Annual Report - HKEXnews
135
-
Upload
khangminh22 -
Category
Documents
-
view
2 -
download
0
Transcript of Annual Report - HKEXnews


1
2
6
7
8
14
17
20
27
43
45
46
47
49
50
52
53
127
132
CONTENTSCorporate Information
Corporate Pro�le
Financial Highlights
Chairman's Statement
Management's Discussion and Analysis – Business and Operation Review
Internet
E-Commerce
Television & Entertainment
Publishing
Outdoor Media
Management’s Discussion and Analysis – Financial Review
Directors' Pro�le
Corporate Governance Report
Report of The Directors
Independent Auditor's Report
Consolidated Income Statement
Consolidated Statement of Comprehensive Income
Consolidated Statement of Financial Position
Statement of Financial Position
Consolidated Statement of Changes in Equity
Consolidated Statement of Cash Flows
Notes to the Consolidated Financial Statements
Principal Subsidiaries, Jointly Controlled Entities and Associated Companies
De�nitions

Annual Report 2010
1CORPORATE INFORM
ATIONBoard of DirectorsChairmanFrank John Sixt
Executive DirectorsYeung Kwok Mung Mak Soek Fun, Angela
Non-executive DirectorsChang Pui Vee, DebbieChow Woo Mo Fong, SusanIp Tak Chuen, EdmondLee Pui Ling, Angelina
Independent Non-executive DirectorsCheong Ying Chew, HenryWu Hung Yuk, Anna James Sha
Alternate DirectorFrancis Anthony Meehan (Alternate to each of Frank John Sixt, Chang Pui Vee, Debbie, Chow Woo Mo Fong, Susan and Ip Tak Chuen, Edmond)
Company SecretaryMak Soek Fun, Angela
Audit CommitteeCheong Ying Chew, Henry (Committee Chairman)Wu Hung Yuk, AnnaJames ShaLee Pui Ling, Angelina
Remuneration CommitteeFrank John Sixt (Committee Chairman)Chow Woo Mo Fong, Susan (Alternate to Frank John Sixt)Cheong Ying Chew, HenryWu Hung Yuk, Anna
Authorised RepresentativesYeung Kwok MungMak Soek Fun, Angela
AuditorPricewaterhouseCoopers
Registered OfficeP. O. Box 309Ugland HouseGrand CaymanKY1-1104Cayman Islands
Head Office and Principal Place of Business48/F., The Center99 Queen’s Road CentralCentralHong KongTel: (852) 2121 7838Fax: (852) 2186 7711
Share RegistrarComputershare Hong Kong Investor Services LimitedRooms 1712–1716, 17/F.Hopewell Centre183 Queen’s Road EastWanchaiHong Kong
Principal BankersThe Hongkong and Shanghai Banking Corporation LimitedBank of China (Hong Kong) LimitedDBS Bank LimitedIndustrial and Commercial Bank of China (Asia) Limited
Website Addresswww.tomgroup.com
Stock Code2383

TOM Group Limited
2CO
RPOR
ATE
PROF
ILE
Internet
(stock code: 2383) is l isted on
the Main Board of the Stock Exchange of Hong Kong. A leading
Chinese-language media conglomerate in Greater China, TOM Group
has diverse business interests in Internet, E-Commerce, Television
& Entertainment, Publishing, Outdoor Media across markets in
Mainland China, Taiwan and Hong Kong. In each of the areas it
operates, TOM Group has secured market leadership.
The Group was founded in October 1999 as a joint venture between
Hutchison Whampoa, Cheung Kong (Holdings) Limited, and other
strategic investors. Headquartered in Hong Kong, the Group has
regional headquarters in Beijing, Shanghai and Taipei with around
3,200 employees in about 20 cities.
TOM Group Limited
With a strong commitment to innovation and technology, TOM Group operates a cloud-based cross-device open platform to serve its users. Through collaboration with handset brands, telecom operators and content providers, TOM develops and introduces diversified handset-embedded mobile internet applications. TOM also offers content-based products to cover sports, entertainment and personal health and lifestyle etc, connecting every aspect of our customers’ lives, online, offline and via mobile.
Key internet products and services include:
TOM portal: www.tom.com, a tool- and user-centr ic open platform, operates the most comprehensive internet portal for applications.
Exclusive webcast of EPL: TOM is the strategic partner of 2010/2011 English Premier League (EPL)
for exclusive content distribution in the Mainland. TOM brings to its users not only webcast of 380 games, but also first-run of peripheral programmes online, video clips and EPL’s latest news via various online and mobile channels. In addition to the popular EPL zone on TOM’s mobile internet platform, iPhone and iPad applications are also launched, and the latter ranked among the top on Apple iTunes App Store. Interactive games and peripheral events are also offered to enhance audience participation.
CBA strategic partnership: TOM cooperated with the Chinese Basketball Association (CBA) in the launch of Uhoop (www.uhoop.cn), an interactive platform for young basketball fans in China, and was named “2010 Internet Premium Channel of the Year”. TOM also partnered with NBL, WCBA, Stankovi Continental Cup and ABA etc.

Annual Report 2010
CO
RPO
RA
TE PRO
FILE3
Wireless and mobile internet: TOM’s wireless division ranks among top three in the industry. Serving a huge wireless user base, TOM offers quality wireless services via short messaging service (SMS), multimedia messaging service (MMS), interactive voice response (IVR) and ring-back tone (RBT) etc. A series of innovative mobile internet services in the areas of communications, music and games are also offered. TOM was awarded “2010 Wireless Internet Portal of the Year”.
TOM-Skype: TOM-Skype is a leading online communication application developed for the Mainland market, offering localised services to its user base of nearly 91 million (as at 31 December 2010). Skype offers free VoIP service which supports audio conferencing for up to 24 parties over PCs, land line and mobile handsets, as well as video conferencing for up to 10 parties. Skype calls and messages are securely encrypted by using P2P technology. It won a number of awards during the year including:
• TheBestGlobal Teleconference Product for2010
• “TheMostPopularNetizenProduct” inChinaInternet Conference 2010
• MicroVoIP.com“TheBest Provider forValue-AddedService2010”
• “TheBestUserExperienceofSoftware”in2010Pconline Appraisal
• “TheAwardofUserCommendation”in2010Onlinedown Appraisal
• “TheAwardofEditorCommendation”in2010Yesky Appraisal
Huanjianshumeng: hjsm.tom.com, an e-reading platform, offers more than 100,000 original fictions and literary works, some of which were licensed for the production of printed books, animation, movies, TV programmes and games etc. Huanjianshumeng partnered with the Chinese Writers Association, Cité under TOM Group and numerous Mainland publishers to present bestsellers online. Huanjianshumeng is also a pioneer partner of China Mobile for content provision, and remains among the top five providers of quality content. Moreover, iPhone and iPad applications have been launched to add a new dimension to the reading experience. Huanjianshumengwasawarded“MobileReadingPortalwiththeBestPotentialinChina2010”.
Sharkwave: www.shawei.com, a sports and leisure portal, offers the latest sports, lifestyle and entertainmentcoverage.Its“Sharkgals”rolledoutvarious iPhone and iPad applications which are popular among fans.
Dietmama: www.dietmama.com, is an interactive health product featuring diversif ied health information, interactive consultation and social networking capabilities. While a number of iPhone applications have been rolled out to meet the increasing demand for health and lifestyle information, since launch, Dietmama continuously remained among the top 10 free applications under the“Health& Fitness” categoryonAppleiTunes App Store, and has from time to time featuredinthe“What’sHot”section.
TOM invests in the development of e-commerce techno logy and bu i ld ing o f p la t fo rm. In conjunction with China Post, TOM launched Ule (www.ule.com.cn), a localised e-commerce platform that offers seamless online, offline and mobile shopping experience in the Mainland, extending the service to not only online shoppers but also those who do not shop online. Since its launch in August 2010, Ule has been well received by merchants and shoppers.
e-commerce A wide selection of quality and authentic products are available on Ule, including renowned local and international brands. In addition to ordering via the web and mobile applications, a dial-in service hotline and off-the-counter sales services are also available. The Ule prepaid card – a unique settlement tool issued and sold nationwide via the Ule online platform as well as post office locations and corporate client sales team of China Post, allows shoppers to enjoy payment convenience.
TOM Group Limited
CO
RPO
RA
TE P
RO
FILE
4
CETV is a leading 24-hour Putonghua general entertainment channel providing the latest and popular Asian and international entertainment programming. Self-productions including CEO Interview, KKBOX, Beauty First, A Beauty’s Trick, Trendy Master, and Lin’s Restaurant etc. offer diversified entertainment and powerful brand-building platform for advertisers by integrating commercial products into the programmes.
CETV is the first foreign satellite television channel to be granted landing rights into the cable systems of Guangdong. Its entertainment programme offerings are extended to the TOM portal and various channels:
CETV official mobile website: m.cetv.com provides live broadcast and video-on-demand features that enable users to view CETV programmes whenever and wherever they want.
CETV official website: www.cetv.com delivers timely entertainment news and interacts with users via the community network.
CETV official iPhone application: allows users to access the latest CETV entertainment news, videos and programme information over handsets.
Yangcheng (YC), an integrated communications business under the Television & Entertainment Group, is the preferred professional agency for multinational brands. The company mainly engages in cross-selling related Group products, media planning and buying, as well as providing tailor-made public relations and marketing campaigns and nationwide event management for clients, such as Nokia, Mentholatum, adidas, Amway, Peps i , Suntory , Br idgestone and TaylorMade etc. With its powerful execution capability, YC has already extended its presence to third- and fourth-tier cities across China.
televIsIon & entertaInment
TOM Group has a well established publishing platform in Greater China. Its publishing unit, Cité Publishing Group, is the largest book and magazine publisher in Taiwan and first-mover in digital publishing and reading. By investing in technological research and development, Cité is capable to simultaneously offer printed and digital copies of books and magazines. It reaches readers via diversified channels such as websites, social networking websites as well as e-reading devices and mobile applications.
TOM’s traditional publishing business attains leadership position. Its market insight has earned numerous recognitions and sales records. Sharp
Point’s Twilight series, Cité’s Eat, Pray, Love and Years of Transience were among the bestsellers in Taiwan. Moreover, many t it les received overwhelming responses from readers, and have been licensed for the making of TV programmes. Labels under the Publishing Group are top players in their specialities. Business Weekly is the leader among its peer competitors and earns numerous awards over the years. Home Media Group is renowned for its technology, know-how and lifestyle publications; Sharp Point remains the leading publisher of leisure publications and popular culture, while Nong Nong Intermedia Group publishes Taiwan’s leading lifestyle, fashion and infant-care guides for women.
PublIshIng
Ule is characterised by its strong logistics and warehousing capabilities. Its innovative one-stop logistics and warehousing system, the virtual distribution centre connects directly with China Post’s logistics system, enhancing merchants’ offline cooperation with distributors and efficiency in logistics and warehousing. The combination of China Post’s nationwide express mail service (EMS)
logistics and warehousing capabilities and sales network, with TOM Group’s technological support and expertise in cloud computing, enables Ule to offer unique sales, logistics and warehousing services online and offline. Ule is well-positioned to become a scalable and trustworthy 360-degree shopping platform.

Annual Report 2010
CO
RPO
RA
TE PRO
FILE5
O n t h e d i g i t a l p u b l i s h i n g f r o n t , P O P O (www.popo.tw) is a first-of-its-kind creative platform in Taiwan for reading, creation and transaction of original contents, eyeing the world’s Chinese-language literature market. Social media website Pixnet (www.pixetnet.net), which ranks number nine in Taiwan in terms of traffic, provides an online community window for publications under the Publishing Group. Gurubear (www.gurubear.com.cn) offers diversified online and offline reading experience for children and their parents. “Lifeel” and“eReadingNow”
meet readers over smartphones, iPhone and iPad, offering hundreds of e-books and e-magazines published by Cité. In addition, tens of book websites are in place to offer online publishing, e-reading, e-learning and interactive community services.
Meanwhile, the Group extended its presence in the Mainland market by publishing a variety of popular periodicals including DG Best and International Wrist Watch. In Hong Kong, CUP is the magazine of choice in educated circles.
TOM Outdoor Media Group (OMG) is a leading outdoor advertising operator with an advertising presence in more than 100 cities in Mainland China. Together with subsidiaries established in Beijing and Shanghai; in second- and third-tier cities such as Dalian, Jinan, Xiamen, Chengdu, Shenyang, Chongqing and Kunming etc. OMG provides professional one-stop media solutions.
OMG operates an established nationwide network of diversified and quality advertising assets. It is also committed to the research and development
outdoor medIa of outdoor new media and technology. With its seasoned sales and client servicing team, OMG has remained the preferred outdoor media agent of local and international brands such as Amway etc.
OMG is acknowledged as a leader in the industry in Mainland China. On the China Media Conference held in the first quarter of 2011, OMG was awardedthe“GoldenGreatWallMediaAwards–2010AwardforOutdoorNewMedia”.

TOM Group Limited
6For the year ended 31 December
FINAN
CIAL
HIG
HLIG
HTS
2010 2009 2008 2007 2006In HKD Thousands (As restated)^ (As restated)^ (As restated)^
ResultsTurnover Internet 1,031,963 1,062,447 1,066,690 1,085,460 1,370,862 E-Commerce 1,834 2 – – – Publishing 947,492 867,315 1,011,734 947,544 948,063 Outdoor Media 275,348 353,447 464,722 440,178 391,166 Television & Entertainment 207,590 152,542 184,887 209,433 88,573
2,464,227 2,435,753 2,728,033 2,682,615 2,798,664
EBITDA* 122,248 105,714 95,906 101,985 377,228Operating (loss)/profit# (93,001) 24,514 (1,367,755) (231,651) 192,986(Loss)/profit attributable to equity holders of the Company (167,952) (60,511) (1,394,429) (331,105) 12,169
Financial PositionTotal assets 5,140,262 5,241,384 5,878,715 8,768,438 8,290,723Total liabilities 3,268,351 3,205,508 3,616,401 5,270,052 3,968,945
Total equity 1,871,911 2,035,876 2,262,314 3,498,386 4,321,778
* EBITDA refers to profit/(loss) before finance costs, taxation, depreciation, amortisation, provision for impairment of goodwill and other assets, net gain on deemed disposals of interests in subsidiaries and excess of net assets value over cost of acquisition of additional interests in a subsidiary.
# Operating (loss)/profit refers to (loss)/profit before finance costs and taxation.
^ In 2010, the Group had reorganised the business segments such that merchandise sales generated through internet-based marketplace have been recorded in the E-Commerce Group such that the consolidated financial data for 2009 had been restated accordingly.
In 2008, the Group had aligned the accounting policy such that the consolidated financial data for 2006 and 2007 had been restated accordingly.
In 2007, the Group had discontinued the Sports Group operations such that the consolidated financial data for 2006 had been restated accordingly.

Annual Report 2010
7CHAIRM
AN’S STATEMENT
While economic conditions in the Greater China region improved measurably in 2010, tightened regulatory policies in the Mainland continued to present challenges for our businesses there. Against this backdrop, TOM Group continued to invest in internet technology and convergence of our new and traditional media businesses. The Group reported a sustainable performance, with HK$2,464 million in revenue for the year. Earnings before interest, tax, depreciation and amortisation improved 16% to HK$122 million. Loss attributable to shareholders was HK$168 million or HK4.31 cents per share.
The Internet Group reported revenues of HK$1,032 million and segment profit of HK$18 million in a difficult operating environment due to continuing regulatory restrictions. The division continued to build user-centric and operator-agnostic open platforms to replace its established 2.5G wireless value added services, including handset-embedded applications in the areas of unified messaging, music social networking services and games platforms. At the same time, the TOM portal (www.tom.com) continued to enrich its premium content on sports and entertainment, tuning into users’ preference for borderless and interactive experience. In addition to forming strategic alliance with partners such as English Premier League (EPL) and Chinese Basketball Association (CBA), the division also deepened its publishing and TV content collaboration with other TOM business units to provide and distribute their content over online and mobile channels.
To mitigate adverse regulatory measures which continued to limit the financial progress of the Television and Entertainment Group, CETV strengthened its self-production programme offerings and enhanced interactive services for distribution over online and mobile platforms, achieving an increase in revenues during the period.
E-Commerce is a young but fast-developing business initiative for TOM Group. During the year, TOM Group entered into a joint-venture with China Post to set up a unique B2C platform – Ule (www.ule.com.cn), which features group-purchase services, offline and online shopping. Customer purchases are delivered via the strong and deep China Post EMS logistic services utilising both virtual distribution centre system and physical warehousing capabilities, and payment is handled via prepaid coupons purchased from China Post. Since its official launch in the fourth quarter of 2010, Ule has continued to improve its customer service quality and increase its product range, and is showing encouraging early results.
The Publishing Group maintained its strong growth momentum and attained first-mover advantage in digital publishing by timely roll-out of numerous e-publishing initiatives, including user-generated content websites, e-books and e-reading applications. Segment revenues and profit increased to HK$947 million and HK$101 million respectively. Alongside its leading position in traditional publishing, the division expects to accelerate its digital investments through strategic alliances with industry partners to further expand its footprint in Greater China.
The Outdoor Media Group (OMG) continued to consolidate its outdoor media assets, including disposals of non-performing business units. Coupled with enhanced operational efficiency, OMG reported improved performance with segment loss reduced considerably by 50%, while revenues amounted to HK$275 million despite the adverse impact of local authorities’ city planning exercises on several of its operations.
Going forward, TOM Group will maintain clear focus on financial and operating disciplines, and continued product and service innovation. Barring market instability and regulatory changes, we remain optimistic for the business outlook in 2011.
I would like to take the opportunity to thank the management and all the staff of TOM Group for their concerted efforts, professionalism and hard work over the year.
Frank John SixtChairman
Hong Kong, 24 March 2011

TOM Group Limited
8M
ANAG
EMEN
T’S
DISC
USSI
ON A
ND A
NALY
SIS
Business and Operation ReviewEyeing long-term sustainability of business growth, TOM Group remained committed to innovation and technology, and over the past two years invested in the development of a cloud-based cross-device open platform to serve its users. The Group not only continues its efforts to consolidate its businesses and maintain financial performance, i t a l so makes investments in the areas of e-commerce, e-publishing, TV programmes and mobile internet. During the year, the Group launched an array of diversified products and services including online shopping, e-reading, mobile infotainment and mobile internet content and applications etc. In the review period, the Group maintained stable revenues with a slight increase of 1% as compared to the previous year. EBITDA was up by 16% to HK$122 million.
InternetInvestment seeds technological and content innovation
As the Group maintained its leadership position in the wireless value added services market, it engaged in the development of cross-device applications and strived to converge its online resources and strengths in the wireless business to launch innovative cross-device mobile internet and social networking services (SNS) in the areas of communications, music, games, sports, entertainment and reading over multi-platforms through cooperation with local and international handset manufacturers and telecommunication operators. During the year, the Internet Group posted revenues of HK$1,032 million and segment profit of HK$18 million.
Communications, music and games on mobile internet applicationsTOM developed a unified messaging service, which bundles voice mail, video mail, e-mail and instant messaging for a local handset brand in China. Such service will be extended to cover more handset users in the near future.
On the music and game front, TOM is the designated partner of digital music provider Top
100 to launch device-based streaming SNS of copyrighted music. In addition, the Group, in conjunction with mobile game provider Glu, will launch a series of unique and innovative device-based game SNS in 2011 leveraging on the strengths and resources from both sides. The services will be embedded in premium handset brands across China. It is the Group’s target to see over 50% of new handsets in China embedded with these unique services by 2011.
Develop cross-device applications on health and lifestyle infotainmentThe Group engaged in the development of cross-device applications. Interactive health product Dietmama (www.dietmama.com) features divers i f ied health information, interact ive consultation and social networking capabilities. The average monthly growth of registered users was 20%. iPhone applications launched in the year received overwhelming responses. The calorie counter application recorded thousands of downloads within the f irst month upon launch. Another database application featuring comprehensive calorie information of Chinese cuisine was subsequently launched in the fourth quarter. Dietmama continuously remained one ofthetop10freeapplicationsunderthe“Health& Fitness” category onApple iTunesApp Storesince launch, and has from time to time featured inthe“What’sHot”section.Goingforward,TOMwill roll out more cross-device social networking applications including recipes, advanced diet planner, utility and group buying etc. It is expected that these applications will increase user stickiness.
Exclusive and premium sports contentLeveraging on its experience and understanding of user preference in content and growing interest in SNS, TOM has during the year brought to users their preferred local and international sports events and entertainment premium content. Building on the previous collaboration with NBA, the Group deepened its understanding of audience’s preferences. During the year, TOM entered into strategic partnership with 2010/2011 English Premier League (EPL) for exclusive content for distribution over various online and mobile
Annual Report 2010
MA
NA
GEM
ENT’S D
ISCU
SSION
AN
D A
NA
LYSIS
9channels. By leveraging on its cloud computing technology, TOM delivered multi-media EPL content including webcasts, video clips, latest news of EPL and online community etc. to users. In addition, its EPL iPhone application ranked among the top on Apple iTunes App Store. TOM users were able to participate in online interactive games and peripheral events.
Basketball continues to be a core component of TOM’s sports platform. TOM in conjunction with the Chinese Basketball Association (CBA), launched an interactive basketball platform, Uhoop (www.uhoop.cn), to provide online offerings for young fans all over the world. Riding on not only being a leading online community, but also as an educational and informative platform for basketball fans, the Group remained a strategic partner of CBA and Beijing Municipal Bureau of Sport, bringing its users exciting content of CBA, WCBA and NBL. TOM also strengthened its interaction with target audience by organising auditions and fans events etc.
E-reading services distributed over multi channelsE - r e a d i n g p l a t f o r m H u a n j i a n s h u m e n g (hjsm.tom.com) features more than 100,000 original fictions. During the year, it partnered with Cité under TOM Group, the Chinese Writers Association and numerous Mainland publishers to strengthen its collection and distribute content over mobile offerings of the top three operators and handset brands in the Mainland.
Enrich entertainment and video contentDuring the year, TOM extended its content offerings to cover general entertainment, personal health and lifestyle. Leveraging on TOM Group’s TV content, the TOM portal (www.tom.com) offers its users with online entertainment news from CETV.
Going forward, the TOM portal will strengthen its collaboration with other businesses of TOM Group in the Greater China region and will increasingly offer more diversified entertainment content and novelty experience to its users.
e-commerceUle combines the strengths of China Post resources and TOM technology to deliver enduring value
Targeting to create a sustainable e-commerce business model that delivers authentic value, TOM Group invested in the development of e-commerce technology and building of platform. TOM formed a joint venture with China Post to launch a localised e-commerce platform Ule (www.ule.com.cn). Featuring nationwide coverage, Ule not only aims at servicing online shoppers in the Mainland but also targets at the population who do not shop online. The combination of China Post’s nationwide EMS logistics and warehousing capabilities and sales network, sales team of 50,000 and 46,000 post office locations, with TOM Group’s technological support and expertise in cloud computing, enables Ule to offer unique sales, logistics and warehousing services online and offline. Ule is well-positioned to become a scalable and trustworthy 360-degree shopping platform and address the developing offline service base of e-commerce in the Mainland.
Logistics and warehousing capabilities facilitate merchants to go onlineChina Post’s extensive delivery infrastructure is complemented with the virtual distribution centre (VDC) system, an innovative one-stop logistics and warehousing system that connects directly with China Post’s logistics system. VDC is tailored to enhance merchants’ offl ine cooperation with distributors and efficiency in logistics and warehousing. The system not only can provide integration points with merchants’ own logistics and warehousing systems and complement their existing offline distribution channels, it also provides support to those merchants without such capabilities. As a result, Ule is able to offer merchants who do not yet have an e-commerce capability an affordable entrance to establish their e-commerce channels in China.
Since its beta launch in August 2010, Ule has attracted nearly 1,000 well-known local and international brands including L’Oreal, Procter & Gamble, Ajisen, Goodbaby, Pampers and Philips etc. Furthermore, several brands including Giordano and Bossini rolled out limited edition products on Ule.

TOM Group Limited
MA
NA
GEM
ENT’
S D
ISC
USS
ION
AN
D A
NA
LYSI
S10
User response and Ule card sales crystallise growth potentialsWith the backing of China Post, users in China are able to access a trustworthy e-commerce platform with comprehensive range of online and offline shopping channels, wide selection of authentic goods and quality services. Since its launch, average daily page view surged, whilst loyal customers saw continuous growth. Ule prepaid card, a unique settlement tool issued and sold nationwide via the Ule online platform as well as post office locations and corporate client sales team of China Post, received positive response since its launch in January 2011. Sales in its first month approximated RMB100 million. To date, over 90% of transactions on Ule are settled by Ule prepaid card, which facilitates offline shoppers and those without online banking accounts to enjoy e-commerce services. The growth prospect of Ule remains promising.
Offline over-the-counter sales services extending nationwideWith the unique combination of online and offline retail, strong back-end capabilities and extensive corporate client sales network, Ule is poised to push forward growth across cities and remote provinces. Following the successful pilot-launch of over-the-counter sales services in Henan Province, the services will be extended to nationwide in 2011. Going forward, the group purchase service will be strengthened to drive sales of Ule cards and transactions. The Ule merchant portfolio will also be enriched to cover more quality brands. Ule is well-positioned to render secured, reliable and trustworthy services.
televIsIon & entertaInmentStrengthened self-production and interactive services offered via multi channels
CETV, under the Television & Entertainment segment, had strived to become a premium ente r ta inment b rand . Wi th va r ious se l f -productions, popular dramas and interactive services, CETV continued to offer diversified entertainment to audience as well as interactive marketing opportunities for advertising clients. CETV also materialised collaboration with its internet and publishing peers under TOM Group by provisioning its wealth of quality content.
By sharing content resources across the Group, CETV not only contributed to overall cost saving for TOM Group, but also extended its outreach to its audience via online and wireless channels, strengthened user interaction and improved service quality. Advertisers were also rendered opportunities to build their brands on a synergised cross-media platform. CETV restored 95% coverage in Shenzhen in 2011. During the year, CETV made further investment in self-produced programmes, which grew by 25% as compared to the previous year. Syndication income increased by more than 3.3 times in the year, while advertising income increased by 15%. Among the numerous channels in Guangzhou, CETV acquired 9% market share and top-five ranking in the local TV advertising market. Despite adverse regulatory initiatives introduced by the State Administration of Radio, Film and Television during the year, segment revenues grew by 36% as compared to the previous year.
Premium self-production attracts advertisers and drives revenuesDuring the review period, CETV invested in an array of premium programmes covering infotainment, health, dining and talk shows, which integrated clients’ brands into content and served as brand-building platforms. The CETV team’s creativity in customising programmes strengthened its client relationship, positioning itself for the improved coverage.
As new hosts joined the popular talk show CEO Interview in 2010, more business leaders in Greater China shared their wisdom and life experiences. The show remained audience’s favourite and a bridge connecting CETV and corporate advertising clients. Beauty First, A Beauty’s Trick and Trendy Master targeted at middle-class female consumers, bringing them the best beauty coverage. These programmes attracted sponsorship from beauty and personal care brands including Vinch, Accen, Sewame, Marie France Bodyline and Modern Hospital Guangzhou etc. On the other hand, Lin’s Restaurant, which featured healthy diet and cooking, was supported by kitchen appliances and sauce manufacturers. In future, CETV will produce more premium programmes hosted by celebrities.

Annual Report 2010
MA
NA
GEM
ENT’S D
ISCU
SSION
AN
D A
NA
LYSIS
11CETV also tailored major events to support clients’ marketing initiatives. The Sarsae Music series successfully strengthened the brand position of softdrink“Sarsae”bymusicperformances.“The6th Anniversary Ceremony and CETV Top 10 Asian StarAwards” celebrated thebest popularAsianstars as voted by CETV audience. The glittering event was attended by celebrities from Mainland China, Korea and Taiwan, as well as business leaders and major advertising clients. CETV’s position as a premium entertainment channel was strengthened.
Trend-setting dramas made promotion platform of tourismDuring the year, CETV broadcasted more popular Asian dramas such as award-winning Taiwanese production Hi My Sweetheart. Top Korean dramas PASTA and White Lie pushed a surge in ratings and overwhelmed audience with Korean popular culture. As the Seoul Government intended to leverage on CETV’s platform to promote Korean tourism across Pearl River Delta, it offered title sponsorship for various CETV programmes, production assistance in Seoul, and released tourist information on CETV website.
Interactivity strengthened as content sharing extendedIn response to the growing significance of online and mobile infotainment, CETV leveraged on the internet and wireless resources of TOM Group to offer round-the-clock entertainment over various channels. Commencing October 2010, CETV entertainment news are available on the TOM portal entertainment channel. The official CETV iPhone application was also launched to offer entertainment news, videos clips and latest programme billing, attracting over 10,000 downloads in the first month since launch. Extension of service to cover Android and MTK handsets is in the pipeline. Besides, the CETV official website (www.cetv.com) and mobile client (m.cetv.com) provide peripheral content such as artists’ micro-blogs, videos and online community etc. to strengthen user stickiness.
Yang Cheng entrusted by multinationals for marketing campaignsAs the marketing expert preferred by multinational brands, Yang Cheng (YC) designed and executed innovative and effective marketing solutions for various well-known brands such as Nokia, Mentholatum, adidas and Amway etc. YC has been the preferred agency for Nokia for consecutive years. In 2010, YC organised numerous nationwide road shows forNokia, including“SolutionVanChina Tour”which coveredmore than1,000Mainlandcitiesandtowns,18“ComeWithMusic”events and938“Lift Tool” road shows coveringrural provinces. YC was also awarded projects by international brands including Pepsi, Suntory, Bridgestone, adidas and TaylorMade etc.
PublIshIngProfit surged by over 36% on booming of traditional and digital publishing and mobile applications
In the context of global economic recovery and a rebound of the advertising market, the Publishing Group delivered outstanding performance. As a result of simultaneous growth in traditional and digital publishing, the Publishing Group posted segment profit of HK$101 million, increased by 36% as compared to the previous year. Revenues amounted to HK$947 million, up by 9% year on year. As the Group’s traditional publishing businesses attained market leadership, it reported another year of growth in book sales and advertising income, while numerous brands and projects were acclaimed. In recent years, TOM has been investing in technological research and development, and moving fast in digital publishing by riding on its edges in internet and new media. The Publishing Group enriched its distribution channels and launched a range of e-reading offerings such as e-publishing products, e-reading devices, mobile applications, book websites and SNS products etc. Going forward, the Publishing Group will pursue more cross-media projects and tap the Mainland market.

TOM Group Limited
MA
NA
GEM
ENT’
S D
ISC
USS
ION
AN
D A
NA
LYSI
S12
Business Weekly and traditional publishing posted further growthBusiness Weekly, the Publishing Group’s flagship magazine in Taiwan, attained its leadership among its peer competitors, with advertisement pages and advertising income increased by 21% and 29% year on year. Alongside rapid development of e-books, overall sales of printed books and magazines continued to grow. Cité’s bestsellers Eat, Pray, Love and Years of Transience, and Sharp Point’s Twilight series sold over 80,000, 60,000 and 1.06 million copies respectively.
Digitalisation of publishing value chainThe Publishing Group continued to strengthen its digital publishing platform. Cité launched POPO (www.popo.tw) in late 2009, the first-of-its-kind platform offering online reading, publishing and distribution. In one year, the aggregate number of authors grew by nearly four times to over 3,000, whereas number of titles was up by nearly four times to around 4,000. In the Digital Publishing Golden Tripod Awards 2010, POPO was acclaimed “InnovationAwardforDigitalPublishing”.
In the f i rst half of 2010, Cité became the industry pioneer in Taiwan with the simultaneous publication of its book title Self-Proud 4: Be a Wise Man with a Kind Heart in printed and digital copies for mobile reader, e-reader and PC etc. At the end of the year, Cité further offered nearly 500 books and magazines in printed and digital formats over various channels including Cité Reading Club (www.cite.com.tw/ebook.php), Cité’s self-owned online platform and the number-one of its kind in Taiwan in terms of traffic.
In February 2011, Cité announced a partnership agreement with Kodansha, one of the largest publishing groups in Japan. The two groups will jointly develop digital publishing business, including production, marketing and sales of digital content, with a view to tap the Chinese-language markets including Taiwan, Mainland China and Hong Kong etc. Such partnership marked the first collaboration between publishers in Taiwan and Japan.
Mobile reading applications meet readersThe Publishing Group launched a number of applications to meet the rapid-growing demand formobile reading. Besides “Lifeel” and“eReadingNow,”which offer nearly 470booksand magazines published by Cité, Nong Nong e-magazine, Grimm Press’ e-books and Sharp Point’s“QuickPlayNews”applicationmetreadersover smartphones, iPhone and/or iPad. POPO commenced free download services for Android users in early 2010. More than 500 new mobile reading applications are expected to launch in 2011.
Book websites enhance e-learning and communitiesThe Group pursued more content digitalisation projects to address the growing significance of online reading and interactive communities. As at year end, 42 websites have been launched to cover a diversified scope of topics such as education, home décor, lifestyle, travel and computer etc.
Pixnet ranks number nine among Taiwan websitesPixnet (www.pixnet.net) is a social media website and online community window for publications under the Publishing Group. Following the Group’s digital publishing initiatives, Pixnet launched the“MobileControl Panel”mobile applicationfor iPhone users to read, respond, dispatch and manage text, images and videos. On the other hand, self-production online dramas Love Harbour and Four People in Bed received overwhelming response, taking daily page view of the website to over a million. According to Alexa, Pixnet had the nineth highest traffic among Taiwan websites as at September 2010.
All-round online and offline reading experiences for childrenCité’s Gurubear ch i ld e- reading p lat form (www.gurubear .com.cn ) in the Main land continued to integrate online and offline reading services for children and their parents. The “Tellybear” e-readingdevicewas launched in

Annual Report 2010
MA
NA
GEM
ENT’S D
ISCU
SSION
AN
D A
NA
LYSIS
13Taiwan in the fourth quarter of 2010 to turn picture-book reading into unrivalled experience. As at year end, a total of eight Gurubear storybook houses were in place to offer online and offline reading services. It is the Group’s intention to expand its operation to around 50 houses in 2011.
Books and magazines acclaimedThe Publishing Group’s vision and professionalism earned numerous recognition. Cité’s book title Building Green Houses was awarded in the 34th Golden Tripod Award (Non-Fiction) in Taiwan, while La Vie magazine won two awards namely the “Best LifestyleMagazine Publication” and“BestSpecialReport”,andBusiness Weekly was named the“Best FinancialMagazine Publication”.Onthe other hand, the Group’s comic publications were also acclaimed in the First Golden Comic Awards.SharpPointwasawardedthe“BestComicContributionAwardForTheYear”,whileitscomictitle My Dear Princesswon the“Award For BestComic”and“AwardForBestGirlComic”.Inthesame event, Energetic Boyswon“AwardForBestNewComic”whereas Lovely, Lovely, Lovely was awarded“National Institute forCompilation andTranslationAwardForGoodComicMasterpiece”.In Japan, Yumeiro Patissiere, Ohoku and Let’s Go To The Space, Brother! won grand prizes in the 56th Shogakukan Magasho Awards. Regular champion Business Weekly was acclaimed in numerous awards including SOPA 2010 Awards for Editorial Excellence, the 9th Excellent Journalism Award, the 5th Hakka Journalism Award, the 14th News Report Award for Cross Straight and Mainland Affairs and 2010 Consumer Protection Award.
outdoor medIaOptimisation and digitalisation of media assets
Since TOM Outdoor Media Group (OMG) was fully acquired by TOM Group in May 2009, it has strived to strengthen its financial performance along consolidation and optimisation of media assets, enhanced operational efficiency and tailoring of creative marketing solutions for clients. During the year, occupancy rate of media assets increased to 72%. Segment loss decreased significantly by 50% as compared to the previous year.
Since May 2010, OMG was appointed as an advertising agent for the major outdoor media assets in Shanghai owned by Shanghai Media and Entertainment Group. As a result, OMG has an additional 25,000 square metres, or 19% increase in its portfolio for advertising clients to choose from. OMG also remained the preferred outdoor media agent of local and international brands for its account service excellence. In 2010, OMG was re-appointed by Amway as its exclusive outdoor advertising agent for its Eastern, Northern and Southern China operations.
The OMG major account servicing centre is equipped with a seasoned team of advertising professionals, extensive network and market intelligence, and is poised to support the Group’s asset digitalisation strategy. On the China Media Conference held in the first quarter of 2011, OMG was awarded the“GoldenGreatWallMediaAwards–2010AwardforOutdoorNewMedia”.

TOM Group Limited
MA
NA
GEM
ENT’
S D
ISC
USS
ION
AN
D A
NA
LYSI
S14
Financial ReviewTOM Group reports its results in five business segments namely Internet Group, E-Commerce Group, Publishing Group, Outdoor Media Group as well as Television & Entertainment Group.
RevenueThe Group’s revenue for the year ended 31 December 2010 amounted to HK$2,464 million, an increase of 1.2% compared to HK$2,436 million last year.
Segment resultsThe Internet Group reported gross revenues of HK$1,032 million, 2.9% lower than last year’s HK$1,062 million. Segment profit was HK$18 million, 71.7% lower than HK$63 million in 2009.
The E-Commerce Group reported gross revenues of HK$2 million and segment loss of HK$32 million.
Gross revenues of the Publishing Group increased by 9.2% to HK$947 million from last year’s HK$867 million. Segment profit increased by 36.2% to HK$101 million from HK$74 million in 2009.
The Outdoor Media Group reported gross revenues of HK$275 million, 22.1% lower than last year’s HK$353 million. Segment loss reduced by 49.8% to HK$22 million from HK$44 million in 2009.
Gross revenues of the Television & Entertainment Group increased by 35.5% to HK$209 million from last year’s HK$154 million. Segment loss was HK$63 million, an 26.3% increase from HK$50 million in 2009.
Operating lossThe Group’s operating loss for the year amounted to HK$93 mil l ion, compared to last year’s operating profit of HK$25 million. Excluding the financial impacts from non-recurring provision for impairment of goodwill and other assets of HK$12 million (2009: excess of net assets value over cost of acquisition of additional interests in a subsidiary of HK$91 million and provision for impairment of goodwill and other assets of HK$7 million), the operating loss was HK$81 million, compared to operating loss of HK$60 million in 2009.
Loss attributable to equity holders of the CompanyThe Group’s loss attributable to equity holders of the Company was HK$168 million, compared to HK$61 million in 2009.
Liquidity and financial resourcesAs at 31 December 2010, TOM Group had bank and cash balances, including pledged deposits, of approximately HK$1,083 mill ion. A total of HK$2,665 million financing facilities were available, of which HK$1,951 million had been utilised as at 31 December 2010, to finance the Group’s capital expenditures and for working capital purposes.
Total borrowings of TOM Group amounted to approximately HK$1,951 million as at 31 December 2010. This included long-term bank loans of approximately HK$1,842 million and short-term bank loans of approximately HK$109 million. The gearing ratio (Debts/(Debts + Equity)) of TOM Group was 51% as at 31 December 2010, compared to 49% as at 31 December 2009.

Annual Report 2010
MA
NA
GEM
ENT’S D
ISCU
SSION
AN
D A
NA
LYSIS
15As at 31 December 2010, the Group had net current assets of approximately HK$565 million, compared to approximately HK$737 million as at 31 December 2009.
As at 31 December 2010, the current ratio (Current assets/Current liabilities) of TOM Group was 1.39, compared to 1.51 as at 31 December 2009.
In 2010, the Group generated net cash of HK$180 million from its operating activities, compared to HK$142 million in 2009. Net cash outflow from investing activities was HK$276 million, which mainly included capital expenditures of HK$227 million and advance to jointly controlled entities of HK$42 million. During the year, the net cash outflow from financing activities amounted to HK$49 million, which mainly included repayment of bank loans, net of new drawdowns, of HK$53 million and dividends paid to non-controlling interests of HK$26 million; partially offset by reduction of restricted cash of HK$41 million.
Charges on Group assetsAs at 31 December 2010, the Group had restricted cash amounting to HK$4 million, being bank deposits mainly pledged in favour of certain publishing distributors in Taiwan as retainer fee for potential sales return.
Foreign exchange exposureIn general, it is the Group’s policy for each operating entity to borrow in local currencies, where necessary to minimise currency risk.
Contingent liabilitiesIn September 2008 and August 2009, a subsidiary of the Group in Taiwan received revised income tax assessments for the years ended 31 December 2004 and 2005 respectively from the local tax authority. In these revised tax assessments, the tax authority claimed that amortisation of intangible assets amounting to approximately NT$44 million (approximately HK$11 million) and NT$146 million (approximately HK$38 million) was not deductible in deriving the assessable profits of the subsidiary
for 2004 and 2005 respectively. This gave rise to a potential additional income tax liability to the Group of approximately NT$48 million (approximately HK$12 million). The subsidiary duly filed the appeals to the tax authority and requested for re-examination on the deductibility of the amortisation charge. In March and August 2010, the appeals for 2004 and 2005 revised tax assessments were turned down by the tax authority and the subsidiary escalated the appeals to the Court in Taiwan in May and October 2010 respectively. In December 2010, the subsidiary won the administrative proceeding for the 2004 tax appeal. In January 2011, the tax authority filed a final appeal to the Court. Up to the date of these financial statements, the appeals are still outstanding and no results have been finalised.
In August 2010, January 2011 and March 2011, the subsidiary received revised tax assessments for the years ended 31 December 2007, 2006 and 2008 respectively, disallowing the deduction of amortisation of intangible assets of approximately NT$472 million (approximately HK$122 million) in total on similar grounds as 2004 and 2005. This gave rise to a potential additional income tax liability to the Group of approximately NT$118 mil l ion (approximately HK$31 mil l ion). The subsidiary duly filed a petition to the tax authority and requested for re-examination of the 2007 revised tax assessment and is in the process to file petitions for the 2006 and 2008 revised tax assessments. Up to the date of these financial statements, the petitions are still outstanding and no results have been finalised.
Management has discussed the cases with its external tax representative. Based on the consultation, management considers that the amortisation of intangible assets should be tax deductible under the tax rules in Taiwan, and in view of the positive outcome of the 2004 administrative proceeding, management is confident of a favourable outcome of the tax appeals/petitions and considers no provision is necessary at this stage.

TOM Group Limited
MA
NA
GEM
ENT’
S D
ISC
USS
ION
AN
D A
NA
LYSI
S16
Should the tax appeals and petitions by the subsidiary be turned down finally, the subsidiary’s income tax assessments for each of the years from 2009 to 2010 would likely be revised on a similar basis. The total incremental tax liability in relation to year 2004 to year 2010 to the Group thereon is approximately NT$232 million (approximately HK$60 million).
Employee informationAs at 31 December 2010, TOM Group had 3,170 full-time employees. Employee costs, excluding Directors’ emoluments, totalled HK$551 million for the year (2009: HK$528 million). All of the TOM Group companies are equal opportunity employers, with the selection and promotion of individuals being based on suitability for the position offered. The salary and benefit levels of the Group’s employees are kept at a competitive level and employees are rewarded on
a performance related basis within the general framework of TOM Group’s salary and bonus system, which is reviewed annually. A wide range of benefits including medical coverage and provident funds are also provided to employees.In addition, training and development programmes are provided on an ongoing basis throughout TOM Group. Social, sporting and recreational activities were arranged during the year for the employees on a Group-wide basis.
The Group also adopted a share option scheme under which, inter alia, the employees of the Group may be granted share options to subscribe for shares of the Company for the purposes of recognising the contributions made by the employees of the Group and retaining the services of the employees who will continue to make valuable contributions to the Group.
Disclaimer:Non-GAAP measures
Certain non-GAAP (generally accepted accounting principles) measures, such as operating profit/(loss) including share of results of
associated companies and jointly controlled entities and segment profit/(loss) excluding provision for impairment charges and excess of
net assets value over cost of acquisition of additional interests in a subsidiary, are used for assessing the Group’s performance. These non-
GAAP measures are not expressly permitted measures under GAAP in Hong Kong and may not be comparable to similarly titled measures
for other companies. Accordingly, such non-GAAP measures should not be considered as an alternative to operating income as an indicator
of the operating performance of the Group or as an alternative to cash flows from operating activities as a measure of liquidity. The use
of non-GAAP measures is provided solely to enhance the overall understanding of the Group’s current financial performance. Additionally
because the Group has historically reported certain non-GAAP results to investors, the Group considers the inclusion of non-GAAP measures
provides consistency in the financial reporting.

Annual Report 2010
17DIRECTORS’ PROFILE
Frank John Sixt aged 59, has been a Non-Executive Director and the Chairman of the Company since 15 December 1999 and is the Chairman of the Remuneration Committee of the Company. He is also an Executive Director of Cheung Kong Infrastructure Holdings Limited and Power Assets Holdings Limited (formerly known as Hongkong Electric Holdings Limited), a Non-Executive Director of Hutchison Telecommunications Hong Kong Holdings Limited and Hutchison Port Holdings Management Pte. Limited as the trustee-manager of Hutchison Port Holdings Trust, and a Director of Hutchison Telecommunications (Australia) Limited and Husky Energy Inc. He is also the Group Finance Director of HWL, a Non-Executive Director of CKH, and a Director of Easterhouse Limited, Hutchison International Limited, Li Ka-Shing Unity Trustcorp Limited, Li Ka-Shing Unity Trustee Company Limited and Li Ka-Shing Unity Trustee Corporation Limited, which are substantial shareholders of the Company within the meaning of Part XV of the SFO. Mr. Sixt holds a Master’s degree in Arts and a Bachelor’s degree in Civil Law, and is a member of the Bar and of the Law Society of the Provinces of Quebec and Ontario, Canada.
Yeung Kwok Mung aged 46, has been the Chief Executive Officer and an Executive Director of the Company since 26 March 2008. Prior to joining the Company, he was a Director and Chief Executive Officer of Horizons Ventures Limited and ChinaCare Investments Holdings Limited respectively, these companies are controlled by Ms. Chau Hoi Shuen and Cranwood Company Limited, the substantial shareholders of the Company within the meaning of Part XV of the SFO. Prior to that, Mr. Yeung worked at Mckinsey & Company, Inc. for over 6 years in Sydney, Melbourne and Hong Kong covering mainly the telecommunications, electronics and e-commerce industry sectors in the area of business strategy, business re-engineering and operational improvements. Mr. Yeung worked for Coca-Cola China Limited as Director of Strategy for Coca-Cola Greater China. He also held management positions in business development and sales & marketing at General Electric. He holds a Bachelor of Science degree in Electrical Engineering and a Master of Science degree in Electrical Engineering and Computer Science from Massachusetts Institute of Technology.
Mak Soek Fun, Angela aged 46, has been an Executive Director of the Company since 16 March 2006 and the Chief Financial Officer of the Company since 1 February 2008. She has also been re-appointed as the Company Secretary of the Company with effect from 28 July 2007. Ms. Mak holds a Bachelor of Commerce degree and a Bachelor of Laws degree from the University of New South Wales in Australia and has been admitted as a solicitor in New South Wales (Australia), England and Wales and Hong Kong. Prior to joining the Company, she was a senior group legal counsel of HWL.
Chang Pui Vee, Debbie aged 60, has been a Non-Executive Director of the Company since 5 October 1999. She holds a Bachelor of Arts degree from Hunter College, New York City. She has been directing business development in Mainland China for a number of years and is a Director of Beijing Oriental Plaza Company Ltd. Ms. Chang is a member of the People’s Consultative Party of Beijing, Eastern City District.

TOM Group Limited
DIR
ECTO
RS’
PR
OFI
LE18
Chow Woo Mo Fong, Susan aged 57, has been a Non-Executive Director of the Company since 5 October 1999 and is an alternate member to the Chairman of the Remuneration Committee of the Company. She is an Executive Director of Cheung Kong Infrastructure Holdings Limited, Hutchison Harbour Ring Limited and Power Assets Holdings Limited (formerly known as Hongkong Electric Holdings Limited), a Non-Executive Director of Hutchison Telecommunications Hong Kong Holdings Limited, a Director of Hutchison Telecommunications (Australia) Limited and an Alternate Director of Hutchison Port Holdings Management Pte. Limited as the trustee-manager of Hutchison Port Holdings Trust. She is also the Deputy Group Managing Director of HWL, and a Director of Hutchison International Limited and Easterhouse Limited, which are substantial shareholders of the Company within the meaning of Part XV of the SFO. Mrs. Chow is a solicitor and holds a Bachelor’s degree in Business Administration.
Ip Tak Chuen, Edmond aged 58, has been a Non-Executive Director of the Company since 15 October 1999. He is also a Deputy Managing Director of CKH, an Executive Director and Deputy Chairman of Cheung Kong Infrastructure Holdings Limited, the Senior Vice President and Chief Investment Officer of CK Life Sciences Int’l., (Holdings) Inc., a Non-Executive Director of ARA Asset Management Limited (an Asian real estate fund management company listed in Singapore), AVIC International Holding (HK) Limited, Excel Technology International Holdings Limited, Ruinian International Limited and Shougang Concord International Enterprises Company Limited (all being listed companies), and a Director of ARA Asset Management (Fortune) Limited (formerly known as ARA Asset Management (Singapore) Limited) as the Manager of Fortune REIT and ARA Trust Management (Suntec) Limited as the Manager of Suntec REIT. Both Fortune REIT and Suntec REIT are listed in Singapore. Mr. Ip was previously a Non-Executive Director of The Ming An (Holdings) Company Limited (whose shares were withdrawn from listing on 2 November 2009). Mr. Ip is also a Director of certain companies which are substantial shareholders of the Company within the meaning of Part XV of the SFO. He holds a Bachelor of Arts degree in Economics and a Master of Science degree in Business Administration.
Cheong Ying Chew, Henry aged 63, has been an Independent Non-Executive Director of the Company since 21 January 2000. He is also the Chairman of the Audit Committee and a member of the Remuneration Committee of the Company. He holds a Bachelor of Science degree in Mathematics and a Master of Science degree in Operational Research and Management. He is also an Independent Non-Executive Director of CKH, which is a substantial shareholder of the Company within the meaning of Part XV of the SFO, Cheung Kong Infrastructure Holdings Limited, Excel Technology International Holdings Limited, Hutchison Telecommunications Hong Kong Holdings Limited, New World Department Store China Limited, SPG Land (Holdings) Limited, CNNC International Limited, Creative Energy Solutions Holdings Limited, all being listed in Hong Kong. He is also an Independent Director of BTS Group Holdings Public Company Limited, a company listed in Thailand, and an Executive Director and the Deputy Chairman of Worldsec Limited, a company listed in London. He is also a Member of the Securities and Futures Appeals Tribunal and a Member of the Advisory Committee of the Securities and Futures Commission, and was previously a member of the Disciplinary Panel (Panel A) of the Hong Kong Institute of Certified Public Accountants. HewasanIndependentNon-ExecutiveDirectorofFPPJapanFundInc.(formerlyknownas“FPPGoldenAsiaFundInc.”and“JadeAsiaPacificFundInc.”),acompanylistedinIreland,upuntilOctober2008.

Annual Report 2010
DIR
ECTO
RS’ PR
OFILE
19Lee Pui Ling, Angelina aged 62, was appointed as an Independent Non-Executive Director of the Company on 28 January 2000. She has been re-designated as a Non-Executive Director of the Company with effect from 4 August 2004 and is a member of the Audit Committee of the Company. She is also a Non-Executive Director of Cheung Kong Infrastructure Holdings Limited and Henderson Land Development Company Limited, and an Independent Non-Executive Director of Great Eagle Holdings Limited. She is active in public service and is a Non-Executive Director of the Securities and Futures Commission, a Member of the Takeover and Mergers Panel and Takeovers Appeal Committee, and a Non-Executive Director of the Mandatory Provident Fund Management Board. She is a practising solicitor. She has a Bachelor of Laws degree and is a Fellow of the Institute of Chartered Accountants in England and Wales.
Wu Hung Yuk, Anna aged 60, has been an Independent Non-Executive Director of the Company since 25 August 2003. She is also a member of the Audit Committee and the Remuneration Committee of the Company. She is a qualified solicitor. She holds a Bachelor of Laws degree and a Postgraduate Certificate in Laws from the University of Hong Kong. She is currently a Non-Official Member of the Executive Council, a Member of the Law Reform Commission, a Council Member of the Hong Kong International Arbitration Centre and the Chairperson of the Mandatory Provident Fund Schemes Authority. She was a Non-Executive Director of the Securities and Futures Commission up until end of 2004 and a Non-Executive Director of the Mandatory Provident Fund Schemes Authority up until mid March 2005. Previously she was the Chairperson of the Equal Opportunities Commission, Chairperson of the Operations Review Committee of the Independent Commission Against Corruption, Chairperson of the Consumer Council and a Member of the Legislative Council.
James Sha aged 60, was appointed as a Non-Executive Director of the Company on 12 May 2000. He has been re-designated as an Independent Non-Executive Director of the Company with effect from 4 August 2004. He is also a member of the Audit Committee of the Company. He has held senior positions with a number of large Internet-related companies. Since November 1999, he has been a Managing Partner with Spring Creek Ventures, a partnership specialising in early stage venture investment and business consultation with Internet and infrastructure companies. He is currently serving on the board of directors of several start-up companies. His board memberships include Appstream, Armorize, E21, LiveABC, Optoplex and Mediostream. He also served as the Chief Executive Officer for Sina.com. Prior to that, he was the Senior Vice President, Commerce Solutions, at Netscape Communications. He has also held senior positions with Actra Business Systems, Oracle’s UNIX Product Division and the Advanced Systems Division of Wyse Technology. He holds a Master of Science degree in Electronic Engineering and Computer Science from the University of California, Berkeley, a Master of Business degree from Santa Clara University and a Bachelor of Science degree in Electronic Engineering from Taiwan University.
Francis Anthony Meehan aged 40, has been an alternate Director to each of Mr. Frank John Sixt (Chairman), Ms. Chang Pui Vee, Debbie, Mrs. Chow Woo Mo Fong, Susan and Mr. Ip Tak Chuen, Edmond, all being Non-executive Directors of the Company, since 25 March 2008. He is also a Director and General Manager, Global Handset and Applications Group of HWL, which is a substantial shareholder of the Company within the meaning of Part XV of the SFO, since March 2001. Prior to that, Mr. Meehan was a Director of Sales & Marketing for New Operators, Ericsson UK. He holds a Bachelor of Engineering (Mechanical).

TOM Group Limited
20CO
RPOR
ATE
GOVE
RNAN
CE R
EPOR
TThe Group is committed to high standards of corporate governance for the enhancement of shareholders’ value. The Company believes that good corporate governance is not only in the interest of investors but also in the interest of the Company. It is also of the view that good corporate governance is a reflection of the standard and quality of the management and operations of the Company and it also helps sustain the long-term support of shareholders on which the Company’s success is dependent upon.
The Company closely monitors corporate governance development in Hong Kong and overseas, and with this objective, it regularly reviews its corporate governance practices in light of experience and evolving regulatory requirements to ensure that the Company keeps abreast of shareholders’ expectations. The principles of corporate governance adopted by the Group emphasise a quality board of Directors (“Board”),soundinternalcontrol,andtransparencyandaccountabilitytoshareholders.
Code on Corporate Governance PracticesThe Company has complied with all the code provisions of the Code on Corporate Governance Practices contained in Appendix 14 to the Listing Rules throughout the year ended 31 December 2010, except that the Chairman was unable to attend the Company’s annual general meeting held on 14 May 2010 (which was required under the code provision E.1.2) as he was out of town for another engagement.
Model Code for Securities Transactions by DirectorsThe Company has adopted the Model Code for Securities Transactions by Directors of Listed Issuers (“ModelCode”)containedinAppendix10totheListingRulesastheGroup’scodeofconductregardingDirectors’ securities transactions. Having made specific enquiry with the Directors, all Directors confirmed that they have complied with the required standard as set out in the Model Code during the year ended 31 December 2010.
The BoardThe principal duty of the Board is to ensure that the Company is properly managed in the interest of shareholders.
The Board, led by the Chairman, is responsible for the formulation of Group-wide strategies and policies, including an oversight of the management of the Company. Management is responsible for the day-to-day operations of the Group under the leadership of the Executive Directors.
As at 31 December 2010, the Board comprised 11 Directors, including the Chairman, Chief Executive Officer, Chief Financial Officer, five Non-executive Directors (one is an Alternate Director) and three Independent Non-executive Directors. One of the Independent Non-executive Directors has appropriate professional qualifications, or accounting or related financial management expertise. Biographical details oftheDirectorsaresetoutinthe“Directors’Profile”sectiononpages17to19andonthewebsiteoftheCompany (www.tomgroup.com).

Annual Report 2010
CO
RPO
RA
TE GO
VER
NA
NC
E REPO
RT
21For a Director to be considered independent, the Board must be satisfied that the Director does not have any direct or indirect material relationship with the Group. In determining the independence of Directors, the Board follows the requirements of the Listing Rules. Each of the Independent Non-executive Directors has made an annual confirmation of independence pursuant to Rule 3.13 of the Listing Rules. The Company is of the view that all the Independent Non-executive Directors meet the independence guidelines set out in Rule 3.13 of the Listing Rules and considers that they are independent.
The position of the Chairman and the Chief Executive Officer are held by separate individuals. The role of the Chairman is separate from that of the Chief Executive Officer. Such division of responsibilities helps to reinforce their independence and accountability.
The Chairman is responsible for providing leadership to, and overseeing the functioning of, the Board to ensure that it acts in the best interests of the Group and the Board meetings are planned and conducted effectively. The Chairman is primarily responsible for drawing up and approving the agenda for each Board meeting, taking into account, where appropriate, any matters proposed by other Directors for inclusion in the agenda. With the support of Executive Directors and the Company Secretary, the Chairman seeks to ensure that all Directors are properly informed of issues arising at Board meetings and receive adequate and accurate information in a timely manner. The Chairman also actively encourages Directors to be fully engaged in the Board’s affairs and contribute to the Board’s functions. To this end, the Chairman holds meetings with the Non-executive Directors at least annually without the Executive Directors present. The Board, under the leadership of the Chairman, has adopted good corporate governance practices and procedures and taken appropriate steps to provide effective communication with shareholders.
The Chief Executive Officer is responsible for managing the businesses of the Group, attending to the formulation and successful implementation of Group policies and assuming full accountability to the Board for all Group operations. Acting as the principal manager of the Group’s businesses, the Chief Executive Officer attends to developing strategic operating plans that reflect the longer-term objectives and priorities established by the Board and is directly responsible for maintaining the operational performance of the Group. Working with the Chief Financial Officer and senior management of each business unit, he presents annual budgets to the Board for consideration and approval, and ensures that the Board is fully apprised of the funding requirements of the businesses of the Group. With the assistance of the Chief Financial Officer, the Chief Executive Officer sees to it that the funding requirements of the businesses of the Group are met and closely monitors the operating and financial results of the businesses against plans and budgets, and takes remedial actions if necessary. Moreover, the Chief Executive Officer maintains ongoing dialogue with the Chairman and all Directors to keep them fully informed of all major business development and issues. He is also responsible for building and maintaining an effective executive team to support him in his role. Furthermore, he also represents the Group in government bodies and professional and trade associations.
The Board meets regularly, and at least 4 times a year with meeting dates scheduled at the beginning of the year. Between scheduled meetings, senior management of the Group provides information to Directors on a regular basis with respect to the activities and development of the businesses of the Group. In addition, Directors have full access to information on the Group and independent professional advice at all times whenever deemed necessary by the Directors and they are liberty to propose appropriate matters for inclusion in Board agendas.
TOM Group Limited
CO
RPO
RA
TE G
OV
ERN
AN
CE
REP
OR
T22
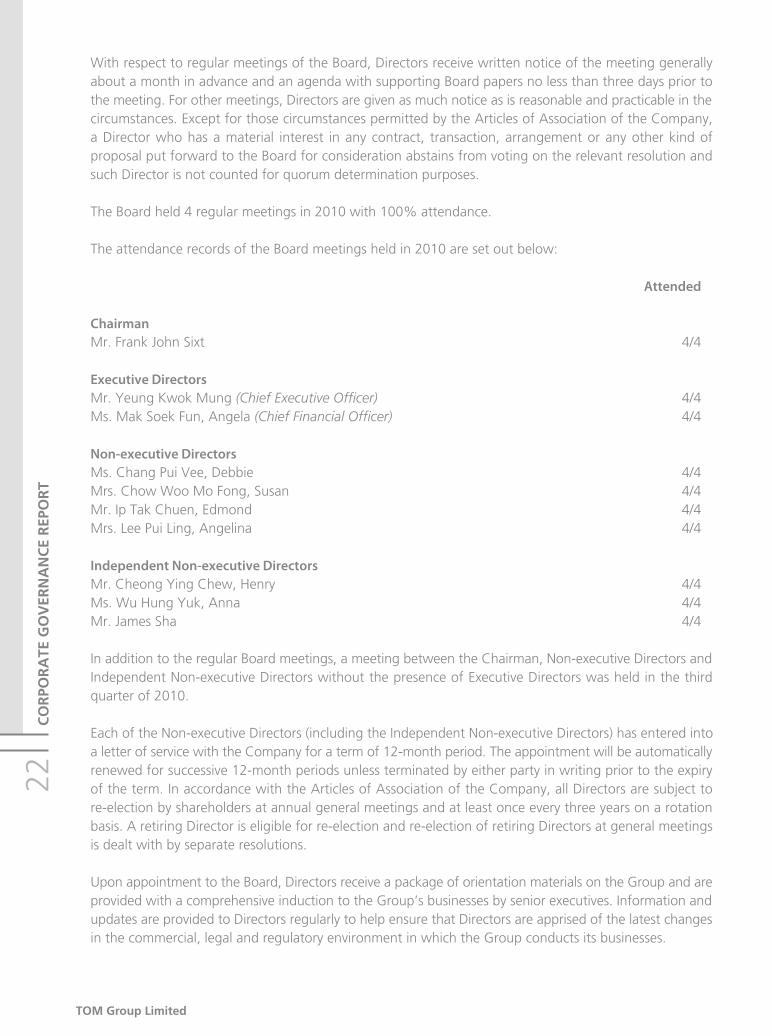
With respect to regular meetings of the Board, Directors receive written notice of the meeting generally about a month in advance and an agenda with supporting Board papers no less than three days prior to the meeting. For other meetings, Directors are given as much notice as is reasonable and practicable in the circumstances. Except for those circumstances permitted by the Articles of Association of the Company, a Director who has a material interest in any contract, transaction, arrangement or any other kind of proposal put forward to the Board for consideration abstains from voting on the relevant resolution and such Director is not counted for quorum determination purposes.
The Board held 4 regular meetings in 2010 with 100% attendance.
The attendance records of the Board meetings held in 2010 are set out below:
Attended
ChairmanMr. Frank John Sixt 4/4
Executive DirectorsMr. Yeung Kwok Mung (Chief Executive Officer) 4/4Ms. Mak Soek Fun, Angela (Chief Financial Officer) 4/4
Non-executive DirectorsMs. Chang Pui Vee, Debbie 4/4Mrs. Chow Woo Mo Fong, Susan 4/4Mr. Ip Tak Chuen, Edmond 4/4Mrs. Lee Pui Ling, Angelina 4/4
Independent Non-executive DirectorsMr. Cheong Ying Chew, Henry 4/4Ms. Wu Hung Yuk, Anna 4/4Mr. James Sha 4/4
In addition to the regular Board meetings, a meeting between the Chairman, Non-executive Directors and Independent Non-executive Directors without the presence of Executive Directors was held in the third quarter of 2010.
Each of the Non-executive Directors (including the Independent Non-executive Directors) has entered into a letter of service with the Company for a term of 12-month period. The appointment will be automatically renewed for successive 12-month periods unless terminated by either party in writing prior to the expiry of the term. In accordance with the Articles of Association of the Company, all Directors are subject to re-election by shareholders at annual general meetings and at least once every three years on a rotation basis. A retiring Director is eligible for re-election and re-election of retiring Directors at general meetings is dealt with by separate resolutions.
Upon appointment to the Board, Directors receive a package of orientation materials on the Group and are provided with a comprehensive induction to the Group’s businesses by senior executives. Information and updates are provided to Directors regularly to help ensure that Directors are apprised of the latest changes in the commercial, legal and regulatory environment in which the Group conducts its businesses.

Annual Report 2010
CO
RPO
RA
TE GO
VER
NA
NC
E REPO
RT
23Board CommitteesThe Board is supported by two permanent Board committees: the Audit Committee and the Remuneration Committee, details of which are described later in this report. The terms of references of these committees adopted by the Board are published on the Company’s website.
Directors’ Responsibility for the Financial StatementsThe annual and interim results of the Company are published in a timely manner, within three months and two months respectively of the year end and the half year end.
The Directors acknowledge their responsibility for preparing the financial statements of the Group. With the assistance of the Finance Department which is under the supervision of the Chief Financial Officer, the Directors ensure the financial statements of the Group are prepared in accordance with the statutory requirements and applicable accounting standards. The Directors also ensure the publication of the financial statements of the Group is made in a timely manner. The Directors, having made appropriate enquiries, consider that the Group has adequate resources to continue in operational existence for the foreseeable future and that, for this reason, it is appropriate for the Group to adopt the going concern basis in preparing the financial statements.
The statement of the auditor of the Company about their reporting responsibilities on the financial statements of the Group is set out in the Independent Auditor’s Report on pages 43 to 44.
Audit CommitteeThe Company has established the Audit Committee in January 2000. The Audit Committee consists of three Independent Non-executive Directors and one Non-executive Director. One of the Independent Non-executive Directors has the appropriate professional qualifications, accounting or related financial management expertise. It is chaired by Mr. Cheong Ying Chew, Henry and the other members include Ms. Wu Hung Yuk, Anna, Mr. James Sha and Mrs. Lee Pui Ling, Angelina.
The principal duties of the Audit Committee include, among other things, oversight of the relationship with external auditor, review of the Group’s financial information and oversight of the Group’s financial reporting system and internal control procedures.
The Audit Committee held 6 meetings in 2010 with 100% attendance.
The attendance records of the Audit Committee meetings held in 2010 are set out below:
Name of Members Attended
Mr. Cheong Ying Chew, Henry (Chairman) 6/6Ms. Wu Hung Yuk, Anna 6/6Mr. James Sha 6/6Mrs. Lee Pui Ling, Angelina 6/6

TOM Group Limited
CO
RPO
RA
TE G
OV
ERN
AN
CE
REP
OR
T24
For 2010, the Audit Committee reviewed with senior management and the Company’s internal and/or external auditor, where applicable, their respective audit findings, the accounting principles and practices adopted by the Group, legal and regulatory compliance, and internal control, risk management and financial reporting matters (including the interim and annual financial statements for the year ended 31 December 2010 before recommending them to the Board for approval). In particular, the Audit Committee monitored the integrity of financial statements of the Group and the annual report and accounts and interim report and accounts of the Company, discussed such annual report and audited accounts and interim report and accounts with management and the external auditor, and reviewed significant financial reporting judgements contained therein. In this regard, in reviewing such reports and accounts of the Company before submission to the Board, the Audit Committee focused particularly on:
(a) any changes in financial reporting and accounting policies and practices;
(b) major judgmental areas;
(c) significant adjustments resulting from audit;
(d) the going concern assumption and any qualifications;
(e) compliance with accounting standards; and
(f) compliance with the Listing Rules and any other legal requirements in relation to financial reporting.
The audited consolidated results of the Group for the year ended 31 December 2010 have been reviewed by the Audit Committee.
Auditors’ RemunerationThe amount of fees charged by the auditors generally depends on the scope and volume of the auditors’ work. For the year ended 31 December 2010, the remunerations to the auditors of the Company were approximately HK$10,141,000 for audit services and HK$878,000 for non-audit services comprising tax and consultancy services.

Annual Report 2010
CO
RPO
RA
TE GO
VER
NA
NC
E REPO
RT
25Remuneration CommitteeThe Company has established the Remuneration Committee in March 2000. The Remuneration Committee consists of two Non-executive Directors (one is an alternate member) and two Independent Non-executive Directors. It is chaired by Mr. Frank John Sixt (his alternate, Mrs. Chow Woo Mo Fong, Susan) and the other members include Mr. Cheong Ying Chew, Henry and Ms. Wu Hung Yuk, Anna. Normally, the remuneration packages of Directors and senior management of the Group are approved by the written resolutions signed by all members of the Remuneration Committee at the end of each year. The Remuneration Committee will also meet as and when required to consider remuneration related matters.
The Remuneration Committee assists the Board to develop and administer a fair and transparent procedure for setting policy on the remuneration of Directors and senior management of the Company and for determining their remuneration packages and also responsible for the administration of the share option schemes adopted by the Company.
Executive Directors, assisted by the Human Resources Department, are responsible for reviewing all relevant remuneration data and market conditions as well as the performance of the individual and the profitability of the Group, and propose to the Remuneration Committee for consideration and approval, remuneration packages for Directors and senior management. Executive Directors do not participate in the determination of their own remuneration.
Consistent with the principles applied in the past, for the year ended 31 December 2010, the remuneration of Directors and senior management was determined with reference to the performance and profitability of the Group as well as remuneration benchmarks from other local and international companies and the prevailing market conditions. Directors and employees also participate in bonus arrangements which are determined in accordance with the performance of the Group and the individual’s performance.
Details of Directors’ emoluments for the year ended 31 December 2010 are set out in note 13 to the financial statements.

TOM Group Limited
CO
RPO
RA
TE G
OV
ERN
AN
CE
REP
OR
T26
Internal ControlInternal control system, being an integral part of the Group’s operations, is a process effected by the Board and management team to provide reasonable assurance on the effectiveness and efficiency of operations in achieving the established corporate objectives, safeguarding Group assets, providing reliable financial reporting, and complying with applicable laws and regulations.
The Board is responsible for making appropriate assertions on the adequacy of internal controls over financial reporting and the effectiveness of disclosure controls and procedures. Through the Audit Committee, it regularly reviews the effectiveness of risk management and control activities within the Group’s business operations.
The Board, through the Audit Committee, has conducted a review of the effectiveness of the Group’s internal control systems for the year ended 31 December 2010 covering all material financial, operational and compliance controls and risk management functions, and is satisfied that such systems are effective and adequate.
Investor Relations and Shareholders’ RightsThe Group actively promotes investor relations and communications by setting up regular meetings between our senior management and institutional shareholders and analysts. General presentations are also made when the financial results are announced.
The Board is committed to providing clear and full information of the Group to shareholders through the publication of notices, announcements, circulars, interim and annual reports. Moreover, additional information is also available to shareholders on the website of the Company.
The annual general meeting provides a useful forum for shareholders to raise comments and exchange views with the Board. Shareholders are encouraged to attend the annual general meetings for which the Company gives at least 20 clear business days’ notice. The Chairman, Directors and external auditor are available to answer questions on the Group’s businesses at the meeting.
Shareholders have statutory rights to call for extraordinary general meetings by serving written requisition to the Company and put forward agenda items for consideration by shareholders. Votes of shareholders at general meetings will be taken by poll and the results of the poll are published on the websites of the Company and the Stock Exchange. Financial and other information on the Group is available on the Company’s website, which is updated regularly.
The Company values feedback from shareholders on its effort to promote transparency and foster investor relationships. Comments and suggestions are welcome and can be addressed to our Investor Relations Manager by mail or by e-mail to the Group at [email protected].

Annual Report 2010
27REPORT OF THE DIRECTORS
The Directors have pleasure in submitting their report together with the audited financial statements for the year ended 31 December 2010.
Principal activities and geographical analysis of operationsThe principal activity of the Company is investment holding. The activities of its principal subsidiaries, jointly controlled entities and associated companies are set out on pages 127 to 131.
An analysis of the Group’s performance for the year by operating and geographical segments is set out in note 4 to the financial statements.
Results and appropriationsThe results for the year are set out in the consolidated income statement on page 45.
The Directors do not recommend the payment of a dividend.
ReservesDetails of the movements in the reserves of the Group and the Company during the year are set out in consolidated statement of changes in equity and note 35 to the financial statements.
Fixed assetsDetails of the movements in fixed assets of the Group are set out in note 14 to the financial statements.
Share capital and share optionsDetails of the movements in share capital and share options of the Company are set out in notes 33 and 34 to the financial statements respectively.
Distributable reservesDetails of the distributable reserves of the Company as at 31 December 2010 are set out in note 35 to the financial statements.

TOM Group Limited
REP
OR
T O
F TH
E D
IREC
TOR
S28
DirectorsThe Directors who held office during the year and up to the date of this report were:
Mr. Frank John Sixt * (Chairman)Mr. Yeung Kwok Mung (Chief Executive Officer)Ms. Mak Soek Fun, AngelaMs. Chang Pui Vee, Debbie *Mrs. Chow Woo Mo Fong, Susan *Mr. Ip Tak Chuen, Edmond *Mr. Cheong Ying Chew, Henry #
Mrs. Lee Pui Ling, Angelina *Ms. Wu Hung Yuk, Anna #
Mr. James Sha #
Mr. Francis Anthony Meehan * (alternate Director to each of Mr. Frank John Sixt, Ms. Chang Pui Vee, Debbie, Mrs. Chow Woo Mo Fong, Susan and Mr. Ip Tak Chuen, Edmond)
* Non-executive Directors# Independent Non-executive Directors
In accordance with Article 116 of the Company’s Articles of Association, Mr. Yeung Kwok Mung, Mr. Ip Tak Chuen, Edmond, Mr. Cheong Ying Chew, Henry and Mrs. Lee Pui Ling, Angelina will retire by rotation at the forthcoming annual general meeting and, being eligible, will offer themselves for re-election.
Each of the Non-executive Directors (including the independent Non-executive Directors) has entered intoa letterofservicewiththeCompanyfora termof12-month (“Term”).Theappointmentwillbeautomatically renewed for successive 12-month periods unless terminated by either party in writing prior to the expiry of the Term. All Directors are subject to retirement by rotation at annual general meetings at least once every three years and, being eligible, offer themselves for re-election.
Directors’ service contractsNone of the Directors being proposed for re-election at the forthcoming annual general meeting of the Company has entered into any service contract with any member of the Group which is not determinable by the Company within one year without payment of compensation (other than statutory compensation).
Confirmation of independence of Independent Non-executive DirectorsThe Company has received from each of Mr. Cheong Ying Chew, Henry, Ms. Wu Hung Yuk, Anna and Mr. James Sha an annual confirmation of his or her independence pursuant to Rule 3.13 of the Listing Rules and the Company still considers the Independent Non-executive Directors to be independent.
Directors’ profileThe Directors’ profile is set out on pages 17 to 19.

Annual Report 2010
REPO
RT O
F THE D
IREC
TOR
S29
Directors’ emolumentsDetails of the Directors’ emoluments are set out in note 13 to the financial statements.
Share Option SchemesPursuant to the written resolutions of the shareholders of the Company dated 11 February 2000, two share option schemesnamely, the Pre-IPO ShareOption Plan (“Pre-IPO ShareOption Plan”) and theemployeesshareoptionscheme(asamendedon24April2002)(“OldOptionScheme”)wereadoptedbythe Company.
Pursuant to an ordinary resolution passed at the extraordinary general meeting of the Company held on 23July2004,theCompanyadoptedanewshareoptionscheme(“NewOptionScheme”)andterminatedthe Old Option Scheme due to the withdrawal of the listing of the shares of the Company on GEM and commencement of dealings of the shares of the Company on the Main Board. The adoption of the New Option Scheme and the termination of the Old Option Scheme took effect from 4 August 2004 (listing date of the shares of the Company on the Main Board) (the Pre-IPO Share Option Plan, the Old Option SchemeandtheNewOptionSchemecollectivelyarereferredtoasthe“Schemes”).
Summary of the Schemes(a) Purpose of the Schemes
The purpose of the Pre-IPO Share Option Plan is to recognise the contribution made by the executive directors and the employees of the Company prior to the listing of shares of the Company on GEM.
The purpose of the Old Option Scheme and the New Option Scheme is to attract, retain and motivate talented participants to strive for future developments and expansion of the Group. The Old Option Scheme shall be an incentive to encourage the participants and to allow the participants to enjoy the results of the Company attained through their efforts and contribution.
(b) Participants of the SchemesPursuant to the Pre-IPO Share Option Plan, the Company may grant options to any full-time employee of the Company or of its subsidiaries or of HWL or any subsidiary of HWL to subscribe for shares in the Company. However, save for the options which have been granted on 11 February 2000, no further options may be granted upon the listing of the shares of the Company on GEM on 1 March 2000.
Pursuant to the Old Option Scheme and the New Option Scheme, the Board may, at its discretion, invite any participant (including any employee and director of the Group and of any company in which the Group owns or controls 20% or more of its voting rights and/or issued share capital, business associate and trustee) to take up option to subscribe for shares of the Company. However, participants do not include any substantial shareholder of the Company and/or any of its Associates. No further options may be granted under the Old Option Scheme upon its termination.
(c) Total number of shares available for issue under the SchemesThe total number of shares of the Company which may be issued upon exercise of all options to be granted under the New Option Scheme and any other share option schemes of the Company shall not in aggregate exceed 10% of the total number of shares of the Company in issue as at the date of approval of the New Option Scheme (i.e. 388,941,336 shares of the Company, which represents approximately 10% of the issued share capital of Company as at 24 March 2011).

TOM Group Limited
REP
OR
T O
F TH
E D
IREC
TOR
S30
The maximum number of shares of the Company which may be issued upon exercise of outstanding options granted and yet to be exercised under the Schemes and any other share option schemes of the Company shall not exceed 30% of the total number of shares of the Company in issue from time to time.
(d) Maximum entitlement of each participantThe total number of shares of the Company issued and to be issued upon exercise of the options granted to each participant (including exercised, cancelled and outstanding options) in any 12-month period shall not exceed 1% of the total number of shares of the Company in issue.
(e) Time of exercise of optionsPursuant to the Pre-IPO Share Option Plan, any option may be exercised in accordance with its terms at any time during a period to be notified by the Board to each grantee provided that the period within which the option must be exercised shall be not less than 3 years and not more than 10 years from the date of grant of the option.
Pursuant to the Old Option Scheme and the New Option Scheme, any option may be exercised in accordance with its terms at any time during a period to be notified by the Board to each grantee provided that the period within which the options must be exercised shall not be more than 10 years from the date of grant of the option.
(f) Payment on acceptance of optionPursuant to the Schemes, HK$5 is payable by the grantee to the Company on acceptance of the option within 28 days from the date of grant of the option.
(g) Basis of determining the subscription priceThe subscription price per share under the Pre-IPO Share Option Plan is HK$1.78, being the price per share at which the shares are offered for subscription by the public at the initial public offer of shares of the Company.
The subscription price per share under the Old Option Scheme and the New Old Scheme shall be determined by the Board at its absolute discretion and notified to each participant and shall be no less than the higher of:–
(i) the closing price of the shares of the Company as stated in the daily quotation sheets issued by the Stock Exchange on the date of grant, which must be a business day;
(ii) the average closing price of the shares of the Company as stated in the daily quotation sheets issued by the Stock Exchange for the five business days immediately preceding the date of grant; and
(iii) the nominal value of a share of the Company.

Annual Report 2010
REPO
RT O
F THE D
IREC
TOR
S31
(h) Remaining life of the SchemesThe Pre-IPO Share Option Plan and the Old Option Scheme have no remaining life as no further options may be granted but the provisions of the Pre-IPO Share Option Plan and the Old Option Scheme shall in all other respects remain in full force and effect and options which are granted during the life of the Pre-IPO Share Option Plan and the Old Option Scheme respectively may continue to be exercisable in accordance with their respective terms of issue.
The New Option Scheme will continue to be in full force and effect for a period of 10 years commencing on 23 July 2004 (save that the Company, by ordinary resolution in general meeting or the Board may at any time terminate the operation of the New Option Scheme). After termination, no further options will be granted but the provisions of the New Option Scheme shall in all other respects remain in full force and effect and the options which are granted during the life of the New Option Scheme may continue to be exercised in accordance with their terms of issue.
The other principal terms of the Pre-IPO Share Option Plan, the Old Option Scheme and the New Option Scheme are set out in the listing document of the Company dated 29 June 2004.
Outstanding share options(a) Pre-IPO Share Option Plan
As at 31 December 2010, there was no outstanding share option granted under the Pre-IPO Share Option Plan. Details of the share option movement during the year ended 31 December 2010 were as follows:
Number of share options Outstanding Outstanding Subscription as at Exercised Lapsed Cancelled as at price per Date of 1 January during the during the during the 31 December Option share of the grant 2010 year year year 2010 Period Company HK$
Directors 11/2/2000 3,026,000 – (3,026,000) – – 11/2/2000 – 1.78 10/2/2010
Employees (including ex-employees) 11/2/2000 4,090,000 – (4,090,000) – – 11/2/2000 – 1.78 10/2/2010
Total: 7,116,000 – (7,116,000) – –

TOM Group Limited
REP
OR
T O
F TH
E D
IREC
TOR
S32
(b) Old Option SchemeAs at 31 December 2010, options to subscribe for an aggregate of 6,976,000 shares of the Company which were granted to certain Directors and continuous contract employees and ex-employees of the Group were outstanding. Details of the share option movement during the year ended 31 December 2010 were as follows:
Number of share options Outstanding Outstanding Subscription as at Granted Exercised Lapsed Cancelled as at price per Date of 1 January during during the during the during the 31 December Option share of the grant 2010 the year year year year 2010 Period Company HK$
Directors 15/11/2000 15,000,000 – – (15,000,000) – – 15/11/2000 – 5.30 (Note 1) 14/11/2010
9/10/2003 6,000,000 – – – – 6,000,000 9/10/2003 – 2.505 8/10/2013
Employees 23/3/2000 1,134,000 – – (1,092,000) (42,000) – 23/3/2000 – 11.30 (including 22/3/2010 ex–employees) 26/6/2000 304,000 – – (220,000) (84,000) – 26/6/2000 – 5.89 25/6/2010
8/8/2000 3,632,000 – – (2,990,000) (642,000) – 8/8/2000 – 5.30 7/8/2010
9/10/2003 1,358,000 – – – (382,000) 976,000 9/10/2003 – 2.505 (Note 2) 8/10/2013
Total: 27,428,000 – – (19,302,000) (1,150,000) 6,976,000
Notes:
1. DetailsoftheoptionsgrantedtotheDirectorsaresetoutinthesectionheaded“Directors’interestsandshortpositionsinshares,underlyingsharesanddebentures”below.
2. (i) For certain grantees, all the options have vested on 10 October 2003.
(ii) For certain grantees, the options have vested in four tranches. The first tranche of the options has vested on 10 October 2003 and the remaining tranches of the options have vested on the anniversaries of their respective joining dates with the Group in 2004, 2005 and 2006.
(iii) For certain grantees, the options have vested in three tranches in the proportion of 1/3:1/3:1/3. The first tranche of the options has vested on the anniversaries of their respective joining dates with the Group in 2004, the second and third tranches of the options have vested on the anniversaries of their respective joining dates with the Group in 2005 and 2006.

Annual Report 2010
REPO
RT O
F THE D
IREC
TOR
S33
(c) New Option SchemeNo option has been granted pursuant to the New Option Scheme since its adoption.
Directors’ interests and short positions in shares, underlying shares and debenturesAs at 31 December 2010, the interests or short positions of the Directors and chief executive in the shares, underlying shares and debentures of the Company or any of its associated corporations (within the meaning of Part XV of the SFO) which were notified to the Company and the Stock Exchange pursuant to Divisions 7 and 8 of Part XV of the SFO (including interests or short positions which they are taken or deemed to have under such provisions of the SFO), or which were required, pursuant to Section 352 of the SFO, to be entered in the register referred to therein, or which were required, pursuant to the Model Code forSecuritiesTransactionsbyDirectorsofListedIssuers(“ModelCode”),tobenotifiedtotheCompanyand the Stock Exchange, were as follows:
(a) Long positions in shares of the Company
Number of shares of the Company ApproximateName of Capacity Personal Family Corporate Other percentage ofDirectors Interests Interests Interests Interests Total shareholding
Yeung Kwok Mung Interest – 30,000 – – 30,000 Below 0.01% of spouse
Mak Soek Fun, Beneficial 44,000 – – – 44,000 Below 0.01% Angela owner
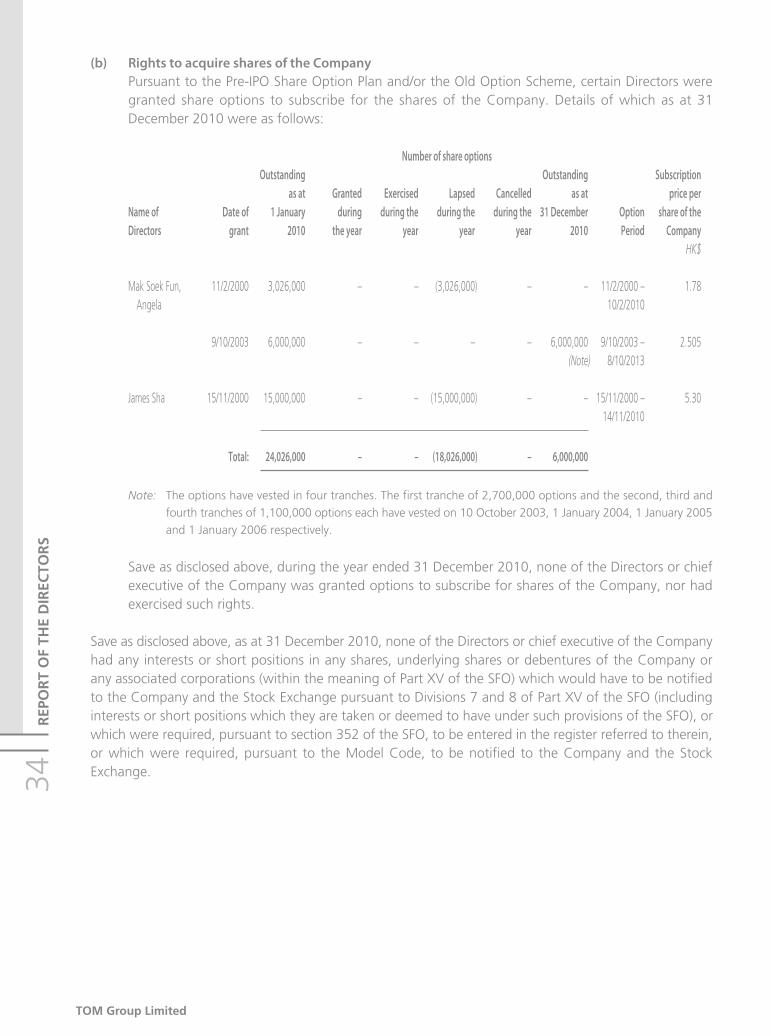
TOM Group Limited
REP
OR
T O
F TH
E D
IREC
TOR
S34
(b) Rights to acquire shares of the CompanyPursuant to the Pre-IPO Share Option Plan and/or the Old Option Scheme, certain Directors were granted share options to subscribe for the shares of the Company. Details of which as at 31 December 2010 were as follows:
Number of share options Outstanding Outstanding Subscription as at Granted Exercised Lapsed Cancelled as at price perName of Date of 1 January during during the during the during the 31 December Option share of theDirectors grant 2010 the year year year year 2010 Period Company HK$
Mak Soek Fun, 11/2/2000 3,026,000 – – (3,026,000) – – 11/2/2000 – 1.78 Angela 10/2/2010
9/10/2003 6,000,000 – – – – 6,000,000 9/10/2003 – 2.505 (Note) 8/10/2013
James Sha 15/11/2000 15,000,000 – – (15,000,000) – – 15/11/2000 – 5.30 14/11/2010
Total: 24,026,000 – – (18,026,000) – 6,000,000
Note: The options have vested in four tranches. The first tranche of 2,700,000 options and the second, third and fourth tranches of 1,100,000 options each have vested on 10 October 2003, 1 January 2004, 1 January 2005 and 1 January 2006 respectively.
Save as disclosed above, during the year ended 31 December 2010, none of the Directors or chief executive of the Company was granted options to subscribe for shares of the Company, nor had exercised such rights.
Save as disclosed above, as at 31 December 2010, none of the Directors or chief executive of the Company had any interests or short positions in any shares, underlying shares or debentures of the Company or any associated corporations (within the meaning of Part XV of the SFO) which would have to be notified to the Company and the Stock Exchange pursuant to Divisions 7 and 8 of Part XV of the SFO (including interests or short positions which they are taken or deemed to have under such provisions of the SFO), or which were required, pursuant to section 352 of the SFO, to be entered in the register referred to therein, or which were required, pursuant to the Model Code, to be notified to the Company and the Stock Exchange.

Annual Report 2010
REPO
RT O
F THE D
IREC
TOR
S35
Interests and short positions of shareholders
As at 31 December 2010, the persons or corporations (not being a Director or chief executive of the Company) who have interests or short positions in the shares and underlying shares of the Company as recorded in the register required to be kept under section 336 of the SFO or have otherwise notified to the Company were as follows:
Approximate No. of shares of percentage ofName Capacity the Company held shareholding
Li Ka-shing Founder of 1,429,024,545 (L) (Notes 1 & 2) 36.70% discretionary trusts & interest of controlled corporations
Li Ka-Shing Unity Trustee Trustee & 1,429,024,545 (L) (Notes 1 & 2) 36.70% Corporation Limited beneficiary (as trustee of The Li Ka-Shing of a trust Unity Discretionary Trust)
Li Ka-Shing Unity Trustee & 1,429,024,545 (L) (Notes 1 & 2) 36.70% Trustcorp Limited beneficiary (as trustee of another of a trust discretionary trust)
Li Ka-Shing Unity Trustee 1,429,024,545 (L) (Notes 1 & 2) 36.70% Trustee Company Limited (as trustee of The Li Ka-Shing Unity Trust)
CKH Interest of 1,429,024,545 (L) (Notes 1 & 2) 36.70% controlled corporations
Cheung Kong Investment Interest of 476,341,182 (L) (Note 1) 12.23% Company Limited controlled corporations
Cheung Kong Holdings (China) Interest of 476,341,182 (L) (Note 1) 12.23% Limited controlled corporations
Sunnylink Enterprises Limited Interest of a 476,341,182 (L) (Note 1) 12.23% controlled corporation

TOM Group Limited
REP
OR
T O
F TH
E D
IREC
TOR
S36
Approximate No. of shares of percentage ofName Capacity the Company held shareholding
Romefield Limited Beneficial 476,341,182(L) (Note 1) 12.23% owner
HWL Interest of 952,683,363(L) (Note 2) 24.47% controlled corporations
Hutchison International Limited Interest of a 952,683,363(L) (Note 2) 24.47% controlled corporation
Easterhouse Limited Beneficial 952,683,363(L) (Note 2) 24.47% owner
Chau Hoi Shuen Interest of 993,498,363(L) (Notes 3 & 4) 25.51% controlled corporations
Cranwood Company Limited Beneficial 993,498,363(L) (Notes 3 & 4) 25.51% owner & interest of controlled corporations
Schumann International Limited Beneficial 580,000,000(L) (Notes 3 & 4) 14.90% owner
Handel International Limited Beneficial 348,000,000(L) (Notes 3 & 4) 8.94% owner
(L) denotes a long position
Notes:
(1) Romefield Limited is a wholly-owned subsidiary of Sunnylink Enterprises Limited, which in turn is a wholly-owned subsidiary of Cheung Kong Holdings (China) Limited. Cheung Kong Holdings (China) Limited is a wholly-owned subsidiary of Cheung Kong Investment Company Limited, which in turn is a wholly-owned subsidiary of CKH.
By virtue of the SFO, Cheung Kong Investment Company Limited, Cheung Kong Holdings (China) Limited and Sunnylink Enterprises Limited are all deemed to be interested in the 476,341,182 shares of the Company held by Romefield Limited.

Annual Report 2010
REPO
RT O
F THE D
IREC
TOR
S37
Li Ka-Shing Unity Holdings Limited, of which each of Mr. Li Ka-shing, Mr. Li Tzar Kuoi, Victor and Mr. Li Tzar Kai, Richard is interested in one-third of the entire issued share capital, owns the entire issued share capital of Li Ka-Shing Unity Trustee Company Limited. Li Ka-Shing Unity Trustee Company Limited as trustee of The Li Ka-Shing Unity Trust, together with certain companies which Li Ka-Shing Unity Trustee Company Limited as trustee of The Li Ka-Shing Unity Trust is entitled to exercise or control the exercise of more than one-third of the voting power at their general meetings, hold more than one-third of the issued share capital of CKH.
In addition, Li Ka-Shing Unity Holdings Limited also owns the entire issued share capital of Li Ka-Shing Unity Trustee CorporationLimited(“TDT1”)astrusteeofTheLiKa-ShingUnityDiscretionaryTrust(“DT1”)andLiKa-ShingUnityTrustcorpLimited(“TDT2”)astrusteeofanotherdiscretionarytrust(“DT2”).EachofTDT1andTDT2holdunitsinThe Li Ka-Shing Unity Trust.
(2) Easterhouse Limited is a wholly-owned subsidiary of Hutchison International Limited, which in turn is a wholly-owned subsidiary of HWL. By virtue of the SFO, HWL and Hutchison International Limited are deemed to be interested in the 952,683,363 shares of the Company held by Easterhouse Limited.
In addition, subsidiaries of CKH are entitled to exercise or control the exercise of more than one-third of the voting power at the general meetings of HWL. By virtue of the SFO, Mr. Li Ka-shing, being the settlor and may being regarded as a founder of each of DT1 and DT2 for the purpose of the SFO, Li Ka-Shing Unity Trustee Corporation Limited, Li Ka-Shing Unity Trustcorp Limited, Li Ka-Shing Unity Trustee Company Limited and CKH are all deemed to be interested in the 476,341,182 shares of the Company and 952,683,363 shares of the Company held by Romefield Limited and Easterhouse Limited respectively.
(3) Schumann International Limited and Handel International Limited are companies controlled by Cranwood Company Limited and Ms. Chau Hoi Shuen is entitled to exercise more than one-third of the voting power at the general meetings of Cranwood Company Limited.
By virtue of the SFO, Cranwood Company Limited is deemed to be interested in the 580,000,000 shares of the Company and 348,000,000 shares of the Company held by Schumann International Limited and Handel International Limited respectively in addition to 65,498,363 shares of the Company held by itself.
By virtue of the SFO, Ms. Chau Hoi Shuen is deemed to be interested in 65,498,363 shares of the Company, 580,000,000 shares of the Company and 348,000,000 shares of the Company held by Cranwood Company Limited, Schumann International Limited and Handel International Limited respectively.
(4) Cranwood Company Limited, Schumann International Limited and Handel International Limited have charged 63,004,363 shares of the Company, 580,000,000 shares of the Company and 348,000,000 shares of the Company respectively in favour of HWL on 20 July 2009.
Save as disclosed above, as at 31 December 2010, the Directors are not aware of any other person or corporation having an interest or short position in the shares and underlying shares of the Company representing 5% or more of the issued share capital of the Company.
Connected transactionsSignificant related party transactions entered by the Group during the year ended 31 December 2010, which do not constitute connected transactions under the Listing Rules are disclosed in note 42 to the financial statements.

TOM Group Limited
REP
OR
T O
F TH
E D
IREC
TOR
S38
Continuing connected transactions(a) On 30 December 2008, TOM International, a wholly-owned subsidiary of the Company, has entered
into an advertising services agreement with CKH, a substantial shareholder of the Company, under which, TOM International shall provide, and/or to procure other members of the Group to provide the print, publishing, advertising and other services to the CKH Group at a fee to be calculated with reference to the then market rate for a term commencing from 1 January 2009 and expiring on 31 December 2011, subject to the annual caps of HK$2,000,000 each for the years 2009, 2010 and 2011 respectively. During the year, no advertising fee has been paid by CKH to the Group.
(b) On 30 December 2008, TOM International has entered into an advertising services agreement withHutchison International Limited (“HIL”, awholly-owned subsidiary ofHWL, a substantialshareholder of the Company), under which, TOM International shall provide, and/or to procure other members of the Group to provide the print, publishing, advertising and other services to the HIL Group at a fee to be calculated with reference to the then market rate for a term commencing from 1 January 2009 and expiring on 31 December 2011, subject to the annual caps of HK$25,000,000, HK$25,000,000 and HK$26,000,000 for the years 2009, 2010 and 2011 respectively. On 28 December 2010, TOM International has entered into a supplemental agreement with HIL to revise the annual caps for the year ended 31 December 2010 and the year ending 31 December 2011 to HK$37,000,000 and HK$45,000,000 respectively. During the year, HK$31,313,000 has been paid by HIL to the Group.
(c) InconsiderationofCKH,HWLandCranwoodCompanyLimited(“Cranwood”)(allbeingsubstantialshareholdersoftheCompany)grantingtheguarantees(“Guarantees”)inrespectoftheCompany’sobligations under the term and revolving loan facilities of up to an aggregate principal amount of HK$1,600 million by three independent financial institutions and/or the term loan facility of up to HK$300millioninprincipalamountbyanindependentfinancialinstitution(collectively,the“LoanFacilities”),on21July2009,theCompanyhasenteredintocertainguaranteefeeagreementswithCKH, HWL and Cranwood respectively, under which, the Company has agreed to pay an aggregate guarantee fee in an amount equivalent to 0.5% per annum of the aggregate principal amount outstanding under the Loan Facilities to CKH, HWL and Cranwood payable quarterly in advance in proportion to their respective percentage of the Guarantees given in respect of the obligations of the Company under the Loan Facilities (in the case of CKH and HWL) or the term loan facility (in the case of Cranwood), subject to the annual caps of HK$4,750,000, HK$9,500,000, HK$9,500,000 and HK$5,600,000 for the years 2009, 2010, 2011 and 2012 respectively. During the year, an aggregate of HK$7,217,000 has been paid by the Company to CKH, HWL and Cranwood.
(d) On3December2009, Beijing Lei TingWu JiNetwork TechnologyCompany Limited (“LTWJi”,a subsidiary of the Company) has entered into a tenancy agreement with Beijing Oriental Plaza CompanyLimited(“BeijingOriental”,anAssociateofCKH)inrespectoftherenewaloftheleasebyBeijing Oriental of Rooms 7 & 8, 5th Floor, Tower W3, Oriental Plaza, No. 1 East Chang An Avenue, DongChengDistrict,Beijing,thePRC(“OrientalPlaza”)toLTWJiwithanareaofapproximately656square metre for a term of 3 years commencing from 15 December 2009 to 14 December 2012. The annual total amount of the rent and management fee payable by LTWJi are subject to the annual caps of RMB1,213,600, RMB1,213,600 and RMB1,055,758 for the years 2010, 2011 and 2012 respectively. During the year, RMB1,213,600 has been paid by LTWJi to Beijing Oriental.

Annual Report 2010
REPO
RT O
F THE D
IREC
TOR
S39
(e) On 3 December 2009, 10 subsidiaries of the Company, namely, Beijing Super Channel Network Limited, Beijing Redsail Netlegend Data Network Technology Company Limited, LTWJi, Beijing Lahiji Technology Development Company Limited, Startone (Beijing) Information Technology Company Limited, Beijing Huan Jian Shu Meng Network Technology Limited, Beijing Lei Ting Wan Jun Network Technology Limited, Music Time Cultural Communication (Beijing) Co., Ltd., Beijing Bo Xun Rong Tong Information Technology Company Limited and Beijing Dong Kui Lin Information Technology Limited have entered into a tenancy agreement with Beijing Oriental in respect of the renewal of the lease by Beijing Oriental of Rooms 1-12, 8th Floor, Tower W3, Oriental Plaza to the aforesaid 10 subsidiaries of the Company with a total area of approximately 3,074 square metre for a term of 3 years commencing from 15 December 2009 to 14 December 2012. The annual total amount of the rent and management fee payable by the aforesaid 10 subsidiaries of the Company are subject to the annual caps of RMB5,686,900, RMB5,686,900 and RMB4,947,256 for the years 2010, 2011 and 2012 respectively. During the year, an aggregate of RMB5,686,900 has been paid by the aforesaid 10 subsidiaries of the Company to Beijing Oriental.
(f) On 3 December 2009, 16 subsidiaries of the Company, namely, TOM.COM (China) Investment Limited, TOM International Beijing Representative Office, Shanghai TOM Cite Consulting Limited Beijing Representative Office, China Entertainment Television Broadcast Limited Beijing Representative Office, Beijing Lahiji Technology Development Limited, Beijing LingXun Interactive Science Technology and Development Company Limited, Beijing GreaTom United Technology Company Limited, Beijing TOM International Advertising Limited, Beijing Sharkwave Asia Pacific Network Company Limited, Beijing TOM Interactive Science Cultural Co., Ltd., Beijing TOM Media Marketing Limited, Shenzhen Jia Jia Television Cultural Transmission Company Limited, GuangdongYangchengAdvertisingCompany Limited (“YangchengAdvertising”), SharkwaveAsia Pacific (Beijing) Technology Limited, Beijing Sharkwave Information Technology Company Limited and Sharkwave (Beijing) Technology Limited have entered into a tenancy agreement with Beijing Oriental in respect of the renewal of the lease by Beijing Oriental of Rooms 1-8, 9th Floor, Tower W3, Oriental Plaza to the aforesaid 16 subsidiaries of the Company with a total area of approximately 2,312 square metre for a term of 3 years commencing from 15 December 2009 to 14 December 2012. The annual total amount of the rent and management fee payable by the aforesaid 16 subsidiaries of the Company are subject to the annual caps of RMB4,277,200, RMB4,277,200 and RMB3,720,903 for the years 2010, 2011 and 2012 respectively. During the year, an aggregate of RMB4,277,200 has been paid by the aforesaid 16 subsidiaries of the Company to Beijing Oriental.
(g) On 10 May 2007, Yangcheng Advertising has entered into an advertising agency agreement with GuangdongYangchengWanbaoAdvertisingCompany (“YCWB”, anAssociateofYangchengEveningNewsEconomicDevelopmentCorporation(“YCHeadOffice”),whichowns20%oftheequity interest in Yangcheng Advertising) for a term of 3 years commencing from 1 January 2007 to 31 December 2009. Pursuant to the aforesaid agreement, YCWB has agreed to appoint Yangcheng Advertising as its advertising agent in respect of the placing of advertisements in the newspaper knownas “羊城晚報” (Yangcheng EveningNews) (“Media BuyingArrangement”).Under theMedia Buying Arrangement, YCWB will collect the advertising fees for advertisements placed in YangchengEveningNews(“AdvertisingPayment”)fromYangchengAdvertisingwhichinturnwillcollect the Advertising Payment from its advertising customers. If the aggregate amount of the Advertising Payment reaches a certain pre-agreed amount, Yangcheng Advertising will be entitled to a rebate of certain percentage of the aggregate amount of the Advertising Payment to be agreed in separate agreements between the parties.

TOM Group Limited
REP
OR
T O
F TH
E D
IREC
TOR
S40
On 28 December 2009, Yangcheng Advertising has entered into an advertising agency agreement with YCWB to extend the Media Buying Arrangement under the advertising agency agreement dated 10 May 2007 (as disclosed above) for a term of 3 years commencing from 1 January 2010 to 31 December 2012. The annual caps for the Advertising Payment are HK$23,000,000, HK$24,000,000 and HK$25,000,000 for the years 2010, 2011 and 2012 respectively. During the year, the Advertising Payment paid by Yangcheng Advertising to YCWB amounted to HK$21,693,000.
(h) On 26 March 2010, TOM International has entered into a tenancy agreement with The Center (48) Limited(“TheCenter(48)”,anAssociateofCKH)inrespectoftheleasebyTOMInternationaloftheentire 48th Floor, The Center, 99 Queen’s Road Central, Central, Hong Kong with gross floor area of approximately 25,563 square feet for a term of 3 years commencing from 1 April 2010 to 31 March 2013. The annual total amount of the rent and management fee payable by TOM International are subject to the annual caps of HK$7,952,976, HK$9,946,380, HK$10,082,028 and HK$1,972,134 for the years 2010, 2011, 2012 and 2013 respectively. During the year, HK$7,952,976 has been paid by TOM International to The Center (48).
The aforesaid continuing connected transactions (“ContinuingConnected Transactions”) havebeenreviewed by the Independent Non-executive Directors. The Independent Non-executive Directors have confirmed that the Continuing Connected Transactions have been entered into (a) in the ordinary and usual course of business of the Group; (b) either on normal commercial terms or on terms no less favourable to the Group than terms available to or from independent third parties; and (c) in accordance with the relevant agreements governing them on terms that are fair and reasonable and in the interests of the shareholders of the Company as a whole.
The Company’s auditor was engaged to report on the Group’s continuing connected transactions in accordancewithHongKong Standard onAssurance Engagements 3000“Assurance EngagementsOtherThanAuditsorReviewsofHistoricalFinancial Information”andwithreferencetoPracticeNote740“Auditor’sLetteronContinuingConnectedTransactionsundertheHongKongListingRules”issuedby the Hong Kong Institute of Certified Public Accountants. The auditor has issued its unqualified letter containing its findings and conclusions in respect of the continuing connected transactions disclosed by the Group on pages 38 to 40 of the Annual Report in accordance with paragraph 14A.38 of the Listing Rules. A copy of the auditor’s letter has been provided by the Company to the Stock Exchange.
Directors’ interests in contractsNo contracts of significance in relation to the Group’s business to which the Company, its fellow subsidiaries or its holding company was a party and in which a director of the Company had a material interest, whether directly or indirectly, subsisted at the end of the year or at any time during the year.

Annual Report 2010
REPO
RT O
F THE D
IREC
TOR
S41
Directors’ interests in competing businessMr. Frank John Sixt and Mrs. Chow Woo Mo Fong, Susan, the Non-executive Chairman of the Company and a Non-executive Director respectively, are executive directors of HWL, Cheung Kong Infrastructure HoldingsLimited (“CKI”)anddirectorsofcertainof their respectiveAssociates (collectively referredtoas“HWLGroup”and“CKIGroup”respectively).Inaddition,Mr.FrankJohnSixtisalsoanon-executivedirectorofCKHandHutchisonTelecommunicationsHongKongHoldingsLimited(“HTHKH”)anddirectorofcertainoftheirAssociates(collectivelyreferredtoas“CKHGroup”and“HTHKHGroup”respectively).Mr. Frank John Sixt was a non-executive director of Hutchison Telecommunications International Limited (“HTIL”whose sharesweredelisted fromtheStockExchangeon25May2010andwhoseAmericandepository shares were delisted from the New York Stock Exchange on 4 June 2010) during the period up to26May2010anddirectorofcertainoftheirAssociates(collectivelyreferredtoasthe“HTILGroup”).Mrs. Chow Woo Mo Fong, Susan is a non-executive director of HTHKH and director of certain of their Associates, and was a non-executive director and an alternate director of HTIL during the period up to 26 May 2010 and director of certain of their Associates. Mr. Ip Tak Chuen, Edmond, a Non-executive Director, is the deputy managing director of CKH, the senior vice president and chief investment officer ofCKLifeSciences Int’l., (Holdings) Inc. (“CKLife”),thedeputychairmanofCKIandanon-executivedirectorofExcelTechnologyInternationalHoldingsLimited(“ExcelTechnology”).HWLGroupisengagedin e-commerce, Internet and information technology services. CKH Group, CKI Group, CK Life and Excel Technology are engaged in information technology, e-commerce or new technology where applicable. HTIL Group is engaged in providing mobile telecommunications services. HTHKH Group operates GSM dual-band and 3G mobile telecommunications services in Hong Kong and Macau and provides fixed-line telecommunications services in Hong Kong. The Directors believe that there is a risk that such businesses may compete with those of the Group.
Save as disclosed above, none of the Directors or their respective Associates have any interests in a business which competes or may compete with the business of the Group during the year.
Management contractsNo contracts concerning the management and administration of the whole or any substantial part of the business of the Company were entered into or existed during the year.
Major customers and suppliersDuring the year, the respective percentage of purchases attributable to the Group’s five largest suppliers and the sales attributable to the Group’s five largest customers, on a combined basis, was less than 30% of the total value of the Group’s purchases and sales.
None of the Directors, their Associates or any shareholder (which to the knowledge of the Directors owns more than 5% of the Company’s issued share capital) had an interest in the major suppliers or customers noted above.
Pre-emptive rightsThere is no provision for pre-emptive rights under the Company’s Articles of Association, or the laws of Cayman Islands, which would oblige the Company to offer new shares on pro-rata basis to existing shareholders.
Subsequent eventsDetails of significant events which have been taken place subsequent to the reporting period are set out in note 44 to the financial statements.

TOM Group Limited
REP
OR
T O
F TH
E D
IREC
TOR
S42
Purchase, sale or redemption of sharesDuring the year, neither the Company nor any of its subsidiaries purchased, sold or redeemed any of the Company’s listed shares.
AuditorThe financial statements have been audited by PricewaterhouseCoopers who retire and, being eligible, offer themselves for re-appointment.
Public floatAs at the date of this report, based on information available to the Company and within the knowledge of the Directors, approximately 37.78% of the issued share capital of the Company was held by the public.
By Order of the Board
Frank John SixtChairman
Hong Kong, 24 March 2011
Annual Report 2010
43INDEPENDENT AUDITOR’S REPORT
PricewaterhouseCoopers22/F Prince’s Building,Central, Hong Kong.Telephone (852) 2289 8888Facsimile (852) 2810 9888
INDEPENDENT AUDITOR’S REPORT TO THE SHAREHOLDERS OFTOM GROUP LIMITED(incorporated in the Cayman Islands with limited liability)
Wehaveaudited the consolidated financial statementsof TOMGroupLimited (the“Company”) anditssubsidiaries (together, the“Group”)setoutonpages45to126,whichcomprisetheconsolidatedand Company statements of financial position as at 31 December 2010, and the consolidated income statement, the consolidated statement of comprehensive income, the consolidated statement of changes in equity and the consolidated statement of cash flows for the year then ended, and a summary of significant accounting policies and other explanatory information.
Directors’ responsibility for the consolidated financial statementsThe directors of the Company are responsible for the preparation of consolidated financial statements that give a true and fair view in accordance with Hong Kong Financial Reporting Standards issued by the Hong Kong Institute of Certified Public Accountants and the disclosure requirements of the Hong Kong Companies Ordinance, and for such internal control as the directors determine is necessary to enable the preparation of consolidated financial statements that are free from material misstatement, whether due to fraud or error.
Auditor’s responsibilityOur responsibility is to express an opinion on these consolidated financial statements based on our audit and to report our opinion solely to you, as a body, and for no other purpose. We do not assume responsibility towards or accept liability to any other person for the contents of this report.
We conducted our audit in accordance with Hong Kong Standards on Auditing issued by the Hong Kong Institute of Certified Public Accountants. Those standards require that we comply with ethical requirements and plan and perform the audit to obtain reasonable assurance about whether the consolidated financial statements are free from material misstatement.

TOM Group Limited
IND
EPEN
DEN
T A
UD
ITO
R’S
REP
OR
T44
An audit involves performing procedures to obtain audit evidence about the amounts and disclosures in the consolidated financial statements. The procedures selected depend on the auditor’s judgement, including the assessment of the risks of material misstatement of the consolidated financial statements, whether due to fraud or error. In making those risk assessments, the auditor considers internal control relevant to the entity’s preparation of consolidated financial statements that give a true and fair view in order to design audit procedures that are appropriate in the circumstances, but not for the purpose of expressing an opinion on the effectiveness of the entity’s internal control. An audit also includes evaluating the appropriateness of accounting policies used and the reasonableness of accounting estimates made by the directors, as well as evaluating the overall presentation of the consolidated financial statements.
We believe that the audit evidence we have obtained is sufficient and appropriate to provide a basis for our audit opinion.
OpinionIn our opinion, the consolidated financial statements give a true and fair view of the state of affairs of the Company and of the Group as at 31 December 2010 and of the Group’s loss and cash flows for the year then ended in accordance with Hong Kong Financial Reporting Standards and have been properly prepared in accordance with the disclosure requirements of the Hong Kong Companies Ordinance.
PricewaterhouseCoopersCertified Public Accountants
Hong Kong, 24 March 2011
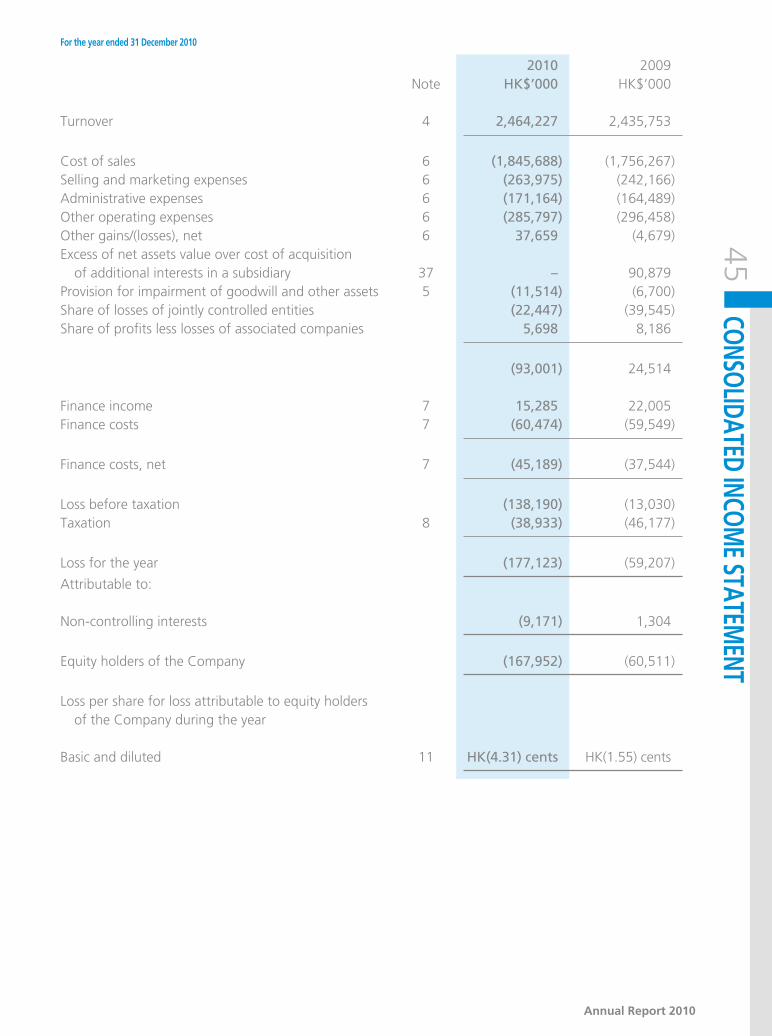
Annual Report 2010
45For the year ended 31 December 2010
CONSOLIDATED INCOME STATEM
ENT
2010 2009 Note HK$’000 HK$’000
Turnover 4 2,464,227 2,435,753
Cost of sales 6 (1,845,688) (1,756,267)Selling and marketing expenses 6 (263,975) (242,166)Administrative expenses 6 (171,164) (164,489)Other operating expenses 6 (285,797) (296,458)Other gains/(losses), net 6 37,659 (4,679)Excess of net assets value over cost of acquisition of additional interests in a subsidiary 37 – 90,879Provision for impairment of goodwill and other assets 5 (11,514) (6,700)Share of losses of jointly controlled entities (22,447) (39,545)Share of profits less losses of associated companies 5,698 8,186
(93,001) 24,514
Finance income 7 15,285 22,005Finance costs 7 (60,474) (59,549)
Finance costs, net 7 (45,189) (37,544)
Loss before taxation (138,190) (13,030)Taxation 8 (38,933) (46,177)
Loss for the year (177,123) (59,207)
Attributable to:
Non-controlling interests (9,171) 1,304
Equity holders of the Company (167,952) (60,511)
Loss per share for loss attributable to equity holders of the Company during the year
Basic and diluted 11 HK(4.31) cents HK(1.55) cents

TOM Group Limited
46For the year ended 31 December 2010
CONS
OLID
ATED
STA
TEM
ENT
OF C
OMPR
EHEN
SIVE
INCO
ME
2010 2009 HK$’000 HK$’000
Loss for the year (177,123) (59,207)
Other comprehensive incomeExchange translation differences 51,313 23,482Net actuarial (loss)/gain on defined benefit plans (2,801) 5,830Available-for-sale financial assets:Revaluation surplus during the year, net of tax 669 780
Other comprehensive income for the year, net of tax 49,181 30,092
Total comprehensive expense for the year (127,942) (29,115)
Total comprehensive income/(expense) attributable to:
– Non-controlling interests 5,327 5,126
– Equity holders of the Company (133,269) (34,241)

Annual Report 2010
47As at 31 December 2010
CONSOLIDATED STATEMENT OF FINANCIAL POSITION
2010 2009 Note HK$’000 HK$’000
ASSETS AND LIABILITIESNon-current assetsFixed assets 14 143,769 152,961Goodwill 15 2,682,513 2,643,106Other intangible assets 16 112,207 82,368Interests in jointly controlled entities 18 (132,651) (139,751)Interests in associated companies 19 230,736 222,432Available-for-sale financial assets 21 28,780 27,682Advance to an investee company 22 2,172 2,169Deferred tax assets 32(a) 31,235 39,011Other non-current assets 23 23,609 31,473
3,122,370 3,061,451
Current assetsInventories 24 98,354 106,252Trade and other receivables 25 836,240 842,316Restricted cash 26 3,958 45,187Cash and cash equivalents 27 1,079,340 1,186,178
2,017,892 2,179,933
Current liabilitiesTrade and other payables 28 1,226,149 1,167,806Taxation payable 45,937 35,925Long-term bank loans – current portion 30 72,039 119,680Short-term bank loans 29 109,032 119,800
1,453,157 1,443,211
Net current assets 564,735 736,722
Total assets less current liabilities 3,687,105 3,798,173
Non-current liabilitiesDeferred tax liabilities 32(b) 12,449 14,739Non-current portion of long-term bank loans 30 1,770,361 1,721,410Pension obligations 31(a) 32,384 26,148
1,815,194 1,762,297
Net assets 1,871,911 2,035,876

TOM Group Limited
CO
NSO
LID
ATE
D S
TATE
MEN
T O
F FI
NA
NC
IAL
POSI
TIO
N48
As at 31 December 2010
2010 2009 Note HK$’000 HK$’000
EQUITYEquity attributable to the Company’s equity holdersShare capital 33 389,328 389,328Reserves 1,130,525 1,275,069Own shares held 36 (6,244) (6,244)
1,513,609 1,658,153Non-controlling interests 358,302 377,723
Total equity 1,871,911 2,035,876
Yeung Kwok Mung Mak Soek Fun, AngelaDirector Director

Annual Report 2010
49As at 31 December 2010
STATEMENT OF FINANCIAL POSITION
2010 2009 Note HK$’000 HK$’000
ASSETS AND LIABILITIESNon-current assetsInterests in subsidiaries 17 1,835,447 1,836,148Other non-current assets 23 3,967 11,501
1,839,414 1,847,649
Current assetsAmounts due from subsidiaries 17 1,719,760 1,683,477Other receivables 25 8,345 8,638Cash and cash equivalents 27 361 811
1,728,466 1,692,926
Current liabilitiesAmounts due to subsidiaries 17 639,286 596,076Other payables 28 58,452 59,962
697,738 656,038
Net current assets 1,030,728 1,036,888
Non-current liabilitiesLong-term bank loans 30 1,453,000 1,440,000
Net assets 1,417,142 1,444,537
EQUITYEquity attributable to the Company’s equity holdersShare capital 33 389,328 389,328Reserves 35 1,034,058 1,061,453Own shares held 36 (6,244) (6,244)
1,417,142 1,444,537
Yeung Kwok Mung Mak Soek Fun, AngelaDirector Director
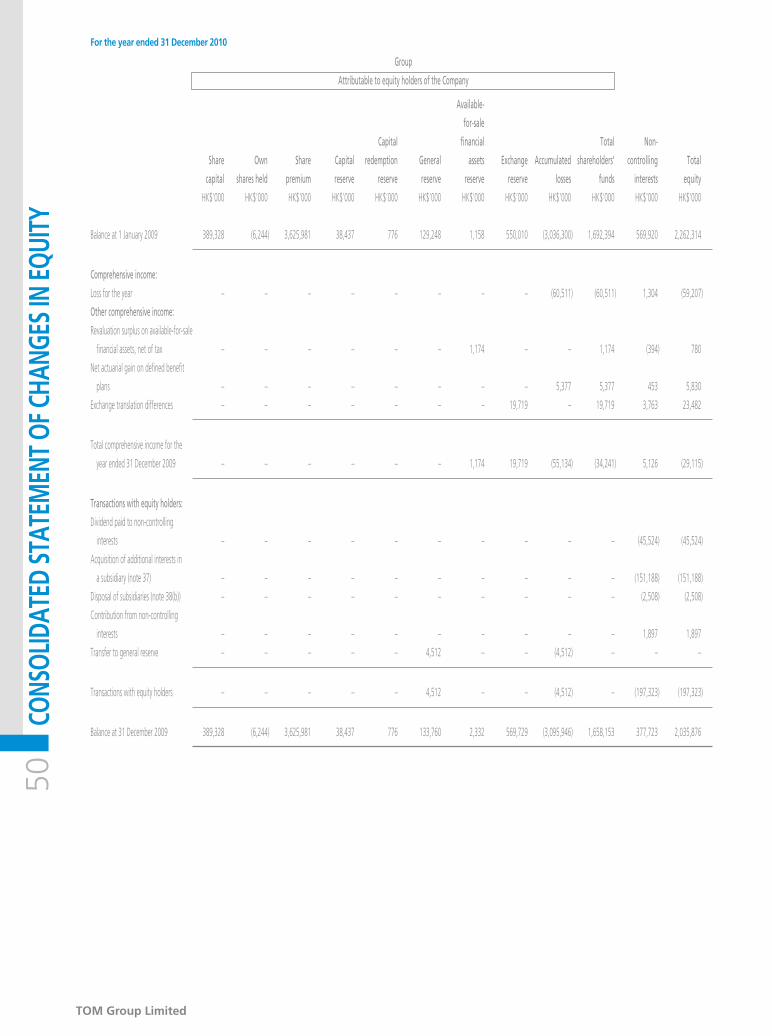
TOM Group Limited
50For the year ended 31 December 2010
CONS
OLID
ATED
STA
TEM
ENT
OF C
HANG
ES IN
EQU
ITY
Group
Attributable to equity holders of the Company
Available-
for-sale
Capital financial Total Non-
Share Own Share Capital redemption General assets Exchange Accumulated shareholders’ controlling Total
capital shares held premium reserve reserve reserve reserve reserve losses funds interests equity
HK$’000 HK$’000 HK$’000 HK$’000 HK$’000 HK$’000 HK$’000 HK$’000 HK$’000 HK$’000 HK$’000 HK$’000
Balance at 1 January 2009 389,328 (6,244) 3,625,981 38,437 776 129,248 1,158 550,010 (3,036,300) 1,692,394 569,920 2,262,314
Comprehensive income:
Loss for the year – – – – – – – – (60,511) (60,511) 1,304 (59,207)
Other comprehensive income:
Revaluation surplus on available-for-sale
financial assets, net of tax – – – – – – 1,174 – – 1,174 (394) 780
Net actuarial gain on defined benefit
plans – – – – – – – – 5,377 5,377 453 5,830
Exchange translation differences – – – – – – – 19,719 – 19,719 3,763 23,482
Total comprehensive income for the
year ended 31 December 2009 – – – – – – 1,174 19,719 (55,134) (34,241) 5,126 (29,115)
Transactions with equity holders:
Dividend paid to non-controlling
interests – – – – – – – – – – (45,524) (45,524)
Acquisition of additional interests in
a subsidiary (note 37) – – – – – – – – – – (151,188) (151,188)
Disposal of subsidiaries (note 38(b)) – – – – – – – – – – (2,508) (2,508)
Contribution from non-controlling
interests – – – – – – – – – – 1,897 1,897
Transfer to general reserve – – – – – 4,512 – – (4,512) – – –
Transactions with equity holders – – – – – 4,512 – – (4,512) – (197,323) (197,323)
Balance at 31 December 2009 389,328 (6,244) 3,625,981 38,437 776 133,760 2,332 569,729 (3,095,946) 1,658,153 377,723 2,035,876

Annual Report 2010
CO
NSO
LIDA
TED STA
TEMEN
T OF C
HA
NG
ES IN EQ
UITY
51For the year ended 31 December 2010
Group
Attributable to equity holders of the Company
Available-
for-sale
Capital financial Total Non-
Share Own Share Capital redemption General assets Exchange Accumulated shareholders’ controlling Total
capital shares held premium reserve reserve reserve reserve reserve losses funds interests equity
HK$’000 HK$’000 HK$’000 HK$’000 HK$’000 HK$’000 HK$’000 HK$’000 HK$’000 HK$’000 HK$’000 HK$’000
Balance at 1 January 2010 389,328 (6,244) 3,625,981 38,437 776 133,760 2,332 569,729 (3,095,946) 1,658,153 377,723 2,035,876
Comprehensive income:
Loss for the year – – – – – – – – (167,952) (167,952) (9,171) (177,123)
Other comprehensive income:
Revaluation surplus on available-for-sale
financial assets, net of tax – – – – – – 669 – – 669 – 669
Net actuarial loss on defined benefit
plans – – – – – – – – (2,250) (2,250) (551) (2,801)
Exchange translation differences – – – – – – – 36,264 – 36,264 15,049 51,313
Total comprehensive income for the
year ended 31 December 2010 – – – – – – 669 36,264 (170,202) (133,269) 5,327 (127,942)
Transactions with equity holders:
Dividend paid to non-controlling
interests – – – – – – – – – – (25,916) (25,916)
Deconsolidation of subsidiaries
(note 38(c)) – – – – – – – – – – (12,004) (12,004)
Change in ownership interests in a
subsidiary that does not result
in loss of control – – – (11,275) – – – – – (11,275) 11,275 –
Contribution from non-controlling
interests – – – – – – – – – – 1,897 1,897
Transfer to general reserve – – – – – 3,586 – – (3,586) – – –
Transactions with equity holders – – – (11,275) – 3,586 – – (3,586) (11,275) (24,748) (36,023)
Balance at 31 December 2010 389,328 (6,244) 3,625,981 27,162 776 137,346 3,001 605,993 (3,269,734) 1,513,609 358,302 1,871,911

TOM Group Limited
52For the year ended 31 December 2010
CONS
OLID
ATED
STA
TEM
ENT
OF C
ASH
FLOW
S
2010 2009 Note HK$’000 HK$’000
Cash flows from operating activitiesNet cash inflow from operations 38(a) 227,880 202,284 Interest paid (22,985) (20,483) Overseas taxation paid (24,436) (40,058)
Net cash from operating activities 180,459 141,743
Cash flows from investing activities Interest received from available-for-sale financial assets – 4,802 Capital expenditure (226,877) (141,598) Proceeds from sale of fixed assets 1,180 3,171 Proceeds from sale of intangible assets – 3,887 Settlement of consideration payable for acquisition of a subsidiary in prior years – (1,140) Acquisition of additional interests in a subsidiary 37 – (60,309) Disposal of a subsidiary/subsidiaries 38(b) (7,608) (1,960) Deconsolidation of subsidiaries 38(c) (12,086) – Proceeds from disposal/maturity of available-for-sale financial assets 10,393 394,117 Proceeds from capital reduction of available-for-sale financial assets – 3,493 Advance to jointly controlled entities (42,124) – Dividends received 1,258 18,071
Net cash (used in)/from investing activities (275,864) 222,534
Cash flows from financing activities New bank loans 38(d) 591,352 1,776,735 Loan repayments 38(d) (644,290) (2,178,469) Loan arrangement fee paid (10,926) (27,464) Dividends paid to non-controlling interests (25,916) (45,524) Reduction/(increase) of restricted cash 26 41,229 (43,016)
Net cash used in financing activities (48,551) (517,738)
Decrease in cash and cash equivalents (143,956) (153,461)
Cash and cash equivalents at 1 January 1,186,178 1,328,813Exchange adjustment 37,118 10,826
Cash and cash equivalents at 31 December 1,079,340 1,186,178
Cash and cash equivalents represent: Bank balances and cash 27 1,079,340 1,186,178
Annual Report 2010
53NOTES TO THE CONSOLIDATED FINANCIAL STATEM
ENTS1 Principal accounting policies
The principal accounting policies applied in the preparation of these consolidated financial statements are set out below. These policies have been consistently applied to all the years presented, unless otherwise stated.
(a) Basis of preparationThe consolidated financial statements have been prepared in accordance with Hong Kong Financial Reporting Standards (“HKFRS”) issuedby theHongKong Institute ofCertifiedPublicAccountants(“HKICPA”)andthedisclosurerequirementsofAppendix16oftheRulesGoverningtheListingofSecuritiesonTheStockExchangeofHongKongLimited(the“StockExchange”).Theconsolidatedfinancialstatementshavebeenpreparedunderthehistoricalcost convention except that, as set out in note 1(f) below, available-for-sale financial assets are stated at fair value, unless fair value cannot be reliably measured.
The preparation of financial statements in conformity with HKFRS requires the use of certain critical accounting estimates. It also requires management to exercise its judgement in the process of applying the Group’s accounting policies. The areas involving a higher degree of judgement or complexity, or areas where assumptions and estimates are significant to the consolidated financial statements, are disclosed in note 3.
The following revised standards and amendments to standards are mandatory and relevant to the Group for the financial year beginning 1 January 2010:
HKFRSs (Amendments) Improvements to HKFRSs 2009HKAS 1 (Amendment) Presentation of Financial StatementsHKAS 27 (Revised) Consolidated and Separate Financial StatementsHKAS 36 (Amendment) Impairment of AssetsHKFRS 2 (Amendment) Group Cash-settled Share-based Payment TransactionsHKFRS 3 (Revised) Business Combinations
In the current year, the Group has adopted all of the revised standards and amendments to standards that are relevant to the Group’s operations and mandatory for annual periods beginning 1 January 2010.
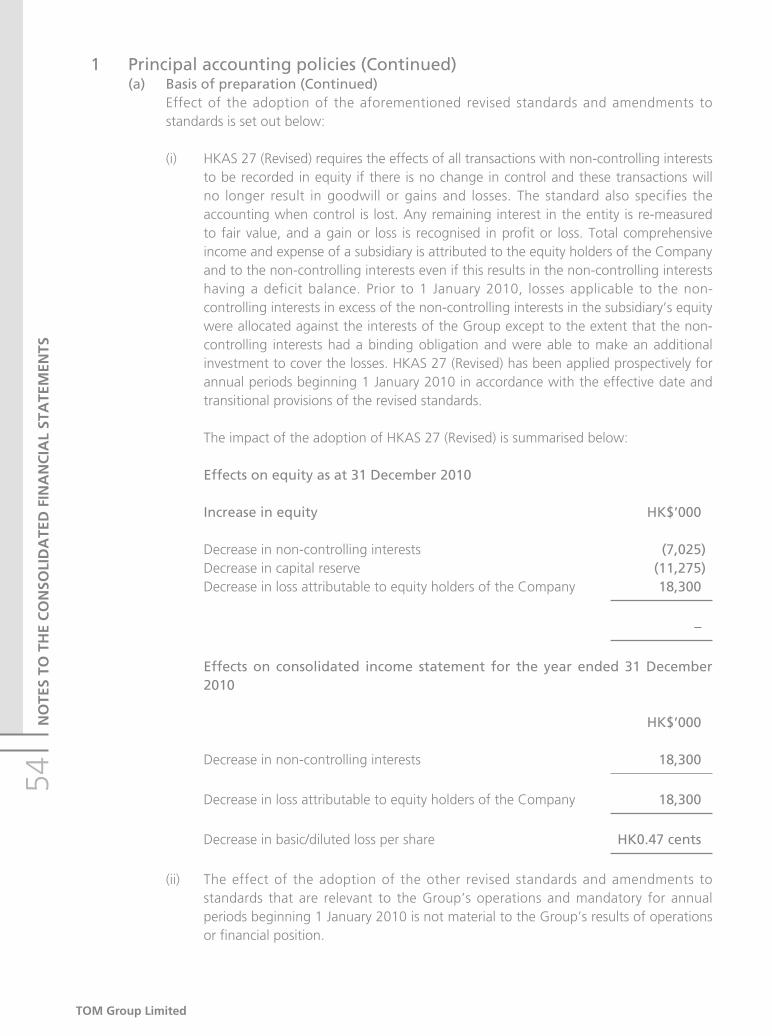
TOM Group Limited
NO
TES
TO T
HE
CO
NSO
LID
ATE
D F
INA
NC
IAL
STA
TEM
ENTS
541 Principal accounting policies (Continued)
(a) Basis of preparation (Continued)Effect of the adoption of the aforementioned revised standards and amendments to standards is set out below:
(i) HKAS 27 (Revised) requires the effects of all transactions with non-controlling interests to be recorded in equity if there is no change in control and these transactions will no longer result in goodwill or gains and losses. The standard also specifies the accounting when control is lost. Any remaining interest in the entity is re-measured to fair value, and a gain or loss is recognised in profit or loss. Total comprehensive income and expense of a subsidiary is attributed to the equity holders of the Company and to the non-controlling interests even if this results in the non-controlling interests having a deficit balance. Prior to 1 January 2010, losses applicable to the non-controlling interests in excess of the non-controlling interests in the subsidiary’s equity were allocated against the interests of the Group except to the extent that the non-controlling interests had a binding obligation and were able to make an additional investment to cover the losses. HKAS 27 (Revised) has been applied prospectively for annual periods beginning 1 January 2010 in accordance with the effective date and transitional provisions of the revised standards.
The impact of the adoption of HKAS 27 (Revised) is summarised below:
Effects on equity as at 31 December 2010
Increase in equity HK$’000
Decrease in non-controlling interests (7,025)Decrease in capital reserve (11,275)Decrease in loss attributable to equity holders of the Company 18,300
–
Effects on consolidated income statement for the year ended 31 December 2010
HK$’000
Decrease in non-controlling interests 18,300
Decrease in loss attributable to equity holders of the Company 18,300
Decrease in basic/diluted loss per share HK0.47 cents
(ii) The effect of the adoption of the other revised standards and amendments to standards that are relevant to the Group’s operations and mandatory for annual periods beginning 1 January 2010 is not material to the Group’s results of operations or financial position.

Annual Report 2010
NO
TES TO TH
E CO
NSO
LIDA
TED FIN
AN
CIA
L STATEM
ENTS
551 Principal accounting policies (Continued)
(a) Basis of preparation (Continued)At the date of authorisation of these financial statements, the following standards, amendments to standards and interpretations were in issue but not yet effective and have not been early adopted by the Group:
HKFRSs (Amendments) (1) Improvements to HKFRSs 2010Amendment to HKFRS 1(1) Limited exemption from comparative HKFRS 7 disclosures for first-time adoptersHKAS 12 (Amendment)(2) Deferred Tax – Recovery of Underlying AssetsHKAS 24 (Revised) (1) Related Party DisclosuresHKAS 32 (Amendment) (1) Financial Instruments: Presentation – Classification of Right IssuesHKFRS 7 (Amendment)(2) Disclosures – Transfers of Financial AssetsHKFRS 9 (3) Financial InstrumentsHK(IFRIC)-Int 14 Prepayments of a Minimum Funding (Amendments) (1) RequirementHK(IFRIC)-Int 19 (1) Extinguishing Financial Liabilities with Equity Instruments
(1) Effective for the Group for annual periods beginning 1 January 2011(2) Effective for the Group for annual periods beginning 1 January 2012(3) Effective for the Group for annual periods beginning 1 January 2013
The Group has already commenced an assessment of the impact of these new standards, amendments to standards and interpretations, but is not in a position to state whether these new standards, amendments to standards and interpretations would have a significant impact to its results of operations and financial position.
(b) ConsolidationThe consolidated financial statements include the financial statements of the Company and all of its subsidiaries made up to 31 December. Subsidiaries are all entities over which the Group has the power to govern the financial and operating policies generally accompanying a shareholding of more than one half of the voting rights.
Subsidiaries are fully consolidated from the date on which control is transferred to the Group. They are deconsolidated from the date that control ceases.
The Group uses the acquisition method of accounting to account for business combinations. The consideration transferred for the acquisition of a subsidiary is the fair values of the assets transferred, the liabilities incurred and the equity interests issued by the Group. The consideration transferred includes the fair value of any asset or liability resulting from a contingent consideration arrangement. Acquisition-related costs are expensed as incurred. Identifiable assets acquired and liabilities and contingent liabilities assumed in a business combination are measured initially at their fair values at the acquisition date. On an acquisition-by-acquisition basis, the Group recognises any non-controlling interest in the acquiree either at fair value or at the non-controlling interest’s proportionate share of the acquiree’s net assets.

TOM Group Limited
NO
TES
TO T
HE
CO
NSO
LID
ATE
D F
INA
NC
IAL
STA
TEM
ENTS
561 Principal accounting policies (Continued)
(b) Consolidation (Continued)The excess of the consideration transferred, the amount of any non-controlling interest in the acquiree and the acquisition-date fair value of any previous equity interest in the acquiree over the fair value of the identifiable net assets acquired is recorded as goodwill. If this is less than the fair value of the net assets of the subsidiary acquired in the case of a bargain purchase, the difference is recognised directly in the consolidated income statement.
Inter-company transactions, balances and unrealised gains on transactions between group companies are eliminated. Unrealised losses are also eliminated unless the transaction provides evidence of an impairment of the asset transferred. Accounting policies of subsidiaries have been changed where necessary to ensure consistency with the policies adopted by the Group.
In the Company’s statement of financial position, the investments in subsidiaries are stated at cost less provision for impairment losses (note 1(i)). Cost is adjusted to reflect changes in consideration arising from contingent consideration amendments. Cost also includes direct attributable costs of investment. The results of subsidiaries are accounted for by the Company on the basis of dividends received and receivable.
(c) Transactions with non-controlling interestsThe Group treats transactions with non-controlling interests as transactions with the equity holders of the Group. For purchases from non-controlling interests, the difference between any consideration paid and the relevant share acquired of the carrying value of net assets of the subsidiary is recorded in equity. Gains or losses on disposal to non-controlling interests are also recorded in equity.
When the Group ceases to have control or significant influence, any retained interest in the entity is re-measured to its fair value, with the change in carrying amount recognised in profit or loss. The fair value is the initial carrying amount for the purposes of subsequently accounting for the retained interest as an associate, joint venture or financial asset. In addition, any amounts previously recognised in other comprehensive income in respect of that entity are accounted for as if the Group had directly disposed of the related assets or liabilities. The amounts previously recognised in other comprehensive income are reclassified to profit or loss.
If the ownership interest in an associate is reduced but significant influence is retained, only a proportionate share of the amounts previously recognised in other comprehensive income are reclassified to profit or loss where appropriate.

Annual Report 2010
NO
TES TO TH
E CO
NSO
LIDA
TED FIN
AN
CIA
L STATEM
ENTS
571 Principal accounting policies (Continued)
(d) Jointly controlled entitiesA jointly controlled entity is a contractual arrangement whereby the Group and other parties undertake an economic activity which is subject to joint control and none of the participating parties has unilateral control over the economic activity.
The consolidated income statement includes the Group’s share of the results of jointly controlled entities for the year, and the consolidated statement of financial position includes the Group’s share of the net assets of the jointly controlled entities and goodwill on acquisition, net of accumulated impairment losses, if any. The cumulative post-acquisition movements are adjusted against the carrying amount of the investment. When the Group’s share of losses in a jointly controlled entity equals or exceeds its interest in the jointly controlled entity, including any other unsecured receivables, the Group does not recognise further losses, unless it has incurred obligations or made payments on behalf of the jointly controlled entity.
(e) Associated companiesAssociated companies are all entities over which the Group has significant influence but not control, generally accompanying a shareholding of between 20% and 50% of the voting rights. Investments in associated companies are accounted for using the equity method of accounting and are initially recognised at cost.
The consolidated income statement includes the Group’s share of the results of associated companies for the year, and the consolidated statement of financial position includes the Group’s share of the net assets of the associated companies, goodwill and intangible assets recognised on acquisition, net of accumulated amortisation of intangible assets other than goodwill and impairment losses, if any. The cumulative post-acquisition movements are adjusted against the carrying amount of the investment. When the Group’s share of losses in an associate equals or exceeds its interest in the associate, including any other unsecured receivables, the Group does not recognise further losses, unless it has incurred obligations or made payments on behalf of the associate.
Unrealised gains on transactions between the Group and its associated companies are eliminated to the extent of the Group’s interest in the associated companies. Unrealised losses are also eliminated unless the transaction provides evidence of an impairment of the asset transferred. Accounting policies of associated companies have been changed where necessary to ensure consistency with the policies adopted by the Group.
(f) Financial assetsThe Group classifies its financial assets in the following categories: loans and receivables, and available-for-sale. The classification depends on the purpose for which the financial assets were acquired. Management determines the classification of its financial assets at initial recognition.
(i) Loans and receivablesLoans and receivables are non-derivative financial assets with fixed or determinable payments that are not quoted in an active market. They are included in current assets, except for maturities greater than 12 months after the end of the reporting period which are classified as non-current assets. The Group’s loans and receivables comprise “tradeandother receivables”,“advancetoan investeecompany”,“cashandcashequivalents”and“restrictedcash”intheconsolidatedstatementoffinancialposition.

TOM Group Limited
NO
TES
TO T
HE
CO
NSO
LID
ATE
D F
INA
NC
IAL
STA
TEM
ENTS
581 Principal accounting policies (Continued)
(f) Financial assets (Continued)(ii) Available-for-sale financial assets
Available-for-sale financial assets are non-derivatives that are either designated in this category or not classified in any of the other categories. They are included in non-current assets unless the investment matures or management intends to dispose of the investment within 12 months of the end of the reporting period.
Regular way purchases and sales of financial assets are recognised on the trade-date – the date on which the Group commits to purchase or sell the asset. Investments are initially recognised at fair value plus transaction costs. Financial assets are derecognised when the rights to receive cash flows from the investments have expired or have been transferred and the Group has transferred substantially all risks and rewards of ownership. Available-for-sale financial assets are subsequently carried at fair value. Loans and receivables are subsequently carried at amortised cost using the effective interest method. Changes in the fair value of monetary securities denominated in a foreign currency and classified as available-for-sale are analysed between translation differences resulting from changes in amortised cost of the security and other changes in the carrying amount of the security. Translation differences related to changes in amortised cost are recognised in profit or loss and other changes in carrying amount are recognised in other comprehensive income. Translation differences on non-monetary securities are recognised in other comprehensive income. Changes in the fair value of monetary and non-monetary securities classified as available-for-sale are recognised in other comprehensive income.
When securities classified as available-for-sale are sold or impaired, the accumulated fair value adjustments recognised in equity are included in the consolidated income statement as gains or losses from available-for-sale financial assets.
Interest on available-for-sale financial assets calculated using the effective interest method is recognised in the consolidated income statement. Dividends on available-for-sale equity investments are recognised in the consolidated income statement as part of other income when the Group’s right to receive payments is established.
The fair value of quoted investments is based on current bid prices. If the market for a financial asset is not active (and for unlisted securities), the Group establishes fair value by using valuation techniques. These include the use of recent arm’s length transactions, reference to other instruments that are substantially the same, or discounted cash flow analysis refined to reflect the issuer’s specific circumstances. Investments in equity instruments that do not have a quoted market price in an active market and those fair value cannot be reliably measured, are measured at cost less impairment.
The Group assesses at the end of each reporting period whether there is objective evidence that a financial asset or a group of financial assets is impaired. In the case of equity securities classified as available-for-sale, a significant or prolonged decline in the fair value of the security below its cost is considered as an indicator that the securities are impaired. If any such evidence exists for available-for-sale financial assets, the cumulative loss – measured as the difference between the acquisition cost and the current fair value, less any impairment loss on that financial asset previously recognised in profit and loss – is removed from equity and recognised in the consolidated income statement. Impairment losses recognised in the consolidated income statement on equity instruments are not reversed through the consolidated income statement. Impairment testing of trade receivables is described in note 1(l).

Annual Report 2010
NO
TES TO TH
E CO
NSO
LIDA
TED FIN
AN
CIA
L STATEM
ENTS
591 Principal accounting policies (Continued)
(g) Fixed assetsFixed assets are stated at historical cost less depreciation and any impairment loss. Properties include leasehold land and buildings. Historical cost includes expenditure that is directly attributable to the acquisition of the items.
Depreciation of other fixed assets is provided at rates calculated to write off their costs over their estimated useful lives on a straight-line basis at the following annual rates:
Properties over the shorter of the unexpired term of land lease or estimated useful lives of 50 yearsLeasehold improvements over the shorter of the lease terms or their useful lives of 5 yearsComputer equipment 20%- 331/3%Outdoor media assets 5%- 20%Other assets 10%- 331/3%
Subsequent costs are included in the asset’s carrying amount or recognised as a separate asset, as appropriate, only when it is probable that future economic benefits associated with the item will flow to the Group and the cost of the item can be measured reliably. The carrying amount of the replaced part is derecognised. All other repairs and maintenance are charged to the consolidated income statement during the financial period in which they are incurred.
The asset’s residual values and useful lives are reviewed, and adjusted if appropriate, at the end of each reporting period. An asset’s carrying amount is written down immediately to its recoverable amount if the asset’s carrying amount is greater than its estimated recoverable amount (note 1(i)).
Gains and losses on disposals are determined by comparing the proceeds with the carrying amount and are recognised within other gains/(losses), net in the consolidated income statement.

TOM Group Limited
NO
TES
TO T
HE
CO
NSO
LID
ATE
D F
INA
NC
IAL
STA
TEM
ENTS
601 Principal accounting policies (Continued)
(h) Intangible assets(i) Goodwill
Goodwill represents the excess of the cost of an acquisition over the fair value of the Group’s share of the net identifiable assets of the acquired subsidiary, jointly controlled entity or associated company at the date of acquisition. Goodwill on acquisitions of subsidiaries is included in intangible assets. Goodwill on acquisitions of jointly controlled entities and associated companies is included in interests in jointly controlled entities and interests in associated companies, respectively and is reviewed for impairment whenever events or changes in circumstances indicate that the carrying amount may not be recoverable. Separately recognised goodwill is tested annually for impairment and carried at cost less accumulated impairment losses. Impairment losses on goodwill included in intangible assets are not reversed. Gains and losses on the disposal of an entity include the carrying value of goodwill relating to the entity sold.
Goodwillisallocatedtocash-generatingunits(“CGUs”)forthepurposeofimpairmenttesting. The allocation is made to those cash-generating units or groups of cash-generating units that are expected to benefit from the business combination in which the goodwill arose identified according to operating segment.
(ii) Other intangible assetsOther intangible assets include concession rights, licence rights and royalties, publishing rights, purchased programme and film rights, software and customer base and technology know-how. Cost of other intangible assets are initially recognised and measured at fair value. Other intangible assets with definite useful lives are amortised on a straight-line basis over the respective period of the operating right.
Principal annual rates are as follows:
Concession rights 5% – 331/3%Licence rights and royalties 28%Publishing rights 6% – 50%Software and customer base and technology know-how 20% – 100%
Purchased programme and film rights are amortised on an individual basis based on the amount of revenues earned in proportion to management’s estimate of the total revenue in respect of the purchased programme and film rights respectively.

Annual Report 2010
NO
TES TO TH
E CO
NSO
LIDA
TED FIN
AN
CIA
L STATEM
ENTS
611 Principal accounting policies (Continued)
(i) Impairment of investments in subsidiaries, associated companies, jointly controlled entities and non-financial assetsAssets that have an indefinite useful life are not subject to amortisation and are tested annually for impairment. Assets are reviewed for impairment whenever events or changes in circumstances indicate that the carrying amount may not be recoverable. An impairment loss is recognised for the amount by which the asset’s carrying amount exceeds its recoverable amount. The recoverable amount is the higher of an asset’s fair value less costs to sell and value-in-use. For the purposes of assessing impairment, assets are grouped at the lowest levels for which there are separately identifiable cash flows (i.e. cash generating units). Non-financial assets other than goodwill that suffered an impairment are reviewed for possible reversal of the impairment at each reporting date.
(j) Operating leasesLeases in which a significant portion of the risks and rewards of ownership are retained by the lessor are classified as operating leases. Payments made under operating leases (net of any incentives received from the lessor) are charged to the consolidated income statement on a straight-line basis over the period of the lease.
(k) InventoriesInventories are stated at the lower of cost and net realisable value. Costs are calculated on the weighted average basis. Net realisable value is determined on the basis of anticipated sales proceeds less estimated selling expenses.
(l) Trade and other receivablesTrade and other receivables are recognised initially at fair value and subsequently measured at amortised cost using the effective interest method, less provision for impairment. A provision for impairment of trade and other receivables is established when there is objective evidence that the Group will not be able to collect all amounts due according to the original terms of the receivables. Significant financial difficulties of the debtor, probability that the debtor will enter bankruptcy or financial reorganisation and default or delinquency in payments (more than one year overdue) are considered indicators that the receivable is impaired. The amount of the provision is the difference between the asset’s carrying amount and the present value of estimated future cash flows, discounted at the original effective interest rate. The carrying amount of the assets is reduced through the use of an allowance account, and the amount of the loss is recognised in other operating expenses in the consolidated income statement. When a trade receivable is uncollectible, it is written off against the allowance account for trade receivables. Subsequent recoveries of amount previously written off are credited against other operating expenses in the consolidated income statement.

TOM Group Limited
NO
TES
TO T
HE
CO
NSO
LID
ATE
D F
INA
NC
IAL
STA
TEM
ENTS
621 Principal accounting policies (Continued)
(m) Employee benefits(i) Pension obligations
The Group operates a number of defined contribution and defined benefit plans and the assets of which are generally held in separate trustee administered funds. The pension plans are generally funded by payments from employees and by the relevant group companies, taking into account of the recommendations of independent qualified actuaries.
A defined contribution plan is a pension plan under which the Group pays contributions into a separate entity. The Group has no legal or constructive obligations to pay further contributions if the fund does not hold sufficient assets to pay all employees the benefits relating to employee service in the current and prior periods. The Group’s contributions to the defined contribution plans are expensed as incurred. A defined benefit plan is a pension plan that is not a defined contribution plan. Typically, defined benefit plans define an amount of pension benefit that an employee will receive on retirement, usually dependent on one or more factors such as age, years of services and compensation.
The liability recognised in the statement of financial position in respect of defined benefit pension plans is the present value of the defined benefit obligation at the end of the reporting period less the fair value of plan assets, together with adjustments for unrecognised actuarial gains or losses and past service costs. The defined benefit obligation is calculated annually by independent actuaries using the projected unit credit method. The present value of the defined benefit obligation is determined by discounting the estimated future cash outflows using interest rates of high-quality corporate bonds that are denominated in the currency in which the benefits will be paid, and that have terms to maturity approximating to the terms of the related pension liability.
The cost of providing pensions is charged to the consolidated income statement so as to spread the regular cost over the service lives of employees in accordance with the advice of the actuaries who carry out a full valuation of the plans. Actuarial gains and losses arising from experience adjustments and changes in actuarial assumptions are charged or credited to equity in other comprehensive income in the period in which they arise.

Annual Report 2010
NO
TES TO TH
E CO
NSO
LIDA
TED FIN
AN
CIA
L STATEM
ENTS
631 Principal accounting policies (Continued)
(m) Employee benefits (Continued)(ii) Share-based compensation
The Group operates equity-settled, share-based compensation plans under which the entity receives services from employees as consideration for equity instruments (options) of the Group. For share options granted after 7 November 2002 and not yet vested on 1 January 2005, the fair value of the employee services received in exchange for the grant of the options is recognised as an expense. The total amount to be expensed over the vesting period is determined by reference to the fair value of the options granted by using an option-pricing model – Black-Scholes valuation model at the grant date:
– including any market performance conditions (for example, an entity’s share price);
– excluding the impact of any service and non-market performance vesting conditions (for example, profitability, sales growth targets and remaining an employee of the entity over a specified time period); and
– including the impact of any non-vesting conditions (for example, the requirement for employees to save).
At the end of each reporting period, the Group revises its estimates of the number of options that are expected to vest based on the non-market vesting conditions. It recognises the impact of the revision to original estimates, if any, in the consolidated income statement, with a corresponding adjustment to equity over the remaining vesting period.
No compensation cost is recognised in relation to share options granted on or before 7 November 2002, or that have already fully vested on 1 January 2005.
The proceeds received net of any directly attributable transaction costs are credited to share capital (nominal value) and share premium when the options are exercised.
The grant by the Company of options over its equity instruments to the employees of subsidiary undertakings in the Group is treated as a capital contribution. The fair value of employee services received, measured by reference to the grant date fair value, is recognised over the vesting period as an increase to investment in subsidiary undertakings, with a corresponding credit to equity.
(iii) Termination benefitsTermination benefits are payable when employment is terminated by the Group before the normal retirement date, or whenever an employee accepts voluntary redundancy in exchange for these benefits. The Group recognises termination benefits when it is demonstrably committed to either: terminating the employment of current employees according to a detailed formal plan without possibility of withdrawal; or providing termination benefits as a result of an offer made to encourage voluntary redundancy. Benefits falling due more than 12 months after the end of the reporting period are discounted to present value.

TOM Group Limited
NO
TES
TO T
HE
CO
NSO
LID
ATE
D F
INA
NC
IAL
STA
TEM
ENTS
641 Principal accounting policies (Continued)
(n) BorrowingsBorrowings are recognised initially at fair value, net of transaction costs incurred. Transaction costs are incremental costs that are directly attributable to the acquisition, issue or disposal of a financial asset or financial liability, including fees and commissions paid to agents, advisers, brokers and dealers, levies by regulatory agencies and security exchanges, and transfer taxes and duties. Borrowings are subsequently stated at amortised cost; any difference between the proceeds (net of transaction costs) and the redemption value is recognised in the consolidated income statement over the period of the borrowings using the effective interest method.
Borrowings are classified as current liabilities unless the Group has an unconditional right to defer settlement of the liability for at least 12 months after the end of the reporting period.
(o) Current and deferred taxationThe tax expense for the period comprises current and deferred tax. Tax is recognised in the consolidated income statement, except to the extent that it relates to items recognised in other comprehensive income or directly in equity. In this case, the tax is also recognised in other comprehensive income or directly in equity, respectively.
The current income tax charge is calculated on the basis of the tax laws enacted or substantively enacted at the end of the reporting period in the countries where the Company and its subsidiaries operate and generate taxable income. Management periodically evaluates positions taken in tax returns with respect to situations in which applicable tax regulation is subject to interpretation and establishes provisions where appropriate on the basis of amounts expected to be paid to the tax authorities.
Deferred taxation is provided in full, using the liability method, on temporary differences arising between the tax bases of assets and liabilities and their carrying amounts in the consolidated financial statements. However, the deferred income tax is not accounted for if it arises from initial recognition of an asset or liability in a transaction other than a business combination that at the time of the transaction affects neither accounting nor taxable profit or loss. Deferred taxation is determined using tax rates (and laws) that have been enacted or substantively enacted by the end of the reporting period and are expected to apply when the related deferred tax asset is realised or the deferred tax liability is settled.
Deferred tax assets are recognised to the extent that it is probable that future taxable profit will be available against which the temporary differences can be utilised.
Deferred taxation is provided on temporary differences arising on investment in subsidiaries, associated companies and jointly controlled entities except for deferred income tax liability where the timing of the reversal of the temporary difference is controlled by the Group and it is probable that the temporary difference will not reverse in the foreseeable future.

Annual Report 2010
NO
TES TO TH
E CO
NSO
LIDA
TED FIN
AN
CIA
L STATEM
ENTS
651 Principal accounting policies (Continued)
(p) ProvisionsProvisions are recognised when the Group has a present legal or constructive obligation as a result of past events; it is probable that an outflow of resources will be required to settle the obligation; and the amount has been reliably estimated.
Provisions are measured at the present value of the expenditures expected to be required to settle the obligation using a pre-tax rate that reflects current market assessments of the time value of money and the risks specific to the obligation. The increase in the provision due to passage of time is recognised as interest expense.
(q) Trade payablesTrade payables are recognised initially at fair value and subsequently measured at amortised cost using the effective interest method.
(r) Contingent liabilities and contingent assetsA contingent liability is a possible obligation that arises from past events and whose existence will only be confirmed by the occurrence or non-occurrence of one or more uncertain future events not wholly within the control of the Group. It can also be a present obligation arising from past events that is not recognised because it is not probable that outflow of economic resources will be required or the amount of obligation cannot be measured reliably.
A contingent liability is not recognised but is disclosed in the notes to the financial statements. When a change in the probability of an outflow occurs so that outflow is probable, it will then be recognised as a provision.
A contingent asset is a possible asset that arises from past events and whose existence will be confirmed only by the occurrence or non-occurrence of one or more uncertain events not wholly within the control of the Group.
Contingent assets are not recognised but are disclosed in the notes to the financial statements when an inflow of economic benefits is probable. When inflow is virtually certain, an asset is recognised.
(s) Revenue recognitionRevenue from advertising is recognised over the period when the advertisement is placed.
Revenue from sale of services is recognised when the services are rendered.
Revenue from sale of goods is recognised on the transfer of risks and rewards of ownership, which generally coincides with the time when the goods are delivered to customers and title has passed.
Interest income is recognised on a time proportion basis using the effective interest method.

TOM Group Limited
NO
TES
TO T
HE
CO
NSO
LID
ATE
D F
INA
NC
IAL
STA
TEM
ENTS
661 Principal accounting policies (Continued)
(t) Foreign currency translation(i) Functional and presentation currency
Items included in the financial statements of each of the Group’s entities are measured using the currency of the primary economic environment in which the entity operates (the“functional currency”). The consolidated financial statements arepresented inHong Kong dollar, which is the Company’s functional and the Group’s presentation currency.
(ii) Transactions and balancesForeign currency transactions are translated into the functional currency using the exchange rates prevailing at the dates of the transactions. Foreign exchange gains and losses resulting from the settlement of such transactions and from the translation at year-end exchange rates of monetary assets and liabilities denominated in foreign currencies are recognised in the consolidated income statement.
Translation differences on non-monetary financial assets, such as equities classified as available-for-sale are included in other comprehensive income.
(iii) Group companiesThe results and financial position of all the Group entities (none of which has the currency of a hyperinflationary economy) that have a functional currency different from the presentation currency are translated into the presentation currency as follows:
(1) assets and liabilities for each statement of financial position presented are translated at the closing rate at the date of that statement of financial position;
(2) income and expense for each income statement are translated at average exchange rates; and
(3) all resulting exchange differences are recognised in other comprehensive income.
On consolidation, exchange differences arising from the translation of the net investment in foreign operations are taken to other comprehensive income. When a foreign operation is partially disposed of or sold, exchange differences that were recorded in equity are recognised in the consolidated income statement as part of the gain or loss on sale.
Goodwill and fair value adjustments arising on the acquisition of a foreign entity on or after 1 January 2005 are treated as assets and liabilities of the foreign entity and translated at closing rate. For those acquisitions made prior to 1 January 2005, goodwill and fair value adjustments arising on the acquisition are expressed in the acquiring company’s functional currency.

Annual Report 2010
NO
TES TO TH
E CO
NSO
LIDA
TED FIN
AN
CIA
L STATEM
ENTS
671 Principal accounting policies (Continued)
(u) Segment reportingOperating segments are reported in a manner consistent with the internal reporting provided to the chief operating decision-maker, who is the chief executive officer of the Group. The chief operating decision-maker is responsible for allocating resources, assessing performance of the operating segments and making strategic decisions.
Unallocated costs represent corporate expenses, including finance costs, net and depreciation and amortisation. Segment assets consist primarily of fixed assets, other non-current assets, goodwill, available-for-sale financial assets, inventories, trade and other receivables and cash and cash equivalents. Segment liabilities comprise operating liabilities and pension obligations and exclude current and deferred taxation and all borrowings. Capital expenditure comprises additions to fixed assets and other intangible assets.
Sales are based on the country in which the business is operated. Total assets and capital expenditure are based on the location of the assets.
(v) Cash and cash equivalentsCash and cash equivalents comprise cash on hand, demand deposits and other short-term highly liquid investments with original maturities of three months or less.
(w) Share capitalOrdinary shares are classified as equity. Incremental costs directly attributable to the issue of new shares or options are shown in equity as a deduction, net of tax, from the proceeds.
Where any group company purchases the Company’s equity share capital (treasury shares), the consideration paid, including any directly attributable incremental costs (net of income taxes) is deducted from equity attributable to the Company’s equity holders until the shares are cancelled, reissued or disposed of. Where such shares are subsequently reissued, any consideration received (net of any directly attributable incremental transaction costs and the related income tax effects) is included in equity attributable to the Company’s equity holders.
2 Financial risk management(a) Financial risk factors
The Group’s activities expose it to a variety of financial risks: credit risk, liquidity risk and market risk (including cash flow interest rate risk, fair value interest rate risk, price risk and currency risk). The Group’s overall risk management programme focuses on the unpredictability of financial markets and seeks to minimise potential adverse effects on the Group’s financial performance.
The Group’s treasury function operates as a centralised service for managing financial risks and for providing cost efficient funding to the Group.
(i) Credit riskThe Group’s credit risk is primarily attributable to trade and other receivables and deposits placed with banks. The Group has no significant concentrations of credit risk. Management has a credit policy in place and the exposures to these credit risks are monitored on an ongoing basis.
Sales of products and services are made to customers with appropriate credit history. For credit exposures to customers, management assesses the credit quality of the customers, taking into account its financial position, past experience and other factors. For banks and financial institutions, deposits are only placed with reputable banks to mitigate the risk arising from banks.

TOM Group Limited
NO
TES
TO T
HE
CO
NSO
LID
ATE
D F
INA
NC
IAL
STA
TEM
ENTS
682 Financial risk management (Continued)
(a) Financial risk factors (Continued)(ii) Liquidity risk
The Group’s policy is to regularly monitor current and expected liquidity requirements and its compliance with lending covenants, to ensure the maintenance of sufficient reserves of cash and readily realisable marketable securities and adequate committed lines of funding from major financial institutions to meet the Group’s liquidity requirements in the short and longer term.
The table below analyses the Group’s and the Company’s financial liabilities into relevant maturity groups based on the remaining period at the end of the reporting period to the contractual maturity date. The amounts disclosed in the table are the contractual undiscounted cash flows. Balances due within 12 months equal their carrying amounts, as the impact of discounting is not significant.
Between Between Less than 1 and 2 2 and 1 year years 5 years HK$’000 HK$’000 HK$’000
At 31 December 2010Group Bank borrowings, including interest payable 185,751 1,570,889 264,191 Trade and other payables 1,223,340 – –
Company Bank borrowings, including interest payable – 1,496,471 – Other payables 56,131 – –
At 31 December 2009Group Bank borrowings, including interest payable 243,430 128,139 1,671,065 Trade and other payables 1,167,509 – –
Company Bank borrowings, including interest payable – – 1,503,067 Other payables 59,962 – –

Annual Report 2010
NO
TES TO TH
E CO
NSO
LIDA
TED FIN
AN
CIA
L STATEM
ENTS
692 Financial risk management (Continued)
(a) Financial risk factors (Continued)(iii) Cash flow and fair value interest rate risk
Cash flow interest rate risk is the risk that future cash flows of a financial instrument will fluctuate because of changes in market interest rates. Fair value interest rate risk is the risk that the value of a financial instrument will fluctuate because of changes in market interest rates. The key exposure of the Group to these risks originates from the interest-bearing borrowings and interest-bearing bank and cash deposits. Borrowings issued at variable rates and bank and cash deposit placed at variable rates expose the Group to cash flow interest rate risk. Financial assets and borrowings issued at fixed rates expose the Group to fair value interest rate risk.
At 31 December 2010, if interest rates on all borrowings had been 100 basis points higher/lower with all other variables held constant, pre-tax loss for the year would have been HK$19,514,000 higher/lower (2009: HK$19,609,000 higher/lower on pre-tax loss), mainly as a result of higher/lower interest expense on floating rate borrowings.
At 31 December 2010, if interest rates on all interest-bearing bank and cash deposits had been 100 basis points higher/lower with all other variables held constant, pre-tax loss for the year would have been HK$10,814,000 lower/higher (2009: HK$11,957,000 lower/higher on pre-tax loss) due to higher/lower interest income earned on market interest rate.
Management monitors the interest rate risk exposure on a continuous basis and adjusts the portfolio of borrowings where necessary.
(iv) Foreign currency riskThe Group mainly operates in the Greater China region and is exposed to foreign currency exchange risk arising from various foreign currencies, primarily Renminbi (“RMB”)andNewTaiwandollar(“NT$”).Foreignexchangeriskonnetinvestmentsin foreign currencies is managed primarily through borrowings denominated in the relevant foreign currencies.
SinceHongKongdollar (“HK$”) is pegged toUnited States dollar (“US$”),management considers that there is no significant foreign currency risk between these two currencies to the Group. A sensitivity review on the foreign currency exposure of HK$/US$ against RMB and NT$ is set out below.

TOM Group Limited
NO
TES
TO T
HE
CO
NSO
LID
ATE
D F
INA
NC
IAL
STA
TEM
ENTS
702 Financial risk management (Continued)
(a) Financial risk factors (Continued)(iv) Foreign currency risk (Continued)
For companies with HK$ as their functional currencyAt 31 December 2010, if RMB had weakened/strengthened by 5% against HK$ with all other variables held constant, pre-tax loss for the year would have been HK$491,000 lower/higher (2009: HK$302,000 higher/lower on pre-tax loss), mainly as a result of foreign exchange gains/losses on translation of RMB denominated cash and bank balances, trade and other receivables, and trade and other payables. Opposite effect in 2010 as compared to 2009 is because the amount of RMB denominated trade and other payables held by operating companies in Hong Kong increased in a greater proportion than cash and bank balances and trade and other receivables.
For companies with RMB as their functional currencyAt 31 December 2010, if US$ had weakened/strengthened by 5% against RMB with all other variables held constant, pre-tax loss for the year would have been HK$1,638,000 higher/lower (2009: HK$4,626,000 higher/lower on pre-tax loss), mainly as a result of foreign exchange losses/gains on translation of US$ denominated cash and bank balances, trade and other receivables, and trade and other payables. Loss in 2010 is less sensitive to movement in currency exchange rate than that in 2009 because the amount of US$ denominated cash and bank balances held by operating companies in the PRC had decreased.
For companies with NT$ as their functional currencyAt 31 December 2010, if HK$/US$ had weakened/strengthened by 5% against NT$ with all other variables held constant, pre-tax profit for those companies for the year would have been HK$17,000 lower/higher (2009: HK$15,000 lower/higher on pre-tax profit), mainly as a result of foreign exchange losses/gains on translation of HK$/US$ denominated cash and bank balances. Profit in 2010 is more sensitive to movement in currency exchange rate than that in 2009 because the amount of HK$/US$ denominated cash and bank balances held by operating companies in Taiwan had increased.
At 31 December 2010, if RMB had weakened/strengthened by 5% against NT$ with all other variables held constant, pre-tax profit for those companies for the year would have been HK$1,000 lower/higher (2009: HK$89,000 lower/higher on pre-tax profit), mainly as a result of foreign exchange losses/gains on translation of RMB denominated cash and bank balances. Profit in 2010 is less sensitive to movement in currency exchange rate than that in 2009 because the amount of RMB denominated cash and bank balances held by operating companies in Taiwan had decreased.

Annual Report 2010
NO
TES TO TH
E CO
NSO
LIDA
TED FIN
AN
CIA
L STATEM
ENTS
712 Financial risk management (Continued)
(a) Financial risk factors (Continued)(v) Price risk
Management considers that the Group is not subject to any significant price risk.
(vi) Market risks sensitivity analysisFor the presentation of market risks (including interest rate risk, exchange rate risk and market price risk) above, HKFRS 7 ‘Financial Instruments: Disclosures’ requires disclosure of a sensitivity analysis for each type of market risks that shows the effects of a hypothetical change in the relevant market risk variable to which the Group is exposed at the end of the reporting period on profit and loss and total equity.
The effect that is disclosed assumes that (a) a hypothetical change of the relevant risk variable had occurred at the end of the reporting period and had been applied to the relevant risk variable in existence on that date; and (b) the sensitivity analysis for each type of market risks does not reflect inter-dependencies between risk variables, e.g. the interest rate sensitivity analysis does not take into account of the impact of changes in interest rates would have on the relative strengthening and weakening of the currency with other currencies.
The preparation and presentation of the sensitivity analysis on market risk is solely for compliance with HKFRS 7 disclosure requirements in respect of financial instruments. The sensitivity analysis measures changes in the fair value and/or cash flows of the Group’s financial instruments from hypothetical instantaneous changes in one risk variable (e.g. functional currency rate or interest rate), the amount so generated from the sensitivity analysis are what-if forward-looking estimates. The sensitivity analysis is for illustration purposes only and it should be noted that in practice market rates rarely change in isolation. Actual results in the future may differ materially from the sensitivity analyses due to developments in the global markets which may cause fluctuations in market rates (e.g. exchange rate or interest rate) to vary and therefore it is important to note that the hypothetical amounts so generated do not represent a projection of likely future events and losses.
(b) Capital risk managementThe Group’s objectives when managing capital are to safeguard the Group’s ability to continue as a going concern in order to provide returns for shareholders and benefits for other stakeholders and to maintain an optimal capital structure to reduce the cost of capital.
In order to maintain or adjust the capital structure, the Group may adjust the amount of dividends paid, raise or repay bank borrowings, issue new shares or sell assets to reduce debt.
Consistent with others in the industry, the Group monitors capital on the basis of the gearing ratio. The ratio is calculated as total borrowings divided by total capital. Total capital includes total borrowings and total equity as shown in the consolidated statement of financial position. Total borrowings include short-term bank loans and long-term bank loans as shown in the consolidated statement of financial position.
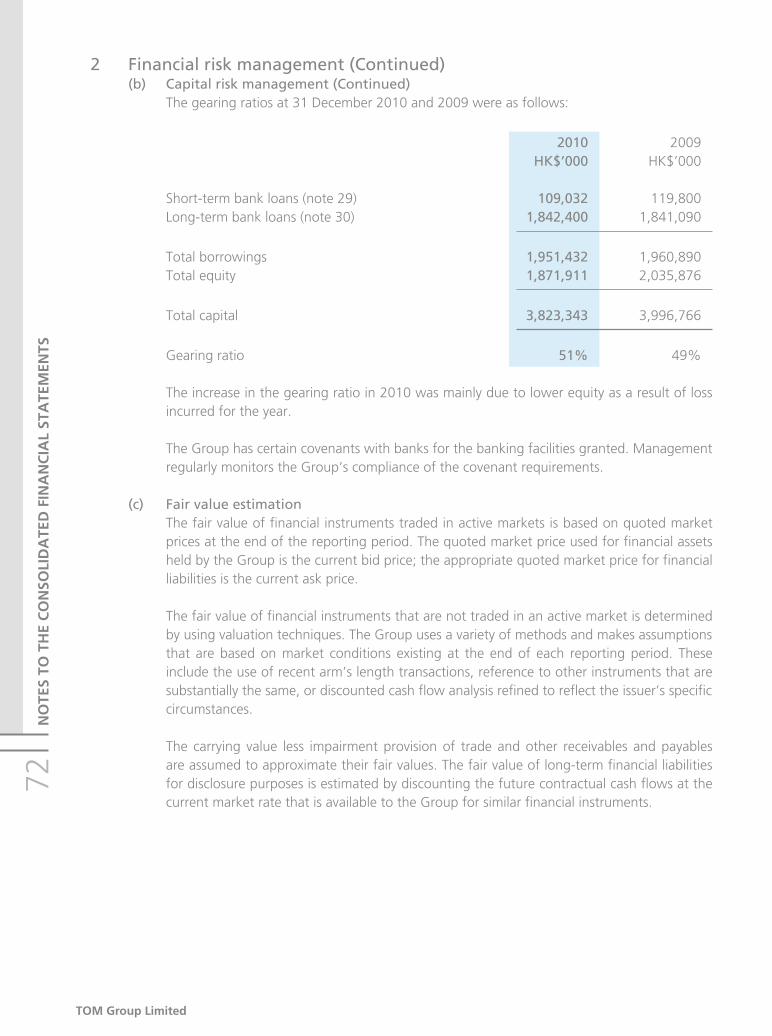
TOM Group Limited
NO
TES
TO T
HE
CO
NSO
LID
ATE
D F
INA
NC
IAL
STA
TEM
ENTS
722 Financial risk management (Continued)
(b) Capital risk management (Continued)The gearing ratios at 31 December 2010 and 2009 were as follows:
2010 2009 HK$’000 HK$’000
Short-term bank loans (note 29) 109,032 119,800Long-term bank loans (note 30) 1,842,400 1,841,090
Total borrowings 1,951,432 1,960,890Total equity 1,871,911 2,035,876
Total capital 3,823,343 3,996,766
Gearing ratio 51% 49%
The increase in the gearing ratio in 2010 was mainly due to lower equity as a result of loss incurred for the year.
The Group has certain covenants with banks for the banking facilities granted. Management regularly monitors the Group’s compliance of the covenant requirements.
(c) Fair value estimationThe fair value of financial instruments traded in active markets is based on quoted market prices at the end of the reporting period. The quoted market price used for financial assets held by the Group is the current bid price; the appropriate quoted market price for financial liabilities is the current ask price.
The fair value of financial instruments that are not traded in an active market is determined by using valuation techniques. The Group uses a variety of methods and makes assumptions that are based on market conditions existing at the end of each reporting period. These include the use of recent arm’s length transactions, reference to other instruments that are substantially the same, or discounted cash flow analysis refined to reflect the issuer’s specific circumstances.
The carrying value less impairment provision of trade and other receivables and payables are assumed to approximate their fair values. The fair value of long-term financial liabilities for disclosure purposes is estimated by discounting the future contractual cash flows at the current market rate that is available to the Group for similar financial instruments.
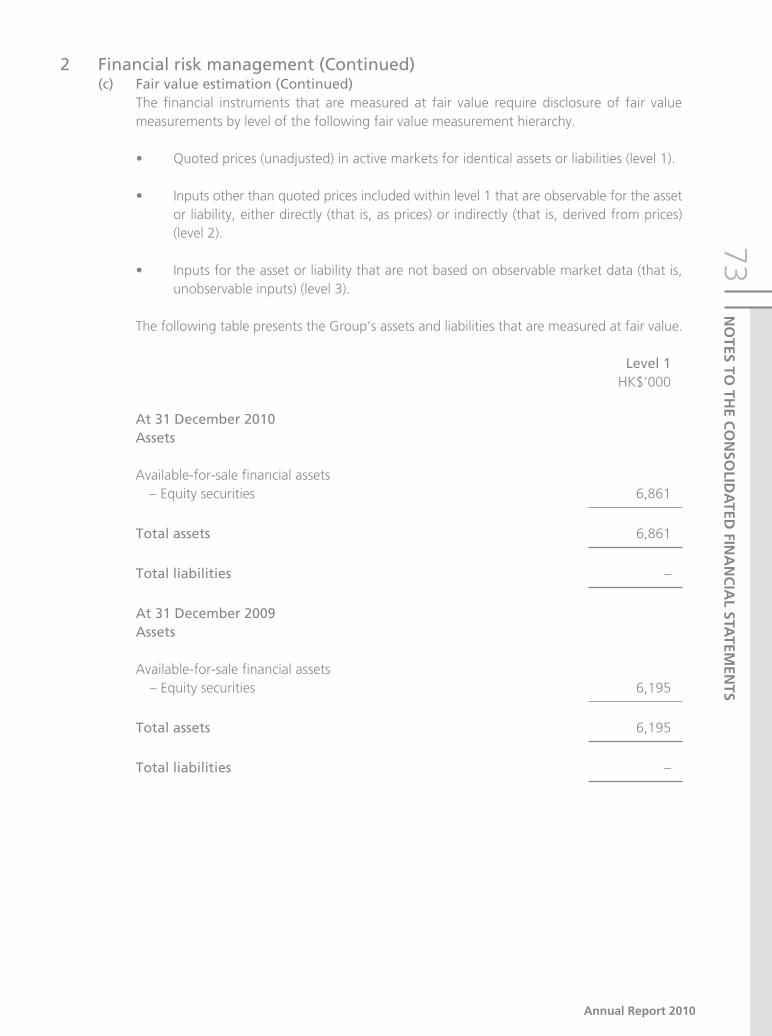
Annual Report 2010
NO
TES TO TH
E CO
NSO
LIDA
TED FIN
AN
CIA
L STATEM
ENTS
732 Financial risk management (Continued)
(c) Fair value estimation (Continued)The financial instruments that are measured at fair value require disclosure of fair value measurements by level of the following fair value measurement hierarchy.
• Quotedprices(unadjusted)inactivemarketsforidenticalassetsorliabilities(level1).
• Inputsotherthanquotedpricesincludedwithinlevel1thatareobservablefortheassetor liability, either directly (that is, as prices) or indirectly (that is, derived from prices) (level 2).
• Inputsfortheassetorliabilitythatarenotbasedonobservablemarketdata(thatis,unobservable inputs) (level 3).
The following table presents the Group’s assets and liabilities that are measured at fair value.
Level 1 HK$’000
At 31 December 2010Assets
Available-for-sale financial assets – Equity securities 6,861
Total assets 6,861
Total liabilities –
At 31 December 2009Assets
Available-for-sale financial assets – Equity securities 6,195
Total assets 6,195
Total liabilities –

TOM Group Limited
NO
TES
TO T
HE
CO
NSO
LID
ATE
D F
INA
NC
IAL
STA
TEM
ENTS
743 Critical accounting estimates and judgements
Estimates and judgements are continually evaluated and are based on historical experience and other factors, including expectations of future events that are believed to be reasonable under the circumstances.
The Group makes estimates and assumptions concerning the future. The resulting accounting estimates will, by definition, seldom exactly equal the related actual results. The estimates and assumptions that have a significant risk of causing a material adjustment to the carrying amounts of assets and liabilities related to defined benefit retirement obligations and fair value of share options granted are contained in notes 31 and 34 to the financial statements, respectively. Other key sources of estimation uncertainty are as follows:
(i) Estimated impairment of goodwillThe Group tests annually whether goodwill has suffered any impairment, in accordance with the accounting policy stated in note 1(i). The recoverable amounts of the CGUs in the Internet Group have been determined based on the higher of fair value less costs to sell and value-in-use. The recoverable amounts of the CGUs of other segments have been determined based on value-in-use calculations. These calculations require the use of estimates (note 15).
An impairment charge of HK$2,614,000 arose in a CGU of the Outdoor Media Group during the year (2009: HK$6,700,000 in the Outdoor Media Group), resulting in the carrying amount of that CGU being written down to its recoverable amount. For sensitivity analysis, if a 1% annual sales growth rate is reduced from the original discounted cash flow assumption under both the value-in-use and fair value less cost to sell calculation, the Group would have recognised a further impairment of goodwill of HK$7,347,000.
(ii) Income taxesThe Group is subject to income taxes in various jurisdictions. Significant judgement is required in determining the worldwide provision for income taxes. There are many transactions and calculations for which the ultimate tax determination is uncertain during the ordinary course of business. The Group recognises liabilities for anticipated tax audit issues based on estimates of whether additional taxes will be due. Where the final tax outcome of these matters is different from the amounts that were initially recorded, such differences will impact the income tax and deferred tax assets and liabilities in the period in which such determination is made.

Annual Report 2010
NO
TES TO TH
E CO
NSO
LIDA
TED FIN
AN
CIA
L STATEM
ENTS
753 Critical accounting estimates and judgements (Continued)
(iii) Provision for sales returnTurnover is stated net of sales return provision. Sales return provision is made by the Group upon the delivery of goods to the customers when the significant risks and rewards of ownership of the goods are transferred to the customers. As at 31 December 2010, the provision for sales return of the Group amounted to HK$41,205,000 (2009: HK$42,287,000). This provision is recognised by the Group based on the best estimates by management with reference to past experience and other relevant factors. Any difference between this estimate and the actual return will impact the Group’s result in the period in which the actual return is determined.
(iv) Provision for impairment of trade and other receivablesThe policy for provision for impairment of trade and other receivables of the Group is based on the evaluation of collectability and ageing analysis of accounts and on management’s judgement. A considerable amount of judgement is required in assessing the ultimate realisation of these receivables, including the current creditworthiness and the past collection history of each customer. The amount of provision made as at 31 December 2010 was HK$95,909,000 (2009: HK$103,950,000). If the financial conditions of customers of the Group were to change, resulting in an impairment or improvement in their ability to make payments, either additional provision or reversal of previously made provision may be required.
4 Turnover, revenue and segment informationThe principal activity of the Company is investment holding. The principal activities of the subsidiaries are set out on pages 127 to 131.
Turnover, comprise the following revenues, are recognised during the year:
2010 2009 HK$’000 HK$’000
– Provision of wireless internet services, online advertising, commercial enterprise solutions and internet access services 1,031,963 1,062,447– Merchandise sales through internet-based marketplace 1,834 2– Magazine and book circulation, sales of publication advertising and other related products 947,492 867,315– Advertising sales of outdoor media assets and provision of outdoor media services 275,348 353,447– Advertising sales in relation to satellite television channel operations and provision of broadcasting post production and event production and marketing services 207,590 152,542
Consolidated turnover 2,464,227 2,435,753

TOM Group Limited
NO
TES
TO T
HE
CO
NSO
LID
ATE
D F
INA
NC
IAL
STA
TEM
ENTS
764 Turnover, revenue and segment information (Continued)
The Group has five reportable operating segments:
• InternetGroup – provisionofwireless internet services, online advertising, commercialenterprise solutions and internet access services.
• E-CommerceGroup–merchandisesalesthroughinternet-basedmarketplace.
• PublishingGroup–magazineandbookcirculation,salesofpublicationadvertisingandotherrelated products.
• OutdoorMediaGroup–advertisingsalesofoutdoormediaassetsandprovisionofoutdoormedia services.
• Television and EntertainmentGroup – advertising sales in relation to satellite televisionchannel operations, provision of broadcasting post production and event production and marketing services.
Sales between segments are carried out at arm’s length.

Annual Report 2010
NO
TES TO TH
E CO
NSO
LIDA
TED FIN
AN
CIA
L STATEM
ENTS
774 Turnover, revenue and segment information (Continued)
The segment results for the year ended 31 December 2010 are as follows:
Year ended 31 December 2010 Television Outdoor and Internet E-Commerce Publishing Media Entertainment Group Group Group Group Group Total HK$’000 HK$’000 HK$’000 HK$’000 HK$’000 HK$’000
Total gross segment revenue 1,031,963 1,834 947,492 275,348 208,738 2,465,375Inter-segment revenue – – – – (1,148) (1,148)
Net revenue from external customers 1,031,963 1,834 947,492 275,348 207,590 2,464,227
Segment profit/(loss) before amortisation and depreciation 32,430 (30,520) 200,660 28,355 (29,500) 201,425Amortisation and depreciation (14,593) (1,879) (99,378) (50,456) (33,878) (200,184)
Segment profit/(loss) 17,837 (32,399) 101,282 (22,101) (63,378) 1,241
Other material non-cash items:Provision for impairment of goodwill and other assets – – – (11,514) – (11,514)Share of losses of jointly controlled entities (255) (22,192) – – – (22,447)Share of profits less losses of associated companies 949 – 4,749 – – 5,698
694 (22,192) 4,749 (11,514) – (28,263)
Finance costs:Finance income (note a) 12,671 5 25,114 2,719 102 40,611Finance expenses (note a) – – (17,944) (569) (17,986) (36,499)
12,671 5 7,170 2,150 (17,884) 4,112
Segment profit/(loss) before taxation 31,202 (54,586) 113,201 (31,465) (81,262) (22,910)
Unallocated corporate expenses (115,280)
Loss before taxation (138,190)
Expenditure for operating segment non-current assets 11,669 9,774 134,805 33,543 36,734 226,525
Unallocated expenditure for non-current assets 352
Total expenditure for non-current assets 226,877
During the year ended 31 December 2010, the Group has reorganised the business segments such that merchandise sales generated through internet-based marketplace have been reported in the E-Commerce Group.
Note:
(a) Inter-segment interest income and inter-segment interest expenses amounted to HK$25,493,000 and HK$19,423,000 were included in the finance income and finance expenses respectively.

TOM Group Limited
NO
TES
TO T
HE
CO
NSO
LID
ATE
D F
INA
NC
IAL
STA
TEM
ENTS
784 Turnover, revenue and segment information (Continued)
The segment assets and liabilities at 31 December 2010 are as follows:
As at 31 December 2010
Television Outdoor and Internet E-Commerce Publishing Media Entertainment Group Group Group Group Group Total HK$’000 HK$’000 HK$’000 HK$’000 HK$’000 HK$’000
Segment assets 2,830,779 25,874 1,243,478 726,167 169,444 4,995,742Interests in jointly controlled entities – (132,651) – – – (132,651)Interests in associated companies 3,722 – 227,014 – – 230,736Unallocated assets 46,435
Total assets 5,140,262
Segment liabilities 517,567 11,739 401,565 158,023 64,125 1,153,019Unallocated liabilities:Corporate liabilities 105,514Current taxation 45,937Deferred taxation 12,449Borrowings 1,951,432
Total liabilities 3,268,351

Annual Report 2010
NO
TES TO TH
E CO
NSO
LIDA
TED FIN
AN
CIA
L STATEM
ENTS
794 Turnover, revenue and segment information (Continued)
The segment results for the year ended 31 December 2009 are as follows:
Year ended 31 December 2009 Television Outdoor and Internet E-Commerce Publishing Media Entertainment Group Group Group Group Group Total HK$’000 HK$’000 HK$’000 HK$’000 HK$’000 HK$’000
Total gross segment revenue 1,062,447 2 867,315 353,447 153,998 2,437,209Inter-segment revenue – – – – (1,456) (1,456)
Net revenue from external customers 1,062,447 2 867,315 353,447 152,542 2,435,753
Segment profit/(loss) before amortisation and depreciation 93,252 (8,300) 143,357 (4,868) (28,670) 194,771Amortisation and depreciation (30,300) (192) (69,002) (39,148) (21,521) (160,163)
Segment profit/(loss) 62,952 (8,492) 74,355 (44,016) (50,191) 34,608
Other material non-cash items:Excess of net assets value over cost of acquisition of additional interests in a subsidiary – – – 90,879 – 90,879Provision for impairment of goodwill and other assets – – – (6,700) – (6,700)Share of losses of jointly controlled entities (30) (39,515) – – – (39,545)Share of profits less losses of associated companies 111 – 8,075 – – 8,186
81 (39,515) 8,075 84,179 – 52,820
Finance costs:Finance income (note a) 18,636 2 24,411 3,992 117 47,158Finance expenses (note a) (2,002) – (20,002) (959) (17,268) (40,231)
16,634 2 4,409 3,033 (17,151) 6,927
Segment profit/(loss) before taxation 79,667 (48,005) 86,839 43,196 (67,342) 94,355
Unallocated corporate expenses (107,385)
Loss before taxation (13,030)
Expenditure for operating segment non-current assets 6,048 5,370 71,334 35,183 23,326 141,261
Unallocated expenditure for non-current assets 337
Total expenditure for non-current assets 141,598
For the year ended 31 December 2009, the Group reported merchandise sales generated through internet-based marketplace in the Internet Group. The comparative figures have been reclassified to conform with the current year’s presentation.
Note:
(a) Inter-segment interest income and inter-segment interest expenses amounted to HK$25,283,000 and HK$18,940,000 were included in the finance income and finance expenses respectively.

TOM Group Limited
NO
TES
TO T
HE
CO
NSO
LID
ATE
D F
INA
NC
IAL
STA
TEM
ENTS
804 Turnover, revenue and segment information (Continued)
The segment assets and liabilities at 31 December 2009 are as follows:
As at 31 December 2009
Television Outdoor and Internet E-Commerce Publishing Media Entertainment Group Group Group Group Group Total HK$’000 HK$’000 HK$’000 HK$’000 HK$’000 HK$’000
Segment assets 2,859,532 6,799 1,149,257 856,106 159,181 5,030,875Interests in jointly controlled entities 250 (140,001) – – – (139,751)Interests in associated companies 2,727 – 219,705 – – 222,432Unallocated assets 127,828
Total assets 5,241,384
Segment liabilities 502,066 1,779 342,954 195,252 49,757 1,091,808Unallocated liabilities:Corporate liabilities 102,146Current taxation 35,925Deferred taxation 14,739Borrowings 1,960,890
Total liabilities 3,205,508
The unallocated assets represent the corporate assets. The unallocated liabilities represent the corporate liabilities in addition to operating segment taxation payable, deferred tax liabilities and borrowings which are managed on a central basis.
The Group’s businesses are operated in three main geographical areas:
Hong Kong – Internet Group, Publishing Group and Television and Entertainment Group
Mainland China – Internet Group, E-Commerce Group, Publishing Group, Outdoor Media Group and Television and Entertainment Group
Taiwan and other Asian countries – Publishing Group

Annual Report 2010
NO
TES TO TH
E CO
NSO
LIDA
TED FIN
AN
CIA
L STATEM
ENTS
814 Turnover, revenue and segment information (Continued)
There are no significant sales between the geographical segments.
Non-current assets other than Turnover deferred tax assets
Year ended Year ended As at As at 31 December 31 December 31 December 31 December 2010 2009 2010 2009 Consolidated Consolidated Consolidated Consolidated Total Total Total Total HK$’000 HK$’000 HK$’000 HK$’000
Hong Kong 17,096 15,110 7,798 14,695Mainland China 1,527,744 1,576,502 2,463,770 2,428,626Taiwan and other Asian countries 919,387 844,141 619,567 579,119
2,464,227 2,435,753 3,091,135 3,022,440
Revenue is allocated based on the country in which the business is operated and non-current assets other than deferred tax assets are allocated based on the location of the assets.
5 Provision for impairment of goodwill and other assetsThe amount in the current year represented a provision for impairment of goodwill of HK$2,614,000 and available-for-sale financial assets of HK$8,900,000 relating to the Outdoor Media Group (2009: provision for impairment of goodwill relating to the Outdoor Media Group of HK$6,700,000). This provision was made with reference to the reduced estimated values of certain operations and assets held by the Outdoor Media Group.

TOM Group Limited
NO
TES
TO T
HE
CO
NSO
LID
ATE
D F
INA
NC
IAL
STA
TEM
ENTS
826 Operating (loss)/profit
Operating (loss)/profit is stated after charging/crediting the following:
2010 2009 HK$’000 HK$’000
Charging:
Mobile operators and revenue sharing costs 645,925 627,840Depreciation (note 14) 64,888 72,750Amortisation of other intangible assets (note 16) 136,135 88,643Amortisation of other intangible assets included in interests in associated companies (note 19) 2,712 3,986Cost of inventories sold (note 24) 540,831 464,299Staff costs (including directors’ emoluments) (note 12) 561,434 538,089Operating leases in respect of: – Land and buildings 59,943 59,436 – Other assets 105,721 143,216Auditors’ remuneration 10,141 12,814Provision for impairment of trade receivables, net (note 25(c)) 5,868 13,699Provision for inventories 11,909 25,138Loss on disposal of fixed assets 182 7,037Loss on disposal of subsidiaries (note 38(b)) – 3,215Loss on disposal of other intangible assets – 484
Crediting:
Dividend income from available-for-sale financial assets 494 370Gain on disposal of available-for-sale financial assets 5,402 –Gain on disposal of a subsidiary (note 38(b)) 7,666 –Exchange gain, net 24,279 5,687
7 Finance costs, net
2010 2009 HK$’000 HK$’000
Interest and borrowing costs on bank loans 58,574 57,578Interest on other loans 1,900 1,971
60,474 59,549
Less: Interest income – bank and others (15,285) (17,203) – available-for-sale financial assets – (4,802)
(15,285) (22,005)
45,189 37,544

Annual Report 2010
NO
TES TO TH
E CO
NSO
LIDA
TED FIN
AN
CIA
L STATEM
ENTS
838 Taxation
Hong Kong profits tax has been provided at the rate of 16.5% (2009: 16.5%) on the estimated assessable profits for the year. Taxation on overseas profits has been calculated on the estimated assessable profits for the year at the rates of taxation prevailing in the countries in which the Group operates. The amount of taxation charged to the consolidated income statement represents:
2010 2009 HK$’000 HK$’000
Overseas taxation 31,942 32,078(Over)/under-provision in prior years (321) 613Deferred taxation (note 32(c)) 7,312 13,486
Taxation charge 38,933 46,177
Taxation on the Group’s loss before taxation differs from the theoretical amount that would arise using the taxation rate of the home country of the Group as follows:
2010 2009 HK$’000 HK$’000
Loss before taxation (138,190) (13,030)
Calculated at a taxation rate of 16.5% (2009: 16.5%) (22,801) (2,150)Effect of different applicable taxation rates in other countries (14,816) (5,143)Income not subject to taxation (19,821) (78,835)Expenses not deductible for taxation purposes 27,933 23,739Utilisation of previously unrecognised tax losses (8,159) (7,623)Recognition of previously unrecognised temporary differences (6,737) (6,218)Tax losses not recognised 57,283 93,602Temporary differences not recognised 13,248 9,475Tax effect of results of associated companies and jointly controlled entities 2,764 5,174Withholding tax 5,305 5,624(Over)/under-provision in prior years (321) 613Tax rate adjustment 5,055 7,919
Taxation charge 38,933 46,177
9 Loss attributable to equity holders of the CompanyThe loss of the Company is HK$27,395,000 (2009: HK$63,896,000) and is included in determining the loss attributable to equity holders of the Company in the consolidated income statement.
10 DividendsNo dividends had been paid or declared by the Company during the year (2009: HK$Nil).

TOM Group Limited
NO
TES
TO T
HE
CO
NSO
LID
ATE
D F
INA
NC
IAL
STA
TEM
ENTS
8411 Loss per share
(a) BasicThe calculation of the basic loss per share is based on consolidated loss attributable to equity holders of the Company of HK$167,952,000 (2009: HK$60,511,000) and the weighted average of 3,893,270,558 (2009: 3,893,270,558) ordinary shares in issue during the year.
(b) DilutedDiluted loss per share is equal to the basic loss per share for the year ended 31 December 2010 as the exercise price of the outstanding share options granted by the Company were higher than the average market price of the share of the Company (2009: Same).
12 Staff costs, including directors’ emoluments
2010 2009 HK$’000 HK$’000
Wages and salaries 541,829 520,363Pension costs – defined contribution plans 16,728 14,581Pension costs – defined benefit plans (note 31(b)) 2,877 3,145
561,434 538,089

Annual Report 2010
NO
TES TO TH
E CO
NSO
LIDA
TED FIN
AN
CIA
L STATEM
ENTS
8513 Directors’ and senior management’s emoluments
(a) Directors’ emolumentsThe remuneration of each director for the year ended 31 December 2010 is set out below:
Basic salaries, housing allowances, Contributions other to allowances retirement and benefits Discretionary benefit Fees in kind bonuses schemes Total HK$’000 HK$’000 HK$’000 HK$’000 HK$’000
Executive directorsMr. Yeung Kwok Mung 50 5,000 424 338 5,812Ms. Mak Soek Fun, Angela 50 3,875 106 253 4,284
Independent non-executive directors and members of Audit CommitteeMr. Cheong Ying Chew, Henry 100 – – – 100Ms. Wu Hung Yuk, Anna 100 – – – 100Mr. James Sha 100 – – – 100
Non-executive director and member of Audit CommitteeMrs. Lee Pui Ling, Angelina 100 – – – 100
Non-executive directorsMr. Frank John Sixt 50 – – – 50Ms. Chang Pui Vee, Debbie 50 – – – 50Mrs. Chow Woo Mo Fong, Susan 50 – – – 50Mr. Ip Tak Chuen, Edmond 50 – – – 50
Total 700 8,875 530 591 10,696

TOM Group Limited
NO
TES
TO T
HE
CO
NSO
LID
ATE
D F
INA
NC
IAL
STA
TEM
ENTS
8613 Directors’ and senior management’s emoluments (Continued)
(a) Directors’ emoluments (Continued)The remuneration of each director for the year ended 31 December 2009 is set out below:
Basic salaries, housing allowances, Contributions other to allowances retirement and benefits Discretionary benefit Fees in kind bonuses schemes Total HK$’000 HK$’000 HK$’000 HK$’000 HK$’000
Executive directorsMr. Yeung Kwok Mung 50 5,000 124 338 5,512Ms. Mak Soek Fun, Angela 50 3,500 20 225 3,795
Independent non-executive directors and members of Audit CommitteeMr. Cheong Ying Chew, Henry 100 – – – 100Ms. Wu Hung Yuk, Anna 100 – – – 100Mr. James Sha 100 – – – 100
Non-executive director and member of Audit CommitteeMrs. Lee Pui Ling, Angelina 100 – – – 100
Non-executive directorsMr. Frank John Sixt 50 – – – 50Ms. Chang Pui Vee, Debbie 50 – – – 50Mrs. Chow Woo Mo Fong, Susan 50 – – – 50Mr. Ip Tak Chuen, Edmond 50 – – – 50
Total 700 8,500 144 563 9,907
During the year, no emoluments were paid by the Group to the directors as an inducement to join or upon joining the Group or as compensation for the loss of office (2009: Nil).
There has been no arrangement under which a director has waived or agreed to waive any emoluments for the year ended 31 December 2010 (2009: Nil).

Annual Report 2010
NO
TES TO TH
E CO
NSO
LIDA
TED FIN
AN
CIA
L STATEM
ENTS
8713 Directors’ and senior management’s emoluments (Continued)
(b) Five highest paid individualsThe five individuals whose emoluments were the highest in the Group for the year include two directors (2009: two directors) whose emoluments are reflected in the analysis presented above. The emoluments payable to the remaining three (2009: three) individuals during the year are as follows:
2010 2009 HK$’000 HK$’000
Basic salaries, housing allowances, other allowances and benefits in kind 4,219 4,407Discretionary bonuses 5,108 3,073Contributions to retirement benefit schemes 53 142
9,380 7,622
The emoluments of these three (2009: three) individuals fell within the following bands:
Number of individuals
2010 2009
Emolument bands HK$2,000,001 – HK$2,500,000 1 1 HK$2,500,001 – HK$3,000,000 1 2 HK$4,000,001 – HK$4,500,000 1 –

TOM Group Limited
NO
TES
TO T
HE
CO
NSO
LID
ATE
D F
INA
NC
IAL
STA
TEM
ENTS
8814 Fixed assets
Group Leasehold Outdoor improve– Computer media Other Construction Properties ments equipment assets assets in progress Total HK$’000 HK$’000 HK$’000 HK$’000 HK$’000 HK$’000 HK$’000
Cost At 1 January 2009 15,786 61,583 449,293 195,241 84,261 4,729 810,893 Exchange adjustment 144 433 3,661 1,477 422 48 6,185 Additions – 3,934 16,065 4,902 1,326 6,606 32,833 Transfer between categories – 19 – 7,855 – (7,874) – Disposals – (11,007) (47,094) (19,378) (9,390) (140) (87,009) Disposal of subsidiaries (note 38(b)) – (537) (765) – (58) – (1,360)
At 31 December 2009 15,930 54,425 421,160 190,097 76,561 3,369 761,542
At 1 January 2010 15,930 54,425 421,160 190,097 76,561 3,369 761,542 Exchange adjustment 488 1,274 12,869 3,905 1,446 30 20,012 Additions – 2,994 30,461 3,032 5,165 15,440 57,092 Transfer between categories – 363 926 5,390 – (6,679) – Disposals – (638) (24,491) (42,837) (5,332) – (73,298) Disposal of a subsidiary (note 38(b)) – (1,195) (205) – (78) – (1,478) Deconsolidation of subsidiaries (note 38(c)) – (254) (430) (5,361) (205) – (6,250)
At 31 December 2010 16,418 56,969 440,290 154,226 77,557 12,160 757,620
Accumulated depreciation and impairment At 1 January 2009 4,782 46,463 385,859 104,011 67,626 – 608,741 Exchange adjustment 47 338 3,372 719 322 – 4,798 Depreciation charge for the year 744 5,615 39,258 20,159 6,974 – 72,750 Disposals – (8,995) (45,902) (13,998) (7,906) – (76,801) Disposal of subsidiaries (note 38(b)) – (405) (479) – (23) – (907)
At 31 December 2009 5,573 43,016 382,108 110,891 66,993 – 608,581
At 1 January 2010 5,573 43,016 382,108 110,891 66,993 – 608,581 Exchange adjustment 173 949 11,592 2,232 1,227 – 16,173 Depreciation charge for the year 907 4,611 24,600 30,543 4,227 – 64,888 Disposals – (638) (23,869) (42,389) (5,040) – (71,936) Disposal of a subsidiary (note 38(b)) – (1,195) (203) – (69) – (1,467) Deconsolidation of subsidiaries (note 38(c)) – (135) (283) (1,850) (120) – (2,388)
At 31 December 2010 6,653 46,608 393,945 99,427 67,218 – 613,851
Net book value
At 31 December 2010 9,765 10,361 46,345 54,799 10,339 12,160 143,769
At 31 December 2009 10,357 11,409 39,052 79,206 9,568 3,369 152,961

Annual Report 2010
NO
TES TO TH
E CO
NSO
LIDA
TED FIN
AN
CIA
L STATEM
ENTS
8914 Fixed assets (Continued)
The Group’s interests in properties at their net book values are analysed as follows:
2010 2009 HK$’000 HK$’000
Outside Hong Kong, held on Leases of over 50 years 9,728 10,296 Leases of between 10 to 50 years 37 61
9,765 10,357
15 Goodwill Group
2010 2009 HK$’000 HK$’000
Net book value, at 1 January 2,643,106 2,634,940Exchange adjustment 48,141 16,006Deconsolidation of a subsidiary (6,120) –Consideration adjustment on prior year acquisition – (1,140)Provision for impairment of goodwill (note 5) (2,614) (6,700)
Net book value, at 31 December 2,682,513 2,643,106
At 31 December: Cost 4,552,408 4,504,315 Accumulated amortisation and impairment (1,869,895) (1,861,209)
Net book value 2,682,513 2,643,106

TOM Group Limited
NO
TES
TO T
HE
CO
NSO
LID
ATE
D F
INA
NC
IAL
STA
TEM
ENTS
9015 Goodwill (Continued)
(a) Impairment tests for goodwillGoodwill is allocated to the Group’s CGUs identified according to business and geographical segments.
A segment level of the goodwill allocation is presented below.
2010 2009 Taiwan Taiwan and other and other Mainland Asian Mainland Asian China countries Total China countries Total HK$’000 HK$’000 HK$’000 HK$’000 HK$’000 HK$’000
Internet 1,699,867 – 1,699,867 1,656,282 – 1,656,282E-Commerce 139,050 – 139,050 135,484 – 135,484Publishing 116 509,601 509,717 116 508,957 509,073Outdoor Media 263,773 – 263,773 272,161 – 272,161Television and Entertainment 70,106 – 70,106 70,106 – 70,106
2,172,912 509,601 2,682,513 2,134,149 508,957 2,643,106
The recoverable amount of each CGU in the Internet Group is determined based on the higher of fair value less costs to sell and value-in-use. Fair value less costs to sell is the amount obtainable from the sale of an asset in an arm’s length transaction between knowledgeable and willing parties, less the cost of disposal. Value-in-use is the present value of the future cash flow expected to be derived from an asset or CGU. The valuation was performed by American Appraisal China Limited on 31 October 2010 and the recoverable amount determined based on the fair value less costs to sell was considered appropriate for each CGU in the Internet Group. Before arriving at the valuation, the following principal factors were considered:
– the nature of the CGU;– the economic outlook in general and the specific economic and competitive elements
affecting the CGU’s business, its industry and its market;– the nature and prospects of each CGU’s industry in China;– the market-derived investment returns of entities engaged in a similar line of business
and returns from other similar types of projects;– the stage of development of the CGU’s operation; and– the business risks of the CGU.
Annual Report 2010
NO
TES TO TH
E CO
NSO
LIDA
TED FIN
AN
CIA
L STATEM
ENTS
9115 Goodwill (Continued)
(a) Impairment tests for goodwill (Continued)Due to the changing environment in which the CGUs are operating, a number of assumptions have to be made in order to sufficiently support the concluded value of the CGUs. The major assumptions adopted were:
– there will be no major changes in the existing political, legal, fiscal and economic conditions in countries in which the CGU will carry on its business;
– there will be no major changes in the current taxation law in countries in which the CGU operates, that the rates of tax payable remain unchanged and that all applicable laws and regulations will be complied with;
– exchange rates and interest rates will not differ materially from those presently prevailing;
– the availability of finance will not be a constraint on the future growth of the CGU’s operation;
– the CGU will retain and have competent management, key personnel, and technical staff to support its ongoing operation; and
– industry trends and market conditions for related industries will not deviate significantly from economic forecasts.
The recoverable amounts of all other CGUs are determined based on value-in-use calculations. These calculations use pre-tax cash flow projections based on financial budgets approved by management covering a five-year period. Cash flows beyond the five-year period are extrapolated using the estimated growth rates stated below. The growth rate does not exceed the long-term average growth rate for the business segments in which the CGUs operate.

TOM Group Limited
NO
TES
TO T
HE
CO
NSO
LID
ATE
D F
INA
NC
IAL
STA
TEM
ENTS
9215 Goodwill (Continued)
(a) Impairment tests for goodwill (Continued)The key assumptions used for the fair value less cost to sell calculation of the CGUs in the Internet Group and the value-in-use calculations for the other CGUs were:
Internet Group Publishing Group CGUs in Outdoor Television and Wireless value E-Commerce Mainland CGUs in Media Entertainment added services Other CGUs Group China Taiwan Group Group
Gross margin1 15.3%-24.8% 14.1%-72.5% 2%-3% 51% 47% 14%-64% 17%-71%Growth rate2 5% 5% 5% 1% 1% 1% 1%Discount rate3 28% 19%-26% 19% 8% 8% 9% 9%Sales multiples4 0.90-1.30 1.05-3.10 – – – – –EBIT multiples4 13.0-17.5 – – – – – –EBITDA multiples4 12.0-16.0 – – – – – –
1 Budgeted gross margin2 Weighted average growth rate used to extrapolate cash flows beyond the five-year budget period3 Pre-tax discount rate applied to the cash flow projections4 Multiples are used to derive for the entity’s indicated value of each CGU under market approach in
the Internet Group
These assumptions have been used for the analysis of each CGU within respective business segments.
Management determined budgeted gross margin based on past performance and its expectations for the market development. The weighted average growth rates used are consistent with the forecasts. The discount rates used are pre-tax and reflect specific risks relating to the relevant segments and the sales, EBIT and EBITDA multiples used were derived with reference to the other comparable companies in the industry.

Annual Report 2010
NO
TES TO TH
E CO
NSO
LIDA
TED FIN
AN
CIA
L STATEM
ENTS
9316 Other intangible assets
Purchased Customer Licence programme base and Concession rights and Publishing and film technical rights royalties rights rights Software know-how Total HK$’000 HK$’000 HK$’000 HK$’000 HK$’000 HK$’000 HK$’000
Cost
At 1 January 2009 95,491 10,835 85,980 203,947 11,771 23,253 431,277 Exchange adjustment 959 96 1,311 – 104 206 2,676 Additions 22,134 – 59,272 22,829 – 4,530 108,765 Disposal of subsidiaries (note 38(b)) – – – – (33) – (33) Disposals (14,701) – (43,690) – – – (58,391)
At 31 December 2009 103,883 10,931 102,873 226,776 11,842 27,989 484,294
At 1 January 2010 103,883 10,931 102,873 226,776 11,842 27,989 484,294 Exchange adjustment 2,760 288 8,587 – 312 962 12,909 Additions 13,800 – 113,091 33,836 – 9,058 169,785 Deconsolidation of subsidiaries (note 38(c)) (8,088) – – – – – (8,088) Disposals – – (85,559) (167,918) – – (253,477)
At 31 December 2010 112,355 11,219 138,992 92,694 12,154 38,009 405,423
Accumulated amortisation and impairment
At 1 January 2009 61,375 10,835 54,550 202,963 11,746 22,911 364,380 Exchange adjustment 566 96 1,969 – 103 202 2,936 Amortisation charge for the year 14,931 – 56,317 17,389 6 – 88,643 Disposal of subsidiaries (note 38(b)) – – – – (13) – (13) Disposals (10,330) – (43,690) – – – (54,020)
At 31 December 2009 66,542 10,931 69,146 220,352 11,842 23,113 401,926
At 1 January 2010 66,542 10,931 69,146 220,352 11,842 23,113 401,926 Exchange adjustment 1,702 288 8,671 272 312 624 11,869 Amortisation charge for the year 15,844 – 86,483 32,617 – 1,191 136,135 Deconsolidation of subsidiaries (note 38(c)) (3,237) – – – – – (3,237) Disposals – – (85,559) (167,918) – – (253,477)
At 31 December 2010 80,851 11,219 78,741 85,323 12,154 24,928 293,216
Net book value
At 31 December 2010 31,504 – 60,251 7,371 – 13,081 112,207
At 31 December 2009 37,341 – 33,727 6,424 – 4,876 82,368

TOM Group Limited
NO
TES
TO T
HE
CO
NSO
LID
ATE
D F
INA
NC
IAL
STA
TEM
ENTS
9417 Interests in subsidiaries
Company
2010 2009 HK$’000 HK$’000
Investments at cost – unlisted shares 2,259,567 2,259,567Less: Provision for impairment (424,120) (423,419)
1,835,447 1,836,148
The amounts due from subsidiaries are unsecured, interest-free and repayable on demand.
The amounts due to subsidiaries are unsecured, interest-free and repayable on demand except HK$812,054,000 (2009: HK$816,127,000) bearing interest rate at Primary Commercial Paper FixingRate(“CPrate”)plus0.7584%perannum(2009:CPrateplus1.428%perannum).
The carrying values of amounts due from and to subsidiaries of the Company approximate their fair values.
The list of the principal subsidiaries of the Group at 31 December 2010 is set out on pages 127 to 131.
18 Interests in jointly controlled entities Group
2010 2009 HK$’000 HK$’000
Share of net liabilities – unlisted shares (246,227) (221,652)Loans to a jointly controlled entity 113,576 81,901
(132,651) (139,751)

Annual Report 2010
NO
TES TO TH
E CO
NSO
LIDA
TED FIN
AN
CIA
L STATEM
ENTS
9518 Interests in jointly controlled entities (Continued)
Notes:
(a) The loans to a jointly controlled entity as at 31 December 2010 are unsecured, interest bearing at US$ LIBOR plus 1.3% per annum and are repayable on the occurrence of certain clauses specified in the joint venture deed.
(b) There are no material contingent liabilities relating to the Group’s interests in these jointly controlled entities and no material contingent liabilities of the entities themselves.
(c) As at 31 December 2010 and 2009, the Group had interests in the following significant jointly controlled entity:
Place of incorporation and EffectiveName kind of legal entity Registered capital interest held
TOM Eachnet PRC BVI, limited liability company US$50,000 45.9% Holdings (BVI) Inc.
Summarised financial information as below:
2010 2009 HK$’000 HK$’000
Current assets 39,268 17,114
Non-current assets 1,126 8,828
Current liabilities 76,082 50,242
Non-current liabilities 117,180 82,625
Income 2,936 5,230
Expenses 46,558 82,628

TOM Group Limited
NO
TES
TO T
HE
CO
NSO
LID
ATE
D F
INA
NC
IAL
STA
TEM
ENTS
9619 Interests in associated companies
Group
2010 2009 HK$’000 HK$’000
At 1 January 222,432 231,388Share of profits less losses 5,698 8,186Dividend paid (764) (17,701)Exchange adjustment 3,370 559
At 31 December 230,736 222,432
Included in the balances:Goodwill (note (a)) At 1 January 137,029 136,729 Exchange adjustment 900 300
At 31 December 137,929 137,029
Other intangible assets (note (b)) Cost 65,156 65,156 Accumulated amortisation (28,320) (25,608)
36,836 39,548
Notes:
(a) No indication for impairment of goodwill of the associated companies was noted during the year.
(b) The other intangible assets arising from the acquisition mainly comprised of exclusive operation agreements, non-compete agreements and advertising customer base, which are recognised at fair value at acquisition and are amortised on a straight-line basis over 5 to 20 years.
(c) The details of the principal associated company of the Group are set out below:
Place of incorporation and EffectiveName kind of legal entity Registered capital Assets Liabilities Turnover Net profit interest held HK$’000 HK$’000 HK$’000 HK$’000
2010China Popular Computer Mainland China, RMB30,000,000 131,688 33,617 102,880 12,119 49% Week Management limited liability Company Limited company
2009China Popular Computer Mainland China, RMB30,000,000 107,179 23,565 107,252 23,520 49% Week Management limited liability Company Limited company

Annual Report 2010
NO
TES TO TH
E CO
NSO
LIDA
TED FIN
AN
CIA
L STATEM
ENTS
9720 Financial instruments by category
Group Available- for-sale Loans and financial receivables assets Total HK$’000 HK$’000 HK$’000
Assets as per consolidated statement of financial position
31 December 2010Available-for-sale financial assets (note 21) – 28,780 28,780Trade and other receivables (note 25) 836,240 – 836,240Advance to an investee company (note 22) 2,172 – 2,172Cash and cash equivalents (note 27) 1,079,340 – 1,079,340Restricted cash (note 26) 3,958 – 3,958
1,921,710 28,780 1,950,490
31 December 2009Available-for-sale financial assets (note 21) – 27,682 27,682Trade and other receivables (note 25) 842,316 – 842,316Advance to an investee company (note 22) 2,169 – 2,169Cash and cash equivalents (note 27) 1,186,178 – 1,186,178Restricted cash (note 26) 45,187 – 45,187
2,075,850 27,682 2,103,532

TOM Group Limited
NO
TES
TO T
HE
CO
NSO
LID
ATE
D F
INA
NC
IAL
STA
TEM
ENTS
9820 Financial instruments by category (Continued)
Group (Continued) Other financial liabilities HK$’000
Liabilities as per consolidated statement of financial position
31 December 2010Short-term bank loans (note 29) 109,032Long-term bank loans (note 30) 1,842,400Trade and other payables (note 28) 1,226,149
3,177,581
31 December 2009Short-term bank loans (note 29) 119,800Long-term bank loans (note 30) 1,841,090Trade and other payables (note 28) 1,167,806
3,128,696
Company Loans and receivables
2010 2009 HK$’000 HK$’000
Assets as per statement of financial position Cash and cash equivalents (note 27) 361 811 Other receivables (note 25) 8,345 8,638 Amounts due from subsidiaries (note 17) 1,719,760 1,683,477
1,728,466 1,692,926
Other financial liabilities
2010 2009 HK$’000 HK$’000
Liabilities as per statement of financial position Long term bank loans (note 30) 1,453,000 1,440,000 Other payables (note 28) 58,452 59,962 Amounts due to subsidiaries (note 17) 639,286 596,076
2,150,738 2,096,038

Annual Report 2010
NO
TES TO TH
E CO
NSO
LIDA
TED FIN
AN
CIA
L STATEM
ENTS
9921 Available-for-sale financial assets
Group
2010 2009 HK$’000 HK$’000
Unlisted equity securitiesAt 1 January 27,682 30,147Exchange adjustment 837 294Net gains transferred to equity 669 4,724Deconsolidation of subsidiaries (note 38(c)) 10,901 –Disposal (11,309) (3,990)Reduction of capital – (3,493)
At 31 December 28,780 27,682
Listed debt securitiesAt 1 January – 392,916Exchange adjustment – 1,390Net losses transferred to equity – (3,944)Amortisation of bond premium – (235)Redemption upon maturity – (390,127)
At 31 December – –
28,780 27,682Less: non-current portion (28,780) (27,682)
Current portion – –
The Group’s available-for-sale financial assets include the followings:
Group
2010 2009 HK$’000 HK$’000
Unlisted equity securities outside Hong Kong 28,780 27,682
Available-for-sale financial assets are denominated in the following currencies:
2010 2009 HK$’000 HK$’000
HK$ 6,861 6,195NT$ 5,665 5,605RMB 16,254 15,882
28,780 27,682
Certain unlisted equity securities are stated at cost because they do not have the quoted market price and the fair value cannot be measured reliably. Management had no intention on disposal of these unlisted equity securities.
During the year, none of the available-for-sale financial assets is either past due or impaired (2009: Nil).

TOM Group Limited
NO
TES
TO T
HE
CO
NSO
LID
ATE
D F
INA
NC
IAL
STA
TEM
ENTS
100
22 Advance to an investee company Group
2010 2009 HK$’000 HK$’000
Advance to an investee company 2,172 2,169
The carrying amount of the Group’s advance to an investee company is denominated in HK dollar.
The advance to an investee company as at 31 December 2010 is interest-free, unsecured and repayable on demand (2009: Same). The carrying amount of the advance to an investee company approximates its fair value.
The maximum exposure to credit risk at the reporting date is its carrying value.
23 Other non-current assets Group Company
2010 2009 2010 2009 HK$’000 HK$’000 HK$’000 HK$’000
Long-term other receivables 13,508 16,178 – –Deferred expenses 10,101 15,295 3,967 11,501
23,609 31,473 3,967 11,501
The maximum exposure to credit risk at the reporting date is its carrying value.
24 Inventories Group
2010 2009 HK$’000 HK$’000
Merchandise 10,480 9,582Finished goods 78,418 87,775Work in progress 9,456 8,895
98,354 106,252
The cost of inventories recognised as an expense and included in the cost of sales amounted to HK$540,831,000 (2009: HK$464,299,000).

Annual Report 2010
NO
TES TO TH
E CO
NSO
LIDA
TED FIN
AN
CIA
L STATEM
ENTS
10125 Trade and other receivables
Group Company
2010 2009 2010 2009 HK$’000 HK$’000 HK$’000 HK$’000
Trade receivables (note c) 538,364 553,456 – –Prepayments, deposits and other receivables (note d) 297,876 288,860 8,345 8,638
836,240 842,316 8,345 8,638
(a) The Group has established credit policies for customers in each of its businesses. The average credit period granted for trade receivables ranges from 30 to 90 days. The Group’s turnover is determined in accordance with terms specified in the contracts governing the relevant transactions. The carrying values of trade and other receivables approximate their fair values.
(b) The carrying amounts of the trade and other receivables are denominated in the following currencies:
Group Company
2010 2009 2010 2009 HK$’000 HK$’000 HK$’000 HK$’000
HK$ 29,980 29,564 8,345 8,638US$ 6,181 25,383 – –RMB 501,593 540,726 – –NT$ 281,459 236,614 – –Others 17,027 10,029 – –
836,240 842,316 8,345 8,638
(c) As at 31 December 2010 and 2009, the ageing analyses of the Group’s trade receivables were as follows:
Group
2010 2009 HK$’000 HK$’000
Current 168,424 133,82531-60 days 132,085 140,61661-90 days 89,129 102,220Over 90 days 244,635 280,745
634,273 657,406Less: Provision for impairment (95,909) (103,950)
538,364 553,456

TOM Group Limited
NO
TES
TO T
HE
CO
NSO
LID
ATE
D F
INA
NC
IAL
STA
TEM
ENTS
102
25 Trade and other receivables (Continued)(c) (Continued)
Group
2010 2009 HK$’000 HK$’000
Represented by: Receivables from related companies 4,231 1,284 Receivables from third parties 534,133 552,172
538,364 553,456
Total trade receivables from related companies beneficially owned by substantial shareholders oftheCompany,HutchisonWhampoaLimited(“HWL”),CheungKong(Holdings)Limited(“CKH”) andCranwoodCompany Limited (“Cranwood”), amounted toHK$4,020,000(2009: HK$1,079,000). Trade receivables from non-controlling interests of subsidiaries of the Group amounted to HK$211,000 (2009: HK$205,000). These are related to sales of goods and services as shown in note 42(a).
The Group has assessed if there is any impairment on an individual customer basis based on ageing analysis of trade receivables balance, historical bad debt rates, repayment patterns, customer credit worthiness and industry trend analysis. As at 31 December 2010, the amount of the provision for impairment of trade receivables was HK$95,909,000 (2009: HK$103,950,000).
As at 31 December 2010, trade receivables of HK$148,726,000 (2009: HK$176,795,000) were past due but not impaired. These related to a number of independent customers for whom there is no recent history of default. The ageing analysis of these trade receivables is as follows:
Group
2010 2009 HK$’000 HK$’000
Overdue by:Up to 3 months 80,450 112,658Over 3 months 68,276 64,137
148,726 176,795

Annual Report 2010
NO
TES TO TH
E CO
NSO
LIDA
TED FIN
AN
CIA
L STATEM
ENTS
10325 Trade and other receivables (Continued)
(c) (Continued)
Movements on the provision for impairment of trade receivables are as follows:
Group
2010 2009 HK$’000 HK$’000
Balance at beginning of the year 103,950 91,691Provision for receivable impairment 5,868 13,699Amount written off during the year (10,055) (2,226)Disposal of a subsidiary (761) –Deconsolidation of subsidiaries (5,117) –Exchange adjustment 2,024 786
Balance at end of the year 95,909 103,950
As at 31 December 2010 and 2009, the ageing analyses of the Group’s impaired trade receivables were as follows:
Group
2010 2009 HK$’000 HK$’000
Over 90 days 95,909 103,950
The creation of provision for impaired receivables has been included in other operating expenses in the consolidated income statement (note 6). Amounts charged to the allowance account are written off when there is no expectation of recovering additional cash.
The other classes within trade and other receivables do not contain impaired assets.
The maximum exposure to credit risk at the reporting date is the carrying value of each class of receivable mentioned above. The Group does not hold any collateral as security.

TOM Group Limited
NO
TES
TO T
HE
CO
NSO
LID
ATE
D F
INA
NC
IAL
STA
TEM
ENTS
104
25 Trade and other receivables (Continued)(d) The Group’s other receivables include amounts due from jointly controlled entities,
associated companies and related companies of HK$37,787,000 (2009: HK$9,096,000), HK$397,000 (2009: HK$362,000) and HK$19,986,000 (2009: HK$24,919,000) respectively. The total balances due from related companies beneficially owned by the substantial shareholders of the Company, HWL, CKH and Cranwood amounted to HK$1,018,000 (2009: HK$1,015,000). The balances due from non-controlling interests of subsidiaries of the Group amounted to HK$18,968,000 (2009: HK$23,904,000).
The balances due from jointly controlled entities, associated companies and related companies represent expenses paid on behalf of these companies and are unsecured, interest-free and repayable on demand.
The maximum exposure to credit risk at the reporting date is the carrying value of each class of receivable mentioned above. The Group does not hold any collateral as security.
26 Restricted cashAt 31 December 2010, NT$15,246,000 (approximately HK$3,958,000) (2009: NT$9,500,000 or approximately HK$2,276,000) were mainly pledged to certain publishing distributors in Taiwan as retainer fee for potential sales return. As at 31 December 2009, bank deposits of US$5,501,000 (approximately HK$42,911,000) were pledged to banks for securing banking facilities granted to certain subsidiaries of the Group, which were fully released in 2010.
The maximum exposure to credit r isk at the reporting date is HK$3,958,000 (2009: HK$45,187,000).

Annual Report 2010
NO
TES TO TH
E CO
NSO
LIDA
TED FIN
AN
CIA
L STATEM
ENTS
10527 Cash and cash equivalents
Group Company
2010 2009 2010 2009 HK$’000 HK$’000 HK$’000 HK$’000
Cash on hand 1,893 2,001 – –Cash at bank 1,077,447 1,184,177 361 811
1,079,340 1,186,178 361 811
Cash and cash equivalents are denominated in the following currencies:
Group Company
2010 2009 2010 2009 HK$’000 HK$’000 HK$’000 HK$’000
HK$ 13,962 79,493 16 466US$ 34,389 52,651 345 345RMB 851,417 889,270 – –NT$ 179,364 164,508 – –Others 208 256 – –
1,079,340 1,186,178 361 811
Maximum exposure to credit risk 1,077,447 1,184,177 361 811
28 Trade and other payables Group Company
2010 2009 2010 2009 HK$’000 HK$’000 HK$’000 HK$’000
Trade payables (note b) 319,787 339,858 – –Other payables and accruals (note c) 906,362 827,948 58,452 59,962
1,226,149 1,167,806 58,452 59,962

TOM Group Limited
NO
TES
TO T
HE
CO
NSO
LID
ATE
D F
INA
NC
IAL
STA
TEM
ENTS
106
28 Trade and other payables (Continued)(a) The carrying values of trade and other payables approximate their fair values.
(b) As at 31 December 2010 and 2009, the ageing analyses of the Group’s trade payables were as follows:
Group
2010 2009 HK$’000 HK$’000
Current 101,460 84,23531-60 days 47,170 53,73361-90 days 27,951 26,829Over 90 days 143,206 175,061
319,787 339,858
Group
2010 2009 HK$’000 HK$’000
Represented by:Payable to related companies 1,513 22,934Payable to third parties 318,274 316,924
319,787 339,858
Total trade payables to related companies beneficially owned by HWL amounted to HK$358,000 (2009: HK$2,237,000). The balances due to non-controlling interests of subsidiaries of the Group amounted to HK$1,155,000 (2009: HK$20,697,000). These are related to purchases of goods and services as shown in note 42(b).
(c) The Group’s other payables include amounts due to a jointly controlled entity and related companies of HK$23,068,000 (2009: HK$1,946,000) and HK$53,101,000 (2009: HK$45,223,000) respectively. The total balances due to related companies beneficially owned by the substantial shareholders of the Company, HWL, CKH and Cranwood, amounted to HK$43,706,000 (2009: HK$34,018,000). The balances due to non-controlling interests of subsidiaries of the Group amounted to HK$9,395,000 (2009: HK$11,205,000).
The amount due to a jointly controlled entity represents expenses paid on behalf of the Group by a jointly controlled entity and the amounts due to related companies arose from purchases of goods and services. These balances are unsecured, interest-free and repayable on demand.

Annual Report 2010
NO
TES TO TH
E CO
NSO
LIDA
TED FIN
AN
CIA
L STATEM
ENTS
10728 Trade and other payables (Continued)
(d) The carrying amounts of the Group’s trade and other payables are denominated in the following currencies:
Group Company
2010 2009 2010 2009 HK$’000 HK$’000 HK$’000 HK$’000
HK$ 91,437 85,235 15,747 13,222US$ 5,227 11,773 – –RMB 684,259 701,309 42,705 46,740NT$ 353,444 306,010 – –Euro 91,782 63,479 – –
1,226,149 1,167,806 58,452 59,962
29 Short-term bank loans Group Company
2010 2009 2010 2009 HK$’000 HK$’000 HK$’000 HK$’000
Unsecured 109,032 119,800 – –
The bank loans are denominated in NT$.
These short-term bank loans are interest bearing at prevailing market rates. Their carrying amounts approximate their fair values.
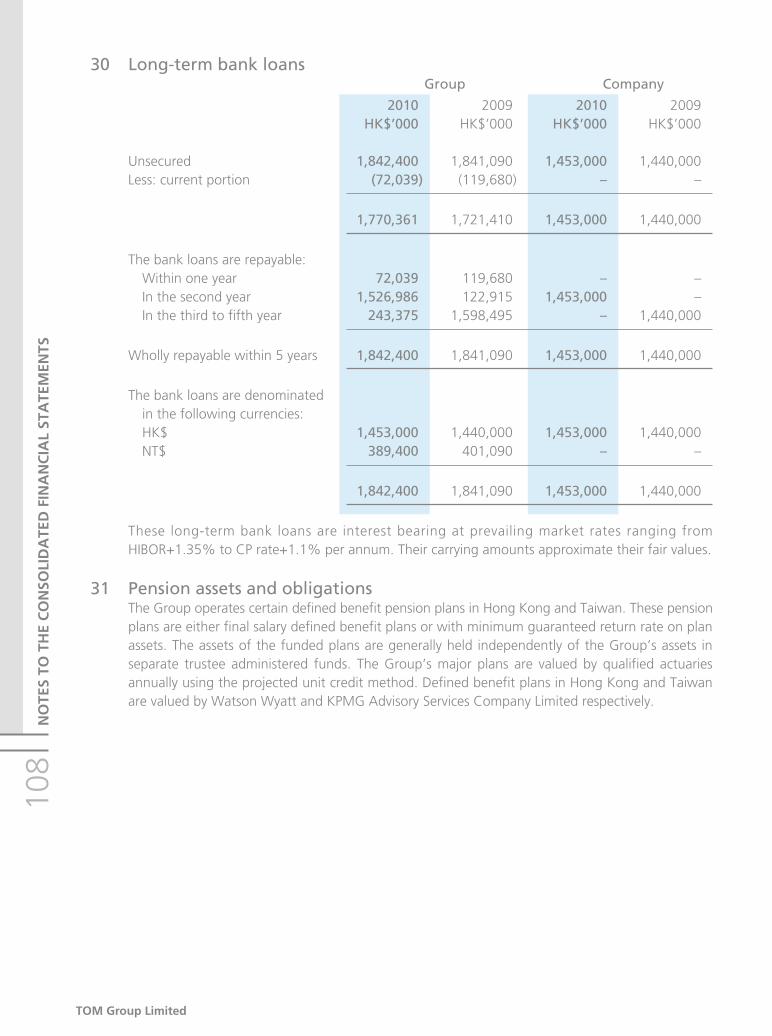
TOM Group Limited
NO
TES
TO T
HE
CO
NSO
LID
ATE
D F
INA
NC
IAL
STA
TEM
ENTS
108
30 Long-term bank loans Group Company
2010 2009 2010 2009 HK$’000 HK$’000 HK$’000 HK$’000
Unsecured 1,842,400 1,841,090 1,453,000 1,440,000Less: current portion (72,039) (119,680) – –
1,770,361 1,721,410 1,453,000 1,440,000
The bank loans are repayable: Within one year 72,039 119,680 – – In the second year 1,526,986 122,915 1,453,000 – In the third to fifth year 243,375 1,598,495 – 1,440,000
Wholly repayable within 5 years 1,842,400 1,841,090 1,453,000 1,440,000
The bank loans are denominated in the following currencies: HK$ 1,453,000 1,440,000 1,453,000 1,440,000 NT$ 389,400 401,090 – –
1,842,400 1,841,090 1,453,000 1,440,000
These long-term bank loans are interest bearing at prevailing market rates ranging from HIBOR+1.35% to CP rate+1.1% per annum. Their carrying amounts approximate their fair values.
31 Pension assets and obligationsThe Group operates certain defined benefit pension plans in Hong Kong and Taiwan. These pension plans are either final salary defined benefit plans or with minimum guaranteed return rate on plan assets. The assets of the funded plans are generally held independently of the Group’s assets in separate trustee administered funds. The Group’s major plans are valued by qualified actuaries annually using the projected unit credit method. Defined benefit plans in Hong Kong and Taiwan are valued by Watson Wyatt and KPMG Advisory Services Company Limited respectively.

Annual Report 2010
NO
TES TO TH
E CO
NSO
LIDA
TED FIN
AN
CIA
L STATEM
ENTS
10931 Pension assets and obligations (Continued)
(a) The pension assets/obligations recognised in the consolidated statement of financial position are determined as follows:
Group
2010 2009 HK$’000 HK$’000
Present value of funded obligations (note c) 63,018 56,973Fair value of plan assets (note d) (30,679) (30,889)Unrecognised prior service cost 45 64
Recognised in the consolidated statement of financial position 32,384 26,148
Represented by: Pension obligations 32,384 26,148
2010 2009 HK$’000 HK$’000
Actuarial (loss)/gain recognised in the consolidated statement of comprehensive income(“SOCI”)intheyear (2,801) 5,830
Cumulative actuarial gains recognised in the SOCI 2,011 4,812

TOM Group Limited
NO
TES
TO T
HE
CO
NSO
LID
ATE
D F
INA
NC
IAL
STA
TEM
ENTS
110
31 Pension assets and obligations (Continued)(b) The amounts recognised in the consolidated income statement are as follows:
Group
2010 2009 HK$’000 HK$’000
Current service cost 2,758 2,947Interest cost 1,370 1,494Expected return on plan assets (1,229) (1,215)Others (22) (81)
Total, included in staff costs (note 12) 2,877 3,145
The actual return on plan assets was a gain of HK$1,163,000 (2009: HK$2,188,000).
Of the total charge, HK$298,000 (2009:HK$203,000), HK$267,000 (2009: HK$381,000), HK$1,441,000 (2009: HK$1,477,000) and HK$871,000 (2009: HK$1,084,000) were includedin“costofsales”,“sellingandmarketingexpenses”,“administrativeexpenses”and“otheroperatingexpenses”respectively.
(c) Movements in present value of funded obligations in current year are as follows:
Group
2010 2009 HK$’000 HK$’000
At 1 January 56,973 58,170Exchange adjustment 3,884 725Current service cost 2,758 2,947Interest cost 1,370 1,494Actuarial loss/(gain) 2,735 (4,857)Others (4,702) (1,506)
At 31 December (note a) 63,018 56,973

Annual Report 2010
NO
TES TO TH
E CO
NSO
LIDA
TED FIN
AN
CIA
L STATEM
ENTS
11131 Pension assets and obligations (Continued)
(d) Movements in fair value of plan assets in current year are as follows:
Group
2010 2009 HK$’000 HK$’000
At 1 January 30,889 28,668Exchange adjustment 1,805 311Expected return on plan assets 1,229 1,215Actuarial (loss)/gain (66) 973Contribution by employer 1,498 1,080Others (4,676) (1,358)
At 31 December (note a) 30,679 30,889
The estimated contribution by the Group for the year 2011 will be amounted to HK$2,231,000.
(e) Fair value of the plan assets are analysed as follows:
Group
2010 2009
Cash/Treasury 74% 76%Equities 20% 18%Bonds 6% 6%
100% 100%
The principal actuarial assumptions used are as follows:
Group
2010 2009
Discount rate 1.75% – 2.80% 2.25% – 2.30%Expected rate of return on plan assets 1.75% – 7.0% 2.25% – 7.0%Expected rate of future salary increases 3.0% 1.5% – 3.0%
The expected return on plan assets is based on market expectations for returns and long-term benchmark allocation of equities and bonds in each plan and allowing for administration fees and other expenses charged to the plans.

TOM Group Limited
NO
TES
TO T
HE
CO
NSO
LID
ATE
D F
INA
NC
IAL
STA
TEM
ENTS
112
31 Pension assets and obligations (Continued)(f) Summary of defined benefit plans and respective experience adjustments are shown as
follows:
2010 2009 2008 2007 2006 HK$’000 HK$’000 HK$’000 HK$’000 HK$’000
Present value of defined benefit obligations (63,018) (56,973) (58,170) (60,358) (55,021)Fair value of plan assets 30,679 30,889 28,668 31,616 27,230
Deficit (32,339) (26,084) (29,502) (28,742) (27,791)
Experience adjustments on plan liabilities (3,417) 3,804 5,423 (1,075) (6,423)
Experience adjustments on plan assets (66) 973 (4,559) 2,464 581
32 Deferred taxation(a) Deferred tax assets
Group
2010 2009 HK$’000 HK$’000
At 1 January 39,011 51,843Exchange adjustment 2,380 1,032Charged to consolidated income statement (note c) (10,156) (13,864)
At 31 December 31,235 39,011
Amount to be recovered after more than one year 4,512 7,872
(b) Deferred tax liabilities
Group
2010 2009 HK$’000 HK$’000
At 1 January 14,739 14,919Exchange adjustment 554 198Credited to consolidated income statement (note c) (2,844) (378)
At 31 December 12,449 14,739
Amount to be payable after more than one year 12,449 14,739

Annual Report 2010
NO
TES TO TH
E CO
NSO
LIDA
TED FIN
AN
CIA
L STATEM
ENTS
11332 Deferred taxation (Continued)
(c) Deferred taxation charged to consolidated income statement
Group
2010 2009 HK$’000 HK$’000
Deferred tax assets (note a) (10,156) (13,864)Deferred tax liabilities (note b) 2,844 378
Deferred taxation charged to consolidated income statement (note 8) (7,312) (13,486)
(d) Movement in deferred tax assets and liabilities (prior to offsetting of balances within the same tax jurisdiction) during the year
Deferred tax assets Group
Provisions Others Total
2010 2009 2010 2009 2010 2009 HK$’000 HK$’000 HK$’000 HK$’000 HK$’000 HK$’000
At 1 January 31,139 40,119 7,872 11,724 39,011 51,843Exchange adjustment 2,219 326 161 706 2,380 1,032Charged to consolidated income statement (6,635) (9,306) (3,521) (4,558) (10,156) (13,864)
At 31 December 26,723 31,139 4,512 7,872 31,235 39,011
Deferred income tax assets are recognised for tax losses carried forward to the extent that realisation of the related tax benefit through the future taxable profits is probable. The Group has unrecognised tax losses as at 31 December 2010 of HK$4,377,596,000 (2009: HK$4,028,868,000) that can be carried forward against future taxable income. Losses amounting to HK$508,420,000 will be expired from 2011 to 2020, and HK$3,869,176,000 has no expiry terms.

TOM Group Limited
NO
TES
TO T
HE
CO
NSO
LID
ATE
D F
INA
NC
IAL
STA
TEM
ENTS
114
32 Deferred taxation (Continued)(d) (Continued)
Deferred tax liabilities Group
Accelerated tax depreciation Others Total
2010 2009 2010 2009 2010 2009 HK$’000 HK$’000 HK$’000 HK$’000 HK$’000 HK$’000
At 1 January 121 227 14,618 14,692 14,739 14,919Exchange adjustment – 70 554 128 554 198Credited to consolidated income statement – (176) (2,844) (202) (2,844) (378)
At 31 December 121 121 12,328 14,618 12,449 14,739
(e) Deferred income tax assets and liabilities are offset when there is a legally enforceable right to offset current tax assets against current tax liabilities and when the deferred income tax assets and liabilities relate to income tax levied by the same taxation authority on either the taxable entity or different taxable entities where there is an intention to settle the balances on a net basis. The offset amounts are as follows:
2010 2009 HK$’000 HK$’000
Deferred tax assets 31,235 39,011Deferred tax liabilities (12,449) (14,739)
18,786 24,272
33 Share capitalCompany – Authorised Ordinary shares of HK$0.1 each No. of shares HK$’000
At 31 December 2010 and 2009 5,000,000,000 500,000
Company – Issued and fully paid Ordinary shares of HK$0.1 each No. of shares HK$’000
At 31 December 2010 and 2009 3,893,270,558 389,328

Annual Report 2010
NO
TES TO TH
E CO
NSO
LIDA
TED FIN
AN
CIA
L STATEM
ENTS
11534 Share option schemes
(a) Details of share options granted by the CompanyPursuant to the written resolutions of the shareholders of the Company dated 11 February 2000, two share option schemes namely, the Pre-IPO Share Option Plan and the Old Option Scheme were adopted by the Company.
Pursuant to an ordinary resolution passed at the extraordinary general meeting of the Company held on 23 July 2004, the Company adopted the New Option Scheme and terminated the Old Option Scheme due to the withdrawal of the listing of the shares of the Company on GEM and commencement of dealings of the shares of the Company on the Main Board. The adoption of the New Option Scheme and the termination of the Old Option Scheme took effect from 4 August 2004 (listing date of the shares of the Company on the Main Board).
Pursuant to the Pre-IPO Share Option Plan, the Company may grant options to any full-time employee of the Company or of its subsidiaries or of HWL or any subsidiary of HWL to subscribe for shares of the Company. However, save for the options which have been granted on 11 February 2000, no further options may be granted upon the listing of the shares of the Company on the GEM of the Stock Exchange on 1 March 2000. The exercise price per share under the Pre-IPO Share Option Plan is HK$1.78 and the options vested in three tranches in the proportion of 20%:30%:50% on 11 February 2001, 2002 and 2003, respectively.
Pursuant to the Old Option Scheme and the New Option Scheme, the Board may, at its discretion, invite any participant (including any employee and director of the Group and of any company in which the Group owns or controls 20% or more of its voting rights and/or issued share capital, business associate and trustee) to take up options to subscribe for shares in the Company. The options granted under the Old Option Scheme can be exercised at prices ranging from HK$2.505 to HK$11.30 per share at any time within the option period of ten years from the respective dates of grant, provided that the options have been vested. Generally, the options are vested in different tranches and may be exercised within the option period unless they are cancelled. No option has been granted pursuant to the New Option Scheme since its adoption.
The total number of shares of the Company which may be issued upon exercise of all options to be granted under the New Option Scheme and any other share option schemes of the Company shall not exceed 388,941,336 shares, being approximately 10% of the issued share capital of the Company at the date of approval of the New Option Scheme.

TOM Group Limited
NO
TES
TO T
HE
CO
NSO
LID
ATE
D F
INA
NC
IAL
STA
TEM
ENTS
116
34 Share option schemes (Continued)(a) Details of share options granted by the Company (Continued)
Movements in share options are as follows:
2010 2009 Weighted Weighted average Number average NumberPre-IPO exercise of share exercise of shareShare Option Plan price options price options HK$ HK$
Outstanding at 1 January 1.78 7,116,000 1.78 7,116,000Lapsed 1.78 (7,116,000) – –Outstanding at 31 December – – 1.78 7,116,000Exercisable at 31 December – – 1.78 7,116,000
2010 2009 Weighted Weighted average Number average Number exercise of share exercise of shareOld Option Scheme price options price options HK$ HK$
Outstanding at 1 January 4.80 27,428,000 3.74 56,028,000Lapsed 5.65 (19,302,000) – –Cancelled 4.63 (1,150,000) 2.72 (28,600,000)Outstanding at 31 December 2.505 6,976,000 4.80 27,428,000Exercisable at 31 December 2.505 6,976,000 4.80 27,428,000
Terms of the share options outstanding at 31 December 2010 are:
Expiry date Exercise price 2010 2009
10 February – 14 November 2010 HK$1.78 – HK$11.30 – 27,186,000
8 October 2013 HK$2.505 6,976,000 7,358,000
6,976,000 34,544,000
Weighted average remaining contractual life (year) 2.77 1.28

Annual Report 2010
NO
TES TO TH
E CO
NSO
LIDA
TED FIN
AN
CIA
L STATEM
ENTS
11734 Share option schemes (Continued)
(b) Valuation of share optionsPursuant to the transitional provision of HKFRS 2, the fair value of services received from employees in return for share options granted after 7 November 2002 and not yet vested on 1 January 2005 are measured by reference to the fair value of share options granted. The amount is to be expensed in the consolidated income statement over the vesting period of the share options granted. The estimate of the fair value of the services received is measured based on the Black-Scholes model. Key assumptions at the dates of grant are as follows:
Risk-free interest rate (%) 2.07 to 4.22Expected option life (years) 1 to 7.01Expected dividend rate (%) 0Expected volatility (%) 46 to 64Weighted average fair value at grant date (HK$) 0.55 to 1.16
The expected volatility is based on the historical volatility. The expected option life used has been adjusted, based on management’s best estimate, for the effects of non-transferability, exercise restrictions and behavioural considerations.
No share based compensation costs was recognised during the year (2009: Nil).

TOM Group Limited
NO
TES
TO T
HE
CO
NSO
LID
ATE
D F
INA
NC
IAL
STA
TEM
ENTS
118
35 Reserves Company Share Capital premium Capital Contributed redemption Accumulated account reserve surplus reserve losses Total HK$’000 HK$’000 HK$’000 HK$’000 HK$’000 HK$’000
At 1 January 2009 4,100,475 38,683 23,565 776 (3,038,150) 1,125,349Loss for the year – – – – (63,896) (63,896)
At 31 December 2009 4,100,475 38,683 23,565 776 (3,102,046) 1,061,453
At 1 January 2010 4,100,475 38,683 23,565 776 (3,102,046) 1,061,453Loss for the year – – – – (27,395) (27,395)
At 31 December 2010 4,100,475 38,683 23,565 776 (3,129,441) 1,034,058
Note:
The Company’s reserves available for distribution calculated under Companies Law of the Cayman Islands comprise the share premium account and contributed surplus, less accumulated losses totalling HK$994,599,000 (2009: HK$1,021,994,000).
36 Own shares held No. of shares HK$’000
At 1 January 2009 and 31 December 2009 3,043,771 6,244
At 1 January 2010 and 31 December 2010 3,043,771 6,244

Annual Report 2010
NO
TES TO TH
E CO
NSO
LIDA
TED FIN
AN
CIA
L STATEM
ENTS
11937 Transaction with non-controlling interests
Acquisition of additional interests in TOM Outdoor Media Group Limited (“TOM OMG”) in 2009
On 27 May 2009, the Group, through a wholly owned subsidiary, TOM Outdoor Media Holdings Limited, acquired an additional 35% equity interests in TOM OMG for a consideration of HK$60,000,000 from the non-controlling interest. The acquisition from the non-controlling interest could enable the Group to have full control over the outdoor business and facilitate the synergy of the outdoor media group with TOM’s other businesses. As a result of the acquisition, the Group’s interests in TOM OMG increased from 65% to 100%.
The allocation of the cost of consideration is as follows:
HK$’000
Non-controlling interests acquired 151,188Excess of net assets value acquired over consideration paid (90,879)
60,309
Satisfied by: Cash 60,000 Direct costs incurred 309
60,309
The excess of net assets value acquired over consideration paid amounting to HK$90,879,000 was recognised in the consolidated income statement.

TOM Group Limited
NO
TES
TO T
HE
CO
NSO
LID
ATE
D F
INA
NC
IAL
STA
TEM
ENTS
120
38 Notes to the consolidated statement of cash flows(a) Reconciliation of loss before taxation to net cash inflow from operations
2010 2009 HK$’000 HK$’000
Loss before taxation (138,190) (13,030)
Interest expenses 60,474 59,549Interest income (15,285) (22,005)Amortisation and depreciation 201,023 161,393Dividend income on available-for-sale financial assets (494) (370)Share of losses of jointly controlled entities 22,447 39,545Share of profits less losses of associated companies (5,698) (8,186)Excess of net assets value over cost of acquisition of additional interests in a subsidiary – (90,879)Provision for impairment of goodwill and other assets 11,514 6,700Provision for impairment of trade receivables 5,868 13,699Provision for inventories 11,909 25,138Loss on disposal of fixed assets 182 7,037Loss on disposal of other intangible assets – 484Gain on disposal of available-for-sale financial assets (5,402) –(Gain)/loss on disposal of a subsidiary/subsidiaries (note b) (7,666) 3,215
Adjusted operating profit before working capital changes 140,682 182,290
Decrease/(increase) in long-term other receivables 2,670 (16,041)Increase in inventories (4,010) (12,992)(Increase)/decrease in trade and other receivables (11,226) 27,829Increase in trade and other payables 83,363 13,792Increase in pension obligations 3,435 2,334Exchange adjustment 12,966 5,072
Net cash inflow from operations 227,880 202,284

Annual Report 2010
NO
TES TO TH
E CO
NSO
LIDA
TED FIN
AN
CIA
L STATEM
ENTS
12138 Notes to the consolidated statement of cash flows (Continued)
(b) Disposal of a subsidiary/subsidiaries
2010 2009 HK$’000 HK$’000
Net assets disposed of: Fixed assets (note 14) 11 453 Other intangibles assets (note 16) – 20 Trade and other receivables 1,603 10,514 Bank balances and cash 3 2,007 Trade and other payables (19,208) (6,094) Non-controlling interests – (2,508) Exchange reserve 1,150 –
(16,441) 4,392Gain/(loss) on disposal of a subsidiary/subsidiaries (note a) 7,666 (3,215)
(8,775) 1,177
Satisfied by: Consideration receivable – 1,130 Cash (paid)/received (7,605) 47 Other payable (1,170) –
(8,775) 1,177
Analysis of the net cash outflow in respect of the disposal of a subsidiary/subsidiaries: Cash (paid)/received (7,605) 47 Bank balances and cash disposed of (3) (2,007)
Net cash outflow in respect of disposal of a subsidiary/subsidiaries (7,608) (1,960)

TOM Group Limited
NO
TES
TO T
HE
CO
NSO
LID
ATE
D F
INA
NC
IAL
STA
TEM
ENTS
122
38 Notes to the consolidated statement of cash flows (Continued)(c) Deconsolidation of subsidiaries
2010 2009 HK$’000 HK$’000
Net assets deconsolidated: Fixed assets (note 14) 3,862 – Other intangibles assets (note 16) 4,851 – Goodwill 6,120 – Trade and other receivables 43,093 – Bank balances and cash 12,086 – Trade and other payables (45,627) – Non-controlling interests (12,004) – Exchange reserve (1,480) –
Reclassified to available-for-sale financial assets (note 21) 10,901 –
(d) Analysis of changes in financing during the year
2010 2009 HK$’000 HK$’000
Bank loansAt 1 January 1,960,890 2,354,388
New bank loans 591,352 1,776,735Loan repayments (644,290) (2,178,469)
Net cash used (52,938) (401,734)
Exchange adjustment 43,480 8,236
At 31 December 1,951,432 1,960,890
Annual Report 2010
NO
TES TO TH
E CO
NSO
LIDA
TED FIN
AN
CIA
L STATEM
ENTS
12339 Pledge of assets
Save as disclosed in note 26, the Group has no pledge of assets as at 31 December 2010 (2009: Nil).
40 Contingent liabilitiesIn September 2008 and August 2009, a subsidiary of the Group in Taiwan received revised income tax assessments for the years ended 31 December 2004 and 2005 respectively from the local tax authority. In these revised tax assessments, the tax authority claimed that amortisation of intangible assets amounting to approximately NT$44 million (approximately HK$11 million) and NT$146 million (approximately HK$38 million) was not deductible in deriving the assessable profits of the subsidiary for 2004 and 2005 respectively. This gave rise to a potential additional income tax liability to the Group of approximately NT$48 million (approximately HK$12 million). The subsidiary duly filed the appeals to the tax authority and requested for re-examination on the deductibility of the amortisation charge. In March and August 2010, the appeals for 2004 and 2005 revised tax assessments were turned down by the tax authority and the subsidiary escalated the appeals to the Court in Taiwan in May and October 2010 respectively. In December 2010, the subsidiary won the administrative proceeding for the 2004 tax appeal. In January 2011, the tax authority filed a final appeal to the Court. Up to the date of these financial statements, the appeals are still outstanding and no results have been finalised.
In August 2010, January 2011 and March 2011, the subsidiary received revised tax assessments for the years ended 31 December 2007, 2006 and 2008 respectively, disallowing the deduction of amortisation of intangible assets of approximately NT$472 million (approximately HK$122 million) in total on similar grounds as 2004 and 2005. This gave rise to a potential additional income tax liability to the Group of approximately NT$118 million (approximately HK$31 million). The subsidiary duly filed a petition to the tax authority and requested for re-examination of the 2007 revised tax assessment and is in the process to file petitions for the 2006 and 2008 revised tax assessments. Up to the date of these financial statements, the petitions are still outstanding and no results have been finalised.
Management has discussed the cases with its external tax representative. Based on the consultation, management considers that the amortisation of intangible assets should be tax deductible under the tax rules in Taiwan, and in view of the positive outcome of the 2004 administrative proceeding, management is confident of a favourable outcome of the tax appeals/petitions and considers no provision is necessary at this stage.
Should the tax appeals and petitions by the subsidiary be turned down finally, the subsidiary’s income tax assessments for each of the years from 2009 to 2010 would likely be revised on a similar basis. The total incremental tax liability in relation to year 2004 to year 2010 to the Group thereon is approximately NT$232 million (approximately HK$60 million).

TOM Group Limited
NO
TES
TO T
HE
CO
NSO
LID
ATE
D F
INA
NC
IAL
STA
TEM
ENTS
124
41 Commitments(a) Capital commitments
Save as disclosed in note (b) below, the Group’s maximum capital commitments as at 31 December 2010 are as follows:
Group
2010 2009 HK$’000 HK$’000
Acquisition of/loans to investments – Contracted but not provided for 220,971 215,305
Acquisition of fixed assets and other intangible assets – Authorised but not contracted for 147,165 155,910
368,136 371,215
(b) Joint venture (“Joint Venture”) with Ebay International AG (“eBay”)On 20 December 2006, TOMO entered into a deed with an independent third party, eBay, to form a Joint Venture which will carry on the business of owning and operating a mobile and Internet-based marketplace in Mainland China. The Joint Venture will be 51% owned by TOMO while the remaining 49% interest will be owned by eBay, and is to be jointly controlled by both parties.
Following the formation of the Joint Venture, eBay will provide an initial funding of US$40,000,000 (approximately HK$312,000,000) in cash to the Joint Venture while TOMO will provide an initial shareholder’s loan of US$20,000,000 (approximately HK$156,000,000) to the Joint Venture. Subject to a mutual agreement between TOMO and eBay, both parties will contribute an additional shareholder’s loan not exceeding US$10,000,000 to the Joint Venture in total in equal proportion once the Joint Venture uses up its initial funding.
As at 31 December 2010, shareholder’s loan of US$14,561,000 (approximately HK$113,576,000) from TOMO has been advanced to the Joint Venture. Therefore, the outstanding commitment of the Group in respect of the Joint Venture totalled US$10,439,000 (approximately HK$81,424,000) as at 31 December 2010 (2009: US$14,500,000 or approximately HK$113,100,000).

Annual Report 2010
NO
TES TO TH
E CO
NSO
LIDA
TED FIN
AN
CIA
L STATEM
ENTS
12541 Commitments (Continued)
(c) Commitments under operating leasesAt 31 December 2010, the Group had future aggregate minimum lease payments under non-cancellable operating leases as follows:
2010 2009 Land and Other Land and Other buildings assets buildings assets HK$’000 HK$’000 HK$’000 HK$’000
No later than one year 47,363 61,762 51,076 60,150Later than one year and no later than five years 36,061 89,223 51,735 89,083Later than five years 87 4,135 133 5,941
83,511 155,120 102,944 155,174
42 Related party transactionsA summary of significant related party transactions, in addition to those disclosed in notes 25 and 28 to the financial statements, is set out below:
(a) Sales of goods and services Group
2010 2009 HK$’000 HK$’000
Sales to – HWL and its subsidiaries 31,335 24,973 – Non-controlling interests of subsidiaries and their subsidiaries 14,314 11,530
All the transactions with related parties were entered into in accordance with terms agreed by the relevant parties.
Year-end balances due from these related companies arising from sales of goods and services are shown in note 25(c).

TOM Group Limited
NO
TES
TO T
HE
CO
NSO
LID
ATE
D F
INA
NC
IAL
STA
TEM
ENTS
126
42 Related party transactions (Continued)(b) Purchase of goods and services
Group
2010 2009 HK$’000 HK$’000
Purchase of services payable to – non-controlling interests of subsidiaries and their subsidiaries 21,693 21,576
Rental payable to – an associated company of CKH 8,922 8,985 – a subsidiary of CKH 8,590 8,518 – non-controlling interests of subsidiaries and their subsidiaries 1,529 1,655
Service fees payable to – HWL and its subsidiaries 5,093 3,234 – non-controlling interests of subsidiaries and their subsidiaries 796 1,723
Interest expenses payable to non-controlling interests of a subsidiary 1,897 1,897
In July 2009, three substantial shareholders of the Company granted guarantees to the Company for loan facilities amounting to HK$1,900 million and guarantee fees were charged by these substantial shareholders. During the year, HK$7,217,000 was paid by the Company (2009: HK$3,600,000).
All the transactions with related parties were entered into in accordance with terms agreed by the relevant parties.
Year-end balances due to these related companies arising from purchase of goods and services are shown in notes 28(b) and 28(c).
(c) Key management compensationManagement considers remuneration to all key management of the Group has already been disclosed in note 13.
43 Comparative figuresCertain of the comparative figures have been reclassified to confirm to the current year’s presentation. These reclassifications have no impact on the Group’s total equity as at both 31 December 2009 and 2010, or on the Group’s loss for the years ended 31 December 2009 and 2010.
44 Subsequent eventsOther than the development of the tax appeals and petitions as disclosed in note 40, there are no other subsequent events after the reporting period which have material impacts to the consolidated financial statements.
45 Approval of financial statementsThe financial statements were approved by the board of directors on 24 March 2011.

Annual Report 2010
127PRINCIPAL SUBSIDIARIES, JOINTLY CONTROLLED ENTITIES AND ASSOCIATED COMPANIES
Place of incorporation Principal activities Particular of issued/ Effective Name and kind of legal entity and place of operation registered capital interest held
tom.com enterprises Limited British Virgin Islands Holding of the domain 1 ordinary share of US$1 100% (“BVI”),limitedliability nameofwww.tom.com company
TOM Group International Limited Hong Kong, limited Operation of tom.com 10 ordinary shares 100% liability company portal and management of HK$1 each of strategic investments of the Group in Greater China
Internet Group
Beijing GreaTom United Technology Mainland China, limited Development of operating Registered capital 81% Company Limited liability company platform for broadband RMB25,000,000 Internet value – added services in Mainland China
Beijing Huan Jian Shu Meng Mainland China, limited Provision of internet content Registered capital 90.002% Network Technology Limited liability company services RMB1,000,000
@ Beijing Lei Ting Wan Jun Network Mainland China, limited Provision of internet content Registered capital 90.002% Technology Limited liability company services, online advertising RMB100,000,000 services and telecom value-added services in Mainland China
@ Beijing LingXun Interactive Science Mainland China, limited Provision of wireless internet Registered capital 90.002% Technology and Development liability company services in Mainland China RMB10,000,000 Company Limited
@ Beijing Lei Ting Wu Ji Network Mainland China, limited Provision of wireless IVR services Registered capital 90.002% Technology Company Limited liability company in Mainland China RMB10,000,000
@ Beijing Redsail Netlegend Data Mainland China, limited Provision of interactive call Registered capital 90.002% Network Technology Company liability company centre services in Mainland RMB62,800,000 Limited China

TOM Group Limited
PRIN
CIP
AL
SUB
SID
IAR
IES,
JO
INTL
Y C
ON
TRO
LLED
EN
TITI
ES A
ND
ASS
OC
IATE
D C
OM
PAN
IES
128
Place of incorporation Principal activities Particular of issued/ Effective Name and kind of legal entity and place of operation registered capital interest held
Internet Group (Continued)
@ Beijing Sharkwave Asia Pacific Mainland China, limited Provision of online advertising Registered capital 90.002% Network Company Limited liability company services in Mainland China RMB10,000,000
Beijing Super Channel Network Mainland China, limited Development of software Registered capital 90.002% Limited liability company information system, computer US$13,000,000 network and website products in Mainland China
Eclink Electronic Network Systems Mainland China, limited Software, electronics and Registered capital 100% (Shenzhen) Company Limited liability company computer network system US$3,000,000 development in Mainland China
@ Shenzhen Freenet Information Mainland China, limited Operation of 163.net and Registered capital 90.002% Technology Company Limited liability company e-mail service provider in RMB23,000,000 Mainland China
@ Startone (Beijing) Information Mainland China, limited Provision of wireless internet Registered capital 90.002% Technology Company Limited liability company services in Mainland China RMB10,000,000
TOM Online Inc. Cayman Islands, limited Investment holding in 4,259,654,528 ordinary 90.002% liability company Mainland China shares of HK$0.01 each
E-Commerce Group
Shanghai Ule Trading Company Mainland China, limited Operation of a mobile and Registered capital 90.002% Limited (formerly known as liability company internet-based marketplace RMB2,000,000 Shanghai TOM Shopping in Mainland China Information Technology Company Limited)
1 TOM Eachnet PRC Holdings BVI, limited liability company Operation of a mobile and 100 ordinary shares of 45.9% (BVI) Inc. internet-based marketplace US$1 each in Mainland China

Annual Report 2010
PRIN
CIPA
L SUB
SIDIA
RIES, JO
INTLY
CO
NTR
OLLED
ENTITIES A
ND
ASSO
CIA
TED C
OM
PAN
IES129
Place of incorporation Principal activities Particular of issued/ Effective Name and kind of legal entity and place of operation registered capital interest held
Publishing Group
Bookworm Club Co., Ltd Taiwan, limited liability Distribution and retailing of 2,015,000 ordinary shares 82.53% company books and magazines of NT$10 each in Taiwan
# China Popular Computer Week Mainland China, limited Advertising sales and Registered capital 49% Management Company Limited liability company distribution of publication RMB30,000,000 products in Mainland China
Cité (Malaysia) SDN. BHD. Malaysia, limited liability Publishing and distribution of 400,000 ordinary shares 72.81% company books and magazines in of RM1 each Malaysia
Cité Publishing Holding Limited BVI, limited liability company Investment holding in Taiwan 4,999,563 ordinary shares 82.55% of US$0.01 each
Cité Publishing Limited Taiwan, limited liability Publishing of books 38,568,632 ordinary shares 82.53% company in Taiwan of NT$10 each
Cup Magazine Publishing Limited Hong Kong, limited liability Publishing of magazines 2 ordinary shares of 100% company in Hong Kong HK$1 each
Home Media Group Limited Cayman Islands, limited Advertising sales and 986,922,602 ordinary shares 82.53% liability company distribution of publications of US$0.00001 each
Nong Nong Magazine Company Taiwan, limited liability Publishing of magazines 2,500,000 ordinary shares 66.02% Limited company in Taiwan of NT$10 each
Pixnet Digital Media Corporation Taiwan, limited liability Supply service of popular 9,183,980 ordinary shares 74.28% Limited company online community of NT$10 each and social networking websites in Taiwan
Shanghai TOM Cite Consulting Mainland China, limited Publication products design, Registered capital 100% Limited liability company promotion and information US$200,000 consultancy services in Mainland China

TOM Group Limited
PRIN
CIP
AL
SUB
SID
IAR
IES,
JO
INTL
Y C
ON
TRO
LLED
EN
TITI
ES A
ND
ASS
OC
IATE
D C
OM
PAN
IES
130
Place of incorporation Principal activities Particular of issued/ Effective Name and kind of legal entity and place of operation registered capital interest held
Outdoor Media Group
@ Beijing TOM International Mainland China, limited Advertising sales in Registered capital 100% Advertising Limited liability company Mainland China RMB1,000,000
@ Changchun TOM New Star Mainland China, limited Advertising sales in Registered capital 60% Media Company Limited liability company Mainland China RMB3,000,000
@ Chongqing TOM Media Mainland China, limited Advertising sales in Registered capital 51% Company Limited liability company Mainland China RMB6,000,000
Fujian TOM Seeout Media Mainland China, limited Advertising sales in Registered capital 70% Company Limited liability company Mainland China RMB5,000,000
Henan New Tianming Advertising & Mainland China, limited Advertising sales in Registered capital 50% Information Chuanbo Company liability company Mainland China RMB6,000,000 Limited
@ Kunming TOM-Fench Media Mainland China, limited Advertising sales in Registered capital 100% Company Limited liability company Mainland China RMB11,000,000
Kunming Fench Star Information Mainland China, limited Advertising sales in Registered capital 100% Industry Limited liability company Mainland China RMB11,000,000
@ Liaoning New Star Guangming Mainland China, limited Advertising sales in Registered capital 60% Media Assets Company Limited liability company Mainland China RMB10,000,000
@ Shandong TOM Longjun Media Mainland China, limited Advertising sales in Registered capital 60% Company Limited liability company Mainland China RMB11,000,000
Shanghai TOM Advertising Mainland China, limited Advertising sales in Registered capital 100% Company Limited liability company Mainland China RMB10,000,000
@ Shenyang TOM Sano Media Mainland China, limited Advertising sales in Registered capital 60% Company Limited liability company Mainland China RMB3,000,000
Sichuan TOM Southwest Outdoor Mainland China, limited Advertising sales in Registered capital 70% Media Company Limited liability company Mainland China RMB3,000,000
Xiamen TOM Bomei Advertising Mainland China, limited Advertising sales in Registered capital 60% Company Limited liability company Mainland China RMB2,500,000
Xiamen TOM Bomei Shiji Advertising Mainland China, limited Advertising sales in Registered capital 60% Company Limited liability company Mainland China RMB1,500,000

Annual Report 2010
PRIN
CIPA
L SUB
SIDIA
RIES, JO
INTLY
CO
NTR
OLLED
ENTITIES A
ND
ASSO
CIA
TED C
OM
PAN
IES131
Place of incorporation Principal activities Particular of issued/ Effective Name and kind of legal entity and place of operation registered capital interest held
Television and Entertainment Group
@ 廣東羊城廣告有限公司 Mainland China, limited Advertising services, corporate Registered capital 80% liability company image design and sale RMB5,000,000 of products in Mainland China
China Entertainment Television Hong Kong, limited Operation of satellite television 42,036 ordinary shares 74.36% Broadcast Limited liability company channels and provision of of HK$0.3 each content and television programmes to various platforms including satellite television and syndication network
@ Shenzhen Jia Jia Television Cultural Mainland China, limited Television programmes Registered capital 100% Transmission Company Limited liability company production and related RMB3,000,000 services and advertising services
YCP Advertising Limited Hong Kong, limited Advertising services, event 10 ordinary shares of 80% liability company management and media HK$1 each buying business in Mainland China and Hong Kong
1 Jointly controlled entity
# Associated company
@ The equity interest is held by individual nominees on behalf of the Group
The above table lists the principal subsidiaries, jointly controlled entities and associated companies of the Group at 31 December 2010 which, in the opinion of the directors of the Company, principally affect the results and net assets of the Group. To give full details of subsidiaries, jointly controlled entities and associated companies would, in the opinion of the directors of the Company, result in particulars of excessive length.
Except for Cup Magazine Publishing Limited, tom.com enterprises Limited, TOM Group International Limited and TOM Online Inc. which are directly held by the Company, the interests in the remaining subsidiaries, jointly controlled entities and associated companies are held indirectly.

TOM Group Limited
132
DEFIN
ITIO
NS“Associates” hasthemeaningascribedtoitintheListingRules
“CETV” meansChinaEntertainmentTelevisionBroadcastLimited
“CKH” meansCheungKong(Holdings)Limited
“Company”or“TOM” meansTOMGroupLimited
“Directors” meansthedirectorsoftheCompany
“GEM” meanstheGrowthEnterpriseMarketoftheStockExchange
“Group”or“TOMGroup” meanstheCompanyanditssubsidiaries
“HWL” meansHutchisonWhampoaLimited
“ListingRules” meanstheRulesGoverningtheListingofSecuritiesontheStockExchange
“MainBoard” meansthemainboardoftheStockExchange
“MainlandChina”or“PRC” means The People’s Republic ofChina, excludingHongKong,Macau and Taiwan
“SFO” meanstheSecuritiesandFuturesOrdinance (Chapter571ofthelaws of Hong Kong)
“StockExchange” meansTheStockExchangeofHongKongLimited
“TOMInternational” meansTOMGroupInternationalLimited
“TOMOnline”or“TOMO” meansTOMOnlineInc.