Annual Report 2018 - HKEXnews
287
Annual Report 2018
-
Upload
khangminh22 -
Category
Documents
-
view
1 -
download
0
Transcript of Annual Report 2018 - HKEXnews
Annual Report 2018

is a cultural vision, a philosophy for living.
In the age of machines, we want to celebrate something
more human and kindle the artisan spirit in us.
Through Collect, Connect, Collide,
The Artisanal Movement becomes an incubator for ideas,
and a channel for audiences to experience them.

C o n t e n t s
16 Corporate Structure
17 Financial Highlights
18 Chairman’s Statement
20 Executive Vice-chairman’s Report
48 Major Property Projects in Hong Kong
50 Major Property Development Projects in Mainland China
52 Directors’ Profile
61 Senior Management Profile
62 Investor Relations
64 Corporate Sustainability
88 Corporate Information
89 Report of the Directors
113 Management Discussion and Analysis
122 Independent Auditor’s Report
128 Consolidated Income Statement
129 Consolidated Statement of Comprehensive Income
130 Consolidated Statement of Financial Position
132 Consolidated Statement of Changes in Equity
134 Consolidated Statement of Cash Flows
136 Notes to the Financial Statements
239 Five-year Financial Summary
241 Risk Factors
254 Corporate Governance Report
263 Principal Projects Summary
284 Glossary of Terms
DisclaimerThe photographs, images, drawings or sketches shown in this annual report represent an artist’s impression of the development concerned only. They are not drawn to scale and/or may have been edited and processed with computerised imaging techniques. Prospective purchasers should make reference to the sales brochure for details of the development. The vendor also advises prospective purchasers to conduct an on-site visit for a better understanding of the development site, its surrounding environment and the public facilities nearby.
All parties engaged in the production of this annual report have made their best efforts to ensure the highest accuracy of all information, photographs, images, drawings or sketches herein contained as to the printing of this annual report and to minimise the existence of clerical errors. Readers are invited to make enquires to sales personnel or consult relevant professionals for verification of doubts or particulars of specific items.
If there is any inconsistency or conflict between the English and the Chinese versions, the English version shall prevail.


Artistry • Creation • Humanised
c r a f t s m a n s h i p


Encounter • Indulgence • Peculiar
b e s p o k e

Aesthetics • Culture • Legacy
h e r i t a g eAestheticccccs ••••••• CCCCCCCCCCCCuuuuuuuuuuuuuuuuullllllllltttttttttttuuuuuuuuuuurrrrrrrrrreeeeeeeeee ••••••• LLLLLLLLeeeeeeeeeegggggggggggaaaaaaaaccccccccyyyyyyyyy


Innovation • Provocative • Visionary
c o n t e m p o r a r y

v ictor iadocks ide


mainland china
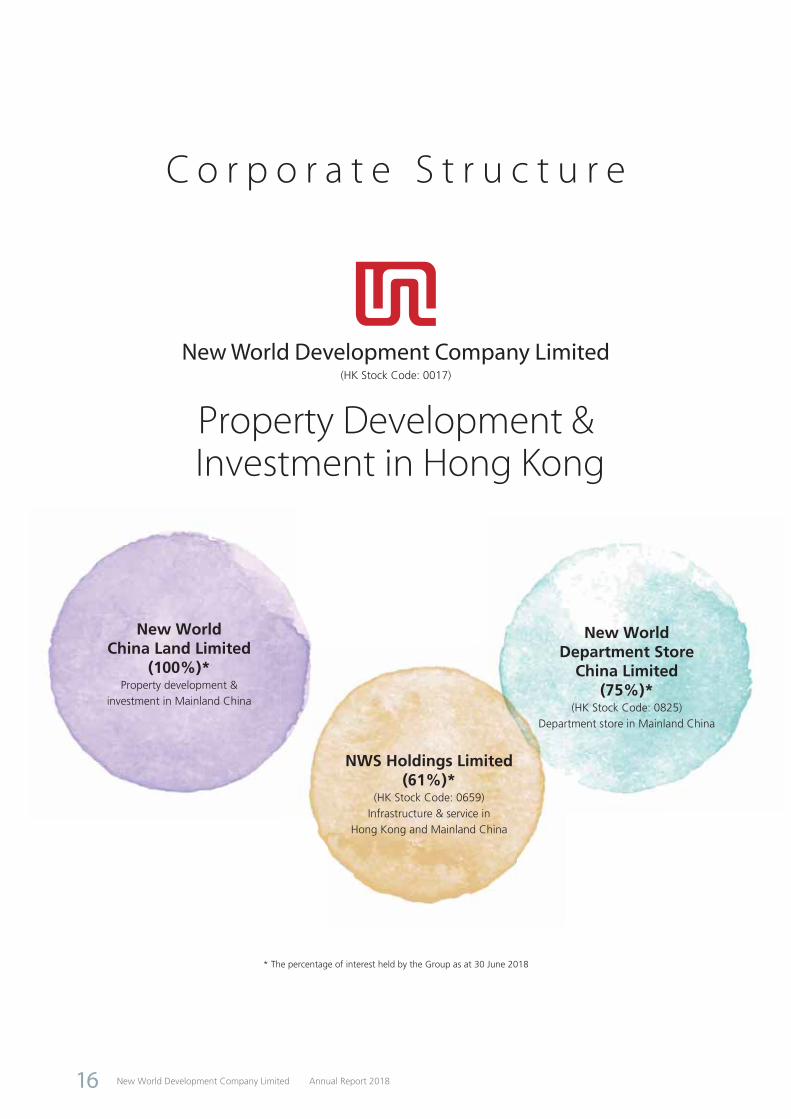
C o r p o r a t e S t r u c t u r e
New World China Land Limited
(100%)*Property development &
investment in Mainland China
NWS Holdings Limited (61%)*
(HK Stock Code: 0659)Infrastructure & service in
Hong Kong and Mainland China
New World Department Store
China Limited(75%)*
(HK Stock Code: 0825)Department store in Mainland China
* The percentage of interest held by the Group as at 30 June 2018
Property Development & Investment in Hong Kong
(HK Stock Code: 0017)
New World Development Company Limited Annual Report 201816
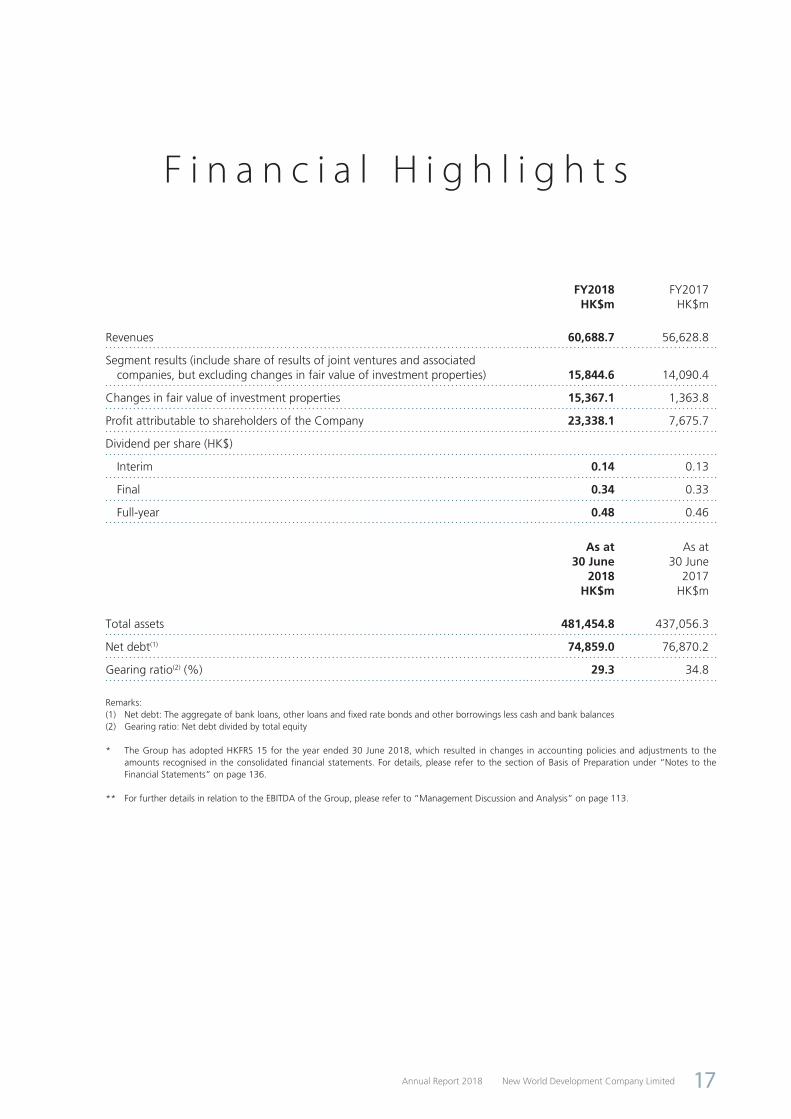
F i n a n c i a l H i g h l i g h t s
FY2018 FY2017HK$m HK$m
Revenues 60,688.7 56,628.8
Segment results (include share of results of joint ventures and associated companies, but excluding changes in fair value of investment properties) 15,844.6 14,090.4
Changes in fair value of investment properties 15,367.1 1,363.8
Profit attributable to shareholders of the Company 23,338.1 7,675.7
Dividend per share (HK$)
Interim 0.14 0.13
Final 0.34 0.33
Full-year 0.48 0.46
As at 30 June
2018
As at 30 June
2017HK$m HK$m
Total assets 481,454.8 437,056.3
Net debt(1) 74,859.0 76,870.2
Gearing ratio(2) (%) 29.3 34.8
Remarks:(1) Net debt: The aggregate of bank loans, other loans and fixed rate bonds and other borrowings less cash and bank balances(2) Gearing ratio: Net debt divided by total equity
* The Group has adopted HKFRS 15 for the year ended 30 June 2018, which resulted in changes in accounting policies and adjustments to the amounts recognised in the consolidated financial statements. For details, please refer to the section of Basis of Preparation under “Notes to the Financial Statements” on page 136.
** For further details in relation to the EBITDA of the Group, please refer to “Management Discussion and Analysis” on page 113.
New World Development Company LimitedAnnual Report 2018 17

C h a i r m a n ’ s S t a t e m e n t
The year 2018
In full support of China’s development strategies including
“The Belt and Road Initiative” andGuangdong-Hong Kong-Macao Bay Area
development,the Group will continue to shoulder the responsibilities as a city builder,
contribute to our homeland and plow back to society.
New World Development Company Limited Annual Report 201818

C h a i r m a n ’ s S t a t e m e n t
TO OUR SHAREHOLDERS,
City is a people-centered complex system. It is an
aggregation of technological advancement, economic
development and social evolvement; a network arising from
the interactions between citizens and natural environment;
and a combination of imagination and reality.
From the perspective of an urban ecologist, the ecological
quality of a city casts direct impact on the pace of economic
and social development. Urban development becomes
more constrained by objective conditions such as land,
resources, environment, society and economy when
evolving to the mature period. By harmonising the conflicts
between economic development and urban environment,
or through the synergies across regions and expansion of
the overall urban development scale and so forth, a city
builder contributes to sustainability and creates a perpetual
ecological environment in which residents can live in peace.
With the tremendously rapid development of our country
and the overall expedition of the integration among
Guangdong, Hong Kong and Macao, Hong Kong has
vigorously utilized its unique strengths to interact and
bond with neighbouring cities. This has key significance to
sustainable development, competitiveness improvement and
long-term prosperity and stability for the city cluster.
On 1 July 2017, the “Framework Agreement on Deepening
Guangdong-Hong Kong-Macao Cooperation in the
Development of the Bay Area” was signed among the
National Development and Reform Commission and the
Governments of Guangdong Province, Hong Kong and
Macao. Comprising 11 cities, the Guangdong-Hong Kong-
Macao Bay Area (“Bay Area”) will be a region with the
highest density of population, capital and global patents of
the country. Its geographical area, population, economic
growth rate, ports handling capacity and airport traffic
volume will be comparable to world-renowned bay areas
which are based on single-core economy, including
San Francisco, New York and Tokyo.
Some research institutions predict that the Bay Area will
surpass the three existing bay areas by 2030 to become a
new global free economic zone with the highest population
and largest economic size in the world. Through innovation
and greater regional col laboration, this multi-core
development plan will enhance the complementary strengths
of the cities in the Bay Area, achieve interconnections in
terms of finance, trade, shipping, services, technology
and talents, improve and innovate upon a cooperation
mechanism, foster the development of industrial value chain,
and deliver mutual benefits.
With its long-standing commitment to developing the
Greater China market, the New World Group advocates
a sustainable model of development and fabricates
different products and services that cater to various needs
generating from the city evolvement. In full support of
China’s development strategies including “The Belt and
Road Initiative” and Guangdong-Hong Kong-Macao Bay Area
Development, the Group will continue to shoulder the
responsibilities as a city builder, contribute to our homeland
and plow back to society. Meanwhile, the Group will further
enhance the New World brand and, by way of boundless
imagination and meticulous planning, create room for
sustainable and diversified development and in turn create
values for stakeholders and society.
Dr. Cheng Kar-Shun, HenryChairman
Hong Kong, 20 September 2018
New World Development Company LimitedAnnual Report 2018 19

E x e c u t i v eV i c e - c h a i r m a n ’ s R e p o r t
The New World
Group will
continue to
stay ahead of
the market with
the passion and
commitment
enshrined under
The Artisanal
Movement
BUSINESS REVIEW
In FY2018, profit attr ibutable to
s h a r e h o l d e r s o f t h e C o m p a n y
amounted to HK$23,338.1 million,
up 204.1%, which was mainly due to
the improved performance in segment
results, together with the surplus in
changes in fair value of investment
properties.
Segment results up 12.4% year-on-
year, in which, property development
and infrastructure recorded a growth
of 26.2% and 14.7% respectively,
mainly attributable to the increase
i n c o n t r i b u t i o n f r o m p r o p e r t y
deve lopment in Hong Kong and
Mainland China, and the improved
performance of road and aviation
businesses. The increase in changes in
fair value of investment properties were
mainly attributable to Victoria Dockside
and the enhancement of the flagship
properties in Hong Kong especially in
office sector.
The basic earnings per share of the
Group increased by 192.5% to HK$2.34.
Net gearing stood at 29.3%, down 5.5
percentage points.
In FY2018, the Group’s underlying
profit amounted to HK$7,977.6 million,
increased by 11.8%. The deduction
were mainly due to changes in fair
va lue of inves tment proper t ies ,
non-controlling shareholder’s interests,
together w i th the d i sposa l and
revaluation of the shares in Beijing
Capital International Airport Co., Ltd.
(“BCIA”) under NWS Holdings Limited
(“NWSH”). In FY2017, the Group’s
unde r l y i ng p ro f i t amounted to
HK$7,133.3 million.
New World Development Company Limited Annual Report 201820

E x e c u t i v e V i c e - c h a i r m a n ’ s R e p o r t
Hong Kong landbankattributable GFAAs at 30 June 2018
Hong Kong agricultural landbank attributable land areaAs at 30 June 2018
Segment performance FY2018 FY2017
(HK$ million) Revenues Segment results* Revenues Segment results*
Property development 23,380.8 9,475.5 25,968.0 7,506.8
Hong Kong 7,141.0 2,864.5 8,538.1 2,277.1
Mainland China 16,239.8 6,611.0 17,429.9 5,229.7
Property investment 3,109.9 1,923.3 2,410.9 1,770.6
Hong Kong 1,835.9 1,160.9 1,576.2 1,169.5
Mainland China 1,274.0 762.4 834.7 601.1
Hotel operations 1,479.0 (76.5) 1,426.5 (113.8)
Hong Kong 608.8 68.9 573.9 87.3
Mainland China 606.8 (180.1) 633.8 (289.2)
Southeast Asia 263.4 34.7 218.8 88.1
Service 25,911.7 858.4 20,743.0 1,186.0
Infrastructure 2,814.6 3,801.4 2,410.6 3,313.0
Department stores 3,670.9 232.4 3,389.0 220.0
Others 321.8 (369.9) 280.8 207.8
Total 60,688.7 15,844.6 56,628.8 14,090.4
* Segment results include share of results of joint ventures and associated companies and exclude changes in fair value of investment properties.
Central and Western District
Eastern District
Yau Tsim Mong District, Kowloon City District, Kwun Tong District, Sham Shui Po District and Wong Tai Sin District
Tsuen Wan District, Yuen Long District and Tuen Mun District
Sha Tin District and Sai Kung District
Others
Yuen Long District and Tuen Mun District
Northern District
Sha Tin District and Tai Po District
Sai Kung District
6%2%
35%
7%17%
33%
6%2%
35%
7%17%
33%
7%
68%
13%
12%
7%
68%
13%
12%11,973,508 sq ft
16,995,861 sq ft
New World Development Company LimitedAnnual Report 2018 21
E x e c u t i v e V i c e - c h a i r m a n ’ s R e p o r t
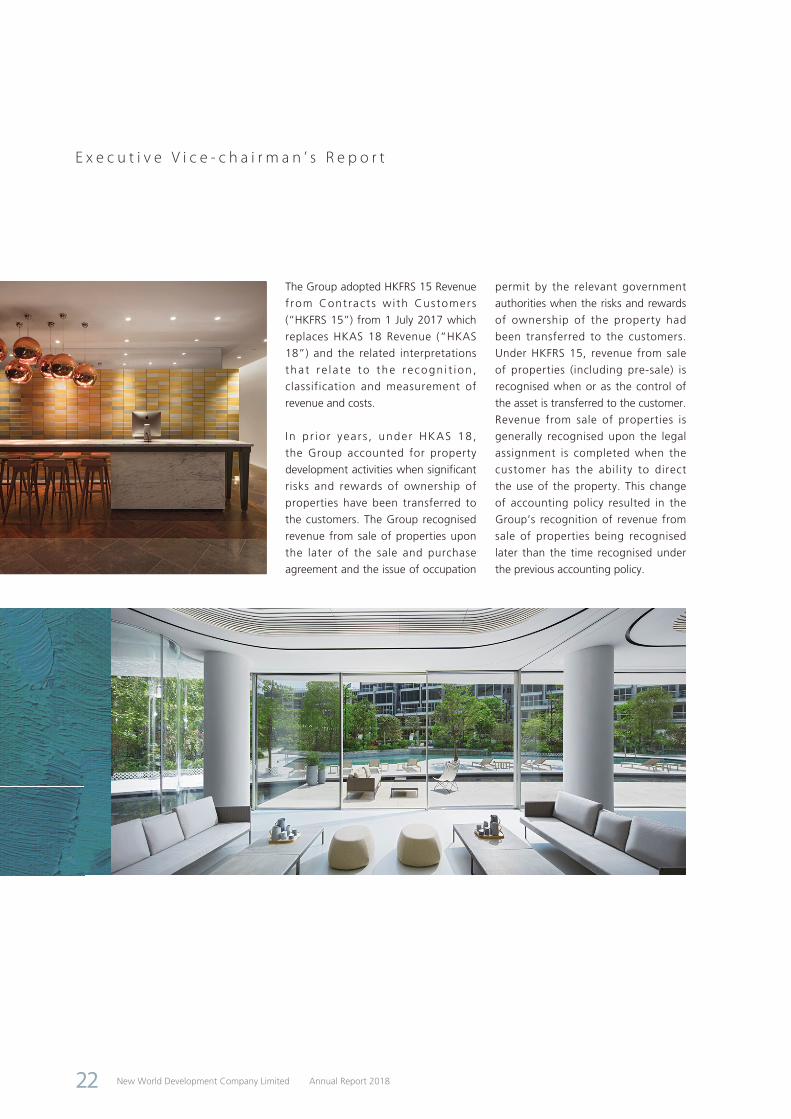
The Group adopted HKFRS 15 Revenue
f rom Contracts wi th Customers
(“HKFRS 15”) from 1 July 2017 which
replaces HKAS 18 Revenue (“HKAS
18”) and the related interpretations
tha t r e l a te to the r ecogn i t i on ,
classification and measurement of
revenue and costs.
In p r io r year s , under HKAS 18 ,
the Group accounted for property
development activities when significant
risks and rewards of ownership of
properties have been transferred to
the customers. The Group recognised
revenue from sale of properties upon
the later of the sale and purchase
agreement and the issue of occupation
permit by the relevant government
authorities when the risks and rewards
of ownership of the property had
been transferred to the customers.
Under HKFRS 15, revenue from sale
of properties (including pre-sale) is
recognised when or as the control of
the asset is transferred to the customer.
Revenue from sale of properties is
generally recognised upon the legal
assignment is completed when the
customer has the ability to direct
the use of the property. This change
of accounting policy resulted in the
Group’s recognition of revenue from
sale of properties being recognised
later than the time recognised under
the previous accounting policy.
New World Development Company Limited Annual Report 201822
E x e c u t i v e V i c e - c h a i r m a n ’ s R e p o r t
The natural
elegance of the
neighbourhood
EBITDA* of the Group for FY2018 by Region is as follows:
EBITDA (HK$m) Under HKFRS 15 Under HKAS 18
Hong KongMainland China
and other regions Hong KongMainland China
and other regions
Property related 3,864.6 87% 7,284.1 77% 10,147.2 95% 6,966.2 76%
Others 585.9 13% 2,159.4 23% 585.9 5% 2,164.2 24%
Total 4,450.5 100% 9,443.5 100% 10,733.1 100% 9,130.4 100%
EBITDA (%) 32% 68% 54% 46%
* EBITDA: operating profit before depreciation and amortisation, changes in fair value of investment properties and other gains, net and after net exchange difference
New World Development Company LimitedAnnual Report 2018 23
E x e c u t i v e V i c e - c h a i r m a n ’ s R e p o r t
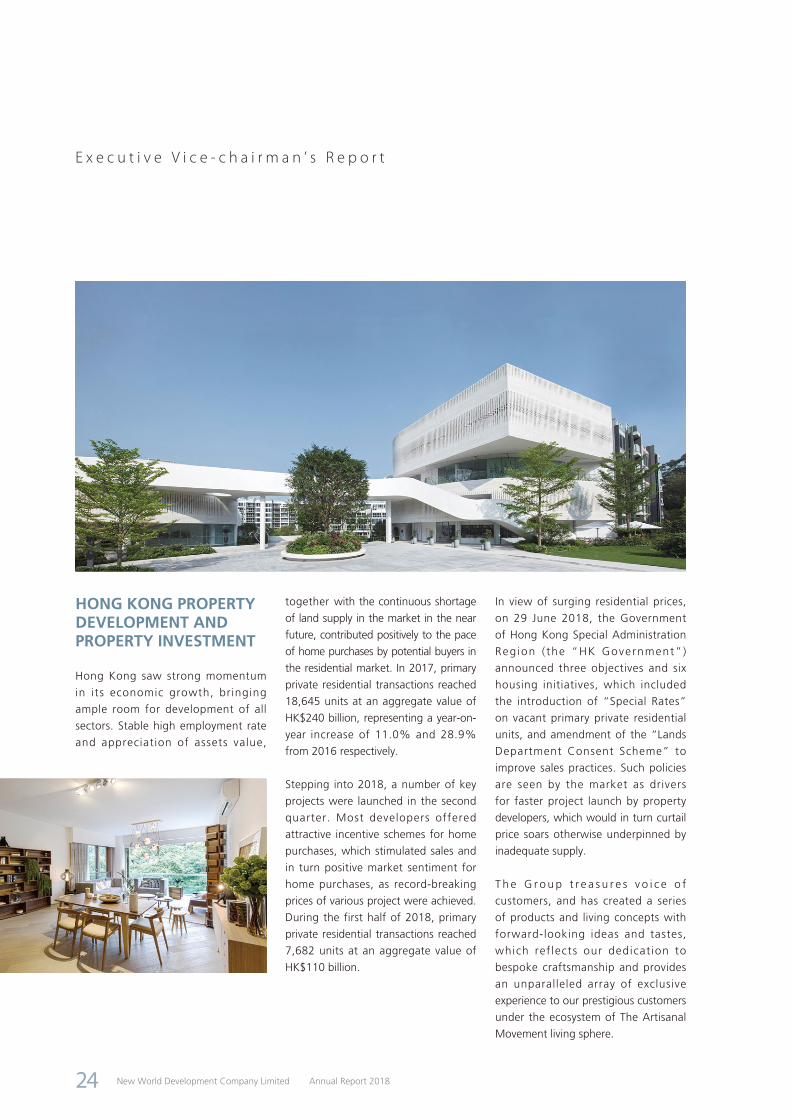
HONG KONG PROPERTY DEVELOPMENT AND PROPERTY INVESTMENT
Hong Kong saw strong momentum
in its economic growth, bringing
ample room for development of all
sectors. Stable high employment rate
and appreciation of assets value,
together with the continuous shortage
of land supply in the market in the near
future, contributed positively to the pace
of home purchases by potential buyers in
the residential market. In 2017, primary
private residential transactions reached
18,645 units at an aggregate value of
HK$240 billion, representing a year-on-
year increase of 11.0% and 28.9%
from 2016 respectively.
Stepping into 2018, a number of key
projects were launched in the second
quarter. Most developers offered
attractive incentive schemes for home
purchases, which stimulated sales and
in turn positive market sentiment for
home purchases, as record-breaking
prices of various project were achieved.
During the first half of 2018, primary
private residential transactions reached
7,682 units at an aggregate value of
HK$110 billion.
In view of surging residential prices,
on 29 June 2018, the Government
of Hong Kong Special Administration
Reg ion ( the “HK Government” )
announced three objectives and six
housing initiatives, which included
the introduction of “Special Rates”
on vacant primary private residential
units, and amendment of the “Lands
Department Consent Scheme” to
improve sales practices. Such policies
are seen by the market as drivers
for faster project launch by property
developers, which would in turn curtail
price soars otherwise underpinned by
inadequate supply.
T h e G r o u p t r e a s u r e s v o i c e o f
customers, and has created a series
of products and living concepts with
forward-looking ideas and tastes,
which ref lects our dedicat ion to
bespoke craftsmanship and provides
an unparalleled array of exclusive
experience to our prestigious customers
under the ecosystem of The Artisanal
Movement living sphere.
New World Development Company Limited Annual Report 201824
E x e c u t i v e V i c e - c h a i r m a n ’ s R e p o r t
D u r i n g t h e y e a r , t h e G r o u p ’ s
attributable contracted sales in Hong
Kong amounted to HK$24.7 billion,
outperforming the HK$10 billion sales
target and reaching a new height for
the Group, being mainly contributions
from residential projects including
MOUNT PAVILIA in Clear Water Bay,
ARTISAN HOUSE in Sai Ying Pun, FLEUR
PAVILIA in North Point, THE PARKVILLE
in Tuen Mun, PARK HILLCREST and
PARK VILLA in Yuen Long, THE PAVILIA
BAY in Tsuen Wan, The Masterpiece
in Tsim Sha Tsui and the Double Cove
series in Ma On Shan.
During the year under review, the
G r o u p ’ s r e v e n u e a n d s e g m e n t
c o n t r i b u t i o n s f r o m p r o p e r t y
development in Hong Kong, including
joint development projects, amounted
to HK$7,141.0 million and HK$2,864.5
million, respectively. The contributions
was mainly attributable to residential
projects including MOUNT PAVILIA
in Clear Water Bay, The Masterpiece
in Tsim Sha Tsui, THE PAVILIA HILL
in North Point, PARK VILLA in Yuen
Long and the Double Cove series in
Ma On Shan.
In November 2017, the Group launched
ARTISAN HOUSE, the third bespoke
project under the Bohemian Collection,
offering a mix of layouts including
studio as well as one-bedroom and
two-bedroom units. 241 units had
been sold as of early September 2018.
During the year, the Group launched
residential projects PARK HILLCREST
and PARK REACH in Yuen Long,
and THE PARKVILLE in Tuen Mun.
THE PARKVILLE is the first pilot project
under the “NewGen F i r s t Home
Program” launched by the Group. This
program provides another housing
ladder to Hong Kong young generation
with housing needs and have stable
income. Market response was very
positive and all units had been sold
out.
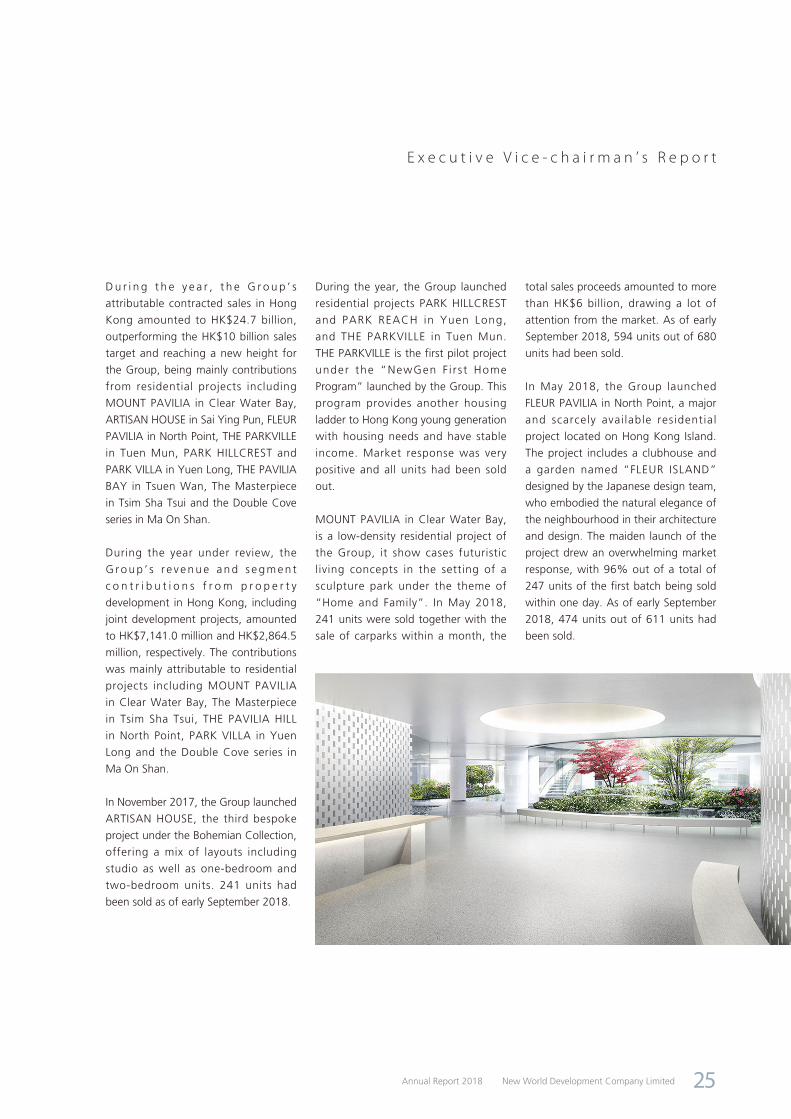
MOUNT PAVILIA in Clear Water Bay,
is a low-density residential project of
the Group, it show cases futuristic
living concepts in the setting of a
sculpture park under the theme of
“Home and Family”. In May 2018,
241 units were sold together with the
sale of carparks within a month, the
total sales proceeds amounted to more
than HK$6 billion, drawing a lot of
attention from the market. As of early
September 2018, 594 units out of 680
units had been sold.
In May 2018, the Group launched
FLEUR PAVILIA in North Point, a major
and scarcely avai lable residential
project located on Hong Kong Island.
The project includes a clubhouse and
a garden named “FLEUR ISLAND”
designed by the Japanese design team,
who embodied the natural elegance of
the neighbourhood in their architecture
and design. The maiden launch of the
project drew an overwhelming market
response, with 96% out of a total of
247 units of the first batch being sold
within one day. As of early September
2018, 474 units out of 611 units had
been sold.
New World Development Company LimitedAnnual Report 2018 25
E x e c u t i v e V i c e - c h a i r m a n ’ s R e p o r t
The Group will fine-tune the pace
of new project launch in response
to market conditions, and provides
home purchasers with choices and
experience to their satisfaction. As of
early September 2018, the Group had
a total of approximately 400 residential
units available for sales. The Group
plans to launch REACH SUMMIT and
Lung Tin Tsuen (Phase 3) in Yuen Long,
Waterloo Road project in Ho Man Tin
and Sheung Heung Road project in
To Kwa Wan, which will provide over
1,300 residential units in aggregate.
Under the cur rent deve lopment
schedule of the projects, THE PAVILIA
BAY in Tsuen Wan, ARTISAN HOUSE in
Sai Ying Pun, THE PARKVILLE in Tuen
Mun, FLEUR PAVILIA in North Point,
and PARK HILLCREST and PARK REACH
in Yuen Long will be handed over
to purchasers in FY2019 and hence
revenue from sales will be recognised
in the same year.
HONG KONG PROPERTY INVESTMENT AND OTHERS
Dr iven by fac tors inc lud ing the
continuous growth of tourist arrivals,
buoyant local job market and prospects
of income growth, the retail sector of
Hong Kong saw twilights of recovery
in 2017, after more than three years of
adjustment. In 2017, total retail sales
increased by 2.2% with substantial
growth in luxury goods and other
consumer goods including medicines
and cosmetics, which rose by 4% and
5.7% respectively. In the first half
of 2018, retail performance further
augmented with an increase of 12% in
total retail sales in June, which was the
16th consecutive months of positive
growth.
D r i v en b y p rom i s i ng e conom i c
environment, corporates plan for
their Hong Kong operations in a
more positive way, the buoyance of
fundraising and listing together with
the market expansion by co-working
space operators in Hong Kong have
ra ised addit ional demand in the
office leasing market. Premium office
spaces in core commercial districts in
Hong Kong are highly sought after
by Chinese enterprises, which have
accounted 41% of all new leases in the
first half of 2018 and increasing year
by year according to property agencies.
Backed by multiple factors, the overall
office vacancy recorded 5.1% and
vacancy rate dropped to 1.1% for the
core area of Central. While supply fell
short of demand, office rental rates
rose by 4.6% in the first half of 2018
on average.
New World Development Company Limited Annual Report 201826

E x e c u t i v e V i c e - c h a i r m a n ’ s R e p o r t
During the year under review, the
Group’s g ross renta l income in
Hong Kong amounted to HK$1,835.9
m i l l i on , an inc rease o f 16 .5%,
a t t r ibutab le to the sa t i s fac to ry
occupancy rates of major projects,
together with the commencement of
o p e r a t i o n i n K 1 1 A T E L I E R a t
Victoria Dockside and THE FOREST in
Mong Kok.
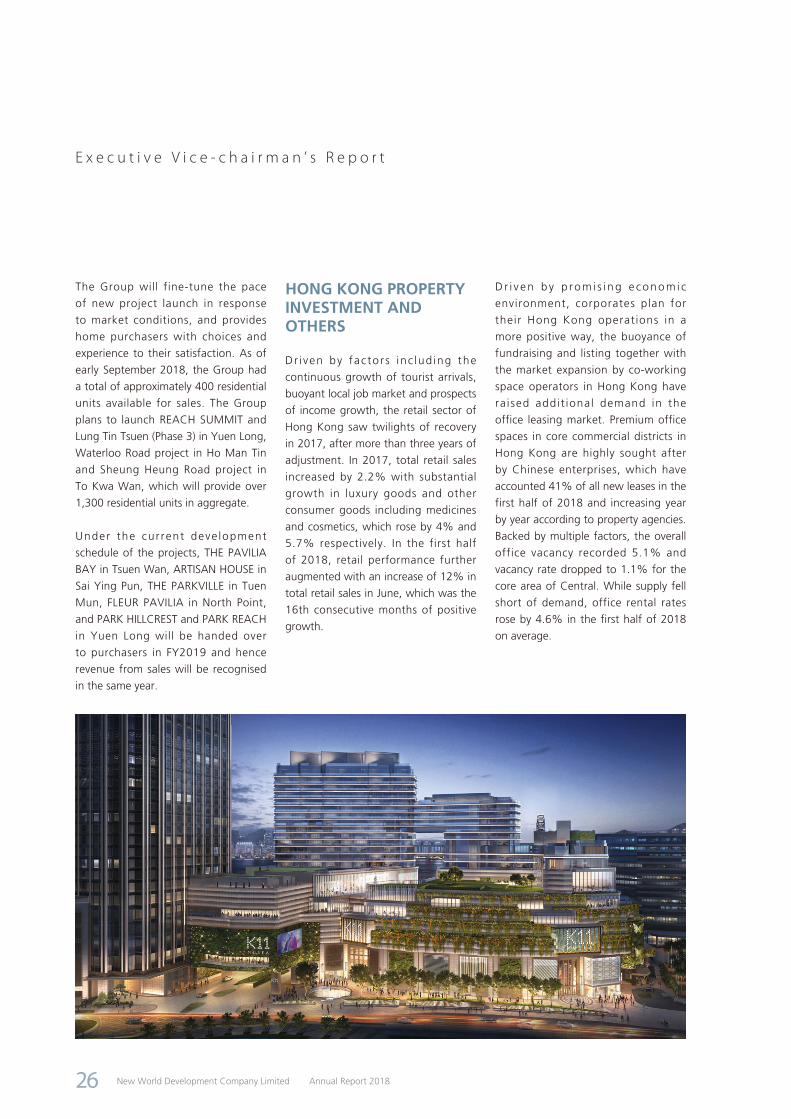
The development of Victoria Dockside,
a new global landmark located at the
core area of Tsim Sha Tsui waterfront
in Kowloon, was progressing well. This
commercial complex with a total GFA
of approximately 3 million sq ft will
accommodate Grade A offices namely
K11 ATELIER, K11 ARTUS serviced
apartments, a luxury hotel Rosewood
Hong Kong, Rosewood Residences, and
K11 MUSEA that offers unparalleled
novel experience of art, design and
leisure, commanding a panoramic view
of Victoria Harbour and Hong Kong
Island from a new perspective. Victoria
Dockside wi l l grand open in the
third quarter in 2019.
K11 ATELIER, the Grade A offices in
Victoria Dockside, was completed and
became available for use during the
year under review. The first batch of
multinational corporations moved in
during the fourth quarter of 2017.
Occupancy rate is over 70% as at the
end of FY2018.
K11 MUSEA, an ambitious project
situated in the heart of Victoria Dockside,
will be unveiled in the third quarter
of 2019. Entai l ing an innovat ive
experiential museum-retail concept, the
project is set to turn over a new leaf
for the retail industry of Hong Kong.
K11 MUSEA has been designed to
offer world-class experience in retail,
a r t , cu l ture , enter ta inment and
dining to global millennials who see
experiencing and travel as parts of an
indulgent lifestyle and aimed to be
the destination of travel gurus. The
10-storey K11 MUSEA will house an
extensive selection of international
brands, many of which are pop-up stores
and flagship stores that are setting their
first presence in Hong Kong.
K11 ARTUS is the first hospitality
extension of K11, a global high-end
lifestyle brand that brings together
three essential elements of art, people
and nature. K11 ARTUS comprises
287 suites spanning across 14-storey,
offering flexible rental plans from short
to long-term stays to accommodate the
needs of guests, is scheduled to open
in summer 2019.
Rosewood Hong Kong, as part of the
multi-use tower, is scheduled to open
in the first quarter in 2019.
Victoria Dockside – area breakdown Total GFA(sq ft ’000)
K11 ATELIER 435
K11 MUSEA (including the portion of 12 Salisbury Road, Tsim Sha Tsui) 1,156
K11 ARTUS 380
Rosewood Hong Kong + Rosewood Residences 1,106
Total 3,077
New World Development Company LimitedAnnual Report 2018 27
E x e c u t i v e V i c e - c h a i r m a n ’ s R e p o r t
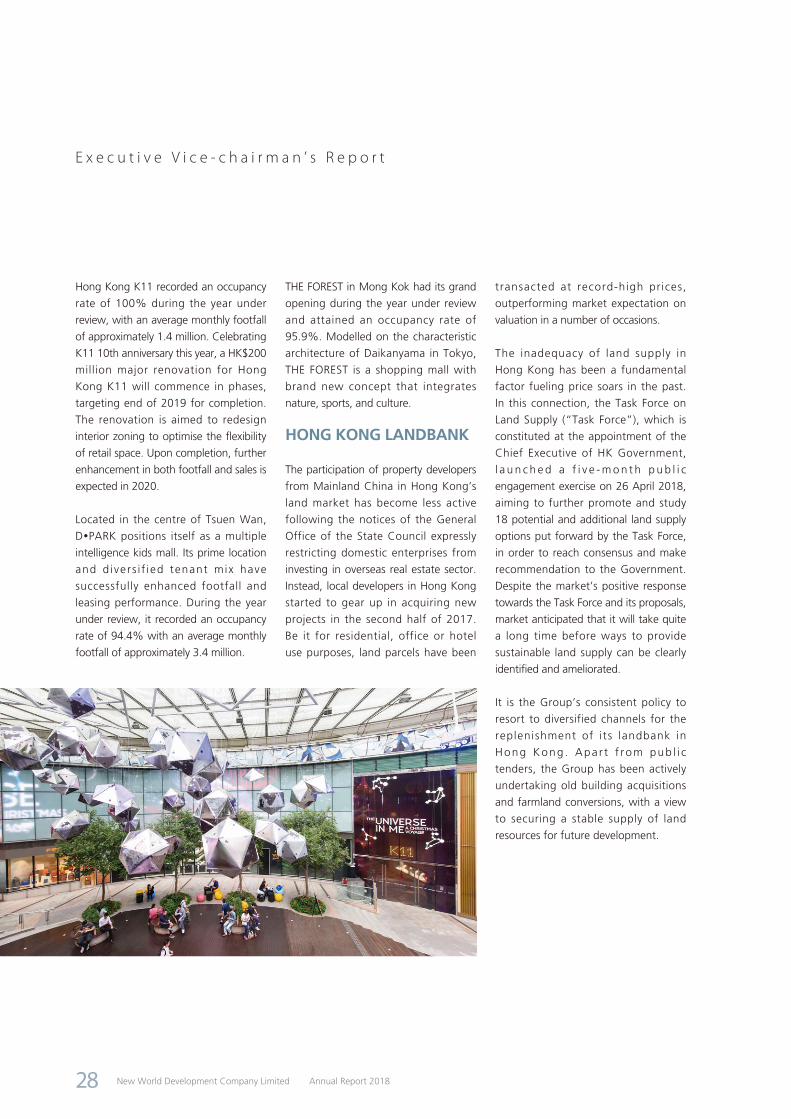
Hong Kong K11 recorded an occupancy
rate of 100% during the year under
review, with an average monthly footfall
of approximately 1.4 million. Celebrating
K11 10th anniversary this year, a HK$200
million major renovation for Hong
Kong K11 will commence in phases,
targeting end of 2019 for completion.
The renovation is aimed to redesign
interior zoning to optimise the flexibility
of retail space. Upon completion, further
enhancement in both footfall and sales is
expected in 2020.
Located in the centre of Tsuen Wan,
DPARK positions itself as a multiple
intelligence kids mall. Its prime location
and d ivers i f ied tenant mix have
successfully enhanced footfall and
leasing performance. During the year
under review, it recorded an occupancy
rate of 94.4% with an average monthly
footfall of approximately 3.4 million.
THE FOREST in Mong Kok had its grand
opening during the year under review
and attained an occupancy rate of
95.9%. Modelled on the characteristic
architecture of Daikanyama in Tokyo,
THE FOREST is a shopping mall with
brand new concept that integrates
nature, sports, and culture.
HONG KONG LANDBANK
The participation of property developers
from Mainland China in Hong Kong’s
land market has become less active
following the notices of the General
Office of the State Council expressly
restricting domestic enterprises from
investing in overseas real estate sector.
Instead, local developers in Hong Kong
started to gear up in acquiring new
projects in the second half of 2017.
Be it for residential, office or hotel
use purposes, land parcels have been
transacted at record-high prices,
outperforming market expectation on
valuation in a number of occasions.
The inadequacy of land supply in
Hong Kong has been a fundamental
factor fueling price soars in the past.
In this connection, the Task Force on
Land Supply (“Task Force”), which is
constituted at the appointment of the
Chief Executive of HK Government,
l a u n c h e d a f i v e - m o n t h p u b l i c
engagement exercise on 26 April 2018,
aiming to further promote and study
18 potential and additional land supply
options put forward by the Task Force,
in order to reach consensus and make
recommendation to the Government.
Despite the market’s positive response
towards the Task Force and its proposals,
market anticipated that it will take quite
a long time before ways to provide
sustainable land supply can be clearly
identified and ameliorated.
It is the Group’s consistent policy to
resort to diversified channels for the
replenishment of its landbank in
Hong Kong . Apa r t f rom pub l i c
tenders, the Group has been actively
undertaking old building acquisitions
and farmland conversions, with a view
to securing a stable supply of land
resources for future development.
New World Development Company Limited Annual Report 201828
E x e c u t i v e V i c e - c h a i r m a n ’ s R e p o r t
In furtherance of i ts strategy of
development in the Guangdong-Hong
Kong-Macao Bay Area, on 2 May
2018, the Group won a successful bid
for an iconic world-class commercial
development in SKYCITY at Hong Kong
International Airport (“HKIA”). Situated
next to HKIA, the development will
involve total investment of HK$20 billion
and take up a GFA of approximately
3.77 million sq ft, comprising 2.1 million
sq ft for dinning and retail outlets and
570,000 sq ft each for experience-based
entertainment facilities and office space.
The remaining floor area will be used
for public facilities and carparks. The
project is scheduled to be completed in
phases from 2023 to 2027.
The Group will be responsible for the
design, development and management
of the entire project, aiming to build
this strategically located project into
a commercial and entertainment hub
in Hong Kong and the Bay Area at
large, offering high-tech experiential
enterta inment, making i t a new
landmark in Hong Kong for locals and
visitors from overseas and a population
of more than 60 million people of the
Bay Area.
The Group is optimistic about the
development of Kowloon West District
and acquired Wing Hong Street project
in Cheung Sha Wan, Kowloon in
August 2017. The project will develop
into a Grade A office building with a
GFA of approximately 370,000 sq ft.
Together with the winning bids for
King Lam Street project and Cheung
Shun Street project, both located in
Cheung Sha Wan, the Group currently
has three Grade A office projects under
development in that district with a total
GFA of 1.9 million sq ft.
Further to the successful land use
conversions of two agricultural land
plots located in Yuen Long in 2016,
the Group converted the land usage
of another land plot Lung Tin Tsuen
Phase 3 farmland in Yuen Long town
centre in August 2017. Total GFA
is approximately 121,100 sq ft and
the total land premium amounted to
approximately HK$460 million.
As at 30 June 2018, the Group had a
landbank in Hong Kong for immediate
development with an attributable total
GFA of approximately 11.97 million sq
ft, of which approximately 3.96 million
sq ft is for residential use. Meanwhile,
the Group had an agricultural landbank
in New Territories with an attributable
total site area of approximately 17
million sq ft pending for land use
conversion.
Landbank by district Attributable total GFA(sq ft ’000)
Hong Kong Island 980
Kowloon 4,217
New Territories 6,777
Total 11,974
Agricultural landbank by districtTotal
site areaAttributable
site area(sq ft ’000) (sq ft ’000)
Yuen Long District 12,593 11,594
Northern District 2,601 2,246
Sha Tin District and Tai Po District 1,975 1,975
Sai Kung District 1,359 1,161
Tuen Mun District 19 19
Total 18,547 16,995
New World Development Company LimitedAnnual Report 2018 29

E x e c u t i v e V i c e - c h a i r m a n ’ s R e p o r t
MAINLAND CHINA PROPERTY DEVELOPMENT
As the real estate sector is highly correlated to financial policies, lowering leverages in the sector is among the key tasks of the Chinese Central Government (“Central Government”) under its financial risk control and prevention initiatives. Against the backdrop of nove l internat ional r e l a t i o n s a n d m a c r o e c o n o m i c conditions, Renminbi exchange rate issue trai l ing from the trade war between China and the United States, together with the deleverage issue in the real estate sector, the potential risks and hidden irregularities are stacking up in the property market. Fortunately, the solid economic and financial foundation of the country and improvements in the global economy as compared to the past years have contributed to some positive sentiments in the market towards the latest development.
Most cities in Mainland China adhere to the pr inc ip les of “one pol icy for one city” and “category-based administration”, under which housing measures are refined and optimised based on the actual situations of the respective localities. First-tier cities and their core districts in general are still seeing some increases in property prices due to the rise in floating population and the overall inadequacy of land supply, despite some cooling down of the property market under tightened housing policies. In third- and fourth-tier cities, many local governments have shifted their policies from easing to comparatively tightening for ironing out risks in response to the over-vitalised market, albeit the remarkable change
in transaction volume and prices under destocking policies and the unleashing of strong purchasing power in the course of renovation of shanty towns.
It is generally anticipated that the possibility for significant re-steering of property policies is remote. Under the current circumstances, policies will remain tight, namely hiking interest rate
for home mortgages, more stringent requirements on down payment, and restrictions on the purchases of second and third homes, under which the transaction volume of property sales should be curtailed to a certain extent. Property developers need to lower leverages to form their sustainable business models. Meanwhile, industry consolidation is also expected to
New World Development Company Limited Annual Report 201830

E x e c u t i v e V i c e - c h a i r m a n ’ s R e p o r t
proceed under new norms of the market. Industry competitiveness will be primarily benchmarked against the fittest-survive principle, brand influence, regional deployment and execution capability.
The property business in Mainland China is operated by our wholly-owned subsidiary New World China Land Limited (“NWCL”). During the year under review, the revenues and segment results of property development in Mainland China, including joint development projects, amounted to HK$16,239.8 million and HK$6,611.0 million, respectively. The contribution was mainly attributable to the sales of Guangzhou Covent Garden, Guangzhou Foshan Canton First Estate, Shenzhen New World Signature Hill, Wuhan New WorldTimes, Changsha La Ville New World, Langfang New World Garden, Beijing New WorldLi Zun and Shenyang New World Garden.
During the year under review, overall property contracted sales in Mainland China reached 798,734 sq m in GFA and RMB16.26 billion in gross sales proceeds, achieving the FY2018 sales
target of RMB16 billion. The average selling price of overall residential contracted sales is RMB22,667 per sq m, an increase of 20.9%. The major contributors were Ning Zhu Zun Fu of Ningbo New World, Shenyang New World Garden, Guangzhou Foshan Canton First Estate, Wuhan New WorldTimes, Wuhan New World Guanggu, Beijing New WorldLi Zun, Langfang New
World Garden, Shenzhen New World Signature Hill and Guangzhou Park Paradise.
As for the geographical distribution of contracted sales proceeds, Southern region being the largest contributor, accounted for 26.0%, followed by Central region and Eastern region, accounting for 24.4% and 18.4%, respectively.
Residential contracted sales Non-residential contracted salesRegion Area Proceeds Area Proceeds
(sq m ’000) (RMB million) (sq m ’000) (RMB million)
Southern region 112 3,062 68 1,161
Central region 96 1,913 143 2,060
Eastern region 65 3,000 – –
Northern region 126 2,370 16 180
North-eastern region 159 2,315 13 199
Total 558 12,660 240 3,600
New World Development Company LimitedAnnual Report 2018 31

E x e c u t i v e V i c e - c h a i r m a n ’ s R e p o r t
The GFA of development property completed (excluding carpark) during the year under review amounted to 1,074,164 sq m,
66.1% of which is residential in key cities including Guangzhou, Foshan, Wuhan and Shenyang. It is expected to reach
1,160,595 sq m in FY2019, representing an increase of 8% year-on-year.
FY2018 Project completion in Mainland China – Development property
Project/GFA sq m Residential Commercial Office
Total (excluding
carpark)
Total (including
carpark)
Wuhan New WorldTimes Site B 186,909 – – 186,909 186,909
Changsha La Ville New World Phase 3B – 25,389 66,938 92,327 123,604
Guangzhou Covent Garden District 1 1C2 109,952 – – 109,952 109,952
Guangzhou Covent Garden District 1 1E 63,525 – – 63,525 63,525
Guangzhou Covent Garden Commercial 1 – 7,910 – 7,910 7,910
Canton First Estate CF-20 Phase 1 82,811 – – 82,811 82,811
Canton First Estate CF-27A 23,837 – – 23,837 23,837
Canton First Estate CF-29 75,140 – – 75,140 75,140
Shenyang New World Centre K11 – 264,038 – 264,038 264,038
Shenyang New World Garden Phase 2D1 128,642 – – 128,642 128,642
Shenyang New World Garden Phase 2D2 39,073 – – 39,073 39,073
Total 709,889 297,337 66,938 1,074,164 1,105,441
New World Development Company Limited Annual Report 201832
E x e c u t i v e V i c e - c h a i r m a n ’ s R e p o r t
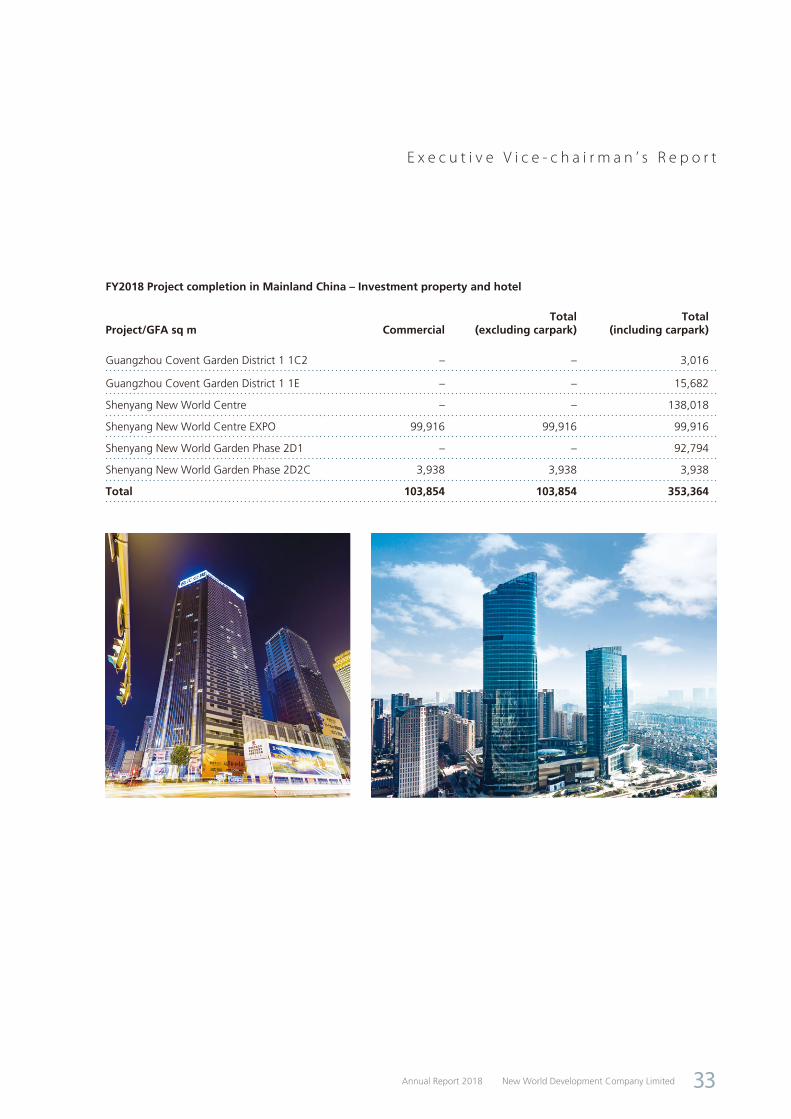
FY2018 Project completion in Mainland China – Investment property and hotel
Project/GFA sq m CommercialTotal
(excluding carpark)Total
(including carpark)
Guangzhou Covent Garden District 1 1C2 – – 3,016
Guangzhou Covent Garden District 1 1E – – 15,682
Shenyang New World Centre – – 138,018
Shenyang New World Centre EXPO 99,916 99,916 99,916
Shenyang New World Garden Phase 2D1 – – 92,794
Shenyang New World Garden Phase 2D2C 3,938 3,938 3,938
Total 103,854 103,854 353,364
New World Development Company LimitedAnnual Report 2018 33
E x e c u t i v e V i c e - c h a i r m a n ’ s R e p o r t
FY2019 Estimated project completion in Mainland China – Development property
Project/GFA sq m Residential Commercial Office
Total (excluding
carpark)
Total (including
carpark)
Yiyang New World Scenic Heights Phase 1D 14,111 – – 14,111 14,111
Yiyang New World Scenic Heights Phase 1E 20,516 1,139 – 21,655 21,655
Langfang New World Centre District A – – – – 33,651
Langfang New World Garden District 2 55,064 7,249 – 62,313 85,691
Ningbo New World Plaza Land No. 11 – 9,702 58,051 67,753 90,010
Ningbo New World Plaza Land No. 12 – 8,085 12,361 20,446 46,428
Ningbo New World Plaza Land Nos. 7-10 – 20,192 – 20,192 125,162
Guangzhou Dong Yi Garden Phase 5 23,015 – – 23,015 37,226
Guangzhou Park Paradise Area 3 Phase 1 136,671 – – 136,671 136,671
Canton First Estate CF-20 Phase 2 42,023 – – 42,023 42,023
Anshan New World Garden Phase 1B1 63,885 14,472 – 78,357 97,782
Jinan New World Sunshine Garden District BC – 5,697 37,162 42,859 61,292
Shenyang New World Centre 287,086 – – 287,086 287,086
Shenyang New World Garden Phase 2D2 169,778 – – 169,778 169,778
Shenyang New World Garden Phase 2E 97,665 – – 97,665 97,665
Shenyang New World Commercial Centre Phase 2 – 25,266 51,405 76,671 76,671
Total 909,814 91,802 158,979 1,160,595 1,422,902
FY2019 Estimated project completion in Mainland China – Investment property and hotel
Project/GFA sq m Commercial Office Hotel
Total (excluding
carpark)
Total (including
carpark)
Wuhan New World Centre Phase 3 32,294 59,434 – 91,728 140,969
Langfang New World Centre District A – – 40,192 40,192 40,192
Ningbo New World Plaza Land Nos. 7-10 5,781 – – 5,781 5,781
Guangzhou Park Paradise Area 3 Phase 1 – – – – 95,435
Guangzhou Park Paradise Area 3 Commercial 90,726 – – 90,726 90,726
Guangzhou Park Paradise Area 5 Land No. 1 22,763 – – 22,763 35,365
Canton First Estate CF-27A – – – – 12,025
Canton First Estate CF-29 – – – – 70,080
Jinan New World Sunshine Garden District BC – – 19,545 19,545 19,545
Shenyang New World Centre – – 99,675 99,675 99,675
Shenyang New World Garden Phase 2D2 2,821 – – 2,821 89,469
Shenyang New World Garden Phase 2E – – – – 40,878
Shenyang New World Commercial Centre Phase 2 – – – – 19,354
Total 154,385 59,434 159,412 373,231 759,494
New World Development Company Limited Annual Report 201834

E x e c u t i v e V i c e - c h a i r m a n ’ s R e p o r t
The Group remains
its full confidence
in the economic
prospect
MAINLAND CHINA PROPERTY INVESTMENT AND OTHERS
For g loba l reta i le rs and brands,
Greater China has surpassed the long-
standing European and American
markets to become the most desired
de s t i na t i on fo r e s t ab l i sh ing o r
strengthening their presence. Ongoing
consumer reliance on the internet has
created opportunities for enterprises
and brands to arouse consumers’
curiosity and change their consumption
behaviours. Big data consolidated
in that progress have formed an
interactive basis on which more precise
bespoke experience can be offered
to consumers. The disruption to retail
ecology and consumption experience
by the millennials that swiftly emerged
in recent years bear testimony to the
fact that the retail market of Mainland
China is moving onto another new
footstep of development.
For the full year of 2017, total retail
sales of commodities in Mainland
China amounted to RMB32.7 trillion,
up 10.2%. Since 2012, total retail
sales of commodities in China has
recorded steady double-digit growth
and accounted for over 80% of the
total retail sales of consumer goods
of the nation. It is expected that as
China’s market of retail consumer goods
continues to develop, the millennials will
play a dominating role in the consumer
group. For a commercial operator,
faster thinking, up-to-date strategies
and the use of technology and digitised
development are all necessary as it sets
a clear brand positioning that caters to
the needs of young consumers.
During the year under review, the
Group recorded a total rental income
of HK$1,274.0 million in Mainland
China with an increase of 52.6%.
The growth were main ly due to
1) the commencement in operations
o f W u h a n G u a n g g u K 1 1 ; a n d
2) the Group has optimised its internal
structure and individual projects have
been converted from joint ventures to
subsidiaries after the completion of the
privatisation of NWCL. Major projects
leaded by Shanghai K11 and Wuhan
International Trade Towers, recorded
satisfactory occupancy.
MAINLAND CHINA LANDBANK
The Group maintains its full confidence
in the economic prospect and passion
of investing in Mainland China. With its
well-founded development strengths,
NWCL puts full effort in optimising
its businesses in Mainland China and
participating in the diversified city
development in Mainland China. The
Group will continue to strategically
invest in key cities and develop iconic
projects with great potential, so as to
provide a quality living environment
and extraordinary experience for the
market.
New World Development Company LimitedAnnual Report 2018 35

E x e c u t i v e V i c e - c h a i r m a n ’ s R e p o r t
In l ine with “The Belt and Road
Initiative” and the Guangdong-Hong
Kong-Macao Bay Area Development,
the Group will continue to step up
investment in the Bay Area. Since the
completion of the privatisation of
NWCL in August 2016, the Group has
successfully acquired permissible GFA
of more than 800,000 sq m in the
Bay Area.
Further to the acquisit ion of the
development rights in two premium
projects in Qianhai and Prince Bay,
both in Shenzhen, the groundbreaking
and commencement ceremony for the
Qianhai project, which is located at
t h e c o r e o f G u i w a n a r e a i n
Qianhai Free Trade Zone in Shenzhen,
was he ld in March 2018. Upon
completion of the project, it wil l
become the Mainland headquarters of
Chow Tai Fook Enterprises Limited
Group and the New World Group,
and will bring in a foreign financial
institution listed in Fortune 500 to
set its regional headquarter with the
remaining GFA for rental. Positioned
as a world-class financial, commercial
and service complex, the project is
expected to boost the development of
the economy and financial industry in
Qianhai.
New World Development Company Limited Annual Report 201836
E x e c u t i v e V i c e - c h a i r m a n ’ s R e p o r t
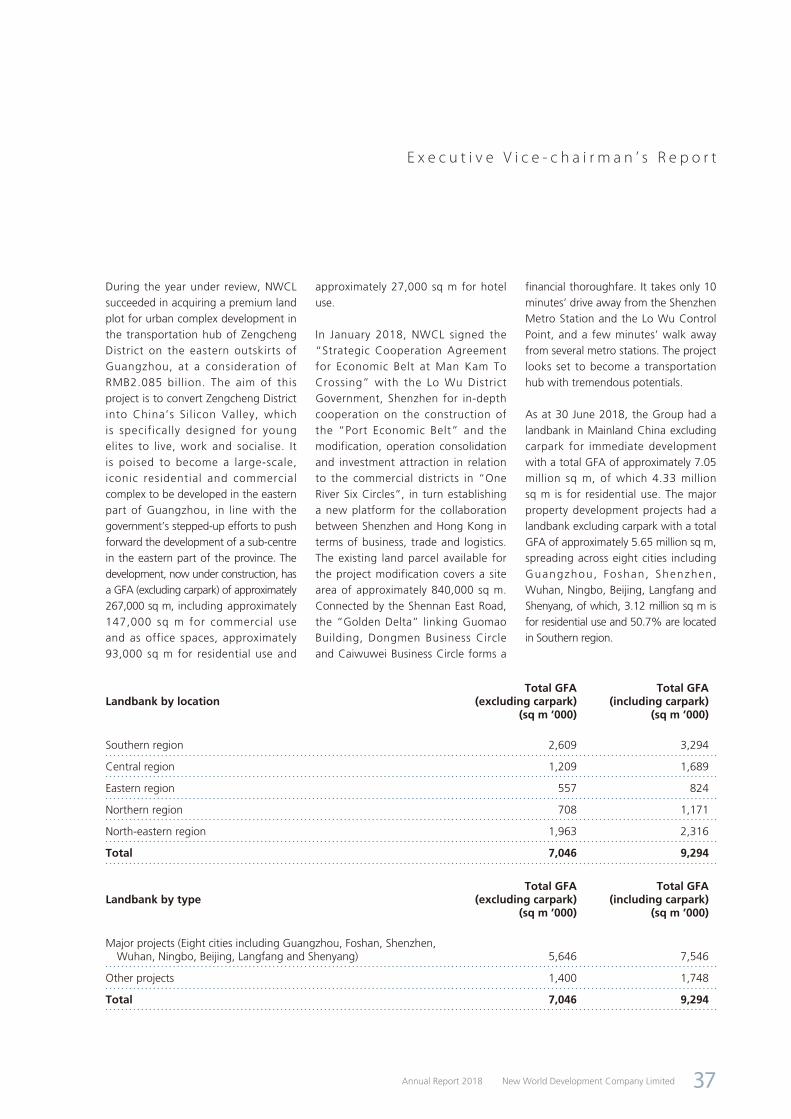
During the year under review, NWCL succeeded in acquiring a premium land plot for urban complex development in the transportation hub of Zengcheng District on the eastern outskirts of Guangzhou, at a consideration of RMB2.085 billion. The aim of this project is to convert Zengcheng District into China’s Sil icon Valley, which is specifically designed for young elites to live, work and socialise. It is poised to become a large-scale, iconic residential and commercial complex to be developed in the eastern part of Guangzhou, in line with the government’s stepped-up efforts to push forward the development of a sub-centre in the eastern part of the province. The development, now under construction, has a GFA (excluding carpark) of approximately 267,000 sq m, including approximately 147,000 sq m for commercial use and as office spaces, approximately 93,000 sq m for residential use and
approximately 27,000 sq m for hotel use.
In January 2018, NWCL signed the “Strategic Cooperation Agreement for Economic Belt at Man Kam To Crossing” with the Lo Wu District Government, Shenzhen for in-depth cooperation on the construction of the “Port Economic Belt” and the modification, operation consolidation and investment attraction in relation to the commercial districts in “One River Six Circles”, in turn establishing a new platform for the collaboration between Shenzhen and Hong Kong in terms of business, trade and logistics. The existing land parcel available for the project modification covers a site area of approximately 840,000 sq m. Connected by the Shennan East Road, the “Golden Delta” linking Guomao Building, Dongmen Business Circle and Caiwuwei Business Circle forms a
financial thoroughfare. It takes only 10 minutes’ drive away from the Shenzhen Metro Station and the Lo Wu Control Point, and a few minutes’ walk away from several metro stations. The project looks set to become a transportation hub with tremendous potentials.
As at 30 June 2018, the Group had a landbank in Mainland China excluding carpark for immediate development with a total GFA of approximately 7.05 million sq m, of which 4.33 million sq m is for residential use. The major property development projects had a landbank excluding carpark with a total GFA of approximately 5.65 million sq m, spreading across eight cities including Guangzhou, Foshan, Shenzhen, Wuhan, Ningbo, Beijing, Langfang and Shenyang, of which, 3.12 million sq m is for residential use and 50.7% are located in Southern region.
Landbank by locationTotal GFA
(excluding carpark)Total GFA
(including carpark)(sq m ’000) (sq m ’000)
Southern region 2,609 3,294
Central region 1,209 1,689
Eastern region 557 824
Northern region 708 1,171
North-eastern region 1,963 2,316
Total 7,046 9,294
Landbank by typeTotal GFA
(excluding carpark)Total GFA
(including carpark)(sq m ’000) (sq m ’000)
Major projects (Eight cities including Guangzhou, Foshan, Shenzhen, Wuhan, Ningbo, Beijing, Langfang and Shenyang) 5,646 7,546
Other projects 1,400 1,748
Total 7,046 9,294
New World Development Company LimitedAnnual Report 2018 37

E x e c u t i v e V i c e - c h a i r m a n ’ s R e p o r t
BUSINESS DEVELOPMENTS IN MAINLAND CHINA
SOUTHERN REGIONLocated at Guangzhou White Swan
Lake business c irc le, Guangzhou
New WorldCanton Bay occupies an
aggregate site area of approximately
370,000 sq m and an aggregate GFA
of approximately 1,200,000 sq m,
representing the largest residential
community currently available for sale
in downtown Guangzhou. The project
is at close proximity to a number
of prestigious schools and is easily
accessible via two metro lines, two
bridges (namely Pearl River Bridge and
Hedong Bridge), three tunnels (namely
Pearl River Tunnel, Zhoutouzui Tunnel
and the under-construction Ruyifang
Tunnel) and 24 bus routes. During the
year under review, approximately 60%
of the residential flats under the project
were launched for sale and were all
sold out. The latest launch of the
brand-new completed flats products
in White Swan Lake Bay Area offering
two-bedroom to five-bedroom layouts
ranging from 79 sq m to 143 sq m is
highly sought after by customers.
Located at the heart of Tianhe District,
Guangzhou New WorldTian Yi is
adjacent to “Tianhe Park Station”,
which is the largest metro station in
Asia, overlooking the panoramic view
of the 707,000 sq m Tianhe Park,
supported by well-established ancillary
facilities including leading academic
institutes and hospitals. During the
year under review, approximately 59%
of the residential units were launched
and sold out. The latest launch of four-
bedroom to five-bedroom units of
142 sq m to 295 sq m has received very
positive market responses.
Situated at the central business district
of Guangzhou Baiyun New Town,
Guangzhou Park ParadiseCozy Clouds
stands at the interchange of three
metro lines. It blends multiple elements
including metropolitan, ecological,
healthy and smart living. Since its
launch, the project has become a
benchmark property for quality living
in the neighbourhood and has drawn a
lot of attention from the market.
Located at the CBD axis of Guangzhou
and Foshan, Canton First Estate is
conveniently located at the Bay Area
transportation hub supported by the
Foshan West Railway Station and three
metro lines, boasting 4,500 mu of
authentic natural ecology. In 2018, a
total of more than 500 units of villas
and townhouses were launched, of
which nearly 90% had been sold and
258 units had been delivered during
the year under review.
Situated at the core of Guiwan area in
Qianhai free-trade zone in Shenzhen,
and capitalising upon Guangdong-
Hong Kong cooperation, the superb
location at the intersection of five
metro lines, and the unique policy-
f a vo red advan tage o f Q ianha i ,
Shenzhen’s Qianhai Chow Tai Fook
Financial Building is poised to become
one of the landmarks in Qianhai
upon completion, accommodating
the regional headquarters of some
Global 500 financial institutions and
setting itself as a world-class financial,
commercial and service complex.
New World Development Company Limited Annual Report 201838
E x e c u t i v e V i c e - c h a i r m a n ’ s R e p o r t
The project occupies a site area of
approximately 18,218 sq m and GFA of
approximately 180,000 sq m, including
GFA of 148,360 sq m as offices and
27,940 sq m for commercial use. With a
total expected investment of RMB8 billion,
the project will be built into a twin-
tower landmark of approximately
200 m and 130 m tall, supported
by creative spaces encompassing
commercial facilities, art exhibition
venues, vertical garden, performance
venues and so forth. Construction of
the project commenced in June 2018
and is scheduled to be completed by
2021.
Shenzhen P r ince Bay P ro j ec t i s
adjacent to the brand-new cruise
homeport in Shekou, Shenzhen.
With naturally-endowed sea-view
resources and geographical advantage,
the project is an integral part of the
efforts in building an international
city of happiness to be envisaged in
Shenzhen. Comprising with a total
of approximately 390,000 sq m for
development, the project is a joint
investment by the Group and China
Merchants Group to build a large-
scale complex with diversified functions
inc lud ing commerc ia l fac i l i t i e s ,
offices, apartments and so forth.
The commercial element will involve
the first and foremost introduction
to Shenzhen of K11, a high-end art-
commercial brand, as well as DPARK,
a family consumption brand. Upon
completion, the project will become the
most unique commercial complex in the
locality with a combination of marine
resources, urban landscape, humanity
art and sustainable development.
Construction commenced in 2017
for some of the office and apartment
functions of the project. For K11 and
DPARK, construction will commence
in fourth quarter of 2018.
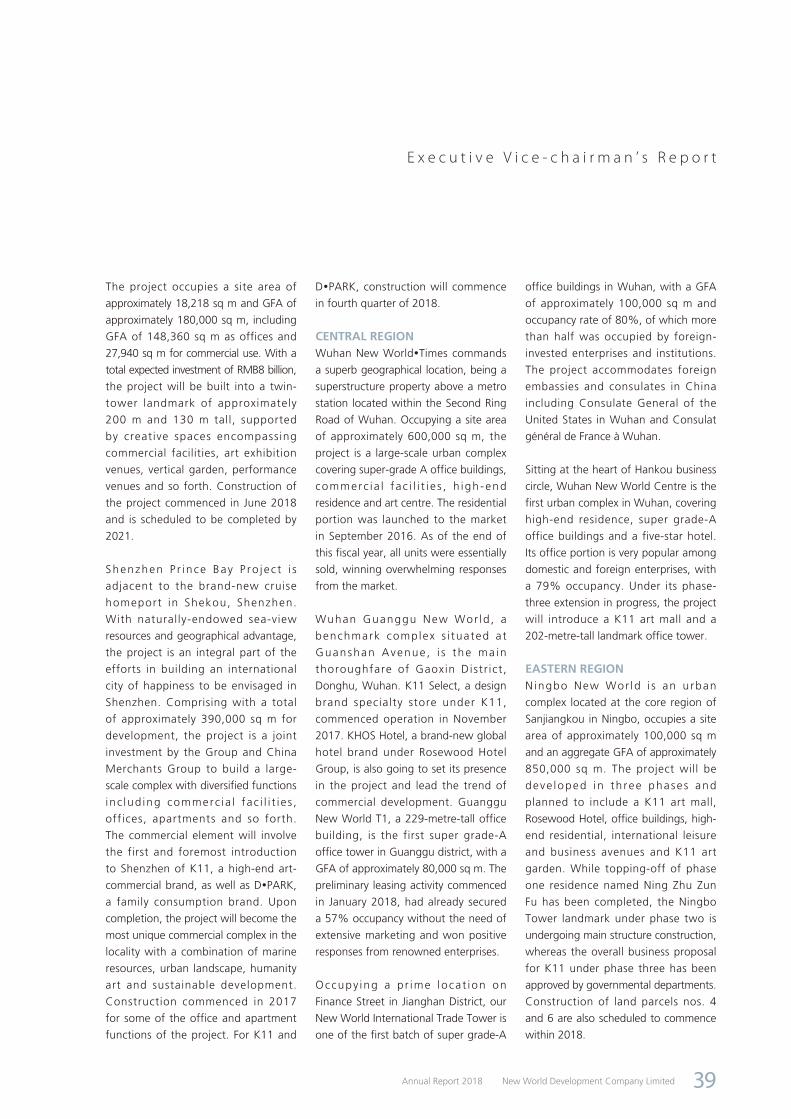
CENTRAL REGIONWuhan New WorldTimes commands
a superb geographical location, being a
superstructure property above a metro
station located within the Second Ring
Road of Wuhan. Occupying a site area
of approximately 600,000 sq m, the
project is a large-scale urban complex
covering super-grade A office buildings,
commerc ia l f ac i l i t i e s , h igh -end
residence and art centre. The residential
portion was launched to the market
in September 2016. As of the end of
this fiscal year, all units were essentially
sold, winning overwhelming responses
from the market.
Wuhan Guanggu New Wor ld , a
benchmark complex s i tuated at
Guanshan Avenue , i s the ma in
thoroughfare of Gaoxin Distr ict ,
Donghu, Wuhan. K11 Select, a design
brand specialty store under K11,
commenced operation in November
2017. KHOS Hotel, a brand-new global
hotel brand under Rosewood Hotel
Group, is also going to set its presence
in the project and lead the trend of
commercial development. Guanggu
New World T1, a 229-metre-tall office
building, is the first super grade-A
office tower in Guanggu district, with a
GFA of approximately 80,000 sq m. The
preliminary leasing activity commenced
in January 2018, had already secured
a 57% occupancy without the need of
extensive marketing and won positive
responses from renowned enterprises.
Occupy ing a p r ime loca t ion on
Finance Street in Jianghan District, our
New World International Trade Tower is
one of the first batch of super grade-A
office buildings in Wuhan, with a GFA
of approximately 100,000 sq m and
occupancy rate of 80%, of which more
than half was occupied by foreign-
invested enterprises and institutions.
The project accommodates foreign
embassies and consulates in China
including Consulate General of the
United States in Wuhan and Consulat
général de France à Wuhan.
Sitting at the heart of Hankou business
circle, Wuhan New World Centre is the
first urban complex in Wuhan, covering
high-end residence, super grade-A
office buildings and a five-star hotel.
Its office portion is very popular among
domestic and foreign enterprises, with
a 79% occupancy. Under its phase-
three extension in progress, the project
will introduce a K11 art mall and a
202-metre-tall landmark office tower.
EASTERN REGIONNingbo New Wor ld i s an urban
complex located at the core region of
Sanjiangkou in Ningbo, occupies a site
area of approximately 100,000 sq m
and an aggregate GFA of approximately
850,000 sq m. The project will be
deve loped in th ree phases and
planned to include a K11 art mall,
Rosewood Hotel, office buildings, high-
end residential, international leisure
and business avenues and K11 art
garden. While topping-off of phase
one residence named Ning Zhu Zun
Fu has been completed, the Ningbo
Tower landmark under phase two is
undergoing main structure construction,
whereas the overall business proposal
for K11 under phase three has been
approved by governmental departments.
Construction of land parcels nos. 4
and 6 are also scheduled to commence
within 2018.
New World Development Company LimitedAnnual Report 2018 39

E x e c u t i v e V i c e - c h a i r m a n ’ s R e p o r t
During the year under review, Ning Zhu
Zun Fu achieved sales revenue of more
than RMB2.8 billion, setting a number
of new records in Ningbo’s supreme
luxury residential market and winning
extensive recognitions from customers
and the industry. Commercial leasing
has also commenced on a full scale,
securing leases with flagship boutique
supermarket and international smart
fitness clubhouse. Premium residential
projects and grade-A office buildings
will be launched successively under
the project to accommodate market
demand.
Shanghai Hong Kong New World
Tower is situated in the prime business
area of Shanghai Huaihai Middle Road.
It comprises offices, K11 Art Mall and
K11 Club, Shanghai’s first clubhouse
for senior executives inside an office
building. During the year under review,
K11 Art Mall recorded an average
monthly footfall of 900,000, 96%
occupancy rate. The occupancy rate of
the office portion was 92%.
NORTHERN REGIONSitting in the Yuhe zone of central
villa area, Beijing New WorldLi Zun
occupies an aggregate site area of
175,000 sq m and an aggregate
GFA of 110,000 sq m. A seamless
connection with Jingcheng Expressway
Exit 8, the project is 15 minutes away
from regions such as Wangjing and
Beijing Capital International Airport and
30 minutes away from Guomao and
Yayuncun business circles. Based on the
design concept deriving from Château
de Versailles in France, the Eastern
Zone of the project offers 81 units of
French-style detached villas, of which
77% were sold. The Western Zone
provides 227 French-style detached
villas and townhouses characterised by
the unique structure of “one villa with
three gardens”, of which 80% were
sold.
Langfang New World Centre, located at
the central business district of Langfang,
is a large-scale landmark complex with
an area of 450,000 sq m, comprising
commercial facilities, offices, hotel,
apartments and high-end residential.
Project development has been divided
into three districts, apartments in
District A were launched for sale
in September 2017 and 60% were
sold during the year under review.
A p a r t m e n t s i n D i s t r i c t B w e r e
launched for sale for the first time in
November 2013, totaling 289 units,
of which 90% were sold. Leasing
of stores on commercial streets in
District B commenced in August 2014,
ach iev ing an occupancy ra te of
100%. Leasing of offices in District C
commenced in March 2017, securing
tenancies with renowned enterprises
in the banking, real estate, insurance,
telecommunications sectors and so
forth, with an occupancy rate of 87%.
Residential portion was launched for
the first time in April 2014, totaling
767 units, which had already been sold
out. 31 units of villas were also made
available, of which 60% were sold.
Langfang New World Garden, with
a GFA of 370,000 sq m and situated
at the heart of the government-
designated key development area, is
developed in three districts. Districts 1
and 3 have been completed and
delivered. The first phase of District 2
will be delivered on 31 October 2018.
During the year under review, the
project achieved a sales revenue of
RMB628 million.
NORTH-EASTERN REGIONLocated at the northern shore of the
Hun River and overlooking the scarcely-
available river view, Shenyang New
WorldThe Riverfront is a LOHAS
community encompassing green,
healthy, wellness and artistic elements,
and has been recognised as ”Shenyang
Green Building Demonstration Project”.
Unit sizes currently for sale with GFA
ranging from 100 sq m to 300 sq m.
1,408 units under D1 cluster were
launched for sale in October 2015,
of which a total of 96% were sold.
905 units under D2 cluster were
launched for sale in October 2016, of
which a total of approximately 86%
were sold.
Shenyang New WorldThe Bayside,
being the Group’s first townhouse
project in Shenyang, is located at the
northern shore of the Hun River, close
to the exit of metro line 2. The project’s
pioneering underground public space
named “The Dome of Light”, with
the utilisation of green technology,
was awarded “National Two-star
Green Building Design Label”. Being
the first builder to have been granted
this honour by the Construct ion
Department of Liaoning Province since
2015 when the New World China Land
Green Building Design Guidelines were
implemented, the Group has been
highly regarded by industry peers.
Centrally located in Heping District,
commanding scarcely-available natural
resources along the northern shore of
Hun River, and in close proximity to
Shenshui Bay Park and the prosperous
New World Development Company Limited Annual Report 201840
E x e c u t i v e V i c e - c h a i r m a n ’ s R e p o r t
bus ine s s c i r c l e , Shenyang New
WorldThe Masterpiece Crescent offers
84 residential units, of which nearly
88% were sold.
Shenyang New WorldThe Elite is an
apartment project commanding a
superb location in the heart of Taiyuan
Street, the key commercial circle of the
city, and has been highly sought after
by the market since its launch. The
project offers finely decorated units
with GFA ranging from 67 sq m to
178 sq m. 73% of a total of 460 units
have been sold.
Adhering to the philosophy of the
“W.E Happy Of f i ce” , Shenyang
New World Prosperous Commercial
Building provides value added services
that combine the elements of the
“New World brand”, “efficiency”,
“ecology” and “enjoyment”, creating a
unique business experience. The project
offers office spaces with a GFA ranging
from 185 sq m to 2,000 sq m. Out of
a total of 180 units of products, nearly
75% have been sold.
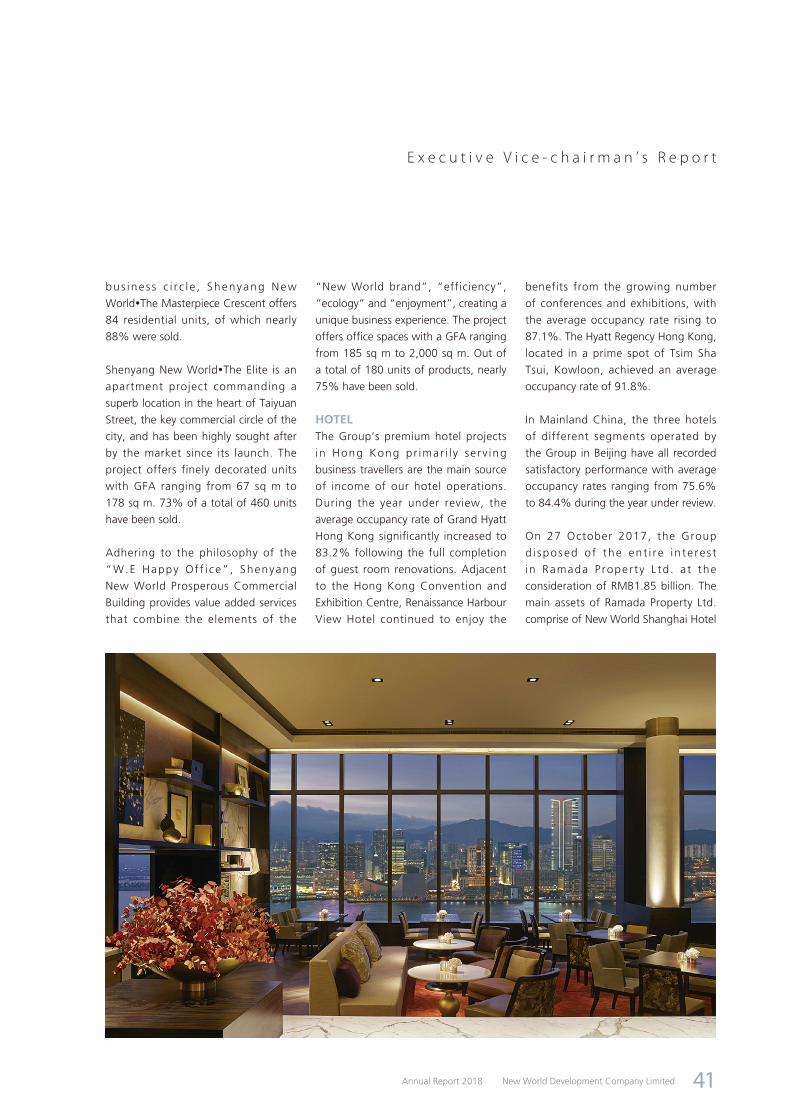
HOTELThe Group’s premium hotel projects
in Hong Kong pr imar i l y se rv ing
business travellers are the main source
of income of our hotel operations.
During the year under review, the
average occupancy rate of Grand Hyatt
Hong Kong significantly increased to
83.2% following the full completion
of guest room renovations. Adjacent
to the Hong Kong Convention and
Exhibition Centre, Renaissance Harbour
View Hotel continued to enjoy the
benefits from the growing number
of conferences and exhibitions, with
the average occupancy rate rising to
87.1%. The Hyatt Regency Hong Kong,
located in a prime spot of Tsim Sha
Tsui, Kowloon, achieved an average
occupancy rate of 91.8%.
In Mainland China, the three hotels
of different segments operated by
the Group in Beijing have all recorded
satisfactory performance with average
occupancy rates ranging from 75.6%
to 84.4% during the year under review.
On 27 October 2017, the Group
d i sposed o f the en t i r e i n te re s t
in Ramada P roper ty L td . a t the
consideration of RMB1.85 billion. The
main assets of Ramada Property Ltd.
comprise of New World Shanghai Hotel
New World Development Company LimitedAnnual Report 2018 41

E x e c u t i v e V i c e - c h a i r m a n ’ s R e p o r t
and pentahotel Shanghai. The disposal
enables the Group to realise cash
resources and unlock value of its low-
yielding assets at fair market value.
Rosewood Phuket, Thailand officially
commenced operat ion with soft
opening on 20 November 2017 with 41
villas. At an exquisite location along a
600-meter beachfront at Emerald Bay,
the project is a beach hideaway with
full opening of 71 villas in June 2018.
Rosewood Hong Kong, as part of the
multi-use tower of Victoria Dockside
located at Tsim Sha Tsui, Hong Kong,
is scheduled to open in the f irst
quarter of 2019. The hotel will have
413 guest rooms, eight dining options
and a f i tness centre , swimming
pool and the first urban setting for
Asaya, Rosewood’s innovative holistic
wellness concept. The Manor Club
executive lounge will provide an array
of exclusive privileges for its guests
and The Pavilion that embodies the
Rosewood’s s ignature, h igh-end
residential-style meeting and event
spaces. Rosewood Residences – 186
luxury accommodations for longer stays
– will offer a dedicated lounge, indoor
swimming pool and fitness center along
with special services and amenities for
residents.
As at 30 June 2018, the Group had a
total of 15 hotel properties in Hong
Kong, Mainland China and Southeast
Asia, providing over 6,000 guest
rooms.
INFRASTRUCTUREInfrastructure division experienced
robust growth in FY2018. Contribution
from road business rose by 32% in
FY2018. Discounting the exchange
factor, the contribution would have
increased by 10% in line with the
overall traffic volume growth of 10%
as NWSH’s road portfolio continued to
benefit from rising vehicle ownership
and urbanisation in Mainland China.
Most of the NWSH’s expressways in
the Pearl River Delta Region continued
to register an increase in both traffic
volume and toll revenue in FY2018. In
addition, both toll revenue and average
daily traffic flow of Hangzhou Ring
Road grew healthily by 5% in FY2018,
reflecting the increase in long-haul
truck traffic and passenger cars which
grew alongside the rise of online sales
and residential property development in
the surrounding areas.
Riding on the r is ing demand for
environmental services in Mainland
China, both NWSH’s environmental
platforms – SUEZ NWS Limited (“SNL”)
and Chongqing Derun Environment
Co., Ltd. (“Derun Environment”)
contributed to the overall growth of the
environment business.
T h e e n l a r g e d p o r t f o l i o o f S N L
established after the restructuring in
FY2017 continued to provide a broader
income base to NWSH, with provision
of services ranging from water and
wastewater projects, waste treatment to
design, engineering and procurement.
D e r u n E n v i r o n m e n t p e r f o r m e d
satisfactorily delivered organic growth
in both water and waste-to-energy
businesses, and commissioned a new
waste-to-energy plant in Chongqing in
January 2018 which also raised its daily
treatment capacity by 1,000 tonnes.
The receipt of a lump sum value added
tax subsidy for its sewage business also
contributed to the growth.
New World Development Company Limited Annual Report 201842

E x e c u t i v e V i c e - c h a i r m a n ’ s R e p o r t
The logistics business increased by
2% in FY2018. ATL Logistics Centre
continued to provide significant and
stable contribution to the logistics
business. Buoyed by the recovery of
the retail market in Hong Kong during
FY2018, its average rental rate grew
by 4% while average occupancy rate
remained high at 97.2%.
China Un i ted In te rnat iona l Ra i l
Containers Co., Limited reported a
throughput growth of 8% to 2,730,000
TEUs which was underpinned by the
development of rail container and sea-
rail intermodal transportation and the
growth of the newly opened Urumqi
terminal. The logistics capabilities and
services at Chongqing and Wuhan
terminals were further enhanced in
FY2018 after the construction of new
warehouse facilities.
Despite the partial divestment of
Beijing Capital International Airport
and its reclassification as an available-
for-sale financial asset during FY2018,
the aviation business still attained
double-digit growth from the steadfast
expans ion of Goshawk Av iat ion
Limited (“Goshawk”). During FY2018,
Goshawk’s fleet size grew from 84 to
105 aircraft and the average age of
the aircraft as at 30 June 2018 was
3.5 years, while the customer base
comprised of 43 airlines in 29 countries.
Goshawk has taken significant steps to
cement itself as a leading aircraft leasing
company. Firstly, Goshawk entered into
an agreement to acquire Sky Aviation
Leasing International Limited (“SALI”)
in June 2018. Upon completion of
this acquisition later this year, the
size and value of Goshawk’s owned,
managed and committed fleet would
reach 223 aircraft and US$11.4 billion
(equivalent to approximately HK$88.9
billion) respectively and thereby placing
Goshawk to be a top 10 aircraft lessor
in the world. Secondly, Goshawk
has secured future aircraft supply by
ordering a total of 40 narrow-body
aircraft directly from Airbus and Boeing.
To enhance management efficiency, the
portfolio of Bauhinia Aviation Capital
Limited (“Bauhinia”), the second
commercial aircraft leasing platform of
NWSH, will be transferred to Goshawk
in FY2019. The total aircraft asset value
under both of NWSH’s aircraft leasing
platforms reached US$4.7 billion as at
30 June 2018.
For the year ended 30 June 2018, the
share of results of joint ventures in
the infrastructure segment included
share of impairment losses for the
underlying assets for Guangzhou City
Nansha Port Expressway of HK$300.0
million, share of impairment losses for
the underlying assets for Guangzhou
Dongxin Expressway of HK$100.0
million and share of impairment losses
for the underlying assets for Guodian
Chengdu Jintang Power Generation
Co., Ltd of HK$200.0 million.
SERVICEThe contribution from service division
recorded a decrease in FY2018.
Enthused by the upbeat property
market sentiments, the construction
business sustained its healthy growth
momentum although the impact could
not mitigate the underperformance
of the facilities management segment
as Free Duty experienced its first ever
annual loss as new contract commenced
in mid-august 2017 subject to much
higher concession fee while Gleneagles
Hong Kong Hospital (“GHK Hospital”)
incurred initial operating losses during
its ramp-up stage.
During FY2018, Hong Kong Convention
and Exhibition Centre (“HKCEC”)
hosted 1,061 events and over 8.2
million visitors. Despite rising cost
New World Development Company LimitedAnnual Report 2018 43

E x e c u t i v e V i c e - c h a i r m a n ’ s R e p o r t
Enhance
the service
experience of the
consumers
pressures, HKCEC delivered stable
revenue and earnings growth having
secured 76 new exhib i t ions and
conferences under various themes.
The Free Duty business swung into a
loss in FY2018 as consumer spending
remained soft although the operating
results rebounded in the second half
of FY2018 under a new concession
contract.
GHK Hospital, in which NWSH has
40% interest, was officially opened
in late March 2018, around one year
after commencing initial services.
Notwithstanding the fact that the
hospital has so far performed in line
with management expectation and
enjoyed continuous patient volume
growth, GHK Hospital reported its first
annual loss as anticipated in FY2018
while it remained in ramp-up stage.
To capture the growing demand
for healthcare services in Mainland
China, The Group has 70% interest in
Healthcare Assets Management Limited
and the interest in UMP Healthcare
China Limited to tap into the primary
healthcare market in Mainland China.
The contribution from the construction
business increased notably by 16% to
reach a new record in FY2018 mainly
due to the continuous improvement
in gross profit and satisfactory job
progress. As at 30 June 2018, the gross
value of contracts on hand for NWS
Construction Limited and its subsidiaries
was approximately HK$47.1 billion and
the remaining works to be completed
amounted to approximately HK$21.2
billion.
DEPARTMENT STOREDuring the year under review, New
World Department Store China Limited
(“NWDS”) same-store sales growth
was 0.8%. The growth in the last
corresponding period was 0.7%. The
commission income from concessionaire
sales was the major income contributor
to NWDS, accounted for 44.0% of the
total revenue. Proceeds from direct
sales and rental income accounted
for 34.6% and 21.3% of the total
revenue respectively. The remaining
0.1% was derived from management
and consultancy fees. By region, the
Northern China region contributed
the most to the revenue of NWDS,
amounting to 48.0% of total revenue,
followed by the Eastern China region
and the Central Western China region,
which accounted for 32.5% and 19.5%
of the total revenue respectively.
As at 30 June 2018, NWDS operated
and managed a total of 35 stores and
two shopping malls in Mainland China
with total GFA of over 1,455,780 sq m.
New World Development Company Limited Annual Report 201844
E x e c u t i v e V i c e - c h a i r m a n ’ s R e p o r t
OUTLOOK
Reinforcement of social relations
on a global basis resulted in closer
l inkage among di f ferent p laces ,
stronger correlations between events
happening in one place and another,
the cooperation between nations
and increased communication and
interaction in the political, economic
and cu l tu ra l f i e l d s . Th i s i s t he
symbol of the rapid development of
globalisation since the end of the Cold
War in the 1980s. The variant pace of
development across nations has led to
conflicts in trade activities and regional
affairs, which have in turn triggered
the growth of protectionism and
populism. The friendly and cooperative
relationship that has made globalisation
has become complicated in the last five
to six years.
While the economy and comprehensive
national strength of China has grown
significantly, the friction between the
United States (U.S.) and other nations
in political, military and economic
terms has been more frequent. On
6 July 2018, China and the U.S. started
to levy punitive tariffs on each other,
sparkling imminent escalation of trade
war. As the midterm elections in the
U.S. to be held in November 2018 draw
near, the U.S. Government has achieved
favourable political bargaining chips
through dealing with Asian geopolitics
and U.S.-China trade war. With its
strong economy, the U.S. will maintain
or further enhance measures on China
trade, bringing uncertainties over the
world.
In 2017, China’s economy achieved
satisfactory performance, with the
GDP growth by 6.9% to more than
RMB80 trillion which surpassed market
expectation, primarily backed by the
picking up of import and export as
well as the outperformance of tertiary
industry. This represented the first
turnaround of the previous slowdown
of China’s economic growth since
2011, to the stage of stabilisation and
rebound. In the first half of 2018, the
macro economy of China remained
stable and grew by 6.8%, made the
nation one of the best performers in
the period among major economies
in the world. With narrowed trade
surplus under the U.S.-China trade war
and the uncertainties over the global
economy and geopolitics, the Central
Government will pay closer attention to
market conditions, maintain its policy
focus on deleveraging and financial
risk mitigation, and adjust relevant
measures in time to prevent major risks.
The targeted reduction of the required
reserve ratio adopted by the People’s
Bank of China and its fine-tuning of
the Renminbi-U.S. Dollar exchange rate
setting mechanism were in response
to the latest development, with leeway
allowed as market expected.
Interest rate movement remains the
major concern of the market under
the current economic dynamic in Hong
Kong. The interest rate of the U.S. has
gone up several times since its first
interest rate hike in nearly 10 years
was announced in December 2015.
Although the prime rate and deposit
and lending rates in Hong Kong have
not followed the U.S. interest rate
hike, the Chief Executive of Hong
Kong Monetary Authority, Norman
Chan Tak-lam, pointed out that the
normalisation of interest rate in Hong
Kong will eventually happen, and
market expectation on a sustained low-
rate environment will change.
For the economic development in
Mainland China, the overall keynote
of making progress amid stability
remains, with the primary policy focus
on steering economic momentum
towards boosting domestic demand
and reforming supply-side, as well
a s fo s te r i ng , de l e ve rag ing and
strengthening supervis ion of the
financial system, with the goal of
creating a sound environment which
favours the long-term economic
development of the nation. Regarding
the property market policies, it is
expected that the tightened austerity
measures will not deviate from the
main line of maintaining stability and
reducing risks, and will continue to
guide the healthy development of
the industry by establishing long-
term adjustment mechanisms for the
property market and accelerating the
implementation of property tax. With
the housing demand of a large floating
populat ion and of professionals,
coupled with the favourable national strategies and overall development requirements, particular first-tier cities and core clusters wil l remain the market focus.
New World Development Company LimitedAnnual Report 2018 45

E x e c u t i v e V i c e - c h a i r m a n ’ s R e p o r t
Despite sufficient liquidity in the Hong Kong market, the widened interest rate spread between the US and Hong Kong since US rate hikes has provided more incentives for interest rate arbitrage. Since the second quarter of 2018, the weak side convertibility undertaking has been triggered repeatedly, resulting in the Hong Kong Monetary Authority to buy Hong Kong dollars and to sell US dollars. The increasing financing cost in Hong Kong’s banking system lays foundation for the normalisation of interest rate. As it becomes clearer for HKD-interbank offer rate to trend up, it is anticipated that the prime rate will have a high chance to increase in the second half of 2018.
The inadequacy o f l and supp l y remains the key factor curtailing the development of Hong Kong property market. Whilst the general public is optimistic about the 18 options that have the potential to provide additional land supply as put forth by the Task Force on Land Supply, it is difficult to reverse the actual situation in the short term in view of the lead time required from the implementat ion of the project to the actual completion of the housing. As such, significant change in the keynote of the property market is not expected for the time being; there is still room for the transaction of primary residential units in a user-oriented market. The key issue will be the direction of property policies to be adopted by Hong Kong SAR Government and the trend of interest rate in the future.
The wealth effect accumulated over the years is another key factor for the boom of property market. Whilst debt servicing ratio has been on the rise in recent years, the foreseeable risks to
the property market in association with interest rate normalisation has been mitigated, due to the domination of end-users and fading out of highly-leveraged speculations, the augmented economic performance and stable job market of Hong Kong, as well as the requirement of passing stringent stress test before mortgages are granted by banks in Hong Kong.
A s w e l l - k n o w n c o n t e m p o r a r y sociologist Anthony Giddens points out, “Thinking in terms of risk certainly has its unsettling aspects, but it is also a means of seeking to stabilise outcomes, a mode of colonising the future. Nothing can be taken for granted. What i s acceptable/appropr iate/recommended behaviour today may be seen differently tomorrow in the l ight of altered circumstances or incoming knowledge-claims.” This utterance points exactly to the need for a corporate to look forward to the future and embrace a favourable turn with changes instead of taking things as they are.
The Group will pay ongoing attention to latest market development in Greater China and the rest of the world, carefully devise and timely adjust its development strategies, to make the best preparations for the opportunities ahead. Notwithstanding uncertainties at the present time, the Group will be unswerving in its adherence of the dedicated artisan spirit under The Artisanal Movement to enhance the brand value. To create a distinctive, sustainable and diversified New World Ecosystem with the belief of “CollectConnectCollide”, and presenting a series of culturally-rich properties to a population of more than 1.3 billion people in Greater
China, through which we achieve the impossible, one after another.
Embody i ng and su s t a i n i ng t he superiority of our brand’s DNA, the Group delivered satisfactory results during the year under review, which is a milestone for us to build on our achievements and begin a new chapter of development. Going forward, a number of premium residential projects that offer numerous living experience and design concepts will be subsequently launched in Hong Kong. Following the previous launch of FLEUR PAVILIA in North Point, a key project that perfectly inherits and interprets what is known as a novel downtown retreat, the Group is vigorously planning the launch of its large-scale living sphere including the Waterloo Road project in Ho Man Tin, the Sheung Heung Road project in To Kwa Wan, REACH SUMMIT in Yuen Long and the Tai Wai Station project in Sha Tin.
For the landbank in Hong Kong, the Group will carefully identify and select development opportunities suitable for the Group with reference to future land supply on the market, the trend of evolvement of consumption behaviour and the voice of home buyers. To secure land resources of premium quality that are in line with our brand positioning and conducive to sustainable development, the Group will continue to adopt a three-line parallel strategy, namely public land tenders, old building acquisitions and farmland conversion.
The Group also vigorously enhances and optimises the recurring income generated by its investment property portfolio. Victoria Dockside, a new
New World Development Company Limited Annual Report 201846

E x e c u t i v e V i c e - c h a i r m a n ’ s R e p o r t
global landmark of art and design in Hong Kong located at Tsim Sha Tsui waterfront facing the Victoria Harbour, will commence operation upon full completion in 2019. As part of the development, the futuristic K11 MUSEA entails an innovative experiential museum-retail concept and is set to turn over a new leaf for the retail industry of Hong Kong. In May 2018, the Group won a successful bid for a commercial development in SKYCITY at Hong Kong International Airport, which is strategically located adjacent to the terminals of Hong Kong International Airport and the Hong Kong-Zhuhai-Macao Bridge. Sitting amid ten other cities within the Bay Area, the development will become a new landmark of commerce, entertainment and shopping that draws residents in the Bay Area, local Hong Kong residents, visitors from domestic and overseas upon completion under the one-hour living sphere concept.
Striving for enhanced brand value in Mainland China, the Group, through i ts property f lagship New World China Land, is engaged in the primary businesses of property development and property investment in Mainland China with a unified and centralised m a n a g e m e n t , a n d i n c r e a s i n g investment in cities with numerous growth potent ia l s and s t rateg ic positions. Taking full account of the needs for both sector development and talent pooling, the Group persistently optimises structure and operational management, solidifies control and enhances efficiency.
The Group will closely monitor the market development and the change in the context of its operations, to expand its Mainland China business
in a vigorous and prudent manner. The Group is particularly optimistic about the development prospects o f the Guangdong-Hong Kong-Macao Bay Area. Capitalising the development opportunity presented by the Bay Area, the Group wi l l make good use of its advantages, resources and unique development. The Group has granted the rights of developing several premium projects in Guangzhou and Shenzhen, these projects are synergistic with SKYCITY commercial development, being part of the one-hour living sphere, and also with the novel landmark Victoria Dockside in Hong Kong. In the near future, the Group will actively seek new opportunities in this area, which is poised to enjoy equal fame with other renowned bay areas in the world including San Francisco, New York and Tokyo.
The Group’s financial position is stable. As at 30 June 2018, cash on hand, bank balance and the undrawn bank facilities amounted to HK$92.1 billion, which provides sufficient development resources for the Group. The Group has a strong working relationship with the major local and multinational banks and the financing channels are diversified. It is expected that equity raising is not necessary in the foreseeable future. In addition, the Group will actively consider different ways, such as share buyback, to enhance shareholder’s return on investment.
Tomorrow never knows! Tomorrow is full of fantasy and hope; full of opportunit ies and chal lenges. In the face of a series of unknown on a new day, it is necessary for the Group to endeavour and make the best preparations, embracing the
future with endless vision and careful planning. With a “New” in its name, the New World Group has all the way been bold for innovation. The DNA underlying the Group’s brand encompasses divers i ty, futur ist ic development, innovation and breaking through tradition. Being the first brand in the sector to use online registration in property sale in Hong Kong, the Group has enhanced existing business mindsets and operat ing mode l s through innovation of businesses, substantiation of intellectual property r i g h t s , s m a r t d e v e l o p m e n t o f information technology, brand creation for cultural and creative products and corporate talent grooming. Tapping on the synergy among various cross-sector interaction such as education, culture, medical care and health care, we create a more sustainable and diversified ecosystem of the New World Group, add value to our core businesses, and enhance the unique experience of the consumers.
The New World Group will continue to stay ahead of the market. With the passion and commitment enshrined under The Artisanal Movement, we will adhere to our people-centered philosophy and bespoke craftsmanship, with a view to optimising stakeholders’ interests and maximising their value.
Dr. Cheng Chi-Kong, AdrianExecutive Vice-chairman & General ManagerHong Kong, 20 September 2018
New World Development Company LimitedAnnual Report 2018 47

M a j o r P r o p e r t y P r o j e c t si n H o n g K o n g
New World Development Company Limited Annual Report 201848
1 23 Babington Path, Mid-levels
2 ARTISAN HOUSE, 1 Sai Yuen Lane, Western District
3 4A-4P Seymour Road, Mid-levels
4 FLEUR PAVILIA, 1 Kai Yuen Street, North Point
5 74 Waterloo Road, Ho Man Tin
6 Kowloon City Road / Sheung Heung Road, Ma Tau Kok
7 Yau Tong Redevelopment Project, Kowloon East
8 43-45 Tsun Yip Street, Kwun Tong
9 46 Tsun Yip Street, Kwun Tong
10 New Kowloon Inland Lot No. 6582, Cheung Shun Street, Cheung Sha Wan
11 New Kowloon Inland Lot No. 6572, Wing Hong Street, Cheung Sha Wan
12 Tai Wai Station Property Development, STTL No. 520, Sha Tin
13 DD221, Sha Ha, Sai Kung
14 THE PAVILIA BAY, West Rail Tsuen Wan West Station (TW6), TWTL No. 402, Tsuen Wan
15 PARK HILLCREST, Lot No.2131 in DD121, Tong Yan San Tsuen (Phase 1 - Site A), Yuen Long
16 THE PARKVILLE, No.76-92 Tuen Mun Heung Sze Wui Road,Tuen Mun
17 Park Reach, YLTL 527, Tai Tong Road, Yuen Long
18 YLTL 524, Tai Tong Road, Yuen Long
19 Lung Tin Tsuen (Phase 3), Yuen Long
20 Lung Tin Tsuen (Phase 2), Yuen Long
21 Tong Yan San Tsuen (Phase 3), Yuen Long
22 Tong Yan San Tsuen (Phase 4), Yuen Long
23 Sha Po North, Yuen Long
24 DD110, Kam Tin, Yuen Long
1 Manning House, Central
2 New World Tower, Central
3 Shun Tak Centre, Shopping Arcade, Sheung Wan
4 Hong Kong Convention and Exhibition Centre, Shopping Arcade, Wan Chai
Grand Hyatt Hong Kong
Renaissance Harbour View Hotel
5 Pearl City, Causeway Bay - Basement, Ground Floor to 4th Floor
6 EIGHT KWAI FONG, Happy Valley
7 Methodist House, Wan Chai
8 Telford Plaza, Kowloon Bay
9 K11, Tsim Sha Tsui
Hyatt Regency Hong Kong, Tsim Sha Tsui
10 pentahotel Hong Kong, Kowloon
11 KOHO, Kwun Tong
12 THE FOREST, Mong Kok
13 ATL Logistic Centre, Kwai Chung
14 D PARK, Tsuen Wan
15 PopCorn II, Tseung Kwan O
16 Hyatt Regency Hong Kong, Sha Tin
17 Citygate, Tung Chung
Novotel Citygate Hong Kong
18 PARK SIGNATURE, Yuen Long
19 K11 ATELIER of Victoria Dockside, Tsim Sha Tsui
Rosewood Hotel & Rosewood Residences of Victoria Dockside, Tsim Sha Tsui
20 Remaining portion of Victoria Dockside, Tsim Sha Tsui
21 704-730 King’s Road, North Point
22 9 Luk Hop Street, San Po Kong
23 21 Luk Hop Street, San Po Kong
24 New Kowloon Inland Lot No. 6505, King Lam Street, Cheung Sha Wan
25 TCTL 11, Tung Chung
26 SKYCITY Project
Major Property Development Projects in Hong Kong
Major Property Investment and Other Properties in Hong Kong

New World Development Company LimitedAnnual Report 2018 49
LANTAU ISLAND HONG KONG
KOWLOON
NEW TERRITORIES
Major Property Development Projects in Hong Kong
Major Property Investment and Other Properties in Hong Kong
27
6
13
15
99
8
5
1214
11
16
18
24
21
22
23
18
17
22 19
1520
10
1 3
43
19
23
12
19
5
26
511
1500 18
21
13
17
2310
12
125
24
11
14
15
16
1120
4
6
8
7
10022

Major Property Development Projects in Mainland China
16
1718
131315
1211
214
119
877
6
4
663
415 115
2
10
New World Development Company Limited Annual Report 201850

M a j o r P r o p e r t y D e v e l o p m e n t P r o j e c t s i n M a i n l a n d C h i n a
New World Development Company LimitedAnnual Report 2018 51
1 Guangzhou Covent Garden Remaining Phases
2 Guangzhou Park Paradise Phase 3B
Guangzhou Park Paradise Phase 5A
Guangzhou Park Paradise Phase 5B
Guangzhou Park Paradise Remaining Phases
3 Guangzhou Dong Yi Garden Phase 5
4 Guangzhou Zengcheng Comprehensive
Development Project
5 Canton First Estate CF-20 Phase 2
Canton First Estate CF-29
Canton First Estate CF-27A
Canton First Estate CF-27B
Canton First Estate CF-30
Canton First Estate CF-31
Canton First Estate Remaining Phases
6 Shenzhen Qianhai Project
7 Shenzhen Prince Bay Project DY04-01
Shenzhen Prince Bay Project DY04-04
8 Shenzhen Prince Bay Project DY02-02
Shenzhen Prince Bay Project DY02-04
9 Wuhan New World Centre Phase 3
10 Wuhan New WorldTimes Phase 1
Wuhan New WorldTimes Phase 2
Major Property Development Projects in Mainland China*
11 Ningbo New World Plaza Land No.7-10
Ningbo New World Plaza Land No.11
Ningbo New World Plaza Land No.5
Ningbo New World Plaza Land No.4
Ningbo New World Plaza Land No.6
Ningbo New World Plaza Land No.1-4
Ningbo New World Plaza Land No.12
12 Beijing New View Commercial Centre
Beijing New View Commercial Centre Remaining Phases
13 Beijing Xin Yu Commercial Centre
Beijing Xin Yu Commercial Centre Remaining Phases
14 Langfang New World Centre District A
15 Langfang New World Garden District 2
16 Shenyang New World Garden Phase 2D2
Shenyang New World Garden Phase 2E
Shenyang New World Garden Phase 2C1
Shenyang New World Garden Phase 2C2
Shenyang New World Garden Phase XB
Shenyang New World Garden Phase XC
17 Shenyang New World Commercial Centre Phase 2
18 Shenyang New World Centre
Remark:* Certain property development projects will be classified as investment properties upon completion.
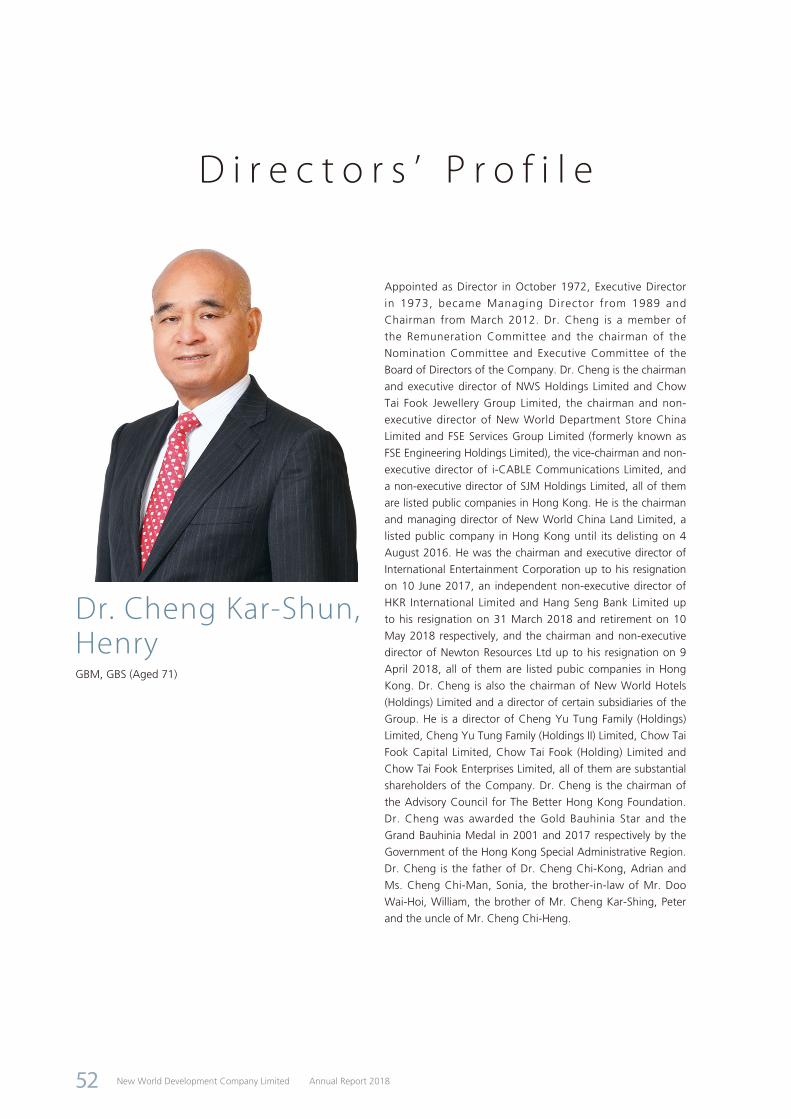
D i r e c t o r s ’ P r o f i l e
New World Development Company Limited Annual Report 201852
Dr. Cheng Kar-Shun, HenryGBM, GBS (Aged 71)
Appointed as Director in October 1972, Executive Director
in 1973, became Managing Director from 1989 and
Chairman from March 2012. Dr. Cheng is a member of
the Remuneration Committee and the chairman of the
Nomination Committee and Executive Committee of the
Board of Directors of the Company. Dr. Cheng is the chairman
and executive director of NWS Holdings Limited and Chow
Tai Fook Jewellery Group Limited, the chairman and non-
executive director of New World Department Store China
Limited and FSE Services Group Limited (formerly known as
FSE Engineering Holdings Limited), the vice-chairman and non-
executive director of i-CABLE Communications Limited, and
a non-executive director of SJM Holdings Limited, all of them
are listed public companies in Hong Kong. He is the chairman
and managing director of New World China Land Limited, a
listed public company in Hong Kong until its delisting on 4
August 2016. He was the chairman and executive director of
International Entertainment Corporation up to his resignation
on 10 June 2017, an independent non-executive director of
HKR International Limited and Hang Seng Bank Limited up
to his resignation on 31 March 2018 and retirement on 10
May 2018 respectively, and the chairman and non-executive
director of Newton Resources Ltd up to his resignation on 9
April 2018, all of them are listed pubic companies in Hong
Kong. Dr. Cheng is also the chairman of New World Hotels
(Holdings) Limited and a director of certain subsidiaries of the
Group. He is a director of Cheng Yu Tung Family (Holdings)
Limited, Cheng Yu Tung Family (Holdings II) Limited, Chow Tai
Fook Capital Limited, Chow Tai Fook (Holding) Limited and
Chow Tai Fook Enterprises Limited, all of them are substantial
shareholders of the Company. Dr. Cheng is the chairman of
the Advisory Council for The Better Hong Kong Foundation.
Dr. Cheng was awarded the Gold Bauhinia Star and the
Grand Bauhinia Medal in 2001 and 2017 respectively by the
Government of the Hong Kong Special Administrative Region.
Dr. Cheng is the father of Dr. Cheng Chi-Kong, Adrian and
Ms. Cheng Chi-Man, Sonia, the brother-in-law of Mr. Doo
Wai-Hoi, William, the brother of Mr. Cheng Kar-Shing, Peter
and the uncle of Mr. Cheng Chi-Heng.

New World Development Company LimitedAnnual Report 2018 53
D i r e c t o r s ’ P r o f i l e
Mr. Doo Wai-Hoi, WilliamJP (Aged 74)
Dr. Cheng Chi-Kong, AdrianJP (Aged 38)
Appointed as the Vice-chairman and Non-executive Director in July 2013. Mr. Doo is also a non-executive director of Lifestyle International Holdings Limited upon re-designation from executive director on 11 June 2015 and an independent non-executive director of Shanghai Industrial Urban Development Group Limited, both being listed public companies in Hong Kong. Mr. Doo was an independent non-executive director of The Bank of East Asia, Limited, a listed public company in Hong Kong, up to his resignation on 18 February 2017. Mr. Doo is also a director of certain subsidiaries of the Group. He is the chairman and director of Fungseng Prosperity Holdings Limited. Mr. Doo is a Justice of the Peace appointed by the Government of the Hong Kong Special Administrative Region. He is also the Honorary Consul General of the Kingdom of Morocco in Hong Kong and Macau, and a Governor of the Canadian Chamber of Commerce in Hong Kong. He was awarded the Chevalier de la Légion d’Honneur by the Republic of France in 2008. Mr. Doo is the brother-in-law of Dr. Cheng Kar-Shun, Henry and Mr. Cheng Kar-Shing, Peter, and the uncle of Dr. Cheng Chi-Kong, Adrian, Ms. Cheng Chi-Man, Sonia and Mr. Cheng Chi-Heng.
Appointed as an Executive Director in March 2007, became Executive Director and Joint General Manager from March 2012, re-designated as Executive Vice-chairman and Joint General Manager from April 2015 and re-designated as Executive Vice-chairman and General Manager from March 2017. Dr. Cheng is a member of the Executive Committee of the Board of Directors of the Company. Dr. Cheng is an executive director of New World Department Store China Limited and Chow Tai Fook Jewellery Group Limited, and a non-executive director of Giordano International Limited, i-CABLE Communications Limited and New Century Healthcare Holding Co. Limited, all being listed public companies in Hong Kong. He was an executive director of International Entertainment Corporation and a non-executive vice chairman of Modern Media Holdings Limited, both being listed public companies in Hong Kong, up to his resignation on 10 June 2017 and 26 August 2017 respectively. He is an executive director of New World China Land Limited, a listed public company in Hong Kong until its delisting on 4 August 2016. He is a director of Chow Tai Fook (Holding) Limited and Chow Tai Fook Enterprises Limited, both are substantial shareholders of the Company. He is also the chairman of New World Group Charity Foundation Limited and a director of certain subsidiaries of the Group. Dr. Cheng worked in a major international bank prior to joining the Group in September 2006 and has substantial experience in corporate finance. Dr. Cheng holds a Bachelor of Arts Degree (cum laude) from Harvard University, and was conferred the Honorary Doctorate of Humanities by the Savannah College of Art and Design. He is the vice-chairman of All-China Youth Federation, a member of the Tianjin Municipal Committee of The Chinese People’s Political Consultative Conference, the chairman of China Young Leaders Foundation, the honorary chairman of K11 Art Foundation and a member of Board of the West Kowloon Cultural District Authority. He is the son of Dr. Cheng Kar-Shun, Henry, the brother of Ms. Cheng Chi-Man, Sonia, the nephew of Mr. Doo Wai-Hoi, William and Mr. Cheng Kar-Shing, Peter, and the cousin of Mr. Cheng Chi-Heng.

New World Development Company Limited Annual Report 201854
D i r e c t o r s ’ P r o f i l e
Mr. Yeung Ping-Leung, Howard(Aged 61)
Mr. ChaMou-Sing, PaysonJP (Aged 76)
Appointed as a Director in November 1985. Mr. Yeung is a member of the Audit
Committee and the Remuneration Committee of the Board of Directors of the
Company. He is also an independent non-executive director of Miramar Hotel and
Investment Company, Limited, a listed public company in Hong Kong. He was the
chairman of King Fook Holdings Limited, a listed pubic company in Hong Kong, up
to his resignation on 1 July 2016.
Appointed as a Director in April 1989. Mr. Cha is a member of the Audit
Committee and the Remuneration Committee of the Board of Directors of the
Company. Mr. Cha is also the chairman of HKR International Limited and the non-
executive chairman of Hanison Construction Holdings Limited, both of them are
listed public companies in Hong Kong. Mr. Cha was appointed as an independent
non-executive director of Munsun Capital Group Limited (formerly known as China
Precious Metal Resources Holdings Co., Ltd.), a listed public company in Hong
Kong, on 3 October 2016 and subsequently resigned as its independent non-
executive director on 23 December 2016. He is also an independent non-executive
director of Eagle Asset Management (CP) Limited – Manager of Champion Real
Estate Investment Trust which is listed on The Stock Exchange of Hong Kong
Limited, the chairman of Mingly Corporation and an independent non-executive
director of Hong Kong International Theme Parks Limited.

New World Development Company LimitedAnnual Report 2018 55
D i r e c t o r s ’ P r o f i l e
Mr. Cheng Kar-Shing, Peter(Aged 66)
Mr. ChaMou-Zing, Victor(Alternate Director toMr. Cha Mou-Sing, Payson)(Aged 68)
Appointed as a Director in October 1994. Mr. Cheng is also an independent non-
executive director of King Fook Holdings Limited, a listed public company in Hong
Kong. He is an executive director of New World China Land Limited, a listed public
company in Hong Kong until its delisting on 4 August 2016. Also, he is a director
of Cheng Yu Tung Family (Holdings) Limited, Cheng Yu Tung Family (Holdings
II) Limited, Chow Tai Fook Capital Limited, Chow Tai Fook (Holding) Limited and
Chow Tai Fook Enterprises Limited, all of them are substantial shareholders of the
Company. Mr. Cheng is a director of New World Hotels (Holdings) Limited, NWS
Service Management Limited and certain subsidiaries of the Group. Mr. Cheng is
committed to community services and is serving as the chairman of Chow Tai Fook
Charity Foundation, the chairman of Chow Tai Fook Medical Foundation Limited,
the chairman of The Welfare Fund Limited, the vice-chairman of Hong Kong
Economic Exchange and a director of Green Council. He is the University Assembly
member of University of Macau. He is a Fellow of The Hong Kong Institution of
Engineers, Hong Kong Institute of Arbitrators, Hong Kong Construction Arbitration
Centre and The Chartered Institute of Arbitrators. He is a CEDR Accredited
Mediator and on the lists of the Mediators of Hong Kong Mediation Accreditation
Association Limited, Hong Kong International Arbitration Centre, Hong Kong
Mediation Centre and Financial Dispute Resolution Centre. He is on the Panel
of Arbitrators of South China International Economic and Trade Arbitration
Commission/Shenzhen Court of International Arbitration and an Arbitrator of
Huizhou Arbitration Commission as well as a Member of Society of Construction
Law Hong Kong. Mr. Cheng is the brother of Dr. Cheng Kar-Shun, Henry, the
brother-in-law of Mr. Doo Wai-Hoi, William, the father of Mr. Cheng Chi-Heng,
and the uncle of Dr. Cheng Chi-Kong, Adrian and Ms. Cheng Chi-Man, Sonia.
Appointed as an Alternate Director in September 2000. Mr. Cha is the deputy
chairman and managing director of HKR International Limited, and an independent
non-executive director of SOHO China Limited, both are listed public companies in
Hong Kong. He has extensive experience in the textile manufacturing and real estate
businesses.

New World Development Company Limited Annual Report 201856
D i r e c t o r s ’ P r o f i l e
Mr. Ho Hau-Hay, Hamilton(Aged 67)
Mr. LeeLuen-Wai, JohnBBS, JP (Aged 69)
Appointed as a Non-executive Director in August 2004 and was re-designated as
Independent Non-executive Director in November 2007. Mr. Ho was an Alternate
Director of the Company from 7 January 2004 to 29 August 2004. Mr. Ho is the
chairman of the Remuneration Committee and a member of the Audit Committee
of the Board of Directors of the Company. He is also an independent non-executive
director of King Fook Holdings Limited (a listed public company in Hong Kong),
and an executive director of Honorway Investments Limited and Tak Hung (Holding)
Company Limited.
Appointed as an Independent Non-executive Director in August 2004. Mr. Lee
is the chairman of the Audit Committee, and a member of the Remuneration
Committee and the Nomination Committee of the Board of Directors of the
Company. Mr. Lee is the managing director and chief executive officer of Lippo
Limited, an executive director and the chief executive officer of Lippo China
Resources Limited and Hongkong Chinese Limited, as well as an independent
non-executive director of UMP Healthcare Holdings Limited, all being listed public
companies in Hong Kong. Mr. Lee is also a non-executive non-independent
chairman of Healthway Medical Corporation Limited, a company listed on the
sponsor-supervised listing platform of the Singapore Exchange Securities Trading
Limited. Mr. Lee was an independent non-executive director of New World China
Land Limited (a listed public company in Hong Kong until its delisting on 4 August
2016) up until his resignation on 1 September 2016. Mr. Lee is a Fellow of The
Institute of Chartered Accountants in England and Wales, the Association of
Chartered Certified Accountants and the Hong Kong Institute of Certified Public
Accountants. He was a partner of Price Waterhouse (now PricewaterhouseCoopers)
in Hong Kong and has extensive experience in corporate finance and capital
markets. Mr. Lee is an Honorary Fellow of the City University of Hong Kong and
a Justice of Peace in Hong Kong. He serves as a member on a number of Public
Boards and Committees including the Chairman of the Investment Committee of
the Hospital Authority Provident Fund Scheme, a member of the Public Service
Commission and the Chairman of the Hospital Governing Committee of Hong
Kong Children’s Hospital.
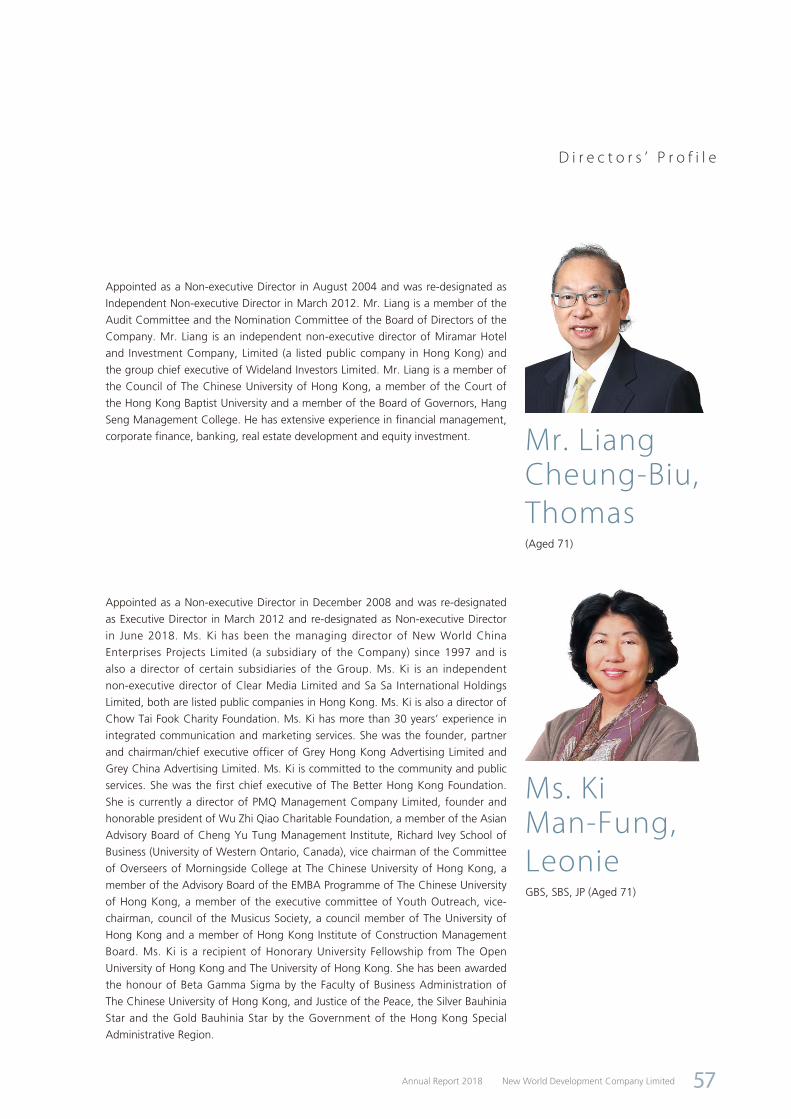
New World Development Company LimitedAnnual Report 2018 57
D i r e c t o r s ’ P r o f i l e
Mr. Liang Cheung-Biu, Thomas(Aged 71)
Ms. Ki Man-Fung, LeonieGBS, SBS, JP (Aged 71)
Appointed as a Non-executive Director in August 2004 and was re-designated as
Independent Non-executive Director in March 2012. Mr. Liang is a member of the
Audit Committee and the Nomination Committee of the Board of Directors of the
Company. Mr. Liang is an independent non-executive director of Miramar Hotel
and Investment Company, Limited (a listed public company in Hong Kong) and
the group chief executive of Wideland Investors Limited. Mr. Liang is a member of
the Council of The Chinese University of Hong Kong, a member of the Court of
the Hong Kong Baptist University and a member of the Board of Governors, Hang
Seng Management College. He has extensive experience in financial management,
corporate finance, banking, real estate development and equity investment.
Appointed as a Non-executive Director in December 2008 and was re-designated
as Executive Director in March 2012 and re-designated as Non-executive Director
in June 2018. Ms. Ki has been the managing director of New World China
Enterprises Projects Limited (a subsidiary of the Company) since 1997 and is
also a director of certain subsidiaries of the Group. Ms. Ki is an independent
non-executive director of Clear Media Limited and Sa Sa International Holdings
Limited, both are listed public companies in Hong Kong. Ms. Ki is also a director of
Chow Tai Fook Charity Foundation. Ms. Ki has more than 30 years’ experience in
integrated communication and marketing services. She was the founder, partner
and chairman/chief executive officer of Grey Hong Kong Advertising Limited and
Grey China Advertising Limited. Ms. Ki is committed to the community and public
services. She was the first chief executive of The Better Hong Kong Foundation.
She is currently a director of PMQ Management Company Limited, founder and
honorable president of Wu Zhi Qiao Charitable Foundation, a member of the Asian
Advisory Board of Cheng Yu Tung Management Institute, Richard Ivey School of
Business (University of Western Ontario, Canada), vice chairman of the Committee
of Overseers of Morningside College at The Chinese University of Hong Kong, a
member of the Advisory Board of the EMBA Programme of The Chinese University
of Hong Kong, a member of the executive committee of Youth Outreach, vice-
chairman, council of the Musicus Society, a council member of The University of
Hong Kong and a member of Hong Kong Institute of Construction Management
Board. Ms. Ki is a recipient of Honorary University Fellowship from The Open
University of Hong Kong and The University of Hong Kong. She has been awarded
the honour of Beta Gamma Sigma by the Faculty of Business Administration of
The Chinese University of Hong Kong, and Justice of the Peace, the Silver Bauhinia
Star and the Gold Bauhinia Star by the Government of the Hong Kong Special
Administrative Region.

New World Development Company Limited Annual Report 201858
D i r e c t o r s ’ P r o f i l e
Ms. Cheng Chi-Man, Sonia(Aged 37)
Mr. Cheng Chi-Heng(Aged 40)
Appointed as an Executive Director in March 2012. Ms. Cheng is a member of
the Executive Committee of the Board of Directors of the Company. She currently
oversees the hotel division and the project management division of the Group. She
is an executive director of New World China Land Limited, a listed public company
in Hong Kong until its delisting on 4 August 2016, and a director of certain
subsidiaries of the Group. Before joining the Group in 2008, Ms. Cheng worked
in a major international investment bank and a global US private equity firm
specialising in real estate investments. Ms. Cheng holds a Bachelor of Arts Degree
with a concentration in Applied Mathematics from Harvard University in the U.S.A..
Ms. Cheng is the chief executive officer of Rosewood Hotel Group, chairman of
the advisory committee of the School of Hotel and Tourism Management at The
Chinese University of Hong Kong and member of the advisory committee of the
School of Hotel & Tourism Management Industry at The Hong Kong Polytechnic
University. She is a member of the Y. Elites Association, the Young Presidents’
Organization and the Hong Kong United Youth Association, and a non-official
member of the Family Council and the Advisory Committee on Gifted Education.
Ms. Cheng is the daughter of Dr. Cheng Kar-Shun, Henry, the sister of Dr. Cheng
Chi-Kong, Adrian, the niece of Mr. Doo Wai-Hoi, William and Mr. Cheng Kar-
Shing, Peter, and the cousin of Mr. Cheng Chi-Heng.
Appointed as an Executive Director in June 2010. Mr. Cheng is a member of the
Executive Committee of the Board of Directors of the Company. He also acts as
director of certain subsidiaries of the Group. Mr. Cheng is an executive director of
Chow Tai Fook Jewellery Group Limited, a listed public company in Hong Kong.
Mr. Cheng is a director of Chow Tai Fook (Holding) Limited and Chow Tai Fook
Enterprises Limited, both are substantial shareholders of the Company. Mr. Cheng
worked in Yu Ming Investment Management Limited from 1999 to 2000 as a
corporate finance executive. He obtained his Bachelor of Arts Degree majoring in
Economics from the University of Western Ontario, Canada in 1999. He is the son
of Mr. Cheng Kar-Shing, Peter, the nephew of Dr. Cheng Kar-Shun, Henry and
Mr. Doo Wai-Hoi, William, and the cousin of Dr. Cheng Chi-Kong, Adrian and
Ms. Cheng Chi-Man, Sonia.
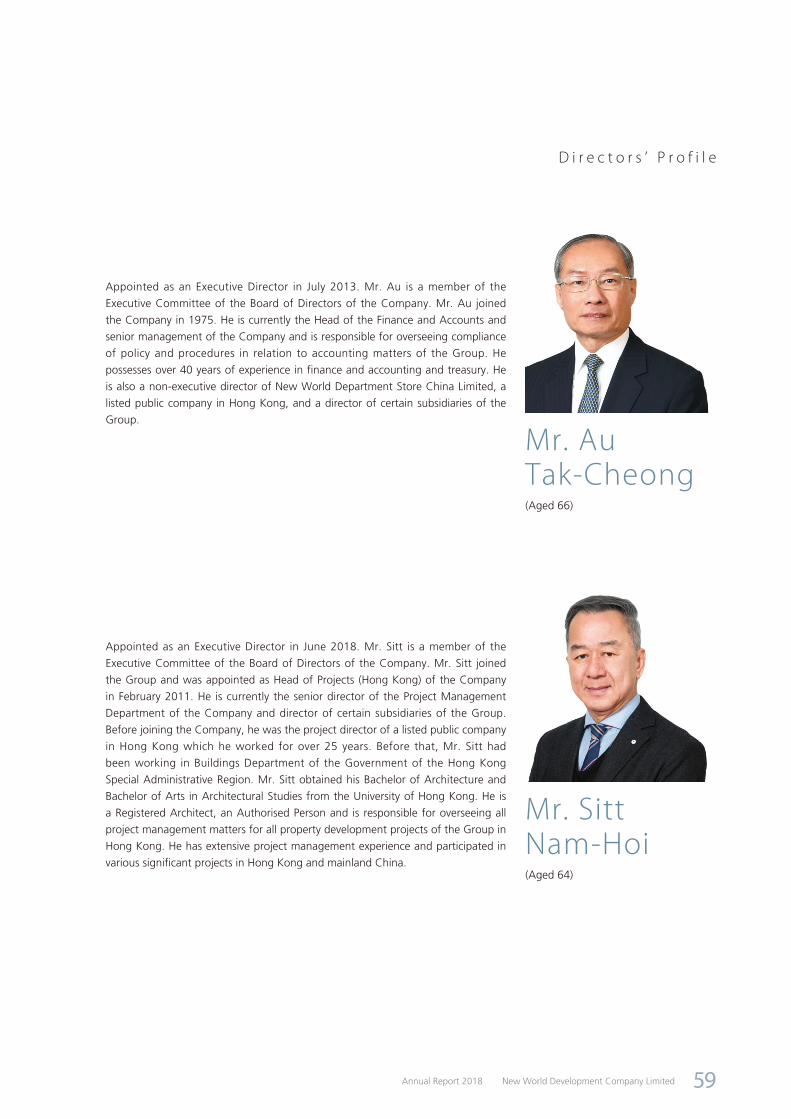
New World Development Company LimitedAnnual Report 2018 59
D i r e c t o r s ’ P r o f i l e
Mr. Au Tak-Cheong(Aged 66)
Mr. Sitt Nam-Hoi(Aged 64)
Appointed as an Executive Director in July 2013. Mr. Au is a member of the
Executive Committee of the Board of Directors of the Company. Mr. Au joined
the Company in 1975. He is currently the Head of the Finance and Accounts and
senior management of the Company and is responsible for overseeing compliance
of policy and procedures in relation to accounting matters of the Group. He
possesses over 40 years of experience in finance and accounting and treasury. He
is also a non-executive director of New World Department Store China Limited, a
listed public company in Hong Kong, and a director of certain subsidiaries of the
Group.
Appointed as an Executive Director in June 2018. Mr. Sitt is a member of the
Executive Committee of the Board of Directors of the Company. Mr. Sitt joined
the Group and was appointed as Head of Projects (Hong Kong) of the Company
in February 2011. He is currently the senior director of the Project Management
Department of the Company and director of certain subsidiaries of the Group.
Before joining the Company, he was the project director of a listed public company
in Hong Kong which he worked for over 25 years. Before that, Mr. Sitt had
been working in Buildings Department of the Government of the Hong Kong
Special Administrative Region. Mr. Sitt obtained his Bachelor of Architecture and
Bachelor of Arts in Architectural Studies from the University of Hong Kong. He is
a Registered Architect, an Authorised Person and is responsible for overseeing all
project management matters for all property development projects of the Group in
Hong Kong. He has extensive project management experience and participated in
various significant projects in Hong Kong and mainland China.

New World Development Company Limited Annual Report 201860
D i r e c t o r s ’ P r o f i l e
Mr. Ip Yuk-Keung(Aged 66)
Mr. So Chung-Keung, Alfred(Aged 69)
Appointed as an Independent Non-executive Director in June 2018. Mr. Ip is a member of the Audit Committee and the Nomination Committee of the Board of Directors of the Company. Mr. Ip is an independent non-executive director of Hopewell Holdings Limited, TOM Group Limited, Power Assets Holdings Limited and Lifestyle International Holdings Limited, all being listed public companies in Hong Kong. He is also the executive director and chief executive officer of LHIL Manager Limited which is the trustee-manager of Langham Hospitality Investments (a listed fixed single investment trust) and Langham Hospitality Investments Limited, and a non-executive director of Eagle Asset Management (CP) Limited, as manager of Champion Real Estate Investment Trust (a listed real estate investment trust). In addition, he was an independent non-executive director of New World China Land Limited (a listed public company in Hong Kong until its delisting on 4 August 2016), AEON Credit Service (Asia) Company Limited (a listed public company in Hong Kong) and Hopewell Highway Infrastructure Limited (a listed public company in Hong Kong) up to his resignation in August 2016, September 2016 and May 2018 respectively. Mr. Ip is an international banking and real estate executive with 33 years of experience at Citigroup, First National Bank of Chicago, Wells Fargo and Merrill Lynch in Hong Kong, Asia and the United States. His areas of expertise are in real estate, corporate banking, risk management, transaction banking and wealth management. Mr. Ip is an Honorary Professor of Business of Lingnan University, a Professor of Practice (International Banking and Real Estate) at The Hong Kong Polytechnic University, an Adjunct Professor of City University of Hong Kong, The Hong Kong University of Science and Technology and Hang Seng Management College, an Adjunct Distinguished Professor in Practice of University of Macau, a Council Member of The Hong Kong University of Science and Technology, a trustee of the Board of Trustees at Washington University in St. Louis, and a Vice Chairman of the Board of Governors of World Green Organization Limited. He is a member of the Committee on Certification for Principalship under the Education Bureau of the Government of the Hong Kong Special Administrative Region. Mr. Ip holds a Bachelor of Science degree at Washington University in St. Louis (summa cum laude) and Master of Science degrees at Cornell University and Carnegie-Mellon University. He is an Honorary Fellow of Vocational Training Council.
Appointed as an Executive Director in June 2018. Mr. So is a member of the Executive Committee of the Board of Directors of the Company. Mr. So joined the Group as the chief executive officer of New World China Land Limited in January 2016. He is currently a director and chief executive officer of New World China Land Limited (a listed public company in Hong Kong until its delisting on 4 August 2016) and director of certain subsidiaries of the Group. Prior to joining the Group, Mr. So worked with a listed group in Hong Kong for over 30 years. Mr. So previously served as executive director and non-executive director of a Hong Kong-listed public company and was appointed as adviser to a Hong Kong-listed mainland China property developer. He is currently a member of the Hong Kong Institute of Real Estate Administrators and a member of The Community Chest Corporate & Employee Contribution Programme Organising Committee. Mr. So received a Master of Science degree in Mathematics from the University of Toronto. He has extensive experience in the business world as a veteran property development professional, having played pivotal roles in launching a host of significant projects in both Hong Kong and mainland China.
S e n i o r M a n a g e m e n t P r o f i l e
New World Development Company LimitedAnnual Report 2018 61
Mr. Wong Man-HoiBSc(Eng)(Hon), LLB(Hon) (Aged 59)
Appointed as the Company Secretary of the Company in January 2011. Mr. Wong
joined the Company in November 2000 and has headed the Legal Department (now
Legal and Company Secretarial Department) since November 2001. Mr. Wong
is a member of the Law Society of Hong Kong and has been a qualified solicitor
in Hong Kong since 1994. Before joining the Company, Mr. Wong worked as a
solicitor specialising in real estate practice. Mr. Wong obtained his Bachelor of
Science (Engineering) Degree from the University of Hong Kong in 1981, Bachelor
of Laws Degree from the University of London in 1990 and passed the Solicitors’
Final Examination of the Law Society of England and Wales in 1992.
Ms. Lo Pui-Ying(Aged 68)
Ms. Lo is currently the Owners’ Representative-Hotel Division of the Company.
Ms. Lo has been in the hotel industry since 1969 and held various positions in
the Hyatt Regency and Excelsior hotels before joining the Group in 1978. Ms. Lo
acted as the financial controller of the New World Hotel in Kowloon for three years
before joining New World Harbour View Hotel (later renamed Renaissance Harbour
View Hotel) in 1988 as Director of Finance. She also held a group controller
position for New World Hotels International Limited (a former hotel management
company of the Company) until 1997 when the position ceased to exist. Ms. Lo
joined Foreign Holiday Philippines, Inc. and Marina Square Properties, Inc. in 2003
and 2005, respectively, as group financial controller, treasurer and co-leader of
the pre-opening and operation team for a hotel and casino property investment
in the Philippines. She rejoined the Company in 2007. Ms. Lo has previously
been certified as a Certified Hotel Administrator (CHA) in the American Hotel
and Motel Association (AHMA) from November 1990 to October 2000. She has
also previously acted as a Fellow and Founder Member of the Hotel Controllers &
Accountants Association (Hong Kong) founded in 1991. She has served respectively
a member of Management Committee and Executive Committee of The Federation
of Hong Kong Hotel Owners in 2012 and 2014 till now.

I n v e s t o r R e l a t i o n s
The Group endeavours to maintain a high standard of corporate disclosures in compliance with the legal and regulatory requirements and believes that de l i ve ry o f c lea r messages regarding the Company’s strategy, business development and prospect will enhance and create value for stakeholders.
COMMUNICATION WITH INVESTORS VIA MULTIPLE CHANNELS
The Board places strong emphasis on the importance of investors to our long-term business development and value creation, by setting up Investor Relations Department for effective communicat ion with the capi ta l market. Investor Relations team takes the professional initiatives to maintain
close and regular communications with different stakeholders including institutional investors, analysts and c red i t ra t ing agenc ies , keep ing the market abreast of the latest development of the Group in a timely manner and accurate assessment of the growth potential and value of the Group upon better understanding of our brand philosophy. Currently, the Group is actively covered by various domestic and international investment banks and securities dealers, which produce research reports on the Group on a regular basis.
The Group organises press conferences and analysts’ briefings in Hong Kong on the dates of annual and interim results announcements. In order to promote dual communications with the stakeholders, management will
chair the meetings and explains the Group’s latest operat ions, takes feedbacks and so l ve ques t ions . Comprehensive presentation materials including financial data and business deve lopment o f the Group a re illustrated and available not only to participants at the meetings, but also published on the Group’s investor relat ions website. Moreover, the meeting are webcast online with choice of languages for investors in other countries and regions.
The Group is often invited to attend large-scale investor conferences at home and abroad to outreach and promote the differentiation of our brand and business with different stakeholders. Non-deal roadshows and project experience tours are organised by the Group on a regular
New World Development Company Limited Annual Report 201862

I n v e s t o r R e l a t i o n s
basis to ensure that investors have a thorough understanding towards our strategies, product offerings and latest development. In FY2018, the Investor Relations team met over hundreds of institutional investors and analysts in Hong Kong, Mainland China and overseas, organised and participated in more than 20 investor events.
HIGH-STANDARD INFORMATION DISCLOSURE
The Group recognises the importance o f t ime l y , f a i r and t ranspa ren t disclosure of information, and takes the active stance to disclose information that may a f fec t the inves tment decision, so as to ensure fair and timely access to important information regarding the Group by the public. The Board has approved and adopted the Shareholders’ Communication Policy, which will be reviewed in due course to ensure its appropriateness and effectiveness.
Through voluntary announcements and compliance with requirements of the Listing Rules regarding issuance of
announcements, disclosure is made on the website of The Stock Exchange of Hong Kong and the page “Investor’s Column” on the Company’s website as soon as possible or within the prescribed time limit under relevant regulations. In addition, information such as financial reports, financial calendar, results presentation and corporate news are available on the Group’s website.
Apart from the shareholders’ services prov ided by the share reg i s t ra r and transfer office, investors are encouraged to raise questions and communicate with the Group via phone, email and online enquiry form available on the Group’s website.
DISTINGUISHED MARKET RECOGNITIONS
The outstanding performance of the Group in investor relations has gained recognition from the market. During the year under review, the Group won more than 50 domestic and international awards regarding investor relations, corporate governance and annual report, in recognition of the
commitments of the management to excellent investor relations and corporate governance.
The awards garnered by the Group inc lude “Quam IR Awards 2017 — The Most Remarkable Investor Relat ions” recognit ion for three consecutive years from Quamnet, a leading financial platform in Hong Kong; four awards including “Best Investor Relations Company” and “Best Investor Relations Professional” of “Asian Excellence Award 2018” organised by Asia renowned corporate governance publication Corporate Governance Asia for consecutive years; two awards including “Best Investor Meeting” of “4th Investor Relations Awards” organised by The Hong Kong Investor Relations Association; “Listed Enterprises Award”, “Best Corporate Governance Award” and “Best Development Strategy Award” presented by Bloomberg Businessweek Chinese; “Best Investor Relations Team Hong Kong 2017” by the international financial magazine Capital Finance International; and 26 annual report awards in the “30th International ARC Awards” from MerComm, Inc.
New World Development Company LimitedAnnual Report 2018 63

C o r p o r a t e S u s t a i n a b i l i t y
MESSAGE FROM MANAGEMENT
TOWARDS YOUR NEW WORLD IN 2030Our Group is building upon strong business foundations to expand into new ventures and geographies, and continuing to promote The Artisanal Movement on our journey to becoming a cultural enterprise. Our ongoing success relies on our understanding of the opportunities and challenges ahead of us in order to craft relevant solutions that stand the test of time and market trends. Global businesses are now facing volatility, uncertainty, complexity and ambiguity due to international politics, the rise of the millennial generation, urbanisation, climate change, digitalisation and other game changers. Our Group recognises the importance of embracing these megatrends and deploying shared economy and big data solutions as part of our way forward. For our conglomerate businesses, these insights have translated into internal workflow enhancements, new product launches and impactful customer engagement. Through these initiatives, we aim to create synergies within our business portfolio, evolve in the age of hyperconnectivity and manifest the cultural vision of The Artisanal Movement by curating opportunities for a life well-lived.
Our commitment, presented here in our “New World Sustainability Vision 2030” (“SV2030”), is to integrate green aspirations, healthy living, smart potential and caring services into our operations, from planning to customer experience. In this way, we will create shared value through quality, meaningful and lasting products, services and cultural content.
As our businesses are gaining a greater presence in Mainland China and placing a larger emphasis on millennial customers, we listen closely to these market voices and have identified key challenges such as urbanisation, climate change, income inequality and ageing population. Underneath these complex issues, we see an aspiration for a holistic lifestyle among our customers and an opportunity to further explore mixed-use developments. Property development is no longer just about building structures but also establishing platforms that support people to live, work, play and dream.
Building upon the K11 brand’s “art x commerce” hybrid model, we launched K11 Atelier at Victoria Dockside in Hong Kong – an innovative workplace that is certified to green building standards and provides wellness and cultural programmes to its tenants. In both Hong Kong and Mainland China, we are planning more mixed-use developments to improve resource efficiency and connectivity between cities and people.
While our businesses have continued to deliver remarkable returns in FY2018, our success will also be measured in terms of environmental and community impact created. Our Group will continue to attract entrepreneurial talents, who embrace a global vision and strive for excellence as their purpose, and develop our existing employees to capture the opportunities in the era of disruptive technologies. It is through these talents that we can execute our vision and better serve our internal and external stakeholders.
In FY2018, our millennial employees inspired the Group to explore solutions to one of the housing issues in Hong Kong. As a response, we launched the “NewGen First Home Program” to offer financial subsidies and preferential payment arrangements to some first-time property owners among Hong Kong permanent residents aged 25-35. To promote green financing in Hong Kong and the Mainland and transparent impact reporting, our Group has also launched the first-in-market “New World Development Green Finance Framework” that covers both future green bonds and loans. Under this Framework, we have raised Hong Kong’s first green loan for an upcoming certified green and healthy building. From strength to strength, our Group will innovate with our society and customers in mind and deliver positive impact to all stakeholders. We welcome you to share any feedback and requests with us as we progress in The Artisanal Movement and the SV2030.
Dr. Cheng Chi-Kong, AdrianExecutive Vice-chairman & General ManagerChairperson of the New World Group Sustainability Steering Committee
New World Development Company Limited Annual Report 201864

C o r p o r a t e S u s t a i n a b i l i t y
REPORTING APPROACH
This section provides an overview of the Group’s Environmental, Social and
Governance (ESG) performance during the reporting period of 1 July 2017 to 30
June 2018.
The reporting boundary extends to all areas of NWD’s business over which the
Group has major financial control, as well as those of ESG significance to the
Group and its stakeholders. In addition to our core property business, the reporting
scope covers our infrastructure and services, department stores, hotels and other
businesses.
REPORTING STANDARDSThis section is prepared in accordance with the requirements stipulated in the
latest ESG Reporting Guide set out in the Appendix 27 of the Rules Governing the
Listing of Securities on the Stock Exchange of Hong Kong Limited (“HKEx”). We
have also made reference to the United Nations Sustainable Development Goals
(“UN SDGs”), in establishing our long-term sustainability vision, under which we
will report ongoing performance and impact. The Group will issue a standalone
Sustainability Report (“SR”) in December 2018 on the Company and HKEx’s
websites.
NWD has been a member of the Hang Seng Corporate Sustainability Index Series
since 2015. We respond to investor enquiries and provide information to various
ESG surveys such as the Carbon Disclosure Project (“CDP”) and the Global Real
Estate Sustainability Benchmark (“GRESB”). In doing so, we identify those issues
that are most relevant and important to the industries in which we operate.
The information contained in this section has been independently assured by the Hong Kong Productivity Council to ensure accuracy and credibility. The independent assurance statement can be found on https://sr.nwd.com.hk/.
NWD has been a member of the Hang Seng Corporate Sustainability Index Series since 2015.
New World Development Company LimitedAnnual Report 2018 65

C o r p o r a t e S u s t a i n a b i l i t y
THE FACTORS INFLUENCING OUR FOCUS AREAS
The capability of an organisation to leap forward and realise its vision hinges on its ability to connect the voice of its
stakeholders, management approach and business priorities, to megatrends defining our current and future world. We
regularly review these connections to assess how they influence our operations and desired impact.
The four major factors driving our agenda and actions are shown below. The subsequent parts of this section delve into these
factors in more detail.
MegatrendsIdentifying the forces that define our current and future world
Stakeholder EngagementHearing the voice of customers and wider stakeholders
New World Sustainability Vision 2030Mapping the voice of the future
Management ApproachTranslating our vision into policies, processes and actions
New World Development Company Limited Annual Report 201866
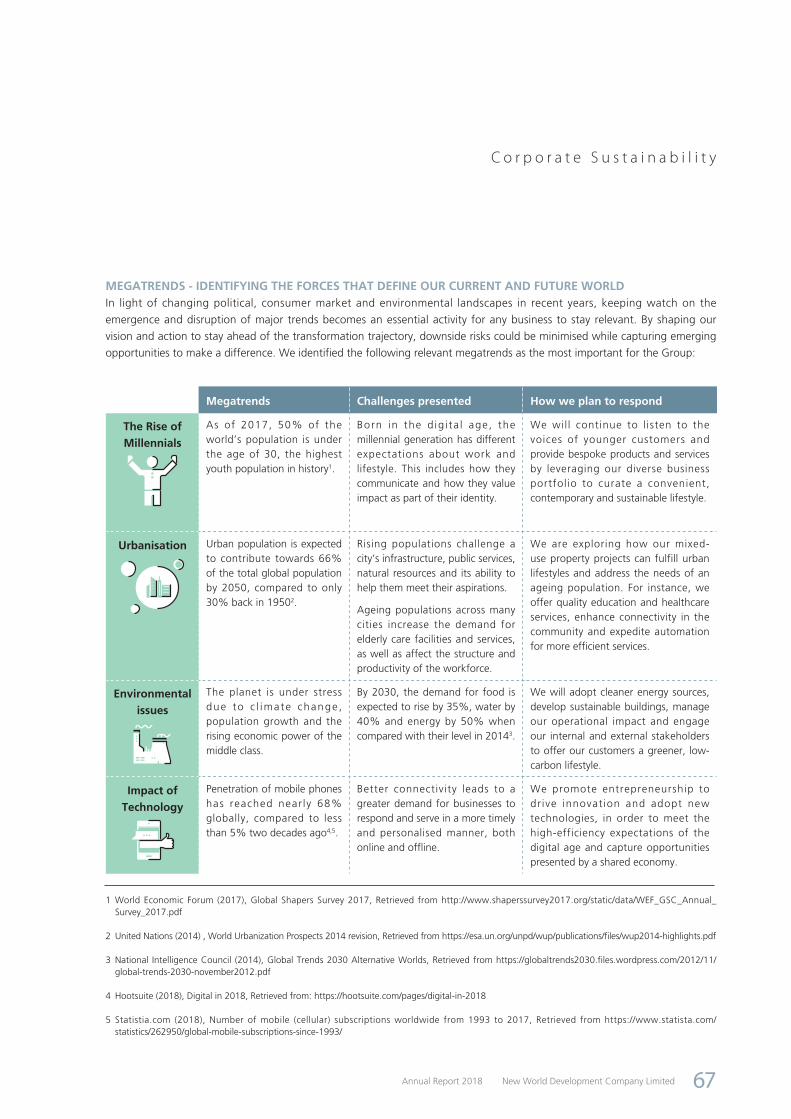
C o r p o r a t e S u s t a i n a b i l i t y
MEGATRENDS - IDENTIFYING THE FORCES THAT DEFINE OUR CURRENT AND FUTURE WORLDIn light of changing political, consumer market and environmental landscapes in recent years, keeping watch on the
emergence and disruption of major trends becomes an essential activity for any business to stay relevant. By shaping our
vision and action to stay ahead of the transformation trajectory, downside risks could be minimised while capturing emerging
opportunities to make a difference. We identified the following relevant megatrends as the most important for the Group:
1 World Economic Forum (2017), Global Shapers Survey 2017, Retrieved from http://www.shaperssurvey2017.org/static/data/WEF_GSC_Annual_Survey_2017.pdf
2 United Nations (2014) , World Urbanization Prospects 2014 revision, Retrieved from https://esa.un.org/unpd/wup/publications/files/wup2014-highlights.pdf
3 National Intelligence Council (2014), Global Trends 2030 Alternative Worlds, Retrieved from https://globaltrends2030.files.wordpress.com/2012/11/global-trends-2030-november2012.pdf
4 Hootsuite (2018), Digital in 2018, Retrieved from: https://hootsuite.com/pages/digital-in-2018
5 Statistia.com (2018), Number of mobile (cellular) subscriptions worldwide from 1993 to 2017, Retrieved from https://www.statista.com/statistics/262950/global-mobile-subscriptions-since-1993/
Megatrends Challenges presented How we plan to respond
The Rise of Millennials
As of 2017, 50% of the world’s population is under the age of 30, the highest youth population in history1.
Born in the d ig i ta l age, the millennial generation has different expectations about work and lifestyle. This includes how they communicate and how they value impact as part of their identity.
We wil l continue to l isten to the voices of younger customers and provide bespoke products and services by leveraging our diverse business portfolio to curate a convenient, contemporary and sustainable lifestyle.
Urbanisation Urban population is expected to contribute towards 66% of the total global population by 2050, compared to only 30% back in 19502.
Rising populations challenge a city’s infrastructure, public services, natural resources and its ability to help them meet their aspirations.
Ageing populations across many cities increase the demand for elderly care facilities and services, as well as affect the structure and productivity of the workforce.
We are exploring how our mixed-use property projects can fulfill urban lifestyles and address the needs of an ageing population. For instance, we offer quality education and healthcare services, enhance connectivity in the community and expedite automation for more efficient services.
Environmental issues
The planet is under stress due to c l imate change , population growth and the rising economic power of the middle class.
By 2030, the demand for food is expected to rise by 35%, water by 40% and energy by 50% when compared with their level in 20143.
We will adopt cleaner energy sources, develop sustainable buildings, manage our operational impact and engage our internal and external stakeholders to offer our customers a greener, low-carbon lifestyle.
Impact of Technology
Penetration of mobile phones has reached near ly 68% globally, compared to less than 5% two decades ago4,5.
Better connectivity leads to a greater demand for businesses to respond and serve in a more timely and personalised manner, both online and offline.
We promote entrepreneurship to dr ive innovat ion and adopt new technologies, in order to meet the high-efficiency expectations of the digital age and capture opportunities presented by a shared economy.
New World Development Company LimitedAnnual Report 2018 67

C o r p o r a t e S u s t a i n a b i l i t y
STAKEHOLDER ENGAGEMENT - HEARING THE VOICE OF CUSTOMERS AND WIDER STAKEHOLDERSWe regularly engage our stakeholders to identify key sustainability topics of importance to them as well as to identify business
opportunities and address risks, in order to further NWD’s sustainable development efforts. Here are our regular engagement
channels:
• Management interviews• Focus group discussions• Whistleblowing channels• Intranet• A. Connect, a staff bulletin mobile app• Talent development programmes• Spotlight+, a monthly sustainability e-newsletter• Internal digital risk flagging system
• Customer satisfaction surveys and ongoing communication through New World CLUB• Online platforms such as Artisanal Living and K11 mobile apps• Social media and company website• Customer service hotline• Meetings and visits
• Audits and performance review• Surveys and meetings• Tendering and procurement processes• Training and briefings
• Public/community events• Company website• Community initiatives such as New World
Springboard Programme and New World Harbour Race
• Annual general meetings and results announcements
• Annual and interim reports• Company website• Roadshows and investor meetings• Investor visits• Responses to investor surveys and
benchmarking exercises such as CDP, GRESB MSCI ESG Rating, etc.
• Technical site visits• Meetings, conferences,
seminars and workshops
• Online surveys• Media briefings and press releases
• Online surveys• Attend conferences
and seminars
Supply chain partners
Shareholdersand investors
Academicand professional
institutions
Employees
Local communitiesNGO partners
Media
Customers and tenants
New World Development Company Limited Annual Report 201868

C o r p o r a t e S u s t a i n a b i l i t y
To solicit feedback from internal and external stakeholders for identifying our focus areas, we conducted:
26in-depth interviews
An online survey, from which
218 responseswere received
The top five issues identified by our stakeholders are being
addressed through our ESG governance and business
activities. Read on to learn about our corporate governance,
under “Management Approach”, and please also refer to the
following sections:
• “Our Products and Services”: regarding anti-corruption
and information privacy
• “Your Health”: regarding occupational health and safety
• “Your Community”: regarding talent attraction and
retention
In addition to our routine engagement with stakeholders, an independent consultant was commissioned in FY2018 to provide an impartial assessment of our sustainability performance, gaining insights into stakeholders’ priorities and identifying opportunities and risks that lie ahead of us.
This exercise consisted of analysing 218 responses from a quantitative online survey and 26 in-depth interviews, combined with desktop research and peer benchmarking. The outcome not only provides us with a clearer picture of our current standing, but also guides us to realise our vision in the future.
Some of the stakeholder groups engaged included the senior management of major business units, key internal departments, employees of different levels, customers, tenants, supply chain partners, social and green non-governmental organisations (“NGOs”) and media. A summary of stakeholders’ views is presented further below:
Top five issuesTop five improvement areas
Internal stakeholders’ views External stakeholders’ views
Bribery and corruption Talent attraction and retention Energy efficiency and greenhouse gas emission
Corporate governance Employee engagement and communication
Social integration and regeneration
Occupational health and safety
Employee development Contribution to the local economic development
Information privacy Waste disposal and recycling Ageing population
Talent attraction and retention
Employee wellness Climate change
Our Group believes solid ESG performance forms a strong basis for the long-term success of a corporation. We will continue to monitor megatrends and the feedback from our stakeholders in designing our roadmap. In the past year, we have started to strengthen our corporate governance structure and practices to include ESG considerations and also developed a long-term sustainability vision to align the efforts of our business units.
New World Development Company LimitedAnnual Report 2018 69
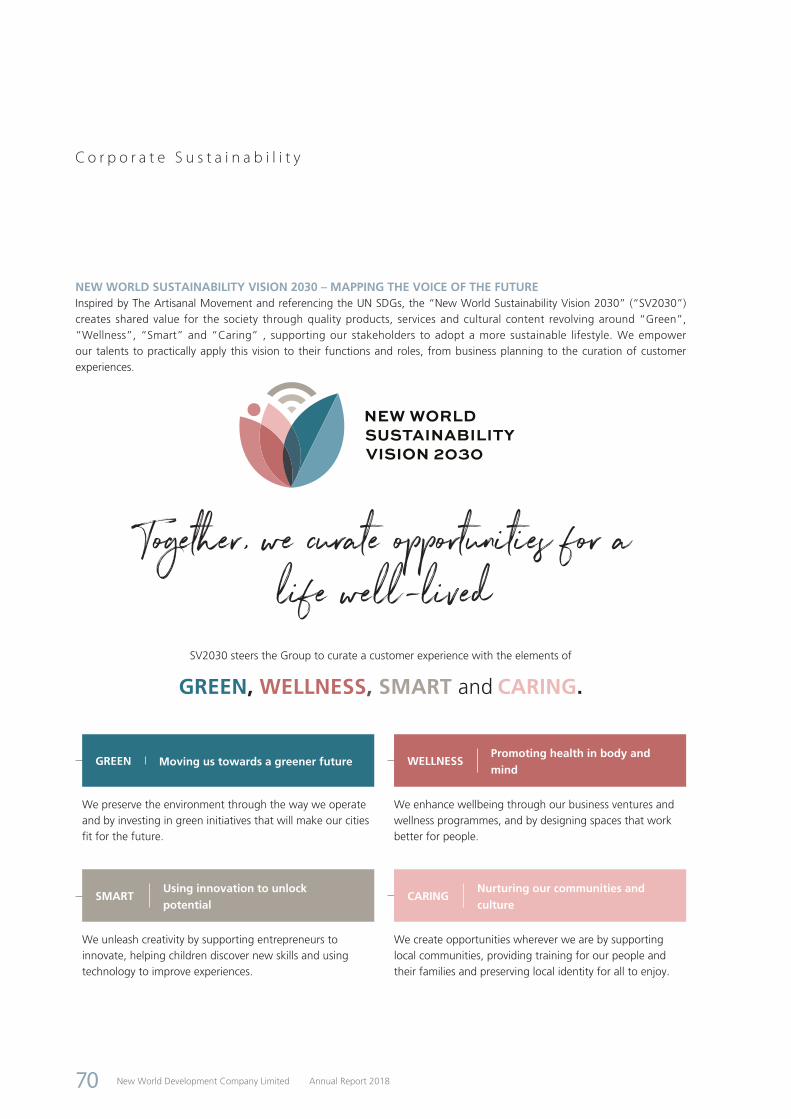
C o r p o r a t e S u s t a i n a b i l i t y
NEW WORLD SUSTAINABILITY VISION 2030 – MAPPING THE VOICE OF THE FUTUREInspired by The Artisanal Movement and referencing the UN SDGs, the “New World Sustainability Vision 2030” (“SV2030”) creates shared value for the society through quality products, services and cultural content revolving around “Green”, “Wellness”, “Smart” and “Caring” , supporting our stakeholders to adopt a more sustainable lifestyle. We empower our talents to practically apply this vision to their functions and roles, from business planning to the curation of customer experiences.
SV2030 steers the Group to curate a customer experience with the elements of
GREEN, WELLNESS, SMART and CARING.
GREEN Moving us towards a greener future
We preserve the environment through the way we operate and by investing in green initiatives that will make our cities fit for the future.
SMARTUsing innovation to unlockpotential
We unleash creativity by supporting entrepreneurs to innovate, helping children discover new skills and using technology to improve experiences.
WELLNESSPromoting health in body and mind
We enhance wellbeing through our business ventures and wellness programmes, and by designing spaces that work better for people.
CARINGNurturing our communities and culture
We create opportunities wherever we are by supporting local communities, providing training for our people and their families and preserving local identity for all to enjoy.
Together, we curate opportunities for alife well-lived
New World Development Company Limited Annual Report 201870
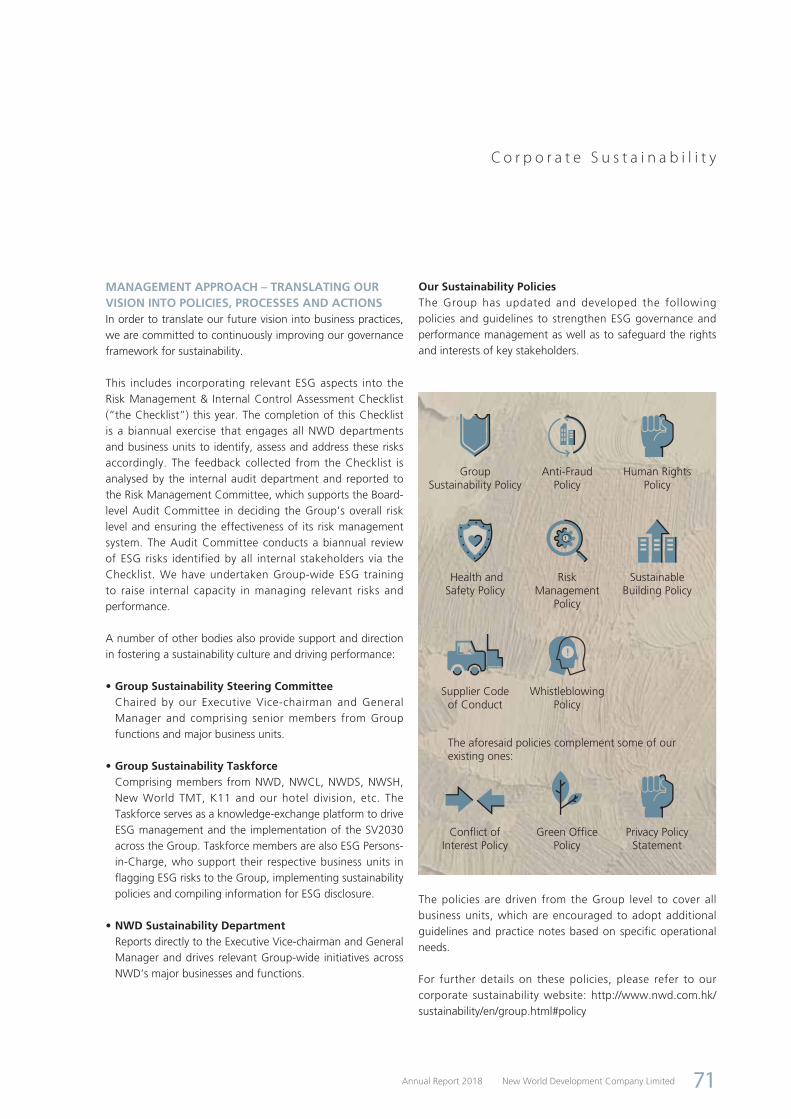
C o r p o r a t e S u s t a i n a b i l i t y
MANAGEMENT APPROACH – TRANSLATING OUR VISION INTO POLICIES, PROCESSES AND ACTIONSIn order to translate our future vision into business practices, we are committed to continuously improving our governance framework for sustainability.
This includes incorporating relevant ESG aspects into the Risk Management & Internal Control Assessment Checklist (“the Checklist”) this year. The completion of this Checklist is a biannual exercise that engages all NWD departments and business units to identify, assess and address these risks accordingly. The feedback collected from the Checklist is analysed by the internal audit department and reported to the Risk Management Committee, which supports the Board-level Audit Committee in deciding the Group’s overall risk level and ensuring the effectiveness of its risk management system. The Audit Committee conducts a biannual review of ESG risks identified by all internal stakeholders via the Checklist. We have undertaken Group-wide ESG training to raise internal capacity in managing relevant risks and performance.
A number of other bodies also provide support and direction in fostering a sustainability culture and driving performance:
• Group Sustainability Steering CommitteeChaired by our Executive Vice-chairman and General Manager and comprising senior members from Group functions and major business units.
• Group Sustainability TaskforceComprising members from NWD, NWCL, NWDS, NWSH, New World TMT, K11 and our hotel division, etc. The Taskforce serves as a knowledge-exchange platform to drive ESG management and the implementation of the SV2030 across the Group. Taskforce members are also ESG Persons-in-Charge, who support their respective business units in flagging ESG risks to the Group, implementing sustainability policies and compiling information for ESG disclosure.
• NWD Sustainability DepartmentReports directly to the Executive Vice-chairman and General Manager and drives relevant Group-wide initiatives across NWD’s major businesses and functions.
Our Sustainability PoliciesThe Group has updated and developed the following policies and guidelines to strengthen ESG governance and performance management as well as to safeguard the rights and interests of key stakeholders.
The policies are driven from the Group level to cover all business units, which are encouraged to adopt additional guidelines and practice notes based on specific operational needs.
For further details on these policies, please refer to our corporate sustainability website: http://www.nwd.com.hk/sustainability/en/group.html#policy
Anti-Fraud Policy
Group Sustainability Policy
Human Rights Policy
RiskManagement
Policy
Sustainable Building Policy
Supplier Code of Conduct
Whistleblowing Policy
The aforesaid policies complement some of our existing ones:
Privacy Policy Statement
Conflict of Interest Policy
Green Office Policy
Health and Safety Policy
New World Development Company LimitedAnnual Report 2018 71
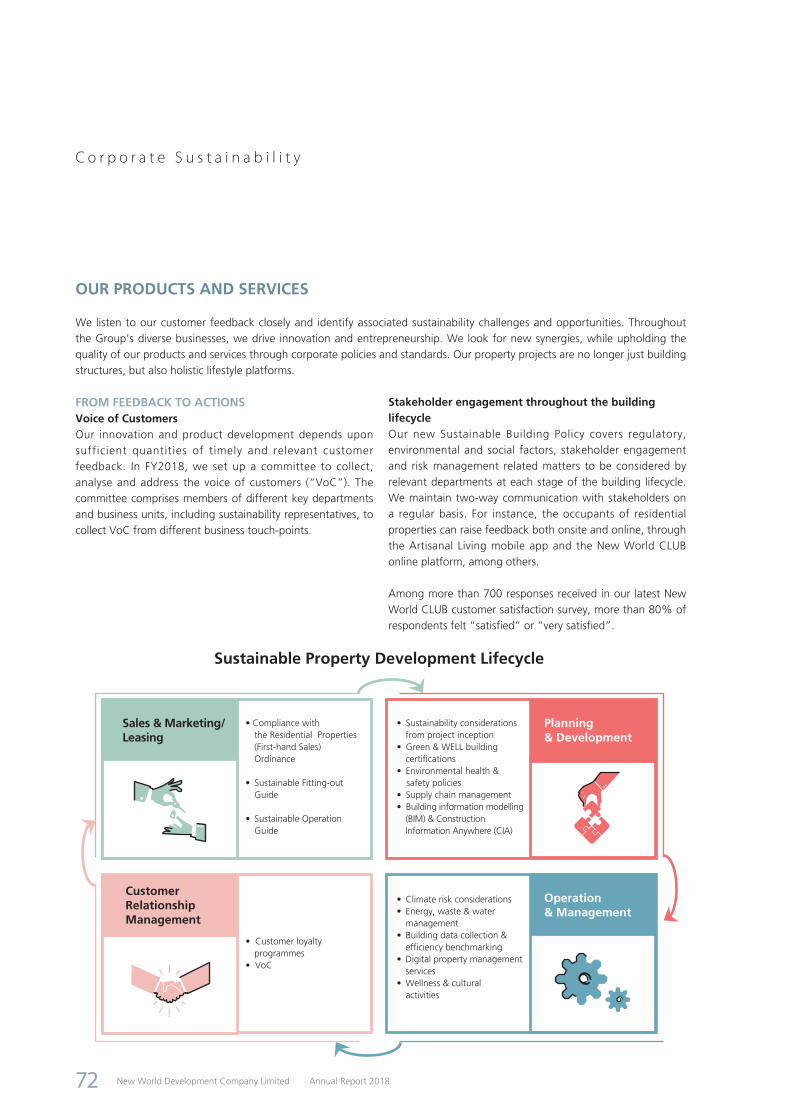
C o r p o r a t e S u s t a i n a b i l i t y
OUR PRODUCTS AND SERVICES
We listen to our customer feedback closely and identify associated sustainability challenges and opportunities. Throughout the Group’s diverse businesses, we drive innovation and entrepreneurship. We look for new synergies, while upholding the quality of our products and services through corporate policies and standards. Our property projects are no longer just building structures, but also holistic lifestyle platforms.
FROM FEEDBACK TO ACTIONSVoice of CustomersOur innovation and product development depends upon sufficient quantities of timely and relevant customer feedback. In FY2018, we set up a committee to collect, analyse and address the voice of customers (“VoC”). The committee comprises members of different key departments and business units, including sustainability representatives, to collect VoC from different business touch-points.
Stakeholder engagement throughout the building lifecycleOur new Sustainable Building Policy covers regulatory, environmental and social factors, stakeholder engagement and risk management related matters to be considered by relevant departments at each stage of the building lifecycle. We maintain two-way communication with stakeholders on a regular basis. For instance, the occupants of residential properties can raise feedback both onsite and online, through the Artisanal Living mobile app and the New World CLUB online platform, among others.
Among more than 700 responses received in our latest New World CLUB customer satisfaction survey, more than 80% of respondents felt “satisfied” or “very satisfied”.
• Compliance withthe Residential Properties (First-hand Sales) Ordinance
• Sustainable Fitting-out Guide
• Sustainable Operation Guide
• Customer loyalty programmes
• VoC
• Sustainability considerations from project inception
• Green & WELL building certifications
• Environmental health & safety policies• Supply chain management• Building information modelling
(BIM) & Construction Information Anywhere (CIA)
Sales & Marketing/ Leasing
Planning & Development
CustomerRelationshipManagement
Operation & Management
• Climate risk considerations• Energy, waste & water
management• Building data collection &
efficiency benchmarking• Digital property management
services• Wellness & cultural activities
Sustainable Property Development Lifecycle
New World Development Company Limited Annual Report 201872
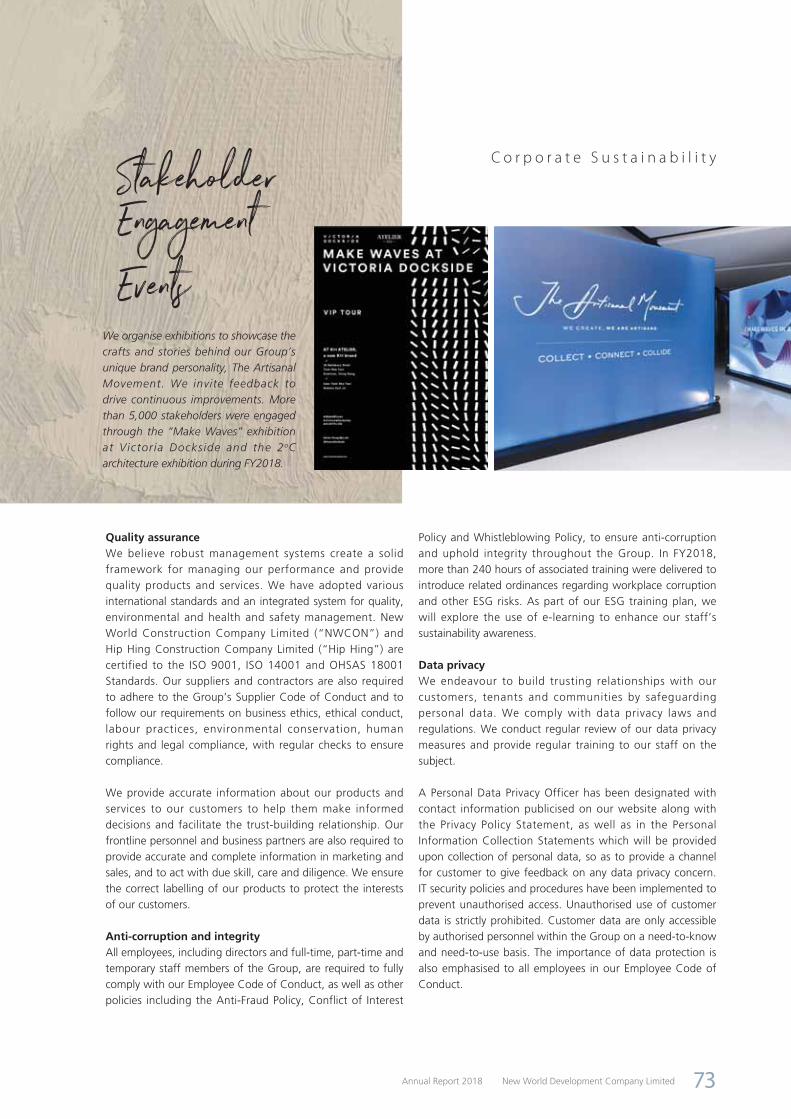
C o r p o r a t e S u s t a i n a b i l i t y
We organise exhibitions to showcase the crafts and stories behind our Group’s unique brand personality, The Artisanal Movement. We invite feedback to drive continuous improvements. More than 5,000 stakeholders were engaged through the “Make Waves” exhibition at Victor ia Dockside and the 2oC architecture exhibition during FY2018.
Quality assuranceWe believe robust management systems create a solid framework for managing our performance and provide quality products and services. We have adopted various international standards and an integrated system for quality, environmental and health and safety management. New World Construction Company Limited (“NWCON”) and Hip Hing Construction Company Limited (“Hip Hing”) are certified to the ISO 9001, ISO 14001 and OHSAS 18001 Standards. Our suppliers and contractors are also required to adhere to the Group’s Supplier Code of Conduct and to follow our requirements on business ethics, ethical conduct, labour practices, environmental conservation, human rights and legal compliance, with regular checks to ensure compliance.
We provide accurate information about our products and services to our customers to help them make informed decisions and facilitate the trust-building relationship. Our frontline personnel and business partners are also required to provide accurate and complete information in marketing and sales, and to act with due skill, care and diligence. We ensure the correct labelling of our products to protect the interests of our customers.
Anti-corruption and integrityAll employees, including directors and full-time, part-time and temporary staff members of the Group, are required to fully comply with our Employee Code of Conduct, as well as other policies including the Anti-Fraud Policy, Conflict of Interest
Policy and Whistleblowing Policy, to ensure anti-corruption and uphold integrity throughout the Group. In FY2018, more than 240 hours of associated training were delivered to introduce related ordinances regarding workplace corruption and other ESG risks. As part of our ESG training plan, we will explore the use of e-learning to enhance our staff’s sustainability awareness.
Data privacyWe endeavour to build trusting relationships with our customers, tenants and communities by safeguarding personal data. We comply with data privacy laws and regulations. We conduct regular review of our data privacy measures and provide regular training to our staff on the subject.
A Personal Data Privacy Officer has been designated with contact information publicised on our website along with the Privacy Policy Statement, as well as in the Personal Information Collection Statements which will be provided upon collection of personal data, so as to provide a channel for customer to give feedback on any data privacy concern. IT security policies and procedures have been implemented to prevent unauthorised access. Unauthorised use of customer data is strictly prohibited. Customer data are only accessible by authorised personnel within the Group on a need-to-know and need-to-use basis. The importance of data protection is also emphasised to all employees in our Employee Code of Conduct.
StakeholderEngagementEvents
New World Development Company LimitedAnnual Report 2018 73

C o r p o r a t e S u s t a i n a b i l i t y
PROMOTING INNOVATION AND CREATIVITYFrom incubation to innovationIn 2013, we launched our Incubation Circle programme to collect, screen and implement novel ideas to optimise business processes and enhance our products and services. About 630 improvement projects have been implemented since the launch of the programme, which have brought an estimated cost saving of HKD 90 million and generated HKD 5.5 million direct revenue.
Our Customer Committee and Innovation Lab were set up in 2016 to fast-track the execution of new solutions and adoption of new technologies. These act as regular channels to collect and discuss innovative ideas, as well as expedite the implementation by facilitating senior management’s approval of shortlisted ideas.
Marrying aspirations and imagination, our in-house professionals have invented products that are both aesthetically designed and highly functional. As a result, 34 intellectual property (“IP”) rights have been granted or are under application through the process driven by the aforesaid platforms since 2016.
DRIVING INNOVATION VIA SUPPORTING START-UPSEureka Nova assists young entrepreneurs in Hong Kong by providing a bespoke incubation programme and critical resources such as networking opportunities, office space and access to funding. The programme collects disruptive business solutions, connects passionate change-makers, and enables the collision of bold ideas.
The Group is also collaborating with Tencent Makerspace to set up a culture and innovation centre in KOHO, one of our office buildings in Hong Kong. This partnership will help cultivate local multimedia talents.
NWCL partnered with the Institute of Digital China Inc. of Peking University to set up the Digital Innovation Institute. Collaborated with incubators for technology start-ups, the Digital Innovation Institute set up a platform to attract and draw related industries and talents for strengthening the Group’s future business ecosystem in Beijing, Tianjin and Hebei Province.
DEDICATED TEAMS FOR DIGITALISATIONWe have dedicated teams to bring ideas to life, accelerating transformation towards digitalisation. New World First Bus and Citybus’ mobile app provides passengers with real-time bus arrival information. The app has accumulated 3 million downloads with average daily enquiries of over 2 million. We develop these online platforms in-house and drive associated IPs. Another example is Artisan 360, which is a virtual reality website that shows our properties to potential customers with 360-degree images of our new flat units. A. Connect is an internal office app that enhances workflows and internal communication.
The New World DigiTalent Programme organises training programmes to inspire and support our workforce to develop and implement creative digital solutions in their daily work through social media, digital marketing, online services, app development and data analytics.
34 intellectual property (IP) applications approved/in progress
Incubation Circle
An annual competition established in 2013 to encourage colleagues to form teams and make suggestions to improve the efficiency and innovation across the Group’s businesses
Innovation Lab
Senior management to endorse shortlisted ideas
Customer Committee
A platform since 2016 to collect and discuss innovative ideas from departments and the Incubation Circle
Process To Drive Innovation
Collect Voice of Customers (VoC) and Review Socio-economic Megatrends
IP application
OVER 630 improvement projects implemented
HKD 90 million estimated cost saving
HKD 5.5 million direct revenue
New World Development Company Limited Annual Report 201874
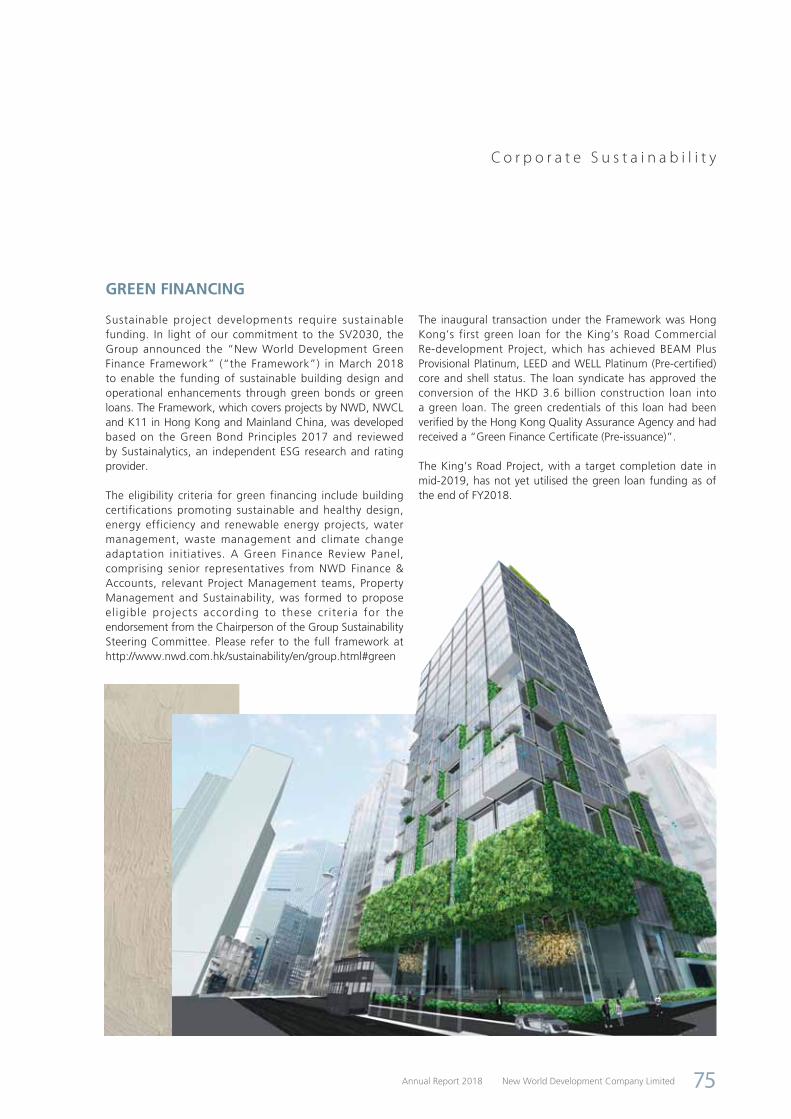
C o r p o r a t e S u s t a i n a b i l i t y
The inaugural transaction under the Framework was Hong Kong’s first green loan for the King’s Road Commercial Re-development Project, which has achieved BEAM Plus Provisional Platinum, LEED and WELL Platinum (Pre-certified) core and shell status. The loan syndicate has approved the conversion of the HKD 3.6 billion construction loan into a green loan. The green credentials of this loan had been verified by the Hong Kong Quality Assurance Agency and had received a “Green Finance Certificate (Pre-issuance)”.
The King’s Road Project, with a target completion date in mid-2019, has not yet utilised the green loan funding as of the end of FY2018.
GREEN FINANCING
Sustainable project developments require sustainable funding. In light of our commitment to the SV2030, the Group announced the “New World Development Green Finance Framework” (“the Framework”) in March 2018 to enable the funding of sustainable building design and operational enhancements through green bonds or green loans. The Framework, which covers projects by NWD, NWCL and K11 in Hong Kong and Mainland China, was developed based on the Green Bond Principles 2017 and reviewed by Sustainalytics, an independent ESG research and rating provider.
The eligibility criteria for green financing include building certifications promoting sustainable and healthy design, energy efficiency and renewable energy projects, water management, waste management and climate change adaptation initiatives. A Green Finance Review Panel, comprising senior representatives from NWD Finance & Accounts, relevant Project Management teams, Property Management and Sustainability, was formed to propose el igible projects according to these criteria for the endorsement from the Chairperson of the Group Sustainability Steering Committee. Please refer to the full framework at http://www.nwd.com.hk/sustainability/en/group.html#green
New World Development Company LimitedAnnual Report 2018 75

C o r p o r a t e S u s t a i n a b i l i t y
The next three sections detail how we are curating opportunities for your environment, your health and your communities.
YOUR ENVIRONMENT
To create sustainable living environments for our customers and tenants, we consider the long-term integrity of the ecosystem and natural resources, as well as climate risks, in our building design, operations, procurement and the curation of our commercial offers.
SUSTAINABLE BUILDING DESIGN AND CLIMATE RESILIENCEOur new Sustainable Building Policy sets out the Group’s commitment to embed sustainability considerations into the full building lifecycle from the identification and acquisition of project sites and project design, to property management and stakeholder engagement. Under the policy, we strive to achieve Gold or above level in BEAM Plus, Hong Kong’s leading independent assessment of building sustainability performance, or U.S. LEED certifications for new commercial and retail buildings in Hong Kong and Mainland China.
As of the end of FY2018, 20 buildings have earned the BEAM Plus certification and 27 buildings have earned the LEED certification, achieving Platinum or Gold ratings. 12 buildings have also been certified to the China Green Building Evaluation Standard (two-star or above).
Our King’s Road Commercial Re-development Project in Hong Kong achieved the world’s first WELL Building Standard Platinum Pre-certification. Further to this, we are exploring other certification opportunities among new Hong Kong and Mainland projects to curate buildings that improve the physical and mental health of our customers. The WELL Building Standard v1 includes seven concepts concerning the holistic wellness of building users: air, water, nourishment, light, fitness, comfort and mind. With reference to this, all new buildings will strive to achieve at least an above-compliance level of indoor air quality, water and lighting.
We have also developed internal sustainable building design guidelines for Hong Kong and Mainland China to cover specifications pertinent to healthy and smart living, social integration and climate change adaptation for different property types.
CONSTRUCTION INFORMATION ANYWHERE (“CIA”)The Group has pioneered the full property l ifecycle application of Building Information Modeling (“BIM”) among Hong Kong companies to reduce project development time, cost, construction risks, abortive works and wastage with computer simulation and 3D visualisation functionalities. Timely sharing of the latest project details with project team members and data-intensive models created on advanced software is a challenge to wider adoption of this full lifecycle BIM approach. We created the Construction Information Anywhere (“CIA”), a cloud-based online system, to address this bottleneck by serving as a centralised project database for internal and external team members to access up-to-date project information easily on their computers or mobile devices. While BIM enables design coordination and the production of “virtual visual mock-up”, CIA allows more efficient distribution of relevant drawings and documents among all project team members, including subcontractors. For instance, about 11,340 documents and 8,740 drawings of the King’s Road Commercial Re-development Project are handled digitally by the Document Control System of CIA. We plan to develop CIA eventually as an Enterprise Resource Planning system, enabling information from various building stages could be reviewed and archived for quality improvements and knowledge sharing.
Bringing our SV2030 to your lives
New World Development Company Limited Annual Report 201876

C o r p o r a t e S u s t a i n a b i l i t y
The Board oversees climate risks, which form part of the Risk Management Policy. We are committed to developing quality and artisanal buildings that are resource efficient and climate resilient. A Group-level Sustainable Building Policy guides relevant business units, such as NWD, NWCL and K11, to consider climate change impacts in the building lifecycle and obtain green and healthy building certifications for new and existing buildings where possible. We also reference building performance benchmarks and implement internal sustainable building design guidelines to ensure that our projects cover specifications related to climate change adaptation. For example, project managers in Mainland China are guided to assess climate risks and adopt “sponge city” features, such as rainwater harvesting, ecological detention ponds and permeable paving, to improve climate resilience. Beyond preliminary energy and carbon reduction targets for our portfolio in Hong Kong and Mainland China, we will also develop Group-wide carbon reduction targets to substantiate the SV2030.
Climate Change Strategy MINIMISING ENVIRONMENTAL IMPACT
We aim to minimise our environmental impact through enhancing operational efficiency, and adopting and investing in renewable energy and sustainable technology.
Digitalisation of ESG data collectionThe Group-wide ESG data management system Resource Advisor has been deployed since FY2017 to streamline data collection. Around 130 sites across our business units now report their ESG data via this system, which has enhanced traceability and accountability of the data and performance disclosure. Eco-world, a real-time building energy monitoring and benchmarking system synchronised with the building management systems, has also been installed at major properties in Hong Kong and Mainland China to record more accurate energy and carbon data.
Energy
75%
13%
9%
3%
Energy Consumption across the Group
Total: 5,818,992 GJ
NWDNWSHNWCLNWDS
Total %changeFY2017 FY2018
Energy Consumption (GJ)
5,784,9081 5,818,9922 +1%
Notes:1) The data have been adjusted to reflect the actual Towngas consumption;
and2) The data exclude tenants’ consumptions in all NWDS stores.
New World Development Company LimitedAnnual Report 2018 77
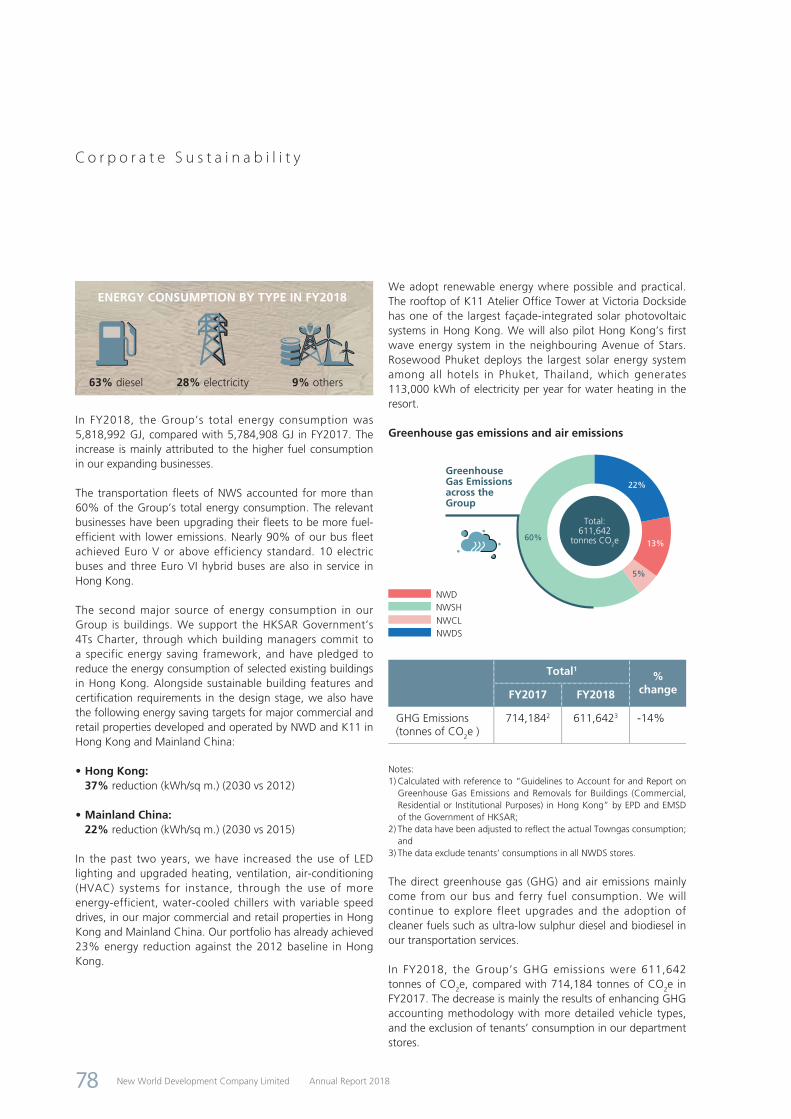
C o r p o r a t e S u s t a i n a b i l i t y
In FY2018, the Group’s total energy consumption was 5,818,992 GJ, compared with 5,784,908 GJ in FY2017. The increase is mainly attributed to the higher fuel consumption in our expanding businesses.
The transportation fleets of NWS accounted for more than 60% of the Group’s total energy consumption. The relevant businesses have been upgrading their fleets to be more fuel-efficient with lower emissions. Nearly 90% of our bus fleet achieved Euro V or above efficiency standard. 10 electric buses and three Euro VI hybrid buses are also in service in Hong Kong.
The second major source of energy consumption in our Group is buildings. We support the HKSAR Government’s 4Ts Charter, through which building managers commit to a specific energy saving framework, and have pledged to reduce the energy consumption of selected existing buildings in Hong Kong. Alongside sustainable building features and certification requirements in the design stage, we also have the following energy saving targets for major commercial and retail properties developed and operated by NWD and K11 in Hong Kong and Mainland China:
• Hong Kong:37% reduction (kWh/sq m.) (2030 vs 2012)
• Mainland China:22% reduction (kWh/sq m.) (2030 vs 2015)
In the past two years, we have increased the use of LED lighting and upgraded heating, ventilation, air-conditioning (HVAC) systems for instance, through the use of more energy-efficient, water-cooled chillers with variable speed drives, in our major commercial and retail properties in Hong Kong and Mainland China. Our portfolio has already achieved 23% energy reduction against the 2012 baseline in Hong Kong.
We adopt renewable energy where possible and practical. The rooftop of K11 Atelier Office Tower at Victoria Dockside has one of the largest façade-integrated solar photovoltaic systems in Hong Kong. We will also pilot Hong Kong’s first wave energy system in the neighbouring Avenue of Stars. Rosewood Phuket deploys the largest solar energy system among all hotels in Phuket, Thailand, which generates 113,000 kWh of electricity per year for water heating in the resort.
Greenhouse gas emissions and air emissions
60%
5%
22%
13%
Total: 611,642
tonnes CO2e
Greenhouse Gas Emissions across theGroup
NWDNWSHNWCLNWDS
Total1%
changeFY2017 FY2018
GHG Emissions (tonnes of CO2e )
714,1842 611,6423 -14%
Notes:1) Calculated with reference to “Guidelines to Account for and Report on
Greenhouse Gas Emissions and Removals for Buildings (Commercial, Residential or Institutional Purposes) in Hong Kong” by EPD and EMSD of the Government of HKSAR;
2) The data have been adjusted to reflect the actual Towngas consumption; and
3) The data exclude tenants’ consumptions in all NWDS stores.
The direct greenhouse gas (GHG) and air emissions mainly come from our bus and ferry fuel consumption. We will continue to explore fleet upgrades and the adoption of cleaner fuels such as ultra-low sulphur diesel and biodiesel in our transportation services.
In FY2018, the Group’s GHG emissions were 611,642 tonnes of CO2e, compared with 714,184 tonnes of CO2e in FY2017. The decrease is mainly the results of enhancing GHG accounting methodology with more detailed vehicle types, and the exclusion of tenants’ consumption in our department stores.
ENERGY CONSUMPTION BY TYPE IN FY2018
9% others28% electricity63% diesel
New World Development Company Limited Annual Report 201878
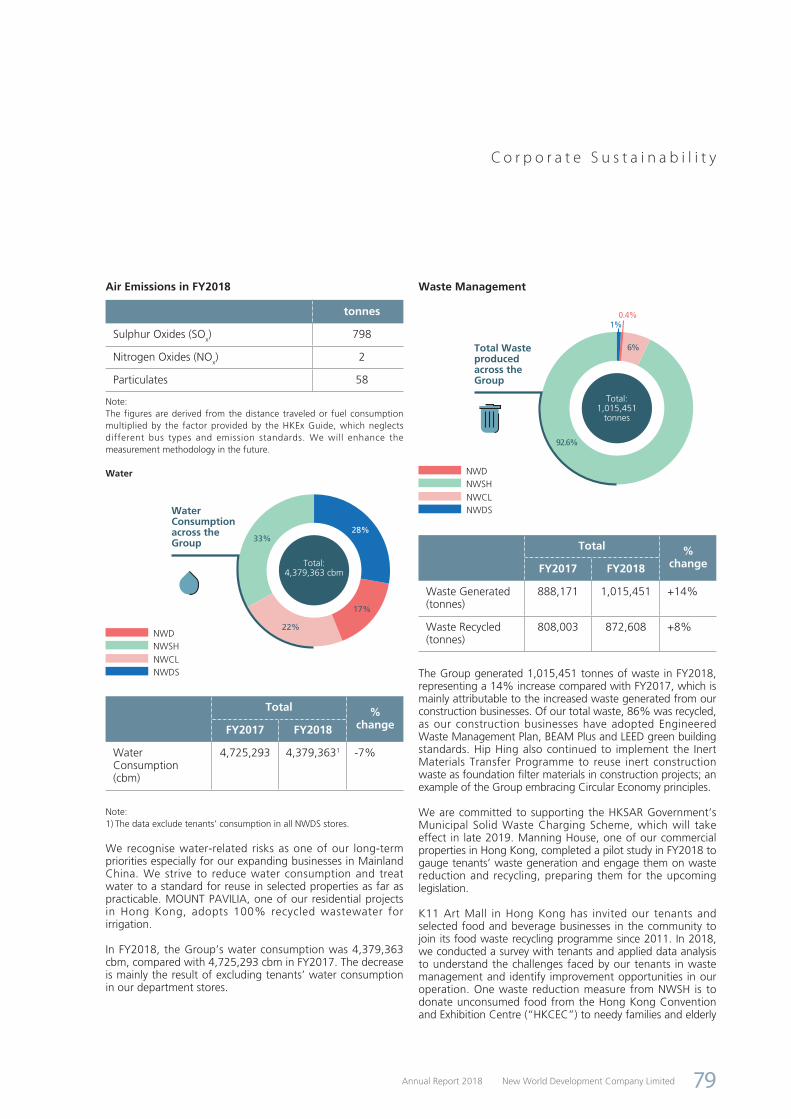
C o r p o r a t e S u s t a i n a b i l i t y
Air Emissions in FY2018
tonnes
Sulphur Oxides (SOx) 798
Nitrogen Oxides (NOx) 2
Particulates 58
Note:The figures are derived from the distance traveled or fuel consumption multiplied by the factor provided by the HKEx Guide, which neglects different bus types and emission standards. We will enhance the measurement methodology in the future.
Water
Total:4,379,363 cbm
33%28%
17%
22%
Water Consumption across the Group
NWDNWSHNWCLNWDS
Total %changeFY2017 FY2018
WaterConsumption(cbm)
4,725,293 4,379,3631 -7%
Note:1) The data exclude tenants’ consumption in all NWDS stores.
We recognise water-related risks as one of our long-term priorities especially for our expanding businesses in Mainland China. We strive to reduce water consumption and treat water to a standard for reuse in selected properties as far as practicable. MOUNT PAVILIA, one of our residential projects in Hong Kong, adopts 100% recycled wastewater for irrigation.
In FY2018, the Group’s water consumption was 4,379,363 cbm, compared with 4,725,293 cbm in FY2017. The decrease is mainly the result of excluding tenants’ water consumption in our department stores.
Waste Management
6%
92.6%
1%0.4%
Total:1,015,451
tonnes
Total Waste produced across the Group
NWDNWSHNWCLNWDS
Total %changeFY2017 FY2018
Waste Generated (tonnes)
888,171 1,015,451 +14%
Waste Recycled (tonnes)
808,003 872,608 +8%
The Group generated 1,015,451 tonnes of waste in FY2018, representing a 14% increase compared with FY2017, which is mainly attributable to the increased waste generated from our construction businesses. Of our total waste, 86% was recycled, as our construction businesses have adopted Engineered Waste Management Plan, BEAM Plus and LEED green building standards. Hip Hing also continued to implement the Inert Materials Transfer Programme to reuse inert construction waste as foundation filter materials in construction projects; an example of the Group embracing Circular Economy principles.
We are committed to supporting the HKSAR Government’s Municipal Solid Waste Charging Scheme, which will take effect in late 2019. Manning House, one of our commercial properties in Hong Kong, completed a pilot study in FY2018 to gauge tenants’ waste generation and engage them on waste reduction and recycling, preparing them for the upcoming legislation.
K11 Art Mall in Hong Kong has invited our tenants and selected food and beverage businesses in the community to join its food waste recycling programme since 2011. In 2018, we conducted a survey with tenants and applied data analysis to understand the challenges faced by our tenants in waste management and identify improvement opportunities in our operation. One waste reduction measure from NWSH is to donate unconsumed food from the Hong Kong Convention and Exhibition Centre (“HKCEC”) to needy families and elderly
New World Development Company LimitedAnnual Report 2018 79

C o r p o r a t e S u s t a i n a b i l i t y
people, through Food Angel, a local charitable organisation. NWCL has also invited more than 400 families to join the food waste recycling programmes across six regions.
The total hazardous waste produced by the Group in FY2018 was 630 tonnes. Our hazardous waste mainly comes from the chemical waste of our transportation businesses, such as lubricant and organic solvent. We have commissioned licensed service providers to collect and recycle these materials for safe and proper disposal.
Responsible resource use along our supply chainsAll suppliers and contractors are required to adhere to the Group’s Supplier Code of Conduct. We have a Group Sustainable Procurement Policy to encourage the use of materials from responsible and local sources.
Construction timber and concrete are the two key materials used by our businesses, in terms of sourcing volumes. We prioritise the use of timber certified to the Forest Stewardship Council (“FSC”) standard or equivalent. NWCON commits to sourcing 100% FSC or an equivalent standard timber for temporary works in each project. Our property construction projects aim to source at least 10% of local materials that are grown or manufactured within a radius of 800 km from project sites, to reduce the environmental impact of transportation. Our hotels also offer amenities made of sustainable and natural materials.
We have been taking an active role in developing new construction materials. Hip Hing formed a partnership with Nano and Advanced Materials Institute Limited to develop green building materials. An award-winning technology was developed to produce high-performance lightweight concrete. With lower thermal conductivity than regular concrete, this new concrete reduces the need for air-conditioning and in turn cuts energy consumption.
Conservation and biodiversityAs part of our Sustainable Building Policy, the Group considers biodiversity impacts and enhancement opportunities as we plan our property projects. For instance, MOUNT PAVILIA has a green coverage that is higher than BEAM Plus’ requirement. Native plant species constitute the majority of the onsite vegetation, and so reduce irrigation needs and protect local biodiversity.
We support a water quality research initiative on the Victoria Harbour, Hong Kong, conducted by the Open University of Hong Kong, as part of our environmental protection efforts for the New World Harbour Race, the Group’s annual city-level sporting event.
During the construction stage of Rosewood Phuket, prudent waste and erosion management had minimised adverse environmental impact on the sea. The resort had also collaborated with the navy and local government on placing 340 artificial reef structures and transplanting coral in the Emerald Bay to help replenish aquatic lives.
Customer engagement on sustainabilityWe distribute the Sustainable Fitting-out Guide and Sustainable Operation Guide to support office and shop tenants to reduce their environmental impact and adopt practical eco-friendly and healthy practices.
We are one of the founding members of the Hong Kong Green Shop Alliance (“the Alliance”) initiated by the Hong Kong Green Building Council. The Alliance was established to raise green building awareness and disseminate sustainable practices in the retail industry. More than 30 tenants from eight properties of NWD have joined the Alliance.
In addition to the ISO 20121 Event Sustainability Management System Certification, the HKCEC launched the LoveGreen Meeting Package to offer low-carbon menus, recycling support, and surplus food donation services to customers.
GREEN RETAILFrom conception to tenant mix, we revolutionise the concept of retail by offering green and healthy options to customers. Spanning nearly 9,000 sq ft., K11 Natural features a number of green catering and retail brands promoting nature, wellness and sustainability. NWDS maintains the sales proportion of eco-friendly merchandise at LOL(“Love • Original Life”) Concept Shops at about 10%. To further promote green merchandising, the “LOL Green Proposal” will guide suppliers to pursue green procurement.
New World Development Company Limited Annual Report 201880
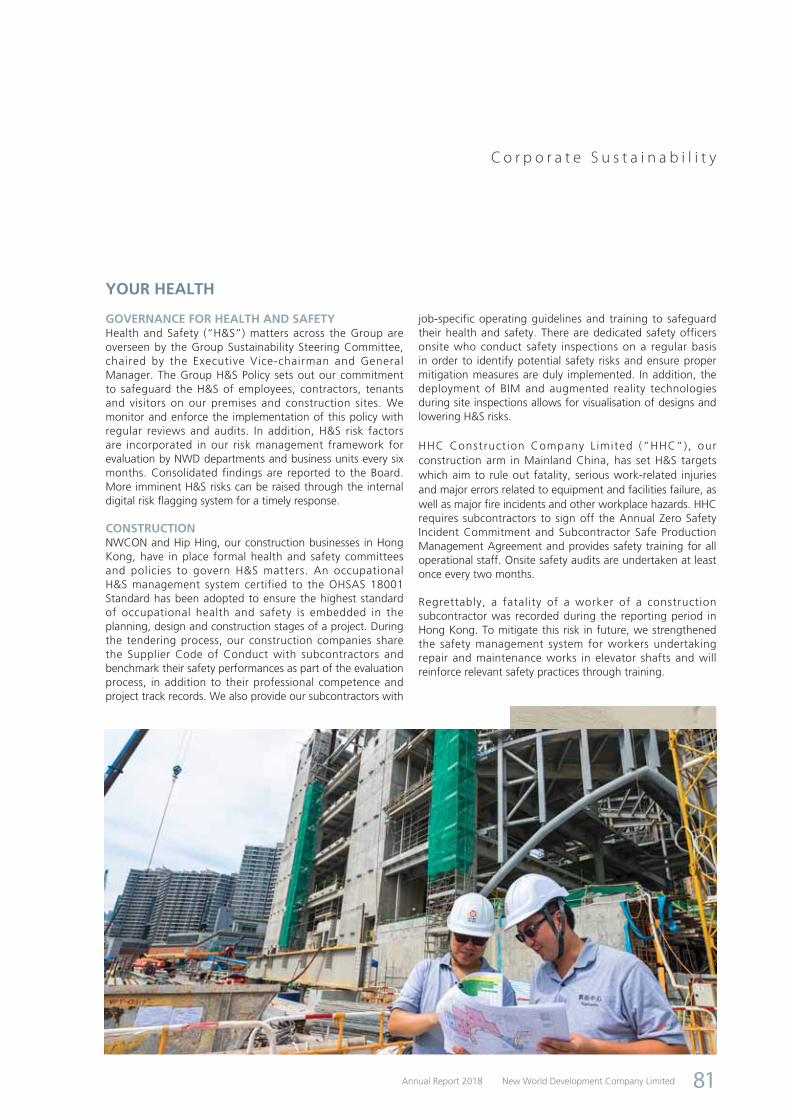
C o r p o r a t e S u s t a i n a b i l i t y
YOUR HEALTH
GOVERNANCE FOR HEALTH AND SAFETYHealth and Safety (“H&S”) matters across the Group are overseen by the Group Sustainability Steering Committee, chaired by the Executive Vice-chairman and General Manager. The Group H&S Policy sets out our commitment to safeguard the H&S of employees, contractors, tenants and visitors on our premises and construction sites. We monitor and enforce the implementation of this policy with regular reviews and audits. In addition, H&S risk factors are incorporated in our risk management framework for evaluation by NWD departments and business units every six months. Consolidated findings are reported to the Board. More imminent H&S risks can be raised through the internal digital risk flagging system for a timely response.
CONSTRUCTIONNWCON and Hip Hing, our construction businesses in Hong Kong, have in place formal health and safety committees and policies to govern H&S matters. An occupational H&S management system certified to the OHSAS 18001 Standard has been adopted to ensure the highest standard of occupational health and safety is embedded in the planning, design and construction stages of a project. During the tendering process, our construction companies share the Supplier Code of Conduct with subcontractors and benchmark their safety performances as part of the evaluation process, in addition to their professional competence and project track records. We also provide our subcontractors with
job-specific operating guidelines and training to safeguard their health and safety. There are dedicated safety officers onsite who conduct safety inspections on a regular basis in order to identify potential safety risks and ensure proper mitigation measures are duly implemented. In addition, the deployment of BIM and augmented reality technologies during site inspections allows for visualisation of designs and lowering H&S risks.
HHC Construct ion Company L imited (“HHC”), our construction arm in Mainland China, has set H&S targets which aim to rule out fatality, serious work-related injuries and major errors related to equipment and facilities failure, as well as major fire incidents and other workplace hazards. HHC requires subcontractors to sign off the Annual Zero Safety Incident Commitment and Subcontractor Safe Production Management Agreement and provides safety training for all operational staff. Onsite safety audits are undertaken at least once every two months.
Regrettably, a fatality of a worker of a construction subcontractor was recorded during the reporting period in Hong Kong. To mitigate this risk in future, we strengthened the safety management system for workers undertaking repair and maintenance works in elevator shafts and will reinforce relevant safety practices through training.
New World Development Company LimitedAnnual Report 2018 81

C o r p o r a t e S u s t a i n a b i l i t y
BUILDINGSWe develop healthy bui ld ings and curate wel lness programmes to enhance the lives of our communities and deepen engagement with stakeholders.
In our upcoming King’s Road Project in Hong Kong, we intend to deliver health benefits to each building user by adopting biophilic design principles such as extensive indoor and outdoor green features, and providing indoor air quality and water above the local standards. Spaces for physical activities will also be available for tenants’ use to promote active living.
To protect our customers’ health in the hotels and retail mall in Shenyang K11, we deployed a mid-high air filtering system in addition to the use of eco-friendly adhesives and sealants which emit lower volatile organic compounds.
Beyond the buildings themselves, engagement programmes are important for building users to experience firsthand the health benefits. Office tenants in K11 Atelier in Hong Kong and Mainland China enjoy the K11 Atelier Academy, a comprehensive wellness curriculum covering fitness, yoga and lifestyle. Visitors of K11 Art Mall in Hong Kong can immerse themselves in a wide array of wellness activities, such as aromatherapy classes and organic food workshops through the K11 Kulture Academy. Online platforms such as mobile applications are available to deepen engagement on wellness.
During the reporting period, we have started a smart metering pilot in Manning House, Hong Kong, a commercial building which hosts mainly medical practitioners as tenants. The smart meters monitor real-time energy consumption and indoor air quality metrics such as PM2.5, carbon dioxide, humidity, etc. With these smart meters, tenants can learn more about their electricity usage and indoor air quality, potentially triggering positive behaviour changes for a more eco-friendly and healthy workplace. We also organised the “New World Tower Wellness Fest”, which promoted the SV2030 and engaged about 100 tenants and Group staff with a full-day of interactive wellness activities and lunchtime seminars.
WORKPLACENWD Central Administration Department oversees matters relating to employee workplace safety and wellness. Mindful of our staff’s physical and mental well-being, our comprehensive wellness programme provides staff with fruit, fitness classes, sporting competitions, seminars on stress management, networking opportunities and affinity groups such as the Christian Family, etc. Staff members based in
KOHO, one of our corporate offices in Hong Kong, also enjoy in-house gym facilities. Employee health and safety metrics are tracked and our target is to achieve a lower year-on-year work-related injury rate, and ultimately create an injury/hazard-free workplace.
PUBLIC TRANSPORTWe are deeply saddened by the unfortunate fatal accident involving Citybus in September 2017 and are determined to enhance safety provisions to better protect passengers and pedestrians. In conjunction with the investigation of the accident, the senior management of our bus companies has undertaken a comprehensive review of bus captains’ working hour guidelines with major stakeholders including the Government and labour unions. Following the Transport Department’s revisions of bus operational guidelines in February 2018, New World First Bus and Citybus announced the introduction of new measures including phased reduction of working hours per shift, and more rest facilities. The salary package for frontline staff was also enhanced.
We have also set up an internal working group to study possible measures to further enhance bus safety, including the installation of in-vehicle safety devices and seatbelts on all seats and trainings for bus captains. Automated external defibrillators have also been installed in multiple ferry piers and will be made available in selected ferries in the future.
OUR WELLNESS BUSINESSESThe Group aspires to building an ecosystem of wellness businesses which will provide a one-stop shop of holistic wellness for stakeholders. We have invested in New Century Healthcare to develop middle to high-end gynecologic and pediatric specialty medical services, as well as family healthcare management services, in the Greater China region. K11 has invested in Hua Medicine, a clinical-stage drug development company. This financing would enable commercialisation of a novel therapy which seeks to address the underlying causes of Type 2 diabetes.
Opened in March 2018, the Gleneagles Hong Kong Hospital (“GHK”) is jointly invested between NWSH and Parkway Pantai, with the University of Hong Kong being its exclusive clinical partner, providing cutting-edge medical services for the community. GHK performed the Hong Kong’s first hyperthermic intraperitoneal chemotherapy for treating ovarian cancer, a treatment that leads to significant improvement in reducing recurrence and enhancing overall survival for patients with ovarian cancer, as published in the New England Journal of Medicine.
New World Development Company Limited Annual Report 201882
C o r p o r a t e S u s t a i n a b i l i t y
YOUR COMMUNITY
FOSTERING AN IDEAL WORKPLACEWe create a supportive workplace conducive for growth and development. Our Employee Handbook is regularly shared with our employees, and spells out employment-related policies covering employee grievances, equal opportunity, and the Employee Code of Conduct. These lay the foundation for an open, diverse and respectful workplace free of harassment, intimidation, bias and discrimination on the grounds of age, gender, disability, religion, family status and obligations, race and colour.
The Human Rights Policy reinforces this message and safeguards the civil rights of not only employees but also suppliers, subcontractors, etc. such as freedom of speech, association and collective bargaining. Under this policy, the employment of forced/child labour is strictly prohibited from our operations. This policy also guides our employees to identify risks related to human rights. In case of experiencing violation or inappropriate treatment within the Company or by business partners, employees must report the incidents, and the internal audit department would conduct further investigation where appropriate.
The annual performance appraisal provides an opportunity for staff members to discuss career planning, identify areas for further development and maximise career potential with their line managers. We also provide staff members with a wide range of caring benefits such as flexible working hours, paternity leave, family-care leave and Care Points, which can be converted from unused annual leave to cover medical expenses.
TALENT GROOMINGOur employees are our source of innovation and ingenuity, which is critical to future-proofing the Group’s business.A. New World UniversityTM is a comprehensive talent grooming curriculum which develops Group talents through various training and development opportunities and financial support. High-flying talents take the opportunity to gain exposure to the wider New World business ecosystem and broaden their professional network through development programmes such as YoungSTAR Programme, New Manager Programme and Accelerating Management Talent Programme. For example, the YoungSTAR programme recruits over 20 promising staff members of Assistant Manager Grade or below from across the Group, to take part in activities including business visits to operations in Mainland
China, a design-thinking workshop, and network events with distinguished entrepreneurs. YoungSTARs also receive mentorship and are encouraged to apply their learning and pitch new business ideas to the senior management.
In our department store operations, we provide the senior management with training sessions on digitalisation and its benefits for customer profiling and experience curation. The training was conducted in the forms of webinars, site visits, etc. Over 150 staff members were trained in 2018 and they were tasked with disseminating the new knowledge with other colleagues from their departments or stores.
We have invited external speakers to conduct training to heighten sustainability awareness across the Group. The training engaged more than 250 staff members and covered ESG risks, supply chain best practices, the “Prevention of Bribery Ordinance (Cap 201)” by the Hong Kong Independent Commission Against Corruption, and equal opportunity related legislation by the Equal Opportunities Commission. A bespoke internal training was also provided for the senior management of our department store business, connecting the major directions of the SV2030 with the retail market landscape in Mainland China, and inspiring participants to apply the vision to business strategies and operations.
FOSTERING ENTREPRENEURSHIPTo support the Group’s vision of expanding its business ecosystem in the realm of “cultural technologies” from digitally-enabled education to e-sports, multimedia and wellness, we call for talents with an entrepreneurial mindset to inject fresh perspectives into the Group and capture opportunities from fast-changing technologies and disruptive business models. We aim to attract bright millennial talents to join our ranks and nurture them to drive practical innovations.
A Entrepreneur Adventure Programme is one of our latest innovative talent acquisition initiatives, through which we aim to attract entrepreneurial talents from all over the world. Candidates participated in weekend hackathons and pitched business ideas for cultural technologies to our judging panels, which comprised both senior management and start-up experts. Outstanding candidates were offered positions with the Group on a full-time, part-time or consultancy basis to drive innovations. We have engaged nearly 300 participants through the programme.
New World Development Company LimitedAnnual Report 2018 83
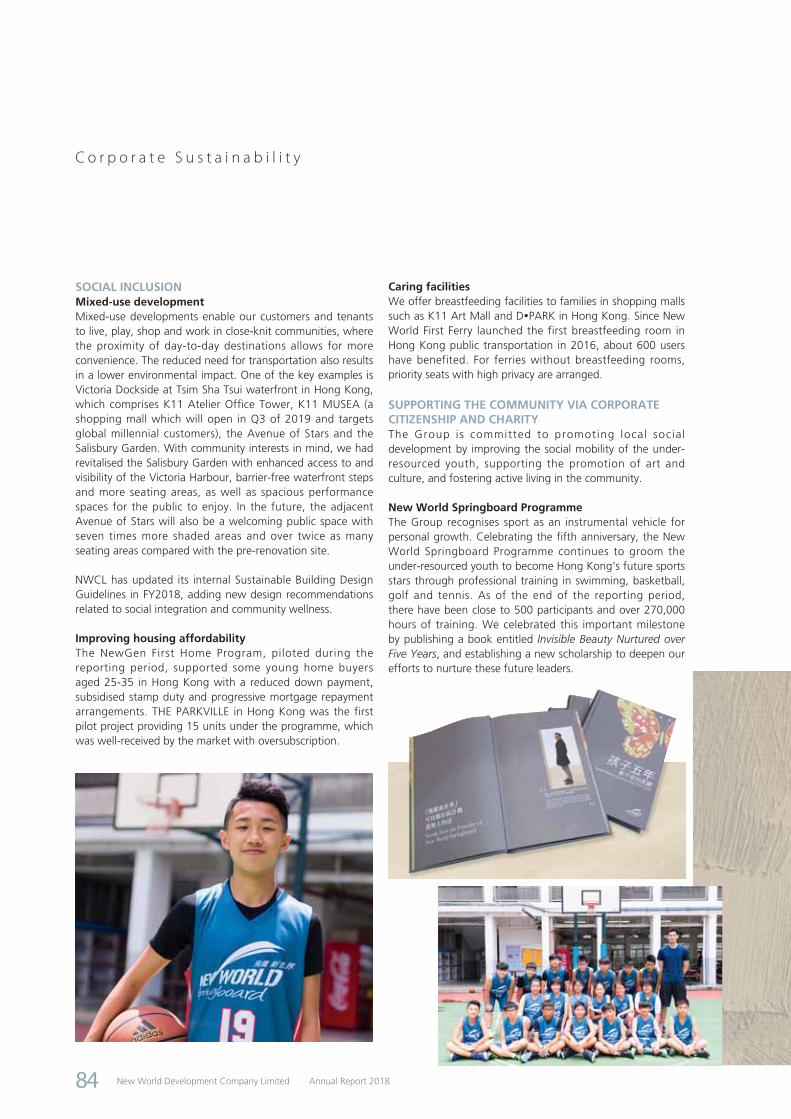
C o r p o r a t e S u s t a i n a b i l i t y
SOCIAL INCLUSIONMixed-use developmentMixed-use developments enable our customers and tenants to live, play, shop and work in close-knit communities, where the proximity of day-to-day destinations allows for more convenience. The reduced need for transportation also results in a lower environmental impact. One of the key examples is Victoria Dockside at Tsim Sha Tsui waterfront in Hong Kong, which comprises K11 Atelier Office Tower, K11 MUSEA (a shopping mall which will open in Q3 of 2019 and targets global millennial customers), the Avenue of Stars and the Salisbury Garden. With community interests in mind, we had revitalised the Salisbury Garden with enhanced access to and visibility of the Victoria Harbour, barrier-free waterfront steps and more seating areas, as well as spacious performance spaces for the public to enjoy. In the future, the adjacent Avenue of Stars will also be a welcoming public space with seven times more shaded areas and over twice as many seating areas compared with the pre-renovation site.
NWCL has updated its internal Sustainable Building Design Guidelines in FY2018, adding new design recommendations related to social integration and community wellness.
Improving housing affordabilityThe NewGen First Home Program, piloted during the reporting period, supported some young home buyers aged 25-35 in Hong Kong with a reduced down payment, subsidised stamp duty and progressive mortgage repayment arrangements. THE PARKVILLE in Hong Kong was the first pilot project providing 15 units under the programme, which was well-received by the market with oversubscription.
Caring facilitiesWe offer breastfeeding facilities to families in shopping malls such as K11 Art Mall and DPARK in Hong Kong. Since New World First Ferry launched the first breastfeeding room in Hong Kong public transportation in 2016, about 600 users have benefited. For ferries without breastfeeding rooms, priority seats with high privacy are arranged.
SUPPORTING THE COMMUNITY VIA CORPORATE CITIZENSHIP AND CHARITYThe Group is committed to promoting local social development by improving the social mobility of the under-resourced youth, supporting the promotion of art and culture, and fostering active living in the community.
New World Springboard ProgrammeThe Group recognises sport as an instrumental vehicle for personal growth. Celebrating the fifth anniversary, the New World Springboard Programme continues to groom the under-resourced youth to become Hong Kong‘s future sports stars through professional training in swimming, basketball, golf and tennis. As of the end of the reporting period, there have been close to 500 participants and over 270,000 hours of training. We celebrated this important milestone by publishing a book entitled Invisible Beauty Nurtured over Five Years, and establishing a new scholarship to deepen our efforts to nurture these future leaders.
New World Development Company Limited Annual Report 201884

C o r p o r a t e S u s t a i n a b i l i t y
Community sports eventsIn 2017, the iconic “M” Mark New World Harbour Race revitalised the historic cross-harbour race route from 40 years ago, which stretched from the Tsim Sha Tsui Public Pier to the Golden Bauhinia Square Public Pier at Wan Chai, Hong Kong. The race drew participation from 2,940 swimmers from around the globe. There were 17 young outstanding swimmers from the New World Springboard Programme participating in the race and 10 of which competed in the racing category.
We continued to sponsor the European Challenge Tour – Foshan Open 2017, which is one of the most significant sporting events in Guangdong and facilitates cultural exchanges between Guangdong and the world. In 2017, a total of 126 golfers were engaged. We also collaborated with local charitable organisations to host a charity walk for participants, as well as a charity sale: the proceeds were donated to under-resourced and hearing-impaired children, as well as to elderly people living alone.
Meanwhile, NWS Geo Hero Run in 2017 attracted over 1,500 runners who raced through the world-renowned Hong Kong UNESCO Global Geopark. No paper cups were provided, and recyclable and reusable cups were used at the water stations
along the race route. Runners were encouraged to bring their own bottles and cutlery. Recyclables were collected and sent to community recycling centre for proper processing afterwards, and fruit residue was sent to a non-profit organic farm for composting.
New World Development Company LimitedAnnual Report 2018 85

C o r p o r a t e S u s t a i n a b i l i t y
Hong Kong Golf & Tennis Academy Charity FoundationEstablished in 2014, the Hong Kong Golf & Tennis Academy Charity Foundation delivers coaching and educational programmes to facilitate the personal development of children and young people, inspiring them to lead active and healthy lives.
K11 Art FoundationThe K11 Art Foundation continues to incubate young contemporary artists and promotes public art education in Greater China. The Emerald City exhibition, which was open to the public between March and May 2018, brought together a kaleidoscope of contemporary artworks including paintings and sculptures to explore the natural and built environments through the lens of geometry. Its aim was to demonstrate how geometry shapes one’s conception of the world, and inspire visitors to look at the world beyond the confines of geometry. The exhibition engaged more than 7,000 visitors.
Culture for TomorrowCulture for Tomorrow is a non-profit organisation founded in 2017 to actualise design and architectural innovation. Its debut cross-cultural event, Hot is Cool: A Cultural Dialogue between Finland and Hong Kong, was held in December 2017. The event put together a Finnish sauna and a Hong Kong pavilion in a public space, inspiring visitors to reimagine these two culturally symbolic constructions and explore the social meanings behind them. A series of design exhibitions, cultural salons, creative workshops and reading and music performances was curated for the public, drawing about 10,000 visitors.
New World Development Company Limited Annual Report 201886
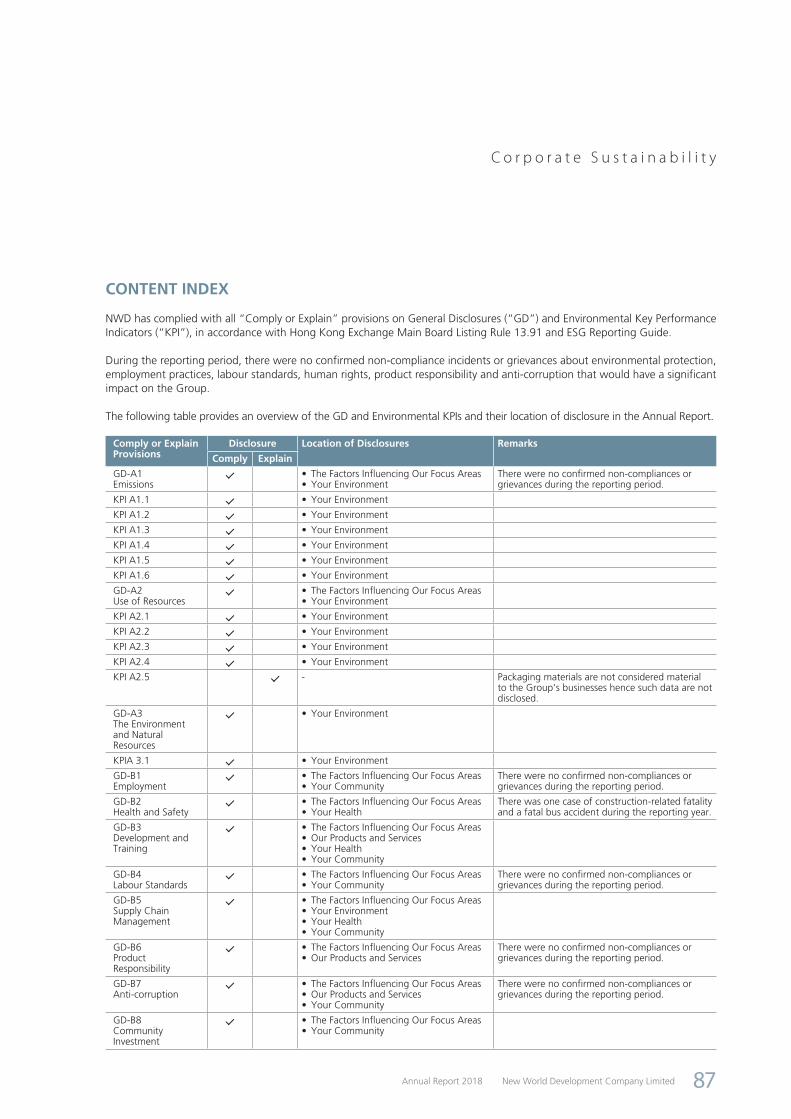
C o r p o r a t e S u s t a i n a b i l i t y
CONTENT INDEX
NWD has complied with all “Comply or Explain” provisions on General Disclosures (“GD”) and Environmental Key Performance Indicators (“KPI”), in accordance with Hong Kong Exchange Main Board Listing Rule 13.91 and ESG Reporting Guide.
During the reporting period, there were no confirmed non-compliance incidents or grievances about environmental protection, employment practices, labour standards, human rights, product responsibility and anti-corruption that would have a significant impact on the Group.
The following table provides an overview of the GD and Environmental KPIs and their location of disclosure in the Annual Report.
Comply or Explain Provisions
Disclosure Location of Disclosures Remarks
Comply Explain
GD-A1Emissions
• The Factors Influencing Our Focus Areas• Your Environment
There were no confirmed non-compliances or grievances during the reporting period.
KPI A1.1 • Your Environment
KPI A1.2 • Your Environment
KPI A1.3 • Your Environment
KPI A1.4 • Your Environment
KPI A1.5 • Your Environment
KPI A1.6 • Your Environment
GD-A2Use of Resources
• The Factors Influencing Our Focus Areas• Your Environment
KPI A2.1 • Your Environment
KPI A2.2 • Your Environment
KPI A2.3 • Your Environment
KPI A2.4 • Your Environment
KPI A2.5 - Packaging materials are not considered material to the Group’s businesses hence such data are not disclosed.
GD-A3The Environment and Natural Resources
• Your Environment
KPIA 3.1 • Your Environment
GD-B1Employment
• The Factors Influencing Our Focus Areas• Your Community
There were no confirmed non-compliances or grievances during the reporting period.
GD-B2Health and Safety
• The Factors Influencing Our Focus Areas• Your Health
There was one case of construction-related fatality and a fatal bus accident during the reporting year.
GD-B3Development and Training
• The Factors Influencing Our Focus Areas• Our Products and Services• Your Health• Your Community
GD-B4Labour Standards
• The Factors Influencing Our Focus Areas• Your Community
There were no confirmed non-compliances or grievances during the reporting period.
GD-B5Supply Chain Management
• The Factors Influencing Our Focus Areas• Your Environment• Your Health• Your Community
GD-B6Product Responsibility
• The Factors Influencing Our Focus Areas• Our Products and Services
There were no confirmed non-compliances or grievances during the reporting period.
GD-B7Anti-corruption
• The Factors Influencing Our Focus Areas• Our Products and Services• Your Community
There were no confirmed non-compliances or grievances during the reporting period.
GD-B8Community Investment
• The Factors Influencing Our Focus Areas• Your Community
New World Development Company LimitedAnnual Report 2018 87
New World Development Company Limited Annual Report 201888
C o r p o r a t e I n f o r m a t i o n
BOARD OF DIRECTORSExecutive DirectorsDr. Cheng Kar-Shun, Henry GBM GBS (Chairman)Dr. Cheng Chi-Kong, Adrian JP (Executive Vice‐chairman and General Manager)Mr. Cheng Chi-HengMs. Cheng Chi-Man, SoniaMr. Au Tak-CheongMr. Sitt Nam-HoiMr. So Chung-Keung, Alfred
Non-executive DirectorsMr. Doo Wai-Hoi, William JP (Non‐executive Vice-chairman)Mr. Cheng Kar-Shing, PeterMs. Ki Man-Fung, Leonie GBS SBS JP
Independent Non-executive DirectorsMr. Yeung Ping-Leung, HowardMr. Cha Mou-Sing, Payson JPMr. Cha Mou-Zing, Victor (Alternate Director to Mr. Cha Mou-Sing, Payson)Mr. Ho Hau-Hay, HamiltonMr. Lee Luen-Wai, John BBS JPMr. Liang Cheung-Biu, ThomasMr. Ip Yuk-Keung
COMPANY SECRETARYMr. Wong Man-Hoi
AUDITORPricewaterhouseCoopers
SOLICITORSWoo, Kwan, Lee & LoKao, Lee & YipVincent T.K. Cheung, Yap & CoIu, Lai & LiEversheds
SHARE REGISTRAR AND TRANSFER OFFICETricor Tengis Limited Level 22, Hopewell Centre,183 Queen’s Road East,Hong Kong
REGISTERED OFFICE30/F., New World Tower,
18 Queen’s Road Central, Hong Kong
Tel: (852) 2523 1056
Fax: (852) 2810 4673
PRINCIPAL BANKERSAgricultural Bank of China
Bank of China (Hong Kong)
Bank of Communications
Bank of East Asia
China Construction Bank (Asia)
China Development Bank
China Merchants Bank
Citibank N.A.
DBS Bank
Hang Seng Bank
Industrial and Commercial Bank of China (Asia)
Mizuho Bank
MUFG Bank, Ltd.
Nanyang Commercial Bank
Sumitomo Mitsui Banking Corporation
Standard Chartered Bank
The Hongkong and Shanghai Banking Corporation
STOCK CODEHong Kong Stock Exchange 0017
Reuters 0017.HK
Bloomberg 17 HK
INFORMATION FOR INVESTORSFor more information about the Group,
please contact the Investor Relations Department of
the Company at:
30/F., New World Tower,
18 Queen’s Road Central,
Hong Kong
Tel: (852) 2523 1056
Fax: (852) 2810 4673
e-mail: [email protected]
WEBSITEwww.nwd.com.hk
New World Development Company LimitedAnnual Report 2018 89
Report of the Directors
The Directors have pleasure in presenting their annual report and financial statements for the year ended 30 June 2018.
GROUP ACTIVITIES
The principal activities of the Company remain investment holding and property development and investment. The principal activities of the principal subsidiaries, joint ventures and associated companies are shown in notes 49, 50 and 51 to the financial statements.
RESULTS AND APPROPRIATION
The results of the Group for the year ended 30 June 2018 are set out in the consolidated income statement on page 128 of this annual report.
The Directors have resolved to recommend a final cash dividend for the year ended 30 June 2018 of HK$0.34 per share (2017: HK$0.33 per share) to shareholders whose names appear on the register of members of the Company on 23 November 2018. Together with the interim dividend of HK$0.14 per share (2017: HK$0.13 per share), the total dividend for the financial year ended 30 June 2018 is HK$0.48 per share (2017: HK$0.46 per share).
Subject to the passing of the relevant resolutions at the annual general meeting of the Company to be held on 20 November 2018, it is expected that the proposed final dividend will be distributed to shareholders on or about 20 December 2018.
BUSINESS REVIEW
The business review of the Group for the year ended 30 June 2018 is set out in the sections headed “Executive Vice-chairman’s Report” on pages 20 to 47, “Management Discussion and Analysis” on pages 113 to 121, “Corporate Sustainability” on pages 64 to 87 and “Risk Factors” on pages 241 to 253 of this annual report.
SHARES ISSUED
During the year, the Company has issued shares as follows:
1 As a result of the exercise of share options under the share option scheme of the Company, a total of 53,197,038 shares of the Company, fully paid, were issued for a total consideration of HK$490,174,761.79.
2 The Company declared final dividend for the year ended 30 June 2017 and interim dividend for the six months ended 31 December 2017 in cash (with scrip option) during the year. Accordingly, a total of 357,226,189 shares of the Company, fully paid, were issued for a total consideration of HK$3,802,109,669.
Details of the shares issued during the year are set out in note 36 to the financial statements.
DEBENTURES ISSUED
The Group has not issued any debenture during the year.
EQUITY-LINKED AGREEMENTS
Save for the share option schemes of the Group as set out on pages 101 to 109, no equity-linked agreements were entered into by the Group, or existed during the year.
DISTRIBUTABLE RESERVES
Distributable reserves of the Company as at 30 June 2018, calculated under Part 6 of the Hong Kong Companies Ordinance (Cap. 622), amounted to HK$24,041.3 million (2017: HK$23,080.9 million).
FIVE-YEAR FINANCIAL SUMMARY
A summary of the results and the assets and liabilities of the Group for the last five financial years is set out on pages 239 and 240.

New World Development Company Limited Annual Report 201890
R e p o r t o f t h e D i r e c t o r s
EMPLOYEES AND REMUNERATION POLICIES
At 30 June 2018, over 45,000 staff was employed by entities under the Group’s management. Remuneration policies are reviewed annually. Remuneration and bonuses are awarded to employees based on individual performances and are in line with market practices. Education subsidies are granted to employees who are taking job-related courses. Periodic in-house training programs are also offered. Under the share options schemes of the Company and all the listed subsidiaries of the Group, options may be granted to certain Directors of the Company and certain employees of the Group to subscribe for shares in the Company and/or the respective subsidiaries.
PURCHASE, SALE OR REDEMPTION OF LISTED SECURITIES
During the year, the Company bought back a total of 11,460,000 shares of the Company on the Hong Kong Stock Exchange at an aggregate consideration of HK$130,537,760 (before expenses). All such bought back shares were subsequently cancelled during the year. As at 30 June 2018, the total number of shares of the Company in issue was 10,214,184,851.
Details of the shares bought back during the year are as follows:
MonthNumber of shares
bought back Price paid per share
Aggregate consideration
(before expenses)Highest Lowest
HK$ HK$ HK$
September 2017 4,000,000 11.24 11.02 44,473,440
October 2017 2,000,000 11.96 11.80 23,801,960
November 2017 1,797,000 11.80 11.70 21,144,660
December 2017 1,663,000 10.98 10.88 18,200,660
June 2018 2,000,000 11.50 11.28 22,917,040
11,460,000 130,537,760
The above share buy-backs were made with a view to enhancing the earnings per share of the Company and thus benefit the shareholders as a whole.
New World China Land Limited (“NWCL”) redeemed the RMB3,000.0 million (equivalent to approximately HK$3,614.5 million) 5.5% bonds due 2018 (stock code: 85914) at principal amount upon maturity on 6 February 2018.
During the year, the Company has not redeemed any of its listed securities. Save as disclosed above, neither the Company nor any of its subsidiaries has purchased or sold any of the Company’s listed securities during the year.
DONATIONS
The Group made charitable and other donations during the year of HK$101.3 million (2017: HK$92.9 million).
MAJOR ACQUISITIONS AND DISPOSALS
1 On 27 October 2017, New World Development (China) Limited (“NWD (China)”), an indirect wholly owned subsidiary of the Company, entered into a sale and purchase agreement with Oriental Triumph Inc. (“Oriental Triumph”), a company wholly owned by Mr. Doo Wai-Hoi, William, the Non-executive Vice-chairman of the Company, and under which NWD (China) agreed to sell, and Oriental Triumph agreed to purchase the entire issued share capital of Ramada Property Ltd., which together with its subsidiaries owns and operates the Shanghai Ramada Plaza, New World Shanghai Hotel and pentahotel Shanghai, at a consideration of RMB1.85 billion (equivalent to approximately HK$2.2 billion), subject to customary closing adjustment (the “Disposal”). The Disposal was completed on 28 March 2018.
2 On 11 January 2018, Fortland Ventures Limited, an indirect wholly owned subsidiary of NWS Holdings Limited (“NWSH”) entered into a placing agreement for the placing of 208,000,000 issued H shares of Beijing Capital International Airport Co., Ltd. (“BCIA”) at the placing price of HK$11.35 per H share of BCIA (the “Placing”). Closing of the Placing took place on 16 January 2018 and thereafter, NWSH’s interest in BCIA’s total issued H shares reduced from approximately 23.86% to approximately 12.79%.

New World Development Company LimitedAnnual Report 2018 91
R e p o r t o f t h e D i r e c t o r s
CONNECTED TRANSACTIONS
Connected transactions of the Company during the year and up to the date of this report are set out on pages 96 to 100.
RULES 13.20 AND 13.22 OF THE LISTING RULES
The disclosure pursuant to Rules 13.20 and 13.22 of the Listing Rules is set out on page 112.
DIRECTORS
The Directors of the Company during the year and up to the date of this report are:
Executive DirectorsDr. Cheng Kar-Shun, Henry GBM GBS (Chairman)Dr. Cheng Chi-Kong, Adrian JP (Executive Vice-chairman & General Manager)Mr. Cheng Chi-HengMs. Cheng Chi-Man, SoniaMr. Au Tak-CheongMr. Sitt Nam-Hoi (appointed on 1 June 2018)Mr. So Chung-Keung, Alfred (appointed on 1 June 2018)
Non-executive DirectorsMr. Doo Wai-Hoi, William JP (Non-executive Vice-chairman)Mr. Cheng Kar-Shing, PeterMs. Ki Man-Fung, Leonie GBS SBS JP (re-designated on 1 June 2018)
Independent Non-executive DirectorsMr. Yeung Ping-Leung, HowardMr. Cha Mou-Sing, Payson JPMr. Cha Mou-Zing, Victor (Alternate Director to Mr. Cha Mou-Sing, Payson)Mr. Ho Hau-Hay, HamiltonMr. Lee Luen-Wai, John BBS JPMr. Liang Cheung-Biu, ThomasMr. Ip Yuk-Keung (appointed on 1 June 2018)
In accordance with Article 94 of the Company’s Articles of Association, Mr. Sitt Nam-Hoi, Mr. So Chung-Keung, Alfred and Mr. Ip Yuk-Keung retire and, being eligible, offer themselves for re-election.
In accordance with Article 103(A) of the Company’s Articles of Association, Dr. Cheng Kar-Shun, Henry, Mr. Doo Wai-Hoi, William, Mr. Cha Mou-Sing, Payson, Mr. Cheng Kar-Shing, Peter, Mr. Liang Cheung-Biu, Thomas and Ms. Cheng Chi-Man, Sonia shall retire by rotation and, being eligible, offer themselves for re-election.
No Director has a service contract which is not determinable by the Company within one year without payment of compensation other than statutory compensation.
A list of names of all the directors who have served on the boards of the Company’s subsidiaries during the year is available on the Company’s website at www.nwd.com.hk.
AUDIT COMMITTEE
An Audit Committee has been established and the members of the Committee as at the date of this report are Mr. Lee Luen-Wai, John, Mr. Cha Mou-Sing, Payson, Mr. Yeung Ping-Leung, Howard, Mr. Ho Hau-Hay, Hamilton, Mr. Liang Cheung-Biu, Thomas and Mr. Ip Yuk-Keung. The principal responsibilities of the Audit Committee include the review and supervision of the Group’s financial reporting process and risk management (including but not limited to business, operation as well as environmental, social and governance related risks) and internal control systems.
New World Development Company Limited Annual Report 201892
R e p o r t o f t h e D i r e c t o r s
DIRECTORS’ INTERESTS IN TRANSACTIONS, ARRANGEMENTS OR CONTRACTS
Save as disclosed in the section headed “Connected Transactions” on pages 96 to 100 of this annual report and contracts amongst group companies, no other transactions, arrangements or contracts of significance to which the Company or any of its subsidiaries was a party and in which a Director of the Company and the Director’s connected entity had a material interest, whether directly or indirectly, subsisted at the end of the year or at any time during the year.
DIRECTORS’ INTERESTS IN SHARES, UNDERLYING SHARES AND DEBENTURES
As at 30 June 2018, interests of the Directors in shares, underlying shares and debentures of the Company and its associated corporations which were recorded in the register to be kept by the Company under Section 352 of the Securities and Futures Ordinance (“SFO”) are set out on pages 101 to 111.
PERMITTED INDEMNITY PROVISION
The Company’s Articles of Association provides that every Director is entitled to be indemnified out of the assets of the Company against all losses or liabilities which he/she may sustain or incur in or about the execution of the duties of his/her office or otherwise in relation thereto.
The Company and its listed subsidiaries have taken out and maintained directors’ liability insurance throughout the year, which provides appropriate cover for the Directors and directors of the subsidiaries of the Group.
DIRECTORS’ INTERESTS IN COMPETING BUSINESSES
During the year, according to the Listing Rules, the following Directors have interests in the following businesses which are considered to compete or are likely to compete, either directly or indirectly, with the businesses of the Group other than those businesses where the Directors of the Company were appointed as directors to represent the interests of the Company and/or the Group:
Businesses which are considered to compete or likely to compete with the businesses of the Group
Nature of interest of the Director in the entityName of Director Name of entity Description of businesses
Dr. Cheng Kar-Shun, Henry Chow Tai Fook Enterprises Limited (“CTF”) group of companies
Property investment and development, hotel operations, commercial aircraft leasing, aircraft trading and healthcare investment
Director
FSE Holdings Limited group of companies
Property and carpark management and landscaping
Shareholder
Supreme Harvest Development Limited group of companies
Property investment and development
Director
Silver City International Limited group of companies
Property investment and food and beverage operations
Director
Sunshine Dragon Group Limited group of companies
Property investment Director

New World Development Company LimitedAnnual Report 2018 93
R e p o r t o f t h e D i r e c t o r s
Businesses which are considered to compete or likely to compete with the businesses of the Group
Nature of interest of the Director in the entityName of Director Name of entity Description of businesses
Mr. Doo Wai-Hoi, William Ace Action Ltd. group of companies Property investment Director and shareholder
Amelia Gold Limited group of companies
Property investment Director and shareholder
Fortune Success Limited group of companies
Property investment Director and shareholder
FSE Holdings Limited group of companies
Property and carpark management and landscaping
Shareholder
Fung Seng Enterprises Investment Company Limited group of companies
Property investment Director and shareholder
Fung Seng Enterprises Limited group of companies
Property investment and management
Director and shareholder
Golden Wealth Investment Limited group of companies
Property investment and development
Director and shareholder
Lifestyle International Holdings Limited group of companies
Department stores operations and property investment
Director
Oriental Triumph Inc. group of companies
Property and hotel investment Director and shareholder
Silver City International Limited group of companies
Property investment and food and beverage operations
Director and shareholder
Silver Success Company Limited group of companies
Hotel operations Director and shareholder
Sunshine Dragon Group Limited group of companies
Property investment Director and shareholder
Dr. Cheng Chi-Kong, Adrian Cheung Hung Development (Holdings) Limited
Property investment and development
Director
CTF group of companies Property investment and development, hotel operations, commercial aircraft leasing, aircraft trading and healthcare investment
Director
Grandhope Properties Limited Property investment Director and shareholder
New Century Healthcare Holding Co. Limited group of companies
Healthcare investment Director
Mr. Cheng Kar-Shing, Peter CTF group of companies Property investment and development, hotel operations, commercial aircraft leasing, aircraft trading and healthcare investment
Director
Long Vocation Investments Limited group of companies
Property investment Director and shareholder
Mr. Cheng Chi-Heng CTF group of companies Property investment and development, hotel operations, commercial aircraft leasing, aircraft trading and healthcare investment
Director
DIRECTORS’ INTERESTS IN COMPETING BUSINESSES (CONTINUED)

New World Development Company Limited Annual Report 201894
R e p o r t o f t h e D i r e c t o r s
DIRECTORS’ INTERESTS IN COMPETING BUSINESSES (CONTINUED)
As the Board of Directors of the Company is independent of the boards of the above-mentioned entities and none of the above Directors can control the Board of the Company, the Group is therefore capable of carrying on its businesses independently of, and at arm’s length from the businesses of these entities.
MANAGEMENT CONTRACTS
No contracts concerning the management and administration of the whole or any substantial part of the business of the Company were entered into or existed during the year.
DIRECTORS’ RIGHTS TO ACQUIRE SHARES OR DEBENTURES
Save as disclosed under the section headed “Share Option Schemes” below, at no time during the year was the Company or any of its subsidiaries a party to any arrangements to enable the Directors of the Company or chief executives or any of their spouse or children under the age of 18 to acquire benefits by means of the acquisition of shares in, or debentures of, the Company or any other body corporate.
SHARE OPTION SCHEMES
Share option schemes of the Group are set out on pages 101 to 109.
SUBSTANTIAL SHAREHOLDERS’ INTERESTS IN SECURITIES
As at 30 June 2018, the interests or short positions of substantial shareholders (as defined in the Listing Rules) in the shares and underlying shares of the Company as recorded in the register required to be kept under Section 336 of the SFO were as follows:
Long positions in shares
Number of shares heldApproximate
% of shareholdingName
Beneficial interests
Corporate interests Total
Cheng Yu Tung Family (Holdings) Limited (“CYTFH”)(1) – 4,535,634,444 4,535,634,444 44.41
Cheng Yu Tung Family (Holdings II) Limited (“CYTFH-II”)(2) – 4,535,634,444 4,535,634,444 44.41
Chow Tai Fook Capital Limited (“CTFC”)(3) – 4,535,634,444 4,535,634,444 44.41
Chow Tai Fook (Holding) Limited (“CTFHL”)(4) – 4,535,634,444 4,535,634,444 44.41
Chow Tai Fook Enterprises Limited (“CTF”)(5) 4,123,491,293 412,143,151 4,535,634,444 44.41
Notes:
(1) CYTFH holds 48.98% direct interest in CTFC and is accordingly deemed to have an interest in the shares deemed to be interested by CTFC.
(2) CYTFH-II holds 46.65% direct interest in CTFC and is accordingly deemed to have an interest in the shares deemed to be interested by CTFC.
(3) CTFC holds 81.03% direct interest in CTFHL and is accordingly deemed to have an interest in the shares deemed to be interested by CTFHL.
(4) CTFHL holds 100% direct interest in CTF and is accordingly deemed to have an interest in the shares interested by or deemed to be interested by CTF.
(5) CTF together with its subsidiaries.
Save as disclosed above, no other person was recorded in the register kept pursuant to section 336 of the SFO having an interest in 10.0% or more of the issued share capital of the Company as at 30 June 2018.
New World Development Company LimitedAnnual Report 2018 95
R e p o r t o f t h e D i r e c t o r s
OTHER PERSON’S INTERESTS IN SECURITIES
As at 30 June 2018, the interests or short positions of persons (other than Directors or chief executive or substantial shareholders (as defined in the Listing Rules) of the Company) in the shares or underlying shares of the Company as recorded in the register required to be kept under Section 336 of the SFO were as follows:
Long positions in Shares
Name Capacity
Number of shares/
underlying shares held Total
Approximate % of
shareholding
BlackRock, Inc. Interest of controlled corporation 538,886,286 538,886,286(1) 5.28
Short positions in Shares
Name Capacity
Number of shares/
underlying shares held Total
Approximate % of
shareholding
BlackRock, Inc. Interest of controlled corporation 18,531,618 18,531,618(2) 0.18
Notes:
(1) The interests included interests in 661,000 underlying shares through its holding of certain cash settled unlisted derivatives.
(2) The interests included interests in 7,649,431 underlying shares through its holding of certain cash settled unlisted derivatives.
Save as disclosed above, there is no other interest recorded in the register that is required to be kept under section 336 of the SFO as at 30 June 2018.
SUFFICIENCY OF PUBLIC FLOAT
According to information that is available to the Company, the percentage of the Company’s shares which are in the hands of the public exceeds 25.0% of the Company’s total number of issued shares.
MAJOR CUSTOMERS AND SUPPLIERS
During the year, less than 30.0% of the Group’s turnover and less than 30.0% of the Group’s purchases were attributable to the Group’s five largest customers and five largest suppliers respectively.
AUDITOR
The financial statements have been audited by Messrs. PricewaterhouseCoopers, who retire and, being eligible, offer themselves for re-appointment.
On Behalf of the Board
Dr. Cheng Kar-Shun, HenryChairmanHong Kong, 20 September 2018

New World Development Company Limited Annual Report 201896
R e p o r t o f t h e D i r e c t o r s
CONNECTED TRANSACTIONS
(1) The Company and Chow Tai Fook Enterprises Limited (“CTF”), severally in the proportions of 64.0% and 36.0%, have on 29 August 1995 issued an indemnity (the “Indemnity”) to Renaissance Hotel Group N.V. (“RHG”), a former subsidiary of New World Hotels (Holdings) Limited (“NWHH”), which is now an independent third party, in respect of any obligations of RHG or its subsidiaries may have in respect of certain lease payment obligations under originally 25 leases or guarantees of leases (now one lease remaining) held by Hotel Property Investments (B.V.I.) Ltd. (“HPI”) and its subsidiaries.
On 25 July 1997, NWHH sold its entire interests in HPI to CTF Holdings Ltd.(“CTFH”), a company then controlled by Dr. Cheng Kar-Shun, Henry and Mr. Doo Wai-Hoi, William (“Mr. Doo”), and currently wholly owned by CTF. Under the sale, the Indemnity will continue. Arrangements have therefore been entered into whereby CTF will counter-indemnify the Company fully against any liability arising under the Indemnity in respect of the said lease obligations and guarantees of leases. It is presently estimated that the maximum liability of the Company under the Indemnity will be approximately US$2.8 million (equivalent to approximately HK$21.7 million) per annum. Up to the date of this report, no payment has ever been made by the Company or CTF under the Indemnity.
(2) On 22 March 2012, New World Department Store China Limited (“NWDS”) and Chow Tai Fook Jewellery Group Limited (“CTFJ”) entered into a master concessionaire counter agreement (the “Master Concessionaire Counter Agreement”) commencing from 24 April 2012 up to and including 30 June 2014, pursuant to which members of the NWDS Group (i.e. NWDS and its subsidiaries) and the CTFJ Group (i.e. CTFJ and its subsidiaries) may from time to time enter into definitive concessionaire agreements in relation to any transactions arising from the concessionaire arrangements or rental agreements in respect of retailing counters for the sale of jewellery products and watches by the CTFJ Group at properties in the PRC owned by, or leased to the NWDS Group or at which the NWDS Group operates its business.
The Master Concessionaire Counter Agreement will be automatically renewed for a successive period of three years after the initial term or subsequent renewal term subject to compliance with relevant requirements of the Listing Rules.
As CTFJ is a fellow subsidiary of CTF which is a substantial shareholder of the Company, CTFJ is therefore a connected person of the Company under the Listing Rules. Accordingly, the entering into of the Master Concessionaire Counter Agreement and all the transactions contemplated thereunder constitute continuing connected transactions for the Company under the Listing Rules.
Upon expiry of its initial term, the Master Concessionaire Counter Agreement was automatically renewed for three years commencing from 1 July 2014. In anticipation of the expiry of the first renewal term on 30 June 2017, NWDS and CTFJ agreed to further renew the Master Concessionaire Counter Agreement for further three years commencing from 1 July 2017 up to and including 30 June 2020. Details of the second renewal of the Master Concessionaire Counter Agreement and the annual caps set for each of the three financial years ending 30 June 2020 were set out in the announcement of the Company dated 10 April 2017.
For the year ended 30 June 2018, the aggregate amount of the transactions under the Master Concessionaire Counter Agreement amounted to approximately RMB65.6 million (equivalent to approximately HK$79.0 million), which is within the annual cap of RMB129.551 million (equivalent to approximately HK$156.1 million).

New World Development Company LimitedAnnual Report 2018 97
R e p o r t o f t h e D i r e c t o r s
CONNECTED TRANSACTIONS (CONTINUED)
(3) On 10 April 2017, the Company and Mr. Doo entered into a master services agreement (the “Mr. Doo MSA”) for a term of three years commencing from 1 July 2017 up to and including 30 June 2020 in respect of the provision of certain operational and rental services which include contracting services, cleaning and landscaping services, facilities management services, property management services, security and guarding services and rental services between members of the Group and members of the Services Group (being Mr. Doo and any company in the equity capital of which Mr. Doo is or will be directly or indirectly interested so as to exercise or control the exercise of 30.0% (or such other amount as may from time to time be specified in the Code on Takeovers and Mergers (the “Takeovers Code”) as being the level for triggering a mandatory general offer) or more of the voting power at general meetings, or to control the composition of a majority of the board of directors and any other company which is its subsidiary). Subject to compliance with the relevant requirements under the Listing Rules, upon expiration of the initial term or subsequent renewal term, the Mr. Doo MSA will be automatically renewed for a successive period of three years thereafter (or such other period permitted under the Listing Rules). The Mr. Doo MSA and the annual caps set for each of the three financial years ending 30 June 2020 were approved by the independent shareholders of the Company on 26 May 2017.
Mr. Doo is the Non-executive Vice-chairman of the Company and a director of certain subsidiaries of the Company, and hence a connected person of the Company under the Listing Rules. Accordingly, the entering into of the Mr. Doo MSA and all the transactions contemplated thereunder constitute continuing connected transactions for the Company under the Listing Rules.
For the year ended 30 June 2018, the aggregate amount of the transactions under the Mr. Doo MSA amounted to approximately HK$1,728.3 million, which is within the annual cap of HK$3,699.6 million.
(4) On 10 April 2017, the Company and CTF entered into a master services agreement (the “CTF MSA”) for a term of three years commencing from 1 July 2017 up to and including 30 June 2020 in respect of the provision of services including administrative services, contracting services, general and rental services, and project management and consultancy services between members of the Group and members of the CTF Services Group (being CTF, (a) any other company which is its subsidiary or holding company or is a fellow subsidiary of any such holding company, and/or (b) any other company in the equity capital of which CTF and such other companies referred to in (a) above taken together are directly or indirectly interested so as to exercise or control the exercise of 30.0% (or such other amount as may from time to time be specified in the Takeovers Code as being the level for triggering a mandatory general offer) or more of the voting power at general meetings or to control the composition of a majority of the board of directors, and any other company which is its subsidiary, but excluding members of the Group).
Subject to compliance with the relevant requirements under the Listing Rules, upon expiration of the initial term or subsequent renewal term, the CTF MSA will be automatically renewed for a successive period of three years thereafter (or such other period permitted under the Listing Rules). Details of the CTF MSA and the annual caps set for each of the three financial years ending 30 June 2020 were set out in the announcement of the Company dated 10 April 2017.
As CTF is a connected person of the Company, the entering into of the CTF MSA and all the transactions contemplated thereunder constitute continuing connected transactions for the Company under the Listing Rules.
For the year ended 30 June 2018, the aggregate amount of the transactions under the CTF MSA amounted to approximately HK$557.9 million, which is within the annual cap of HK$1,708.6 million.
New World Development Company Limited Annual Report 201898
R e p o r t o f t h e D i r e c t o r s
CONNECTED TRANSACTIONS (CONTINUED)
(5) On 11 April 2014, the Company and CTFJ entered into a master leasing agreement (the “Master Leasing Agreement”) regarding the leasing of premises between members of the Group and members of the CTFJ Group for an initial term of three years commencing from 1 July 2014. Subject to compliance with the relevant requirements under the Listing Rules, upon expiration of the initial term or subsequent renewal term, the Master Leasing Agreement will be automatically renewed for a successive period of three years thereafter.
As CTFJ is a fellow subsidiary of CTF which is a substantial shareholder of the Company, CTFJ is therefore a connected person of the Company under the Listing Rules. Accordingly, the entering into of the Master Leasing Agreement and all the transactions contemplated thereunder constitute continuing connected transactions for the Company under the Listing Rules.
Upon expiry of its initial term, the Master Leasing Agrement was automatically renewed in accordance with its terms and conditions for three years commencing from 1 July 2017 up to and including 30 June 2020. Details of the renewal of the Master Leasing Agreement and the annual caps set for each of the three financial years ending 30 June 2020 were set out in the announcement of the Company dated 13 April 2017.
For the year ended 30 June 2018, the aggregate amount of the transactions under the Master Leasing Agreement amounted to approximately HK$98.5 million, which is within the annual cap of HK$125.0 million.
(6) On 19 March 2013, NWCL and CTFJ entered into a master purchase agreement (the “Master Purchase Agreement”) to provide a framework for the transactions between members of the NWCL Group (i.e. NWCL and its subsidiaries) and members of the CTFJ Group in respect of (i) the purchases of gold products by the relevant members of the NWCL Group from the relevant members of the CTFJ Group; (ii) the purchases of gift vouchers issued or to be issued by the CTFJ Group (“CTFJ Gift Vouchers”) by relevant members of the NWCL Group from the relevant members of the CTFJ Group and the use of CTFJ Gift Vouchers by holders thereof given by the NWCL Group as payment of purchase of goods at the stores where the CTFJ Group operates its business; and (iii) the use of gift vouchers issued or to be issued by the NWCL Group (“NWCL Gift Vouchers”) by customers of the NWCL Group as payment of purchase of goods at the stores where the CTFJ Group operates its business and the settlement of the relevant value represented by such NWCL Gift Vouchers (with rebates) between relevant members of the NWCL Group and the CTFJ Group.
The Master Purchase Agreement commenced from 19 March 2013 up to and including 30 June 2015, and will be automatically renewed for a successive period of three years upon the expiration of the initial term or subsequent renewal term subject to compliance with relevant requirements of the Listing Rules.
As CTFJ is a fellow subsidiary of CTF which is a substantial shareholder of the Company, CTFJ is therefore a connected person of the Company under the Listing Rules. Accordingly, the entering into of the Master Purchase Agreement and all the transactions contemplated thereunder constitute continuing connected transactions for the Company under the Listing Rules.
The Master Purchase Agreement was automatically renewed in accordance with its terms and conditions for further three years from 1 July 2015 to 30 June 2018.
For the year ended 30 June 2018, the aggregate amount of the transactions under the Master Purchase Agreement amounted to approximately HK$1.3 million, which is within the annual cap of HK$241.0 million.
The Master Purchase Agreement was further automatically renewed for three years commencing from 1 July 2018 up to and including 30 June 2021. As the annual cap amount for the transactions under the Master Purchase Agreement for each of the three financial years ending 30 June 2021 is de minimis, the renewal of the Master Purchase Agreement is fully exempt from the reporting, announcement and independent shareholders’ approval requirements under the Listing Rules.

New World Development Company LimitedAnnual Report 2018 99
R e p o r t o f t h e D i r e c t o r s
CONNECTED TRANSACTIONS (CONTINUED)
(7) On 10 April 2017, the Company and CTF entered into a master hotel management services agreement (the “Master Hotel Management Services Agreement”) regarding the provision of hotel management and consultancy services by members of the CTF Group to members of the Group. The Master Hotel Management Services Agreement is for a term of 10 years commencing from 1 July 2017 up to and including 30 June 2027 and will be automatically renewed for a further term of 10 years upon expiration of the initial term subject to compliance with the relevant requirements under the Listing Rules. Details of the Master Hotel Management Services Agreement and the annual caps set for each of the three financial years ending 30 June 2020 were set out in the announcement of the Company dated 10 April 2017.
As CTF is a connected person of the Company, the entering into of the Master Hotel Management Services Agreement and all the transactions contemplated thereunder constitute continuing connected transactions for the Company under the Listing Rules.
For the year ended 30 June 2018, the aggregate amount of the transactions under the Master Hotel Management Services Agreement amounted to approximately HK$112.2 million, which is within the annual cap of HK$136.4 million.
(8) On 29 September 2017, (i) Smart Future Investments Limited (“Smart Future”, an indirect wholly owned subsidiary of the Company) and Healthcare Assets Management Limited (“HAML”) entered into a subscription agreement (the “Subscription Agreement”), pursuant to which Smart Future agreed to subscribe for and HAML agreed to allot and issue, four shares, representing 40.0% of the enlarged issued share capital of HAML, at a subscription price of HK$10,177,194, on terms and subject to the conditions set out in the Subscription Agreement (the “Subscription”); and (ii) CTF, Healthcare Ventures Holdings Limited (“Healthcare Ventures”, a direct wholly owned subsidiary of CTF), New World Strategic Investment Limited (“NWSI”, a direct wholly owned subsidiary of the Company), Smart Future, NWS Service Management Limited (“NWS Service”, a direct wholly owned subsidiary of NWS Holdings Limited), Dynamic Ally Limited (“Dynamic Ally”, an indirect wholly owned subsidiary of NWS Service) and HAML entered into an amended and restated joint venture agreement (“Amended and Restated JV Agreement”) upon completion of the Subscription to regulate the respective rights and obligations of Healthcare Ventures, Smart Future and Dynamic Ally towards the management of HAML. The Subscription was completed on 29 September 2017.
Prior to the completion of the Subscription, HAML was owned as to 50.0% by Healthcare Ventures and 50.0% by Dynamic Ally. A joint venture agreement was entered into between CTF, Healthcare Ventures, NWS Service, Dynamic Ally and HAML on 15 December 2016. Immediately after completion of the Subscription, HAML is owned as to 30.0%, 40.0% and 30.0% by Healthcare Ventures, Smart Future and Dynamic Ally, respectively.
The total amount of investment by Healthcare Ventures, Smart Future and Dynamic Ally to HAML amounted to HK$780.0 million. Initial investment of HK$63.0 million had been made by each of Healthcare Ventures and Dynamic Ally towards HAML. HK$10,177,194 has been contributed by way of capital injection and HK$77,333,333 has been contributed by way of interest-free shareholder’s loan by Smart future on the date of completion of the Subscription, The remaining amount shall be contributed by the shareholders of HAML by way of capital injection and/or shareholder’s loan in proportion to their shareholding interests in HAML on an as-needed basis pursuant to the Amended and Restated JV Agreement.
HAML shall be an investment holding company and its business shall be the investment in, and operation and management of primary healthcare facilities (predominantly clinics and medical centres) located in Asia, with primary focus in the PRC and Hong Kong.
For reasons stated above, CTF is a connected person of the Company. Prior to the completion of the Subscription, CTF indirectly controls more than 30.0% interest in HAML. HAML is therefore deemed as an associate of CTF and a connected person of the Company. Healthcare Ventures is a direct wholly owned subsidiary of CTF and is therefore deemed as an associate of CTF and a connected person of the Company. Accordingly, the transactions contemplated under the Subscription Agreement and the Amended and Restated JV Agreement constitute connected transactions of the Company under the Listing Rules. Details of the Subscription and the Amended and Restated JV Agreement were set out in the announcement of the Company dated 29 September 2017.

New World Development Company Limited Annual Report 2018100
R e p o r t o f t h e D i r e c t o r s
CONNECTED TRANSACTIONS (CONTINUED)
(9) On 27 October 2017, New World Development (China) Limited (“Vendor”, an indirect wholly owned subsidiary of the Company) and Oriental Triumph Inc. (“Purchaser”, a company wholly owned by Mr. Doo) entered into a sale and purchase agreement (the “Agreement”) pursuant to which the Vendor agreed to sell, and the Purchaser agreed to purchase, the entire issued share capital of Ramada Property Ltd. (“Ramada”) at the consideration of RMB1.85 billion (equivalent to approximately HK$2.2 billion) subject to customary closing adjustment (the “Disposal”). Ramada, together with its subsidiaries owns and operates the Shanghai Ramada Plaza, New World Shanghai Hotel and pentahotel Shanghai.
By reason stated above, Mr. Doo is a connected person of the Company. Therefore, the Purchaser is a connected person of the Company by virtue of being wholly owned by Mr. Doo and the Disposal constitutes a connected transaction for the Company under the Listing Rules. Details of the Disposal were set out in the announcement of the Company dated 27 October 2017.
The Disposal was completed on 28 March 2018.
The price and terms of the continuing connected transactions mentioned in paragraphs (2) to (7) above were determined in accordance with the pricing policies and guidelines as set out in the relevant announcements of the Company. These continuing connected transactions have been reviewed by the Independent Non-executive Directors of the Company who have confirmed that the transactions have been entered into:
(a) in the ordinary and usual course of business of the Group;
(b) on normal commercial terms or better; and
(c) in accordance with the relevant agreements governing them on terms that are fair and reasonable and in the interests of the shareholders of the Company as a whole.
The Company’s auditor was engaged to report on the Group’s continuing connected transactions stated in paragraphs (2) to (7) above in accordance with Hong Kong Standard on Assurance Engagements 3000 (Revised) “Assurance Engagements Other Than Audits or Reviews of Historical Financial Information” and with reference to Practice Note 740 “Auditor’s Letter on Continuing Connected Transactions under the Hong Kong Listing Rules” issued by the Hong Kong Institute of Certified Public Accountants. The auditor has issued his unqualified letter containing his findings and conclusions in respect of the continuing connected transactions disclosed by the Group in accordance with paragraph 14A.56 of the Listing Rules. A copy of the auditor’s letter has been provided by the Company to the HKEx.
Save as disclosed above, a summary of significant related party transactions that did not constitute connected transactions made during the year was disclosed in note 47 to the financial statements.
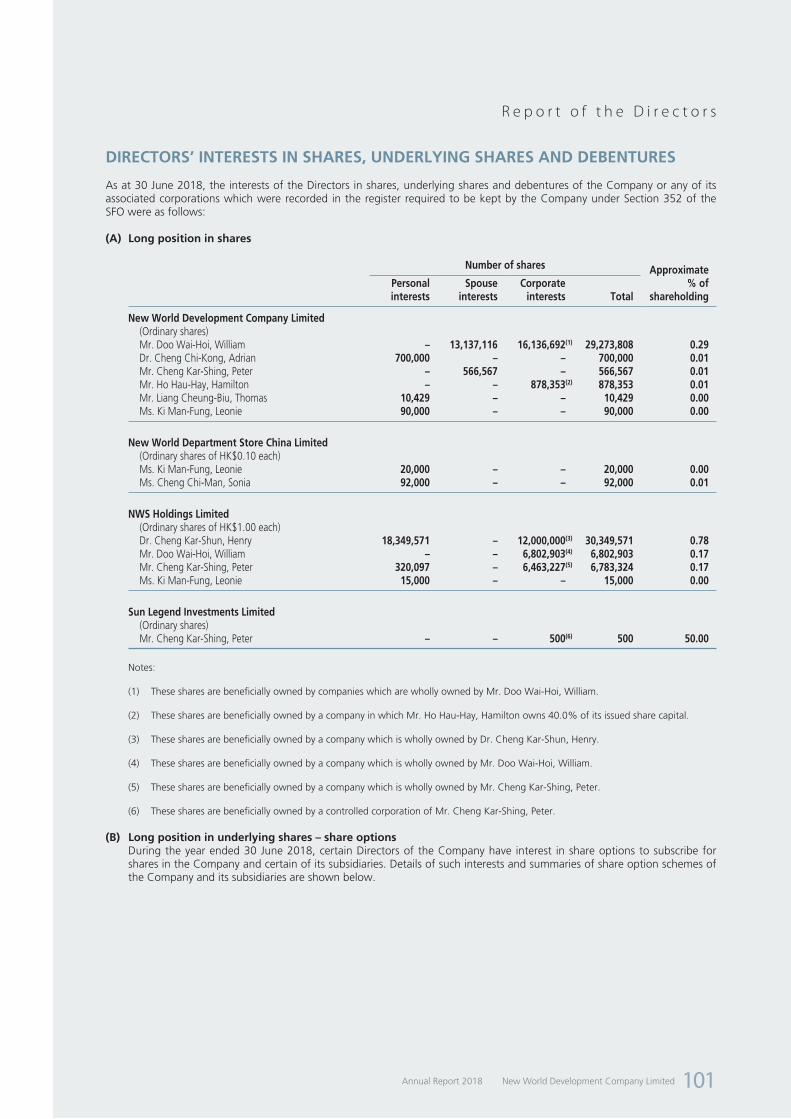
New World Development Company LimitedAnnual Report 2018 101
R e p o r t o f t h e D i r e c t o r s
DIRECTORS’ INTERESTS IN SHARES, UNDERLYING SHARES AND DEBENTURES
As at 30 June 2018, the interests of the Directors in shares, underlying shares and debentures of the Company or any of its associated corporations which were recorded in the register required to be kept by the Company under Section 352 of the SFO were as follows:
(A) Long position in shares
Number of shares Approximate % of
shareholdingPersonal interests
Spouse interests
Corporate interests Total
New World Development Company Limited(Ordinary shares)Mr. Doo Wai-Hoi, William – 13,137,116 16,136,692(1) 29,273,808 0.29Dr. Cheng Chi-Kong, Adrian 700,000 – – 700,000 0.01Mr. Cheng Kar-Shing, Peter – 566,567 – 566,567 0.01Mr. Ho Hau-Hay, Hamilton – – 878,353(2) 878,353 0.01Mr. Liang Cheung-Biu, Thomas 10,429 – – 10,429 0.00Ms. Ki Man-Fung, Leonie 90,000 – – 90,000 0.00
New World Department Store China Limited(Ordinary shares of HK$0.10 each)Ms. Ki Man-Fung, Leonie 20,000 – – 20,000 0.00Ms. Cheng Chi-Man, Sonia 92,000 – – 92,000 0.01
NWS Holdings Limited(Ordinary shares of HK$1.00 each)Dr. Cheng Kar-Shun, Henry 18,349,571 – 12,000,000(3) 30,349,571 0.78Mr. Doo Wai-Hoi, William – – 6,802,903(4) 6,802,903 0.17Mr. Cheng Kar-Shing, Peter 320,097 – 6,463,227(5) 6,783,324 0.17Ms. Ki Man-Fung, Leonie 15,000 – – 15,000 0.00
Sun Legend Investments Limited(Ordinary shares)Mr. Cheng Kar-Shing, Peter – – 500(6) 500 50.00
Notes:
(1) These shares are beneficially owned by companies which are wholly owned by Mr. Doo Wai-Hoi, William.
(2) These shares are beneficially owned by a company in which Mr. Ho Hau-Hay, Hamilton owns 40.0% of its issued share capital.
(3) These shares are beneficially owned by a company which is wholly owned by Dr. Cheng Kar-Shun, Henry.
(4) These shares are beneficially owned by a company which is wholly owned by Mr. Doo Wai-Hoi, William.
(5) These shares are beneficially owned by a company which is wholly owned by Mr. Cheng Kar-Shing, Peter.
(6) These shares are beneficially owned by a controlled corporation of Mr. Cheng Kar-Shing, Peter.
(B) Long position in underlying shares – share optionsDuring the year ended 30 June 2018, certain Directors of the Company have interest in share options to subscribe for shares in the Company and certain of its subsidiaries. Details of such interests and summaries of share option schemes of the Company and its subsidiaries are shown below.
New World Development Company Limited Annual Report 2018102
R e p o r t o f t h e D i r e c t o r s
DIRECTORS’ INTERESTS IN SHARES, UNDERLYING SHARES AND DEBENTURES (CONTINUED)
(B) Long position in underlying shares – share options (continued)Share Option Schemes of the CompanyOn 24 November 2006, the Company adopted a share option scheme (the “2006 Scheme”) and certain rules of such scheme were amended on 13 March 2012. Under the 2006 Scheme, the Directors of the Company may at their discretion grant options to any eligible participant (as explained hereinafter) to subscribe for shares in the Company. In anticipation of the expiry of the 2006 Scheme on 24 November 2016, the Company adopted a new share option scheme (the “2016 Scheme”) at the annual general meeting of the Company held on 22 November 2016. Share options granted under the 2006 Scheme prior to its expiry on 24 November 2016 shall continue to be valid and exercisable in accordance with the terms of the 2006 Scheme.
Summary of the 2006 Scheme and the 2016 Scheme disclosed in accordance with the Listing Rules is as follows:
2006 Scheme and 2016 Scheme
Purpose of the schemes To reward directors and employees of the Group for past service or performance, to provide incentive, motivation or reward to eligible participants for increasing performance or making contribution to the Group, to attract and retain persons of right caliber with the necessary experience to work for or make contribution to the Group, to foster a sense of corporate identity and to allow the eligible participants to enjoy the results of the Company attained through their relationship, efforts and/or contribution.
Participants of the schemes Eligible participant may be a person or an entity belonging to any of the following classes:
(i) any employee (including directors) of the Group or any invested entity of the Group (the “Invested Entity”);
(ii) any person seconded or nominated by the Group to represent the Group’s interest in any of the Invested Entity or any other company or organisation;
(iii) any supplier of goods or services to any member of the Group or any Invested Entity;
(iv) any customer of any member of the Group or any Invested Entity;
(v) any person or entity that provides research, development or other technological support to the Group or any Invested Entity;
(vi) any adviser (professional or otherwise) or consultant to any area of business or business development of any member of the Group or any Invested Entity; and
(vii) any joint venture partner or business alliance that co-operates with any member of the Group or any Invested Entity in any area of business operation or development.
Total number of shares available for issue under the schemes and percentage of issued shares as at the date of this annual report
The Company had granted 425,987,928 share options of the Company under the 2006 Scheme up to the date of this report. No further share option was granted under the 2006 Scheme since the adoption of the 2016 Scheme on 22 November 2016. 92,700,000 share options were granted under the 2016 Scheme up to the date of this report.
The total number of shares available for issue under the 2016 Scheme is 849,405,147 representing approximately 8.32% of the Company’s total number of issued shares as at the date of this report.

New World Development Company LimitedAnnual Report 2018 103
R e p o r t o f t h e D i r e c t o r s
2006 Scheme and 2016 Scheme
Maximum entitlement of each participant under the schemes
Unless approved by shareholders of the Company, the total number of shares issued and to be issued upon exercise of the share options granted to each eligible participant (including both exercised and outstanding options) in any 12-month period must not exceed 1.0% of the total number of shares of the Company in issue.
The period within which the shares must be taken up under an option
A period to be specified by the Directors and not to exceed 10 years from the date of grant of options.
The minimum period for which an option must be held before it can be exercised
Any period as determined by the Directors.
The amount payable on application or acceptance of the option and the period within which payments or calls must or may be made or loans for such purposes must be paid
HK$10.0 is to be paid as consideration for the grant of option within 14 days from the date of offer.
The basis of determining the exercise price The exercise price is determined by the Directors which must be at least the higher of (i) the closing price of the shares on the HKEx as stated in the HKEx’s daily quotations sheets on the date of grant, which must be a dealing day; and (ii) the average closing price of the shares as stated in the HKEx’s daily quotation sheets for the five dealing days immediately preceding the date of grant.
The remaining life of the schemes The schemes shall be valid and effective for a period of 10 years from the date of adoption. The 2006 Scheme which was adopted on 24 November 2006 expired on 24 November 2016. The 2016 Scheme which was adopted on 22 November 2016 will expire on 22 November 2026.
DIRECTORS’ INTERESTS IN SHARES, UNDERLYING SHARES AND DEBENTURES (CONTINUED)
(B) Long position in underlying shares – share options (continued)Share Option Schemes of the Company (continued)

New World Development Company Limited Annual Report 2018104
R e p o r t o f t h e D i r e c t o r s
DIRECTORS’ INTERESTS IN SHARES, UNDERLYING SHARES AND DEBENTURES (CONTINUED)
(B) Long position in underlying shares – share options (continued)Share Option Schemes of the Company (continued)Share options granted to Directors
Number of share options
Name Date of grantExercisable
period
Balance as at
1 July 2017
Granted during
the year
Transferred from other
category on 1 June 2018(6)
Transferred to other
category on 1 July 2017(7)
Exercised during
the year
Balance as at
30 June 2018
Exercise price per
share(Note) HK$
Dr. Cheng Kar-Shun, Henry 10 June 2016 (1) 10,675,637 – – – – 10,675,637 7.5403 July 2017 (2) – 2,000,000 – – – 2,000,000 10.036
Mr. Doo Wai-Hoi, William 22 January 2014 (3) 532,982 – – – (532,982)(8) – 9.7563 July 2017 (2) – 100,000 – – – 100,000 10.036
Dr. Cheng Chi-Kong, Adrian 9 March 2016 (4) 4,500,000 – – – (700,000)(9) 3,800,000 7.20010 June 2016 (1) 3,736,471 – – – – 3,736,471 7.5403 July 2017 (2) – 2,000,000 – – – 2,000,000 10.036
Mr. Yeung Ping-Leung, Howard 10 June 2016 (1) 533,779 – – – – 533,779 7.5403 July 2017 (2) – 100,000 – – – 100,000 10.036
Mr. Cha Mou-Sing, Payson 10 June 2016 (1) 533,779 – – – – 533,779 7.5403 July 2017 (2) – 100,000 – – – 100,000 10.036
Mr. Cheng Kar-Shing, Peter 10 June 2016 (1) 533,779 – – – – 533,779 7.5403 July 2017 (2) – 100,000 – – – 100,000 10.036
Mr. Ho Hau-Hay, Hamilton 10 June 2016 (1) 533,779 – – – (200,000)(10) 333,779 7.5403 July 2017 (2) – 100,000 – – – 100,000 10.036
Mr. Lee Luen-Wai, John 10 June 2016 (1) 533,779 – – – – 533,779 7.5403 July 2017 (2) – 100,000 – – – 100,000 10.036
Mr. Liang Cheung-Biu, Thomas 10 June 2016 (1) 533,779 – – – – 533,779 7.5403 July 2017 (2) – 100,000 – – – 100,000 10.036
Ms. Ki Man-Fung, Leonie 10 June 2016 (5) 2,002,016 – – – (400,000)(11) 1,602,016 7.5403 July 2017 (2) – 100,000 – – – 100,000 10.036
Mr. Cheng Chi-Heng 10 June 2016 (1) 533,779 – – – – 533,779 7.5403 July 2017 (2) – 100,000 – – – 100,000 10.036
Ms. Cheng Chi-Man, Sonia 10 June 2016 (1) 3,202,688 – – – – 3,202,688 7.5403 July 2017 (2) – 100,000 – – – 100,000 10.036
Mr. Au Tak-Cheong 22 January 2014 (3) 532,982 – – – (532,982)(12) – 9.75610 June 2016 (1) 1,016,693 – – – (150,000)(13) 866,693 7.5403 July 2017 (2) – 400,000 – – (100,000)(14) 300,000 10.036
Mr. Sitt Nam-Hoi(6) 10 June 2016 (1) – – 767,827 – – 767,827 7.5403 July 2017 (2) – – 300,000 – – 300,000 10.036
Mr. So Chung-Keung, Alfred(6) 3 July 2017 (2) – – 2,300,000 – – 2,300,000 10.036
Mr. Chen Guanzhan(7) 10 June 2016 (1) 1,868,471 – – (1,868,471) – – 7.540
31,804,393 5,400,000 3,367,827 (1,868,471) (2,615,964) 36,087,785
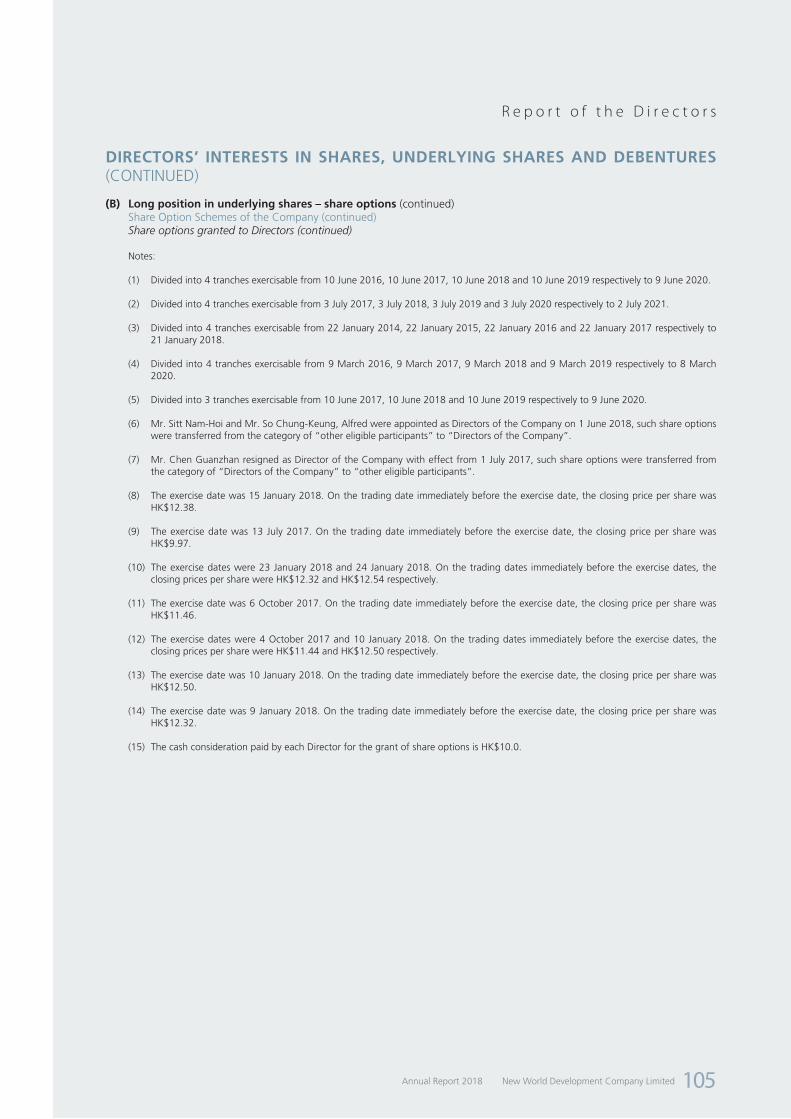
New World Development Company LimitedAnnual Report 2018 105
R e p o r t o f t h e D i r e c t o r s
DIRECTORS’ INTERESTS IN SHARES, UNDERLYING SHARES AND DEBENTURES (CONTINUED)
(B) Long position in underlying shares – share options (continued)Share Option Schemes of the Company (continued)Share options granted to Directors (continued)
Notes:
(1) Divided into 4 tranches exercisable from 10 June 2016, 10 June 2017, 10 June 2018 and 10 June 2019 respectively to 9 June 2020.
(2) Divided into 4 tranches exercisable from 3 July 2017, 3 July 2018, 3 July 2019 and 3 July 2020 respectively to 2 July 2021.
(3) Divided into 4 tranches exercisable from 22 January 2014, 22 January 2015, 22 January 2016 and 22 January 2017 respectively to 21 January 2018.
(4) Divided into 4 tranches exercisable from 9 March 2016, 9 March 2017, 9 March 2018 and 9 March 2019 respectively to 8 March 2020.
(5) Divided into 3 tranches exercisable from 10 June 2017, 10 June 2018 and 10 June 2019 respectively to 9 June 2020.
(6) Mr. Sitt Nam-Hoi and Mr. So Chung-Keung, Alfred were appointed as Directors of the Company on 1 June 2018, such share options were transferred from the category of “other eligible participants” to “Directors of the Company”.
(7) Mr. Chen Guanzhan resigned as Director of the Company with effect from 1 July 2017, such share options were transferred from the category of “Directors of the Company” to “other eligible participants”.
(8) The exercise date was 15 January 2018. On the trading date immediately before the exercise date, the closing price per share was HK$12.38.
(9) The exercise date was 13 July 2017. On the trading date immediately before the exercise date, the closing price per share was HK$9.97.
(10) The exercise dates were 23 January 2018 and 24 January 2018. On the trading dates immediately before the exercise dates, the closing prices per share were HK$12.32 and HK$12.54 respectively.
(11) The exercise date was 6 October 2017. On the trading date immediately before the exercise date, the closing price per share was HK$11.46.
(12) The exercise dates were 4 October 2017 and 10 January 2018. On the trading dates immediately before the exercise dates, the closing prices per share were HK$11.44 and HK$12.50 respectively.
(13) The exercise date was 10 January 2018. On the trading date immediately before the exercise date, the closing price per share was HK$12.50.
(14) The exercise date was 9 January 2018. On the trading date immediately before the exercise date, the closing price per share was HK$12.32.
(15) The cash consideration paid by each Director for the grant of share options is HK$10.0.
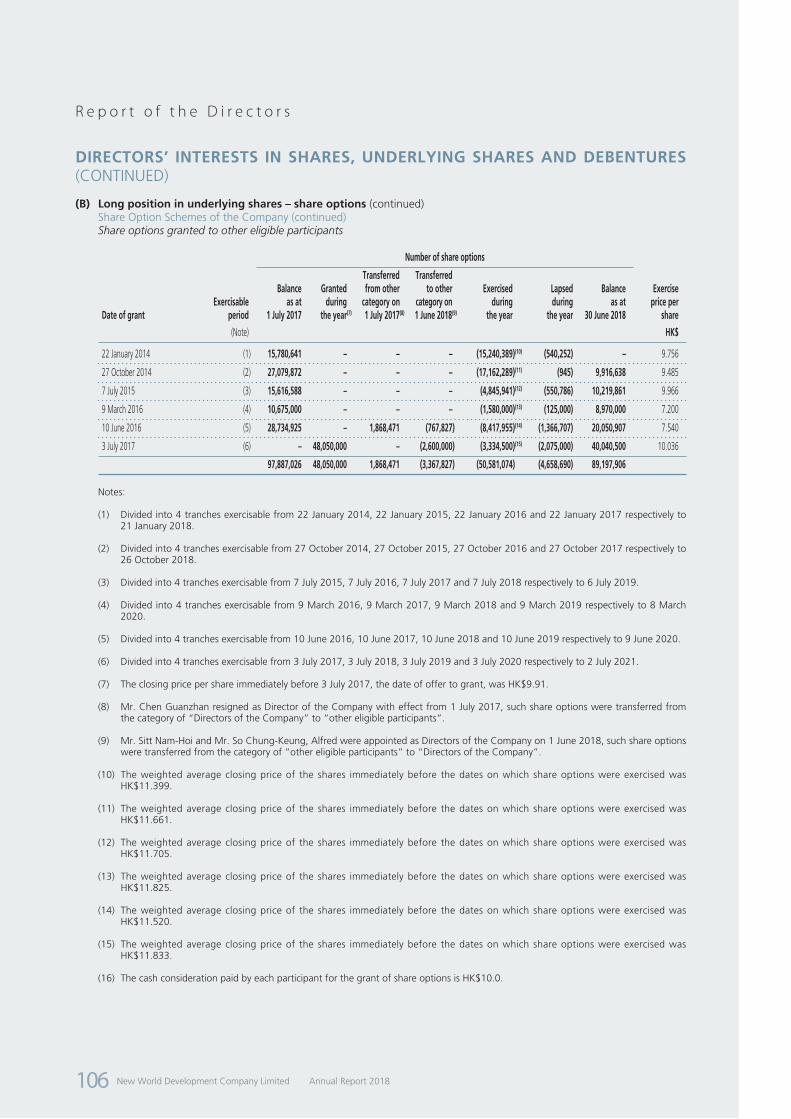
New World Development Company Limited Annual Report 2018106
R e p o r t o f t h e D i r e c t o r s
DIRECTORS’ INTERESTS IN SHARES, UNDERLYING SHARES AND DEBENTURES (CONTINUED)
(B) Long position in underlying shares – share options (continued)Share Option Schemes of the Company (continued)Share options granted to other eligible participants
Number of share options
Date of grantExercisable
period
Balance as at
1 July 2017
Granted during
the year(7)
Transferred from other
category on 1 July 2017(8)
Transferred to other
category on 1 June 2018(9)
Exercised during
the year
Lapsed during
the year
Balance as at
30 June 2018
Exercise price per
share
(Note) HK$
22 January 2014 (1) 15,780,641 – – – (15,240,389)(10) (540,252) – 9.756
27 October 2014 (2) 27,079,872 – – – (17,162,289)(11) (945) 9,916,638 9.485
7 July 2015 (3) 15,616,588 – – – (4,845,941)(12) (550,786) 10,219,861 9.966
9 March 2016 (4) 10,675,000 – – – (1,580,000)(13) (125,000) 8,970,000 7.200
10 June 2016 (5) 28,734,925 – 1,868,471 (767,827) (8,417,955)(14) (1,366,707) 20,050,907 7.540
3 July 2017 (6) – 48,050,000 – (2,600,000) (3,334,500)(15) (2,075,000) 40,040,500 10.036
97,887,026 48,050,000 1,868,471 (3,367,827) (50,581,074) (4,658,690) 89,197,906
Notes:
(1) Divided into 4 tranches exercisable from 22 January 2014, 22 January 2015, 22 January 2016 and 22 January 2017 respectively to 21 January 2018.
(2) Divided into 4 tranches exercisable from 27 October 2014, 27 October 2015, 27 October 2016 and 27 October 2017 respectively to 26 October 2018.
(3) Divided into 4 tranches exercisable from 7 July 2015, 7 July 2016, 7 July 2017 and 7 July 2018 respectively to 6 July 2019.
(4) Divided into 4 tranches exercisable from 9 March 2016, 9 March 2017, 9 March 2018 and 9 March 2019 respectively to 8 March 2020.
(5) Divided into 4 tranches exercisable from 10 June 2016, 10 June 2017, 10 June 2018 and 10 June 2019 respectively to 9 June 2020.
(6) Divided into 4 tranches exercisable from 3 July 2017, 3 July 2018, 3 July 2019 and 3 July 2020 respectively to 2 July 2021.
(7) The closing price per share immediately before 3 July 2017, the date of offer to grant, was HK$9.91.
(8) Mr. Chen Guanzhan resigned as Director of the Company with effect from 1 July 2017, such share options were transferred from the category of “Directors of the Company” to “other eligible participants”.
(9) Mr. Sitt Nam-Hoi and Mr. So Chung-Keung, Alfred were appointed as Directors of the Company on 1 June 2018, such share options were transferred from the category of “other eligible participants” to “Directors of the Company”.
(10) The weighted average closing price of the shares immediately before the dates on which share options were exercised was HK$11.399.
(11) The weighted average closing price of the shares immediately before the dates on which share options were exercised was HK$11.661.
(12) The weighted average closing price of the shares immediately before the dates on which share options were exercised was HK$11.705.
(13) The weighted average closing price of the shares immediately before the dates on which share options were exercised was HK$11.825.
(14) The weighted average closing price of the shares immediately before the dates on which share options were exercised was HK$11.520.
(15) The weighted average closing price of the shares immediately before the dates on which share options were exercised was HK$11.833.
(16) The cash consideration paid by each participant for the grant of share options is HK$10.0.

New World Development Company LimitedAnnual Report 2018 107
R e p o r t o f t h e D i r e c t o r s
DIRECTORS’ INTERESTS IN SHARES, UNDERLYING SHARES AND DEBENTURES (CONTINUED)
(B) Long position in underlying shares – share options (continued)Share Option Schemes of the Company (continued)The fair value of the share options granted during the year is estimated at HK$1.052 per share using the Binomial pricing model. Value is estimated based on the risk-free rate at 1.05% per annum with reference to the market yield rates of the Hong Kong Government Bond (maturing 21 June 2021 and 6 December 2021) as of the value date, a historical volatility of 24.55% calculated based on the historical price with period equals to the life of the options, assuming dividend yield of 4.26% based on the average dividend yield in the past five years and an expected option life of four years.
The Binomial pricing model requires input of subjective assumptions such as the expected stock price volatility. Change in the subjective input may materially affect the fair value estimates.
Share Option Scheme of NWS Holdings Limited (“NWSH”)The existing share option scheme of NWSH (“NWSH Share Option Scheme”) was adopted at the annual general meeting of NWSH held on 21 November 2011. A summary of the share option scheme of NWSH disclosed in accordance with the Listing Rules is as follows:
NWSH Share Option Scheme
Purpose of the scheme To reward directors and employees of NWSH and its subsidiaries (“NWSH Group”) for their past service or performance; providing incentive and motivation or reward to eligible participants for optimising their performance or making contribution to NWSH Group; attracting and retaining persons of right caliber with the necessary experience to work for or make contribution to NWSH Group; and fostering a sense of corporate identity.
Participants of the scheme Eligible participant may be a person or an entity belonging to any of the following classes:
(i) any eligible employee;
(ii) any non-executive director (including independent non-executive director) of NWSH Group or any invested entity of NWSH Group (the “Invested Entity”);
(iii) any supplier of goods or services to any member of NWSH Group or any Invested Entity;
(iv) any customer of any member of NWSH Group or any Invested Entity;
(v) any person or entity that provides research, development or other technological support to NWSH Group or any Invested Entity;
(vi) any shareholder of any member of NWSH Group or any Invested Entity or any holder of any securities issued by any member of NWSH Group or any Invested Entity;
(vii) any adviser (professional or otherwise) or consultant to any area of business or business development of any member of NWSH Group or any Invested Entity; and
(viii) any joint venture partner or business alliance that co-operates with any member of NWSH Group or any Invested Entity in any area of business operation or development.

New World Development Company Limited Annual Report 2018108
R e p o r t o f t h e D i r e c t o r s
NWSH Share Option Scheme
Total number of shares available for issue under the scheme and percentage of issued shares of NWSH as at the date of this annual report
NWSH had granted share options to certain eligible participants to subscribe for a total of 55,623,705 shares of NWSH under the NWSH Share Option Scheme, which include certain adjustments made pursuant to the rules of the NWSH Share Option Scheme, up to the date of this report.
The total number of shares of NWSH available for issue under the NWSH Share Option Scheme is 284,347,671 representing approximately 7.30% of the total number of shares of NWSH as at the date of this report.
Maximum entitlement of each participant under the scheme
Unless approved by shareholders of NWSH, the total number of shares issued and to be issued upon exercise of the share options granted to each eligible participant (including both exercised and outstanding options) in any 12-month period must not exceed 1.0% of the share capital of NWSH in issue.
The period within which the shares must be taken up under an option
At any time during a period as specified by NWSH’s directors, however in any event the share options must be exercised within 10 years from the date of grant.
The minimum period for which an option must be held before it can be exercised
Any period as determined by NWSH’s directors.
The amount payable on application or acceptance of the option and the period within which payments or calls must or may be made or loans for such purposes must be paid
HK$10.0 is to be paid as consideration for the grant of option within 14 days from the date of offer.
The basis of determining the exercise price The exercise price is determined by NWSH’s directors which must be at least the highest of: (i) the closing price of the shares as stated in the HKEx’s daily quotations sheet on the date of grant; (ii) the average closing price of the shares as stated in the HKEx’s daily quotations sheets for the five dealing days immediately preceding the date of grant; and (iii) the nominal value of the shares.
The remaining life of the scheme The NWSH Share Option Scheme shall be valid and effective for a period of 10 years from the date of adoption, i.e. 21 November 2011.
Share options granted to Director
Number of share options
Name Date of grantExercisable
period
Balance as at
1 July 2017
Adjusted during
the year
Exercised during
the year
Balance as at
30 June 2018
Exercise price per
share(Note) HK$
Dr. Cheng Kar-Shun, Henry 9 March 2015 (1) 7,420,739 – – 7,420,739 14.120
Notes:
(1) 60.0% of the share options are exercisable from 9 May 2015 to 8 March 2020 while the remaining 40.0% of the share options are divided into 2 tranches exercisable from 9 March 2016 and 9 March 2017 respectively to 8 March 2020.
(2) The cash consideration paid by the above Director for the grant of share options is HK$10.0.
DIRECTORS’ INTERESTS IN SHARES, UNDERLYING SHARES AND DEBENTURES (CONTINUED)
(B) Long position in underlying shares – share options (continued)Share Option Scheme of NWS Holdings Limited (“NWSH”) (continued)

New World Development Company LimitedAnnual Report 2018 109
R e p o r t o f t h e D i r e c t o r s
DIRECTORS’ INTERESTS IN SHARES, UNDERLYING SHARES AND DEBENTURES (CONTINUED)
(B) Long position in underlying shares – share options (continued)Share Option Scheme of NWS Holdings Limited (“NWSH”) (continued)Share options granted to other eligible participants
Number of share options
Date of grantExercisable
period
Balance as at
1 July 2017
Adjusted during
the year
Exercised during
the year(2)
Lapsed during
the year
Balance as at
30 June 2018
Exercise price per
share(Note) HK$
9 March 2015 (1) 42,035,091 – (8,214,363) (74) 33,820,654 14.120
Notes:
(1) 60.0% of the share options are exercisable from 9 May 2015 to 8 March 2020 while the remaining 40.0% of the share options are divided into 2 tranches exercisable from 9 March 2016 and 9 March 2017 respectively to 8 March 2020.
(2) The weighted average closing price of the shares of NWSH immediately before the dates on which such share options were exercised was HK$15.726 per share.
(3) The cash consideration paid by each eligible participant for each grant of share options is HK$10.0.
(C) Long position in debentures(1) Fita International Limited (“Fita”)
Amount of debentures in US$ issued by Fita
Approximate % to the
total amount of debentures
in issue as at 30 June 2018Name
Personal interests
Family interests
Corporate interests Total
US$ US$ US$ US$
Mr. Doo Wai-Hoi, William – 2,900,000 12,890,000(1) 15,790,000 2.11
Mr. Lee Luen-Wai, John 1,000,000 1,000,000 – 2,000,000 0.27
1,000,000 3,900,000 12,890,000 17,790,000
Note:
(1) These debentures are beneficially owned by companies which are wholly owned by Mr. Doo Wai-Hoi, William.
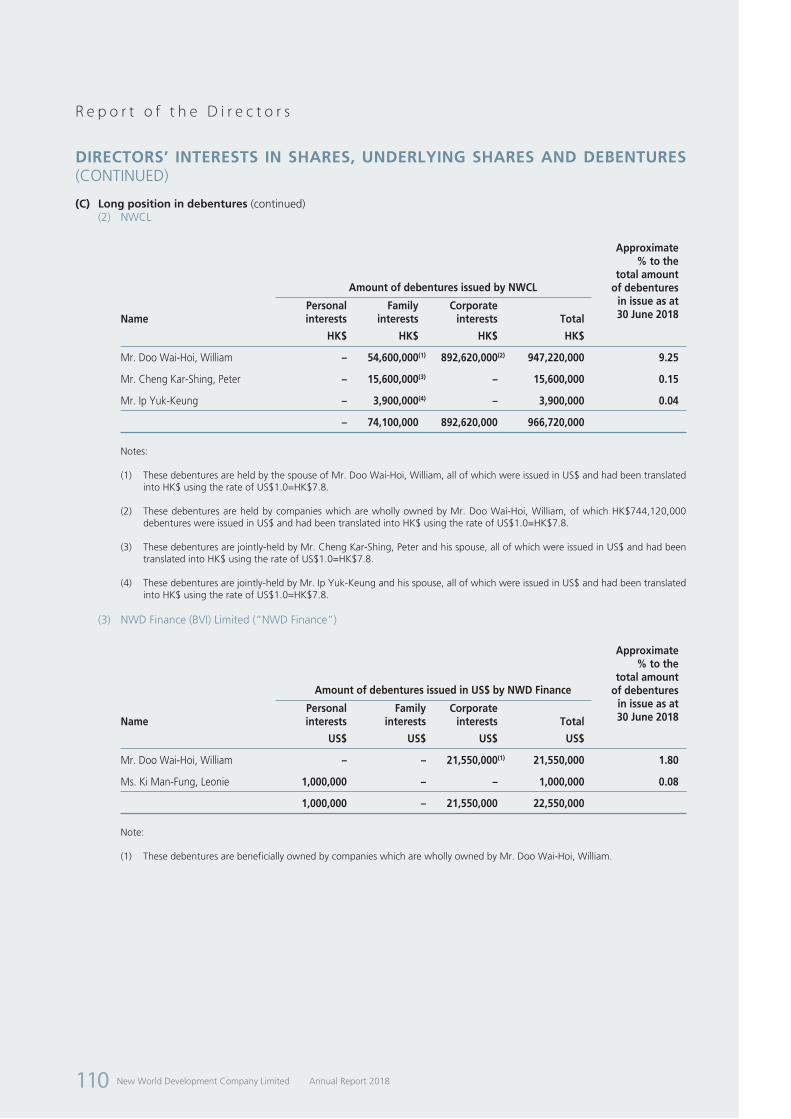
New World Development Company Limited Annual Report 2018110
R e p o r t o f t h e D i r e c t o r s
DIRECTORS’ INTERESTS IN SHARES, UNDERLYING SHARES AND DEBENTURES (CONTINUED)
(C) Long position in debentures (continued)(2) NWCL
Amount of debentures issued by NWCL
Approximate % to the
total amount of debentures
in issue as at 30 June 2018Name
Personal interests
Family interests
Corporate interests Total
HK$ HK$ HK$ HK$
Mr. Doo Wai-Hoi, William – 54,600,000(1) 892,620,000(2) 947,220,000 9.25
Mr. Cheng Kar-Shing, Peter – 15,600,000(3) – 15,600,000 0.15
Mr. Ip Yuk-Keung – 3,900,000(4) – 3,900,000 0.04
– 74,100,000 892,620,000 966,720,000
Notes:
(1) These debentures are held by the spouse of Mr. Doo Wai-Hoi, William, all of which were issued in US$ and had been translated into HK$ using the rate of US$1.0=HK$7.8.
(2) These debentures are held by companies which are wholly owned by Mr. Doo Wai-Hoi, William, of which HK$744,120,000 debentures were issued in US$ and had been translated into HK$ using the rate of US$1.0=HK$7.8.
(3) These debentures are jointly-held by Mr. Cheng Kar-Shing, Peter and his spouse, all of which were issued in US$ and had been translated into HK$ using the rate of US$1.0=HK$7.8.
(4) These debentures are jointly-held by Mr. Ip Yuk-Keung and his spouse, all of which were issued in US$ and had been translated into HK$ using the rate of US$1.0=HK$7.8.
(3) NWD Finance (BVI) Limited (“NWD Finance”)
Amount of debentures issued in US$ by NWD Finance
Approximate % to the
total amount of debentures
in issue as at 30 June 2018Name
Personal interests
Family interests
Corporate interests Total
US$ US$ US$ US$
Mr. Doo Wai-Hoi, William – – 21,550,000(1) 21,550,000 1.80
Ms. Ki Man-Fung, Leonie 1,000,000 – – 1,000,000 0.08
1,000,000 – 21,550,000 22,550,000
Note:
(1) These debentures are beneficially owned by companies which are wholly owned by Mr. Doo Wai-Hoi, William.

New World Development Company LimitedAnnual Report 2018 111
R e p o r t o f t h e D i r e c t o r s
DIRECTORS’ INTERESTS IN SHARES, UNDERLYING SHARES AND DEBENTURES (CONTINUED)
(C) Long position in debentures (continued)(4) NWD (MTN) Limited (“NWD (MTN)”)
Amount of debentures issued by NWD (MTN)
Approximate % to the
total amount of debentures
in issue as at 30 June 2018Name
Personal interests
Family interests
Corporate interests Total
HK$ HK$ HK$ HK$
Mr. Doo Wai-Hoi, William – 23,400,000(1) 156,000,000(2) 179,400,000 0.82
Ms. Ki Man-Fung, Leonie 11,800,000(3) – – 11,800,000 0.05
11,800,000 23,400,000 156,000,000 191,200,000
Notes:
(1) These debentures were issued in US$ and had been translated into HK$ using the rate of US$1.0=HK$7.8.
(2) These debentures are beneficially owned by a company which is wholly owned by Mr. Doo Wai-Hoi, William and were issued in US$ and had been translated into HK$ using the rate of US$1.0=HK$7.8.
(3) This amount includes HK$7,800,000 debentures which were issued in US$ and had been translated into HK$ using the rate of US$1.0=HK$7.8.
Save as disclosed above, as at 30 June 2018, none of the Directors or chief executive had or deemed to have any interest or short positions in the shares, underlying shares and debentures of the Company or any of its associated corporations as defined in the SFO that were required to be entered into the register kept by the Company pursuant to Section 352 of the SFO or were required to be notified to the Company and the Stock Exchange pursuant to the Model Code for Securities Transactions by Directors of Listed Issuers.

New World Development Company Limited Annual Report 2018112
R e p o r t o f t h e D i r e c t o r s
DISCLOSURE PURSUANT TO RULES 13.20 AND 13.22 OF THE LISTING RULES
At 30 June 2018, the Group had given financial assistance and guarantees to its joint ventures and associated companies (collectively “affiliated companies”) as set out below:
2018 2017
HK$m HK$m
Amounts due by affiliated companies (note) 37,045.5 33,537.0
Guarantees given for affiliated companies in respect of banking and other credit facilities 5,996.4 5,932.3
Commitments to capital injections and loan contributions 2,977.6 1,689.5
46,019.5 41,158.8
Note:
The advances were unsecured and were interest free except for an aggregate amount of HK$13,189.0 million (2017: HK$9,453.3 million) which carried interest ranging from 0.9% above HIBOR to 12.2% above LIBOR per annum (2017: from 1.3% above HIBOR to 12.2% above LIBOR per annum). The advances had no fixed repayment terms.
Pursuant to Rule 13.22 of the Listing Rules, a combined statement of financial position of those affiliated companies with financial assistance from the Group and the Group’s attributable interests in those affiliated companies as at 30 June 2018 are presented as follows:
Combined statement
of financial position
Group’s attributable
interests
HK$m HK$m
Non-current assets 136,667.2 66,264.4
Current assets 54,651.0 21,473.7
Current liabilities (47,788.1) (21,053.8)
Total assets less current liabilities 143,530.1 66,684.3
Non-current liabilities (111,865.9) (50,294.0)
Net assets 31,664.2 16,390.3
The combined statement of financial position of the affiliated companies was prepared by combining their statements of financial position, after making adjustments to conform with the Group’s significant accounting policies and re-grouping into significant classification in the statement of financial position, as at 30 June 2018.
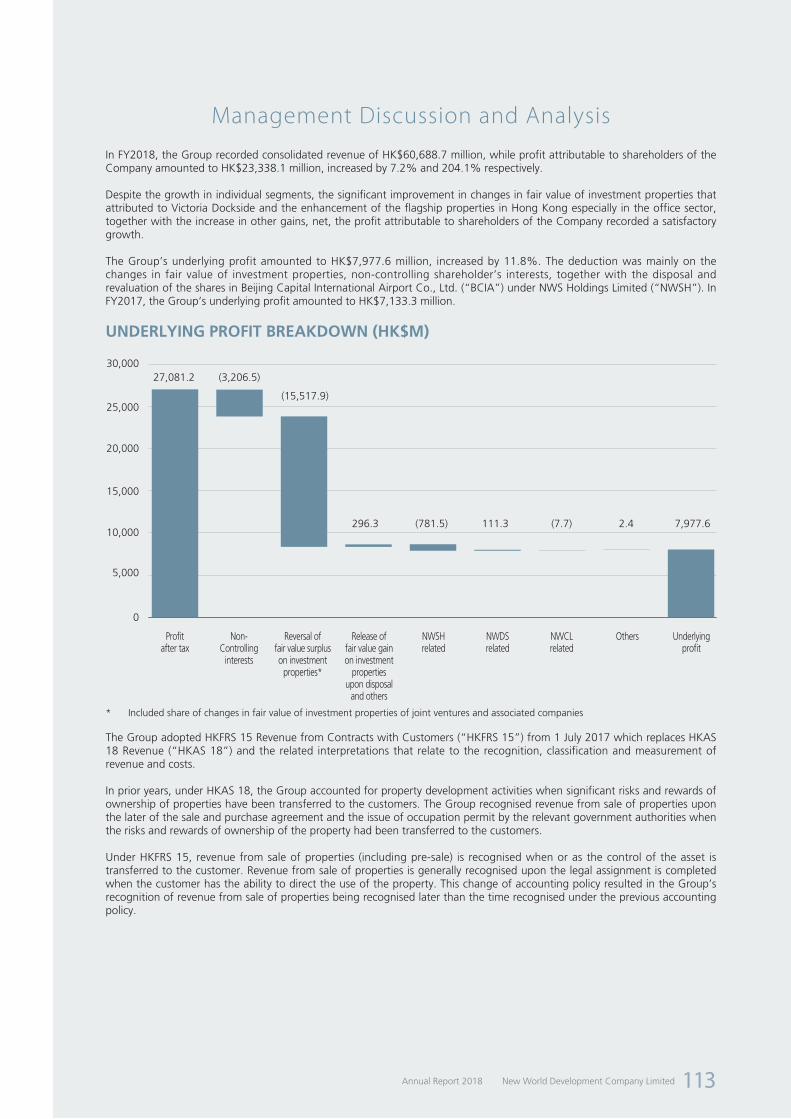
New World Development Company LimitedAnnual Report 2018 113
Management Discussion and Analysis
In FY2018, the Group recorded consolidated revenue of HK$60,688.7 million, while profit attributable to shareholders of the Company amounted to HK$23,338.1 million, increased by 7.2% and 204.1% respectively.
Despite the growth in individual segments, the significant improvement in changes in fair value of investment properties that attributed to Victoria Dockside and the enhancement of the flagship properties in Hong Kong especially in the office sector, together with the increase in other gains, net, the profit attributable to shareholders of the Company recorded a satisfactory growth.
The Group’s underlying profit amounted to HK$7,977.6 million, increased by 11.8%. The deduction was mainly on the changes in fair value of investment properties, non-controlling shareholder’s interests, together with the disposal and revaluation of the shares in Beijing Capital International Airport Co., Ltd. (“BCIA”) under NWS Holdings Limited (“NWSH”). In FY2017, the Group’s underlying profit amounted to HK$7,133.3 million.
UNDERLYING PROFIT BREAKDOWN (HK$M)
0
5,000
10,000
15,000
20,000
25,000
30,00027,081.2 (3,206.5)
(15,517.9)
296.3 (781.5) 111.3 (7.7) 2.4 7,977.6
Profit after tax
Non-Controlling
interests
Reversal of fair value surplus on investment
properties*
Release of fair value gain on investment
properties upon disposal
and others
NWSH related
NWDS related
NWCL related
Others Underlying profit
* Included share of changes in fair value of investment properties of joint ventures and associated companies
The Group adopted HKFRS 15 Revenue from Contracts with Customers (“HKFRS 15”) from 1 July 2017 which replaces HKAS 18 Revenue (“HKAS 18”) and the related interpretations that relate to the recognition, classification and measurement of revenue and costs.
In prior years, under HKAS 18, the Group accounted for property development activities when significant risks and rewards of ownership of properties have been transferred to the customers. The Group recognised revenue from sale of properties upon the later of the sale and purchase agreement and the issue of occupation permit by the relevant government authorities when the risks and rewards of ownership of the property had been transferred to the customers.
Under HKFRS 15, revenue from sale of properties (including pre-sale) is recognised when or as the control of the asset is transferred to the customer. Revenue from sale of properties is generally recognised upon the legal assignment is completed when the customer has the ability to direct the use of the property. This change of accounting policy resulted in the Group’s recognition of revenue from sale of properties being recognised later than the time recognised under the previous accounting policy.

New World Development Company Limited Annual Report 2018114
M a n a g e m e n t D i s c u s s i o n a n d A n a l y s i s
EBITDA* of the Group for FY2018 by Region is as follows:
EBITDA (HK$m) Under HKFRS 15 Under HKAS 18
Hong KongMainland China
and other regions Hong KongMainland China
and other regions
Property related 3,864.6 87% 7,284.1 77% 10,147.2 95% 6,966.2 76%
Others 585.9 13% 2,159.4 23% 585.9 5% 2,164.2 24%
Total 4,450.5 100% 9,443.5 100% 10,733.1 100% 9,130.4 100%
EBITDA (%) 32% 68% 54% 46%
* EBITDA: operating profit before depreciation and amortisation, changes in fair value of investment properties and other gains, net and after net exchange difference
Total segment results (including share of results of joint ventures and associated companies but excluding changes in fair value in investment properties) amounted to HK$15,844.6 million, increased by 12.4%.
REVENUE – ANALYSED BY BUSINESS SEGMENT
FY2018 FY2017HK$m HK$m
Property development 23,380.8 25,968.0
Property investment 3,109.9 2,410.9
Service 25,911.7 20,743.0
Infrastructure 2,814.6 2,410.6
Hotel operations 1,479.0 1,426.5
Department stores 3,670.9 3,389.0
Others 321.8 280.8
Total 60,688.7 56,628.8
REVENUE – GEOGRAPHIC CONTRIBUTION (PROPERTY RELATED SEGMENT)
FY2018 FY2017HK$m HK$m
Property development
Hong Kong 7,141.0 8,538.1
Mainland China 16,239.8 17,429.9
Total 23,380.8 25,968.0

New World Development Company LimitedAnnual Report 2018 115
M a n a g e m e n t D i s c u s s i o n a n d A n a l y s i s
FY2018 FY2017HK$m HK$m
Property investment
Hong Kong 1,835.9 1,576.2
Mainland China 1,274.0 834.7
Total 3,109.9 2,410.9
FY2018 FY2017HK$m HK$m
Hotel operations
Hong Kong 608.8 573.9
Mainland China 606.8 633.8
Southeast Asia 263.4 218.8
Total 1,479.0 1,426.5
Property development segment recorded 10.0% decrease in revenue, it was mainly due to the differences in project mix between FY2018 and FY2017.
In FY2017, SKYPARK, BOHEMIAN HOUSE and Double Cove Summit had driven the revenues of Hong Kong property development segment. In Mainland China, the key contributor was the Signature Hill, the luxury project in Shenzhen, together with the projects located in Guangzhou, Langfang and Shenyang.
In FY2018, Hong Kong property development segment was mainly rely on the contribution from MOUNT PAVILIA and the inventory sales. In Mainland China, a series of project in Guangzhou project, and the projects located in Changsha, Langfang, Beijing, Shenyang and Wuhan were the key contributors.
The property investment segment reported an increase in revenue by 29.0%. It was mainly due to 1) the commencement of operation in K11 ATELIER at Victoria Dockside and THE FOREST in Mong Kok; 2) the commencement in operations of Wuhan Guanggu K11; and 3) the Group has optimised its internal structure and individual projects have been converted from joint ventures to subsidiaries after the completion of the privatisation of NWCL. In fact, the overall occupancy of the key projects in the Hong Kong and Mainland China Investment portfolio have recorded a satisfactory results that help to improve the overall rental income performance.
Revenue from the service segment increased by 24.9%, it was mainly due to NWSH acquired further 50% interest in NWS Transport Service Limited (“NWST”) in December 2016 and since then, and NWST has become a wholly owned subsidiary of NWSH from a JV company. Nonetheless, the improved contribution from contracting, Hong Kong Convention and Exhibition Centre, together with the new healthcare & wellness business also provided a positive effect to the segment.
Revenue from infrastructure segment increased by 16.8%. The performance of major business remains stable especially the increase in contribution from road business which was benefited by the growth in traffic volume.
Hotel operations segment recorded an increase of 3.7% in revenue, it was due to the improved contribution from the hotels in Hong Kong and Southeast Asia. Decrease in the contribution from the hotels in Mainland China was mainly due to the disposal of two Shanghai Hotels in the year under review.
Revenue from the department store segment recorded an increase of 8.3% which was benefited by the improvement in sales and rental income.
Meanwhile, the 14.6% revenue increase in Others segment was mainly due to the improved contribution from NWTMT and the new investment project.

New World Development Company Limited Annual Report 2018116
M a n a g e m e n t D i s c u s s i o n a n d A n a l y s i s
ANALYSIS OF SEGMENT RESULTS
FY2018 FY2017HK$m HK$m
Property development 9,475.5 7,506.8
Property investment 1,923.3 1,770.6
Service 858.4 1,186.0
Infrastructure 3,801.4 3,313.0
Hotel operations (76.5) (113.8)
Department stores 232.4 220.0
Others (369.9) 207.8
Total 15,844.6 14,090.4
SEGMENT RESULTS – GEOGRAPHIC CONTRIBUTION(PROPERTY RELATED SEGMENT)
FY2018 FY2017HK$m HK$m
Property development
Hong Kong 2,864.5 2,277.1
Mainland China 6,611.0 5,229.7
Total 9,475.5 7,506.8
FY2018 FY2017HK$m HK$m
Property investment
Hong Kong 1,160.9 1,169.5
Mainland China 762.4 601.1
Total 1,923.3 1,770.6
FY2018 FY2017HK$m HK$m
Hotel operations
Hong Kong 68.9 87.3
Mainland China (180.1) (289.2)
Southeast Asia 34.7 88.1
Total (76.5) (113.8)

New World Development Company LimitedAnnual Report 2018 117
M a n a g e m e n t D i s c u s s i o n a n d A n a l y s i s
Property developmentSegment results of property development for FY2018 amounted to HK$9,475.5 million, increased by 26.2%.
Segment results derived from Hong Kong increased by 25.8%, it was mainly attributable to the increase in gross profit margin of the residential projects, from 27% in FY2017 to 40% in FY2018. The incurrence of marketing expenses that relate to the pre-sale of property projects were also reduced during the year under review.
The contributions derived from Hong Kong segment was mainly attributable to residential projects including MOUNT PAVILIA, The Masterpiece, THE PAVILIA HILL, PARK VILLA and the Double Cove series.
During the year, the Group’s attributable contracted sales in Hong Kong amounted to HK$24.7 billion, outperforming the HK$10 billion sales target and reaching a new height for the Group, being mainly contributions from the residential projects including MOUNT PAVILIA, ARTISAN HOUSE, FLEUR PAVILIA, THE PARKVILLE, PARK HILLCREST, PARK VILLA, THE PAVILIA BAY, The Masterpiece and the Double Cove series.
Under the current development schedule of the projects, THE PAVILIA BAY, ARTISAN HOUSE, THE PARKVILLE, FLEUR PAVILIA, PARK HILLCREST and PARK REACH will be handed over to purchasers in FY2019 and hence results from those sales together with the unrecognise portion from MOUNT PAVILIA will be recognised for in the same fiscal year.
ProjectTotal No.
of unitsNo. of units sold as at 2 Sept 2018
Total contracted sales proceeds
HK$bn
THE PAVILIA BAY 983 978 10.0
FLEUR PAVILA 611 474 11.2
MOUNT PAVILIA 680 594* 14.9*
ARTISAN HOUSE 250 241 2.1
THE PARKVILLE 100 100 0.9
PARK HILLCREST 123 123 0.9
Total 2,747 2,510 40.0
* Sales booked in FY2018: 218 units, total contracted sales proceeds HK$4.4 bn
Segment results derived from Mainland China increased by 26.4% to HK$6,611.0 million, reflecting the increase in overall gross profit margin of the residential projects, from 30.0% in FY2017 to 41% in FY2018. The contribution was mainly attributable to the sales of Guangzhou Covent Garden, Guangzhou Foshan Canton First Estate, Shenzhen New World Signature Hill, Wuhan New World Times, Changsha La Ville New World, Langfang New World Garden, Beijing New World Li Zun and Shenyang New World Garden. Of which, the gross profit margin of the key projects located in the Greater Bay Area was 54.6%.
During the year under review, overall property contracted sales in Mainland China reached 798,734 sq m in GFA and RMB16.26 billion in gross sales proceeds, achieving the FY2018 sales target of RMB16 billion. The average selling price of overall residential contracted sales is RMB22,667 per sq m, an increase of 20.9%. The major contributors were Ning Zhu Zun Fu of Ningbo New World, Shenyang New World Garden, Guangzhou Foshan Canton First Estate, Wuhan New World Times, Wuhan New World Guanggu, Beijing New World Li Zun, Langfang New World Garden, Shenzhen New World Signature Hill and Guangzhou Park Paradise.
As for the geographical distribution of contracted sales proceeds, Southern region being the largest contributor, accounted for 26.0%, followed by Central region and Eastern region, accounting for 24.4% and 18.4%, respectively.

New World Development Company Limited Annual Report 2018118
M a n a g e m e n t D i s c u s s i o n a n d A n a l y s i s
Property investmentSegment contributions from property investment amounted to HK$1,923.3 million for FY2018, increased by 8.6%.
Investment property in Hong Kong achieved an overall satisfactory performance. The growth in contribution from key properties including K11 Hong Kong, New World Tower, Telford Plaza, Pearl City and KOHO, together with the commencement of operation in K11 ATELIER at Victoria Dockside and THE FOREST in Mong Kok. Of which, the occupancy of K11 ATELIER has already surpassed 70% in FY2018 and the latest per square foot rental rate has reached HK$110. The decent performance of the abovementioned key properties mitigated the negative effects from the pre-opening expenses incurred from Victoria Dockside, and the renovation expenses of selected projects.
The development of Victoria Dockside, a new global landmark located at the core area of Tsim Sha Tsui waterfront in Kowloon, was progressing well and the project will grand open in the third quarter in 2019.
Segment results in property investment derived from Mainland China increased by 26.8%, it was mainly due to improved contribution from the flagship projects including Wuhan International Trade Towers, Shanghai Hong Kong New World Tower & K11 Shanghai, and the commercial clusters plus serviced apartment in Central Park-view in Guangzhou. Of which, the contribution from Wuhan International Trade Towers increased by 24.3%. In addition, the Group has optimised its internal structure and individual projects have been converted from joint ventures to subsidiaries after the completion of the privatisation of NWCL, which also provide a positive effect on the segment results derived from Mainland China.
ServiceThe service segment recorded a decrease of 27.6% to HK$858.4 million for FY2018.
Enthused by the upbeat property market sentiments, the construction business sustained its healthy growth momentum although the impact could not mitigate the underperformance of the facilities management segment as Free Duty experienced its first ever annual loss as new contract commenced in mid-August 2017 subject to much higher concession fee while GHK Hospital incurred initial operating losses during its ramp-up stage. Nevertheless, the decrease in contribution from transportation business led by the declining fare revenue and escalating operating expenses affected the segment results.
InfrastructureIn FY2018, the infrastructure segment reported contribution of HK$3,801.4 million, increased by 14.7%.
Contribution from road business rose by 32% in FY2018. Discounting the exchange factor, the contribution would have increased by 10% in line with the overall traffic volume growth of 10% as NWSH’s road portfolio continued to benefit from rising vehicle ownership and urbanisation in Mainland China. Most of the NWSH’s expressways in the Pearl River Delta Region continued to register an increase in both traffic volume and toll revenue.
The enlarged portfolio of SNL established after the restructuring in FY2017 continued to provide a broader income base to NWSH, with provision of services ranging from water and wastewater projects, waste treatment to design, engineering and procurement. Derun Environment performed satisfactorily delivered organic growth in both water and waste-to-energy businesses.
Nevertheless, the aviation business still attained double-digit growth from the steadfast expansion of Goshawk. In FY2018, Goshawk’s fleet size grew from 84 to 105 aircraft, while the customer base comprised of 43 airlines in 29 countries.
Hotel operationsIn FY2018, the hotel operations segment recorded loss of HK$76.5 million, the drop was narrowed year-on-year.
The performance in Hong Kong recorded a satisfactory results, which mainly due to the increase in contribution from Grand Hyatt Hong Kong after the overhaul, the enhanced contribution was also recorded in Renaissance Harbour View Hotel, Wan Chai, Hyatt Regency, Tsim Sha Tsui and Hyatt Regency, Sha Tin. Of which, Grand Hyatt Hong Kong achieved the average room rate at HK$3,290 and average occupancy of 83.2% in FY2018, increased by 5.0% and 6.9 percentage points respectively. However, the pre-opening expenses of Rosewood Hong Kong, which is targeted to commencement operations in the first quarter of 2019, has mitigated the growth of the contribution of other key hotels and led to a decrease of 21.1% in Hong Kong portion.

New World Development Company LimitedAnnual Report 2018 119
M a n a g e m e n t D i s c u s s i o n a n d A n a l y s i s
In Mainland China, despite the impact of rising operating costs, the slowdown of economic activities in individual regions and the pre-opening expenses incurred, the loss of the Group’s hotel operations in Mainland China was narrowed due to the improved operations performance together with effective cost saving measures.
Department storesIn FY2018, segment contributions from the department stores amounted to HK$232.4 million, increased by 5.6%. Despite the competition from e-commerce and shopping malls, together with the increasingly diverse consumer demands and rising operating cost, through the implementation of a series of cost control measures and the unique new operations strategies to connect with the evolving business environment, NWDS enhanced its overall operation performance.
OthersIn FY2018, other businesses reported segment loss of HK$369.9 million, decreased by 278.0%, which was mainly due to the Group’s investment in a perpetual security was fully redeemed by the issuer in FY2017, as the results, interest income from the abovementioned investment no longer exist in FY2018. Nevertheless, the dividend income received also recorded a drop.
Other gainsNet other gains were increased by 864.4% to HK$4,133.4 million in FY2018.
In FY2017, the key attributes include the gain on deemed disposal of SNL and the remeasurement of previously held interests upon completion of acquiring further 50% interest in NWST by NWSH in December 2016.
In FY2018, the key attributes include 1) the disposal of subsidiaries, which is mainly related to two hotels in Shanghai, Tonkin street residential development project and carparks in Hong Kong; 2) gain on partial disposal and remeasurement of interests in BCIA, an associated company of the Group prior to partial disposal and 3) reversal of other payables.
Changes in fair value of investment propertiesThe Group reported a fair-value change of HK$15,367.1 million in FY2018 for its investment properties which is benefited by the robust office market outlook with continuous low vacancy rate recorded together with the rebound in Hong Kong retail market.
For the Group’s investment property portfolio, over 90% of the contribution were recorded in Hong Kong segment and the increase was mainly attributable to Victoria Dockside together with the enhancement of the flagship properties in Hong Kong especially in office sector.
TaxationTaxation for FY2018 amounted to HK$6,272.4 million, increased by 31.9%, it was mainly due to the increase in taxation in Mainland China and overseas, together with Land Appreciation Tax in Mainland China.

New World Development Company Limited Annual Report 2018120
M a n a g e m e n t D i s c u s s i o n a n d A n a l y s i s
LIQUIDITY AND CAPITAL RESOURCESNet Debt
FY2018 FY2017HK$m HK$m
Consolidated net debt 74,859.0 76,870.2
NWSH (Stock Code: 0659) 3,518.0 3,229.3
NWDS – net cash and bank balances (Stock Code: 0825) (703.6) (869.5)
Net debt (exclude listed subsidiaries) 72,044.6 74,510.4
The Group’s debts were primarily denominated in Hong Kong dollar and Renminbi. In respect of the Group’s operations in Mainland China, the Group maintains an appropriate level of external borrowings in Renminbi for natural hedging of Renminbi attributed to those projects. The Renminbi currency exposure of the Group is mainly derived from the translation of non-current assets and liabilities of the subsidiaries, associated companies and joint ventures in Mainland China with functional currency of Renminbi and the Renminbi deposits held for future development costs to be expended to Hong Kong Dollar. As at 30 June 2018, the translation of non-current assets and liabilities of subsidiaries, associated companies and joint ventures with functional currency other than Hong Kong Dollar to Hong Kong Dollar by using exchange rates at that day resulted a gain of HK$4,832.6 million is recognised in equity. Apart from this, the Group does not have any material foreign exchange exposure.
The Group’s borrowings were mainly arranged on a floating rate basis. The Group used interest rate swaps and foreign currency swaps and forward contracts to hedge part of the Group’s underlying interest rate and foreign exchange exposure. As at 30 June 2018, the Group had outstanding derivative instruments in the amounts of HK$10,100.0 million and US$600.0 million (equivalent to approximately HK$4,662.0 million) and had outstanding foreign currency swaps and forward contracts in the amounts of HK$7,948.7 million. Fuel price swap contracts are also used to hedge against the upside risk of fuel prices of the Group’s transport business in the Service segment.
A wholly-owned subsidiary of the Group redeemed the RMB3,000.0 million (equivalent to approximately HK$3,614.5 million) 5.5% bonds due 2018 (stock code: 85914) at principal amount upon maturity on 6 February 2018.
As at 30 June 2018, the Group’s cash and bank balances (including restricted bank balances) stood at HK$63,456.1 million (2017: HK$67,106.5 million) and the consolidated net debt amounted to HK$74,859.0 million (2017: HK$76,870.2 million). The net debt to equity ratio was 29.3%, a decrease of 5.5 percentage points as compared with FY2017.
As at 30 June 2018, the Group’s long-term bank loans, other loans and fixed rate bonds and notes payable amounted to HK$131,454.1 million. Short-term bank and other loans as at 30 June 2018 were HK$6,861.0 million. The maturity of bank loans, other loans, and fixed rate bonds and notes payable as at 30 June 2018 was as follows:
HK$m
Within one year 18,712.5
In the second year 28,454.3
In the third to fifth year 74,521.6
After the fifth year 16,626.7
Total 138,315.1
Equity of the Group as at 30 June 2018 increased to HK$255,181.9 million against HK$220,944.5 million as at 30 June 2017.
It is expected that equity raising is not necessary for the Group in the foreseeable future.
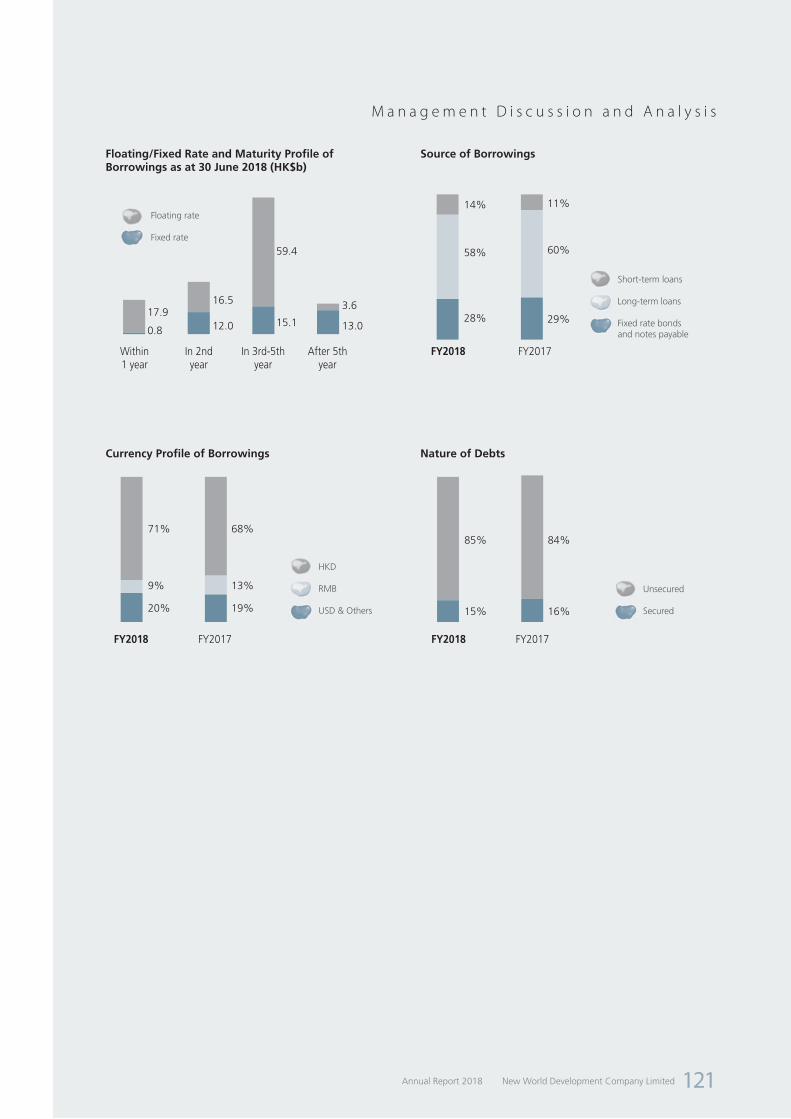
New World Development Company LimitedAnnual Report 2018 121
M a n a g e m e n t D i s c u s s i o n a n d A n a l y s i s
Floating/Fixed Rate and Maturity Profile ofBorrowings as at 30 June 2018 (HK$b)
17.9
0.8
16.5
12.0
59.4
15.1 13.0
3.6
Currency Profile of Borrowings
71% 68%
13%
19%
9%
20%
Source of Borrowings
14% 11%
60%
29%
58%
28%
Nature of Debts
85% 84%
16%15%
FY2018
FY2018 FY2018
Within1 year
After 5thyear
In 3rd-5thyear
In 2ndyear
FY2017
FY2017 FY2017
Floating rate
Fixed rate
Unsecured
Secured
HKD
RMB
USD & Others
Short-term loans
Long-term loans
Fixed rate bonds and notes payable

New World Development Company Limited Annual Report 2018122
Independent Auditor’s Report
INDEPENDENT AUDITOR’S REPORT TO THE MEMBERS OF NEW WORLD DEVELOPMENT COMPANY LIMITED(incorporated in Hong Kong with limited liability)
OPINION
What we have auditedThe consolidated financial statements of New World Development Company Limited (the “Company”) and its subsidiaries (the “Group”) set out on pages 128 to 238, which comprise:
• the consolidated statement of financial position as at 30 June 2018;
• the consolidated income statement for the year then ended;
• the consolidated statement of comprehensive income for the year then ended;
• the consolidated statement of changes in equity for the year then ended;
• the consolidated statement of cash flows for the year then ended; and
• the notes to the consolidated financial statements, which include a summary of significant accounting policies.
Our opinionIn our opinion, the consolidated financial statements give a true and fair view of the consolidated financial position of the Group as at 30 June 2018, and of its consolidated financial performance and its consolidated cash flows for the year then ended in accordance with Hong Kong Financial Reporting Standards (“HKFRSs”) issued by the Hong Kong Institute of Certified Public Accountants (“HKICPA”) and have been properly prepared in compliance with the Hong Kong Companies Ordinance.
BASIS OF OPINION
We conducted our audit in accordance with Hong Kong Standards on Auditing (“HKSAs”) issued by the HKICPA. Our responsibilities under those standards are further described in the Auditor’s Responsibilities for the Audit of the Consolidated Financial Statements section of our report.
We believe that the audit evidence we have obtained is sufficient and appropriate to provide a basis for our opinion.
IndependenceWe are independent of the Group in accordance with the HKICPA’s Code of Ethics for Professional Accountants (“the Code”), and we have fulfilled our other ethical responsibilities in accordance with the Code.

New World Development Company LimitedAnnual Report 2018 123
I n d e p e n d e n t A u d i t o r ’ s R e p o r t
KEY AUDIT MATTERS
Key audit matters are those matters that, in our professional judgement, were of most significance in our audit of the consolidated financial statements of the current period. These matters were addressed in the context of our audit of the consolidated financial statements as a whole, and in forming our opinion thereon, and we do not provide a separate opinion on these matters.
Key audit matters identified in our audit are summarised as follows:
• Valuation of investment properties held by the Group and its joint ventures and associated companies;
• Recoverability of properties for/under development and properties held for sale held by the Group and its joint ventures; and
• Impairment of the Group’s interests in joint ventures and associated companies.
Key Audit Matter How our audit addressed the Key Audit Matter
Valuation of investment properties held by the Group and its joint ventures and associated companies
Refer to notes 6(b), 7 and 17 to the consolidated financial statements.
As at 30 June 2018, the investment properties held by the Group and its joint ventures and associated companies were significant to the Group and were stated at fair value. Changes in fair value were recognised in the consolidated income statement.
Independent external valuers were engaged to determine the fair value of investment properties held by the Group and its joint ventures and associated companies as at 30 June 2018.
For completed investment properties, fair value was generally derived by the income capitalisation method and where appropriate, by direct comparison method. Income capitalisation method was based on the capitalisation of the net income and reversionary income potential by adopting appropriate capitalisation rates and prevailing market rents. Direct comparison method was based on comparable market transactions, as adjusted by the property-specific qualitative factors.
For investment properties under construction, fair value was derived using the residual method by deducting development costs together with developer’s profit and risk margins from the estimated capital value of the proposed development assuming completed as at the date of valuation.
We focused on this area due to the fact that there are significant judgements and estimates involved in the valuation of investment properties.
Our procedures in relation to the valuation of investment properties included:
• We assessed the competence, capability and objectivity of the independent external valuers;
• We obtained the valuation reports and met the independent external valuers to discuss the valuation methodologies and key assumptions;
• We involved our in-house valuation experts and assessed the valuation methodologies and the reasonableness of the key assumptions used in the valuation of investment properties, based on our knowledge of the property industry, research evidence of capitalisation rates, prevailing market rents and comparable market transactions for similar properties, where applicable; and
• We tested, on a sample basis, the data used in the valuation of investment properties, including rental rates from existing tenancies and estimated cost to complete, by agreeing them to the underlying agreements with the tenants and approved budgets, respectively. We also compared the estimated developer’s profit and risk margins to historical records, where appropriate.
Based on the procedures performed, we found the methodologies used in preparing the valuations were appropriate and the key assumptions were supportable in light of available evidence.

New World Development Company Limited Annual Report 2018124
I n d e p e n d e n t A u d i t o r ’ s R e p o r t
Key Audit Matter How our audit addressed the Key Audit Matter
Recoverability of properties for/under development and properties held for sale held by the Group and its joint ventures
Refer to notes 6(c) and 29 to the consolidated financial statements.
As at 30 June 2018, the carrying values of the Group’s properties for development, properties under development and properties held for sale amounted to HK$19,656.2 million, HK$37,171.0 million and HK$42,301.2 million respectively. The Group also has significant property development projects for sale held by its joint ventures.
Management assessed the recoverability of the property portfolios held for sale by the Group and its joint ventures based on estimates of the net realisable values of the underlying properties. These involve the estimation of selling prices of the properties based on current market prices of properties of comparable locations and conditions and the construction costs to complete the properties for/under development based on the existing development plans. Management concluded that the current level of provision for the properties for/under development and properties held for sale as at 30 June 2018 was appropriate.
If the estimated net realisable values of the underlying properties were significantly different from their carrying values as a result of changes in market conditions and/or significant variation in the budgeted development costs, material reversal or impairment provision for properties for/under development and properties held for sale may result. Accordingly, the existence of significant estimates warrants specific audit focus and attention on this area.
Our procedures in relation to management’s assessment of recoverability of properties for/under development and properties held for sale included:
• We evaluated and tested the operating effectiveness of key controls around the property development cycle with particular focus on, but not limited to, controls over cost budgeting for estimated costs to completion, where applicable;
• We evaluated management’s assessment on the recoverability of property portfolios, with particular focus on properties with relatively low gross profit margins or those with cost exceeding the net realisable value; and
• We assessed the reasonableness of key assumptions and estimates in management’s assessment including:
(i) For the estimated selling prices, we compared, on a sample basis, to the contracted selling prices of the underlying properties or current market prices of properties of comparable locations and conditions, where applicable; and
(ii) For the estimated costs to completion, we assessed the reasonableness of the latest budgets of total construction costs and tested, on a sample basis, the construction costs to committed contracts and other supporting documentation.
Based on the procedures performed, we found the key assumptions in the recoverability assessment were supportable in light of available evidence.
KEY AUDIT MATTERS (CONTINUED)

New World Development Company LimitedAnnual Report 2018 125
I n d e p e n d e n t A u d i t o r ’ s R e p o r t
Key Audit Matter How our audit addressed the Key Audit Matter
Impairment of the Group’s interests in joint ventures and associated companies
Refer to notes 6(d), 22 and 23 to the consolidated financial statements.
As at 30 June 2018, the carrying values of the Group’s interests in joint ventures and associated companies amounted to HK$49,135.8 million and HK$24,708.2 million respectively. Management reviewed regularly whether there are any indicators of impairment of the investments by reference to the requirements under HKAS 28 (2011) “Investments in Associates and Joint Ventures” and HKAS 36 “Impairment of Assets”.
For investments where impairment indicators exist, management estimated the recoverable amounts of those investments, being higher of value in use or fair value less costs of disposal. The value in use is determined based on the discounted cash flow projections. Significant judgements are required to determine the key assumptions used in the discounted cash flow models, such as revenue growth, unit price and discount rates. Independent external valuers were also involved in certain value in use assessments, where management considered necessary. Based on the results of these impairment assessments, impairment losses were recognised for the underlying assets of certain joint ventures and the Group’s share of such impairment losses, in aggregate, of HK$600 million, which have been included in the Group’s share of results of joint ventures for the year ended 30 June 2018 and the Group considered no further impairment is required in respect of the carrying values of the Group’s interests in joint ventures and associated companies.
The Group has certain associated companies, whose assets principally included available-for-sale financial assets and loans and receivables. Management carried out impairment assessments on the underlying available-for-sale financial assets and loans and receivables held by these associated companies. Based on the results of the impairment assessments, management concluded that no impairment provision is needed.
As the impairment assessment involves s ignif icant judgements and estimates, we regard this as a key audit matter.
Our procedures in assessing the management’s judgement for the impairment assessments of the Group’s interests in joint ventures and associated companies included:
• We evaluated the competence, capabil it ies and objectivity of the independent external valuers, where applicable;
• With the support of our in-house valuation experts, we assessed the appropriateness of the valuation methodology and the reasonableness of the key assumptions adopted in the cash flow projections;
• We assessed the reasonableness of the discount rates applied by the management in the discounted cash flow models by comparing to external market data and publicly available information;
• We checked the key assumptions to external market data or other supporting evidence where available;
• We performed sensitivity analysis on the key assumptions adopted in the impairment assessments to understand the impact of reasonable changes in assumptions on the estimated recoverable amounts; and
• We eva luated management ’s assessments on impairment of underlying available-for-sale financial assets and the recoverability assessment on underlying loans and receivables held by the Group’s associated companies which take into account the repayment histories of the borrowers, credit worthiness, value of the pledged assets and subsequent settlement of loans and receivables, if applicable.
Based on the p rocedure s pe r fo rmed , we found management’s impairment assessments relating to the Group’s interests in joint ventures and associated companies were supported by available evidence.
KEY AUDIT MATTERS (CONTINUED)

New World Development Company Limited Annual Report 2018126
I n d e p e n d e n t A u d i t o r ’ s R e p o r t
OTHER INFORMATION
The directors of the Company are responsible for the other information. The other information comprises all of the information included in the annual report other than the consolidated financial statements and our auditor’s report thereon.
Our opinion on the consolidated financial statements does not cover the other information and we do not express any form of assurance conclusion thereon.
In connection with our audit of the consolidated financial statements, our responsibility is to read the other information and, in doing so, consider whether the other information is materially inconsistent with the consolidated financial statements or our knowledge obtained in the audit or otherwise appears to be materially misstated.
If, based on the work we have performed, we conclude that there is a material misstatement of this other information, we are required to report that fact. We have nothing to report in this regard.
RESPONSIBILITIES OF DIRECTORS AND AUDIT COMMITTEE FOR THE CONSOLIDATED FINANCIAL STATEMENTS
The directors of the Company are responsible for the preparation of the consolidated financial statements that give a true and fair view in accordance with HKFRSs issued by the HKICPA and the Hong Kong Companies Ordinance, and for such internal control as the directors determine is necessary to enable the preparation of consolidated financial statements that are free from material misstatement, whether due to fraud or error.
In preparing the consolidated financial statements, the directors are responsible for assessing the Group’s ability to continue as a going concern, disclosing, as applicable, matters related to going concern and using the going concern basis of accounting unless the directors either intend to liquidate the Group or to cease operations, or have no realistic alternative but to do so.
The Audit Committee is responsible for overseeing the Group’s financial reporting process.
AUDITOR’S RESPONSIBILITIES FOR THE AUDIT OF THE CONSOLIDATED FINANCIAL STATEMENTS
Our objectives are to obtain reasonable assurance about whether the consolidated financial statements as a whole are free from material misstatement, whether due to fraud or error, and to issue an auditor’s report that includes our opinion. We report our opinion solely to you, as a body, in accordance with Section 405 of the Hong Kong Companies Ordinance and for no other purpose. We do not assume responsibility towards or accept liability to any other person for the contents of this report. Reasonable assurance is a high level of assurance, but is not a guarantee that an audit conducted in accordance with HKSAs will always detect a material misstatement when it exists. Misstatements can arise from fraud or error and are considered material if, individually or in the aggregate, they could reasonably be expected to influence the economic decisions of users taken on the basis of these consolidated financial statements.
As part of an audit in accordance with HKSAs, we exercise professional judgement and maintain professional scepticism throughout the audit. We also:
• Identify and assess the risks of material misstatement of the consolidated financial statements, whether due to fraud or error, design and perform audit procedures responsive to those risks, and obtain audit evidence that is sufficient and appropriate to provide a basis for our opinion. The risk of not detecting a material misstatement resulting from fraud is higher than for one resulting from error, as fraud may involve collusion, forgery, intentional omissions, misrepresentations, or the override of internal control.
• Obtain an understanding of internal control relevant to the audit in order to design audit procedures that are appropriate in the circumstances, but not for the purpose of expressing an opinion on the effectiveness of the Group’s internal control.
• Evaluate the appropriateness of accounting policies used and the reasonableness of accounting estimates and related disclosures made by the directors.
• Conclude on the appropriateness of the directors’ use of the going concern basis of accounting and, based on the audit evidence obtained, whether a material uncertainty exists related to events or conditions that may cast significant doubt on the Group’s ability to continue as a going concern. If we conclude that a material uncertainty exists, we are required to draw attention in our auditor’s report to the related disclosures in the consolidated financial statements or, if such disclosures are inadequate, to modify our opinion. Our conclusions are based on the audit evidence obtained up to the date of our auditor’s report. However, future events or conditions may cause the Group to cease to continue as a going concern.
New World Development Company LimitedAnnual Report 2018 127
I n d e p e n d e n t A u d i t o r ’ s R e p o r t
AUDITOR’S RESPONSIBILITIES FOR THE AUDIT OF THE CONSOLIDATED FINANCIAL STATEMENTS (CONTINUED)
• Evaluate the overall presentation, structure and content of the consolidated financial statements, including the disclosures, and whether the consolidated financial statements represent the underlying transactions and events in a manner that achieves fair presentation.
• Obtain sufficient appropriate audit evidence regarding the financial information of the entities or business activities within the Group to express an opinion on the consolidated financial statements. We are responsible for the direction, supervision and performance of the group audit. We remain solely responsible for our audit opinion.
We communicate with the Audit Committee regarding, among other matters, the planned scope and timing of the audit and significant audit findings, including any significant deficiencies in internal control that we identify during our audit.
We also provide the Audit Committee with a statement that we have complied with relevant ethical requirements regarding independence, and to communicate with them all relationships and other matters that may reasonably be thought to bear on our independence, and where applicable, related safeguards.
From the matters communicated with the Audit Committee, we determine those matters that were of most significance in the audit of the consolidated financial statements of the current period and are therefore the key audit matters. We describe these matters in our auditor’s report unless law or regulation precludes public disclosure about the matter or when, in extremely rare circumstances, we determine that a matter should not be communicated in our report because the adverse consequences of doing so would reasonably be expected to outweigh the public interest benefits of such communication.
The engagement partner on the audit resulting in this independent auditor’s report is Mr. Ho Chi Keung.
PricewaterhouseCoopersCertified Public Accountants
Hong Kong, 20 September 2018

New World Development Company Limited Annual Report 2018128
Consolidated Income StatementFor the year ended 30 June 2018
2018 2017Note HK$m HK$m
Revenues 7 60,688.7 56,628.8
Cost of sales (40,125.3) (38,413.2)
Gross profit 20,563.4 18,215.6
Other income 8 137.3 528.8
Other gains, net 9 4,133.4 428.6
Selling and marketing expenses (1,083.8) (1,376.6)
Administrative and other operating expenses (8,142.1) (7,408.9)
Changes in fair value of investment properties 17 15,367.1 1,363.8
Operating profit 10 30,975.3 11,751.3
Financing income 1,475.2 1,705.9
Financing costs 11 (2,179.5) (2,152.0)
30,271.0 11,305.2
Share of results of
Joint ventures 1,886.2 2,029.7
Associated companies 1,196.4 1,895.4
Profit before taxation 33,353.6 15,230.3
Taxation 12 (6,272.4) (4,755.6)
Profit for the year 27,081.2 10,474.7
Attributable to:
Shareholders of the Company 39 23,338.1 7,675.7
Holders of perpetual capital securities 536.6 395.9
Non-controlling interests 3,206.5 2,403.1
27,081.2 10,474.7
Earnings per share 13
Basic HK$2.34 HK$0.80
Diluted HK$2.33 HK$0.80

New World Development Company LimitedAnnual Report 2018 129
Consolidated Statement of Comprehensive IncomeFor the year ended 30 June 2018
2018 2017HK$m HK$m
Profit for the year 27,081.2 10,474.7 Other comprehensive income
Items that will not be reclassified to profit or loss
Revaluation of investment properties upon reclassification from property, plant and equipment and land use rights 3,539.5 554.9
— deferred tax arising from revaluation thereof (4.0) (92.2)
Remeasurement of post employment benefit obligation 24.7 24.0
Items that had been reclassified/may be reclassified subsequently toprofit or loss
Fair value changes of available-for-sale financial assets (846.9) 501.6
Release of investment revaluation deficit to the consolidated income statement upon impairment of available-for-sale financial assets 7.1 60.2
Release of reserve upon disposal of available-for-sale financial assets (78.9) 73.5
Release of reserve upon disposal of subsidiaries (155.9) (35.4)
Release of reserve upon deemed disposal of interests in joint ventures – 5.7
Release of reserves upon remeasurement of previously held equity interest in a joint venture – 35.6
Release of reserve upon deregistration of subsidiaries (60.6) (15.3)
Release of reserve upon return of registered capital of a subsidiary (22.5) –
Release of reserves upon disposal of interests in joint ventures andassociated companies 36.3 (135.4)
Release of reserves upon reclassification of an associated company toan available-for-sale financial asset 53.6 –
Share of other comprehensive income of joint ventures and associated companies 872.3 (344.4)
Cash flow hedges 83.9 253.8
Translation differences 3,964.4 (1,576.8)
Other comprehensive income for the year 7,413.0 (690.2)
Total comprehensive income for the year 34,494.2 9,784.5
Attributable to:
Shareholders of the Company 30,454.8 7,145.2
Holders of perpetual capital securities 536.6 395.9
Non-controlling interests 3,502.8 2,243.4
34,494.2 9,784.5
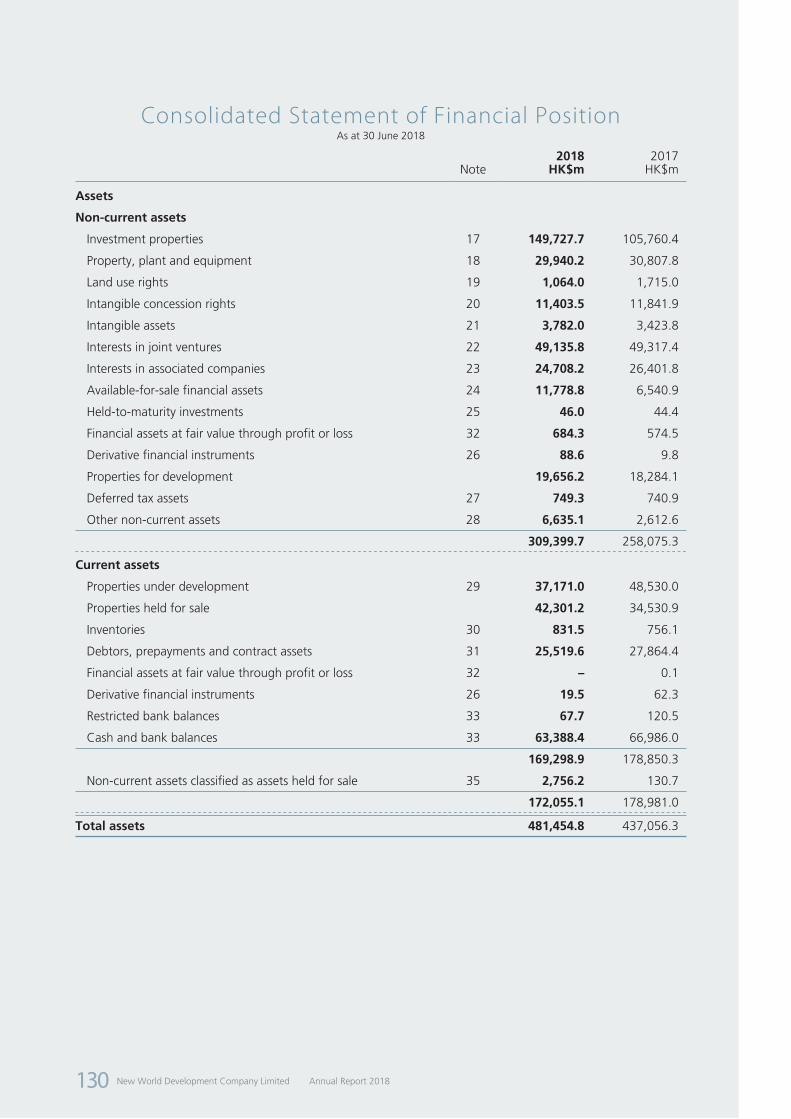
New World Development Company Limited Annual Report 2018130
Consolidated Statement of Financial PositionAs at 30 June 2018
2018 2017Note HK$m HK$m
Assets
Non-current assets
Investment properties 17 149,727.7 105,760.4
Property, plant and equipment 18 29,940.2 30,807.8
Land use rights 19 1,064.0 1,715.0
Intangible concession rights 20 11,403.5 11,841.9
Intangible assets 21 3,782.0 3,423.8
Interests in joint ventures 22 49,135.8 49,317.4
Interests in associated companies 23 24,708.2 26,401.8
Available-for-sale financial assets 24 11,778.8 6,540.9
Held-to-maturity investments 25 46.0 44.4
Financial assets at fair value through profit or loss 32 684.3 574.5
Derivative financial instruments 26 88.6 9.8
Properties for development 19,656.2 18,284.1
Deferred tax assets 27 749.3 740.9
Other non-current assets 28 6,635.1 2,612.6
309,399.7 258,075.3 Current assets
Properties under development 29 37,171.0 48,530.0
Properties held for sale 42,301.2 34,530.9
Inventories 30 831.5 756.1
Debtors, prepayments and contract assets 31 25,519.6 27,864.4
Financial assets at fair value through profit or loss 32 – 0.1
Derivative financial instruments 26 19.5 62.3
Restricted bank balances 33 67.7 120.5
Cash and bank balances 33 63,388.4 66,986.0
169,298.9 178,850.3
Non-current assets classified as assets held for sale 35 2,756.2 130.7
172,055.1 178,981.0
Total assets 481,454.8 437,056.3

New World Development Company LimitedAnnual Report 2018 131
C o n s o l i d a t e d S t a t e m e n t o f F i n a n c i a l P o s i t i o nAs at 30 June 2018
2018 2017Note HK$m HK$m
Equity
Share capital 36 77,525.9 73,233.6
Reserves 39 138,724.0 112,857.6
Shareholders’ funds 216,249.9 186,091.2
Perpetual capital securities 37 9,451.8 9,451.8
Non-controlling interests 38 29,480.2 25,401.5
Total equity 255,181.9 220,944.5
Liabilities
Non-current liabilities
Long-term borrowings 40 120,123.6 125,895.3
Deferred tax liabilities 27 10,287.9 9,327.2
Derivative financial instruments 26 365.6 631.3
Other non-current liabilities 41 806.5 757.4
131,583.6 136,611.2 Current liabilities
Creditors, accrued charges and contract liabilities 42 65,059.0 50,735.2
Current portion of long-term borrowings 40 11,851.5 14,857.9
Derivative financial instruments 26 – 36.1
Short-term borrowings 40 8,777.6 6,366.7
Current tax payable 8,992.4 7,504.7
94,680.5 79,500.6
Liabilities directly associated with non-current assets classified as assets held for sale 35 8.8 –
94,689.3 79,500.6
Total liabilities 226,272.9 216,111.8
Total equity and liabilities 481,454.8 437,056.3
Dr. Cheng Kar-Shun, Henry Dr. Cheng Chi-Kong, AdrianDirector Director
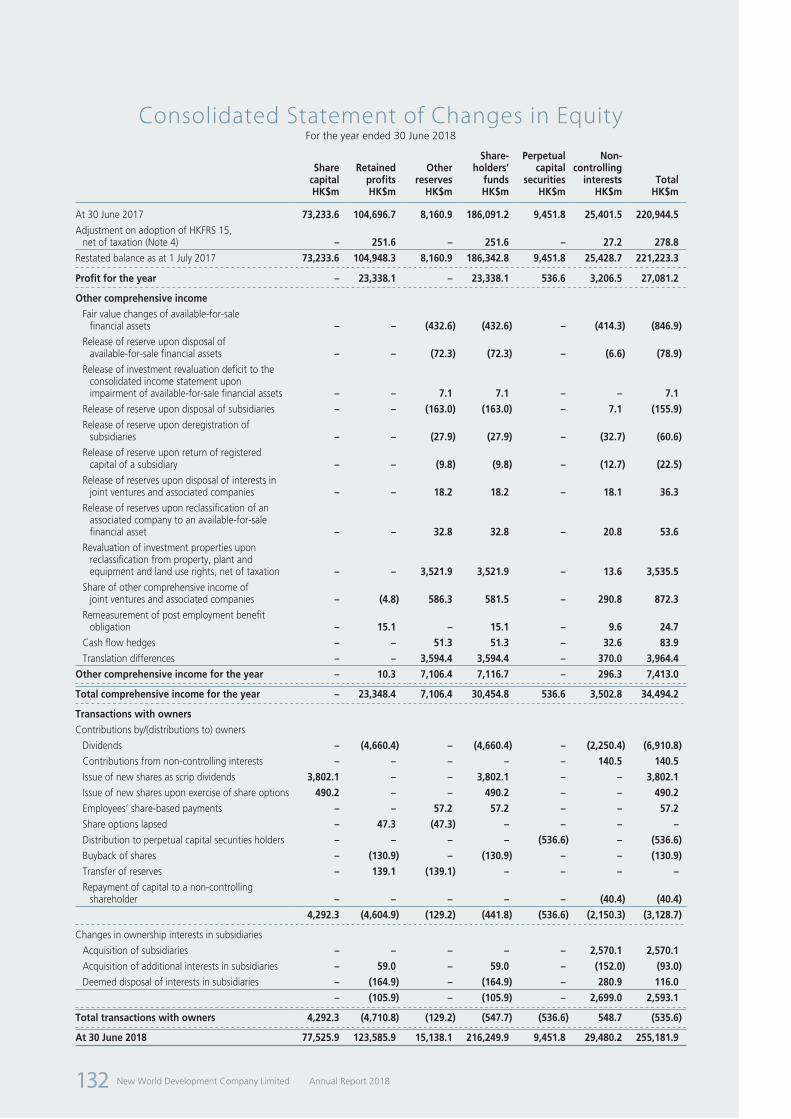
New World Development Company Limited Annual Report 2018132
Consolidated Statement of Changes in EquityFor the year ended 30 June 2018
Sharecapital
Retainedprofits
Otherreserves
Share-holders’
funds
Perpetualcapital
securities
Non-controlling
interests TotalHK$m HK$m HK$m HK$m HK$m HK$m HK$m
At 30 June 2017 73,233.6 104,696.7 8,160.9 186,091.2 9,451.8 25,401.5 220,944.5Adjustment on adoption of HKFRS 15,
net of taxation (Note 4) – 251.6 – 251.6 – 27.2 278.8Restated balance as at 1 July 2017 73,233.6 104,948.3 8,160.9 186,342.8 9,451.8 25,428.7 221,223.3 Profit for the year – 23,338.1 – 23,338.1 536.6 3,206.5 27,081.2 Other comprehensive income
Fair value changes of available-for-salefinancial assets – – (432.6) (432.6) – (414.3) (846.9)
Release of reserve upon disposal ofavailable-for-sale financial assets – – (72.3) (72.3) – (6.6) (78.9)
Release of investment revaluation deficit to the consolidated income statement upon impairment of available-for-sale financial assets – – 7.1 7.1 – – 7.1
Release of reserve upon disposal of subsidiaries – – (163.0) (163.0) – 7.1 (155.9)Release of reserve upon deregistration of
subsidiaries – – (27.9) (27.9) – (32.7) (60.6)Release of reserve upon return of registered
capital of a subsidiary – – (9.8) (9.8) – (12.7) (22.5)Release of reserves upon disposal of interests in
joint ventures and associated companies – – 18.2 18.2 – 18.1 36.3Release of reserves upon reclassification of an
associated company to an available-for-sale financial asset – – 32.8 32.8 – 20.8 53.6
Revaluation of investment properties upon reclassification from property, plant and equipment and land use rights, net of taxation – – 3,521.9 3,521.9 – 13.6 3,535.5
Share of other comprehensive income of joint ventures and associated companies – (4.8) 586.3 581.5 – 290.8 872.3
Remeasurement of post employment benefit obligation – 15.1 – 15.1 – 9.6 24.7
Cash flow hedges – – 51.3 51.3 – 32.6 83.9Translation differences – – 3,594.4 3,594.4 – 370.0 3,964.4
Other comprehensive income for the year – 10.3 7,106.4 7,116.7 – 296.3 7,413.0 Total comprehensive income for the year – 23,348.4 7,106.4 30,454.8 536.6 3,502.8 34,494.2 Transactions with ownersContributions by/(distributions to) owners
Dividends – (4,660.4) – (4,660.4) – (2,250.4) (6,910.8)Contributions from non-controlling interests – – – – – 140.5 140.5Issue of new shares as scrip dividends 3,802.1 – – 3,802.1 – – 3,802.1Issue of new shares upon exercise of share options 490.2 – – 490.2 – – 490.2Employees’ share-based payments – – 57.2 57.2 – – 57.2Share options lapsed – 47.3 (47.3) – – – –Distribution to perpetual capital securities holders – – – – (536.6) – (536.6)Buyback of shares – (130.9) – (130.9) – – (130.9)Transfer of reserves – 139.1 (139.1) – – – –Repayment of capital to a non-controlling
shareholder – – – – – (40.4) (40.4)4,292.3 (4,604.9) (129.2) (441.8) (536.6) (2,150.3) (3,128.7)
Changes in ownership interests in subsidiaries
Acquisition of subsidiaries – – – – – 2,570.1 2,570.1Acquisition of additional interests in subsidiaries – 59.0 – 59.0 – (152.0) (93.0)Deemed disposal of interests in subsidiaries – (164.9) – (164.9) – 280.9 116.0
– (105.9) – (105.9) – 2,699.0 2,593.1 Total transactions with owners 4,292.3 (4,710.8) (129.2) (547.7) (536.6) 548.7 (535.6) At 30 June 2018 77,525.9 123,585.9 15,138.1 216,249.9 9,451.8 29,480.2 255,181.9
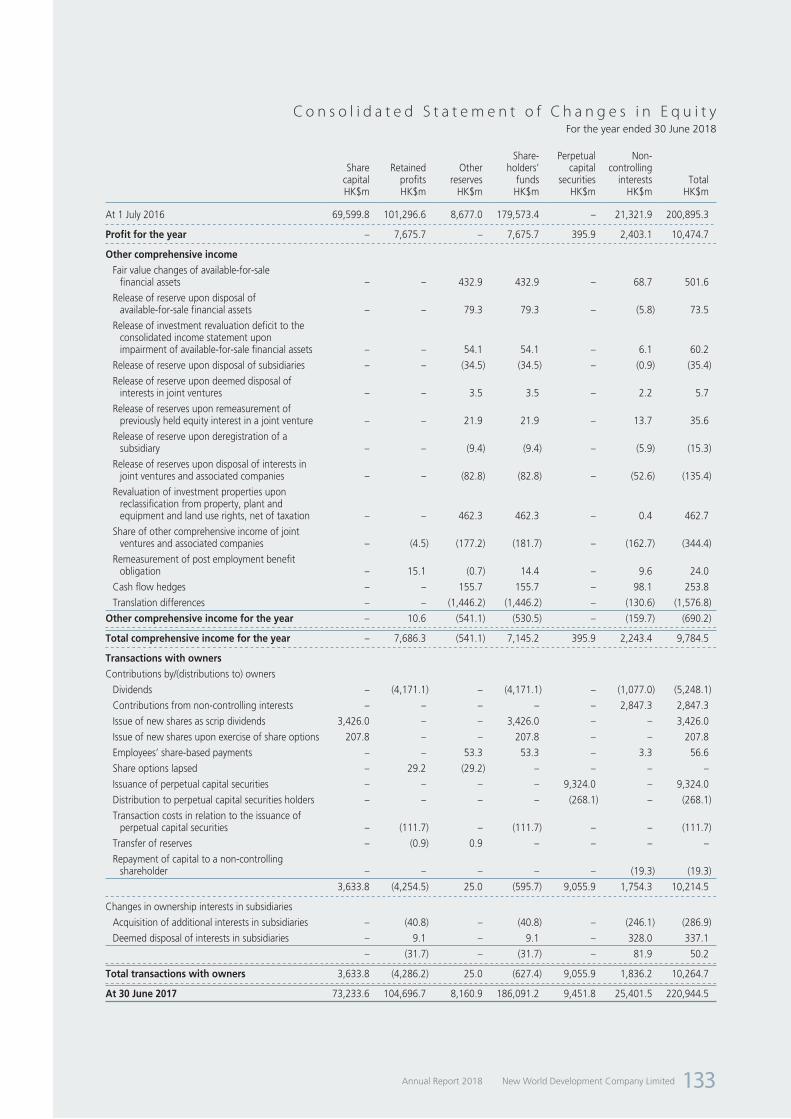
New World Development Company LimitedAnnual Report 2018 133
C o n s o l i d a t e d S t a t e m e n t o f C h a n g e s i n E q u i t yFor the year ended 30 June 2018
Sharecapital
Retainedprofits
Otherreserves
Share-holders’
funds
Perpetualcapital
securities
Non-controlling
interests TotalHK$m HK$m HK$m HK$m HK$m HK$m HK$m
At 1 July 2016 69,599.8 101,296.6 8,677.0 179,573.4 – 21,321.9 200,895.3 Profit for the year – 7,675.7 – 7,675.7 395.9 2,403.1 10,474.7 Other comprehensive income
Fair value changes of available-for-sale financial assets – – 432.9 432.9 – 68.7 501.6
Release of reserve upon disposal of available-for-sale financial assets – – 79.3 79.3 – (5.8) 73.5
Release of investment revaluation deficit to the consolidated income statement upon impairment of available-for-sale financial assets – – 54.1 54.1 – 6.1 60.2
Release of reserve upon disposal of subsidiaries – – (34.5) (34.5) – (0.9) (35.4)
Release of reserve upon deemed disposal of interests in joint ventures – – 3.5 3.5 – 2.2 5.7
Release of reserves upon remeasurement of previously held equity interest in a joint venture – – 21.9 21.9 – 13.7 35.6
Release of reserve upon deregistration of a subsidiary – – (9.4) (9.4) – (5.9) (15.3)
Release of reserves upon disposal of interests in joint ventures and associated companies – – (82.8) (82.8) – (52.6) (135.4)
Revaluation of investment properties upon reclassification from property, plant and equipment and land use rights, net of taxation – – 462.3 462.3 – 0.4 462.7
Share of other comprehensive income of joint ventures and associated companies – (4.5) (177.2) (181.7) – (162.7) (344.4)
Remeasurement of post employment benefit obligation – 15.1 (0.7) 14.4 – 9.6 24.0
Cash flow hedges – – 155.7 155.7 – 98.1 253.8
Translation differences – – (1,446.2) (1,446.2) – (130.6) (1,576.8)
Other comprehensive income for the year – 10.6 (541.1) (530.5) – (159.7) (690.2) Total comprehensive income for the year – 7,686.3 (541.1) 7,145.2 395.9 2,243.4 9,784.5 Transactions with ownersContributions by/(distributions to) owners
Dividends – (4,171.1) – (4,171.1) – (1,077.0) (5,248.1)
Contributions from non-controlling interests – – – – – 2,847.3 2,847.3
Issue of new shares as scrip dividends 3,426.0 – – 3,426.0 – – 3,426.0
Issue of new shares upon exercise of share options 207.8 – – 207.8 – – 207.8
Employees’ share-based payments – – 53.3 53.3 – 3.3 56.6
Share options lapsed – 29.2 (29.2) – – – –
Issuance of perpetual capital securities – – – – 9,324.0 – 9,324.0
Distribution to perpetual capital securities holders – – – – (268.1) – (268.1)
Transaction costs in relation to the issuance of perpetual capital securities – (111.7) – (111.7) – – (111.7)
Transfer of reserves – (0.9) 0.9 – – – –
Repayment of capital to a non-controlling shareholder – – – – – (19.3) (19.3)
3,633.8 (4,254.5) 25.0 (595.7) 9,055.9 1,754.3 10,214.5 Changes in ownership interests in subsidiaries
Acquisition of additional interests in subsidiaries – (40.8) – (40.8) – (246.1) (286.9)
Deemed disposal of interests in subsidiaries – 9.1 – 9.1 – 328.0 337.1
– (31.7) – (31.7) – 81.9 50.2 Total transactions with owners 3,633.8 (4,286.2) 25.0 (627.4) 9,055.9 1,836.2 10,264.7 At 30 June 2017 73,233.6 104,696.7 8,160.9 186,091.2 9,451.8 25,401.5 220,944.5
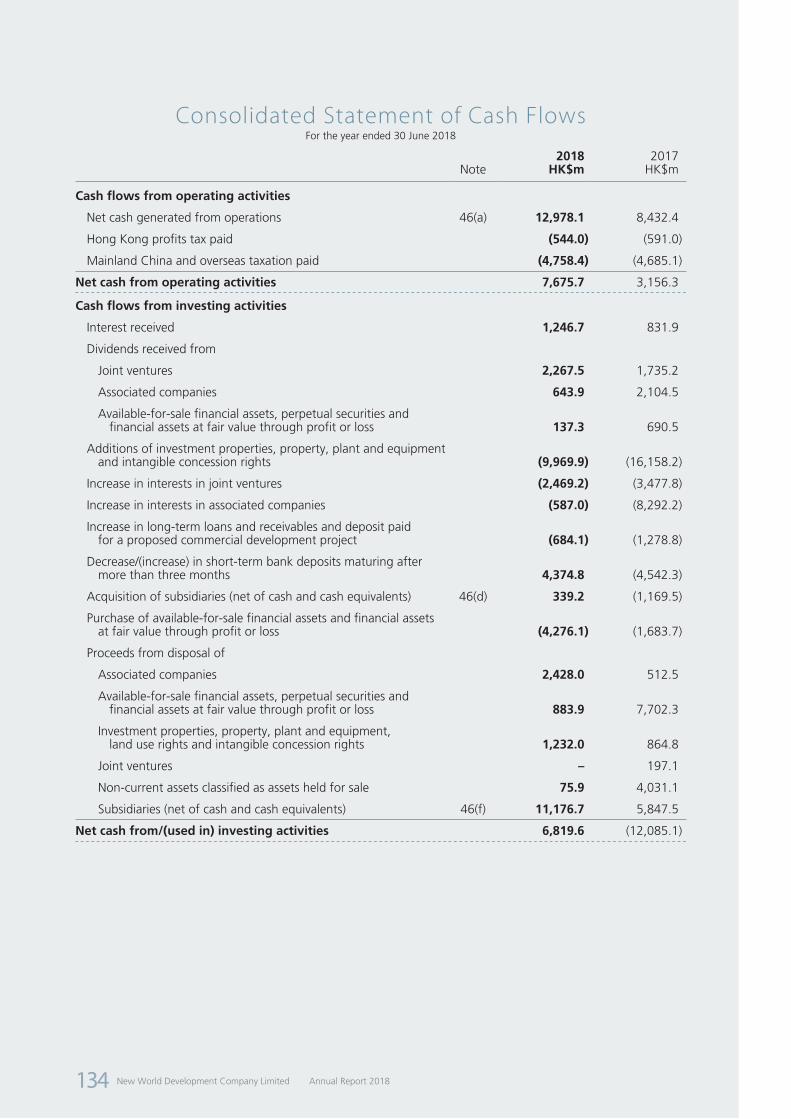
New World Development Company Limited Annual Report 2018134
Consolidated Statement of Cash FlowsFor the year ended 30 June 2018
2018 2017Note HK$m HK$m
Cash flows from operating activities
Net cash generated from operations 46(a) 12,978.1 8,432.4
Hong Kong profits tax paid (544.0) (591.0)
Mainland China and overseas taxation paid (4,758.4) (4,685.1)
Net cash from operating activities 7,675.7 3,156.3 Cash flows from investing activities
Interest received 1,246.7 831.9
Dividends received from
Joint ventures 2,267.5 1,735.2
Associated companies 643.9 2,104.5
Available-for-sale financial assets, perpetual securities and financial assets at fair value through profit or loss 137.3 690.5
Additions of investment properties, property, plant and equipment and intangible concession rights (9,969.9) (16,158.2)
Increase in interests in joint ventures (2,469.2) (3,477.8)
Increase in interests in associated companies (587.0) (8,292.2)
Increase in long-term loans and receivables and deposit paid for a proposed commercial development project (684.1) (1,278.8)
Decrease/(increase) in short-term bank deposits maturing after more than three months 4,374.8 (4,542.3)
Acquisition of subsidiaries (net of cash and cash equivalents) 46(d) 339.2 (1,169.5)
Purchase of available-for-sale financial assets and financial assets at fair value through profit or loss (4,276.1) (1,683.7)
Proceeds from disposal of
Associated companies 2,428.0 512.5
Available-for-sale financial assets, perpetual securities and financial assets at fair value through profit or loss 883.9 7,702.3
Investment properties, property, plant and equipment, land use rights and intangible concession rights 1,232.0 864.8
Joint ventures – 197.1
Non-current assets classified as assets held for sale 75.9 4,031.1
Subsidiaries (net of cash and cash equivalents) 46(f) 11,176.7 5,847.5
Net cash from/(used in) investing activities 6,819.6 (12,085.1)

New World Development Company LimitedAnnual Report 2018 135
C o n s o l i d a t e d S t a t e m e n t o f C a s h F l o w sFor the year ended 30 June 2018
2018 2017Note HK$m HK$m
Cash flows from financing activities
Issue of fixed rate bonds and notes payable, net of transaction costs – 6,415.9
Redemption of fixed rate bonds and notes payable (3,614.5) (6,539.0)
Drawdown of bank and other loans 18,977.6 34,319.0
Repayment of bank and other loans (21,377.7) (23,073.7)
(Decrease)/increase in loans from non-controlling shareholders (777.3) 430.7
Decrease in restricted bank balances 52.8 85.2
Increase in interests in subsidiaries (133.4) (306.3)
Issue of shares 490.2 207.8
Contributions from non-controlling interests 130.2 2,847.3
Interest paid (4,264.1) (4,914.7)
Dividends paid to shareholders of the Company (858.3) (745.1)
Dividends paid to non-controlling shareholders (2,134.4) (739.8)
Proceeds from perpetual capital securities, net of transaction costs 37 – 9,212.3
Distribution to holders of perpetual capital securities (536.6) (268.1)
Buyback of shares (130.9) –
Net cash (used in)/from financing activities (14,176.4) 16,931.5 Net increase in cash and cash equivalents 318.9 8,002.7
Cash and cash equivalents at beginning of the year 61,763.6 54,297.5
Translation differences 514.8 (536.6)
Cash and cash equivalents at end of the year 62,597.3 61,763.6
Analysis of cash and cash equivalents
Cash at banks and on hand 33 35,027.8 32,115.5
Short-term bank deposits maturing within three months 33 27,513.0 29,648.1
Cash and bank balances of a subsidiary reclassified as non-current assets classified as assets held for sale 56.5 –
62,597.3 61,763.6

New World Development Company Limited Annual Report 2018136
Notes to the Financial Statements
1 GENERAL INFORMATION
New World Development Company Limited (the “Company”) is a limited liability company incorporated in Hong Kong. The address of its registered office is 30/F, New World Tower, 18 Queen’s Road Central, Hong Kong. The shares of the Company are listed on the Main Board of The Stock Exchange of Hong Kong Limited (the “Stock Exchange”).
The Company and its subsidiaries (together the “Group”) are principally engaged in property development and investment, construction, provision of services (including property and facility management, transport and other services), infrastructure operations (including the operation of roads, environment projects, commercial aircraft leasing as well as ports and logistic facilities), hotel operations, department store operations, media, technology and other strategic businesses.
These consolidated financial statements have been approved by the Board of Directors on 20 September 2018.
2 BASIS OF PREPARATION
The consolidated financial statements have been prepared in accordance with Hong Kong Financial Reporting Standards (“HKFRS”) issued by the Hong Kong Institute of Certified Public Accountants (“HKICPA”). The consolidated financial statements have been prepared under the historical cost convention, as modified by the revaluation of investment properties, certain financial assets and financial liabilities (including available-for-sale financial assets, financial assets at fair value through profit or loss and derivative financial instruments), which have been measured at fair value.
The preparation of consolidated financial statements in conformity with HKFRS requires the use of certain critical accounting estimates. It also requires management to exercise its judgement in the process of applying the Group’s accounting policies. The areas involving a higher degree of judgement or complexity, or areas where assumptions and estimates are significant to the consolidated financial statements are disclosed in note 6 below.
(a) Adoption of amendments to standardsThe Group has adopted the following amendments to standards which are relevant to the Group’s operations and are mandatory for the financial year ended 30 June 2018:
Amendments to HKAS 7 Disclosure Initiative
Amendments to HKAS 12 Recognition of Deferred Tax Assets for Unrealised Losses
HKFRSs Amendments Annual Improvements to HKFRSs 2014-2016 Cycle
The adoption of these amendments to standards does not have significant effect on the results and financial position of the Group.

New World Development Company LimitedAnnual Report 2018 137
N o t e s t o t h e F i n a n c i a l S t a t e m e n t s
2 BASIS OF PREPARATION (CONTINUED)
(b) Early adoption of Hong Kong Financial Reporting Standard 15 “Revenue from Contracts with Customers” (“HKFRS 15”)HKFRS 15 as issued by the HKICPA is effective for the financial year beginning on or after 1 January 2018.
The Group has elected to early adopt HKFRS 15 for the year ended 30 June 2018 because the new accounting standard provides more reliable and relevant information for users to assess the amounts, timing and uncertainty of revenue and cash flows. The Group has also elected to apply the “cumulative catch-up” transitional method whereby the effects of adopting HKFRS 15 for uncompleted contracts with customers as at 30 June 2017 are adjusted at the opening balance of equity as at 1 July 2017 and prior period comparatives are not restated. The effects of the adoption of HKFRS 15 are set out in note 4 below.
HKFRS 15 establishes a comprehensive framework for determining when to recognise revenue and how much revenue to be recognised through a 5-step approach: (i) identify the contract(s) with customer; (ii) identify separate performance obligations in the contract; (iii) determine the transaction price; (iv) allocate the transaction price to the performance obligations; and (v) recognise revenue when a performance obligation is satisfied. The core principle is that a company should recognise revenue when control of goods or services transfers to a customer.
From 1 July 2017 onwards, the Group has adopted the following accounting policies on revenues:
Revenues are recognised when or as the control of the goods or services is transferred to the customer. Depending on the terms of the contract and the laws that apply to the contract, the control of the goods or services may be transferred over time or at a point in time.
Control of the goods or services is transferred over time if the Group’s performance:
• provides all of the benefits received and consumed simultaneously by the customer;
• creates or enhances an asset that the customer controls as the Group performs; or
• does not create an asset with an alternative use to the Group and the Group has an enforceable right to payment for performance completed to date.
If control of the asset transfers over time, revenue is recognised over the period of the contract by reference to the progress towards complete satisfaction of that performance obligation. Otherwise, revenue is recognised at a point in time when the customer obtains control of the asset.
The progress towards complete satisfaction of the performance obligation is measured based on one of the following methods that best depict the Group’s performance in satisfying the performance obligation:
• direct measurements of the value transferred by the Group to the customer; or
• the Group’s efforts or inputs to the satisfaction of the performance obligation relative to the total expected efforts or inputs.
Incremental costs incurred to obtain a contract, if recoverable, are capitalised as contract acquisition cost and subsequently amortised when the related revenue is recognised.
Please refer to the accounting policy in relation to revenue recognition in note 3(y).
New World Development Company Limited Annual Report 2018138
N o t e s t o t h e F i n a n c i a l S t a t e m e n t s
2 BASIS OF PREPARATION (CONTINUED)
(c) Standards, amendments to standards and interpretations which are not yet effectiveThe following new standards, amendments to standards and interpretations are mandatory for accounting periods beginning on or after 1 July 2018 or later periods but which the Group has not early adopted:
HKFRS 9 Financial Instruments
HKFRS 16 Leases
HKFRS 17 Insurance Contracts
Amendments to HKFRS 2 Classification and Measurement of Share-based Payment Transactions
Amendments to HKFRS 4 Applying HKFRS 9 Financial Instruments with HKFRS 4 – Insurance Contracts
Amendments to HKFRS 9 Prepayment Features with Negative Compensation
Amendments to HKFRS 10 and HKAS 28 Sale or Contribution of Assets between an Investor and its Associate or Joint Venture
Amendments to HKAS 19 Employee Benefits
Amendments to HKAS 28 Long-term Interests in Associates and Joint Ventures
Amendments to HKAS 40 Transfers of Investment Property
HK (IFRIC) — Interpretation 22 Foreign Currency Transactions and Advance Consideration
HK (IFRIC) — Interpretation 23 Uncertainty over Income Tax Treatments
HKFRSs Amendments Annual Improvements to HKFRSs 2014–2016 Cycle and Annual Improvements to HKFRSs 2015–2017 Cycle
The Group has already commenced an assessment of the likely impact of adopting the above new standards, amendments to standards and interpretations, in which the preliminary assessment of HKFRS 9 and HKFRS 16 is detailed below.
HKFRS 9 “Financial Instruments”HKFRS 9 replaces the multiple classification and measurement models in HKAS 39 Financial Instruments: Recognition and Measurement with a single model that has three classification categories: amortised cost, fair value through other comprehensive income (“FVOCI”) and fair value through profit or loss (“FVPL”).
Classification of debt assets will be driven by the Group’s business model for managing the financial assets and the contractual cash flow characteristics of the financial assets. A debt instrument is measured at amortised cost if (i) the objective of the business model is to hold the financial asset for the collection of the contractual cash flows, and (ii) the contractual cash flows under the instrument solely represent payments of principal and interest. All other debt and equity instruments, including investments in complex debt instruments and equity investments, must be recognised at fair value and their gains and losses will either be recorded in consolidated income statement or consolidated statement of comprehensive income. For investment in debt instruments, this will depend on the business model in which the investment is held. For investments in equity instruments that are not held for trading, this will depend on whether the Group has made an irrevocable election at the time of initial recognition to account for the equity investments at FVOCI.

New World Development Company LimitedAnnual Report 2018 139
N o t e s t o t h e F i n a n c i a l S t a t e m e n t s
2 BASIS OF PREPARATION (CONTINUED)
(c) Standards, amendments to standards and interpretations which are not yet effective (continued)HKFRS 9 “Financial Instruments” (continued)Certain financial assets of the Group that are currently classified as available-for-sale equity securities will be classified and measured as FVOCI or as FVPL under the new standard. Under the prevailing accounting policies, changes in fair value of available-for-sale financial assets are recognised in other comprehensive income, and upon disposal, the accumulated fair value adjustments are included in the consolidated income statement. Upon adoption of HKFRS 9, for investments that are measured as FVPL, changes in fair value are included in the consolidated income statement; while for investments that are measured at FVOCI, changes in fair value are included in consolidated statement of comprehensive income and accumulated fair value adjustments will not be transferred to the consolidated income statement upon disposal. As a result, depending on the classification of and timing of disposal of the investments, there may be impact on the profit or loss of the Group.
For financial liabilities that are measured under the fair value option, the Group will need to recognise a part of the fair value change that is due to changes in its own credit risk in consolidated statement of comprehensive income rather than consolidated income statement.
The new hedge accounting rules align hedge accounting more closely with common risk management practices. As a general rule, it will be easier to apply hedge accounting going forward. The new standard also introduces expanded disclosure requirements and changes in presentation. The Group does not expect a significant impact on the accounting for hedging relationship.
A new expected credit loss (“ECL”) impairment model has been introduced which involves a three-stage approach whereby financial assets move through the three stages as their credit quality changes. The stage dictates how the Group measures impairment losses and applies the effective interest rate method. A simplified approach is permitted for trade debtors and contract assets that do not have a significant financing component. On initial recognition, entities will record a day-1 loss equal to the 12 month ECL (or lifetime ECL for trade debtors and contract assets with no significant financing components), unless the assets are considered credit impaired. The Group expects to apply the simplified approach to recognise lifetime ECL for its trade debtors and contract assets and considers the remaining financial assets have low credit risk and hence expects to recognise 12-month ECL.
The new accounting standard will be effective for the year ending 30 June 2019. As allowed in the transitional provisions in HKFRS 9 (2014), comparative figures will not be restated.
The Group will continue to assess its impact in more details.
HKFRS 16 “Leases”HKFRS 16 addresses the definition of a lease, recognition and measurement of leases and establishes principles for reporting useful information to users of financial statements about the leasing activities of both lessees and lessors. A key change arising from HKFRS 16 is that most operating leases will be accounted for on the consolidated statements of financial position for lessees. The Group is a lessee of certain premises and properties which are currently classified as operating leases. HKFRS 16 provides a new provision for the accounting treatment of leases when the Group is the lessee, almost all leases should be recognised in the form of an asset (for the right-of-use) and a financial liability (for the payment obligation). Short-term leases of less than twelve months and leases of low-value assets are exempt from the reporting obligation. The new standard will therefore result in an increase in assets and financial liabilities in the consolidated statements of financial position. As for the financial performance impact in the consolidated income statement, straight-line depreciation expense on the right-of-use asset and the interest expenses on the financial liability are recognised and no rental expenses will be recognised. The combination of a straight-line depreciation of the right-of-use asset and the effective interest rate method applied to the financial liability will result in a higher total charge to consolidated income statements in the initial years of the lease, and decreasing expenses during the latter part of the lease term.
The Group conducted preliminary assessment and estimated that the adoption of HKFRS 16 would result in recognition of right-of-use assets and financial liabilities primarily arising from leases of premises and properties in relation to the Group’s various businesses. The Group will continue to assess the impact in more details.
The Group has already commenced an assessment of the impact of other new standards, amendments to standards and interpretations, certain of which may be relevant to the Group’s operations and may give rise to changes in accounting policies, changes in disclosures and remeasurement of certain items in the consolidated financial statements.
New World Development Company Limited Annual Report 2018140
N o t e s t o t h e F i n a n c i a l S t a t e m e n t s
2 BASIS OF PREPARATION (CONTINUED)
(d) Hong Kong Companies Ordinance (Cap.622)The consolidated financial statements comply with the applicable requirements of Hong Kong Companies Ordinance (Cap. 622), with the exception of section 381 which requires a company to include all its subsidiary undertakings (within the meaning of Schedule 1 to Cap. 622) in the company’s annual consolidated financial statements. Section 381 is inconsistent with the requirements of HKFRS 10 Consolidated Financial Statements so far as Section 381 applies to subsidiary undertakings which are not controlled by the Group in accordance with HKFRS 10. For this reason, under the provisions of section 380(6), the Company has departed from section 381 and has not treated such companies as subsidiaries but they are accounted for in accordance with the accounting policies in notes 3(a)(ii) and 3(a)(iii). Those excluded subsidiary undertakings of the Group are disclosed in notes 50 and 51.
3 PRINCIPAL ACCOUNTING POLICIES
The principal accounting policies adopted for the preparation of these consolidated financial statements, which have been consistently applied to all the years presented, unless otherwise stated, are set out as below:
(a) ConsolidationThe consolidated financial statements incorporate the financial statements of the Company and all its subsidiaries made up to 30 June.
(i) SubsidiariesA subsidiary is an entity (including a structured entity) over which the Group has control. The Group controls an entity when the Group is exposed to, or has rights to, variable returns from its involvement with the entity and has the ability to affect those returns through its power over the entity. Subsidiaries are consolidated from the date on which control is transferred to the Group. They are deconsolidated from the date that control ceases.
The acquisition method of accounting is used to account for business combinations by the Group. The consideration transferred for the acquisition of a subsidiary is the fair values of the assets transferred, the liabilities incurred to the former owners of the acquiree and the equity interests issued by the Group. The consideration transferred includes the fair value of any asset or liability resulting from a contingent consideration arrangement at the acquisition date. Acquisition-related costs are expensed as incurred. Identifiable assets acquired and liabilities and contingent liabilities assumed in a business combination are measured initially at their fair values at the acquisition date. There is a choice, on the basis of each acquisition to measure the non-controlling interest in the acquiree either at fair value or at the non-controlling interest’s proportionate share of the recognised amount of acquiree’s identifiable net assets. If the business combination is achieved in stages, the acquirer’s previously held equity interest in the acquiree is remeasured to fair value at the acquisition date through profit or loss.
The excess of the consideration transferred, the amount of any non-controlling interest in the acquiree and the fair value of any previous equity interest in the acquiree at the date of acquisition over the fair value of the Group’s share of the identifiable net assets acquired is recorded as goodwill. If this consideration is less than the fair value of the net assets of the subsidiary acquired in the case of a bargain purchase, the difference is recognised directly in the consolidated income statement.
Inter-company transactions, balances and unrealised gains on transactions between group companies are eliminated. Unrealised losses are also eliminated, unless the transaction provides evidence of an impairment of the transferred asset. Accounting policies of subsidiaries have been changed where necessary to ensure consistency with the policies adopted by the Group.
When the Group ceases to have control, any retained interest in the entity is remeasured to its fair value at the date when control is lost, with the change in carrying amount recognised in profit or loss. The fair value is the carrying amount for the purposes of subsequently accounting for the retained interest as associated companies, joint ventures or financial assets. In addition, any amounts previously recognised in other comprehensive income in respect of that entity are accounted for as if the Group had directly disposed of the related assets or liabilities. It means the amounts previously recognised in other comprehensive income are reclassified to profit or loss or transferred to another category of equity as specified/permitted by applicable HKFRSs.
The Company’s investments in subsidiaries are stated at cost less provision for impairment losses. The results of subsidiaries are accounted for by the Company on the basis of dividend received and receivable.

New World Development Company LimitedAnnual Report 2018 141
N o t e s t o t h e F i n a n c i a l S t a t e m e n t s
3 PRINCIPAL ACCOUNTING POLICIES (CONTINUED)
(a) Consolidation (continued)(ii) Joint arrangements
Under HKFRS 11, investments in joint arrangements are classified as either joint ventures or joint operations depending on the contractual rights and obligations each investor.
(1) Joint venturesThe Group recognises its interests in joint ventures using equity method of accounting. Interests in joint ventures are stated in the consolidated financial statements at cost (including goodwill on acquisition) plus the share of post-acquisition results and movements in other comprehensive income less provision for impairment losses. Goodwill represents the excess of the cost of an acquisition over the fair value of the Group’s share of the net identifiable assets of the acquired joint ventures at the date of acquisition.
The Group’s interests in joint ventures include the loans and advances to the joint ventures which, in substance, form part of the Group’s interests in the joint ventures. The loans and advances to the joint ventures are a form of commercial arrangement between the parties to the joint ventures to finance the development of projects and viewed as a mean by which the Group invests in the relevant projects. These loans and advances have no fixed repayment terms and will be repaid when the relevant joint venture has surplus cash flow.
The share of post-acquisition results and other comprehensive income is based on the relevant profit sharing ratios which vary according to the nature of the joint ventures set out as follows:
(a) Equity joint ventures/joint ventures in wholly foreign owned enterprisesEquity joint ventures/joint ventures in wholly foreign owned enterprises are joint ventures in respect of which the capital contribution ratios of the venturers are defined in the joint venture contracts and the profit sharing ratios and share of net assets of the venturers are in proportion to the capital contribution ratios.
(b) Co-operative joint venturesCo-operative joint ventures are joint ventures in respect of which the profit sharing ratios of the venturers and share of net assets upon the expiration of the joint venture periods are not in proportion to their capital contribution ratios but are as defined in the joint venture contracts.
(c) Companies limited by sharesCompanies limited by shares are limited liability companies in respect of which each shareholder’s beneficial interests therein is in accordance with the amount of the voting share capital held thereby.
When the Group’s share of losses in a joint venture equals or exceeds its interests in the joint venture (which includes any long-term interests that, in substance, form part of the Group’s net investment in the joint ventures), the Group does not recognise further losses, unless it has incurred obligations or made payments on behalf of the joint ventures.
The Group recognises the portion of gains or losses on the sale of assets by the Group to the joint venture that is attributable to the other venturers. The Group does not recognise its share of profits or losses from the joint venture that result from the purchase of assets from the joint venture until it resells the assets to an independent party. However, a loss on the transaction is recognised immediately if the loss provides evidence of a reduction in the net realisable value of current assets, or an impairment loss.
For equity accounting purpose, accounting policies of joint ventures have been changed where necessary to ensure consistency with the policies adopted by the Group.
The Company’s interests in joint ventures are stated at cost less provision for impairment losses. The results of joint ventures are accounted for by the Company on the basis of dividend received and receivable.

New World Development Company Limited Annual Report 2018142
N o t e s t o t h e F i n a n c i a l S t a t e m e n t s
3 PRINCIPAL ACCOUNTING POLICIES (CONTINUED)
(a) Consolidation (continued)(ii) Joint arrangements (continued)
(2) Joint operationsThe assets that the Group has the rights and the liabilities that the Group has the obligations in relation to the joint operations are recognised in the consolidated statement of financial position on an accrual basis and classified according to the nature of the item. The share of expenses that the Group incurs and its share of income that it earns from the joint operations are included in the consolidated income statement.
(iii) Associated companiesAn associated company is a company other than a subsidiary and a joint venture, in which the Group has significant influence, but not control, exercised through representatives on the board of directors.
Interests in associated companies are accounted for by the equity method of accounting and are initially recognised at cost. The Group’s interests in associated companies include goodwill (net of any accumulated impairment loss) identified on acquisition. Goodwill represents the excess of the cost of an acquisition over the fair value of the Group’s share of the net identifiable assets of the acquired associated companies at the date of acquisition. The interests in associated companies also include long-term interest that, in substance, form part of the Group’s net investment in the associated companies.
The Group’s share of its associated companies’ post acquisition profits or losses is recognised in the consolidated income statement, and the share of post-acquisition movements in other comprehensive income is recognised in the consolidated statement of comprehensive income. The cumulative post-acquisition movements are adjusted against the carrying amount of the investment. When the share of losses in an associated company equals or exceeds its interests in the associated company, including any other unsecured receivable, the Group does not recognise further losses, unless it has incurred legal and constructive obligations or made payments on behalf of the associated company.
Unrealised gains on transactions between the Group and its associated companies are eliminated to the extent of the Group’s interests in the associated companies. Unrealised losses are also eliminated unless the transaction provides evidence of an impairment of the asset transferred. For equity accounting purpose, accounting policies of associated companies have been changed where necessary to ensure consistency with the policies adopted by the Group.
The Company’s interests in associated companies are stated at cost less provision for impairment losses. The results of associated companies are accounted for by the Company on the basis of dividend income received and receivable.
Gains or losses on deemed disposal on dilution arising from interests in associated companies are recognised in the consolidated income statement.
The cost of an associated company acquired in stages is measured as the sum of consideration paid for each purchase plus a share of investee’s profits and other equity movements.
The Group ceases to use the equity method from the date an investment ceases to be an associated company that is the date on which the Group ceases to have significant influence over the associated company or on the date it is classified as held for sale.
(iv) Transactions with non-controlling interestsNon-controlling interests is the equity in a subsidiary which is not attributable, directly or indirectly, to a parent. The Group treats transactions with non-controlling interests (namely, acquisitions of additional interests and disposals of partial interests in subsidiaries that do not result in a loss of control) as transactions with equity owners of the Group. For purchases of additional interests in subsidiaries from non-controlling shareholders, the difference between any consideration paid and the relevant share acquired of the carrying value of net assets of the subsidiary is recorded in equity. Gains or losses on disposals of partial interests to non-controlling shareholders are also recorded in equity.

New World Development Company LimitedAnnual Report 2018 143
N o t e s t o t h e F i n a n c i a l S t a t e m e n t s
3 PRINCIPAL ACCOUNTING POLICIES (CONTINUED)
(b) Intangible assets(i) Goodwill
Goodwill arising on acquisitions of subsidiaries is included in intangible assets. Goodwill arising on acquisitions of joint ventures and associated companies is included in interests in joint ventures and associated companies respectively and is tested for impairment as part of overall balance. Separately recognised goodwill is tested annually for impairment and carried at cost less accumulated impairment losses. Impairment losses on goodwill are not reversed. Gains or losses on the disposal of all or part of an entity include the carrying amount of goodwill relating to the entity sold.
Goodwill is allocated to cash-generating units for the purpose of testing for impairment. The allocation is made to those cash-generating units or groups of cash-generating units that are expected to benefit from the business combination in which the goodwill arose.
(ii) TrademarksSeparately acquired trademarks are initially recognised at initial cost. Trademarks acquired in a business combination are recognised at fair value at the date of acquisition. Trademarks have a finite useful life and are subsequently carried at cost less accumulated amortisation and impairment losses. Amortisation is calculated using the straight-line method to allocate the cost of trademarks over their estimated useful lives.
(iii) Operating rightOperating right primarily resulted from the acquisition of right to operate facilities rental and other businesses. Separately acquired operating rights are initially recognised at cost. Operating rights acquired in a business combination are initially recognised at fair value at the acquisition date. Operating right is carried at cost less accumulated amortisation and impairment. Amortisation is calculated using the straight-line method to allocate the cost over the period of the operating right.
(iv) Intangible concession rightsThe Group has entered into various service arrangements (“Service Concessions”) with local government authorities for its participation in the development, financing, operation and maintenance of various infrastructures for public services, such as toll roads and bridges, power plants and water treatment plants (the “Infrastructures”). The Group carries out the construction or upgrade work of Infrastructures from the granting authorities in exchange for the right to operate the Infrastructures concerned and the right to change users of the respective Infrastructures. The fees collected during the operating periods are attributable to the Group. The relevant Infrastructures are required to be returned to the local government authorities upon the expiry of the operating rights without significant compensation to the Group.
The Group applies the intangible asset model to account for the Infrastructures where they are paid by the users of the Infrastructures and the concession grantors (the respective local governments) have not provided any contractual guarantees in respect of the amounts of construction costs incurred to be recoverable. The consideration to be received during the construction or the upgrade period is classified as contract assets and reclassified as intangible concession rights upon completion.
Land use rights acquired in conjunction with the Service Concessions which the Group has no discretion or latitude to deploy for other services other than the use in the Service Concessions are treated as intangible assets acquired under the Service Concessions.
Amortisation of intangible concession rights is calculated to write off their costs, where applicable, on an economic usage basis for roads and bridges whereby the amount of amortisation is provided based on the ratio of actual volume compared to the total projected volume or on a straight-line basis for water treatment plants over the periods which the Group is granted the rights to operate these Infrastructures. The total projected volume of the respective Infrastructures is reviewed regularly with reference to both internal and external sources of information and appropriate adjustments will be made should there be a material change.

New World Development Company Limited Annual Report 2018144
N o t e s t o t h e F i n a n c i a l S t a t e m e n t s
3 PRINCIPAL ACCOUNTING POLICIES (CONTINUED)
(c) Non-current assets classified as assets held for saleNon-current assets or disposal group are classified as assets held for sale when their carrying amount is to be recovered principally through a sale transaction and a sale is considered highly probable. They are stated at the lower of carrying amount and fair value less costs to sell if their carrying amount is to be recovered principally through a sale transaction rather than through continuing use.
(d) Land use rightsThe upfront prepayments made for the land use rights held under operating leases are expensed in the consolidated income statement on a straight-line basis over the period of the lease or when there is impairment, the impairment is expensed in the consolidated income statement.
(e) Investment propertiesProperty that is held for long-term rental yields or for capital appreciation or both, and that is not occupied by the Group, is classified as investment property. Investment property also includes property that is being constructed or developed for future use as investment property.
Investment property comprises land held under operating leases and buildings held under finance leases. Land held under operating leases are classified and accounted for as investment property when the rest of the definition of investment property is met. The operating lease is accounted for as if it was a finance lease.
Investment property is measured initially at its cost, including related transaction costs and where applicable borrowing costs. After initial recognition, investment property is carried at fair value. Fair value is determined by professional qualified valuers on an open market value basis at the end of each reporting period. Changes in fair value are recognised in the consolidated income statement.
Subsequent expenditure is included in the carrying amount of the asset only when it is probable that future economic benefits associated with the asset will flow to the Group and the cost of the asset can be measured reliably. All other repairs and maintenance costs are expensed in the consolidated income statement during the financial period in which they are incurred.
If an investment property becomes owner-occupied, it is reclassified as property, plant and equipment, and its fair value at the date of reclassification becomes its cost for accounting purposes.
Where an investment property undergoes a change in use, evidenced by commencement of development with a view to sale, the property is transferred to properties for/under development. The property’s deemed cost for subsequent accounting as properties for/under development is its fair value at the date of change in use.
If an owner-occupied property becomes an investment property because its use has changed, any difference resulting between the carrying amount and the fair value of this property at the date of transfer is recognised in equity as a revaluation of property, plant and equipment. However, if the fair value of the property at the date of transfer which results in a reversal of the previous impairment loss, the write-back is recognised in the consolidated income statement.
For a transfer from properties for/under development or property held for sale to investment properties that will be carried at fair value, any difference between the fair value of the property at that date and its previous carrying amount shall be recognised in the consolidated income statement. Transfers to investment properties shall be made when, and only when, there is a change in use. The inception of an operating lease to another party is generally an evidence of a change in use. A change in use has occurred is based on an assessment of all relevant facts and circumstances. The relevant facts include but not limited to the Group’s business plan, financial resources and legal requirements.
(f) Property, plant and equipmentProperty, plant and equipment are stated at historical cost less accumulated depreciation and impairment losses. Historical cost includes expenditure that is directly attributable to the acquisition of assets. Subsequent costs are included in the carrying amount of the assets or recognised as a separate asset, as appropriate, only when it is probable that future economic benefits associated with the asset will flow to the Group and the cost of the asset can be measured reliably. The carrying amount of the replaced part is derecognised. All other repair and maintenance costs are charged in the consolidated income statement during the financial period in which they are incurred. The carrying amount of an asset is written down immediately to its recoverable amount if the carrying value of an asset is greater than its estimated recoverable amount.

New World Development Company LimitedAnnual Report 2018 145
N o t e s t o t h e F i n a n c i a l S t a t e m e n t s
3 PRINCIPAL ACCOUNTING POLICIES (CONTINUED)
(f) Property, plant and equipment (continued)(i) Assets under construction
All direct costs relating to the construction of property, plant and equipment, including borrowing costs during the construction period are capitalised as the costs of the assets.
(ii) DepreciationNo depreciation is provided on assets under construction until such time when the relevant assets are completed and available for intended use.
Leasehold land classified as finance lease commences amortisation from the time when the land interest becomes available for its intended use. Amortisation on leasehold land classified as finance lease and depreciation on other assets is calculated using the straight-line method to allocate their cost to their residual values over their estimated useful lives, as follows:
Leasehold land classified as finance lease
Shorter of remaining lease term of 10 to over 50 years or useful life
Buildings 20 to 40 years
Other assets 2 to 25 years
The residual values and useful lives of the assets are reviewed, and adjusted if appropriate, at the end of each reporting period.
(iii) Gain or loss on disposalThe gain or loss on disposal of property, plant and equipment is determined by comparing the difference between the net sales proceeds and the carrying amount of the relevant asset, and is recognised in the consolidated income statement.
(g) Impairment of investments in subsidiaries, joint ventures, associated companies and non-financial assetsNon-financial assets that have an indefinite useful life, for example goodwill, or have not yet been available for use are not subject to amortisation and are tested annually for impairment. Assets are reviewed for impairment whenever events or changes in circumstances indicate that the carrying amount may not be recoverable. The carrying amount of an asset is written down immediately to its recoverable amount if the carrying amount of the asset is greater than its estimated recoverable amount. An impairment loss is recognised in the consolidated income statement for the amount by which the carrying amount of an asset exceeds its recoverable amount. The recoverable amount is the higher of its fair value less costs of disposal and value in use. For the purpose of assessing impairment, assets are grouped as cash-generating units for which there are separately identifiable cash flows. Non-financial assets other than goodwill that suffered an impairment are reviewed for possible reversal of the impairment at the end of each reporting period.
Impairment testing of the interests in subsidiaries, joint ventures or associated companies is required upon receiving dividends from these interests if the dividend exceeds the total comprehensive income of the subsidiaries, joint ventures or associated companies in the period the dividend is declared or if the carrying amount of the interest in the separate financial statements exceeds the carrying amount in the consolidated financial statements of the investee’s net assets including goodwill.
(h) InvestmentsThe Group classifies its investments in the categories of financial assets at fair value through profit or loss, loans and receivables, held-to-maturity investments, and available-for-sale financial assets. Management determines the classification of its investments at initial recognition depending on the purpose for which the investments are acquired.
(i) Financial assets at fair value through profit or lossThe Group classifies financial assets held for trading and those designated as at fair value through profit or loss at inception under certain circumstances as financial assets at fair value through profit or loss. A financial asset is classified in this category if acquired principally for the purpose of selling in the short-term or if so designated by management. They are presented as current assets if they are expected to be settled within 12 months after the end of the reporting period; otherwise, they are classified as non-current.
New World Development Company Limited Annual Report 2018146
N o t e s t o t h e F i n a n c i a l S t a t e m e n t s
3 PRINCIPAL ACCOUNTING POLICIES (CONTINUED)
(h) Investments (continued)(ii) Loans and receivables
Loans and receivables are non-derivative financial assets with fixed or determinable payments that are not quoted in an active market. They arise when the Group provides money, goods or services directly to a debtor with no intention of trading the receivable and are included in current assets, except for those with maturities more than 12 months after the end of the reporting period, which are classified as non-current assets.
(iii) Held-to-maturity investmentsHeld-to-maturity investments are non-derivative financial assets with fixed or determinable payments and fixed maturities that management has the positive intention and ability to hold to maturity. Held-to-maturity financial assets are included in non-current assets, except for those with maturities less than 12 months from the end of the reporting period, which are classified as current assets.
(iv) Available-for-sale financial assetsInvestments are designated as available-for-sale financial assets if they do not have fixed maturities and fixed or determinable payments, and management intends to hold them for the medium to long-term. Financial assets that are not classified into any of the other categories are also included in the available-for-sale category.
The financial assets are presented as non-current assets unless they mature, or management intends to dispose of them within 12 months of the end of the reporting period.
Regular way purchases and sales of financial assets are recognised on trade-date, which is the date on which the Group commits to purchase or sell the asset. Financial assets are derecognised when the rights to receive cash flows from the financial assets have expired or have been transferred and the Group has transferred substantially all risks and rewards of ownership.
Available-for-sale financial assets and financial assets at fair value through profit or loss are subsequently carried at fair value. Loans and receivables and held-to-maturity investments are carried at amortised cost using the effective interest method.
Gains and losses arising from changes in the fair value of the financial assets at fair value through profit or loss are included in the consolidated income statement in the financial period in which they arise. Changes in the fair value of available-for-sale financial assets are recognised in other comprehensive income. When available-for-sale financial assets are sold, the accumulated fair value adjustments are included in the consolidated income statement as gains or losses from financial assets. Changes in the fair value of monetary financial assets denominated in a foreign currency and classified as available-for-sale are analysed between translation differences resulting from changes in amortised cost of the financial asset and other changes in the carrying amount of the financial asset. The translation differences on monetary financial assets are recognised in the consolidated income statement; translation differences on non-monetary financial assets are recognised in other comprehensive income.
Financial assets and liabilities are offset and the net amount reported in the consolidated statement of financial position when there is a legally enforceable right to offset the recognised amounts and there is an intention to settle on a net basis or realise the asset and settle the liability simultaneously.
The fair values of listed investments are based on quoted bid prices at the end of the reporting period. If the market for a financial asset is not active and for unlisted financial assets, the Group establishes fair value by using valuation techniques. These include the use of recent arm’s length transactions, reference to other instruments that are substantially the same, discounted cash flow analysis and option pricing models, making maximum use of market inputs and relying as little as possible on entity-specific inputs.
(i) Derivative financial instrumentsA derivative is initially recognised at fair value on the date a derivative contract is entered into and is subsequently remeasured at its fair value at the end of each reporting period. The change in the fair value is recognised in the consolidated income statement.

New World Development Company LimitedAnnual Report 2018 147
N o t e s t o t h e F i n a n c i a l S t a t e m e n t s
3 PRINCIPAL ACCOUNTING POLICIES (CONTINUED)
(j) Impairment of financial assets(i) Assets carried at amortised cost
The Group assesses at the end of each reporting period whether there is objective evidence that a financial asset or group of financial assets is impaired. A financial asset or a group of financial assets is impaired and impairment losses are incurred only if there is objective evidence of impairment as a result of one or more events that occurred after the initial recognition of the asset (a “loss event”) and that loss event (or events) has an impact on the estimated future cash flows of the financial asset or group of financial assets that can be reliably estimated.
The criteria that the Group uses to determine that there is objective evidence of an impairment loss include:
• Significant financial difficulty of the issuer or obligor;
• A breach of contract, such as a default or delinquency in interest or principal payments;
• The Group, for economic or legal reasons relating to the borrower’s financial difficulty, granting to the borrower a concession that the lender would not otherwise consider;
• It becomes probable that the borrower will enter bankruptcy or other financial reorganisation;
• The disappearance of an active market for that financial asset because of financial difficulties; or
• Observable data indicating that there is a measurable decrease in the estimated future cash flows from a portfolio of financial assets since the initial recognition of those assets, although the decrease cannot yet be identified with the individual financial assets in the portfolio, including:
(1) adverse changes in the payment status of borrowers in the portfolio;
(2) national or local economic conditions that correlate with defaults on the assets in the portfolio.
The Group first assesses whether objective evidence of impairment exists.
The amount of the loss is measured as the difference between the asset’s carrying amount and the present value of estimated future cash flows (excluding future credit losses that have not been incurred) discounted at the financial asset’s original effective interest rate. The carrying amount of the asset is reduced and the amount of the loss is recognised in the consolidated income statement. If a loan or held-to-maturity investment has a variable interest rate, the discount rate for measuring any impairment loss is the current effective interest rate determined under the contract. As a practical expedient, the Group may measure impairment on the basis of an instrument’s fair value using an observable market price.
If, in a subsequent period, the amount of the impairment loss decreases and the decrease can be related objectively to an event occurring after the impairment was recognised (such as an improvement in the debtor’s credit rating), the reversal of the previously recognised impairment loss is recognised in the consolidated income statement.
(ii) Assets classified as available-for-saleIf there is objective evidence of impairment for available-for-sale financial assets, the cumulative loss — measured as the difference between the acquisition cost and the current fair value, less any impairment loss on that financial asset previously recognised in the consolidated income statement — is removed from equity and recognised in the consolidated income statement. Impairment losses recognised in the consolidated income statement on equity instruments are not reversed through the consolidated income statement. If the fair value of a debt instrument classified as available-for-sale increases and the increase can be objectively related to an event occurring after the impairment loss was recognised in consolidated income statement, the impairment loss is reversed through the consolidated income statement.
New World Development Company Limited Annual Report 2018148
N o t e s t o t h e F i n a n c i a l S t a t e m e n t s
3 PRINCIPAL ACCOUNTING POLICIES (CONTINUED)
(k) Properties for/under developmentProperties for/under development comprise leasehold land and land use rights, development expenditure and borrowing costs capitalised, and are carried at the lower of cost and net realisable value. Net realisable value takes into account the proceeds ultimately expected to be realised, less applicable variable selling expenses and the anticipated costs to complete. Upon completion, the properties are transferred to properties held for sale. Properties under development included in the current assets are expected to be realised in, or is intended for sale in the Group’s normal operating cycle.
(l) Properties held for saleProperties held for sale are initially measured at the carrying amount of the property at the date of reclassification from properties under development. Subsequently, properties held for sale are carried at the lower of cost and net realisable value. Net realisable value is determined by reference to management estimates based on prevailing market conditions.
(m) InventoriesInventories are stated at the lower of cost and net realisable value. Cost is calculated on the weighted average basis. Net realisable value is determined on the basis of anticipated sales proceeds less estimated selling expenses.
(n) Contracts in progressContracts in progress comprise contract cost incurred, plus recognised profits (less recognised losses) less progress billing. Cost comprises materials, direct labour and overheads attributable to bringing the work in progress to its present condition.
Variations in contract works, claims and incentive payments are included in contract revenue to the extent that may have been agreed with the customer and are capable of being reliably measured.
For fixed price construction service contract, the Group make reference to the progress towards complete satisfaction of that performance obligation to determine the appropriate amount to recognise in a given period. The progress is measured by reference to the contract costs incurred up to the end of the reporting period as a proportion of total estimated costs for each contract. Costs incurred in the year in connection with future activity on a contract and costs not attributable to progress are excluded from contract costs in determining the progress.
If the value of the services provided exceed the net payments received, a contract asset is recognised. If the payment exceed the value of the services provided, a contract liability is recognised.
(o) Trade and other debtorsTrade and other debtors are amounts due from customers for merchandise sold or services performed in the ordinary course of business. If collection of trade and other debtors is expected in one year or less (or in the normal operating cycle of the business if longer), they are classified as current assets. If not, they are presented as non-current assets.
Trade and other debtors are recognised initially at fair value and subsequently measured at amortised cost using the effective interest method, less provision for impairment.
(p) Contract related assets and contract liabilitiesUpon entering into a contract with a customer, the Group obtains rights to receive consideration from the customer and assumes performance obligations to transfer goods or provide services to the customer.
The combination of those rights and performance obligations gives rise to a net contract asset or a net contract liability depending on the relationship between the remaining rights and the performance obligations. The contract is an asset and recognised as contract assets if the cumulative revenue recognised in profit or loss exceeds cumulative payments made by customers. Conversely, the contract is a liability and recognised as contract liabilities if the cumulative payments made by customers exceeds the revenue recognised in profit or loss.
Contract assets are assessed for impairment under the same approach adopted for impairment assessment of financial assets carried at amortised cost. Contract liabilities are recognised as revenue when the Group transfers the goods or services to the customers and therefore satisfies its performance obligation.
The incremental costs of obtaining a contract with a customer are capitalised and presented as contract related assets, if the Group expects to recover those costs, and are subsequently amortised on a systematic basis that is consistent with the transfer to the customers of the goods or services to which the assets relate. The Group recognises an impairment loss in the consolidated income statement to the extent that the carrying amount of the contract related assets recognised exceeds the remaining amounts of consideration that the Group expects to receive less the costs that directly relate to those goods or services and have not been recognised as expenses.
New World Development Company LimitedAnnual Report 2018 149
N o t e s t o t h e F i n a n c i a l S t a t e m e n t s
3 PRINCIPAL ACCOUNTING POLICIES (CONTINUED)
(q) Cash and cash equivalentsIn the consolidated statement of cash flows, cash and cash equivalents include cash in hand, deposits held at call with banks, other short-term highly liquid investments with original maturities of three months or less and bank overdrafts. Bank overdrafts are shown within borrowings under current liabilities in the consolidated statement of financial position.
(r) Share capitalOrdinary shares are classified as equity.
Incremental costs directly attributable to the issue of new shares or options are shown in equity as a deduction, net of tax, from the proceeds.
(s) Perpetual capital securitiesPerpetual capital securities with no contracted obligation to repay its principal or to pay any distribution are classified as part of equity.
(t) Trade and other payablesTrade and other payables are obligations to pay for goods or services that have been acquired in the ordinary course of business from suppliers. Trade and other payables are classified as current liabilities if payment is due within one year or less (or in the normal operating cycle of the business if longer). If not, they are presented as non-current liabilities.
Trade and other payables are recognised initially at fair value and subsequently measured at amortised cost using the effective interest method.
(u) ProvisionsProvisions are recognised when the Group has a present legal or constructive obligation as a result of past events; it is probable that an outflow of resources will be required to settle the obligation; and the amount has been reliably estimated.
Where there are a number of similar obligations, the likelihood that an outflow will be required in settlement is determined by considering the class of obligations as a whole. A provision is recognised even if the likelihood of an outflow with respect to any one item included in the same class of obligations may be small.
Provisions are measured at the present value of the expenditures expected to be required to settle the obligation using a pre-tax rate that reflects current market assessments of the time value of money and the risks specific to the obligation. The increase in the provision due to passage of time is recognised as interest expense.
(v) Contingent liabilities and contingent assetsA contingent liability is a possible obligation that arises from past events and whose existence will only be confirmed by the occurrence or non-occurrence of one or more uncertain future events not wholly within the control of the Group. It can also be a present obligation arising from past events that is not recognised because it is not probable that outflow of economic resources will be required or the amount of obligation cannot be measured reliably.
A contingent liability, other than that assumed in a business combination, is not recognised but is disclosed in the notes to the consolidated financial statements. When a change in the probability of an outflow occurs so that outflow is probable, it will then be recognised as a provision.
A contingent asset is a possible asset that arises from past events and whose existence will be confirmed only by the occurrence or non-occurrence of one or more uncertain events not wholly within the control of the Group.
A contingent asset is not recognised but is disclosed in the notes to the consolidated financial statements when an inflow of economic benefits is probable. When inflow is virtually certain, an asset is recognised.
New World Development Company Limited Annual Report 2018150
N o t e s t o t h e F i n a n c i a l S t a t e m e n t s
3 PRINCIPAL ACCOUNTING POLICIES (CONTINUED)
(w) Current and deferred income taxThe income tax expense or credit for the period is the tax payable on the current period’s taxable income based on the applicable income tax rate for each jurisdiction adjusted by changes in deferred tax assets and liabilities attributable to temporary differences and to unused tax losses.
The current income tax charge is calculated on the basis of the tax laws enacted or substantively enacted at the end of the reporting period in the countries where the Group, joint ventures and associated companies operate and generate taxable income. Management periodically evaluates positions taken in tax returns with respect to situations in which applicable tax regulation is subject to interpretation and establishes provisions where appropriate on the basis of amounts expected to be paid to the tax authorities.
Deferred income tax is provided in full, using the liability method, on temporary differences arising between the tax bases of assets and liabilities and their carrying amounts in the consolidated financial statements. However, the deferred tax liabilities are not recognised if they arise from the initial recognition of goodwill. Deferred income tax is also not accounted for if it arises from initial recognition of an asset or liability in a transaction other than a business combination that at the time of transaction affects neither accounting nor taxable profit or loss. Deferred income tax is determined using tax rates and laws that have been enacted or substantively enacted by the end of the reporting period and are expected to apply when the related deferred income tax asset is realised or the deferred income tax liability is settled.
The deferred tax liability in relation to investment property that is measured at fair value is determined assuming the property will be recovered entirely through sale.
Deferred income tax assets are recognised to the extent that it is probable that future taxable profit will be available against which the temporary differences can be utilised.
Deferred income tax is provided on temporary differences arising on investments in subsidiaries, joint ventures and associated companies, except where the timing of the reversal of the temporary difference can be controlled and it is probable that the temporary difference will not reverse in the foreseeable future.
Deferred income tax assets and liabilities are offset when there is a legally enforceable right to offset current tax assets and liabilities and when the deferred tax balances relate to the same taxation authority. Current tax assets and tax liabilities are offset where the entity has a legally enforceable right to offset and intends either to settle on a net basis, or to realise the asset and settle the liability simultaneously.
Current and deferred tax is recognised in consolidated income statement, except to the extent that it relates to items recognised in other comprehensive income or directly in equity. In this case, the tax is also recognised in other comprehensive income or directly in equity, respectively.
(x) BorrowingsBorrowings are recognised initially at fair value, net of transaction costs incurred. Borrowings are subsequently stated at amortised cost; any difference between the proceeds (net of transaction costs) and the redemption value is recognised in the consolidated income statement or capitalised on the basis set out in note 3(aa) over the period of the borrowings using the effective interest method where appropriate.
Borrowings are classified as current liabilities unless the Group has an unconditional right to defer settlement of the liability for at least 12 months after the end of the reporting period.
(y) Revenue recognitionRevenue comprises the fair value of the consideration received or receivable for the sale of goods and services rendered in the ordinary course of the Group’s activities. Revenue is shown net of value-added tax, returns, rebates and discounts, allowances for credit and other revenue reducing factors after eliminating sales within the Group.
Revenue is recognised when it is probable that future economic benefits will flow to the Group and specific criteria for each of the activities have been met. Estimates are based on historical results, taking into consideration the type of customers, the type of transactions and the specifics of each arrangement.
(i) RentalRental is recognised in the consolidated income statement on a straight-line basis over the lease term.
New World Development Company LimitedAnnual Report 2018 151
N o t e s t o t h e F i n a n c i a l S t a t e m e n t s
3 PRINCIPAL ACCOUNTING POLICIES (CONTINUED)
(y) Revenue recognition (continued)(ii) Property sales
Revenue is recognised when or as the control of the asset is transferred to the customer. Depending on the terms of the contract and the laws that apply to the contract, control of the asset may be transferred over time or at a point in time. If properties have no alternative use to the Group contractually and the Group has an enforceable right to payment from the customers for performance completed to date, the Group satisfies the performance obligation over time and therefore, recognises revenue over time in accordance with the input method for measuring progress. Otherwise, revenue is recognised at a point in time when the customer obtains control of the completed property.
The progress towards complete satisfaction of the performance obligation is measured based on the Group’s efforts or inputs to the satisfaction of the performance obligation, by reference to the contract costs incurred up to the end of reporting period as a percentage of total estimated costs for each contract.
For property development and sales contract for which the control of the property is transferred at a point in time, revenue is recognised when the customer obtains the physical possession or the legal title of the completed property and the Group has present right to payment and the collection of the consideration is probable.
In determining the transaction price, the Group adjusts the promised amount of consideration for the effect of a financing component if it is significant.
(iii) Construction revenue Revenue from construction service contract is recognised over the period of the contract by reference to the progress towards complete satisfaction of that performance obligation using input method.
(iv) Service feesProperty and facilities management service fees, property letting agency fee are recognised when services are rendered.
(v) Infrastructure operationsToll revenue from road and bridge operations, port revenue from cargo, container handling and storage are recognised when services are rendered.
(vi) Sales of goodsIncome from sales of goods is recognised at a point in time when the goods are delivered to customers and title has passed.
(vii) Fare revenueFare revenue from bus and ferry services is recognised at a point in time when the services are rendered.
(viii) Hotel operationsRevenue from hotel and restaurant operations is recognised upon provision of the services.
(ix) Department store operationsRevenue from sale of goods to retail customers is recognised when the Group sells the product to the customers and the revenue from sale of goods to wholesalers is recognised when control of the products has transferred, being when the products are delivered to the wholesaler. The Group recognises commission income from concessionaire sales upon sale of goods or provision of services by counter suppliers. Payments received in advance that are related to sales of goods or provision of services not yet delivered to customers are deferred and recognised as contract liabilities. Revenue is recognised when goods or services are delivered to customers.
Marketing or promotional offer made to customers at the time of the sale of goods is a separate performance obligation, and the likelihood of settlement of the outstanding performance obligation must be estimated and allocated to the consideration received.
(x) InterestInterest is recognised on a time proportion basis using the effective interest method. When a receivable is impaired, the Group reduces the carrying amount to its recoverable amount, being the estimated future cash flow discounted at the original effective interest rate of the instrument, and continues unwinding the discount as interest income. Interest income on impaired receivables is recognised using the original effective interest rate.

New World Development Company Limited Annual Report 2018152
N o t e s t o t h e F i n a n c i a l S t a t e m e n t s
3 PRINCIPAL ACCOUNTING POLICIES (CONTINUED)
(y) Revenue recognition (continued)(xi) Dividend
Dividend is recognised when the right to receive payment is established.
(z) Leases(i) Finance leases
Leases that transfer to the Group, as lessee, substantially all the risks and rewards of ownership of assets are classified as finance leases. Finance leases are capitalised at the lease’s inception at the fair value of the leased assets or, if lower, the present value of minimum lease payments. Each lease payment is allocated between the liability and finance cost so as to achieve a constant rate on the finance balance outstanding. The corresponding rental obligations, net of finance charges, are included in liabilities, as creditors, accrued charges and contract liabilities. The finance charges are charged to the consolidated income statement over the lease period so as to produce a constant periodic rate of interest on the remaining balance of the liability for each period.
Assets held under finance leases are depreciated on the basis described in note 3(f)(ii) above.
(ii) Operating leasesLeases in which a significant portion of the risks and rewards of ownership are not transferred to the Group as lessee are classified as operating leases. Payments made under operating leases (net of any incentives received from the lessor) are charged to the consolidated income statement on a straight-line basis over the period of the lease.
(aa) Borrowing costBorrowing costs incurred for the construction of any qualifying assets are capitalised during the period of time that is required to complete and prepare the asset for its intended use. Other borrowing costs are expensed as incurred.
Borrowing costs include interest expense, finance charges in respect of finance lease and exchange differences arising from foreign currency borrowings to the extent that they are regarded as an adjustment to interest costs. The exchange gains and losses that are an adjustment to interest costs include the interest rate differential between borrowing costs that would be incurred if the entity had borrowed funds in its functional currency, and the borrowing costs actually incurred on foreign currency borrowings. Such amounts are estimated based on forward currency rates at the inception of the borrowings.
When the construction of the qualifying assets takes more than one accounting period, the amount of foreign exchange differences eligible for capitalisation is determined on a cumulative basis based on the cumulative amounts of interest expenses that would have been incurred had the entity borrowed in its functional currency. The total amount of foreign exchange differences capitalised cannot exceed the amount of total net foreign exchange differences incurred on a cumulative basis at the end of the reporting period.
(ab) Employee benefits(i) Employee leave entitlements
Employee entitlements to annual leave are recognised when they accrue to employees. A provision is made for the estimated liability for annual leave as a result of services rendered by employees up to the end of the reporting period. Employee entitlements to sick leave and maternity leave are not recognised until the time of leave.
(ii) Bonus plansProvision for bonus plans are recognised when the Group has a present legal or constructive obligation as a result of services rendered by employees and a reliable estimate of the obligation can be made.
(iii) Defined contribution plansA defined contribution plan is a pension plan under which the Group pays contributions into a separate entity. The Group has no legal or constructive obligations to pay further contributions if the fund does not hold sufficient assets to pay all employees the benefits relating to employee service in the current and prior periods. Contributions to defined contribution plans, including the Mandatory Provident Fund Scheme and employee pension schemes established by municipal government in The People’s Republic of China (“PRC”) are expensed as incurred. Contributions are reduced by contributions forfeited by those employees who leave the schemes prior to vesting fully in the contributions, where applicable.
New World Development Company LimitedAnnual Report 2018 153
N o t e s t o t h e F i n a n c i a l S t a t e m e n t s
3 PRINCIPAL ACCOUNTING POLICIES (CONTINUED)
(ab) Employee benefits (continued)(iv) Defined benefit plans
Defined benefit plans define an amount of pension benefit that an employee will receive on retirement, usually dependent on one or more factors such as age, years of service and compensation.
The liability recognised in the consolidated statement of financial position in respect of defined benefit pension plans is the present value of the defined benefit obligation at the end of the reporting period less the fair value of plan assets. The defined benefit obligation is calculated annually by independent actuaries using the projected unit credit method. The present value of the defined benefit obligation is determined by discounting the estimated future cash outflows using interest rates of high-quality corporate bonds that are denominated in the currency in which the benefits will be paid, and that have terms to maturity approximating to the terms of the related pension obligation. In countries where there is no deep market in such bonds, the market rates on government bonds are used.
Actuarial gains and losses arising from experience adjustments and changes in actuarial assumptions are charged or credited to equity in other comprehensive income in the period in which they arise. Past-service costs are recognised immediately in the consolidated income statement.
(v) Share-based compensationThe Group operates a number of equity-settled, share-based compensation plans. The fair value of the employee services received in exchange for the grant of share options is recognised as an expense. The total amount to be expensed over the vesting period is determined by reference to the fair value of the options granted at the date of grant, excluding the impact of any non-market vesting conditions. At the end of each reporting period, the Group revises its estimates of the number of options that are expected to vest. It recognises the impact of the revision of original estimates, if any, in the consolidated income statement, with a corresponding adjustment to equity.
The proceeds received net of any directly attributable transaction costs are credited to share capital (nominal value) when the options are exercised.
On lapse of share options according to the plan, corresponding amount recognised in employees’ share-based compensation reserve is transferred to retained profits.
The grant by the Company of options over its equity instruments to the employees of subsidiary undertakings in the Group is treated as a capital contribution. The fair value of employee services received, measured by reference to the grant date fair value, is recognised over the vesting period as an increase to investment in subsidiary undertakings, with a corresponding credit to equity in the parent entity accounts.
(ac) Foreign currencies(i) Functional and presentation currency
Items included in the financial statements of each of the Group’s entities are measured using the currency of the primary economic environment in which the entity operates (the “functional currency”). The consolidated financial statements are presented in Hong Kong dollar, which is the Company’s functional and presentation currency.
(ii) Transactions and balancesForeign currency transactions are translated into the functional currency using the exchange rates at the dates of the transactions. Foreign exchange gains and losses resulting from the settlement of such transactions and from the translation of monetary assets and liabilities denominated in foreign currencies at the exchange rates ruling at the end of the reporting period are recognised in the consolidated income statement.
Non-monetary items that are measured at fair value in a foreign currency are translated using the exchange rates at the date when the fair value was determined. Translation differences on assets and liabilities carried at fair value are reported as part of fair value gain or loss. For example, translation differences on financial assets and liabilities held at fair value through profit or loss are reported as part of the fair value gain or loss. Translation differences on non-monetary available-for-sale financial assets are included in equity.
New World Development Company Limited Annual Report 2018154
N o t e s t o t h e F i n a n c i a l S t a t e m e n t s
3 PRINCIPAL ACCOUNTING POLICIES (CONTINUED)
(ac) Foreign currencies (Continued)(iii) Group companies
The results and financial position of foreign operations that have a functional currency different from the presentation currency are translated into the presentation currency as follows:
(1) assets and liabilities for each consolidated statement of financial position presented are translated at the exchange rate ruling at the date of that consolidated statement of the financial position;
(2) income and expenses for each consolidated income statement are translated at the average exchange rate during the period covered by the consolidated income statement;
(3) all resulting translation differences are recognised as a separate component of equity; and
(4) on the disposal of the Group’s entire interest in a foreign operation, or a disposal involving loss of control over a subsidiary that includes a foreign operation, all of the translation differences accumulated in equity in respect of that operation attributable to the equity holders of the company are reclassified to profit or loss.
In the case of a partial disposal that does not result in the Group losing control over a subsidiary that includes a foreign operation, the proportionate share of accumulated translation differences are re-attributed to non-controlling interests and are not recognised in profit or loss. For all other partial disposals (that is, reductions in the Group’s ownership interest in associated companies or joint ventures that do not result in the Group losing significant influence or joint control), the proportionate share of the accumulated translation difference is reclassified to profit or loss.
Goodwill and fair value adjustments arising on the acquisition of a foreign operation are treated as assets and liabilities of the foreign operation and translated at the exchange rate ruling at the end of the reporting period.
(ad) Insurance contractsThe Group assesses at the end of each reporting period the liabilities under its insurance contracts using current estimates of future cash flows. If the carrying amount of the relevant insurance liabilities is less than the best estimate of the expenditure required to settle the relevant insurance liabilities at the end of the reporting period, the Group recognises the entire difference in profit or loss. These estimates are recognised only when the outflow is probable and the estimates can be reliably measured.
The Group regards its financial guarantee contracts in respect of mortgage facilities provided to certain property purchasers, guarantees provided to its related parties and tax indemnity provided to its non-wholly owned subsidiary as insurance contracts.
(ae) Segment reportingOperating segments are reported in a manner consistent with the internal reporting provided to the chief operating decision-maker. The Board of Directors of the Company has appointed an Executive Committee which assess the financial performance and position of the Group, and makes strategic decisions. The Executive Committee, which has been identified as being the chief operating decision-maker, consists of executive directors of the Company.
Segment assets consist primarily of property, plant and equipment, land use rights, investment properties, intangible concession rights, intangible assets, available-for-sale financial assets, held-to-maturity investments, financial assets at fair value through profit or loss, properties for development, other non-current assets, properties under development, properties held for sale, inventories and receivables and exclude derivative financial instruments, deferred tax assets, restricted bank balances and cash and bank balances. Segment liabilities comprise operating liabilities and exclude items such as taxation and borrowings.
(af) Dividend distributionDividend distribution to the Company’s shareholders is recognised as a liability in the financial statements in the financial period when the dividends are approved by the Company’s shareholders/directors, where appropriate.

New World Development Company LimitedAnnual Report 2018 155
N o t e s t o t h e F i n a n c i a l S t a t e m e n t s
4 CHANGE IN ACCOUNTING POLICY
As explained in note 2(b) above, the Group has early adopted HKFRS 15 from 1 July 2017, which resulted in changes in accounting policies and adjustments to the amounts recognised in the consolidated financial statements. In accordance with the transitional provisions in HKFRS 15, comparative figures have not been restated.
The accounting policies were changed to comply with HKFRS 15, which replaces both the provisions of HKAS 18 Revenue (“HKAS 18”) and HKAS 11 Construction Contracts (“HKAS 11”) and the related interpretations that relate to the recognition, classification and measurement of revenue and costs.
The effects of the adoption of HKFRS 15 are as follows:
Presentation of contract assets and liabilitiesReclassifications were made as at 1 July 2017 to be consistent with the terminologies used under HKFRS 15:
• Contract liabilities for progress billing recognised in relation to property development activities were previously presented as deposits received on sale of properties within creditors and accrued charges.
• Contract liabilities in relation to prepayments from customers and customer loyalty programme under department stores operation were previously presented as other creditors and accrued charges within creditors and accrued charges.
• Contract liabilities recognised in relation to contracting activities were previously presented as amounts due to customers for contract works within creditors and accrued charges.
• Contract assets recognised in relation to contracting activities were previously presented as amounts due from customers for contract works within debtors and prepayment.
Accounting for property development activitiesIn prior reporting periods, the Group accounted for property development activities when significant risks and rewards of ownership of properties have been transferred to the customers.
Under HKFRS 15, revenue from pre-sales of properties is recognised when or as the control of the asset is transferred to the customer. Depending on the terms of the contracts and the laws that are applicable to the contracts, control of the properties under development may transfer over time or at a point in time. If properties have no alternative use to the Group contractually and the Group has an enforceable right to payment from the customers for performance completed to date, the Group satisfies the performance obligation over time and therefore, recognises revenue over time in accordance with the input method for measuring progress. Otherwise, revenue is recognised at a point in time when the customer obtains control of the completed property.
Revenue for certain pre-sale properties transactions will be accounted for differently and recognised earlier over time, instead of at a single point in time under HKAS 18.
The timing of revenue recognition for sale of certain completed properties, which is currently based on whether significant risks and rewards of ownership of properties have been transferred, may be recognised at a later point in time when the underlying property is legally or physically transferred to the customer.
The Group currently offers different payment schemes to customers, the transaction price and the amount of revenue for the sale of property will be adjusted when significant financing component exists in that contract.
The excess of cumulative revenue recognised in profit or loss over the cumulative payments made by customers is recognised as contract assets.
The excess of cumulative payments made by customers over the cumulative revenue recognised in profit or loss is recognised as contract liabilities.

New World Development Company Limited Annual Report 2018156
N o t e s t o t h e F i n a n c i a l S t a t e m e n t s
4 CHANGE IN ACCOUNTING POLICY (CONTINUED)
Accounting for department stores operationUnder HKFRS 15, revenue from sale of goods to retail customers is recognised when the Group sells the product to the customers and the revenue from sale of goods to wholesalers is recognised when control of the products has transferred, being when the products are delivered to the wholesaler. The Group recognises commission income from concessionaire sales upon sale of goods or provision of services by counter suppliers. Payments received in advance that are related to sales of goods or provision of services not yet delivered to customers are deferred and recognised as contract liabilities. Revenue is recognised when goods or services are delivered to customers.
Marketing or promotional offer made to customers at the time of the sale of goods is a separate performance obligation, and the likelihood of settlement of the outstanding performance obligation must be estimated and allocated to the consideration received.
Accounting for costs incurred to obtain a contractFollowing the adoption of HKFRS 15, stamp duty, sales commissions and other costs only incurred if the contract is obtained, if recoverable, are capitalised as contract acquisition cost and subsequently amortised when the related revenue is recognised.
(a) The impact on the Group’s financial position by the application of HKFRS 15 as compared to HKAS 18 and HKAS 11 that was previously in effect before the adoption of HKFRS 15 is as follows:
As at 1 July 2017
As previously stated
Effects of the early adoption of
HKFRS 15 As restatedHK$m HK$m HK$m
Consolidated statement of financial position (extract)
Interests in joint ventures 49,317.4 2.2 49,319.6
Deferred tax assets 740.9 (33.3) 707.6
Properties under development 48,530.0 (359.6) 48,170.4
Debtors, prepayments and contract assets 27,864.4 158.2 28,022.6
— Trade debtors, deposits, prepayments and other debtors 27,317.2 (79.1) 27,238.1
— Amounts due from customers for contract works 547.2 (547.2) –
— Contract assets – 784.5 784.5
Retained profits 104,696.7 251.6 104,948.3
Non-controlling interests 25,401.5 27.2 25,428.7
Deferred tax liabilities 9,327.2 0.9 9,328.1
Creditors, accrued charges and contract liabilities 50,735.2 (591.7) 50,143.5
— Trade creditors, other creditors and accrued charges 33,262.5 (280.0) 32,982.5
— Amounts due to customers for contract works 2,297.3 (2,297.3) –
— Deposits received on sale of properties 15,175.4 (15,175.4) –
— Contract liabilities – 17,161.0 17,161.0
Current tax payable 7,504.7 79.5 7,584.2

New World Development Company LimitedAnnual Report 2018 157
N o t e s t o t h e F i n a n c i a l S t a t e m e n t s
4 CHANGE IN ACCOUNTING POLICY (CONTINUED)
(b) The amount by each financial statement line item affected in the current year by the application of HKFRS 15 as compared to HKAS 18 and HKAS 11 that was previously in effect before the adoption of HKFRS 15 is as follows:
As at 30 June 2018
Without the early adoption
of HKFRS 15
Effects of the early adoption
of HKFRS 15 As reportedHK$m HK$m HK$m
Consolidated statement of financial position (extract)
Interests in joint ventures 49,055.3 80.5 49,135.8
Deferred tax assets 766.5 (17.2) 749.3
Properties under development 37,494.8 (323.8) 37,171.0
Properties held for sale 29,582.8 12,718.4 42,301.2
Debtors, prepayments and contract assets 33,404.0 (7,884.4) 25,519.6
— Trade debtors, deposits, prepayments and other debtors 33,035.6 (8,837.0) 24,198.6
— Amounts due from customers for contract works 368.4 (368.4) –
— Contract assets – 1,321.0 1,321.0
Retained profits 127,225.6 (3,639.7) 123,585.9
Non-controlling interests 30,622.4 (1,142.2) 29,480.2
Deferred tax liabilities 10,288.7 (0.8) 10,287.9
Creditors, accrued charges and contract liabilities 54,986.5 10,072.5 65,059.0
— Trade creditors, other creditors and accrued charges 39,795.1 (279.3) 39,515.8
— Amounts due to customers for contract works 2,626.3 (2,626.3) –
— Deposits received on sale of properties 12,565.1 (12,565.1) –
— Contract liabilities – 25,543.2 25,543.2
Current tax payable 9,708.7 (716.3) 8,992.4

New World Development Company Limited Annual Report 2018158
N o t e s t o t h e F i n a n c i a l S t a t e m e n t s
4 CHANGE IN ACCOUNTING POLICY (CONTINUED)
(b) (continued)
For the year ended 30 June 2018
Without the early adoption
of HKFRS 15
Effects of the early adoption
of HKFRS 15 As reportedHK$m HK$m HK$m
Consolidated income statement (extract)
Revenues 80,242.2 (19,553.5) 60,688.7
Cost of sales 52,858.0 (12,732.7) 40,125.3
Selling and marketing expenses 1,935.1 (851.3) 1,083.8
Share of results of joint ventures 1,806.9 79.3 1,886.2
Taxation 7,101.9 (829.5) 6,272.4
Non-controlling interests 4,375.9 (1,169.4) 3,206.5
Consolidated statement of cash flows (extract)
Net cash generated from operations
Operating profit before working capital changes 19,847.7 (5,969.5) 13,878.2
Changes in working capital:
— Decrease/(increase) in properties for/under development and properties held for sale 2,743.2 (12,754.2) (10,011.0)
— (Increase)/decrease in debtors, prepayments and contract assets and long-term prepayments and deposits (12,811.9) 8,042.6 (4,769.3)
— Increase in creditors, accrued charges and contract liabilities 3,271.9 10,681.1 13,953.0
The early adoption of HKFRS 15 has no impact to the investing and financing activities on the consolidated statement of cash flows.

New World Development Company LimitedAnnual Report 2018 159
N o t e s t o t h e F i n a n c i a l S t a t e m e n t s
5 FINANCIAL RISK MANAGEMENT AND FAIR VALUE ESTIMATION
The Group’s activities expose it to a variety of financial risks: market risk (including foreign exchange risk, interest rate risk and price risk), credit risk and liquidity risk. The Group has centralised treasury function for all of its subsidiaries except for listed subsidiaries which arrange their financial and treasury affairs on a stand-alone basis and in a manner consistent with the overall policies of the Group.
(a) Market risk(i) Foreign exchange risk
The Group’s operations are mainly in Hong Kong and Mainland China. Entities within the Group are exposed to foreign exchange risk from future commercial transactions and monetary assets and liabilities that are denominated in a currency that is not the entity’s functional currency.
The Group manages its foreign currency risk by closely monitoring the movement of the foreign currency rates and will consider to enter into foreign exchange forward contracts and foreign exchange swaps to reduce the exposure should the need arises.
At 30 June 2018, the Group’s entities with functional currency of Hong Kong dollar had aggregate United States dollar net monetary liabilities of HK$12,175.4 million (2017: HK$3,825.5 million). Under the Linked Exchange Rate System in Hong Kong, Hong Kong dollar is pegged to the United States dollar, management therefore considers that there are no significant foreign exchange risk with respect to the United States dollar.
At 30 June 2018, the Group’s entities with functional currency of Hong Kong dollar had aggregate Renminbi net monetary assets of HK$3,064.8 million (2017: HK$690.8 million). If Hong Kong dollar had strengthened/weakened by 5% (2017: 5%) against Renminbi with all other variables unchanged, the Group’s profit before taxation would have been HK$153.2 million (2017: HK$34.5 million) lower/higher.
At 30 June 2018, the Group’s entities with functional currency of Renminbi had aggregate United States dollar net monetary assets of HK$188.3 million (2017: HK$253.9 million). If Renminbi had strengthened/weakened by 5% (2017: 5%) against United States dollar with all other variables unchanged, the Group’s profit before taxation would have been HK$9.4 million (2017: HK$12.7 million) lower/higher.
At 30 June 2018, the Group’s entities with functional currency of Renminbi had aggregate Hong Kong dollar net monetary liabilities of HK$423.1 million (2017: net monetary assets of HK$87.4 million). If Renminbi had strengthened/weakened by 5% (2017: 5%) against Hong Kong dollar with all other variables unchanged, the Group’s profit before taxation would have been HK$21.2 million higher/lower (2017: HK$4.4 million lower/higher).
New World Development Company Limited Annual Report 2018160
N o t e s t o t h e F i n a n c i a l S t a t e m e n t s
5 FINANCIAL RISK MANAGEMENT AND FAIR VALUE ESTIMATION (CONTINUED)
(a) Market risk (continued)(i) Foreign exchange risk (continued)
This sensitivity analysis ignores any offsetting foreign exchange factors and has been determined assuming that the change in foreign exchange rates had occurred at the end of the reporting period. The stated change represents management’s assessment of reasonably possible changes in foreign exchange rates over the period from the end of the reporting period until the end of next reporting period. There are no other significant monetary balances held by group companies at 30 June 2018 and 2017 that are denominated in a non-functional currency. Currency risks as defined by HKFRS 7 arise on account of monetary assets and liabilities being denominated in a currency that is not the functional currency, differences resulting from the translation of financial statements into the Group’s presentation currency are not taken into consideration.
(ii) Interest rate riskThe Group is exposed to interest rate risk through the impact of rate changes on interest bearing assets and liabilities. Cash flow interest rate risk is the risk that changes in market interest rates will impact cash flows arising from variable rate financial instruments. The Group’s interest bearing assets mainly include deposits at bank and amounts due from joint ventures and associated companies. The Group’s floating rate borrowings will be affected by fluctuation of prevailing market interest rates and will expose the Group to cash flow interest rate risk. The Group’s borrowings issued at fixed rates exposed the Group to fair value interest rate risk.
To mitigate the risk, the Group has maintained fixed and floating rate debts. To match with underlying risk faced by the Group, the level of fixed rate debt for the Group is decided after taking into consideration the potential impact of higher interest rates on profit or loss, interest cover and the cash flow cycles of the Group’s businesses and investments.
If interest rates had been 100 basis points (2017: 100 basis points) higher/lower with all other variables held constant, the Group’s profit before taxation would have been HK$231.4 million higher or HK$233.9 million lower respectively (2017: HK$259.3 million lower or HK$256.8 million higher). The sensitivity analysis has been determined assuming that the change in interest rates had occurred throughout the year and had been applied to the exposure to interest rate risk for financial instruments in existence at the end of the reporting period. The 100 basis points (2017: 100 basis points) increase or decrease represents management’s assessment of a reasonably possible change in those interest rates which have the most impact on the Group over the period until the end of next reporting period. Changes in market interest rates affect the interest income or expense of non-derivative variable-interest financial instruments. As a consequence, they are included in the calculation of profit before taxation sensitivities.
(iii) Price riskThe Group is exposed to securities price risk arising from the listed and unlisted investments held by the Group. Gains or losses arising from changes in the fair value of available-for-sale financial assets and financial assets at fair value through profit or loss are dealt with in equity and the consolidated income statement respectively. The performance of the Group’s listed and unlisted investments are monitored regularly, together with an assessment of their relevance to the Group’s strategic plans. The Group is also exposed to other price risk arising from fair value of certain interest rate swaps which is determined based on the in-house indexes of banks. Changes in fair value of these interest rate swaps are dealt with in the consolidated income statement. The Group is not exposed to commodity price risk.
At 30 June 2018, if the price of listed and unlisted investments in available-for-sale financial assets had been 25% (2017: 25%) higher with all other variables held constant, the Group’s investment revaluation reserve would have been HK$2,944.7 million (2017: HK$1,635.1 million) higher. If the price of listed and unlisted investments in available-for-sale financial assets had been 25% (2017: 25%) lower with all other variables held constant, the Group’s profit before taxation and investment revaluation reserve would have been HK$370.0 million and HK$2,574.7 million (2017: HK$345.0 million and HK$1,290.1 million) lower respectively. The sensitivity analysis has been determined based on a reasonable expectation of possible valuation volatility over the next 12 months.
At 30 June 2018, if the price of listed and unlisted investments in financial assets at fair value through profit or loss had been 25% (2017: 25%) higher/lower with all other variables held constant, the Group’s profit before taxation would have been HK$171.1 million (2017: HK$143.6 million) higher/lower. The sensitivity analysis has been determined based on a reasonable expectation of possible valuation volatility over the next 12 months.

New World Development Company LimitedAnnual Report 2018 161
N o t e s t o t h e F i n a n c i a l S t a t e m e n t s
5 FINANCIAL RISK MANAGEMENT AND FAIR VALUE ESTIMATION (CONTINUED)
(b) Credit riskThe credit risk of the Group mainly arises from deposits with banks, trade and other debtors and balances receivable from investee companies, joint ventures, associated companies and debt securities. The exposures to these credit risks are closely monitored on an ongoing basis by established credit policies in each of its core businesses.
Bank deposits are mainly placed with high-credit-quality financial institutions. Trade debtors mainly include receivables from sale and lease of properties and other services. Loans receivable included in other non-current assets normally carry interest at rates with reference to prevailing market interest rate and are secured by collaterals. The Group carry out regular reviews and follow-up actions on any overdue amounts to minimise exposures to credit risk. There is no concentration of credit risk with respect to trade debtors from third party customers as the customer bases are widely dispersed in different sectors and industries.
In respect of credit exposures to the mortgage loans receivable, similar to other financial institutions, credit assessments are part of the normal process before approving loans to applicants. Regular review is carried out and stringent monitoring procedures are in place to deal with overdue debts. At the end of each reporting period, the Group reviews the recoverable amount of each individual receivable to ensure that adequate provisions for impairment are made for irrecoverable amounts, if any.
In addition, the Group monitors the exposure to credit risk in respect of the financial assistance provided to subsidiaries, joint ventures and associated companies through exercising control, joint control or significant influence over their financial and operating policy decisions and reviewing their financial positions on a regular basis. Investment in debt securities are limited to financial institutions or investment counterparty with high quality.
The Group provides guarantees to banks in connection with certain property purchasers’ borrowing of mortgage loans to finance their purchase of the properties until the issuance of the official property title transfer certificates by the relevant authority in the Mainland China. If a purchaser defaults on the payment of its mortgage during the term of the guarantee, the bank holding the mortgage may demand the Group to repay the outstanding amount under the loan and any accrued interest thereon. Under such circumstances, the Group is able to retain the purchaser’s deposit and sell the property to recover any amounts paid by the Group to the bank. Therefore the Group’s credit risk is significantly reduced. Nevertheless, the net realisable values of the relevant properties are subject to the fluctuation of the property market in general, the Group assesses at the end of each reporting period the liabilities based on the current estimates of future cash flows. As at 30 June 2018 and 2017, no provision on the above guarantees to banks had been made in the consolidated financial statements.
(c) Liquidity riskPrudent liquidity risk management includes managing the profile of debt maturities and funding sources, maintaining sufficient cash and marketable securities, and ensuring the availability of funding from an adequate amount of committed credit facilities and the ability to close out market positions. It is the policy of the Group to regularly monitor current and expected liquidity requirements and to ensure that adequate funding is available for operating, investing and financing activities. The Group also maintain adequate undrawn committed credit facilities to further reduce liquidity risk in meeting funding requirements.
The table below analyses the Group’s non-derivative financial liabilities into relevant maturity groupings based on the remaining period at the end of the reporting period to the contractual maturity dates. The amounts disclosed in the table are the contractual undiscounted cash flows.
New World Development Company Limited Annual Report 2018162
N o t e s t o t h e F i n a n c i a l S t a t e m e n t s
5 FINANCIAL RISK MANAGEMENT AND FAIR VALUE ESTIMATION (CONTINUED)
(c) Liquidity risk (continued)Non-derivative financial liabilities:
Carrying amount
Total contractual
undiscounted cash flow
Within 1 year or on demand
Over 1 year but within
5 years After 5 yearsHK$m HK$m HK$m HK$m HK$m
At 30 June 2018
Creditors and accrued charges 35,790.6 35,790.6 33,749.4 2,036.2 5.0
Short-term borrowings 8,777.6 8,955.1 8,955.1 – –
Long-term borrowings 131,975.1 144,098.7 15,737.8 111,024.2 17,336.7
At 30 June 2017
Creditors and accrued charges 27,874.1 27,874.1 25,889.3 1,975.8 9.0
Short-term borrowings 6,366.7 6,499.3 6,499.3 – –
Long-term borrowings 140,753.2 157,920.5 18,803.4 112,190.9 26,926.2
Derivative financial liabilities:
Total contractual
undiscounted cash flow
Within 1 year or
on demand
Over 1 year but within
5 years After 5 yearsHK$m HK$m HK$m HK$m
At 30 June 2018
Derivative financial instruments (net settled) 152.5 91.3 11.3 49.9
At 30 June 2017
Derivative financial instruments (net settled) 298.9 139.0 126.7 33.2
There are no gross settled derivative financial liabilities as at 30 June 2018.
(d) Capital managementThe Group’s objectives when managing capital are to safeguard the Group’s ability to continue as a going concern in order to provide returns for shareholders and benefits for other stakeholders and to maintain an optimal capital structure to reduce the cost of capital.
The Group generally obtains long-term financing to on-lend or contribute as equity to its subsidiaries, joint ventures and associated companies to meet their funding needs in order to provide more cost efficient financing. In order to maintain or adjust the capital structure, the Group may adjust the amount of dividends paid to shareholders, issue or repurchase shares, raise new debt financing or sell assets to reduce debt.
The Group monitors capital on the basis of the Group’s gearing ratio and makes adjustments to it in light of changes in economic conditions and business strategies. The gearing ratio is calculated as net debt divided by total equity. Net debt is calculated as total borrowings (excluding loans from non-controlling shareholders) less cash and bank balances.

New World Development Company LimitedAnnual Report 2018 163
N o t e s t o t h e F i n a n c i a l S t a t e m e n t s
5 FINANCIAL RISK MANAGEMENT AND FAIR VALUE ESTIMATION (CONTINUED)
(d) Capital management (continued)The gearing ratios at 30 June 2018 and 2017 were as follows:
2018 2017HK$m HK$m
Consolidated total borrowings (excluding loans from non-controlling shareholders) 138,315.1 143,976.7
Less: cash and bank balances (63,456.1) (67,106.5)
Consolidated net debt 74,859.0 76,870.2
Total equity 255,181.9 220,944.5
Gearing ratio 29.3% 34.8%
(e) Fair value estimationThe Group’s financial instruments that are measured at fair value are disclosed by levels of the following fair value measurement hierarchy:
• Quoted prices (unadjusted) in active markets for identical assets or liabilities (level 1).
• Inputs other than quoted prices included within level 1 that are observable for the asset or liability, either directly (that is, as prices) or indirectly (that is, derived from prices) (level 2).
• Inputs for the asset or liability that are not based on observable market data (that is, unobservable inputs) (level 3).
Management determined the fair value of these available-for-sale financial assets within level 2 and level 3 as follows:
• For investments in investment funds, management discussed with the respective fund managers to understand the performance of the underlying investments and fair value measurement basis conducted by the respective fund managers in order to evaluate whether the fair values as stated in the fund statements at the end of reporting period is appropriate;
• For investments in unlisted equity and debt securities with recent transactions, management determined the fair value at the end of reporting period with reference to recent transaction prices of these financial assets; and
• For investments in unlisted equity and debt securities without recent transactions, management has established fair values of these investments by using appropriate valuation techniques. Independent external valuer has been involved in determining the fair value, where appropriate.
The carrying amounts of the financial instruments of the Group are as follows. See note 17 for disclosure relating to the investment properties which are measured at fair value.
Listed investments are stated at market prices. The quoted market price used for financial assets held by the Group is the bid price at the end of the reporting period. They are included in level 1.
Unlisted investments are stated at fair values which are estimated using other prices observed in recent transactions or valuation techniques when the market price is not readily available. The fair value of interest rate swaps is calculated as the present value of the estimated future cash flows. If all significant inputs required to estimate the fair value of an instrument are observable, the instrument is included in level 2. If one or more of the significant inputs is not based on observable market data, the instrument is included in level 3.
The fair value of long-term financial liabilities is estimated by discounting the future contractual cash flows at the current market interest rate that is available to the Group for similar financial instruments.
The carrying amounts of mortgage loans receivables, which carry interest rates with reference to bank’s lending rates, approximate their fair values that are determined based on the discounted cash flow projections with reference to the lending rates from financial institutions.

New World Development Company Limited Annual Report 2018164
N o t e s t o t h e F i n a n c i a l S t a t e m e n t s
5 FINANCIAL RISK MANAGEMENT AND FAIR VALUE ESTIMATION (CONTINUED)
(e) Fair value estimation (continued)The following table presents the Group’s financial instruments that are measured at fair value at 30 June 2018:
Level 1 Level 2 Level 3 TotalHK$m HK$m HK$m HK$m
Available-for-sale financial assets 4,158.8 1,907.4 5,712.6 11,778.8
Financial assets at fair value through profit or loss – – 684.3 684.3
Derivative financial instruments
Derivative financial assets – 108.1 – 108.1
4,158.8 2,015.5 6,396.9 12,571.2
Derivative financial instruments
Derivative financial liabilities – (352.5) (13.1) (365.6)
The following table presents the Group’s financial instruments that are measured at fair value at 30 June 2017:
Level 1 Level 2 Level 3 TotalHK$m HK$m HK$m HK$m
Available-for-sale financial assets 2,558.5 1,422.5 2,559.9 6,540.9
Financial assets at fair value through profit or loss 0.1 – 574.5 574.6
Derivative financial instruments
Derivative financial assets – 13.3 58.8 72.1
2,558.6 1,435.8 3,193.2 7,187.6
Derivative financial instruments
Derivative financial liabilities – (648.5) (18.9) (667.4)
There were no significant transfer of financial assets between level 1 and level 2 fair value hierarchy classifications.
The following table presents the changes in level 3 instruments for the year ended 30 June 2018:
Available-for-sale
financial assets
Financial assets at
fair value through
profit or loss
Derivative financial
assets
Derivative financial liabilities
HK$m HK$m HK$m HK$m
At 1 July 2017 2,559.9 574.5 58.8 (18.9)
Additions 2,780.4 452.6 – –
Transfer from level 2 instruments 352.5 – – –
Net gain/(loss) recognised in the consolidated statement of comprehensive income/income statement 144.2 (109.4) 80.5 5.8
Disposals (124.4) (233.4) (139.3) –
At 30 June 2018 5,712.6 684.3 – (13.1)
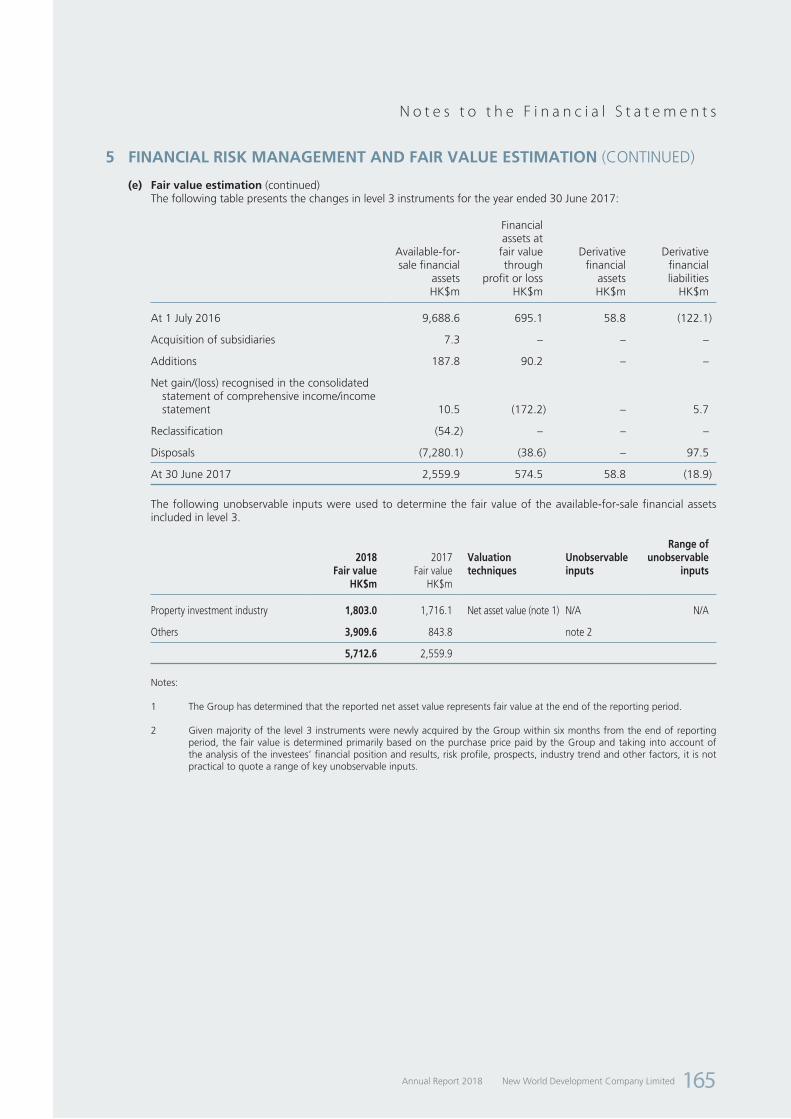
New World Development Company LimitedAnnual Report 2018 165
N o t e s t o t h e F i n a n c i a l S t a t e m e n t s
5 FINANCIAL RISK MANAGEMENT AND FAIR VALUE ESTIMATION (CONTINUED)
(e) Fair value estimation (continued)The following table presents the changes in level 3 instruments for the year ended 30 June 2017:
Available-for-sale financial
assets
Financial assets at fair value through
profit or loss
Derivative financial
assets
Derivative financial liabilities
HK$m HK$m HK$m HK$m
At 1 July 2016 9,688.6 695.1 58.8 (122.1)
Acquisition of subsidiaries 7.3 – – –
Additions 187.8 90.2 – –
Net gain/(loss) recognised in the consolidated statement of comprehensive income/income statement 10.5 (172.2) – 5.7
Reclassification (54.2) – – –
Disposals (7,280.1) (38.6) – 97.5
At 30 June 2017 2,559.9 574.5 58.8 (18.9)
The following unobservable inputs were used to determine the fair value of the available-for-sale financial assets included in level 3.
2018 Fair value
2017 Fair value
Valuation techniques
Unobservable inputs
Range of unobservable
inputsHK$m HK$m
Property investment industry 1,803.0 1,716.1 Net asset value (note 1) N/A N/A
Others 3,909.6 843.8 note 2
5,712.6 2,559.9
Notes:
1 The Group has determined that the reported net asset value represents fair value at the end of the reporting period.
2 Given majority of the level 3 instruments were newly acquired by the Group within six months from the end of reporting period, the fair value is determined primarily based on the purchase price paid by the Group and taking into account of the analysis of the investees’ financial position and results, risk profile, prospects, industry trend and other factors, it is not practical to quote a range of key unobservable inputs.
New World Development Company Limited Annual Report 2018166
N o t e s t o t h e F i n a n c i a l S t a t e m e n t s
6 CRITICAL ACCOUNTING ESTIMATES AND JUDGEMENTS
Estimates and judgements are continually evaluated by the Group and are based on historical experience and other factors, including expectations of future events that are believed to be reasonable under the circumstance.
The Group makes estimates and assumptions concerning the future. The resulting accounting estimates will, by definition, seldom equal the related actual results. The estimates and assumptions that have a significant effect on carrying amounts of assets and liabilities are as follows:
(a) Revenue recognitionRevenue from property development activities is recognised over time when the Group’s performance does not create an asset with an alternative use to the Group and the Group has an enforceable right to payment for performance completed to date; otherwise, revenue is recognised at a point in time when the buyer obtains control of the completed property. The properties contracted for pre-sale to customers have generally no alternative use for the Group due to contractual restrictions. However, whether there is an enforceable right to payment and hence the related contract revenue should be recognised over time, depends on the terms of each contract and the relevant laws that apply to that contract. To assess the enforceability of right to payment, the Group has reviewed the terms of its contracts and the relevant local laws, considered the local regulators’ views and obtained legal advice, where necessary.
For property development revenue that is recognised over time, the Group recognises such property development revenue by reference to the progress of satisfying the performance obligation at the reporting date. This is measured based on the Group’s costs incurred up to the reporting date and budgeted costs which depict the Group’s performance towards satisfying the performance obligation. Significant estimates and judgements are required in determining the accuracy of the budgets, the extent of the costs incurred and the allocation of costs to each property unit. In making the above estimation, the Group conducts periodic review on the budgets and make reference to past experience and work of contractors and surveyors.
For property development and sales contracts for which the control of the property is transferred at a point in time, revenue is recognised when the underlying completed property unit is legally and/or physically transferred to the customer.
(b) Valuation of investment propertiesThe fair value of each completed investment property is individually determined at the end of each reporting period by independent valuers or by management based on a market value assessment. The valuers have relied on the capitalisation of income approach as their primary methods, supported by the direct comparison method. Management also determines fair value based on active market prices and adjusted if necessary for any difference in nature, location or conditions of the specific asset, and uses alternative valuation methods such as recent prices on less active markets. These methodologies are based upon estimates of future results and a set of assumptions specific to each property to reflect its tenancy and cashflow profile. The fair value of each investment property reflects, among other things, rental income from current leases and assumptions about rental income from future leases in light of current market conditions. The fair value also reflects, on a similar basis, any cash outflows that could be expected in respect of the property.
The fair values of investment properties under development are determined by reference to independent valuations. For majority of the Group’s investment properties under development, their fair value reflects the expectations of market participants of the value of the properties when they are completed, less deductions for the costs required to complete the projects and appropriate adjustments for profit and risk. The valuation and all key assumptions used in the valuation should reflect market conditions at the end of each reporting period. The key assumptions include value of completed properties, period of development, outstanding construction costs, finance costs, other professional costs, risk associated with completing the projects and generating income after completion and investors’ return as a percentage of value or cost.
At 30 June 2018, if the market value of investment properties had been 5% (2017: 5%) higher/lower with all other variables held constant, the carrying value of the Group’s investment properties would have been HK$7,486.4 million (2017: HK$5,288.0 million) higher/lower.
(c) Recoverability of properties for/under development and properties held for saleThe Group assesses the carrying amounts of properties for/under development and properties held for sale according to their estimated net realisable value based on the realisability of these properties, taking into account construction costs to completion based on the existing development plans and the estimation of selling prices of the properties of comparable locations and conditions. Provision is made when events or changes in circumstances indicate that the carrying amounts may not be realised. The assessment requires the use of significant estimates.

New World Development Company LimitedAnnual Report 2018 167
N o t e s t o t h e F i n a n c i a l S t a t e m e n t s
6 CRITICAL ACCOUNTING ESTIMATES AND JUDGEMENTS (CONTINUED)
(d) Impairment of interests in joint ventures and associated companiesThe Group determines whether interests in joint ventures and associated companies are impaired by regularly review whether there are any indicators of impairment of the investments by reference to the requirements under HKAS 28 (2011) “Investments in Associates and Joint Ventures” and HKAS 36 “Impairment of Assets”.
For investments where impairment indicators exist, management estimated the recoverable amounts of the investments, being higher of fair value less costs of disposal and value in use. The value in use of the underlying businesses is determined based on the discounted cash flow projections. Significant judgements are required to determine the key assumptions used in the discounted cash flow models, such as revenue growth, unit price and discount rates. Independent external valuers were also involved in the fair value and value in use assessments, where appropriate. For the strategic investment funds held by the Group’s associated companies, management carried out impairment assessments of available-for-sale financial assets and loans and receivables held by these associated companies. Based on the results of these impairment assessments, impairment losses were recognised for the underlying assets of those joint ventures and the Group’s share of such impairment losses, in aggregate, of HK$600.0 million, which have been included in the Group’s share of results of joint ventures for the year ended 30 June 2018 (2017: nil).
(e) Impairment of assetsThe Group tests annually whether goodwill has suffered any impairment according to their recoverable amounts determined by the cash-generating units based on value in use calculations. These calculations require the use of estimates which are subject to change of economic environment in future. Details are set out in note 21.
The Group determines whether an available-for-sale financial asset is impaired by evaluating whether there is significant or prolonged decline in the fair value below its cost.
The Group assesses whether there is objective evidence as stated in note 3(j) that deposits, loans and receivables are impaired. It recognises impairment based on estimates of the extent and timing of future cash flows using applicable discount rates. The final outcome of the recoverability and cash flows of these receivables will impact the amount of impairment required.
(f) Fair value of available-for-sale financial assets and financial assets at fair value through profit or lossThe fair value of available-for-sale financial assets and financial assets at fair value through profit or loss that are not traded in an active market is determined by using valuation techniques. The Group uses its judgement to select a variety of methods and evaluates, among other factors, whether there is significant or prolonged decline in the fair value below the cost of an investment; and the financial health and short-term business outlook for the investee and historical price volatility of these investments. The key assumptions adopted on projected cashflow are based on management’s best estimates.
(g) Estimate of revenue for construction contractsFor revenue from construction work that is recognised over time, the Group recognised such revenue by reference to the progress of satisfying the performance obligation at the reporting date. This is measured based on the Group’s costs incurred up to the reporting date and budgeted costs which depict the Group’s performance towards satisfying the performance obligation. Significant estimates and judgements are required in determining the accuracy of the budgets. In making the above estimation, the Group conducts periodic review on the budgets and makes reference to past experience and work of internal quantity surveyors.
(h) Estimated volume of infrastructures of public servicesThe amortisation for intangible concession rights and impairment assessment of infrastructures for public services using discounted cash flow model are affected by the estimated volume for public services, such as toll roads. Management performs annual reviews to assess the appropriateness of estimated volume by making reference to independent professional studies, if necessary.
The traffic volume is directly and indirectly affected by a number of factors, including the availability, quality, proximity and toll rate differentials of alternative roads and the existence of other means of transportation. The growth of the traffic flow is also highly tied to the future economic and transportation network development of the area in which the infrastructures serve. The growth in future traffic flow projected by the management is highly dependent on the realisation of the aforementioned factors.
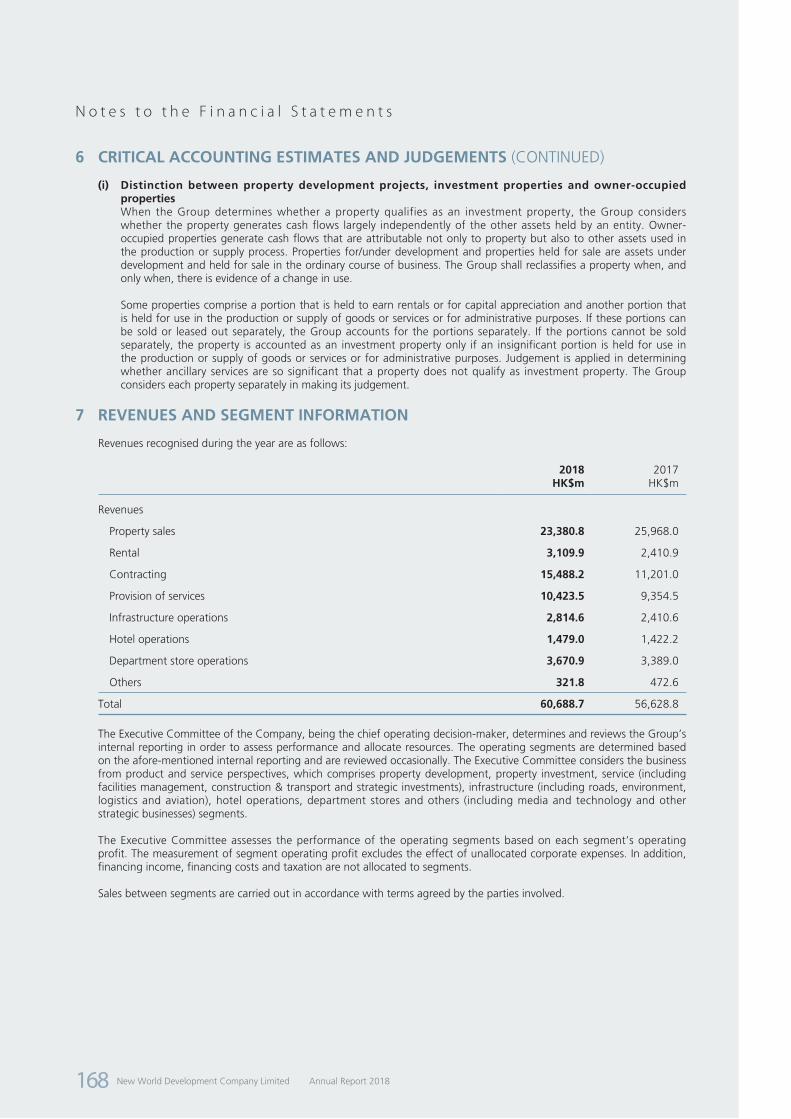
New World Development Company Limited Annual Report 2018168
N o t e s t o t h e F i n a n c i a l S t a t e m e n t s
6 CRITICAL ACCOUNTING ESTIMATES AND JUDGEMENTS (CONTINUED)
(i) Distinction between property development projects, investment properties and owner-occupied propertiesWhen the Group determines whether a property qualifies as an investment property, the Group considers whether the property generates cash flows largely independently of the other assets held by an entity. Owner-occupied properties generate cash flows that are attributable not only to property but also to other assets used in the production or supply process. Properties for/under development and properties held for sale are assets under development and held for sale in the ordinary course of business. The Group shall reclassifies a property when, and only when, there is evidence of a change in use.
Some properties comprise a portion that is held to earn rentals or for capital appreciation and another portion that is held for use in the production or supply of goods or services or for administrative purposes. If these portions can be sold or leased out separately, the Group accounts for the portions separately. If the portions cannot be sold separately, the property is accounted as an investment property only if an insignificant portion is held for use in the production or supply of goods or services or for administrative purposes. Judgement is applied in determining whether ancillary services are so significant that a property does not qualify as investment property. The Group considers each property separately in making its judgement.
7 REVENUES AND SEGMENT INFORMATION
Revenues recognised during the year are as follows:
2018 2017HK$m HK$m
Revenues
Property sales 23,380.8 25,968.0
Rental 3,109.9 2,410.9
Contracting 15,488.2 11,201.0
Provision of services 10,423.5 9,354.5
Infrastructure operations 2,814.6 2,410.6
Hotel operations 1,479.0 1,422.2
Department store operations 3,670.9 3,389.0
Others 321.8 472.6
Total 60,688.7 56,628.8
The Executive Committee of the Company, being the chief operating decision-maker, determines and reviews the Group’s internal reporting in order to assess performance and allocate resources. The operating segments are determined based on the afore-mentioned internal reporting and are reviewed occasionally. The Executive Committee considers the business from product and service perspectives, which comprises property development, property investment, service (including facilities management, construction & transport and strategic investments), infrastructure (including roads, environment, logistics and aviation), hotel operations, department stores and others (including media and technology and other strategic businesses) segments.
The Executive Committee assesses the performance of the operating segments based on each segment’s operating profit. The measurement of segment operating profit excludes the effect of unallocated corporate expenses. In addition, financing income, financing costs and taxation are not allocated to segments.
Sales between segments are carried out in accordance with terms agreed by the parties involved.
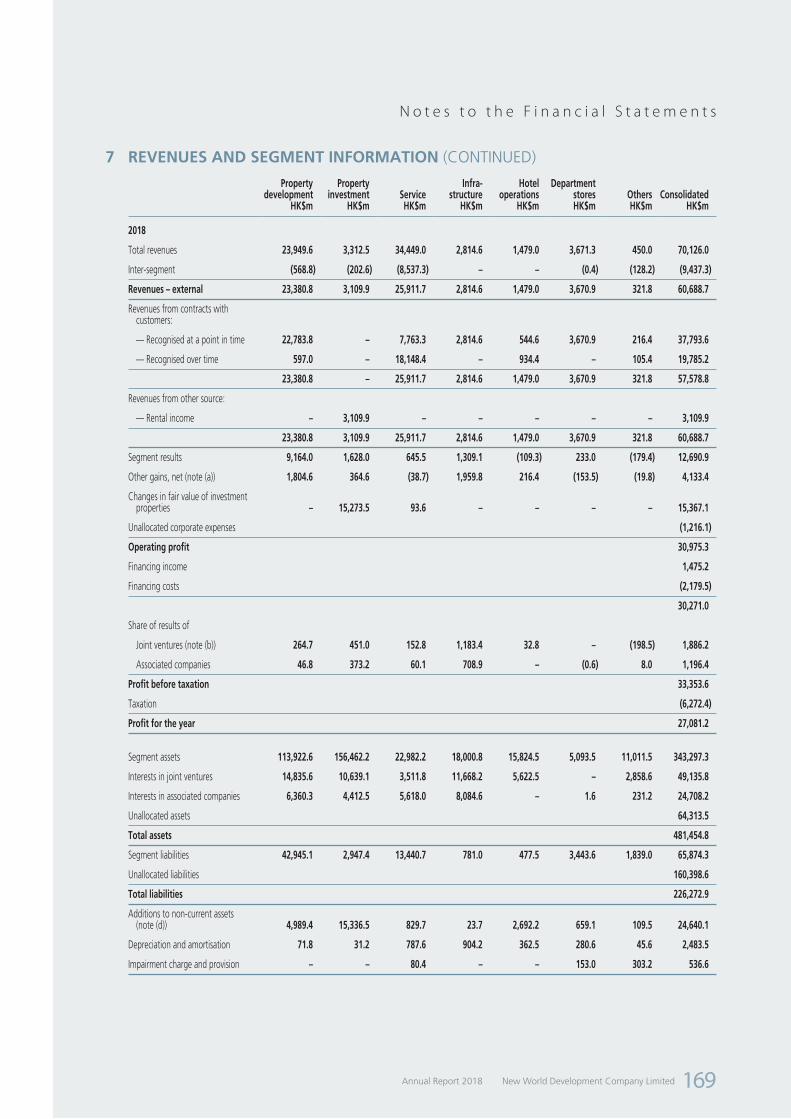
New World Development Company LimitedAnnual Report 2018 169
N o t e s t o t h e F i n a n c i a l S t a t e m e n t s
7 REVENUES AND SEGMENT INFORMATION (CONTINUED)
Property development
Property investment Service
Infra-structure
Hotel operations
Department stores Others Consolidated
HK$m HK$m HK$m HK$m HK$m HK$m HK$m HK$m
2018
Total revenues 23,949.6 3,312.5 34,449.0 2,814.6 1,479.0 3,671.3 450.0 70,126.0
Inter-segment (568.8) (202.6) (8,537.3) – – (0.4) (128.2) (9,437.3)
Revenues – external 23,380.8 3,109.9 25,911.7 2,814.6 1,479.0 3,670.9 321.8 60,688.7
Revenues from contracts with customers:
— Recognised at a point in time 22,783.8 – 7,763.3 2,814.6 544.6 3,670.9 216.4 37,793.6
— Recognised over time 597.0 – 18,148.4 – 934.4 – 105.4 19,785.2
23,380.8 – 25,911.7 2,814.6 1,479.0 3,670.9 321.8 57,578.8
Revenues from other source:
— Rental income – 3,109.9 – – – – – 3,109.9
23,380.8 3,109.9 25,911.7 2,814.6 1,479.0 3,670.9 321.8 60,688.7
Segment results 9,164.0 1,628.0 645.5 1,309.1 (109.3) 233.0 (179.4) 12,690.9
Other gains, net (note (a)) 1,804.6 364.6 (38.7) 1,959.8 216.4 (153.5) (19.8) 4,133.4
Changes in fair value of investment properties – 15,273.5 93.6 – – – – 15,367.1
Unallocated corporate expenses (1,216.1)
Operating profit 30,975.3
Financing income 1,475.2
Financing costs (2,179.5)
30,271.0
Share of results of
Joint ventures (note (b)) 264.7 451.0 152.8 1,183.4 32.8 – (198.5) 1,886.2
Associated companies 46.8 373.2 60.1 708.9 – (0.6) 8.0 1,196.4
Profit before taxation 33,353.6
Taxation (6,272.4)
Profit for the year 27,081.2
Segment assets 113,922.6 156,462.2 22,982.2 18,000.8 15,824.5 5,093.5 11,011.5 343,297.3
Interests in joint ventures 14,835.6 10,639.1 3,511.8 11,668.2 5,622.5 – 2,858.6 49,135.8
Interests in associated companies 6,360.3 4,412.5 5,618.0 8,084.6 – 1.6 231.2 24,708.2
Unallocated assets 64,313.5
Total assets 481,454.8
Segment liabilities 42,945.1 2,947.4 13,440.7 781.0 477.5 3,443.6 1,839.0 65,874.3
Unallocated liabilities 160,398.6
Total liabilities 226,272.9
Additions to non-current assets (note (d)) 4,989.4 15,336.5 829.7 23.7 2,692.2 659.1 109.5 24,640.1
Depreciation and amortisation 71.8 31.2 787.6 904.2 362.5 280.6 45.6 2,483.5
Impairment charge and provision – – 80.4 – – 153.0 303.2 536.6

New World Development Company Limited Annual Report 2018170
N o t e s t o t h e F i n a n c i a l S t a t e m e n t s
7 REVENUES AND SEGMENT INFORMATION (CONTINUED)
Property development
Property investment Service
Infra-structure
Hotel operations
Department stores Others Consolidated
HK$m HK$m HK$m HK$m HK$m HK$m HK$m HK$m(note (c))
2017
Total revenues 26,134.1 2,585.9 30,249.4 2,410.6 1,422.2 3,391.1 564.4 66,757.7
Inter-segment (166.1) (175.0) (9,693.9) – – (2.1) (91.8) (10,128.9)
Revenues – external 25,968.0 2,410.9 20,555.5 2,410.6 1,422.2 3,389.0 472.6 56,628.8
Segment results 7,419.6 1,377.7 774.9 1,166.6 (52.0) 220.0 225.5 11,132.3
Other gains, net (40.8) 213.5 314.3 663.3 – (97.7) (624.0) 428.6
Changes in fair value of investment properties – 1,246.7 117.1 – – – – 1,363.8
Unallocated corporate expenses (1,173.4)
Operating profit 11,751.3
Financing income 1,705.9
Financing costs (2,152.0)
11,305.2
Share of results of
Joint ventures (26.3) 428.8 269.9 1,546.3 (27.4) – (161.6) 2,029.7
Associated companies 113.5 167.9 983.2 600.1 – – 30.7 1,895.4
Profit before taxation 15,230.3
Taxation (4,755.6)
Profit for the year 10,474.7
Segment assets 117,055.7 108,476.1 18,048.9 15,191.8 17,549.5 5,182.7 11,912.9 293,417.6
Interests in joint ventures 11,754.9 13,271.9 3,308.7 11,957.4 5,873.4 – 3,151.1 49,317.4
Interests in associated companies 5,979.4 3,996.0 6,819.9 9,373.1 – – 233.4 26,401.8
Unallocated assets 67,919.5
Total assets 437,056.3
Segment liabilities 31,902.8 1,108.9 12,058.8 618.9 474.7 3,488.2 1,840.3 51,492.6
Unallocated liabilities 164,619.2
Total liabilities 216,111.8
Additions to non-current assets (note (d)) 2,845.8 14,295.1 5,301.2 37.6 2,963.6 164.5 919.1 26,526.9
Depreciation and amortisation 58.5 31.6 390.8 822.1 276.3 294.1 79.1 1,952.5
Impairment charge and provision 101.2 – 34.1 – – 90.3 243.1 468.7

New World Development Company LimitedAnnual Report 2018 171
N o t e s t o t h e F i n a n c i a l S t a t e m e n t s
7 REVENUES AND SEGMENT INFORMATION (CONTINUED)
RevenuesNon-current
assetsHK$m HK$m
(note (d))
2018
Hong Kong 33,397.2 132,470.3
Mainland China 26,234.0 82,742.2
Others 1,057.5 1,385.3
60,688.7 216,597.8
2017
Hong Kong 29,978.6 97,141.0
Mainland China 25,958.8 74,391.1
Others 691.4 300.9
56,628.8 171,833.0
Notes:
(a) On 11 January 2018, Fortland Ventures Limited (an indirect wholly owned subsidiary of NWS Holdings Limited (“NWSH”), a subsidiary of the Group) entered into a placing agreement for the placing of 208,000,000 issued H shares of Beijing Capital International Airport Co., Ltd (“BCIA”) at the placing price of HK$11.35 per share (the “Placing”). Closing of the Placing took place on 16 January 2018 and thereafter, the NWSH’s interest in BCIA’s total issued H shares reduced from approximately 23.86% to approximately 12.79%. A gain on disposal under the Placing of HK$783.8 million was recognised during the year. Subsequently, an executive director of NWSH resigned as a non-executive director and a member of the strategy committee of BCIA on 2 February 2018. As a result, NWSH ceased to exercise significant influence on BCIA and its interest in BCIA was reclassified from investment in an associated company to an available-for-sale financial asset with effect from 2 February 2018 with its carrying value marked to its market value on 2 February 2018. Pursuant to HKAS 39 “Financial Instruments: Recognition and Measurement”, a gain on the remeasurement at fair value upon reclassification amounting to HK$1,095.5 million was recognised during the year.
(b) For the year ended 30 June 2018, the share of results of joint ventures in the infrastructure segment included share of impairment losses for the underlying assets for Guangzhou City Nansha Port Expressway of HK$300.0 million, share of impairment losses for the underlying assets for Guangzhou Dongxin Expressway of HK$100.0 million and share of impairment losses for the underlying assets for Guodian Chengdu Jintang Power Generation Co., Ltd of HK$200.0 million.
(c) For the year ended 30 June 2017, the segment results of the service segment included gain on disposal of the entire interest in Tricor Holdings Limited of HK$932.8 million, and losses in relation to the Group’s interest in Newton Resources Ltd including share of impairment loss of HK$204.0 million, loss on partial disposal of HK$52.3 million and loss on remeasurement of HK$34.3 million.
(d) Non-current assets represent non-current assets other than financial instruments, interests in joint ventures, interests in associated companies and deferred tax assets.
(e) For the year ended 30 June 2018, the operating profit before depreciation and amortisation, changes in fair value of investment properties and other gains, net and after net exchange difference amounted to HK$13,894.0 million, of which HK$4,450.5 million was attributable to Hong Kong and HK$9,443.5 million was attributable to Mainland China and others.
8 OTHER INCOME
2018 2017HK$m HK$m
Dividend income from available-for-sale financial assets, perpetual securities and financial assets at fair value through profit or loss 137.3 528.8

New World Development Company Limited Annual Report 2018172
N o t e s t o t h e F i n a n c i a l S t a t e m e n t s
9 OTHER GAINS, NET
2018 2017HK$m HK$m
Gain/(loss) on remeasurement of an available-for-sale financial asset retained at fair value upon reclassification from an associated company (note 7(a)) 1,095.5 (34.3)
Gain on deemed disposal of interests in joint ventures – 546.9
Gain on remeasurement of previously held interests of joint ventures at fair value upon further acquisition to become subsidiaries – 374.2
Net gain/(loss) on fair value of financial assets at fair value through profit or loss 91.3 (236.7)
Net gain/(loss) on disposal of
Associated companies (note 7(a)) 850.1 74.2
Available-for-sale financial assets 114.9 110.2
Financial assets at fair value through profit or loss 7.8 69.2
Investment properties, property, plant and equipment and intangible concession rights 232.4 167.8
Joint ventures – 133.7
Non-current assets classified as assets held for sale – 244.2
Perpetual securities – (116.4)
Subsidiaries (note (a)) 1,821.0 (127.2)
Write back of provision for loans and other receivables 90.3 124.8
Reversal of other payables 431.0 –
Impairment loss on
Available-for-sale financial assets (27.3) (139.2)
Intangible assets (192.9) (48.4)
Loans and other receivables (220.3) (231.3)
Property, plant and equipment (96.1) (49.8)
Net exchange losses (64.3) (433.3)
4,133.4 428.6
Notes:
(a) The subsidiaries being disposed during the year were mainly engaged in property development, property investment and hotel operations.
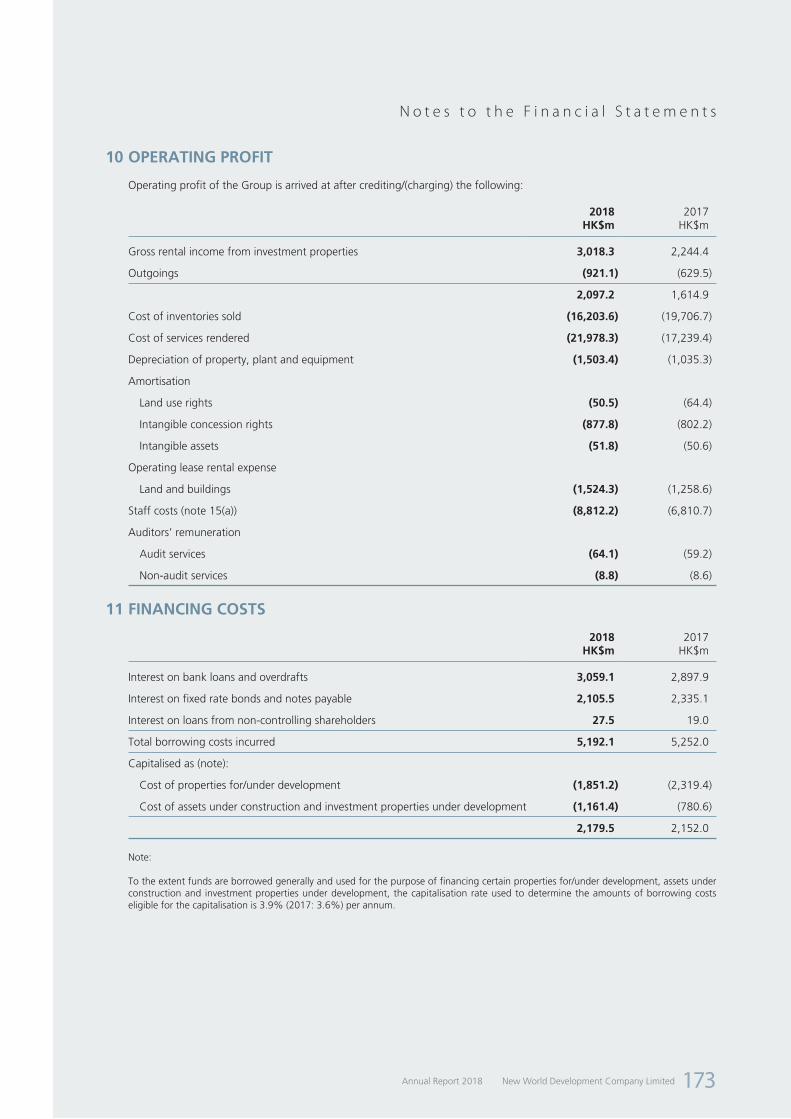
New World Development Company LimitedAnnual Report 2018 173
N o t e s t o t h e F i n a n c i a l S t a t e m e n t s
10 OPERATING PROFIT
Operating profit of the Group is arrived at after crediting/(charging) the following:
2018 2017HK$m HK$m
Gross rental income from investment properties 3,018.3 2,244.4
Outgoings (921.1) (629.5)
2,097.2 1,614.9
Cost of inventories sold (16,203.6) (19,706.7)
Cost of services rendered (21,978.3) (17,239.4)
Depreciation of property, plant and equipment (1,503.4) (1,035.3)
Amortisation
Land use rights (50.5) (64.4)
Intangible concession rights (877.8) (802.2)
Intangible assets (51.8) (50.6)
Operating lease rental expense
Land and buildings (1,524.3) (1,258.6)
Staff costs (note 15(a)) (8,812.2) (6,810.7)
Auditors’ remuneration
Audit services (64.1) (59.2)
Non-audit services (8.8) (8.6)
11 FINANCING COSTS
2018 2017HK$m HK$m
Interest on bank loans and overdrafts 3,059.1 2,897.9
Interest on fixed rate bonds and notes payable 2,105.5 2,335.1
Interest on loans from non-controlling shareholders 27.5 19.0
Total borrowing costs incurred 5,192.1 5,252.0
Capitalised as (note):
Cost of properties for/under development (1,851.2) (2,319.4)
Cost of assets under construction and investment properties under development (1,161.4) (780.6)
2,179.5 2,152.0
Note:
To the extent funds are borrowed generally and used for the purpose of financing certain properties for/under development, assets under construction and investment properties under development, the capitalisation rate used to determine the amounts of borrowing costs eligible for the capitalisation is 3.9% (2017: 3.6%) per annum.

New World Development Company Limited Annual Report 2018174
N o t e s t o t h e F i n a n c i a l S t a t e m e n t s
12 TAXATION
2018 2017HK$m HK$m
Current taxation
Hong Kong profits tax 751.9 704.1
Mainland China and overseas taxation 2,370.3 1,606.3
Mainland China land appreciation tax 3,187.1 2,085.5
Deferred taxation (note 27)
Valuation of investment properties 206.8 246.3
Other temporary differences (243.7) 113.4
6,272.4 4,755.6
Hong Kong profits tax has been provided at the rate of 16.5% (2017: 16.5%) on the estimated assessable profit for the year.
Taxation on Mainland China and overseas profits has been calculated on the estimated taxable profit for the year at the rates of taxation prevailing in the countries in which the Group operates. These rates range from 12% to 25% (2017: 12% to 25%).
Mainland China land appreciation tax is provided at progressive rates ranging from 30% to 60% (2017: 30% to 60%) on the appreciation of land value, being the proceeds of sale of properties less deductible expenditures including costs of land use rights and property development expenditures.
Share of results of joint ventures and associated companies is stated after deducting the share of taxation of joint ventures and associated companies of HK$626.0 million and HK$161.3 million (2017: HK$779.5 million and HK$263.0 million) respectively.
The taxation on the Group’s profit before taxation differs from the theoretical amount that would arise using the taxation rate of Hong Kong as follows:
2018 2017HK$m HK$m
Profit before taxation and share of results of joint ventures and associated companies 30,271.0 11,305.2
Calculated at a taxation rate of 16.5% (2017: 16.5%) 4,994.7 1,865.4
Effect of different taxation rates in other countries 941.6 742.8
Income not subject to taxation (3,131.4) (1,200.2)
Expenses not deductible for taxation purposes 903.8 955.6
Tax losses not recognised 311.9 374.9
Temporary differences not recognised 40.1 400.2
Utilisation of previously unrecognised tax losses (56.0) (67.0)
Deferred taxation on undistributed profits 201.4 292.6
Recognition of previously unrecognised temporary differences 8.7 2.5
Recognition of previously unrecognised tax losses (124.3) (125.8)
Over-provision in prior years (210.7) (44.5)
Land appreciation tax deductible for calculation of income tax purposes (796.5) (521.1)
Others 2.0 (5.3)
3,085.3 2,670.1
Mainland China land appreciation tax 3,187.1 2,085.5
Taxation charge 6,272.4 4,755.6

New World Development Company LimitedAnnual Report 2018 175
N o t e s t o t h e F i n a n c i a l S t a t e m e n t s
13 EARNINGS PER SHARE
The calculation of basic and diluted earnings per share for the year is based on the following:
2018 2017HK$m HK$m
Profit attributable to shareholders of the Company for calculating basic earnings per share 23,338.1 7,675.7
Adjustment on the effect of dilution in the results of subsidiaries (2.1) –
Profit attributable to shareholders of the Company for calculating diluted earnings per share 23,336.0 7,675.7
Number of shares (million)2018 2017
Weighted average number of shares for calculating basic earnings per share 9,974.0 9,553.2
Effect of dilutive potential ordinary shares upon the exercise of share options 24.7 10.9
Weighted average number of shares for calculating diluted earnings per share 9,998.7 9,564.1
Diluted earnings per share is calculated by adjusting the weighted average number of ordinary shares outstanding to assume conversion of all dilutive potential ordinary shares (2017: Same).
14 DIVIDENDS
2018 2017HK$m HK$m
Interim dividend of HK$0.14 (2017: HK$0.13) per share 1,414.1 1,258.8
Final dividend proposed of HK$0.34 (2017: HK$0.33) per share 3,470.4 3,244.7
4,884.5 4,503.5
Of which the following were settled by the issue of scrip:
Interim dividend 1,175.4 1,056.3
Final dividend # 2,626.7
# Full amount had been set aside from retained profits for the 2018 proposed final dividend on the basis that all shareholders would elect to receive cash being the alternative to their entitlements to the scrip dividends.
At a meeting held on 20 September 2018, the Directors recommended a final dividend of HK$0.34 per share. This proposed dividend was not reflected as a dividend payable in these financial statements, but will be reflected as an appropriation of retained profits for the year ending 30 June 2019.

New World Development Company Limited Annual Report 2018176
N o t e s t o t h e F i n a n c i a l S t a t e m e n t s
15 STAFF COSTS
(a) Staff costs
2018 2017HK$m HK$m
Wages, salaries and other benefits 10,180.0 8,283.8
Pension costs – defined benefit plans 24.0 4.0
Pension costs – defined contribution plans 353.6 296.2
Share options (note (b)) 57.2 56.6
10,614.8 8,640.6
Less: Amounts capitalised in investment properties under development, assets under construction and properties for/under development (1,802.6) (1,829.9)
8,812.2 6,810.7
Staff costs include directors’ remuneration.
(b) Share optionsDuring the year, the Company and its subsidiary, NWSH, operate share option schemes whereby options may be granted to eligible employees and directors, to subscribe for shares of the Company and NWSH respectively.
Details of share options are as follows:
Grantor Date of grant Exercise price HK$
At 1 July 2017
Granted Exercised Lapsed/cancelled
At 30 June 2018
Number of share options
exercisable as at
30 June 2018
Note
The Company 22 January 2014 to 3 July 2017 7.2 to 10.4 129,691,419 53,450,000 (53,197,038) (4,658,690) 125,285,691 63,522,436 (i)
Weighted average exercise price of each category (HK$) – 8.486 10.036 9.214 9.187 8.812 8.427
NWSH 9 March 2015 14.120 49,455,830 – (8,214,363) (74) 41,241,393 41,241,393 (ii)
Weighted average exercise price of each category (HK$) – 14.120 – 14.120 14.120 14.120 14.120

New World Development Company LimitedAnnual Report 2018 177
N o t e s t o t h e F i n a n c i a l S t a t e m e n t s
15 STAFF COSTS (CONTINUED)
(b) Share options (continued)Notes:
(i) A share option scheme was adopted by the Company on 24 November 2006 and amended on 13 March 2012 which will be valid and effective for a period of ten years from the date of adoption. On 22 January 2014, 27 October 2014, 7 July 2015, 9 March 2016 and 10 June 2016, 30,100,000, 34,400,000, 20,100,000, 20,200,000 and 68,037,928 share options were granted to Directors and certain eligible participants at the exercise price of HK$10.400, HK$9.510, HK$9.976, HK$7.200 and HK$7.540 per share respectively.
A share option scheme was adopted by the Company on 22 November 2016 which will be valid and effective for a period of ten years from the date of adoption. On 3 July 2017, 53,450,000 share options were granted to Directors and certain eligible participants at the exercise price of HK$10.036 per share.
The share options granted on 22 January 2014 were divided into 4 tranches exercisable from 22 January 2014, 22 January 2015, 22 January 2016 and 22 January 2017 respectively to 21 January 2018.
The share options granted on 27 October 2014 were divided into 4 tranches exercisable from 27 October 2014, 27 October 2015, 27 October 2016 and 27 October 2017 respectively to 26 October 2018.
The share options granted on 7 July 2015 were divided into 4 tranches exercisable from 7 July 2015, 7 July 2016, 7 July 2017 and 7 July 2018 respectively to 6 July 2019.
The share options granted on 9 March 2016 were divided into 4 tranches exercisable from 9 March 2016, 9 March 2017, 9 March 2018 and 9 March 2019 respectively to 8 March 2020.
The share options granted on 10 June 2016 were divided into 4 tranches exercisable from 10 June 2016, 10 June 2017, 10 June 2018 and 10 June 2019 respectively to 9 June 2020.
The share options granted on 3 July 2017 were divided into 4 tranches exercisable from 3 July 2017, 3 July 2018, 3 July 2019 and 3 July 2020 respectively to 2 July 2021.
For the year ended 30 June 2018, the weighted average share price at the time of exercise was HK$11.571 per share (2017: HK$10.128 per share).
(ii) The share option scheme of NWSH, which was adopted on 21 November 2011, is valid and effective for a period of ten years from the date of adoption. The Board may, at their discretion, grant options to any eligible participant as defined under the share option scheme to subscribe for the shares of NWSH. The total number of shares which may be issued upon exercise of all options to be granted under the share option scheme must not in aggregate exceed 10% of the share capital of NWSH in issue as at 21 November 2011, i.e. 3,388,900,598 shares.
On 9 March 2015, 55,470,000 share options were granted to directors and certain eligible participants at the exercise price of HK$14.160 per share, which represents the average closing price of NWSH’s shares in the daily quotations sheets of the Hong Kong Stock Exchange for the five trading days immediately preceding 9 March 2015. Such share options will expire on 8 March 2020.
Pursuant to the Share Option Scheme, the number of unexercised share options and the exercise price may be subject to adjustment in case of alteration in the capital structure of NWSH. Due to the distribution of dividends of NWSH in scrip form, several adjustments had been made to the number and the exercise price of outstanding share options in accordance with the Share Option Scheme in prior years. With effect from 15 May 2017, the exercise price per share for the share options granted was adjusted to HK$14.120.
The share options were vested according to the Share Option Scheme and the terms of grant provided that for the vesting to occur the grantee has to remain as an eligible participant on such vesting date.
(iii) The Binomial pricing model requires input of subjective assumptions such as the expected stock price volatility. Change in the subjective input may materially affect the fair value estimates.

New World Development Company Limited Annual Report 2018178
N o t e s t o t h e F i n a n c i a l S t a t e m e n t s
15 STAFF COSTS (CONTINUED)
(c) Five highest paid individualsThe five individuals whose emoluments were the highest in the Group for the year include 4 directors (2017: 3 directors) whose emoluments are reflected in the analysis shown in Note 16(a). The emoluments to the remaining 1 (2017: 2) individual during the year are as follows:
2018 2017HK$m HK$m
Salaries and other emoluments 15.5 31.7
Employer’s contributions to retirement benefit schemes 0.6 1.2
Share options 0.7 0.2
16.8 33.1
The emoluments of the individuals fell within the following bands:
Number of individuals2018 2017
Emolument band (HK$)
15,500,001–16,000,000 – 1
16,500,001–17,000,000 1 –
17,000,001–17,500,000 – 1
1 2
(d) Emoluments of senior managementOther than the emoluments of directors and five highest paid individuals disclosed in note 16(a) and note 15(c) respectively, the emoluments of the senior management whose profiles are included in Directors’ Profile/Senior Management Profile sections of this report fell within the following bands:
Number of individuals2018 2017
Emolument band (HK$)
5,000,001–5,500,000 – 3
5,500,001–6,000,000 2 –
11,500,001–12,000,000 – 1
2 4

New World Development Company LimitedAnnual Report 2018 179
N o t e s t o t h e F i n a n c i a l S t a t e m e n t s
16 BENEFITS AND INTERESTS OF DIRECTORS
(a) Directors’ emoluments
As director (note(i))
Name of Directors
Fees SalariesDiscretionary
bonuses
Estimated money value
of other benefits
(note (iii))
Employer’s contribution to
a retirement benefit scheme
As management (note (ii)) Total
HK$m HK$m HK$m HK$m HK$m HK$m HK$m
Year ended 30 June 2018
Dr. Cheng Kar-Shun, Henry 1.7 – – 3.1 – 52.5 57.3
Mr. Doo Wai-Hoi, William 0.3 – – 0.1 – – 0.4
Dr. Cheng Chi-Kong, Adrian 0.5 – – 2.6 – 36.1 39.2
Mr. Yeung Ping-Leung, Howard 0.6 – – 0.2 – – 0.8
Mr. Cha Mou-Sing, Payson 0.7 – – 0.2 – – 0.9
Mr. Cheng Kar-Shing, Peter 0.4 7.3 1.6 0.2 0.7 – 10.2
Mr. Ho Hau-Hay, Hamilton 0.7 – – 0.2 – – 0.9
Mr. Lee Luen-Wai, John 0.7 – – 0.2 – – 0.9
Mr. Liang Cheung-Biu, Thomas 0.6 – – 0.2 – – 0.8
Mr. Ip Yuk-Keung 0.1 – – – – – 0.1
Ms. Ki Man-Fung, Leonie 0.3 – – 0.8 – 7.8 8.9
Mr. Cheng Chi-Heng 0.3 – – 0.2 – 2.2 2.7
Ms. Cheng Chi-Man, Sonia 0.3 – – 0.8 – 14.8 15.9
Mr. Au Tak-Cheong 0.5 – – 0.3 – 8.6 9.4
Mr. Sitt Nam-Hoi 0.1 – – 0.3 – 13.6 14.0
Mr. So Chung-Keung, Alfred 0.1 – – 0.5 – 16.8 17.4
Total 7.9 7.3 1.6 9.9 0.7 152.4 179.8

New World Development Company Limited Annual Report 2018180
N o t e s t o t h e F i n a n c i a l S t a t e m e n t s
16 BENEFITS AND INTERESTS OF DIRECTORS (CONTINUED)
(a) Directors’ emoluments (continued)
As director (note(i))
Name of Directors
Fees SalariesDiscretionary
bonuses
Estimated money value
of other benefits
(note (iii))
Employer’s contribution to
a retirement benefit scheme
As management (note (ii)) Total
HK$m HK$m HK$m HK$m HK$m HK$m HK$m
Year ended 30 June 2017
Dr. Cheng Kar-Shun, Henry 1.5 – – 3.7 – 50.0 55.2
Mr. Doo Wai-Hoi, William 0.3 – – 0.2 – – 0.5
Dr. Cheng Chi-Kong, Adrian 0.5 – – 2.1 – 30.6 33.2
Mr. Yeung Ping-Leung, Howard 0.7 – – 0.1 – – 0.8
Mr. Cha Mou-Sing, Payson 0.8 – – 0.1 – – 0.9
Mr. Cheng Kar-Shing, Peter 0.3 7.0 1.6 0.1 0.7 – 9.7
Mr. Ho Hau-Hay, Hamilton 0.7 – – 0.1 – – 0.8
Mr. Lee Luen-Wai, John 0.8 – – 0.1 – – 0.9
Mr. Liang Cheung-Biu, Thomas 0.6 – – 0.1 – – 0.7
Ms. Ki Man-Fung, Leonie 0.4 – – 0.8 – 7.2 8.4
Mr. Cheng Chi-Heng 0.4 – – 0.1 – 2.1 2.6
Mr. Chen Guanzhan 0.4 – – 0.9 – 5.4 6.7
Ms. Cheng Chi-Man, Sonia 0.4 – – 0.8 – 12.7 13.9
Mr. Au Tak-Cheong 0.5 – – 0.5 – 7.9 8.9
Total 8.3 7.0 1.6 9.7 0.7 115.9 143.2
Notes:
(i) The amounts represented emoluments paid or receivable in respect of a person’s services as a director, whether of the Company or its subsidiary undertakings.
(ii) The amounts represented emoluments paid or receivable in respect of a person’s other services in connection with the management of the affairs of the Company or its subsidiary undertakings and included salaries, discretionary bonuses, employer’s contributions to retirement benefit schemes and housing allowance.
(iii) Other benefits represented share options. The value of the share options granted to the directors of the Company under the share option schemes of the Company and its subsidiaries represents the fair value of these options charged to the consolidated income statement for the year in accordance with HKFRS 2.
(iv) No director waived or agreed to waive any emoluments during the year.

New World Development Company LimitedAnnual Report 2018 181
N o t e s t o t h e F i n a n c i a l S t a t e m e n t s
16 BENEFITS AND INTERESTS OF DIRECTORS (CONTINUED)
(b) Directors’ material interests in transactions, arrangements or contractsOn 10 April 2017, a master services agreement (the “Mr. Doo MSA”) was entered into between the Company and Mr. Doo Wai-Hoi, William, Non‐executive Vice-chairman (“Mr. Doo”) for a term of three years commencing from 1 July 2017 up to and including 30 June 2020 in respect of the provision of the operational and rental services by companies owned by Mr. Doo to the Group, and vice versa. Subject to compliance with the relevant requirements under the Listing Rules, upon expiration of the initial term or subsequent renewal term, the Mr. Doo MSA will be automatically renewed for a successive period of three years thereafter (or such other period permitted under the Listing Rules). The Mr. Doo MSA and the annual caps set for each of the three financial years ending 30 June 2020 were approved by the independent shareholders of the Company on 26 May 2017. For the year ended 30 June 2018, the aggregate amount of the transactions amounted to approximately HK$1,728.3 million (2017: HK$1,419.7 million).
On 27 October 2017, New World Development (China) Limited (“NWD (China)”), an indirectly wholly owned subsidiary of the Group, entered into a Sales and Purchase Agreement with Oriental Triumph Inc. (“Oriental Triumph”), a wholly owned company of Mr. Doo, with regards to the sales of the entire issue share capital of Ramada Property Ltd., which together with its subsidiaries own and operate the Shanghai Ramada Plaza, New World Shanghai Hotel and pentahotel Shanghai, from NWD (China) to Oriental Triumph, at a consideration of RMB1.85 billion (equivalent to approximately HK$2.2 billion), subject to customary closing adjustment, which was completed on 28 March 2018.
Save as mentioned above, no other significant transactions, arrangements or contracts in relation to the Group’s business to which the Company was a party and in which a director of the Company had a material interest, whether directly or indirectly, subsisted at the end of the year or at any time during the year.
17 INVESTMENT PROPERTIES
2018 2017HK$m HK$m
Completed investment properties 86,254.8 61,936.3
Investment properties under development 63,472.9 43,824.1
149,727.7 105,760.4
Completed investment properties
Investment properties
under development Total
HK$m HK$m HK$m
At 1 July 2017 61,936.3 43,824.1 105,760.4
Translation differences 1,042.2 441.3 1,483.5
Acquisition of subsidiaries 7,083.5 – 7,083.5
Disposal of subsidiaries (539.6) – (539.6)
Additions 387.5 6,761.4 7,148.9
Transfer between investment properties, property, plant and equipment and land use rights 134.5 7,255.0 7,389.5
Transfer between investment properties, properties under development and properties held for sale 79.6 7,712.5 7,792.1
Transfer between investment properties and non-current assets classified as assetsheld for sale (252.5) (568.2) (820.7)
Disposals (937.0) – (937.0)
Changes in fair value 4,586.9 10,780.2 15,367.1
Transfer upon completion 12,733.4 (12,733.4) –
At 30 June 2018 86,254.8 63,472.9 149,727.7
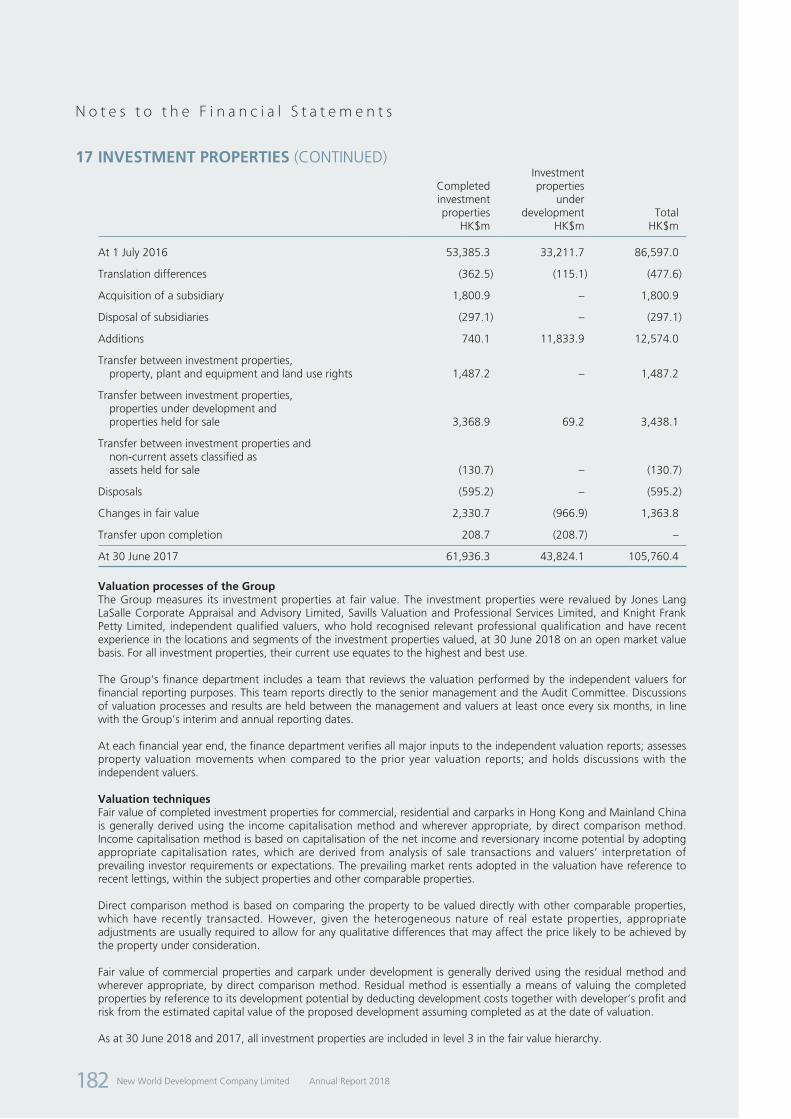
New World Development Company Limited Annual Report 2018182
N o t e s t o t h e F i n a n c i a l S t a t e m e n t s
17 INVESTMENT PROPERTIES (CONTINUED)
Completed investment properties
Investment properties
under development Total
HK$m HK$m HK$m
At 1 July 2016 53,385.3 33,211.7 86,597.0
Translation differences (362.5) (115.1) (477.6)
Acquisition of a subsidiary 1,800.9 – 1,800.9
Disposal of subsidiaries (297.1) – (297.1)
Additions 740.1 11,833.9 12,574.0
Transfer between investment properties, property, plant and equipment and land use rights 1,487.2 – 1,487.2
Transfer between investment properties, properties under development and properties held for sale 3,368.9 69.2 3,438.1
Transfer between investment properties and non-current assets classified as assets held for sale (130.7) – (130.7)
Disposals (595.2) – (595.2)
Changes in fair value 2,330.7 (966.9) 1,363.8
Transfer upon completion 208.7 (208.7) –
At 30 June 2017 61,936.3 43,824.1 105,760.4
Valuation processes of the GroupThe Group measures its investment properties at fair value. The investment properties were revalued by Jones Lang LaSalle Corporate Appraisal and Advisory Limited, Savills Valuation and Professional Services Limited, and Knight Frank Petty Limited, independent qualified valuers, who hold recognised relevant professional qualification and have recent experience in the locations and segments of the investment properties valued, at 30 June 2018 on an open market value basis. For all investment properties, their current use equates to the highest and best use.
The Group’s finance department includes a team that reviews the valuation performed by the independent valuers for financial reporting purposes. This team reports directly to the senior management and the Audit Committee. Discussions of valuation processes and results are held between the management and valuers at least once every six months, in line with the Group’s interim and annual reporting dates.
At each financial year end, the finance department verifies all major inputs to the independent valuation reports; assesses property valuation movements when compared to the prior year valuation reports; and holds discussions with the independent valuers.
Valuation techniquesFair value of completed investment properties for commercial, residential and carparks in Hong Kong and Mainland China is generally derived using the income capitalisation method and wherever appropriate, by direct comparison method. Income capitalisation method is based on capitalisation of the net income and reversionary income potential by adopting appropriate capitalisation rates, which are derived from analysis of sale transactions and valuers’ interpretation of prevailing investor requirements or expectations. The prevailing market rents adopted in the valuation have reference to recent lettings, within the subject properties and other comparable properties.
Direct comparison method is based on comparing the property to be valued directly with other comparable properties, which have recently transacted. However, given the heterogeneous nature of real estate properties, appropriate adjustments are usually required to allow for any qualitative differences that may affect the price likely to be achieved by the property under consideration.
Fair value of commercial properties and carpark under development is generally derived using the residual method and wherever appropriate, by direct comparison method. Residual method is essentially a means of valuing the completed properties by reference to its development potential by deducting development costs together with developer’s profit and risk from the estimated capital value of the proposed development assuming completed as at the date of valuation.
As at 30 June 2018 and 2017, all investment properties are included in level 3 in the fair value hierarchy.

New World Development Company LimitedAnnual Report 2018 183
N o t e s t o t h e F i n a n c i a l S t a t e m e n t s
17 INVESTMENT PROPERTIES (CONTINUED)
Valuation techniques (Continued)There were no changes to the valuation techniques during the year and there were no transfers among the fair value hierarchy during the year.
Information about fair value measurements using significant unobservable inputs:
Range of significant unobservable inputs
2018 Fair value
HK$mValuation
techniquesPrevailing market
rent per month Unit priceCapitalisation
rate
Completed investment properties
Hong Kong
Commercial 45,399.8 Income capitalisation
HK$23 – HK$400 per square feet
N/A 1.5% – 5.3%
Carparks 2,862.0 Income capitalisation
HK$2,730 – HK$6,500 per carpark space
N/A 3.5% – 4.2%
Mainland China and others
Commercial 29,166.0 Income capitalisation
HK$13 – HK$261 per square metre
N/A 2.0% – 12.0%
260.6 Direct comparison
N/A HK$19,000 – HK$21,000
per square metre
N/A
Carparks 6,757.2 Direct comparison
N/A HK$143,000 – HK$690,000
per carpark space
N/A
Residential 1,809.2 Income capitalisation
HK$121 – HK$214per square metre
N/A 4.25% – 15.0%
Total 86,254.8
Range of significant unobservable inputs
2018 Fair value
HK$mValuation
techniques Unit price
Estimated developer’s
profit and risk margins
Investment properties under development
Commercial 55,975.2 Residual HK$2,130 – HK$63,000 per square feet
0.8% – 15.0%
6,666.7 Direct comparison
HK$29,000per square metre
N/A
Carparks 831.0 Residual HK$226,000 – HK$381,000 per carpark space
0.5% – 0.7%
Total 63,472.9

New World Development Company Limited Annual Report 2018184
N o t e s t o t h e F i n a n c i a l S t a t e m e n t s
17 INVESTMENT PROPERTIES (CONTINUED)
Valuation techniques (Continued)
Range of significant unobservable inputs
2017Fair value
HK$mValuation
techniquesPrevailing market
rent per month Unit priceCapitalisation
rate
Completed investment properties
Hong Kong
Commercial 31,379.2 Income capitalisation
HK$22 – HK$400 per square feet
N/A 1.5%–5.3%
Carparks 2,441.0 Income capitalisation
HK$2,400 – HK$6,700 per carpark space
N/A 4.3%-4.5%
Mainland China
Commercial 17,299.1 Income capitalisation
HK$28 – HK$325 per square metre
N/A 2.0%-9.0%
3,272.1 Direct comparison
N/A HK$11,700 – HK$24,100
per square metre
N/A
Carparks 5,856.9 Direct comparison
N/A HK$75,000–HK$517,000
per carpark space
N/A
Residential 1,688.0 Income capitalisation
HK$115 – HK$207 per square metre
N/A 4.3%-15.0%
Total 61,936.3
Range of significant unobservable inputs
2017 Fair value
HK$mValuation
techniques Unit price
Estimated developer’s
profit and risk margins
Investment properties under development
Commercial 35,441.0 Residual HK$1,300 – HK$60,000 per square feet
0.5%-15.0%
6,356.3 Direct comparison
HK$28,000 per square metre
N/A
Carparks 2,026.8 Residual HK$218,000 – HK$264,000 per carpark space
0.5%-2.8%
Total 43,824.1
Prevailing market rents are estimated based on independent valuers’ view of recent lettings, within the subject properties and other comparable properties. The higher the rents, the higher the fair value.
Capitalisation rates and developer’s profit and risk margins are estimated by independent valuers based on the risk profile of the properties being valued and the market conditions. The lower the rates and the margins, the higher the fair value.
At 30 June 2018, the aggregate fair value of completed investment properties and investment properties under development pledged as securities for the Group’s borrowings amounted to HK$44,509.6 million (2017: HK$29,169.8 million) and HK$7,800.0 million (2017: HK$5,440.0 million) respectively.

New World Development Company LimitedAnnual Report 2018 185
N o t e s t o t h e F i n a n c i a l S t a t e m e n t s
18 PROPERTY, PLANT AND EQUIPMENT
Leasehold land BuildingsOthers
(note (a))Assets under construction Total
HK$m HK$m HK$m HK$m HK$m
Cost
At 1 July 2017 2,284.9 11,226.1 11,621.1 13,468.8 38,600.9
Translation differences – 219.7 362.8 157.3 739.8
Acquisition of subsidiaries – 53.4 59.6 2.7 115.7
Additions – 397.9 1,009.0 2,384.4 3,791.3
Transfer between property, plant and equipment, land use rights and investment properties (298.1) (33.3) (85.6) (3,642.3) (4,059.3)
Transfer between property, plant and equipment, and properties for/under development 265.0 810.9 – – 1,075.9
Transfer between property, plant and equipment and non-current assets classified as assets held for sale – – (1.9) – (1.9)
Transfer upon completion – 2,114.1 165.3 (2,279.4) –
Disposal of subsidiaries – (813.4) (874.3) – (1,687.7)
Disposals – (15.9) (303.2) – (319.1)
At 30 June 2018 2,251.8 13,959.5 11,952.8 10,091.5 38,255.6 Accumulated depreciation and
impairment
At 1 July 2017 102.1 2,112.4 5,578.6 – 7,793.1
Translation differences – 118.5 294.0 – 412.5
Transfer between property, plant and equipment, land use rights and investment properties (159.3) (10.6) (4.4) – (174.3)
Transfer between property, plant and equipment and non-current assets classified as assets held for sale – – (0.3) – (0.3)
Depreciation 171.6 323.6 1,008.2 – 1,503.4
Impairment – – 96.1 – 96.1
Disposal of subsidiaries – (387.6) (670.0) – (1,057.6)
Disposals – (7.1) (250.4) – (257.5)
At 30 June 2018 114.4 2,149.2 6,051.8 – 8,315.4
Net book value (note (b)) At 30 June 2018 2,137.4 11,810.3 5,901.0 10,091.5 29,940.2
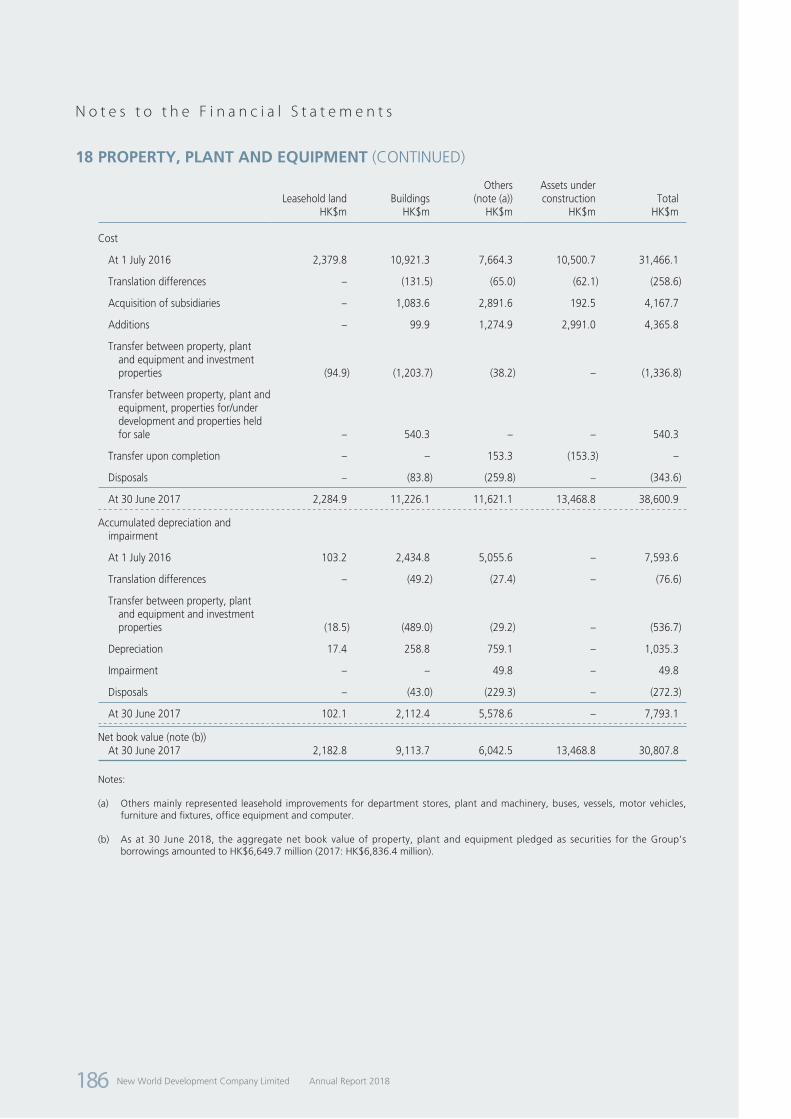
New World Development Company Limited Annual Report 2018186
N o t e s t o t h e F i n a n c i a l S t a t e m e n t s
18 PROPERTY, PLANT AND EQUIPMENT (CONTINUED)
Leasehold land BuildingsOthers
(note (a))Assets under construction Total
HK$m HK$m HK$m HK$m HK$m
Cost
At 1 July 2016 2,379.8 10,921.3 7,664.3 10,500.7 31,466.1
Translation differences – (131.5) (65.0) (62.1) (258.6)
Acquisition of subsidiaries – 1,083.6 2,891.6 192.5 4,167.7
Additions – 99.9 1,274.9 2,991.0 4,365.8
Transfer between property, plant and equipment and investment properties (94.9) (1,203.7) (38.2) – (1,336.8)
Transfer between property, plant and equipment, properties for/under development and properties held for sale – 540.3 – – 540.3
Transfer upon completion – – 153.3 (153.3) –
Disposals – (83.8) (259.8) – (343.6)
At 30 June 2017 2,284.9 11,226.1 11,621.1 13,468.8 38,600.9 Accumulated depreciation and
impairment
At 1 July 2016 103.2 2,434.8 5,055.6 – 7,593.6
Translation differences – (49.2) (27.4) – (76.6)
Transfer between property, plant and equipment and investment properties (18.5) (489.0) (29.2) – (536.7)
Depreciation 17.4 258.8 759.1 – 1,035.3
Impairment – – 49.8 – 49.8
Disposals – (43.0) (229.3) – (272.3)
At 30 June 2017 102.1 2,112.4 5,578.6 – 7,793.1
Net book value (note (b)) At 30 June 2017 2,182.8 9,113.7 6,042.5 13,468.8 30,807.8
Notes:
(a) Others mainly represented leasehold improvements for department stores, plant and machinery, buses, vessels, motor vehicles, furniture and fixtures, office equipment and computer.
(b) As at 30 June 2018, the aggregate net book value of property, plant and equipment pledged as securities for the Group’s borrowings amounted to HK$6,649.7 million (2017: HK$6,836.4 million).

New World Development Company LimitedAnnual Report 2018 187
N o t e s t o t h e F i n a n c i a l S t a t e m e n t s
19 LAND USE RIGHTS
2018 2017HK$m HK$m
At beginning of the year 1,715.0 1,932.2
Translation differences 62.7 (34.7)
Transfer between land use rights and properties under development – 14.6
Transfer between land use rights, property, plant and equipment and investment properties 35.0 (132.2)
Disposals (1.0) (0.5)
Disposal of subsidiaries (697.2) –
Amortisation (50.5) (64.4)
At end of the year 1,064.0 1,715.0
Interests in land use rights represent prepaid operating lease payments.
As at 30 June 2018, the aggregate net book value of land use rights pledged as securities for the Group’s borrowings amounted to HK$128.6 million (2017: HK$270.8 million).
20 INTANGIBLE CONCESSION RIGHTS
2018 2017HK$m HK$m
Cost
At beginning of the year 16,528.9 16,945.2
Translation differences 657.7 (324.7)
Additions 3.5 –
Disposals – (91.6)
At end of the year 17,190.1 16,528.9 Accumulated amortisation and impairment
At beginning of the year 4,687.0 4,038.8
Translation differences 221.8 (92.4)
Amortisation 877.8 802.2
Disposals – (61.6)
At end of the year 5,786.6 4,687.0
Net book value At end of the year 11,403.5 11,841.9
As at 30 June 2018, no intangible concession rights pledged as securities of the Group’s borrowings (2017: aggregate net book value of HK$11,697.8 million).

New World Development Company Limited Annual Report 2018188
N o t e s t o t h e F i n a n c i a l S t a t e m e n t s
21 INTANGIBLE ASSETS
Goodwill Trademarks
Operating right and
others TotalHK$m HK$m HK$m HK$m
Cost
At 1 July 2017 3,222.9 73.6 705.5 4,002.0
Translation differences 68.1 – – 68.1
Acquisition of subsidiaries 488.6 – 54.1 542.7
Disposal of subsidiaries (40.5) – – (40.5)
At 30 June 2018 3,739.1 73.6 759.6 4,572.3 Accumulated amortisation and impairment
At 1 July 2017 287.3 3.9 287.0 578.2
Translation differences (1.3) – – (1.3)
Amortisation – 5.3 46.5 51.8
Impairment 192.9 – – 192.9
Disposal of subsidiaries (31.3) – – (31.3)
At 30 June 2018 447.6 9.2 333.5 790.3
Net book value
At 30 June 2018 3,291.5 64.4 426.1 3,782.0
Goodwill Trademarks
Operating right and
others TotalHK$m HK$m HK$m HK$m
Cost
At 1 July 2016 2,579.4 – 636.3 3,215.7
Translation differences (30.1) – – (30.1)
Acquisition of subsidiaries 707.8 73.6 69.2 850.6
Amount written off (34.2) – – (34.2)
At 30 June 2017 3,222.9 73.6 705.5 4,002.0 Accumulated amortisation and impairment
At 1 July 2016 273.1 – 240.3 513.4
Amortisation – 3.9 46.7 50.6
Impairment 14.2 – – 14.2
At 30 June 2017 287.3 3.9 287.0 578.2
Net book value
At 30 June 2017 2,935.6 69.7 418.5 3,423.8

New World Development Company LimitedAnnual Report 2018 189
N o t e s t o t h e F i n a n c i a l S t a t e m e n t s
21 INTANGIBLE ASSETS (CONTINUED)
Impairment test for goodwillAn operating segment level summary of the goodwill allocation is presented below:
2018
Hong KongMainland
China TotalHK$m HK$m HK$m
Property development 2.5 – 2.5
Property investment – 270.7 270.7
Service and infrastructure 1,342.7 – 1,342.7
Department stores – 1,478.4 1,478.4
Others 197.2 – 197.2
1,542.4 1,749.1 3,291.5
2017
Hong KongMainland
China TotalHK$m HK$m HK$m
Property development 2.5 – 2.5
Property investment – 257.6 257.6
Service and infrastructure 1,211.9 – 1,211.9
Hotel operations – 9.2 9.2
Department stores – 1,046.7 1,046.7
Others 407.7 – 407.7
1,622.1 1,313.5 2,935.6
Goodwill is allocated to the Group’s cash generating units identified according to country of operation and business segment.
For the purpose of impairment test for goodwill, the recoverable amount of the business unit is determined based on either fair value less costs of disposal or value in use calculations whichever is higher. The key assumptions adopted on growth rates and discount rates used in the value in use calculations are based on management best estimates and past experience.
For the segment of property investment, growth rates are determined by considering both internal and external factors relating to the relevant segments. Discount rate used also reflect specific risks relating to the relevant segment, which was 12.4% (2017: 12.4%).
For the segment of service and infrastructure, goodwill amounted to HK$849.3 million (2017: HK$849.3 million) was determined based on the fair value less costs of disposal. Goodwill amounted to HK$362.6 million (2017: HK$362.6 million) was determined based on value in use calculations, among which, annual growth rates being 3.0-11.0% (2017: 0.0-7.0%) for the first five years and terminal growth rate of 2.0% (2017: 2.0%) are determined by considering both internal and external factors relating to the relevant segment. Discount rate used also reflect specific risks relating to the relevant segment, which was 8.5% (2017: 8.5%).
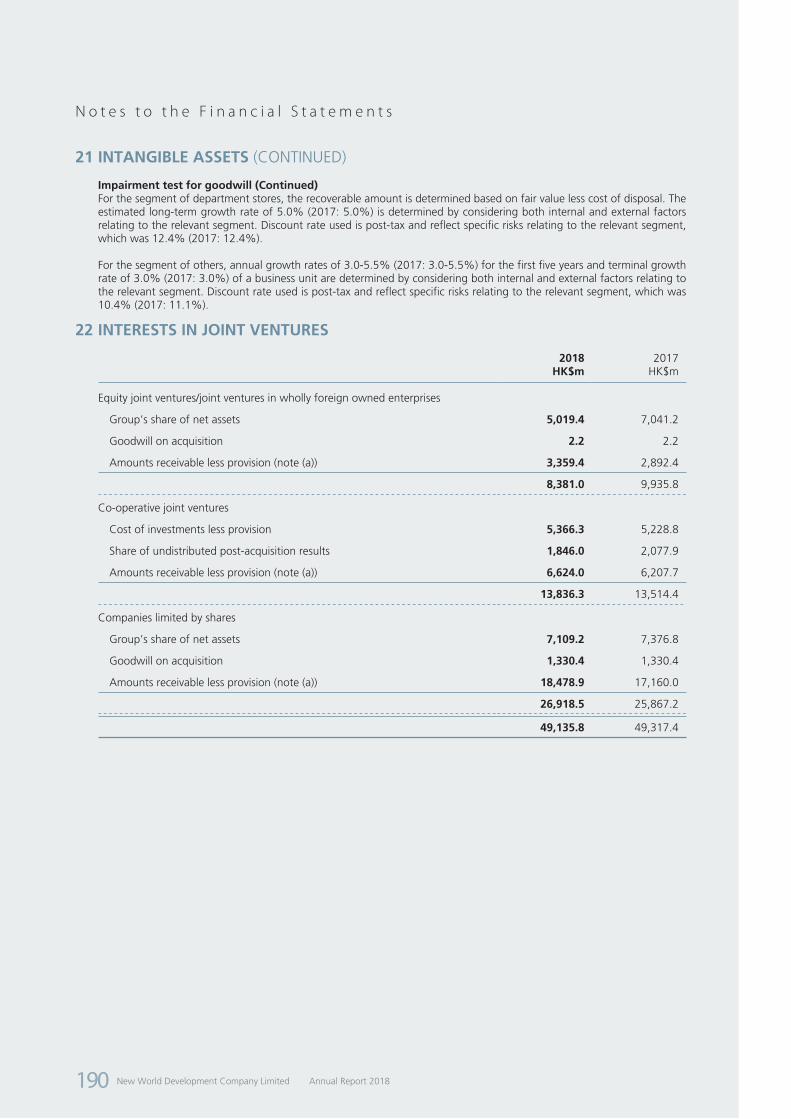
New World Development Company Limited Annual Report 2018190
N o t e s t o t h e F i n a n c i a l S t a t e m e n t s
21 INTANGIBLE ASSETS (CONTINUED)
Impairment test for goodwill (Continued)For the segment of department stores, the recoverable amount is determined based on fair value less cost of disposal. The estimated long-term growth rate of 5.0% (2017: 5.0%) is determined by considering both internal and external factors relating to the relevant segment. Discount rate used is post-tax and reflect specific risks relating to the relevant segment, which was 12.4% (2017: 12.4%).
For the segment of others, annual growth rates of 3.0-5.5% (2017: 3.0-5.5%) for the first five years and terminal growth rate of 3.0% (2017: 3.0%) of a business unit are determined by considering both internal and external factors relating to the relevant segment. Discount rate used is post-tax and reflect specific risks relating to the relevant segment, which was 10.4% (2017: 11.1%).
22 INTERESTS IN JOINT VENTURES
2018 2017HK$m HK$m
Equity joint ventures/joint ventures in wholly foreign owned enterprises
Group’s share of net assets 5,019.4 7,041.2
Goodwill on acquisition 2.2 2.2
Amounts receivable less provision (note (a)) 3,359.4 2,892.4
8,381.0 9,935.8 Co-operative joint ventures
Cost of investments less provision 5,366.3 5,228.8
Share of undistributed post-acquisition results 1,846.0 2,077.9
Amounts receivable less provision (note (a)) 6,624.0 6,207.7
13,836.3 13,514.4 Companies limited by shares
Group’s share of net assets 7,109.2 7,376.8
Goodwill on acquisition 1,330.4 1,330.4
Amounts receivable less provision (note (a)) 18,478.9 17,160.0
26,918.5 25,867.2
49,135.8 49,317.4

New World Development Company LimitedAnnual Report 2018 191
N o t e s t o t h e F i n a n c i a l S t a t e m e n t s
22 INTERESTS IN JOINT VENTURES (CONTINUED)
Notes:
(a) Amounts receivable less provisions are analysed as follows:
2018 2017HK$m HK$m
Interest bearing
Fixed rates (note (i)) 664.1 661.2
Floating rates (note (ii)) 10,535.5 6,772.4
Non-interest bearing 17,262.7 18,826.5
28,462.3 26,260.1
note (i) Carry interest rates ranging from 8.5% to 10.0% (2017: 8.5% to 10.0%) per annum.
note (ii) Carry interest rates ranging from 0.9% over Hong Kong interbank offered rates (“HIBOR”) to 1.0% over Hong Kong prime rate (2017: 2.0% over HIBOR to People’s Bank of China rate) per annum.
The amounts are unsecured. Their carrying amounts are not materially different from their fair values.
The amounts receivable form part of the Group’s interests in joint ventures.
(b) There is no joint venture that is individually material to the Group. The Group’s share of results of the joint ventures are as follows:
2018 2017HK$m HK$m
For the year ended 30 June
Profit for the year 1,886.2 2,029.7
Other comprehensive income for the year 375.6 (307.0)
Total comprehensive income for the year 2,261.8 1,722.7
(c) Management regularly reviews whether there are any indications of impairments of the Group’s interests in joint ventures based on value in use calculations, as detailed in note 6(d). The Group shared impairment loss amounted to HK$600.0 million for the Group’s interests in joint ventures for the year ended 30 June 2018 (2017: nil).
(d) Details of principal joint ventures are stated in note 50.

New World Development Company Limited Annual Report 2018192
N o t e s t o t h e F i n a n c i a l S t a t e m e n t s
23 INTERESTS IN ASSOCIATED COMPANIES
2018 2017HK$m HK$m
Group’s share of net assets
Hong Kong listed shares 2,303.2 4,118.5
Overseas listed shares 1,050.5 1,069.9
Unlisted shares 16,605.5 16,435.3
19,959.2 21,623.7
Goodwill 396.2 721.7
Amounts receivable less provision (note (a)) 4,352.8 4,056.4
24,708.2 26,401.8
Market value of listed shares (note (b)) 1,995.1 6,822.5
Notes:
(a) Amounts receivable less provision are analysed as follows:
2018 2017HK$m HK$m
Interest bearing
Fixed rate (note (i)) 109.7 109.7
Floating rate (note (ii)) 1,600.0 1,600.0
Non-interest bearing 2,643.1 2,346.7
4,352.8 4,056.4
note (i) Carry interest rate of 8.0% (2017: 8.0%) per annum.
note (ii) Carry interest rate of 1.3% over HIBOR (2017: 1.3% over HIBOR) per annum.
The amounts were unsecured and not repayable within 12 months. Their carrying amounts were not materially different from their fair values.
The amounts receivable form part of the Group’s interests in associated companies.
(b) The market value of the Group’s listed associated companies in Hong Kong and overseas amounted to HK$1,995.1 million (2017: HK$6,822.5 million). Management regularly reviews whether there are any indications of impairments of the Group’s interests in associated companies based on value in use calculations, as detailed in note 6(d). The Group shared no impairment loss (2017: HK$204.0 million) for the Group’s interests in associated companies for the year ended 30 June 2018.
(c) There is no associated company that is individually material to the Group. The Group’s share of results of the associated companies are as follows:
2018 2017HK$m HK$m
For the year ended 30 June
Profit for the year 1,196.4 1,895.4
Other comprehensive income for the year 496.7 (37.4)
Total comprehensive income for the year 1,693.1 1,858.0
(d) Details of principal associated companies are stated in note 51.
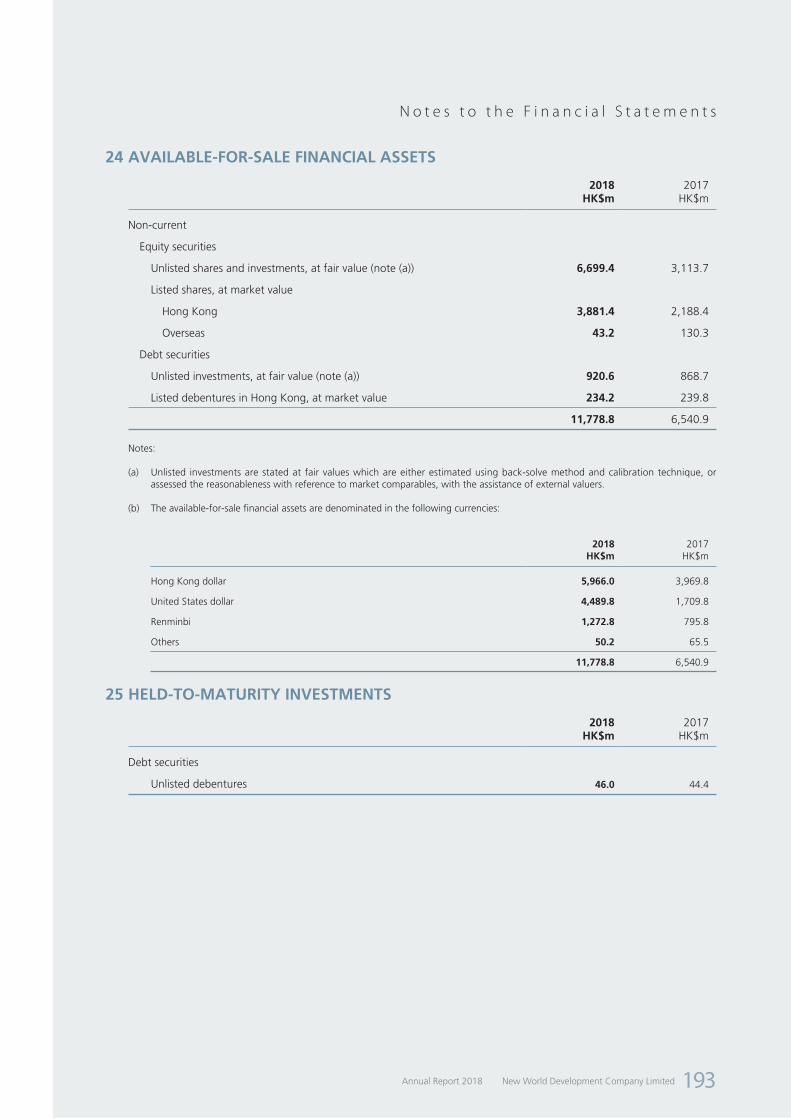
New World Development Company LimitedAnnual Report 2018 193
N o t e s t o t h e F i n a n c i a l S t a t e m e n t s
24 AVAILABLE-FOR-SALE FINANCIAL ASSETS
2018 2017HK$m HK$m
Non-current
Equity securities
Unlisted shares and investments, at fair value (note (a)) 6,699.4 3,113.7
Listed shares, at market value
Hong Kong 3,881.4 2,188.4
Overseas 43.2 130.3
Debt securities
Unlisted investments, at fair value (note (a)) 920.6 868.7
Listed debentures in Hong Kong, at market value 234.2 239.8
11,778.8 6,540.9
Notes:
(a) Unlisted investments are stated at fair values which are either estimated using back-solve method and calibration technique, or assessed the reasonableness with reference to market comparables, with the assistance of external valuers.
(b) The available-for-sale financial assets are denominated in the following currencies:
2018 2017HK$m HK$m
Hong Kong dollar 5,966.0 3,969.8
United States dollar 4,489.8 1,709.8
Renminbi 1,272.8 795.8
Others 50.2 65.5
11,778.8 6,540.9
25 HELD-TO-MATURITY INVESTMENTS
2018 2017HK$m HK$m
Debt securities
Unlisted debentures 46.0 44.4
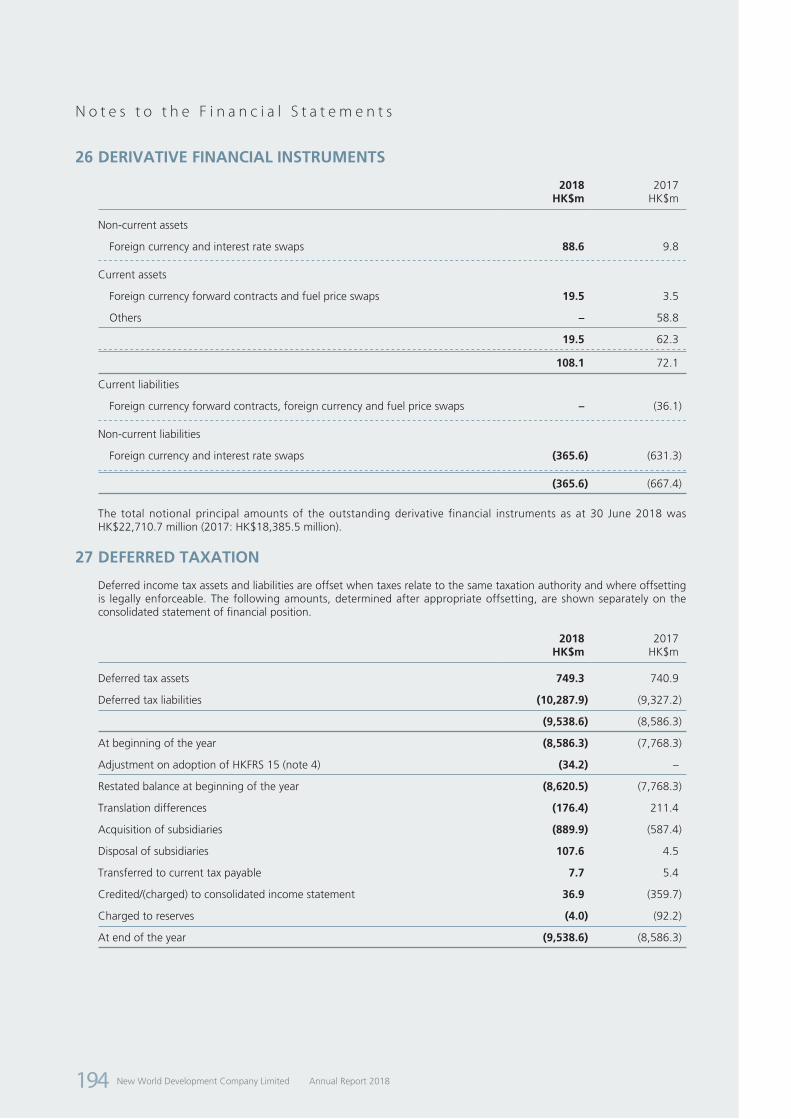
New World Development Company Limited Annual Report 2018194
N o t e s t o t h e F i n a n c i a l S t a t e m e n t s
26 DERIVATIVE FINANCIAL INSTRUMENTS
2018 2017HK$m HK$m
Non-current assets
Foreign currency and interest rate swaps 88.6 9.8
Current assets
Foreign currency forward contracts and fuel price swaps 19.5 3.5
Others – 58.8
19.5 62.3
108.1 72.1
Current liabilities
Foreign currency forward contracts, foreign currency and fuel price swaps – (36.1)
Non-current liabilities
Foreign currency and interest rate swaps (365.6) (631.3)
(365.6) (667.4)
The total notional principal amounts of the outstanding derivative financial instruments as at 30 June 2018 was HK$22,710.7 million (2017: HK$18,385.5 million).
27 DEFERRED TAXATION
Deferred income tax assets and liabilities are offset when taxes relate to the same taxation authority and where offsetting is legally enforceable. The following amounts, determined after appropriate offsetting, are shown separately on the consolidated statement of financial position.
2018 2017HK$m HK$m
Deferred tax assets 749.3 740.9
Deferred tax liabilities (10,287.9) (9,327.2)
(9,538.6) (8,586.3)
At beginning of the year (8,586.3) (7,768.3)
Adjustment on adoption of HKFRS 15 (note 4) (34.2) –
Restated balance at beginning of the year (8,620.5) (7,768.3)
Translation differences (176.4) 211.4
Acquisition of subsidiaries (889.9) (587.4)
Disposal of subsidiaries 107.6 4.5
Transferred to current tax payable 7.7 5.4
Credited/(charged) to consolidated income statement 36.9 (359.7)
Charged to reserves (4.0) (92.2)
At end of the year (9,538.6) (8,586.3)
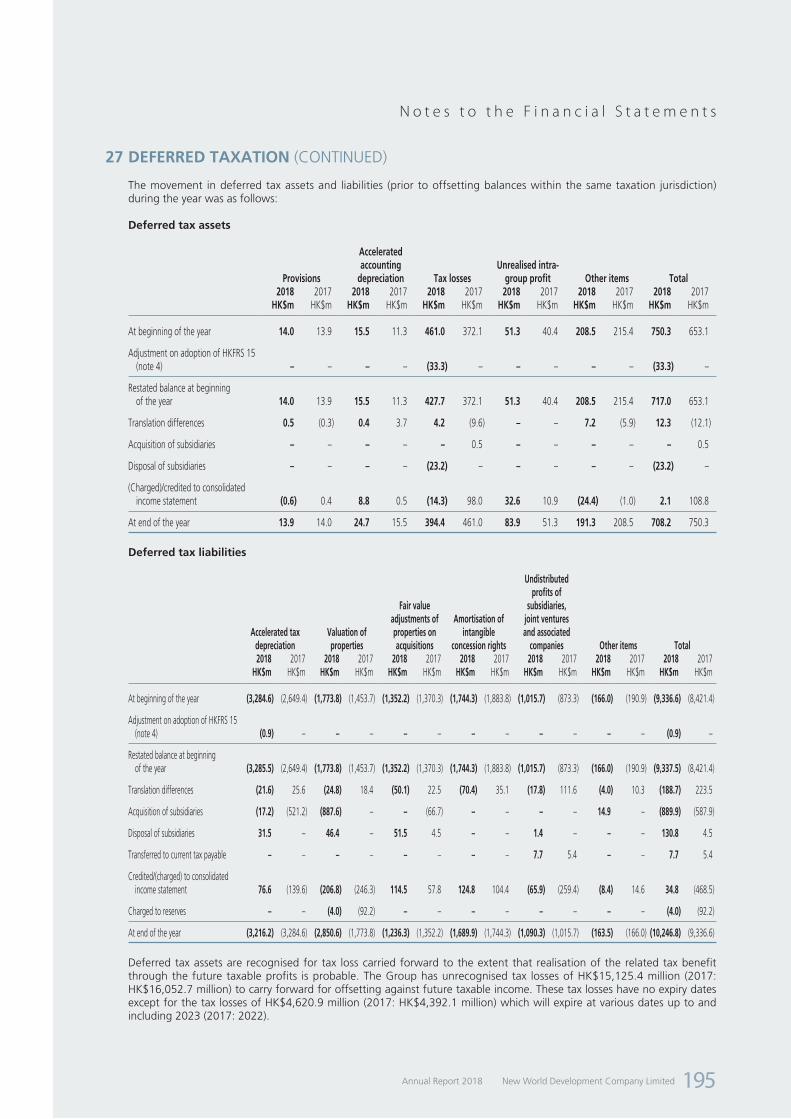
New World Development Company LimitedAnnual Report 2018 195
N o t e s t o t h e F i n a n c i a l S t a t e m e n t s
27 DEFERRED TAXATION (CONTINUED)
The movement in deferred tax assets and liabilities (prior to offsetting balances within the same taxation jurisdiction) during the year was as follows:
Deferred tax assets
Provisions
Accelerated accounting
depreciation Tax lossesUnrealised intra-
group profit Other items Total2018 2017 2018 2017 2018 2017 2018 2017 2018 2017 2018 2017
HK$m HK$m HK$m HK$m HK$m HK$m HK$m HK$m HK$m HK$m HK$m HK$m
At beginning of the year 14.0 13.9 15.5 11.3 461.0 372.1 51.3 40.4 208.5 215.4 750.3 653.1
Adjustment on adoption of HKFRS 15 (note 4) – – – – (33.3) – – – – – (33.3) –
Restated balance at beginning of the year 14.0 13.9 15.5 11.3 427.7 372.1 51.3 40.4 208.5 215.4 717.0 653.1
Translation differences 0.5 (0.3) 0.4 3.7 4.2 (9.6) – – 7.2 (5.9) 12.3 (12.1)
Acquisition of subsidiaries – – – – – 0.5 – – – – – 0.5
Disposal of subsidiaries – – – – (23.2) – – – – – (23.2) –
(Charged)/credited to consolidated income statement (0.6) 0.4 8.8 0.5 (14.3) 98.0 32.6 10.9 (24.4) (1.0) 2.1 108.8
At end of the year 13.9 14.0 24.7 15.5 394.4 461.0 83.9 51.3 191.3 208.5 708.2 750.3
Deferred tax liabilities
Accelerated tax depreciation
Valuation of properties
Fair value adjustments of properties on acquisitions
Amortisation of intangible
concession rights
Undistributed profits of
subsidiaries, joint ventures and associated
companies Other items Total2018 2017 2018 2017 2018 2017 2018 2017 2018 2017 2018 2017 2018 2017
HK$m HK$m HK$m HK$m HK$m HK$m HK$m HK$m HK$m HK$m HK$m HK$m HK$m HK$m
At beginning of the year (3,284.6) (2,649.4) (1,773.8) (1,453.7) (1,352.2) (1,370.3) (1,744.3) (1,883.8) (1,015.7) (873.3) (166.0) (190.9) (9,336.6) (8,421.4)
Adjustment on adoption of HKFRS 15 (note 4) (0.9) – – – – – – – – – – – (0.9) –
Restated balance at beginning of the year (3,285.5) (2,649.4) (1,773.8) (1,453.7) (1,352.2) (1,370.3) (1,744.3) (1,883.8) (1,015.7) (873.3) (166.0) (190.9) (9,337.5) (8,421.4)
Translation differences (21.6) 25.6 (24.8) 18.4 (50.1) 22.5 (70.4) 35.1 (17.8) 111.6 (4.0) 10.3 (188.7) 223.5
Acquisition of subsidiaries (17.2) (521.2) (887.6) – – (66.7) – – – – 14.9 – (889.9) (587.9)
Disposal of subsidiaries 31.5 – 46.4 – 51.5 4.5 – – 1.4 – – – 130.8 4.5
Transferred to current tax payable – – – – – – – – 7.7 5.4 – – 7.7 5.4
Credited/(charged) to consolidated income statement 76.6 (139.6) (206.8) (246.3) 114.5 57.8 124.8 104.4 (65.9) (259.4) (8.4) 14.6 34.8 (468.5)
Charged to reserves – – (4.0) (92.2) – – – – – – – – (4.0) (92.2)
At end of the year (3,216.2) (3,284.6) (2,850.6) (1,773.8) (1,236.3) (1,352.2) (1,689.9) (1,744.3) (1,090.3) (1,015.7) (163.5) (166.0) (10,246.8) (9,336.6)
Deferred tax assets are recognised for tax loss carried forward to the extent that realisation of the related tax benefit through the future taxable profits is probable. The Group has unrecognised tax losses of HK$15,125.4 million (2017: HK$16,052.7 million) to carry forward for offsetting against future taxable income. These tax losses have no expiry dates except for the tax losses of HK$4,620.9 million (2017: HK$4,392.1 million) which will expire at various dates up to and including 2023 (2017: 2022).

New World Development Company Limited Annual Report 2018196
N o t e s t o t h e F i n a n c i a l S t a t e m e n t s
27 DEFERRED TAXATION (CONTINUED)
Deferred tax liabilities (Continued)For the investment properties that are located outside Hong Kong, they are held by certain subsidiaries with a business model to consume substantially all the economic benefits embodied in the investment properties over time, rather than through sale, the presumption is rebutted and related deferred tax continues to be determined based on recovery of use. For the remaining investment properties, the tax consequence is on the presumption that they are recovered entirely by sale.
As at 30 June 2018, the aggregate amount of temporary differences associated with investments in subsidiaries and joint ventures for which deferred tax liabilities have not been recognised totalled approximately HK$11.0 billion (2017: HK$7.1 billion), as the directors consider that the timing of reversal of the related temporary differences can be controlled and the temporary differences will not be reversed in the foreseeable future.
28 OTHER NON-CURRENT ASSETS
2018 2017HK$m HK$m
Long-term loans and receivables (note (a)) 4,344.7 1,452.7
Long-term prepayments and deposits 1,266.2 1,159.9
Deposit paid for a proposed commercial development project 1,024.2 –
6,635.1 2,612.6
Notes:
(a)
2018 2017HK$m HK$m
Mortgage loans receivable (note (i)) 4,462.2 1,483.4
Mortgage loans receivable within one year included in debtors, prepayments and contract assets (147.4) (65.7)
Other receivables 29.9 35.0
4,344.7 1,452.7
note (i) Mortgage loans receivables are advances to purchasers of development projects of the Group in Hong Kong and are secured by first or second mortgages on the related properties. The balance included first mortgage loans of HK$3,768.9 million (2017: HK$1,193.9 million).
The mortgage loans receivables are repayable by monthly instalments with various tenors not more than 30 years (2017: not more than 30 years) at the balance sheet date and carrying interest at rates with reference to banks’ lending rates.
During the year ended 30 June 2018, the cash inflow in relation to the repayment of mortgage loans by the property purchasers amounted to HK$340.1 million (2017: HK$84.0 million).

New World Development Company LimitedAnnual Report 2018 197
N o t e s t o t h e F i n a n c i a l S t a t e m e n t s
29 PROPERTIES UNDER DEVELOPMENT
2018 2017HK$m HK$m
Properties under development
Expected to be completed after 12 months 22,286.8 30,256.7
Expected to be completed within 12 months 14,884.2 18,273.3
37,171.0 48,530.0
At 30 June 2018, the aggregate carrying value of properties under development pledged as securities for the Group’s borrowings amounted to HK$2,035.3 million (2017: HK$8,808.5 million).
30 INVENTORIES
2018 2017HK$m HK$m
Raw materials 121.7 27.3
Finished goods 709.8 728.8
831.5 756.1
31 DEBTORS, PREPAYMENTS AND CONTRACT ASSETS
2018 2017HK$m HK$m
Trade debtors (note (a)) 3,456.0 3,161.9
Amounts due from customers for contract works (note 34) – 547.2
Retention receivable for contract works 1,723.2 1,246.8
Contract assets (note (e)) 1,321.0 –
Prepayment for purchase of land and land preparatory costs 1,105.0 1,066.4
Deposits, prepayments and other debtors (note (g)) 13,684.0 18,621.6
Amounts due from associated companies (note (h)) 51.3 88.1
Amounts due from joint ventures (note (i)) 4,179.1 3,132.4
25,519.6 27,864.4
Notes:
(a) The Group has different credit policies for different business operations depending on the requirements of the markets and businesses in which the subsidiaries operate. Sales proceeds receivable from sale of properties and retention receivable in respect of construction and engineering services are settled in accordance with the terms of respective contracts.
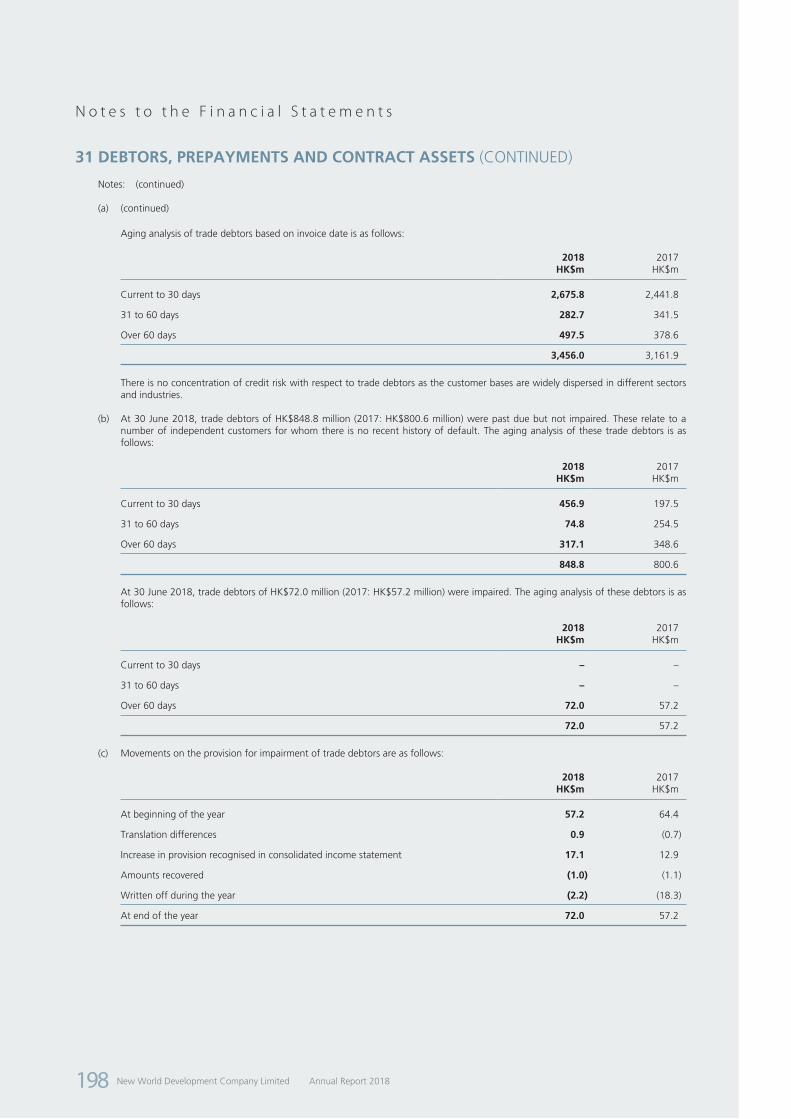
New World Development Company Limited Annual Report 2018198
N o t e s t o t h e F i n a n c i a l S t a t e m e n t s
31 DEBTORS, PREPAYMENTS AND CONTRACT ASSETS (CONTINUED)
Notes: (continued)
(a) (continued)
Aging analysis of trade debtors based on invoice date is as follows:
2018 2017HK$m HK$m
Current to 30 days 2,675.8 2,441.8
31 to 60 days 282.7 341.5
Over 60 days 497.5 378.6
3,456.0 3,161.9
There is no concentration of credit risk with respect to trade debtors as the customer bases are widely dispersed in different sectors and industries.
(b) At 30 June 2018, trade debtors of HK$848.8 million (2017: HK$800.6 million) were past due but not impaired. These relate to a number of independent customers for whom there is no recent history of default. The aging analysis of these trade debtors is as follows:
2018 2017HK$m HK$m
Current to 30 days 456.9 197.5
31 to 60 days 74.8 254.5
Over 60 days 317.1 348.6
848.8 800.6
At 30 June 2018, trade debtors of HK$72.0 million (2017: HK$57.2 million) were impaired. The aging analysis of these debtors is as follows:
2018 2017HK$m HK$m
Current to 30 days – –
31 to 60 days – –
Over 60 days 72.0 57.2
72.0 57.2
(c) Movements on the provision for impairment of trade debtors are as follows:
2018 2017HK$m HK$m
At beginning of the year 57.2 64.4
Translation differences 0.9 (0.7)
Increase in provision recognised in consolidated income statement 17.1 12.9
Amounts recovered (1.0) (1.1)
Written off during the year (2.2) (18.3)
At end of the year 72.0 57.2
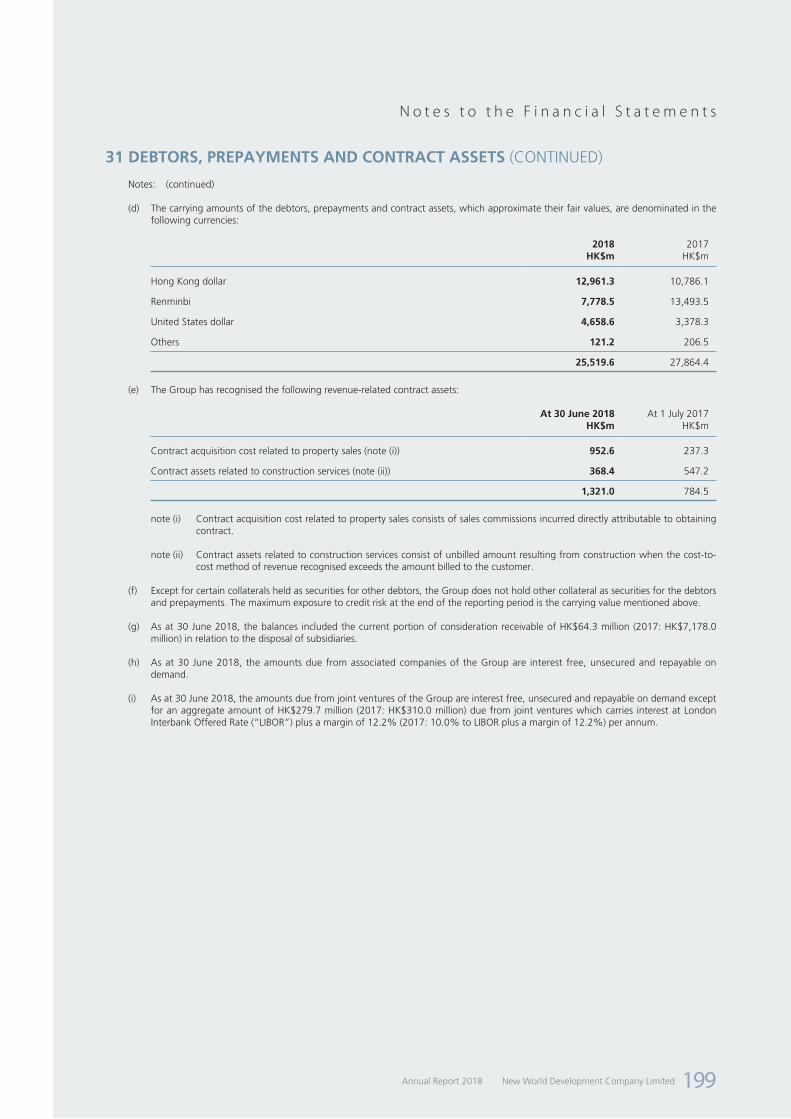
New World Development Company LimitedAnnual Report 2018 199
N o t e s t o t h e F i n a n c i a l S t a t e m e n t s
31 DEBTORS, PREPAYMENTS AND CONTRACT ASSETS (CONTINUED)
Notes: (continued)
(d) The carrying amounts of the debtors, prepayments and contract assets, which approximate their fair values, are denominated in the following currencies:
2018 2017HK$m HK$m
Hong Kong dollar 12,961.3 10,786.1
Renminbi 7,778.5 13,493.5
United States dollar 4,658.6 3,378.3
Others 121.2 206.5
25,519.6 27,864.4
(e) The Group has recognised the following revenue-related contract assets:
At 30 June 2018 At 1 July 2017HK$m HK$m
Contract acquisition cost related to property sales (note (i)) 952.6 237.3
Contract assets related to construction services (note (ii)) 368.4 547.2
1,321.0 784.5
note (i) Contract acquisition cost related to property sales consists of sales commissions incurred directly attributable to obtaining contract.
note (ii) Contract assets related to construction services consist of unbilled amount resulting from construction when the cost-to-cost method of revenue recognised exceeds the amount billed to the customer.
(f) Except for certain collaterals held as securities for other debtors, the Group does not hold other collateral as securities for the debtors and prepayments. The maximum exposure to credit risk at the end of the reporting period is the carrying value mentioned above.
(g) As at 30 June 2018, the balances included the current portion of consideration receivable of HK$64.3 million (2017: HK$7,178.0 million) in relation to the disposal of subsidiaries.
(h) As at 30 June 2018, the amounts due from associated companies of the Group are interest free, unsecured and repayable on demand.
(i) As at 30 June 2018, the amounts due from joint ventures of the Group are interest free, unsecured and repayable on demand except for an aggregate amount of HK$279.7 million (2017: HK$310.0 million) due from joint ventures which carries interest at London Interbank Offered Rate (“LIBOR”) plus a margin of 12.2% (2017: 10.0% to LIBOR plus a margin of 12.2%) per annum.

New World Development Company Limited Annual Report 2018200
N o t e s t o t h e F i n a n c i a l S t a t e m e n t s
32 FINANCIAL ASSETS AT FAIR VALUE THROUGH PROFIT OR LOSS
2018 2017HK$m HK$m
Non-current
Unlisted equity securities, at fair value 684.3 574.5
Current
Unlisted equity securities, at fair value – 0.1
684.3 574.6
Representing:
Held for trading – 0.1
Designated as financial assets at fair value through profit or loss 684.3 574.5
684.3 574.6
The financial assets at fair value through profit or loss are denominated in the following currencies:
2018 2017HK$m HK$m
United States dollar 641.3 481.3
Renminbi 27.2 77.5
Others 15.8 15.8
684.3 574.6
33 CASH AND BANK BALANCES
2018 2017HK$m HK$m
Cash at banks and on hand 35,027.8 32,115.5
Bank deposits – unrestricted and maturing within three months 27,513.0 29,648.1
62,540.8 61,763.6
Bank deposits – unrestricted and maturing after more than three months 847.6 5,222.4
63,388.4 66,986.0
Bank deposits – restricted 67.7 120.5
63,456.1 67,106.5
The effective interest rates on bank deposits range from 0.02% to 5.00% (2017: 0.0083% to 4.9%) per annum and these deposits have maturities ranging from 2 to 365 days (2017: 3 to 365 days).
As at 30 June 2018, the aggregate carrying value of restricted bank deposits pledged as securities for the Group’s borrowing amounted to HK$67.7 million (2017: HK$60.2 million).

New World Development Company LimitedAnnual Report 2018 201
N o t e s t o t h e F i n a n c i a l S t a t e m e n t s
33 CASH AND BANK BALANCES (CONTINUED)
The carrying amounts of the cash and bank balances are denominated in the following currencies:
2018 2017HK$m HK$m
Renminbi 35,722.7 26,333.3
Hong Kong dollar 15,418.2 19,174.6
United States dollar 12,020.9 21,205.1
Others 294.3 393.5
63,456.1 67,106.5
The conversion of Renminbi denominated balances into foreign currencies and the remittance of foreign currencies denominated bank balances and cash out of the Mainland China are subject to relevant rules and regulations of foreign exchange control promulgated by the PRC government.
34 AMOUNTS DUE FROM/TO CUSTOMERS FOR CONTRACT WORKS
2018 2017HK$m HK$m
Contract assets related to construction service (note 31(e)) 368.4 –
Amounts due from customers for contract works (note 31) – 547.2
Contract liabilities related to construction service (note 42(b)) (2,626.3) –
Amounts due to customers for contract works (note 42) – (2,297.3)
(2,257.9) (1,750.1)
As at 30 June 2017, the net amount due to customers for contract works recognised under HKAS11 represented contract costs incurred plus attributable profits less foreseeable losses amounted to HK$12,807.0 million, netted off with progress payments received and receivable amounted to HK$14,557.1 million.
35 NON-CURRENT ASSETS CLASSIFIED AS ASSETS HELD FOR SALE/LIABILITIES DIRECTLY ASSOCIATED WITH NON-CURRENT ASSETS CLASSIFIED AS ASSETS HELD FOR SALE
Non-current assets classified as assets held for sale
2018 2017HK$m HK$m
Investment properties 875.5 130.7
Properties for/under development and other assets classified as held for sale (note) 1,880.7 –
2,756.2 130.7
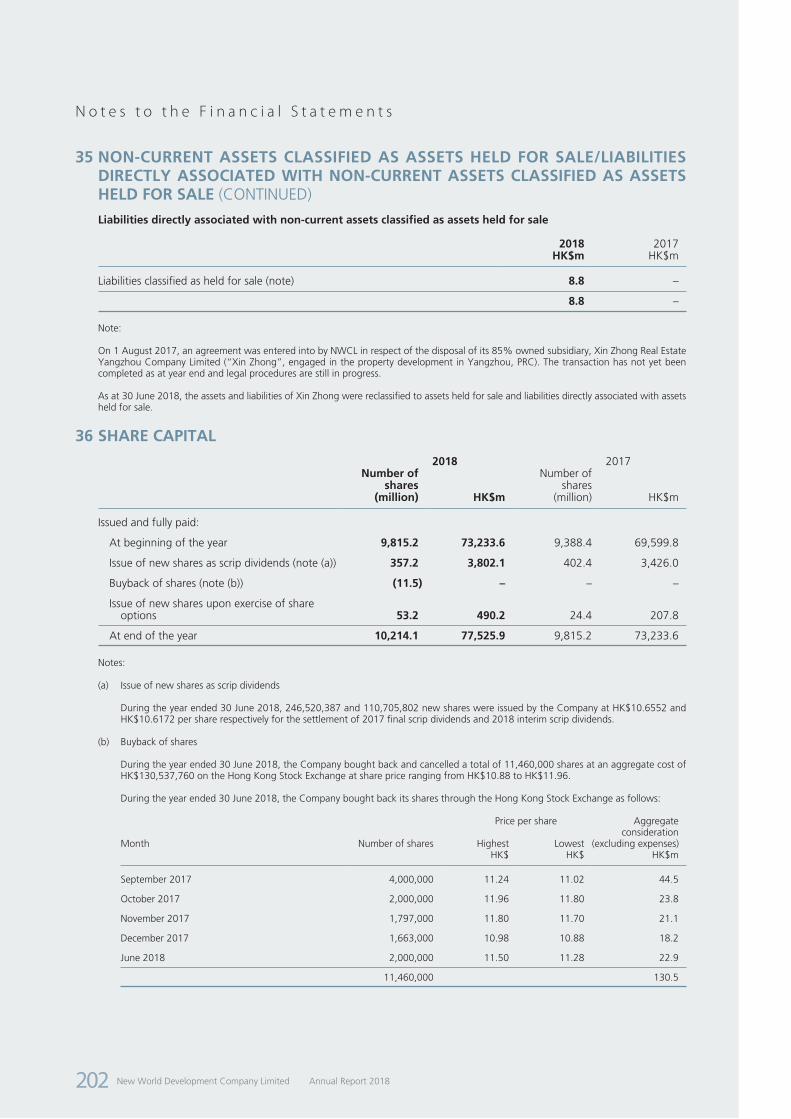
New World Development Company Limited Annual Report 2018202
N o t e s t o t h e F i n a n c i a l S t a t e m e n t s
35 NON-CURRENT ASSETS CLASSIFIED AS ASSETS HELD FOR SALE/LIABILITIES DIRECTLY ASSOCIATED WITH NON-CURRENT ASSETS CLASSIFIED AS ASSETS HELD FOR SALE (CONTINUED)
Liabilities directly associated with non-current assets classified as assets held for sale
2018 2017HK$m HK$m
Liabilities classified as held for sale (note) 8.8 –
8.8 –
Note:
On 1 August 2017, an agreement was entered into by NWCL in respect of the disposal of its 85% owned subsidiary, Xin Zhong Real Estate Yangzhou Company Limited (“Xin Zhong”, engaged in the property development in Yangzhou, PRC). The transaction has not yet been completed as at year end and legal procedures are still in progress.
As at 30 June 2018, the assets and liabilities of Xin Zhong were reclassified to assets held for sale and liabilities directly associated with assets held for sale.
36 SHARE CAPITAL
2018 2017Number of
sharesNumber of
shares(million) HK$m (million) HK$m
Issued and fully paid:
At beginning of the year 9,815.2 73,233.6 9,388.4 69,599.8
Issue of new shares as scrip dividends (note (a)) 357.2 3,802.1 402.4 3,426.0
Buyback of shares (note (b)) (11.5) – – –
Issue of new shares upon exercise of share options 53.2 490.2 24.4 207.8
At end of the year 10,214.1 77,525.9 9,815.2 73,233.6
Notes:
(a) Issue of new shares as scrip dividends
During the year ended 30 June 2018, 246,520,387 and 110,705,802 new shares were issued by the Company at HK$10.6552 and HK$10.6172 per share respectively for the settlement of 2017 final scrip dividends and 2018 interim scrip dividends.
(b) Buyback of shares
During the year ended 30 June 2018, the Company bought back and cancelled a total of 11,460,000 shares at an aggregate cost of HK$130,537,760 on the Hong Kong Stock Exchange at share price ranging from HK$10.88 to HK$11.96.
During the year ended 30 June 2018, the Company bought back its shares through the Hong Kong Stock Exchange as follows:
Month Number of shares
Price per share Aggregateconsideration
(excluding expenses)Highest LowestHK$ HK$ HK$m
September 2017 4,000,000 11.24 11.02 44.5
October 2017 2,000,000 11.96 11.80 23.8
November 2017 1,797,000 11.80 11.70 21.1
December 2017 1,663,000 10.98 10.88 18.2
June 2018 2,000,000 11.50 11.28 22.9
11,460,000 130.5

New World Development Company LimitedAnnual Report 2018 203
N o t e s t o t h e F i n a n c i a l S t a t e m e n t s
37 PERPETUAL CAPITAL SECURITIES
On 6 October 2016, a wholly owned subsidiary of the Company (the “Issuer”) issued US$1,200.0 million 5.75% perpetual capital securities with the aggregate net proceeds after transaction cost of HK$9,212.3 million.
The perpetual capital securities issued by the Issuer are guaranteed by the Company. There is no maturity of the securities and the payments of distribution can be deferred at the discretion of the Issuer, and there is no limit as to the number of times of deferral of distribution. The perpetual capital securities are callable. When the Company elects to declare dividends to its ordinary shareholders, the Issuer shall make distribution to the holders of perpetual capital securities at the distribution rate as defined in the subscription agreement.
38 NON-CONTROLLING INTERESTS
The total non-controlling interests as at 30 June 2018 is HK$29,480.2 million (2017: HK$25,401.5 million), of which HK$19,435.6 million (2017: HK$18,834.1 million) is attributable to NWSH. The total comprehensive income attributable to non-controlling interests for the year ended 30 June 2018 is HK$3,502.8 million (2017: HK$2,243.4 million), of which HK$2,573.9 million (2017: HK$1,974.3 million) is attributable to NWSH. The non-controlling interests in respect of other subsidiaries are not material to the Group.
Set out below is the summarised financial information for NWSH which is a subsidiary with material non-controlling interest to the Group.
Summarised consolidated statement of financial position of NWSH as at 30 June 2018 and 2017 are as follows:
2018 2017HK$m HK$m
Non-current assets 55,507.4 55,001.3
Current assets 19,267.2 20,724.6
Assets held for sale 3,364.0 –
Total assets 78,138.6 75,725.9
Current liabilities (12,995.0) (14,328.8)
Non-current liabilities (11,806.7) (12,122.1)
Liabilities directly associated with assets held for sale (3,213.1) –
Net assets 50,123.8 49,275.0
Non-controlling interests (173.8) (217.9)
Net assets after non-controlling interests 49,950.0 49,057.1

New World Development Company Limited Annual Report 2018204
N o t e s t o t h e F i n a n c i a l S t a t e m e n t s
38 NON-CONTROLLING INTERESTS (CONTINUED)
Summarised consolidated statement of comprehensive income of NWSH for the year ended 30 June 2018 and 2017 are as follows:
2018 2017HK$m HK$m
Revenues 35,114.8 31,385.0
Profit before taxation 6,865.6 6,330.4
Taxation (745.0) (685.2)
Profit for the year 6,120.6 5,645.2
Other comprehensive income for the year 265.5 (330.2)
Total comprehensive income for the year 6,386.1 5,315.0
Non-controlling interests (39.3) (8.6)
Total comprehensive income after non-controlling interests 6,346.8 5,306.4
Dividends paid to non-controlling interests 43.0 10.9
Summarised consolidated statement of cash flows of NWSH for the year ended 30 June 2018 and 2017 are as follows:
2018 2017HK$m HK$m
Net cash from operation activities 4,428.8 2,958.3
Net cash from investing activities 1,506.9 2,403.6
Net cash used in financing activities (5,114.5) (7,742.5)
Net increase/(decrease) in cash and cash equivalents 821.2 (2,380.6)
Translation differences 38.7 (75.5)
Cash and cash equivalents at beginning of the year 6,436.8 8,892.9
Cash and cash equivalents at end of the year 7,296.7 6,436.8
The information above represents balances before inter-company eliminations, reclassification of assets and remeasurement of assets on Group level.
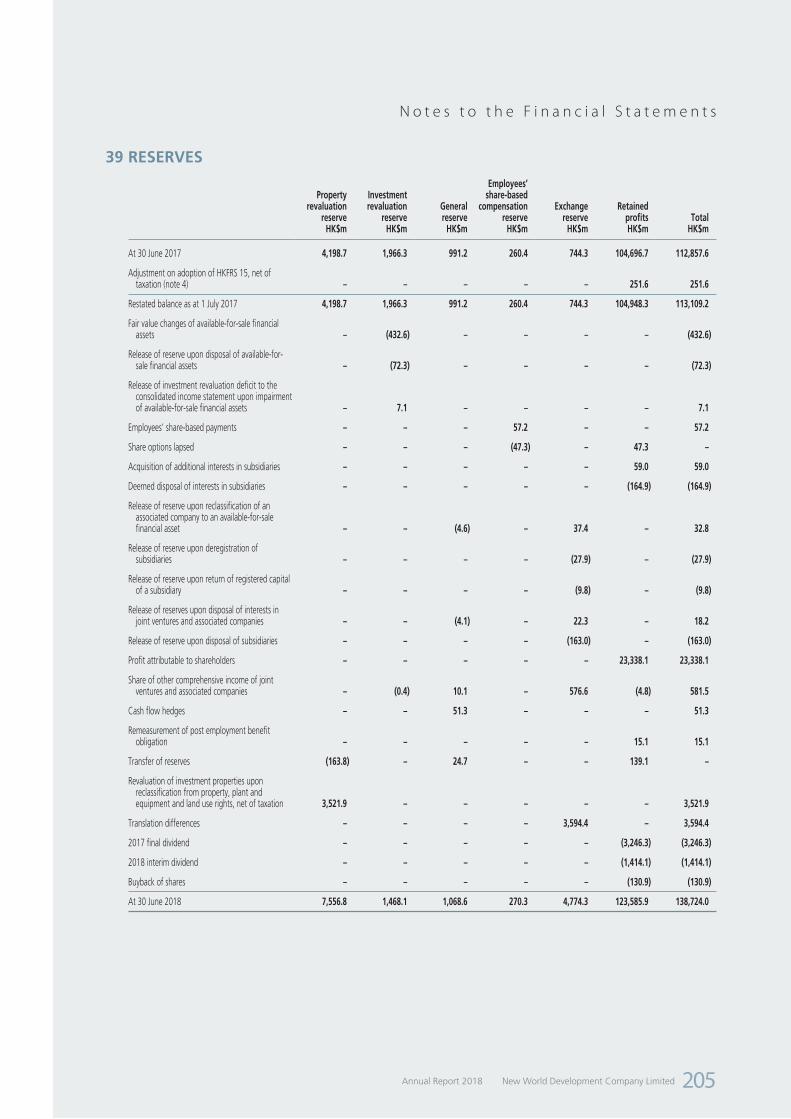
New World Development Company LimitedAnnual Report 2018 205
N o t e s t o t h e F i n a n c i a l S t a t e m e n t s
39 RESERVES
Property revaluation
reserve
Investment revaluation
reserveGeneral reserve
Employees’ share-based
compensation reserve
Exchange reserve
Retained profits Total
HK$m HK$m HK$m HK$m HK$m HK$m HK$m
At 30 June 2017 4,198.7 1,966.3 991.2 260.4 744.3 104,696.7 112,857.6
Adjustment on adoption of HKFRS 15, net of taxation (note 4) – – – – – 251.6 251.6
Restated balance as at 1 July 2017 4,198.7 1,966.3 991.2 260.4 744.3 104,948.3 113,109.2
Fair value changes of available-for-sale financial assets – (432.6) – – – – (432.6)
Release of reserve upon disposal of available-for-sale financial assets – (72.3) – – – – (72.3)
Release of investment revaluation deficit to the consolidated income statement upon impairment of available-for-sale financial assets – 7.1 – – – – 7.1
Employees’ share-based payments – – – 57.2 – – 57.2
Share options lapsed – – – (47.3) – 47.3 –
Acquisition of additional interests in subsidiaries – – – – – 59.0 59.0
Deemed disposal of interests in subsidiaries – – – – – (164.9) (164.9)
Release of reserve upon reclassification of an associated company to an available-for-sale financial asset – – (4.6) – 37.4 – 32.8
Release of reserve upon deregistration of subsidiaries – – – – (27.9) – (27.9)
Release of reserve upon return of registered capital of a subsidiary – – – – (9.8) – (9.8)
Release of reserves upon disposal of interests in joint ventures and associated companies – – (4.1) – 22.3 – 18.2
Release of reserve upon disposal of subsidiaries – – – – (163.0) – (163.0)
Profit attributable to shareholders – – – – – 23,338.1 23,338.1
Share of other comprehensive income of joint ventures and associated companies – (0.4) 10.1 – 576.6 (4.8) 581.5
Cash flow hedges – – 51.3 – – – 51.3
Remeasurement of post employment benefit obligation – – – – – 15.1 15.1
Transfer of reserves (163.8) – 24.7 – – 139.1 –
Revaluation of investment properties upon reclassification from property, plant and equipment and land use rights, net of taxation 3,521.9 – – – – – 3,521.9
Translation differences – – – – 3,594.4 – 3,594.4
2017 final dividend – – – – – (3,246.3) (3,246.3)
2018 interim dividend – – – – – (1,414.1) (1,414.1)
Buyback of shares – – – – – (130.9) (130.9)
At 30 June 2018 7,556.8 1,468.1 1,068.6 270.3 4,774.3 123,585.9 138,724.0
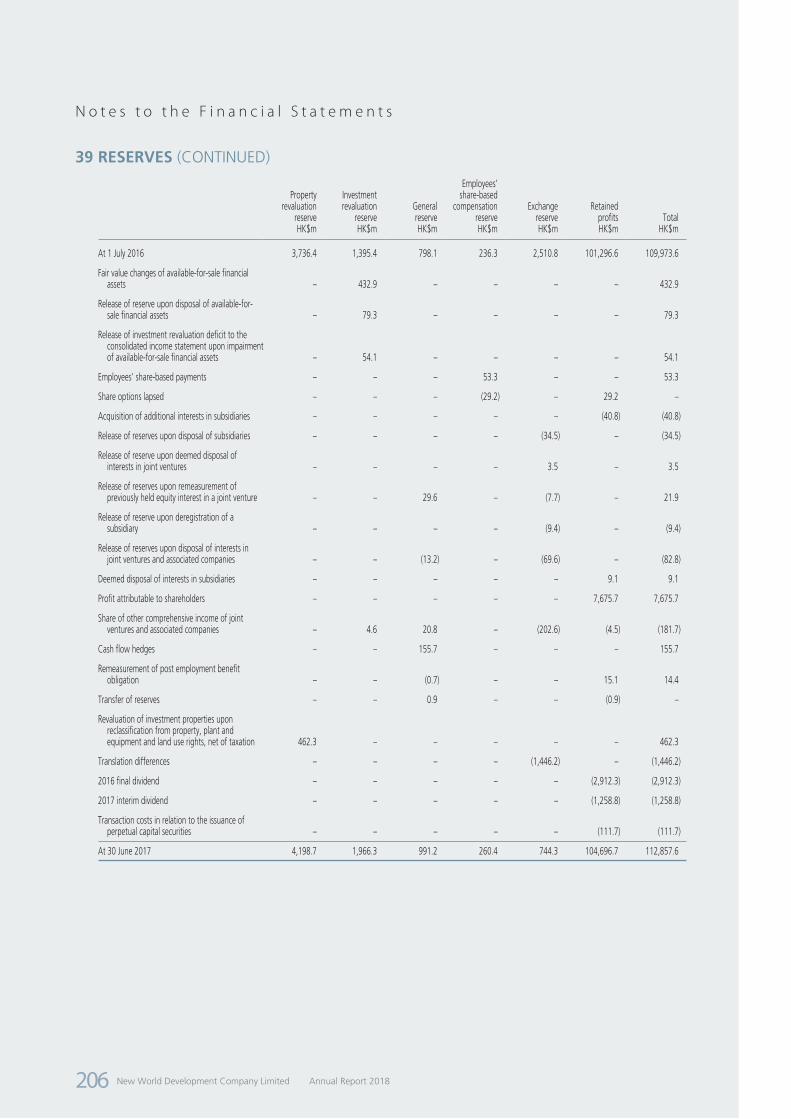
New World Development Company Limited Annual Report 2018206
N o t e s t o t h e F i n a n c i a l S t a t e m e n t s
39 RESERVES (CONTINUED)
Property revaluation
reserve
Investment revaluation
reserveGeneral reserve
Employees’ share-based
compensation reserve
Exchange reserve
Retained profits Total
HK$m HK$m HK$m HK$m HK$m HK$m HK$m
At 1 July 2016 3,736.4 1,395.4 798.1 236.3 2,510.8 101,296.6 109,973.6
Fair value changes of available-for-sale financial assets – 432.9 – – – – 432.9
Release of reserve upon disposal of available-for-sale financial assets – 79.3 – – – – 79.3
Release of investment revaluation deficit to the consolidated income statement upon impairment of available-for-sale financial assets – 54.1 – – – – 54.1
Employees’ share-based payments – – – 53.3 – – 53.3
Share options lapsed – – – (29.2) – 29.2 –
Acquisition of additional interests in subsidiaries – – – – – (40.8) (40.8)
Release of reserves upon disposal of subsidiaries – – – – (34.5) – (34.5)
Release of reserve upon deemed disposal of interests in joint ventures – – – – 3.5 – 3.5
Release of reserves upon remeasurement of previously held equity interest in a joint venture – – 29.6 – (7.7) – 21.9
Release of reserve upon deregistration of a subsidiary – – – – (9.4) – (9.4)
Release of reserves upon disposal of interests in joint ventures and associated companies – – (13.2) – (69.6) – (82.8)
Deemed disposal of interests in subsidiaries – – – – – 9.1 9.1
Profit attributable to shareholders – – – – – 7,675.7 7,675.7
Share of other comprehensive income of joint ventures and associated companies – 4.6 20.8 – (202.6) (4.5) (181.7)
Cash flow hedges – – 155.7 – – – 155.7
Remeasurement of post employment benefit obligation – – (0.7) – – 15.1 14.4
Transfer of reserves – – 0.9 – – (0.9) –
Revaluation of investment properties upon reclassification from property, plant and equipment and land use rights, net of taxation 462.3 – – – – – 462.3
Translation differences – – – – (1,446.2) – (1,446.2)
2016 final dividend – – – – – (2,912.3) (2,912.3)
2017 interim dividend – – – – – (1,258.8) (1,258.8)
Transaction costs in relation to the issuance of perpetual capital securities – – – – – (111.7) (111.7)
At 30 June 2017 4,198.7 1,966.3 991.2 260.4 744.3 104,696.7 112,857.6

New World Development Company LimitedAnnual Report 2018 207
N o t e s t o t h e F i n a n c i a l S t a t e m e n t s
39 RESERVES (CONTINUED)
Note:
Effect on net transfer to the non-controlling interests of the Group:
2018 2017HK$m HK$m
Total comprehensive income for the year attributable to the shareholders of the Company 30,454.8 7,145.2 Transfer between shareholders’ funds and non-controlling interests
Acquisition of additional interests in subsidiaries 59.0 (40.8)
Deemed disposal of interests in subsidiaries (164.9) 9.1
Net transfer to the non-controlling interests (105.9) (31.7) Total comprehensive income for the year attributable to the shareholders of the Company
and net transfer to the non-controlling interests 30,348.9 7,113.5
40 BORROWINGS
2018 2017HK$m HK$m
Long-term borrowings
Secured bank loans 18,134.4 19,703.3
Unsecured bank loans 70,754.0 73,594.4
Other secured loans 2,976.2 2,873.6
Other unsecured loans 1,309.5 1,264.4
Fixed rate bonds and notes payable 38,280.0 41,959.7
Loans from non-controlling shareholders (note (b)) 521.0 1,357.8
131,975.1 140,753.2
Current portion of long-term borrowings (11,851.5) (14,857.9)
120,123.6 125,895.3 Short-term borrowings
Unsecured bank loans 6,856.0 4,576.3
Other unsecured loans 5.0 5.0
Loans from non-controlling shareholders (note (b)) 1,916.6 1,785.4
8,777.6 6,366.7
Current portion of long-term borrowings 11,851.5 14,857.9
20,629.1 21,224.6
Total borrowings 140,752.7 147,119.9
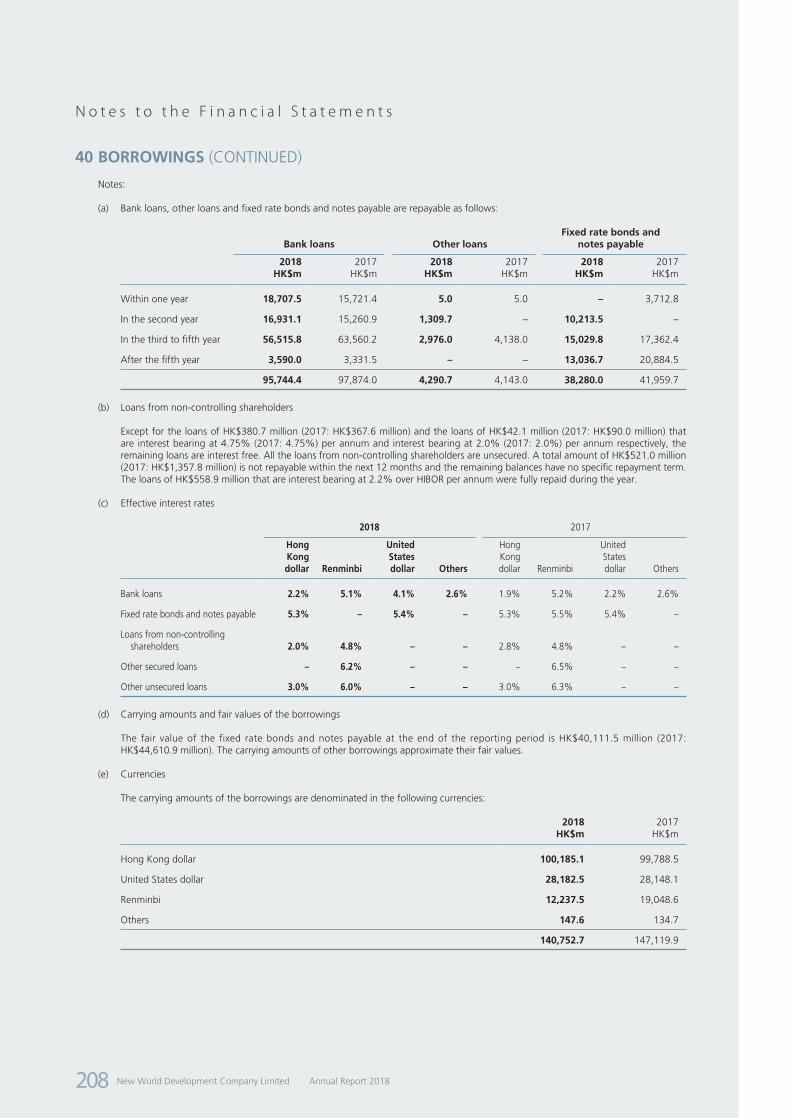
New World Development Company Limited Annual Report 2018208
N o t e s t o t h e F i n a n c i a l S t a t e m e n t s
40 BORROWINGS (CONTINUED)
Notes:
(a) Bank loans, other loans and fixed rate bonds and notes payable are repayable as follows:
Bank loans Other loansFixed rate bonds and
notes payable 2018 2017 2018 2017 2018 2017
HK$m HK$m HK$m HK$m HK$m HK$m
Within one year 18,707.5 15,721.4 5.0 5.0 – 3,712.8
In the second year 16,931.1 15,260.9 1,309.7 – 10,213.5 –
In the third to fifth year 56,515.8 63,560.2 2,976.0 4,138.0 15,029.8 17,362.4
After the fifth year 3,590.0 3,331.5 – – 13,036.7 20,884.5
95,744.4 97,874.0 4,290.7 4,143.0 38,280.0 41,959.7
(b) Loans from non-controlling shareholders
Except for the loans of HK$380.7 million (2017: HK$367.6 million) and the loans of HK$42.1 million (2017: HK$90.0 million) that are interest bearing at 4.75% (2017: 4.75%) per annum and interest bearing at 2.0% (2017: 2.0%) per annum respectively, the remaining loans are interest free. All the loans from non-controlling shareholders are unsecured. A total amount of HK$521.0 million (2017: HK$1,357.8 million) is not repayable within the next 12 months and the remaining balances have no specific repayment term. The loans of HK$558.9 million that are interest bearing at 2.2% over HIBOR per annum were fully repaid during the year.
(c) Effective interest rates
2018 2017 Hong Kong dollar Renminbi
United States dollar Others
Hong Kong dollar Renminbi
United States dollar Others
Bank loans 2.2% 5.1% 4.1% 2.6% 1.9% 5.2% 2.2% 2.6%
Fixed rate bonds and notes payable 5.3% – 5.4% – 5.3% 5.5% 5.4% –
Loans from non-controlling shareholders 2.0% 4.8% – – 2.8% 4.8% – –
Other secured loans – 6.2% – – – 6.5% – –
Other unsecured loans 3.0% 6.0% – – 3.0% 6.3% – –
(d) Carrying amounts and fair values of the borrowings
The fair value of the fixed rate bonds and notes payable at the end of the reporting period is HK$40,111.5 million (2017: HK$44,610.9 million). The carrying amounts of other borrowings approximate their fair values.
(e) Currencies
The carrying amounts of the borrowings are denominated in the following currencies:
2018 2017HK$m HK$m
Hong Kong dollar 100,185.1 99,788.5
United States dollar 28,182.5 28,148.1
Renminbi 12,237.5 19,048.6
Others 147.6 134.7
140,752.7 147,119.9

New World Development Company LimitedAnnual Report 2018 209
N o t e s t o t h e F i n a n c i a l S t a t e m e n t s
40 BORROWINGS (CONTINUED)
Notes: (continued)
(f) The contractual repricing dates or maturity dates (whichever is earlier) of the interest-bearing borrowings are as follows:
Bank loans Other loans
Loans from non-controlling
shareholders
Fixed rate bonds and
notes payable TotalHK$m HK$m HK$m HK$m HK$m
2018
Within five years 92,154.4 4,290.7 422.9 25,243.3 122,111.3
After the fifth year 3,590.0 – – 13,036.7 16,626.7
95,744.4 4,290.7 422.9 38,280.0 138,738.0
2017
Within five years 97,874.0 4,143.0 1,016.5 21,211.2 124,244.7
After the fifth year – – – 20,748.5 20,748.5
97,874.0 4,143.0 1,016.5 41,959.7 144,993.2
41 OTHER NON-CURRENT LIABILITIES
2018 2017HK$m HK$m
Deferred income 170.6 180.4
Provision for long service payments 44.2 30.8
Long-term accounts payable 591.7 546.2
806.5 757.4
42 CREDITORS, ACCRUED CHARGES AND CONTRACT LIABILITIES
2018 2017HK$m HK$m
Trade creditors (note (a)) 13,040.9 8,693.9
Amounts due to customers for contract works (note 34) – 2,297.3
Deposits received on sale of properties – 15,175.4
Contract liabilities (note (b)) 25,543.2 –
Amounts due to joint ventures (note (e)) 1,813.6 1,369.7
Amounts due to associated companies (note (e)) 2,431.3 2,334.2
Other creditors and accrued charges 22,230.0 20,864.7
65,059.0 50,735.2
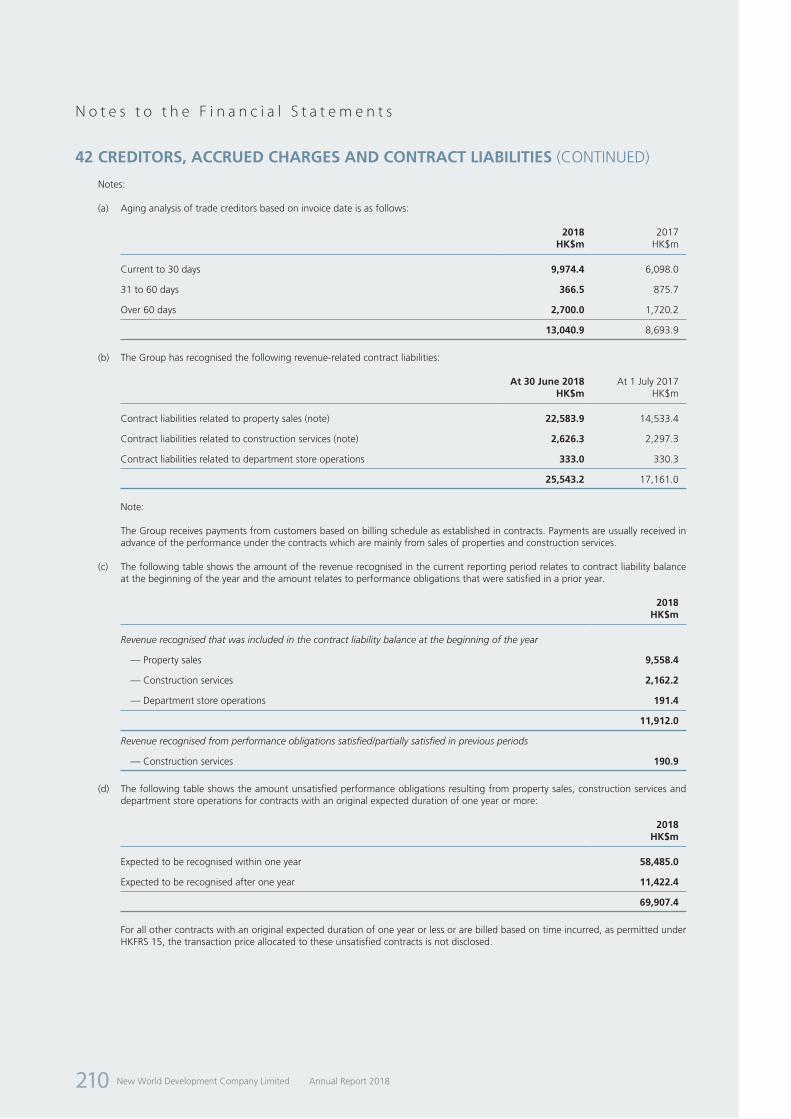
New World Development Company Limited Annual Report 2018210
N o t e s t o t h e F i n a n c i a l S t a t e m e n t s
42 CREDITORS, ACCRUED CHARGES AND CONTRACT LIABILITIES (CONTINUED)
Notes:
(a) Aging analysis of trade creditors based on invoice date is as follows:
2018 2017HK$m HK$m
Current to 30 days 9,974.4 6,098.0
31 to 60 days 366.5 875.7
Over 60 days 2,700.0 1,720.2
13,040.9 8,693.9
(b) The Group has recognised the following revenue-related contract liabilities:
At 30 June 2018 At 1 July 2017HK$m HK$m
Contract liabilities related to property sales (note) 22,583.9 14,533.4
Contract liabilities related to construction services (note) 2,626.3 2,297.3
Contract liabilities related to department store operations 333.0 330.3
25,543.2 17,161.0
Note:
The Group receives payments from customers based on billing schedule as established in contracts. Payments are usually received in advance of the performance under the contracts which are mainly from sales of properties and construction services.
(c) The following table shows the amount of the revenue recognised in the current reporting period relates to contract liability balance at the beginning of the year and the amount relates to performance obligations that were satisfied in a prior year.
2018HK$m
Revenue recognised that was included in the contract liability balance at the beginning of the year
— Property sales 9,558.4
— Construction services 2,162.2
— Department store operations 191.4
11,912.0
Revenue recognised from performance obligations satisfied/partially satisfied in previous periods
— Construction services 190.9
(d) The following table shows the amount unsatisfied performance obligations resulting from property sales, construction services and department store operations for contracts with an original expected duration of one year or more:
2018HK$m
Expected to be recognised within one year 58,485.0
Expected to be recognised after one year 11,422.4
69,907.4
For all other contracts with an original expected duration of one year or less or are billed based on time incurred, as permitted under HKFRS 15, the transaction price allocated to these unsatisfied contracts is not disclosed.
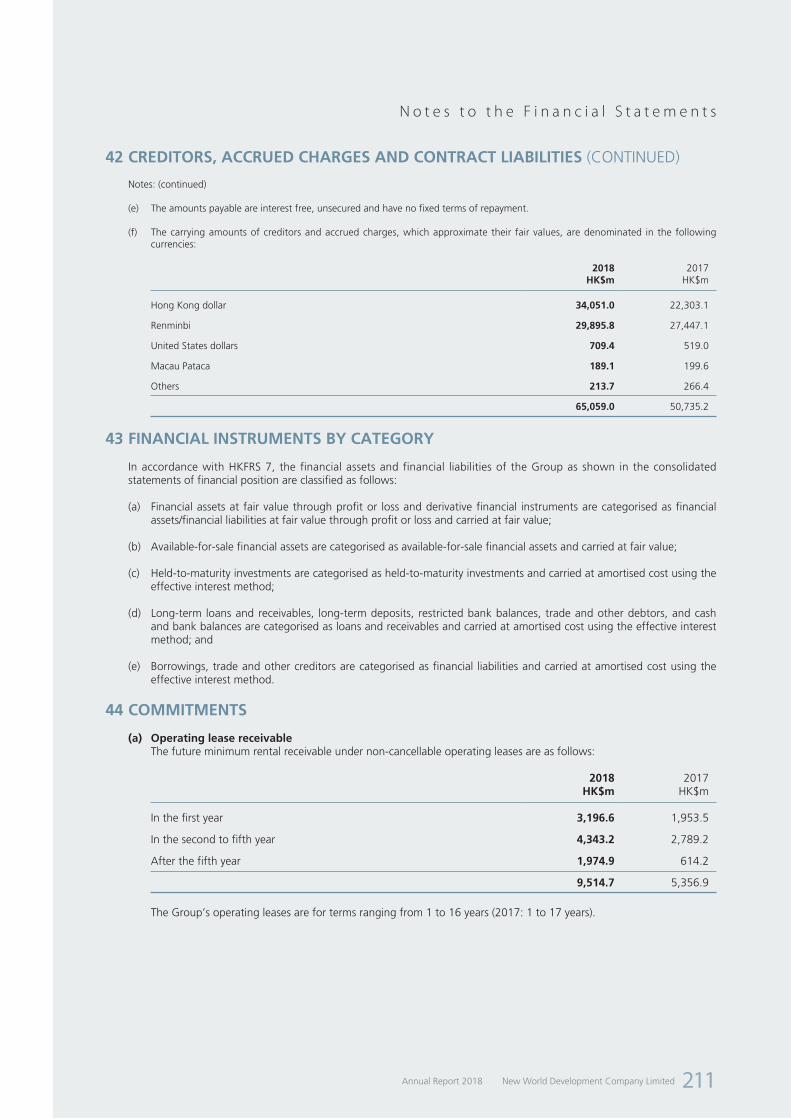
New World Development Company LimitedAnnual Report 2018 211
N o t e s t o t h e F i n a n c i a l S t a t e m e n t s
42 CREDITORS, ACCRUED CHARGES AND CONTRACT LIABILITIES (CONTINUED)
Notes: (continued)
(e) The amounts payable are interest free, unsecured and have no fixed terms of repayment.
(f) The carrying amounts of creditors and accrued charges, which approximate their fair values, are denominated in the following currencies:
2018 2017HK$m HK$m
Hong Kong dollar 34,051.0 22,303.1
Renminbi 29,895.8 27,447.1
United States dollars 709.4 519.0
Macau Pataca 189.1 199.6
Others 213.7 266.4
65,059.0 50,735.2
43 FINANCIAL INSTRUMENTS BY CATEGORY
In accordance with HKFRS 7, the financial assets and financial liabilities of the Group as shown in the consolidated statements of financial position are classified as follows:
(a) Financial assets at fair value through profit or loss and derivative financial instruments are categorised as financial assets/financial liabilities at fair value through profit or loss and carried at fair value;
(b) Available-for-sale financial assets are categorised as available-for-sale financial assets and carried at fair value;
(c) Held-to-maturity investments are categorised as held-to-maturity investments and carried at amortised cost using the effective interest method;
(d) Long-term loans and receivables, long-term deposits, restricted bank balances, trade and other debtors, and cash and bank balances are categorised as loans and receivables and carried at amortised cost using the effective interest method; and
(e) Borrowings, trade and other creditors are categorised as financial liabilities and carried at amortised cost using the effective interest method.
44 COMMITMENTS
(a) Operating lease receivableThe future minimum rental receivable under non-cancellable operating leases are as follows:
2018 2017HK$m HK$m
In the first year 3,196.6 1,953.5
In the second to fifth year 4,343.2 2,789.2
After the fifth year 1,974.9 614.2
9,514.7 5,356.9
The Group’s operating leases are for terms ranging from 1 to 16 years (2017: 1 to 17 years).
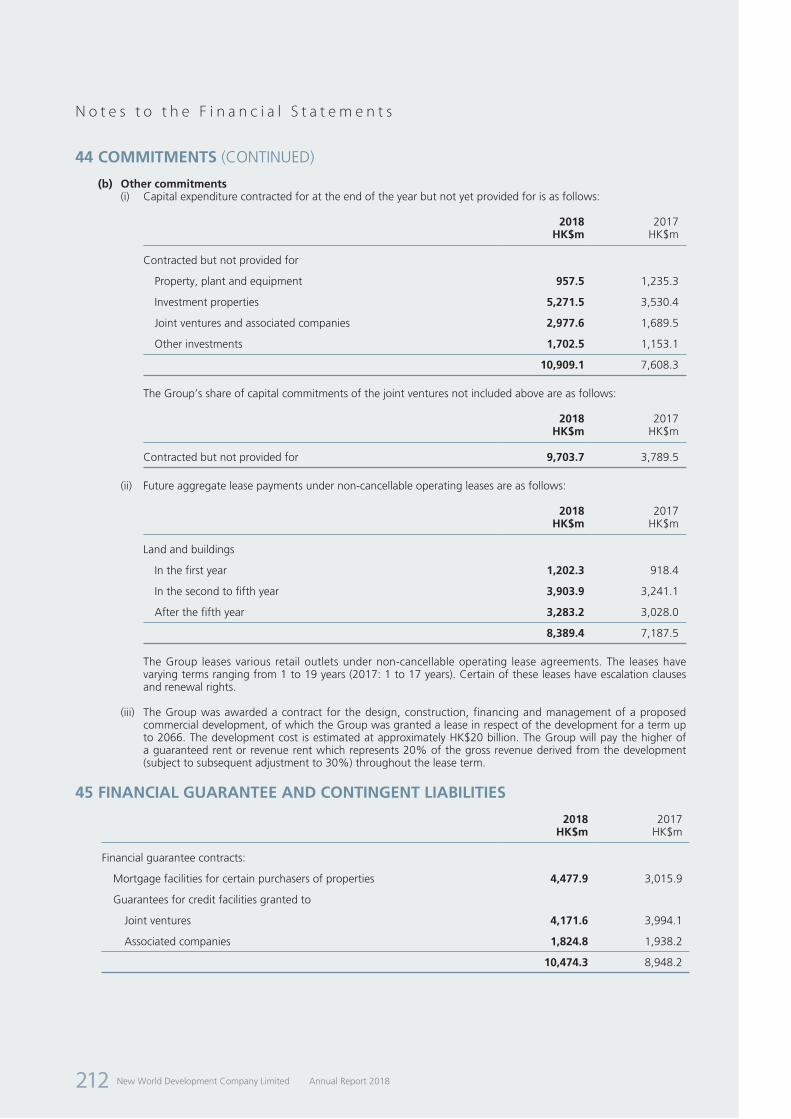
New World Development Company Limited Annual Report 2018212
N o t e s t o t h e F i n a n c i a l S t a t e m e n t s
44 COMMITMENTS (CONTINUED)
(b) Other commitments(i) Capital expenditure contracted for at the end of the year but not yet provided for is as follows:
2018 2017HK$m HK$m
Contracted but not provided for
Property, plant and equipment 957.5 1,235.3
Investment properties 5,271.5 3,530.4
Joint ventures and associated companies 2,977.6 1,689.5
Other investments 1,702.5 1,153.1
10,909.1 7,608.3
The Group’s share of capital commitments of the joint ventures not included above are as follows:
2018 2017HK$m HK$m
Contracted but not provided for 9,703.7 3,789.5
(ii) Future aggregate lease payments under non-cancellable operating leases are as follows:
2018 2017HK$m HK$m
Land and buildings
In the first year 1,202.3 918.4
In the second to fifth year 3,903.9 3,241.1
After the fifth year 3,283.2 3,028.0
8,389.4 7,187.5
The Group leases various retail outlets under non-cancellable operating lease agreements. The leases have varying terms ranging from 1 to 19 years (2017: 1 to 17 years). Certain of these leases have escalation clauses and renewal rights.
(iii) The Group was awarded a contract for the design, construction, financing and management of a proposed commercial development, of which the Group was granted a lease in respect of the development for a term up to 2066. The development cost is estimated at approximately HK$20 billion. The Group will pay the higher of a guaranteed rent or revenue rent which represents 20% of the gross revenue derived from the development (subject to subsequent adjustment to 30%) throughout the lease term.
45 FINANCIAL GUARANTEE AND CONTINGENT LIABILITIES
2018 2017HK$m HK$m
Financial guarantee contracts:
Mortgage facilities for certain purchasers of properties 4,477.9 3,015.9
Guarantees for credit facilities granted to
Joint ventures 4,171.6 3,994.1
Associated companies 1,824.8 1,938.2
10,474.3 8,948.2

New World Development Company LimitedAnnual Report 2018 213
N o t e s t o t h e F i n a n c i a l S t a t e m e n t s
46 NOTES TO CONSOLIDATED STATEMENT OF CASH FLOWS(a) Reconciliation of operating profit to net cash generated from operations
2018 2017HK$m HK$m
Operating profit 30,975.3 11,751.3
Depreciation 1,503.4 1,035.3
Amortisation 980.1 917.2
Changes in fair value of investment properties (15,367.1) (1,363.8)
Write back of provision for loans and other receivables (90.3) (124.8)
Reversal of other payables (431.0) –
Gain on deemed disposal of interests in joint ventures – (546.9)
(Gain)/loss on remeasurement of an available-for-sale financial asset retained at fair value upon reclassification from an associated company (1,095.5) 34.3
Gain on remeasurement of previously held interest of joint ventures at fair value upon further acquisition to become subsidiaries – (374.2)
Net (gain)/loss on fair value of financial assets at fair value through profit or loss (91.3) 236.7
Net (gain)/loss on disposal of
Associated companies (850.1) (74.2)
Available-for-sale financial assets (114.9) (110.2)
Financial assets at fair value through profit or loss (7.8) (69.2)
Investment properties, property, plant and equipment and intangible concession rights (232.4) (167.8)
Joint ventures – (133.7)
Non-current assets classified as assets held for sale – (244.2)
Perpetual securities – 116.4
Subsidiaries (1,821.0) 127.2
Impairment loss on
Available-for-sale financial assets 27.3 139.2
Intangible assets 192.9 48.4
Loans and other receivables 220.3 231.3
Property, plant and equipment 96.1 49.8
Dividend income from available-for-sale financial assets, perpetual securities and financial assets at fair value through profit or loss (137.3) (528.8)
Share options expenses 57.2 56.6
Net exchange losses 64.3 433.3
Operating profit before working capital changes 13,878.2 11,439.2
Increase in inventories (72.8) (4.2)
Increase in properties for/under development and properties held for sale (10,011.0) (14,282.3)
Increase in debtors, prepayments and contract assets and long-term prepayments and deposits (4,769.3) (1,753.2)
Increase in creditors, accrued charges and contract liabilities 13,953.0 13,032.9
Net cash generated from operations 12,978.1 8,432.4
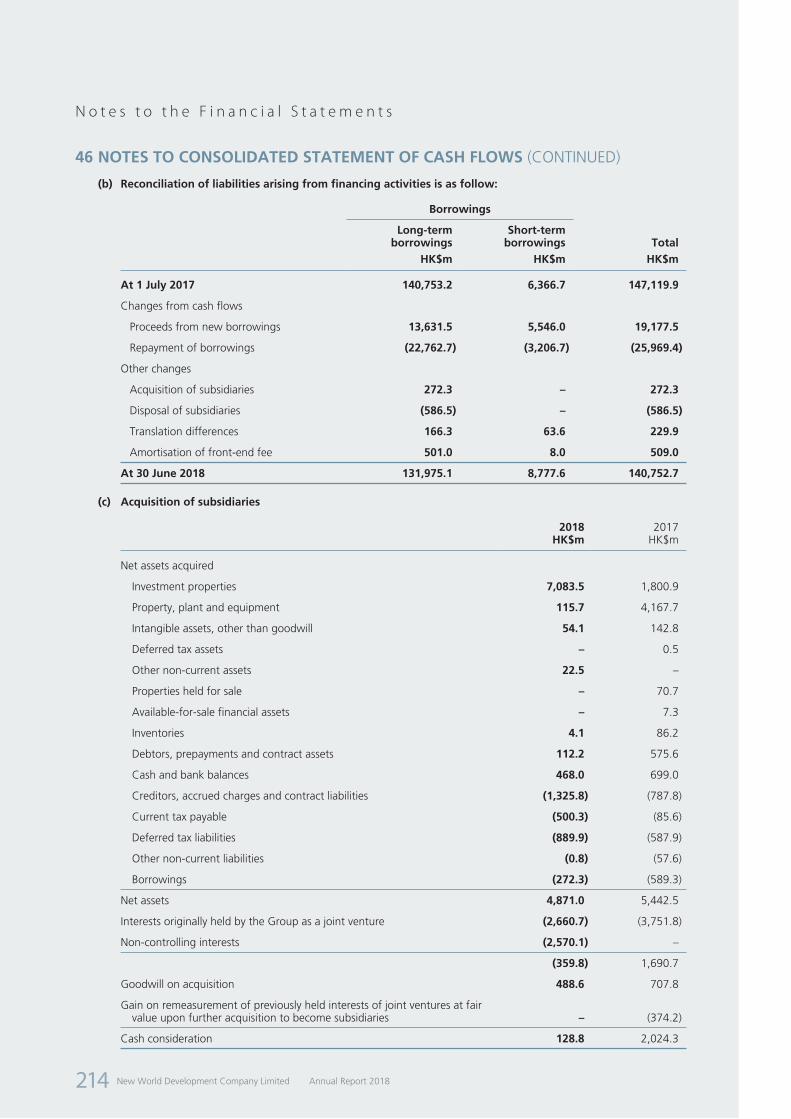
New World Development Company Limited Annual Report 2018214
N o t e s t o t h e F i n a n c i a l S t a t e m e n t s
46 NOTES TO CONSOLIDATED STATEMENT OF CASH FLOWS (CONTINUED)
(b) Reconciliation of liabilities arising from financing activities is as follow:
Borrowings
Long-term borrowings
Short-term borrowings Total
HK$m HK$m HK$m
At 1 July 2017 140,753.2 6,366.7 147,119.9
Changes from cash flows
Proceeds from new borrowings 13,631.5 5,546.0 19,177.5
Repayment of borrowings (22,762.7) (3,206.7) (25,969.4)
Other changes
Acquisition of subsidiaries 272.3 – 272.3
Disposal of subsidiaries (586.5) – (586.5)
Translation differences 166.3 63.6 229.9
Amortisation of front-end fee 501.0 8.0 509.0
At 30 June 2018 131,975.1 8,777.6 140,752.7
(c) Acquisition of subsidiaries
2018 2017HK$m HK$m
Net assets acquired
Investment properties 7,083.5 1,800.9
Property, plant and equipment 115.7 4,167.7
Intangible assets, other than goodwill 54.1 142.8
Deferred tax assets – 0.5
Other non-current assets 22.5 –
Properties held for sale – 70.7
Available-for-sale financial assets – 7.3
Inventories 4.1 86.2
Debtors, prepayments and contract assets 112.2 575.6
Cash and bank balances 468.0 699.0
Creditors, accrued charges and contract liabilities (1,325.8) (787.8)
Current tax payable (500.3) (85.6)
Deferred tax liabilities (889.9) (587.9)
Other non-current liabilities (0.8) (57.6)
Borrowings (272.3) (589.3)
Net assets 4,871.0 5,442.5
Interests originally held by the Group as a joint venture (2,660.7) (3,751.8)
Non-controlling interests (2,570.1) –
(359.8) 1,690.7
Goodwill on acquisition 488.6 707.8
Gain on remeasurement of previously held interests of joint ventures at fair value upon further acquisition to become subsidiaries – (374.2)
Cash consideration 128.8 2,024.3
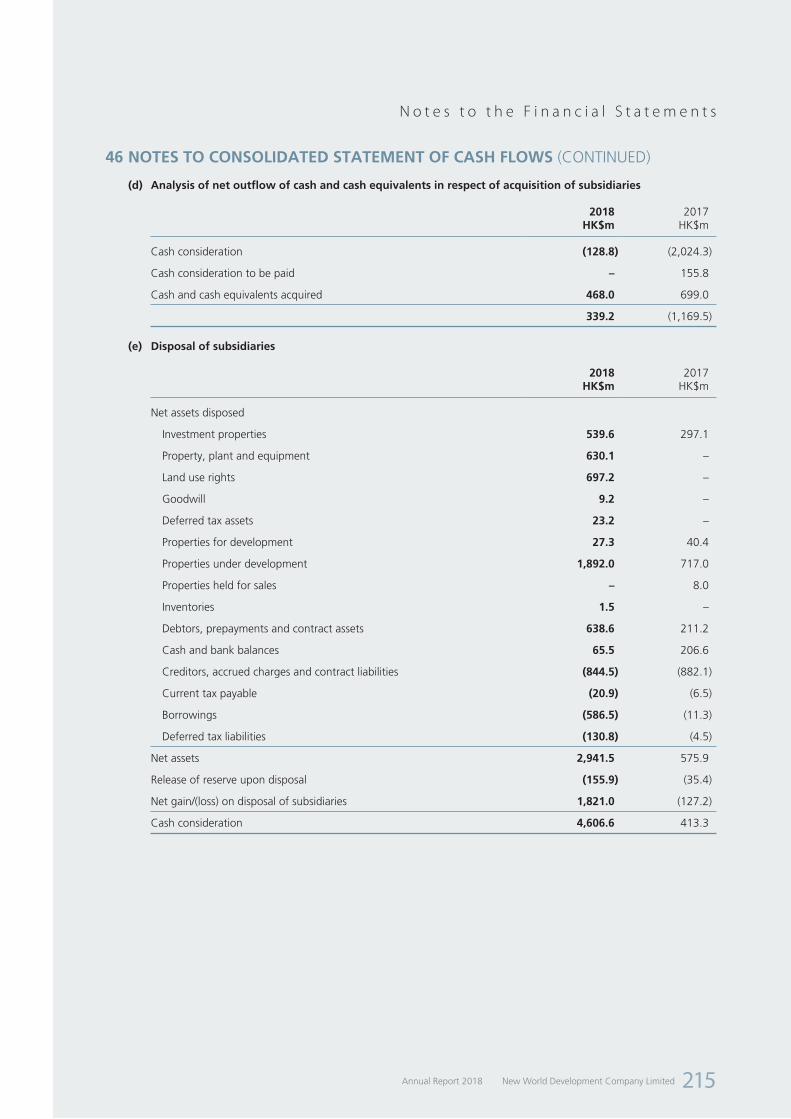
New World Development Company LimitedAnnual Report 2018 215
N o t e s t o t h e F i n a n c i a l S t a t e m e n t s
46 NOTES TO CONSOLIDATED STATEMENT OF CASH FLOWS (CONTINUED)
(d) Analysis of net outflow of cash and cash equivalents in respect of acquisition of subsidiaries
2018 2017HK$m HK$m
Cash consideration (128.8) (2,024.3)
Cash consideration to be paid – 155.8
Cash and cash equivalents acquired 468.0 699.0
339.2 (1,169.5)
(e) Disposal of subsidiaries
2018 2017HK$m HK$m
Net assets disposed
Investment properties 539.6 297.1
Property, plant and equipment 630.1 –
Land use rights 697.2 –
Goodwill 9.2 –
Deferred tax assets 23.2 –
Properties for development 27.3 40.4
Properties under development 1,892.0 717.0
Properties held for sales – 8.0
Inventories 1.5 –
Debtors, prepayments and contract assets 638.6 211.2
Cash and bank balances 65.5 206.6
Creditors, accrued charges and contract liabilities (844.5) (882.1)
Current tax payable (20.9) (6.5)
Borrowings (586.5) (11.3)
Deferred tax liabilities (130.8) (4.5)
Net assets 2,941.5 575.9
Release of reserve upon disposal (155.9) (35.4)
Net gain/(loss) on disposal of subsidiaries 1,821.0 (127.2)
Cash consideration 4,606.6 413.3
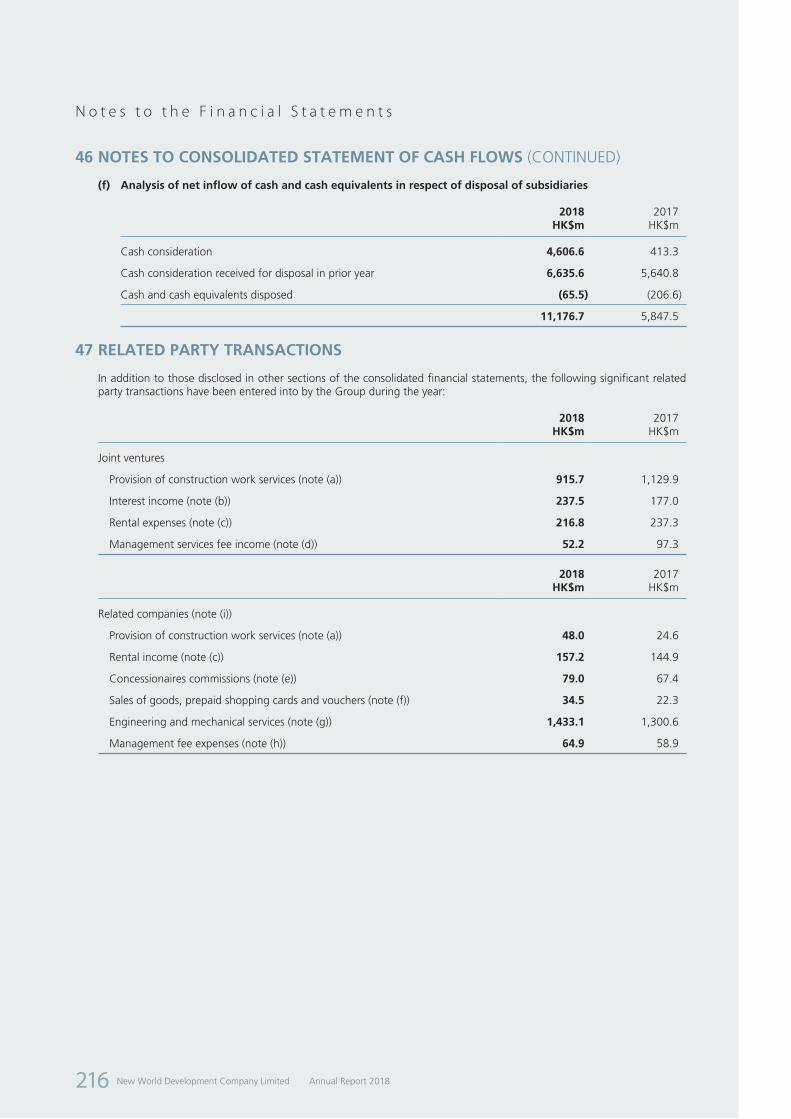
New World Development Company Limited Annual Report 2018216
N o t e s t o t h e F i n a n c i a l S t a t e m e n t s
46 NOTES TO CONSOLIDATED STATEMENT OF CASH FLOWS (CONTINUED)
(f) Analysis of net inflow of cash and cash equivalents in respect of disposal of subsidiaries
2018 2017HK$m HK$m
Cash consideration 4,606.6 413.3
Cash consideration received for disposal in prior year 6,635.6 5,640.8
Cash and cash equivalents disposed (65.5) (206.6)
11,176.7 5,847.5
47 RELATED PARTY TRANSACTIONS
In addition to those disclosed in other sections of the consolidated financial statements, the following significant related party transactions have been entered into by the Group during the year:
2018 2017HK$m HK$m
Joint ventures
Provision of construction work services (note (a)) 915.7 1,129.9
Interest income (note (b)) 237.5 177.0
Rental expenses (note (c)) 216.8 237.3
Management services fee income (note (d)) 52.2 97.3
2018 2017HK$m HK$m
Related companies (note (i))
Provision of construction work services (note (a)) 48.0 24.6
Rental income (note (c)) 157.2 144.9
Concessionaires commissions (note (e)) 79.0 67.4
Sales of goods, prepaid shopping cards and vouchers (note (f)) 34.5 22.3
Engineering and mechanical services (note (g)) 1,433.1 1,300.6
Management fee expenses (note (h)) 64.9 58.9

New World Development Company LimitedAnnual Report 2018 217
N o t e s t o t h e F i n a n c i a l S t a t e m e n t s
47 RELATED PARTY TRANSACTIONS (CONTINUED)
Notes:
(a) Revenue from provision of construction work services is principally charged in accordance with relevant contracts.
(b) Interest income is charged at interest rates as specified in note 22(a) on the outstanding amounts.
(c) Rental income and expenses are charged in accordance with respective tenancy agreements.
(d) Management services fee income is charged in accordance with the terms of respective management service agreements.
(e) The income is charged in accordance with concessionaire counter agreements with Chow Tai Fook Jewellery Group Limited (“CTFJ”) and its subsidiaries (collectively “CTFJ Group”). The commission is mainly calculated by pre-determined percentages of gross sales value in accordance with respective agreements.
(f) This represents the amounts received in respect of the sales of goods, prepaid shopping cards and vouchers to the Group as payment of purchase of goods and settlement of the relevant value CTF and its subsidiaries (collectively “CTF Group”), CTFJ Group and companies owned by Mr. Doo.
(g) Engineering and mechanical services are charged in accordance with relevant contracts.
(h) Management fee expenses are charged at rates in accordance with relevant contracts.
(j) Related companies are subsidiaries and joint ventures of CTF Group, CTFJ Group and companies owned by Mr. Doo.
(j) The balances with joint ventures and associated companies are disclosed in notes 22, 23, 31 and 42.
(k) No significant transactions have been entered with the Directors of the Company (being the key management personnel) during the year other than the emoluments paid to them as disclosed in note 16 and note (l).
(l) On 27 October 2017, New World Development (China) Limited (“NWD (China)”), an indirect wholly owned subsidiary of the Company, entered into a sale and purchase agreement with Oriental Triumph Inc. (“Oriental Triumph”), a company wholly owned by Mr. Doo, and under which NWD (China) agreed to sell, and Oriental Triumph agreed to purchase the entire issued share capital of Ramada Property Ltd., which together with its subsidiaries owns and operates the Shanghai Ramada Plaza, New World Shanghai Hotel and pentahotel Shanghai, at a consideration of RMB1.85 billion (equivalent to approximately HK$2.2 billion), subject to customary closing adjustment (the “Disposal”). The Disposal was completed on 28 March 2018.
(m) On 29 September 2017, CTF, Healthcare Ventures Holdings Limited (“Healthcare Ventures”, a direct wholly owned subsidiary of CTF), New World Strategic Investment Limited (“New World Strategic”, a direct wholly owned subsidiary of NWD), Smart Future Investments Limited (“Smart Future”, an indirect wholly owned subsidiary of New World Strategic), NWS Service Management Limited (“NWS Service”, a direct wholly owned subsidiary of the Company), Dynamic Ally Limited (“Dynamic Ally”, an indirect wholly owned subsidiary of NWS Service) and Healthcare Assets Management Limited (“Healthcare Assets”) entered into an amended and restated joint venture agreement to regulate the respective rights and obligations of Healthcare Ventures, Smart Future and Dynamic Ally towards the management of Healthcare Assets, following the subscription of shares in Healthcare Assets by Smart Future. Upon completion of the subscription, the entire issued share capital of Healthcare Assets is owned as to 30%, 40% and 30% by Healthcare Ventures, Smart Future and Dynamic Ally respectively. The Group ceased its joint control in Healthcare Assets. Accordingly, the investment in Healthcare Assets was thereafter accounted for as an associated company. Pursuant to the amended and restated joint venture agreement, Healthcare Ventures, Smart Future and Dynamic Ally intend to invest an aggregate amount of up to HK$780 million in Healthcare Assets.
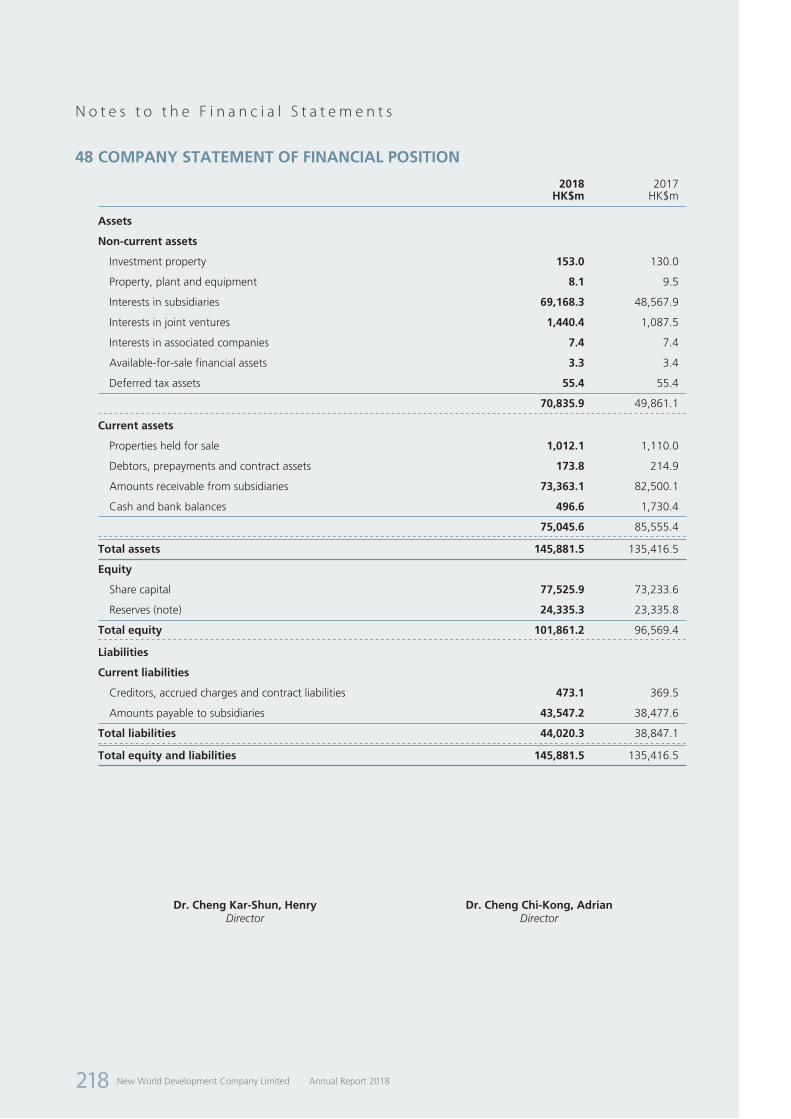
New World Development Company Limited Annual Report 2018218
N o t e s t o t h e F i n a n c i a l S t a t e m e n t s
48 COMPANY STATEMENT OF FINANCIAL POSITION
2018 2017HK$m HK$m
Assets
Non-current assets
Investment property 153.0 130.0
Property, plant and equipment 8.1 9.5
Interests in subsidiaries 69,168.3 48,567.9
Interests in joint ventures 1,440.4 1,087.5
Interests in associated companies 7.4 7.4
Available-for-sale financial assets 3.3 3.4
Deferred tax assets 55.4 55.4
70,835.9 49,861.1 Current assets
Properties held for sale 1,012.1 1,110.0
Debtors, prepayments and contract assets 173.8 214.9
Amounts receivable from subsidiaries 73,363.1 82,500.1
Cash and bank balances 496.6 1,730.4
75,045.6 85,555.4 Total assets 145,881.5 135,416.5
Equity
Share capital 77,525.9 73,233.6
Reserves (note) 24,335.3 23,335.8
Total equity 101,861.2 96,569.4 Liabilities
Current liabilities
Creditors, accrued charges and contract liabilities 473.1 369.5
Amounts payable to subsidiaries 43,547.2 38,477.6
Total liabilities 44,020.3 38,847.1 Total equity and liabilities 145,881.5 135,416.5
Dr. Cheng Kar-Shun, Henry Dr. Cheng Chi-Kong, AdrianDirector Director
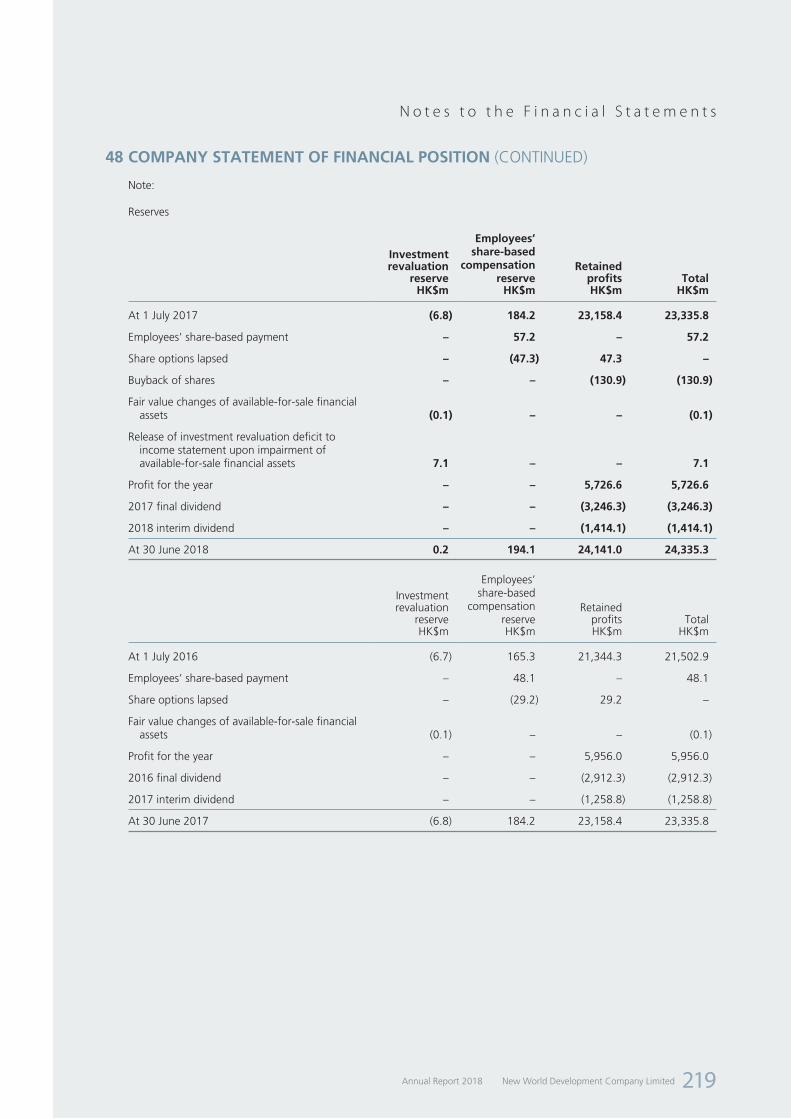
New World Development Company LimitedAnnual Report 2018 219
N o t e s t o t h e F i n a n c i a l S t a t e m e n t s
48 COMPANY STATEMENT OF FINANCIAL POSITION (CONTINUED)
Note:
Reserves
Investment revaluation
reserve
Employees’ share-based
compensation reserve
Retained profits Total
HK$m HK$m HK$m HK$m
At 1 July 2017 (6.8) 184.2 23,158.4 23,335.8
Employees’ share-based payment – 57.2 – 57.2
Share options lapsed – (47.3) 47.3 –
Buyback of shares – – (130.9) (130.9)
Fair value changes of available-for-sale financial assets (0.1) – – (0.1)
Release of investment revaluation deficit to income statement upon impairment of available-for-sale financial assets 7.1 – – 7.1
Profit for the year – – 5,726.6 5,726.6
2017 final dividend – – (3,246.3) (3,246.3)
2018 interim dividend – – (1,414.1) (1,414.1)
At 30 June 2018 0.2 194.1 24,141.0 24,335.3
Investment revaluation
reserve
Employees’ share-based
compensation reserve
Retained profits Total
HK$m HK$m HK$m HK$m
At 1 July 2016 (6.7) 165.3 21,344.3 21,502.9
Employees’ share-based payment – 48.1 – 48.1
Share options lapsed – (29.2) 29.2 –
Fair value changes of available-for-sale financial assets (0.1) – – (0.1)
Profit for the year – – 5,956.0 5,956.0
2016 final dividend – – (2,912.3) (2,912.3)
2017 interim dividend – – (1,258.8) (1,258.8)
At 30 June 2017 (6.8) 184.2 23,158.4 23,335.8

New World Development Company Limited Annual Report 2018220
N o t e s t o t h e F i n a n c i a l S t a t e m e n t s
49 PRINCIPAL SUBSIDIARIESAs at 30 June 2018
Share capital issued#
Number of shares
Issued and paid up
share capital
Attributable interest to the Group Principal activities
HK$ (%)
Incorporated and operate in Hong Kong
Ace Island Limited 1 1 100 Property investment
Addlight Investments Limited 9,9982 ¹
9,9982
6363
Property development
Adwin Top Limited 2 2 100 Property investment
All Speed Investment Limited 2 2 100 Property investment
Anway Limited 1 1 61 Duty free operation and general trading
Billion Huge (International) Limited 950,001 950,001 100 Investment holding
Billion Park Investment Limited 1,000,000 1,000,000 80 Investment holding
Billionoble Investment Limited 4,9982 ¹
4,9982
6161
Investment holding
Bonson Holdings Limited 1 1 100 Property investment
Bounty Gain Limited 1 1 61 Investment holding
Bright Moon Company, Limited 100,000 1,000,000 75 Property investment
Cheer Best Enterprises Limited 2 2 100 Property investment
Cheering Step Investments Limited 1 1 61 Investment holding
Cheong Sing Company Limited 10,000 10,000 100 Property investment
Cheong Yin Company Limited 30,000 3,000,000 100 Property investment
Chi Lam Investment Company Limited 7,000 700,000 100 Investment holding
Chinese Future Limited 1,300,000,000 1,300,000,000 61 Investment holding
CiF Solutions Limited 10160,000 ¹
1,00016,000,000
6161
Provision of information technology solutions
Citybus Limited 37,500,000 376,295,750 61 Provision of franchised and non-franchised bus services
Come City Limited 2 2 100 Property investment
Discovery Park Commercial Services Limited 2 2 100 Property management
DP Properties Limited 4,000 1,000 100 Property investment
Dynamic Ally Limited 1 1 61 Investment holding
Easywin Enterprises Corporation Limited 2,000 200,000 100 Investment holding
Fook Hang Trading Company Limited 100 10,000 85 Property development
Fook Hong Enterprises Company, Limited 10,000 1,000,000 100 Property investment
Fortune Kingdom Development Limited 2 2 100 Property development
Fortune Land Development Limited 1 1 100 Property investment
Full Asset Enterprises Limited 1 1 100 Property investment
Good Sense Development Limited 1 1 100 Property investment
Grace Crystal Limited 1 1 61 Investment holding
Grace Sky Creation Limited 10,000 10,000 100 Investment holding
Gracejoy Investments Limited 1 1 100 Property development
Grand Express International Limited 1 1 61 Investment holding
Guidetone Investments Limited 100,000 100,000 80 Property investment

New World Development Company LimitedAnnual Report 2018 221
N o t e s t o t h e F i n a n c i a l S t a t e m e n t s
Share capital issued#
Number of shares
Issued and paid up
share capital
Attributable interest to the Group Principal activities
HK$ (%)
Incorporated and operate in Hong Kong (continued)
Happy Champion Limited 2 2 100 Investment holding
Head Step Limited 2 2 100 Hotel operation
Healthcare Assets Management Limited 10 20,177,194 58 Healthcare
Highness Land Investment Company Limited
10 100 60 Property investment
Hip Hing Builders Company Limited 40,00010,000 ¹
40,000,00010,000,000
6161
Construction
Hip Hing Construction Company Limited 400,000600,000 ¹
40,000,00060,000,000
6161
Construction and civil engineering
Hip Hing Engineering Company Limited 2,000,000 200,000,000 61 Building construction
Hip Seng Builders Limited 20,000 20,000,000 61 Construction
Hip Seng Construction Company Limited 1 1 61 Construction
Hong Kong Convention and Exhibition Centre (Management) Limited
31 ¹
31
6161
Management of Hong Kong Convention and Exhibition Centre (“HKCEC”)
Hong Kong Exhibition and Convention Venue Management China Limited
1 1 61 Investment holding
Hong Kong Island Development Limited 33,400,000 167,000,000 100 Property investment
Hong Kong Jing-Guang Development Limited 100,000 1,000,000 82 Investment holding
Hong Kong Multiple Intelligence Education Company Limited
1 1 100 Provision of training courses
Honour Shares Limited 100 100 100 Investment holding
Housing Finance Limited 2 2 100 Financial services
Istaron Limited 4 4 100 Investment holding
Jade Gain Enterprises Limited 100 100 70 Property investment
Join Base Development Limited 1 1 100 Property investment
Joint Profit Limited 2 2 100 Property investment
K11 (China) Limited 1 1 100 Investment holding
K11 Concepts Limited 1 1 100 Provision of property management consultancy services
K11 Cultural & Creation Company Limited 1 1 100 Cultural & Creation
K11 Sales & E-Commerce Company Limited 1 1 100 Retail & Corporate Sales
Kin Kiu Enterprises, Limited 10,000 10,000,000 100 Investment holding
King Lee Investment Company Limited 300 300,000 100 Investment holding
Kiu Lok Property Services (China) Limited 22 ¹
22
6161
Property agency management and consultancy
La Tune Limited 2 200 100 Property investment
Land Chain Limited 2 2 100 Property investment
Land Source Investment Limited 2 2 100 Property investment
49 PRINCIPAL SUBSIDIARIES (CONTINUED)
As at 30 June 2018
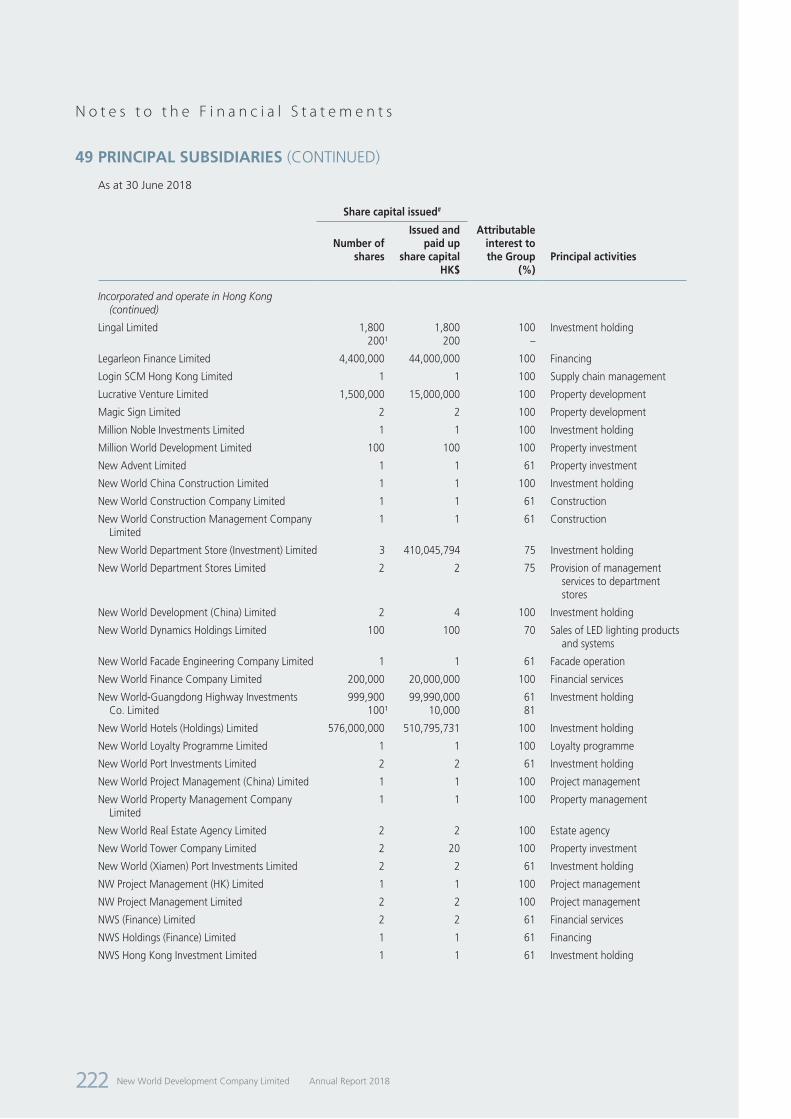
New World Development Company Limited Annual Report 2018222
N o t e s t o t h e F i n a n c i a l S t a t e m e n t s
Share capital issued#
Number of shares
Issued and paid up
share capital
Attributable interest to the Group Principal activities
HK$ (%)
Incorporated and operate in Hong Kong (continued)
Lingal Limited 1,800200 ¹
1,800200
100–
Investment holding
Legarleon Finance Limited 4,400,000 44,000,000 100 Financing
Login SCM Hong Kong Limited 1 1 100 Supply chain management
Lucrative Venture Limited 1,500,000 15,000,000 100 Property development
Magic Sign Limited 2 2 100 Property development
Million Noble Investments Limited 1 1 100 Investment holding
Million World Development Limited 100 100 100 Property investment
New Advent Limited 1 1 61 Property investment
New World China Construction Limited 1 1 100 Investment holding
New World Construction Company Limited 1 1 61 Construction
New World Construction Management Company Limited
1 1 61 Construction
New World Department Store (Investment) Limited 3 410,045,794 75 Investment holding
New World Department Stores Limited 2 2 75 Provision of management services to department stores
New World Development (China) Limited 2 4 100 Investment holding
New World Dynamics Holdings Limited 100 100 70 Sales of LED lighting products and systems
New World Facade Engineering Company Limited 1 1 61 Facade operation
New World Finance Company Limited 200,000 20,000,000 100 Financial services
New World-Guangdong Highway Investments Co. Limited
999,900100 ¹
99,990,00010,000
6181
Investment holding
New World Hotels (Holdings) Limited 576,000,000 510,795,731 100 Investment holding
New World Loyalty Programme Limited 1 1 100 Loyalty programme
New World Port Investments Limited 2 2 61 Investment holding
New World Project Management (China) Limited 1 1 100 Project management
New World Property Management Company Limited
1 1 100 Property management
New World Real Estate Agency Limited 2 2 100 Estate agency
New World Tower Company Limited 2 20 100 Property investment
New World (Xiamen) Port Investments Limited 2 2 61 Investment holding
NW Project Management (HK) Limited 1 1 100 Project management
NW Project Management Limited 2 2 100 Project management
NWS (Finance) Limited 2 2 61 Financial services
NWS Holdings (Finance) Limited 1 1 61 Financing
NWS Hong Kong Investment Limited 1 1 61 Investment holding
49 PRINCIPAL SUBSIDIARIES (CONTINUED)
As at 30 June 2018
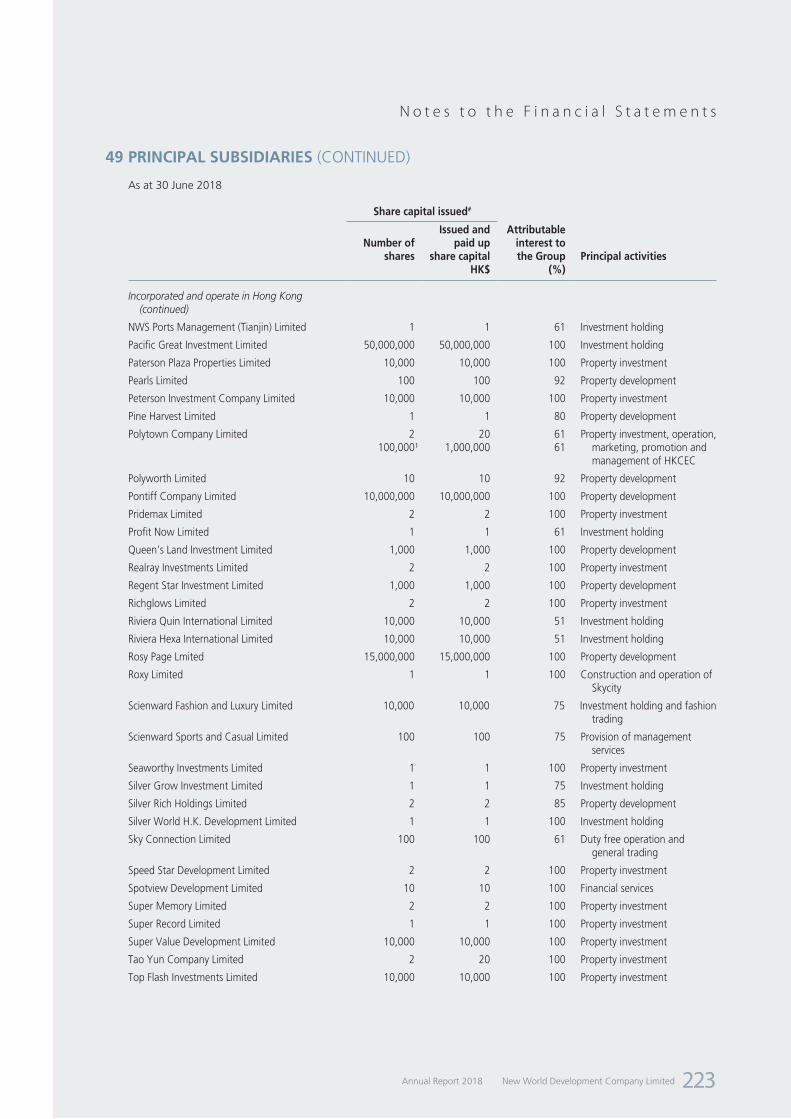
New World Development Company LimitedAnnual Report 2018 223
N o t e s t o t h e F i n a n c i a l S t a t e m e n t s
Share capital issued#
Number of shares
Issued and paid up
share capital
Attributable interest to the Group Principal activities
HK$ (%)
Incorporated and operate in Hong Kong (continued)
NWS Ports Management (Tianjin) Limited 1 1 61 Investment holding
Pacific Great Investment Limited 50,000,000 50,000,000 100 Investment holding
Paterson Plaza Properties Limited 10,000 10,000 100 Property investment
Pearls Limited 100 100 92 Property development
Peterson Investment Company Limited 10,000 10,000 100 Property investment
Pine Harvest Limited 1 1 80 Property development
Polytown Company Limited 2100,000 ¹
201,000,000
6161
Property investment, operation, marketing, promotion and management of HKCEC
Polyworth Limited 10 10 92 Property development
Pontiff Company Limited 10,000,000 10,000,000 100 Property development
Pridemax Limited 2 2 100 Property investment
Profit Now Limited 1 1 61 Investment holding
Queen’s Land Investment Limited 1,000 1,000 100 Property development
Realray Investments Limited 2 2 100 Property investment
Regent Star Investment Limited 1,000 1,000 100 Property development
Richglows Limited 2 2 100 Property investment
Riviera Quin International Limited 10,000 10,000 51 Investment holding
Riviera Hexa International Limited 10,000 10,000 51 Investment holding
Rosy Page Lmited 15,000,000 15,000,000 100 Property development
Roxy Limited 1 1 100 Construction and operation of Skycity
Scienward Fashion and Luxury Limited 10,000 10,000 75 Investment holding and fashion trading
Scienward Sports and Casual Limited 100 100 75 Provision of management services
Seaworthy Investments Limited 1 1 100 Property investment
Silver Grow Investment Limited 1 1 75 Investment holding
Silver Rich Holdings Limited 2 2 85 Property development
Silver World H.K. Development Limited 1 1 100 Investment holding
Sky Connection Limited 100 100 61 Duty free operation and general trading
Speed Star Development Limited 2 2 100 Property investment
Spotview Development Limited 10 10 100 Financial services
Super Memory Limited 2 2 100 Property investment
Super Record Limited 1 1 100 Property investment
Super Value Development Limited 10,000 10,000 100 Property investment
Tao Yun Company Limited 2 20 100 Property investment
Top Flash Investments Limited 10,000 10,000 100 Property investment
49 PRINCIPAL SUBSIDIARIES (CONTINUED)
As at 30 June 2018
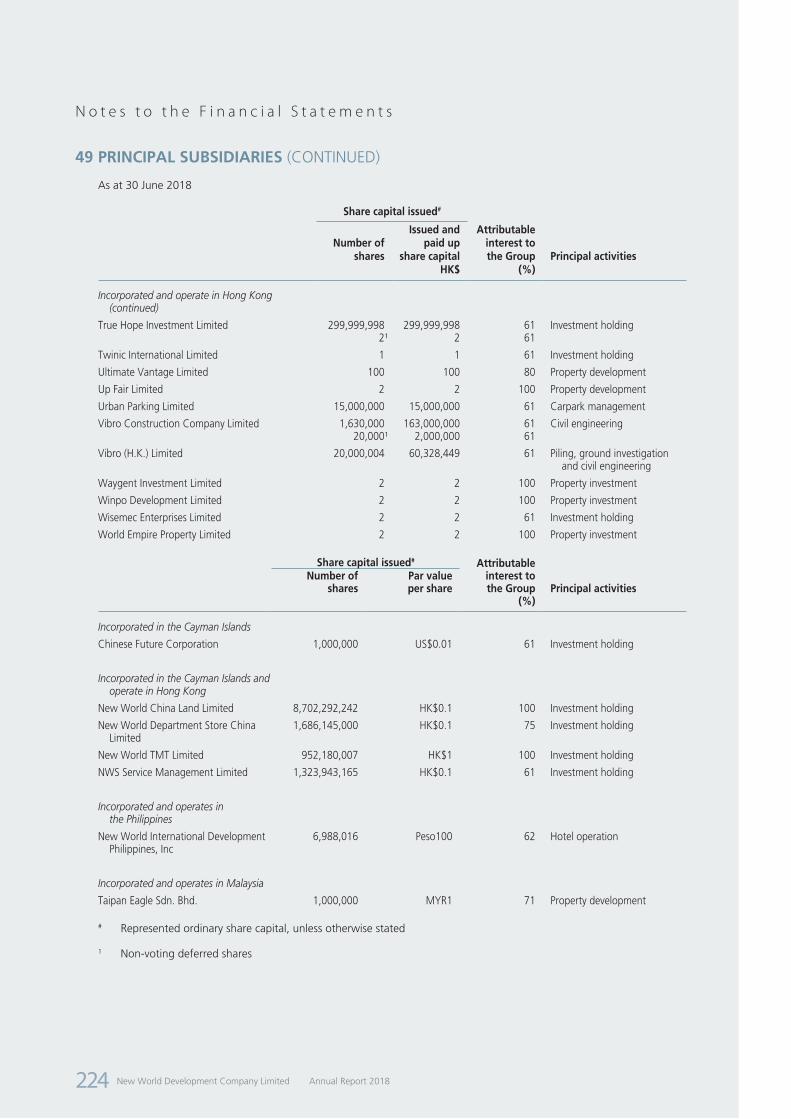
New World Development Company Limited Annual Report 2018224
N o t e s t o t h e F i n a n c i a l S t a t e m e n t s
Share capital issued#
Number of shares
Issued and paid up
share capital
Attributable interest to the Group Principal activities
HK$ (%)
Incorporated and operate in Hong Kong (continued)
True Hope Investment Limited 299,999,9982 ¹
299,999,9982
6161
Investment holding
Twinic International Limited 1 1 61 Investment holding
Ultimate Vantage Limited 100 100 80 Property development
Up Fair Limited 2 2 100 Property development
Urban Parking Limited 15,000,000 15,000,000 61 Carpark management
Vibro Construction Company Limited 1,630,00020,000 ¹
163,000,0002,000,000
6161
Civil engineering
Vibro (H.K.) Limited 20,000,004 60,328,449 61 Piling, ground investigation and civil engineering
Waygent Investment Limited 2 2 100 Property investment
Winpo Development Limited 2 2 100 Property investment
Wisemec Enterprises Limited 2 2 61 Investment holding
World Empire Property Limited 2 2 100 Property investment
Share capital issued# Attributable interest to the Group
Number of shares
Par value per share Principal activities
(%)
Incorporated in the Cayman Islands
Chinese Future Corporation 1,000,000 US$0.01 61 Investment holding
Incorporated in the Cayman Islands and operate in Hong Kong
New World China Land Limited 8,702,292,242 HK$0.1 100 Investment holding
New World Department Store China Limited
1,686,145,000 HK$0.1 75 Investment holding
New World TMT Limited 952,180,007 HK$1 100 Investment holding
NWS Service Management Limited 1,323,943,165 HK$0.1 61 Investment holding
Incorporated and operates in the Philippines
New World International Development Philippines, Inc
6,988,016 Peso100 62 Hotel operation
Incorporated and operates in Malaysia
Taipan Eagle Sdn. Bhd. 1,000,000 MYR1 71 Property development
# Represented ordinary share capital, unless otherwise stated
1 Non-voting deferred shares
49 PRINCIPAL SUBSIDIARIES (CONTINUED)
As at 30 June 2018
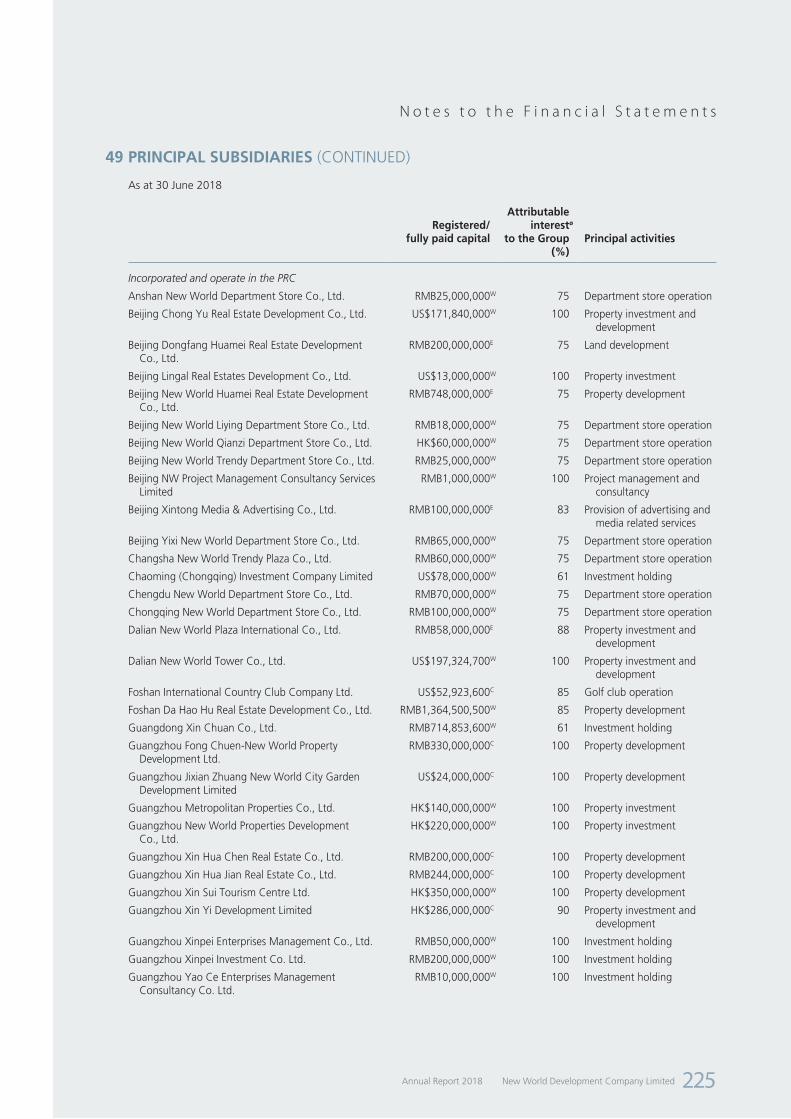
New World Development Company LimitedAnnual Report 2018 225
N o t e s t o t h e F i n a n c i a l S t a t e m e n t s
49 PRINCIPAL SUBSIDIARIES (CONTINUED)
As at 30 June 2018
Registered/fully paid capital
Attributableinterestø
to the Group Principal activities(%)
Incorporated and operate in the PRC
Anshan New World Department Store Co., Ltd. RMB25,000,000W 75 Department store operation
Beijing Chong Yu Real Estate Development Co., Ltd. US$171,840,000W 100 Property investment and development
Beijing Dongfang Huamei Real Estate Development Co., Ltd.
RMB200,000,000E 75 Land development
Beijing Lingal Real Estates Development Co., Ltd. US$13,000,000W 100 Property investment
Beijing New World Huamei Real Estate Development Co., Ltd.
RMB748,000,000E 75 Property development
Beijing New World Liying Department Store Co., Ltd. RMB18,000,000W 75 Department store operation
Beijing New World Qianzi Department Store Co., Ltd. HK$60,000,000W 75 Department store operation
Beijing New World Trendy Department Store Co., Ltd. RMB25,000,000W 75 Department store operation
Beijing NW Project Management Consultancy Services Limited
RMB1,000,000W 100 Project management and consultancy
Beijing Xintong Media & Advertising Co., Ltd. RMB100,000,000E 83 Provision of advertising and media related services
Beijing Yixi New World Department Store Co., Ltd. RMB65,000,000W 75 Department store operation
Changsha New World Trendy Plaza Co., Ltd. RMB60,000,000W 75 Department store operation
Chaoming (Chongqing) Investment Company Limited US$78,000,000W 61 Investment holding
Chengdu New World Department Store Co., Ltd. RMB70,000,000W 75 Department store operation
Chongqing New World Department Store Co., Ltd. RMB100,000,000W 75 Department store operation
Dalian New World Plaza International Co., Ltd. RMB58,000,000E 88 Property investment and development
Dalian New World Tower Co., Ltd. US$197,324,700W 100 Property investment and development
Foshan International Country Club Company Ltd. US$52,923,600C 85 Golf club operation
Foshan Da Hao Hu Real Estate Development Co., Ltd. RMB1,364,500,500W 85 Property development
Guangdong Xin Chuan Co., Ltd. RMB714,853,600W 61 Investment holding
Guangzhou Fong Chuen-New World Property Development Ltd.
RMB330,000,000C 100 Property development
Guangzhou Jixian Zhuang New World City Garden Development Limited
US$24,000,000C 100 Property development
Guangzhou Metropolitan Properties Co., Ltd. HK$140,000,000W 100 Property investment
Guangzhou New World Properties Development Co., Ltd.
HK$220,000,000W 100 Property investment
Guangzhou Xin Hua Chen Real Estate Co., Ltd. RMB200,000,000C 100 Property development
Guangzhou Xin Hua Jian Real Estate Co., Ltd. RMB244,000,000C 100 Property development
Guangzhou Xin Sui Tourism Centre Ltd. HK$350,000,000W 100 Property development
Guangzhou Xin Yi Development Limited HK$286,000,000C 90 Property investment and development
Guangzhou Xinpei Enterprises Management Co., Ltd. RMB50,000,000W 100 Investment holding
Guangzhou Xinpei Investment Co. Ltd. RMB200,000,000W 100 Investment holding
Guangzhou Yao Ce Enterprises Management Consultancy Co. Ltd.
RMB10,000,000W 100 Investment holding

New World Development Company Limited Annual Report 2018226
N o t e s t o t h e F i n a n c i a l S t a t e m e n t s
Registered/fully paid capital
Attributableinterestø
to the Group Principal activities(%)
Incorporated and operate in the PRC (continued)
Guangzhou Yibo Real Estate Development Co., Ltd. RMB392,500,000W 100 Property development
Guangzhou Yong Pei Properties Development Co., Ltd. RMB2,300,000,000W 100 Property development
Hangzhou Guoyi Expressway and Bridge Management Co., Ltd.
US$320,590,000E 61 Operation of toll road
Harbin New World Department Store Co., Ltd. RMB126,000,000W 75 Department store operation
Huamei Wealth (Beijing) Technology Co., Ltd. RMB640,000,000W 100 Property investment
Hunan Fortune Lake Property Development Co., Ltd. RMB255,724,318W 100 Property development
Hunan Success New Century Investment Company Limited
RMB980,000,000E 95 Property development
Jiangsu New World Department Store Co., Ltd. RMB16,000,000W 75 Department store operation
Jinan New World Sunshine Development Ltd. US$69,980,000W 100 Property development
K11 Concepts (Beijing) Limited RMB8,000,000W 100 Business consultancy
K11 Concepts (Shanghai) Limited RMB16,000,000W 100 Business consultancy
Langfang New World Properties Development Co., Ltd. US$145,300,000W 100 Property development
Langfang Xin Zhong Properties Development Co., Ltd. US$98,200,000W 100 Property development
Lanzhou New World Department Store Co., Ltd. RMB30,000,000W 75 Department store operation
Login SCM (Shenzhen) Co. Ltd. RMB50,000,000W 100 Supply chain management
Mianyang New World Department Store Co., Ltd. RMB14,000,000W 75 Department store operation
Nanjing New World Real Estate Co., Ltd. US$45,339,518W 100 Property investment
New World Anderson (Tianjin) Development Co., Ltd. US$5,500,000W 100 Property investment
New World (Anshan) Property Development Co., Ltd. RMB1,420,000,000W 100 Property development
New World (China) Investment Limited US$130,000,000W 100 Investment holding
New World China Land Investments Company Limited US$80,000,000W 100 Investment holding
New World Department Store (China) Co., Ltd. RMB50,000,000W 75 Department store operation
New World Department Stores Investment (China) Co., Ltd.
US$150,000,000W 75 Investment holding
New World Development (Wuhan) Co., Ltd US$128,500,000W 100 Property investment and development
New World Dynamics (Shenzhen) Company Limited RMB18,880,000W 70 Sales of LED lighting products and systems
New World Goodtrade (Wuhan) Limited US$219,500,000W 100 Property investment and development
New World HHC Construction Limited RMB53,000,000W 100 Construction
New World New Land Real Estate (Wuhan) Co., Ltd. US$590,900,000W 100 Property development
New World Project Management (Shenzhen) Limited RMB10,000,000W 100 Project management
New World (Shenyang) Property Development Limited RMB5,647,800,000W 100 Property investment and development
New World Strategic (Beijing) Investment Consultancy Limited
US$2,400,000W 100 Investment consultancy
49 PRINCIPAL SUBSIDIARIES (CONTINUED)
As at 30 June 2018
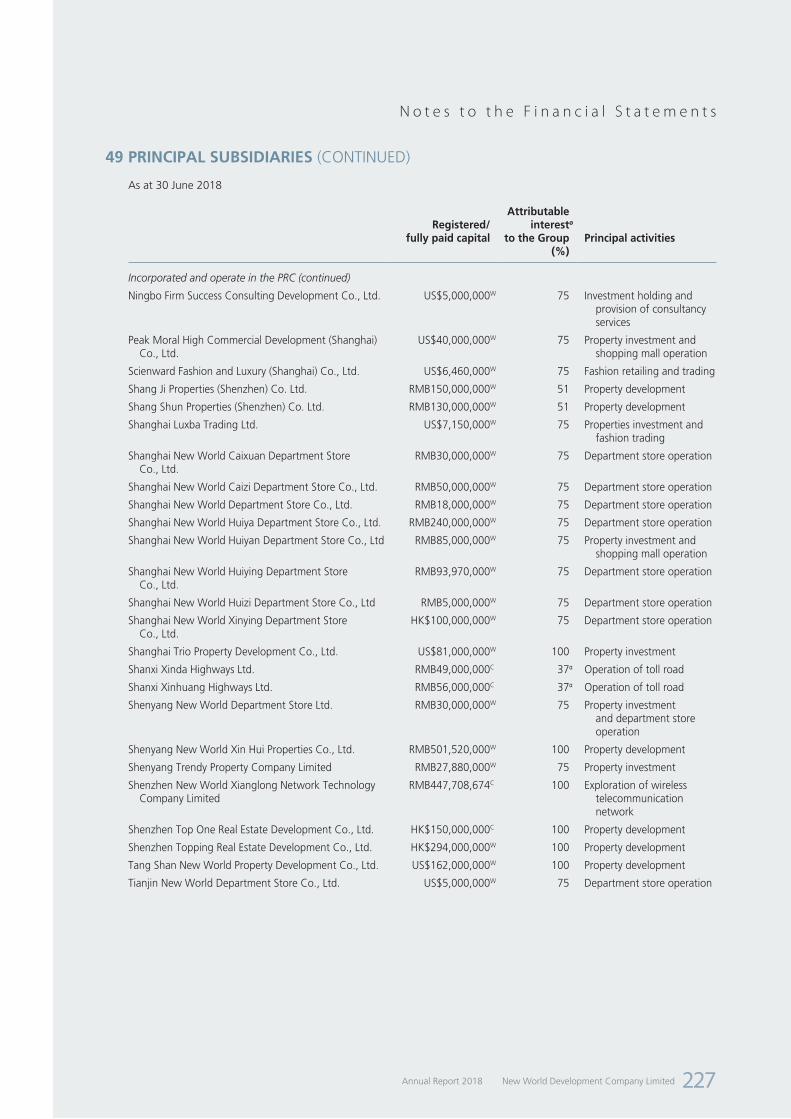
New World Development Company LimitedAnnual Report 2018 227
N o t e s t o t h e F i n a n c i a l S t a t e m e n t s
Registered/fully paid capital
Attributableinterestø
to the Group Principal activities(%)
Incorporated and operate in the PRC (continued)
Ningbo Firm Success Consulting Development Co., Ltd. US$5,000,000W 75 Investment holding and provision of consultancy services
Peak Moral High Commercial Development (Shanghai) Co., Ltd.
US$40,000,000W 75 Property investment and shopping mall operation
Scienward Fashion and Luxury (Shanghai) Co., Ltd. US$6,460,000W 75 Fashion retailing and trading
Shang Ji Properties (Shenzhen) Co. Ltd. RMB150,000,000W 51 Property development
Shang Shun Properties (Shenzhen) Co. Ltd. RMB130,000,000W 51 Property development
Shanghai Luxba Trading Ltd. US$7,150,000W 75 Properties investment and fashion trading
Shanghai New World Caixuan Department Store Co., Ltd.
RMB30,000,000W 75 Department store operation
Shanghai New World Caizi Department Store Co., Ltd. RMB50,000,000W 75 Department store operation
Shanghai New World Department Store Co., Ltd. RMB18,000,000W 75 Department store operation
Shanghai New World Huiya Department Store Co., Ltd. RMB240,000,000W 75 Department store operation
Shanghai New World Huiyan Department Store Co., Ltd RMB85,000,000W 75 Property investment and shopping mall operation
Shanghai New World Huiying Department Store Co., Ltd.
RMB93,970,000W 75 Department store operation
Shanghai New World Huizi Department Store Co., Ltd RMB5,000,000W 75 Department store operation
Shanghai New World Xinying Department Store Co., Ltd.
HK$100,000,000W 75 Department store operation
Shanghai Trio Property Development Co., Ltd. US$81,000,000W 100 Property investment
Shanxi Xinda Highways Ltd. RMB49,000,000C 37
α Operation of toll road
Shanxi Xinhuang Highways Ltd. RMB56,000,000C 37
α Operation of toll road
Shenyang New World Department Store Ltd. RMB30,000,000W 75 Property investment and department store operation
Shenyang New World Xin Hui Properties Co., Ltd. RMB501,520,000W 100 Property development
Shenyang Trendy Property Company Limited RMB27,880,000W 75 Property investment
Shenzhen New World Xianglong Network Technology Company Limited
RMB447,708,674C 100 Exploration of wireless telecommunication network
Shenzhen Top One Real Estate Development Co., Ltd. HK$150,000,000C 100 Property development
Shenzhen Topping Real Estate Development Co., Ltd. HK$294,000,000W 100 Property development
Tang Shan New World Property Development Co., Ltd. US$162,000,000W 100 Property development
Tianjin New World Department Store Co., Ltd. US$5,000,000W 75 Department store operation
49 PRINCIPAL SUBSIDIARIES (CONTINUED)
As at 30 June 2018

New World Development Company Limited Annual Report 2018228
N o t e s t o t h e F i n a n c i a l S t a t e m e n t s
Registered/fully paid capital
Attributableinterestø
to the Group Principal activities(%)
Incorporated and operate in the PRC (continued)
Tianjin New World Properties Development Co., Ltd. US$91,000,000W 100 Property development
Tianjin New World Trendy Plaza Co., Ltd. RMB30,000,000W 75 Department store operation
Tianjin Xin Guang Development Co., Ltd. US$4,500,000W 100 Property investment
Wuhan New Eagle Enterprises Co., Limited US$2,830,000W 100 Property investment
Wuhan New World Caixuan Department Store Co., Ltd. RMB75,000,000W 75 Department store operation
Wuhan New World Department Store Co., Ltd. US$15,630,000W 75 Property investment and department store operation
Wuhan New World Trendy Department Store Co., Ltd. RMB80,000,000W 75 Department store operation
Wuhan New World Trendy Plaza Co., Ltd. RMB50,000,000W 75 Department store operation
Wuhan Xinhan Development Co., Ltd. US$16,000,000C 100 Property development
Wuzhou Xinwu Highways Limited RMB72,000,000C 32
α Operation of toll road
Xiamen NWS Management Consultancy Limited US$500,000W 61 Management consultation
Xi’an New World Department Store Co., Ltd. RMB40,000,000W 75 Department store operation
Yantai New World Department Store Co., Ltd RMB80,000,000W 75 Department store operation
Yunnan New World Department Store Co., Ltd. RMB10,000,000W 75 Department store operation
Zhaoqing New World Property Development Limited US$16,500,000W 100 Property development
Zhengzhou New World Department Store Co., Ltd. RMB50,000,000W 75 Department store operation
Incorporated and operate in Macau
Hip Hing Engineering (Macau) Company Limited MOP100,000 61 Construction
Vibro (Macau) Limited MOP1,000,000 61 Foundation works
α The Group indirectly holds equity interest in these subsidiaries through non-wholly owned subsidiaries, and has control over each of these subsidiaries
ø Profit or cash sharing percentage was adopted for certain PRC entities
W Registered as wholly foreign owned enterprise under PRC law
E Registered as sino-foreign equity joint venture under PRC law
C Registered as sino-foreign co-operative joint venture under PRC law
49 PRINCIPAL SUBSIDIARIES (CONTINUED)
As at 30 June 2018

New World Development Company LimitedAnnual Report 2018 229
N o t e s t o t h e F i n a n c i a l S t a t e m e n t s
49 PRINCIPAL SUBSIDIARIES (CONTINUED)
As at 30 June 2018
Share capital issued# Attributableinterest to the Group
Number of shares
Par value per share Principal activities
(%)
Incorporated in Bermuda and operates in Hong Kong
NWS Holdings Limited 3,896,506,451 HK$1 61 Investment holding
Incorporated in the British Virgin Islands
Allied Win Investments Limited 1 US$1 100 Investment holding
Beauty Ocean Limited 1 US$1 61 Investment holding
Brilliant Alpha Investment Limited 1 US$1 100 Investment holding
Crown Success Limited 100 US$1 100 Investment holding
Eagle Eyes Development Limited 1 US$1 100 Investment holding
Ease Kind Development Limited 1 US$1 100 Property development
Esteemed Sino Limited 1 US$1 100 Investment holding
Ever Brisk Limited 1 US$1 100 Investment holding
Ever Reliance Enterprises Limited 1 US$1 51 Investment holding
Fine Reputation Incorporated 10,000 US$1 100 Investment holding
Flying Gravity Limited 1 US$1 61 Investment holding
Fortland Ventures Limited 1 US$1 61 Investment holding
Fortune Star Worldwide Limited 100 US$1 100 Investment holding
Fotoland Limited 1 US$1 100 Investment holding
Gao Li Enterprises Limited 1 US$1 51 Investment holding
Gigantic Global Limited 2 US$1 100 Investment holding
Goodtrade Enterprises Limited 1 US$1 100 Investment holding
Gravy Train Investments Limited 1 US$1 61 Investment holding
HH Holdings Corporation 600,000 HK$1 61 Investment holding
Hing Loong Limited 20,010,000 US$1 100 Investment holding
Ideal Global International Limited 1 US$1 61 Investment holding
K11 Group Limited 1 HK$1 100 Investment holding
K11 Investment Company Limited 1 US$1 100 Investment holding
Kee Shing Investments Limited 1,000 US$1 100 Investment holding
Keen Link Enterprises Limited 1 US$1 100 Investment holding
Lotsgain Limited 100 US$1 100 Investment holding
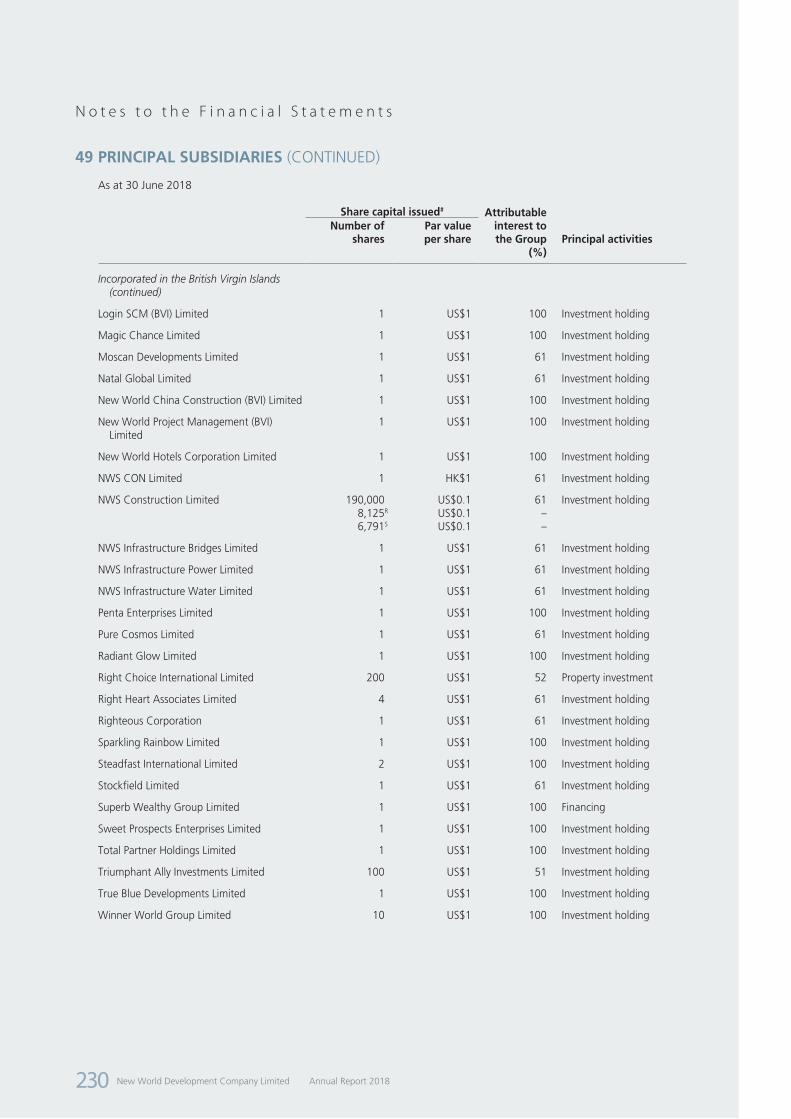
New World Development Company Limited Annual Report 2018230
N o t e s t o t h e F i n a n c i a l S t a t e m e n t s
Share capital issued# Attributableinterest to the Group
Number of shares
Par value per share Principal activities
(%)
Incorporated in the British Virgin Islands (continued)
Login SCM (BVI) Limited 1 US$1 100 Investment holding
Magic Chance Limited 1 US$1 100 Investment holding
Moscan Developments Limited 1 US$1 61 Investment holding
Natal Global Limited 1 US$1 61 Investment holding
New World China Construction (BVI) Limited 1 US$1 100 Investment holding
New World Project Management (BVI) Limited
1 US$1 100 Investment holding
New World Hotels Corporation Limited 1 US$1 100 Investment holding
NWS CON Limited 1 HK$1 61 Investment holding
NWS Construction Limited 190,0008,125
R
6,791
S
US$0.1US$0.1US$0.1
61––
Investment holding
NWS Infrastructure Bridges Limited 1 US$1 61 Investment holding
NWS Infrastructure Power Limited 1 US$1 61 Investment holding
NWS Infrastructure Water Limited 1 US$1 61 Investment holding
Penta Enterprises Limited 1 US$1 100 Investment holding
Pure Cosmos Limited 1 US$1 61 Investment holding
Radiant Glow Limited 1 US$1 100 Investment holding
Right Choice International Limited 200 US$1 52 Property investment
Right Heart Associates Limited 4 US$1 61 Investment holding
Righteous Corporation 1 US$1 61 Investment holding
Sparkling Rainbow Limited 1 US$1 100 Investment holding
Steadfast International Limited 2 US$1 100 Investment holding
Stockfield Limited 1 US$1 61 Investment holding
Superb Wealthy Group Limited 1 US$1 100 Financing
Sweet Prospects Enterprises Limited 1 US$1 100 Investment holding
Total Partner Holdings Limited 1 US$1 100 Investment holding
Triumphant Ally Investments Limited 100 US$1 51 Investment holding
True Blue Developments Limited 1 US$1 100 Investment holding
Winner World Group Limited 10 US$1 100 Investment holding
49 PRINCIPAL SUBSIDIARIES (CONTINUED)
As at 30 June 2018

New World Development Company LimitedAnnual Report 2018 231
N o t e s t o t h e F i n a n c i a l S t a t e m e n t s
Share capital issued# Attributableinterest to the Group
Number of shares
Par value per share Principal activities
(%)
Incorporated in the British Virgin Islands and operate in Hong Kong
Bellwood Group Limited 100 US$1 61 Investment holding
Best Star (BVI) Investments Limited 1 US$1 61 Investment holding
China Sincere Limited 1 – 75 Financing
Citiplus Investment Limited 1 US$1 100 Investment holding
Creative Profit Group Limited 1 US$1 61 Investment holding
Economic Velocity Limited 1 US$1 61 Investment holding
Fita International Limited 1 – 100 Bond issuer
Great Start Group Corporation 1 US$1 61 Investment holding
Hetro Limited 101 US$1 61 Investment holding
Lucky Strong Limited 1 US$1 61 Investment holding
New World Capital Finance Limited 1 US$1 100 Bond issuer
New World First Bus Services Limited 200,000,000 HK$1 61 Provision of franchised bus services
New World First Ferry Services Limited 1 US$1 61 Provision of ferry services
New World Strategic Investment Limited 1 US$1 100 Investment holding
Noonday Limited 100 US$1 61 Investment holding
NWD Finance (BVI) Limited 1 US$1 100 Bond issuer
NWD (MTN) Limited 1 US$1 100 Bond issuer
NWS Financial Management Services Limited 1 US$1 61 Investment holding
NWS Infrastructure Management Limited 2 US$1 61 Investment holding
NWS Infrastructure Roads Limited 1 US$1 61 Investment holding
NWS Ports Management Limited 2 US$1 61 Investment holding
NWS Transport Services Limited 500,000,016 HK$1 61 Investment holding
Park New Astor Hotel Limited 101 US$1 100 Property investment
South Scarlet Limited 1 US$1 100 Hotel operation
Well Metro Group Limited 14,000 US$1 75 Investment holding
Incorporated in the British Virgin Islands and operates in the PRC
Nacaro Developments Limited 2 US$1 100 Property Investment
Incorporated and operates in Thailand
Emerald Bay Resort Co., Ltd. 7,380,000 THB100 100 Hotel operation
# Represented ordinary share capital, unless otherwise stated
R Redeemable, non-convertible and non-voting A preference shares
S Redeemable, non-convertible and non-voting B preference shares
49 PRINCIPAL SUBSIDIARIES (CONTINUED)
As at 30 June 2018
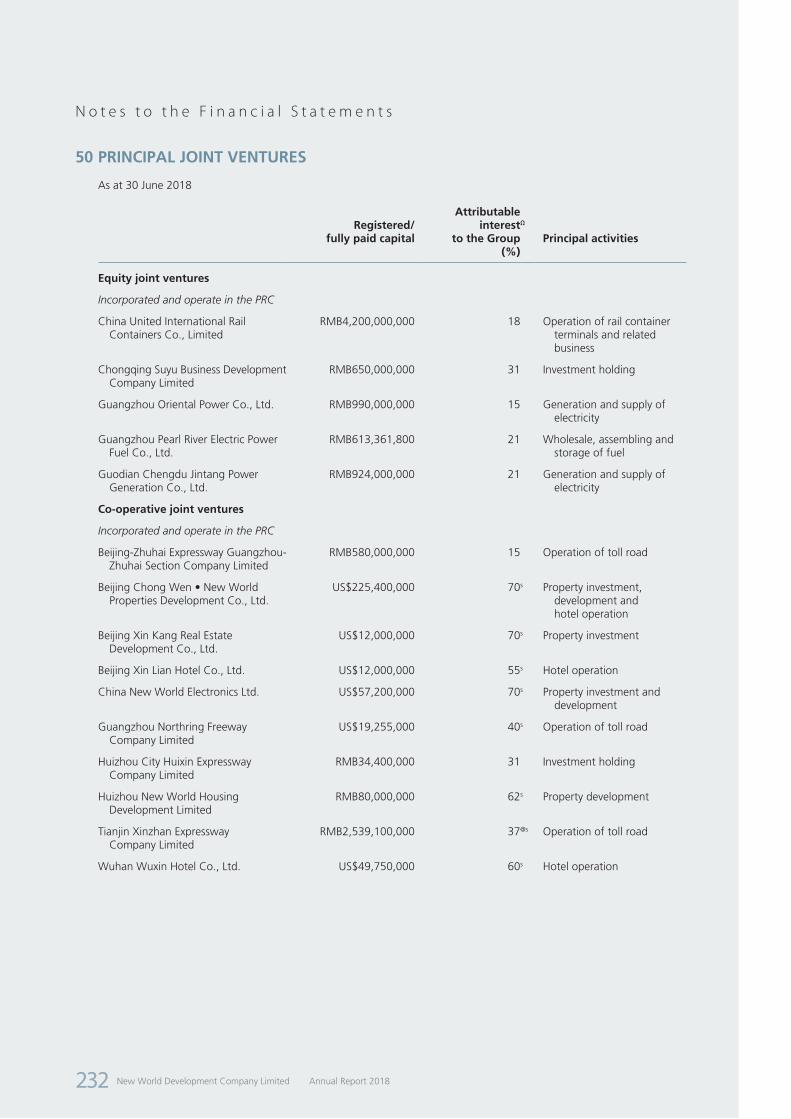
New World Development Company Limited Annual Report 2018232
N o t e s t o t h e F i n a n c i a l S t a t e m e n t s
50 PRINCIPAL JOINT VENTURES
As at 30 June 2018
Registered/fully paid capital
Attributable interest
to the Group
Ω
Principal activities(%)
Equity joint ventures
Incorporated and operate in the PRC
China United International Rail Containers Co., Limited
RMB4,200,000,000 18 Operation of rail container terminals and related business
Chongqing Suyu Business Development Company Limited
RMB650,000,000 31 Investment holding
Guangzhou Oriental Power Co., Ltd. RMB990,000,000 15 Generation and supply of electricity
Guangzhou Pearl River Electric Power Fuel Co., Ltd.
RMB613,361,800 21 Wholesale, assembling and storage of fuel
Guodian Chengdu Jintang Power Generation Co., Ltd.
RMB924,000,000 21 Generation and supply of electricity
Co-operative joint ventures
Incorporated and operate in the PRC
Beijing-Zhuhai Expressway Guangzhou-Zhuhai Section Company Limited
RMB580,000,000 15 Operation of toll road
Beijing Chong Wen • New World Properties Development Co., Ltd.
US$225,400,000 70s Property investment, development and hotel operation
Beijing Xin Kang Real Estate Development Co., Ltd.
US$12,000,000 70s Property investment
Beijing Xin Lian Hotel Co., Ltd. US$12,000,000 55s Hotel operation
China New World Electronics Ltd. US$57,200,000 70s Property investment and development
Guangzhou Northring Freeway Company Limited
US$19,255,000 40s Operation of toll road
Huizhou City Huixin Expressway Company Limited
RMB34,400,000 31 Investment holding
Huizhou New World Housing Development Limited
RMB80,000,000 62s Property development
Tianjin Xinzhan Expressway Company Limited
RMB2,539,100,000 37@s Operation of toll road
Wuhan Wuxin Hotel Co., Ltd. US$49,750,000 60s Hotel operation

New World Development Company LimitedAnnual Report 2018 233
N o t e s t o t h e F i n a n c i a l S t a t e m e n t s
50 PRINCIPAL JOINT VENTURES (CONTINUED)
As at 30 June 2018
Registered/fully paid capital
Attributable interestΩ
to the Group Principal activities(%)
Wholly foreign owned enterprises
Incorporated and operate in the PRC
Guangzhou Bosson Real Estate Co., Ltd.
RMB50,003,000 62s Property development
Guangzhou Hemsell Real Estate Development Co., Ltd.
RMB79,597,000 62s Property development
Guangzhou Shengpei Enterprises Co. Ltd.
RMB500,000,000 40 Property development
Ningbo Gong Tai Properties Co., Ltd. RMB235,000,000 49 Property development
Ningbo Xin Li Real Estate Co., Ltd. US$856,000,000 49 Property development
Wuhan New World Hotel Properties Co., Ltd.
RMB83,507,110 60s Property investment
Ω Percentage of equity interest, in the case of equity joint ventures or profit sharing percentage, in the case of co-operative joint ventures
@ Represented cash sharing ratio
s The Group through its subsidiaries holds more than 50% interests in these joint ventures. These joint ventures are considered as subsidiary undertakings under the Hong Kong Companies Ordinance (Cap. 622). However, under the respective contractual agreements, the Group does not control these joint ventures as the decisions about relevant activities require the unanimous consent of the parties sharing the control.
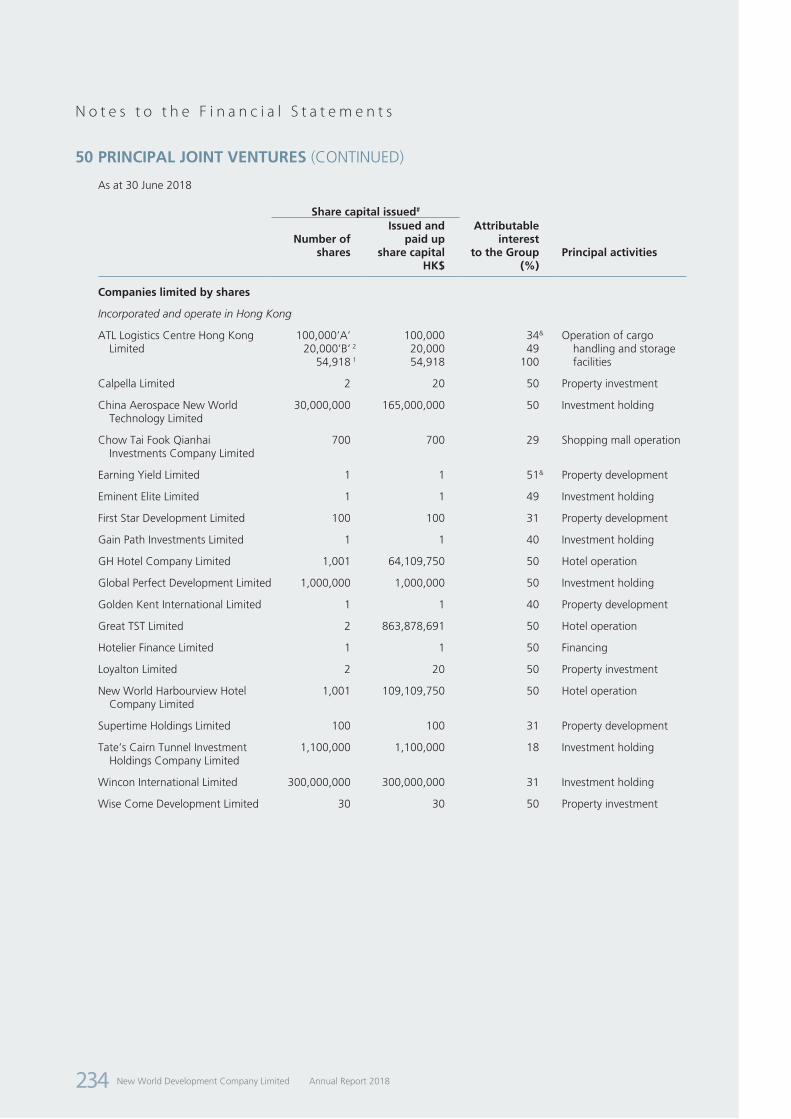
New World Development Company Limited Annual Report 2018234
N o t e s t o t h e F i n a n c i a l S t a t e m e n t s
50 PRINCIPAL JOINT VENTURES (CONTINUED)
As at 30 June 2018
Share capital issued#
Number of shares
Issued and paid up
share capital
Attributable interest
to the Group Principal activitiesHK$ (%)
Companies limited by shares
Incorporated and operate in Hong Kong
ATL Logistics Centre Hong Kong Limited
100,000’A’20,000’B’ 2
54,918 1
100,00020,00054,918
34&
49100
Operation of cargo handling and storage facilities
Calpella Limited 2 20 50 Property investment
China Aerospace New World Technology Limited
30,000,000 165,000,000 50 Investment holding
Chow Tai Fook Qianhai Investments Company Limited
700 700 29 Shopping mall operation
Earning Yield Limited 1 1 51& Property development
Eminent Elite Limited 1 1 49 Investment holding
First Star Development Limited 100 100 31 Property development
Gain Path Investments Limited 1 1 40 Investment holding
GH Hotel Company Limited 1,001 64,109,750 50 Hotel operation
Global Perfect Development Limited 1,000,000 1,000,000 50 Investment holding
Golden Kent International Limited 1 1 40 Property development
Great TST Limited 2 863,878,691 50 Hotel operation
Hotelier Finance Limited 1 1 50 Financing
Loyalton Limited 2 20 50 Property investment
New World Harbourview Hotel Company Limited
1,001 109,109,750 50 Hotel operation
Supertime Holdings Limited 100 100 31 Property development
Tate’s Cairn Tunnel Investment Holdings Company Limited
1,100,000 1,100,000 18 Investment holding
Wincon International Limited 300,000,000 300,000,000 31 Investment holding
Wise Come Development Limited 30 30 50 Property investment

New World Development Company LimitedAnnual Report 2018 235
N o t e s t o t h e F i n a n c i a l S t a t e m e n t s
50 PRINCIPAL JOINT VENTURES (CONTINUED)
As at 30 June 2018
Share capital issued#
Number of shares
Par value per share
Attributable interest
to the Group Principal activities(%)
Incorporated in the British Virgin Islands and operate in the PRC
Holicon Holdings Limited 2 US$1 50 Property Investment
Jaidan Profits Limited 2 US$1 50 Property Investment
Jorvik International Limited 2 US$1 50 Property Investment
Orwin Enterprises Limited 2 US$1 50 Property Investment
Incorporated in the British Virgin Islands
Blaze Flourish Holdings Limited 1 US$1 40 Investment holding
DP World New World Limited 2,000 US$1 31 Investment holding
Great Hotels Holdings Limited 6 US$1 50 Investment holding
Group Program Limited 1 US$1 40 Loyalty programme
Landso Investment Limited 100 – 35 Investment holding
Newfoundworld Investment Holdings Limited
5 US$1 20 Investment holding
Silverway Global Limited 2 US$1 31 Investment holding
Silvery Yield Development Limited 100 US$1 49 Investment holding
Success Concept Investments Limited
1,000 US$1 55& Investment holding
Unite Profit Holdings Limited 100 US$1 40 Investment holding
Incorporated and operates in the Netherlands
Hyva I B.V. 19,000 EUR1 31 Manufacturing and supply of components used in hydraulic loading and unloading systems
Incorporated in the Cayman Islands and operate globally
Goshawk Aviation Limited 362,026,264*** US$0.001 31 Commercial aircraft leasing
Goshawk Management Holdings (Cayman) Limited
100 US$1 31 Commercial aircraft leasing management
Incorporated and operates in Singapore
FEC Skyline Pte. Ltd. 4,000,000 – 30 Property development
# Represented ordinary share capital, unless otherwise stated
1 Non-voting deferred shares
2 Non-voting preference shares
*** Preference shares
& The directors of the Company considered the Group does not have unilateral control governing the financial and operating activities over these joint ventures
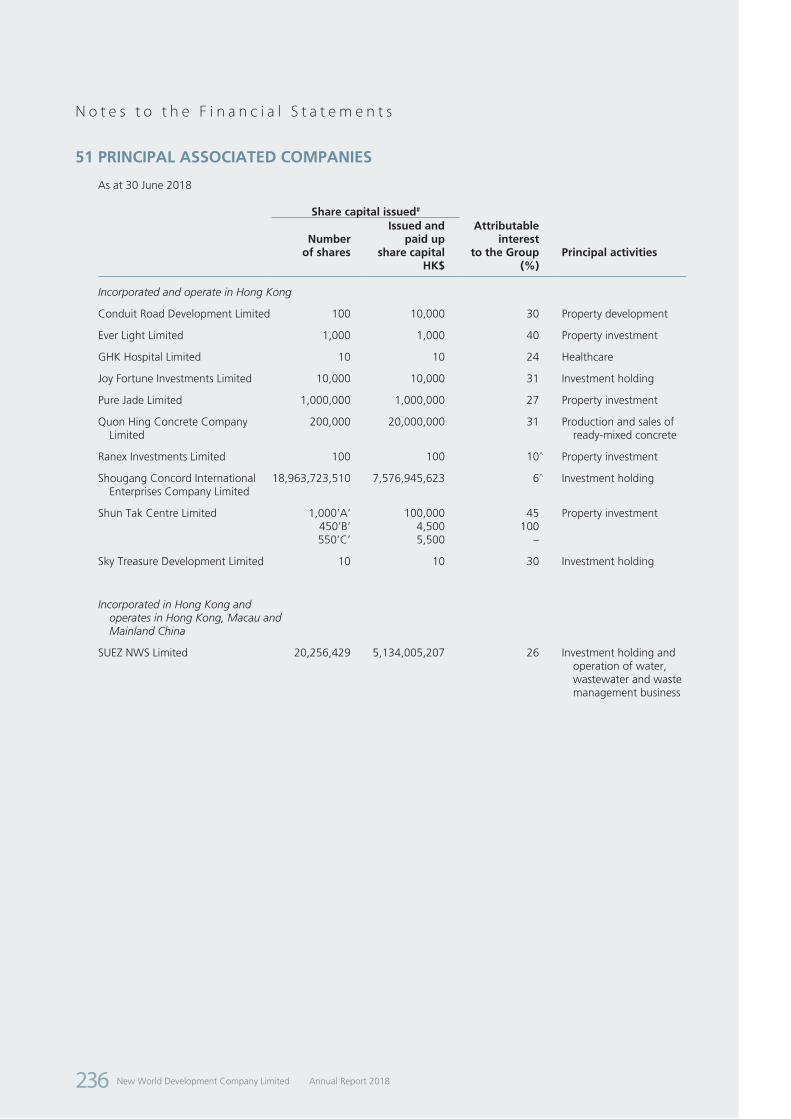
New World Development Company Limited Annual Report 2018236
N o t e s t o t h e F i n a n c i a l S t a t e m e n t s
51 PRINCIPAL ASSOCIATED COMPANIES
As at 30 June 2018
Share capital issued#
Number of shares
Issued and paid up
share capital
Attributable interest
to the Group Principal activitiesHK$ (%)
Incorporated and operate in Hong Kong
Conduit Road Development Limited 100 10,000 30 Property development
Ever Light Limited 1,000 1,000 40 Property investment
GHK Hospital Limited 10 10 24 Healthcare
Joy Fortune Investments Limited 10,000 10,000 31 Investment holding
Pure Jade Limited 1,000,000 1,000,000 27 Property investment
Quon Hing Concrete Company Limited
200,000 20,000,000 31 Production and sales of ready-mixed concrete
Ranex Investments Limited 100 100 10^ Property investment
Shougang Concord International Enterprises Company Limited
18,963,723,510 7,576,945,623 6^ Investment holding
Shun Tak Centre Limited 1,000’A’450’B’550’C’
100,0004,5005,500
45100
–
Property investment
Sky Treasure Development Limited 10 10 30 Investment holding
Incorporated in Hong Kong and operates in Hong Kong, Macau and Mainland China
SUEZ NWS Limited 20,256,429 5,134,005,207 26 Investment holding and operation of water, wastewater and waste management business
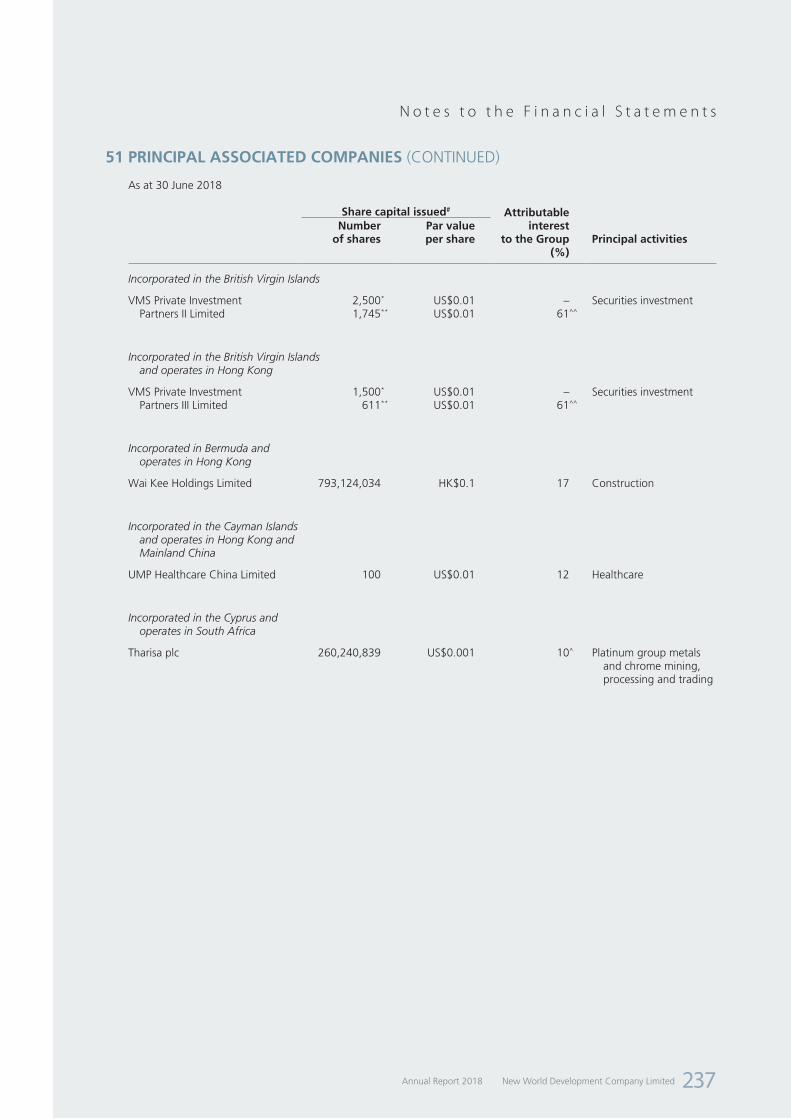
New World Development Company LimitedAnnual Report 2018 237
N o t e s t o t h e F i n a n c i a l S t a t e m e n t s
51 PRINCIPAL ASSOCIATED COMPANIES (CONTINUED)
As at 30 June 2018
Share capital issued# Attributable interest
to the Group Principal activitiesNumber
of sharesPar value per share
(%)
Incorporated in the British Virgin Islands
VMS Private Investment Partners II Limited
2,500*
1,745**US$0.01US$0.01
–61^^
Securities investment
Incorporated in the British Virgin Islandsand operates in Hong Kong
VMS Private Investment Partners III Limited
1,500*
611**US$0.01US$0.01
–61^^
Securities investment
Incorporated in Bermuda and operates in Hong Kong
Wai Kee Holdings Limited 793,124,034 HK$0.1 17 Construction
Incorporated in the Cayman Islands and operates in Hong Kong and Mainland China
UMP Healthcare China Limited 100 US$0.01 12 Healthcare
Incorporated in the Cyprus andoperates in South Africa
Tharisa plc 260,240,839 US$0.001 10^ Platinum group metals and chrome mining, processing and trading
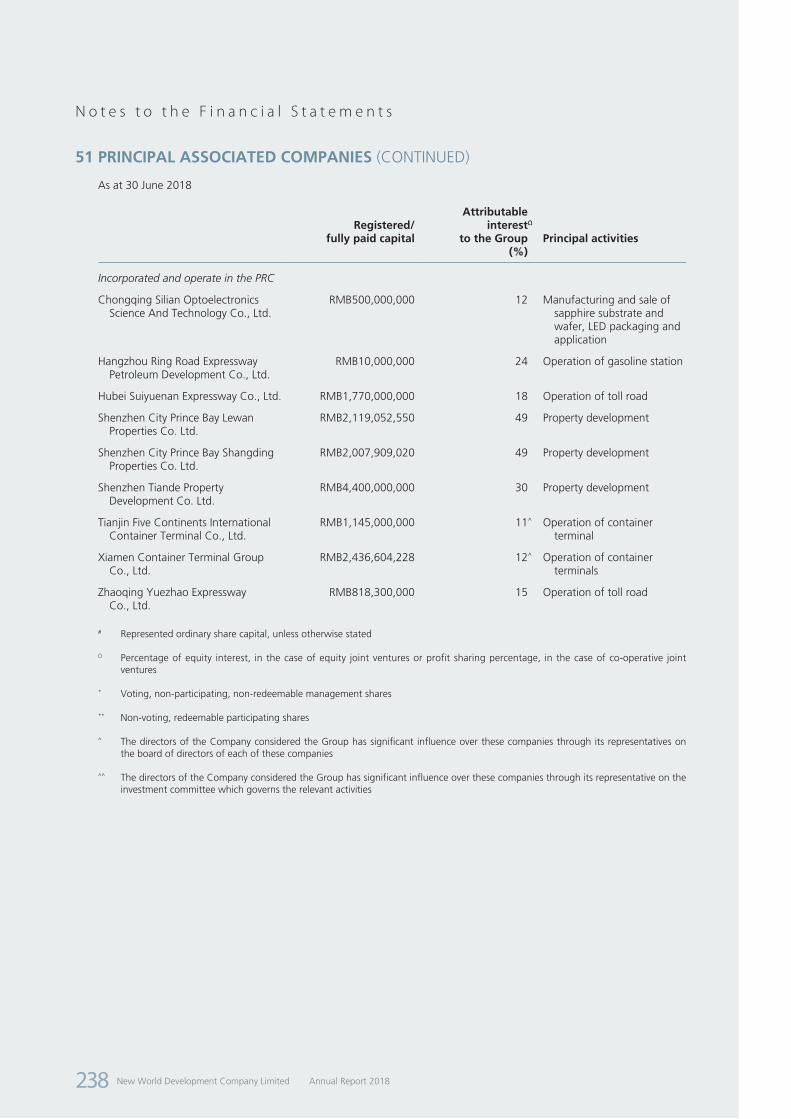
New World Development Company Limited Annual Report 2018238
N o t e s t o t h e F i n a n c i a l S t a t e m e n t s
51 PRINCIPAL ASSOCIATED COMPANIES (CONTINUED)
As at 30 June 2018
Registered/fully paid capital
AttributableinterestΩ
to the Group Principal activities(%)
Incorporated and operate in the PRC
Chongqing Silian Optoelectronics Science And Technology Co., Ltd.
RMB500,000,000 12 Manufacturing and sale of sapphire substrate and wafer, LED packaging and application
Hangzhou Ring Road Expressway Petroleum Development Co., Ltd.
RMB10,000,000 24 Operation of gasoline station
Hubei Suiyuenan Expressway Co., Ltd. RMB1,770,000,000 18 Operation of toll road
Shenzhen City Prince Bay Lewan Properties Co. Ltd.
RMB2,119,052,550 49 Property development
Shenzhen City Prince Bay Shangding Properties Co. Ltd.
RMB2,007,909,020 49 Property development
Shenzhen Tiande Property Development Co. Ltd.
RMB4,400,000,000 30 Property development
Tianjin Five Continents International Container Terminal Co., Ltd.
RMB1,145,000,000 11^ Operation of container terminal
Xiamen Container Terminal Group Co., Ltd.
RMB2,436,604,228 12^ Operation of container terminals
Zhaoqing Yuezhao Expressway Co., Ltd.
RMB818,300,000 15 Operation of toll road
# Represented ordinary share capital, unless otherwise stated
Ω Percentage of equity interest, in the case of equity joint ventures or profit sharing percentage, in the case of co-operative joint ventures
* Voting, non-participating, non-redeemable management shares
** Non-voting, redeemable participating shares
^ The directors of the Company considered the Group has significant influence over these companies through its representatives on the board of directors of each of these companies
^^ The directors of the Company considered the Group has significant influence over these companies through its representative on the investment committee which governs the relevant activities
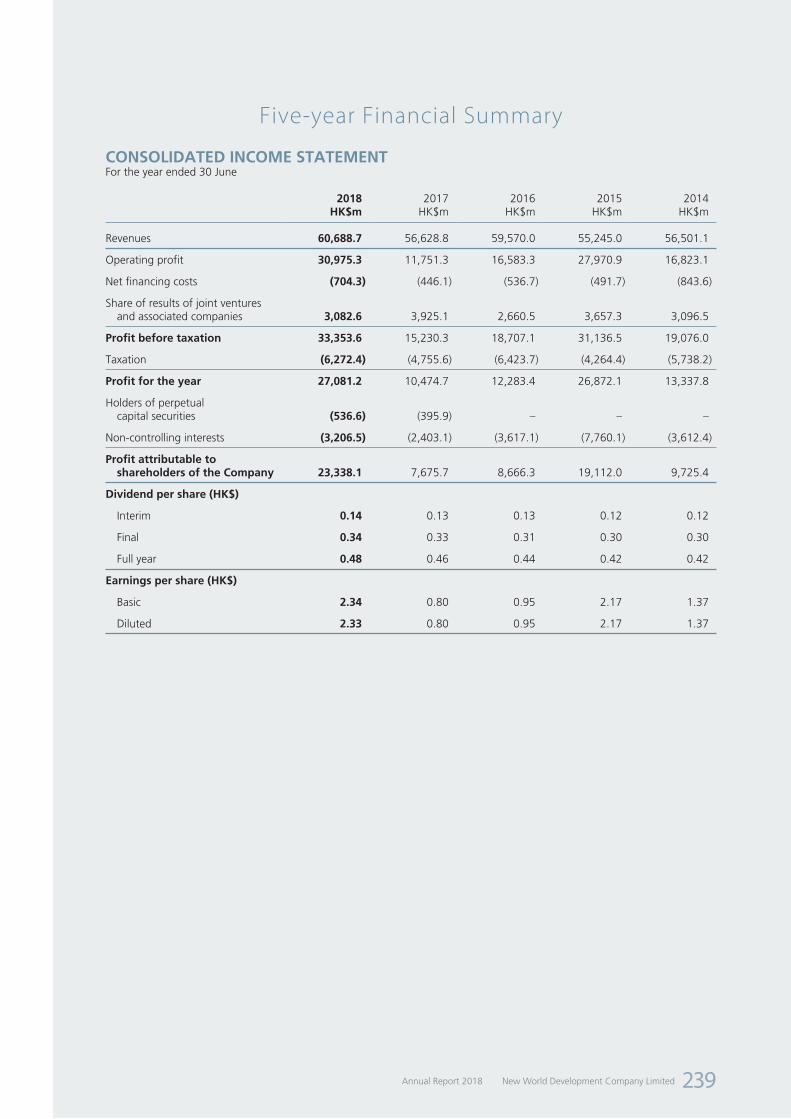
New World Development Company LimitedAnnual Report 2018 239
Five-year Financial Summary
CONSOLIDATED INCOME STATEMENTFor the year ended 30 June
2018 2017 2016 2015 2014HK$m HK$m HK$m HK$m HK$m
Revenues 60,688.7 56,628.8 59,570.0 55,245.0 56,501.1
Operating profit 30,975.3 11,751.3 16,583.3 27,970.9 16,823.1
Net financing costs (704.3) (446.1) (536.7) (491.7) (843.6)
Share of results of joint ventures and associated companies 3,082.6 3,925.1 2,660.5 3,657.3 3,096.5
Profit before taxation 33,353.6 15,230.3 18,707.1 31,136.5 19,076.0
Taxation (6,272.4) (4,755.6) (6,423.7) (4,264.4) (5,738.2)
Profit for the year 27,081.2 10,474.7 12,283.4 26,872.1 13,337.8
Holders of perpetual capital securities (536.6) (395.9) – – –
Non-controlling interests (3,206.5) (2,403.1) (3,617.1) (7,760.1) (3,612.4)
Profit attributable to shareholders of the Company 23,338.1 7,675.7 8,666.3 19,112.0 9,725.4
Dividend per share (HK$)
Interim 0.14 0.13 0.13 0.12 0.12
Final 0.34 0.33 0.31 0.30 0.30
Full year 0.48 0.46 0.44 0.42 0.42
Earnings per share (HK$)
Basic 2.34 0.80 0.95 2.17 1.37
Diluted 2.33 0.80 0.95 2.17 1.37

New World Development Company Limited Annual Report 2018240
F i v e - y e a r F i n a n c i a l S u m m a r y
CONSOLIDATED STATEMENT OF FINANCIAL POSITIONAs at 30 June
2018 2017 2016 2015 2014HK$m HK$m HK$m HK$m HK$m
Assets
Investment properties, property, plant and equipment and land use rights and intangible concession rights 192,135.4 150,125.1 125,308.1 129,250.0 113,634.5
Intangible assets 3,782.0 3,423.8 2,702.3 2,864.1 4,662.5
Interests in joint ventures, associated companies, other investments and other non-current assets 113,482.3 104,526.4 105,160.5 104,068.9 95,739.3
Current assets 172,055.1 178,981.0 158,937.7 161,747.7 155,191.1
Total assets 481,454.8 437,056.3 392,108.6 397,930.7 369,227.4
Equity
Share capital 77,525.9 73,233.6 69,599.8 66,711.6 63,761.3
Reserves 138,724.0 112,857.6 109,973.6 112,207.0 96,047.0
Shareholders’ funds 216,249.9 186,091.2 179,573.4 178,918.6 159,808.3
Perpetual capital securities 9,451.8 9,451.8 – – –
Non-controlling interests 29,480.2 25,401.5 21,321.9 43,439.4 40,468.2
Total equity 255,181.9 220,944.5 200,895.3 222,358.0 200,276.5
Current liabilities 94,689.3 79,500.6 66,522.5 81,003.1 70,070.5
Non-current liabilities 131,583.6 136,611.2 124,690.8 94,569.6 98,880.4
Total equity and liabilities 481,454.8 437,056.3 392,108.6 397,930.7 369,227.4
New World Development Company LimitedAnnual Report 2018 241
Risk Factors
The Group’s businesses, financial condition, results of operations and growth prospects may be affected by risks and uncertainties directly or indirectly pertaining to the Group’s businesses. The risk factors set out below are those that could result in the Group’s businesses, financial conditions, results of operations or growth prospects differing materially from expected or historical results. Such factors are by no means exhaustive or comprehensive, and there may be other risks in addition to those shown below which are not known to the Group or which may not be material now but could turn out to be material in the future.
A RISKS RELATING TO PROPERTY DEVELOPMENT, SALES, INVESTMENTS AND HOTEL OPERATIONS
1 As projects of the Group are primarily located in Hong Kong and Mainland China, the Group’s businesses and prospects are principally dependent on the performance of property market in Hong Kong and Mainland China. The property market in Hong Kong and Mainland China are affected by a number of factors, including changes in social, political, economic and legal environment, as well as changes in the government’s policies and regulations. The Group is also susceptible to changes in consumer confidence, consumption spending, and changes in consumption preferences. Other factors beyond the Group’s control, including personal and family disposable income levels and mortgage market condition etc., may also affect the demand for properties. Any adverse changes, price control on property or rental value and restrictions on the development of property market imposed by the relevant governments in the locations where the Group operates may have material adverse impacts on its businesses, financial condition, results of operations and growth prospects.
2 Under the influence of government policies and present economic trend of Hong Kong, Mainland China and the world, property markets in Hong Kong and Mainland China have witnessed volatility in recent years. In future, any economic downturn or financial turmoil in Hong Kong, Mainland China and the global economies, or the government to implement further property market cooling measures or extend the scope, application and rate level of the existing measures, may have a material adverse impact on the Group’s potential purchasers or tenants, which will in turn lead to a decrease in the general market demand for the Group’s properties and its property price or rental rate.
3 The Group’s results of operations may fluctuate according to the progress of property development and the timing of its property sales. Revenue from sale of properties (including pre-sale) is recognised when or as the control of the asset is transferred to the customer. Revenue from sale of properties is generally recognised upon the legal assignment is completed when the customer has the ability to direct the use of the property. The Group’s revenue and results may vary from one period to another depending on the number of properties completed in a specific period, or the time and capital required for the completion of construction projects. The timing of its property sales is dependent on the lead time required for the Group to obtain the requisite government approvals, which is beyond the control of the Group.
4 The Group is subject to fine or sanctions if it does not pay land premiums or does not develop properties according to terms of land grant documents. If the land is repossessed, the Group will not be able to continue its property development on forfeited land, recover the costs incurred for initial acquisition of the repossessed land nor recover development cost and other costs incurred up to the date of the repossession. Any violation of the terms of land grant contracts may restrict or prevent a developer in participating in future land bidding opportunities.
5 The real estate sector in Hong Kong and Mainland China are regulated by the respective governments. In general, developers must comply with requirements mandated by the applicable laws and regulations, which include policies and procedures established by the local governments for implementation thereof. Developers, in particular, must obtain relevant permits, licenses, certificates and other approvals at various stages of property development. The grant of relevant permits, licenses, certificates and other approvals is dependent on whether certain conditions set by the relevant authorities are fulfilled by the developers or projects as they are often subject to governmental discretions and new laws, regulations, and changes in policies.
6 The Group cannot assure that it will not encounter impediments in fulfilling the conditions or meeting the particular process requirements in order to obtain the required approvals, or will acquire occupation of the land parcels, in relation to its property development project, or can perform its obligations under the land grant contract including the commencement and completion of the development in future. There can be no assurance that the Group’s businesses will be in compliance with new laws, regulations or policies which come into effect from time to time relating to the particular process related to the granting of the approvals or generally applicable to the overall real estate sector. When the Group fails to obtain the relevant approvals, fulfill the conditions or acquire the land parcels, the relevant projects may not proceed as scheduled or at all.
New World Development Company Limited Annual Report 2018242
R i s k F a c t o r s
A RISKS RELATING TO PROPERTY DEVELOPMENT, SALES, INVESTMENTS AND HOTEL OPERATIONS (CONTINUED)
7 For some of the Group’s development sites in Hong Kong, where agricultural land parcels are converted into residential or commercial uses, approvals from various government authorities would be required. The lengthy and complicated approval procedures imply that government policies and efficiency of approval directly affect the addition to land reserve. The Group cannot guarantee that such land use conversion will be approved, or that the Group can precisely grasp the land use and timeframe of such conversion. Meanwhile, the addition to the Group’s land reserve are susceptible to regulatory requirements or restrictions that acquisition of land in Hong Kong, Mainland China and overseas market may subject to, and the demand-supply dynamics together with the price level.
8 A portion of the Group’s revenue is derived from its hotel operations. Since hotel guests are short-term occupants of hotel rooms, they are generally not committed to contracts of medium-term or long-term rental payment. Consequently, a hotel’s occupancy rate and room rate are subject to a high degree of fluctuations due to factors including seasonality, social stability, politics, natural hazards, disease and economic condition as well as the nature of hotel business. In addition, a portion of the Group’s revenue from hotel operations is attributable to catering services, including banqueting services. Typically, demand for banqueting services increases on holidays, festivals and the propitious dates on the Chinese lunar calendar. Although corresponding measures have been taken to cope with the seasonal fluctuations of the hotel business, such measures may be ineffective. Therefore, any comparison of our results of operations between various interims in a financial year may not be meaningful and shall not be relied upon as an indicator for the Group’s performance.
9 The Group’s property value and rental value are affected by numerous factors. Property values and rental levels are impacted by external economic and market conditions including but not limited to the state of local economy, fluctuations in general supply and demand, change in consumption behaviors, stock markets performance, financial volatility, which may indirectly affect the Group’s investment properties performance. The Group’s rental income may experience more frequent adjustments resulting from competition arising from oversupply in retail and office areas. The Group’s investment properties may need to be renovated, repaired and re-let on periodic basis, which may not be possible to renew leases or re-let spaces when existing leases expire. Investment properties are non-current assets, which may limit the ability of the Group to monetise property assets timely.
10 A significant amount of fixed costs are involved in operating investment properties and hotels of the Group, including maintenance costs as well as employees, staff salaries and expenses. These fixed costs may constrain the Group’s ability to respond to adverse market conditions by minimising costs. Where property leasing or hotel industry experiences downturns, or the number of maintenance or renovation increases, such costs may adversely affect the Group’s businesses, financial condition, results of operations and growth prospects.
11 The growth of global online travel or hotel platforms has created opportunities for hotel operators or asset owners in terms of tapping into new clients and promotion in new markets. However, the abovementioned new trends may increase the cost of agency commissions and the rising competition for customer loyalty. Also, it may limit the growth potential of room rate due to keen competition among those platforms, potential risk of last minute order change and high accessibility of information of customers, such situations may adversely affect the Group’s hotel contribution and results of operations.
12 Substantially all of the Group’s business operations are in Mainland China and substantially all of our revenue is derived from its operations in Mainland China. Accordingly, the Group results of operations and prospects are, to a significant degree, subject to economic, political and legal developments in Mainland China. The economy of Mainland China differs from the economies of most developed countries in many respects, including the extent of government involvement, its level of development, its growth rate and its control over foreign exchange. Mainland China’s economy has been transitioning from a planned economy to a more market-oriented economy. In recent years, the Central government has implemented measures emphasising market forces for economic reform, the reduction of State ownership of productive assets and the establishment of sound corporate governance in business enterprises. However, a portion of productive assets in Mainland China is still owned by the Central Government. The Central Government continues to play a significant role in regulating the development of industries. It also exercises significant control over Mainland China’s economic growth through the allocation of resources, controlling payment of foreign currency-denominated obligations, setting monetary policies and providing preferential treatments to particular industries or companies. All of these factors could affect the economic conditions in Mainland China and, in turn, the Group’s business. While the Chinese economy has experienced significant growth in the past 20 years, growth has been uneven across both geographic regions and the various sectors of the economy, growth rates have begun to stabilised recently. The Group cannot predict whether its results of operations and financial condition could be materially and adversely affected by changes in economic conditions in Mainland China, or the monetary policies, interest rate policies, tax regulations or policies and regulations of the Central Government.
New World Development Company LimitedAnnual Report 2018 243
R i s k F a c t o r s
A RISKS RELATING TO PROPERTY DEVELOPMENT, SALES, INVESTMENTS AND HOTEL OPERATIONS (CONTINUED)
13 A significant portion of the Group’s property development operations is concentrated in Guangdong-Hong Kong-Macao Bay Area. The Group expect that Guangdong-Hong Kong-Macao Bay Area will still continue to account for a significant portion of our property development operations in the near future. If the Guangdong-Hong Kong-Macao Bay Area experiences any adverse economic conditions, such as an economic downturn, natural disaster, contagious disease outbreak or terrorist attack, or if the local governmental authorities adopt regulations that place additional restrictions or burdens on the Group or on the property management industry in general, our business, financial condition and results of operations could be materially and adversely affected.
14 The rapid economic growth and infrastructure development in Hong Kong and Mainland China in recent years have uplifted the costs of construction materials and wages of workers. In addition, in view of the improvement of general living standards in Hong Kong and Mainland China and recent policies of the Central Government of Mainland China to increase the wages of workers from rural areas, the Group expects that labour costs may continue to increase in the foreseeable future. Other than the higher labour costs, the rising labour demand and in turn more intensified competition for construction workers in regions where the Group operates, such as the growing shortage of construction and service workers in Hong Kong, has made it increasingly difficult for the Group to hire sufficient well-skilled labour for its property development projects and investment properties, hindering its property development business. Increasing cost of construction materials and labour are expected to raise contractors’ fee quotes in our new property development projects. In addition, the Group usually commences pre-sales of properties prior to their completion. In the event that the construction materials and labour costs surge subsequent to the pre-sales, such increases in costs may not be passed on to buyers of the properties. Escalating labour shortage and/or significant increase in costs of labour or construction materials without corresponding reduction of other costs to offset such increases or pass on such increases to the buyers or tenants of our properties may adversely and materially affect the Group’s businesses, financial condition, results of operations and growth prospects.
B RISK RELATING TO FINANCIAL CONDITIONS AND RESULTS OF OPERATIONS
1 The following factors may lower the level of turnover and profit of the Group, while the Group cannot guarantee that the turnover and profit level will be sustained or improved. The Group may not be able to sustain similar patterns or levels of turnover or profit in the future:
I change in the mix of turnover contributions, such as income from property development, rental income from investment properties and income from hotels;
II new market entrants and intensified price competition among existing market players;
III unfavourable government policies affecting consumer sentiments;
IV failure to achieve target sales volumes and prices;
V failure to achieve target rentals, daily room rates and occupancy rates;
VI decrease in the fair value of investment properties;
VII our costs may not decrease in tandem with a reduction in turnover to be derived from properties, as most of the expenses associated with owning and maintaining the Group’s properties are fairly fixed (including land cost, development cost, administration cost, and selling and distribution marketing cost); and
VIII failure to negotiate volume discounts with suppliers on favourable terms.
2 The Group’s finance costs and interest expenses fluctuate with changes in interest rates. In Hong Kong, the Group’s borrowings include amounts denominated in Hong Kong dollar. The interest rates on some of our outstanding Hong Kong dollar denominated borrowings are benchmarked to the Hong Kong interbank offered rates (“HIBOR”) for Hong Kong dollar. We cannot assure that the benchmark interest rate will not increase in the future, which would increase our financing costs and interest expenses. In Mainland China, the Group’s borrowings also include amounts denominated in RMB. The People’s Bank of China adjusts its benchmark lending rates from time to time in response to domestic and global economic changes. The Group cannot guarantee that the People’s Bank of China will not raise such lending rates in future. In addition, as the Group also borrows from overseas banks and other financial institutions, the availability of sufficient capital in the capital market directly affects the cost of borrowing in relation to the currencies the Group borrows. The Group may also be affected by changes in the prevailing interest rate of the global credit market. Any increase in interest rate in connection with the currencies the Group borrows will increase the Group’s finance costs and customers’ mortgage interest rates and may adversely and materially affect the Group’s businesses, financial condition, results of operations and growth prospects.
New World Development Company Limited Annual Report 2018244
R i s k F a c t o r s
B RISK RELATING TO FINANCIAL CONDITIONS AND RESULTS OF OPERATIONS (CONTINUED)
3 Fluctuations in the Group’s results of operations may also be induced by other factors, including changes in market demand for the Group’s properties. In addition, the periodicity of the property market also has an impact on the optimal timing for land acquisition as well as the planning of development and sales of properties. As results of operations in relation to property development activities are susceptible to significant fluctuations, comparison of the Group’s results of operations and cash flow position among periods may not be an effective indicator of the Group’s financial performance in any particular period.
4 The Group is required to reassess the fair value of its investment properties at every balance sheet date to which financial statements are made up. Pursuant to HKFRS, investment properties are stated at their fair value, and the variation in their changes should be taken to the consolidated income statement of the financial period in which it is incurred. Based on the appraisal conducted by independent property valuers, the Group recognises the aggregate market value of investment properties at fair value and the related deferred tax in the consolidated statement of financial position, while the variation in changes in fair value and the related deferred tax of investment properties are recognised in the consolidated income statement. Therefore, the assumptions made in appraising investment properties would change under changing market conditions, including lower weighted average capital ratio. Notwithstanding any variations in fair value gains and losses are not cash items and will not increase or decrease cash and cash equivalent. The amount of revaluation adjustment has been and will continually be subject to changes in market conditions. As such, there can be no assurance that changes in market conditions will continue to generate gains from fair value changes in investment properties at similar level or at all, or there will be no decline in the fair value of the Group’s investment properties. Changes in fair value of investment properties are recognised in the income statement, any significant change in investment properties value may overwhelmingly affect the Group’s results, which may not be able to reflect the Group’s operation and cash flow performance. If the property market in the region where the Group operates slows down, the fair value of the Group’s investment properties may decline.
5 Properties developed by the Group for sales in Mainland China are subject to Land Appreciation Tax (“LAT”). Pursuant to Mainland China relevant tax laws and regulations, prior to the fulfillment of the conditions on the settlement of LAT, the Group makes provisions for the payable amount of LAT from time to time. Provisions for LAT are made on the Group’s own estimates based on, among other things, the amount of deductible items before taxation which is subject to final confirmation by the relevant tax authorities upon settlement of LAT. At the same time, the Group prepays a portion of such provisions to Mainland China tax authorities according to relevant regulations. The Group cannot assure that the relevant PRC tax authorities will agree with the amount of LAT determined by the Group. If the relevant tax authorities determine that its LAT exceed the LAT prepayments and provisions, and seek to collect that excess amount, the Group’s cash flow, results of operations and financial position may be adversely affected. As there are uncertainties as to whether Mainland China tax authorities will apply the LAT collection retrospectively to properties sold before the enforcement of LAT, any payment as a result of the enforcement of LAT collection may significantly restrict the Group’s cash flow position, its ability to finance its land acquisitions and to execute its business plans.
6 The results of the Group are presented in Hong Kong dollar, but its various subsidiaries, associated companies and joint ventures may receive turnover and incur expenses in other currencies. Any currency fluctuations on translation of the accounts of these subsidiaries, joint ventures and associated companies and also on the repatriation of earnings, equity investments and loans may therefore impact the Group’s businesses. Exchange rate of Hong Kong dollar against RMB, the USD or other foreign currencies is affected by, among other things, changes in the political and economic environment of the issuing jurisdictions of the currencies. The exchange rate of RMB against Hong Kong dollar, the USD or other currencies may be re-valued, and may be permitted to enter a full or limited free float. Such situation may result in appreciation or depreciation in RMB against Hong Kong dollar, the USD or other foreign currencies. Continual fluctuations in the exchange rate of the Hong Kong dollar against RMB or other currencies may materially and adversely affect the Group’s businesses, financial condition, results of operations and growth prospects.
New World Development Company LimitedAnnual Report 2018 245
R i s k F a c t o r s
B RISK RELATING TO FINANCIAL CONDITIONS AND RESULTS OF OPERATIONS (CONTINUED)
7 In April 2013, State Administration of Foreign Exchange (“SAFE”) issued the Operation Guidelines for the Administration of Foreign Debt (the “Guidelines”), which became effective on 13 May 2013. The Guidelines stipulate that, amongst other things, (i) with respect to real estate enterprises with foreign investment who obtained approval certificates from commercial authorities and registered with the Ministry of Commerce on or after 1 June 2007, the branches of SAFE will no longer process the foreign debt registrations for such enterprises, (ii) with respect to real estate enterprises with foreign investment established prior to 1 June 2007, such enterprises may borrow foreign debt in accordance with the relevant provisions in the Guidelines, but the amount of foreign debt shall not exceed the surplus between the enterprise’s total investment amount and its registered capital (the “Surplus”); in the event that the enterprise increases its registered capital, and the Surplus after the increase of registered capital is less than the Surplus before the increase of registered capital, then the amount of foreign debt of such enterprise shall not exceed the Surplus after the increase of registered capital, and (iii) in the event that the registered capital of a real estate enterprise with foreign investment is not paid in full, or such real estate enterprise with foreign investment does not obtain State-owned land use right certificate(s), or the capital for real estate projects to be developed is less than 35% of the total investment amount of such projects, such real estate enterprise with foreign investment is prohibited from borrowing foreign debt, and the branches of SAFE will not process the foreign debt registrations for such enterprises. The Guidelines therefore restrict the ability of the Group subsidiaries in Mainland China that are real estate enterprises with foreign investment to raise funds offshore for the purpose of injecting such funds into the enterprises by way of shareholder loans. The Group cannot assure that the Central Government will not issue any new policy that will further restrict the ability of the Group in allocating its funds in Mainland China.
8 The Group maintains a certain level of indebtedness to finance its operation. The Group’s indebtedness could have an adverse effect on it, for example, by:
I requiring the Group to maintain certain financial ratios;
II requiring the Group to dedicate a large portion of its cash flow to repay interest and debt, thereby reducing the availability of its cash flow to expand its business;
III increasing the Group’s vulnerability to adverse economic or industry conditions;
IV limiting the Group’s flexibility in planning or responding to the changes in its business or the industry in which it operates;
V limiting the Group’s ability to raise additional debt or equity capital in the future or increasing the cost of such funding;
VI restricting the Group from making strategic acquisitions or taking advantage of business opportunities;
VII increasing the difficulty of the Group to meet its obligations in relation to its debt; and
VIII increasing the cost of borrowings of the Group.
9 The Group is principally engaged in property development business. As such business operation requires substantial capital input, the Group will still need to obtain financing from financial institutions. When the credit market contracts or tightens, the Group cannot assure that there will be sufficient borrowings or that it can refinance. During property development and property construction period, the risks that the Group faces also include financing for developments may not be available on favorable terms and long-term financing may not be available. Its business development will be adversely affected to a certain extent.
10 In the future, the Group may from time to time incur other substantial indebtedness, intensifying the risks induced by its indebtedness. The Group’s ability to generate sufficient cash to satisfy its outstanding and future debt obligations will depend on the Group’s operating performance in future, which will be affected by, among other things, the prevailing economic conditions, governmental regulations, the demand for properties in the region where the Group’s business operates and other factors, many of which are beyond the Group’s control. The Group may not generate sufficient cash flow to pay its anticipated operating expenses and to service its debts. In this case, the Group will have to adopt an alternative strategy that may include actions such as reducing or delaying capital expenditures, disposing of the Group’s assets, restructuring or refinancing, or seeking equity capital. These strategies may not be implemented on satisfactory terms, or at all. Even they are implemented, they may result in an adverse effect on the Group’s businesses, financial conditions and results of operations. In addition, if the Group fails to fulfill its payment obligations, comply with any actual covenants or required financial ratios, or breach any restrictive covenants, it may result in a default under the terms of such borrowing. If an event of default occurs, the loan borrower is entitled to request the Group to repay in full or part of its outstanding indebtedness on an accelerated basis.
New World Development Company Limited Annual Report 2018246
R i s k F a c t o r s
B RISK RELATING TO FINANCIAL CONDITIONS AND RESULTS OF OPERATIONS (CONTINUED)
11 The Hong Kong Institute of Certified Public Accountants (“HKICPA”) has issued new standards, amendments to standards and interpretations which are mandatory for accounting periods beginning on or after 1 July 2018 or later periods, including HKFRS 9 “Financial Instruments” and HKFRS 16 “Leases”. Under HKFRS 9, certain financial assets of the Group that are currently classified as available-for-sale equity securities will be classified and measured as fair value through other comprehensive income and fair value through profit or loss. Depending on the classification of and timing of disposal of the investments, there may be impact on the profit or loss of the Group. The Group will need to recognise part of the fair value change of financial liabilities that is due to changes in its own credit risk in consolidated statement of comprehensive income rather than consolidated income statement. A new expected credit loss (“ECL”) impairment model has been introduced which involves a three-stage approach whereby financial assets move through the three stages as their credit quality changes. The Group expects to apply the simplified approach to recognise lifetime ECL for its trade debtors and contract assets and considers the remaining financial assets have low credit risk and hence expects to recognise 12-month ECL. Under HKFRS 16, it provides a new provision for the accounting treatment of leases when the Group is the lessee, almost all leases should be recognised in the form of an asset (for the right-of-use) and a financial liability (for the payment obligation). As for the financial performance impact in the consolidated income statement, straight-line depreciation expense on the right-of-use asset and the interest expenses on the financial liability are recognised and no rental expenses will be recognised. The combination of a straight-line depreciation of the right-of-use asset and the effective interest rate method applied to the financial liability will result in a higher total charge to consolidated income statements in the initial years of the lease, and decreasing expenses during the latter part of the lease term.
C OTHER RISKS
1 An outbreak of any epidemics in the region where the Group operates may result in material disruptions in the Group’s and its tenants’ businesses. Natural disasters or other catastrophic events, such as earthquake, flood or severe weather conditions, could, depending on its magnitude, significantly disrupt the Group’s business operations or result in significant economic downturn in the affected regions. The Group cannot assure that there will be no occurrence of earthquakes or other natural hazards in the area where it operates, which may result in severe destruction of the Group’s property development projects, assets, cash flow from infrastructure and facilities.
2 The Group is subject to extensive and increasingly stringent environmental protection laws, regulations and decrees that impose fine for violation of such laws, regulations or decrees and provide for the shutdown by the government authorities of any construction sites not in compliance with government orders requiring the cessation or cure of certain activities causing environmental damage. In addition, there is a growing global awareness of environmental issues and the Group may sometimes be expected to meet a standard which is more stringent than the requirement of the prevailing environmental laws and regulations and may cause negative impacts on the costs and operations of its projects. The Group has adopted various environmental protection measures, including conducting environmental assessment on the Group’s property construction project and hiring contractors with good environmental protection and safety track records, and required them to comply with the relevant regulations or laws on environmental protection and safety, whereas such measure may be ineffective. In addition, the Group cannot assure that more stringent environmental projection regulations will not be imposed in the future. If the Group fails to comply with the prevailing environmental laws or regulations, or fails to meet public expectations in relation to environmental matters, the Group’s reputation may be damaged or may be required to pay fines or take remedial actions, in which case suspension of operation may be required in the Group’s subsidiaries.
3 The Group considers the intellectual property rights as crucial business assets, key to customer loyalty and essential to the Group’s future growth. The success of the Group’s business depends substantially upon the continued ability to use its brand, trade names and trademarks to increase brand recognition and to further develop its brand. The unauthorized reproduction of the Group trade names or trademarks could diminish the value of the Group brand and our market reputation and competitive advantages. The Group relies on a combination of trademarks, trade secrets, confidentiality procedures and contractual provisions to protect our intellectual property rights. Nevertheless, these afford limited protection and preventing unauthorized use of proprietary information can be difficult and expensive. In addition, enforceability, scope and validity of laws governing intellectual property rights in Mainland China are uncertain and still evolving, and could involve substantial risk to us. If the Group were unable to detect unauthorized use of, or take appropriate steps to enforce, our intellectual property rights, it could have a material adverse effect on its business, financial condition and results of operations.

New World Development Company LimitedAnnual Report 2018 247
R i s k F a c t o r s
C OTHER RISKS (CONTINUED)
4 The development of, and future trends in Hong Kong and Mainland China property industries have been the focus of numerous media reports. As a leading property developer in Hong Kong and Mainland China, information about the Group or its projects appears frequently in various media outlets. Some of these media reports contain inaccurate information about the projects of the Group and the Group. There can be no assurance that there will not be false, inaccurate or adverse media reports about the Group or its projects in the future. In particular, the Group may be required to respond or take defensive and remedial actions with regard to such inaccurate or adverse media reports, which may adversely divert its resources and management’s attention and may materially and adversely impact its business operations. Moreover, there can be no assurance as to the appropriateness, accuracy, completeness or reliability of any media reports regarding the Group. The Group disclaims any media reports containing information that is inconsistent or conflicts with the information contained in its annual report and circulars. Investors should not rely on such information in making a decision as to invest in the Group’s shares and/or its listed securities, and should rely only on the official public information from the Group included in its annual report and corporate announcement.
5 The Group has insurance in place in relation to its various development projects, including third-party and earthquake insurances. In general, such insurances do not cover wars, riots, terrorism and natural disaster, any of which case would result in an unpredictable amount of losses and have negative impacts on the Group’s businesses and cash flow to a certain extent. Properties could suffer from physical damage by fire or other causes, the Group may be exposed to potential risks associated with public liability claims, resulting in losses which may not be fully compensated for by insurance proceeds, in turn affecting the Group’s financial condition.
6 Certain businesses of the Group are operated under concession rights, including the Hong Kong Convention and Exhibition Centre, public bus services, public ferry services, operations of duty-free shops and toll roads etc. The Group cannot assure that such concession rights can be renewed upon their expiry, and the conditions could be worse off than the existing ones even if renewals are approved.
7 Notwithstanding the appropriate measures adopted to protect the Group’s computer system and information, the Group cannot assure that there will be no occurrence of unlawful break-ins or misuse with rapid technological advancement, which may affect its businesses to a certain extent.
8 The International Accounting Standards Board has from time to time issued new and revised International Financial Reporting Standards (“IFRS”). As accounting standards continue to develop, the International Accounting Standards Board may in the future issue more new and revised IFRS and the Group may be required to adopt new accounting policies which might or could have a significant impact on the Group’s businesses, financial condition, results of operations or growth prospects.
9 To balance and minimise risks associated with cyclical nature of property development or generally, the Group is committed to enhancing its business portfolio and initialising its innovative strategies, but no assurance that all stakeholders would favour the Group’s strategies and new ventures that may be made by the Group.
10 Image of the Group may be affected by possible oppositions or protests during property development, delayed handover of residential units and quality issues.
11 The Group observes a number of other environmental, social and governance (“ESG”) related risks which could have a material impact on the Group’s ability to achieve its objectives and goals, including:
• Quality issues in products and services, as well as business and financial failures of key suppliers, contractors and customers
• Environmental and waste management issues, pollution, climate change impacts and disruptions to the Group’s assets and operations
• Bribery, corruption, fraud, extortion and money laundering
• Significant leakage of sensitive and confidential information
• Health and safety (such as safety incidents of both employees and supply chain partners)

New World Development Company Limited Annual Report 2018248
R i s k F a c t o r s
D MAJOR RISK FACTOR ON SUBSIDIARIES
New World China Land Limited (“NWCL”)1 NWCL’s property development business is highly susceptible to the prevailing condition and performance of Mainland
China property market which is heavily regulated by the Central and Local Governments. In response to the domestic and international market volatility, the Central Government will, from time to time adjust its monetary and economic policies to monitoring the rate of growth of Chinese economy and economies of local areas within Mainland China. Such policies and regulations would have significant impact on Mainland China property market where NWCL operates.
2 Economic conditions in Mainland China are sensitive to global economic conditions, and it is impossible to predict how Chinese economy will develop in the future and whether it might slow down due to the global crisis or experience a financial crisis in a manner and scale similar to that in the United States and the European countries. As the real estate industry is sensitive to macroeconomic trends, real estate prices tend to fluctuate along with the change of macroeconomic conditions. Furthermore, the recent breakout of U.S.-China trade war would inevitably slow down the economic growth of Mainland China. There are still many uncertainties and the magnitude of impact is unpredictable. The escalation of trade war may further increase the volatility of real estate prices.
3 These and other issues resulting from the global economic slowdown and financial market turmoil have adversely affected, and may continue adversely affecting, the Mainland China market and consumption capacity in this market, which may lead to a decline in the general demand for NWCL’s products and erosion of their sale prices. In addition, any further tightening of liquidity in the global financial markets and in Mainland China may negatively affect the liquidity of NWCL. Therefore, if the global economic slowdown and turmoil in the financial markets crisis continue, the business, financial condition and results of operations of NWCL may be adversely affected.
4 NWCL’s property development operations face competition from both international and local property developers with respect to factors such as location, facilities and supporting infrastructure, services and pricing. NWCL competes with both local and international companies in capturing new business opportunities in Mainland China. In addition, some local companies have extensive local knowledge and business relationships and/or a longer operational track record in the relevant local markets than NWCL while international companies are able to capitalise on their overseas experience to compete in Mainland China market. Intensified competition between property developers may result in increased costs for land acquisition and an oversupply of properties, both of which may adversely affect NWCL’s business and financial conditions.
5 Property development companies in Mainland China, including Mainland China subsidiaries of NWCL, are subject to extensive governmental regulation in most aspects of their operations, including those relating to the acquisition of land use rights, resettlement and clearance of land, the approval of property development proposals and pre-sales. There can be no assurance that these regulations will not change in the future in a manner which could adversely affect NWCL’s business or results of operations. In addition, the Central Government is presently strengthening its regulation and control of the development of properties. While enforcement of these and other regulations are beneficial to the entire property development industry, it is possible that certain individual regulations could adversely affect property development companies, including NWCL. As regulations continue to develop, prevailing industry practices may not comply with such regulations.
6 The Central Government has in the past imposed restrictions on foreign investments in the property sector to curtail the overheating of the property sector by, among other things, increasing the capital and other requirements for establishing foreign-invested real estate enterprises, tightening foreign exchange control and imposing restrictions on purchases of properties in China by foreign persons. Such restriction may affect NWCL’s ability to make further investments in NWCL’s subsidiaries in Mainland China and as a result may limit its business growth and have a material adverse effect on its business, financial condition and results of operations.
7 The fiscal and other measures adopted by the Central Government from time to time may limit NWCL’s flexibility and ability to use bank loans to finance its property developments and therefore may require NWCL to maintain a relatively high level of internally-sourced cash. In recent years, the Central Government has tightened the requirements in relation to grant of state-owned land use rights by way of tender, auction and listing for sale and raised the minimum down payment of land premium several times up to 70% of the benchmark price of the locality where the parcel of land is granted, and the bidding deposit at not less than 20% of the minimum land premium. Additionally, a land grant contract is required to be entered into within 10 working days after a land grant deal is closed, and the down payment of 50% of the land premium is to be paid within one month of the signing of the land grant contract, with the remaining to be paid in full within one year of the date of the land grant contract in accordance with provisions of such land grant contract, subject to limited exceptions. Such change of policy may constrain NWCL’s cash otherwise available for additional land acquisitions and construction works.
New World Development Company LimitedAnnual Report 2018 249
R i s k F a c t o r s
D MAJOR RISK FACTOR ON SUBSIDIARIES (CONTINUED)
New World China Land Limited (“NWCL”) (continued)8 Under Mainland China tax laws and regulations, NWCL’s properties developed for sale are subject to LAT, which is
collectible by the local tax authorities. All income from the sale or transfer of state-owned land use rights, buildings and their ancillary facilities in Mainland China is subject to LAT at progressive rates ranging from 30% to 60% of the appreciation value as defined by the relevant tax laws, with certain exemptions available for the sale of eligible ordinary residential properties if the appreciation does not exceed 20% of the total amount of deductible items as defined in the relevant tax laws. NWCL shall prepay LAT as required by Mainland China local tax authorities if the income is derived from the transfer of properties before the settlement of LAT upon completion of the development project, or the conditions on the settlement of LAT for the development project are not fulfilled.
9 Effective from 1 May 2016, the Central Government rolled out the pilot program for the nationwide replacement of the business tax with the value-added tax (“VAT”) (the “Replacement”), covering the sectors of construction, real estate, financial services and consumer services. 11% VAT rate is applied to the leasing services of real estate, sales of real estate and transfer of land use rights. Pursuant to the relevant provisions of VAT, the applicable VAT rate for eligible taxpayers shall be 5%. Upon the Replacement, the cash flow, expenses and income of NWCL may be affected.
10 A significant portion of NWCL’s operation is in Mainland China and majority of NWCL’s income and expenditures are transacted in RMB. RMB is not freely convertible. The Central Government regulates the conversion between RMB and foreign currencies, and there is significant restriction on the remittance of RMB into and outside Mainland China. The value of RMB is subject to changes in the Central Government policies and to international economic and political developments. Therefore there is no assurance that the exchange rate of RMB will remain stable against foreign currencies in the market and fluctuations in exchange rates may adversely affect the value, translated into Hong Kong dollar, of NWCL’s net assets, earnings and any declared dividends.
11 In recent years, the Central Government has promulgated administrative measures to gradually liberalise the control over cross-border remittance of RMB where payment of current account items, including profit distributions, interest payments and expenditure from trade may be made in foreign currencies without prior approval, but subject to certain procedural requirements. However strict foreign exchange controls continue to implement in respect of capital account transactions including repayment of loan principal and return on direct capital investments and investments in negotiable securities. Such exchange controls may impact the distribution plans of NWCL’s subsidiaries in Mainland China to the Group.
12 NWCL’s property development business requires substantial capital investment. NWCL will require additional financing to fund working capital and capital expenditure, to support the future growth of its business and/or to refinance existing debts obligations. NWCL’s ability to arrange for external financing and the cost of such financing are dependent on numerous factors, including general economic and capital market conditions, interest rates, credit availability from banks or other lenders, investor confidence in NWCL, success of its businesses, provisions of tax and securities laws that may be applicable to NWCL’s efforts to raise capital and political and economic conditions in Mainland China. In addition, a substantial portion of NWCL’s borrowings are linked to benchmark lending rates published by the People Bank of China. The People Bank of China has adjusted the benchmark one-year lending rate a number of times in the past in response to the changing Mainland China and global financial and economic conditions. As such, NWCL is exposed to foreign currency exchange risk, interest rate risk, credit risk and liquidity risk.
13 The rapid economic growth and infrastructure development in Mainland China in recent years have uplifted the costs of construction materials and wages of workers. In addition, in view of the improvement of general living standards in Mainland China and policies of the Central Government to increase the wages of workers from rural areas, NWCL expects that labour costs may continue to increase in the foreseeable future. Increasing cost of construction materials and labour are expected to raise contractors’ fee quotes in our new property development projects. In addition, NWCL usually commences pre-sales of properties prior to their completion. In the event that the construction materials and labour costs surge subsequent to the pre-sales, such increases in costs may not be passed on to buyers of the properties. Escalating labour shortage and/or significant increase in costs of labour or construction materials without corresponding reduction of other costs to offset such increases or pass on such increases to the buyers or tenants of NWCL’s properties may adversely and materially affect NWCL’s businesses, financial condition, results of operations and growth prospects.

New World Development Company Limited Annual Report 2018250
R i s k F a c t o r s
D MAJOR RISK FACTOR ON SUBSIDIARIES (CONTINUED)
New World Department Store China Limited (“NWDS”)1 According to information published by the National Bureau of Statistics of China, the gross domestic product of
Mainland China grew 6.9% year-on-year to RMB82.7122 trillion in 2017; the expansion was 0.2 percentage points higher than that of 2016. As the first time since 2010 that registered expedited economic growth, the number indicates that the Chinese economy is somehow stabilizing. However, the situation of the domestic retail market has remained severe for a few reasons: the Mainland China retail market is relatively mature; the U.S.-China trade war has begun; and the retail environment of the society is at its low ebb at present.
2 As consumption upgrade in Mainland China continues in 2018, consumer demands will become even more sophisticated and fragmented. The generation born after the 1980s and the 1990s gradually becomes the main force behind consumption upgrade. Characterized by their pursuits for stylishness, personality and material enjoyment, this demographic tends to overspend. Their consumption demand is manifested in an emphasis on personality and a focus on experience. Alongside the additional growth in consumption on branded fashion, cosmetics, sports and entertainment products, the market will also maintain rapid growth in service consumption related to culture, entertainment and health. The spending structure on goods is shifting towards enjoyment. As such, the ever-sophisticating consumption market is on one hand creating challenges for business development, operation and innovation of retailers, and on the other, prompting retailers to invest more to meet the demand for customer experience. Through active strategy adjustment, the consumption trend of constant demand for novelty and emphases on experiences and digitization can be addressed.
At the same time, fragmented consumption is emerging in the consumption patterns of many young people. With the widespread of the mobile internet and the integration of online and offline consumption, fragmented consumption and refined markets are becoming more and more popular. The nature of fragmented consumption ambiance is to enable consumption anywhere, any time – from crafting the consumption ambiance, stimulating the desire to spend to closing with payment, the entire consumption cycle is now more seamless and convenient than ever. Fragmented consumption can be seen as yet another layer of the consumption market. This emerging business model can refine the market, which matches consumers’ requirement in fragmented consumption. In future, this new type of consumption habit will become an important segment in the entertainment and recreation categories of the business sector, as well as that of the consumption market at large.
3 New supply for the overall retail property market in Mainland China is expected to further increase alongside more intensified homogenized competition. The total supply of retail properties in 17 major cities in Mainland China is expected to see the entrance of 7.9 million sq m of new projects in 2018. Amongst these new comers, some 900 shopping malls are expected to enter the market in 2018. According to the forecast of market research, the overall growth of shopping malls is demonstrating year-on-year expansion. First-tier cities such as Beijing, Shanghai, Guangzhou and Shenzhen, have maintained their advantageous positions. However, as the development of core commercial precincts reaches its full capacity, it is only an irresistible trend for shopping malls to descend to second- and third-tier cities.
Meanwhile, the momentum to expand has been prominent in the Mainland China retail industry in recent years, resulting in oversupply of retail space in certain commercial precincts. With the pressure of closures and openings running side by side, the overall vacancy rate of shopping malls in Beijing, Shanghai, Guangzhou and Shenzhen is trending up and the room for sustaining survival is becoming smaller. The gap in operation performance of shopping malls in core and non-core business districts is gradually widening. As observed from the vacancy rate of shopping malls in first- and second-tier cities, the total number of shopping malls are approaching their full take-up capacity and the speed of their development has far exceeded the actual spending levels. From this, vicious competition caused by oversupply, homogenization of shopping malls, and unfavorable competition in leasing offers are also curtailing the room for survival for the department store sector.
The influx of shopping malls in the market has overloaded the expansion capacity of brand owners, intensifying the competition amongst retailers and increasing the difficulty for business development. In addition, brand owners prefer shopping malls to traditional department stores. As such, brand introduction is becoming increasingly difficult for department stores.
4 As economy development in Mainland China enters a new era, there are now more restrictions on the resource environment, and the demographic dividend of China has vanished. The “high cost era” has stealthily arrived. Costs on land, raw materials, labour, talents, energy, environmental conservation, capital, logistics, intellectual property and transactions are all on the rise. With cost increase across the board, companies are left with eroded room for profit, which would in turn limit industrial growth and pose challenges to many industries and companies.

New World Development Company LimitedAnnual Report 2018 251
R i s k F a c t o r s
D MAJOR RISK FACTOR ON SUBSIDIARIES (CONTINUED)
New World Department Store China Limited (“NWDS”) (continued)5 Bringing more state-of-the-art technologies and substantial capital with them, online retailers are quickly eroding
the turf of offline retail and attempting to identify new volume addition by setting up offline retail. They are also leveraging on the consumption data accumulated online and technology to empower physical retail. For example, Alibaba and Suning are not only holding shares of each other but also investing in physical businesses such as Intime and Bailian; after forming a strategic alliance, Tencent and JD.com are both investing in traditional brick-and-mortar retailers such as Wanda and Yonghui Superstores. E-commerce giants are actively seizing the offline retail market by integrating online and offline channels. These include the Hema Fresh Supermarket of Alibaba, Yonghui Super Species, as well as unmanned shelves and unmanned convenience stores such as Xingbianli and Bingobox, etc. As the new outlets of the retail industry, these new species are mushrooming and more varied shopping ambiances are created, bringing consumers more diversified consumption experiences. All these are gradually overthrowing traditional retail categories. Traditional department stores should respond to these changes and actively seek transformation to keep abreast of new consumption trends and customer demands.
6 The traditional retail sector is now transforming towards the smart and technology-oriented direction. In future, the retail sector must innovate in technology and reform to become smart shopping malls. Technological innovation will definitely become a main driving force for transformation in the advancement of the retail sector. There are two aspects in the innovative technologies of the retail industry. The first one is about convenient services, i.e. technology that can improve the customer’s experience, such as mobile payment, smart parking, online ordering, smart fitting, etc. These technologies are integral to the industry and their lacking or lagging would affect the consumer’s experience. The second type of technologies improves a company’s operational efficiency and facilitates supply chain upgrade and refined management. Mobile office, digitization, big data AI and other technologies are examples of this type. Without these, companies can hardly adapt to the competition under the new circumstances.
NWS Holdings Limited (“NWSH”)1 Global economy – NWSH is exposed to the development of the global economy as well as the industries and
geographical markets in which it operates. As a result, NWSH’s financial condition and results of operations may be influenced by the general state of the global economy or the general state of a specific market or economy. Any significant decrease in the level of economic growth in the global or regional or a specific economy and any form of protectionism such as trade war could adversely affect NWSH’s financial condition or results of operations.
2 Currency fluctuations – The results of NWSH are presented in Hong Kong dollar, but its various subsidiaries, associated companies and joint ventures may receive revenue and incur expenses in other currencies such as RMB, the major currency denominated in the infrastructure projects in Mainland China. Any currency fluctuations on translation of the accounts of these subsidiaries, associated companies and joint ventures and also on the repatriation of earnings, equity investments and loans may have an impact on NWSH’s financial condition and results of operations.
3 Interest rate fluctuations – NWSH’s finance costs and interest expenses fluctuate with changes in interest rates. NWSH is exposed to interest rate risk through the impact of rate changes on interest bearing assets and liabilities. NWSH may be affected by changes in the prevailing interest rate of the global credit market. Any increase in interest rate in connection with the currencies NWSH borrows will increase NWSH’s finance costs and may adversely affect NWSH’s businesses, financial condition, results of operations and growth prospects.
4 Impact on changes of government policies and legislation, concession, franchise and license terms – NWSH operates and manages certain concession and franchise businesses such as roads, environmental projects, public transport and facilities management. There can be no assurance that these concessions, franchises and license agreements can be renewed or, if renewed, that the terms of such concessions, franchises and license agreements will not be less favourable than those currently obtained by NWSH. Also, any changes in government policies and legislations such as tax regulations and concession requirements, and the implementation of new schemes such as Municipal Solid Waste Charging Scheme may affect NWSH’s financial condition and results of operations.
5 Social and political unrest, terrorist attack, natural disasters and cyber security – Social and political unrest, and terrorist attacks occurred in many places around the world in recent years. There is no assurance that there will not be social and political unrest, or terrorist attack in places where NWSH operates, and if these events take place, they may have a negative impact on NWSH’s financial condition and results of operations. Natural disasters and extreme weather events caused by global climate change are not uncommon. The occurrence of these events may disrupt NWSH’s business and adversely affect NWSH’s financial condition and results of operations.
With the advent of information technology and its increased application, the frequency and intensity of cyber-attacks are on the rise. NWSH’s critical information assets are exposed to risk of damage or unauthorized access in the digital world. Any system breakdown or breach in security may have adverse impact on the integrity, accuracy and confidentiality of NWSH’s data and information.

New World Development Company Limited Annual Report 2018252
R i s k F a c t o r s
D MAJOR RISK FACTOR ON SUBSIDIARIES (CONTINUED)
NWS Holdings Limited (“NWSH”) (continued)6 Tariff and service fee determination – Tariffs and fees charged by NWSH for its toll roads, environmental projects
and rail container terminal network are set by the various government authorities. Factors that these government authorities take into account when considering rate changes may include construction costs, prospective recovery periods of investment, loan repayment terms, inflation rates, operating and maintenance costs, affordability and usage. Reductions in or cessation of tariffs and fees charged by NWSH’s projects may adversely affect NWSH’s operating results.
A Infrastructure Division1 Roads – NWSH invests in and operates a wide range of roads and related projects in Mainland China. Revenue
from NWSH’s toll roads is principally dependent upon the number and types of vehicles using such roads and their applicable toll regimes. Traffic volume is directly and indirectly affected by a number of factors, such as the availability, quality, proximity and toll rate differentials of alternative roads, competition from new roads and other means of transport, fall-behind-schedule development in the peripheral areas such as the opening of connecting interchanges, fuel prices and suspension of operation due to material accidents. NWSH’s operating results may also be affected by capital expenditure requirements for ongoing repair, maintenance, renewal and expansion of the toll roads.
2 Environment – NWSH engages in environmental business in Greater China by providing water and wastewater treatment, waste treatment, renewable resource recycling and utilisation, environmental remediation as well as related design, engineering and procurement services. These projects are subject to extensive and stringent environmental protection laws and regulations, violations of which may result in fines and penalties such as suspension of operation. NWSH’s reputation may be damaged if it fails to meet public expectations for water safety and compliance with environmental legislations.
The operation of NWSH’s power plants in Mainland China may be adversely affected by many factors, such as reduced demand in electricity, changes in fuel prices, supply and quality, downtimes caused by system upgrades and overhaul works and the impact of on-grid renewable energy.
3 Logistics – NWSH engages in the operation of a logistics centre, container terminal ports and a pivotal rail container terminal network. The operation of these logistics facilities in Mainland China and Hong Kong may be adversely affected by many factors, such as the breakdown of shore cranes and other machinery, inclement weather, the lack of adjoining land for expansion and the general downturn of the logistics sector. In addition, these facilities outsource various internal operations and trucking services to contractors. The failure or inefficient operations of such contractors, labour shortages and labour disputes could disrupt operation. The performance of the outsourced contractors is closely monitored to ensure their service quality. Cargo handling charges, service fees and rental incomes received by the logistics centre and facilities may be adversely affected by many factors, such as increase in warehouse supply, availability of alternative facilities, slowdown in the domestic and international trade and changes in government policies.
Similarly, container terminals’ charges, tariffs and throughputs are affected by many competitive and trade factors including rate competitiveness, service levels, availability of competing terminals and trade trends. Container terminals tariffs are subject to government authorities' antitrust investigation which may cause tariff adjustments.
4 Aviation – NWSH’s commercial aircraft leasing business has seen increasing competition in the sale and lease back market of commercial aircraft which has consequently reduced profit margins for leasing companies, leading to higher aircraft purchase values, and therefore higher exposure for leasing companies. The business model relies on the airline customers to honour their payments and other obligations under their existing or future leases. The business may be adversely affected by factors such as disruptions in the aviation industry, global economic downturn, fluctuation of financial market and oil prices, as well as geopolitical uncertainties. The aircraft asset value may be affected by various factors such as market demand fluctuations and changes in technology.

New World Development Company LimitedAnnual Report 2018 253
R i s k F a c t o r s
D MAJOR RISK FACTOR ON SUBSIDIARIES (CONTINUED)
B Services Division1 Facilities Management – NWSH’s facilities management of Hong Kong Convention and Exhibition Centre
may be adversely affected by factors such as space constraints, fierce competition from other exhibition venues in Hong Kong, Shanghai, Shenzhen and other major Asian cities, continuous increase in operating costs, inadequate supply of skilled service staff and the changing needs for trade shows and exhibitions. NWSH continues to explore new exhibition themes and attract international exhibitions and conferences to Hong Kong during off peak seasons.
NWSH’s duty free business may be adversely affected by changes in government policies relating to domestic and cross-border duties on liquor and tobacco. Revenue of NWSH’s duty free business is dependent upon the volume and spending power of cross border tourists and travellers, any significant changes in travel policies may affect the footfall in the retail outlets and cause fluctuations in NWSH’s revenue.
NWSH’s healthcare business, especially the Gleneagles Hong Kong Hospital (“GHK”), is subject to extensive government regulations and media and public scrutiny. Any failure to comply with laws and regulations and safety/care requirements could adversely affect NWSH’s business and results, and tarnish NWSH’s corporate image. Additionally, doctors and other medical professionals, together with NWSH, could become the subject of claims, complaints and regulatory investigations arising from service failures or medical disputes.
2 Construction & Transport – NWSH’s government projects are affected by government investment plans and its ability to secure funding approvals from the legislature. Its private sector projects may be adversely affected by the downturn and slowdown in any of the industries served by NWSH’s construction business, leading to a decrease in potential construction projects as well as project delays or cancellations. The general economic environment such as mortgage and interest rates, inflations, demographic trends, rivalry among competitors and subcontractors, supply of skilled labour and material prices may also influence the performance and growth of NWSH’s construction business. The recent concern of the public about the quality of certain infrastructure projects carried out by other contractors may cause negative impacts on the construction industry as a whole, possibly resulting in higher cost and slower progress. With the increasing concern over the number of fatal accidents and the accident rate of the construction industry, the Labour Department is actively reviewing the penalty levels of occupation safety and health legislation with a view to strengthening its deterrent effect, including studying whether it is appropriate to increase the maximum fines by pegging them to the financial means of those convicted.
NWSH’s transport business could be affected by fluctuations in fuel costs, elasticity of fares, competition from other means of transport, labour shortages, strikes and collective actions of labour unions and serious traffic accidents. Given Hong Kong’s heavy reliance on public transport, any fare increase proposals to offset rising overheads and costs would invariably attract strong public objections and negative publicity.
3 Strategic Investments – NWSH invests in the stock and capital markets through investments in shares, private equities and pre-IPO financing of companies in a variety of businesses and industries. These investments are affected by factors particular to the specific industries as well as external and global factors, including but not limited to the performance of global financial markets which are generally sensitive to economic conditions, investment sentiment and fluctuations in interest rates.
New World Development Company Limited Annual Report 2018254
Corporate Governance Report
All along, the Company is committed to maintain a high standard of corporate governance practices to safeguard the interests of its shareholders and enhance the performance of the Group. From time to time, the board of Directors (the “Board”) reviews and improves its corporate governance practices in order to ensure that the Group is under the leadership of an effective board so as to optimise return for its shareholders.
CORPORATE GOVERNANCE CODE
Throughout the year ended 30 June 2018, the Company has complied with all the applicable code provisions of the Corporate Governance Code (the “CG Code”) as set out in Appendix 14 of the Listing Rules, with the exception of code provisions A.6.4 and E.1.2.
Code provision A.6.4 is in relation to guidelines for securities dealings by relevant employees. As required under code provision A.6.4, the Board should establish for its relevant employees written guidelines on no less exacting terms than the Model Code for Securities Transactions by Directors of Listed Issuers (the “Model Code”) as set out in Appendix 10 of the Listing Rules in respect of their dealings in the securities of the Company. Instead of following the Model Code strictly, the Board has established its own guidelines which are not on no less exacting terms than the Model Code. Such deviation from the CG Code is considered necessary, mainly because of the huge size of employees of the Group which is over 45,000 and the Group’s diversified businesses. For these reasons, to follow the exact guidelines of the Model Code will cause immense administrative burden to the Company in processing written notifications from the relevant employees when they deal in the securities of the Company, which can be avoided under the Company’s own guidelines.
Code provision E.1.2 provides that the chairman of the board should attend the annual general meeting. Dr. Cheng Kar-Shun, Henry, the Chairman of the Board, was unable to attend the annual general meeting of the Company held on 21 November 2017 (the “AGM”) due to his other engagement. Dr. Cheng Chi-Kong, Adrian, Executive Vice-chairman and General Manager of the Company who took the chair of the AGM, together with other members of the Board who attended the AGM, were of sufficient calibre for answering questions at the AGM and had answered questions at the AGM competently.
DIRECTORS’ SECURITIES TRANSACTIONS
The Company has adopted the Model Code as its own code of conduct for securities transactions by its Directors.
Specific enquiries have been made with all Directors who confirmed that they had complied with the required standard set out in the Model Code during the year ended 30 June 2018.
BOARD OF DIRECTORS
CompositionWith effect from 1 June 2018, Mr. Sitt Nam-Hoi and Mr. So Chung-Keung, Alfred were appointed as Executive Directors, Mr. Ip Yuk-Keung was appointed as an Independent Non-executive Director, Ms. Ki Man-Fung, Leonie was re-designated from Executive Director to Non-executive Director and was appointed as an adviser (the “Board Changes”). Currently, the Board comprises a total of 16 Directors, being seven Executive Directors, three Non-executive Directors and six Independent Non-executive Directors. The number of Independent Non-executive Directors represents more than one-third of the Board as required by Rule 3.10A of the Listing Rules. The biographies of the Directors are set out from pages 52 to 60 of this annual report.
All Directors have entered into formal letters of appointment with the Company, each for a term of three years, subject to retirement by rotation in accordance with the articles of association of the Company (the “Articles of Association”).
Article 103(A) of the Articles of Association provides that at each annual general meeting, one-third of the Directors for the time being (or if their number is not a multiple of three, the number nearest to but not less than one-third) shall retire from office by rotation, provided that every Director (including those appointed for a specific term) shall be subject to retirement by rotation at least once every three years. Also, pursuant to Article 94 of the Articles of Association, any Director appointed to fill a casual vacancy or as an addition to the Board is subject to re-election at the next following general meeting or next following annual general meeting of the Company respectively.
Independence of Independent Non-executive DirectorsThe Company has received annual confirmation of independence from all Independent Non-executive Directors in accordance with Rule 3.13 of the Listing Rules. The Board is of the view that all Independent Non-executive Directors are independent in accordance with the Listing Rules.

New World Development Company LimitedAnnual Report 2018 255
C o r p o r a t e G o v e r n a n c e R e p o r t
BOARD OF DIRECTORS (CONTINUED)
Role of the BoardThe Board oversees the management, businesses, strategic directions and financial performance of the Group. It is collectively responsible for the management and operation of the Company. The Board is the ultimate decision making body of the Company except for matters requiring the approval of the shareholders in accordance with the Articles of Association, the Listing Rules or other applicable laws and regulations.
Day-to-day businesses of the Company are delegated to the management team which works under the leadership and supervision of the Executive Vice-chairman & General Manager and the Executive Committee of the Board as discussed in sections below.
Corporate Governance FunctionsThe Board is responsible for performing the corporate governance duties of the Company including:
(a) to develop and review the Company’s policies and practices on corporate governance;
(b) to review and monitor the training and continuous professional development of the Directors and senior management;
(c) to review and monitor the Company’s policies and practices in compliance with legal and regulatory requirements;
(d) to develop, review and monitor the code of conduct and compliance manual (if any) applicable to employees and the Directors; and
(e) to review the Company’s compliance with Appendix 14 of the Listing Rules (Corporate Governance Code and Corporate Governance Report).
Board MeetingsRegular Board meetings are held at least four times a year with at least 14 days’ notices and additional meetings with reasonable notices are held as and when the Board considers appropriate. The Company Secretary assists the Chairman in preparing agenda for each meeting. Draft agenda for each Board meeting is circulated to all Directors to enable them to include other matters into the agenda. Agenda accompanying board papers are sent to all Directors at least three days before each regular Board meeting. Board decisions are voted upon at the Board meetings. The Company Secretary records all matters considered by the Board, decisions reached and any concerns raised or dissenting views expressed by the Directors. Minutes of meetings are kept by the Company Secretary with copies circulated to all Directors for information and records.
Directors’ TrainingEach newly appointed Director is provided with the necessary induction and information to ensure that he/she has a proper understanding of the Company’s operations and businesses as well as his/her responsibilities under the relevant statues, laws, rules and regulations. From time to time, the Company Secretary also provides the Directors with updates on latest development and changes in the Listing Rules and other relevant legal and regulatory requirements.
In addition, all Directors are provided with monthly updates on the Company’s performance, position and prospects to enable the Board as a whole and each Director to discharge their duties.

New World Development Company Limited Annual Report 2018256
C o r p o r a t e G o v e r n a n c e R e p o r t
BOARD OF DIRECTORS (CONTINUED)
Directors’ Training (continued)All Directors are encouraged to participate in continuous professional development activities to develop and refresh their knowledge and skills. From time to time, the Company has arranged in-house trainings for the Directors in the form of seminars and reading materials. A summary of training received by the Directors for the year ended 30 June 2018 according to the records provided by the Directors is as follows:
Type of Continuous Professional Development
Name of Directors
Training on corporate governance,
regulatory development and other relevant topics
Attending corporate events or visits
Executive Directors
Dr. Cheng Kar-Shun, Henry ✓ –
Dr. Cheng Chi-Kong, Adrian ✓ ✓
Mr. Cheng Chi-Heng ✓ –
Ms. Cheng Chi-Man, Sonia ✓ –
Mr. Au Tak-Cheong ✓ ✓
Mr. Sitt Nam-Hoi* ✓ ✓
Mr. So Chung-Keung, Alfred* ✓ ✓
Non-executive Directors
Mr. Doo Wai-Hoi, William ✓ –
Mr. Cheng Kar-Shing, Peter ✓ –
Ms. Ki Man-Fung, Leonie# ✓ ✓
Independent Non-executive Directors
Mr. Yeung Ping-Leung, Howard ✓ –
Mr. Cha Mou-Sing, Payson ✓ –
Mr. Cha Mou-Zing, Victor(Alternate Director to Mr. Cha Mou-Sing, Payson) ✓ –
Mr. Ho Hau-Hay, Hamilton ✓ –
Mr. Lee Luen-Wai, John ✓ ✓
Mr. Liang Cheung-Biu, Thomas ✓ ✓
Mr. Ip Yuk-Keung* ✓ –
* appointed as Director on 1 June 2018# re-designated from Executive Director to Non-executive Director on 1 June 2018

New World Development Company LimitedAnnual Report 2018 257
C o r p o r a t e G o v e r n a n c e R e p o r t
CHAIRMAN, EXECUTIVE VICE-CHAIRMAN & GENERAL MANAGER AND OTHER EXECUTIVE DIRECTORS
Dr. Cheng Kar-Shun, Henry, the Chairman, has led the Board and ensured that the Board works effectively and that all important issues are discussed in a timely manner. Dr. Cheng Chi-Kong, Adrian, the Executive Vice-chairman & General Manager oversees the Company’s day-to-day businesses and the implementation of major strategies and policies of the Company. Each of the other Executive Directors takes up different responsibilities according to their own expertise. The responsibilities of the Chairman, the Executive Vice-chairman & General Manager and the other Executive Directors are clearly set out in their respective letters of appointment. The positions of the Chairman and the Executive Vice-chairman & General Manager are held by separate individuals so as to maintain an effective segregation of duties.
NON-EXECUTIVE DIRECTORS
Non-executive Directors (including the Independent Non-executive Directors) serve the relevant function of bringing independent judgement on the development, performance and risk management of the Company. They have the same duties of care and skill and fiduciary duties as the Executive Directors. Each Non-executive Director has entered into a letter of appointment with the Company for a fixed term of three years, subject to retirement by rotation in accordance with the Articles of Association.
BOARD COMMITTEES
The Board currently has four committees, namely the Executive Committee, the Audit Committee, the Remuneration Committee and the Nomination Committee. All the Board committees are empowered by the Board under their own terms of reference which have been posted on HKEx’s website and/or the Company’s website.
Executive CommitteeMembers:
Executive Directors Dr. Cheng Kar-Shun, Henry (Chairman) Dr. Cheng Chi-Kong, Adrian Mr. Cheng Chi-Heng Ms. Cheng Chi-Man, Sonia Mr. Au Tak-Cheong Mr. Sitt Nam-Hoi* Mr. So Chung-Keung, Alfred*
* appointed as Director on 1 June 2018
The Board has delegated to the Executive Committee comprising all Executive Directors with authority and responsibility for handling the management functions and day-to-day operations of the Company, while reserving certain key matters such as the declaration of interim dividend, making recommendation of final dividend or other distributions for the approval by the Board. The Executive Committee shall monitor the execution of the Company’s strategic plans and the operations of all business units of the Company, and manage and develop generally the businesses of the Company. The Executive Committee meets regularly as and when necessary.
Audit CommitteeMembers:
Independent Non-executive Directors Mr. Lee Luen-Wai, John (Chairman) Mr. Cha Mou-Sing, Payson Mr. Yeung Ping-Leung, Howard Mr. Ho Hau-Hay, Hamilton Mr. Liang Cheung-Biu, Thomas Mr. Ip Yuk-Keung*
* became member on 1 June 2018
The Audit Committee is responsible for the review and supervision of the Group’s financial reporting process and risk management (including but not limited to business, operation as well as environmental, social and governance related risks) and internal control systems. The Audit Committee is empowered to review and monitor the external auditor’s independence and objectivity and the effectiveness of the audit process in accordance with applicable standards. It also reviews the internal audit programme and ensures the internal audit function is adequately resourced and effective.

New World Development Company Limited Annual Report 2018258
C o r p o r a t e G o v e r n a n c e R e p o r t
BOARD COMMITTEES (CONTINUED)
Audit Committee (continued)During the year, the Audit Committee met twice and reviewed the audited financial statements of the Company for the year ended 30 June 2017 and the unaudited interim financial statements of the Company for the six months ended 31 December 2017 with recommendations to the Board for approval, reviewed reports on risk management and internal control systems of the Group, and discussed with the management and the external auditors of the accounting policies and practices which may affect the Group and the financial reporting matters. Furthermore, the Audit Committee reviewed the framework and policy of risk management, the system of internal control and the financial statements for the year ended 30 June 2018 of the Company with recommendation to the Board for approval.
Remuneration CommitteeMembers:
Independent Non-executive Directors Mr. Ho Hau-Hay, Hamilton (Chairman) Mr. Yeung Ping-Leung, Howard Mr. Cha Mou-Sing, Payson Mr. Lee Luen-Wai, John
Executive Director Dr. Cheng Kar-Shun, Henry
The Remuneration Committee is responsible for making recommendations to the Board on the Company’s policy and structure on the remuneration of all Directors and senior management of the Company and on the establishment of a formal and transparent procedure for developing remuneration policy for the Company for approval by the Board. It shall also make recommendations to the Board on the remuneration packages of individual Executive Director and senior management.
During the year, the Remuneration Committee met once and reviewed the remuneration policy of the Company, including that for the Directors and senior management of the Company. The remuneration for the Executive Directors comprises basic salary, pensions and discretionary bonus. Share options have been granted to all Directors and senior management to subscribe for shares in the Company under the Company’s share option scheme. In addition, a Director has been granted options under share option scheme of a listed subsidiary of the Group to subscribe for shares in that listed subsidiary. Details of the remuneration paid to the Directors and members of senior management for the financial year ended 30 June 2018 are disclosed in the notes to the financial statements.
Nomination CommitteeMembers:
Executive Director Dr. Cheng Kar-Shun, Henry (Chairman)
Independent Non-executive Directors Mr. Lee Luen-Wai, John Mr. Liang Cheung-Biu, Thomas Mr. Ip Yuk-Keung*
* became member on 1 June 2018
The Nomination Committee is responsible for reviewing the structure, size and composition of the Board and making recommendations on any proposed changes to the Board to complement the Company’s corporate strategy. It shall consider the suitability of a candidate to act as a Director on the basis of the candidate’s qualification, experience, integrity and potential contribution to the Company, and assess the independence of Independent Non-executive Directors taking into account the independence requirements set out in Rule 3.13 of the Listing Rules. During the year, the Nomination Committee met once and reviewed the structure, size and composition of the Board and considered that the Board consists of a diverse mix of members appropriate to the requirements of the businesses of the Company. The Nomination Committee also recommended to the Board on the Board Changes.
The Board adopted a Board Diversity Policy (the “Policy”) in August 2013 which sets out the approach by the Company to achieve diversity on the Board. Under the Policy, the Company recognises and embraces the benefits of having a diverse Board and sees increasing diversity at Board level as an essential element in maintaining its competitive advantage and supporting its sustainable development. In determining an optimum composition of the Board, the Company will consider all aspects of diversity and will also take into account factors based on its own business model and specific needs from time to time. Board members’ appointment will be based on meritocracy and candidates will be considered against objective criteria, having due regard for the benefits of diversity on the Board. Selection of candidates will be based on a range of diversity perspectives, including but not limited to gender, age, skills, regional and industry experience and expertise, cultural and educational background, and professional experience. The ultimate decision will be based on merit and contribution that the selected candidates will bring to the Board.
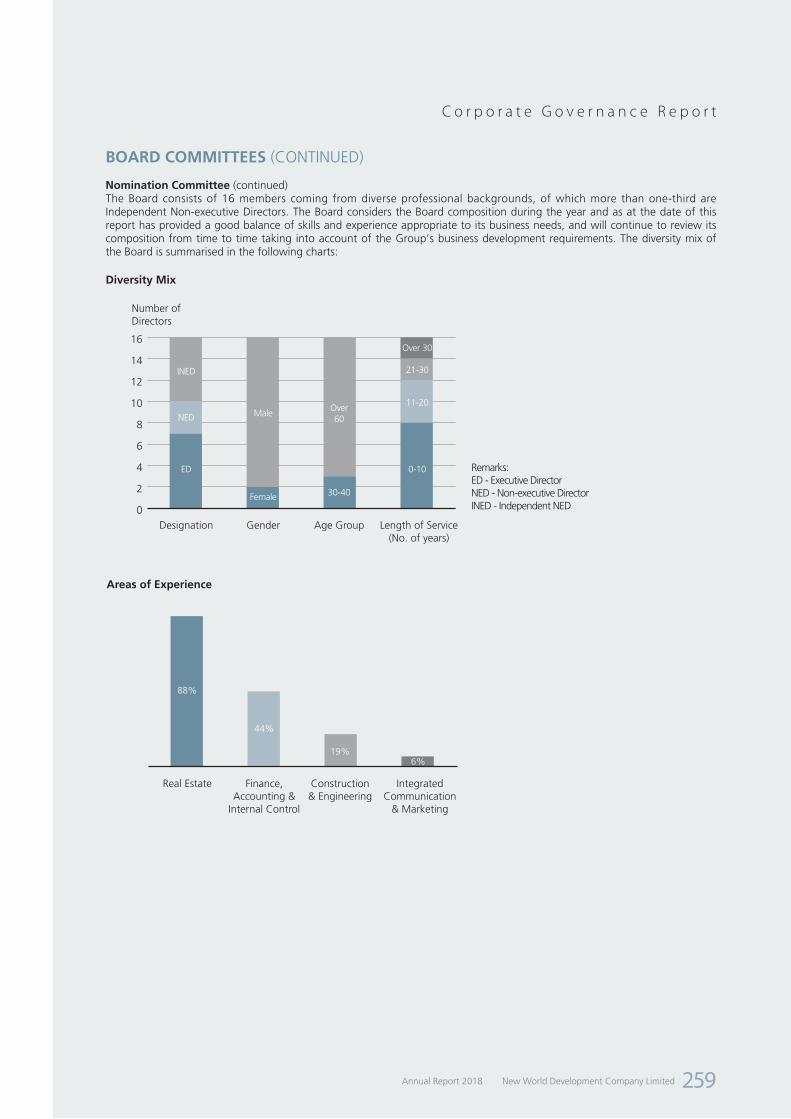
New World Development Company LimitedAnnual Report 2018 259
C o r p o r a t e G o v e r n a n c e R e p o r t
BOARD COMMITTEES (CONTINUED)
Nomination Committee (continued)The Board consists of 16 members coming from diverse professional backgrounds, of which more than one-third are Independent Non-executive Directors. The Board considers the Board composition during the year and as at the date of this report has provided a good balance of skills and experience appropriate to its business needs, and will continue to review its composition from time to time taking into account of the Group’s business development requirements. The diversity mix of the Board is summarised in the following charts:
0
2
4
6
8
10
12
14
16
Diversity Mix
Number of Directors
INED
NED
ED
Designation Gender Age Group Length of Service(No. of years)
Male
Female
Over 60
30-40
0-10
11-20
21-30
Over 30
Remarks:ED - Executive DirectorNED - Non-executive DirectorINED - Independent NED
Areas of Experience
88%
Real Estate Finance, Accounting &
Internal Control
Construction & Engineering
Integrated Communication
& Marketing
44%
19%6%

New World Development Company Limited Annual Report 2018260
C o r p o r a t e G o v e r n a n c e R e p o r t
ATTENDANCE AT BOARD MEETINGS, BOARD COMMITTEE MEETINGS AND GENERAL MEETINGS
Number of Meetings Attended/Eligible to attend for the year ended 30 June 2018
Name of DirectorsBoard
Meeting
Audit Committee
Meeting
Remuneration Committee
Meeting
Nomination Committee
Meeting
Annual General Meeting
Executive Directors
Dr. Cheng Kar-Shun, Henry 4/4 – 1/1 1/1 0/1
Dr. Cheng Chi-Kong, Adrian 4/4 – – – 1/1
Mr. Cheng Chi-Heng 3/4 – – – 1/1
Ms. Cheng Chi-Man, Sonia 4/4 – – – 1/1
Mr. Au Tak-Cheong 3/4 – – – 1/1
Mr. Sitt Nam-Hoi* 0/0 – – – 0/0
Mr. So Chung-Keung, Alfred* 0/0 – – – 0/0
Non-executive Directors
Mr. Doo Wai-Hoi, William 4/4 – – – 1/1
Mr. Cheng Kar-Shing, Peter 4/4 – – – 1/1
Ms. Ki Man-Fung, Leonie** 4/4 – – – 1/1
Independent Non-executive Directors
Mr. Yeung Ping-Leung, Howard 4/4 2/2 0/1 – 1/1
Mr. Cha Mou-Sing, Payson 4/4 1/2 1/1 – 0/1
Mr. Ho Hau-Hay, Hamilton 4/4 2/2 1/1 – 1/1
Mr. Lee Luen-Wai, John 4/4 2/2 1/1 1/1 1/1
Mr. Liang Cheung-Biu, Thomas 4/4 2/2 – 1/1 1/1
Mr. Ip Yuk-Keung# 0/0 0/0 – 0/0 0/0
* appointed as Director on 1 June 2018** re-designated from Executive Director to Non-executive Director on 1 June 2018# appointed as Director and became member of Audit Committee and Nomination Committee on 1 June 2018
AUDITORS’ REMUNERATION
During the year ended 30 June 2018, the total fee paid/payable in respect of audit and non-audit services provided by the Group’s external auditors is set out below:
Fee paid/payable for the year ended 30 June
Type of services 2018 2017HK$m HK$m
Audit services 64.1 59.2
Non-audit services 8.8 8.6
Total 72.9 67.8
Non-audit services include merger and acquisition related due diligence, taxation and services on system enhancement.

New World Development Company LimitedAnnual Report 2018 261
C o r p o r a t e G o v e r n a n c e R e p o r t
DIRECTORS’ RESPONSIBILITY FOR THE FINANCIAL STATEMENTS
The Board, supported by the finance and accounts department, is responsible for the preparation of the financial statements of the Company and the Group. The Board has prepared the financial statements in accordance with the Hong Kong Financial Reporting Standards issued by the Hong Kong Institute of Certified Public Accountants. Appropriate accounting policies have also been used and applied consistently except the adoption of revised standards, amendments to standards and interpretation. The Directors have not been aware of any material uncertainties relating to events or conditions which may cast significant doubt upon the Group’s ability to continue as a going concern.
The statement by the auditor of the Company and the Group regarding its reporting responsibilities on the financial statements of the Company and the Group is set out in the Independent Auditor’s Report in this annual report.
RISK MANAGEMENT AND INTERNAL CONTROL
The Board is responsible to oversee the Company’s risk management and internal control systems on an ongoing basis. Risk Management Committee has been set up under the Audit Committee and a risk management policy has been adopted since 2016. Procedures have been designed for safeguarding assets against unauthorised use or disposition, ensuring the maintenance of proper accounting records for the provision of reliable financial information for internal use or for publication, and ensuring compliance of applicable laws, rules and regulations. The procedures are designed to manage rather than eliminate the risks of failure to achieve business objectives, and can only provide reasonable but not absolute assurance against material misstatement or loss.
The Risk Management Committee has assisted the Audit Committee in deciding the Group’s risk level and risk appetite, considering the Group’s risk management strategies and giving guidelines where appropriate, and ensuring the soundness and effectiveness of the Group’s risk management and internal control systems. It covers all the material controls, including environmental, social and governance related risks, financial, operational and compliance controls.
An internal audit department has been established to conduct internal audit of the Company and its subsidiaries, joint ventures and associated companies. The internal audit department performs risk-based audits to review the effectiveness of the Group’s material internal controls so as to provide assurance that all key risks (including but not limited to business, operation as well as environmental, social and governance related risks) are identified and managed, and to ensure that the risk management and internal control measures are carried out appropriately and functioning as intended. Major audit findings and recommendations are reported to the Audit Committee, which in turn reports to the Board. The implementation of the agreed actions in response to the identified audit issues are tracked and followed up regularly, and the status is reported to the Audit Committee.
The Audit Committee receives the report from the internal audit department and takes such report into consideration when it makes recommendation to the Board for approval of the half-yearly or annual results of the Group.
COMPANY SECRETARY
The Company Secretary is a full time employee of the Company and has day-to-day knowledge of the Company’s affairs. The Company Secretary reports to the Chairman and is responsible for advising the Board on governance matters. For the year under review, the Company Secretary has confirmed that he has taken no less than 15 hours of relevant professional training. The biography of the Company Secretary is set out on page 61 of this annual report.
CONSTITUTIONAL DOCUMENTS
No change has been made to the Company’s Articles of Association during the year.
ENVIRONMENTAL, SOCIAL AND GOVERNANCE
The Group will issue a standalone Sustainability Report (“SR”) in December 2018 on the Company’s website (http://www.nwd.com.hk/sustainability/en/publication.html) and the Stock Exchange’s website. The SR will be prepared in accordance with the Core option of the Global Reporting Initiative (“GRI”) Sustainability Reporting Standards, as well as the Environmental, Social and Governance Reporting Guide issued by the Stock Exchange, which will provide an overview of the Group’s efforts and performance in pursuing corporate sustainability. Please refer to the “Corporate Sustainability” section in this annual report for a summary of the SR.

New World Development Company Limited Annual Report 2018262
C o r p o r a t e G o v e r n a n c e R e p o r t
SHAREHOLDERS’ RIGHTS
Convening Extraordinary General Meeting (“EGM”) and Putting Forward Proposals at Shareholders’ MeetingsShareholders representing at least 5% of the total voting rights of all the shareholders of the Company having a right to vote at general meetings can deposit a written request to convene an EGM at the registered office of the Company for the attention of the Company Secretary. Such requisition, signed by the shareholders concerned, must state the general nature of the business to be dealt with at the meeting and may include the text of a resolution that may properly be moved and is intended to be moved at the meeting. If the Directors do not within 21 days from the date of the deposit of a request (after being verified to be valid) proceed to convene an EGM on a day not more than 28 days after the date on which the notice convening the EGM is given, the shareholders concerned, or any of them representing more than one-half of the total voting rights of all of them, may themselves convene an EGM, but any EGM so convened shall not be held after the expiration of three months after the date on which the Directors become subject to the requirement to call a meeting.
To put forward proposals at the shareholders’ meeting, a request in writing must be made by:
(i) shareholders representing at least 2.5% of the total voting rights of all shareholders of the Company having the right to vote at the shareholders’ meeting; or
(ii) at least 50 shareholders of the Company having the right to vote at the meeting,
to the Company to give to shareholders notice of any resolution which may properly be moved and is intended to be moved at an annual general meeting, or to circulate to shareholders any statement of not more than 1,000 words with respect to the matter referred to in any proposed resolution or the business to be dealt with at any general meeting.
The written request must be signed by all the shareholders concerned in one or more documents in like form and deposited at the registered office of the Company for the attention of the Company Secretary not less than six weeks before the meeting in the case of a requisition requiring notice of a resolution at annual general meeting, and not less than seven days before the meeting in the case of requiring circulation of statement. Upon the request verified to be valid, the Company will give notice of the resolution or circulate the statement.
If a shareholder of the Company intends to propose a person other than a Director of the Company for election as a Director of the Company at any general meeting, the shareholder concerned shall lodge with the registered office of the Company for the attention of the Company Secretary (i) a written notice of his intention to propose that person for election as a Director; and (ii) a written notice by that person of his/her willingness to be elected as a Director together with the necessary information within the period commencing no earlier than the day after the dispatch of the notice of the general meeting and ending no later than seven days prior to the date of such general meeting.
Detailed procedures can be found in the following documents which are available on the Company’s website:
• “Procedures for Shareholders to convene Extraordinary General Meetings and putting forward proposals at General Meetings”; and
• “Procedures for Shareholders to propose a person for election as a Director”.
Enquiries to the BoardEnquiries may be put to the Board through the Company’s Investor Relations Department at 30/F., New World Tower, 18 Queen’s Road Central, Hong Kong (email: [email protected]).
COMMUNICATION WITH SHAREHOLDERS
The Board and senior management maintain a continuing dialogue with the Company’s shareholders and investors through various channels including the Company’s annual general meeting. The Chairman, other members of the Board and the external auditor attend the annual general meeting to meet the shareholders. The Directors will answer questions raised by the shareholders on the performance of the Group. The Company holds press and analysts conferences at least twice a year following the release of interim and full year results announcements at which the Executive Directors and senior management of the Company are available to answer questions regarding the performance of the Group. Our corporate website which contains corporate information, interim and annual reports, announcements and circulars issued by the Group as well as the recent developments of the Group enables the Company’s shareholders to have timely and updated information of the Group. Shareholders can refer to the “Shareholders’ Communication Policy” posted on the Company’s website for more details.
EMPHASISE INVESTOR RELATIONS
To ensure that the investors have a comprehensive and thorough understanding of the Group with the establishment of timely and effective two-way communications, the management and investor relations team of the Group participates in different international conferences and arranges local and overseas roadshows on a regular basis to elaborate the Group’s business development and market movement to investors in different locations. We also show our key projects in both Mainland China and Hong Kong to the investor communities via various kinds of site visits and reverse roadshows. The “Investor Relations” section is set out on pages 62 and 63 of this annual report.
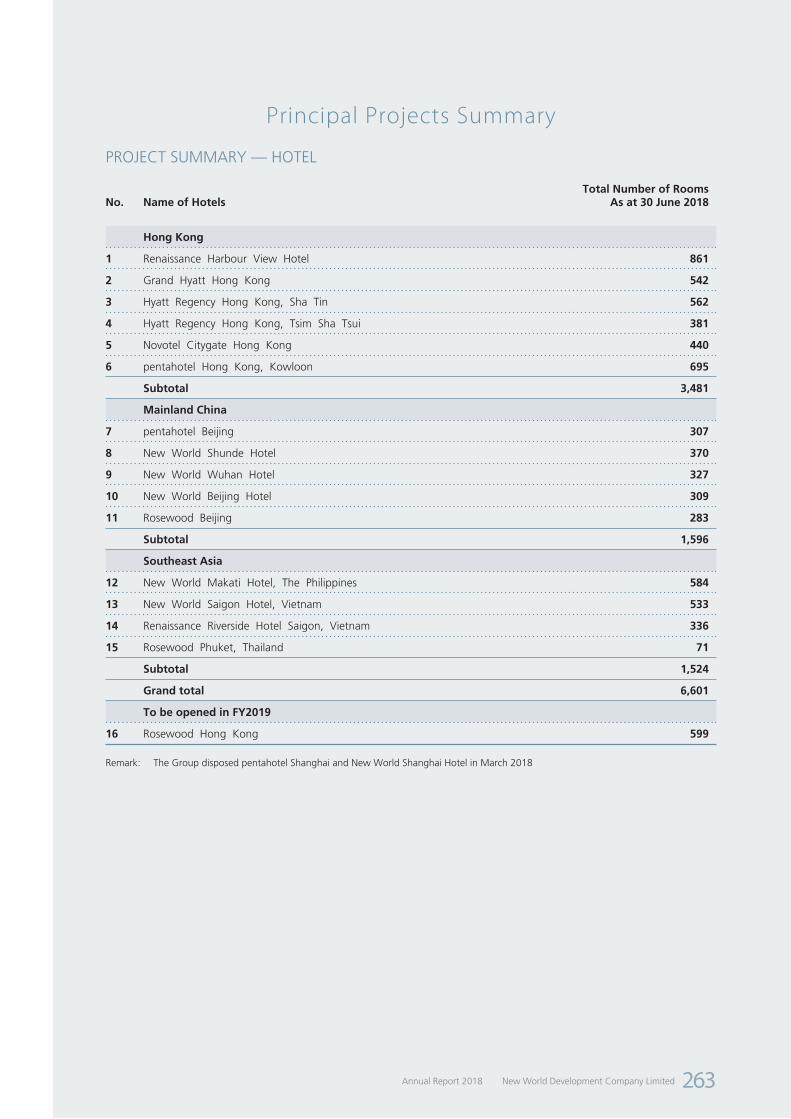
New World Development Company LimitedAnnual Report 2018 263
Principal Projects Summary
PROJECT SUMMARY — HOTEL
No. Name of HotelsTotal Number of Rooms
As at 30 June 2018
Hong Kong
1 Renaissance Harbour View Hotel 861
2 Grand Hyatt Hong Kong 542
3 Hyatt Regency Hong Kong, Sha Tin 562
4 Hyatt Regency Hong Kong, Tsim Sha Tsui 381
5 Novotel Citygate Hong Kong 440
6 pentahotel Hong Kong, Kowloon 695
Subtotal 3,481
Mainland China
7 pentahotel Beijing 307
8 New World Shunde Hotel 370
9 New World Wuhan Hotel 327
10 New World Beijing Hotel 309
11 Rosewood Beijing 283
Subtotal 1,596
Southeast Asia
12 New World Makati Hotel, The Philippines 584
13 New World Saigon Hotel, Vietnam 533
14 Renaissance Riverside Hotel Saigon, Vietnam 336
15 Rosewood Phuket, Thailand 71
Subtotal 1,524
Grand total 6,601
To be opened in FY2019
16 Rosewood Hong Kong 599
Remark: The Group disposed pentahotel Shanghai and New World Shanghai Hotel in March 2018

New World Development Company Limited Annual Report 2018264
P r i n c i p a l P r o j e c t s S u m m a r y
PROJECT SUMMARY – MAJOR PROPERTY DEVELOPMENT PROJECTS IN HONG KONG
No. Name of Property Development Projects Site Area(sq ft)
Total GFA(sq ft)
The Group’s Interest
Central and Western District
1 23 Babington Path, Mid-levels 13,294 66,470 10.00%
2 ARTISAN HOUSE, 1 Sai Yuen Lane, Western District 7,812 90,913 100.00%
3 4A-4P Seymour Road, Mid-levels 52,466 472,186 35.00%
Eastern District
4 FLEUR PAVILIA, 1 Kai Yuen Street, North Point 72,000 573,301 40.00%
Yau Tsim Mong District
5 74 Waterloo Road, Ho Man Tin 11,256 94,972 51.00%
Kowloon City District and Kwun Tong District
6 Kowloon City Road / Sheung Heung Road, Ma Tau Kok (2) 14,897 111,730 100.00%
7 Yau Tong Redevelopment Project, Kowloon East 810,454 3,992,604 10.88%
8 43-45 Tsun Yip Street, Kwun Tong 9,169 100,840 100.00%
9 46 Tsun Yip Street, Kwun Tong 5,530 60,830 100.00%
Sham Shui Po District
10 New Kowloon Inland Lot No. 6582, Cheung Shun Street, Cheung Sha Wan (3) 44,897 524,766 100.00%
11 New Kowloon Inland Lot No. 6572, Wing Hong Street, Cheung Sha Wan 30,925 363,094 100.00%
Sha Tin District and Sai Kung District
12 Tai Wai Station Property Development, STTL No. 520, Sha Tin (2) 521,107 2,050,327 100.00%
13 DD221, Sha Ha, Sai Kung 618,220 927,330 76.00%
Tsuen Wan District
14 THE PAVILIA BAY, West Rail Tsuen Wan West Station (TW6), TWTL No. 402, Tsuen Wan (2) 148,586 675,021 80.00%
Yuen Long District and Tuen Mun District
15 PARK HILLCREST, Lot No.2131 in DD121, Tong Yan San Tsuen (Phase 1 - Site A), Yuen Long 78,502 78,502 100.00%
16 THE PARKVILLE, No.76-92 Tuen Mun Heung Sze Wui Road, Tuen Mun 8,000 84,046 100.00%
17 Park Reach, YLTL 527, Tai Tong Road, Yuen Long 6,131 21,453 20.97%
18 YLTL 524, Tai Tong Road, Yuen Long 48,933 171,265 20.97%
19 Lung Tin Tsuen (Phase 3), Yuen Long 24,230 121,148 100.00%
20 Lung Tin Tsuen (Phase 2), Yuen Long 88,157 440,785 100.00%
21 Tong Yan San Tsuen (Phase 3), Yuen Long 88,658 88,658 100.00%
22 Tong Yan San Tsuen (Phase 4), Yuen Long 193,591 193,591 100.00%
23 Sha Po North, Yuen Long TBC 373,240 34.81%
24 DD110, Kam Tin, Yuen Long 170,577 68,231 100.00%
Grand Total 11,745,303
Remarks:(1) P=Planning; D=Demolition; SP=Site Preparation; F=Site Formation / Foundation; S=Superstructure; C=Completed (OP Issued);
LE=Land Exchange; NA=Not Applicable; TBC=To be confirmed(2) Property in which the Group is entitled to a share of development profits in accordance with the terms and conditions of the respective
development agreements(3) Others include public carpark, but exclude government accommodations (i.e., children care centre and elderly care centre)

New World Development Company LimitedAnnual Report 2018 265
P r i n c i p a l P r o j e c t s S u m m a r y
Residential(sq ft)
Retail(sq ft)
Office(sq ft)
Industrial(sq ft)
Others(sq ft)
Total Attributable
GFA(sq ft)
Stage of Completion(1)
6,647 6,647 C
82,934 7,979 90,913 C
165,265 165,265 F
229,320 229,320 S
43,051 5,385 48,436 F
111,730 111,730 S
423,683 10,793 434,476 LE
100,840 100,840 S
60,830 60,830 F
152 488,256 36,358 524,766 F
5,234 357,860 363,094 SP
2,050,327 2,050,327 S
704,770 704,770 P
540,017 540,017 C
78,502 78,502 S
70,106 13,940 84,046 C
4,014 485 4,499 S
35,914 35,914 S
121,148 121,148 F
440,785 440,785 LE
88,658 88,658 LE
193,591 193,591 NA
129,925 129,925 NA
68,231 68,231 LE
5,588,618 43,968 846,116 161,670 36,358 6,676,730

New World Development Company Limited Annual Report 2018266
P r i n c i p a l P r o j e c t s S u m m a r y
PROJECT SUMMARY – MAJOR PROPERTY INVESTMENT AND OTHER PROJECTS IN HONG KONGNo. Name of Property Investment and Other Projects Total GFA
(sq ft)Total
Attributable GFA(sq ft)
Completed
Hong Kong Island
1 Manning House, Central 110,040 110,040
2 New World Tower, Central 640,135 640,135
3 Shun Tak Centre, Shopping Arcade, Sheung Wan 214,336 96,451
4 Hong Kong Convention and Exhibition Centre, Shopping Arcade, Wan Chai 87,999 87,999
5 Grand Hyatt Hong Kong 524,928 262,464
6 Renaissance Harbour View Hotel 544,518 272,259
7 Pearl City, Causeway Bay - Ground Floor to 4th Floor 53,691 21,476
Pearl City, Causeway Bay - Ground Floor to Basement 24,682 24,682
8 EIGHT KWAI FONG, Happy Valley 65,150 57,965
9 Methodist House, Wan Chai (1) 40,813 40,405
Kowloon
10 K11 ATELIER of Victoria Dockside, Tsim Sha Tsui 435,145 435,145
Rosewood Hotel & Rosewood Residences of Victoria Dockside, Tsim Sha Tsui 1,105,644 1,105,644
11 Telford Plaza, Kowloon Bay (1) 335,960 335,960
12 K11, Tsim Sha Tsui (1) 335,939 334,259
Hyatt Regency Hong Kong, Tsim Sha Tsui 277,877 138,939
13 pentahotel Hong Kong, Kowloon 285,601 285,601
14 KOHO, Kwun Tong 204,514 204,514
15 THE FOREST, Mong Kok (1) 53,337 26,669
New Territories
16 ATL Logistic Centre, Kwai Chung 9,329,000 3,190,518
17 DPARK, Tsuen Wan 466,400 466,400
18 PopCorn II, Tseung Kwan O (1) 125,730 88,011
19 Hyatt Regency Hong Kong, Sha Tin (1) 538,000 538,000
20 Citygate, Tung Chung (4) 659,003 131,801
Novotel Citygate Hong Kong 236,758 47,352
21 PARK SIGNATURE, Yuen Long 24,155 24,155
Grand Total 16,719,355 8,966,844
To be completed/ Under development/ Alteration and additional work (5)
22 Remaining portion of Victoria Dockside, Tsim Sha Tsui (6) 1,536,076 1,536,076
23 TCTL 11, Tung Chung 474,617 94,923
24 704-730 King's Road, North Point 487,500 487,500
25 9 Luk Hop Street, San Po Kong 65,787 65,787
26 21 Luk Hop Street, San Po Kong 100,800 100,800
27 New Kowloon Inland Lot No. 6505, King Lam Street, Cheung Sha Wan 998,210 998,210
28 SKYCITY Project (1) 3,767,389 3,767,389
Remarks:(1) Properties in which the Group has development interests: other parties provide the land whilst the Group finances the construction costs
and occasionally land costs, and is entitled to a share of the rental income or a share of the development profits in accordance with the terms and conditions of the respective joint development agreements after completion
(2) Meeting rooms(3) Logistics centre(4) Including Tung Chung Crescent(5) GFA breakdown by usage of the project to be completed/ under development/ alteration and additional work is to be determined(6) Including 12 Salisbury Road

New World Development Company LimitedAnnual Report 2018 267
P r i n c i p a l P r o j e c t s S u m m a r y
Retail(sq ft)
Office(sq ft)
Hotel(sq ft)
Residential(sq ft)
Others(sq ft)
Total Number of Carpark
Land Lease Expiry
63,383 46,657 2843
77,948 562,187 385 2863
96,451 85 2055
69,173 18,826(2) 1,070 2060
262,464 2060
272,259 2060
21,476 2868
24,682 2868
57,965 2079
40,405 2084
435,145 2052
1,105,644 2052
335,960 136 2047
334,259 240 2057
138,939 2057
285,601 2057
1,567 202,947 28 2047
26,669 7 2062
3,190,518(3) 2047
466,400 1,000 2047
88,011 50 2047
538,000 100 2047
99,697 32,104 1,231 2047
47,352 7 2047
24,155 2058
1,729,831 1,319,445 2,650,259 57,965 3,209,344 4,339
2052
2063
2083/2088/2090
2047
2047
2067
2066
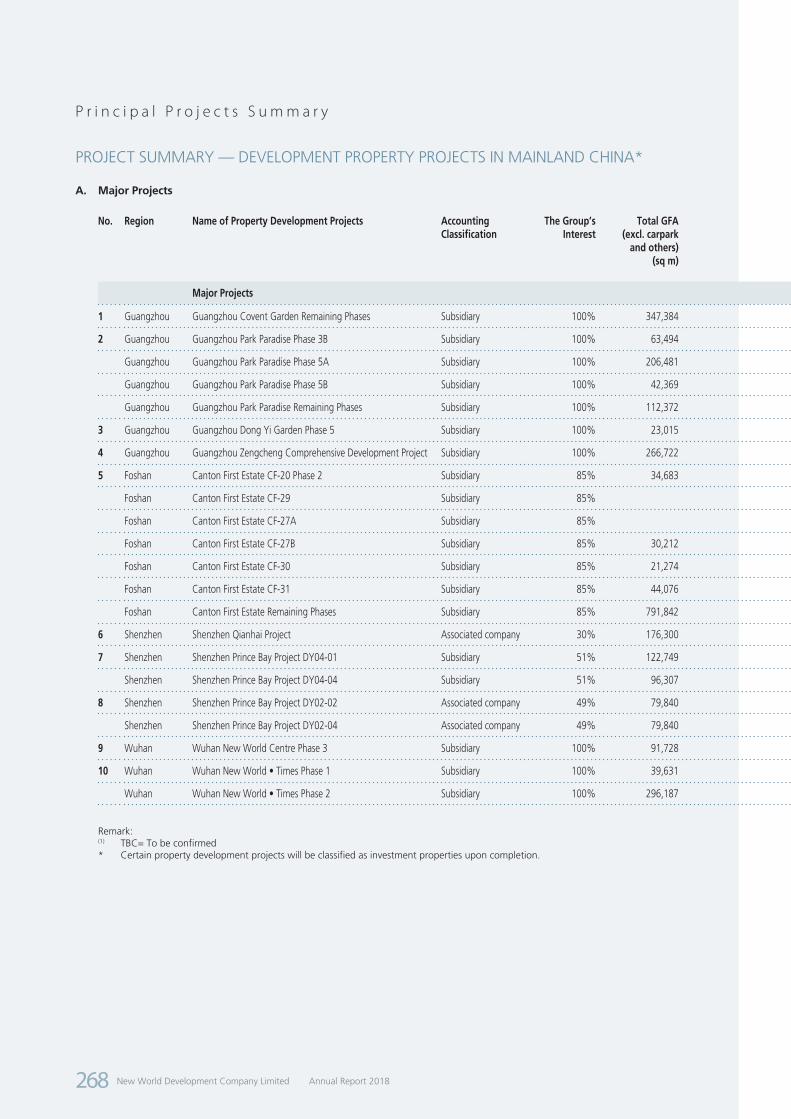
New World Development Company Limited Annual Report 2018268
P r i n c i p a l P r o j e c t s S u m m a r y
PROJECT SUMMARY — DEVELOPMENT PROPERTY PROJECTS IN MAINLAND CHINA*
A. Major Projects
No. Region Name of Property Development Projects Accounting Classification
The Group’s Interest
Total GFA(excl. carpark
and others)(sq m)
Residential(sq m)
Commercial(sq m)
Office(sq m)
Hotel(sq m)
Carpark and others(sq m)
Development status
Expected completion
date(1)
Major Projects
1 Guangzhou Guangzhou Covent Garden Remaining Phases Subsidiary 100% 347,384 317,727 29,657 52,519 Planning completed Jun-2022
2 Guangzhou Guangzhou Park Paradise Phase 3B Subsidiary 100% 63,494 63,494 17,304 Under development Dec-2019
Guangzhou Guangzhou Park Paradise Phase 5A Subsidiary 100% 206,481 128,298 78,183 118,720 Under development Sept-2018
Guangzhou Guangzhou Park Paradise Phase 5B Subsidiary 100% 42,369 42,369 10,860 Planning completed Apr-2021
Guangzhou Guangzhou Park Paradise Remaining Phases Subsidiary 100% 112,372 87,339 25,033 15,518 Under planning TBC
3 Guangzhou Guangzhou Dong Yi Garden Phase 5 Subsidiary 100% 23,015 23,015 14,211 Under development Oct-2018
4 Guangzhou Guangzhou Zengcheng Comprehensive Development Project Subsidiary 100% 266,722 93,274 12,005 134,804 26,639 122,005 Under planning TBC
5 Foshan Canton First Estate CF-20 Phase 2 Subsidiary 85% 34,683 34,683 1,682 Under development Jul-2018
Foshan Canton First Estate CF-29 Subsidiary 85% 39,276 Under development Sept-2018
Foshan Canton First Estate CF-27A Subsidiary 85% 12,492 Under development Sept-2018
Foshan Canton First Estate CF-27B Subsidiary 85% 30,212 30,212 487 Under development Jun-2020
Foshan Canton First Estate CF-30 Subsidiary 85% 21,274 21,274 526 Under development Jun-2020
Foshan Canton First Estate CF-31 Subsidiary 85% 44,076 44,076 Under development Jun-2020
Foshan Canton First Estate Remaining Phases Subsidiary 85% 791,842 706,951 84,891 252,100 Under planning TBC
6 Shenzhen Shenzhen Qianhai Project Associated company 30% 176,300 27,940 148,360 3,800 Under development Dec-2021
7 Shenzhen Shenzhen Prince Bay Project DY04-01 Subsidiary 51% 122,749 98,000 24,749 2,751 Planning completed Dec-2020
Shenzhen Shenzhen Prince Bay Project DY04-04 Subsidiary 51% 96,307 96,307 193 Planning completed Dec-2020
8 Shenzhen Shenzhen Prince Bay Project DY02-02 Associated company 49% 79,840 25,000 54,840 160 Under development Nov-2020
Shenzhen Shenzhen Prince Bay Project DY02-04 Associated company 49% 79,840 55,000 24,840 160 Under development Feb-2021
9 Wuhan Wuhan New World Centre Phase 3 Subsidiary 100% 91,728 32,294 59,434 49,241 Under development May-2019
10 Wuhan Wuhan New World • Times Phase 1 Subsidiary 100% 39,631 39,631 73,946 Under development Dec-2019
Wuhan Wuhan New World • Times Phase 2 Subsidiary 100% 296,187 31,950 264,237 114,200 Under planning Jun-2023
Remark:(1) TBC= To be confirmed* Certain property development projects will be classified as investment properties upon completion.
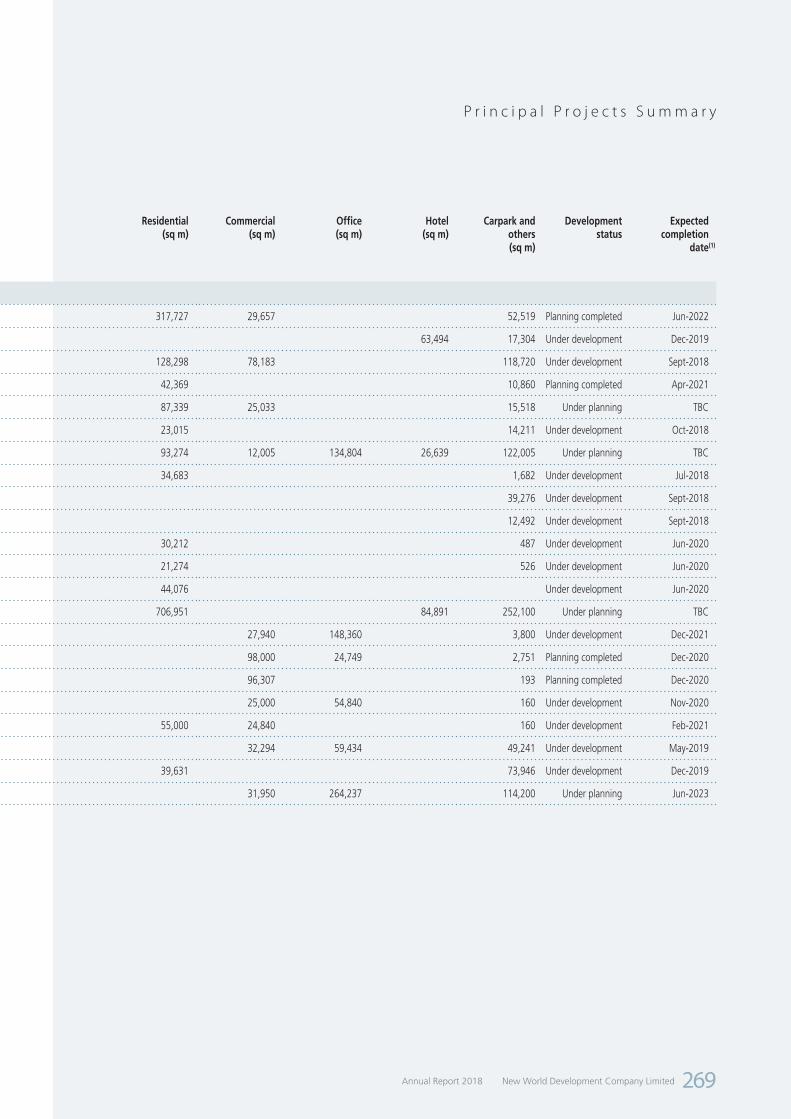
New World Development Company LimitedAnnual Report 2018 269
P r i n c i p a l P r o j e c t s S u m m a r y
PROJECT SUMMARY — DEVELOPMENT PROPERTY PROJECTS IN MAINLAND CHINA*
A. Major Projects
No. Region Name of Property Development Projects Accounting Classification
The Group’s Interest
Total GFA(excl. carpark
and others)(sq m)
Residential(sq m)
Commercial(sq m)
Office(sq m)
Hotel(sq m)
Carpark and others(sq m)
Development status
Expected completion
date(1)
Major Projects
1 Guangzhou Guangzhou Covent Garden Remaining Phases Subsidiary 100% 347,384 317,727 29,657 52,519 Planning completed Jun-2022
2 Guangzhou Guangzhou Park Paradise Phase 3B Subsidiary 100% 63,494 63,494 17,304 Under development Dec-2019
Guangzhou Guangzhou Park Paradise Phase 5A Subsidiary 100% 206,481 128,298 78,183 118,720 Under development Sept-2018
Guangzhou Guangzhou Park Paradise Phase 5B Subsidiary 100% 42,369 42,369 10,860 Planning completed Apr-2021
Guangzhou Guangzhou Park Paradise Remaining Phases Subsidiary 100% 112,372 87,339 25,033 15,518 Under planning TBC
3 Guangzhou Guangzhou Dong Yi Garden Phase 5 Subsidiary 100% 23,015 23,015 14,211 Under development Oct-2018
4 Guangzhou Guangzhou Zengcheng Comprehensive Development Project Subsidiary 100% 266,722 93,274 12,005 134,804 26,639 122,005 Under planning TBC
5 Foshan Canton First Estate CF-20 Phase 2 Subsidiary 85% 34,683 34,683 1,682 Under development Jul-2018
Foshan Canton First Estate CF-29 Subsidiary 85% 39,276 Under development Sept-2018
Foshan Canton First Estate CF-27A Subsidiary 85% 12,492 Under development Sept-2018
Foshan Canton First Estate CF-27B Subsidiary 85% 30,212 30,212 487 Under development Jun-2020
Foshan Canton First Estate CF-30 Subsidiary 85% 21,274 21,274 526 Under development Jun-2020
Foshan Canton First Estate CF-31 Subsidiary 85% 44,076 44,076 Under development Jun-2020
Foshan Canton First Estate Remaining Phases Subsidiary 85% 791,842 706,951 84,891 252,100 Under planning TBC
6 Shenzhen Shenzhen Qianhai Project Associated company 30% 176,300 27,940 148,360 3,800 Under development Dec-2021
7 Shenzhen Shenzhen Prince Bay Project DY04-01 Subsidiary 51% 122,749 98,000 24,749 2,751 Planning completed Dec-2020
Shenzhen Shenzhen Prince Bay Project DY04-04 Subsidiary 51% 96,307 96,307 193 Planning completed Dec-2020
8 Shenzhen Shenzhen Prince Bay Project DY02-02 Associated company 49% 79,840 25,000 54,840 160 Under development Nov-2020
Shenzhen Shenzhen Prince Bay Project DY02-04 Associated company 49% 79,840 55,000 24,840 160 Under development Feb-2021
9 Wuhan Wuhan New World Centre Phase 3 Subsidiary 100% 91,728 32,294 59,434 49,241 Under development May-2019
10 Wuhan Wuhan New World • Times Phase 1 Subsidiary 100% 39,631 39,631 73,946 Under development Dec-2019
Wuhan Wuhan New World • Times Phase 2 Subsidiary 100% 296,187 31,950 264,237 114,200 Under planning Jun-2023

New World Development Company Limited Annual Report 2018270
P r i n c i p a l P r o j e c t s S u m m a r y
No. Region Name of Property Development Projects Accounting Classification
The Group’s Interest
Total GFA(excl. carpark
and others)(sq m)
Residential(sq m)
Commercial(sq m)
Office(sq m)
Hotel(sq m)
Carpark and others(sq m)
Development status
Expected completion
date(1)
Major Projects
11 Ningbo Ningbo New World Plaza Land No.7-10 Joint venture 49% 164,555 138,582 25,973 104,970 Under development Sept-2020
Ningbo Ningbo New World Plaza Land No.11 Joint venture 49% 67,753 9,702 58,051 22,257 Under development May-2019
Ningbo Ningbo New World Plaza Land No.5 Joint venture 49% 150,092 1,602 93,933 54,557 21,727 Under development Jun-2020
Ningbo Ningbo New World Plaza Land No.4 Joint venture 49% 47,374 47,374 22,493 Planning completed TBC
Ningbo Ningbo New World Plaza Land No.6 Joint venture 49% 14,345 14,345 22,676 Planning completed TBC
Ningbo Ningbo New World Plaza Land No.1-4 Joint venture 49% 92,467 92,467 47,100 Planning completed TBC
Ningbo Ningbo New World Plaza Land No.12 Joint venture 49% 20,446 8,085 12,361 25,982 Under development May-2019
12 Beijing Beijing New View Commercial Centre Joint venture 70% 21,294 9,063 12,231 13,513 Under development Jan-2020
Beijing Beijing New View Commercial Centre Remaining Phases Joint venture 70% 16,400 1,960 14,440 5,420 Under planning TBC
13 Beijing Beijing Xin Yu Commercial Centre Joint venture 70% 60,925 60,925 48,689 Under planning May-2023
Beijing Beijing Xin Yu Commercial Centre Remaining Phases Joint venture 70% 431,314 236,590 194,724 319,340 Under planning TBC
14 Langfang Langfang New World Centre District A Subsidiary 100% 40,192 40,192 33,651 Under development Sept-2018
15 Langfang Langfang New World Garden District 2 Subsidiary 100% 75,609 68,360 7,249 23,378 Under development Aug-2018
16 Shenyang Shenyang New World Garden Phase 2D2 Subsidiary 100% 172,599 169,778 2,821 86,648 Under development Aug-2018
Shenyang Shenyang New World Garden Phase 2E Subsidiary 100% 97,665 97,665 40,878 Under development Oct-2018
Shenyang Shenyang New World Garden Phase 2C1 Subsidiary 100% 207,751 187,858 19,893 61,477 Under development Aug-2020
Shenyang Shenyang New World Garden Phase 2C2 Subsidiary 100% 225,970 212,853 13,117 56,210 Planning completed Aug-2022
Shenyang Shenyang New World Garden Phase XB Subsidiary 100% 51,849 43,457 8,392 12,616 Planning completed Apr-2022
Shenyang Shenyang New World Garden Phase XC Subsidiary 100% 68,368 55,622 12,746 9,137 Planning completed Apr-2022
17 Shenyang Shenyang New World Commercial Centre Phase 2 Subsidiary 100% 76,671 25,266 51,405 19,354 Under development Oct-2018
18 Shenyang Shenyang New World Centre Subsidiary 100% 575,992 287,086 189,231 99,675 Under development May-2021
Subtotal of Major Projects 5,646,137 3,121,700 989,539 1,165,450 369,448 1,899,667
PROJECT SUMMARY — DEVELOPMENT PROPERTY PROJECTS IN MAINLAND CHINA* (CONTINUED)
A. Major Projects (continued)
Remark:(1) TBC= To be confirmed* Certain property development projects will be classified as investment properties upon completion.

New World Development Company LimitedAnnual Report 2018 271
P r i n c i p a l P r o j e c t s S u m m a r y
No. Region Name of Property Development Projects Accounting Classification
The Group’s Interest
Total GFA(excl. carpark
and others)(sq m)
Residential(sq m)
Commercial(sq m)
Office(sq m)
Hotel(sq m)
Carpark and others(sq m)
Development status
Expected completion
date(1)
Major Projects
11 Ningbo Ningbo New World Plaza Land No.7-10 Joint venture 49% 164,555 138,582 25,973 104,970 Under development Sept-2020
Ningbo Ningbo New World Plaza Land No.11 Joint venture 49% 67,753 9,702 58,051 22,257 Under development May-2019
Ningbo Ningbo New World Plaza Land No.5 Joint venture 49% 150,092 1,602 93,933 54,557 21,727 Under development Jun-2020
Ningbo Ningbo New World Plaza Land No.4 Joint venture 49% 47,374 47,374 22,493 Planning completed TBC
Ningbo Ningbo New World Plaza Land No.6 Joint venture 49% 14,345 14,345 22,676 Planning completed TBC
Ningbo Ningbo New World Plaza Land No.1-4 Joint venture 49% 92,467 92,467 47,100 Planning completed TBC
Ningbo Ningbo New World Plaza Land No.12 Joint venture 49% 20,446 8,085 12,361 25,982 Under development May-2019
12 Beijing Beijing New View Commercial Centre Joint venture 70% 21,294 9,063 12,231 13,513 Under development Jan-2020
Beijing Beijing New View Commercial Centre Remaining Phases Joint venture 70% 16,400 1,960 14,440 5,420 Under planning TBC
13 Beijing Beijing Xin Yu Commercial Centre Joint venture 70% 60,925 60,925 48,689 Under planning May-2023
Beijing Beijing Xin Yu Commercial Centre Remaining Phases Joint venture 70% 431,314 236,590 194,724 319,340 Under planning TBC
14 Langfang Langfang New World Centre District A Subsidiary 100% 40,192 40,192 33,651 Under development Sept-2018
15 Langfang Langfang New World Garden District 2 Subsidiary 100% 75,609 68,360 7,249 23,378 Under development Aug-2018
16 Shenyang Shenyang New World Garden Phase 2D2 Subsidiary 100% 172,599 169,778 2,821 86,648 Under development Aug-2018
Shenyang Shenyang New World Garden Phase 2E Subsidiary 100% 97,665 97,665 40,878 Under development Oct-2018
Shenyang Shenyang New World Garden Phase 2C1 Subsidiary 100% 207,751 187,858 19,893 61,477 Under development Aug-2020
Shenyang Shenyang New World Garden Phase 2C2 Subsidiary 100% 225,970 212,853 13,117 56,210 Planning completed Aug-2022
Shenyang Shenyang New World Garden Phase XB Subsidiary 100% 51,849 43,457 8,392 12,616 Planning completed Apr-2022
Shenyang Shenyang New World Garden Phase XC Subsidiary 100% 68,368 55,622 12,746 9,137 Planning completed Apr-2022
17 Shenyang Shenyang New World Commercial Centre Phase 2 Subsidiary 100% 76,671 25,266 51,405 19,354 Under development Oct-2018
18 Shenyang Shenyang New World Centre Subsidiary 100% 575,992 287,086 189,231 99,675 Under development May-2021
Subtotal of Major Projects 5,646,137 3,121,700 989,539 1,165,450 369,448 1,899,667

New World Development Company Limited Annual Report 2018272
P r i n c i p a l P r o j e c t s S u m m a r y
PROJECT SUMMARY — DEVELOPMENT PROPERTY PROJECTS IN MAINLAND CHINA* (CONTINUED)
B. Other Projects
No. Region Name of Property Development Projects Accounting Classification
The Group’sInterest
Total GFA(excl. carpark
and others)(sq m)
Residential(sq m)
Commercial(sq m)
Office(sq m)
Hotel(sq m)
Carpark and others(sq m)
Development status
Expected completion
date(1)
Other Projects
1 Huizhou Huizhou Changhuyuan Phase 4 Joint venture 63% 69,769 62,329 7,440 20,535 Under development May-2022
2 Changsha Changsha La Ville New World Phase 4A Subsidiary 95% 82,340 81,102 1,238 31,853 Under development Jun-2020
Changsha Changsha La Ville New World Phase 4B Subsidiary 95% 239,675 231,549 8,126 102,701 Planning completed Oct-2021
Changsha Changsha La Ville New World Phase 4C Subsidiary 95% 72,378 65,025 7,353 22,539 Under planning Mar-2022
3 Yiyang Yiyang New World Scenic Heights Phase 1D Subsidiary 100% 14,111 14,111 Under development Sept-2018
Yiyang Yiyang New World Scenic Heights Phase 1E Subsidiary 100% 21,656 20,517 1,139 2,988 Under development Sept-2018
Yiyang Yiyang New World Scenic Heights Phase 1F Subsidiary 100% 17,846 17,846 Under development May-2020
Yiyang Yiyang New World Scenic Heights Phase 1G Subsidiary 100% 11,019 11,019 Under development Dec-2019
Yiyang Yiyang New World Scenic Heights Phase 2A Subsidiary 100% 56,897 56,897 10,978 Planning completed Jun-2022
Yiyang Yiyang New World Scenic Heights Phase 2B Subsidiary 100% 14,360 14,360 38 Planning completed Jul-2020
Yiyang Yiyang New World Scenic Heights Phase 2C Subsidiary 100% 112,968 106,390 6,578 22,278 Planning completed Mar-2021
Yiyang Yiyang New World Scenic Heights Remaining Phases Subsidiary 100% 138,305 138,305 48,980 Under planning Jan-2023
4 Jinan Jinan New World Sunshine Garden District BC Subsidiary 100% 62,404 5,697 37,162 19,545 18,433 Under development Mar-2019
5 Anshan Anshan New World Garden Phase 1B1 Subsidiary 100% 78,357 63,885 14,472 19,425 Under development Jun-2019
Anshan Anshan New World Garden Phase 1B2 and B3 Subsidiary 100% 174,484 151,515 22,969 46,831 Planning completed Jun-2021
6 Anshan Anshan New World • The Grandiose Phase 1B Subsidiary 100% 44,789 44,789 Planning completed Jun-2024
Anshan Anshan New World • The Grandiose Phase 2 Subsidiary 100% 189,000 189,000 Under planning TBC
Subtotal of Other Projects 1,400,358 1,211,742 131,909 37,162 19,545 347,579
Grand Total 7,046,495 4,333,442 1,121,448 1,202,612 388,993 2,247,246
Remark:(1) TBC= To be confirmed* Certain property development projects will be classified as investment properties upon completion.

New World Development Company LimitedAnnual Report 2018 273
P r i n c i p a l P r o j e c t s S u m m a r y
Residential(sq m)
Commercial(sq m)
Office(sq m)
Hotel(sq m)
Carpark and others(sq m)
Development status
Expected completion
date(1)
62,329 7,440 20,535 Under development May-2022
81,102 1,238 31,853 Under development Jun-2020
231,549 8,126 102,701 Planning completed Oct-2021
65,025 7,353 22,539 Under planning Mar-2022
14,111 Under development Sept-2018
20,517 1,139 2,988 Under development Sept-2018
17,846 Under development May-2020
11,019 Under development Dec-2019
56,897 10,978 Planning completed Jun-2022
14,360 38 Planning completed Jul-2020
106,390 6,578 22,278 Planning completed Mar-2021
138,305 48,980 Under planning Jan-2023
5,697 37,162 19,545 18,433 Under development Mar-2019
63,885 14,472 19,425 Under development Jun-2019
151,515 22,969 46,831 Planning completed Jun-2021
44,789 Planning completed Jun-2024
189,000 Under planning TBC
1,211,742 131,909 37,162 19,545 347,579
4,333,442 1,121,448 1,202,612 388,993 2,247,246
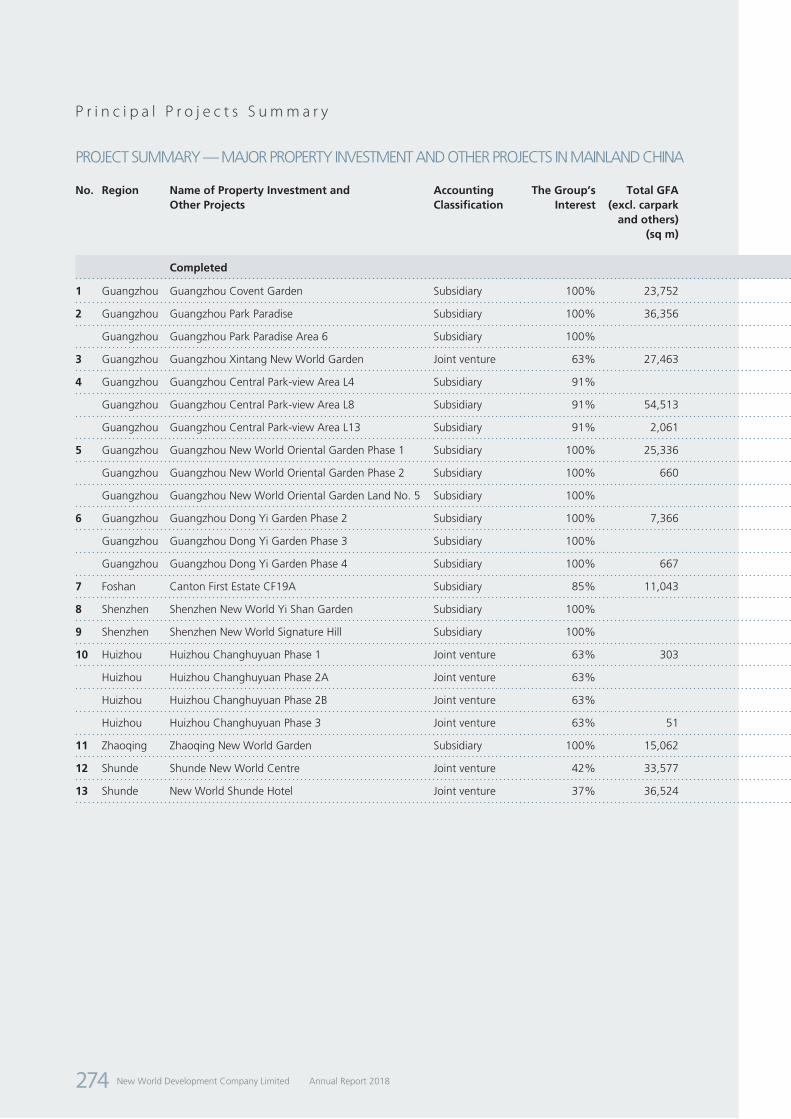
New World Development Company Limited Annual Report 2018274
P r i n c i p a l P r o j e c t s S u m m a r y
PROJECT SUMMARY — MAJOR PROPERTY INVESTMENT AND OTHER PROJECTS IN MAINLAND CHINA
No. Region Name of Property Investment and Other Projects
Accounting Classification
The Group’sInterest
Total GFA (excl. carpark
and others)(sq m)
Completed
1 Guangzhou Guangzhou Covent Garden Subsidiary 100% 23,752
2 Guangzhou Guangzhou Park Paradise Subsidiary 100% 36,356
Guangzhou Guangzhou Park Paradise Area 6 Subsidiary 100%
3 Guangzhou Guangzhou Xintang New World Garden Joint venture 63% 27,463
4 Guangzhou Guangzhou Central Park-view Area L4 Subsidiary 91%
Guangzhou Guangzhou Central Park-view Area L8 Subsidiary 91% 54,513
Guangzhou Guangzhou Central Park-view Area L13 Subsidiary 91% 2,061
5 Guangzhou Guangzhou New World Oriental Garden Phase 1 Subsidiary 100% 25,336
Guangzhou Guangzhou New World Oriental Garden Phase 2 Subsidiary 100% 660
Guangzhou Guangzhou New World Oriental Garden Land No. 5 Subsidiary 100%
6 Guangzhou Guangzhou Dong Yi Garden Phase 2 Subsidiary 100% 7,366
Guangzhou Guangzhou Dong Yi Garden Phase 3 Subsidiary 100%
Guangzhou Guangzhou Dong Yi Garden Phase 4 Subsidiary 100% 667
7 Foshan Canton First Estate CF19A Subsidiary 85% 11,043
8 Shenzhen Shenzhen New World Yi Shan Garden Subsidiary 100%
9 Shenzhen Shenzhen New World Signature Hill Subsidiary 100%
10 Huizhou Huizhou Changhuyuan Phase 1 Joint venture 63% 303
Huizhou Huizhou Changhuyuan Phase 2A Joint venture 63%
Huizhou Huizhou Changhuyuan Phase 2B Joint venture 63%
Huizhou Huizhou Changhuyuan Phase 3 Joint venture 63% 51
11 Zhaoqing Zhaoqing New World Garden Subsidiary 100% 15,062
12 Shunde Shunde New World Centre Joint venture 42% 33,577
13 Shunde New World Shunde Hotel Joint venture 37% 36,524
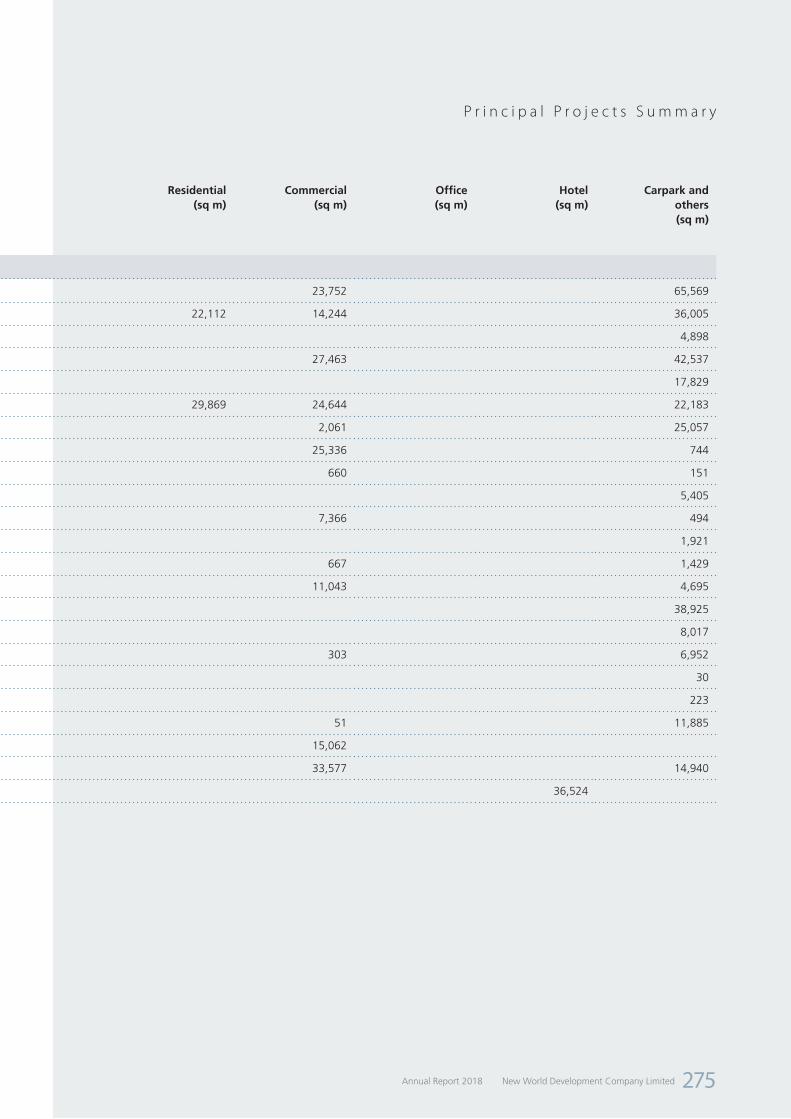
New World Development Company LimitedAnnual Report 2018 275
P r i n c i p a l P r o j e c t s S u m m a r y
Residential(sq m)
Commercial(sq m)
Office(sq m)
Hotel(sq m)
Carpark and others(sq m)
23,752 65,569
22,112 14,244 36,005
4,898
27,463 42,537
17,829
29,869 24,644 22,183
2,061 25,057
25,336 744
660 151
5,405
7,366 494
1,921
667 1,429
11,043 4,695
38,925
8,017
303 6,952
30
223
51 11,885
15,062
33,577 14,940
36,524
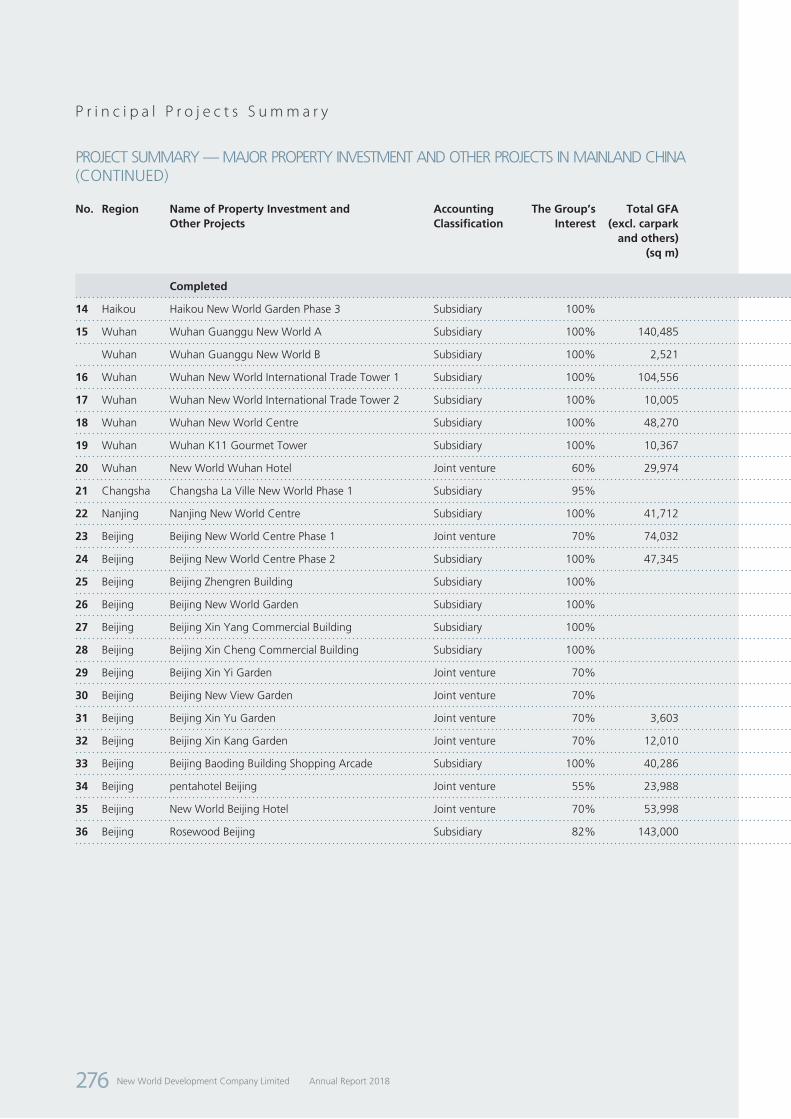
New World Development Company Limited Annual Report 2018276
P r i n c i p a l P r o j e c t s S u m m a r y
No. Region Name of Property Investment and Other Projects
Accounting Classification
The Group’sInterest
Total GFA (excl. carpark
and others)(sq m)
Completed
14 Haikou Haikou New World Garden Phase 3 Subsidiary 100%
15 Wuhan Wuhan Guanggu New World A Subsidiary 100% 140,485
Wuhan Wuhan Guanggu New World B Subsidiary 100% 2,521
16 Wuhan Wuhan New World International Trade Tower 1 Subsidiary 100% 104,556
17 Wuhan Wuhan New World International Trade Tower 2 Subsidiary 100% 10,005
18 Wuhan Wuhan New World Centre Subsidiary 100% 48,270
19 Wuhan Wuhan K11 Gourmet Tower Subsidiary 100% 10,367
20 Wuhan New World Wuhan Hotel Joint venture 60% 29,974
21 Changsha Changsha La Ville New World Phase 1 Subsidiary 95%
22 Nanjing Nanjing New World Centre Subsidiary 100% 41,712
23 Beijing Beijing New World Centre Phase 1 Joint venture 70% 74,032
24 Beijing Beijing New World Centre Phase 2 Subsidiary 100% 47,345
25 Beijing Beijing Zhengren Building Subsidiary 100%
26 Beijing Beijing New World Garden Subsidiary 100%
27 Beijing Beijing Xin Yang Commercial Building Subsidiary 100%
28 Beijing Beijing Xin Cheng Commercial Building Subsidiary 100%
29 Beijing Beijing Xin Yi Garden Joint venture 70%
30 Beijing Beijing New View Garden Joint venture 70%
31 Beijing Beijing Xin Yu Garden Joint venture 70% 3,603
32 Beijing Beijing Xin Kang Garden Joint venture 70% 12,010
33 Beijing Beijing Baoding Building Shopping Arcade Subsidiary 100% 40,286
34 Beijing pentahotel Beijing Joint venture 55% 23,988
35 Beijing New World Beijing Hotel Joint venture 70% 53,998
36 Beijing Rosewood Beijing Subsidiary 82% 143,000
PROJECT SUMMARY — MAJOR PROPERTY INVESTMENT AND OTHER PROJECTS IN MAINLAND CHINA (CONTINUED)

New World Development Company LimitedAnnual Report 2018 277
P r i n c i p a l P r o j e c t s S u m m a r y
Residential(sq m)
Commercial(sq m)
Office(sq m)
Hotel(sq m)
Carpark and others(sq m)
4,286
81,771 58,714 22,188
2,521
104,556 17,272
10,005
45,766 2,504 27,894
10,367 10,580
563 29,411 5,639
4,694
41,712 11,082
74,032 19,956
47,345 28,948
16,415
43,195
3,439
8,051
43,708
11,398
3,603 21,197
12,010 28,185
40,286 22,000
23,988
53,998
143,000

New World Development Company Limited Annual Report 2018278
P r i n c i p a l P r o j e c t s S u m m a r y
PROJECT SUMMARY — MAJOR PROPERTY INVESTMENT AND OTHER PROJECTS IN MAINLAND CHINA (CONTINUED)
No. Region Name of Property Investment and Other Projects
Accounting Classification
The Group’sInterest
Total GFA (excl. carpark
and others)(sq m)
Completed
37 Tianjin Tianjin Xin An New World Plaza Subsidiary 100% 87,053
38 Tianjin Tianjin Xin Hui Hua Ting Subsidiary 100% 25,876
39 Langfang Langfang New World Centre B Subsidiary 100% 7,016
40 Tangshan Tangshan New World Centre Phase 2 Subsidiary 100% 86,061
41 Jinan Jinan New World Sunshine Garden East 2 Subsidiary 100%
Jinan Jinan New World Sunshine Garden West Subsidiary 100% 4,971
42 Shenyang Shenyang New World Garden Phase 1AB Subsidiary 100%
Shenyang Shenyang New World Garden Phase 1D Subsidiary 100%
Shenyang Shenyang New World Garden Phase 1E Subsidiary 100% 5,673
Shenyang Shenyang New World Garden Phase 1XA Subsidiary 100% 5,862
Shenyang Shenyang New World Garden Phase 2A Subsidiary 100% 4,601
Shenyang Shenyang New World Garden Phase 2B Subsidiary 100%
Shenyang Shenyang New World Garden Phase 2D1 Subsidiary 100% 7,911
Shenyang Shenyang New World Garden Phase 2D2 Subsidiary 100% 3,938
Shenyang Shenyang New World Garden Commercial Building Subsidiary 100%
43 Shenyang Shenyang New World Commercial Centre Phase 1 Subsidiary 100%
44 Shenyang Shenyang New World Centre (1) Subsidiary 100%
45 Anshan Anshan New World Garden Subsidiary 100% 4,789
46 Dalian Dalian New World Plaza - Manhattan Tower Subsidiary 88% 49,413
47 Dalian Dalian New World Tower - The Galleria and Hotel Subsidiary 100% 82,401
Grand Total 1,436,451
Remark:(1) Including convention centre

New World Development Company LimitedAnnual Report 2018 279
P r i n c i p a l P r o j e c t s S u m m a r y
Residential(sq m)
Commercial(sq m)
Office(sq m)
Hotel(sq m)
Carpark and others(sq m)
80,439 6,614 11,284
25,876
7,016
37,776 48,285
10,425
4,971
5,500
10,372
5,673 22,517
3,859 2,003
4,601 155,807
56,104
7,911 57,543
3,938
753
8,710
237,934
4,789 133,183
49,413 19,783
29,153 53,248 21,915
51,981 729,286 256,301 398,883 1,411,846
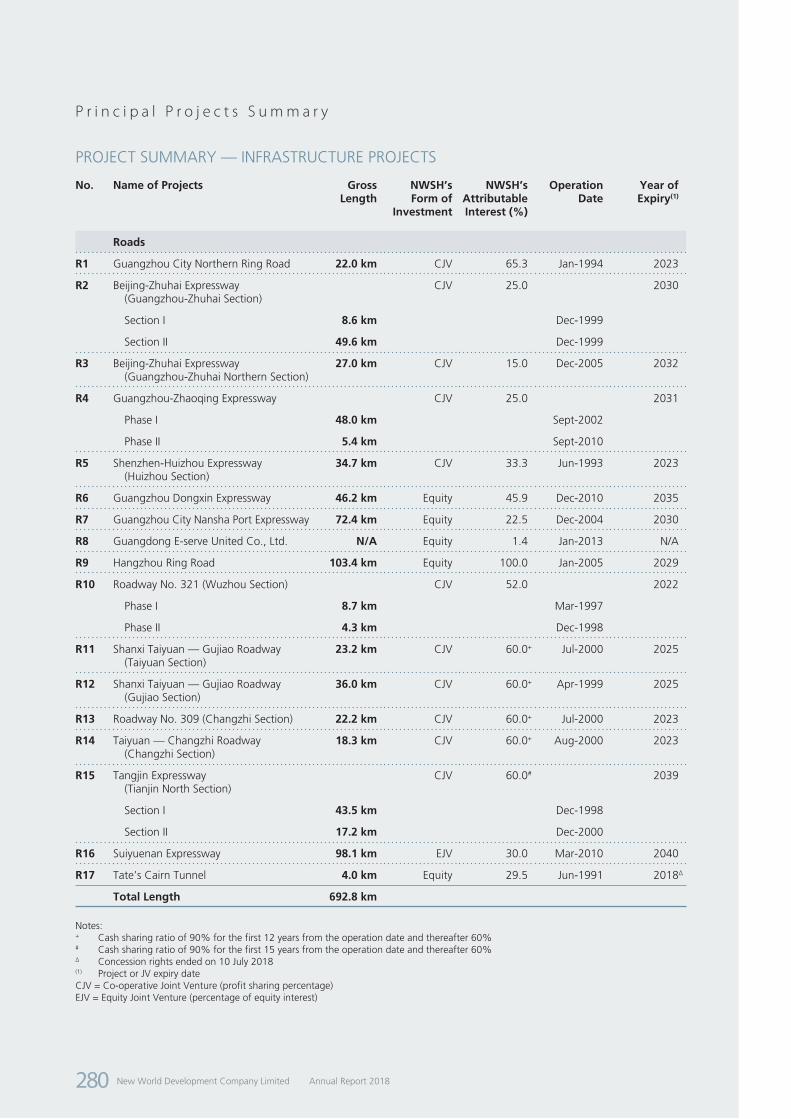
New World Development Company Limited Annual Report 2018280
P r i n c i p a l P r o j e c t s S u m m a r y
PROJECT SUMMARY — INFRASTRUCTURE PROJECTS
No. Name of Projects Gross Length
NWSH’s Form of
Investment
NWSH’s Attributable Interest (%)
Operation Date
Year of Expiry(1)
Roads
R1 Guangzhou City Northern Ring Road 22.0 km CJV 65.3 Jan-1994 2023
R2 Beijing-Zhuhai Expressway (Guangzhou-Zhuhai Section)
CJV 25.0 2030
Section I 8.6 km Dec-1999
Section II 49.6 km Dec-1999
R3 Beijing-Zhuhai Expressway (Guangzhou-Zhuhai Northern Section)
27.0 km CJV 15.0 Dec-2005 2032
R4 Guangzhou-Zhaoqing Expressway CJV 25.0 2031
Phase I 48.0 km Sept-2002
Phase II 5.4 km Sept-2010
R5 Shenzhen-Huizhou Expressway (Huizhou Section)
34.7 km CJV 33.3 Jun-1993 2023
R6 Guangzhou Dongxin Expressway 46.2 km Equity 45.9 Dec-2010 2035
R7 Guangzhou City Nansha Port Expressway 72.4 km Equity 22.5 Dec-2004 2030
R8 Guangdong E-serve United Co., Ltd. N/A Equity 1.4 Jan-2013 N/A
R9 Hangzhou Ring Road 103.4 km Equity 100.0 Jan-2005 2029
R10 Roadway No. 321 (Wuzhou Section) CJV 52.0 2022
Phase I 8.7 km Mar-1997
Phase II 4.3 km Dec-1998
R11 Shanxi Taiyuan — Gujiao Roadway (Taiyuan Section)
23.2 km CJV 60.0+ Jul-2000 2025
R12 Shanxi Taiyuan — Gujiao Roadway (Gujiao Section)
36.0 km CJV 60.0+ Apr-1999 2025
R13 Roadway No. 309 (Changzhi Section) 22.2 km CJV 60.0+ Jul-2000 2023
R14 Taiyuan — Changzhi Roadway (Changzhi Section)
18.3 km CJV 60.0+ Aug-2000 2023
R15 Tangjin Expressway (Tianjin North Section)
CJV 60.0# 2039
Section I 43.5 km Dec-1998
Section II 17.2 km Dec-2000
R16 Suiyuenan Expressway 98.1 km EJV 30.0 Mar-2010 2040
R17 Tate’s Cairn Tunnel 4.0 km Equity 29.5 Jun-1991 2018∆
Total Length 692.8 km
Notes:+ Cash sharing ratio of 90% for the first 12 years from the operation date and thereafter 60%# Cash sharing ratio of 90% for the first 15 years from the operation date and thereafter 60%∆ Concession rights ended on 10 July 2018(1) Project or JV expiry dateCJV = Co-operative Joint Venture (profit sharing percentage)EJV = Equity Joint Venture (percentage of equity interest)

New World Development Company LimitedAnnual Report 2018 281
P r i n c i p a l P r o j e c t s S u m m a r y
PROJECT SUMMARY — INFRASTRUCTURE PROJECTS (CONTINUED)
No. Name of Projects Capacity/Installed Capacity
No. of Projects
NWSH’s Form of
Investment
NWSH’s Attributable Interest (%)
Operation Date
Year of Expiry(1)
Environment
E1 SUEZ NWS Limited Water and wastewater (including industrial)
treatment: 9.12 million m3/day
35 Equity 42.0 May-1985# N/A
Sludge treatment: 2,140 tonnes/day
4
Waste collection and treatment:
9,250 tonnes/day
11
Industrial and municipal waste incineration:
750,800 tonnes/year
8
Landfill and landfill restoration:
96 million m3 (excluding landfill restoration)
9
Total 67
E2 Chongqing Derun Environment Co., Ltd.
N/A Equity 12.6 Oct-2014# N/A
E3 Chongqing Silian Optoelectronics Science & Technology Co., Ltd.
N/A EJV 20.0 Jul-2008 N/A
E4 Zhujiang Power Station — Phase II 620 MW EJV 25.0 Apr-1996 2020
E5 Chengdu Jintang Power Plant 1,200 MW Equity 35.0 Jun-2007 2040
E6 Guangzhou Fuel Company Coal Pier: 7 million tonnes/year
EJV 35.0 Jan-2008 2033
Water and wastewater treatment
9,120,000 m3/day
Sludge treatment 2,140 tonnes/day
Waste collection and treatment 9,250 tonnes/day
Waste incineration 750,800 tonnes/year
Landfill 96 million m3
Power plants installed capacity 1,820 MW
Coal pier handling capacity 7 million tonnes/year
Notes:# Date of incorporation(1) Project or JV expiry dateCJV = Co-operative Joint Venture (profit sharing percentage)EJV = Equity Joint Venture (percentage of equity interest)
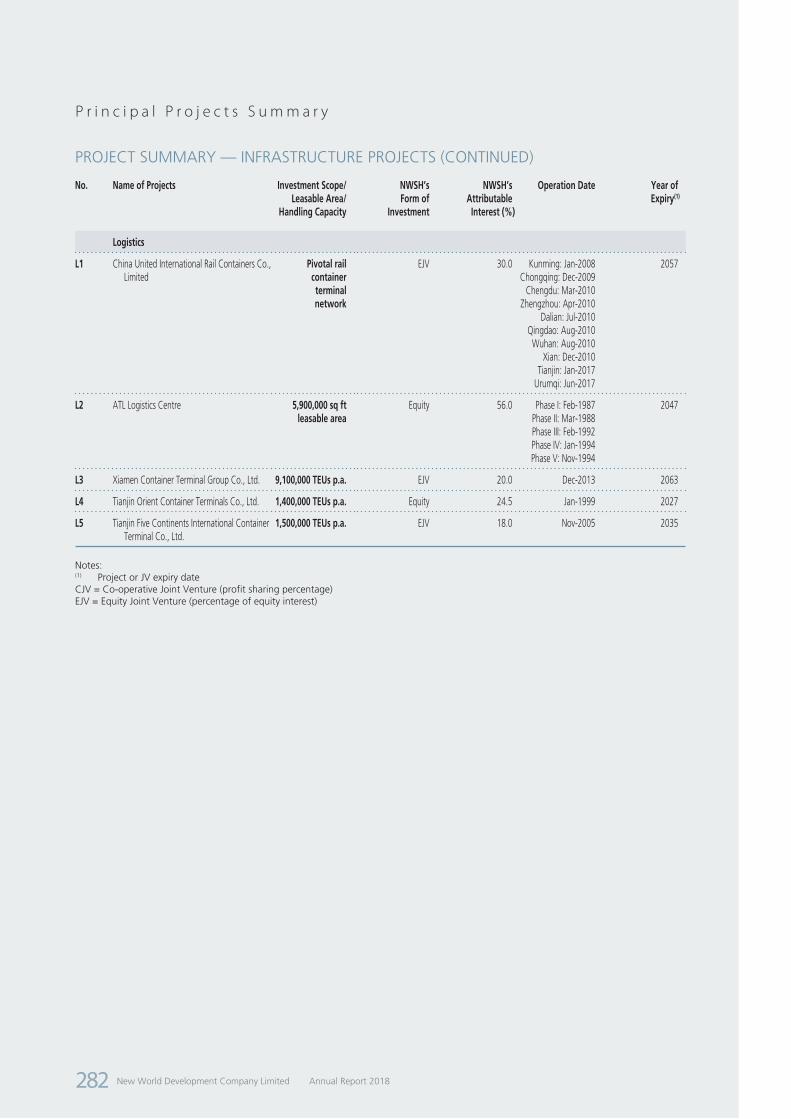
New World Development Company Limited Annual Report 2018282
P r i n c i p a l P r o j e c t s S u m m a r y
PROJECT SUMMARY — INFRASTRUCTURE PROJECTS (CONTINUED)
No. Name of Projects Investment Scope/Leasable Area/
Handling Capacity
NWSH’s Form of
Investment
NWSH’s Attributable
Interest (%)
Operation Date Year of Expiry(1)
Logistics
L1 China United International Rail Containers Co., Limited
Pivotal rail container terminal network
EJV 30.0 Kunming: Jan-2008Chongqing: Dec-2009
Chengdu: Mar-2010Zhengzhou: Apr-2010
Dalian: Jul-2010Qingdao: Aug-2010
Wuhan: Aug-2010Xian: Dec-2010
Tianjin: Jan-2017Urumqi: Jun-2017
2057
L2 ATL Logistics Centre 5,900,000 sq ft leasable area
Equity 56.0 Phase I: Feb-1987Phase II: Mar-1988Phase III: Feb-1992Phase IV: Jan-1994Phase V: Nov-1994
2047
L3 Xiamen Container Terminal Group Co., Ltd. 9,100,000 TEUs p.a. EJV 20.0 Dec-2013 2063
L4 Tianjin Orient Container Terminals Co., Ltd. 1,400,000 TEUs p.a. Equity 24.5 Jan-1999 2027
L5 Tianjin Five Continents International Container Terminal Co., Ltd.
1,500,000 TEUs p.a. EJV 18.0 Nov-2005 2035
Notes:(1) Project or JV expiry dateCJV = Co-operative Joint Venture (profit sharing percentage)EJV = Equity Joint Venture (percentage of equity interest)

New World Development Company LimitedAnnual Report 2018 283
P r i n c i p a l P r o j e c t s S u m m a r y
PROJECT SUMMARY — INFRASTRUCTURE PROJECTS (CONTINUED)
No. Name of Projects Facility/No. of Aircraft
NWSH’s Form of
Investment
NWSH’s Attributable
Interest (%)
Operation Date Year of Expiry(1)
Aviation
A1 Goshawk Aviation Limited No. of Aircraft Owned: 105
Equity 50.0 Oct-2013# N/A
A2 Bauhinia Aviation Capital Limited No. of Aircraft Owned: 6
Equity 50.0 Mar-2016 N/A
A3 Beijing Capital International Airport Co., Ltd. 3 runways and 3 terminals
(total floor area: 1.41 million sq m)
Equity 5.6 Oct-1999# N/A
Notes:# Date of incorporation(1) Project or JV expiry dateCJV = Co-operative Joint Venture (profit sharing percentage)EJV = Equity Joint Venture (percentage of equity interest)

New World Development Company Limited Annual Report 2018284
Glossary of Terms
GENERAL TERMSFY Fiscal year, 1 July to 30 JuneGroup NWD and its subsidiariesHIBOR Hong Kong Interbank Offered RateHK Hong KongHK$ Hong Kong dollar(s), the lawful currency of Hong KongHK$b billion of Hong Kong DollarsHK$m million of Hong Kong DollarsHKEx or Stock Exchange The Stock Exchange of Hong Kong LimitedLIBOR London Interbank Offered RateListing Rules Rules Governing the Listing of Securities on the HKExMainland China The People’s Republic of China excluding Hong Kong, Macau and Taiwan for
the purposes of this annual reportN/A or n/a not applicableNew World or NWD or New World
Development or CompanyNew World Development Company Limited (新世界發展有限公司)
NWCL or New World China Land New World China Land LimitedNWDS or New World Department Stores New World Department Store China LimitedNWSH or NWS Holdings NWS Holdings LimitedPRC The People’s Republic of ChinaRMB Renminbi, the lawful currency of PRCTBC To be confirmedUS The United States of AmericaUS$ or USD United States dollar(s), the lawful currency of USMOP Macau Pataca, the lawful currency of MacauEUR Euro, the official currency of EurozoneTHB Thailand Baht, the official currency of ThailandPeso Philippine Peso, the official currency of the PhilippinesMYR Malaysian Ringgit, the official currency of Malaysia
FINANCIAL TERMSEBITDA Operating profit before depreciation and amortisation, change in fair value of
investment properties and other gains, net and after net exchange differenceGearing Ratio Net Debt divided by total equityNet Debt The aggregate of bank loans, other loans and fixed rate bonds and notes
payable less cash and bank balancesTotal Debt Net Debt plus cash and bank balancesHKFRS Hong Kong Financial Reporting StandardsHKAS Hong Kong Accounting Standards
TECHNICAL TERMSCJV Co-operative joint ventureEJV Equity joint ventureJV Joint ventureWFOE Wholly foreign owned enterprise
MEASUREMENTSkm kilometre(s)m3 cubic metreMW megawatt(s), equal to 1,000kWsq ft square feetsq m square metreTEU or TEUs Twenty-Foot Container Equivalent Unit