FY22 - World Bank Documents & Reports
124
FY22 Unlocking Egypt’s Potential for Poverty Reduction and Inclusive Growth EGYPT SYSTEMATIC COUNTRY DIAGNOSTIC UPDATE OCTOBER 2021 Public Disclosure Authorized Public Disclosure Authorized Public Disclosure Authorized Public Disclosure Authorized
-
Upload
khangminh22 -
Category
Documents
-
view
1 -
download
0
Transcript of FY22 - World Bank Documents & Reports

FY22
Unlocking Egypt’s Potential for Poverty Reduction and Inclusive Growth
EGYPT SYSTEMATIC COUNTRY DIAGNOSTIC UPDATE
OCTOBER 2021
Pub
lic D
iscl
osur
e A
utho
rized
Pub
lic D
iscl
osur
e A
utho
rized
Pub
lic D
iscl
osur
e A
utho
rized
Pub
lic D
iscl
osur
e A
utho
rized

II
CONTENTS
Abbreviations and Acronyms ................................................................................................................... VII
Team Members and Acknowledgments ................................................................................................... VIII
Executive Summary ....................................................................................................................................... i
1 Poverty and Shared Prosperity .............................................................................................................. 1
1.1 Egypt’s Development Experience .................................................................................................... 1
1.2 Poverty, Inequality, and Shared Prosperity ...................................................................................... 2
1.3 Poverty, Human Capital, and Employment ..................................................................................... 7
1.3.1 Education................................................................................................................................. 7
1.3.2 Health and nutrition ................................................................................................................. 7
1.3.3 Human Capital Index .............................................................................................................. 8
1.3.4 Employment and poverty ........................................................................................................ 9
1.4 Poverty and Gender........................................................................................................................ 10
1.5 Impact of COVID-19 ..................................................................................................................... 10
1.6 Diagnostic Framework ................................................................................................................... 11
2 Growth, Investment, Employment, and Productivity .......................................................................... 13
2.1 Benchmarking Egypt’s Growth and Macroeconomic Resilience .................................................. 13
2.2 Growth and Macroeconomic Resilience ........................................................................................ 13
2.3 Growth Decomposition .................................................................................................................. 18
2.3.1 Contribution of total factor productivity, labor and capital factors to per capita GDP growth
– Little growth from labor and capital factors .................................................................................... 19
2.3.2 Labor factor– low labor productivity growth explains low per capita GDP growth ............. 21
2.3.3 Labor productivity–structural change contributed little to labor productivity ...................... 22
2.3.4 Capital and efficiency –growth returns to capital accumulation are declining ..................... 24
3 Labor Market Performance ................................................................................................................. 28
3.1 Employment, Earnings, and Returns to Education ........................................................................ 28
3.2 Constraints to Employment and Earnings Growth ........................................................................ 32
3.2.1 Skills demanded in the labor market ..................................................................................... 33
3.2.2 Employment by firm size ...................................................................................................... 35
3.2.3 Labor market segmentation and informality ......................................................................... 36
3.2.4 Constraints to women’s employment .................................................................................... 38
3.2.5 Constraints affecting employment in agriculture .................................................................. 39
4 Firm Performance ............................................................................................................................... 44
4.1 Firms, Jobs, and Poverty Alleviation ............................................................................................. 44
4.2 Productivity of Manufacturing Firms and Reallocation of Resources ........................................... 47
4.2.1 Low and stagnant productivity .............................................................................................. 47

III
4.2.2 Poor allocation of productive resources ................................................................................ 51
4.3 Stunted Competition ...................................................................................................................... 52
4.4 Lack of Openness as a Constraint to Firm Growth ........................................................................ 55
5 The Role of the State ........................................................................................................................... 58
5.1 High Public Debt as a Constraint to Continued Public Investment–Led Growth .......................... 58
5.1.1 Public sector spending efficiency .......................................................................................... 58
5.1.2 Implications of government debt for macroeconomic resilience .......................................... 59
5.2 The Long Shadow of the Public Sector ......................................................................................... 60
5.3 The Political Economy; the Most Binding Constraint to Reforms ................................................ 64
5.3.1 The state as regulator of the market ...................................................................................... 65
5.3.2 The state as a participant in the market ................................................................................. 68
5.3.3 The state as an emerging investor in the market ................................................................... 69
6 Resilience, Efficiency, and Sustainability ........................................................................................... 71
6.1 Resilience, Efficiency, and Sustainability of the Growth Model ................................................... 71
6.2 Resilience and Efficiency .............................................................................................................. 71
6.2.1 Use of natural resources ........................................................................................................ 71
6.2.2 Household resilience to shocks, social protection, and financial services ............................ 73
6.2.3 The COVID-19 shock ........................................................................................................... 76
6.3 Sustainability ................................................................................................................................. 77
6.3.1 Environment and natural resources use ................................................................................. 78
6.3.2 Water supply ......................................................................................................................... 79
6.3.3 Social sustainability .............................................................................................................. 81
6.3.4 Sustainability of cities and communities, agglomeration, and territorial development ........ 82
7 Pathways to Tackling Poverty Reduction and Inclusive Growth: A New Growth Model.................. 84
7.1 A New Growth Model ................................................................................................................... 84
7.2 Prioritizing Pathways ..................................................................................................................... 84
7.2.1 Priority areas by pathways .................................................................................................... 85
7.2.2 Enablers for a new growth model ......................................................................................... 87
7.3 Policy Recommendations by Priority Areas .................................................................................. 88
7.3.1 Policy areas for Pathway 1: Improve public sector spending efficiency and strengthen
macroeconomic resilience. .................................................................................................................. 88
7.3.2 Policy areas for Pathway 2: Boost private sector investment, firm growth and productivity 89
7.3.3 Policy areas for Pathway 3: Enhance economic inclusion and strengthen households’
resilience ............................................................................................................................................. 90
7.3.4 Policy areas for Pathway 4: Promote resilient, efficient, and sustainability of natural
resource use ......................................................................................................................................... 92
7.3.5 Policies to enhance citizen engagement and data transparency across all pathways ............ 93

IV
References ................................................................................................................................................... 94
Annex A: Data Diagnostics for Egypt ...................................................................................................... 103
Data Openness ...................................................................................................................................... 103
Egypt’s Official Poverty Measurement Methodology .......................................................................... 104
Welfare aggregate ............................................................................................................................. 104
Poverty line ....................................................................................................................................... 104
Poverty trends ................................................................................................................................... 105
Annex B: Growth accounting methodology and data ............................................................................... 106
Figures
Figure Box ES.1 Egypt’s new growth model ............................................................................................ vii
Figure 1.1 Share of population living on US$1.90 and US$3.20 a day in Egypt and regional peers, 2010–
17 .................................................................................................................................................................. 3
Figure 1.2 Gini index for Egypt and peer economies ................................................................................... 4
Figure 1.3 Median consumption, 2010–17 ................................................................................................... 5
Figure 1.4 Consumption growth and shared prosperity, 2010–17 ................................................................ 5
Figure 1.5 Poverty rates by governorates, 2017–18 ...................................................................................... 6
Figure 1.6 Percentage of poor and non-poor children under the age of five year who are stunted, wasted,
or underweight .............................................................................................................................................. 8
Figure 1.7 Percentage of main income earners working before and after first COVID–related lockdown 10
Figure 1.8 Percentage of main income earners (MIE) working in April 2020, by type of employment
before the lockdown .................................................................................................................................... 10
Figure 1.9 Diagnostic framework based on proximate determinants of growth ......................................... 11
Figure 2.1 GDP growth and per capita GDP growth in Egypt, 2004-2019 ................................................ 13
Figure 2.2 Growth in GDP per capita, employment, and employment rate, 2004-19 ................................ 15
Figure 2.3 Year-on-year inflation, January 2000-November 2018 ............................................................. 17
Figure 2.4 Egypt’s economic performance relative to peer economies, 2004–19 ...................................... 17
Figure 2.5: Schematic of factors that contribute to average annual GDP per capita growth: Egypt 2004-19
.................................................................................................................................................................... 19
Figure 2.6 Decomposition of GDP per capita in Egypt and peers, 2004–19 .............................................. 20
Figure 2.7 Decomposition of GDP per capita in Egypt 2004-19, by subperiod ......................................... 21
Figure 2.8 Contribution of labor productivity, employment and labor participation, and demographics to
GDP per capita growth in Egypt and peers, 2004-2019.............................................................................. 22
Figure 2.9 Decomposition of growth in labor productivity (GDP per worker) in Egypt and peers, 2004-
2019 ............................................................................................................................................................ 23
Figure 2.10 Correlation between sectoral productivity growth and changes in employment shares in Egypt
.................................................................................................................................................................... 24

V
Figure 2.11 Gross fixed investment as share of GDP in Egypt and peers, 2004–19 .................................. 25
Figure 2.12 Share of public investment in total gross fixed investments in Egypt and selected peers,
2004–19 ...................................................................................................................................................... 26
Figure 2.13 Incremental capital output ratio (ICOR) in Egypt and peer countries, 2007-19 ...................... 27
Figure 3.1 Labor force participation rates for men and women, 2006–19 .................................................. 29
Figure 3.2 Total number of employed and unemployed people and employment rate, 2006–19 ............... 30
Figure 3.3 Real median and average earnings, 2010–19 ............................................................................ 31
Figure 3.4 Returns to educational attainment among men 25–50, 2018 ..................................................... 32
Figure 3.5 Occupational structure, 1988–98 and 1998–2016 ..................................................................... 34
Figure 3.6 Employment by establishment size and industry....................................................................... 35
Figure 3.7 Returns to education for men in private sector employment, by firm size and type, 2018 ....... 36
Figure 3.8 Share of employment that is informal, 2007–17 ....................................................................... 37
Figure 3.9 Percentage of households relying on agriculture, by consumption quintile and region ............ 42
Figure 5.1 Private sector and public sector credit as percent of GDP, 2011–19 ......................................... 61
Figure 5.2 Shares of credit, by sector, 2008–20 .......................................................................................... 61
Figure 5.3 Real interest rates, February 2016–February 2020 .................................................................... 61
Figure 5.4 Gross domestic savings and gross capital formation rates, 2009–19 ........................................ 61
Figure 5.5 Egypt’s Worldwide Governance Indicators rankings for controlling corruption and regulating
the economy, 2004-2019 ............................................................................................................................. 67
Figure 5.6 Economywide product market regulation score for Egypt and other economies ...................... 68
Figure 6.1 Performance on resilience indicators relative to lower-middle-income countries..................... 72
Figure 6.2 Performance on efficiency indicators relative to lower-middle-income countries .................... 73
Figure 6.3 Coping mechanisms used by households experiencing shocks during previous year ............... 74
Figure 6.4 Percentage of households covered by social protection programs, by wealth quintile and
location ........................................................................................................................................................ 75
Figure 6.5 Performance on sustainability indicators relative to lower-middle-income countries............... 78
Figure 6.6 Sources of demand for water ..................................................................................................... 80
Figure 7.1 Pathways and constraints to poverty reduction and inclusive growth in Egypt ........................ 85

VI
Tables
Table 1.1 Factors contributing to percentage change in per capita household income, 2015–2017/18 ........ 6
Table 1.2 Employment by sector and share of informal and poor workers, 2017 ........................................ 9
Table 2.1 Growth (GDP, per capita GDP, and Labor Productivity) and Employment rates, Egypt and peer
economies, 2004–19 ................................................................................................................................... 14
Table 2.2 Employment to growth elasticities in Egypt and peers, 2004-19 ................................................ 15
Table 2.3 Growth in capital stock, employment, and capital per worker, 2004–19 ................................... 25
Table 3.1 Relative hourly wages, by sector and education level, 1998–2018 (LE, except where indicated
otherwise) .................................................................................................................................................... 33
Table 3.2 Proportion of working-age population whose primary employment was in farming, off-farming
agri-food system, or the non-farm sector, 2007–17 .................................................................................... 41
Table 4.1 Covariance of productivity with market share (2013, 2016, and 2020) ...................................... 51
Table 4.2 Markups in Egypt’s manufacturing sectors, 2013, 2016, and 2020 ............................................ 54
Table 4.3 Markups in selected manufacturing subsectors .......................................................................... 55
Table 6.1 Sources of awareness of measures taken by the government to slow the spread of COVID-19 82
Boxes
Box ES.1 Egypt’s new growth model to unlock its full potential ……………………………………..vii
Box 1.1 Egypt’s performance on the Human Capital Index ......................................................................... 8
Box 2.1 Egypt’s forthcoming demographic window of opportunity .......................................................... 16
Box 3.1: Education quality and returns to education in Egypt ................................................................... 32
Box 4.1 Estimating total factor productivity ............................................................................................... 49
Box 4.2 Estimating markups ....................................................................................................................... 54
Box 5.1 Reducing the role of state-owned enterprises in China ................................................................. 62
VII
Government Fiscal Year:
July 1 – June 30
Currency Equivalents:
Exchange Rate Effective as of September 29, 2021
Currency Unit = Egyptian Pound (LE)
1 USD= 15.70 LE
Weights and Measures:
Metric System
Abbreviations and Acronyms
CAPMAS Central Agency for Public Mobilization and Statistics
EA Economic Authority
ELMPS Egypt Labor Market Panel Survey
ERF Economic Research Forum
FTE full-time equivalent
GDP Gross Domestic Product
HCI Human Capital Index
HIECS Household Income, Expenditure, and Consumption Survey
ICOR incremental capital to output ratio
IMF International Monetary Fund
LE Egyptian pound
LFS Labor Force Survey
MENA Middle East and North Africa
MFN most favored nation
NSDS National Strategy for the Development of Statistics
OECD Organisation for Economic Co-operation and Development
OP Olley and Pakes
PM10 particular matter with diameter of 10 microns or less
PM2.5 particular matter with diameter of 2.5 microns or less
PMR Product Market Regulation
PPP purchasing power parity
SCD Systematic Country Diagnostics
SOE state-owned enterprise
SWF sovereign wealth fund
TFP total factor productivity
TKP Takaful and Karama programs
VAT value-added tax

VIII
Team Members and Acknowledgments
The report was prepared by a team led by Alvaro Gonzalez and Nistha Sinha. The core team consisted of
Sara Alnashar, Eduardo Alonso Malasquez Carbonel, Pablo Fleiss, and Imane Helmy (up to September
2020). Frederic Aubery, Uche Eseosa Ekhator-Mobayode, and Jala Youssef contributed to specific chapters
of the report. The preparation of the report benefited from overall coordination and advice provided by SCD
Focal Points: Ibrahim Chowdhury (up to June 2020), Maria Laura Sanchez Puerta, Mark Ahern, Mena
Cammett, Nada Farid, Oliver Braedt, and Yasmine El-Hini. The report draws on the contributions of the
following colleagues: Adeel Abbas Syed, Amal Faltas, Aminur Rahman, Amira Kazem, Amr Elshalakani,
Bridget Crumpton, Cornelia Jesse, Eric Dunand, Graciela Miralles, Harika Masud, Hoda Youssef, Hosam
Hassan, Irina Klytchnikova, Iryna Postolovska, Jonna Lundvall, Laila Abdelkader, Martin Heger,
Mohamed Nada, Nahla Zeitoun, Nancy Gracia, Nataliya Biletska, Paul Brenton, Rajesh Balasubramanian,
Sameh El-Saharty, Sandra Broka, Somik Lall, and Souraya El Assiouty. The report also draws on the
Country Private Sector Diagnostic, the 2020 Egypt Economic Monitor, and background analytical work
coordinated by Irina Klytchnikova (agriculture and labor markets) and Gladys Lopez Acevedo (exports and
labor markets). Caroline Krafft and Ragui Assaad led background research on the characteristics of informal
and formal firms. The report has been enriched with the thoughtful comments received during discussions
with the Egypt Country Office, the Egypt Country Team, and MENA Chief Economist Office. Suhair Al-
Zubairi and Enas Mahmud provided outstanding administrative support. The consultations with
stakeholders would not have been possible without the excellent organization of the virtual events by Lina
Abdelghaffar.
The report was prepared under the overall guidance of Marina Wes, Nadir Mohamed, Walid Labadi, Kevin
Carey, and Johannes Hoogeveen, and with substantive inputs from Sherif Hamdy, Robert Bou Jaoude, and
Janette Uhlmann. Benu Bidani and Najy Benhassine advised the team when work on the report commenced.
The team thanks Ferid Belhaj, Sergio Pimenta, and Ethiopis Tafara for their valuable guidance.
The team is grateful for comments received from the peer reviewers Samuel Freije-Rodriguez and Leonardo
Iacovone. The report benefitted from virtual consultations held in April 2020 and June 2021 with
government, private sector, think tanks, academics, civil society, and development partners. The team
would like to thank the participants for their valuable feedback and comments.

i
Executive Summary
Systematic Country Diagnostics (SCDs) analyze the most critical constraints and opportunities to ending
extreme poverty and promoting shared prosperity in a sustainable manner. The first SCD for Egypt was
published in 2015. A lot has happened since then, so this SCD Update takes advantage of a longer stretch
of reforms and newer data up to 2019 to identify and again assess the set of priorities through which Egypt
can most effectively and sustainably achieve the goals of poverty reduction and shared prosperity.
When the previous SCD was written, the surge in the youth population was an emerging opportunity—a
boost to the working age population for a dynamic economy—and correspondingly also a source of rising
aspirations and needs that the economy would have to meet. The SCD also took note of potentially major
reforms, including on taxation and subsidies, that had been launched in 2015. These reforms have offered
the beginning of a renewal of the social contract: universal subsidies would be replaced by a better-targeted,
scalable system; the distortions from trying to maintain an unaffordable system would be corrected, and the
savings would provide space to expand social spending and reduce debt, all with the ultimate goal of job-
rich, sustainable growth.
Egypt successfully revitalized growth by adopting the first wave of ambitious economic reforms
Egypt entered the global pandemic with reserve buffers rebuilt and macroeconomic vulnerabilities reduced.
Real Gross Domestic Product (GDP) grew by 5.6 percent in 2019, up from an average rate of 4.6 percent
in the previous three years. Thanks to fiscal consolidation and energy subsidy reforms, the fiscal deficit was
trending downward. External accounts were stabilizing at broadly favorable levels. Exchange rate
liberalization eliminated distortions in the foreign exchange market, corrected the excessive real
appreciation in the exchange rate, and led to a depreciation of the Egyptian pound (LE). Social mitigation
measures, notably the poverty-targeted Takaful and Karama programs, helped cushion the most vulnerable
groups from the impact of those reforms. Egypt also introduced education reforms focused on improving
the quality of learning and took steps toward achieving universal health coverage.
The pandemic interrupted this progress, putting a significant strain on the health system and the economy.
Real growth declined to 3.6 percent in 2020, although remaining higher than in many other economies. This
economic slowdown has raised concerns about people’s welfare. The poorest Egyptians, many of whom
lost their jobs or faced reduced incomes, have been among the worst hit. Almost a third of the population
was poor before COVID-19 pandemic hit and even as the economy grew, there was limited creation of jobs
to productively employ the country’s expanding working-age population.
To safeguard the success of the first wave of economic reforms and recover strongly from the health crisis,
Egypt must prioritize policy actions that support job creation and productivity growth. This will be crucial
to build pathways out of poverty, support shared prosperity, and create conditions for the economy to
become green, resilient, inclusive, and sustainable.
Egypt has the potential to make significant gains in poverty reduction and inclusive
growth
Official figures indicate an increase in poverty between 2015 (27.8 percent) and 2017 (32.5 percent). This
worsening of poverty is associated with the sharp rise in inflation following the November 2016 currency
depreciation. Recently published official poverty estimates for 2019 suggest some gains in people’s welfare
three years after the introduction of economic reforms. Nevertheless, the poverty rate remains elevated at
29.7 percent, higher than the share of the population assessed as poor in 2015. Based on the international
poverty line of US$1.90 a day, Egypt’s poverty rate rose from 1.6 percent in 2015 to 3.8 percent in 2017.
The share of the population living on US$3.20 a day rose from 18.2 percent in 2015 to 28.9 percent in
2017—despite per capita GDP growth. As a result, the poverty-to-GDP growth elasticity is positive for this
period: growth happened while poverty increased. While this is usually not the experience in peer

ii
countries,1 it is consistent with a low labor share of income in national accounts as well as an increase in
inequality.
Pursuing shared prosperity calls for promoting growth in consumption spending of the bottom 40 percent
of the population. Per capita consumption growth between 2012 and 2017 was negative for all households.
The bottom 40 percent of the distribution were disproportionately hit, however.
The previous SCD reported similar patterns in poverty reduction and shared prosperity for the 2005-2010
period.
Long-term trends also point to a weak impact of GDP growth on labor income and jobs which affects the
poor and the non-poor. Between 2015 and 2017, all households experienced a contraction in real incomes
as income growth was weak and did not keep pace with inflation. For the top 60 percent of the income
distribution, this reduction in real income came mainly from lower labor earnings. For the poorest 40
percent it was a combination of lower labor earnings as well as a reduction in the share of employed working
age adults. Increase in transfer incomes (likely supported by cash transfers program) helped mitigate some
of the reduction in real income of the poorest 40 percent.
Spatial disparities in poverty endure. Rural poverty is higher than poverty in urban areas, reflecting the low
productivity agriculture practiced by small-holder farmers and a weak process of transformation from farm
to non-farm livelihoods. Upper Egypt governorates have among the highest poverty rates; they host about
40 percent of the population but 50 percent of the poor population. Poverty in Assiout and Sohag is twice
as high as the national poverty rate.
Egypt’s growth model has not delivered the level of productivity growth or the productive
utilization of labor and capital needed to sustainably lift incomes
This pattern of limited progress on poverty reduction and income growth is a symptom of challenges related
to the level and structure of growth—the way in which labor, capital, and productivity contribute to growth.
Movement of workers and capital resources to high productivity activities can lift incomes of the poor and
the middle class. And job creation in these productive sectors will enable a growing population of youth to
find employment.
Studying how Egypt’s growth model performs relative to peer countries is helpful for identifying pathways
that can bridge the disconnect between GDP growth and household incomes growth. Egypt’s growth differs
from that of peer countries in several ways.
As in most peer countries, per capita GDP increased mainly as a result of increases in total factor
productivity (TFP) rather than how productively the economy used labor and capital. What is unusual is
that compared with peer countries, Egypt gets less output from labor and capital use. This inefficiency in
labor and capital use occurred in a context of high population growth. As a result, Egypt’s per capita GDP
has not caught up with that of peers over the last 15 years (2004–19).
At 2.5 percent per year, growth in output per worker (labor productivity) is low compared with most peers.
This low labor productivity growth likely reflects the fact that workers are moving to sectors such as private
manufacturing, transport and logistics, and construction (sectors that had the largest gains in employment),
where productivity is declining or barely growing.
Compared to peer economies, Egypt’s employment rate is low; capital accumulation is low as well. The
private sector’s share of total investment is small. At the same time, the share of public investment in total
investment is higher in Egypt than in peers, at almost 60 percent in 2018 before dropping to 50 percent in
2019, thanks to an increase in private investments in new energy projects.
1 The SCD update considers the following countries as Egypt’s peers: Indonesia, Jordan, Malaysia, Mexico, Morocco, Pakistan,
Peru, Poland, the Philippines, Sri Lanka, Tunisia, Turkey, Ukraine, and Vietnam.
iii
Overall, returns to capital investment (reflected in a rising incremental capital to output ratio [ICOR]) have
fallen over time, suggesting that investment has become less efficient. Given the importance of public sector
investments in total investment, this decline in returns to capital investment indicates that it would be
important to ensure that public investment goes to high growth sectors of the economy.
Egypt has strong human capital potential
Egypt has significantly expanded educational attainment since the 1980s. The share of illiterate adults fell
sharply between 1988 and 2018. The number of students graduating with vocational education and
university degrees grew significantly. The policy priority today is to improve the quality of learning and its
labor market relevance.
How has the economy engaged the growing and educated workforce? Employment has grown, but it has
not kept pace with the growth in the working-age population. As a result, the employment rate (share of
working-age population employed) fell. While education quality could be a reason, it cannot fully account
for the decline in the employment rate observed. Nearly 6 million additional jobs would have to be created
between 2019 and 2030 just to keep the employment rate at the 2019 level. Between 2009 and 2019, the
economy added only about 3 million jobs, most of them informal and in construction. In fact, informality
in employment has increased significantly over time. The inability to fully engage the rapidly growing
working-age population in the economy and enjoy a boost in growth (“demographic dividend”) through a
dynamic process of rising incomes and savings (which could in turn finance investment) was a major loss.
Unemployment has fallen recently. Since unemployment in Egypt is concentrated among youth it is linked
to the challenge of finding first jobs rather than lay-offs. Periods when a large youth cohort has entered the
labor market have tended to coincide with a rise in unemployment. Correspondingly, when the size of the
youth cohort has declined, as it did in the late 2010s, unemployment has fallen as well.
Not only has the employment rate declined, earnings (assessed in real terms) have fallen as well (with some
stabilizing recently). This combination of declining employment rates and earnings suggests weak job
creation and demand for workers. The decline in earnings may have discouraged young men from staying
engaged in the labor market. Men’s labor force participation rates declined from 75 percent in 2010 to 67
percent in 2019, mainly as a result of lower participation by young men. Women’s labor force participation
rates have also fallen over the same time period from 23 percent to 16 percent.
More education does not necessarily translate into a large gain in earnings in Egypt. Because of the
reduction in public sector hiring, the large informal sector, the concentration of employment in
microenterprises, and limited formal job growth in small- and medium-size enterprises, more education—
whether university or technical and vocational education—has translated into only meager gains in
earnings. Issues related to quality of primary and secondary education and labor market relevance of
university or technical and vocational education programs can explain these low returns only to some
extent.
The type of occupations and sectors where employment has grown over time do not necessarily require
high-skilled labor. As a result, skilled labor is not in high demand, and to the extent that demand is there,
the tertiary education system is not generating a well-matched skills mix. The 2019 Global Competitiveness
Index ranks the skills of Egypt’s current workforce to be 99 out of 141 countries. The skills of Egypt’s
future workforce are assessed to rank at 133 out of 141 countries.
Indeed, demand for low- and middle-skilled jobs (such as in construction and transport) has been growing
while the employment in the public sector, a source of high skilled jobs, has fallen. Since women are less
likely to work in construction or transport it is not surprising that their work participation has fallen. For
women, factors such as care responsibilities and gender norms pose additional obstacles to working.

iv
As high-wage, high-skilled jobs are not growing and there are more workers with university education than
demanded by the labor market, the wage gap between less educated and university-educated workers has
narrowed.
Labor markets appears to function in a segmented way which can further reinforce the low demand for
workers. The segmentation appears to be along the lines of firm type, public-private sector, geographic
regions, and between formal-informal parts of the economy. Two workers with the same level of education
will earn different wages depending on the type of firm or sector (public/private) they find employment in.
Workers also do not make easy transitions from informal to formal employment, private to public sector
job, or across governorates. Formal jobs remain concentrated in metropolitan areas, Lower Egypt
governorates, and governorates that are near Cairo. This geographic segmentation of the labor market
correlates with higher poverty rates in Upper Egypt governorates.
The poor cannot afford to be unemployed, and their employment levels are not significantly lower than
those of other groups of the population. However, they are mainly engaged in agriculture or in non-
agricultural informal work in construction, transport and wholesale and retail trade.
The private sector can be an important engine for jobs-rich growth
The Egyptian economy could be characterized as a large country with small and underdeveloped markets.
Egyptian firms grow more slowly than firms in peer countries, at least partly because of limited market
competition and segmented markets. In addition, if firm-level productivity is stagnant, wages will be as
well. Private sector firms run into diminishing returns quickly when they expand.
A large share of jobs is in smaller, older establishments that do not grow and tend not to exit. The
predominance and persistence of small establishments results in very few job opportunities, and those that
do arise pay low wages.
Egypt has fewer larger firms than other economies. Larger firms are job creators, especially for the middle
class. Large firms produce jobs that are increasingly more productive, pay higher wages, and provide the
kind of job stability and benefits that is the foundation for a strong middle class.
Although some informal firms may be entrepreneurs (with more education) who will eventually cross the
threshold to formality, the informal sector overall is not an incubator for what could be young, formal firms
that will grow and produce jobs, and improve owner’s education and firm productivity. Many informal
micro and small firms are not linked to the formal economy. Formal and informal firms operate in different,
segmented markets, stranding the majority of workers employed in the informal sector.
Firms are relatively undercapitalized, using more labor than comparators. Undercapitalization could be the
result of low returns to capital, the lower relative cost of labor (given declining wages), and/or misallocation
of credit.
Firm-level productivity growth is nearly stagnant, probably because the economy is not competitive and
relatively closed.
To grow, firms need open markets, where they could exploit the country’s comparative advantages and
create firms that could be global leaders. This should be an easier transition for Egyptian firms that could
use a large domestic market for scale. As markets integrate, economies specialize, become key links in
global value chains, exploit new technologies, and host foreign direct investment.
A cross-cutting reason for low private sector investment and stagnant economy-wide productivity growth
relates to the role of the state. The state borrows heavily from the domestic banking system, likely crowding
out private sector lending. To alleviate the demand on the domestic financial sector, the state can borrow
externally, but this brings vulnerabilities to a “sudden stop,” a risk faced by many emerging markets.
Moreover, the state is present in sectors as a shareholder and manager as well as a regulator. While the state
might assess the presence or potential entry of a state-owned civilian or non-civilian enterprise in terms of

v
a gap not being filled by the private sector, the prospect of entry can have a dampening effect on private
sector investment (both foreign and domestic), creating uncertainty about an ex post change in the rules of
the game. The state’s regulatory regime can be bureaucratic and opaque, creating public sector discretion
in the application of its rules and regulations and a benefit to being a “known” firm.
Resilience, efficiency and sustainability of the growth model are also a concern
Egypt’s growth model is inseparable from its natural resources. The combination of vulnerabilities faced
by Egypt – high dependence on a single water source, surrounded by desert, and a large population – is
unique, and it is overlaid by climate change. Although Egypt is quite resilient to natural disasters, it faces
risks from depletion of natural resources—mainly water and clean air. Climate change exposes Egypt to
increased frequency of droughts and heatwaves, sea level rise and coastal erosion, increased water stress,
land loss, and agricultural productivity. This will put additional burden on the poor who disproportionally
rely and obtain income from nature-based sources and tend to live in high risk areas. Climate change
therefore acts as a threat multiplier, exacerbating vulnerabilities and risks to economic, social, and political
stability. Focusing on building resilience and improving resource use efficiency, as well as raising the
ambition on climate change mitigation and adaptation provides an unprecedented opportunity to boost long-
term economic competitiveness and sustainable development.
A greener growth model is critical to help tackle these challenges. Fuel subsidy reforms and investments in
the Benban solar park, and the Gabel El Zeit wind farm have created the conditions for sustainable growth.
Since 2019, the climate agenda has also increasingly become a focus for the government. In September
2020, Egypt became the first country in the Middle East and North Africa (MENA) region to issue green
bonds.
Like in so many countries around the world, the recent COVID-19 pandemic has intensified many pre-
existing economic challenges, while highlighting the key role of digital technologies in both response and
recovery periods.
The pandemic has also tested households’ resilience. But even before this crisis, in 2018, a quarter of the
population reported being food insecure, as high inflation interacted with a need for revamping the food
subsidy program. Since then, the expansion of Takaful and Karama programs have helped to protect the
poorest segments of the population. Social protection programs do offer a recourse in the case of shocks,
but they need to be comprehensive and adaptive and will need a larger tax base and expenditure
reallocation within the social protection portfolio for a sustainable expansion. Financial inclusion plays an
important role as well.
While any growth process is imperfect, feedback mechanisms provide essential information about what is
not working, to which policymakers can react. Egypt underperforms on key indicators of social
sustainability, including on voice and accountability, and citizens’ engagement is limited by low data
transparency. There is scope for Egypt to advance voice and accountability, transparency, and regulatory
governance, and channels for citizen engagement to facilitate learning by doing and enhance the
sustainability of growth.
Egypt can realize its full ambition and growth potential by making a shift to a new
growth model
As Egypt builds on the gains from the first wave of reforms and tackles the pandemic, the growth model
for the country to unlock its full potential has to be one that fully optimizes the country’s resources, human
and natural (see Box ES 1). For a country to transform its growth model is not a simple task but the good
news is that the economic reform program set in motion in 2016 has created the necessary conditions for
success. Realizing the new growth model which brings jobs and productivity growth will require staying
the course set by the first wave of reforms and implementing additional, deeper reforms, including to

vi
incentivize green growth. These deeper reforms and their implementation will enable the country to
improve private sector growth, productivity, and create the conditions for firms to compete globally.
Box ES.1 Egypt’s new growth model to unlock its full potential
The SCD recommends a new growth model for Egypt to tap its full potential where labor and capital
accumulation and productivity growth come together to engender sustained high growth that is:
1. led by private sector expansion which in turn is financed by a stable and development-oriented
financial sector;
2. based on inclusive and poverty-reducing growth linked to jobs created by the private sector and
bringing more women into the labor force; and
3. anchored in a level playing field and fair competition, with a complementary openness to
regional and global markets.
Figure Box ES.1 Egypt’s new growth model
This growth model furthers the recommendations of
the previous SCD for an economic transformation
that moves Egypt closer to its goals and ambitions
including to create private sector generated jobs for
Egypt’s growing population. The diagnostic analysis
in this SCD indicates that this transformation is
crucial for Egypt to reach its full potential achieving
growth with shared prosperity and poverty
reduction. Egypt’s first wave of reforms established
a policy stance of movement away from regressive
universal price subsidies and towards more effective
social protection, particularly for the poor, and made
investments in green initiatives such renewable
energy. The new growth model will build on this
progress to bring about poverty reduction and
income growth via greater economic inclusion, particularly of women, and rooted in robust, resilient,
and sustainable economic growth.
The diagnostic analysis in this SCD points to four pathways to arrive at this growth model: namely, (i)
efficient and higher public spending on key social and physical infrastructure and pursuit of
macroeconomic resilience; (ii) more effective economic role of state as well as greater openness to boost
private sector investment, firm growth, and productivity; (iii) greater economic inclusion and
strengthened household resilience; and (iv) resilient, efficient, and sustainable natural resource use and
preparation for climate impacts. A cross-cutting pathway will ensure that policy making is informed by
greater engagement of stakeholders (citizens and the private sector) and transparent use of data and
evidence. This is crucial for fostering a shared vision of the economic transformation needed.
Together these pathways emphasize a growth model centered around the importance of human capital
accumulation and protection—education, health and social safety nets where the government has already
undertaken important reforms. Further improving the quality of educational investments would allow the
full exploitation of technological inflows likely to result from more open markets. Higher quality
Private sector expansion for higher capital accumulation
Jobs in the private sector for a growing and more
educated cohort of women and men
Openness to international markets and FDI, and fair competition

vii
education pays off in the presence of rapid technological change. In addition, the primary effect of
education is to facilitate the ability to deal with rapid change that results from more dynamic markets.
Underpinning this model is macroeconomic stability based on low fiscal deficits, a flexible exchange
rate and transparent and prudent foreign borrowing. In this growth model macroeconomic stability is
coupled with persistently high rates of investment in plant, equipment, and infrastructure. High
investment rates must be accompanied by high savings rates to mitigate the balance of payments
vulnerabilities that have derailed past growth episodes. Implicitly, this requires policies to increase the
developmental focus of the banking system, and to make it more accessible to non-traditional savers,
raising the levels of financial savings. To reach its full potential, Egypt must seize the opportunity,
through policy reforms, for reaping the growth and inclusion dividends of the rise in the share of working
age population expected to occur between 2025 and 2040. The prospect for higher per capita growth,
stemming from private sector job creation and investment, would improve the economy’s chances of
achieving the poverty reduction and inclusive growth prioritized by this SCD.
Four pathways will expand opportunities for high productivity activities that will encourage
firms to grow and where workers can find good jobs
The four pathways are the basis for a new growth model to boost investment, employment, and productivity
growth with sustainability and resilience. In order of priority, these pathways are as follows (Figure ES.1):
• Pathway 1: Improve public sector spending efficiency and strengthen macroeconomic resilience.
• Pathway 2: Boost private sector investment, firm growth, and productivity.
• Pathway 3: Advance economic inclusion and strengthen household resilience.
• Pathway 4: Promote resilient, efficient, and sustainable natural resource use.
• Cross-cutting pathway relates to strengthening citizen and firm engagement with the state and data
transparency to ensure social sustainability and to build the public’s and investors’ trust in the
Government’s economic program and reform efforts.
viii
Figure ES.2 Pathways and constraints to poverty reduction and inclusive growth in Egypt
Source: World Bank, based on diagnostic analysis.
Pathway 1, the top priority area for action in the new growth model, addresses constraints to public spending
allocation patterns. Its goal is to redirect public resources toward high returns and efficient investment,
which will help private sector investment and productivity, support macroeconomic resilience, and address
the resource misallocation that drives employment toward low-skilled employment. Egypt committed to
increasing public spending as part of its pandemic response. This pathway calls for ensuring that capital
spending, which is particularly needed in health and education sectors, is efficient and equitable. Increased
health spending is needed to equip the public health system with the supply chains and resources needed to
roll out the COVID-19 vaccine. Using a climate lens, through the budgeting and resource allocation process,
in addressing these constraints will also be important.
Pathway 2 is the next priority area in the new growth model. It addresses constraints to competition and
labor demand in the economy. Constraints in this area arise from markets that are relatively protected from
external competition and that are not well integrated spatially. Among the constraints to private sector
expansion and firm growth are the policy uncertainty, conflicts of interest, and an unlevel competitive field
that arise from the state’s activities.
Pathway 3 recognizes the need for greater economic inclusion and forms the third priority area of the new
growth model. Since most employment growth will likely take place within the informal sector in the near
Wh
at w
ill
it t
ake
to a
chie
ve
pover
ty r
edu
ctio
n a
nd
in
clu
sive
gro
wth
su
stai
nab
ly?
Pathway 1: Improve public sector spending efficiency and strengthen macroeconomic resilience
Constraint 1.1: Public investment (mostly in infrastructure) progressively yields lower returns and is inefficient.
Constraint 1.2: Education spending is low and with limited link to learning/quality.
Constraint 1.3: Public health spending is low relative to needs and population growth.
Constraint 1.4:High public sector borrowing exposes the economy to macroeconomic shocks.
Pathway 2: Boost private sector investment, firm growth, and productivity
Constraint 2.1: State's footprint as investor creates uncertainty, stifling private investments.
Constraint 2.2: State's role as regulator adds uncertainty, conflict of interest, and lowers productivity.
Constraint 2.3: State's role as market participant introduces uncertainty and unfair competition, stifiling private investment.
Constraint 2.4: Domestic markets are relatively closed to international trade, thwarting competition and innovation.
Constraint 2.5: Domestic markets are segmented, stifling competition and adding unnecessary costs to the economy.
Pathway 3: Advance economic inclusion and strengthen household resilience
Constraint 3.1: The labor market is segmented (spatially); labor demand is low and skewed toward low skills; informal sector productivity is low.
Constraint 3.2: Care responsibilities and gender norms limit female employment, reducing the economy's potential.
Constraint 3.3: Fragmented social protection leaves many poor households vulnerable to shocks.
Pathway 4: Promote resilient, efficient, and sustainable natural resource use
Constraint 4.1: Agricultural practices and water use reduce sectoral sustainability.
Constraint 4.2: Air pollution exacerbates health problems.
Constraint 4.3: Rapid territorial development affects sustainability.
Cross-cutting constraints: Limited mechanisms for feedback provision and participation by citizens and the private sector, and
limited data transparency

ix
term, tackling constraints to productivity in this sector will be needed especially as the economy recovers
from the pandemic. For women, additional constraints to employment, such as care responsibilities, will
need to be addressed as well. This pathway also paves the way for a stronger and integrated system of social
insurance and social protection in general to support informal workers as well as Egyptian households’
economic resilience.
Pathway 4, the fourth priority area, addresses constraints to resilience, efficiency and sustainability of the
growth model, consolidating and reinforcing progress on Pathways 1-3. Egypt’s natural resource
endowments are being used in unsustainable ways that particularly affect water resources, and specifically
agriculture, an important source of employment and food security. The shift toward more efficient and
sustainable use of water and less polluting fuels, along with drinking water management, can increase the
sustainability of the development model—although it may necessitate measures that raise the user costs of
fuels and natural resources, according to the user pays principle, with protection for the poor. Facilitating
the development of a green economy can generate growth and improve lives in ways that are consistent
with sustainable development.
Several of the elements of the new growth model can be addressed with the increased adoption and use of
digital technologies. Digital technologies can provide opportunities to increase the productivity and
improve market access of the private sector, increase the efficiency of public expenditures, enhance the
cost-effectiveness of public services, and provide citizens and businesses a platform for voice and the means
to hold government accountable.
Identifying reform areas is one element of the transformation that Egypt needs. The other is an ability to
reach consensus on the meaning and ramifications (in terms of winners and losers) of reform among key
national stakeholders. Given Egypt’s track record on adopting and implementing reforms, an assessment of
feasibility of the proposed package of reforms is important.
Most of the private sector—represented by micro, small- and medium-size enterprises, and members of
civil society, especially workers and grassroots organizations—is not well-organized in the debate over
Egypt’s economic reform strategy. Egypt has a history of landmark reforms aimed at inclusive growth: land
reform in the 1950s, openness to foreign investment in the 1970s, and private sector development and
privatization in the late 1990s to mid-2000s. Each of these three waves over the last 70 years were intended
to create more empowered citizens and lessen reliance on an overstretched, indebted state. Yet in retrospect
they are perceived as having petered out too quickly and been captured by crony capitalism, rather than
raising Egypt as a whole.
The potential now exists for another set of landmark reforms. Developing a robust system of engagement
by citizens and firms will be crucial to this process to boost inclusion and empowerment. A strong system
of using data and evidence to guide reform implementation and adjustments is important as is the active
engagement of stakeholders to build consensus and ownership around prospective reforms.
The actions taken by policymakers today will shape the future of Egypt’s children and youth. Half of the
country’s population is younger than 24 years old. A child born in Egypt today will be 49 percent as
productive when she grows up as she could have been had she benefited from complete education and full
health. Clean air and sustainable access to water—achieved through better stewardship of the
environment—will also be critical for a productive future.
Given the positive impact of the 2016 reforms, Egypt’s leadership has a reservoir of credibility which it can
use to implement bold actions for more prosperous social outcomes, by focusing on inclusion, greater job
creation and productivity, fostering resilience and preservation of natural assets for future generations, and
emphasizing sustainability. Its citizens—and future citizens—deserve that leadership.

1
1 Poverty and Shared Prosperity
Key findings on Egypt’s development experience:
• Between 2004 and 2019, the Egyptian economy expanded at a pace in line with that of many
middle-income peers.
• Egypt entered the pandemic with reserve buffers. Real growth declined to 3.6 percent in 2020,
although remaining higher than in many other economies.
• Growth in Egypt has not been inclusive. Progress on reducing poverty and boosting shared
prosperity has not been commensurate with the economy’s growth performance.
1.1 Egypt’s Development Experience
1. Prior to the COVID-19 crisis, the Egyptian economy grew in line with that of many middle-income
countries. The Gross Domestic Product (GDP) averaged 4.5 percent per year over a 15-year period (2004-
2019). This average growth rate covers periods of accelerated growth of 7.0 percent (2005-08) and 5.4
percent (2017-19), well above that of middle-income peers. These growth spurts occurred in a context of
bold economic reforms, covering macroeconomic stabilization, fuel subsidy reduction, and privatization of
state owned enterprises (2004-05).
2. The impressive ability of the Egypian economy to achieve strong overall growth has been
accompanied by little progress on per capita income growth or socioeconomic conditions of Egyptian
houseohlds. This pattern of limited progress on poverty reduction and income growth is a symptom of
fundamental challenges related to the level and structure of growth. As a result of a number of factors
related to productivity and structure of growth, Egypt’s poverty rates have not fallen even during periods
of high growth:
3. First, accounting for population growth, Egypt’s GDP per capita growth averaged 2.4 percent
(2004-18), 2 percentage points below that of middle-income country peers.
4. Second, a growing share of the working age population was not absorbed into employment. The
share of employed in the working-age population has been low and declined, even during the episodes of
accelerating growth. As a result, Egypt may not have obtained the full growth-boosting effects of a large
working age population during 2000-2010 (“demographic dividend”). Women and youth’s employment
rates also remain particularly low.
5. Third, growth has been based on employment opportunities created either in low value-added
sectors or in sectors that have experienced a productivity decline. The share of informal employment has
also grown. The construction sector, a labor-intensive sector employing informal workers, saw a boom in
employment but low productivity growth. The economy has had little success in creating well-paying
productive jobs in the private sector.
6. The pandemic has adversely affected growth and the economy is forecasted to grow by 2.3 percent
during fiscal year 2020-21. Tourism, manufacturing, the Suez Canal, and oil and gas extractives continue
to be impacted by travel restrictions, the slump in demand, and disruptions to domestic and global supply
chains and trade. The lower growth will make it difficult for the economy to generate significant poverty
reduction or raise shared prosperity. In light of Egypt’s population dynamics and a forecasted sharp rise in
the working age population in 2025-30, action now is urgent and can generate significant payoffs.
7. As the country builds on the benefits of the first wave of economic reforms and recovers from the
pandemic, unlocking the economy’s potential to reduce poverty and promote shared prosperity will require

2
faster productivity and employment growth led by the private sector. The World Bank’s Systematic Country
Diagnostics (SCD) are conducted to identify the set of priorities through which countries can most
effectively and sustainably achieve the goals of poverty reduction and shared prosperity. The previous
Egypt Systematic Country Diagnostic (SCD 2015) (World Bank Group 2015) studied the country’s
development experience prior to 2014, including the 2004-2008 high-growth period, and found little
progress in poverty reduction and shared prosperity even during the period of rapid growth. Based on this
analysis and reflecting the urgent need for restoring growth and macroeconomic stability in the post-2011
period, the 2015 SCD recommended policies that addressed both the underlying sectoral constraints to
inclusive and environmentally sustainable growth, as well as the urgent need to restore macroeconomic
stability via sustainable macroeconomic management, energy subsidy reform, and public governance
reform.
8. Much has been accomplished by the Government of Egypt (GoE) since the 2015 SCD was
published. Fiscal consolidation measures boosted government revenues and reined in public expenditures
through sustained energy subsidy reform and control of the public sector wage bill. On the revenue side, a
new value-added tax (VAT) regime was introduced, and a gradual decline in the fiscal deficit was achieved,
(although the reported budget sector public debt ratio remained elevated). The reforms paved the way for
reduced public spending on regressive energy subsidies, creating fiscal space for increased social spending
and an incentive to reduce the economy’s reliance on fuel use. The introduction of a modern and
comprehensive investment law, a new industrial licensing law, and a progressive insolvency law laid the
groundwork for a dynamic private sector participation in the economy as macroeconomic conditions
improved. However, progress was more limited on reforms related to governance (such as on data
transparency) and sectoral constraints to inclusive and sustainable growth.
9. This SCD Update analyzes the Egyptian economy’s development experience with a focus on the
period since the first SCD. It extends the years studied by the previous SCD which was published in 2015
and used data up to 2012. This report analyzes the period between 2004 and 2019 to best leverage data
availability and cover important reform efforts undertaken since the 2015 SCD was published. Data from
2020 were partially available when the analysis was being carried out and were included where possible
such as the 2020 World Bank Enterprise survey.
10. The report identifies pathways to achieving growth anchored in improved productivity and
employment outcomes. Overall, the report’s analysis reiterates the need for a new growth model that
expands market opportunities for the private sector to invest, grow, and create productive jobs.
11. This chapter describes progress on poverty, inequality, and shared prosperity. It also introduces the
diagnostic framework used by the SCD Update.
1.2 Poverty, Inequality, and Shared Prosperity
12. The share of the population living in extreme poverty (US$1.90 a day in 2011 purchasing power
parity [PPP] dollars) rose from 1.5 percent in 2012 to 3.8 percent in 2017, and the share living on US$3.20
a day rose from 19 percent to 28.9 percent (Figure 1.1). The official estimates of poverty for the same period
were 30.4 percent in 2012, 27.8 percent in 2015, and 32.5 percent in 2017. Both international and official
poverty estimates show some gains between 2012-15 which were reversed by 2017. Reduction in poverty
between 2012 and 2015 can be attributed to increases in social spending after the 2011 revolution (World
Bank 2019). The increase in poverty between 2015 and 2017 is linked to the double-digit inflation which
occurred following the November 2016 currency depreciation and greatly eroded purchasing power
(Alazzawi and Hlasny 2020; World Bank 2019). Recently published official estimates of poverty of 29.7

3
percent suggest that there was some improvement in people’s purchasing power prior to COVID-19.
Nevertheless, the estimated poverty rate in 2019 remains above that in 2015.2
13. This pattern of limited progress on poverty reduction was observed in the 2000s as well. The
previous SCD found that the share of the population living below the 2005 poverty line increased from 19.6
percent in 2005 to 24.3 percent in 2010.
Figure 1.1 Share of population living on US$1.90 and US$3.20 a day in Egypt and regional peers, 2010–17
a. Share of population living on US$1.90 a day (Sustainable Development [SDG] Goal 1)
b. Share of population living on US$3.20 a day
Source: World Development Indicators (WDI).
Note: Poverty rates reported are for survey years. Poverty is measured using consumption.
2 The official poverty estimates are based on poverty lines that can be considered to be relative poverty lines, with the real value of
the lines changing over time and reflecting the most recent consumption patterns of the population (see annex A for methodological
details). The poverty rates are therefore not strictly comparable over time as they are not estimated against a fixed poverty line like
the international poverty rates are. Thus, although the published national poverty rate in 2019 (29.7 percent) is lower than in 2017
(32.5 percent), it is not directly comparable because it is based on a different poverty line. Further analysis and construction of a
comparable poverty series will be possible when the 2019 Household Income, Expenditure, and Consumption Surveys (HIECS)
microdata are published.
0
1
2
3
4
5
6
7
2010 2011 2012 2013 2014 2015 2016 2017
Per
cent
of
po
pula
tio
n
Egypt (2010-2017) Tunisia Turkey Middle East and North Africa
0
5
10
15
20
25
30
35
2010 2011 2012 2013 2014 2015 2016 2017
Per
cent
of
po
pula
tio
n
Egypt (2010-2017) Tunisia Turkey Middle East and North Africa

4
14. Between 2012 and 2017, poverty increased even as the economy grew and new social mitigation
measures were introduced. At the US$3.20 line, the change in poverty between 2012 and 2017 translates
into a positive poverty-to-GDP growth elasticity of 7.5. For most countries, the poverty-to-GDP growth
elasticity is negative, ranging from –3.5 to –0.5 (Haughton and Khandker 2009). Between 2010 and 2017,
all of Egypt’s peer countries except Ukraine experienced negative poverty-to-GDP growth elasticities,
ranging from –1.0 in Sri Lanka to –4.0 in Malaysia and Mexico.
15. Inequality increased in the recent period, which can help explain the lack of progress in poverty
reduction despite growth. Inequality in consumption, measured by the Gini index, fell from 30.2 to 28.3
between 2010 and 2012 before rising to 31.5 in 2017. The inequality in income also rose between 1998 and
2018 (Said, Galal, and Sami 2019). Globally, a Gini index of 30.0–31.5 is low (Figure 1.2). But in Egypt,
the figure may reflect the national household survey’s limited coverage of rich households—a problem
common to most surveys. Studies that have sought to correct for the missing consumption information of
rich households find that the Gini index in Egypt is much higher. Using housing prices to adjust for the top
incomes, for example, van der Weide, Lakner, and Ianchovichina (2016) estimate that the Gini index for
consumption for urban areas of Egypt may have been as high as 47 in 2008. In addition to the possible
under-coverage of rich households in surveys, inequality measured using consumption might be low
because of the declining marginal propensity to consume from income. When measured using income rather
than consumption, Gini index for Egypt is found to 50 which is closer to that of Brazil. Van der Weide,
Lakner, and Ianchovichina (2018) estimate a Gini index for income of 52 for urban areas in 2008. Alvaredo,
Assouad, and Piketty’s (2019) correction for top incomes shows the MENA region to have high inequality.
Their adjustments result in a higher Gini index of 54 for Egypt in 2015, indicating a high level of inequality.
Figure 1.2 Gini index for Egypt and peer economies
Source: World Development Indicators (WDI) accessed June 15, 2021.
Note: Gini index measures the extent to which the distribution of income (or, in some cases, consumption expenditure) among
individuals or households within an economy deviates from a perfectly equal distribution. A Gini index of 0 represents perfect
equality, while an index of 100 implies perfect inequality.
16. Household consumption growth, as measured by the household survey, shows a reduction in
consumption over time when adjusted for inflation. The median monthly per capita consumption dropped
between 2010 and 2017, with some gains in the intervening years (Figure 1.3). Shared prosperity, as
measured by growth in households’ per capita consumption, also did not show any gains (Figure 1.4). Just
0
5
10
15
20
25
30
35
40
45
50
Ukraine
(2019)
Poland
(2018)
Egypt
(2017)
Pakistan
(2018)
Tunisia
(2015)
Vietnam
(2018)
Sri Lanka
(2016)
Malaysia
(2015)
Turkey
(2019)
Mexico
(2018)
Gin
i In
dex

5
as in the 2005–10 period, households’ consumption growth was negative between 2012 and 2017. Over this
seven-year period, the poorest 40 percent of the population (the “bottom 40 percent”) experienced a
contraction in consumption of 0.97 percent a year. The sharpest contraction in the consumption of the
bottom 40 percent occurred in 2015–17, when the economy experienced a resumption in GDP growth and
a sharp rise in inflation following the 2016 currency depreciation.
Figure 1.3 Median consumption, 2010–17 Figure 1.4 Consumption growth and shared
prosperity, 2010–17
Source: World Bank calculations using HIECS data. Source: World Bank calculations using HIECS data.
17. Egypt data has long shown limited transmission of aggregate growth to household consumption
growth (see Verme 2014; World Bank Group 2015). The low labor share of income in national accounts
can partially explain the lack of poverty reduction during periods of growth. The capital remuneration (gross
operating surplus and mixed income of companies) has been close to 70 percent of GDP or higher since
2006. The labor share, or compensation of employees, has remained close to 30 percent of GDP over 2006-
2016. Morsy, Antoine, and Sanchez (2014) report a declining trend in labor income share for the 2000-
2010 period. A persistently low labor share of income reflects the performance of labor productivity.
Chapter 2 shows that Egypt’s labor productivity growth has been below that of peer economies. In his study
of the 2000-09 period when household consumption contracted during a high growth period, Verme (2014)
points to another factor that could play role. National accounts data for this period shows that most of the
growth went to nonfinancial institutions (private enterprises). The observed contraction in household
incomes and consumption in this period suggests that private enterprises did not distribute this growth
through wages or dividends.
18. The deterioration in living standards between 2015 and 2017–18 was linked to worsening labor
incomes (Table 1.1). A micro-decomposition of household income change shows that almost all of the
contraction in per capita income experienced by the top 60 percent of the distribution came from declining
labor income. For the poorest 40 percent, declining labor income accounted for 80 percent of the contraction
in per capita income; the smaller share of employed adults in the household accounted for the remaining 20
percent. The increase in the share of adults in the household offset the decline in incomes. Social protection
income (non-labor income)—including transfers which grew over this period, particularly for the poor—
helped offset the decline in incomes of the bottom 40 percent but not for the top 60 percent of the population.
137
143
147
129
115
120
125
130
135
140
145
150
2010-11 2012-13 2015 2017-18
Med
ian
mon
thly
per
cap
ita
con
sum
pti
on
(20
11
pu
rch
asin
g p
ow
er p
arit
y d
oll
ars)
-0.97
-2.51
-5.16
-0.53
-1.14
-4.97
-6
-5
-4
-3
-2
-1
0
2010-2017 2012-2017 2015-2017
Per
cen
tage
chan
ge
in a
nn
ual
per
cap
ita
con
sum
pti
on
Consumption growth of bottom 40 (% per year)
Consumption growth of all (% per year)

6
Table 1.1 Factors contributing to percentage change in per capita household income, 2015–2017/18
Part of the income distribution (by per capita income)
Factor Bottom 40 percent Top 60 percent
Change in share of adults in the household 0.1 13.9
Change in share of working adults –22.0 –4.2
Labor income –79.4 –94.5
Nonlabor income 1.2 –15.2
Source: World Bank, based on data from the 2015 and 2017 Household Income, Expenditure, and Consumption Surveys
(HIECS).
Note: The results are based on Shapley decomposition of components of per capita income change (Azevedo, Sanfelice, and
Nguyen 2019).
19. The disparities across Egypt’s regions found in poverty assessment reports dating back almost two
decades (World Bank 2002, 2007, 2010) are still present today (Figure 1.5). Spatial disparities were marked
in 2017, especially between rural and urban areas in Upper Egypt. The poverty rate was 37.7 percent in
rural areas and 24.8 percent in urban areas. Upper Egypt governorates have among the highest poverty
rates, with some, such as Assiout and Sohag, experiencing a rate that is twice the national rate. The poor
are concentrated in Upper Egypt, which is home to about 40 percent of the population but about 50 percent
of the poor population (Lower Egypt, with a similar population share, accounts for a little over 30 percent
of the poor). Metropolitan areas’ share of the poor is in line with their population shares. These spatial
patterns have persisted, with some differences, such as the near doubling of Cairo’s poverty rate, from 18
percent in 2015 to 30 percent in 2017.
Figure 1.5 Poverty rates by governorates, 2017–18
Source: World Bank, based on data from the 2017 Household Income, Expenditure, and Consumption Survey (HIECS).
Note: Estimates are based on the national poverty measurement methodology.
0
10
20
30
40
50
60
70
Port
Sai
d
Ale
xan
dri
a
Suez
Cai
ro
Gh
arbey
a
Dam
iett
a
Dak
ahle
ya
Kaf
r el
sh
eikh
Qal
you
bia
Shar
key
a
Men
oufi
a
Ism
aili
a
Beh
eira
Fay
ou
m
Giz
a
Ben
i S
uef
Qen
a
Asw
an
Men
ia
Lux
or
Soh
ag
Ass
iout
Bo
rder
gov
erno
rate
s
Tota
l
Metropolitan areas Lower Egypt Upper Egypt Border regionsTotal
Po
ver
ty r
ate
(Per
cent)

7
20. Monetary poverty in Egypt is highly correlated with other indicators of poverty. The poor are more
likely to live in households with more members, have higher dependency rates (share of children under 14
and people 65 and older), live in smaller dwellings, and have higher rates of overcrowding. They also tend
to live in dwellings of lower quality: 83 percent live in a dwelling with cement walls, and 18 percent have
dirt floors (compared with 95 and 2.5 percent among non-poor households, respectively). Poor households
generally have both lower access to and lower quality of services. Not surprisingly, they also have limited
resources with which to acquire durable goods. Only 12.0 percent have a personal computer, 8.7 percent
own a smartphone, 3.6 percent have an air conditioning unit at home, and a mere 0.7 percent own a car.
Ownership rates among the nonpoor are 43.0, 28.7, 13.7, and 10.9 percent, respectively.
1.3 Poverty, Human Capital, and Employment
21. The 2015 SCD identified progress on human development indicators that had occurred since the
2000s. Indicators of child mortality, life expectancy, and educational attainment had improved dramatically;
gender gaps in education were closing in urban areas; and regional gaps were narrowing in education and
health outcomes.
1.3.1 Education
22. With concerted efforts to expand education, Egypt substantially reduced illiteracy rates. The share
of illiterate adults fell from 57 percent in 1988 to 30 percent in 2018. The increase in educational attainment
largely reflected the expansion in vocational education and, to some extent, in university education (Krafft,
2018).
23. A generation ago, 80 percent of Egyptians had less than a primary education, and only about 4.0
percent had at least a university degree (World Bank 2019). By 2015, the share of individuals 25 years old
and older without a primary level diploma had plummeted to 41.5 percent, and the share with a university
degree had reached 14.5 percent. The changes among the poor were positive, albeit less impressive than
those of the general population. Among the poor, more than 90 percent of the father’s generation lacked a
primary diploma; among the current generation, the share is 60 percent. Across all groups, the educational
level that observed the largest increases was a secondary level technical certificate. The intergenerational
gains in education experienced by the population as a whole were weaker among the poor and residents of
Upper Egypt. Nationwide, 50 percent of people 25 and older attained more education than their parents did;
for the poor and people living in rural Upper Egypt, this rate was only 36.4 and 38.9 percent, respectively.
24. Poor women are one of the groups with the lowest human capital accumulation in Egypt. The low
level of human capital puts them at disadvantage in the labor market, making it hard for them to find a
sustainable path out of poverty (World Bank 2019). About 70 percent of women 25 and older lack a primary
level diploma, and less than 3 percent have a university degree or more. Poor women also show even lower
educational mobility than the poor population as a whole, with only about 28 percent of them reaching an
educational level that was higher than that of their fathers. About 75 percent of women whose father did
not complete primary also did not attain this level, and only 3 percent were able to complete postsecondary
education. Only a quarter of women whose father had a university degree also attained this level of
education. The corresponding rate among the poor population as a whole was about 46 percent.
1.3.2 Health and nutrition
25. The share of the population reporting a chronic disease is high (23 percent on average) and
increasing with age (64 percent among individuals 50 and older), according to data from the 2017–18
Household Income, Expenditure, and Consumption Survey (HIECS). At every age, women are more likely
than men to report having a chronic disease. The incidence of chronic disease is higher among the better-
off than the less well-off, and in urban and metro areas than in rural areas, possibly because people with
limited access to health care (because of poverty or location) are less likely to be diagnosed with a chronic
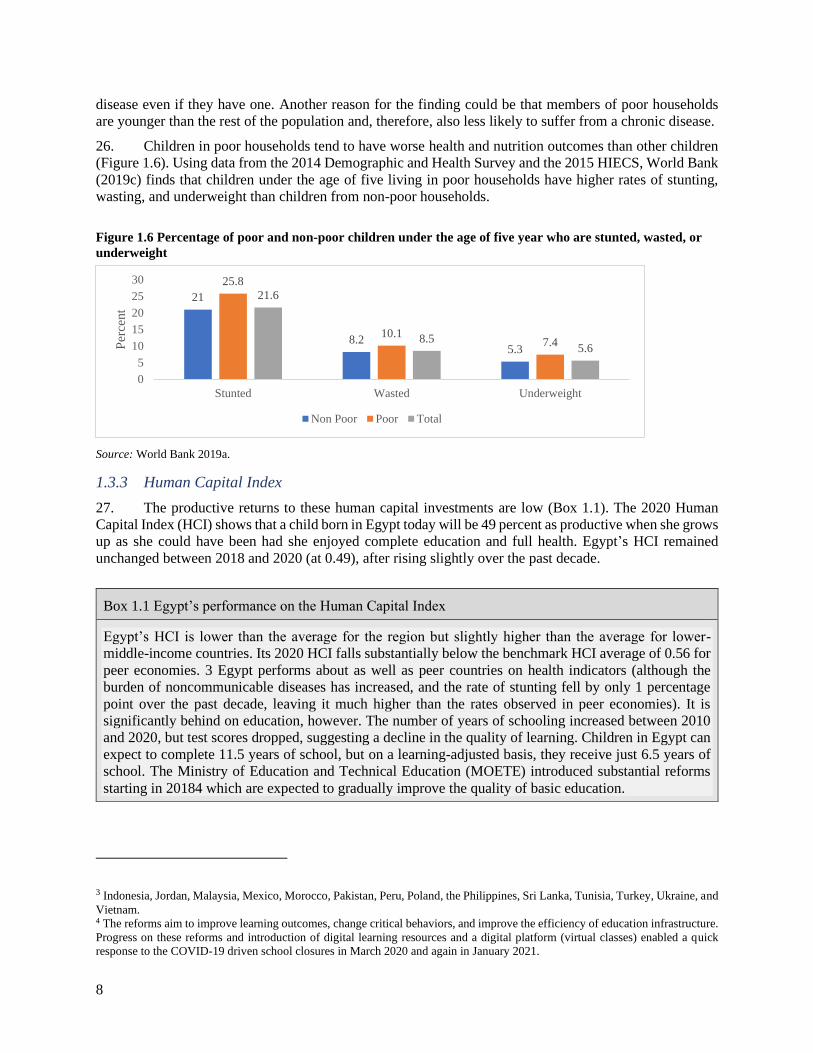
8
disease even if they have one. Another reason for the finding could be that members of poor households
are younger than the rest of the population and, therefore, also less likely to suffer from a chronic disease.
26. Children in poor households tend to have worse health and nutrition outcomes than other children
(Figure 1.6). Using data from the 2014 Demographic and Health Survey and the 2015 HIECS, World Bank
(2019c) finds that children under the age of five living in poor households have higher rates of stunting,
wasting, and underweight than children from non-poor households.
Figure 1.6 Percentage of poor and non-poor children under the age of five year who are stunted, wasted, or
underweight
Source: World Bank 2019a.
1.3.3 Human Capital Index
27. The productive returns to these human capital investments are low (Box 1.1). The 2020 Human
Capital Index (HCI) shows that a child born in Egypt today will be 49 percent as productive when she grows
up as she could have been had she enjoyed complete education and full health. Egypt’s HCI remained
unchanged between 2018 and 2020 (at 0.49), after rising slightly over the past decade.
Box 1.1 Egypt’s performance on the Human Capital Index
Egypt’s HCI is lower than the average for the region but slightly higher than the average for lower-
middle-income countries. Its 2020 HCI falls substantially below the benchmark HCI average of 0.56 for
peer economies. 3 Egypt performs about as well as peer countries on health indicators (although the
burden of noncommunicable diseases has increased, and the rate of stunting fell by only 1 percentage
point over the past decade, leaving it much higher than the rates observed in peer economies). It is
significantly behind on education, however. The number of years of schooling increased between 2010
and 2020, but test scores dropped, suggesting a decline in the quality of learning. Children in Egypt can
expect to complete 11.5 years of school, but on a learning-adjusted basis, they receive just 6.5 years of
school. The Ministry of Education and Technical Education (MOETE) introduced substantial reforms
starting in 20184 which are expected to gradually improve the quality of basic education.
3 Indonesia, Jordan, Malaysia, Mexico, Morocco, Pakistan, Peru, Poland, the Philippines, Sri Lanka, Tunisia, Turkey, Ukraine, and
Vietnam. 4 The reforms aim to improve learning outcomes, change critical behaviors, and improve the efficiency of education infrastructure.
Progress on these reforms and introduction of digital learning resources and a digital platform (virtual classes) enabled a quick
response to the COVID-19 driven school closures in March 2020 and again in January 2021.
21
8.25.3
25.8
10.17.4
21.6
8.55.6
0
5
10
15
20
25
30
Stunted Wasted Underweight
Per
cent
Non Poor Poor Total

9
1.3.4 Employment and poverty
28. Men are mainly engaged in services and industry while women are concentrated in services and
agriculture (Table 1.2). Other than agriculture, women are mostly engaged in education, wholesale and
retail trade, health, and public administration. Men are mainly employed in construction, wholesale and
retail trade, manufacturing, and transportation and storage. Informal employment is pervasive, accounting
for more than 30 percent of employment in all sectors other than utilities, public administration, education,
health, and financial and insurance services. In construction, the sector that has added the greatest number
of jobs over time, 91 percent of employment is informal. The highest shares of working poor are found in
agriculture, construction, transportation and storage, manufacturing, and wholesale and retail trade. Sectors
like mining and accommodation and food services, and administrative and support services have about a
third of workers who are poor but these sectors each employ a small share of workers.
Table 1.2 Employment by sector and share of informal and poor workers, 2017 Share in total
male
employment
(15-64) (%)
(1)
Share in total
female
employment
(15-64) (%)
(2)
Share in total
employment
(15-64) (%)
(3)
Share of
informal
employment
within each
sector (%
informal)
(4)
Share of
poor
workers
within each
sector (%
poor)
(5)
Agriculture, forestry 16.8 22.4 18.0 98.1 42.0
Industry
Mining and quarrying 0.4 0.1 0.3 66.0 31.4
Manufacturing 13.4 7.0 12.0 64.2 29.7
Electricity, gas and water (utilities) 0.9 0.3 0.8 12.3 11.3
Water supply; sewerage 0.7 0.3 0.6 34.5 38.2
Construction 15.4 0.5 12.2 90.7 41.8
Services
Wholesale and retail 14.9 17.0 15.4 86.9 29.5
Education 5.4 24.1 9.4 16.6 15.2
Public administration 8.3 9.0 8.5 8.9 21.4
Transportation and storage 9.4 0.5 7.5 60.2 33.0
Human health and social services 1.7 10.0 3.5 29.0 19.5
Accommodation and food services 3.9 1.1 3.3 84.1 34.6
Professional, scientists 1.7 1.2 1.6 47.5 15.7
Administrative and support services 1.5 0.6 1.3 62.2 30.1
Information and communication 0.8 0.8 0.8 44.6 13.4
Financial and insurance 0.5 0.9 0.6 13.3 10.9
Arts, entertainment a 0.5 0.5 0.5 56.0 22.1
Real estate activities 0.3 0.1 0.2 87.7 10.0
Source: World Bank estimates based on HIECS 2017-18 data.
Note: Within Columns 1,2, and 3, shares add up to 100. Informal wage workers, employers, and self-employed are those that do
not participate in social security. For informal wage workers, no participation in social security overlaps to a large extent with a
lack of contract. Column 5 reports share of workers who live below the 2017 official poverty line. This Table is based on the HIECS
because it allows the study of working poor. The sectoral employment statistics could differ from those reported by Labor Force
Surveys discussed in Chapter 3.

10
1.4 Poverty and Gender
29. An estimated 3.7 percent of Egypt’s population lives in a household in which only women work
(World Bank 2019). Households with female breadwinners or main income earners tend to have higher
consumption levels and lower poverty rates than other households. According to HIECS 2015 data, almost
half of Egypt’s population live in households in which there is only one employed male member. Another
14 percent live in households with more than one male earner but no employed women.
30. Households in which only women work are less likely to be poor than households in which only
men work, even though households with one or more female main income earners tend to have lower
salaries, lower incomes from agricultural activities, and lower incomes from non-agricultural businesses
than households with one or more male breadwinners. Part of the explanation is demographic: These
households are smaller and their dependency rates lower. The main reason for their higher consumption
levels and total income is that monetary transfers to households with female breadwinners are four times
higher on average than monetary transfers to households with male breadwinners. These transfers include
social protection (pensions) income, as well as other private transfers, such as remittances.
1.5 Impact of COVID-19
31. The first wave of measures introduced to contain COVID-19 reduced people’s income and hit
informal wage workers harder than the rest of the labor force. Following the declaration of a national public
health emergency on March 17, 2020, the government restricted travel and established a curfew, required
restaurants and cafés to remain closed, and limited opening hours for other businesses. The results of a
phone survey conducted at the end of April, just before restrictions started to be relaxed, provide evidence
that COVID-19 prevention measures led to a large drop in the proportion of working adults still active.
Nationally, the share of individuals identified as the main income earner in their household that were
working fell from 79 percent in February/March to 47 percent in April 19–25, 2020 (Figure 1.7).
32. Informal wage workers (defined as workers lacking a contract or workers who do not make social
security contributions) were more likely to be inactive or to work less than usual under the lockdown. Only
44 percent of them were working in April 19–25, a much lower figure than the 69 percent of formal wage
workers (formal private sector) who were still employed) (Figure 1.8) And among informal wage workers
who were still working, 80 percent declared working less than usual.
Figure 1.7 Percentage of main income earners working
before and after first COVID–related lockdown
Figure 1.8 Percentage of main income earners (MIE)
working in April 2020, by type of employment before
the lockdown
Source: Phone survey conducted in April 2020 by Baseera.
Note: Respondents are main income earners in the household.
Source: Phone survey conducted in April 2020 by Baseera.
Note: Respondents are main income earners (MIE) in the
household.
79% 80% 78% 78% 82%
47% 48% 46% 47% 45%
0%10%20%30%40%50%60%70%80%90%
Total Urban Rural Male Female
Location Gender
Before lockdown on April 19-25

11
33. Poverty is likely to increase as a result of the pandemic and lower GDP growth—particularly if the
slowdown also reduces employment or incomes (assuming consumption and employment changes are
sensitive to changes in aggregate growth). A World Bank microsimulation based on sectoral GDP
projections and using HIECS 2017 data suggests that the headcount poverty rate (at the US$3.20 line) could
increase by 0.32–0.54 percentage points as a result of the pandemic. 5 If the slowdown mainly affects the
formal sector, the increase in poverty will likely be 0.32 percentage points. If the slowdown mainly reduces
informal sector incomes (as it appears to have done), the poverty rate is expected to increase by 0.54
percentage points. In both scenarios, the increase is simulated to be slightly larger in urban than in rural
areas.
1.6 Diagnostic Framework
34. This SCD Update uses a diagnostic framework that is based on the two immediate (or proximate)
determinants of growth: (i) the accumulation of and returns to labor/human and physical capital and the
extent to which these inputs are allocated to productive uses; and (ii) the productivity of labor and capital
use within and across sectors (allocative efficiency or structural change). Constraints to inclusive growth
could lie in accumulation (of labor and capital) or in productivity or both (Figure 1.9).
Figure 1.9 Diagnostic framework based on proximate determinants of growth
35. The framework is helpful for understanding the association between poverty reduction and growth
in Egypt since the proximate determinants that affect growth also affect prospects for poverty reduction.
Empirical evidence from cross-country and within-country studies confirms that as labor and capital
resources move out of low-productivity sectors into high-productivity sectors, the productivity of both
sectors increases and the rising incomes that come with this transition reduce poverty (Ravallion and Datt
5 Several limitations of this microsimulation exercise should be noted. First, as the microsimulation is based on annual growth
projections and workers’ reallocations between sectors, it does not capture the short-term dynamics of the crisis on employment,
such as furloughs or temporary income losses. Second, the microsimulation assumes that there is no population growth and that
workers are either unemployed or employed in one of five sectors: agriculture, formal services, informal services, formal industry,
or informal industry. Therefore, according to the model structure, new workers in a specific sector need to move either from other
sectors or from unemployed (that is, no workers retire or enter the labor market). Third, the results of the simulation are only as
accurate as the data on the effects of COVID-19 on the economy. In the case of Egypt, the estimated elasticities of sector GDP and
sector employment are low, suggesting that overall, the labor market does not respond significantly to changes in economic activity
at the sector level.
Growth
Capital accumulation and returns
Labor (human capital) accumulation and returns
Productivity (structural transformation; allocative
efficiency; innovation)
Within-sector productivity growth (firms)
Workers and capital shift from low- to high-
productivity sectors
Intersectoral linkages (spatial integration,
migration)

12
1996; Loayza and Raddatz 2006; Datt and Ravallion 2011). However, this only occurs if strong intersectoral
linkages exist, through migration, trade, or both.
36. Sustainable use of natural resources can also be analyzed within this diagnostic framework. The
framework rests on the assumption that prices guide scare resources to their most productive use. For natural
resources such as water and clean air, this assumption breaks down—a classic case of the tragedy of the
commons. Nile River water may not appear to be a binding constraint to individual farmers as they decide
which crops to plant, because the price they pay does not reflect its scarcity. Overuse of these resources and
inefficiencies are inevitable if the state does not intervene to guide resources to their most efficient uses.
37. Chapter 2 reviews Egypt’s recent growth and macroeconomic performance. It benchmarks Egypt’s
growth against that of peer economies to identify the constraints that affect each of the proximate
determinants of growth. This identification of constraints at the economy-wide level is based on a growth
decomposition analysis combined with an analysis of labor productivity growth, following the methodology
described in McMillan and Rodrik (2011).
38. The chapters that follow deepen the analysis of proximate determinants of growth and identify
constraints. Chapter 3 focuses on constraints in the labor market via an analysis of employment and earnings
trends. This chapter also reviews constraints specific to women’s employment and the agriculture sector.
Chapter 4 analyzes constraints that affect firm performance since firm growth matters not only for
employment (via job creation) but also for capital accumulation and productivity. Chapter 5 looks at how
public sector spending and the state’s economic activities affect the private sector and hence firm growth.
Chapter 6 analyzes resilience to shocks and efficiency and sustainability of natural resource use. This
chapter also reviews social sustainability and sustainability of territorial development.
39. The constraints identified by each chapter and actions to address them can be grouped into four
pathways for a new growth model that unlocks poverty reduction and inclusive growth: improve public
sector spending efficiency and strengthen macroeconomic resilience (Pathway 1); boost private sector
investment, firm growth, and productivity (Pathway 2); advance economic inclusion and strengthen
household resilience (Pathway 3); and promote sustainability of natural resource use (Pathway 4). Across
these pathways, stronger citizen engagement and data transparency are needed as well. Chapter 7 concludes
by reviewing priorities for policy action across these pathways and discussing policy recommendations for
the constraints identified.

13
2 Growth, Investment, Employment, and Productivity
Key findings on the current growth model:
• Growth did not translate into improved livelihoods and living standards for three reasons: low labor
productivity growth (value-added per worker); low contribution of labor and capital factors to
growth; and low employment rate and investment.
• Egypt’s limited success to transform its economy structurally—by reallocating labor toward more
productive sectors—has kept productivity growth (and consequently incomes) low.
• The productivity of investment has fallen over time. Since the state is actively investing in the
economy while the private sector is not, this decline in productivity raises concerns about the
productivity of public investments.
• Positive sectoral shifts include declining agricultural employment accompanied by a rise in this
sector’s productivity. The construction sector, an employer of unskilled and low-skilled workers,
experienced a surge in employment, but with low productivity growth—likely weakening the
sectors’ potential to reduce poverty.
• The combination of low returns to labor and capital accumulation suggests that a binding constraint
to growth is limited avenues for high-productivity activities, rather than the inadequate supply of
capital and labor.
2.1 Benchmarking Egypt’s Growth and Macroeconomic Resilience
40. To analyze Egypt’s growth model, the SCD Update compares Egypt’s performance with that of a
set of countries chosen because they are similar to Egypt in terms of structural characteristics (population,
geographic size, and stage of development). The countries chosen for benchmarking are (a) the countries
selected in the previous SCD (Indonesia, Malaysia, Mexico, Pakistan, Poland, Turkey, and Ukraine); (b)
countries identified in Alnashar, Elashmawy, and Youssef (2020) (Morocco, Peru, the Philippines, Sri
Lanka, and Vietnam); and (c) two Middle East and North Africa (MENA) region countries that share
similarities with Egypt (Jordan and Tunisia). The SCD Update also considers how Egypt fared compared
with middle-income countries and other developing countries in MENA.
2.2 Growth and Macroeconomic Resilience
41. Egypt’s GDP grew in
spurts at an average rate of 4.5
percent during 2004–19, just below
that of many middle-income peers
(Figure 2.1, Table 2.1). During
2006–08, growth peaked at an
average annual rate of 7.0 percent,
well above middle-income peers.
The analysis in the previous SCD
showed that this growth spurt
occurred at a time of reforms that
took place between 2004 and 2008
including corporate tax cuts,
simplification of tax regime,
reduced tariffs, strengthening of the business environment, privatization, and exchange rate liberalization.
After a slowdown in early 2010s, growth rebounded following the initiation of recent wave of economic
Figure 2.1 GDP growth and per capita GDP growth in Egypt, 2004-2019
Source: World Development Indicators.
-2.00
0.00
2.00
4.00
6.00
8.00
2004 2005 2006 2007 2008 2009 2010 2011 2012 2013 2014 2015 2016 2017 2018 2019
Per
cen
t
Fiscal Year
GDP growth (annual %) GDP per capita growth (annual %)

14
reforms and reached 5.6 percent in 2019. Growth is expected to fall to 3.6 percent in 2020 due to the
COVID-19 pandemic.6
42. GDP per capita growth has been substantially lower, averaging just 2.4 percent, which was 1.8
percentage points lower than the average in middle-income countries (during 2004-19). GDP per worker or
labor productivity growth is similarly low, averaging 2.5 percent per year. This growth rate is higher than
the average for MENA region peer economies (1.1 percent) but lower than the average for middle-income
peers (4.4 percent).
Table 2.1 Growth (GDP, per capita GDP, and Labor Productivity) and Employment rates, Egypt and peer
economies, 2004–19
Annual average growth (percent) Percent of working-age
population employed
Country or country group GDP
GDP per
capita
GDP per
worker
(Labor
Productivity) 2004-2009 2014–19
Egypt 4.5 2.4 2.5 45.5 44.1
Indonesia 5.5 4.1 3.2 62.4 66.3
Jordan 4 0 -0.1 37.5 35.5
Malaysia 4.9 3.3 2.2 61.0 65.8
Mexico 2.1 0.7 -0.1 61.2 61.8
Morocco 3.9 2.6 2.8 47.7 44.8
Pakistan 4.1 1.9 1.4 52.6 52.7
Peru 5.1 4 2.9 75.5 77.4
Philippines 5.8 4.1 3.4 61.1 61.4
Poland 4 4 2.4 55.8 65.5
Sri Lanka 5.5 4.7 4.7 56.1 56.3
Tunisia 2.8 1.7 1.5 43.1 43.7
Turkey 5 3.4 2.3 44.2 50.5
Ukraine 0.5 0.9 1.1 61.7 60.3
Vietnam 6.4 5.3 4.8 79.3 81.3
Country group
Middle East and North Africa 2.9 1.1 1.3 42.7 41.7
Middle-income 5.4 4.2 4.4 63.7 61.4
Source: World Bank, based on data from World Development Indicators.
6 In the fourth quarter of fiscal year 2020, due to the lockdown, growth contracted to 1.7 percent but subsequently recovered after
easing of COVID-19-related restrictions.

15
43. Employment growth in
Egypt has not kept pace with GDP
per capita growth, particularly
since 2014. Employment growth
and growth in the employment rate
(employment as a share of the
working-age population) closely
tracked GDP per capita growth in
early 2000s (Figure 2.2) (Assaad,
Alsharawi, and Salemi 2019).
Since 2011, there has been a
downward trend in employment
rate, despite resumption of growth
in 2014. Egypt’s employment-to-
GDP growth elasticity is 0.88,
which is higher than that of its
peers (Table 2.2). However, when adjustments for population growth are made, this elasticity falls to zero.
In contrast, this elasticity is above zero in every other peer country except Morocco. This difference is
driven by the relatively rapid growth of Egypt’s working-age population.
Table 2.2 Employment to growth elasticities in Egypt and peers, 2004-19
Country
Elasticity of
employment to GDP
growth
Elasticity of
employment rate to
GDP per capita
growth
Egypt 0.88 0.00
Indonesia 0.54 0.10
Jordan –1.84 0.07
Malaysia 0.86 0.17
Mexico 1.79 0.25
Morocco 0.4 –0.03
Pakistan 1.44 0.08
Peru 0.46 0.12
Philippines 0.54 0.06
Poland 0.37 0.16
Sri Lanka 0.17 0.01
Turkey 0.82 0.13
Ukraine –0.07 0.02
Vietnam 0.32 0.07
Source: World Bank, based on data from World Development Indicators.
44. Egypt joins Jordan and Tunisia in having the lowest share of working-age population that is
employed. Youthful countries face steeper challenges than others in creating jobs and undertaking structural
change that comes with per capita income growth (Merotto, Weber, and Aterido 2020). Egypt has both a
younger population and a higher annual population growth rate than its peers (2.0 percent, compared with
less than 1.2 percent on average in middle-income countries in 2004–18). Vietnam and Sri Lanka had
average annual population growth well below 1 percent during this period. They also employ a large share
of their working age population. By 2030, Egypt would have to add about 6 million jobs just to keep the
Figure 2.2 Growth in GDP per capita, employment, and employment
rate, 2004-19
Source: World Bank, based on data from World Development Indicators.
90
100
110
120
130
140
150
2004 2005 2006 2007 2008 2009 2010 2011 2012 2013 2014 2015 2016 2017 2018 2019
Ind
ex (
20
04
=1
00
)
Fiscal Year
GDPPC Index EMP Index EMP/POP Index

16
employment rate at its 2019 level. Achieving better per capita growth outcomes in Egypt will therefore be
helped by slower population growth (strong family planning programs and support provided via the Takaful
and Karama programs can be helpful). The young dependents (children 0-14) today can become a potential
source of growth in the future if as working-age adults they can engage in productive jobs (Box 2.1).
Investment in children’s human capital would be key to realizing this growth dividend.
Box 2.1 Egypt’s forthcoming demographic window of opportunity
A rise in the size of the working age population (15-64) relative to the nonworking age population
(children and elderly) can boost growth – an effect referred to as the demographic dividend. Studies have
attributed a significant share of the rapid growth in East Asian economies during 1965-1990 to this rise
in the ratio of working age population to population of children (0-14 years) and elderly (65 years and
older). A relatively larger working age population translates into higher output per capita mainly via the
jobs channel. A large share of the working age population can also boost growth via higher aggregate
savings and investment per capita since this age group is more likely to save than children or elderly
dependents (World Bank 2006).
Assaad (2020) projects an increase in Egypt’s total population from 102 million in 2020 to about 160
million by 2050 (based on medium variant of the United Nation’s population projections). By 2025-
2030, the growth of working age population is expected to accelerate when the echo generation (born
between 2006 and 2014), reaches working age. Assaad (2020) estimates that the annualized growth in
the youth population (15-24) entering the labor force will increase from 1.1 percent in 2020-25 to 3.1
percent in 2025-30 and 3.8 percent over 2030-35.
The demographic “window of opportunity” for accelerated growth is expected to be last from 2025 until
2040. During this period, the dependency ratio, or the ratio of children and elderly dependents to the
working age population, is projected to decline, creating favorable conditions for growth if job creation
can absorb the large cohorts of workers. After 2040, the rise in dependents (particularly the elderly
dependents), will start to outweigh the projected growth in working age population.
45. Periodic macroeconomic instability may suppress the country’s per capita growth. Egypt’s
macroeconomic resilience is affected by the following factors: high deficit-to-GDP and government debt-
to-GDP ratios (averaging 9.7 percent and 94.6 percent, respectively, during 2004–19); high and volatile
inflation; and price distortions in the form of administered rather than market-determined prices. Egypt’s
exchange rate repeatedly needs to be realigned because of loss of competitiveness and at times acute real
appreciation and heightened foreign currency shortages, which lead to the intermittent emergence of
parallel market rates (Alnashar, Elashmawy and Youssef 2020). As a result, the economy has needed
periodic structural adjustments to restore macroeconomic stability (see Chapter 5 for further discussion).
46. Abdelraouf, El-Abbadi, and Noureldin (2019) analyzed Egypt’s inflation between 2000-2018 and
concluded that structural factors (price variability and excess money growth) rather than transitory factors
(exchange rate devaluations and other supply-side shocks) account for the upward inflation trend since 2003
(Figure 2.3). This upward trend in inflation has also hurt purchasing power and affected poverty (AlAzzawi
and Hlasny 2020).

17
Figure 2.3 Year-on-year inflation, January 2000-November 2018
Source: Based on Abdelraouf, El-Abbadi, and Noureldin (2019).
Note: Data from International Financial Statistics.
47. Compared to its peers, Egypt performs poorly on inflation (higher than average), fiscal balance
(more frequent deficits than average), and saving rates (lower than average). For each indicator, the bars in
Figure 2.4 show the difference between Egypt and the simple average of its peers for three periods: 2004–
10, 2011–15, and 2016–19.7 During the 2004-10 period, inflation in Egypt was in the 85th percentile but
export growth and employment growth were also in the 85th percentile. Reforms in that period thus helped
the economy export and employ workers, but fiscal deficits remained a problem (World Bank Group 2015).
Figure 2.4 Egypt’s economic performance relative to peer economies, 2004–19
Source: Alnashar, Elashmawy and Youssef (2020) and World Economic Outlook.
Note: All indicators are percentage point deviations of yearly growth rates, except fiscal balance and gross national savings,
which are percentage point deviations of nominal GDP. Figures are simple averages across years and comparator countries.
7 This section updates the analysis in Box 3.1 in the 2015 SCD.
0
5
10
15
20
25
30
35
Jan
20
00
Au
g 2
00
0
Mar
20
01
Oct
20
01
May
20
02
Dec
20
02
Jul 2
00
3
Feb
20
04
Sep
20
04
Ap
r 2
00
5
No
v 2
00
5
Jun
20
06
Jan
20
07
Au
g 2
00
7
Mar
20
08
Oct
20
08
May
20
09
Dec
20
09
Jul 2
01
0
Feb
20
11
Sep
20
11
Ap
r 2
01
2
No
v 2
01
2
Jun
20
13
Jan
20
14
Au
g 2
01
4
Mar
20
15
Oct
20
15
May
20
16
Dec
20
16
Jul 2
01
7
Feb
20
18
Sep
20
18
Per
cen
t
0.5
8.4
5.3 3.9
(5.1)
2.1
(0.4)
1.7 0.5
(1.2)
(5.1)
0.2
4.4
(7.7)
(3.0)
0.4
(1.2)
(9.6)
1.0
20.2
7.5
12.7
(7.2)
10.4
(1.5)
0.3
(9.8) (10.0)
(5.0)
-
5.0
10.0
15.0
20.0
GDP Exports Imports CPI Inflation Fiscal
Balance
Investment Consumption Employment Gross
National
Savings
Dif
fere
nce
bet
wee
n p
erfo
rman
ce i
n E
gyp
t
and
per
form
ance
in
pee
r ec
on
om
ies
(per
cen
tage
poin
ts)
2004-2010 2011-2015 2016-2019

18
48. Chronic fiscal weakness and high dependence on external flows to maintain macroeconomic
stability have been a constant in Egypt. Concerns about the pervasively high fiscal deficit were pointed out
in the previous SCD, which showed that countries that maintained fiscal deficits the size of Egypt’s (Cape
Verde, Guyana, Jamaica, the Kyrgyz Republic, and Lebanon) tend to have chronic fiscal weakness and high
dependence on external flows. After 2011, Egypt’s fiscal deficit increased. The macroeconomic
stabilization and structural reforms program launched in 2016 improved the fiscal deficit, but it is still larger
than that of its peer economies. In constant 2010 dollars, the export of goods and services skyrocketed from
US$36 billion in 2016 to US$90 billion in 2018, an increase of 245 percent. This period also saw revitalized
investment, especially from the public sector. However, the adjustment program reduced consumption and
savings, with the national savings rate plummeting from 20 percent in 2009–10 to 9 percent in 2016–17,
before partially recovering to 14 percent in 2019. While growth in employment has not been significantly
different than the comparators, the employment to population ratio in Egypt is one of the lowest in the
world.
2.3 Growth Decomposition
49. Why is GDP per capita growth so low in Egypt? The chapter answers this question using three
types of decompositions following the diagnostic framework of Figure 1.9. The first decomposition follows
a commonly used approach to decompose GDP per capita growth into the three key factors of production:
labor, capital, and total factor productivity (TFP) to see how much each contributed to growth (see Annex
B). This facilitates understanding of how much of the changes in the economy’s total output can be
attributed to changes in these factors (Figure 2.5, panel a).8 The labor factor indicates how much output is
generated from each additional unit of labor and human capital employed. The capital factor indicates how
much output is obtained from each additional unit in capital stock. TFP is a measure of efficiency, estimated
by dividing economywide total output by the weighted average of inputs (labor and capital). TFP thus
represents growth in real output that exceeds the growth in inputs.
50. The second decomposition breaks down GDP per capita growth into contribution of growth in labor
productivity, the employment and participation rate, and working age population (Figure 2.5, panel b).9
This decomposition is informative because of the importance of the labor factor in poverty reduction and
inclusive growth.
51. The third decomposition splits labor productivity growth into two constituent parts—within-sector
productivity growth (how much of overall labor productivity growth can be attributed to changes within
sectors) and the “structural change” component (how much of overall labor productivity growth can be
attributed to movements of workers across sectors) (Figure 2.5, panel c) (see McMillan and Rodrik 2011).
The structural change component is further broken down into between-sector productivity changes (static
reallocation) and cross-sector productivity changes (dynamic reallocation).10 When changes in employment
shares are positively correlated with productivity levels the dynamic reallocation term will be positive, and
structural change will increase economywide productivity growth.
8 Land is also a factor of production, but it is assumed to be fixed for the economy. For that reason, it is not included in the
decomposition.
9 This GDP per capita decomposition uses Shapley decomposition of the following equation: 𝑌
𝑁=
𝑌
𝐸∗
𝐸
𝐿∗
𝐿
𝑁; where Y = GDP; N =
total population; E= number of employed individuals; L= working-age population. 10∆𝑤 = ∑ (𝑤𝑡1
𝑖 − 𝑤𝑡0𝑖 ) ∗ 𝜃𝑡𝑜
𝑖𝑛𝑖=1 + ∑ (𝜃𝑡1
𝑖 − 𝜃𝑡𝑜𝑖 ) ∗ 𝑤𝑡0
𝑖𝑛𝑖=1 + ∑ (𝑤𝑡1
𝑖 − 𝑤𝑡0𝑖 ) ∗ (𝜃𝑡1
𝑖 − 𝜃𝑡0𝑖 )𝑛
𝑖=1 where
Δw =Change in value added per worker; wit0 =Value added per worker in sector i in year t0; wit1 =Value added per worker in
sector i in year t1; θit0 =Share of employment in sector i in total employment in year t0; θit1 =Share of employment in sector i in
total employment in year t1. Within sector productivity growth is the first term on the right- hand side. Static reallocation is the
second term and dynamic reallocation is the third term on the right-hand side. See discussion in Rodrik, McMillan, and Sepúlveda
(2016).

19
Figure 2.5: Schematic of factors that contribute to average annual GDP per capita growth: Egypt 2004-19
a. b. c.
2.3.1 Contribution of total factor productivity, labor and capital factors to per capita GDP
growth – Little growth from labor and capital factors
52. The first decomposition of Egypt’s GDP per capita growth shows that of the 2.4 percent of average
per capita GDP growth, 1.1 percent stems from changes in efficiency (or TFP), 0.7 percent from capital
inputs, and just 0.6 percent from labor inputs (see, panel a). The most surprising finding is how little Egypt’s
labor inputs contribute to per capita growth relative to some peer economies (Figure 2.6). By comparison,
Vietnam had average per capita GDP growth of 5.2 percent between 2004 and 2018, to which TFP
(efficiency gains) contributed 1.3 percent, capital 2.4 percent, and labor 1.4 percent. The contribution of
TFP to per capita GDP growth was thus roughly similar in Egypt and Vietnam, but labor and capital
contributed much more in Vietnam. Only in Morocco (0.5 percent) and Pakistan (0.6 percent) was the
contribution of labor smaller.
Average per capita GDP growth=2.4 percent
Labor factor (0.7 percent)
Capital factor (0.6 percent)
Total Factor Productivity (1.1
percent)
Average per capita GDP growth=2.4 percent
Contribution of labor productivity
(2.5 percent)
Employment and labor particpation
rate rate (-0.1 percent)
Working age population (0.0
percent)
Average labor productivity growth=2.5
percent
Contribution of within-sector
productivity (2.1 percent)
Contribution of dynamic
reallocation (-0.2 percent)
Contribution of static reallocation
(0.6 percent)

20
Figure 2.6 Decomposition of GDP per capita in Egypt and peers, 2004–19
Source: World Bank estimates, based on data from World Development Indicators.
Note: The elasticity of capital is estimated to be 1/3. Annex B describes the methodology
53. Moreover, the contribution of the labor input to per capita GDP growth declined significantly over
time—from a high of 2.4 percent in 2004-2010 to -1.1 percent in 2011-2015, before inching back up to 0.2
percent in 2016-219 (Figure 2.7). In contrast, the contribution of capital rose from 0.1 percent in 2004-2010
to 1.0 percent in 2011-2015 and held about there (0.9 percent) in 2016-2019.
1.1
(0.9)
(0.9)
1.7
(0.3)
1.2
0.6
0.6
0.3
2.3
0.6
2.3
0.7
2.8
1.3
0.6
0.0
0.5
(0.4)
1.1
0.1
1.4
0.7
1.3
1.3
1.3
0.8
1.1
1.9
2.4
0.7
0.9
1.2
0.0
1.0
0.6
0.5
1.9
1.8
0.3
2.1
0.9
2.2
(0.1)
1.4
-2 0 2 4 6
Egypt
growth = 2.4%
Jordan
growth = 0%
Mexico
growth = 0.7%
Ukraine
growth = 1.3%
Tunisia
growth = 1.7%
Pakistan
growth = 1.8%
Morocco
growth = 2.6%
Malaysia
growth = 3.2%
Turkey
growth = 3.4%
Peru
growth = 3.9%
Poland
growth = 4%
Philippines
growth = 4%
Indonesia
growth = 4.1%
Sri Lanka
growth = 4.6%
Vietnam
growth = 5.2%
Contributions to Annual GDP Per Capita Growth
(in PPT)
Total Factor Productivity (TFP) Capital Labor

21
Figure 2.7 Decomposition of GDP per capita in Egypt 2004-19, by subperiod
Source: World Bank estimates, based on data from World Development Indicators.
Note: Elasticity of capital is estimated to be 1/3. Annex B describes the methodology.
2.3.2 Labor factor– low labor productivity growth explains low per capita GDP growth
54. Given that Egypt got so little growth from labor (as shown by the first growth decomposition), it is
helpful to look at the second decomposition which focuses entirely on the labor factor (Figure 2.5, panel
b). This decomposition suggests that almost all of growth in GDP per capita is due to labor productivity
growth (Figure 2.8). Thus, the low pace of 2.5 percent per year at which labor productivity has grown in
Egypt (see Table 2.1), explains most of Egypt’s slow GDP per capita growth. What is striking is that
employment, labor force participation or the growth in working age population did not contribute at all to
per capita GDP growth and acted as a drag on overall growth. The fact that the boom in the working age
population experienced by Egypt did not translate into a boost in per capita GDP growth reflects a missed
opportunity. Chapter 3 studies constraints that could explain the observed patterns in labor market
outcomes. The low contribution of labor market outcomes or demographic factors is not unusual amongst
Egypt’s peer economies. For Sri Lanka, Poland and Ukraine, population aging can explain the drag on
growth due to demographic changes. Like Egypt, Morocco’s per capita GDP growth did not benefit from
employment or labor participation. Jordan and Mexico experienced significantly lower per capita GDP
growth than Egypt and employment and labor participation and demographic factors helped their growth
to a limited extent.
1.1 1.4 0.6
1.5
0.6 0.1 1.0
0.9 0.7
2.4
(1.1)
0.2
-2
-1
0
1
2
3
4
5
2004-19 (2.4%) 2004-10 (4.0%) 2011-15 (0.4%) 2016-19 (2.7%)Co
ntr
ibuti
on t
o a
nnual
GD
P p
er c
apit
a
gro
wth
(in
per
centa
ge
po
ints
)
Annual per capital GDP growth (percent)
Total factor Productivity (TFP) Capital Labor

22
Figure 2.8 Contribution of labor productivity, employment and labor participation, and demographics to
GDP per capita growth in Egypt and peers, 2004-2019
Source: World Bank estimates, based on data from World Development Indicators.
2.3.3 Labor productivity–structural change contributed little to labor productivity
55. As the schematic at the beginning of the chapter indicated (Figure 2.5, panel c), labor productivity
can be decomposed into its two components: (i) within-sector productivity growth; and (ii) productivity
growth associated with structural changes in employment. The first refers to how much labor productivity
grows within a sector, such as agriculture, industry, or services. The second refers to how much labor
productivity grows as workers shift to more-productive sectors—for example, away from agriculture to
industry and/or services as a country moves to a higher economic development stage. Further, within the
structural change component, there can be static (always positive) or dynamic (positive or negative)
reallocation. Static means that workers move to sectors with higher productivity growth. When the dynamic
component is positive, this means that workers move to sectors that continue to have positive productivity
growth despite this movement (that is, their increasing the labor supply). Negative dynamic reallocation
occurs when this movement of labor reduces the average productivity.
56. Within-sector productivity growth explains most of the growth in labor productivity for Egypt as
well as its peers (except for Jordan and Mexico) (Figure 2.9). The structural change component plays a
small role in explaining labor productivity growth in Egypt, Malaysia, Pakistan, Peru, Tunisia, and Turkey.
Importantly, peer economies that experienced high labor productivity growth, such as Vietnam, Sri Lanka
and Indonesia, did so with positive contribution of structural change. In the case of Egypt, negative dynamic
reallocation of labor drags down the effect of structural change. Ukraine is the only peer economy to
2.5
(0.1)
(0.1)
1.1
1.5
1.4
2.8
2.2
2.3
2.9
2.4
3.4
3.2
4.7
4.8
(0.1)
(0.4)
0.4
0.0
0.2
(0.1)
(0.5)
0.6
0.9
0.6
2.0
0.1
0.7
0.2
0.1
0.0
0.5
0.4
(0.2)
0.1
0.6
0.3
0.5
0.3
0.4
(0.3)
0.5
0.3
(0.2)
0.4
-2 0 2 4 6
Egypt
GDP per capita growth = 2.4%
Jordan
GDP per capita growth = 0%
Mexico
GDP per capita growth = 0.7%
Ukraine
GDP per capita growth = 0.9%
Tunisia
GDP per capita growth = 1.7%
Pakistan
GDP per capita growth = 1.9%
Morocco
GDP per capita growth = 2.6%
Malaysia
GDP per capita growth = 3.3%
Turkey
GDP per capita growth = 3.4%
Peru
GDP per capita growth = 4%
Poland
GDP per capita growth = 4%
Philippines
GDP per capita growth = 4.1%
Indonesia
GDP per capita growth = 4.1%
Sri Lanka
GDP per capita growth = 4.7%
Vietnam
GDP per capita growth = 5.3%
Contributions to Annual GDP Per Capita Growth
(in PPT)
Labor Productivity Changes in Employment and Participation Rates Demographic Change

23
experience a similar negative dynamic reallocation. Thus, while workers in Egypt moved into sectors with
initially higher (albeit declining) levels of productivity, the opposite occurred in other middle-income
countries (with the exception of Jordan, Malaysia, and Ukraine,), where productivity growth increased
partly as a result of reallocating workers to sectors with higher and growing levels of productivity (Figure
2.9).
Figure 2.9 Decomposition of growth in labor productivity (GDP per worker) in Egypt and peers, 2004-2019
Source: World Bank estimates based on data from World Development Indicators.
57. A correlation between productivity growth by sector and changes in employment shows that
structural change in Egypt has proceed in some beneficial ways (Figure 2.10). Agricultural productivity has
grown as its employment share has fallen. Chapter 3 discusses these patterns in more detail. The
employment contraction in public sector social services has also been accompanied by growth in
productivity. However, labor’s contribution to GDP per capita is hampered by changes in employment
shares in sectors where productivity growth is low.
58. An economy performs best when employment shares increase in sectors in which productivity is
growing most—as shown in the upper-right-hand quadrant of Figure 2.10, which illustrates the correlation
between productivity growth and changes in employment shares. In Egypt, the private sector is featured
mainly in the lower-right-hand quadrant, where employment shares increased but productivity declined.
Sectors in this quadrant include private sector manufacturing, social services, transport, utilities, finance,
and restaurants and hotels. The sectors that experienced the largest increases in employment shares (private
sector construction, and wholesale and retail trade) witnessed only limited productivity growth and
consequently low income growth for the large share of low-skilled and unskilled workers, including the
2.1
(0.2)
1.0
1.3
1.2
1.9
2.2
1.9
2.4
1.8
2.5
2.3
3.5
2.9
0.6
0.2
0.5
0.2
0.2
0.9
(0.2)
0.4
0.4
0.4
0.6
0.8
0.8
1.5
(0.2)
(0.4)
(0.0)
(0.0)0.1
0.1
(0.0)0.2
0.1
0.2
0.1
0.4
0.4
-2 0 2 4 6
Egypt
GDP per worker growth = 2.5%
Jordan
GDP per worker growth = -0.1%
Mexico
GDP per worker growth = -0.1%
Ukraine
GDP per worker growth = 1.1%
Tunisia
GDP per worker growth = 1.5%
Pakistan
GDP per worker growth = 1.4%
Morocco
GDP per worker growth = 2.8%
Malaysia
GDP per worker growth = 2.2%
Turkey
GDP per worker growth = 2.3%
Peru
GDP per worker growth = 2.9%
Poland
GDP per worker growth = 2.4%
Philippines
GDP per worker growth = 3.4%
Indonesia
GDP per worker growth = 3.2%
Sri Lanka
GDP per worker growth = 4.7%
Vietnam
GDP per worker growth = 4.8%
Contributions to Annual GDP Per Worker Growth
(in PPT)
Within-sector productivity Static reallocation Dynamic reallocation

24
poor, employed in these sectors. High value-added sectors have failed to raise their productivity,
constraining their ability to expand and create more employment opportunities. These patterns show why
Egypt reaped weak gains from structural change.
Figure 2.10 Correlation between sectoral productivity growth and changes in employment shares in Egypt
Source: Alnashar, Elashmawy and Youssef (2020).
Note: Figure shows the cumulative change in sectoral productivity and employment shares between 2004 and 2018. The size of
each bubble represents the employment share in 2018 (as indicated beside each bubble).
2.3.4 Capital and efficiency –growth returns to capital accumulation are declining
59. What is happening to capital in Egypt and how does it relate to labor productivity growth? As Table
2.3 shows, between 2004 and 2019, there was modest growth in capital per worker: averaging 2.1 percent
in 2004–19, 0.3 percent 2004–10, but rising to 3.5 percent in 2016–19. At the same time, the capital stock
increased noticeably throughout this time period, growing at 4.0 percent in 2004–19, 4.0 percent in 2004–
10, and 4.7 percent in 2016–19. One would expect a higher contribution to labor productivity growth from
this growth in capital, as adding capital is likely to make workers more efficient. But the decomposition
analysis discussed previously does not show this to be the case. It is therefore likely that capital investment
was not as efficient, yielding lower returns than expected.
Agric., Pub., 0.4%
Agric., Priv., 23.0%
Utilities, Pub., 1.2%
Utilities, Priv.,
0.3%
Manufact., Pub., 1.4%
Manufact.,
Priv., 10.9%
Construct., Pub., 0.4%
Construct., Priv., 12.4%
Wholesale & Retail,
Pub., 0.2%
Wholesale & Retail, Priv.,
12.9%
Rest. &
Hotels,
Priv., 2.7%
Transport, Priv., 6.8%
ICT, Pub., 0.3%
ICT, Priv., 0.5%
Finance, Pub., 0.4%
Finance, Priv., 0.2%
Social Services,
Pub., 17.0%
Social Services, Priv.,
7.9%-6
-4
-2
0
2
4
6
8
10
12
-10 -8 -6 -4 -2 0 2 4 6 8
Con
trib
uti
on
of
GD
P p
er W
ork
er G
row
th "
wit
hin
" E
ach
Sec
tor
to O
ver
all
Pro
du
ctiv
ity G
row
th,
in P
PT
Change in employment share (percentage points)

25
Table 2.3 Growth in capital stock, employment, and capital per worker, 2004–19
Average Annual Growth (percent)
Period Capital Stock Total Employment Capital per worker
2004–19 4.0 1.9 2.1
2004–10 4.0 3.7 0.3
2011–15 3.5 0.5 3.0
2016–19 4.7 1.1 3.5
Source: World Bank, based on data from World Development indicators.
Notes: Employed includes self-employed. Average annual growth of total factor productivity: 2004–18: 1.1 percent; 2004–10: 1.1
percent; 2011–18: 1.0 percent.
60. Analyzing trends in gross fixed investments between 2004 and 2019 shows how Egypt compares
with peer economies. Egypt’s gross fixed capital accumulation as a share of GDP is low relative to that of
peers, even with the uptick between 2014 and 2019 (Figure 2.11). From an average of 18.5 percent of GDP
in 2004–10, public and private investment dipped below 13 percent in 2014—well below regional peers
Morocco (28.4 percent) and Tunisia (19.9 percent). Employment growth is not helped by the relative low
levels of investment.
Figure 2.11 Gross fixed investment as share of GDP in Egypt and peers, 2004–19
Source: © The Economist Intelligence Unit Limited 120. All rights reserved. © Technology by Alacra, Inc.
Note: Figures are averages of peers in each region. South and East Asia: Indonesia, Malaysia, the Philippines, Pakistan, Sri
Lanka, and Vietnam. Europe and Central Asia: Poland, Turkey, and Ukraine. Middle East and North Africa: Jordan, Morocco.
and Tunisia. Latin America: Mexico and Peru.
61. Moreover, public sector investments dominate capital accumulation in Egypt (Figure 2.12). As a
proportion of total gross fixed investment between 2004 and 2019, investment by the Egyptian public sector
peaked at almost 59 percent. In comparison, in Malaysia, the share peaked in 2009, at 48 percent, as the
government tried to pull the economy out of 2008 financial crisis, and Poland peaked at 39 percent, in 2011.
In Egypt, private investments rebounded strongly in 2019 following an upturn in private sector participation
in energy sector projects in electricity and gas extractives, that were traditionally in the public sector’s
Egypt
10
12
14
16
18
20
22
24
26
28
30
Per
cent
of
GD
P
South and East Asia Europe and Central Asia Middle East and North Africa Latin America

26
domain (Alnashar, Elashmawy and Youssef 2020). This recent spike mainly reflected the private sector’s
investments in renewable energy, including the Benban Solar plant, other wind projects, investments in the
newly discovered gas fields (such as ElZohr), as well as investments in oil extractives.11
62. As for net foreign direct investment (FDI) inflows, these have slipped from a strong period in 2004–
10 (almost 9 percent of GDP in some years) to a negative in 2011, although they climbed back up to almost
4 percent of GDP until 2017, according to data from the Economist Intelligent Unit.12 Even so, investment
is chronically low in Egypt compared with peers in every region.
Figure 2.12 Share of public investment in total gross fixed investments in Egypt and selected peers, 2004–19
Source: World Bank, based on data from World Development Indicators.
63. Egypt’s chronically low level of capital accumulation matters greatly, especially for improving the
efficiency of production—the third component of GDP besides labor factor and capital. Bridges that reduce
transport costs, ICT infrastructure that reduces the cost of information, and better schools that make for
healthier and more productive workers all help to increase productivity.
64. Measures of how changes in capital are related to changes in output indicate that Egypt’s
investments are effective in raising output but that the returns to capital accumulation declined over time.
The incremental capital to output ratio (ICOR) provides an indication of the additional capital required to
generate additional economic output.13 Economies that produce a relatively large amount of additional
output have lower ICORs. An ICOR of 1 means that for each Egyptian pound invested, the additional output
was also 1 Egyptian pound: 1 pound in yields 1 pound out. Egypt’s ICOR was about 0.9 in 2007. An ICOR
near 1 indicates a relatively high level of efficiency and returns to investment. Such high levels of efficiency
11 Key legislative amendments introduced in 2014-2017 period opened up the renewable energy, electricity and gas sectors,
respectively, for the private sector. 12 © The Economist Intelligence Unit Limited 120. All rights reserved. © Technology by Alacra, Inc. 13 For example, if 10 percent additional capital is required to push the overall output by 1 percent, the ICOR will be 10. The
lower the ICOR, the better.
Egypt
0
10
20
30
40
50
60
Per
cent
of
tota
l in
ves
tmen
t
Malaysia Poland Jordan Peru

27
and marginal rate of return are not uncommon for developing countries (Banerjee and Duflo 2005).
However, after 2007, Egypt’s ICOR has been rising (Figure 2.13). It rose from 0.9 in 2007 to 2.7 in 2011
and 2.5 in 2015 declining modestly to 1.9 in 2019. This trend indicates a decline in the average marginal
product of investment. Egypt is not alone among its peers to experience rising ICOR. However, a rising
and high ICOR for Egypt is observed at relatively low levels of overall investment which suggests that
diminishing returns may be settling in or that investments are becoming increasingly less efficient even at
these low rates of investment (shored up by the public sector). Chapter 5 discusses this further.
Figure 2.13 Incremental capital output ratio (ICOR) in Egypt and peer countries, 2007-19
Source: World Bank, based on data from © The Economist Intelligence Unit Limited 120. All rights reserved. © Technology
by Alacra, Inc.
Note: Figures show three-year average ending in year shown. EGY = Egypt, IDN = Indonesia, JOR = Jordan, LKA = Sri Lanka,
MAR = Morocco, MEX = Mexico, MYS = Malaysia, PAK = Pakistan, PER = Peru, PHL = Philippines, POL = Poland, TUN =
Tunisia, TUR = Turkey, and VNM = Vietnam.
0.9
2.2
1.1
1.8
3.42.9
1.60.9 0.9
1.21.7
1.4 1.3
2.32.7 2.7
3.5
2.4
3.9
3.1
1.3
3.0
4.4
2.4
3.2
2.2
3.5 3.6
2.5
3.3
4.03.4
4.5
3.6
2.5
0.7
4.4
1.4
5.0 5.1
1.5
2.8
1.9
3.5
6.4
4.4
6.4
2.6 2.82.5
3.5
2.4 2.3
8.4 8.5
2.7
02
46
80
24
68
EGY IDN JOR LKAMARMEXMYSPAKPERPHLPOLTUNTURVNM EGY IDN JOR LKAMARMEXMYSPAKPERPHLPOLTUNTURVNM
EGY IDN JOR LKAMARMEXMYSPAKPERPHLPOLTUNTURVNM EGY IDN JOR LKAMARMEXMYSPAKPERPHLPOLTUNTURVNM
2007 2011
2015 2019
ICO
R R
atio
Graphs by Year
Averages of the indicated and the three previous years
ICOR Egypt and Peer Countries

28
3 Labor Market Performance
Key findings on constraints to advancing economic inclusion (Pathway 3):
• Employment growth and labor market returns to education have been affected by four
characteristics of the labor market: weak demand for labor; growth in low- or medium-skilled
occupations while high-skilled occupations experience limited growth; employment concentrated
in small-scale firms; and segmented labor markets so that workers are constrained in moving across
sectors, region, or firm type, which also curtail job opportunities.
• Informal employment, as share of total employment, has grown over time.
• Female employment remains low, partly because the demand for labor in the economy has shifted
toward more manual and physical tasks. Gender norms about working outside the home and care
responsibilities as well as concerns about harassment also constrain women’s employment.
• Agriculture, which is dominated by small family holdings, is an important employer of the poor,
and has strong potential to improve productivity and expand jobs in higher value-added off-farm
activities.
3.1 Employment, Earnings, and Returns to Education14
65. Good jobs and incomes are essential elements of economic inclusion that help people escape
poverty and create conditions for prosperity that is shared widely. They also help the economy reap the
benefits of investments in educational attainment and learning quality. Declining employment rates,
earnings, and returns to education, characterize Egypt’s labor market outcomes and this chapter analyzes
potential reasons.
66. Egypt’s labor force participation rate—the sum of the number of employed and unemployed people
as a share of the working-age population—has been declining since about 2014. It fell from 47 percent in
2006 to 42 percent in 2019, with a peak in between of 50 percent in 2010 (Figure 3.1).15 The decline in
participation in the labor market is due to falling participation rates among men, especially young men.
Men reduced their participation rates from 72 percent in 2006 to 67 percent in 2019. Women’s participation
rates, already very low, fell from 23 percent during 2007-16 to 16 percent in 2019.
14 The first SCD was based on labor market outcomes through 2012. This SCD covers the years through 2018 for most indicators
and through the second half of 2020 for some. The Central Agency for Public Mobilization and Statistics (CAPMAS) collects
Quarterly Labor Force Surveys (QLFS). The microdata of the QLFS are harmonized, converted into annual samples, and published
by the Economic Research Forum (ERF). CAPMAS publishes summary results of the QLFS within a few months of survey
completion, but the harmonized microdata disseminated by ERF are published with a lag. The latest QLFS summary published by
CAPMAS covers April–June 2020. The most recent harmonized annual Labor Force Survey (LFS) published by ERF is for 2018.
The LFS is complemented with data from the Egypt Labor Market Panel Survey (ELMPS), a nationally representative panel survey
carried out by the ERF and CAPMAS and published by ERF. The ELMPS now has four rounds of data spanning 20 years; data
were collected in 1998, 2006, 2012, and 2018. Although there are differences in the levels and trends of some labor market
outcomes, the LFS and ELMPS data provide broadly consistent patterns (Krafft, Assaad, and Rahman 2019). 15 The participation rate dropped sharply to 39 percent in the second half of 2020 as a result of the lockdown introduced in
response to the pandemic.

29
Figure 3.1 Labor force participation rates for men and women, 2006–19
Source: Open Access Micro Data Initiative (OAMDI) for 2006–18. CAPMAS, Bulletin of Labor Force Survey, for 2019.
Note: Labor force participation rates are computed using annual labor force survey data from Harmonized Labor Force Surveys
for people 15 and older, using the CAPMAS definition. Years correspond to the years of the labor force survey which are
calendar year.
67. Changes in labor force participation among men vary with education and age. The decline in
participation occurred for both men 15–24 and prime-age men (25–50); among men 25-50 participation
rate fell from 97 percent in 2014 to 94.8 percent in 2018. The decline also occurred across all education
levels. The increase in tertiary education enrollment is likely a reason for the decline in young men’s
participation, but it cannot explain the decline in participation rates among older men. Between 2012 and
2018, the share of young men (15–29) not in education, employment, or training increased, with more than
half of them unemployed and actively seeking jobs (Amer and Atallah 2019).16
68. Young women’s participation fell in 2011, recovered and then fell again after 2017. Women 25–
50, who participate in the labor market at a higher rate than younger women do, experienced a decline in
participation, from 30 percent in 2014 to 24 percent in 2018. The decline occurred among women with all
levels of education. University-educated women, who are most likely to be employed in the public sector,
experienced a decline in participation from 65 percent in 2016 to 55 percent in 2018.
69. Figure 3.2 breaks down labor force participation into trends in unemployment and employment.
The number of unemployed (people 15–64 actively searching for jobs) rose from 2.4 million in 2004 to a
peak of 3.6 million in 2016 before declining. This period of rising unemployment coincided with disruptions
in the economy in 2011, recovery of GDP growth, and the entry of the baby boom generation into working-
age years (Assaad, Alsharawi, and Salemi 2019). Unemployment in Egypt is concentrated among youth;
the problem is one of labor market insertion (finding first jobs) rather than lay-offs. It is thus more structural
than cyclical.
70. Employment increased from 20.0 million in 2006 to 26.1 million in 2019, according to estimates
by the Central Agency for Public Mobilization and Statistics (CAPMAS) (Figure 3.2). This translates into
16 Amer and Attallah (2019) exclude from their analysis men who report being out of the labor force due to “other” reasons.
47% 48% 48% 48% 50% 49% 49% 49% 48% 47% 47% 45% 44% 42%
72% 72% 72% 72% 75% 74% 74% 73% 72% 71% 70%67% 68.0% 67%
21% 23% 22% 23% 23% 23% 22% 23% 23% 23% 23% 22%18.4% 16%
0%
10%
20%
30%
40%
50%
60%
70%
80%
90%
100%
2006 2007 2008 2009 2010 2011 2012 2013 2014 2015 2016 2017 2018 2019
% o
f w
ork
ing a
ge
po
pula
tio
n
Labor force participation, all Labor force participation, men Labor force participation, women

30
an average annual growth rate of 1.9 percent. The working age population grew at average annual rate of
2.5 percent. As a result, the employment rate (share of working age that are employed) fell, from a peak of
47 percent in 2008 and to 39 percent in 2019.
Figure 3.2 Total number of employed and unemployed people and employment rate, 2006–19
Source: Open Access Micro Data Initiative (OAMDI) for 2006–18. CAPMAS, Bulletin of Labor Force Survey, for 2019.
Note: Working-age population includes people 15 and older. CAPMAS did not published the number unemployed in 2011.
Years correspond to the years of the labor force survey which are calendar year.
71. What happened to workers’ earnings? Among workers in Egypt, 70 percent are employed in paid
work, more than 50 percent are informally employed, and almost 30 percent are employees of the public
sector or SOEs, whose wages are set by the government. Multiple data sources indicate that real monthly
earnings declined recently for all categories of workers (Figure 3.3). This trend is consistent with the finding
that lower labor income was the key contributor to the poverty increase that occurred between 2015 and
2017. Real monthly earnings data from the Egypt labor market panel surveys of households (conducted by
the Economic Research Forum [ERF] and CAPMAS) show a decline in real earnings of 9 percent between
2012 and 2018 (Said, Galal, and Sami 2019). The quarterly labor force survey data of households collected
by CAPMAS indicate that median earnings increased between 2010 and 2014 and fell thereafter. Said,
Galal, and Sami (2019) find that earnings fell 4 percent between 2006 and 2018. They also find that men
and women at all educational levels experienced declining total and hourly real earnings. Gross weekly
earnings data collected by CAPMAS from both the public sector and private establishments also show a
declining trend. Earnings recovered only partially, in 2019, when the monthly minimum earning was raised
from LE 1,200 to LE 2,000. Declining real earnings along with declining employment rates indicate a
weakening demand for labor.
20.4 21.7 22.5 23 23.8 23.3 23.6 24 24.3 25 25.3 26 26 26.1
42%44%
47%44%
45%42% 42%
45%42% 41% 41% 40% 39% 39%
0%
5%
10%
15%
20%
25%
30%
35%
40%
45%
50%
0
5
10
15
20
25
30
35
2006 2007 2008 2009 2010 2011 2012 2013 2014 2015 2016 2017 2018 2019
Em
plo
yed
as
a p
erce
nta
ge
of
wo
rkin
g
age
po
pula
tio
n
Em
plo
ym
ent
and
unem
plo
ym
ent
(mil
lio
ns)
Number employed Number unemployed Employment rate

31
Figure 3.3 Real median and average earnings, 2010–19
Source: Open Access Micro Data Initiative (OAMDI), various years. Harmonized Labor Force Surveys (HLFS), Licensed Data
Files; LFS, 2010-2017, Central Agency for Public Mobilization and Statistics (CAPMAS). Egypt: Economic Research Forum
(ERF). Said, Galal, and Sami (2019) for earnings from ELMPS. CAPMAS, Annual Bulletin of Employment, Wages, and Working
Hours Statistics.
Note: The consumer price index with the new base reference period (July 2018–June 2019) is used to construct real earnings.
Earnings based on data from the Labor Force Survey (LFS) and Egypt Labor Market Panel Survey (ELMPS) are assumed to be
net monthly earnings, as they are reported by employees. Weekly earnings reported in the Annual Bulletin of Employment, Wages
and Working Hours are gross earnings reported by public sector and private employers; they cover “cash wages for payment period
before any deductions, including basic wage, additional, bonuses, allowances, grants, in kind benefits and other periodical benefits
such as commissions and periodical production bonuses.” In 2019, the minimum monthly earning was increased from LE 1,200
to LE 2,000.
72. Labor market returns to education—defined as the percentage increase in wages from each
additional year or level of schooling completed—is an important indicator of how well the economy is
benefiting from investments in this sector. Like most MENA countries, these returns are relatively low in
Egypt. Krafft (2018) estimates that each additional year of education results in a 4.1 percent increase in the
hourly wage (with much lower returns for younger graduates). This estimate is lower than the 10 percent
returns to education estimated globally (Psacharopoulos and Patrinos, 2004).
73. The returns have also declined for workers of successive birth cohorts as educational attainment
increased in Egypt. Figure 3.4 displays returns to education for Egyptian men by year of their birth
(estimates are shown for male workers because very few females are employed). For men in the private
sector, the wage benefits of university education (over no education) are positive but have declined in
magnitude across successive birth cohorts. Men with university and vocational education have higher
returns to their education in the public sector than in the private sector (except for those born in 1968-72).
In the private sector vocational education brings very little wage gain relative to no education. In their
analysis of men 15–64, Krafft (2018) find that skills acquired on the job pay higher returns than a vocational
education degree. While learning quality and labor market relevance of education play a role (see Box 3.1)
the next section shows that factors on the demand side of the labor market play a role as well.
0
500
1000
1500
2000
2500
3000
2010 2011 2012 2013 2014 2015 2016 2017 2018 2019
Co
nst
ant
20
18
LE
real monthly median
earnings (net) (LFS)
real median monthly
earnings (net) (ELMPS)
real average weekly
earnings (gross)(Bulletin
of employment and
wages)Real weekly public sector
earnings
Real weekly private sector
earnings

32
Figure 3.4 Returns to educational attainment among men 25–50, 2018
Source: Egypt Labor Market Panel Survey 2018.
Note: Estimates are from a Mincerian regression using ordinary least squares for men 25–50 employed in the public and private
sectors. Returns to education are estimated by regressing the log of hourly wages on each level of education attained, where no
formal education (illiterate) is the omitted category. Regression controls for years of work experience.
Box 3.1: Education quality and returns to education in Egypt
In addition to labor market conditions and demographic pressures, the quality of educational outcomes
plays a role in the low returns to education in Egypt. Egypt’s learning poverty rate—the share of children
who cannot read and understand a short age-appropriate text by age 10—is 70 percent. About 69 percent
of fourth-graders do not achieve the international benchmark score on the Progress in International
Reading Literacy Study 2016. As in most countries, learning poverty is higher for boys (73.6 percent)
than for girls (64.6 percent). Children in Egypt can expect to complete 11.5 years of school, but because
of below-average international test scores, they receive just 6.5 learning-adjusted years of school.
The 2019 Global Competitiveness Index (GCI) underscores the urgency of boosting skills now and in
the future. Egypt’s current workforce skills rank 99 out of 141 countries, and the skills of the future
workforce rank even lower, at only 133 out of 141 countries.1 Except for digital skills among the
economically active population (rank 44), Egypt is behind in all other skills-related sub-indices, for
example, the quality of vocational training (rank 129) and critical thinking in teaching (rank 123). In
addition, Egypt’s score on digital skills is 4.7 out of 7, below the MENA average, indicating that there is
substantial room for improvement.
Source: World Bank 2021.
3.2 Constraints to Employment and Earnings Growth
74. Two broad sets of constraints can explain these trends in the labor market. One set relates to the
workers’ side of the labor market (the supply side), which is determined by population growth and
expansion in education as well as factors that affect individuals’ decisions to work. Role of gendered factors,
such as care responsibilities, are important to examine in this context. A second set relates to the employers’
side of the labor market (the demand side), which is affected by the decisions of private sector firms
-20%
0%
20%
40%
60%
80%
100%
Born between
1968 and 1972
Born between
1973 and 1977
Born between
1978 and 1982
Born between
1983 and 1987
Born between
1968 and 1972
Born between
1973 and 1977
Born between
1978 and 1982
Born between
1983 and 1987
Private sector Public sector
Per
cen
tage
incr
ease
in
hou
rly w
age
over
no
edu
cati
on
Vocational education (returns relative to no education) University education (returns relative to no education)

33
(analyzed in detail in this SCD), state-owned enterprises (SOEs), and the public sector in Egypt. The bulk
of the evidence suggests that the constraints lie on the demand side. Complementing the falling labor
demand indicated by the decline in employment rate, earnings and returns to education discussed above,
the Chapter discusses three features of the labor market related to the demand side: skills demanded;
distribution of employment by firm size; and how integrated or segmented the labor market is.
3.2.1 Skills demanded in the labor market
75. The relative wage gap narrowed in favor of low-skilled workers which explains the declining
returns to education. The ratio of formal private to informal private wages declined, from 1.41 in 1998 to
1.16 in 2018 (Table 3.1). The ratio of private formal to public sector wage also fell over this 20-year period.
The hourly wage gap between workers with university degrees and no education narrowed, falling from
1.79 to 1.45. And there is a similar narrowing of in the hourly wage gap between university educated
workers and those who completed vocational education.
Table 3.1 Relative hourly wages, by sector and education level, 1998–2018 (LE, except where indicated
otherwise)
Item 1998 2006 2012 2018
Sector
Public 8.6 11.3 13.1 11.8
Private formal 9.7 10.5 10.9 9.6
Informal 6.9 7.8 9.2 8.3
Ratio of private formal to public 1.13 0.93 0.83 0.81
Ratio of private formal to informal 1.41 1.35 1.18 1.16
Education
Illiterate 6.7 7.9 9 8.3
Can read and write 7.3 8.2 9 8.8
Completed grade 1-9 7.8 8.7 9.3 8.3
Completed vocational or general
secondary
7.5 9.4 10.5 9.6
Completed Post-secondary 9 11.3 11.8 10.7
University 12 13.7 14.8 12
Ratio of university to illiterate 1.79 1.73 1.64 1.45
Ratio of university to vocational or
general secondary
1.60 1.46 1.41 1.25
Source: Based on Table A5 in Said, Galal, and Sami 2019. Data are from ELMPS.
76. There is further evidence of a shift in skills demanded from high-skilled to low- and middle-skilled
jobs. Between 1988-1998 high-skilled occupations were growing at a faster pace than low- or middle-
skilled occupations (Figure 3.5, panel a). During the 1990s, when Egypt undertook reforms to liberalize the
economy, reform trade, and privatize some SOEs, growth in middle- and high-skilled jobs dominated the
labor market—a trend consistent with the rise in manufacturing documented in previous studies (World
Bank 2014). Still, almost half of the growth in high-skilled occupations over this period was from the public
sector, the main source of high-skilled work in Egypt. As the government continued to curtail the growth
of public sector employment and privatize SOEs, growth in the number of high-skilled jobs slowed and the
number of middle-skilled jobs contracted. Since 1998, however, there has been a shift toward low- and
middle-skilled occupations, with little growth in high-skilled occupations, and agriculture continuing to

34
shed jobs (Figure 3.5, panel b). During this period (1998–2016), most workers outside of the public sector
worked in low- or middle-skilled occupations. Most of the middle-skilled private sector jobs that were
created were in construction and transportation sectors, which are not a sustainable source of good-quality
jobs.
Figure 3.5 Occupational structure, 1988–98 and 1998–2016
Source: World Bank 2019, based on data from Egypt Labor Market Panel Survey and Labor Force Surveys.
Note: High-skilled = managerial, professional, and technical and associate professionals; middle-skilled = clerks, craft-related
trade workers, plant and machine operators and assemblers, and service workers; low-skilled = elementary occupations.
Agriculture = all workers in the agriculture industry, independent of occupation level.
77. Looking at the task content of jobs, the structure of occupations in Egypt is skewed toward manual
and physical jobs in the private sector, which additionally explains low female labor force participation and
employment. Employment in manual and physical jobs has been increasing over time relative to nonmanual
jobs, in part because the transportation and construction sectors have been growing more rapidly than other
sectors. Women are much more likely than men to be employed in occupations that are less manual and
physical and more interpersonal. They tend to account for a large share of employment in only a few
occupations, namely, business administration associates (79 percent), health associates (66 percent),
teachers (51 percent), agriculture laborers (47 percent), and legal associates (40 percent). Employment of
women in customer service and sales jobs—which have been primary drivers of increases in female
employment in some countries—is limited in Egypt (Chun 2019).
78. The demand for workers with primary and secondary education (assessed based on occupations of
workers) exceeds supply. At the same time, demand for workers with post-secondary education lags supply.
As a result of these mismatches between demand and supply, 38 percent of workers can be considered
underqualified for the jobs they hold (the figure is higher among administrative managers and elementary
occupations), and 21 percent are overqualified. Among people with vocational and technical certification,
the rates of overqualification and unemployment are high, and many people with technical degrees are
employed in occupations unrelated to these degrees, raising questions about the quality of learning. The
high level of underqualification implies significant losses to productivity and constrains growth.
Overqualification indicates overinvestment in education compared with labor market demand or an
education system that is failing to produce skills that are demanded by the labor market.
0.27% 0.20%
-0.06%
-0.61%
0.26%
-0.04%-0.01%
-0.03%
-1.00%
-0.80%
-0.60%
-0.40%
-0.20%
0.00%
0.20%
0.40%
0.60%
0.80%
1.00%
High-skilled Middle-skilled Low-skilled Agriculture
Avea
ge
Yea
rly P
erce
nta
ge
Po
int
Chan
ge
a. 1988 to 1998
Private Public
0.09%
0.87%
0.21%
-0.80%
-0.02%
-0.44%
0.11%
-0.02%
-1.00%
-0.80%
-0.60%
-0.40%
-0.20%
0.00%
0.20%
0.40%
0.60%
0.80%
1.00%
High-skilled Middle-skilled Low-skilled Agriculture
b. 1998 to 2016
Private Public

35
3.2.2 Employment by firm size
79. Data from firms that capture about 30 percent of employment17 in the country show that jobs in
Egypt are concentrated in smaller-scale (particularly micro firms with less than 5 workers), less formal, and
less-productive economic activities (Figure 3.6, panel a) (see also Adly 2020; Assaad, Krafft, Rahman, and
Selwaness 2019). Assaad, Krafft, Rahman, and Selwaness (2019) estimate that over the 2006-17 period,
the contribution of micro establishments to net job growth fell but these firms continued to account for
more than half of total employment in 2017. They also find that the contribution of small and medium
enterprises to net job growth increased, a positive trend, while large firms did not contribute much to job
growth (see Chapter 4). The continued concentration of job creation in smaller firms is consistent with
movement toward more informal employment and less productive activities.
80. Employment within firms is concentrated in the wholesale and retail trade sector. Wholesale and
retail trade also account for most informal employment (counting all employment within informal firms as
informal) (Figure 3.6, panel b). Within sectors, more than 50 percent of employment in transportation and
storage, wholesale and retail trade, construction, agriculture is informal.
Figure 3.6 Employment by establishment size and industry
a. Share of employment by establishment
size, 1996-2017
b. Percent of employment that is in informal
establishments, by sector, 2017
Source: World Bank calculations using General Census for Population, Housing and Establishments 1996, 2006, and 2017.
Note: An establishment is a fixed place where economic activity is carried out. An employee is informal if the establishment
lacks industrial or commercial registry.
81. How does education fit into this picture? The concentration of workers in micro and small
enterprises explains the low and declining returns to education in Egypt. Figure 3.7 shows the increase in
the hourly wage that workers earn given one additional year of education. For workers engaged in activities
outside fixed establishments (including most construction and transportation work), the returns to education
17 Although agriculture, construction, and transportation are large employers of workers in Egypt, most workers in these sectors
are engaged in economic activities outside fixed establishments (fixed locations). This factor is responsible for the low share of
employment accounted for by these sectors when looking at firm-level data.
50
17
10
24
59
18
8
16
53
21
15
11
0
20
40
60
Micro [1-4] Small [5-19] Medium [20-
99]
Large [+100]
Per
cen
t
Firm size [number of workers]
1996 2006 2017
0 10 20 30 40
Education
Construction
Health
Agriculture, Forestry, Fishing
Accom. & food services
Transportation and storage
Financial & Real estate
Other services
Manufact., Mining & Utilities
Wholesale and retail
Formal Informal

36
are close to zero for those in microbusinesses and small enterprises (5-9 employees). Those returns increase
to almost 1 percent for workers in engaged in activities outside fixed establishments with 10 workers or
more. A similar pattern can be observed for workers employed within fixed establishments (such as shops),
with virtually no returns to education for people employed in micro and small firms, the type of firms
employing the largest share of workers. The returns to education exceed 5 percent for people in
establishments with 10-99 workers, while returns to education of workers in establishments with over 100
workers are 3.6 percent. The fact that returns to education differ across firms of similar size but different
types (outside fixed establishments and within) suggests that the labor market may also be segmented by
firm type.
Figure 3.7 Returns to education for men in private sector employment, by firm size and type, 2018
Source: Egypt Labor Market Panel Survey 2018.
Note: The survey contains data on the status of workers’ firms. Those engaged in firms that do not have a fixed location
are defined as being employed outside establishments. Figures are based on a regression of log wage on years of
education by firm size. Controls include actual work experience.
3.2.3 Labor market segmentation and informality
82. The composition of employment shifted toward informal employment, as labor market entrants
increasingly found it easier to find jobs in that sector. The share of workers in all sectors (agriculture and
non-agriculture) without social security coverage or contracts increased from 55 percent in 2007 to 63
percent in 2018 (Figure 3.8). The share of agricultural workers within total informal employment has fallen
sharply from 54 percent in 2007 to 33 percent in 2018 which mirrors the rise of construction sector
employment. This increase, most of which occurred since 2011, was for both men and women, although it
was slightly lower for women. Elsayed and Wahba (2019) find that the probability of being informally
employed rose between 1998 and 2012, particularly after the Arab Spring. When Egypt introduced
lockdown measures during COVID-19, informal workers were more likely than formal (particularly public
sector) workers to be out of work, according to phone interviews conducted during April–May 2020.
83. Women’s informality rate (53 percent in 2018) is lower than men’s (65 percent in 2018). This is
because women are more likely than men to be employed in government jobs (public administration,
education, and health and social services). The reduction in women’s labor force participation rate between
2017 and 2018 was accompanied by a decline in female informality rate due to a fall in the share of women
employed in agriculture (resulting in an increase in the share of women engaged in the public sector).
-1.0%
0.0%
1.0%
2.0%
3.0%
4.0%
5.0%
6.0%
Outside
estab 1-4
workers
Outside
estab 5-9
workers
Outside
estab 10-99
workers
Outside
estab 100+
workers
in estab 1-4
workers
in estab 5-9
workers
in estab 10-
99 workers
in estab
100+
workers
Per
cent
incr
ease
in h
ourl
y w
age
for
one
add
itio
nal
yea
r o
f ed
uca
tio
n
Number of workers

37
Figure 3.8 Share of employment that is informal, 2007–17
Source: OAMDI, various years. Harmonized Labor Force Surveys (HLFS), Licensed Data Files; LFS, 2007-2017, Central
Agency for Public Mobilization and Statistics (CAPMAS). Egypt: Economic Research Forum (ERF).
Note: Figures show percentage of employed workers 15 and over engaged in agriculture or non-agricultural work and without
social security coverage. Years correspond to the years of the labor force survey which are calendar year.
84. The probability of exiting informality is very low, which suggests that the labor market may be
segmented along formal-informal jobs. Panel data on individuals’ employment between 2012 and 2018,
shows evidence of a limited transition between informal and formal jobs. Among men, new entrants to the
labor market join informal low-tier employment and remain in those jobs for years. Men in low-tier informal
wage or self-employment are more likely to stay in those jobs and have a low probability of moving to
upper-tier jobs (skilled jobs with professional training). Thus, informal, easy-entry jobs are not likely to be
a steppingstone to better-quality employment. Indeed, the opposite may be true: Men who were in upper-
tier informal jobs in 2012 had a high probability of staying in informal jobs or to have moved to lower-tier
wage jobs in 2018. This downward mobility is involuntary. As for women, there appears to be little
transition across employment type. Those who entered the labor market tended to find jobs in the public
sector, which employed an important share of all working women in Egypt in 2018, but those who were in
informal employment remained there.
85. The labor market is also segmented geographically. The metropolitan areas of Cairo and
Alexandria, together with the Lower Egypt governorates of Sharkeya, Qalyoubia, and Menoufia—where
large firms are concentrated—account for 56 percent of employment in large firms. The share of
employment in microenterprises and firms outside establishments is less spatially concentrated than
employment in large firms. The share of formal employment is also larger in metropolitan areas and Lower
Egypt governorates than in Upper Egypt governorates that are not near Cairo. This type of geographic
segmentation of the labor market correlates with higher poverty rates in Upper Egypt governorates.
86. Other than in Port Said (one of Egypt’s three metropolitan areas), hourly wages are significantly
lower in almost all governorates than in Cairo. Returns to education follow a similar geographic pattern.
The persistence of these spatial differences in wages and returns to education suggests that there are
obstacles to workers commuting or migrating to better-quality jobs in the Cairo area. In 2018, slightly more
than 40 percent of workers commuted to their jobs. World Bank (2014) finds that although commuters to
metropolitan areas improved their wages relative to those who did not commute, they still earned less than
residents of metropolitan areas (controlling for worker characteristics). This result could occur if commuters
0%
10%
20%
30%
40%
50%
60%
70%
2007 2008 2009 2010 2011 2012 2013 2014 2015 2016 2017 2018
Per
cen
t
Year
informal men informal women informal

38
have less information about employment opportunities than residents. The same report also finds that
workers who live farthest away from Cairo are more likely to migrate internationally than to move within
the country.
87. Researchers have sought to explain the rise of informal employment as an outcome of the high cost
to firms of covering labor costs, such as providing employer-linked social insurance. The 2003 labor laws
that brought more protection to workers may have helped individuals with existing jobs in formal firms to
transition into better employment within the formal sector (Wahba and Assaad 2017), but they may also
have suppressed the creation of formal jobs (Langot and Yassin 2015).
88. Although the social insurance law includes provisions for covering agriculture sector and irregular
workers, they have proven difficult to implement. The current social insurance policy (as reflected in the
2019 Law on Social Insurance and Pensions) is to broaden the scope of insurance to include all casual
workers. However, to date, only 417,000 have registered with the National Organization for Social
Insurance (NOSI). In response to the pandemic’s impact on informal workers, the government transferred
LE 500 to all casual workers who register with the Ministry of Manpower (through the self-administered
application via portal of the Ministry of Labor and Manpower). Disbursement outlets include 4,000 post
offices, 1,100 branches of the Agriculture Bank of Egypt, and 600 schools.
3.2.4 Constraints to women’s employment
89. Several channels and factors could motivate women to leave the labor force or work in certain
sectors (although marriage plays a significant role [Assaad, Krafft, and Selwaness 2017]). Demand- and
supply-side factors could play a role in making marriage and family care responsibilities incompatible with
private sector work. Women may prefer public sector work for its non-wage attributes as well as leave
policies, which better enable them to balance work and care responsibilities.
90. According to the 2017 population census, there were 15.4 million children (0- 6 years old) which
corresponds to almost one child below age of 6 per household. Results from the 2015 Time-Use Survey in
Egypt indicate that women are nearly fully responsible for housework duties and for taking care of children
even if they are employed. This “double-burden” can discourage women from looking for a job or can
disrupt their career (World Bank 2018a). World Bank (2018a) reports that in 2017, the gross enrollment
rate in pre-primary education in Egypt was only 31 percent in 2017 (for the 4 to 6 year old age group) while
8 percent of children (0-4 years) attended nurseries.
91. Increasing enrollment in nurseries and pre-primary education would not only provide the children
the substantial benefits of early childhood education18 but also expand employment opportunities for women
in the care economy (social care, human health, education), which is already a large employer of women.
World Bank (2018a) identifies the 12 industries that hire the largest percentages of women, based on data
from the 2013 economic census, Labor Force Surveys for 2008–14, and Enterprise Surveys for 2013 and
2016. Outside of agriculture, these industries include social care (elderly and childcare), education, human
health, garments, computers and electronics, pharmaceuticals, financial services, travel agencies, business
services, real estate, ICT, and retail trade. Together they employ 78 percent of all female wage workers in
non-agricultural private establishments, and women make up just under a third of their workforce. A third
of female wage employment is in just three of these industries: social care, education, and human health.
Social care ranks first, with a nearly 70 percent share of female employees. Education and human health
follow, with shares of 59 percent and 51 percent, respectively. Another third of female employment in
private establishments is in retail trade and garment manufacturing.
92. Women continue to face longstanding challenges from gender stereotypes (World Bank 2018a).
Many stereotypes defining men and women’s economic and social roles exist globally. Nurturing, for
18 See Heckman and Masterov (2007); El-Kogali and Krafft (2015).

39
example, is considered a stereotypically feminine trait, and assertiveness is a stereotypically male trait.
These stereotypes inform gendered social norms that affect women’s labor force participation. Gender
norms may also discourage women from working in manual jobs—precisely the type of jobs that have been
growing in Egypt (Chun 2019). World Bank (2018a) report provides qualitative insights into gendered
social norms and stereotypes constraining labor force participation in Egypt.
93. Beliefs about gender roles and unconscious bias can also discourage women’s employment. Many
Egyptian women believe that as men are the main breadwinners, priority should be given to them in the
labor market, according to the results of two rounds of the Survey of Young People in Egypt (SYPE)
conducted in 2010 and 2014. Egyptian men can be subjected to unconscious bias in positions traditionally
held by women, at both the application stage and as employees.19 However, unconscious bias does not
threaten men’s likability in the same way it affects women. Indeed, across cultures, men are assumed to be
more competent than women. It is, therefore, no surprise that female managers are perceived negatively by
both men and women (as discussed in the World Bank 2018a).
94. Another factor that could discourage women from working outside the home is sexual harassment.
In 2014, Egypt amended its penal code, criminalizing sexual harassment. Despite this legislation, concerns
about verbal and physical abuse could continue to limit women’s participation in activities outside the
home. In 2015, 10 percent of women between the ages of 18 and 64 reported having experienced harassment
within the past year in public streets; 7 percent reported experiencing harassment in public transport
(CAPMAS, UNFPA, and NCW, 2015). The high levels of concern about harassment reduces women’s
willingness to be involved in public activity or participate in the labor market. Better-off households may
prevent their female members from working in order to protect them from harassment. Harassment also
constrains women’s mobility, forcing some to rely on a male chaperone for night commutes or travel
between cities.
95. Greater legal equality in areas that affect women’s ability to work and engage in economic activities
has been found to be associated with higher female labor force participation (Gonzales, Jain-Chandra,
Kochhar, and Newiak 2015). Results from the Women, Busines and the Law 2021 suggest several areas
where Egypt could achieve legal equality. Egypt’s labor laws mandate maternity leave, rather than parental
leave. The provision of leave for mothers but not fathers could inadvertently discourage the hiring of
women, because of the potential costs to employers. The costs of hiring women can tilt employers’
preferences toward hiring men, which in turn perpetrates inequalities and diminishes productivity in jobs
where women may be better equipped and have better skills. The Nordic countries mandate equal maternity
and paternity leave, so that cost considerations do not create preferences for hiring men.
3.2.5 Constraints affecting employment in agriculture
96. Understanding the relationship between productivity and employment in the agriculture sector is
important for poverty reduction and central to realizing income gains from structural transformation. Rising
agricultural income growth tends to be associated with lower poverty in rural and urban areas. Egypt’s
agricultural productivity has increased as the sector shed workers over the last 15 years (see Figure 2.10).
Yet 55 percent of rural Upper Egypt residents employed in the sector are poor (the share of the poor in
agriculture is 43 percent for all of rural Egypt). Farming, although still important, has declined moderately,
both in terms of the absolute numbers of jobs and as a share of jobs in the labor force. The share of jobs in
farming declined from 29 percent of all full-time equivalent (FTE) jobs in 2007 to 22 percent in 2017—a
decrease of about 1 million FTE jobs in the farming sector (Table 3.2).
19 World Bank (2018a) states: “Unconscious bias manifests itself in the workplace in the criteria put for performance appraisals,
deep beliefs about differences in success standards for males and females, resistance to female leadership, women-to-women
bias, and the trend for females to adopt ‘masculine traits’ in order to advance professionally.”

40
97. Agri-food system is particularly important as a source of livelihoods for Egyptian women and
youth. Youth (ages 15–24) are engaged in farming at a higher rate than young adults (ages 25–34) or adults
(ages 35–64). Farming also appears to be a more important source of jobs for women than for men.20 The
only exception to the declining trend of farming employment is observed among women 15–24, among
whom employment in farming rose by 11.9 percentage points over the 2007-2017 period; however, data
from 2018 suggests that women’s engagement in this sector might have declined sharply since 2017 (as
discussed in the previous section).
98. Employment in primary agriculture farming activities is expected to continue to decline, but there
is scope for workers to move downstream of the farm-gate to higher productivity off-farm work. However,
farming in Egypt still accounts for more than twice as many jobs as the off-farm segment of the agri-food
system, and the pace of job growth in the agri-food system is likely to be highly dependent on farm-level
productivity growth. There is, therefore, a need to both increase productivity in the sector and facilitate a
movement away from farm work for smallholder family farms, possibly to off-farm work.
99. A large proportion of the employment in off-farm segment of the agri-food system is concentrated
in downstream marketing and food services. According to the 2017 Labor Force Survey (LFS), agro-
processing accounts for about 5 percent of all FTE jobs, and food marketing and services represents account
for about 7 percent. According to the LFS, between 2007 and 2017, employment shares in the downstream
marketing and food services grew six times faster than agro-processing and generated twice as many new
FTE jobs. Over the next decade, the share of jobs in the downstream food marketing and services is expected
to rise rapidly, reaching about 10 percent of total FTE jobs by 2030; agro-processing’s share of total FTE
jobs will remain at 5 percent. Egypt’s rising reliance on food imports may further diminish the potential for
job expansion in the agro-processing sector. Potential growth of the agro-processing sector will depend on
the availability of agricultural raw materials in consistent quality and quantity, which also depend on on-
farm productivity growth.
20 In all age categories, more women are engaged in farming than males. For instance, in 2016/17, women were about twice as
likely as men to be engaged in farming among youth (15–24) and young adults (25–34).

41
Table 3.2 Proportion of working-age population whose primary employment was in farming, off-farming
agri-food system, or the non-farm sector, 2007–17
Survey year
Off-farm within agri-food system Food preparation Non-farm
outside the agri-
food system Farming Agroprocessing Downstream
% of
jobs
% of
FTE jobs
Number of
jobs (million)
# of
FTE jobs
Number of
jobs (million)
# of
FTE jobs
Number of
jobs (million)
# of
FTE jobs
% of
jobs
% of
FTE jobs
2007 32.7 29.3 4.3 4.6 2.7 3.1 1.2 1.4 59.1 61.6
2008 31.0 28.2 4.6 4.8 2.6 2.9 1.3 1.6 60.5 62.5
2009 29.3 26.6 4.2 4.4 2.8 3.1 1.4 1.6 62.3 64.2
2010 27.7 25.0 4.4 4.6 3.2 3.5 1.6 1.8 63.2 65.0
2011 28.7 26.3 3.8 3.9 3.0 3.4 1.4 1.6 63.1 64.7
2012 26.4 24.3 4.0 4.3 3.1 3.5 1.6 1.8 64.9 66.1
2013 27.3 24.8 3.8 4.1 3.4 3.8 1.6 1.9 63.9 65.4
2014 26.8 24.3 4.1 4.4 3.3 3.8 1.7 2.0 64.0 65.5
2015 25.2 23.2 4.3 4.6 3.7 4.1 2.0 2.3 64.8 65.8
2016 24.8 22.2 4.4 4.8 3.6 4.1 2.1 2.5 65.1 66.4
2017 24.4 22.4 4.8 5.2 3.9 4.3 2.0 2.3 64.9 65.8
Source: Yeboah and Jayne 2020.
Note: Working-age population is people 15–64. Farming comprises all activities related to crop and livestock production. Off-
farm agri-food system represents all pre- and post-farm value-addition activities within the agricultural value chains. Non-farm
sectors encompassing all other activities outside the agri-food system such as construction, finance, utilities. Agro-processing
involves the processing of agricultural products; Downstream commerce and distribution represent wholesale and retail of food
and agricultural products; Food away from home entails food services including street food vendors, restaurants. FTE = full-time
equivalent.
100. People relying to a large extent on agricultural income (wage work or self-employment) are more
likely to be poor. A quarter of households in the bottom 20 consumption quintile relies, at least partly, on
labor income from agriculture (Figure 3.11). The share of households relying on agricultural income is
higher in rural Upper Egypt than in rural Lower Egypt (Figure 3.12)). Exclusive reliance on agricultural
income is significantly higher in the poorest quintile (18 percent of households), indicating that better-off
households are better able to diversify their sources of income. In the poorest agricultural households, 40
percent of male workers outside of agriculture are in the construction sector and 58 percent of female
workers are in wholesale and retail trade.

42
Figure 3.9 Percentage of households relying on agriculture, by consumption quintile and region
a. By consumption quintile b. By region
101. Total factor productivity in agriculture has increased with declining shares of employment in
farming and employment growth in the non-farm sector. Therefore, government policies and programs
affecting the rate of agricultural productivity growth are a powerful means of promoting structural
transformation. Egypt offers significant growth opportunities for agri-food sector given its large domestic
food market. A significantly greater share of domestic demand for high-value and processed products could
be met through an increase in economically competitive and environmentally sustainable domestic
production than is currently the case. On average, Egyptian households spend almost 40 percent of their
disposable income on food. A shift in food expenditure away from cereals to high-value proteins and
relatively perishable food items occurred across all income categories between 2000 and 2015 (Yeboah and
Jayne 2020). An increasing share of this growing food demand is being met through food imports. The
share of the value of food imports in total merchandise has steadily, from about 25 percent in 2005 to 43
percent in 2017, according to the Food and Agricultural Organization (FAO 2020). Imports offer
downstream employment in activities such as food distribution, retailing, restaurants, and some types of
processing. The untapped export potential for agriculture stands at US$16 billion, according to the
International Trade Center, three times current export levels of about US$5 billion a year. Meeting this
demand needs to be environmentally sustainable.21
102. How much scope is there to raise agricultural total factor productivity among small-scale family
farms? Egypt has a dualistic farming system—small-scale family farms in the delta and Nile valley using
irrigation and state-of-art large commercial farms on reclaimed lands. The incidence of very small land
plots is higher in Upper Egypt than in Lower Egypt—a feature that also likely contributes to the difference
in agriculture productivity between the two regions, as the previous SCD noted. Smallholder farmers are
family farms, usually of 3 feddans or less. These farmers grow field crops (cereals, legumes, sugar crops,
oilseeds, and forages for livestock feed) and raise livestock. Medium-size and large farm holdings tend to
allocate a larger share of land to horticultural cash crops.
103. Fragmentation of land holdings into very small plots limits economies of scale and reduces
efficiency. Estimates based on the 2012 ELMPS data show that the average number of workers per feddan
is 9.0 for poor agricultural households and 1.2 for better off households (Nin-Pratt, ElDidi, and Breisinger
21 Agricultural products with the greatest export potential include fruits, vegetables, dairy products, and other food products (such
as food preparations and vegetable saps and extracts), as the global income for high value foods rises.

43
2018). This high intensity of cultivation of small farms relative to larger farms is similar to that found in
other developing countries and could indicate market imperfections. Small family farms in Egypt have year-
round access to irrigation water, but the water supply is entirely reliant on the Nile (see chapter 6) and
incentives for efficient water use are not in place. Both factors limit the sustainability of water use in
agriculture. The inefficient use of water resources by smallholders reflects Egypt’s irrigation water pricing
and farmers’ suboptimal crop mix (Saleh 2018). Smallholder family farms use the traditional flood
irrigation system, which does not allow farmers to control the amount of water used per plot and for
different type of crops. They grow crops considered important for food security, such as wheat, rice, and
sugar beets, which are also water-thirsty, in a context in which their purchases are effectively guaranteed
by the government and state-owned refineries (World Bank Group 2015).
104. Another factor affecting the efficiency of small family farmers is lack of information about demand
for crops. For crops other than strategic field crops, market mechanisms determine the price and quantity
sold. Small farmer associations that could provide marketing services or information are not in place.
Agricultural cooperatives tend to focus only on the distribution of (significantly subsidized) fertilizer and
other inputs rather than as market-enabling organizations linking small farmers to market opportunities and
value chains, as the 2015 SCD noted.
105. Weak intersectoral linkages between farm and off-farm opportunities and demand for agricultural
products prevent farmers from responding to rising domestic demand or participating in export value chains.
These weak linkages can be attributed to inefficiencies along key agricultural value chains that result in
losses averaging 30 percent, including poor logistics and marketing infrastructure (which accounts for about
half of all losses); the lack of access to (cold) storage and transportation, which particularly affects small
farmers; poor skills and poor access to new technologies and knowledge; and implementation of food safety
and quality standards (World Bank 2018b).

44
4 Firm Performance
Key findings on constraints to boosting private sector investment, firm growth, and productivity (Pathway
2):
• Egyptian firms do not grow as much as firms in peer economies —not in terms of hired workforce
and less so in terms of sales. As a result, there are relatively fewer large Egyptian firms, and they
are undercapitalized, compared to what is found in peer economies.
• There are a great number of small firms, many of which are in the informal sector. But this sector
is not an incubator for future formal firms—rather, once informal firms enter that sector, they likely
remain there.
• Firm-level productivity is relatively stagnant, although the most productive ones are slightly more
likely to gain market share than the less productive ones.
• While improving, the economy is still relatively closed and has a complex trade regime that likely
keeps firms from growing, investing and innovating. FDI is relatively confined to a few sectors. In
more open economies, the competition from international trade and foreign firms adds dynamism
to the economy.
• Persistence of pricing above costs—that is, markups—indicates a lack of competition and
segmented markets, and a lack of competition seems to be a prevalent problem.
4.1 Firms, Jobs, and Poverty Alleviation
106. Egypt cannot reduce poverty or improve economic inclusion without good jobs; job creation and
poverty reduction are not independent. Because private sector firms are the main engine of job creation, it
is critical to understand what drives job creation and what obstacles prevent firms from growing and
generating jobs. While in a well-functioning private sector, competition among firms would push them to
improve productivity, innovate, and expand markets—allowing the most productive firms to grow, and less
productive firms to shrink or go out of business—this dynamic process seems to be hampered. Without the
benefit of these firm dynamics, the Egyptian economy will find it difficult to sustain growth, create jobs,
raise incomes, and reduce poverty.
107. A clear problem with firm dynamics is that Egyptian firms do not grow as rapidly as those in other
economies, and firm-level productivity is stagnant or declining. In several sectors, increased market share
is not related to productivity; a growing market share does not necessarily mean that firms are getting better
at what they do.
108. Because it is difficult for firms to grow, the Egyptian economy has fewer large firms than other
economies do. This has implications for overall economy-wide productivity. Segmentation between formal
and informal firms is sharp; differences in productivity between the two sectors make it difficult to see how
informal firms can transition to the formal market. The underlying cause of these findings may be low levels
of competition manifested in markups on prices above competitive levels.
109. Most importantly, large firms are the steppingstone for the making of a country’s middle class. The
job stability, the benefits and the higher and rising wages are the hallmarks of what provides a middle-class
family the ability to save, invest and keep the consumption engine of an economy growing. With fewer
larger firms, it is difficult to see how Egypt can grow a vibrant middle class.
110. The analysis in this chapter uses firm-level data from the World Bank’s Enterprise Surveys to
compare Egyptian firms with firms in other economies (peer economies or other economies in the MENA

45
region).22 Enterprise Surveys poll a representative sample of private sector firms, with a focus on the
manufacturing sector. Formal (registered) companies with five or more employees are targeted for
interview. Firms with 100 percent government/state ownership are excluded from the sample. In each
country, businesses in the cities/regions of major economic activity are interviewed. The Enterprise Surveys
for Egypt covered the urban regions of Greater Cairo, the Middle and East Delta, the West Delta, Northern
Upper Egypt, Southern Upper Egypt, the Suez Region, and the Frontier.
111. In a well-functioning economy, firms enter the market small and then grow, creating jobs and
increasing sales. In a distorted business environment, firms grow more slowly, create fewer jobs, and may
stagnate (Hsieh and Klenow 2014). One way to determine how effective an economy is in supporting firm
growth is to track firms over their lifecycles—that is, to see whether they employ more workers and/or earn
more revenue every year they stay in the market. The slope of the lines in Figure 4.1 indicates how rapidly
firms in Egypt grow with respect to their workforce and revenues as they age.23 Where firm growth is faster,
the slope of the line is steeper.
Note: Band shows 95 percent confidence level.
112. This analysis suggests that firm growth in Egypt is slower than in other economies, in terms of both
revenue and employment growth. The presence of stagnant or slow-growing firms hampers overall growth
22 For Egypt, the chapter uses data collected in 2013, 2016, and 2020. For information on the World Bank Enterprise Surveys,
see www.enterprisesurveys.org.
23 A cross-sectional analysis of this type incorporates the strong assumption that the average 1-year-old firm today is the same
size as the average 10-year-old firm was 10 years ago. The expectation is that age is a good predictor of growth.
Figure 4.1 Projected number of employees and revenues given firm age in Egypt and comparator countries
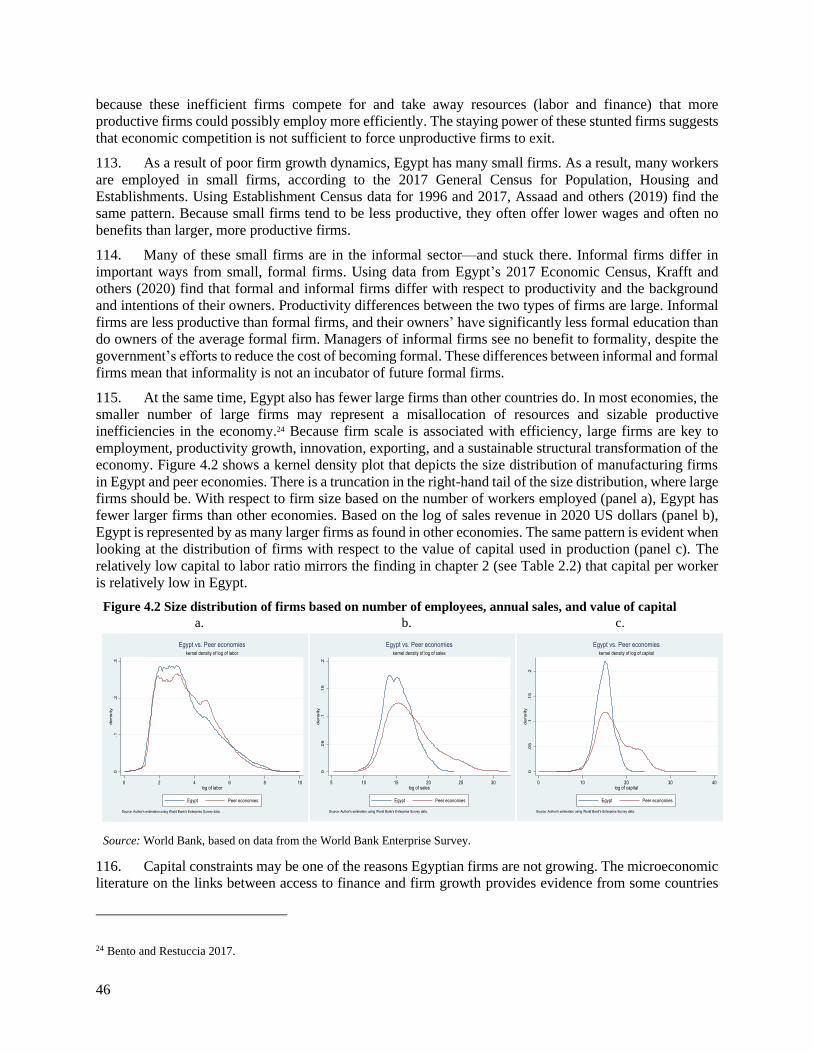
46
because these inefficient firms compete for and take away resources (labor and finance) that more
productive firms could possibly employ more efficiently. The staying power of these stunted firms suggests
that economic competition is not sufficient to force unproductive firms to exit.
113. As a result of poor firm growth dynamics, Egypt has many small firms. As a result, many workers
are employed in small firms, according to the 2017 General Census for Population, Housing and
Establishments. Using Establishment Census data for 1996 and 2017, Assaad and others (2019) find the
same pattern. Because small firms tend to be less productive, they often offer lower wages and often no
benefits than larger, more productive firms.
114. Many of these small firms are in the informal sector—and stuck there. Informal firms differ in
important ways from small, formal firms. Using data from Egypt’s 2017 Economic Census, Krafft and
others (2020) find that formal and informal firms differ with respect to productivity and the background
and intentions of their owners. Productivity differences between the two types of firms are large. Informal
firms are less productive than formal firms, and their owners’ have significantly less formal education than
do owners of the average formal firm. Managers of informal firms see no benefit to formality, despite the
government’s efforts to reduce the cost of becoming formal. These differences between informal and formal
firms mean that informality is not an incubator of future formal firms.
115. At the same time, Egypt also has fewer large firms than other countries do. In most economies, the
smaller number of large firms may represent a misallocation of resources and sizable productive
inefficiencies in the economy.24 Because firm scale is associated with efficiency, large firms are key to
employment, productivity growth, innovation, exporting, and a sustainable structural transformation of the
economy. Figure 4.2 shows a kernel density plot that depicts the size distribution of manufacturing firms
in Egypt and peer economies. There is a truncation in the right-hand tail of the size distribution, where large
firms should be. With respect to firm size based on the number of workers employed (panel a), Egypt has
fewer larger firms than other economies. Based on the log of sales revenue in 2020 US dollars (panel b),
Egypt is represented by as many larger firms as found in other economies. The same pattern is evident when
looking at the distribution of firms with respect to the value of capital used in production (panel c). The
relatively low capital to labor ratio mirrors the finding in chapter 2 (see Table 2.2) that capital per worker
is relatively low in Egypt.
Figure 4.2 Size distribution of firms based on number of employees, annual sales, and value of capital
a. b. c.
Source: World Bank, based on data from the World Bank Enterprise Survey.
No 116. Capital constraints may be one of the reasons Egyptian firms are not growing. The microeconomic
literature on the links between access to finance and firm growth provides evidence from some countries
24 Bento and Restuccia 2017.

47
that firms with access to external finance grow more quickly than other firms (Rajan and Zingales 1998;
Ayyagari, Demirgüç-Kunt and Maksimovic 2010). The undercapitalization of large firms points in the
direction of financial constraints as well.
117. In addition to access to capital, firms are likely to grow where labor is well-trained or trainable, and
labor contracts are flexible. Large, competitive markets that are open and growing are also key to firm
growth. Foreign direct investment (FDI) and open trade give firms access to new technologies and new
ways of organizing more efficient production, allowing firms to compete for market share and grow.
4.2 Productivity of Manufacturing Firms and Reallocation of Resources
118. Why is firm growth relatively low in Egypt? The concern is with what is happening with
productivity—as opposed to demand, another factor that affects firm growth. Since the economy has been
growing during the period of time reviewed, demand should be growing, productivity is more likely to be
impeding firm growth. Changes in productivity can occur within the firm (through innovation, technology,
or reorganization of production) or through a reallocation of resources across firms (through markets). It is
the latter that is the focus of the following analysis. Two measures are used to examine the allocation of
resources across firms and sectors: (i) the relationship between a firm’s market share and its productivity
(Olley and Pakes 1996); and (ii) the distribution of firm-level productivity across economies (Hsieh and
Klenow 2009).
4.2.1 Low and stagnant productivity
119. Between 2013 and 2020, overall firm productivity, as measured by total factor productivity (TFP),
for the sample of formal, urban manufacturing firms in Egypt remained relatively stable, as shown in Figure
4.3. The bell-shape part of the distributions has not shifted to the right, which would indicate that average
productivity is improving. However, the Figure displays an almost complete overlap between the
productivity distributions for the three years sampled, revealing that productivity changed little during this
time period.25
25 World Bank Enterprise Survey data are used to estimate productivity because the data are designed for cross-country comparisons
of firm-level productivity. These distributions are unweighted, so the kernel density displays the productivity distribution for the
average firm, reported in the second column of Table 4.1.
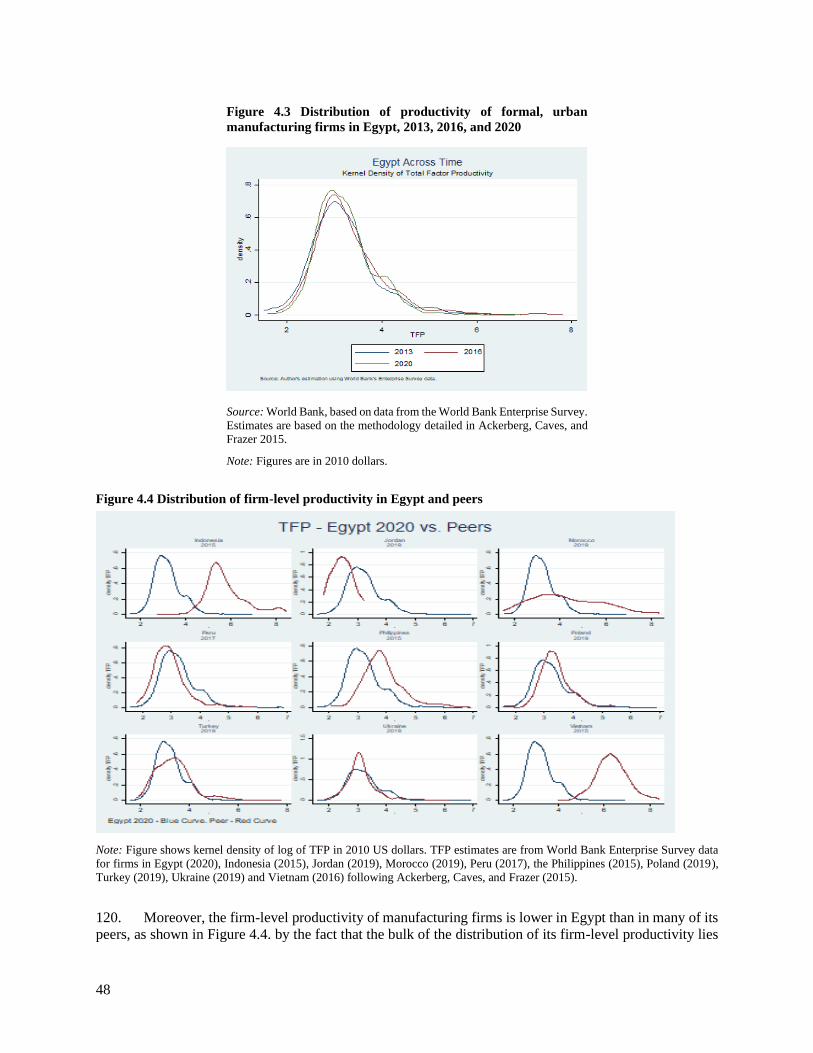
48
Figure 4.3 Distribution of productivity of formal, urban
manufacturing firms in Egypt, 2013, 2016, and 2020
Source: World Bank, based on data from the World Bank Enterprise Survey.
Estimates are based on the methodology detailed in Ackerberg, Caves, and
Frazer 2015.
Note: Figures are in 2010 dollars.
Figure 4.4 Distribution of firm-level productivity in Egypt and peers
Note: Figure shows kernel density of log of TFP in 2010 US dollars. TFP estimates are from World Bank Enterprise Survey data
for firms in Egypt (2020), Indonesia (2015), Jordan (2019), Morocco (2019), Peru (2017), the Philippines (2015), Poland (2019),
Turkey (2019), Ukraine (2019) and Vietnam (2016) following Ackerberg, Caves, and Frazer (2015).
120. Moreover, the firm-level productivity of manufacturing firms is lower in Egypt than in many of its
peers, as shown in Figure 4.4. by the fact that the bulk of the distribution of its firm-level productivity lies
49
to the left of that of most peer economies (Indonesia, the Philippines, Vietnam, Morocco, Poland, and
Turkey). Firm productivity in Egypt is closer to that of Ukraine and higher than that of manufacturing firms
in Jordan and Peru. 26 The data also reveal that Egypt has fewer high-productivity manufacturing firms than
its peers, especially Indonesia, Morocco, Poland, Ukraine, and Vietnam. There is a strong correlation
between the predominance of large firms and above-average levels of productivity (Ciani and others 2020)
(see Box 4.1 for how TFP was estimated).
121. In addition, differences in productivity are greater among large firms than among small- and
medium-size firms.27 Of the 40 most productive firms in this sample of manufacturing establishments,
almost half (18) are large, 13 are small, and 9 are medium-size. The top 5 firms in terms of productivity
and 8 of the top 10 are large.
Box 4.1 Estimating total factor productivity
The classic production function used to analyze productivity follows the Cobb-Douglas approach, where
𝑌𝑖𝑡 is the physical production of firm i in period t; 𝐴𝑖𝑡 is the Hicksian neutral efficiency level of firm i in
period t; and 𝐾𝑖𝑡, 𝐿𝑖𝑡 , and 𝑀𝑖𝑡 represent the capital, labor, and material inputs, respectively:
𝑌𝑖𝑡 = 𝐴𝑖𝑡𝐾𝑖𝑡𝛽𝑘𝐿𝑖𝑡
𝛽𝑙𝑀𝑖𝑡𝛽𝑚.
In principle, all inputs (𝐾𝑖𝑡, 𝐿𝑖𝑡, and 𝑀𝑖𝑡) are observable to both the firm and the econometrician, but the
efficiency level 𝐴𝑖𝑡 is observed only by the firm (Van Beveren 2010). It affects the firm’s decisions about
inputs levels and allocations. Taking natural logarithms to the previous expression produces a linear
equation that could be estimated using ordinary least squares (OLS):
𝑦𝑖𝑡 = 𝛽0 + 𝛽𝑘𝑘𝑖𝑡 + 𝛽𝑙𝑙𝑖𝑡 + 𝛽𝑚𝑚𝑖𝑡 + 𝜀𝑖𝑡
where the lower-case letters represent natural logarithms, and the efficiency term can be rewritten as:
ln (𝐴𝑖𝑡) = 𝛽0 + 𝜀𝑖𝑡
In the previous expression, 𝛽0 represents the average efficiency level across firms and over time, and 𝜀𝑖𝑡
is the time- and producer-specific deviation from the mean efficiency. This deviation from mean
efficiency could be further decomposed into an observable (𝑣𝑖𝑡) and an unobservable component (𝑢𝑖𝑡𝑞
),
where the latter is an independent and identically distributed random variable representing unexpected
deviations from the mean:
𝜀𝑖𝑡 = 𝑣𝑖𝑡 + 𝑢𝑖𝑡𝑞
.
Combing the previous elements into a single equation results in
𝑦𝑖𝑡 = 𝛽0 + 𝛽𝑘𝑘𝑖𝑡 + 𝛽𝑙𝑙𝑖𝑡 + 𝛽𝑚𝑚𝑖𝑡 + 𝑣𝑖𝑡 + 𝑢𝑖𝑡𝑞
.
Estimating the previous expression using OLS is problematic. Marschak and Andrews (1944) noted that
the selection of inputs in the production function was determined by characteristics of the firm, such as
26 Peer economies used as comparators are Indonesia, Jordan, Morocco, Peru, the Philippines, Poland, Turkey, Ukraine, and
Vietnam. Mexico and Pakistan are also peer economies, but the latest round of panel for these economies was collected before
2015, making these data too dated to provide a meaningful comparison with the latest data from Egypt. As of September 2020, full
World Bank Enterprise Survey panel data were not available for Malaysia, Sri Lanka, or Tunisia. Malaysia and Sri Lanka had
completed only one wave. Tunisia conducted a survey in 2020 but a panel was not constructed using the previous survey. For this
reason, these economies were excluded from this analysis.
27 One firm had negative value added. As the finding can be a data error, this observation was excluded.

50
its efficiency (endogeneity of inputs or simultaneity bias), violating the condition 𝐸(𝜀|𝑋) = 0. As a
consequence, using OLS would bias the estimated coefficients.
The traditional approach to estimating TFP relied on firm-level data from balanced panels. It therefore
excluded firms that exit or enter the market. Failure to explicitly take the exit decision into account would
result in a selection bias or endogeneity of attrition, as the firm’s decision on the allocation of inputs in
a given period is made conditional on survival (Van Beveren 2010). Ackerberg and others (2007) argue
that the observations of firms’ expected productivity level before their exit will generate a correlation
between the error term and their productivity level, conditional on the firm being in the dataset, because
firms with more capital will be able to survive shocks of lower productivity relative to firms with lower
capital stock.
Olley and Pakes (1996) argue that the simultaneity problem arises because the selection of input
quantities is (partly) determined by prior beliefs about their productivity. For example, a positive
productivity shock would likely lead to more intense use of labor and materials, introducing an upward
bias in the input coefficients (De Loecker 2007) and likely a downward biased in the capital coefficient
(Levinsohn and Petrin 2003). They argue that addressing the selection and simultaneity problems
requires a dynamic model of firm behavior that allows for differences in firm-specific efficiency that
show idiosyncratic changes across time. The model, they argue, must specify the information available
when input decisions are made. To control for the selection induced by the liquidation decision, the model
must also include an exit rule. Olley and Pakes solve a control function on investment (which needs to
satisfy some characteristics, such as invertibility and be positive with respect to productivity) as a proxy
for a firm’s productivity.
Levinsohn and Petrin (2003) argue that using investment as the proxy variable for productivity is
problematic, because several firms report zero investment and the investment variable tends to be very
lumpy (as investment tends to face important adjustment costs), forcing researchers to drop multiple
firms from the sample and show few reactions to productivity shocks. They propose using materials as
the proxy variable for a firm’s productivity (or one of the material components, such as fuel or electricity).
Ackerberg, Caves, and Frazer (2015) find that the estimation method proposed by Levinsohn and Petrin
does not allow for identification of the labor coefficient when labor is a state variable (when, for instance,
there are significant hiring and firing costs, as in several EU countries). They came up with an alternative
procedure to solve this problem. If labor is a completely flexible input, estimates using either their method
or that of Levinsohn and Petrin should be the same. If labor is not a completely flexible input, the
parameter on labor may be biased and the TFP estimates may therefore differ. As labor markets are
fraught with frictions, the Ackerberg, Caves, and Frazer method seems to be better suited to estimating
TFP.
Several caveats are necessary regarding results of the productivity estimation exercise. First, the periods
used to estimate productivity differ in each country. In addition, as the objective of the exercise was not
to obtain the best possible estimation of productivity but to present comparable estimates of productivity,
a simple model was used to estimate productivity in each country. Data from the Enterprise Survey were
collected and harmonized to be as comparable as possible and a similar model was used to estimate
productivity. Nevertheless, definitions (especially regarding capital) in Egypt, Indonesia, and Turkey
may differ somewhat. Overall, the results obtained using the Enterprise Survey data for these countries
should be taken as suggestive evidence, not proof of differences in productivity across firms in different
countries.
The exit and entrance of firms should not be attributed to the endogeneity of attrition in the sample. When
working with administrative registries, it is possible to observe the entrance and exit of firms based on
their actual economic activity. However, as the firm-level information from the Enterprise Surveys
corresponds to a representative sample, it is not possible to determine whether changes in the composition

51
of the sample reflect actual changes in firm entrance and exit or to sampling or survey implementation
decisions.
4.2.2 Poor allocation of productive resources
122. A first step in better understanding the dynamics of productivity in Egypt is to ask whether markets
allocate resources to more productive firms. To answer this question, the Olley and Pakes (OP)
decomposition is used. The OP decomposition assumes that in the absence of distortions, more productive
firms would expand while less productive firms would shrink or even exit the market.28 By implication,
productivity and firm size move in the same direction, so the covariance between productivity and market
share is positive when the economy is not distorted, and markets function well; a large covariance term
suggests that the economy efficiently allocates productive resources. In contrast, a large negative covariance
term indicates that the economy is inefficient in allocating resources, suggesting distortions in product
markets.
123. Estimates of the OP productivity decomposition for Egypt provide mixed results about how
efficiently the economy allocates resources and how well markets function (Table 4.1). The first result is
that for a large proportion of firms—which are mostly smaller ones—there is little productivity growth.
The smaller changes between the unweighted (.80, .83 and .81), as compared to the weighted (1.0, 1.14,
and 1.15), imply that larger Egyptian manufacturing firms had larger productivity gains than smaller firms.29
In the unweighted mean, smaller firms have more influence on the mean since they are more numerous in
the sample.
Table 4.1 Covariance of productivity with market share (2013, 2016, and 2020)
Year 𝐩𝐭
Weighted mean
�̅�𝐭
Unweighted mean
𝐂𝐨𝐯𝐚𝐫(𝐩𝐭, 𝐒𝐭)
Covariance between TFP and sales
2013 1.00 0.80 0.20
2016 1.14 0.83 0.30
2020 1.15 0.81 0.34
Source: World Bank, based on data from World Bank Enterprise Surveys.
Note: Productivity is estimated using the Ackerberg, Caves, and Frazer method. Weighted and unweighted means are normalized
to the 2013 weighted mean (1.00).
124. The second result is that a higher market share goes to more productive firms though the
relationship between productivity and market share is low. This is so because a positive and large (close to
1.00) covariance indicates that a higher (lower) share of the market goes to more (less) productive firms.
Although market shares, based on sales, were correlated with higher productivity—the term is positive and
the covariance factor rose between 2013 and 2020—the relationship remains relatively weak.
28 Other decompositions used for similar objectives include those developed by Baily, Hulten, and Campbell (1992); Griliches and
Regev (1995); Foster, Haltiwanger, and Krizan (2001); Baldwin and Gu (2006); Diewert and Fox (2010); and Petrin and Levinsohn
(2012). For more details, see Karagiannis and Paleologou (2018).
29 When an average is unweighted, that means that firms with more revenue influence that average more than when the average is
weighted. Stability in the unweighted means that the covariance of large firms did not change much across the years as compared
to others in the distribution.

52
125. Taken together, these two results suggest that the reallocation of output across firms—rather than
the increase in the average productivity of each firm—seems to drive increases in productivity at the
industry level. That means that it is less likely that internal (within-firm) factors, such as innovation, the
reorganization of production, and the application of new technologies, drive increases in productivity
growth. It is more likely that improvements in productivity, though rather muted, are driven by reallocation
of resources to more productive firms.30
126. In sum, the analysis in this section found that while the allocation of market share generally goes
to the more productive firms, there are reasons for concern. The good news is that larger firms seem to be
driving productivity. The bad news is that small firms, the largest employers, seem to be stagnant. The
relatively weak correlation between sales and productivity appears to call into question how well markets
function to reallocate resources efficiently in the Egyptian economy. There are also concerns that the
estimated improvements of productivity growth by large firms may be due to their ability to charge higher
prices, because of market power, not improvements in productivity.31
4.3 Stunted Competition
127. Another concern about the dynamics of productivity centers on market power and competition—
in particular, that Egypt is characterized by less competition than most of its comparators. The World
Economic Forum computes a Global Competitiveness Index, including a domestic and foreign competition
index. These indicators—based on macroeconomic data, as well as responses to surveys by business
leaders—are available for 2019. They consider factors such as the intensity of local competition, the
effectiveness of anti-monopoly policy, and the ease of doing business, measuring the level of competition
on a scale of 1 (worst) to 7 (best). Egypt ranks low on both domestic and foreign competition, but especially
on foreign competition. Among the peers identified in the SCD, only Pakistan ranks lower on foreign
competition, and only Mexico, the Philippines, and Ukraine perform worse in terms of domestic
competition (Figure 4.5).
30 Concerns about biased estimates are based on the lack of data on firm entry and exit, as well as the impact a large informal sector
may have on the productivity of formal firms. New entrants tend to price their goods lower than the average firm. Lower than
average prices would pull average productivity down even when output productivity is the same. Ignoring entry thus pull the
average down and can be misinterpreted as lower productivity growth of surviving firms. The opposite is true with exiting firms.
When exiting firms go unmeasured, they tend to raise the aggregate productivity of surviving firms, because exiting firms are likely
to have had lower than average productivity. It is unclear what happens to aggregate productivity when entry and exit goes
unmeasured. Another potential source of bias is the fact that the sample includes only formal manufacturing firms and the share of
informal firms is relatively high in Egypt (as in other developing economies). The presence of a high share of informal firms
indicate that distortions exist that could induce even formal firms to exit. As a consequence, firms that left because of these high
distortions are not captured in the sample.
31 The models used to estimate productivity use total annual revenue as the dependent variable. In other words, the models are
designed to explain how much the variation across firms in sales revenue are due to the use of capital, labor, and how efficiently
these are employed. Sales revenue is a function of how much is sold (𝑄) and prices (𝑃). 𝑄 multiplied by 𝑃 equals Revenue (𝑃 × 𝑄 =𝑅). The variable 𝑃, however, may be inflated because of markups. This, in turn, would inflate 𝑅 (revenues). The econometric model
would interpret this inflated revenue, all other things being equal, as higher productivity; two firms that use the same amount of
labor and capital, but in one revenues are higher because of higher prices, would be categorized as more productive. This would be
an incorrect conclusion. An increase in markups could lead to the false conclusion that productivity is improving. In future research,
it would be important to understand how much of the positive changes in productivity in Egyptian manufacturing firms can be
attributed to markups and to efficiency gains.
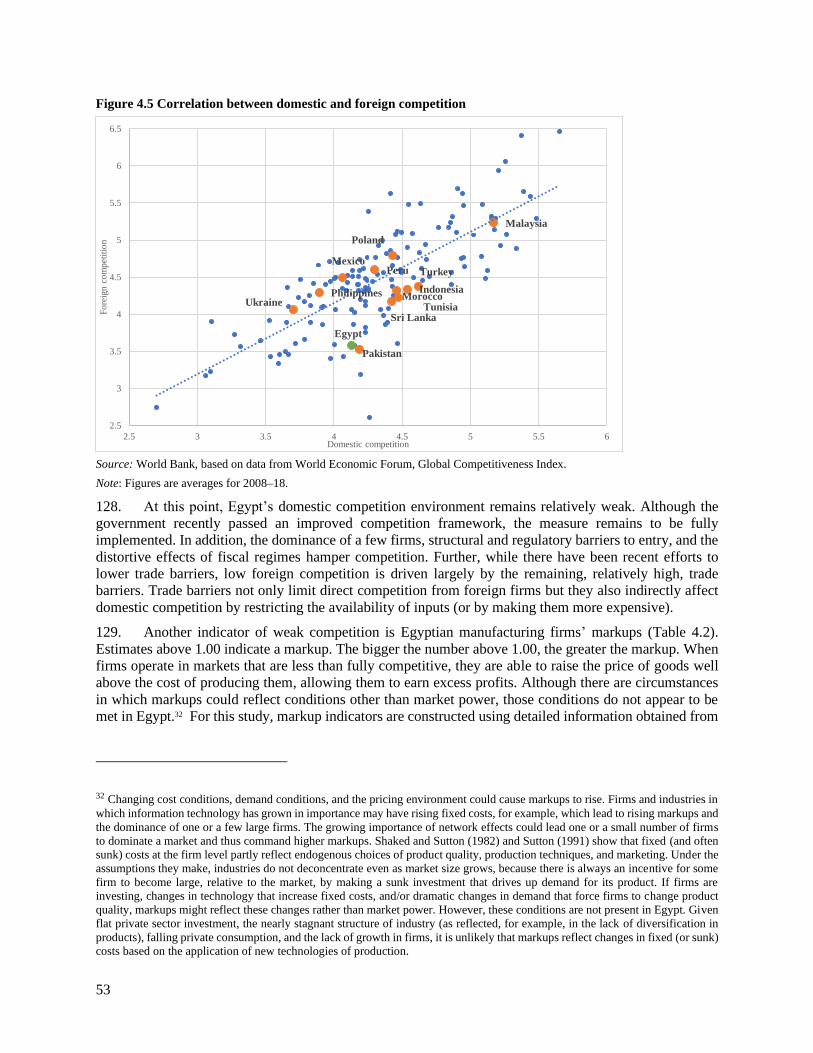
53
Figure 4.5 Correlation between domestic and foreign competition
Source: World Bank, based on data from World Economic Forum, Global Competitiveness Index.
Note: Figures are averages for 2008–18.
128. At this point, Egypt’s domestic competition environment remains relatively weak. Although the
government recently passed an improved competition framework, the measure remains to be fully
implemented. In addition, the dominance of a few firms, structural and regulatory barriers to entry, and the
distortive effects of fiscal regimes hamper competition. Further, while there have been recent efforts to
lower trade barriers, low foreign competition is driven largely by the remaining, relatively high, trade
barriers. Trade barriers not only limit direct competition from foreign firms but they also indirectly affect
domestic competition by restricting the availability of inputs (or by making them more expensive).
129. Another indicator of weak competition is Egyptian manufacturing firms’ markups (Table 4.2).
Estimates above 1.00 indicate a markup. The bigger the number above 1.00, the greater the markup. When
firms operate in markets that are less than fully competitive, they are able to raise the price of goods well
above the cost of producing them, allowing them to earn excess profits. Although there are circumstances
in which markups could reflect conditions other than market power, those conditions do not appear to be
met in Egypt.32 For this study, markup indicators are constructed using detailed information obtained from
32 Changing cost conditions, demand conditions, and the pricing environment could cause markups to rise. Firms and industries in
which information technology has grown in importance may have rising fixed costs, for example, which lead to rising markups and
the dominance of one or a few large firms. The growing importance of network effects could lead one or a small number of firms
to dominate a market and thus command higher markups. Shaked and Sutton (1982) and Sutton (1991) show that fixed (and often
sunk) costs at the firm level partly reflect endogenous choices of product quality, production techniques, and marketing. Under the
assumptions they make, industries do not deconcentrate even as market size grows, because there is always an incentive for some
firm to become large, relative to the market, by making a sunk investment that drives up demand for its product. If firms are
investing, changes in technology that increase fixed costs, and/or dramatic changes in demand that force firms to change product
quality, markups might reflect these changes rather than market power. However, these conditions are not present in Egypt. Given
flat private sector investment, the nearly stagnant structure of industry (as reflected, for example, in the lack of diversification in
products), falling private consumption, and the lack of growth in firms, it is unlikely that markups reflect changes in fixed (or sunk)
costs based on the application of new technologies of production.
Egypt
Indonesia
Malaysia
Mexico
Morocco
Pakistan
Peru
Philippines
Poland
Sri LankaTunisia
Turkey
Ukraine
2.5
3
3.5
4
4.5
5
5.5
6
6.5
2.5 3 3.5 4 4.5 5 5.5 6
Fore
ign c
om
pet
itio
n
Domestic competition

54
World Bank Enterprise Surveys, which provide mostly cross-sectional information. Markups are estimated
using the methodology described in De Loecker and Warzynski 2012 (Box 4.2).
Box 4.2 Estimating markups
Markups can be expressed as the ratio of prices to marginal costs. They can be recovered from a
production function by dividing the output elasticity of an input by the revenue share of that input (the
latter being the ratio of the expenditure in that particular input to total output).
A translog production function is first run to estimate output elasticities:
𝑦𝑖𝑡 = 𝛽𝑙𝑙𝑖𝑡 + 𝛽𝑙𝑙𝑙2𝑖𝑡 + 𝛽𝑙𝑘𝑙𝑖𝑡𝑘𝑖𝑡 + 𝜔𝑖𝑡 + 𝜀𝑖𝑡
where yit is the output of firm i in time t; lit is the number of workers; kit is the capital stock; wit is a
term that reflects the inclusion of capital stocks, intermediate materials, and the interaction between them
in the production function; and eit is the error term. All variables are expressed in logs.
The election of a translog (instead of a Cobb-Douglas) production function is important because it allows
the output elasticities to depend on input use intensities (given by the squared variables and the cross
factors). To estimate this function considering the endogeneity of the error term, De Loecker and
Warzynski used a working paper version of the model that would later be published by Ackerberg, Caves,
and Frazier (2015).
The estimated output elasticity of the labor input is given by
𝜃�̂�𝑖𝑡 = �̂�𝑙 + �̂�𝑙𝑙𝑙𝑖𝑡 + �̂�𝑙𝑘𝑘𝑖𝑡.
The markup mit of the firm is computed by dividing this output elasticity by aL, the wage bill of the firm
divided by total output (measured by sales):
�̂�𝑖𝑡 = 𝜃�̂�𝑖𝑡(𝛼𝐿
𝑖𝑡)−1.
An additional correction can be made to the revenue share. Instead of dividing the wage bill by total
sales, total output, it is divided by the sales predicted by a factor of production and materials from the
first equation. According to De Loecker and Warzynski, this correction eliminates any variation in
expenditure shares that comes from variation in output that is not correlated with the inputs of the
production function—or, put differently from output variation that is not related to variables affecting
input demand, including input prices, productivity, technology parameters, and output prices.
Table 4.2 Markups in Egypt’s manufacturing sectors, 2013, 2016, and 2020
Year Weighted by sales Weighted by labor
2013 1.00 1.00
2016 1.09 1.12
2020 1.06 1.05 Note: All markups were computed using the method explained in De Loecker and Warzynski (2012). Individual markups are
weighted by firms’ sales and the number of employees to obtain the economy’s averages. Markups are normalized to 1.0 in the
first wave of the World Bank Enterprise Surveys (2013).
130. On average, markups in Egyptian manufacturing rose between 2013 and 2016 and then fell slightly
between 2016 and 2020 (Table 4.3). The chemicals, rubber, basic metals, and all of the electrical machinery
and transport sub-sectors have higher markups than other sub-sectors. Markups are lower than average in
apparel, leather, wood manufacturing, nonmetallic manufacturing, fabricated metals, printing, and
furniture. Most of the sub-sectors with higher markups have relatively high fixed costs. Higher fixed (or

55
sunk) costs can lead to fewer firms in a market, which can result in softer competition, higher prices, and
reduced consumer welfare.33
Table 4.3 Markups in selected manufacturing subsectors
Sector (ISIC two-digit code) Weighted by sales Weighted by labor
Wood (20) 0.59 0.61
Leather (19) 0.72 0.72
Furniture (36) 0.81 0.82
Non-metallic (26) 0.87 0.88
Fabricated metals (28) 0.87 0.88
Apparel (18) 0.93 0.95
Food and beverages (15) 1.02 1.01
Paper and publishing (21) 1.06 1.05
Machinery (29) 1.07 1.07
Textiles (17) 1.10 1.07
Electrical machinery, communication, office, motor, and
transport equipment (30–35) 1.14 1.15
Rubber (25) 1.16 1.16
Basic metals (27) 1.18 1.20
Chemicals (24) 1.23 1.24
Note: All markups were computed using the method explained in De Loecker and Warzynski (2012). Individual
markups are weighted by firms’ sales and the number of employees to obtain the economy’s averages. Markups
are normalized to 1.0 in the first wave of the World Bank Enterprise Surveys (2013).
4.4 Lack of Openness as a Constraint to Firm Growth
131. A final aspect of productivity dynamics is whether a lack of openness is constraining firm growth.
Certainly, Egypt has signed free trade agreements with the European Union, Turkey, and Arab countries.
But on the one hand, Egypt’s relatively closed economy restricts opportunities for private sector
development and impede economic growth. On the other hand, its natural endowments and the comparative
advantages of a large domestic market, strategic location, and diversified sectors point to significant export
potential. But exports have not increased, even in response to the large currency depreciation in 2016. And
the experience of other economies has shown that high trade barriers often constrain an economy from
responding to the market opportunities international markets hold.
33 In some cases, higher fixed (or sunk) costs can be the endogenous outcome of improved products or of improved production
technology that lowers marginal cost (Sutton 1991). In this case, observed higher markups may or may not be associated with
higher prices and reduced consumer welfare.

56
132. Another indication that the trade regime may be restricting growth is the relatively low level of
Egyptian firms’ integration into global value chains (GVCs) compared to other large developing economies.
This matters greatly given that the growth of GVCs has been a key feature of the last two decades of
globalization. Countries that have successfully integrated into GVCs have seen high rates of growth of
exports and positive impacts on poverty. A recent major review concludes that GVCs can continue to boost
growth, create better jobs, and reduce poverty provided that developing countries implement deeper reforms
to promote GVC participation.34
133. At the sector level, Egypt is much less globally integrated into key GVCs than Indonesia, Malaysia
and Turkey. The goods sectors in Egypt that shows the highest degree of total GVC participation are: (i)
metal products, (ii) petroleum, chemical and non-metallic mineral products, (iii) mining and quarrying (iv)
electrical and machinery and (v) textiles and wearing apparel. Nevertheless, the degree of GVC
participation for these sectors is lower than in the comparator countries, especially Turkey and Malaysia.
For all four countries, metal products are the most integrated sector but backward and forward linkages
account for just over 50 percent of gross exports in Egypt compared to over 70 percent in Turkey and
Malaysia. For both electrical machinery and textiles and apparel—two key sectors in which GVCs have
driven export growth in a number of fast-growing developing countries—the GVC index for Egypt is just
over 30 percent, whereas for Malaysia it is more than 50 percent of gross exports. Again, Egypt exhibits
very limited backward linkages. For electrical machinery, 20 percent of Egypt’s gross exports are from
backward linkages compared to 37 percent for Turkey and 43 percent for Malaysia.
134. As measured by the GVC integration index, Egypt’s total participation in GVCs stands at 37
percent of gross exports, compared to 57 percent in Malaysia, 48 percent in Turkey, and 39 percent in
Indonesia. Egypt’s total GVC participation is decomposed into 26 percent of forward participation (the use
of domestic intermediates in third country exports) and 11 percent of backward participation (the use of
foreign inputs embodied in gross exports). It is with regard to backward linkages that Egypt’s performance
compared to other countries is particularly low. Egypt’s participation in GVCs has slightly declined during
the last decade from 40 percent in 2006 to 37 percent in 2015.
135. Egyptian tariff protection for other parties, outside of preferential trade agreements, remains very
high and has become more restrictive and unpredictable in the past five years. High levels of protection
reduce overall welfare and can have disproportionately large effects on inequality, given that protection
goes to producers (generally wealthier) and tariffs are paid by consumers.35 With an average most favored
nation (MFN) tariff of 19 percent—the tariff that is applied to imports from countries that do not have a
trade agreement with Egypt—Egypt has the second-highest average MFN tariff in the world (after Sudan).
Protection is highest for processed food and beverages and consumer goods.36
136. High MFN tariffs may also be distorting the incentive to export, either because profits per unit are
much higher in selling to the domestic market, because protection limits the incentive to make productivity-
enhancing investments that could lead to firms becoming internationally competitive or because they
undermine the ability to compete by raising the cost of essential intermediate inputs relative to exporters in
other countries. Further analytical work would be useful to identify the extent to which the removal of
tariffs on imports from the European Union has led to more competition, lower prices, and access to a wider
variety of goods—or has been reflected in higher profits for EU firms. It is also worth assessing whether
34 World Bank 2020e. World Development Report 2020: Trading for Development in the Age of Global Value Chain provides a
comprehensive review of the growth and impact of GVCs. 35 Furceri and others 2018 report evidence of the adverse effects of tariffs on both growth and inclusion.
36 For example, tariffs of 60 percent are levied on products including prepared fruit and vegetables, perfumes, soaps, suitcases,
carpets and floor coverings, footwear, glass and glassware, stoves and cookers, a range of electrical appliances, furniture, and pens.

57
the policy framework is channeling resources into the production of low-quality products for the domestic
market if high tariff protection has limited competition in low value-added segments.
137. This, together with extensive non-tariff barriers, poor trade facilitation and weak logistics may have
contributed to Egypt having fewer exporting firms than comparator countries, exports are less
technologically advanced, and they are sold in fewer markets on average. It lags comparator countries in
participation in global value chains and has yet to reach the stage of a medium-technology manufacturing
exporter. Export activity is also concentrated in a small number of regions, and the poorest ones appear to
have no linkages to overseas markets through exports.
138. Improving export performance and having increased participation in GVCs may also be affected
by nontariff barriers, with more than 33 ministries or government agencies regulating trade. The result is a
very complex and opaque process for importing and exporting. Notification of measures to the World Trade
Organization (WTO) reveals that Egypt has been introducing new measures at a faster rate than competitor
countries. Studies of the implementation of nontariff barriers in Egypt in the 2000s suggests that these
measures primarily benefited politically connected firms and that the presence of politically connected firms
in a sector strongly predicted the subsequent introduction of nontariff measures. Diwan, Keefer and
Schiffbauer (2015), as well as Eibl and Malik (2016), suggest that the entry of politically connected firms
into a sector tends to lead to lower productivity and slower employment growth.

58
5 The Role of the State
Key findings on constraints to improving public sector spending efficiency, macroeconomic resilience,
boosting private sector investment, firm growth, and productivity (Pathways 1 and 2):
• Egypt boosted growth with deficit spending. However, returns to public investment have recently
dropped.
• High interest payments, due to high public debt, reduce fiscal space for needed social spending and
revenue mobilization remains relatively low.
• The widespread presence of SOEs across the economy reduces competition and distorts the market.
The recent amendments to the SOE law enhance governance, disclosure, transparency and
accountability of some SOEs. Nonetheless, the sustained growth of state-owned enterprises, and
the complex framework in which they operate, feeds private sector uncertainty and some SOEs
remain outside the law making it difficult to monitor them and hold them accountable.
• The government is pursuing an anti-corruption strategy, including offering about 500 governmental
services electronically to cut down red tape. Government efforts are ongoing but more are needed
to reduce uncertainty and conflicts of interest.
5.1 High Public Debt as a Constraint to Continued Public Investment–Led
Growth
139. The Egyptian government has boosted growth with investment spending that is increasingly
inefficient (see Chapter 2). When the economy has at times slowed, the government has increased spending
and investment, providing countercyclical spending to stem the slowdown. However, public sector
spending has historically outweighed revenues, and so chronically high budget deficits are financed through
government debt. Driven by longstanding fiscal imbalances and bouts of exchange rate depreciation,
government debt37 averaged 96.8 percent of GDP in 2002–17. Following years of steady increases, the
government debt ratio fell sharply from 108.0 percent of GDP in 2017 to 90.2 percent in 2019, helped by
the ongoing fiscal consolidation process and strong economic growth. The government debt to GDP ratio
went on to decrease further to 87.5 percent in by the end of fiscal year 2020, despite the adverse impact of
the pandemic, although the decline was explained by the one-off cancellation of debt owed by the
government towards the Social Insurance Funds, in return for larger annual transfers and improved
investment opportunities, notably on Social Insurance Funds’ holdings of government securities.
140. The returns (ICOR) to public investment are recently dropping (see Chapter 2), indicating that the
efficiency of some investments fell. At the same time, since government covers a large proportion of that
investments through borrowing and must be repaid with interest, requiring returns that would cover the cost
of paying back funds. Thus, the government’s efforts to prop up growth with investment spending may be
reaching their limits.
5.1.1 Public sector spending efficiency
141. What is the extent of this inefficiency? A recent study looks at the efficiency of public spending in
education, health, and infrastructure by measuring input inefficiency (the excess input consumption needed
to achieve a level of output) and output inefficiency (the output shortfall for a given level of inputs) across
countries (Herrera and Ouedraogo 2018). It finds that developing countries have output efficiency scores
37 In this report references to government debt mean gross budget sector debt and do not include debt held by state owned
enterprises that is often backed by a sovereign guarantee.
59
of 0.6, 0.8, and 0.9 in infrastructure, education, and health, respectively (a score of 1 implies that the country
is on the frontier, or maximum efficiency). On the quality of overall infrastructure to public investment per
capita, it finds input and output efficiency scores of 0.38 and 0.72, respectively (well below the frontier).
These scores indicate that many peer countries achieve significantly higher levels of outputs with the same
level of input (spending), although Egypt performs better than the average for MENA countries.
142. Given that public investment has been the main source of total investment in recent years (see
Figure 2.12), the low efficiency or returns suggests that public resources are not going to areas with high
development impact. For example, several geographic areas, particularly rural Upper Egypt, continue to
face some challenges regarding sanitation infrastructure.38.
143. Much of this inefficiency may be attributed to the fact that public investment is managed through
a complex and fragmented system (World Bank 2018b). This means that there is room to improve budget
comprehensiveness, prioritization, and management of public investments—both by government and the
broader public sector—to support value for money and better service delivery.
144. For education, transformational reforms are underway and there has been recent positive progress
in learning outcomes as evidenced by 2019 TIMSS score. Multiplying this success is key especially in light
of COVID-19 pandemic. Egypt spent less than other countries in the region, both as a share of total
government expenditure and as a share of GDP. Education spending as a share of GDP has declined in real
terms, from 3.6 percent of GDP in 2016 to 2.5 percent in 2020. Morocco and Tunisia allocate more than 5
percent of their GDP to education and most OECD countries spend between 4 and 7 percent of their GDP
on education. Overall, public spending on education is in large part based on historical budgets, and learning
metrics or needs are seemingly weakly factored into budget formulation. In addition, Egypt’s primary-level
pupil-to-teacher ratio was 23.1 in 2016, higher than the MENA average of 20.5 but slightly lower than the
middle-income average of almost 24.
145. For health, important governmental effort towards universal health coverage and tackling the
pandemic are underway. There is a constitutional mandate to increase public spending on health to 3 percent
of GDP, however, spending on health declined from 1.6 percent of GDP in 2017 to 1.4 percent in the two
following years, before reaching 1.5 percent of GDP in 2020. Within MENA, Egypt is on the lower end of
the spectrum in terms of spending on health as a percent of GDP. Healthcare services are financed mainly
with private funds from households, businesses, and nonprofit organizations—and about 90 percent of
private expenditures are out-of-pocket costs, paid directly to healthcare providers by households. Thus,
there is a pressing need to improve targeting of public health services for the poor, which will require better
expenditure prioritization, broader public financial management, and better service delivery. To accelerate
progress toward universal health coverage and improve health outcomes, the government passed the
Universal Health Insurance Law in 2018 which envisions mandatory coverage for all citizens in the country.
The new universal health insurance scheme aims to provide Egyptians with financial protection, improve
public health facility capacity, and enhance the quality of care.
5.1.2 Implications of government debt for macroeconomic resilience
146. Most government debt remains domestic, although external debt increased in recent years. The
share of domestic debt in total public debt averaged 85.0 percent in 2002–18; external government debt
remained contained, at an average of 15.4 percent of total public debt—equivalent to 15.2 percent of GDP—
over the same period. However, its share rose to 18.0 percent of GDP at the beginning of 2017 before
reaching 19.0 percent of GDP at the end of 2018.
38 The government has recently announced the Decent Life (Hayah Karima) initiative for Sustainable Rural Communities and
aimed at improving access to basic services and infrastructure in target villages. (Source:
https://sustainabledevelopment.un.org/partnership/?p=36683)

60
147. This external government debt increase was due to valuation effects stemming from the large
currency depreciation in 2017. In addition, the government increased external borrowing from international
financing institutions and international bond issuances, with the latter benefitting from better
macroeconomic conditions and enhanced confidence in the economy. A recent push by the government to
build up foreign reserves increased the portion of debt held in foreign currencies from 12.5 percent of all
public debt (domestic and external) at the end of 2015 to 29.2 percent at the end of 2017. The external
portion of the debt surpassed 200 percent of exports of goods and services. At more than US$120 billion,
it required servicing of about US$13 billion in 2020 and may soon need to be refinanced. The pressure of
the external debt will increase if interest rates rise or the Egyptian pound devalues further.
148. Another source of fiscal risk stems from contingent liabilities (sovereign guarantees were last
estimated at 18.4 percent of GDP in end-June 2020)39 as they may push up government financing needs if
they materialize and become direct liabilities. Further, financial interlinkages between the Treasury and
other extra-budgetary public entities entail debt-issuance that exceeds the budget financing needs (Alnashar,
Elashmawy, and Youssef, 2020). Therefore, enhancing debt transparency is warranted in order to render
the government debt path more predictable and to ensure its sustainability.
149. Egypt’s dependence on external revenues is high and risky because the pandemic has reduced many
of the sources of foreign exchange required to pay the debt. In 2019, the country needed to raise nearly
US$100 billion to cover its foreign exchange needs and service its external debt. Despite decades of pro-
market reforms and a 2016 devaluation of 50 percent, it managed to export only US$30 billion of goods
(including about US$10 billion of gas, as Egypt became a net exporter of oil and gas in late 2018). The gap
was covered by remittances (nearly US$30 billion), tourism (about US$15 billion), foreign direct
investment (FDI) and portfolio investment (US$12 billion), revenues from the Suez Canal (US$6 billion),
and official international assistance of about US$10 billion (from the IMF). The largest of these sources,
tourism, is being badly hit by the global pandemic. Surprisingly, remittances may actually be rising.
150. State-led investment and spending financed by borrowing may be difficult to maintain. Although
financial prospects improved after the successful 2016 stabilization, the fundamental problem of public
sector–led spending—fueled by borrowed money—to support growth remains. Post-COVID, the economy
may once again be at serious risk of unravelling in the medium term if the government cannot find another
engine for growth. While the government enables the private sector to take the lead in propelling growth,
it can also constrain private sector growth in many ways.
5.2 The Long Shadow of the Public Sector
151. The government recognizes that the private sector must be the engine for growth, and it is making
efforts to create a business environment that is more hospitable to business. However, constraints to private
sector growth stem from the capital restrictions that heavy public sector borrowing has on private
establishments, along with the anticompetitive effects from the dominant presence of government entities
and corporations in the domestic market. Both phenomena suppress private sector investment, entry into
new markets, innovation, and productivity growth.
152. Sizable public borrowing constrains private sector growth because public demand for credit soaks
up scarce capital. Before 2011, credit to the private sector represented about 20 percent of GDP, one of the
lowest ratios in MENA. By 2015, the figure had fallen to 14 percent of GDP, and in subsequent years, it
fell as low as 7.5 percent of GDP, before starting to recover (Figure 5.1). Claims on the government
continued to make up the largest portion of total domestic credit and remained the main contributor to
liquidity growth (Figure 5.2). Although credit extended to the private business sector started to pick up, its
share in total domestic credit, as well as its ratio to GDP, has not yet returned to historical levels.
39 Ministry of Finance, Medium Term Debt Management Strategy for Fiscal Years 2020-21 through 2023-24.
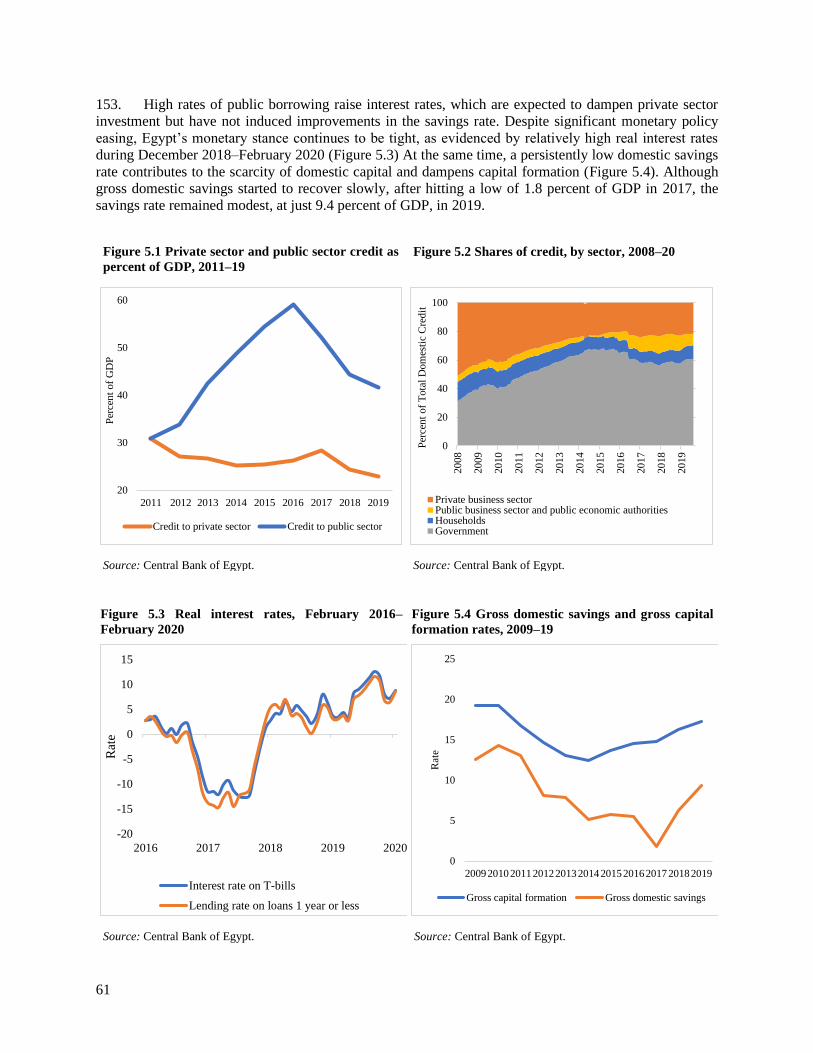
61
153. High rates of public borrowing raise interest rates, which are expected to dampen private sector
investment but have not induced improvements in the savings rate. Despite significant monetary policy
easing, Egypt’s monetary stance continues to be tight, as evidenced by relatively high real interest rates
during December 2018–February 2020 (Figure 5.3) At the same time, a persistently low domestic savings
rate contributes to the scarcity of domestic capital and dampens capital formation (Figure 5.4). Although
gross domestic savings started to recover slowly, after hitting a low of 1.8 percent of GDP in 2017, the
savings rate remained modest, at just 9.4 percent of GDP, in 2019.
Figure 5.1 Private sector and public sector credit as
percent of GDP, 2011–19
Figure 5.2 Shares of credit, by sector, 2008–20
Source: Central Bank of Egypt. Source: Central Bank of Egypt.
20
30
40
50
60
2011 2012 2013 2014 2015 2016 2017 2018 2019
Per
cen
t of
GD
P
Credit to private sector Credit to public sector
0
20
40
60
80
100
20
08
20
09
20
10
20
11
20
12
20
13
20
14
20
15
20
16
20
17
20
18
20
19
Per
cen
t of
Tota
l D
om
esti
c C
red
it
Private business sectorPublic business sector and public economic authoritiesHouseholdsGovernment
Figure 5.3 Real interest rates, February 2016–
February 2020
Figure 5.4 Gross domestic savings and gross capital
formation rates, 2009–19
Source: Central Bank of Egypt. Source: Central Bank of Egypt.
-20
-15
-10
-5
0
5
10
15
2016 2017 2018 2019 2020
Rat
e
Interest rate on T-bills
Lending rate on loans 1 year or less
0
5
10
15
20
25
20092010201120122013201420152016201720182019
Rat
e
Gross capital formation Gross domestic savings

62
154. Moreover, private sector investment remains muted. In 2017, total investment is about 15 percent
of GDP (versus MENA average of 23 percent, itself one of the lowest in the world), according to World
Bank (World Development Indicators) data. The level of private investment in 2017 is approximately 6
percent of GDP. In comparison, the 1991 reform period was able to raise private investment from 10 percent
of GDP in the early 1970s to 19 percent in the early 1990s. Investment by the central government is also
down to about 2.5 percent of GDP. The rest—about 6.5 percent of GDP—is made by enterprises owned
and managed by the state. Part of the muted response of private investment to better macroeconomic
conditions can be attributed to investors’ perceptions of the prominent role of the state in economic activity.
Although Egypt has been transitioning from a centrally planned to a market economy for decades, the state
remains an important economic actor. In recent years, perceptions of its growing role in economic activities
have created confusion about the country’s vision for the role and space available for the private sector to
contribute to development challenges. The effect has been compounded by flaws in the competition policy
framework, private sector sentiment about the lack of a level-playing field, and ambiguity over whether
firms in Egypt face the same set of rules regardless of ownership.
155. Based on OECD and Egyptian records that are public information, only China may have more
SOEs than Egypt (Box 5.1). SOEs have a significant presence across sectors in Egypt. EAs operate in 12
industry groups, including 2 (media entertainment and diversified financials) in which no SOEs covered in
the official reports operate. State-owned non-civilian enterprises operate in 14 of the 24 sectors studied.
Although some address market failures (including natural monopolies), there is an unusually high presence
of SOEs in subsectors in which SOEs do not usually operate and in which the private sector might be better
placed to provide goods and services.
156. Public Sector Law No. 203/1991 requires that SOEs may not be deprived of any benefits or be
burdened with any charges that may put them at a competitive disadvantage with respect to joint stock
companies. The recent amendments to the same law enhance governance, disclosure, transparency and
accountability of some SOEs. Nonetheless, the sustained growth of state-owned enterprises, and the
complex framework in which they operate, feeds private sector uncertainty.
157. Besides incorporated SOEs, Egypt has 51 Economic Authorities (EAs), many of them are
technically SOEs. The Egyptian General Authority for Petroleum (EGPC), the Suez Canal Authority
(SCA), and the New Urban Communities Authority, for example, play significant roles in the economy. In
addition, some SOEs operate under, or are affiliated to, non-civilian authorities with their governing
authorities being subject to special laws. These include the National Service Projects Organization (NSPO),
the Arab Organization for Industrialization (AOI) and the National Authority of Military Production. NSPO
owns 32 companies active in 14 industry groups.40
Box 5.1 Reducing the role of state-owned enterprises in China
China’s has an enormous SOE sector and a history of extraordinary economic growth and poverty
reduction. For more than three decades, GDP growth averaged 10 percent a year, lifting half a billion
people out of poverty. However, success was probably related to reducing the size of the SOE sector,
rather than the sector’s large size.
Indeed, significant enterprise sector reforms underpinned China’s growth performance. Bold reforms
under the Ninth Five Year Plan (1995–2000) led to a greatly expanded role for the private and other
nonstate sector. The state sector’s share of the total number of industrial enterprises with annual sales of
40 A more detailed description of SOEs and the legal and institutional framework under which they operate is included in the
World Bank’s recently published Country Private Sector Diagnostic (World Bank 2020c, see Chapter 2 and Appendix D).

63
more than US$750,000 (in 2020 US dollars) fell from 39.2 percent in 1998 to just 4.5 percent in 2010.
During this period, the SOE share of total industrial assets fell from 68.8 percent to 42.4 percent, and the
SOE share of employment plummeted from 60.5 percent to 19.4 percent. The SOE share of China’s
exports fell from 57 percent in 1997 to 15 percent in 2010. As a result, the nonstate sector has become
not only the main generator of output (an estimated 70 percent of GDP) and employment and the
strongest engine of growth—but also the most active sector for innovation.
The reforms under the Ninth Five-Year Plan’s guiding principle of “grasping the big, letting go of the
small” left China with a distinctive industrial structure. Most small- and medium-size firms were
privatized. Facing much domestic and external competition in an increasingly integrated domestic
market, they became very dynamic and productive and now dominate many sectors.*
In parallel, the “commanding heights” of the economy (the 120 or so large central enterprises in sectors
such as electricity, petroleum, aviation, and telecommunications) remained largely state owned. But
progress was made among them, too. Many SOEs were corporatized, radically restructured (including
through the shedding of labor) and expected to operate at a profit. In some sectors, intra-SOE competition
was promoted and the scope for private participation expanded. The 2003 establishment of the State-
Owned Assets Supervision and Administration Commission to exercise authority over large centrally run
firms laid a foundation for future improvements in governance and investment planning. As a result, the
profitability of China’s SOEs increased, with their reported average return on equity jumping from 2.2
percent in 1996 to 15.7 percent in 2007, before sliding back to 10.9 percent in 2009.
Relative to the private sector, SOEs still consume a large share of capital, raw materials, and intermediate
inputs to produce relatively small shares of gross output and value added. China 2030: Building a
Modern, Harmonious, and Creative Society (a joint research report of the World Bank and the
Development Research Center of China’s State Council), therefore, gives priority to: (a) additional
reforms of state enterprises—including measures to recalibrate the role of public resources; introduce
modern corporate governance practices (such as separating ownership from management); and
implement gradual ownership diversification where necessary; (b) development of the private sector and
removal of barriers to entry and exit; and (c) increased competition in all sectors, including strategic and
pillar industries.
China’s success rate in creating jobs and reducing poverty is likely tied to an open, stable exporting
economy—with high savings rates and low fiscal deficits, high levels of investments in social and
physical infrastructure and less so to the presence of SOEs. If Egypt were to emulate China’s model, it
would need to increase its domestic savings rate and avoid large fiscal deficits, dramatically shift to a
more open trade and investment policy, aggressively integrate the domestic economy, adopt more
technology-oriented education, and increase reliance on private sector jobs.
_______________
*“Bamboo Capitalism.” The Economist, March 11, 2011.
158. The widespread presence of SOEs across the economy reduces competition and distorts market
outcomes. In some sectors, the lack of clear separation between the state’s role as a market regulator and a
major player/SOE owner creates conflicts of interest. Independent regulators are required to act as a neutral
arbiter, particularly when the state controls one or more operators. However, many regulators remain under
direct supervision of line ministries, which results in less scrutiny of their operations, and they sometimes
give SOEs access to information before other market participants. For instance, the Ministry of
Communications and Information Technology oversees both the National Telecom Regulatory Authority
(NTRA) and Telecom Egypt—an SOE that is 80 percent owned by the government and holds a dominant
position in the sector—creating a conflict of interests. The Ministry of Energy regulates the energy sector,
another clear conflict of interest, as the regulator is not independent. The regulatory regime for the energy

64
sector is considered strong, but it is not strictly enforced. In the financial sector, the Central Bank of Egypt
regulates and supervises the banking sector. But it is also the owner representative of banks wholly owned
by the state, given that it owns the majority of the shares of one private sector bank as well as significant
minority stakes in two others. As stated in the recently published Country Private Sector Diagnostic for
Egypt (World Bank 2020c), the two largest banks in Egypt, which together held 48 percent of customer
deposits as of end-June 2019, are state owned.
159. SOEs and nonincorporated EAs that perform both commercial and noncommercial/public service
activities—and do not separate the costs and revenues for the two—distort markets, which is the case in
Egypt. In addition, SOEs are not required to earn a positive rate of return through their commercial
activities. Revenues generated by SOEs from commercial activities means that they compete directly with
private operators that typically cover their costs and generate a rate of return without recourse to government
coffers. The Egyptian Public Enterprise Law calls for equal treatment of SOEs and private enterprises, but
SOEs benefit from implicit and explicit support from the Treasury. This includes direct monetary support
via subsidies as well as indirect subsidies through mandatory state purchasing of goods and services (as in
the requirement that governmental officials fly only on EgyptAir, the national carrier). Explicit support can
also occur through the credit channel when the Ministry of Finance on-lends to an SOE or issues explicit
loan guarantees. EAs have had increasing access to bank credit since early 2016. In contrast, the private
sector share has been stable, at about 22 percent of total credit. Preferential access to inputs also sometimes
takes the form of free or low-price land or real estate, along with the provision of cheap labor (Abul-Magd,
Akça, and Marshall 2020).
160. Tax exemptions provided under certain laws provide financial privileges and feed the perception
that the playing field is not level. For instance, SOEs are generally taxed under the same reference system
as private operators, but public agencies are often granted tax exemptions (such as the exemption of the
National Service Projects Organization from income tax, exemptions of state-owned non-civilian facilities
from real estate tax, and the exemption of railways and petroleum authorities from import duties on
equipment and machinery). The latest proposed amendments to the Egypt Fund law—approved by the
cabinet in December 2019—allow its subsidiary funds and companies with Fund ownership of more than
50 percent to claim a value-added tax refund proportionate to the Fund’s investment share. The amendments
also waive notarizing fees on assets transferred from the state to the Fund (or its fully owned subsidiaries).
161. Having to compete against large and protected SOEs is likely one of the constraints preventing
large firms from growing. Incorporated SOEs vary significantly in size and financial performance. Among
SOEs on which financial information is publicly available, the total assets of the top 20 (mainly banks,
electricity companies, oil and gas companies, Egypt Air, water and sanitation providers, insurance
companies, and Telecom Egypt) were LE 170 billion (3.3 percent of GDP) in 2018; the total assets of the
smallest 20 SOEs (mainly in the textile, logistics, automotive, and trading sectors) were less than LE 1
billion. Companies with large revenues operate in a few industries, including banking, oil and gas, utilities,
food retail, transportation, telecommunications, and capital goods (construction). Investors are concerned
about the unknown boundaries of these enterprises and likely hold back investments for fear of running
afoul of them, because of protection from the state, lack of transparency on the budgetary support received,
and lack of transparency in the deals they make (Sayigh 2019).
5.3 The Political Economy; the Most Binding Constraint to Reforms
162. The state-led growth based on public sector–led capital accumulation and state-controlled
enterprises is likely to increasingly encroach on and crowd out the private sector. Because many of these
enterprises are likely to be inefficient, they cannot survive international competition. Firms and businesses
benefiting from them are unlikely to welcome the opening of the large Egyptian market. This inward
orientation exacerbates the lack of innovation and means that Egypt fails to upgrade its operations through
access to foreign technologies, resulting in even less-efficient enterprises. It also gives these enterprises
market power and the incentives to segment markets in order to avoid domestic competition. These

65
enterprises do not need to invest. Because they cast a large shadow over the private sector, private sector
firms do not invest either.
163. Throughout this SCD, the economic role of the state is mentioned, but the government plays a
variety of roles in the economy. A useful starting point is Stiglitz’s (1989) simple division of government
economic activity into production, consumption, and stabilization. Here, the SCD is focused on different
types of government intervention in production.
164. Governments can intervene indirectly in private production through regulation and subsidy and
directly by producing some goods themselves (Stiglitz 1989). The three broad government roles in the
production side of the economy are: (a) the state as regulator of economic activity; (b) the state as market
actor, through state-owned civilian and non-civilian enterprises; and (c) the emerging role of the state as
investor, through financialization or direct investment and financial interest in private enterprises.41
5.3.1 The state as regulator of the market
165. When designed correctly and implemented well, the state’s regulatory role can benefit the economy
by improving allocative efficiency, leveling the field of competition, incentivizing job creation, and
improving wealth and income distribution—while at the same time protecting workers, consumers, and
businesses. In theory, the major economic justifications for the state regulating the private sector include:
• Addressing market failures (situations in which market prices do not reflect the true costs and
benefits of providing a good or service).
• Reducing entry barriers, leveling the playing field, encouraging greater competition and innovation,
and combating short-sightedness in order to increase economic growth.
• Ensuring consumer, worker, and investor safety; transparency in information about products and
services; and a fair distribution of net benefits in the economy counter.
• Preventing potential market power abuses in prices and quality.
166. Regulations affect allocative efficiency across economic sectors by defining how resources (labor,
capital, natural) are used to produce different goods and services and whether those inputs are distributed
to their highest-value uses. They affect vibrancy and competitiveness within industries by determining how
easy it is for new businesses to form and for the most successful businesses to grow and thrive; it also
determines how easy it is for unsuccessful firms to close down. They affect the short-term, cyclical
movements of the economy (such as employment during a recession) and the longer-term growth of the
economy (such as via investment and innovation). And they affect the distribution of benefits by
determining which businesses, workers, and consumers end up bearing the burden of the economic cost of
regulations and whom it helps (through rents and privileges).
167. But when regulations are complex and go beyond addressing market failures, they can become
burdensome and costly and provide opportunities for corruption. The emergence of an invasive regulatory
regime is often identified as a major cause of corruption (Tanzi 1998). Particular kinds of regulatory burdens
are associated with corruption (Djankov and others 2002).
168. Complex regulations make it more difficult for the government to control corruption and improve
regulatory quality. Corruption and regulatory quality indicators generated by the World Bank’s Worldwide
Governance Indicators (WGI) indicate this phenomenon.42 The control of corruption indicator reflects
41 At the time Stiglitz wrote, the emerging role of the state as investor—as has happened in China and is emerging in other
economies, such as Malaysia and Turkey—was not yet apparent.
42 For more information on the WGI data, see Figure 5.6.

66
perceptions of the extent to which public power is exercised for private gain, including both petty and grand
forms of corruption and “capture” of the state by elites and private interests. The regulatory quality indicator
reflects perceptions of the ability of the government to formulate and implement sound policies and
regulations that permit and promote private sector development. The WGI project reports governance
indicators for more than 200 countries and territories over the period 1996–2019 for six dimensions of
governance, including control of corruption and regulatory quality. For this SCD, data from 2004–19 were
used. In these worldwide rankings, Egypt is in the 20th–25th percentile in controlling corruption and below
the 20th percentile in regulatory quality (Figure 5.5).
169. Restrictive government regulation and the widespread presence of SOEs across the economy
reduce competition and distort market outcomes. Newly available Product Market Regulation (PMR) data
on a range of OECD and emerging non–OECD countries reveals that Egypt scores worse than comparator
countries with similar income levels (Figure 5.6). 43 Egypt is above the average in terms of restrictiveness
(2.84 on a scale of 0–6, where higher scores are associated with regulations that are more restrictive).
43 The product market regulation methodology explores three aspects that affect competition in markets: the extent of State control,
the presence of barriers to market entry and rivalry, and the presence of barriers to trade and investment. The combination of these
aspects shapes the competitive environment that enables firms to enter new markets, invest, and expand.

67
Figure 5.5 Egypt’s Worldwide Governance Indicators rankings for controlling corruption and regulating the
economy, 2004-2019
170. In its role as regulator, the government uses price controls in telecommunications, electricity, and
air transport, which may distort incentives for private sector companies to enter some market segments.
The PMR data indicate that the prices of certain goods may impose unnecessary restrictions on competitive
conditions, and widespread price controls may contribute to distorted market outcomes. Although Egypt
has embarked on efforts to liberalize prices since the 1970s, both general and sectoral provisions still allow
the government to set prices. Price-fixing mechanisms and subsidies are often implemented simultaneously,
as was the case for bread and gasoline. This approach not only suppresses market signals and introduces
distortions to competition (limiting business strategies) but also places strains on public finances.

68
Figure 5.6 Economywide product market regulation score for Egypt and other economies
Source: OECD–World Bank Group Product Market Regulation (PMR) indicators for Egypt; OECD PMR database for OECD
countries; OECD–World Bank Group PMR database for non-OECD countries.
Note: Scores range from 0 to 6. Higher values are associated with regulations that are more restrictive to competition.
5.3.2 The state as a participant in the market
171. Egypt is the only country surveyed for the PMR in which the government controls at least one firm
in 26 of the 27 screened sectors (the average of the other countries is 14 sectors). Governments sometimes
own and operate companies when they may want to correct the market failure of natural monopoly (sectors
with increasing economies of scale). But rather than do so, they can instead simply regulate the market, so
that the price is kept at the welfare-maximizing level by providing the producer with a subsidy to
compensate the losses it would otherwise make (if economies of scale are large).
172. Governments can also increase social welfare by intervening in markets for goods with large
externalities. Government ownership and operation of sectors with large externalities (education, health,
mail delivery) is one way to address the problem. Many other options are less intrusive. Government
intervention is also justified in the case of public goods, such as defense. In this case, the arguments in favor
of a light government approach are less clear, and direct government intervention is more justified.
173. State ownership should be limited for a variety of reasons. Across the world, it is highly correlated
with lower firm financial performance (Aharoni 2018; Ramamurti 1986; Stan, Peng, and Bruton 2014;
Estrin and others 2016; Lazzarini and Musacchio 2018). It reduces firm performance because state owners
pursue a multitude of objectives, some of which conflict with those of other stakeholders in the firm
(Lazzarini and Musacchio 2018). Alongside business objectives, state owners also pursue social objectives
(those directed at improving societal welfare) and political objectives (those intended to enhance the
interests of politicians, bureaucrats, and special interest groups). State owners are also known for
0.0
0.5
1.0
1.5
2.0
2.5
3.0
3.5B
oli
via
Arg
enti
na
India
Hondura
s
Chin
a
Indones
ia
Egypt
Ecu
ador
Sen
egal
Ken
ya
Bra
zil
Uru
guay
Turk
ey
Jam
aica
Cost
a R
ica
Dom
inic
an R
epubli
c
Par
aguay
Rw
anda
Russ
ia
South
Afr
ica
Guat
emal
a
Isra
el
Phil
ippin
es
Cro
atia
El
Sal
vad
or
Pan
ama
Nic
arag
ua
Mex
ico
Ko
rea
Rep
.
Colo
mbia
Gre
ece
Slo
ven
ia
Rom
ania
Per
u
Cypru
s
Pola
nd
Lat
via
Unit
ed S
tate
s
Bulg
aria
Mal
ta
Ukra
ine
Sw
eden
Lit
huan
ia
Chil
e
Sw
itze
rlan
d
Icel
and
Fra
nce
No
rway
Luxem
bourg
Irel
and
Spai
n
Can
ada
Jap
an
Cze
ch R
epubli
c
Bel
giu
m
Hungar
y
Port
ugal
Fin
land
Est
onia
Ital
y
Slo
vak
Rep
ubli
c
Ger
man
y
Aust
rali
a
New
Zea
land
Den
mar
k
Aust
ria
Unit
ed K
ingdom
Net
her
lands
Pro
duct
Mar
ket
Reg
ula
tio
n s
core
Non-OECD PMR score average = 2.34
OECD PMR score average = 1.47
2.84

69
monitoring companies ineffectively (Dharwadkar, George, and Brandes 2000) and implementing risk-
averse strategies that ultimately reduce firm performance (Tihanyi and others 2019).44
174. Corruption can affect SOE performance and the productivity of firms overall. It is more likely for
corruption to be more prevalent in SOEs than in private firms, for several reasons. First, it is easier for
politics to impinge on the operations of publicly owned firms, especially when transparency and
accountability are weak (Baum and others 2019). Second, the level of productivity of firms is positively
correlated with the degree of control over corruption. Although private firms tend to be more productive
than SOEs, it is not the case when control of corruption is low. Corruption may also explain differences in
productivity, given that labor costs are usually higher for SOEs, except when corruption is low (Baum and
others 2019). In the case of SOEs, key weaknesses include lack of independent and professional boards and
management, weak procurement processes, and lack of transparency.
5.3.3 The state as an emerging investor in the market
175. The Egyptian State formally commenced its role as an investor in 2018 with the establishment of
the Sovereign Fund of Egypt (Tharaa) (hereafter called the Egypt Fund). This fund has been designed as a
vehicle to attract private investment into public entities and projects, while leaving the state in control.
While the government acts as a holding company of the fund, it is supposed to place selected state assets
under partial private control. The inauguration of the sovereign wealth fund signals Egypt’s intention to
begin privatizing state-owned civilian and non-civilian enterprises and, if successful, will initiate a long
process of creating a more active and vibrant private sector while withdrawing government control over
large parts of the economy.
176. In effect, the government is now becoming an investor of capital and equity in firms of all kinds,
including as a minority investor in nominally privately owned firms. The extension of capital in this form
establishes a new role for the state in corporate governance, generates novel principal–agent problems
between the owners and managers of capital, and provides an alternative means for the government to push
its political agenda through its stakes in firms. Having the state act as an investor could further hinder the
growth of a decentralized, innovative, modern economy.
177. The role of the state as investor is different from the financialization of the state’s role in managing
SOEs, state assets, and private firms in which the state has interests. Financialization is a process in which
the state increasingly relies on a set of financial means (financial markets, financial indicators, and financial
instruments). However, when the state is an investor, its goals extend beyond maximizing shareholder
returns and relationships that expand outside the realm of traditional SOEs.
178. The government has managed to address concerns about transparency and management of the
Egypt Fund by becoming a signatory of an Associate member of the International Forum of Sovereign
Wealth Funds and signing on to the Santiago Principles. As an associate member, the Egypt Fund agrees
to work to apply the Generally Accepted Principles and Practices for governance, investment, and risk
management of sovereign wealth funds (known as the Santiago Principles) as it puts its investment and risk
management processes in place.
179. The Egypt Fund may generate uncertainty to the investment climate. For example, the fund will
pursue both financial and development objectives, but the exact scope of its “sustainable economic
development” objective remains unclear. Defining boundaries for the scope would ease concerns from
private investors in sectors where existing or potential competitors could receive investments from the fund.
The worry is that such uncertainty will likely freeze investments.
44 None of the cross-country studies cited above included Egypt, probably because financial data on its SOEs are hard to come
by.

70
180. Most importantly, issues may arise from conflicts of interest between the state’s role as investor
and its role as market participant. The extent and scope of the assets owned by the state are complicated
and will make it difficult if the state, as investor, decides to fund projects in which the state, as market
participant, is involved. It would then become unclear whether the regulator would be acting to enhance the
fund’s return on investment or influence the regulator to look favorably upon the fund’s investments. Here,
too, the uncertainty might be enough to freeze investments from other parties.
181. The private sector’s concerns about competing against firms that receive relatively high levels of
government investment are not unwarranted. Some state-owned enterprises are known to suffer from excess
capacity that has led to revenue shortfalls—that are then covered by public banks that provide financing or
oblige domestic and foreign business partners to accept unattractive terms. Wealth fund investments in
select SOEs would be difficult to monitor because these enterprises are generally not subject to independent
auditing or public accountability. This is still the case in spite of the recent changes to the SOE law which
improves public disclosure. Some state-owned civilian and non-civilian enterprises, however, remain
outside this regime, making it difficult for investors to monitor them and hold them accountable.

71
6 Resilience, Efficiency, and Sustainability
Key findings on constraints to resilient, efficient, and sustainable natural resource use (Pathway 4):
• Egypt appears to be food secure and resilient to natural hazards relative to its peers, but in a water
scarce country, this resilience could be weakened without a more efficient and sustainable use of
natural resources such as water.
• A growing population and rapid spatial expansion further strain sustainability and inclusion, as
demands for meeting housing needs and delivering basic infrastructure services go unmet.
• Ambient air pollution is one of the most significant environmental health issues in the Greater Cairo
area.
• Households’ resilience to shocks may have been eroded by periods of high inflation, and the
COVID-19 crisis has created additional challenges such as loss of incomes. Social protection and
expanding digital technologies are important policies to support households’ resilience.
• Egypt faces challenges on data transparency as well as on key indicators of social sustainability,
including on voice and accountability, and citizens’ engagement.
6.1 Resilience, Efficiency, and Sustainability of the Growth Model
182. Resilience refers to the ability of an economy or household to withstand shocks. Ensuring resilience
to multiple shocks can minimize the adverse effects of what cannot be avoided. Sustainability refers to a
growth model that brings economic progress and job creation while preserving natural assets. Water scarcity
can affect livelihoods and productivity. Climate change is deepening existing challenges of water scarcity,
coastal resources and populations will be affected by sea level rise. These are only a few of the challenges
to come and thinking ahead about how to prepare for the future through a focus on sustainability is essential
today for a better tomorrow. Better management of natural and financial resources is also needed, and hence
improving efficiency in the use of resources is critical.
6.2 Resilience and Efficiency
6.2.1 Use of natural resources
183. Resilience is assessed through six key indicators that provide a broad characterization of the many
risks to which countries are exposed: the size of the population affected by disasters, exposure to rainfall
shocks, risk to assets, risk to well-being, the urban slum population, and the food security index. How does
Egypt score on these indicators? It is at the top among its lower-middle-income peers because it has the
lowest share of population and assets exposed to natural hazards (Figure 6.1). Its exposure to rainfall shocks
is average, although most of the country’s water supply is from the Nile. And overall food security is above
average for its income group and almost the median for upper-middle-income countries.

72
Figure 6.1 Performance on resilience indicators relative to lower-middle-income countries
Source: Food Security Index (2019) from the Economist Intelligence Unit; Risk to asset (% of GDP- 2017) and Risk to wellbeing
(% of GDP- 2017) from Hallegatte 2017; Population affected by disasters from EM-DAT database (2000-2019), Rainfall shock
exposure % Average (2009-2013) from Damania et al. (2017); Urban slum population % from World Development Indicators.
184. However, food affordability remains a major concern, and sustainability challenges may jeopardize
Egypt’s strong performance on building resilience. About 12–15 percent of the most fertile arable land in
the Nile delta is expected to be negatively affected by sea-level rise and saltwater intrusion, potentially
affecting food security in the long term. Given that Egypt imports more than half of its food, a decline in
agricultural production is likely to exacerbate the impact of fluctuations in international food prices (World
Bank Group 2020).
185. Moreover, climate change could also affect resilience on food security, underscoring the need for
investments in adaptation measures. For example, climate models predict lower rainfall and higher
temperatures in agricultural areas, both of which could lower food production. According to Perez, Kassim,
Ringler, Thomas and Eldidi (2021), “Compared to a no-climate change scenario, on average, yields for
food crops are projected to decline by 10 percent by 2050 as a result of heat stress (4.9 percent), water stress
(4.1 percent), and salinity (1.6 percent).” Such an impact, along with others that result from climate change
in countries that Egypt imports food from, could weaken domestic food security.
186. Within areas officially designated as urban, population growth has led to an expansion of informal
settlements. Egypt’s share of the population living in slums is the lowest among its peer countries; Egypt
outperforms countries with comparable income levels on this Sustainable Development Goal (SDG11)
indicator on sustainable cities and communities (Amin-Salem and others 2018). However, informal
settlements have been growing. They are particularly prevalent in the Greater Cairo region (the Cairo
governorate and the urban areas of the Giza and Qalyubia governorates), which is home to almost 20 percent
of the population, and 60 percent of the population live in informal settlements, according to one estimate
(Khalifa 2015). The Informal Settlements Development Fund (ISDF)—the government authority
responsible for identifying and promoting the development of slums—distinguishes between unplanned
informal settlements (generally with good-quality housing that do not meet requirements of the building
law) and unsafe informal settlements.
Indicates the country is within 1 standard deviation of the LMI median
/UMI media Indicates country performs 1+ standard deviations better than LMI
median /UMI median Indicates country performs 1+ standard deviations worse than LMI
median /UMI median *Prior to the indicator names indicates that higher value represents worse
performance

73
187. Egypt’s greenhouse emissions are relatively low, but its output per greenhouse emission is also
very low. Therefore, room exists for the country to improve its use of natural resources (Figure 6.2).
According to the Natural Capital Index (NCI), the efficiency of the economic resources allocated to control
air pollution is still low and only just above that of other countries in North Africa. Water efficiency in
Egypt is lower than most of its income peers, almost the bottom 10 percent of the distribution.
188. Land property rights are stronger than in other lower-middle-income countries, but land
management systems are outdated, leading to inefficiencies in the way land is used for urban growth,
industrial development, and agriculture.
Figure 6.2 Performance on efficiency indicators relative to lower-middle-income countries
Source: Governance effectiveness, Control of corruption, and Regulatory Quality from WB Worldwide Governance Indicators
(2018): Population using internet (2017), and Total GNI/GHG (2012) from World Development Indicators; Logistics
performance index (Aggregate 2012-2018) from WB Logistic Performance Index; Tenure Insecurity (2018-2019) from Global
Property Index; Agriculture value added per worker $ (2019), Agricultural land productivity $/ha (2016), and Water efficiency
(USD/m3) (2017), from the Food and Agriculture Organization.
6.2.2 Household resilience to shocks, social protection, and financial services
189. Households’ well-being is affected by individual-level shocks such as job loss or illness as well as
by economy-wide shocks such as inflation spikes or disruptions due to the COVID-19 crisis. Using data
from the 2018 Egypt Labor Market Panel Survey (ELMPS), Helmy and Roushdy (2019) find that about 25
percent of Egyptian households had experienced food insecurity during the month preceding the survey and
16 percent of households had been exposed to at least one type of shock in the year preceding it. Economic
shocks, defined as reduced income or loss of employment, were the most frequently reported type of shock,
followed by health shocks. Households in the poorest wealth quintile were much more likely to experience
shocks (23 percent) than households in the fourth (12 percent) and fifth (9 percent) wealth quintiles.
Indicates the country is within 1 standard deviation of the LMI
median /UMI media Indicates country performs 1+ standard deviations better than
LMI median /UMI median Indicates country performs 1+ standard deviations worse than
LMI median /UMI median *Prior to the indicator names indicates that higher value represents
worse performance

74
Households’ exposure to shocks was also higher in rural areas than in urban areas. Consumption rationing,
defined as reducing expenditures on food, health, and education (55 percent), as well as borrowing (43
percent), mostly informally, were the most commonly used coping mechanisms in response to shocks
(Figure 6.3). Social capital played a significant role as an informal safety net for Egyptian households, given
that almost a third of households reported seeking assistance from relatives and friends to cope with a shock.
Figure 6.3 Coping mechanisms used by households experiencing shocks during previous year
Source: Helmy and Roushdy 2019.
Note: Multiple strategies are possible.
190. Households rely on informal coping mechanisms when faced with shocks, even though a large
share of them receive some formal social protection programs introduced by the government (contributory
pension, non-contributory social assistance, Takaful and Karama, food smart cards, social insurance and
health insurance), suggesting the need to improve adequacy of these programs. Households in the bottom
two wealth quintiles were more likely to benefit from one or two programs than were households in the top
two quintiles (Figure 6.4, panel a). The share of households receiving benefits from two programs was 44
percent among households in the poorest quintile and 28 percent among households in the highest quintile.
However, the share of households receiving benefits from three programs was larger among households in
the top quintile (38 percent) than the bottom one (26 percent). This finding may reflect that fact that a larger
share of households in the top quintile receive contributory pensions and are enrolled in health insurance
and social insurance because they are far more likely to work in the formal sector. Rural households are
more likely to be covered by one or two social protection programs than urban households (59 percent
versus 52 percent), but slightly less likely to be enrolled in three programs (30 percent versus 35 percent)
(Figure 6.4, panel b).
191. Egypt still lacks a comprehensive and adaptive social protection strategy aiming at integrating
social protection programs and policies under one framework along with its corresponding monitoring
framework, coordination mechanisms and institutional arrangements. The strategy should be evidence-
based relying on a rigorous analysis of the efficiency and effectiveness of the existing programs i.e. cash
assistance (TKP, old social pension, social housing), in-kind (food subsidies, school meals, etc..), economic
inclusion interventions (i.e. FORSA which promotes graduation out of cash transfers), pensions systems
and protection of the informal workers; and leveraging technology for an efficient and effective delivery
chain, promoting financial inclusion and strengthening social registry. The strategy would also look at how
social spending is allocated across the following three pillars: provision, prevention, and promotion.

75
192. Despite the positive expansion of TKP which has reached up to date 3.4m households
(approximately 12 million individuals) and another 400,000 households getting cash assistance under the
old social pension (Daman), there are around 4 million poor households not covered. As such, making the
fiscal space through increasing the tax base and reallocating expenditures within the social protection
portfolio to increase the efficiency and effectiveness of spending is necessary to be able to cover additional
poor households. Egypt is also moving towards consolidating all its cash assistance under one umbrella
program, that of TKP, pending the issuance of a Unified Cash Transfer Law. There is an ongoing debate of
moving from in-kind to cash and perhaps capitalizing on the Unified National Registry, led by the
Administrative Control Authority, can offer a good step towards better integration and targeting.
Figure 6.4 Percentage of households covered by social protection programs, by wealth quintile and location
a. By wealth quintile b. By location
Source: World Bank calculations, based on data from the 2018 Egypt Labor Market Panel Survey.
193. In 2018, around 57 percent of Egyptian households had a least one member receiving either non-
contributory (such as Sadat/Mubarak pensions, Takaful and/or Karama, and other types of social assistance)
or contributory (such as retirement pensions) benefits as opposed to 62 percent in 2012 and 68 percent in
2006. This reduction is potentially due a decline in the percentage of households with at least one actively
contributing member as well as the drop in social insurance coverage that decreased by around 10
percentage points, from 42 percent in 2012 to only 32 percent in 2018 (see Selwaness and Ehab 2019).
194. As for finances, only 33 percent of Egyptians over 15 had an account at a regulated financial
institution in 2017 (27 percent of women and 39 percent of men), according to the World Bank’s Global
Findex database.45 Among unbanked Egyptians, 83 percent cited insufficient funds as the reason for not
having an account. Other barriers included the cost of opening and maintaining an account (19 percent),
lack of documentation (13 percent), distance to the nearest access point (7 percent), lack of trust in the
financial sector (5 percent), and religion (5 percent). These findings suggest that a wider range of financial
products could help meet Egyptians needs.
195. Egypt has very few financial sector access points (World Bank 2020b). In 2018, it had just five
commercial bank branches per 100,000 adults. The number of automatic teller machines (ATMs) per
100,000 adults (18.7) was far fewer than in Lebanon (39.5), the West Bank and Gaza (34.6), Tunisia (30.7),
45 See https://globalfindex.worldbank.org/.
7 9 7 9 8
20 21 20 20 17
44 41 36 3228
26 27 31 3438
3 3 5 5 9
0
20
40
60
80
100
1 2 3 4 5
Per
cen
tage
of
ho
use
ho
lds
Wealth Quintiles
No Programs One Program Two Programs
Three Programs Four Programs
9 8
19 20
33 39
3330
7 3
0
20
40
60
80
100
Urban Rural
Per
cen
tage
of
ho
ou
seh
old
s
No Programs One Program Two Programs
Three Programs Four Programs

76
or Jordan (29.4). The number of point of service (POS) terminals (97 per 100,000 adults) in 2015 compared
poorly with other countries in MENA, including the United Arab Emirates (1,796), Saudi Arabia (1,000),
Lebanon (610), Jordan (465), and Tunisia (152). There were 20,600 banking agents in Egypt and 22,247
mobile money agent outlets in 2018.46 There were also more than 140,000 locations of digital payments
companies. Egypt Post has an extensive branch network that makes it particularly suitable for reaching low-
income and remote populations.
196. With regards to digital finance, online payments are regulated by the Central Bank and Banking
System Law (World Bank 2020b). According to this law the CBE can regulate and supervise banks and
regulate and oversee payment service providers and payment service operators. CBE has adopted a bank-
led model for mobile money and introduced regulations in 2012 and 2016 to enable the development of
mobile wallets and mobile payment services in Egypt.
6.2.3 The COVID-19 shock
197. Egypt registered its first case of COVID-19 on February 14, 2020 (the first case detected in Africa).
On March 17, following the country’s first recorded COVID-19 death, the government declared a national
public health emergency and launched a strong response, including travel restrictions, social distancing,
and lockdown measures. The strict public health measures put in place at the beginning of the pandemic
were later relaxed to balance the need for public health, economic activities, and overall well-being.
198. The pandemic put a significant strain on the health system and exacerbated challenges related to
quality of care and efficiency of service delivery. The daily number of new cases declined considerably
after peaking at 1,774 cases on June 20, 2020. As of February 15, 2021, the total number of confirmed cases
in Egypt was 174,426, with 10,050 deaths.
199. During the initial days of the pandemic, most households reported that they suffered income shocks,
according to a survey in April-May 2020 by the Central Agency for Public Mobilization and Statistics
(CAPMAS) as part of the Household Expenditure Income and Consumption Survey (HIECS). The vast
majority of surveyed respondents said incomes fell because of job loss or reduction in hours or days worked.
Households coped by adjusting food consumption and shifting to cheaper foods; reducing weekly
consumption of meat, poultry, and fish; relying on friends and relatives; reducing the quantity of food in
each meal; and reducing the frequency of meals in a day. A larger share of rural than urban households
reported using these coping strategies. About half of the interviewed households reported borrowing money
to smooth the income shock.
200. The COVID-19 crisis and its future waves are expected to disproportionately affect informal
workers, particularly urban workers. The share of households in which all workers are informal wage
workers is large, especially among the urban poor. In 42 percent of urban households in the poorest
consumption quintile, all members who work are informal wage workers. Among half of all poor
households, an informal wage worker is the only working member of the household.
201. The average monthly income of an informal wage worker living in a poor household and employed
in the nonagricultural sector was LE 1,433 (in 2020 prices), according to the HIECS 2017–18. Informal
workers in sectors affected by the pandemic could lose all or part of this monthly income because of
disruptions in economic activity. The vast majority of these workers are enrolled in the food subsidy
(Tamween) program. The challenge is reaching them with cash compensation. In March 2020, the
government opened registration for Seasonal Workers Assistance program for informal workers. Eligible
workers received LE 500 a month.
46 See International Monetary Fund, Financial Access Survey (FAS) and World Bank Global Payment Systems Survey (GPSS).

77
202. The pandemic has not only intensified many pre-existing economic challenges but also highlighted
the key role digital technologies can play in helping people and firms cope better in the face of shocks. As
recent experience with COVID-19 lockdowns has shown, digital payments are crucial in facilitating
minimum essential economic activity during such periods of stress and crisis (World Bank 2020b). Most
payments in Egypt are made in cash. The use of digital payments by Egyptian adults is low. Overall, only
six percent of Egyptian adults reported making a digital payment in the past year. This includes using a
debit or credit card, a mobile phone to make a payment from an account, using the internet to pay bills or
to buy something online, paying bills or sending domestic remittances directly from a financial institution
account or through a mobile money account. 47 The percentage is much lower than most economies, with
the MENA average at 28 percent and the world average at 45 percent. Among those who report paying
utility bills in the past year (69 percent of adults), 98 percent report using cash. Only two percent of Egyptian
adults reported using the internet to pay bills online. Around 66 percent of wage earners report receiving
salaries in cash. Twenty-two percent of account holders report having made neither a deposit nor a
withdrawal in the previous year. Similarly, the use of mobile money services in Egypt is low at only two
percent of Egyptian adults.
6.3 Sustainability
203. Egypt lags peer countries on most sustainability indicators (Figure 6.5). Freshwater availability is
very low, and pollution, especially from agricultural waste and poor rural sanitation, affects the quality of
water. The level of wastewater utilization is much higher than in the average lower-middle or upper-middle-
income countries, a strength that should be maintained. However, only a third of waste is properly managed.
Although this proportion is higher than in Egypt’s income peers, it is only half of the median for upper-
middle-income countries, suggesting an area that must be improved as Egypt pushes toward higher income
levels.
47 Global Findex (2017)

78
Figure 6.5 Performance on sustainability indicators relative to lower-middle-income countries
Source: PM2.5 mean annual exposure (2016), Renewable energy consumption (2015), Renewable Internal Freshwater
Resources per capita (2017), and CO2 emissions (2016) from World Development Indicators; Waste water treatment,
Biodiversity and Habitat, Fisheries Index, and Green house growth rate from Yale Environmental Performance Index (2020);
Municipal solid waste from Kaza et al (2018); Share of waste properly managed from Jambeck et al data, 2015; Water quality
SDG 6.3 from Damania et al data, 2016.
204. Egypt’s renewable energy generation is the lowest among lower-middle-income countries,
highlighting the need to exploit the country’s impressive endowments of wind and solar energy to reduce
dependency on fossil fuels, which currently meet 95 percent of energy needs. The Benban Solar Park
project, the world’s fourth-largest solar power plant, promises to add significant capacity from solar energy
starting in 2019–20.
205. Environmental challenges are putting additional pressures on sustainability, with air pollution at
extremely high levels. Average PM2.5 levels are almost nine times higher than World Health Organization
(WHO) guidelines, with open burning of agricultural waste and motor vehicles the primary sources of air
pollution.
6.3.1 Environment and natural resources use
206. Air quality is poor in some urban and industrial centers of Egypt, as well as in some rural areas
(World Bank 2020a). At many industrial and traffic sites, emissions of nitrogen oxides, sulfur dioxide, and
particulate matter regularly exceed WHO limits. Air pollution in Greater Cairo severely affects areas
adjacent to industrial activities, as well as areas around heavy traffic highways, such as the Cairo–
Indicates the country is within 1 standard deviation of the LMI
median /UMI media Indicates country performs 1+ standard deviations better than
LMI median /UMI median Indicates country performs 1+ standard deviations worse than
LMI median /UMI median *Prior to the indicator names indicates that higher value
represents worse performance

79
Alexandria Agricultural Road. Small and medium-size industrial activities—such as foundries, secondary
smelters, pottery workshops, brick industry, mechanical workshops, lime crushers, and charcoal
producers—are scattered within most urban areas, especially Greater Cairo, Alexandria, Tanta, and several
other cities. These activities are often located in informal settlements and use old technologies, with few
precautions for air pollution control.
207. The primary contributors to air pollution in Greater Cairo are public and private transport, the
burning of agricultural residues, industrial emissions, and the burning of municipal waste. Fuel combustion
is the greatest source of greenhouse gas emissions. Air pollution source attribution studies from the early
2000s show that motor vehicle emissions, as well as the open burning of waste, were the largest contributors
to PM10 concentrations. Together, these two sources account for about two-thirds of ambient fine particle
air pollution concentrations in Egypt. Their combined contribution to air pollution may be lower in the
autumn when agricultural burning is more prevalent.
208. Pollution management is key to ensuring safe living conditions for communities. Solid waste
management is a critical part of pollution management in the Greater Cairo area, which generates about 0.8
kilograms per capita per day (about 5,256 tons a year), only about 70 percent of which is collected.
Increasing levels of waste generation, the lack of sufficient infrastructure, the uncontrolled spread of urban
development, and inappropriate disposal practices by communities and individuals are increasing the
challenges of collecting, transferring, and disposing of solid waste. As a result, uncollected and poorly
treated waste, such as unrecycled plastic, is dumped at open sites and subject to open burning or ends up
contaminating water bodies. Several laws have been endorsed over the last few years covering tenure
security and building regulations.
209. Coastal zones in Egypt are expected to suffer from direct climate change impacts (UNFCCC 2014).
For example, sea-level rise and the overflow of low-level land poses a risk in particular to Alexandria and
Port Said. In fact, Alexandria is among the top 20 cities with the highest exposed assets by 2070 under
business as usual (BAU) sea-level rise scenarios (Nicholls and Cazenave 2010). Unmitigated sea-level rise
and coastal erosion bring a substantial risk of mass displacement and mass migration. Almost half of
Egypt’s population may be negatively affected or forced to relocate because of sea-level rise by the end of
this century. Proposed solutions include Integrated Coastal Zone Management, sea-level rise adaptation,
and urban flood prevention measures. But constraints to managing coastal areas include lack of an
integrated, multisectoral approach to reduce the vulnerability of coastal areas and institutional
fragmentation in regulation and enforcement.
210. Overfishing and unregulated fishing threaten the sustainability of the marine and coastal economy
(the “blue economy”). This sector contributes significantly to food security and the livelihoods of many
Egyptians. Coastal ecosystems (including mangroves and reefs) provide marine habitats for fish and green
infrastructure/protection against storm surges. But they are being destroyed and degraded by coastal
development, habitat destruction, pollution (including marine debris), ocean warming, and acidification.
6.3.2 Water supply
211. Egypt is a water-scarce country. The United Nations predicts that by 2025, Egypt may reach the
level of absolute scarcity of less than 500 cubic meters per capita. The Nile River is the main source of
water (providing 55.5 billion cubic meters a year), followed by groundwater, rainfall, and flash floods.
Recycling of wastewater (estimated at 20 billion cubic meters a year) and desalination are the two
nonconventional water resources.
212. Agriculture accounts for more than 80 percent of water needs, followed by drinking water and
industrial use (Figure 6.6). Demand for water is growing, and the supply of water may be becoming
increasingly constrained. Using the Suez Canal zone for industrial development and the Western Desert for
agriculture poses additional water challenges (World Bank 2018b), as it requires expensive long-distance
conveyance infrastructure for Nile waters, the desalination of sea waters, or the exploitation of groundwater.

80
Limited recharge and depth to the water table are constraining the supply of groundwater. The gap between
demand and supply is expected to exceed 20 billion cubic meters by 2037 (World Bank 2020d). Untreated
sewage, industrial effluent emissions, and agricultural fertilizer runoff further contribute to the declining
availability of clean water (Alternative Policy Solutions 2019).
Figure 6.6 Sources of demand for water
Source: World Bank 2020d.
213. Egyptian agriculture is dependent on the Nile for irrigation water. Factors such as population
growth and possibly climate change affect the per capita availability of water from the Nile. Output per unit
of water use is lower in agriculture than in industry; within agriculture, it is higher for some crops than for
others. The efficiency of water use is as low as 50 percent, according to one estimate reported in Nin-Pratt
and others (2018). Farmers in the Nile delta and valley pay only for the operations and maintenance costs
of irrigation water, which does not account for environmental externalities, and they do not pay for the
volume of water used (Saleh 2018). In addition, the government subsidizes a large part of the fixed cost of
irrigation water delivery. Volumetric pricing would encourage farmers to conserve water use, but it is
unclear how efficient such a solution would be given the high incidence of small plots. Reforms to the way
Water Users Associations function could help price irrigation water more effectively.
214. The government’s approach to addressing the demand–supply gap is based on tackling the supply
side. Its efforts are constrained by the size of the investment needed to find alternative sources of water
supply, including by expanding desalination, increasing groundwater usage, reusing treated water, and
reducing water losses and nonrevenue water (estimated to account for more than 40 percent of the total).
The volume of treated water used can be increased by expanding the construction of wastewater treatment
plants, increasing their efficiency, and upgrading them to tertiary treatment for irrigation water use. The
government is considering private sector participation in the sector, given the significant investment needs.
Multiple water sector government agencies, low tariffs, the need for significant capital spending, and
obstacles to public–private partnerships constrain investment, however.
215. There is also significant scope to address the demand side management of drinking water and
irrigation water in the Government National Water Resources Plans (Alternative Policy Solutions 2019).
More attention has to be paid to helping water users adapt to changing water supply scenarios. Residential
water tariffs were increased significantly in 2017 and 2018, and an increasing block rate structure was
adopted. There is also scope to address water scarcity via the agricultural sector, the largest source of
demand for water. Constraints to the agricultural sector productivity (such as fragmented land holdings) are
relevant in this regard (see Chapter 3). Also important are appropriate tariffs for irrigation water suitable
for Egyptian agriculture.
85.21%
13.76%
6.95%
Agriculture Drinking Industry

81
6.3.3 Social sustainability
216. Improved voice and accountability can help ensure the social sustainability of structural reforms.
Two global measures of governance provide an assessment of Egypt’s performance on voice and
accountability. The 2019 Worldwide Governance Indicators document the decline in Egypt’s performance
on voice and accountability, which fell from the 14.2 percentile in 2009 to 8.4 percentile in 2019. The 2020
Bertelsmann Stiftung Transformation Index (BTI) shows that Egypt has an overall score of 4.20 (on a scale
of 1-10) and ranks of 104 out of 137 countries.48 The findings of the 2020 BTI indicate that there is scope
for Egypt to improve performance on consensus building, rule of law, and political and social integration.
The BTI analysis also notes the limited inputs by civil society in policy formulation.
217. Transparency and regulatory governance are important for increasing trust by the public and
investors in the government’s economic program and reform efforts. Fiscal transparency and oversight and
regulatory governance are key to bolstering the confidence of investors and enhancing possibilities for
private sector investment. Egypt is gradually improving its budget process. According to Open Budget
Survey[1], which covers the three areas of budget transparency, public participation and oversight, Egypt’s
score on transparency has improved cumulatively by 27 percentage points (pp) in the Open Budget Index
in 2019 up from 16 pp in 2015. The score on this Index has increased to 43/100 in 2019 from 41/100 in
2017. This improvement is mainly due to publishing Mid-Year review and Year-End Report online in a
timely manner. There is room for improving opportunities for public participation as well as oversight by
the legislature and supreme audit institution during the budget process. The 2019 Worldwide Governance
Indicators find a decline in indicators for regulatory quality, with Egypt’s score falling from 46.9 out of 100
points in 2009 to 18.8 points in 2019. The Worldwide Governance Indicators also show Egypt’s limited
progress on controlling corruption. Government efforts are ongoing with ample room for improving
indicators.
218. In addition to transparency, citizen access to the government rule-making process would foster trust
in the state and adherence to new regulations; it is a key part of business environments in which investors
make long-range plans and investments. Egypt’s regulatory governance score of 1.5 (on a scale of 0–5)
reflects challenges, such as the fact that rule-making bodies are not required by law to solicit public
comments on proposed regulations or report on the results of any consultations that are convened. On the
2019 Open Budget Survey, Egypt scored 50 out of 100 on oversight of its budget, 43 on the transparency
of its annual budget preparation and implementation, and 15 on public participation at various stages of the
budget process.
219. Central to stronger citizen engagement is the transparent provision of accessible, reliable, and
usable data that meets the demand for information. Egypt’s statistical capacity to produce data is strong
relative to other MENA countries (see Annex A). However, data transparency is limited, as it is in most
countries in the region (Arezki and others 2020). Egypt’s national statistical agency, CAPMAS, routinely
announces data on key indicators such as the employment rate and quarterly unemployment rate, for
example, but the data are published in formats that are not easily accessible or reusable by users. Egypt also
provides limited access to raw microdata from surveys, which are needed for social and economic analysis.
Egypt has “basic data registers” that cover diverse registries of vehicles, land, and businesses, many of
which are not publicly known or accessible (World Bank 2020b). The most recent Open data Access
Indicator (ODIN), for 2018–19, reveals the limited access. In 2018, Egypt ranked 64th out of 178 countries
in terms of coverage of data available but 136th out of 178 countries in terms of openness.
220. Managing public health crises at the scale of the COVID-19 pandemic requires effective
communications with the public. Several lessons can be drawn from Egypt’s efforts during the first
48 https://www.bti-project.org/content/en/downloads/reports/country_report_2020_EGY.pdf. [1] https://www.internationalbudget.org/open-budget-survey/open-budget-survey-2019-0

82
lockdown. During this period, the government’s communication reached a large share of the population. In
a national phone survey conducted in May 2020, 74 percent of respondents reported being aware of the
national curfew. But awareness about the use of masks and handwashing as a way to prevent the spread of
COVID-19 was low at this early stage of the pandemic, and awareness of measures taken by the government
was slightly lower among respondents from the bottom quintile than among other respondents. Television
was by far the main source of information: 81 percent of respondents learned about measures taken against
the spread of the virus through TV (Table 6.1). Social media was a major source of information but only
among people in the top quintile. More recent data show that awareness has grown substantially thanks in
large part to government efforts.
Table 6.1 Sources of awareness of measures taken by the government to slow the spread of COVID-19
Wealth quintile
Source National Bottom Second Third Fourth Top
Television 81 76 83 82 82 83
Family and neighbors 23 30 23 21 18 17
Social media 20 6 14 18 28 43
Local government 3 3 3 4 3 2
Radio 2 2 2 3 2 2
Number of respondents 2,034 409 415 447 372 391
Source: Phone survey on well-being conducted in April-May 2020.
221. The rollout and expansion of the Takaful (Solidarity) and Karama (Dignity) (TKP) cash transfer
programs illustrate the combination of citizens’ engagement and evidence-based policy adjustments that
can be replicated for other programs in Egypt. TKP, which was introduced in 2015, uses a combined
targeting approach—drawing on geographical and proxy means testing, along with cross-validation against
the Unified National Registry. An independent impact evaluation of the Takaful program in 2018 by the
International Food Policy Research Institute (IFPRI) showed that it increased household consumption for
beneficiary households by between 7.3 percent to 8.4 percent compared to non-beneficiary households. The
TKP information system and database facilitated program adaptability during COVID-19. The proxy means
testing threshold was revised to expand the program coverage to include more poor and vulnerable
households from the database. Social accountability tools and mechanisms are used at the village level to
provide citizens with the opportunity to voice their opinions and concerns about the program and to ensure
regular feedback. A management information system (MIS) grievance redress mechanism captured a total
of 660,184 complaints through November 30, 2020, 70 percent of which were closed.
6.3.4 Sustainability of cities and communities, agglomeration, and territorial development
222. Control of designated public land is complex, with about 90–95 percent of Egyptian territory owned
by the state. More than 40 laws and executive orders stipulate which government entities control what land,
whether the land can be disposed of, and who has a say in determining land use (Sims 2015). A minority
of public land is reserved for security or other state purposes. The remaining territory either has a governing
authority, which in many cases can allocate land to investors, or does not yet have a designated use or
specific controlling entity. As a result, the supply of land is detached from market demand, which impairs
efficient and sustainable use.
223. Egypt’s urbanization rate is low, even though the country is highly agglomerated, because a
relatively small share of the population lives in areas officially designated as urban. Census data reveal that
since 1976, the share of the population living in urban areas has remained roughly constant, at about 40
percent. However, this apparent stagnation in the urbanization rate does not reflect actual urbanization
trends—rather, it reflects the arbitrary administrative definition of which settlements are declared as cities.
In the 2017 census, for instance, 275 settlements were administratively defined as villages, even though
their populations exceeded 40,000 inhabitants. Considering the extent of agglomeration, almost 97 percent

83
of the population can be considered urbanized. It is, therefore, more accurate to refer to a “core–periphery
continuum” in Egypt than to rural and urban spaces (World Bank 2014).
224. The spatial pattern of development of Egypt’s cities is characterized by informal expansion, low-
density urban sprawl, and leapfrog development. According to some estimates, more than half of urban
dwellers may be living in informal areas (see Khalifa 2015), and this percentage is likely to increase with
population growth.
225. Agglomeration has both positive and negative effects. A World Bank (2014) study finds that wages
are higher in Egypt’s core, which is highly agglomerated, than in the periphery. Firms are concentrated in
the core—with Alexandria, Cairo, Giza, Sharkeya, Beheira, and Gharbeya accounting for 53 percent of all
establishments, according to the 2017 Establishment Census. Such agglomeration can increase the
productivity of firms if clustering reduces business costs (for example, by increasing the availability of
skilled workers). But it can also raise business costs by increasing congestion. Using data from the 2013
Economic Census, Badr, Rizk, and Zaki (2019) find that firms’ productivity is positively related to the
number of firms in a governorate, the average productivity of those firms, and the number of high growth
firms (sales in the 90th percentile) within a sector, suggesting the existence of agglomeration economies at
the core (Cairo area). In contrast, the number of firms within a governorate and sector negatively affects
the productivity of firms on the periphery (outside Cairo), suggesting the presence of congestion effects.
226. Access to regular water supply and sanitation services is lower in rural areas than in urban areas,
with most Egyptian households outside of metropolitan areas lacking regular access to water and modern
sanitation (Figure 6.6). As the share of poverty in rural areas of Upper Egypt and Lower Egypt governorates
is high, weak services connectivity translates into a larger share of the poor without access to basic services.
The government recently launched the Decent Life (Hayah Karima) initiative for Sustainable Rural
Communities and aimed at improving access to basic services and infrastructure in target villages. The
impact of these investments can be assessed by future HIECS surveys.
Figure 6.6 Regular availability of water and modern sanitation services, by region, 2017
Source: World Bank, based on data from the 2017–18 Household Income, Expenditure, and Consumption Survey (HIECS).
Note: Irregular water supply includes households not connected to water and households that experience interruption in supply at
least once a day or once a week.
a. Water b. Modern sanitation services

84
7 Pathways to Tackling Poverty Reduction and Inclusive Growth:
A New Growth Model
Key findings on the components of a new growth model:
• To safeguard the success of the first wave of economic reforms, and recover strongly from the
health crisis, it is important to tackle the longstanding challenges that have kept per capita growth
low and hamper success on poverty reduction, shared prosperity, and inclusive growth.
• A new growth model that expands opportunities for job creation and productivity is needed. The
growth model may require stronger implementation of existing programs and policies, policy or
institutional changes of existing programs, or the introduction of new programs or structures.
7.1 A New Growth Model
227. Egypt’s flagship economic reforms in the last 15 years have been bold and successful in restoring
macroeconomic stability while navigating political change. Although Egypt succeeded in achieving growth
as a result of these reforms, progress on reducing poverty and boosting shared prosperity lagged. This
pattern is symptomatic of an economy that lacks the productivity growth needed to create jobs with rising
wages and benefits.
228. A new growth model can bring productive jobs that create pathways out of poverty for the poor
and create opportunities for a stronger middle class. This SCD suggests four areas to accomplish these
goals: (i) improve public sector spending efficiency and strengthen macroeconomic resilience; (ii) boost
private sector investment, firm growth, and productivity; (iii) advance economic inclusion and strengthen
household resilience; and (iv) promote resilient, efficient, and sustainable natural resource use and prepare
for climate impacts. There also needs to be a cross-cutting focus on stronger citizens engagement and data
transparency.
229. Many of these elements and needed actions have been put forward by previous studies, including
the previous SCD. But acting on these recommendations now is even more urgent than it was then. Half of
Egypt’s population today is under the age of 24. By 2025, the share working age population is projected to
increase, creating favorable conditions for a boost in growth (a “demographic dividend”)—provided
productive jobs are available for this rising share of young workers (Assaad 2020). In addition, climate
change adds a sense of urgency, underscoring the need for investments in adaptation activities that can
mitigate its negative effects on agriculture and food security. Globally, the prospects for regional and global
trade are changing as are the possibilities for leveraging new technology and advances in digitalization. As
one of the Middle East and North Africa’s leading economies, Egypt can prepare itself to tap into these
global mega-trends for growth that can transform people’s lives, boost their incomes, and lift them out of
poverty.
7.2 Prioritizing Pathways
230. Pathways of the new growth model are ordered to reflect their priority level based on the potential
of each to unlock progress across multiple constraints. Another criterion for ranking pathways is the extent
to which each pathway can contribute to protecting the economy from the negative effects of the pandemic
crisis. Thus, the pathway that can enable progress across multiple pathways and help with pandemic
recovery is deemed to be a top priority.
231. Applying the two criteria, the priorities across pathways are as follows (Figure 7.1):
• Pathway 1: Improve public sector spending efficiency and strengthen macroeconomic resilience.
• Pathway 2: Boost private sector investment, firm growth, and productivity.

85
• Pathway 3: Advance economic inclusion and strengthen household resilience.
• Pathway 4: Promote resilient, efficient, and sustainable natural resource use.
232. Cutting across these pathways is the need for strong state engagement with its citizens and firms
and data transparency. The goal is to ensure social sustainability and to build the public’s and investors’
trust in the government’s economic program and reform efforts.
Figure 7.1 Pathways and constraints to poverty reduction and inclusive growth in Egypt
7.2.1 Priority areas by pathways
233. Pathway 1: Improving public sector spending efficiency and strengthening macroeconomic
resilience is critical and a top priority for the new growth model given the role the government plays in the
Egyptian economy. Macroeconomic stability is not only good for the private sector, it also helps protect
people’s purchasing power (via contained inflation). More efficient public spending could help direct more
public resources toward activities that help attract private sector investment and increase productivity,
support macroeconomic resilience, and redirect resources away from activities that drive employment
toward low-skilled employment. It can also enhance confidence in the government’s stewardship role that
is important as steps are taken to increase domestic revenue mobilization.
Wh
at w
ill
it t
ake
to a
chie
ve
pover
ty r
edu
ctio
n a
nd
in
clu
sive
gro
wth
su
stai
nab
ly?
Pathway 1: Improve public sector spending efficiency and strengthen macroeconomic resilience
Constraint 1.1: Public investment (mostly in infrastructure) progressively yields lower returns and is inefficient.
Constraint 1.2: Education spending is low and with limited link to learning/quality.
Constraint 1.3: Public health spending is low relative to needs and population growth.
Constraint 1.4:High public sector borrowing exposes the economy to macroeconomic shocks.
Pathway 2: Boost private sector investment, firm growth, and productivity
Constraint 2.1: State's footprint as investor creates uncertainty, stifling private investments.
Constraint 2.2: State's role as regulator adds uncertainty, conflict of interest, and lowers productivity.
Constraint 2.3: State's role as market participant introduces uncertainty and unfair competition, stifiling private investment.
Constraint 2.4: Domestic markets are relatively closed to international trade, thwarting competition and innovation.
Constraint 2.5: Domestic markets are segmented, stifling competition and adding unnecessary costs to the economy.
Pathway 3: Advance economic inclusion and strengthen household resilience
Constraint 3.1: Labor market is segmented (spatially); labor demand is low and skewed toward low skills; and informal sector productivity is low.
Constraint 3.2: Care responsibilities and gender norms limit female employment, reducing the economy's potential.
Constraint 3.3: Fragmented social protection leaves many poor households vulnerable to shocks.
Pathway 4: Promote resilient, efficient, and sustainable natural resource use
Constraint 4.1: Agricultural practices and water use reduce sectoral sustainability.
Constraint 4.2: Air pollution exacerbates health problems.
Constraint 4.3: Rapid territorial development affects sustainability.
Cross-cutting constraints: Limited mechanisms for feedback provision and participation by citizens and the private sector and
limited data transparency

86
234. Egypt has committed to increasing public spending as part of its pandemic response. This pathway
calls for ensuring that spending is efficient and equitable and meets critical social infrastructure needs.
Increased health spending is needed to equip the public health system to meet the goals of universal health
coverage and also fight COVID-19 effectively with resources to vaccinate the population. Better aligning
education spending with learning needs is crucial given the need to boost jobs and earnings. With
globalization and increasing digitization, economies have been undergoing substantial transformations and,
as a result, so has the nature of work and the demand for skills. In this age of greater digitalization, there is
a higher demand for advanced cognitive skills, socio-behavioral skills and skill combinations associated
with greater adaptability.49 In addition, studies have shown that cognitive abilities are closely related to
productivity and economic growth (Hanushek and Woessmann 2008). When benchmarked against other
members of the MENA region, Egypt qualifies as “Emerging” in Digital Skills (World Bank 2020b). To
build these skills, there will need to be not only strong basic education foundations and lifelong learning
but also new higher education programs and teaching methods that adopt and use the latest technologies
(World Bank 2020b; World Bank 2021).
235. Pathway 2: The next priority is boosting private sector investment, firm growth, and productivity
because this is critical for the jobs and productivity boost needed. This pathway requires loosening
constraints to competition and labor demand in the economy. These constraints arise because markets are
protected from external competition and are poorly integrated spatially, and because the state’s activities
create policy uncertainty, conflicts of interest, and unfair competition.
236. Enhancing the oversight and transparency of the financial operations of SOEs and Economic
Authorities, clearly separating the state’s role as owner from that as sector regulator and bringing the
regulatory arrangements of these entities into line with those of private sector competitors is important.
Strengthening the transparency of state procurement activity and enhancing the public-private partnership
(PPP) environment are also priorities. The private sector could play a greater role through a well-crafted
PPP environment through (i) removing duplication of laws due to overlapping jurisdiction; (ii) introducing
stronger provisions in both laws related to transparency, record of procurement proceedings, procedural
safeguards for the use of registers of suppliers/contractors, and the requirement to publish a notice of award
(iii) clarifying dispute resolution mechanisms available through the PPP Law and those designated by the
PPP Central Unit and (iv) increasing the technical and physical capacity of the Central PPP Unit.
237. Opening up markets not only means improving the trade regime but also the regime that governs
foreign direct investments (FDI). Egypt has not been able to attract much FDI beyond the oil and gas sector.
In 2018 net FDI inflows amounted to 2.7 percent of GDP, slightly down from net inflows of 3.1 percent of
GDP in 2017. These inflows as a share of GDP are similar to those of Morocco, Thailand, and Turkey, but
less than half of those of Vietnam. To improve chances of attracting more FDI, the government may want
to reform policies that restrict FDI in services to pave the way for greater freedom of movement of services
providers (as done in Morocco) and better governance (as in Turkey and Jordan).
238. Pathway 3: Advancing economic inclusion and strengthening household resilience represents the
most direct route to reducing poverty and gender inequality and is a third priority area. This is an area where
a number of beneficial policies have already been introduced to support vulnerable workers and women.
As most employment growth will likely take place within the informal sector in the near term, reducing
constraints to productivity of microenterprises and protecting informal workers will be important, especially
as the economy recovers from the pandemic crisis. For women, additional constraints to employment from
factors such as care responsibilities will need to be addressed as well. Policy attention will also be needed
to help build households’ resilience against shocks, especially among the poor and vulnerable.
49 Advanced cognitive skills are skills such as complex problem-solving, and socio-behavioral skills such as teamwork. Skills
predictive of adaptability are, for example, reasoning and self-efficacy.

87
239. Addressing informality is important for economic inclusion. The analysis presented in Chapters 2
and 4 suggests that in Egypt, informal sector firms are mainly subsistence entrepreneurs who have a low
probability of growing and entering the formal sector. For this sector, more equitable public policies and
programs to foster greater inclusion are needed. However, it must be emphasized that informality is also an
outcome of the lack of dynamism and fair competition in the economy. Addressing these constraints to
openness will also go a long way towards addressing informality.
240. Pathway 4: Last but not least, promoting resilient, efficient, and sustainable natural resource use
is vital because Egypt is using its natural resource endowments in unsustainable ways—with particularly
negative effects on the agricultural sector, an important source of employment and food security. Population
pressure and weak policies are leading to rapid territorial development that needs better policy planning
and resource allocation. Ensuring that public spending responds to spatial gaps in productive infrastructure
investment could also help address constraints to sustainable development that is both resilient and efficient.
7.2.2 Enablers for a new growth model
241. These pathways require modernizing the state to ensure that it becomes a guardian of the
environment in order to safeguard the wealth and well-being of future generations. They also require better
investments in the human capital of current and future generations, with a focus on complementing rather
than crowding out private sector activity and achieving higher returns. To effect these changes, Egypt
requires a nimble, modern, and responsive state—one that is best served by fostering diverse and frequent
channels of communication and feedback with its citizens, communities, and markets. Such a system would
also serve Egypt well to cope with shocks in the future.
242. Digital transformation can be a key enabler for the new growth model. Several of the issues
highlighted in this SCD Update can be partially addressed with the increased adoption and use of digital
technologies. Digital technologies can provide opportunities to increase the productivity and improve
market access of the private sector, increase the efficiency of public expenditures, enhance the cost-
effectiveness of public services, and provide citizens and businesses a platform for voice and the means to
hold government accountable.
243. Recent evidence suggests that reaching the goal of universal and affordable internet coverage can
raise growth per capita by 2 percentage points per year and reduce the poverty headcount by 1 percentage
point per year. When internet coverage is complemented by human capital investments, growth per capita
increases by approximately 5 percentage points and the poverty headcount falls by 2.5 percentage points
per year. These contributions to growth are mainly due to growth in productivity across economic sectors;
digital transformation is thus part and parcel of economic transformation (Choi, Dutz, and Usman 2019).
244. The introduction of digital systems can also have a transformative effect on government. It is
estimated that developing countries could collectively save 0.9 to 1.1 percent of GDP, equivalent to US$220
billion to US$330 billion annually (IMF 2017), by introducing digital systems in government that increase
efficiency and reduce the potential for leakages to occur. Additionally, significant effectiveness gains can
be realized by equipping government officials responsible for public service delivery with access to better
data and tools.
245. Digital technology can improve access to new markets and create new ones. Online and social
media platforms offer new markets and reduce the distance between producer and buyer. Innovative
business models such as the sharing economy are disrupting established ways of doing business and creating
markets.
246. But identifying reform areas and enabling factors is only one element of the transformation that
Egypt needs. The other is reaching a consensus among national stakeholders on the rationale, measures,
and implications of reforms in order to build support for the needed change. The feasibility of implementing
the proposed package of reform measures described below will rest on engaging with private sector

88
stakeholders—including micro, small, and medium-size enterprises, members of civil society, workers, and
grassroots organizations.
7.3 Policy Recommendations by Priority Areas
7.3.1 Policy areas for Pathway 1: Improve public sector spending efficiency and strengthen
macroeconomic resilience.
247. Three constraints reduce the returns to public spending on infrastructure, education, and health.
First, capital accumulation, which is led by the public sector, is increasingly less efficient. There are
infrastructure needs. Gaps remain in connectivity to water and sanitation infrastructure outside of urban
areas, and public investment in social sector infrastructure has declined, failing to keep pace with population
growth. Second, public spending on education is only weakly linked to quality or learning outcomes. Third,
public spending on health is low—especially with regard to achieve universal health coverage, responding
to the pandemic, and delivering the COVID-19 vaccine.
248. Well-targeted public spending could add to the capital stock and crowd in private investments.
Using scarce public resources to lower the cost of doing business could help boost firm growth. The
following policy recommendations address ways in which the efficiency of public spending and service
delivery could be improved:
• Enhance the transparency of public spending by improving the range of reporting on budget
expenditures and public sector debt, and supplementing this with regular reports on the performance and
position of SOEs and Economic Authorities. The budget reports should progressively introduce
performance information and the annual reports should be subject to an audit which is made available to
the public.
• Review public investment management (PIM) system for a more systematic approach to developing
project pipelines and managing a project cycle to improve the allocation of public investment funds, both
on-budget and off-budget. This could include: (i) performing robust economic appraisal of capital
investment project proposals (cost-benefit analysis for all high value projects and cost-effectiveness
analysis for lower value projects, possibly coupled with other appraisal methods); (ii) rationalizing project
portfolio, particularly for projects funded from the government budget (including cancelling poorly
performing projects) to create fiscal space for new high-priority projects; (iii) facilitating a dialogue
between core central agencies on whether public investments should be implemented as on-budget capital
projects, as public-private partnerships, or by SOEs or Economic Authorities (which typically involves
sovereign guarantees); and (iv) putting in place an effective monitoring system for implementation of
capital projects.
• Increase education spending and improve its efficiency in improving learning outcomes continuing
the education sector reforms underway. As part of this it will be important to reform budgeting and budget
management for education expenditures to include medium- and long-term budget plans. Additional
measures could include making capital spending decisions based on supply and demand and equity
considerations.
• Increase public health spending and efficiency, and direct it toward general health services, as well
as the construction of new primary health care facilities to support universal health care and roll out of
universal health insurance. Measures could include: (i) evaluating all public investments in new public
hospitals, primary health care units, new technologies, and new procedures for need, efficacy, cost-
effectiveness, and affordability; (ii) aligning public health plans and spending priorities with resource
allocations at the governorate level; (iii) targeting public subsidies in the health sector to poor and
vulnerable households as the comprehensive health insurance (universal health insurance) scheme is rolled
out; and (iv) doubling vaccination capacity to reach high-priority population groups (reaching 70 percent
of the population with the vaccine is estimated to cost about 0.14 percent of GDP).
89
249. High overall fiscal deficits threaten macroeconomic resilience. Interest payments take up 39 percent
of total expenditures, and tax revenues remain low, at 13.8 percent of GDP. To achieve macroeconomic
resilience, the following actions will be needed:
• Maintain macroeconomic stabilization achieved by reforms begun in 2016–17 and avoid policy
slippage and reversals. Resuming the fiscal consolidation after the COVID-19 crisis, notably through
revenue mobilization, will be crucial for creating the space to finance physical and human capital.
• Advance a macroeconomic policy framework supportive of an open and export-oriented trade
regime. A sound macroeconomic policy facilitates stable relative prices, which encourage long-term
planning and private investment. Fine-tuning macroeconomic policies to respond to terms of trade shocks
more quickly would spur the robust recovery of private investment. Fiscal discipline and high public
savings would allow Egypt to manage its exchange rate better.
7.3.2 Policy areas for Pathway 2: Boost private sector investment, firm growth and
productivity
250. Private sector investment is low, firm growth is slow, and firm-level productivity is stagnant. The
oversized presence of state-owned civilian and non-civilian enterprises discourages private investors. A
complex and costly regulatory regime (which well-connected firms can circumvent) compounds
uncertainty. Firms linked to the state can avoid the regulatory labyrinth, gain access to land, and obtain
exemptions from taxes and other state-imposed costs; they also have access to government coffers, aid, and
special deals (World Bank 2020c). For the private sector to invest, grow, and create jobs, the state will have
to redefine the role it plays in the economy.
251. The following reforms would help make the private sector more dynamic:
• To promote consistency in the application of the law and increasing predictability for court users,
a dedicated system for commercial cases can make a big difference in the effectiveness of the judiciary,
add predictability of the business environment and speed to resolving business disputes. Judges in such
courts develop expertise in their field, which may support faster and more qualitative dispute resolution.
Having specialized commercial courts or divisions reduces the number of cases pending before the main
first-instance court and thus can lead to shorter resolution times within the main trial court.
• To reduce business uncertainty make the following aspects of the Tharaa fund clear and
transparent: (i) its structure, including its objectives, fiscal treatment, and whether it is separate from the
country’s international reserves; (ii) its governance, including the roles of the government and the fund’s
managers and whether the fund follows guidelines for corporate responsibility and ethical investment
behavior; (iii) its accountability and transparency in its investment strategy, investment activities, reporting,
and audits; and (iv) its behavior in managing its portfolio, including the use of leverage and derivatives.
• To address the resulting conflicts of interest between the state’s role as sector policy
maker/regulator and SOE owner create a separate entity, not line ministries, oversee SOEs, particularly
relevant to the ICT and banking sectors.
• To ensure that SOEs face the same conditions private firms do, consider taking the following
actions: (i) Establish the tools to clearly identify the commercial and noncommercial activities of SOEs and
look to finance the SOEs for their non-commercial obligations. In addition to the transparency steps
mentioned in pathway 1, SOE and Economic Authority oversight should focus on the overall financial
performance of the entity and hold the Board and management accountable for the performance achieved;
(ii) foster regulatory neutrality by limiting exclusions and exemptions from the competition law and other
economywide and sectoral regulation; (iii) reduce tax exemptions or exceptions granted to public agencies
and special funds; (iv) strengthen debt neutrality rules to restrict public entities from accessing financing
sources at preferential rates; and (v) reduce the distortions to competition of subsidies/state aid through
90
clear rules on subsidy design that are proportionate to the market failure they address and limit
discriminatory treatment.
• To improve corporate governance and transparency, strengthen the legal framework of SOEs.
Legal reforms could first be applied to Law 203, which governs a large number of commercial SOEs. An
overarching state ownership policy could complement legal reforms and improve the SOE governance
framework. That policy should: (i) lay out the rationale and strategic objectives of state ownership; (ii)
define the role of the state in the governance of SOEs; (iii) assign roles and responsibilities across
government agencies; (iv) specify policy tools to be used for implementation; and (v) monitor progress and
evaluate results to inform regular policy reviews.
252. To export more successfully, Egypt will have to develop a less restrictive business environment for
FDI, lower tariffs, and reduce distortions and restrictions on exports. Opening up Egypt’s relatively closed
markets calls for actions on tariffs, nontariff measures, and transparency:
• As an initial step, to reduce the most extreme distortionary effects of high MFN rates, extensive
tariff preferences, and the bias against exports, lower the maximum tariff rate to 40 percent. Given the
small share of products subject to duties of more than 40 percent in total imports, the impact on revenues
would be insignificant, but the boost to trade could be noticeable.
• To establish transparency and streamline nontariff measures use a regulatory guillotine approach
by: (i) compiling all regulations governing both imports and exports (preferably through an online registry)
for transparency; (ii) determining whether the public policy objectives these measures seek are achieved,
and eliminating measures that are redundant or hinder export competitiveness or domestic competition; and
(iii) ensuring a transparent, risk based, and streamlined implementation process, which would necessitate
less interference and duplication of activities by different ministries and agencies involved in trade.
253. The following measures can improve competition and support better geographic integration:
• To ensure free and fair domestic competition by: (i) create a transparent, predictable, and
streamlined regulatory environment that encourages competition through easy firm entry, operation, and
exit; and (ii) establish a level playing field on which all firms, public and private, play by the same rules,
and private investment enters sectors currently dominated by the public sector.
• To promote better connectivity across Egypt, particularly between Upper Egypt and port locations,
enabling private participation in infrastructure (as discussed in World Bank 2018b), should facilitate this
connectivity. Improving connectivity would facilitate agricultural exports and reduce losses from potential
agricultural exports that cannot reach markets. Additional action items could include reviewing and
reforming laws and regulations governing the transport sector.
7.3.3 Policy areas for Pathway 3: Enhance economic inclusion and strengthen households’
resilience
254. Besides increasing opportunities for good-quality employment via reforms to boost private sector
dynamism, three related sets of constraints need to be tackled. Tackling these constraints will enable
workers to better adapt to labor market shifts arising from structural changes or economic shocks. First, the
labor market does not appear to function as an integrated market. The geographic segmentation of
employment opportunities means that workers who live far from Cairo or Alexandria have reduced
employment opportunities. In addition, the productivity of the informal sector is low. This sector has borne
the brunt of the pandemic crisis, suffering the large majority of employment losses. Social insurance does
not cover informal workers, including agricultural workers, even though the social insurance law aims to
do so. Second, women’s participation has been constrained by the rising share of occupations requiring
manual and physical tasks and a declining share of occupations requiring tasks more conducive to female
work (such as those in the public sector). In addition to these demand-side challenges, gender norms about
female work outside the home and care responsibilities constrain women’s employment.

91
255. The following actions could enhance economic inclusion:
• To reduce geographic market segmentation design and implement policies that lower job search
costs. Promising policy interventions could include active labor market programs that provide training in
skills demanded by the private sector and facilitate information sharing on job openings. The creation of
digital platform–based job boards such as Shaghalni and Wuzzuf, which feature low-skilled jobs, are
promising private sector options that facilitate job search.
• Focus on the informal sector productivity. A study from Togo shows the significant impact of
personal initiative training on sales and profits among microentrepreneurs (Campos and others 2017). A
combination of providing income generating assets and skills training (targeted to women) has also been
found to be effective in helping poor entrepreneurs escape poverty in Bangladesh (Bandiera and others
2017). Rotating credit and savings associations (ROSCAs) could be leveraged to broaden access to finance.
• Use digital technologies to improve the delivery of financial services and make the financial sector
broader, more efficient, and more inclusive. Payments, transfers, savings, credit, insurance, securities,
financial planning, and account statements can be delivered via digital/electronic technology such as e-
money, payment cards, and regular bank accounts.
• Continue reforms to contributory pensions and social insurance system and increase participation
by informal workers. The 2019 Social Security and Pension bill helped advance the sustainability, fairness,
and incentives of the pension system. Nevertheless, there is significant scope to better tailor the pension
system to the current and emerging economic, demographic, and labor market shifts, including to the rising
importance of self-employment and informal work. Measures to increase take-up by casual and seasonal
workers include raising awareness about these schemes and providing incentives for participation. Creation
of a unified national registry would reduce documentation needs and would also facilitate greater
participation by informal workers.
• Invest in early childhood care and education for children 0–6 and consider legal reforms as part
of a broader reform effort to enable women to participate in the labor market. A number of measures can
help expand access to quality nurseries and kindergartens (pre-school): Reviewing and simplifying
licensing procedures and establishing quality assurance and accreditation system for nurseries; increasing
spending on kindergartens to improve access and quality. Redefinition at both the firm and societal level of
notions of gender and work is also needed. Suggested efforts at the firm level include tracking gender
diversity across job roles as well as acknowledging and tackling societal and institutional biases and barriers
to inclusivity. Suggested efforts at the societal level include interventions targeting attitude change to create
a fairer contract between employees and employers regardless of gender. With regards to the law, analysis
from the Women, Business and the Law 2021, suggests several areas where reforms could enhance
Egyptian women’s work and earning opportunities, including mandating equal remuneration for work of
equal value and removing restriction to women’s work at night or in jobs deemed dangerous for women.
Enforcing the legislation protecting women from violence and harassment in public spaces (including
transport facilities, and the workspace) would also help induce women to take up employment
opportunities. Other measures include informing the public about this law and supporting the expansion of
the Safe City initiative.
256. The third constraint to making progress under this pathway is related to households’ resilience in
the face of any type of shocks they may face. Functioning credit markets and social protection programs
help households cope with shocks and smooth consumption without having to cut spending on health or
children’s education. Egypt has been shifting public spending from regressive universal energy subsidies
toward more efficient targeted programs. The government introduced the targeted cash transfer programs,
Takaful and Karama, in 2015 to cushion the most vulnerable groups from the impact of those reforms. The
non-contributory social pension scheme (Daman) is being dissolved and merged with TKP and will be
using its targeting formula.

92
257. To strengthen social protection, the government needs to craft a comprehensive, multisectoral
strategy; conduct a comprehensive review of different types of subsidies; and assess the gradual transition
from in-kind subsides to cash, including its fiscal implications. Specific actions include the following:
• Strengthen the institutional system to implement the new cash transfer law, which puts all cash
transfer programs under a single umbrella. The government is moving in this direction as it leverages the
database of TKP beneficiaries and TKP applicants who did not qualify for the program to launch cash
distribution plus interventions that tackle multiple dimensions of poverty and vulnerability (such as the
need for housing, family planning, and child health and nutrition). Upgrading the management information
system infrastructure of the Ministry of Social Solidarity and building a social registry of the poor will also
help.
• Continue developing the unified national registry, including connecting existing databases through
the unique identification number, to improve targeting and promote integration. The Administrative
Control Authority has made progress in establishing a unified national registry, connecting more than 50
databases. The registry database is being used to better target food subsidies and roll out health insurance
plan, among other interventions. The registry can also help facilitate the delivery of cash transfers and social
insurance for informal sector workers. The registry of irregular workers introduced by the Ministry of
Manpower offers a promising start to reaching these workers.
7.3.4 Policy areas for Pathway 4: Promote resilient, efficient, and sustainability of natural
resource use
258. Agriculture is an important sector for the poor. The sustainability and efficiency of this sector are,
therefore, critical to reducing poverty. This sector is also critical for ensuring food security and realizing
export potential. Several actions could help improve the productivity and sustainability of the sector (World
Bank 2018b):
• Identify cross-sectoral growth opportunities presented by the broader agri-food system in Egypt
and promote local value addition. Priority reforms to help upgrade the sector’s productivity rest on six
pillars: land, labor, connectivity, quality of output, access to finance, and value chain (see Alnashar,
Elashmawy, and Youssef 2020). Thus, it will be crucial to focus on the following reforms: (i) addressing
land fragmentation which hinders production efficiency and limits small farmers ability to access markets,
in addition to expanding reclaimable land, adequate water resources and facilitating land registration and
titling; (ii) investing in upgrading the capacity and the skills of farmers, including through access to
knowledge and information; (iii) enhancing connectivity, storage and logistics to minimize waste (estimated
at 30 percent of the value chain, half of which results from the poor, or lack of access to logistics and
marketing infrastructure); (iv) upgrading the quality of agricultural production through adopting quality
standards and strengthening the food quality certification system; (v) facilitating access to finance through
different sources including through banks and non-bank financial institutions, notably those catering to
micro enterprises and farmers; (vi)developing agricultural value chains through policy interventions along
all its different components, including seeds, chemical inputs, mechanization, output processing, quality
control, marketing and access to credit. Furthermore, streamlining tax and tariff rates and procedures, and
enhancing policy predictability are key to influence agriculture value chains.
• Better manage water demand through appropriate tariff design and awareness measures, and
support efforts to increase the water supply. Improving the financial viability of water supply companies is
key, as is supporting PPP opportunities, given the scale of financing needs and the urgency of improving
water supply management (World Bank 2018b).
259. Despite progress, air pollution levels remain high in Egypt, particularly in densely populated urban
areas. Rapid territorial development also needs to be addressed to support sustainable development. Specific
measures to consider include the following:

93
• Address air pollution by adopting an integrated, multisectoral approach: (i) implement low-
emissions solutions in key emitting sectors; (ii) continue to establish an integrated air quality management
system with a robust system of solid waste management; (iii) improve the evidence base on emissions (by
sector and health impacts) and disseminate this information; (iv) complement the construction of mass
transit systems with transit-oriented development, the right kind of feeder systems, and public awareness
campaigns.
• Address challenges posed by territorial development and access to land by the following actions:
(i) empower local governments by reforming local planning processes and prioritizing local services and
infrastructure and enhancing asset management and local government operations and maintenance
capabilities; (ii) promote the sustainable expansion of cities, and halt informal expansion and low-density
leapfrog development; (iii) modernize Egypt’s land registration system; and (iv) address the mismatch
between land demand and supply by ensuring better coordination by and synergy between the different land
custody agencies during the process of allocating state land to each agency.
7.3.5 Policies to enhance citizen engagement and data transparency across all pathways
260. Stronger engagement by citizens and firms would help improve the design and implementation of
policy priorities in each pathway. This engagement would include informing citizens, soliciting inputs, and
using evidence-based methods to assess impact of proposed policies. Egypt could strengthen citizen
engagement by publishing draft regulations, conducting public consultations, conducting impact
assessments, and reporting back on consultation results (Mahmood and Slimane 2018).
261. The growing use of digital technologies, including mobile connectivity and the internet, offers new
opportunities to institute a range of scalable feedback mechanisms that are far speedier, and probably less
costly, than traditional approaches. Rapid, more granular, feedback can help in the early design phases as
well as in the reform of legacy systems where major redesign may be costly. Bottlenecks can be alleviated,
and accountability improved, often without the need to fully replace the system. Some nongovernmental
organizations have pioneered efforts to build on digital technology to strengthen citizen feedback and many
governments have taken steps to incorporate the use of digital technology, including payments, into service
delivery. However, few government programs have yet harnessed the potential of the vast amount of
information generated by digital systems to assess service quality and empower citizens.
262. The pandemic has underscored the importance of a transparent and robust system of data collection
and sharing. A coordinated system within the government is needed to collect and disseminate data and
information. A 2015 assessment of Egypt’s national statistical system conducted by the PARIS21, the
United Nations Economic Commission for Africa (UNECA), the United Nations Economic and Social
Commission for Western Asia (UNESCWA), and the African Development Bank identified the need to
update the statistical law. The government has recently prepared a National Strategy for the Development
of Statistics (NSDS) which can pave the way for a modernized system of data and statistics. Another
important step toward increasing data transparency would be building a digitally enabled system of
information and data sharing and access (World Bank 2020b). Egypt could strengthen its Open Data
initiative,50 which aims to make data digitally and publicly available.
50 Open_Gov_Data_initiative; CAPMAS manages the Egypt Open Data Portal.

94
References
Abdel Latif Wahba, T. El-T. 2020. “Egypt Suspends State-Company Stake Sales Due to Virus Turmoil.”
Bloomberg Quint, June 29, https://www.bloombergquint.com/politics/egypt-suspends-state-
company-stakesales-due-to-virus-turmoil
Abdelraouf, N., H. El-Abbadi, D. Noureldin. 2019. “Inflation Dynamics in Egypt: Structural
Determinants versus Transitory Shocks.” Egyptian Center for Economic Studies Working
Paper 201. Cairo, Egypt.
Aboulnaga, A., I. Siddik, W. Megahed, E. Salah, S. Ahmed, R. Nageeb, M. Abdelzaher. 2017. “Small-
Scale Farming in the Middle East and North Africa Region: Egypt.” Cairo: Food and
Agriculture Organization of the United Nations.
Abul-Magd, Z, İ. Akça, and S. Marshall. 2020. “Two Paths to Dominance: Military Businesses in Turkey
and Egypt.” Carnegie Endowment for International Peace.
https://doi.org/10.2307/resrep24917.1.
Ackerberg D., L. Benkard, S. Berry, and A. Pakes. 2007. “Econometric Tools for Analyzing Market
Outcomes.” In The Handbook of Econometrics, Vol. 6A, edited by J. Heckman and E.
Learner, 4171–276. Amsterdam: North-Holland.
Ackerberg, D., K. Caves, and G. Frazer. 2015. “Identification Properties of Recent Production Function
Estimators.” Econometrica 83 (6, November): 2411–51.
Adly, A. 2020. Cleft Capitalism: The Social Origins of Failed Market Making in Egypt. Stanford, CA:
Stanford University Press.
Aharoni, Y. 2018. “The Evolution of State-Owned Multinational Enterprise Theory.” In: Cuervo-
Cazurra, A. (eds) State-Owned Multinationals. JIBS Special Collections. Palgrave
Macmillan, Cham. https://doi.org/10.1007/978-3-319-51715-5_2
Alazzawi, S. and V. Hlasny. 2020. “Disparities in Cost of Living Changes After a Large-Scale
Devaluation: The Case of Egypt 2016.” Economic Research Forum Working Paper Series.
Cairo, Egypt.
Alnashar, S., F. Elashmawy, and J. Youssef. 2020. Egypt Economic Monitor : From Crisis to Economic
Transformation - Unlocking Egypt’s Productivity and Job-Creation Potential (English).
Washington, DC: World Bank. © World Bank.
Alternative Policy Solutions. 2019. Water Management in Egypt. American University at Cairo.
Alvaredo, F., L. Assouad, and T. Piketty. 2019. "Measuring lnequality in the Middle East 1990–2016:
The World’s Most Unequal Region?" Review of Income and Wealth (International
Association for Research in Income and Wealth) 65 (No.4): 685-711.
Amer, M. and M. Atallah. 2019. “The School to Work Transition and Youth: Economic Vulnerability in
Egypt.” Economic Research Forum Working Paper Series. Cairo, Egypt.
Amin-Salem, H., M. El-Maghrabi, I. Osorio Rodarte, and J. Verbeek. 2018. “Sustainable Development
Goal Diagnostics: The Case of Arab Republic of Egypt.” Policy Research Working Paper
8463, Washington, DC: World Bank. © World Bank.
Arezki, R., D. Lederman, A. Abou Harb, N. El-Mallakh, R. Y., Fan, A. Islam, M. Zouaidi. 2020. Middle
East and North Africa Economic Update: How Transparency Can Help The Middle East
and North Africa.. Washington, DC: World Bank. © World Bank.
Assaad, R. 2020. “Prospects for Egypt’s Population and Labor Force: 2000 to 2050.” Economic Research
Forum Working Paper Series. Cairo, Egypt.
https://www.bloombergquint.com/politics/egypt-suspends-state-company-stakesales-due-to-virus-turmoil

95
Assaad, R., A. Alsharawi, and C. Salemi. 2019.“Is the Egyptian Economy Creating Good Jobs? Job
Creation and Economic Vulnerability From 1998 to 2018.” Economic Research Forum
Working Paper Series. Cairo, Egypt.
Assaad, R., C. Krafft, and I. Selwaness. 2017. “The Impact of Marriage on Women’s Employment in the
Middle East and North Africa.” Economic Research Forum Working Paper Series. Cairo,
Egypt.
Assaad, R., C. Krafft, K.W. Rahman, and I. Selwaness. 2019. “Job Creation in Egypt: A Sectoral and
Geographical Analysis Focusing on Private Establishments 1996–2017.” Economic
Research Forum Working Paper Series. Cairo, Egypt.
Assaad, R., C. Krafft, K. W. Rahman, and I. Selwaness. 2019. "Job Creation in Egypt: A Sectoral and
Geographical Analysis Focusing on Private Establishments 1996-2017.” Economics &
Political Science Faculty Scholarship. 106. https://sophia.stkate.edu/economics_fac/106
Atamanov, A., S. Tandon, G. Lopez-Acevedo, and M. Vergara Bahena. 2020. “Measuring Monetary
Poverty in the Middle East and North Africa (MENA) Region: Data Gaps and Different
Options to Address Them.” IZA Discussion Paper No. 13363, Available at
SSRN: https://ssrn.com/abstract=3627065
Ayyagari M., A. Demirgüç-Kunt, V. Maksimovic. 2010. “Formal versus Informal Finance: Evidence
from China.” Review of Financial Studies 23 (10): 3048–97.
Azevedo, J. P., V. Sanfelice, and M.C. Nguyen. 2019. “ADECOMP: Stata Module to Estimate Shapley
Decomposition by Components of a Welfare Measure.”
https://econpapers.repec.org/software/bocbocode/s457562.htm.
Badr, K., R. Rizk, and C. Zaki. 2019. "Firm Productivity and Agglomeration Economies: Evidence from
Egyptian data." Applied Economics 51 (51): 5528-44. doi:10.1080/00036846.2019.1613506.
Bailey, M., C. Hulten, and D. Campbell. 1992. “Productivity Dynamics in Manufacturing Plants.” in
Brookings Papers on Economic Activity: Microeconomics, Vol. 4, edited by M. Bailey and
C. Winston. Washington , DC : Brookings Institute.
Bandiera, O., R. Burgess, N. Das, S. Gulesci, I. Rasul, and M. Sulaiman. 2017. ”Labor Markets and
Poverty in Village Economies.” Quarterly Journal of Economics, 132 (May 2): 811–70.
https://doi.org/10.1093/qje/qjx003.
Banerjee, A., and E. Duflo. 2005. “Growth Theory through the Lens of Development Economics.” In
Handbook of Economic Growth, Volume 1A., 1A, ed. P. Aghion, and S. N. Durlauf, 474–
552.
Baum, A., C. Hackney, P. Medas, and S. Mouhamadou . 2019. “Governance and State-Owned
Enterprises: How Costly Is Corruption?” IMF Working Paper 19/253, International
Monetary Fund, Washington, DC.
https://www.imf.org/en/Publications/WP/Issues/2019/11/22/Governance-and-State-Owned-
Enterprises-How-Costly-is-Corruption-48800.
Bento, P., and D. Restuccia. 2017 “Misallocation, Establishment Size, and Productivity.” American
Economic Journal: Macroeconomics 9 (3): 267–303. JSTOR,
www.jstor.org/stable/26598368.
Blundell, R., and S. Bond. 1998. “Initial Conditions and Moment Restrictions in Dynamic Panel Data
Models.” Journal of Econometrics 87: 115−43.
Campos, F., M. Frese, M. Goldstein, L. Iacovone, H. C. Johnson, D. McKenzie, and M. Mensmann. 2017.
“Teaching Personal Initiative Beats Traditional Training in Boosting Small Business in West
Africa.” Science, 22 (September): 1287–90.

96
CAPMAS, UNFPA and NCW (2015). The Egypt Economic Cost of Gender-based Violence Survey.
https://egypt.unfpa.org/sites/default/files/pub-
pdf/Costs%20of%20the%20impact%20of%20Gender%20Based%20Violence%20%28GBV
%29%20WEB.pdf
Choi, J., M. Dutz, and Z. Usman. 2019. The Future of Work in Africa: Harnessing the Potential of Digital
Technologies for All. Washington, DC: World Bank. © World Bank.
Chun, N. 2019. “Improving Labor Market Matching in Egypt.” Chapter 3 in Understanding Poverty and
Inequality in Egypt, Background Papers, World Bank. 2019. Washington, DC: World Bank.
© World Bank.
Ciani, A., M. Caitriona Hyland, N. Karalashvili, J. L. Keller, A. Ragoussis, and T. Thu Tran. 2020
Making It Big: Why Developing Countries Need More Large Firms. Washington, DC:
World Bank. © World Bank. doi: 10.1596/978-1-4648-1557-7.
Damania, R., S. Desbureaux, M. Hyland, A. Islam, S. Moore, A. Rodella, J. Russ, E. Zaveri. 2017.
Uncharted Waters : The New Economics of Water Scarcity and Variability. Washington,
DC: World Bank. © World Bank.
Damania, R., S. Desbureaux, A. Rodella, J. Russ, and E. Zaveri. 2019. Quality Unknown : The Invisible
Water Crisis. Washington, DC: World Bank. © World Bank.
D’Erasmo, P.N., and H. J. Moscoso Boedo. 2012. “Financial Structure, Informality and Development.”
Journal of Monetary Economics 59 (3): 286–302.
Datt, G., and M. Ravallion. 2011. "Has India’s Economic Growth Become More Pro-Poor in the Wake of
Economic Reforms?" World Bank Economic Review 1-33, Washington, DC: World Bank. ©
World Bank.
Davidson, R., and J. MacKinnon. 2004. Econometric Theory and Methods. Oxford University Press.
De Loecker, J., and A. Collard-Wexler. 2015. “Reallocation and Technology: Evidence from the US Steel
Industry.” American Economic Review 105 (1, January): 131–71.
De Loecker, J., and F. Warzynski. 2012. “Markups and Firm-Level Export Status.” American Economic
Review 102 (6, October): 2437−71.
De Loecker, J., and P. T. Scott. 2016. “Estimating Market Power. Evidence from the US Brewing
Industry.” NBER Working Paper 22957, National Bureau of Economic Research,
Cambridge, MA.
De Loecker, J., J. Van Biesebroeck, and J. Fuss. 2016. “International Competition and Firm-Level
Adjustment in Markups and Production Efficiency.” Working paper.
De Loecker, J., P. Goldberg, A. Khandelwal, and N. Pavcnik. 2016. “Prices, Markups, and Trade
Reform.” Econometrica 84 (2): 445–510.
De Loecker. J. 2011 “Product Differentiation, Multi-Product Firms and Estimating the Impact of Trade
Liberalization on Productivity.” Econometrica 79(5, September): 1407–51.
Dharwadkar, R., G. George, and P. Brandes. 2000. “Privatization in Emerging Economies: An Agency
Theory Perspective.” Academy of Management Review, 25(3): 650-69.
Diwan I., P. Keefer, and M. Schiffbauer. 2015. “Pyramid Capitalism: Political Connections, Regulation,
and Firm Productivity in Egypt.” World Bank Policy Research Working Paper No. 7354
Diwan, I., P. Keefer, and M. Schiffbauer. 2019. “The Mechanics, Growth Implications, and Political
Economy of Crony Capitalism in Egypt.” Crony Capitalism in the Middle East: Business
and Politics from Liberalization to the Arab Spring: 67.

97
Djankov, S. R. La Porta, F. Lopez-de-Silanes, and A. Shleifer. 2002. “The Regulation of Entry.”
Quarterly Journal of Economics, 117 (1 February): 1–37,
https://doi.org/10.1162/003355302753399436.
Eibl, F. and A. Malik. 2016. “The Politics of Partial Liberalization: Cronyism and Non-Tari Protection in
Mubarak's Egypt.” Center for Study of African Economies, Working Paper WPS/2016-27.
El Kogali, S. and C. Krafft. 2015. Expanding Opportunities for the Next Generation: Early Childhood
Development in the Middle East and North Africa. Washington, DC: World Bank.
El Laithy, H. and D. Armanious. 2019. “Middle Class in Egypt: Size, Trends and Profile.” Chapter 2 in
Understanding Poverty and Inequality in Egypt, Background Papers, World Bank. 2019.
Washington, DC: World Bank. © World Bank.
Elsayed, A., and J. Wahba. 2019. "Political change and informality: Evidence from the Arab Spring."
Economics of Transition and Institutional Change 27 (1): 31–66. doi:10.1111/ecot.12198.
Estrin, S., K. E. Meyer, , B. B. Nielsen, and S. Nielsen. 2015. “Home Country Institutions and the
Internationalization of State-Owned Enterprises: A Cross-country Analysis.” Journal of
World Business, 51 (2): 294-307. https://doi.org/10.1016/j.jwb.2015.11.002.
Foster, L., J. Haltiwanger, and C. Krizan, C. 2001. “New Developments in Productivity Analysis.” in
Aggregate Productivity Growth: Lessons from Microeconomic Evidence , edited by E. Dean,
M. Harper, and C. Hulten. Chicago , Ill.: University of Chicago Press.
Foster, L., J. Haltiwanger, and C. Syverson. 2008. “Reallocation, Firm Turnover, and Efficiency:
Selection on Productivity or Profitability?” American Economic Review 98 (1): 394−425.
Foster, L., J. Haltiwanger, and C. Syverson. 2016. “The Slow Growth of New Plants: Learning about
Demand.” Economica 83 (3289): 91−129.
Furceri, D., S.A. Hannan, J.D. Ostry, and A.K. Rose. 2018. “Macroeconomic Consequences of Tariffs.”
NBER Working Paper 25402, National Bureau of Economic Research, Cambridge, MA.
Gollin, D. 2002. "Getting Income Shares Right." Journal of Political Economy 110(2): 458-474.
Gonzales, C., S. Jain-Chandra, K. Kochhar, and M. Newiak. 2015. “Fair Play: More Equal Laws Boost
Female Labor Force Participation” IMF Staff Discussion Note.
Griliches, Z. and H. Regev. 1995. “Firm Productivity in Israeli Industry: 1977–1988.” Journal of
Econometrics 65: 175–203.
Hallegatte, S., A. Vogt-Schilb, M. Bangalore, J. Rozenberg. 2017.“Unbreakable: Building the Resilience
of the Poor in the Face of Natural Disasters.” Climate Change and Development,
Washington, DC: World Bank. © World Bank.
Hanushek, Eric A., L. Woessmann. 2008. “The Role of Cognitive Skills in Economic Development.”
Journal of Economic Literature, 46 (3): 607-68.
Haughton, J., and S.R. Khandker. 2009. Handbook on Poverty and Inequality. Washington, DC: World
Bank. © World Bank.
Heckman, J. J., and D. V. Masterov. 2007. “The Productivity Argument for Investing in Young
Children.” Applied Economic Perspectives and Policy 29 (3): 446–93.
Helmy, I., and R. Roushdy. 2019. “Household Vulnerability and Resilience to Shocks in Egypt.”
Working Paper Series No. 1362. Economic Research Forum Working Paper Series.
Herrera, S.; A. Ouedraogo. 2018. “Efficiency of Public Spending in Education, Health, and Infrastructure:
An International Benchmarking Exercise.” The World Bank Policy Research working paper
no. WPS 8586, Washington, DC: World Bank. © World Bank.

98
Hsieh, C.-T., and P. J. Klenow. 2009. “Misallocation and Manufacturing TFP in China and India.”
Quarterly Journal of Economics 124 (4 November): 1403–48.
Hsieh, C.-T., and P. J. Klenow. 2014. “The Life Cycle of Plants in India and Mexico.” Quarterly Journal
of Economics 129 (3 August): 1035–84.
International Monetary Fund. 2017. Digital Revolutions in Public Finance. Washington, DC:
International Monetary Fund.
Jambeck, J.R., A. Andrady, R. Geyer, R. Narayan, M. Perryman, T. Siegler, C. Wilcox, K. Lavender Law.
2015. “Plastic Waste Inputs from Land into the Ocean.” Science 347: 768-71.
Karagiannis, G. and S. Paleologou. 2018. “Exploring the Covariate Term in the Olley-Pakes productivity
decomposition.” In W.H. Greene and others (eds.), Productivity and Inequality, Springer
Proceedings in Business and Economics.
Katayama, H., S. Liu, and J. Tybout. 2009. “Why Plant-Level Productivity Studies Are Often Misleading,
and an Alternative Approach to Inference.” International Journal of Industrial Organisation
27 (3): 403−13.
Kaza, S., L. Yao, P. Bhada-Tata, F. Van Woerden. 2018. “What a Waste 2.0 : A Global Snapshot of Solid
Waste Management to 2050.” Urban Development, Washington, DC: World Bank. © World
Bank. https://openknowledge.worldbank.org/handle/10986/30317.
Khalifa, M.A. 2015. “Evolution of Informal Settlements Upgrading Strategies in Egypt: From Negligence
to Participatory Development.” Ain Shams Engineering Journal 6: 1151–9.
Klette, T. J., and Z. Griliches. 1996. “The Inconsistency of Common Scale Estimators When Output
Prices Are Unobserved and Endogenous.” Journal of Applied Econometrics 11 (4): 343−61.
Krafft, C. 2018. “Is School the Best Route to Skills? Returns to Vocational School and Vocational Skills
in Egypt.” Journal of Development Studies, 54(7): 1100-20.
doi:10.1080/00220388.2017.1329524
Krafft, C., K.W. Rahman, and I. Selwaness. 2019. “Job Creation in Egypt: A Sectoral and Geographical
Analysis Focusing on Private Establishments 1996–2017.” Economic Research Forum
Working Paper Series. Cairo, Egypt.https://erf.org.eg/app/uploads/2019/12/Policy-Paper-
December-2019.pdf.
Krafft, C., R. Assaad, and K.W. Rahman. 2019. “Introducing the Egypt Labor Market Panel Survey
2018.” Economic Research Forum Working Paper Series. Cairo, Egypt.
Krafft, C., R. Assaad, K.W. Rahman, and M. Cumanzala. 2020. “How Do Small Formal and Informal
Firms in the Arab Republic of Egypt Compare ?” Policy Research WPS 9423, World Bank,
Washington, DC. http://documents.worldbank.org/curated/en/324411601923707684/How-
Do-Small-Formal-and-Informal-Firms-in-the-Arab-Republic-of-Egypt-Compare.
Krafft, C., R. Assaad, K.W. Rahman, M. Cumanzala. 2020. “How Do Small Formal and Informal Firms
in the Arab Republic of Egypt Compare?.” Policy Research Working Paper; No. 9423.
Washington, DC: World Bank. © World Bank.
https://openknowledge.worldbank.org/handle/10986/34594
Kumar, K. B., R. G. Rajan, and L. Zingales. 2001. “What Determines Firm Size?.” Technical Report,
University of Southern California.
Langot, F., and S. Yassin. 2015. “Reforming Employment Protection in Egypt: An Evaluation Based on
Transition Models with Measurement Errors.” Economic Research Forum Working Paper
Series. Cairo, Egypt.
Lara Ibarra, G. 2019. “Poverty Profile and Trends: Evidence from Recent Household Surveys.” Chapter 1
in Understanding Poverty and Inequality in Egypt, Background Papers, World Bank. 2019.
Washington, DC: World Bank. © World Bank.

99
Lazzarini, S. G. and A. Musacchio. 2018. “State Ownership Reinvented? Explaining Performance
Differences between State‐Owned and Private Firms.” Corporate Governance: An
International Review, 26 (July 4): 255-72, http://dx.doi.org/10.1111/corg.12239.
Lederman, D., J. Messina, S. Pienknagura, and J. Rigolini. 2014. “Latin American Entrepreneurs: Many
Firms but Little Innovation.” World Bank Latin American and Caribbean Studies;
Washington, DC: World Bank. © World Bank.
Levinsohn, J., and A. Petrin. 2003. “Estimating Production Functions Using Inputs to Control for
Unobservables.” Review of Economic Studies 70: 317−40.
Loayza, N., and C. E. Raddatz. 2006. “The Composition of Growth Matters for Poverty Alleviation.”
World Bank Policy Research Working Paper No. 4077.
Mahmood, S.A., and M.A. Slimane. 2018. Privilege-Resistant Policies in the Middle East and North
Africa: Measurement and Operational Implications. Washington, DC: World Bank. ©
World Bank.
Marschack, J. and W. Andrews.1994. “Random simultaneous equations and the theory of production.”
Econometrica 12(3/4):143-205.
McMillan, M., and D. Rodrik. 2011. “Globalization, Structural Change, and Productivity Growth.” NBER
Working Paper 17143. National Bureau of Economic Research. Cambridge, Massachusetts.
Melitz, M., and S. Polanec. 2015. “Dynamic Olley-Pakes Productivity Decomposition with Entry and
Exit.” RAND Journal of Economics 46 (2): 362−75.
Merotto, D., M. Weber, R. Aterido. 2018. “Pathways to Better Jobs in IDA Countries : Findings from
Jobs Diagnostics.” Jobs Series, No. 14. World Bank, Washington, DC. © World Bank.
https://openknowledge.worldbank.org/handle/10986/30594.
Morsy, H., L. Antoine, and C. Sanchez. 2014. “Growing without Changing: A Tale of Egypt’s Weak
Productivity Growth.” European Bank for Reconstruction and Development Working Paper
No. 172.
Nicholls R. and A. Cazenave 2010. “Sea-level Rise and Its Impact on Coastal Zones.” Science. Aug 6;
329 (5992):628
Nin Pratt, A., H. ElDidi, and C. Breisinger. 2018. “Farm Households in Egypt: A Typology for Assessing
Vulnerability to Climate Change.” IFPRI Regional Program Working Paper, International
Food Policy Research Institute, Washington, DC.
OAMDI (Open Access Micro Data Initiative). Various years. Economic Research Forum Working Paper
Series. Cairo, Egypt. http://erf.org.eg/data-portal/.
Olley, S. G., and A. Pakes. 1996. “The Dynamics of Productivity in the Telecommunications Equipment
Industry.” Econometrica 64 (6): 1263−97.
Ordóñez Leal, J.C. 2014. “Tax Collection, the Informal Sector, and Productivity.” Review of Economic
Dynamics, 17 (2), 262–86.
Perez, N. D.; Y. Kassim; C. Ringler; T.S. Thomas; and H. ElDidi. 2021. “Climate Change and Egypt’s
Agriculture.” MENA Policy Note 17. Washington, DC: International Food Policy Research
Institute (IFPRI).
Pavcnik, N. 2002. “Trade Liberalization, Exit, and Productivity Improvement: Evidence from Chilean
Plants.” Review of Economic Studies, 69: 245–76.
Petrin, A., and J. Levinsohn. 2012. “Measuring Aggregate Productivity Growth Using Plant-level Data.”
RAND Journal of Economics, 43: 705–25.
Psacharopoulos, G., and H.A. Patrinos. 2004. “Returns to Investment in Education: A Further Update.”
Education Economics, 12: 111–34. doi:10.1080/0964529042000239140.
100
Rajan, R. G., and L. Zingales. 1998. “Financial Dependence and Growth”. American Economic Review,
88: 559–587.
Ramamurti R. 1986. “Public Entrepreneurs: Who They Are and How They Operate.” California
Management Review, 28 (3):142-58. doi:10.2307/411652077
Ravallion, M., and G. Datt. 1996. “How Important to India's Poor Is the Sectoral Composition of
Economic Growth?” The World Bank Economic Review 10 (1): 1-25.
Restuccia, D., and R. Rogerson. 2008. “Policy Distortions and Aggregate Productivity with
Heterogeneous Establishments.” Review of Economic Dynamics 11 (4), 707–20.
Restuccia, D., and R. Rogerson. 2017. “The Causes and Costs of Misallocation.” Journal of Economic
Perspectives 31 (3): 151–74.
Rodrik, D., M. McMillan, and C. Sepúlveda. 2016. “Overview: Structural Change, Fundamentals, and
Growth.” in M. McMillan, D. Rodrik, and C. Sepúlveda, Structural Change, Fundamentals,
and Growth (pp. 1-38). Washington DC: International Food Policy Research Institute.
Said, M., R. Galal, and M. Sami. 2019. “Inequality and Income Mobility in Egypt.” Economic Research
Forum Working Paper Series. Cairo, Egypt.
Saleh, E. M. 2018. “The Economic Value and Cost Recovery of Water in the Egyptian Irrigated
Agriculture.” Egypt. Journal of Agricultural Research. 96 (2).
Sayigh, Y. 2019. Owners of the Republic: An Anatomy of Egypt’s Military Economy. Carnegie Middle
East Center, https://carnegie-mec.org/2019/11/18/owners-of-republic-anatomy-of-egypt-s-
military-economy-pub-80325.
Selwaness, I., and M. Ehab. 2019. “Social Protection and Vulnerability in Egypt: A gendered Analysis.”
Working Papers No. 1363, Economic Research Forum Working Paper Series. Cairo, Egypt.
Shaked, A., and J. Sutton. 1982. “Relaxing Price Competition through Product Differentiation.” Review of
Economic Studies 49 (1): 3–13.
Sims. 2015. Egypt’s Desert Dreams, Development or Disaster? Cairo: American University in Cairo
Press.
Solow, R.M. 1957. “Technical Change and the Aggregate Production Function.” Review of Economics
and Statistics 39: 312–320.
Stan, C., M. Peng, and G. Bruton. 2014. “Slack and the Performance of State-Owned Enterprises.” Asia
Pacific Journal of Management, 31 (2): 473-95.
https://link.springer.com/article/10.1007%2Fs10490-013-9347-7.
Stiglitz, J.E. 1989. “The Economic Role of the State.” in: A. Heertje (ed), The Economic Role of the State.
London: Basil Blackwell.
Sutton, J. 1991. Sunk Costs and Market Structure: Price Competition, Advertising, and the Evolution of
Concentration. Cambridge, MA: MIT Press.
Syverson, C. 2004. “Market Structure and Productivity: A Concrete Example.” Journal of Political
Economy 112: 1181–222.
Syverson, C. 2011.“What Determines Productivity?.” Journal of Economic Literature 49: 326–65.
Tanzi, V. 1998. “Corruption Around the World: Causes, Consequences, Scope, and Cures.”. IMF
Working Paper No. 98/63, Available at SSRN: https://ssrn.com/abstract=882334
Tihanyi, L., R. V. Aguilera, P. Heugens, M. van Essen, S. Sauerwald, P. Duran, and R. Turturea, 2019.
“State Ownership and Political Connections.” Journal of Management, 45 (6): 2293-321.
https://doi.org/10.1177/0149206318822113
https://carnegie-mec.org/2019/11/18/owners-of-republic-anatomy-of-egypt-s-military-economy-pub-80325

101
Tybout, J. R, 2000.“Manufacturing Firms in Developing Countries: How Well Do They Do, and Why?.”
Journal of Economic Literature 38 (1): 11–44.
United Nations Framework Convention on Climate Change. 2014. The Arab Republic of Egypt: Intended
Nationally Determined Contributions as per United Nation Framework Convention on
Climate Change.
https://www4.unfccc.int/sites/ndcstaging/PublishedDocuments/Egypt%20First/Egyptian%20
INDC.pdf
Van Beveren, I. 2010. “Total Factor Productivity estimation: A practical review.” The Journal of
Economic Surveys, 26(1):98-128.
van der Weide, R., C. Lakner, and E. Ianchovichina. 2016. “Is Inequality Underestimated in Egypt?:
Evidence from House Prices.” World Bank Policy Research Working Paper 7727,
Washington, DC: World Bank. © World Bank.
Verme, P. 2014. “Facts and Perceptions of Inequality.” Chapter 3 in Verme, P., B. Milanovic, S. Al-
Shawarby, S. El Tawila, M. Gadallah, and E. A.El-Majeed. Inside Inequality in the Arab
Republic of Egypt: Facts and Perceptions across People, Time, and Space. World Bank
Studies. Washington, DC: World Bank. doi:10.1596/978-1-4648-0198-3
Wahba, J., and R. A. Assaad. 2017. “Flexible Labor Regulations and Informality in Egypt.” Review of
Development Economics 21 (4): 962–984. https://ssrn.com/abstract=3069179 or http://
dx.doi.org/10.1111/rode.12288.
World Bank Group. 2015. Promoting Poverty Reduction and Shared Prosperity in Egypt: A Systematic
Country Diagnostic. Washington, DC: World Bank. © World Bank.
__________. 2020. Middle East & Northern Africa Agricultural Policy Inventory Country Files: Egypt.
Washington, DC: World Bank. © World Bank.
World Bank. 2002. Arab Republic of Egypt. Poverty Reduction in Egypt, Diagnosis and Strategy, vol. 1.
Report no. 24234-EGT. Washington, DC: World Bank. © World Bank.
__________. 2007. Arab Republic of Egypt. Poverty Assessment Update. Vol. 1. Report no. 39885- EG
Washington, DC: World Bank. © World Bank.
__________. 2011. Arab Republic of Egypt: Poverty in Egypt 2008–09, Withstanding the Global
Economic Crisis. Report no. 60249-EG. Washington, DC: World Bank. © World Bank.
__________. 2014. Arab Republic of Egypt. More Jobs, Better Jobs: A Priority for Egypt. Washington,
DC: World Bank. © World
Bank.http://documents.worldbank.org/curated/en/926831468247461895/Arab-Republic-of-
Egypt-More-jobs-better-jobs-a-priority-for-Egypt .
__________. 2018a. Women's Economic Empowerment Study. Washington, DC: World Bank. © World
Bank. https://openknowledge.worldbank.org/handle/10986/31351 License: CC BY 3.0
IGO.”
__________. 2018b. Expanding Private Investment and Commercial Finance in Egypt's Infrastructure.
Washington, DC: World Bank. © World Bank.
__________. 2019. Understanding Poverty and Inequality in Egypt. Washington, DC: World Bank. ©
World Bank.
__________. 2020a. Arab Republic of Egypt: Development of Air Emissions Accounts – Technical
Report. Washington, DC: World Bank. © World Bank.
__________. 2020b. Egypt Digital Economy Country Assessment. Washington, DC: World Bank. ©
World Bank
102
__________. 2020c. Egypt: Country Private Sector Diagnostic. Washington, DC: World Bank. © World
Bank
__________. 2020d. Egypt Desalination and Wastewater Market Study. Washington, DC: World Bank. ©
World Bank
__________. 2020e. World Development Report 2020: Trading for Development in the Age of Global
Value Chains. Washington, DC: World Bank. © World Bank.
https://openknowledge.worldbank.org/handle/10986/32437 License: CC BY 3.0 IGO.”
__________.2021. Employability and Relevance of Higher Education Graduates. Egypt Higher Education
Policy Notes. Washington, DC: World Bank. © World Bank

103
Annex A: Data Diagnostics for Egypt
At 82.2 percent, the 2019 World Bank’s Statistical Capacity Indicator (SCI) score for Egypt ranks higher
than the average for countries in the MENA region at 53.8 percent.51 The World Bank’s SCI assesses the
capacity of a country’s statistical system using publicly available information and/or country input. The
WB SCI is a composite score assessing the statistical capacity of countries across three dimensions namely:
methodology, source data, and periodicity and timeliness.52 The statistical methodology dimension assesses
countries’ ability to comply with internationally recommended standards and methods, while the source
data dimension assesses whether countries conduct data collection in accordance with internationally
recommended periodicity and whether data from administrative systems are available and reliable for
statistical estimation purposes. Finally, the periodicity and timeliness dimension assess the availability and
periodicity of key socioeconomic indicators. Egypt performs better than MENA countries on all three
dimensions. While Egypt has strong statistical capacity, accessibility of data, particularly with regards to
microdata, remains a challenge.
The Central Agency for Public Mobilization and Statistics (CAPMAS) is tasked as the official data
producer, however, other government entities produce data—such as the Central Bank of Egypt, the
Ministry of Planning and Economic Development, and the Ministry of Finance. The Economic Research
Forum (ERF) also disseminates microdata in collaboration with CAPMAS, and it collects the Egypt Labor
Market Panel Surveys (ELMPS), which spans a period of 20 years, with the most recent round collected in
2018.53
In the case of surveys such as the Economic Census (survey of enterprises) or the Household Income,
Expenditure and Consumption Surveys (HIECS), summary tables of statistics are more likely to be publicly
available (published on CAPMAS website) than the underlying micro-level data that could be used by
researchers and policy analysts. In most such cases, the unit-level (enterprise or household level) data is
only available after access is requested. In a few cases, most notably for the population census data, the
data is not accessible.
Data on macroeconomic indicators are published by the Ministry of Planning and Economic Development,
Central Bank of Egypt, and CAPMAS. The Central Bank and CAPMAS announce inflation data every
month. CAPMAS publishes results from Labor Force Surveys conducted quarterly.
During 2019-2020, CAPMAS led the preparation of Egypt’s first National Strategy for the Development
of Statistics (NSDS). The Strategy is expected to be launched in early 2021.
Data Openness
There are data gaps related to accessibility when data exists in Egypt. The most recent Open data Access
Indicator (ODIN) for 2018-2019 reiterates this finding. The ODIN assesses the coverage and openness of
data available on National Statistics Offices (NSOs) websites (based on 10 dimensions of coverage and
openness). It also makes available both a data coverage subscore and an openness subscore for each country.
With an ODIN coverage subscore of 49 out of 100 and an openness subscore of 30 out of 100, Egypt ranked
64th out of 178 countries in terms of coverage but ranked 136th out of 178 countries in terms of openness in
2018.54 Like many MENA countries, Egypt has lagged in its capacity to make available data accessible,
which could lead to poor policies (Atamanov, Tandon, Lopez-Acevedo, and Vergara Bahena 2020).
51 http://datatopics.worldbank.org/statisticalcapacity/CountryProfile.aspx
52 http://datatopics.worldbank.org/statisticalcapacity/
53 https://erf.org.eg/erf-data-portal/
54 Open Data Watch-Open Data Inventory www.OpenDataWatch.com

104
Improving access to data where it exists in Egypt will significantly close gaps especially relating to data
transparency.
Egypt’s Official Poverty Measurement Methodology Official estimates of poverty and inequality are produced by CAPMAS, which collects a nationally
representative household survey, the HIECS, every two years, and publishes national and regional poverty
rates after each survey round. The public use version of HIECS is released with some lag via the CAPMAS
website (https://www.capmas.gov.eg/) and the data repository maintained by the ERF
(http://www.erfdataportal.com/index.php/catalog). The most recent round, intended to cover the period
2019-2020, was initiated in October 2019. The first phase of the 2019-2020 survey, which consists of a first
interview of all sample households, was completed prior to lockdown measures that were introduced in
March 2020. CAPMAS published poverty estimates based on this phase. In the second phase, CAPMAS
continued to interview sample households, with a focus on responses to COVID-19. The poverty and
inequality estimates and other analyses from the first phase of the 2019-2020 survey were announced in
December 2020. But the detailed report and microdata for the first phase of the survey that was used to
calculate poverty had not been released as of April 2021.
Welfare aggregate
In 2015, the welfare aggregate estimation, based on a consumption measure, included the following
expenditure groups: food (adjusting for subsidized food consumed); dwelling-related expenditures;
education; health; general services; food away from home; a rental value as proxy for housing services;
purchases of durable goods, transportation, and communications; and purchases of other non-durable goods.
The welfare aggregate is not temporally deflated.
The methodology to measure welfare changed starting in 2015, and caution should be used when comparing
official estimates with pre-2015 indicators.
Poverty line
The official poverty measure is based on a household-specific poverty line that considers two key things:
(1) the household composition and thus the household-specific caloric requirements; and (2) the regional
variation in cost/calorie and non-food allowance. This methodology leads to thousands of poverty lines.55
The methodology to measure poverty uses the Cost of Basic Needs Approach (CBN) approach. This
approach defines a poverty line for each household, considering each household’s location, size, and age
and gender composition. The implementation of this approach followed two steps: Step 1. Create a household- and region-specific food poverty line
• Using tables from the World Health Organization (WHO), caloric needs were separately specified
for urban and rural individuals, by gender and 13 age categories. For example, for men over 18
years of age, an average weight of 70 kilograms and for women 60 kilograms were assumed. Urban
individuals were assumed to need 1.8 times the average basal metabolic rate (BMR) and rural
individuals were assumed to need twice the average BMR. By adding the caloric requirements of
all individuals in the household, a household-specific caloric requirement was obtained (called kh).
• Using the nominal consumption expenditure per capita distribution, households in the bottom 40
percent were identified and labeled as the reference group. While use of the bottom 40 percent is
the practice that the World Bank recommends, CAPMAS uses the consumption pattern of the
second per capita consumption quintile as the reference group (see El Laithy and Armanious, 2019).
For households in the reference group, total quantities consumed of all food items (vector Zr) were
55 See Lara Ibarra (2019) for more details.

105
calculated to define the reference poverty food bundle. Next, using calories-per-food-item
information, the associated total calories of the reference bundle Zr were calculated (called kr).
• The value of the reference bundle Zr was determined by the cost of purchasing the items belonging
to the bundle in each region. That is, for each region, unit values were calculated for each food item
and each household. The regional average unit value would then be applied to each item to obtain
its representative value in the region. Adding the representative value of each item in the bundle
within each region provided the value of the reference bundle.
• The region-specific cost per calorie of the consumption bundle Zr is obtained by dividing the region-
specific value of the reference bundle by the total calories in the bundle (kr).
• The final household-specific food poverty line (Foodline) is obtained by multiplying each
household’s caloric requirements by the region-specific per-calorie cost.
Step 2. Estimate the nonfood poverty line using an application of Engel’s law
• A region-specific Engel regression is run with all households in the region as observations. The
dependent variable of the regression is the households’ food share of expenditures, while the
independent variables included the logarithm of the ratio of total household expenditures and the
food poverty line, the square of this logarithm, the logarithm of household size and its square, the
share of children, adult males and adult females.
• For each household, the share of food expenditure for households whose total expenditure is
equivalent to the food poverty line was estimated. That is, using the Engel regression’s estimates
(coefficients), a prediction was obtained (fs) for each household under the assumption that total
expenditure was equal to the food poverty line.
• Finally, the total poverty line associated with each household was obtained by applying the
following formula: Povline=(2–fh)Foodline.
This approach yields household- and region-specific poverty lines, also called lower poverty lines.
Households were classified as poor whenever the household’s total consumption expenditure was below
the estimated poverty line. Finally, the official national poverty rates were estimated as the share of the
population living in households whose total consumption expenditure was below its corresponding poverty
line.
Poverty trends While the underlying methodology is the same across survey rounds, CAPMAS re-sets the poverty line at
each survey round following the CBN approach described above (see Lara Ibarra 2019 and El Laithy and
Armanious 2019). At each survey round, the reference bundle, and hence the cost of basic needs is re-
calculated. If the food consumption of the reference group changes, then so will the poverty threshold. A
strength of this approach is that it reflects the consumption pattern in that time period—an important
consideration given ongoing reforms. Official estimates can be considered as relative poverty estimates.
They are informative about the share of the population that lives below what is a relevant poverty threshold
for a particular survey year.
However, the limitation of the official poverty numbers is that they are not comparable over time. This
makes it difficult to evaluate the effect of policy changes and a worsening or improvement in economic
conditions. For this reason, the World Bank usually recommends fixing the poverty line to one year.
Comparable poverty trends require a poverty line that stays constant in real value: any adjustments made
reflect only changes in the cost of living. This implementation ensures that the threshold of what is
considered a minimum standard of living (that is, the poverty line) is constant across time and does not
change.

106
Annex B: Growth accounting methodology and data
As it is standard in the literature, a Cobb-Douglas aggregate production function is expressed in the
following way:
𝑌 = 𝐴𝐾𝛼(ℎ𝐿)1−𝛼 (1)
where Y represents the real gross domestic product (GDP), A is residual Total Factor Productivity (TFP),
K is real physical capital, h is a human capital index per person, and L is numbers of employees. All the
variables vary by country i and time t. The parameter a is the capital elasticity. Dividing equation (1) by
population N, and rearranging, yields the following expression:
𝑦 =𝑌
𝑁= 𝐴 (
𝐾
𝐿)
𝛼ℎ1−𝛼 𝐿
𝑁= 𝐴𝑘𝛼ℎ1−𝛼𝑙 (2)
Where y = 𝑌
𝑁 is the GDP per capita, k =
𝐾
𝐿 is the capital stock per worker, and l =
𝐿
𝑁 the ratio of employees
over the total population. Taking logarithms and differentiating to time yields56:
�̂� = �̂� + 𝛼�̂� + (1 − 𝛼)ℎ̂ + 𝑙 (3)
where �̂� = �̂� − �̂� ; �̂� = �̂� − �̂� ; 𝑙 = �̂� − �̂�
This is our fundamental equation of growth accounting. The growth in GDP per capita (in turn, the
growth of GDP minus the growth of the population) can be decomposed in the increase in productivity,
growth in capital stock per worker (the growth of total capital minus the growth of workers), the growth
in the human capital per person and the growth of the employment to population ratio. Note that the first
term of the sum represents the contribution of TFP to the growth of GDP per capita. The second is the
capital, and the last two are the labor contribution; together, the last three are the factor’s contribution to
growth.
For the international comparison, following (Daude & Fernández-Arias, 2011) we can express equation
(2) in terms of ratios between an economy of interest (Egypt in our case) and a benchmark economy or
group of economies, taken as a development yardstick. If we denote y* as the GDP per capita of our
benchmark we obtain:
�̅� =𝑦
𝑦∗ =𝐴
𝐴∗ (𝑘
𝑘∗)𝛼
(ℎ
ℎ∗)1−𝛼 𝑙
𝑙∗ = �̅��̅�𝛼ℎ̅1−𝛼𝑙 ̅ (5)
To calculate a benchmark among n economies in a group, we use a geometric mean57: 𝑦∗ = (∏ 𝑦𝑖𝑛𝑖=1 )1/𝑛
Finally, we can obtain the evolution of this gap over time by generalizing equation (3) for any two points
in time:
∆𝑝𝑙𝑛�̅�𝑡 = 𝑙𝑛 (�̅�𝑡
�̅�𝑡−𝑝) = 𝑙𝑛 (
�̅�𝑡
�̅�𝑡−𝑝) + 𝛼𝑙𝑛 (
�̅�𝑡
�̅�𝑡−𝑝) + (1 − 𝛼)𝑙𝑛 (
ℎ̅𝑡
ℎ̅𝑡−𝑝) + 𝑙𝑛 (
𝑙�̅�
𝑙�̅�−𝑝) (6)
In what follows, we use equation (3) to perform the factor decomposition analysis of the Egyptian
economy and equation (5) to compare the evolution of Egypt to a series of country-groups comparators.
Data
56 All the variables in “hats” represent growth with respect to the previous period �̂� = 𝐿𝑛 (𝑋𝑡
𝑋𝑡−1). Note that the parenthesis is one
plus the growth rate of the variable X, so we are using the approximation 𝐿𝑛(1 + 𝑔) ≈ 𝑔 for small g.
57 We choose to work with geometric means as they represent the central tendency or typical value in our set of comparators.

107
• Gross Domestic Product: Data on GDP is obtained from the World Bank Open Data (WBOD),
available in Stata through the command “wbopendata”. Except when otherwise indicated, GDP is
considered in constant 2010 US dollars (variable ny.gdp.pcap.kd).
• Population: WBOD, variable sp.pop.totl.
• Capital Stocks: Data obtained from (Berlemann & Wesselhöft, 2017). They use the series of gross
fixed capital formation (variable ne.gdi.ftot.kd) and uniform across countries (but varying over time)
depreciation rates computed by the authors to compute capital stocks for 122 countries using the
perpetual inventory method. As the series goes until 2016, we update for the last two years using the
mentioned capital formation series and a depreciation rate of 5%, consistent with the authors’
calculations for the latest years.
• Human Capital: Following the literature (see (Hall & Jones, 1999) for example), human capital
indexes are computed using the formula: ℎ = 𝑒𝜑𝑆. j is computed as the median of the overall Mincerian
return for education for all the countries compiled by (Psacharopoulos & Patrinos, 2018).58 S is the
average year of schooling in the population (older than 15) from the (Barro & Lee, 2001) database,
available in WBOD under the variable bar.schl.15up.
• Employees: WBOD does not have a widely available series of the number of employees. We construct
it using two series: Labor Force (sl.tlf.totl.in) and unemployment rate, obtained either from the
International Labor Organization (ILO) or national estimates (sl.uem.totl.zs and sl.uem.totl.ne.zs)
respectively. Employees are calculated as Labor Force*(1-unemployment rate).
• Capital Elasticity: As is standard in the literature (see (Hsieh & Klenow, 2010) for example), we use
a constant across countries and time capital elasticity equal to 1
3.59
This approach is based on Van Beveren (2010).
58 We use the median to avoid the effect of extreme values. The value of the Mincerian median across 74 countries is 8.85. That
is, on median, an additional year of schooling generates a return of 8.85%.
59 As discussed in Daude and Fernández-Arias (2011): “Although there is some debate in the literature regarding the validity of
this assumption, Gollin (2002) shows that once informal labor and household entrepreneurship are taken into account, there is no
systematic difference across countries associated with level of development (GDP per capita), nor any time trend. Hence its
uniformity across countries and time appears to be a reasonable assumption.”