Transformation - World Bank Documents & Reports
248
10125 - 't? The Transformation Of Urban Housing W PAUL STRASSMANN A WORLD BAN I Public Disclosure Authorized Public Disclosure Authorized Public Disclosure Authorized Public Disclosure Authorized
-
Upload
khangminh22 -
Category
Documents
-
view
3 -
download
0
Transcript of Transformation - World Bank Documents & Reports
10125
- 't? TheTransformation
OfUrban
Housing
W PAUL STRASSMANN
A WORLD BAN
I
Pub
lic D
iscl
osur
e A
utho
rized
Pub
lic D
iscl
osur
e A
utho
rized
Pub
lic D
iscl
osur
e A
utho
rized
Pub
lic D
iscl
osur
e A
utho
rized


TheTransformation
ofUrban Housing
A WORLD BANK RESEARCH PUBLICATION

lStS | | | i g | | § 1 Dlfi~~~~~~~~~~~~~~~~~~~~~~ogota t k5t
_._:1 n I 11 I i 3R il 11 i#u lold <5 9; 1lr ~~~~COLSOMBIA
| 11 1i | | 0 PERU )~~~~~~~~~~~~~~~
2| B | i S ! || | | | S1-65 + -~~~C:l| 2 t m 0 i | | S i i .ffi ie g 4 -9ffl 1L - < il ER! HEa S n n i o >~~~~~~~~~~~~~~~~~~~~o
i !N | | | | i fi fi 0 g S F iyX i ~~~~~~~~~~~~~~~~ECADO I|.BRAZILi !2 F } g | | | | | | | ! 2 t : ,~~~~~~''t'(12 "'5.PE UZ
| @ @ | l | | " X X | g E |X jEI Bo5aut\, @ t w~~~~~~~~~~~~~~~~~~~~~~~~~~~~~~~~~~~~~~~~~~~~~~~~~~~~~~~~~~~~~~~~~~~~~~~~~~~~~~~~~~~~~~~~~~~~~~~~~~~~~~~~~~~~~~~~~~~~~~~~~~~~~~~~~~~~~~~~~~
g W g t !B E E g U 3 E ~~~~~~~~~~~~~~~~~~~~~~~~~~~~~~~~~JULY 1982tt
TheTransformation
of
Urban HousingThe Experienceof Upgradingin Cartagena
W. Paul Strassmann
Published for The World BankTHE JOHNS HOPKINS UNIVERSITY PRESS
Baltimore & London

Copyright © 1982 by the International Bankfor Reconstruction and Development THE WORLD BANK
1818 H Street, N.W., Washington, D.C. 20433, U.S.A.All rights reservedManufactured in the United States of America
The Johns Hopkins University PressBaltimore, Maryland 21218, U.S.A.
The views and interpretations in this book are theauthor's and should not be attributed to the WorldBank, to its affiliated organizations, or to any individualacting in their behalf. The map appearing as frontispiecewas prepared exclusively for the convenience of readersof this book; the denominations used and the bound-aries shown do not imply, on the part of the WorldBank and its affiliates, any judgment on the legal statusof any territory or any endorsement or acceptance ofsuch boundaries.
EDITOR Virginia deHaven HitchcockMAP Julio Ruiz and Larry A. BowringBOOK DESIGN Christine HouleBINDING DESIGN Joyce C. Eisen
Library of Congress Cataloging in Publication Data
Strassmann, W. Paul (Wolfgang Paul), 1926-The transformation of urban housing.
Bibliography: p.Includes index.1. Housing-Colombia-Cartagena (Province)
2. Urban renewal-Colombia-Cartagena (Province)I. World Bank. II. Title
HD7325.C4S77 1982 363.5'8 81-48176ISBN 0-8018-2805-8 AACR2

Contents
Map frontispiece
Acknowledgments xi
Acronyms xiv
1. Introduction and Summary 3
The Role of Housing in Economic Development 3An Overview of the Study 5
2. Cartagena 10Evolution of the City 10Population and Economy during the 1970s 12Employment in the Formal Sector 15The Free Port and Export Processing Zone 17A Tour of the City 18
3. Physical Need for Housing, Water, and Waste Disposal 22Flows and Standards 22Housing Needs and Zones 24Family Structure 26The Housing Deficit in 1973 29Household Size in 1978 31The Need for and Supply of Water 32The Sewerage System 33Conclusion 36
4. Effective Demand and Housing Finance 38Household Income 38Unemployment 41Occupations 41Payments and Willingness to Pay 45Income and Tenure 46Tenants 47Owner-Occupied Housing 49Family Size and Housing Value 51Housing Finance 52
v
Vi CONTENTS
Real Estate Taxes 59The Demand for Land and Location 61
Moves and Location 62Demand Elasticities 66
Summary 72
5. The Housing Stock and New Construction 74
Characteristics of the Housing Stock 75Six Types of Housing 78Determinants of Value 79Amount and Value of Space 84Hedonic Analysis 85
Housing Eradication 87Housing Construction by ICT 89Housing Construction by Other Developers 90Inflation and Relative Price Changes 93
Construction and Employment 94Innovations in Building Materials 100
6. Transformation of the Old Housing Stock 103
Housing Analysis 104Improvements by Owner-Occupants 105
Age and Value 113Sources of Finance for Improvements 114Water 117
icT Financing 122Rental Housing 127Summary 131
7. The Housing Market 133
Housing Used by Four Income Groups 133The Southeast Zone and Squatters 136The Overall Housing Matrix for 1978 138Projections to 1990 143Building to Meet the Demand 145
8. Lessons from Experience 149
Review 149Obstacles to Transformation 154Housing Prospects 156Completing the Circle 159

CONTENTS Vii
Appendix A. The Sample 161
The Preliminary Questionnaire 162The Final Questionnaire 163
Analysis 165
Appendix B. Questionnaire for the Housing Survey inCartagena, 1978 167
General Information 167The Dwelling 168Additional Rooms 169The Kitchen 170
Water 171Sanitary Facilities 171General Questions about Dwelling Improvements 172
Finances 174Moves 177
The Household 178The Head of Household and Employment 179Transport 182Income 183
Appendix C. Value, Income, and Housing Characteristics 185
Appendix D. Housing Models and Density of Settlement 197
Upgrading and Conversion 198The Ingram-Oron Model 199
Appendix E. Subdivision and Expansion in Ciudad Kennedy, Bogota 202
Appendix F. A 1970 Survey of the Southeast Zone 204
Appendix G. A 1976 Census of the Southeast Zone: Boston-Tesca 205
Appendix H. A 1978 Study of Employment in the Southeast Zone:Esperanza 207
Appendix I. Housing in Latin American Budget Surveys 209Expenditures on Housing as a Share of Income in Four Colombian
Cities 209Other Determinants of Housing Expenditures 211
Appendix J. CVP Housing Projects in Bogota 214
References 216
Index 221
Viii CONTENTS
Tables
2-1. Distribution of Employment, 1975 132-2. Distribution of Income, for Employed Workers Ten Years Old and Over,
by Occupational Category, 1973 14
3-1. Estimated Population for 1978 and Projections for 1990, by District 253-2. Characteristics of Occupied Housing, According to the 1973 Census 283-3. Cross-Tabulation of Number of Occupants and Number of Rooms in
Occupied Housing, According to the 1973 Census 303-4. Percentage Distribution of Water Source and Sanitary Facilities, by Zone,
1978 34
4-1. Distribution of the 1978 Housing Sample, by Monthly Income Level 394-2. Sources of Household Income 404-3. Income Levels for Specific Occupations 424-4. Occupations of Principal Workers 434-5. Primary Source of Household Income, Income Levels, and Housing
Value 434-6. Household Income, Age of Dwellings, and Duration of Occupation by
Present Owner, by Zone 444-7. Average Rent and Share in Income, by Zone 474-8. Stock-User Matrix for Tenants 484-9. Housing, by Type of Builder 504-10. Estimators for Owning or Renting: Logit Analysis 524-11. Household Size Matrix for Income-Dwelling Combinations, for Tenants
and Others 544-12. Sources of Finance for Owner-Occupied Housing, 1973 554-13. Characteristics of Some IcT Dwellings under Construction from 1977 to
1978 564-14. Relation between Mobility and Type of Tenure 634-15. Reasons for Moving to Another Dwelling 644-16. Modes of Transport Used to Get to Work 654-17. Combined Travel Time to Work of Household Head and Spouse or Other
Second Worker, by Income and Dwelling Value, for Nontenants 654-18. Logarithmic Regressions of Values, Rents, and Mortgage Payments against
Incomes, Household Size, and the Proportion of Adults 684-19. Stock-User Matrix for Owner-Occupants and Rent-Free Tenants 70
5-1. Distribution of Housing, by Income 745-2. Distribution of the Occupied Housing Stock 765-3. Wall and Roofing Materials Used in Dwellings 775-4. Type of Plumbing Facilities in Housing, 1973 and 1978 775-5. Characteristics of Housing Categories 805-6. Value of Owner-Occupied Dwellings, by Type of Builder 815-7. Number of Rooms and Value of Owner-Occupied Housing 81
CONTENTS iX
5-8. Source of Water, Sanitary Facilities, and Value of Owner-OccupiedHousing, 1978 82
5-9. Percentage of Dwellings with Various Characteristics in Different ValueCategories 83
5-10. Amount of Floor Space, by Type of Tenure 845-11. Number of Rooms, by Type of Tenure 855-12. Determinants of Dwelling Value: Hedonic Regression Coefficients 865-13. Licensed Housing Construction in Cartagena, 1976 and 1977 915-14. Price Inflators for Housing Construction and Annual Increases in
Construction Costs, Cartagena, 1971 to 1977, and Barranquilla,1954 to 1972 92
5-15. Index of Housing Construction Costs for Three Basic Housing Types, May1978 94
5-16. Residential Construction Costs and Employment 955-17. Share of Labor Costs in Costs of Selected Components of Dwellings,
Colombia, 1971 965-18. Employment and Cost to Build a 19.5-Square-Meter Expandable House,
by Component 98
6-1. Owners Making Specific Changes, by Years of Occupancy 1066-2. Logarithmic Regressions of Rooms, Floor Space, Value per Square Meter,
Added Rooms, and Improvements against Income and the Number ofAdults per Household 108
6-3. Dwelling Condition in 1978 Compared with That at the Time of Acquisi-tion, by Income Level 112
6-4. Age and Average Value of Owner-Occupied Housing 1146-5. Most Important Source of Finance for Home Improvements, by Income
Level 1156-6. Estimators for Adding Rooms or Making Improvements: Logit
Analysis 1166-7. Probabilities of Adding Rooms or Making Three or More Types of Im-
provements, for Different Occupant-Dwelling Combinations 1176-8. Income Elasticity Regressions for Tenants, Mortgagors, and All
Owners 1186-9. Value-Income Elasticities for Housing, with Dummies for Public Utilities
and Location 121
7-1. Income, Rent, and Dwelling Value per Adult in Households with DifferentNumbers of Adults 136
7-2. Distribution of the Occupied Housing Stock, 1973 1427-3. Income Distribution in 1978 and 1990 1447-4. Stock-User Matrix for 1990, Showing Minimal Construction Needed to
Preserve Housing Conditions as in 1978 146
C-1. Number of Rooms, Family Size, and Percentage with Inferior Materials,by Income and Dwelling Value, for Owner-Occupied Housing 186
C-2. Persons per Room, by Income and Dwelling Value, for Owner-Occupants 187
X CONTENTS
C-3. Household Size, Income, and Dwelling Value for Tenants 188C-4. Percentage of Households without Piped Water and without Sanitary Fa-
cilities, by Income and Dwelling Value, for Owner-Occupants 190C-5. Average Floor Space, by Income and Dwelling Rent 191C-6. Average Floor Space, by Income and Dwelling Value 192C-7. Number of Rooms, by Income and Dwelling Rent 193C-8. Number of Rooms and Rooms Added, by Income and Dwelling
Value 194C-9. Share of Households Receiving Primarily Wage Income or Having
Relatives in Venezuela, by Income and Dwelling Value, forOwner-Occupants 195
1-1. Spending Share of Housing, by Social Class 2101-2. Share of Housing in Expenditures for Comparable Groups in Four
Colombian Cities, 1953, 1967-68, and 1970 2111-3. Income Distribution According to the Income of the Family Head and Gini
Coefficients in Four Colombian Cities, 1967-68 211
Acknowledgments
THIS STUDY OF URBAN HOUSING WOULD HAVE BEEN IMPOSSIBLE without thehelp of numerous people. Most important numerically and otherwisewere the 293 families of Cartagena who were willing to answer 100 ques-tions, some personal, others rather absurd. Gratitude is also due to thesmaller sample of landlords. The high rate of successful responses tointerview attempts-86 percent-was due to the energy, skill, and dedi-cation of four interviewers from the School of Social Work of the Uni-versity of Cartagena: Samia Rosa Francis, Lylia Marina Jaquin Sanchez,Elena Lepesqueur de Guerrero, and Margarita Mejia Guerrero. Ourdrivers, Napoleon Baena and Antonio Cardona, did not spare theirvehicles from remote and rugged journeys and helped with encyclopedicknowledge of the city. They all worked together with Norma L. BoteroM. whose tact and organizing skill enabled the interviews to be com-pleted in a mere fourteen days, July 5-18, 1978. Norma's creativity,dailigence, and good humor kept the entire study on course.
The work in Cartagena began with practical advice from Hector Tru-jillo, Ester de Alvear, Gilda de Calvo, and Lacydes Cortes Diaz of the Plan-ning Commission for the North of Bolivar. At the University of Car-tagena, Libardo Castro Reyes explained economic conditions, andGustavo Pacheco gave us crucial details about demographic trends andpopulation densities. At the University Jorge Tadeo Lozano, Tova Solo,an ingenious architect, and Carlos Marnet, a fellow economist, weremost helpful. Policies of the Banco Central Hipotecario were patientlyexplained by Diego Salgado.
The Territorial Credit Institute (ICT) plays an important role in lowcost housing, and we could have accomplished little without the patienceand interest of their leading officials, Dionisio Velez, Fernando Navarro,Delly de Barrios, Melba de Chavez, and Edgardo Martinez. Their infor-mation was supplemented by that of Antonio Acunia and LisimacoDuran of the Oficina Departamental de Rehabilitaci6n de Tugurios(Slum Rehabilitation).
For further background information we sought the help of Jorge Pay-ares Bossa of the Chamber of Commerce, Hernando Sarmiento Castillo
xi

Xii ACKNOWLEDGMENTS
of the municipal treasury (Catastro), Alberto Fl6rez Rojas of the nationalstatistical service (DANE), Camilo Abadio of the Chamber of Construc-tion, Jorge Ochoa Covo of the National Association of Industrialists,Oscar G6mez of the Municipal Planning Office, Raul Quintero ofMunicipal Public Enterprises, Juan Carlos Lemaitre and David Escuderoof the National Vocational Training Service (SENA), and Omar DiazGranados and Anibal Perez of the Cartagena branch of the Banco de laRepublica. All provided important clues, were generous with time, andgave us a library of documents.
To make sure we were on the right track from the point of view of peo-ple living in Southeast Zone, we often compared notes with Angel Pala-cio, president of Communal Action in Olaya Herrera. (One day the col-lapse of a neighboring shack killed a man and his wife, and Angeladopted their surviving children.) Eric Hoffman, a former Peace Corpsvolunteer who still lives in La Magdalena, also helped with his thoroughknowledge of the area. Our last interview, as reported in the last chapter,was in Fredonia with two indomitable former nuns, Cruz Elena RamirezP. and Teresa de Jesus Gonzales V., "Sister Amparo."
To put findings from Cartagena into an appropriate context of na-tional trends and policies, we had ten days of interviews in Bogota. Es-pecially helpful were Lucia Cruz de Schlesinger and Daniel SchlesingerRicaurte of the Banco de la Repuiblica and Augusto Cano of the Uni-versity of the Andes, all former graduate students of Michigan State Uni-versity. Others who made important suggestions were Augusto AlfredoSolarte and Lauchlin Currie of the National Planning Department;Gustavo Jimenez of IcT; Elsie de Alcala of the Caja de Vivienda Popular(cvp); Jorge Torres of the National Center for Construction Studies(CENAC); Miriam Ordonez, Carlos Velasquez, Noel Olaya, and MoisesRojas of DANE, Martha Baquero and Carlos Zorro of the University ofthe Andes; and Ramiro Cardona, Jose Femando Pineda, Guillermo Ro-jas, and Alvaro L6pez of the Centro de Cooperaci6n Regional dePoblaci6n.
This project was initiated at the World Bank with counsel from JohnCourtney, Orville Grimes, Gregory Ingram, Friedrich Kahnert, AnupamKhanna, Nicolas Lethbridge, and Alastair Stone.
Colleagues at Michigan State University who gave advice on the ques-tionnaire and project design were Aaron Gurwitz, Carl Liedholm, andDaniel Saks. Three thousand pages of questionnaires were ingeniouslytransformed into computer printout by Chris Wolf, who was helped byCathy Caswell, Cheryl Wilkins, Mary Moeller, and others. For typing allthese names, pages, and numbers in tables correctly, I am thankful to TyDao, Pat Trommater, Kelli Sweet, and Miae Evans.
ACKNOWLEDGMENTS Xiii
My wife, Betty, accompanied me on some of the interviews, to someof the tugurios, to the eradication of La Carbonera, and finally readsome early drafts of chapters and conscientiously found embarrassingmistakes. For all this and more, much thanks.
W. PAUL STRASSMANN

Acronyms
BCH Banco Central Hipotecario(Central Mortgage Bank)
CAMACOL Camara de Construcci6n(Colombian Chamber of Construction)
CAV Corporaci6n de Ahorro y Vivienda(Corporation for Saving and Housing)
CEDE Centro de Estudios sobre Desarrollo Econ6mico(Center for Economic Development Studies)
CENAC Centro Nacional de Estudios de la Construcci6n(National Center for Construction Studies)
cvp Caja de Vivienda Popular de Bogota(Low-Cost Housing Bank of Bogota)
DANE Departamento Administrativo Nacional de Estadistica(National Statistics Department)
ECIEL Estudios Conjuntos sobre Integraci6n Economica Latino-americana(Joint Studies of Latin American Economic Integration)
EPM Empresas Publicas Municipales(Municipal Public Enterprises)
icT Instituto de Credito Territorial(Territorial Credit Institute)
INSFOPAL Instituto Nacional de Fomento Municipal(National Institute for Urban Development)
SENA Servicio Nacional de Aprendizaje(National Apprenticeship Service)
zpic Zona Franca Industrial y Comercial de Cartagena(Duty-free Industrial and Commercial Zone of Cartagena)
xiv
TheTransformation
ofUrban Housing

I
1Introduction and Summary
IN A MATERIAL SENSE, economic development means a better countrysideand better cities. New seeds, new pumps, new engines, new shoes, andcountless other new goods are supposed to replace the worn-out andobsolete. Even new cities have been built, but these have turned out tobe too expensive and dreary.' In the urban setting, therefore, the maintask is to improve the old appealing cities and the present housingstock, rather than to replace it. This book is about the transformation ofhousing.
The Role of Housing in Economic Development
Because of population growth and migration, old cities will need manynew dwellings, but these, like others, will have to be transformed, ex-panded, and modified over the years to play their part in the develop-ment process. Housing transformation must not only be expected andtolerated but should even be fostered as a good way to raise an importanttype of production, to generate employment, and to improve equity indistribution. For example, employment naturally accompanies small-scale improvements of dwellings: labor-intensive, conventional buildingmethods are still more efficient than capital-intensive prefabrication inalmost all settings.2
With respect to equity, most young families in developing countriescannot obtain any type of newly built two-room dwelling with a kitchenand bathroom if they pay only one-fifth of their income for fifteen yearsat an unsubsidized real interest rate of around 12 percent.3 Subsidies thatbring such housing within reach of the poor are inequitable because theycan be given to only a small minority unless investment in all other sec-tors is wholly neglected. The poor should have access to their share offinance plus a widely dispersed, hence modest, subsidy. With that theycan easily acquire a utility-serviced site, an incomplete but expandablecore house, or an existing substandard dwelling that can be upgraded.
3
4 INTRODUCTION AND SUMMARY
The case for an urban strategy that stresses such lending is strong. Inrecent years this strategy has been recommended by several nationalhousing agencies and by international lenders, such as the World Bankand the U.S. Agency for International Development. 4 Not only does thisupgrading strategy provide more improved housing than the costly alter-native of eradicating slums, subsidizing the middle class, and hoping thatthe benefits will filter downward, but it also leads to more employmentand to entrepreneurial opportunities for the poor. 5
Casual observation and studies of specific projects and neighborhoodshave shown that many of the poor are already upgrading their dwellings,despite obstacles and institutional constraints. Instruction on technicaldetails might be useful, but massive campaigns such as those for betternutrition or family planning will not be needed. What has been lackinginstead is knowledge by urban authorities of how upgrading transformsthe use of the entire housing stock by a growing population with chang-ing incomes. Without such knowledge, policies dealing with finance,land, and infrastructure will generate an inadequate and misdirectedvolume of construction.
The upgrading or the transformation of housing must be understood interms of the changing housing market as a whole. The demand for newdwellings or for improvements depends on population growth, house-hold formation, migration, personal income growth, income distribu-tion, access to land and finance, the availability of competing goods andservices, the characteristics of the old housing stock, and various regula-tions. Analysis of supply is even more complex because of the diversityof actors that are involved: workers, builders, utility providers, materi-als suppliers, financiers, and often designers, landlords, and others.Some perform multiple functions. It would be misleading, however, toassume that all the financial and entrepreneurial institutions of advancedcountries exist in cities in developing countries. When the focus is onhousing by and for the poor, complex theories based on irrelevant set-tings are not helpful.6
Poor households will save and work to transform dwellings progres-sively in a variety of ways. They can use current income, liquidate pastsavings, borrow from relatives, or take out materials or general con-struction loans. Some countries have informal credit societies or money-lending clubs.7 Construction work can be performed by the family, byfriends and neighbors, by artisan contractors from the informal sector,as well as by registered builders.8
One pattern is obvious: constraints of any type inhibit the transforma-tion of housing.9 In some countries occupants must follow predeterminedhousing designs, whereas in others they must simply convince inspectors
INTRODUCTION AND SUMMARY 5
that they are building in a structurally sound manner. A few countriesprohibit renting, subletting, or selling the serviced site with its newlybuilt or upgraded dwelling for several years to anyone other than thesupervising or lending institution. These restrictions are meant to pro-hibit real estate speculation and transfers to higher income groups.Presumably if "trickle-down" policies left the poor out in the past,"trickle-up" policies might be equally bad. And yet this may be the veryway that self-help builders can become entrepreneurs with increasingskills. They can become the suppliers of middle-income housing by livingon the premises during construction. 10 Thus the 1950s squatter settlementcalled 27 de Octubre across the Rimac River from Lima, Peru, hadbecome the partly middle-class area of San Martin de Porras by the1970s.11 In the World Bank Dandora project at Nairobi, Kenya, oc-cupants were encouraged to finance expansions by taking in lodgers.Partly as a result, the average dwelling was completed within eight in-stead of eighteen months.1 2 Afterward entire dwellings were sublet orsold to richer households. Integrating informal building with the rest ofthe urban economy in this manner reduces dualism, a reduction thatsome take as synonymous with development. The poor are not hurt ifthey are allowed to develop specialized talents and to use them most pro-ductively. Someone has to build middle-income housing-why not thepoor, organized in their own fashion?
Obviously, immediate resale of serviced sites or core houses, perhapsdrawn by poor families through a lottery, would be an awkward way ofgiving the poor income instead of better housing. Some say that incomeis indeed what poor families lack, so why not let them allocate it in termsof their own priorities?13 Urban planners and development economists,however, have a longer perspective than specific poor individuals andare concerned with the functioning of the city and the economy for dec-ades ahead. Policies should not only mitigate poverty within the next fewyears but also prevent eventual urban breakdowns and raise the produc-tivity of the poor.1 4 The best way to raise their productivity is to givethem work experience in a sector with an expanding market. Resaleshould be discouraged for a year and be limited to substantially im-proved dwellings.
An Overview of the Study
The ideas reviewed in the preceding section are by no means new, butin 1978 they had never been empirically tested in a comprehensive man-ner for an entire city. The Urban Projects Department of the World Bank
6 INTRODUCTION AND SUMMARY
therefore asked the author to study the determinants of the supply anddemand for housing among different socioeconomic groups, the currentand potential resource allocating mechanisms, and the role of institu-tional, policy, and material constraints, with a case study of one city,Cartagena, Colombia. As described in the next chapter, Cartagena hadbeen a leading South American city in Spanish colonial times, but its for-tunes had varied after its liberation in 1821. In the 1970s the World Bank,together with local and national agencies, was financing a commercialand industrial duty-free district and was upgrading the city's SoutheastZone. One-fifth of the population lived there in 1978 with monthly in-comes of US$20 per capita, half the average in the remaining city (al-though that included other sizable slums). In the rest of the city about 70percent of households had indoor piped water and means of sanitarydisposal better than latrines, whereas in the Southeast Zone only about30 percent had those facilities. With luck, a study of Cartagena could berelevant to further projects in that city and could provide guidelines forpolicymakers elsewhere.
A questionnaire with 100 items was developed, tested, and used duringJuly 5-18, 1978, in interviews with 296 households (out of 340 attempts).The sample and procedure are described in Appendix A, and the ques-tionnaire reproduced in English in Appendix B. There were also inter-views with local authorities and experts, as well as with others in Bogota.Furthermore, a substantial number of published and unpublished reportsabout urban conditions in Colombia were consulted.
Chapter 2 gives the general background to the study and providessome history (omitting heroes and battles), a review of demographic andeconomic trends, a description of employment and the labor force, twoparagraphs about the free port, and other information that helps to setthe stage.
Chapters 3 and 4 are about demand and related public institutions.One chapter deals with housing in terms of physical needs; the other isabout effective demand, hence income levels, income distribution, creditsystems, and access to land as they affect households of different sizesand at different stages of their life cycles. Tenants and owners are treatedseparately.
Housing supply is discussed in two parts. Chapter 5 surveys two con-ventional matters, the old housing stock and new construction. Hedonicprice indexes show how specific physical characteristics account for theoverall value of a dwelling. A number of cross-tabulations show whatkind of household has settled in what type of dwelling. Other sectionsdeal with construction costs, employment effects, and innovations. Since
INTRODUCTION AND SUMMARY 7
the housing market is fractured, as in most third world cities, a com-prehensive model of rational behavior is not applied. The implication isnot that builders, landlords, and occupants are "irrational," but ratherthat they are rational in a very imperfect context. For example, we foundthat most adult occupants know how to appraise the value of their owndwelling rather shrewdly. Detailed training in price indexing and pat-terns of urbanization would not greatly improve their estimates. Wefound that the permanent income hypothesis holds: unexpected lumpsum receipts from a lottery, an inheritance, smuggling, or a remittancefrom Venezuela are not squandered but saved and invested in housing ordurables.
Improvement and conversion of the existing housing stock are dis-cussed in Chapter 6. Downgrading through subdivision and poor main-tenance are also possibilities but not of comparable significance in de-veloping countries. In the face of rapid population growth and urbanexpansion, usually only a small portion of the old housing stock is a can-didate for subdivision. Doubling up of several generations of middle-class or impoverished upper-class families occurs if there are constraintson building. Subdivision for tenants is often illegal, hence clandestine, inpublic housing. Such subdivision goes on primarily in very large citieswithout opportunities for squatting at accessible locations. There is muchsubdivision in Bogota, little in Cartagena. Squatting usually takesplace on public land with tacit official tolerance.1 5
Thirteen different types of improvements can be made, but addedrooms get the most attention. A variety of econometric tests all suggestthat with access to indoor piped water, households will improve theirdwellings much more than otherwise. Landlords make improvements butonly when their rented premises happen to be vacant.
Following these chapters on demand and supply is another on their in-teraction. Demand and supply interact when an existing dwelling is im-proved by the occupants or when a family moves from one dwelling toanother. Chapter 7 reports why households in Cartagena had moved,and why some were thinking of moving again. From figures about hous-ing values and characteristics during a single month, we could not, how-ever, deduce much about price changes and stock adjustments as ways ofclearing the housing market with all its imperfections. It is easier to pro-ject what will have to be built by 1990 if households in each incomebracket are to have at least the same level of housing quality as they hadin 1978.
The concluding chapter lists a few topics that merit further examina-tion. Recommendations are made for upper-, middle-, and low-income
8 INTRODUCTION AND SUMMARY
housing. Outside support for upgrading is favored if it is designed tomeet the occupants' priorities and capabilities. Utopian thinking, pater-nalism, and paper-intensive delivery systems will not work.
The experience of Cartagena seems to support all these recommenda-tions, because opportunities for transforming the housing stock wereunusually good in that city during the 1970s. Many-amilies receivedtransitory incomes, and the principal housing agency:0had financed in-complete, expandable dwellings. Eradication of squatter settlements wasno longer official policy. The response of owner-occupants to these op-portunities was energetic. The poor were just as likely to add a room asthe rich. Everyone's additions and improvements made housing nearlytwice as good as might have been predicted on the basis of income alone.Rooms per dwelling increased by 24 percent for the city during 1973-78,and value per dwelling rose even more. Access to public utilities, espe-cially water, was a significant spur to modemnization and elaboration.More could have been done, but at least the policies that stressed publicutilities and unfinished housing were justified.
Notes to Chapter 1
1. Bertrand Renaud has concluded that new towns 'constitute the most expensive way offinancing urban development." National Urbanization Policy in Developing Countries(New York: Oxford University Press, 1981), p. 114. See also Ved Prakash, New Towns inIndia (Durham, N.C.: Duke University Program in Comparative Studies on Southern Asia,1969). John F. C. Turner tells about "the architects and planners who preserve some of theslums that are cleared to make way for their schemes, in order to have somewhere pleasantto live themselves" in Housing by People: Towards Autonomy in Building Environments(New York: Pantheon Books, 1976), p. 3.
2. W. Paul Strassmann, Housing and Building Technology in Developing Countries,msu International Business and Economic Studies (East Lansing, Mich.: Michigan StateUniversity, 1978), is a survey of the literature on appropriate technology and employmentin building.
3. Orville F. Grimes, Housing for Low-Income Urban Families (Baltimore, Md.: JohnsHopkins University Press, 1976), especially pp. 61-81. Barbara Ward, The Home of Man(Toronto: McClelland and Stewart, 1976), pp. 192-233, and works of the United NationsFoundation for Human Settlements also show how the emphasis in this field has shiftedtoward housing for the poor. See also Anthony A. Churchill and Margaret Lycette, Shelter,Poverty and Basic Needs Series (Washington, D.C.: World Bank, 1980). Johannes Linn,Cities in the Developing World: Policies for Their Equitable and Efficient Growth (NewYork: Oxford University Press, 1982), explores in detail the issues raised in these introduc-tory pages.
4. World Bank, Housing Sector Policy Paper (Washington, D.C: World Bank, 1975);Agency for International Development, Comptroller General, Agency for IntemationalDevelopment's Housing Investment Guaranty Program, report to the Congress(Washington, D.C.: U.S. General Accounting Office, September 6, 1978); also, Agency for
INTRODUCTION AND SUMMARY 9
International Development, Office of Housing, Tunisia: Shelter Sector Assessment (Wash-ington, D.C., January 1979), and similar reports for other countries.
5. Geoffrey K. Payne, Urban Housing in the Third World (London: Leonard Hill, 1977),pp. 194-99, 211-16.
6. Rakesh Mohan, Urban Economic and Planning Models: Assessing the Potential forCities in Developing Countries (Baltimore, Md.: Johns Hopkins University Press, 1979).
7. Marguerite Jellicoe, "Credit and Housing Associations among Luo Immigrants inKampala," in Urban Challenge in East Africa, ed. John Hutton (Nairobi: East Africa Pub-lishing House, 1970); Bernard Gallin, Hsin Hsing, Taiwan: A Chinese Village in Change(Berkeley, Calif.: University of California Press, 1966), pp. 74-75.
8. David Drakakis-Smith, "Low-Cost Housing Provision in the Third World," Housingin Third World Countries, ed. H. S. Murison and J. P. Lea (New York: St. Martin's Press,1979), pp. 22-30.
9. Sally Cameron, "Local Participation in Bank-Supported Urban Development Proj-ects" (Washington, D.C., World Bank, Urban Projects Department, 1978; processed).Linn, Cities in the Developing World.
10. Carlos Zorro Sanchez and Edgar Reveiz Roldan, Estudio sobre los Inquilinatos (Vi-vienda Compartida en Arrendamiento) en Bogota (Bogota: Centro de Estudios sobreDesarrollo Econ6mico, University of the Andes, Etapa I, February 1974 and Segunda Parte,June 1976).
11. David Collier, Squatters and Oligarchs: Authoritarian Rule and Policy Change inPeru (Baltimore, Md.: Johns Hopkins University Press, 1976), p. 91.
12. M. S. Muller, "House Building in Site and Services Schemes: Some Observations"(University of Nairobi, Housing Research and Development Unit, June 1977; processed);Mazingira Institute, "Post-Habitat Evaluation Report on Human Settlements" (Nairobi,July 1978; processed); Bureau of Educational Research, "The Residents of Umoja HousingEstate" (University of Nairobi, March 1978; processed).
13. Ira S. Lowry, Mack Ott, and Charles Noland, "Housing Allowances and HouseholdBehavior," Rand Corporation note prepared for the Department of Housing and UrbanDevelopment (Santa Monica, Calif., March 1973; processed).
14. Leland S. Burns and Leo Grebler, The Housing of Nations: Analysis and Policy in aComparative Framework (London: Macmillan, 1977).
15. Collier, Squatters and Oligarchs, pp. 40-54; A. A. Laquian, "Squatters and SlumDwellers," in Housing Asia's Millions, ed. Stephen H. K. Yeh and A. A. Laquian (Ottawa:International Development Research Center, 1979), pp. 51-65. Payne, Urban Housing inthe Third World, p. 198, refers to similar policies in Turkey.
2Cartagena
CARTAGENA DE INDIAS IS COLOMBIA'S MAIN CENTER for two rather contradic-tory activities: tourism and the production of chemicals, especially petro-
chemicals. The city also remains an important naval base, capital of theDepartment of Bolivar, and the commercial center for a cattle-raising hin-terland. The influx of tourists, sailors, students, smugglers, migrants fromthe interior, as well as workers back from Venezuela makes demographyguesswork in Cartagena, but a population of 429,000 seemed reasonablefor 1978.
Evolution of the City
Tourists are attracted by the city's pleasant configuration of peninsulasand islands between a large bay of the Caribbean Sea and a series oflagoons (see map, frontispiece). During the colonial era, this configura-tion made Cartagena the fortified port best suited for collecting goldfrom all Nueva Granada until enough was at hand for a convoy ofgalleons. The date of the Spanish founding of Cartagena is 1533; that ofthe preceding Indian settlement of Calamary is a problem for ar-cheologists. African slaves built an elaborate (and now photogenic)series of fortifications for the Spaniards and dug the Canal del Dique, a115-kilometer diversion of the Magdalena River. In 1851 the slaves werefreed. Just before national independence in 1811, the population of Car-tagena was estimated at 18,000 and just afterward at 12,000, indicatingthe hazards of liberation.
In the latter half of the nineteenth century, the economy of Cartagenawas stimulated by a brief tobacco boom and the steady growth of coffeeexports. Some of the fortifications were razed at La Matuna so that arailway could reach the docks at the Bahia de Animas. This railway andits freightyards split the former enlisted men's quarter of Getsemani
10

CARTAGENA 11
from the more aristocratic quarters along the ocean and around thecathedral. The population rose from 9,700 in 1905 to 36,600 in 1912.
The boom ended when coffee shipments were diverted to Buenaven-tura on the Pacific Coast after the opening of the Panama Canal in 1914.When the port of Barranquilla at the mouth of the Magdalena was prop-erly dredged in the 1930s, Cartagena lost additional shipping. Asomewhat premature oil refinery had been set up in 1908 and was closedin 1921. In the early 1950s the railway and its station, called La Machina,were dismantled, leaving space for a sector of high-rise banks and officesthat would finance and organize the tourism and chemical industries.
The population rose from 85,000 in 1938, to 129,000 in 1951, and to242,000 in 1964. The migrants of the 1950s included many refugees fromthe anarchic civil war in the interior, La Violencia. The first squatters ap-propriated the former garbage dump of San Francisco in 1955, just as anew one was being started at Albornoz. These squatters were rounded upin trucks and locked in the athletic stadium while their shacks wereknocked down. The second great eradication of 4,000 dwellings on 9hectares at Chambacu proceeded more gently from the late 1960s to 1973with sociological guidance and compensation. If Cartagena was tobecome enchanting to tourists, a vast encampment of shacks was simplyintolerable between the giant fortress of San Felipe and the crenellatedwalls of San Diego.
Meanwhile the central city behind its fortifications was declared ahistorical monument, except for La Matuna, and only whitewashed col-onial houses could be built or renovated here. Balconies and patios werenow cultural shrines, together with the Palace of the Inquisition. The na-tional government appropriated money for a sewerage system thatopened in March 1968. Rich old families had already moved from the Cen-tro to Manga and to Bocagrande. Until the 1970s there had been only onelarge tourist hotel in Bocagrande, low-rise and elegant but unaircondi-tioned, built in 1948. Now high-rise hotels and condominiums appearedalong the beach, and mansions were converted to pensions, pizzaparlors, and discotheques. The displaced rich, by no means impoverishedby the change, have built new mansions for themselves, in some cases 12kilometers west of town on the hills of Turbaco. The chemical plants andrefineries are located 12 kilometers south of town at Mamonal. For-tunately the tradewinds blow from the north.
They blow hardest from December through March, the dry season.On the coolest January mornings the temperature falls to 19 degrees (C),the annual minimum. As one might expect at 10 degrees of latitude northof the equator, the August maximum averages 32 degrees, but thetemperature can reach 36 degrees. The rainy season is May to October
12 CARTAGENA
and generates an annual 885 millimeters of rainfall. Average humidity is88 percent.
Cartagena is governed by three levels of government-national,departmental, and municipal-and autonomous public agencies. The na-tional president appoints the governor who appoints the mayor, whoworks with an elected municipal council. The national government playsa predominant role in health, welfare, education, and housing. Amongfour autonomous municipal agencies, the Empresas Publicas Municipales(EPM) is most important since it supplies water, provides refuse collectionand sewerage disposal, builds some and maintains all streets and parks,fights fires, and administers the slaughterhouse and municipal markets.Most streets and roads, however, are built by the Valorization Depart-ment, which finances its work with special assessments. Private firmscarry out the actual construction. Coordination of all this is complex andsubject to frequent changes.1
Population and the Economy during the 1970s
From 1964 to 1978 the population of Cartagena grew at an annual rateof 4.2 percent and reached 429,000, excluding tourists and temporarymilitary personnel. The 1973 census is considered very inaccurate, off by10 to 50 percent, so that it is preferable to use a variety of local statisticalinterpolations. 2 Perhaps some 123,000 people were economically active.In recent years unemployment has been estimated at around 19 percent.About two-thirds of employment is informal, that is, in activities notregistered with the Colombian Social Security Institute. The distributionof employment in the municipality in 1975 is shown in Table 2-1.
Labor force participation was 70 percent among men and 25 percentamong women. Men had a life expectancy of 58.6 years; women, 62.5years. Adjusted infant mortality was 111 per thousand. The 1973 grossbirth rate (adjusted by the Chandrasekar-Deming method) was urban,3.0 percent; semi-urban, 3.8 percent; and rural Bolivar, 4.9 percent.Rural women were likely to have completed families of 9.9 children; ur-ban women had 2.9 children. Women with no education had 4.8children, those with only primary education 2.7 children, those withsecondary education 1.3 children, and those with higher education only0.5 children.3
The distribution of employment and income among four generalcategories of workers according to the census of 1973 is shown in Table2-2. Most striking is that 65 percent of workers earned 1,500 pesos or less

CARTAGENA 13
Table 2-1. Distribution of Employment, 1975
Sector Number of employees Percent
Agriculture, forestry, fishing 2,600 3.0Mining 300 0.4Manufacturing 12,000 12.8Construction 5,600 6.5Electricity, gas, water 1,100 1.3Commerce 20,100 20.0
Finance 2,300 2.7Personal services 30,600 31.0Government 10,500 11.1Military and police 2,100 2.4Transport 7,400 7.5Communications 1,100 1.3
Total 95,700 100.0
Source: Department of Economic Research of the University of Cartagena.
per month, which is less than about 6,000 1978 pesos (US$154). In oursurvey we found that only 39.2 percent of households earned less than6,000 pesos. A total of 65 percent earned up to 9,400 pesos. Only 29 per-cent of all households received their income only from the earnings ofone person.
One could go on with other statistics. For example, some 100,000children, nearly one-fourth of the population, were enrolled in primaryand secondary education. Vocational programs enrolled about 17,000workers, and an additional 4,500 students were in the three institutionsof higher learning: the University of Cartagena, the Corporacion Tecno-l6gica de Bolivar, and the Cartagena branch of the University JorgeTadeo Lozano. Fifteen hospitals had more than 1,000 beds.
In 1976, 1,044 ships docked in the Bay of Cartagena, not quite threedaily. Compared with the 700 tourists and other visitors who arrived byship, about 200,000 came by air. To swell their numbers further, in July1978 the cornerstone was laid for an International Convention Center atthe Bahia de Animas. It will accommodate 4,000 delegates in two audi-toriums connected by closed circuit television.
In August 1978 a new urban physical development plan was issued toprevent the encroachment on one another of tourists, industries, andhousing. Of the 5,310 hectares that were considered part of the urbanarea of Cartagena, half were under water in rivers, channels, bays,
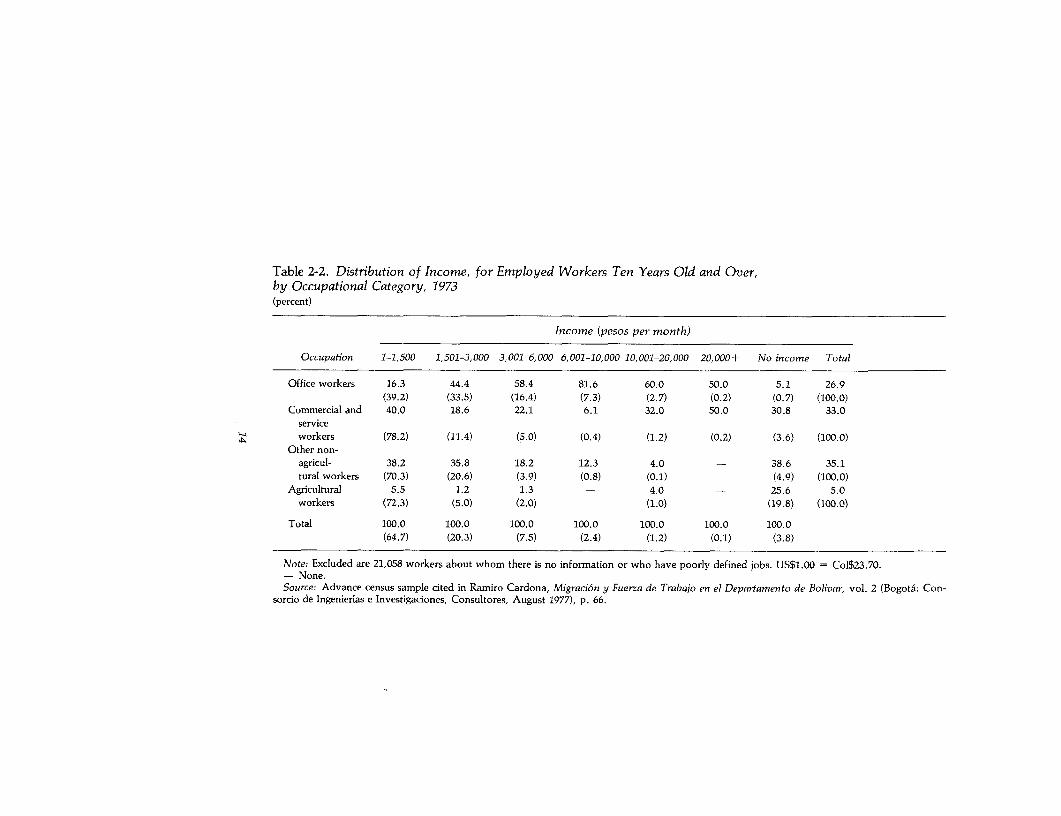
Table 2-2. Distribution of Income, for Employed Workers Ten Years Old and Over,by Occupational Category, 1973(percent)
Income (pesos per month)
Occupation 1-1,500 1,501-3,000 3,001-6,000 6,001-10,000 10,001-20,000 20,000+ No income Total
Office workers 16.3 44.4 58.4 81.6 60.0 50.0 5.1 26.9(39.2) (33.5) (16.4) (7.3) (2.7) (0.2) (0.7) (100.0)
Commercial and 40.0 18.6 22.1 6.1 32.0 50.0 30.8 33.0serviceworkers (78.2) (11.4) (5.0) (0.4) (1.2) (0.2) (3.6) (100.0)
Other non-agricul- 38.2 35.8 18.2 12.3 4.0 - 38.6 35.1tural workers (70.3) (20.6) (3.9) (0.8) (0.1) (4.9) (100.0)
Agricultural 5.5 1.2 1.3 - 4.0 - 25.6 5.0workers (72.3) (5.0) (2.0) (1.0) (19.8) (100.0)
Total 100.0 100.0 100.0 100.0 100.0 100.0 100.0(64.7) (20.3) (7.5) (2.4) (1.2) (0.1) (3.8)
Note: Excluded are 21,058 workers about whom there is no information or who have poorly defined jobs. US$1.00 = Col$23.70.- None.Source: Advance census sample cited in Ramiro Cardona, Migraci6n y Fuerza de Trabajo en el Departamento de Bolivar, vol. 2 (Bogot6: Con-
sorcio de Ingenierias e Investigaciones, Consultores, August 1977), p. 66.
CARTAGENA 15
lagoons, and marshes. Some of these were being filled in by familiesseeking land for squatting, as described in this study. The primary fillarea was the Southeast Zone that extended for 7 kilometers along thesouthern shore of the Cienga de Tesca. The families that moved here hadgood access to employment, markets, and schools. Filling in land waseasy because even in the wet season, the water was no more than from 20to 40 centimeters deep. However, periodic damage came with storm-water runoff from nearby hills and from tidal incursions that could reach80 centimeters. Seven drainage ditches and several minor canals ranthrough the area but were not enough to keep trickles from kitchens andouthouses from meandering about. Nevertheless, in 1975 it was decidednot to eradicate this zone, and in November 1977 a program began oflarge-scale filling in with limestone and general upgrading. Total costwas estimated to be $35 million, including a foreign exchange componentof $10 million that came primarily from a World Bank loan.4
Of the 2,650 hectares of dry Cartagena land, about 81 percent issuitable for urbanization, being neither too high nor too steep. By con-trast with other cities, it has not been increasingly difficult to find landfor expansion of the city. Since the 1950s the density of settlement has re-mained fairly stable at around 160 people per hectare. Of course, growthhas meant greater investments in roads and infrastructure. But the cityhas been expanding away from the confinements of islands and penin-sulas below the steep hills toward open country. It has been movingsouthwest toward the industrial areas of Mamonal and Pasacaballos,and even a few of the rich have migrated southwestward towardTurbaco.
Plans for the land have been followed by plans for the water, in theform of measures to halt further pollution of the bay. As a first step, 30million pesos (US$770,000) was allocated to coordinate national and in-ternational pollution studies.
Employment in the Formal Sector
The formal economic sector of Cartagena can be defined as enterprisesaffiliated with the Instituto de Seguros Sociales (Social Security).According to the Institute, in December 1977, 2,100 such enterprisesemployed 32,300 workers (15.4 workers per firm) and paid them anaverage of 4,070 pesos (US$105) monthly. Compared with the previousyear, employment had risen by 4.7 percent, and the average wage by23.2 percent. Since the cost of living for workers (Barranquilla) rose by46 percent, real wages declined by about 15 percent.

16 CARTAGENA
Income distribution in the formal sector was:
Income (pesos) Percentage of workers0-2,040 1.0
2,040-2,819 50.92,820-3,779 15.43,780-5,039 14.05,040-8,399 11.78,400-16,000 5.5
16,000+ 1.6
According to the Institute, workers were distributed among the sectorsas follows:
Percentageof formal
Economic sector employmentManufacturing 30.9Construction 4.1Electricity, water 2.3Commerce, banking, insurance 25.3Transport, communications 6.8Other services 26.0Miscellaneous 4.6
The 30.9 percent of workers in manufacturing was a much higher sharethan the 13 percent of the labor force as a whole. The number of workersin construction had fallen from 2,400 in 1976 to 1,300. The governmenthad tightened credit to offset inflationary pressures from the boom incoffee and illegal marijuana exports. The Banco de la Republica exchangeddollars for pesos without asking questions at the ventanilla siniestra.
Women made up 29.5 percent of the workers in the formal sector.About 8,900 men and women, or 28.9 percent, belonged to trade unionsin 1976. Since the labor force of the formal sector was 32.3 percent ofemployment in 1975, trade unions made up only 9 percent of the total.
Within the formal sector, the largest twenty-five enterprises employedan average of 255 workers, for a total of 6,400 at the end of 1977. Largestof all was the chemical firm, Alcalis de Colombia, with 1,600 workersand sales of 800 million pesos (US$21 million). First in output was thegovernment refinery, Ecopetrol, with 2.6 billion pesos (US$67 million)and 380 workers. Other employers of more than 100 workers packedfish; made chewing gum; processed vegetable oil; bottled soft drinks;made soap, polymers, chemicals, and petrochemicals; and worked onships. Less important were dairies, bakeries, and plants making textiles,paper products, shoes, and furniture. Altogether the largest twenty-fivefirms produced an output of 9.3 billion pesos (US$237 million) of which
CARTAGENA 17
they exported one-third in 1977. Output per worker in these capital-intensive plants was 1.45 million pesos (US$37,000). Without therefinery, output per worker was 1.1 million pesos (US$28,000).
Cartagena's share of national industrial output was 3.8 percent in1975, not remarkably high and unchanged since 1966. Striking,however, was its 17 percent share of chemicals. Together with petroleumproducts, this sector produced 70 percent of the manufacturing output,required 84 percent of the investment, and therefore employed only 26percent of manufacturing workers. The rest of the formal sectoremployed 43 percent, and handicraft manufacturing employed 31 per-cent. To attract more medium-sized, nonchemical industries, the Na-tional Association of Industrialists backed plans for a free port with anindustrial park. They hoped that some firms might set up headquarters inCartagena rather than Bogota and that manufacturing employmentwould rise to the national average of 14.6 percent. 5
The Free Port and Export Processing Zone
Plans for the Cartagena free port or Zona Franca Industrial y Comer-cial de Cartagena (zFIc) began in 1973 with the experience of ShannonAirport in Ireland as a model. South of Mamonal (the existing industrialcomplex) 104 hectares had been set aside for eighty-six industrial sitesnear the fishing village of Pasacaballos. The cost of the first stage ofabout 640 million pesos (US$16 million) was primarily financed with aWorld Bank loan. Represented on the board of zric were the State ofBolivar, the City of Cartagena, and such branches of the nationalgovernment as SENA (vocational training), ICT (low-cost housing and ur-banization), the Corporaci6n Financiera Popular (small enterprise pro-motion), and the Instituto Colombiano de Bienestar Familiar (familywelfare). Industrial development was to be combined with touristfacilities and social programs for thirteen nearby communities. Never-theless, as a dependency of the Ministry of Development, the main pur-pose of zFic was economic. By 1987 some sixty primarily foreign-ownedplants are supposed to employ 20,000 workers and export 80 percent ofUS$150 million (1976 U.S. dollars) in goods. Umbrellas, plastic plumb-ing fixtures, and inflatable boats were expected to lead the way in theearliest plants. To avoid a crass and destabilizing difference between ac-tivities associated with the free port and existing communities, the newwas to be integrated with the old, for example, through the extension ofpublic services. At the beginning further steps were still a matter ofresearch, and several surveys were under way. 6 Environmental con-
18 CARTAGENA
siderations were included to avoid such past mistakes as destroying theoyster mangroves of Cartagena Bay through pollution.
The broader goals of the Free Zone related to all aspects of economicand social development .7 Consequently there were nutritional programs,educational programs, and health programs, including improvement ofwater and sewerage systems. The area seemed suitable for a neighbor-hood development center (Centro de Desarrollo Vecinal). By late 1976 acommunal enterprise for making building materials (Empresa Com-unitaria de Producci6n de Materiales para Construcci6n) had been set upwith support of the Corporacion Financiera Popular, a government bankfor small firms. The twenty-one founding members were various types ofconstruction workers with an average age of twenty-two. Because ofdelays in the rest of the project, this enterprise failed, but it may be reviv-ed. A restaurant was the second such enterprise, but it was limited to ser-ving subsidized food to primary school children. Both firms will beneeded when buildings in the Free Zone are under construction.
A Tour of the City
For most outsiders, a drive around the city was likely to begin at ahotel in Bocagrande, the narrow peninsula that was redesigned by aDutch engineer a generation ago. Tourism had intruded on Bocagrande'spastel villas among luxurious gardens and had brought in hotels, icecream parlors, and horse carriage stands like those in resorts throughoutthe world. On the bay side was the naval station with its marines incamouflage uniforms drilling on the parade ground. Going north,Avenida San Martin became Avenida Venezuela where the ramparts ofthe historical center ended and the high-rise banks of La Matuna began.A bridge led to a large empty stretch below the Fortress of San Felipe deBarajas. Here the great slum of Chambacu (population 8,000) waseradicated in the late 1960s and early 1970s, and here preparations forthe construction of luxury apartments had begun but were then stalledfor years.
Continuing north one saw a number of quarters between the woodedpromontory of La Popa (the poopdeck) and the sea. The income levelvaried sharply from block to block, even from house to house. The con-dition of streets varied from poor to impassable swamp. The city endedwith a settlement for noncommissioned military personnel in a trianglebetween the shore and the airport. Streets were unpaved because the cityconsidered that a task for the navy, but the navy left it to the city.
CARTAGENA 19
The airport runways were so close to the muddy lagoon, Cienaga deTesca o la Virgen, that no squatters were found along this shore. Butthey had settled along the Canio Juan De Angola that drained this lagoon.Huts were made of odd-size pieces of old lumber and were surrounded bybamboo fencing. As symbol of persistence, one settlement was defiantlycalled Cara del Perro. Smoke showed that the squatters were cookingwith wood. Their neighbors used kerosene bought from one of the two-barreled, two-wheeled donkey carts that one passed on the streets. (Themiddle and upper classes cooked with bottled propane.) Little cardboardhuts were not really latrines along the Canios and Cienagas because atnight the excrement was dumped into the water. Stacks of enormous ce-ment pipes showed that these northem districts might eventually get asewerage system.
To reach the eastem districts after seeing the northem Crespo and LeMaitre, one had to drive back along the Paseo Bolivar to the Fortress ofSan Felipe and tum left on Avenida Don Pedro de Heredia, a noisy routecrowded with trucks and buses. It passed just below the highest point ofLa Popa with its Augustine monastery. Squatter shacks on the slopeswere spreading fast but might be eradicated for reforestation to preventerosion. Besides, they were above the 25-meter limit for pumping waterin Cartagena.
Beyond the football stadium, the bull ring, and the baseball field camethe public housing developments of ICT (the Territorial Credit Insti-tute)-first, Chiquinquira, then RepCblica de Venezuela. Here 800Chambac6 households who had been owners were resettled. They hadowned their ChambacC houses for an average of seventeen years. Thesefamilies were too demoralized by the confiscation to improve their newminimal 42-square-meter concrete block houses. The new houses indeedlooked raw and uncared for, with nothing planted. Settlers from otherparts of Cartagena, usually richer, had plastered, painted, and addediron grills, glass windows, and tile floors. A few occupants had evenbuilt a precarious second story and an occasional carved woodenbalcony of the sort seen in the historical center. In 1980 tensions still ex-isted among those from ChambacC and other residents of Chiquinquira,making community action programs impossible.8
Between the ICT and other developments were large empty stretches ofweedy terrain reputedly held by speculators. Over the crest of anuninhabited hill one came suddenly into a valley with shacks amongbanana leaves and thick foliage, an invasion of squatters, called El Mi-lagro (the miracle) because it sprang up almost ovemight. icr was help-ing these people get loans for legal title to their land, provided they

20 CARTAGENA
would relocate in a systematic fashion. A new water treatment plant wasto be built nearby, but for the time being trucks delivered water at tentimes the normal price.
El Milagro in the eastern hills was quite different from the vast squattersettlement along the southern shore of the Cienaga de Tesca o la Virgen.In this Southeast Zone the taxi let one off in 1978 where the road becamean impassable trail with hilly and marshy places. Shacks were closetogether, and the salty earth discouraged even tropical vegetation, henceshade. Some houses had short spiral-fluted white columns that supportedroofs over small terraces. A few were unpainted, but others were pink orturquoise or had mosaics of sailboats or fish. Fancy signs gave housenumbers, often unauthorized and just randomly chosen by the owner. Somany children were about that each house seemed like a school duringrecess. In the doorways air stirred a little, perhaps cooling a very younggirl standing there in some stage of pregnancy. Dogs were abundant andseemed to be suffering with the heat or disease.
Most corner houses had a business, such as selling fried snacks or softdrinks. Tailors and furniture makers had their terms of credit painted onthe walls. Some sold water out of 2-meter-square cement cisterns thatwere filled when water was available (in 1978 between 2:00 AM and 5:00AM). Few houses had a connection, and by dawn all the water had beensold.
Near the shoreline, the last huts became utterly rudimentary withoutany decorative touch. The path dipped gradually into a morass ofsewerage, and what the map showed as a street was just a few rottingboards between mounds built during the dry season by squatters. Thelast mound was an island with a framework for the latest hut, but no onewas about except three muddy pigs, signs of wealth. A ramshackle out-house was on a little peninsula. Patches of short mangrove were nearby,and a solid mangrove stretch shuts off the horizon a few hundred yardsaway. White herons and other waterfowl stalked about in the lagoon,proving how shallow it was. Pelicans came in for landing, then flew off.
By December 1980 the Southeast Zone was dry, since most of thedrainage ditches were in operation and yellow clay had been dumped inand spread throughout the area as part of the IcT-World Bank project.The little huts appeared to be sitting in holes. Their owners now had toshovel in dirt through the doors and, in some cases, raise the roofs. Afew blocks away the water sellers could now turn on the taps as early as10:00 PM.
A drive around Cartagena would be incomplete without a visit to theoutskirts of Turbaco on a plateau a dozen kilometers away. Here a fewwealthy Cartagenians introduced something new to their society: com-

CARTAGENA 21
muting. With red tile roofs and elaborate balconies, their mansionsshowed nostalgia for the historical, fortified center, and even the multi-car garages were in the colonial style. The cost of water depended on thedepth of wells and on the size of lawns to be watered in the dry season.Pumping it up depended on uncertain electric power. The urge to com-mute from these lonesome heights was overestimated by developers,however, and in late 1980 the empty network of streets and lightpostshad almost disappeared among tropical weeds and shrubs and resembledan unexplored archeological site with remnants of some lost civilization.
Notes to Chapter 2
1. Johannes Linn made a thorough analysis of the situation in the mid-1970s in "UrbanPublic Finances in Developing Countries: A Case Study of Cartagena, Colombia," Urbanand Regional report no. 77-1 (Washington, D.C.: World Bank, January 1975; processed).
2. Regulo Ahumada Sulbaran, "A Medias Qued6 el Censo de Cartagena," El Espectador(August 11, 1978). In this study we have used the detailed estimates of Gustavo Pacheco,demographer at the University of Cartagena. They were generally preferred by localexperts.
3. Ramiro Cardona, Migraci6n y Fuerza de Trabajo en el Departamento de Bolivar,vol. 1 (Bogota: Consorcio de Ingenierias e Investigaciones, Consultores, August 1977),p. 71.
4. World Bank data.5. Asociaci6n Nacional de Industriales, Monograffa Industrial de Cartagena, 1976 (Car-
tagena, 1977), pp. 22-23.6. Ministerio de Desarrollo Econ6mico, "Zona Franca Industrial y Comercial de Car-
tagena: Una Visi6n Nueva de Una Regi6n en Desarrollo" (Cartagena, August 1976).7. Humberto Serna Gomez and Francisco Rodriguez Urrego, Area de Promoci6n
Humana y Desarrollo Tecnol6gico, Informe Segunda Etapa (Bogota: Ministerio de Desar-rollo Econ6mico, September 1976).
8. Robert V. Farrell and Lacydes Cortes, "Four Walls Are Not Enough: A Case Study ofEducation and Housing in Cartagena, Colombia," International Journal for HousingScience and Its Applications, vol. 4, no. 5 (1980), pp. 425-26.
3Physical Need for Housing, Water,
and Waste Disposal
STUDIES AND POLICY RECOMMENDATIONS ON HOUSING usually take "need" insome physical sense as a point of departure. Intense sun, rain, wind, orcold make some form of shelter necessary for physical survival in manyparts of the world, so it is tempting to put housing in a class with water,food, sanitation, and medicine as a "basic need." After disasters such astyphoons or earthquakes, tents are usually among the goods that are sentin as emergency relief; but for more than short-term survival, they willbe inadequate. Improvement in housing quality, however, has troublecompeting with primary education and job-oriented investment forspecial public favors. One cannot really specify a minimum amount ofspace per person or a maximum number of persons per room with asmuch confidence as the need for water within 200 meters or a minimumof 2,350 calories per adult male. Since access to water reinforces thedesire for more space and other improvements, basic and secondaryneeds cannot be unraveled in practice. The term "basic need" loses mostof its physical connotation if it is defined as that which is the minimumsocially acceptable.
Flows and Standards
But if things are, in fact, complex, nothing is lost when an over-simplification is abandoned. A dwelling performs more functions than atent or an umbrella. The location of each dwelling is unique and gives ac-cess to work, to public amenities such as schools and parks or police andhospitals, and to various neighborhood benefits of a physical and socialnature. Each of these is obtained not once, but steadily over a period oftime: they are a flow of services that are received for outbidding or out-maneuvering other claimants for a particular site. The size of the site and
22
HOUSING, WATER, AND WASTE DISPOSAL 23
the implied density of settlement also matter and give rise to flows ofbenefits. Flows from the structure itself come not only from the roof andwalls but also from the lock on the door, the decorations, work space,rental income from lodgers, the chance for long-term capital gains, andthe plumbing. Even vacant units raise the flow of benefits from the ex-isting housing stock because they facilitate moves from one unit toanother.
It is costly to provide each of these flows. The installation has to bebuilt; the component must be added, and often land must be divertedfrom other productive uses. Since a society's values can diverge from itsperformance, the minimum socially acceptable can easily cost more thansociety can afford. If all families are to reach the minimum level for hous-ing, such a large share of GNP may have to be spent on construction thatnutrition, health, and education will fall drastically below their ownsocially acceptable minimum level. Housing standards can be both asafeguard and a spur to action if they are somewhat in advance of eco-nomic possibilities; but when they rise to unrealistic levels, they will besimply ignored as curiosities in the archives.
There are two implications. One is that minimum socially acceptablestandards are not absolute but will rise in the course of economic devel-opment. The other is that different standards can be applied to differentincome groups-that more can be asked of the rich than of the poor. Inother words, the subject of this chapter-need and physical stan-dards-cannot be separated from that of the next-income, finance, andeffective demand.
Economic factors primarily affect the quality of the dwelling becausethat depends on each household's ability to pay rent, to build, or to fi-nance a loan. The number of units that must be built depends on the rateof population growth, specifically the rate of household formation. Al-though they are not independent, these demographic and sociologicalfactors can be discussed separately from income trends.
The provision of streets, drainage, water, and sewerage systems doesmainly depend on the sheer numbers that have to be served and involvesso many economies of scale and externalities that they will often be sub-sidized or provided at public expense. Such subsidies should neverthelessbe avoided as much as possible. The provision of infrastructure alsohelps to determine the density of settlement and therefore the type ofstructure and neighborhood.
Density standards vary with income, transport technology, and thenumber of people in a city. Improvements in income and transport tendto improve density standards by raising the space per household. Popu-lation growth works in the opposite direction. Households in a prospering
24 HOUSING, WATER, AND WASTE DISPOSAL
but rapidly proliferating city may,therefore have to change their conceptof what is a minimally acceptable density. Instead of having a free-standing dwelling, they may have to learn to share walls with neighborsand ultimately to share buildings, perhaps in the form of a condomin-ium. As buses came to Cartagena, the density fell from 294 people perhectare in 1916 to 163 in 1956. After that the density nearly stabilizedand was estimated as 157 in 1976. Luxury apartments have found a mar-ket in prestigious neighborhoods such as Laguito in Bocagrande, butmiddle- and lower-income groups still resist the distasteful risks of shar-ing buildings with strangers. They believe that they can never be pres-sured into that.
Housing Needs and Zones
Reports of housing needs in Cartagena resemble those made for othercities. Studies describe and project population growth and density.Changes in household formation, family structure, and age distributionmodify expectations, but not necessarily in a precise way. Even morevague and subjective are surveys of deficiencies of existing houses andthe "qualitative gap." More precise are estimates of needs for publicutilities that will allow dwellings to have washbasins, sinks, showers,and toilets. What it takes to make better neighborhoods beyond that stilleludes specification.
If we accept Gustavo Pacheco's estimate of the Cartagena populationas being 428,800 in 1978 and if the average family had seven members,then 61,300 dwellings were needed (not counting a stock of useful vacan-cies). If population is projected to grow 4.4 percent per year up to 1990(perhaps a maximum), it will reach 721,000 people. If the average house-hold size remains the same, then 103,000 units will be needed in 1990. Ineach of the twelve intervening years approximately 3,475 dwellings willhave to be build if the housing backlog is not to worsen.
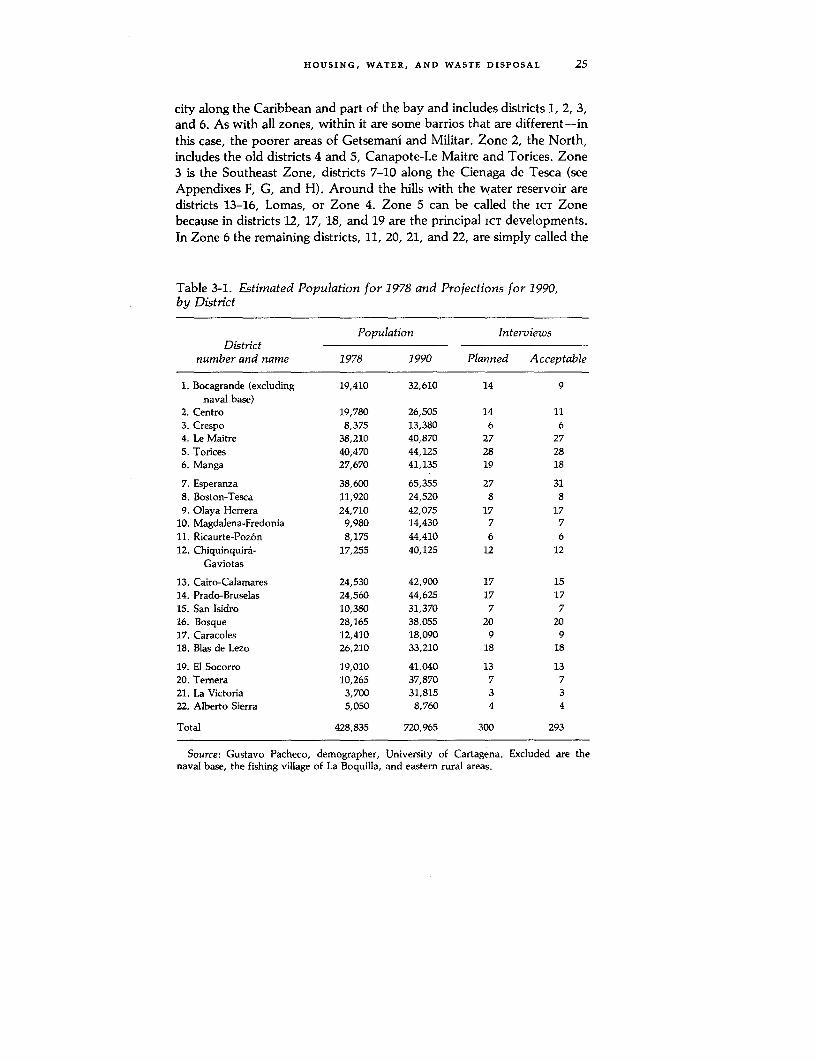
The changing density of settlement can be seen from Table 3-1, whichgives Pacheco's 1978 and 1990 estimates in terms of twenty-two principaldistricts. Pacheco divides each of these further into anywhere from twoto seventeen barrios. Our sample of 300 interviews was selected on thebasis of these barrio densities. Although the total population rises byonly 68 percent, most of the western districts (numbers 10-22) double,triple, and more in population.
In presenting data geographically in this study, the twenty-twodistricts have been combined into six zones with distinct characteristics(see map, frontispiece). Zone 1, the Coast, is the high-income part of the
HOUSING, WATER, AND WASTE DISPOSAL 25
city along the Caribbean and part of the bay and includes districts 1, 2, 3,and 6. As with all zones, within it are some barrios that are different-inthis case, the poorer areas of Getsemani and Militar. Zone 2, the North,includes the old districts 4 and 5, Canapote-Le Maitre and Torices. Zone3 is the Southeast Zone, districts 7-10 along the Cienaga de Tesca (seeAppendixes F, G, and H). Around the hills with the water reservoir aredistricts 13-16, Lomas, or Zone 4. Zone 5 can be called the ICT Zonebecause in districts 12, 17, 18, and 19 are the principal ICT developments.In Zone 6 the remaining districts, 11, 20, 21, and 22, are simply called the
Table 3-1. Estimated Population for 1978 and Projections for 1990,by District
Population InterviewsDistrict
number and name 1978 1990 Planned Acceptable
1. Bocagrande (excluding 19,410 32,610 14 9naval base)
2. Centro 19,780 26,505 14 113. Crespo 8,375 13,380 6 64. Le Maitre 38,210 40,870 27 275. Torices 40,470 44,125 28 286. Manga 27,670 41,135 19 18
7. Esperanza 38,600 65,355 27 318. Boston-Tesca 11,920 24,520 8 89. Olaya Herrera 24,710 42,075 17 17
10. Magdalena-Fredonia 9,980 14,430 7 711. Ricaurte-Poz6n 8,175 44,410 6 612. Chiquinquira- 17,255 40,125 12 12
Gaviotas
13. Cairo-Calamares 24,530 42,900 17 1514. Prado-Bruselas 24,560 44,625 17 1715. San Isidro 10,380 31,370 7 716. Bosque 28,165 38,055 20 2017. Caracoles 12,410 18,090 9 918. Blas de Lezo 26,210 33,210 18 18
19. El Socorro 19,010 41,040 13 1320. Ternera 10,265 37,870 7 721. La Victoria 3,700 31,815 3 322. Alberto Sierra 5,050 8,760 4 4
Total 428,835 720,965 300 293
Source: Gustavo Pacheco, demographer, University of Cartagena. Excluded are thenaval base, the fishing village of La Boquilla, and eastern rural areas.

26 HOUSING, WATER, AND WASTE DISPOSAL
Outskirts. The population in 1978 and numbers of households in oursample were:
Population SampleZone (thousands of persons) (number of interviews)
1. Coast 75.3 442. North 78.7 553. Southeast 85.2 634. Lomas 88.0 595. ICT 74.9 526. Outskirts 27.3 20
Total 429 293
Further details about the sample are discussed in Appendix A.If Pacheco's estimates are correct, and knowledgeable Cartagenians
believe so, then the 1973 population was close to 350,000, not 304,000 asreported by the census of that year-a 15 percent underestimate. But ifthe population grew by 4.2 percent, and the housing stock grew by anannual 4.0 percent, then the deficit worsened more than reported by theNational Center of Construction Studies (CENAC).
CENAC projected growth rates of families and housing to 1980. For theDepartment of Bolivar it was thus assumed that each household con-sisted of 1.18 families-a ratio attained only by the other Caribbean De-partments of Sucre and Cordoba and exceeded by Atlantico with 1.24.The number of Cartagena families was expected to rise to 67,100 and thehousing stock to 52,800. Hence the deficit would go to 14,300. Thesefigures imply nothing about the changing deficit in qualitative terms.Moreover, given the erratic quality of the 1973 census, the projectionsare open to a large margin of error. Before giving more details from the1973 census, the concept of household and family structure should be ex-amined.
Family Structure
According to definitions used for the 1973 census, members of a house-hold live in the same dwelling and share at least one meal daily. Theymay be related or not. CENAC defined a family as a group of related peo-ple living together, including grandparents, uncles, and aunts. If any ofthese has a spouse present, however, the household is defined as con-sisting of two or more family units.
HOUSING, WATER, AND WASTE DISPOSAL 27
These definitions do not apply well to the way of life in Cartagena. Forthe poor, the recognized head of the household, the owner of the dwell-ing and provider of most income, may be a woman working in Venezu-ela as a cook. For the rich, the head may be a father or brother whomanages a cattle ranch in the interior. In between are many variations.
A detailed analysis was made by Lacydes Cortes Diaz in 1971.1 Thepopulation was divided into categories: 5 percent upper class, 10 percentmiddle class, and 85 percent lower class. In general, the upper class livedin the three barrios of Bocagrande and in Crespo. The middle class livedin the other oceanfront barrios of the Centro, San Diego, Cabrero, andMarbello, as well as in Militar, Pie de la Popa, Manga, Alto Bosque, andNuevo Bosque. The poor lived everywhere else, with some much poorerthan others. The pattern of settlement was extremely heterogeneous,however, with rich and poor, ancient and upstart families intermingledin several parts of the city.
According to Cortes, in 1971 the wealth and achievements of some hadnot yet become equivalent to the ancient name inherited by a group ofpoorer and relatively undistinguished people.2 This group stressed inter-marriage within itself or with outsiders of European ancestry and thus seta model of racial prejudice for the rest of the population. According to asurvey by Triana y Antorveza, about 70 percent of poor Cartageniansconsidered whites superior and preferred to marry them either to"preserve" or to "improve" their family stock.3 Household income of thethree classes, according to Cortes, ranged from a monthly average of2,300 pesos for the poor, to 7,100 for the middle group, to 10,000 pesosfor the upper class. In terms of 1978 pesos, the income levels were: lowerclass, 6,000 pesos (US$150); middle, 18,000 pesos (US$450); and upper,25,000 pesos (US$650).
The Cortes Diaz study goes on to discuss the division of households be-tween 60 percent legitimately married couples and 40 percent freeunions. Women suitable for marriage with men of status had to seempure and innocent. This characteristic was shown by lack of enthusiasmfor and skill in lovemaking, which in turn led husbands to frequenthouses of prostitution or have lower-class concubines and second fami-lies. According to Cortes Diaz, these relations were public knowledgeand hence in line with public morals, a function of the social structure,quite unlike European experience.4 Second families or concubinage weredue to rigidities in marriage customs, criteria of suitability, and the im-possibility of divorce.
The lowest class consisted of domestic servants who earned 1,000(1978) pesos monthly plus room and board, as well as unskilled workers,
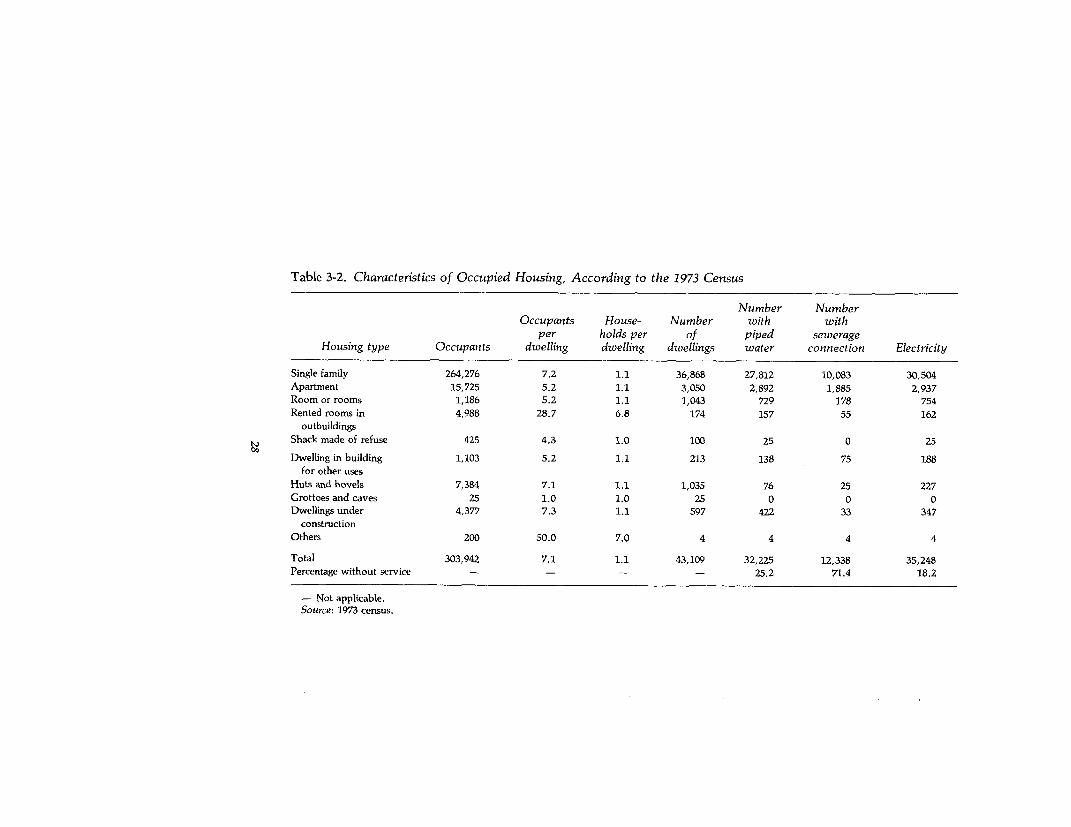
Table 3-2. Characteristics of Occupied Housing, According to the 1973 Census
Number NumberOccupants House- Number with with
per holds per of piped sewerageHousing type Occupants dwelling dwelling dwellings water connection Electricity
Single family 264,276 7.2 1.1 36,868 27,812 10,083 30,504
Apartment 15,725 5.2 1.1 3,050 2,892 1,885 2,937Room or rooms 1,186 5.2 1.1 1,043 729 178 754
Rented rooms in 4,988 28.7 6.8 174 157 55 162
outbuildingsShack made of refuse 425 4.3 1.0 100 25 0 25
00Dwelling in building 1,103 5.2 1.1 213 138 75 188
for other usesHuts and hovels 7,384 7.1 1.1 1,035 76 25 227
Grottoes and caves 25 1.0 1.0 25 0 0 0Dwellings under 4,377 7.3 1.1 597 422 33 347
constructionOthers 200 50.0 7.0 4 4 4 4
Total 303,942 7.1 1.1 43,109 32,225 12,338 35,248Percentage without service - - - - 25.2 71.4 18.2
- Not applicable.Source: 1973 census.

HOUSING, WATER, AND WASTE DISPOSAL 29
waiters, delivery men, shoe shiners, street sellers, and the like earning2,000 pesos monthly or less. Free unions were common among them, andCortes found that only 17 percent in that state were embarrassed aboutit. In fact, in about half of the entire population, the attitude wasfavorable (38 percent) or indifferent (9 percent). Completely monogam-ous males, according to Cort6s, were rare, and were gossiped about andconsidered abnormal by both sexes.5 Among the poor, a wedding wasregarded as a great expense that yielded no benefits. Like concubinage,free unions benefited poor young women by reducing the pressure tobecome prostitutes, given other social rigidities. Moreover, it preventedthe pattern of homeless vagabond children observed in some interiorColombian cities.6
Throughout this study one should therefore bear in mind that a house-hold is not a simple and obvious concept, but one that varies from coun-try to country, from city to city within countries, and from class to classwithin cities. Our definition (and that of the 1973 census) of a householdas people who live in the same dwelling and who share at least one mealdaily evades these complexities without denying their significance. Fifty-one (17.4 percent) of the sample households received aid in cash from ab-sent people who considered themselves family members. Ten households(3.4 percent) received aid from absent people who were not consideredfamily members, but who might nevertheless be fathers of some of thechildren. The four households for whom cash aid from nonfamilymembers was even the primary income averaged only 3,725 pesos(US$96) monthly. This amount compares with 9,751 pesos (US$250) forthose depending primarily on wages and salaries and with 7,143(US$183) for those depending mainly on aid in cash from absentacknowledged family members. The four households lived in dwellingsworth only 68,500 pesos (US$1,800), compared with 367,000 pesos and257,000 pesos for the other two types of households. So the difference indwelling value was greater than that in incomes. In general, householdsheaded by females lived in dwellings worth only 47 percent as much asthose of households headed by males. Related sociological questionscould not be pursued in this study, but the work of Cortes fills in much ofthe gap.
The' Housing Deficit in 1973
The 1973 census collected qualitative information about dwellings andcan help in assessing the qualitative housing deficit. For example, Table3-2 shows that the most overcrowded dwellings were 174 "rented rooms
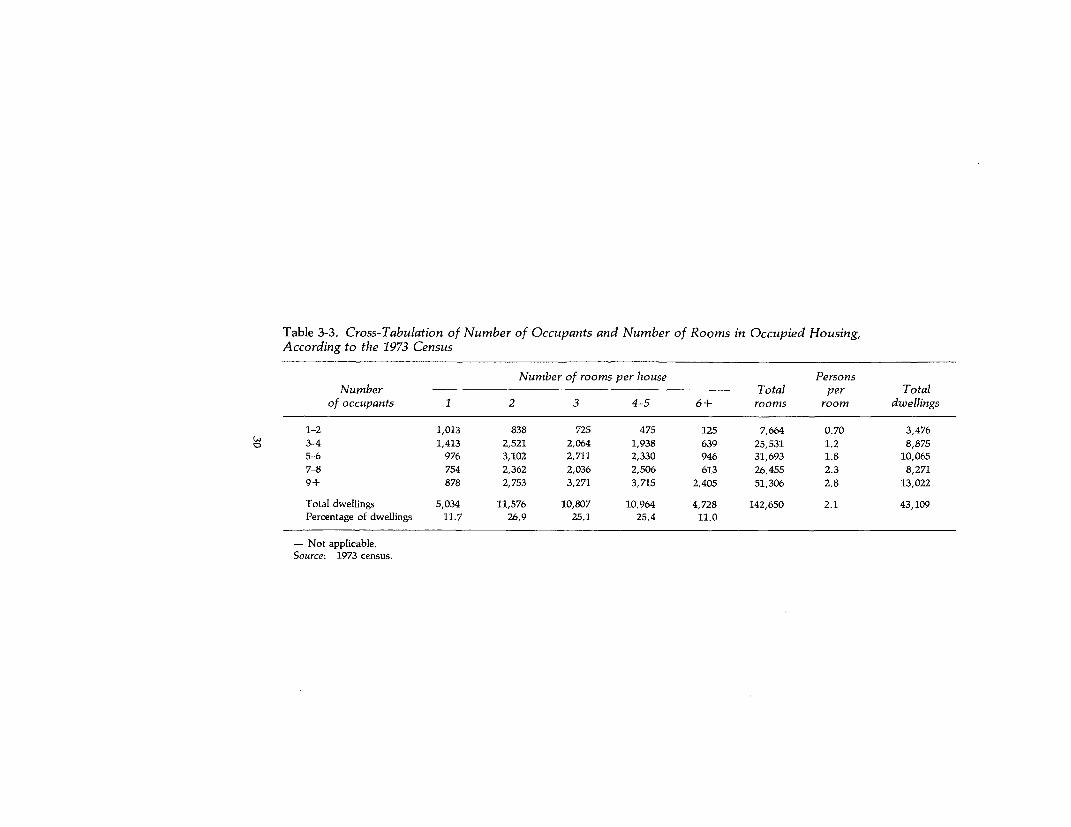
Table 3-3. Cross-Tabulation of Number of Occupants and Number of Rooms in Occupied Housing,According to the 1973 Census
Number of rooms per house PersonsNumber - Total per Total
of occupants 1 2 3 4-5 6+ rooms room dwellings
1-2 1,013 838 725 475 125 7,664 0.70 3,476
3-4 1,413 2,521 2,064 1,938 639 25,531 1.2 8,8755-6 976 3,102 2,711 2,330 946 31,693 1.8 10,065
7-8 754 2,362 2,036 2,506 613 26,455 2.3 8,271
9+ 878 2,753 3,271 3,715 2,405 51,306 2.8 13,022
Total dwellings 5,034 11,576 10,807 10,964 4,728 142,650 2.1 43,109Percentage of dwellings 11.7 26.9 25.1 25.4 11.0 - - -
-Not applicable.Source: 1973 census.
HOUSING, WATER, AND WASTE DISPOSAL 31
in outbuildings." Such structures averaged 6.8 households each and werelooked on with great disfavor. One hundred dwellings were classified as"shacks made of refuse," and 1,035 were "huts and hovels." Twenty-fivedwellings were grottoes and caves-no doubt qualitatively unsatisfactory.
Table 3-2 also shows that 18.2 percent of dwellings were qualitativelydeficient in not having electricity, that 25.2 percent lacked piped water,and that 71.4 had no connection to a public sewerage disposal system. Anumber of finer distinctions are also possible. For example, apartmentscontributed only 7.1 percent of the housing stock, but 38.2 percent ofthese lacked a sewerage connection. In discussing all these aspects of thedeficit, we have begun to cite facts that might Just as well have been leftto the chapter on the old housing stock. The difference between the ex-isting stock and its characteristics and the number of households is thehousing deficit. A physical needs survey simply surveys the supply inrelation to whatever population total is to be served.
According to the 1973 census, the median number of occupants perdwelling was six, and the median size of a dwelling was three rooms. Thecombination implies that 2.0 persons typically occupied each room. Theprecise average density of 2.1 persons per room is relatively acceptable;but, as always, concem goes to those on the unfavorable side of the aver-age. Only 7.9 percent of dwellings had one or fewer persons per room,but 47.6 percent had more than two per room. Especially crowded werethe 15.7 percent of one- and two-room houses occupied by seven or morepeople. One-eighth of these (or 878) were one-room shacks with nine ormore inhabitants. Altogether 30.2 percent of dwellings were occupied bynine or more people. Most of these dwellings had three or four rooms.Further details can be seen in the cross-tabulation of Table 3-3.
Household Size in 1978
Our sample suggests that the size of households had not changed muchby 1978. The mean was 7.03 persons (standard error 0.19). The smallesthouseholds were twelve couples, some elderly, not necessarily married,possibly siblings or parent and child. The largest were two householdswith twelve adults, one with four, and the other with twelve children,living in four and five large rooms. In both households, men were sailorsand presumably absent much of the time. Altogether 9.2 percent ofhouseholds had twelve or more members. Median and modal size was six(18.8 percent). The percentage distribution of occupants per dwelling in1973 and 1978 is
32 HOUSING, WATER, AND WASTE DISPOSAL
Occupants per dwelling 1973 1978
1-2 8.1 4.13-4 20.6 16.45-6 23.3 33.17-8 19.2 21.89-11 20.0 15.412+ 10,2 9.2
The richest and poorest districts, Bocagrande (1) and Magdalena-Fredonia (10), had the smallest households with 4.3 and 4.6 members.Largest households were in San Isidro (15) and Boston-Tesca (8), with9.6 and 8.5 members. The sample for each district was only seven to ninehouseholds, and hence the results are not statistically significant. If dis-tricts are combined into the six zones defined earlier, statistically signifi-cant differences do emerge with smallest households along the high-in-come coast, largest ones in the long-established North and Lomas, andwith the Southeast closest to the Cartagena average.
Population Household mean sizeZone (district numbers) (thousands of persons) (number of persons)
Coast (1, 2, 3, 6) 75.3 6.00North (4, 5) 78.7 7.69Southeast (7, 8, 9, 10) 85.2 7.05Lomas (13, 14, 15, 16) 88.0 7.88iCT (12, 17, 18, 19) 74.9 6.37Outskirts (11, 20, 21, 22) 27.3 6.60
Owner-occupants had larger families (average household size of 7.3)than did tenants (6.0). For both groups, the smallest households were inthe best and worst housing categories. The largest family size (10.3) oc-curred for households with an income of from 8,000 to 16,000 pesos andliving in dwellings valued at from 80,000 to 160,000 pesos.
The Need for and Supply of Water
In 1978 much of the population still carried home their water supply inrectangular cans called latas de manteca (lard cans). About fifty suchcans add up to a cubic meter. The typical family of seven members con-sumed about 1,000 such cans monthly, or 20 cubic meters.
The price of water varied with the income level of the neighborhood inaccordance with seven categories, from 70 centavos per cubic meter to 8pesos (US$0.205) according to official rates.7 But in the poor neighbor-hoods water was resold at rates that ranged from 20 to 50 centavos per

HOUSING, WATER, AND WASTE DISPOSAL 33
can. Where it had to be delivered by donkey, it cost 2 pesos. But even at20 centavos a can the cubic meter would be worth 10 pesos, that is, morethan the price charged to the rich. Some water retailers had paid for theirown connections to the water mains to be able to enter that business.They could sell water at ten times the price charged by the city. Entryinto this business was limited by lack of capital and by reluctance to livein or close to the poorest quarters of the city. Our interviews indicatedthat the water sellers earned an additional 3,000 pesos (US$77) monthlyfrom selling 500 cans daily. In the Southeast Zone this typically raisedtheir income from 4,000 to 7,000 pesos (US$103 to US$180).
The government tried to reduce water costs by installing public stand-pipes with varying success. Someone had to guard the installation tomake sure that none of the components of the faucet, especially the han-dle, would be stolen. In some cases the guard became a water seller moreor less like any other. Those who did not pay had to get their water at themost inconvenient hours.
According to our sample, as shown in Table 3-4, 71.5 percent of thedwellings had piped water, and of these 20 percent had more than onebathroom. In the high-income Coastal Zone, 60 percent of the dwellingswith piped water had more than one bathroom. Only in this zone andthat dominated by ICT developments did more than 90 percent of thedwellings have piped water. Worst off was the Southeast Zone wheretwo-thirds of the dwellings lacked water. As already mentioned, this isthe zone of the water sellers. Here are 61.5 percent of the water sellers ofCartagena, and they supply 63.5 percent of the households in this zone.Water wagons are found primarily in the Outskirts, and multiple sharingof a faucet is occasionally found in the Northern Zone. The effect ofalternative water and sewerage systems on the value of owner-occupiedhousing is examined in Chapter 5, and Chapter 6 shows how lack of in-door piped water discouraged the process of home improvement.
With loans from the World Bank, however, some of the water prob-lems were to be resolved in the early 1980s. The tank at Narifio below LaPopa and another farther west in Carmelo were ready but generated alevel of water pressure that was too great for the deteriorating old net-work of pipes.
The Sewerage System
Only about 35 percent of households had connections to the urbansewerage system in 1978: those in the old walled city; those in the high-income sectors of Bocagrande, Manga, and Pie de la Popa; and those in
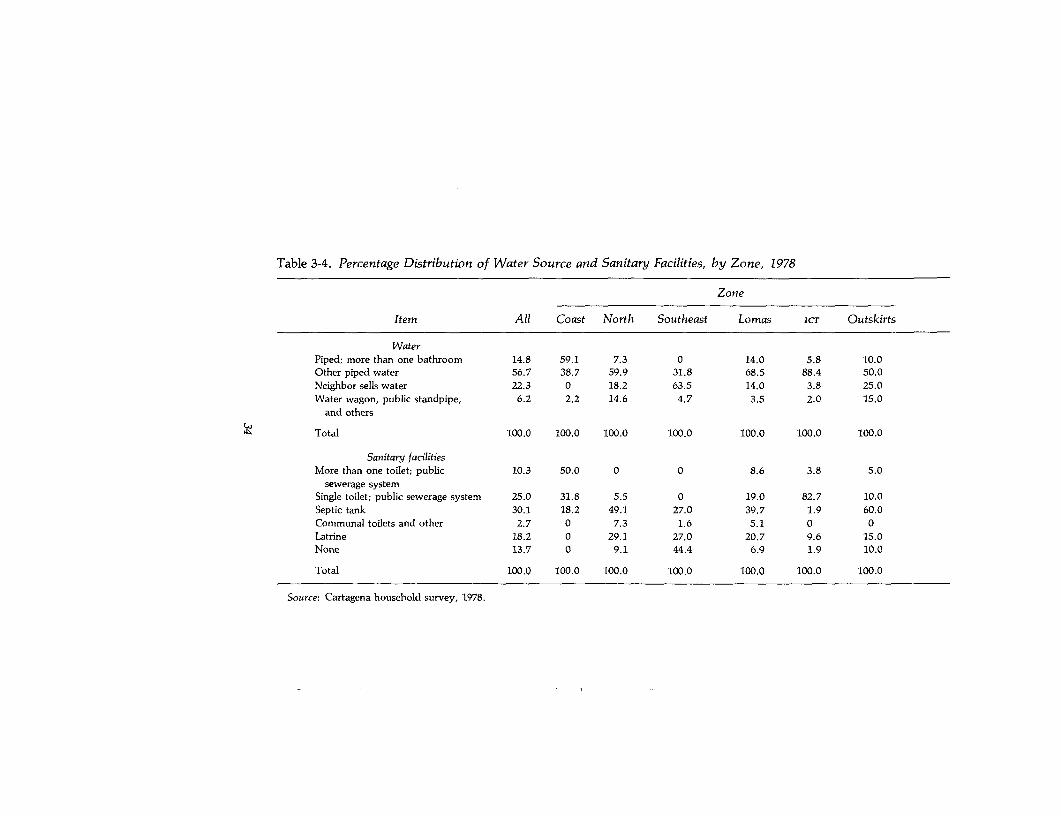
Table 3-4. Percentage Distribution of Water Source and Sanitary Facilities, by Zone, 1978
Zone
Item All Coast North Southeast Lomas IcT Outskirts
WaterPiped; more than one bathroom 14.8 59.1 7.3 0 14.0 5.8 10.0Other piped water 56.7 38.7 59.9 31.8 68.5 88.4 50.0Neighbor sells water 22.3 0 18.2 63.5 14.0 3.8 25.0Water wagon, public standpipe, 6.2 2.2 14.6 4.7 3.5 2.0 15.0
and others
Total 100.0 100.0 100.0 100.0 100.0 100.0 100.0
Sanitary facilitiesMore than one toilet; public 10.3 50.0 0 0 8.6 3.8 5.0
sewerage systemSingle toilet; public sewerage system 25.0 31.8 5.5 0 19.0 82.7 10.0Septic tank 30.1 18.2 49.1 27.0 39.7 1.9 60.0Communal toilets and other 2.7 0 7.3 1.6 5.1 0 0Latrine 18.2 0 29.1 27.0 20.7 9.6 15.0None 13.7 0 9.1 44.4 6.9 1.9 10.0
Total 100.0 100.0 100.0 100.0 100.0 100.0 100.0
Source: Cartagena household survey, 1978.
HOJUSING, WATER, AND WASTE DISPOSAL 35
ICT developments. The northern sectors of Torices, Le Maitre, Siete deAgosto, and others had had sewer pipes installed since the 1950s, but thissystem had never been put into operation. Two pumping stations wereunder construction in 1980, partly with World Bank loans, and sometimeduring the decade sewerage is expected to be pumped away to theCienaga at San Francisco. Together with a 10 percent addition of con-nected dwellings in the Prado-Amberes section, total coverage will cometo 60 percent of the city. Work now underway in the Southeast Zone willeventually raise the total to 70 percent, taking into account the continualinflow of migrants and squatters elsewhere in the city. In 1978 two col-lectors in the Southeast Zone were planned some blocks away on eitherside of Avenida Pedro Romero, and pumping stations were about to beinstalled. Even with massive international support, treatment plantswere not part of the plan, and the sewerage was to be pumped 100 or 200meters into the Cienaga de Tesca o la Virgen. Simple drainage channelswere also under construction in 1978-relatively complete in Esperanza;actively in process in the next sector, Boston-Tesca; still less in OlayaHerrera; and merely contemplated for Magdalena-Fredonia. In Decem-ber 1980 nearly all were finished throughout the zone.
A small sewerage tax was paid by all owners of dwellings, whetherthey were serviced or not. This charge caused considerable resentment,but dwellings actually serviced were charged an additional much largeramount, equal to half the fee for water.
Septic tanks were the most common form of sewerage disposal in theNorth, Lomas, and the Outskirts. Human waste was dumped in theCienaga or nearby creeks by 44.4 percent of households in the SoutheastZone-who were 70 percent of the population of Cartagena who had nosanitary facilities whatsoever. Another 27 percent of Southeast house-holds had latrines. As can be seen in the lower part of Table 3-4, thepriority assigned to supplying this sector with a sewerage disposal systemis justified.
In Colombia, expanding water, sewerage, and drainage infrastructurefor housing is the responsibility of the ICT. In 1972 this agency inven-toried slum conditions in sixty-nine cities and set up a credit program forutilities, home improvement, and legalization of tenure .8 The programwas called the Plan for Integrated Servicing of Substandard Urban Areas(PHIZSU), and it included help with community facilities. Operationsstarted in 1976. World Bank support for water supply and sewerage proj-ects in Cartagena began with the Instituto Nacional de Fomento Munici-pal (INSFOPAL). This agency makes funds available to ICT or municipalauthorities.
Next came the $35 million project for the Southeast Zone and Pasa-caballos, scheduled for $13.2 million of World Bank support although

36 HOUSING, WATER, AND WASTE DISPOSAL
only $10.1 million in foreign exchange costs were foreseen. The aim waspartly to improve urban conditions for 12,000 households living on 355hectares in the Southeast. One-third of this area was situated a mere 50to 150 centimeters above sea level, and one-third was lower than that.Filling in began in November 1977. All streets were given curbs and gut-ters (but no pavement) to serve as storm drains. Six major drainageditches were replaced with concrete canals, and interlot drains were dugwith communal effort. Water mains had to be extended to one-third ofthe area above 1.5 meters in elevation and everywhere below that. Thelow area was not provided with a waterborne sewerage disposal system,by contrast with the sections above 1.5 meters. Hooking up was notmandatory but was done only in response to family and neighborhoodcontributions and commitments.
To make room for streets and community facilities, about 7 percent ofhouseholds were scheduled for relocation. They were to be given 80-square-meter lots and US$685 loans for construction. The communityfacilities included primary schools, child welfare centers, health centers,and an employment and productivity unit. ICT was in charge of im-plementation, including design, bidding, and construction through con-tractors of all public works. For subprojects, participants were expectedto pay 5 percent down and to pledge land or dwellings as collateral.
The project would have a substantial effect on relieving poverty, since84 percent of households in the Southeast Zone earned less than the Co-lombian per capita income. A rate of return cannot be estimated easilyfor such investments, including their intangible benefits. On the assump-tion that the residential value of land would rise to a level comparable tothe rest of Cartagena, a 15 percent rate of return seemed plausible to agroup of World Bank appraisers. The project was to be completed inJune 1984, but further improvements and loans were expected to follow.Specific aspects of the project will be discussed later in this study.
Conclusion
Housing needs in a physical sense are derived from the number ofhouseholds and their distribution by size. Most Cartagena surveys, in-cluding ours, have reported that the average household contains sevenpersons. If that is divided into the 1978 population of 428.8 thousand,approximately 61.3 thousand dwellings are needed. The need for vacantunits to facilitate stock redistribution and the exact dispersion ofhouseholds by size explain why that estimate is only approximate. Thepopulation is expected to rise to no more than 721 thousand, but will
HOUSING, WATER, AND WASTE DISPOSAL 37
household size remain at seven? If so, upper-income families would havelarger families than is now the case, so perhaps it is best to assume thatfamily size will remain constant within broad income ranges. A detaileddemographic analysis was not the object of this study, so assumptionswill be kept simple. If average household size falls to 6.84 with rising in-comes by 1990, then 105,340 dwellings will be needed for occupancyalone-an increase of 72.2 percent.
The distribution of this increase depends partly on how much of thepresent housing stock is considered adequate and likely to survive in apurely physical sense. The distribution also depends on how muchhouseholds can afford and are willing to pay for improved housing. Thisquestion is complicated by the durability of housing, its stock character-istics, the alternatives in long-term finance, and the possibilities for self-help and upgrading. Broader needs that involve location, transport,neighborhood quality, and public amenities are clearly important, butare not the main focus of this study.
Notes to Chapter 3
1. Lacydes Cortes Diaz, Familia y Sociedad en Cartagena (Departamento de In-vestigaci6n Econ6mica y Social, Universidad de Cartagena, July 1971). In 1978 Cortes wasmanager of the Northern Bolivar Planning and Development Council.
2. Ibid., pp. 10-11.3. Humberto Triana y Antorveza, Cultura del Tugurio en Cartagena (Bogota: Impresa
en Italgraf for UNICEF, 1974).
4. Cortes Diaz, Familia y Sociedad en Cartagena, pp. 20, 44.5. Ibid,, p. 34.6. Ibid., p. 45, and Virginia Gutierrez Pineda, Familia y Cultura en Colombia (Bogata:
Ediciones Tercer Mundo, 1968).7. For a detailed analysis of water and sewerage systems in Cartagena and related
charges in the early 1970s, see Johannes F. Linn, "Urban Public Finances in DevelopingCountries: A Case Study of Cartagena, Colombia," Urban and Regional Report no. 77-1(Washington, D.C.: World Bank, January 1975; processed), pp. 238-76.
8. Instituto de Credito Territorial, "Inventario de Zonas Subnormales de Vivienda yProyectos de Desarrollo Progresivo" (Bogota, 1972; processed).
4Effective Demand and Housing Finance
ErFECTIVE DEMAND DOES NOT INDICATE the kind of housing that familiesought to have, but the kind that they are actually renting, buying, orbuilding at given prices. It is a function of income, wealth, access to landand credit, government subsidies or taxes, and the need for competinggoods and services. This need varies with the size of a family, its history,and its life cycle from marriage to retirement. What matters for planning isthe expected proportion between income and rent, mortgage payments, orhousing value.
Information from our 1978 sample gives the level and distribution of in-come in Cartagena, its origin by occupation and other sources, and itsassociation with household size and zone of the city. Both tenants andowner-occupants have distinct characteristics. Logit analysis gives theprobability of being an owner or a tenant because of factors such as the ageof the head of the household or the household size. Regressions and cross-tabulations show how rent and value change with income and familystructure, although these effects are partly due to the housing supply con-ditions discussed in the next two chapters. The cost of land, finance, andthe type of taxes change the amount that can be spent on the dwellingstructure. For comparison, Appendix I summarizes results of housingbudget surveys by others.
Household Income
In our sample, monthly household incomes ranged from zero to 60,000pesos (US$1,538). Nothing had been eamed in the previous month by thefamily of a secretary who had just lost her job. Her permanent income wasobviously higher, but we did not find it practical to identify transitory in-come components. The highest incomes were received by two technicianswho also sold property or had property income. Average income was9,947 pesos (standard error 502 pesos). The median income was 7,500
38
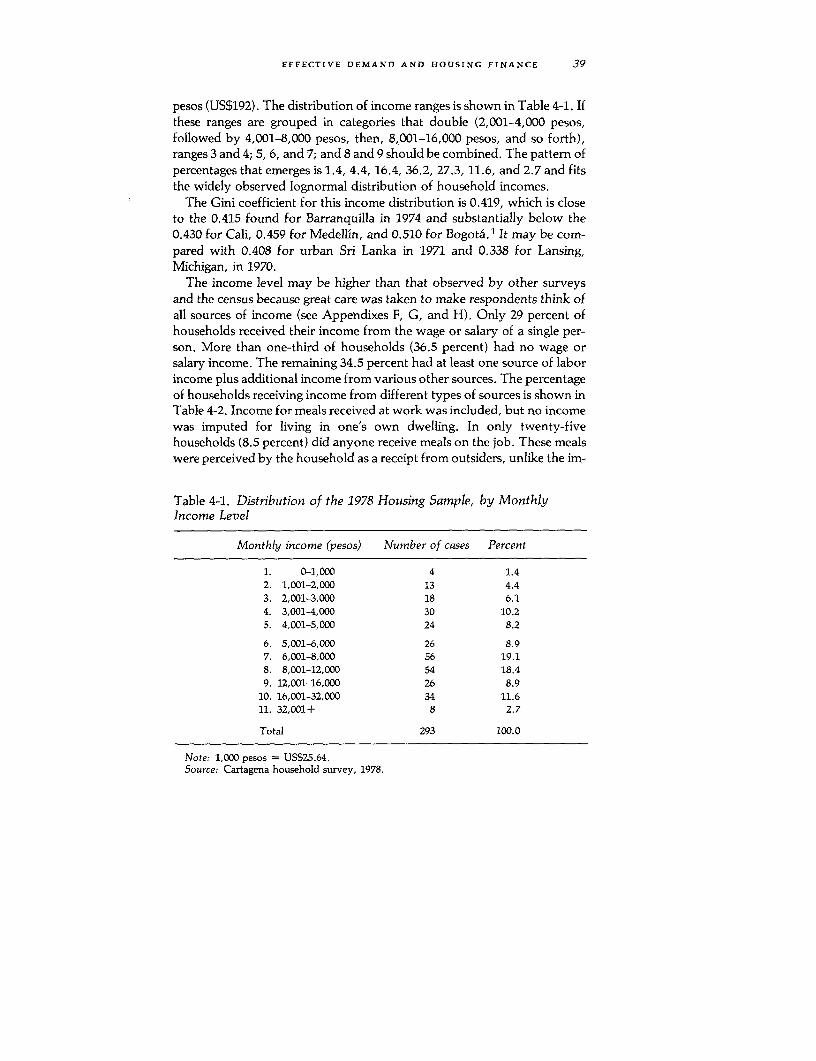
EFFECTIVE DEMAND AND HOUSING FINANCE 39
pesos (US$192). The distribution of income ranges is shown in Table 4-1. Ifthese ranges are grouped in categories that double (2,001-4,000 pesos,followed by 4,001-8,000 pesos, then, 8,001-16,000 pesos, and so forth),ranges 3 and 4; 5, 6, and 7; and 8 and 9 should be combined. The pattern ofpercentages that emerges is 1.4, 4.4, 16.4, 36.2, 27.3, 11.6, and 2.7 and fitsthe widely observed lognormal distribution of household incomes.
The Gini coefficient for this income distribution is 0.419, which is closeto the 0.415 found for Barranquilla in 1974 and substantially below the0.430 for Cali, 0.459 for Medellin, and 0.510 for Bogota. 1 It may be com-pared with 0.408 for urban Sri Lanka in 1971 and 0.338 for Lansing,Michigan, in 1970.
The income level may be higher than that observed by other surveysand the census because great care was taken to make respondents think ofall sources of income (see Appendixes F, G, and H). Only 29 percent ofhouseholds received their income from the wage or salary of a single per-son. More than one-third of households (36.5 percent) had no wage orsalary income. The remaining 34.5 percent had at least one source of laborincome plus additional income from various other sources. The percentageof households receiving income from different types of sources is shown inTable 4-2. Income for meals received at work was included, but no incomewas imputed for living in one's own dwelling. In only twenty-fivehouseholds (8.5 percent) did anyone receive meals on the job. These mealswere perceived by the household as a receipt from outsiders, unlike the im-
Table 4-1. Distribution of the 1978 Housing Sample, by MonthlyIncome Level
Monthly income (pesos) Number of cases Percent
1. 0-1,000 4 1.42. 1,001-2,000 13 4.43. 2,001-3,000 18 6.14. 3,001-4,000 30 10.25. 4,001-5,000 24 8.2
6. 5,001-6,000 26 8.97. 6,001-8,000 56 19.18. 8,001-12,000 54 18.49. 12,001-16,000 26 8.9
10. 16,001-32,000 34 11.611. 32,001+ 8 2.7
Total 293 100.0
Note: 1,000 pesos = US$25.64.Source: Cartagena household survey, 1978.
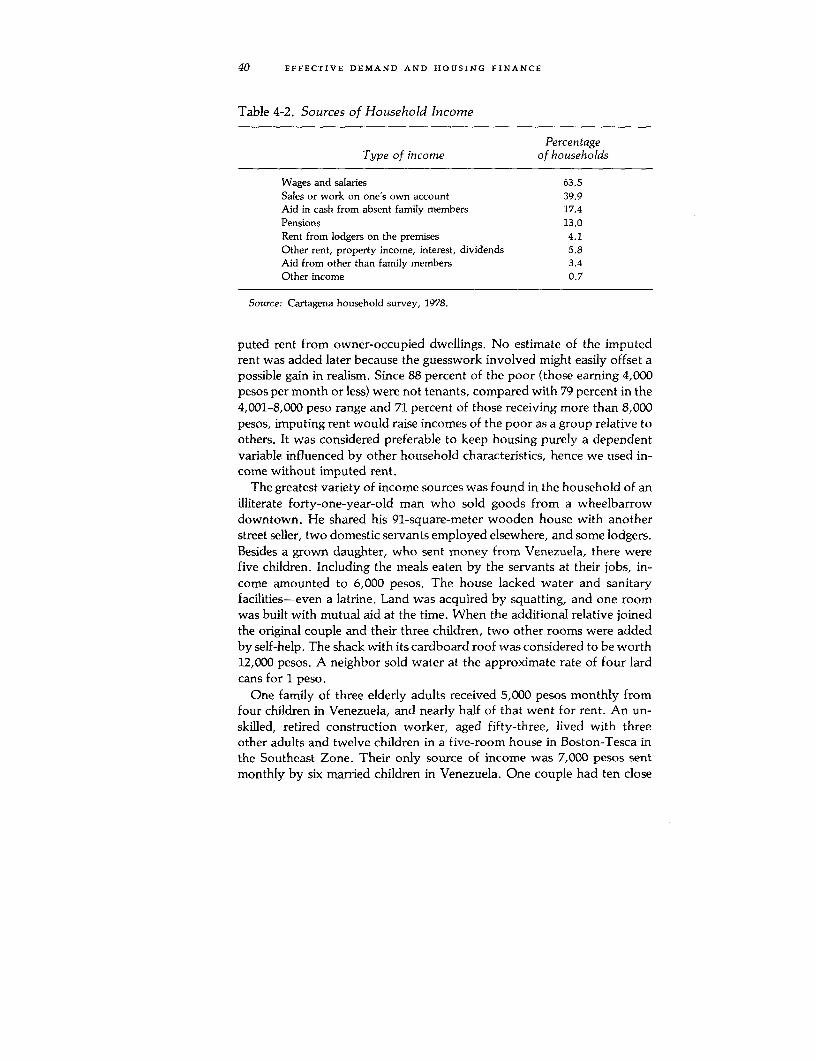
40 EFFECTIVE DEMAND AND HOUSING FINANCE
Table 4-2. Sources of Household Income
PercentageType of income of households
Wages and salaries 63.5Sales or work on one's own account 39.9Aid in cash from absent family members 17.4Pensions 13.0Rent from lodgers on the premises 4.1Other rent, property income, interest, dividends 5.8Aid from other than family members 3.4Other income 0.7
Source: Cartagena household survey, 1978.
puted rent from owner-occupied dwellings. No estimate of the imputedrent was added later because the guesswork involved might easily offset apossible gain in realism. Since 88 percent of the poor (those earning 4,000pesos per month or less) were not tenants, compared with 79 percent in the4,001-8,000 peso range and 71 percent of those receiving more than 8,000pesos, imputing rent would raise incomes of the poor as a group relative toothers. It was considered preferable to keep housing purely a dependentvariable influenced by other household characteristics, hence we used in-come without imputed rent.
The greatest variety of income sources was found in the household of anilliterate forty-one-year-old man who sold goods from a wheelbarrowdowntown. He shared his 91-square-meter wooden house with anotherstreet seller, two domestic servants employed elsewhere, and some lodgers.Besides a grown daughter, who sent money from Venezuela, there werefive children. Including the meals eaten by the servants at their jobs, in-come amounted to 6,000 pesos. The house lacked water and sanitaryfacilities-even a latrine. Land was acquired by squatting, and one roomwas built with mutual aid at the time. When the additional relative joinedthe original couple and their three children, two other rooms were addedby self-help. The shack with its cardboard roof was considered to be worth12,000 pesos. A neighbor sold water at the approximate rate of four lardcans for 1 peso.
One family of three elderly adults received 5,000 pesos monthly fromfour children in Venezuela, and nearly half of that went for rent. An un-skilled, retired construction worker, aged fifty-three, lived with threeother adults and twelve children in a five-room house in Boston-Tesca inthe Southeast Zone. Their only source of income was 7,000 pesos sentmonthly by six married children in Venezuela. One couple had ten close

EFFECTIVE DEMAND AND HOUSING FINANCE 41
relatives in Venezuela, but with an income of 14,000 pesos did not needtheir help. More common was the case of a grandmother whose daughterhad been in Venezuela for twelve years and who supported the five re-maining family members in Cartagena with a monthly remittance of 5,000pesos, their only income. By contrast, another family of twelve lived on2,000 pesos earned locally but said that the head of the household was thefather who worked as a pilot of a ship in Aruba. He sent no money. Astreet seller had six children in Venezuela; none sent money.
The rates of pay for specific occupations and activities during the sum-mer of 1978 are given in Table 4-3.
Unemployment
In 293 households we encountered 98 unemployed workers. These aredefined as anyone willing to look for work but unable to find an activitythat pays at home or elsewhere. They represented 19 percent of the samplelabor force. If the unemployed were evenly distributed among households,one out of three households would have one member unemployed. Thenumber of unemployed per household was:
Average numberMonthly income of unemployed
(pesos) per household0-2,000 0.35
2,001-4,000 0.644,001-8,000 0.318,001-16,000 0.32
16,001-32,000 0.0832,000+ 0
Unemployment was highest in the second-lowest income range whereaverage family size was 5.9. This family size was lower than that of thehigher-income households that had unemployed members. Comparison ofthis table with the classification of occupations in Table 4-3 shows that un-skilled workers, messengers, stevedores, and construction workers weremost likely to be unemployed. The assumption is that those without jobswere more or less in the same types of activities as relatives with jobs.
Occupations
Table 4-4 shows that in our sample the largest number of principalworkers, 84 (19.9 percent), classified themselves as skilled. Owning a storeor business and office work came second and third. The kind of store

42 EFFECTIVE DEMAND AND HOUSING FINANCE
Table 4-3. Income Levels for Specific Occupations
Monthly income (pesos) Occupation
0-2,000 Domestic servant, carpenter, street seller of lottery tickets,jewelry credit collector, owner of soft drink stand, infor-mal teacher.
2,001-4,000 Street seller of charcoal, hotel bellboy, night watchman,messenger, agricultural worker, mason, stevedore.
4,001-6,000 Telephone operator, policeman, street seller of contrabandcigarettes, bus driver, welder, caldron tender, jeweler,maintenance man, mechanic, marine sergeant, warehousekeeper, smuggler, airport office worker.
6,001-8,000 Office workers, newspaper worker, shopkeepers, taxi driversnot owning their vehicles, denture maker, brewerytechnician, warehouse supervisor, natural science teacher,contractor.
8,001-12,000 Chemical plant workers, boat repairer, marine pilot, publicutility electrician, bank clerk, cashier, shopkeepers, con-tractor.
12,001-16,000 Chief of accounting department, coconut merchant, privateschool teacher, chemical plant shift foreman, owner of onebus, unlicensed lawyer, other technicians and salesmen.
16,000+ Lawyers, doctors, chemical plant superintendent, wholesalemerchants, owners of multiple buses and taxis, autorepairshop owner-operator, owner of family-run jewelrystore, administrator of family properties, other storeowners.
Source: Cartagena household survey, 1978, subset of eighty-five with only one source ofwage, salary, or other currently earned income.
owned by the spouse was usually a little shop in the home. For wives,domestic service and indoor sales were next in importance. The fact that52 out of 293 heads of households reported no occupation is due to thefrequent designation of retired fathers or grandmothers as householdheads. Heads of households and third workers were either male or female,but spouses were always wives.
The primary source and amount of household income is given in Table4-5. The six households for whom property income was the primarysource of income had the highest earnings, 16,083 pesos monthly. Self-employed workers or owner-operators were next, followed by householdsin which the leading source of income was pensions, wages and salaries,aid from absent family members, and aid from others. Only sevenhouseholds did not receive more than half of income from a single source.Aid or pensions were the main source of income for 18.1 percent of house-

EFFECTIVE DEMAND AND HOUSING FINANCE 43
Table 4-4. Occupations of Principal Workers
Head of ThirdOccupation household Spouse worker Total
Skilled worker 58 9 17 84Owner of store or business 32 15 3 50Unskilled worker 25 2 16 43Office worker 23 5 24 52Technician, semiprofessional 19 8 17 44Professional 19 3 2 24
Indoor salesperson 17 10 10 37Highly skilled worker 13 0 4 17Personal services 12 3 4 19Street vendor 9 2 7 18Foreman 7 0 2 9Police and military 5 0 0 5Domestic service 2 11 7 20
Total 241 68 113 422
Source: Cartagena household survey, 1978.
Table 4-5. Primary Source of Household Income, Income Levels,and Housing Value
Average Average valueSource of more than income Percentage of dwelling
half of income (pesos) of households (pesos)
Rent, interest, dividends, or otherproperty income 16,083 2.1 600,000
Sales or work on one's own account 11,555 26.2 495,000Pensions 10,279 6.6 776,000Wages and salaries 9,751 53.5 367,000Aid in cash from family members
living away 7,143 10.1 257,000Aid from others 3,725 1.4 68,500
Note: Seven additional households had incomes for which no single source accountedfor more than 50 percent.
Source: Cartagena household survey, 1978.
holds. These families were not especially poor, and pensioners lived in themost valuable housing.
One might expect that a larger number of adults in a household wouldmean a higher average income, creating both a need and the means for
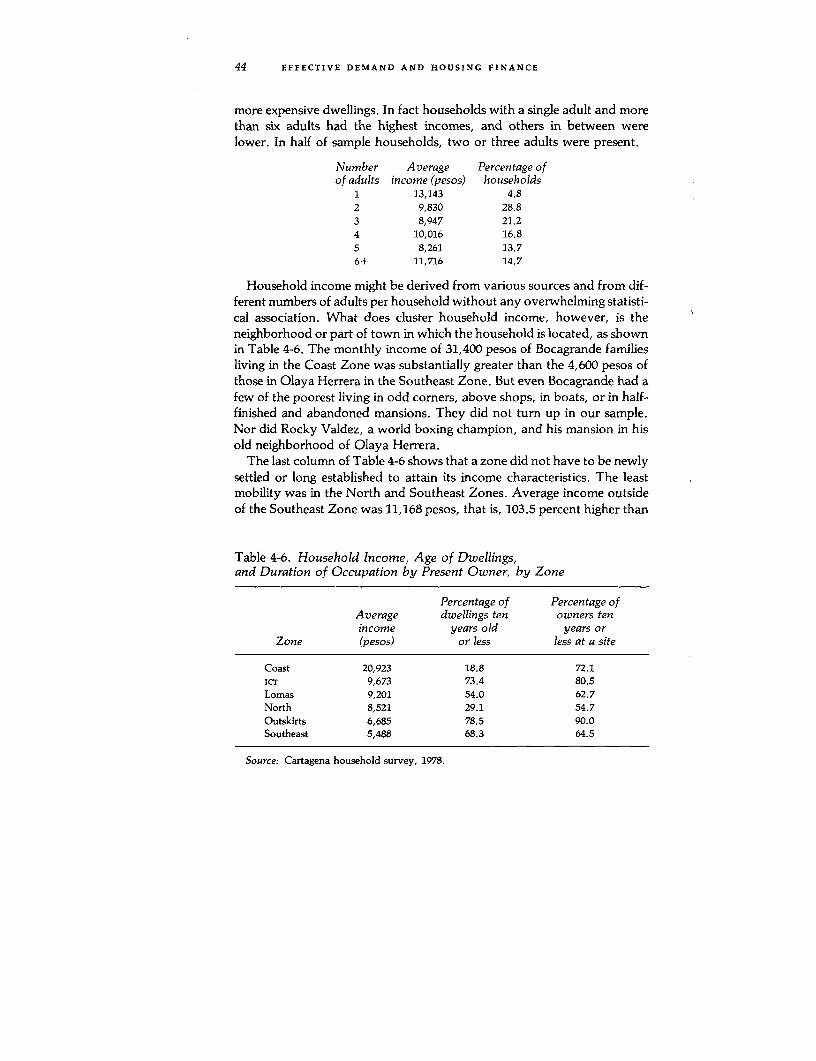
44 EFFECTIVE DEMAND AND HOUSING FINANCE
more expensive dwellings. In fact households with a single adult and morethan six adults had the highest incomes, and others in between werelower. In half of sample households, two or three adults were present.
Number Average Percentage ofof adults income (pesos) households
1 13,143 4.82 9,830 28.83 8,947 21.24 10,016 16.85 8,261 13.76+ 11,716 14.7
Household income might be derived from various sources and from dif-ferent numbers of adults per household without any overwhelming statisti-cal association. What does cluster household income, however, is theneighborhood or part of town in which the household is located, as shownin Table 4-6. The monthly income of 31,400 pesos of Bocagrande familiesliving in the Coast Zone was substantially greater than the 4,600 pesos ofthose in Olaya Herrera in the Southeast Zone. But even Bocagrande had afew of the poorest living in odd corners, above shops, in boats, or in half-finished and abandoned mansions. They did not turn up in our sample.Nor did Rocky Valdez, a world boxing champion, and his mansion in hisold neighborhood of Olaya Herrera.
The last column of Table 4-6 shows that a zone did not have to be newlysettled or long established to attain its income characteristics. The leastmobility was in the North and Southeast Zones. Average income outsideof the Southeast Zone was 11,168 pesos, that is, 103.5 percent higher than
Table 4-6. Household Income, Age of Dwellings,and Duration of Occupation by Present Owvner, by Zone
Percentage of Percentage ofAverage dwellings ten owners tenincome years old years or
Zone (pesos) or less less at a site
Coast 20,923 18.8 72.1Icr 9,673 73.4 80.5Lomas 9,201 54.0 62.7North 8,521 29.1 54.7Outskirts 6,685 78.5 90.0Southeast 5,488 68.3 64.5
Source: Cartagena household survey, 1978.
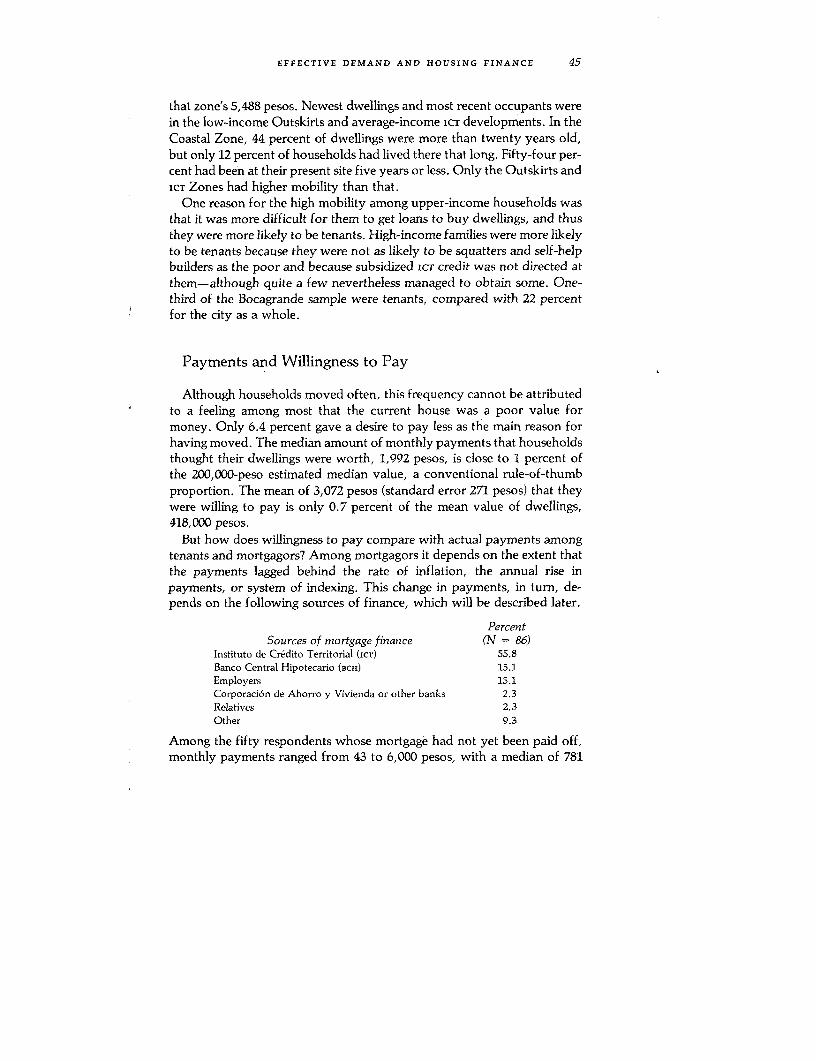
EFFECTIVE DEMAND AND HOUSING FINANCE 45
that zone's 5,488 pesos. Newest dwellings and most recent occupants werein the low-income Outskirts and average-income icT developments. In theCoastal Zone, 44 percent of dwellings were more than twenty years old,but only 12 percent of households had lived there that long. Fifty-four per-cent had been at their present site five years or less. Only the Outskirts andICT Zones had higher mobility than that.
One reason for the high mobility among upper-income households wasthat it was more difficult for them to get loans to buy dwellings, and thusthey were more likely to be tenants. High-income families were more likelyto be tenants because they were not as likely to be squatters and self-helpbuilders as the poor and because subsidized ICT credit was not directed atthem-although quite a few nevertheless managed to obtain some. One-third of the Bocagrande sample were tenants, compared with 22 percentfor the city as a whole.
Payments and Willingness to Pay
Although households moved often, this frequency cannot be attributedto a feeling among most that the current house was a poor value formoney. Only 6.4 percent gave a desire to pay less as the main reason forhaving moved. The median amount of monthly payments that householdsthought their dwellings were worth, 1,992 pesos, is close to 1 percent ofthe 200,000-peso estimated median value, a conventional rule-of-thumbproportion. The mean of 3,072 pesos (standard error 271 pesos) that theywere willing to pay is only 0.7 percent of the mean value of dwellings,418,000 pesos.
But how does willingness to pay compare with actual payments amongtenants and mortgagors7 Among mortgagors it depends on the extent thatthe payments lagged behind the rate of inflation, the annual rise inpayments, or system of indexing. This change in payments, in turn, de-pends on the following sources of finance, which will be described later.
PercentSources of mortgage finance (N = 86)
Instituto de Credito Territorial (icT) 55.8Banco Central Hipotecario (Bcsi) 15.1Employers 15.1Corporaci6n de Ahorro y Vivienda or other banks 2.3Relatives 2.3Other 9.3
Among the fifty respondents whose mortgage had not yet been paid off,monthly payments ranged from 43 to 6,000 pesos, with a median of 781
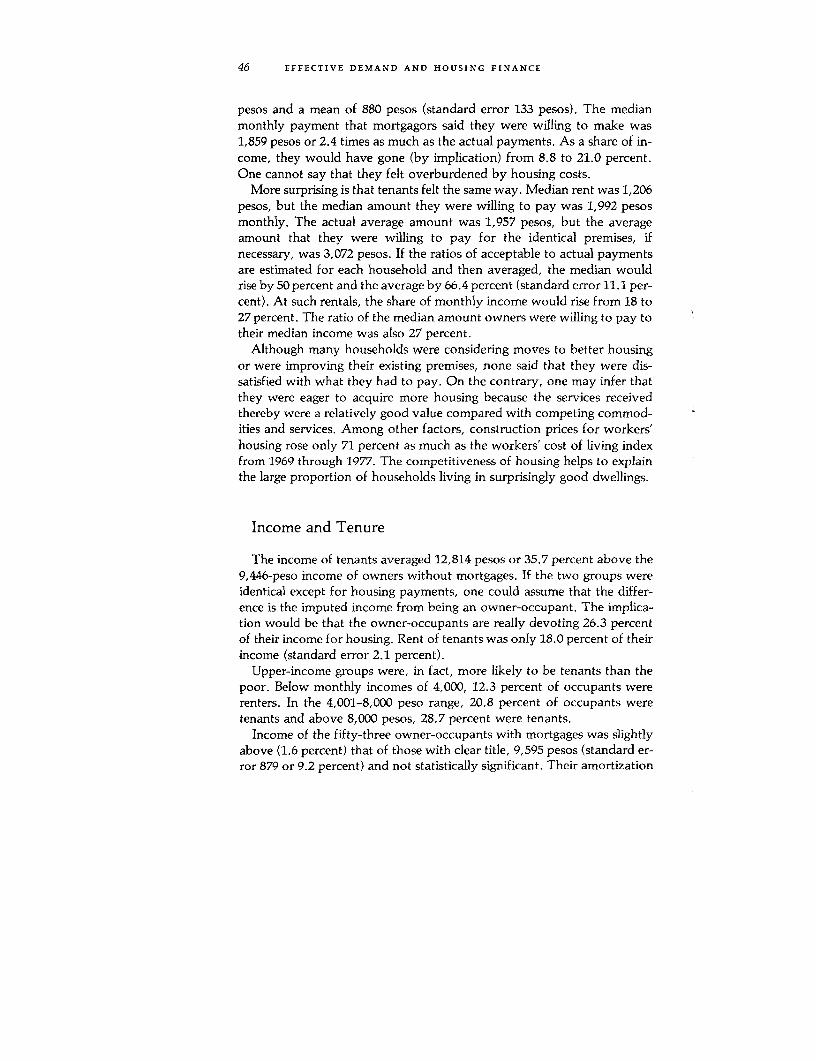
46 EFFECTIVE DEMAND AND HOUSING FINANCE
pesos and a mean of 880 pesos (standard error 133 pesos). The medianmonthly payment that mortgagors said they were willing to make was1,859 pesos or 2.4 times as much as the actual payments. As a share of in-come, they would have gone (by implication) from 8.8 to 21.0 percent.One cannot say that they felt overburdened by housing costs.
More surprising is that tenants felt the same way. Median rent was 1,206pesos, but the median amount they were willing to pay was 1,992 pesosmonthly. The actual average amount was 1,957 pesos, but the averageamount that they were willing to pay for the identical premises, ifnecessary, was 3,072 pesos. If the ratios of acceptable to actual paymentsare estimated for each household and then averaged, the median wouldrise by 50 percent and the average by 66.4 percent (standard error 11.1 per-cent). At such rentals, the share of monthly income would rise from 18 to27 percent. The ratio of the median amount owners were willing to pay totheir median income was also 27 percent.
Although many households were considering moves to better housingor were improving their existing premises, none said that they were dis-satisfied with what they had to pay. On the contrary, one may infer thatthey were eager to acquire more housing because the services receivedthereby were a relatively good value compared with competing commod-ities and services. Among other factors, construction prices for workers'housing rose only 71 percent as much as the workers' cost of living indexfrom 1969 through 1977. The competitiveness of housing helps to explainthe large proportion of households living in surprisingly good dwellings.
Income and Tenure
The income of tenants averaged 12,814 pesos or 35.7 percent above the9,446-peso income of owners without mortgages. If the two groups wereidentical except for housing payments, one could assume that the differ-ence is the imputed income from being an owner-occupant. The implica-tion would be that the owner-occupants are really devoting 26.3 percentof their income for housing. Rent of tenants was only 18.0 percent of theirincome (standard error 2.1 percent).
Upper-income groups were, in fact, more likely to be tenants than thepoor. Below monthly incomes of 4,000, 12.3 percent of occupants wererenters. In the 4,001-8,000 peso range, 20.8 percent of occupants weretenants and above 8,000 pesos, 28.7 percent were tenants.
Income of the fifty-three owner-occupants with mortgages was slightlyabove (1.6 percent) that of those with clear title, 9,595 pesos (standard er-ror 879 or 9.2 percent) and not statistically significant. Their amortization
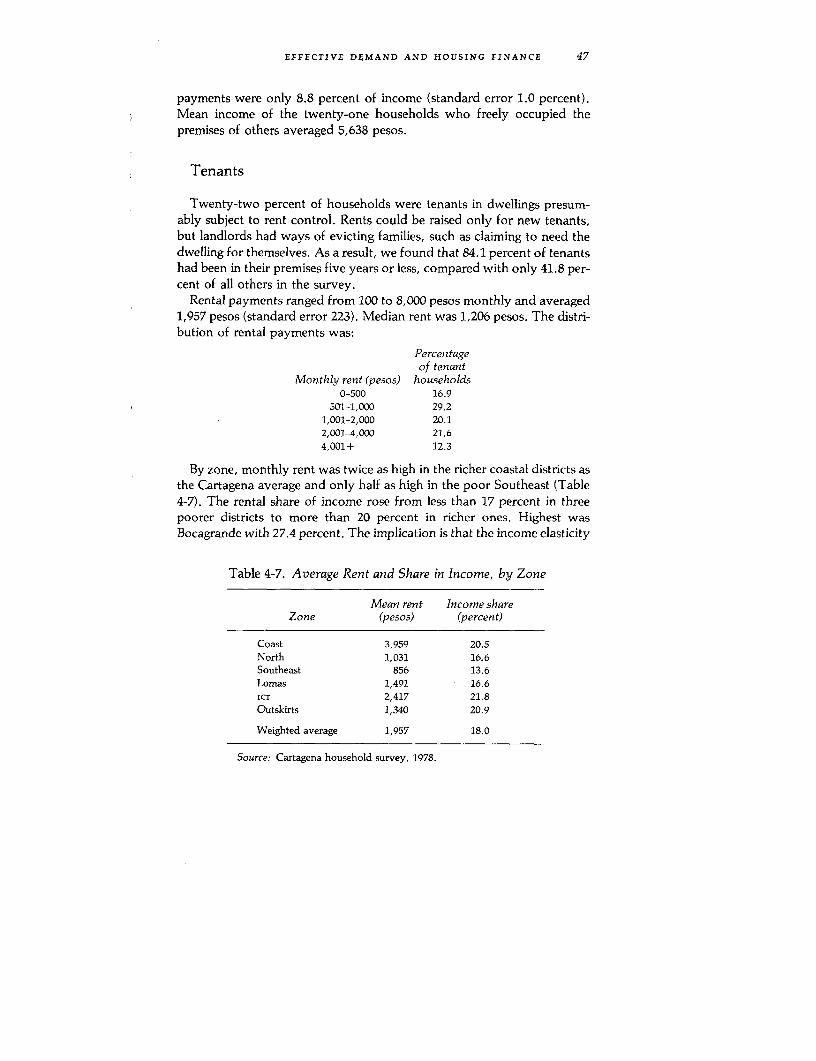
EFFECTIVE DEMAND AND HOUSING FINANCE 47
payments were only 8.8 percent of income (standard error 1.0 percent).Mean income of the twenty-one households who freely occupied thepremises of others averaged 5,638 pesos.
Tenants
Twenty-two percent of households were tenants in dwellings presum-ably subject to rent control. Rents could be raised only for new tenants,but landlords had ways of evicting families, such as claiming to need thedwelling for themselves. As a result, we found that 84.1 percent of tenantshad been in their premises five years or less, compared with only 41.8 per-cent of all others in the survey.
Rental payments ranged from 100 to 8,000 pesos monthly and averaged1,957 pesos (standard error 223). Median rent was 1,206 pesos. The distri-bution of rental payments was:
Percentageof tenant
Monthly rent (pesos) households0-500 16.9
501-1,000 29.21,001-2,000 20.12,001-4,000 21.64,001+ 12.3
By zone, monthly rent was twice as high in the richer coastal districts asthe Cartagena average and only half as high in the poor Southeast (Table4-7). The rental share of income rose from less than 17 percent in threepoorer districts to more than 20 percent in richer ones. Highest wasBocagrande with 27.4 percent. The implication is that the income elasticity
Table 4-7. Average Rent and Share in Income, by Zone
Mean rent Income shareZone (pesos) (percent)
Coast 3,959 20.5North 1,031 16.6Southeast 856 13.6Lomas 1,491 16.6ICT 2,417 21.8Outskirts 1,340 20.9
Weighted average 1,957 18.0
Source: Cartagena household survey, 1978.
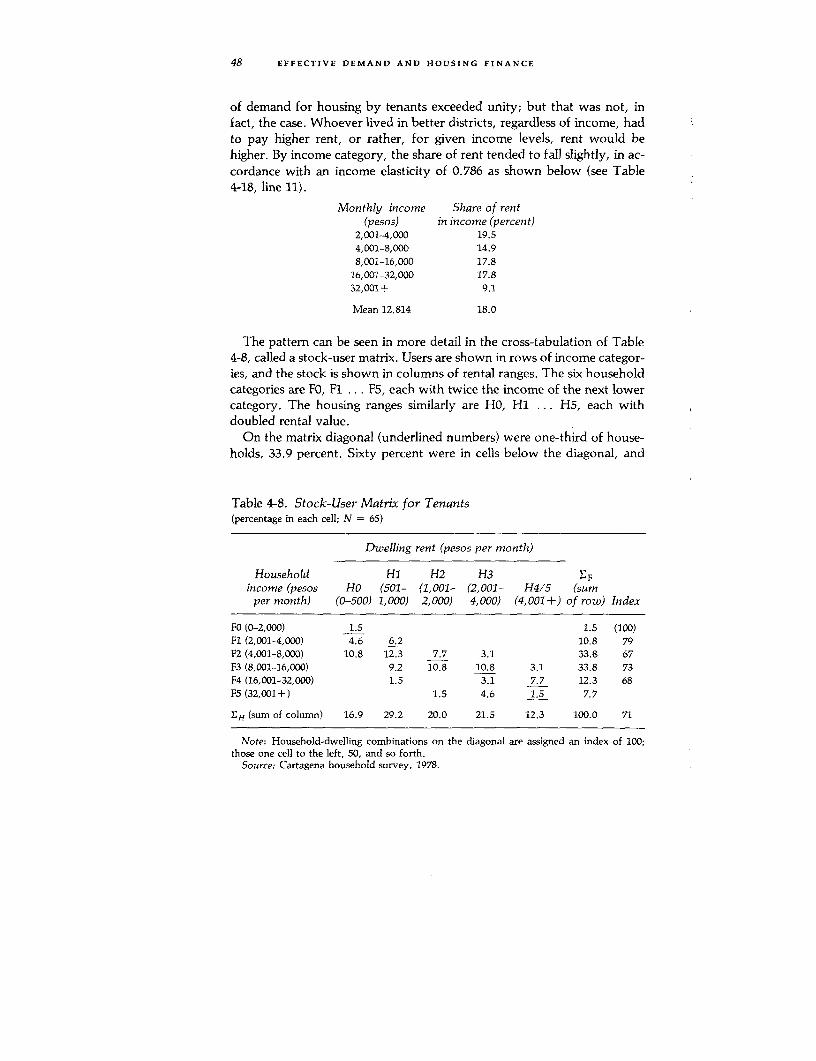
48 EFFECTIVE DEMAND AND HOUSING FINANCE
of demand for housing by tenants exceeded unity; but that was not, infact, the case. Whoever lived in better districts, regardless of income, hadto pay higher rent, or rather, for given income levels, rent would behigher. By income category, the share of rent tended to fall slightly, in ac-cordance with an income elasticity of 0.786 as shown below (see Table4-18, line 11).
Monthly income Share of rent(pesos) in income (percent)
2,001-4,000 19.54,001-8,000 14.98,001-16,000 17.8
16,001-32,000 17.832,001+ 9.1
Mean 12,814 18.0
The pattern can be seen in more detail in the cross-tabulation of Table4-8, called a stock-user matrix. Users are shown in rows of income categor-ies, and the stock is shown in columns of rental ranges. The six householdcategories are FO, Fl ... F5, each with twice the income of the next lowercategory. The housing ranges similarly are HO, HI ... H5, each withdoubled rental value.
On the matrix diagonal (underlined numbers) were one-third of house-holds, 33.9 percent. Sixty percent were in cells below the diagonal, and
Table 4-8. Stock-User Matrix for Tenants(percentage in each cell; N = 65)
Dwelling rent (pesos per month)
Household Hi H2 H3 SF
income (pesos HO (501- (1,001- (2,001- H4/5 (sumper month) (0-500) 1,000) 2,000) 4,000) (4,001+) of row) Index
FO (0-2,000) 1.5 1.5 (100)Fl (2,001-4,000) 4.6 6.2 10.8 79FZ (4,001-8,000) 10.8 12.3 7.7 3.1 33.8 67F3 (8,001-16,000) 9.2 10.8 10.8 3.1 33.8 73F4 (16,001-32,000) 1.5 3.1 7.7 12.3 68F5 (32,001+) 1.5 4.6 1.5 7.7
EH (sum of column) 16.9 29.2 20.0 21.5 12.3 100.0 71
Note: Household-dwelling combinations on the diagonal are assigned an index of 100;those one cell to the left, 50, and so forth.
Source: Cartagena household survey, 1978.
EFFECTIVE DEMAND AND HOUSING FINANCE 49
only 6.2 percent were above. Since the tenant sample is very small (N =
65), little significance can be attributed to any individual cell. What issignificant is that one-third of tenants were in cells to the left of thediagonal. The most frequent combination (12.3 percent) was F2 familiesliving in HI housing. By contrast, among owner-occupants, the most fre-quent combination was F2 families living in H3 housing, a cell to the rightof the diagonal (see Table 4-19). Evidence will suggest that these familieshad upgraded their housing.
An alternative explanation for so many tenants being on the left of thediagonal might be that tenants use less housing because their families aresmaller-6.0 members compared with 7.3 for owner-occupants. But as canbe seen in line 12 of Table 4-18, the regression coefficient for family size isnot significant and is even slightly negative among tenants. Averagehousehold size among tenants rises from 5.5 for those living in HO housingto 7.3 for those in H2 housing, and then falls off to 4.4 for those in H4housing. More significant is the number of adults. The greater the numberof adults who lived in a dwelling the less the rent was likely to be in ab-solute terms, and that smaller amount was also a smaller share of income.
Number of adults Averagerent Rentas percentage(excluding servants) (pesos) of income
1 1,833 16.62 2,179 20.33 2,069 19.94 2,022 17.05 1,217 12.96+ 980 13.1
Owner-Occupied Housing
Value of housing could be discussed in Chapter 5, which covers supplyas a characteristic of the stock, or in Chapter 7, which covers the interac-tion between supply and demand, since only that determines value. Buteffective demand and finance, the subject of this chapter, cannot be dis-cussed without mentioning housing values, so the subject has to be intro-duced here.
Values reported in our sample for nonrental housing ranged from 10,000pesos for a shack to 5 million pesos for a mansion. Average value was418,000 pesos (US$10,700, standard error 44,000 pesos), and median valuewas 200,000 pesos.
Still under amortization were 26 percent of owner-occupied dwellings.Their value averaged 309,000 pesos compared with 479,000 pesos for those
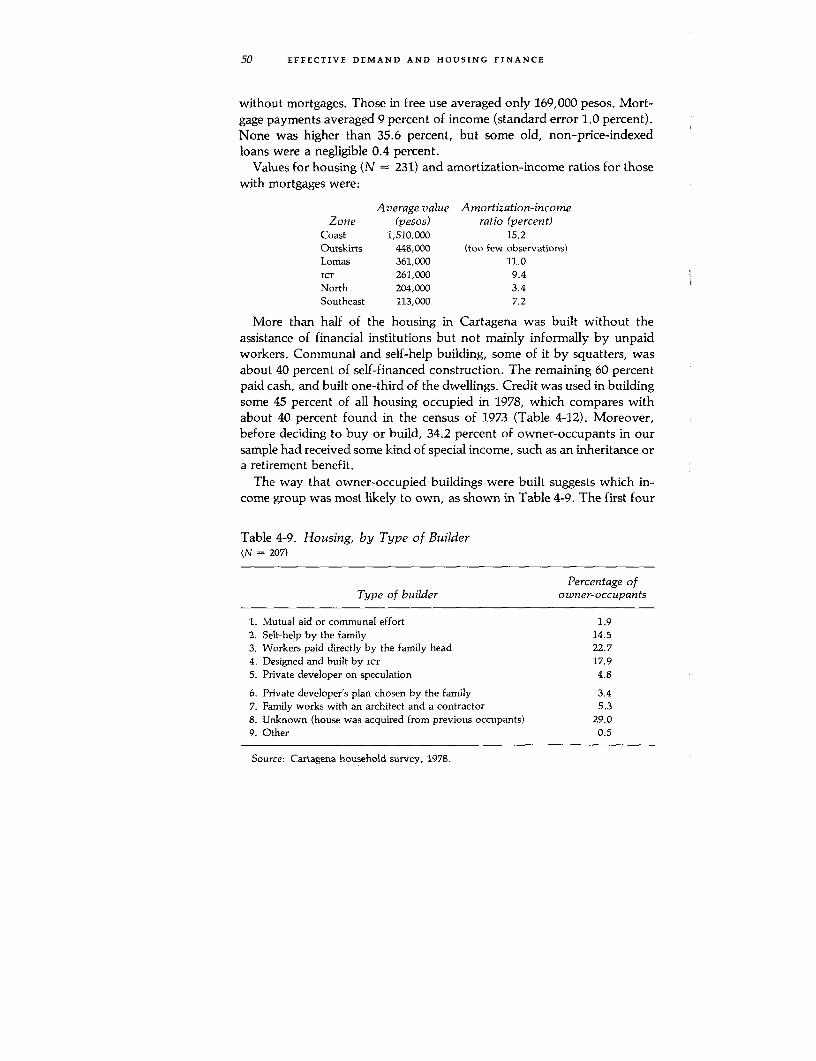
50 EFFECTIVE DEMAND AND HOUSING FINANCE
without mortgages. Those in free use averaged only 169,000 pesos. Mort-gage payments averaged 9 percent of income (standard error 1.0 percent).None was higher than 35.6 percent, but some old, non-price-indexedloans were a negligible 0.4 percent.
Values for housing (N = 231) and amortization-income ratios for thosewith mortgages were:
Average value Amortization-incomeZone (pesos) ratio (percent)
Coast 1,510,000 15.2Outskirts 448,000 (too few observations)Lomas 361,000 11.0ICT 261,000 9.4North 204,000 3.4Southeast 113,000 7.2
More than half of the housing in Cartagena was built without theassistance of financial institutions but not mainly informally by unpaidworkers. Communal and self-help building, some of it by squatters, wasabout 40 percent of self-financed construction. The remaining 60 percentpaid cash, and built one-third of the dwellings. Credit was used in buildingsome 45 percent of all housing occupied in 1978, which compares withabout 40 percent found in the census of 1973 (Table 4-12). Moreover,before deciding to buy or build, 34.2 percent of owner-occupants in oursample had received some kind of special income, such as an inheritance ora retirement benefit.
The way that owner-occupied buildings were built suggests which in-come group was most likely to own, as shown in Table 4-9. The first four
Table 4-9. Housing, by Type of Builder(N = 207)
Percentage ofType of builder owner-occupants
1. Mutual aid or communal effort 1.92. Self-help by the family 14.53. Workers paid directly by the family head 22.74. Designed and built by ICT 17.95. Private developer on speculation 4.8
6. Private developer's plan chosen by the family 3.47. Family works with an architect and a contractor 5.38. Unknown (house was acquired from previous occupants) 29.09. Other 0.5
Source: Cartagena household survey, 1978.
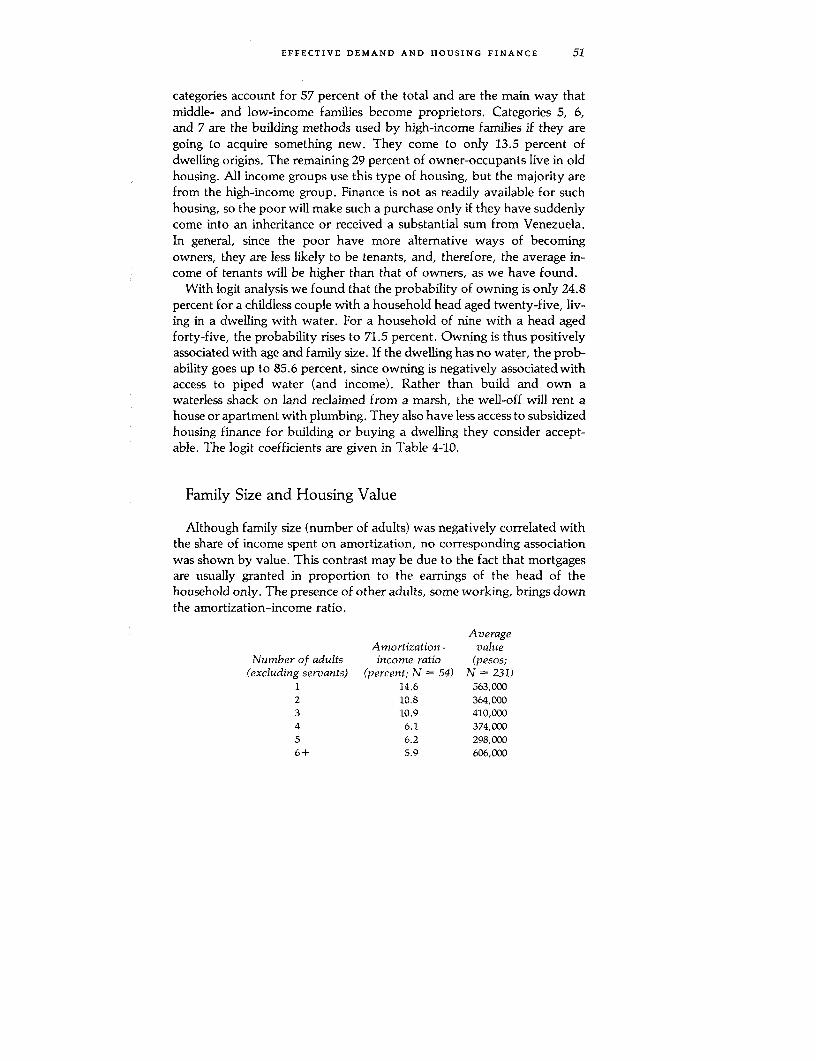
EFFECTIVE DEMAND AND HOUSING FINANCE 51
categories account for 57 percent of the total and are the main way thatmiddle- and low-income families become proprietors. Categories 5, 6,and 7 are the building methods used by high-income families if they aregoing to acquire something new. They come to only 13.5 percent ofdwelling origins. The remaining 29 percent of owner-occupants live in oldhousing. All income groups use this type of housing, but the majority arefrom the high-income group. Finance is not as readily available for suchhousing, so the poor will make such a purchase only if they have suddenlycome into an inheritance or received a substantial sum from Venezuela.In general, since the poor have more alternative ways of becomingowners, they are less likely to be tenants, and, therefore, the average in-come of tenants will be higher than that of owners, as we have found.
With logit analysis we found that the probability of owning is only 24.8percent for a childless couple with a household head aged twenty-five, liv-ing in a dwelling with water. For a household of nine with a head agedforty-five, the probability rises to 71.5 percent. Owning is thus positivelyassociated with age and family size. If the dwelling has no water, the prob-ability goes up to 85.6 percent, since owning is negatively associated withaccess to piped water (and income). Rather than build and own awaterless shack on land reclaimed from a marsh, the well-off will rent ahouse or apartment with plumbing. They also have less access to subsidizedhousing finance for building or buying a dwelling they consider accept-able. The logit coefficients are given in Table 4-10.
Family Size and Housing Value
Although family size (number of adults) was negatively correlated withthe share of income spent on amortization, no corresponding associationwas shown by value. This contrast may be due to the fact that mortgagesare usually granted in proportion to the earnings of the head of thehousehold only. The presence of other adults, some working, brings downthe amortization-income ratio.
AverageAmortization- value
Number of adults income ratio (pesos;(excluding servants) (percent; N = 54) N = 231)
1 14.6 563,0002 10.8 364,0003 10.9 410,0004 6.1 374,0005 6.2 298,0006+ 5.9 606,000
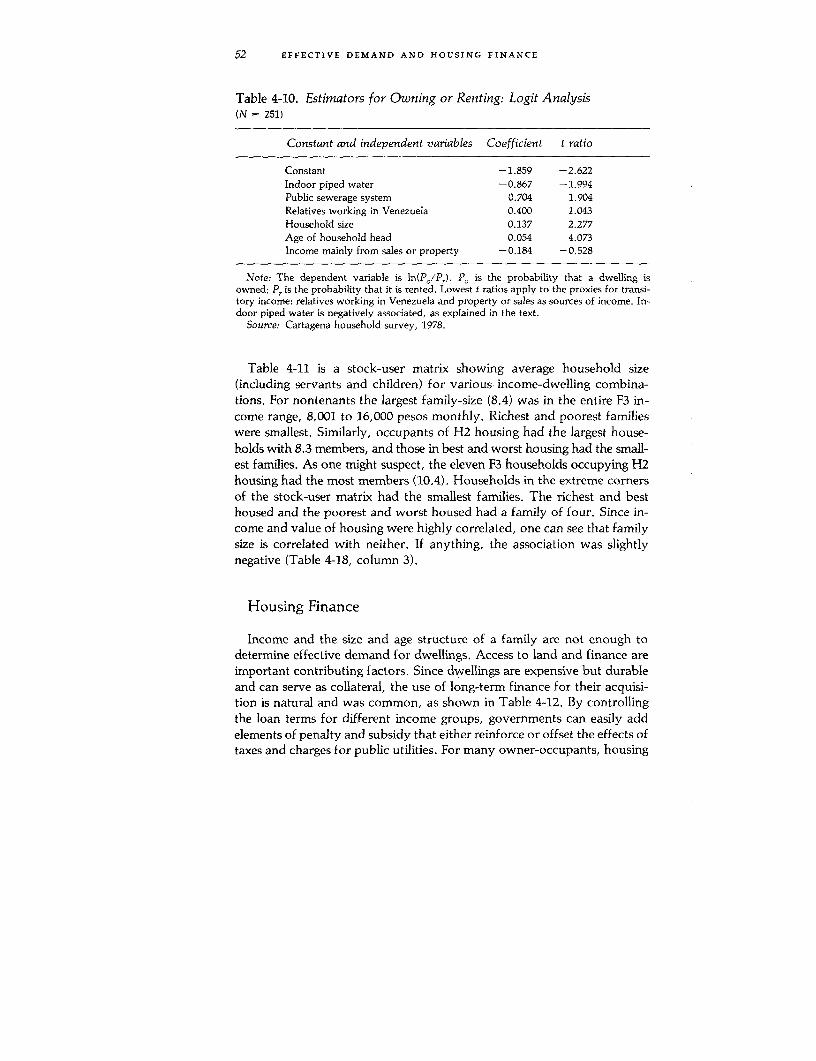
52 EFFECTIVE DEMAND AND HOUSING FINANCE
Table 4-10. Estimators for Owning or Renting: Logit Analysis(N = 251)
Constant and independent variables Coefficient t ratio
Constant -1.859 -2.622
Indoor piped water -0.867 -1.994
Public sewerage system 0.704 1.904
Relatives working in Venezuela 0.400 1.043
Household size 0.137 2.277
Age of household head 0.054 4.073
Income mainly from sales or property -0.184 -0.528
Note: The dependent variable is ln(Po/Pr). PO is the probability that a dwelling isowned; P, is the probability that it is rented. Lowest t ratios apply to the proxies for transi-tory income: relatives working in Venezuela and property or sales as sources of income. In-door piped water is negatively associated, as explained in the text.
Source: Cartagena household survey, 1978.
Table 4-11 is a stock-user matrix showing average household size(including servants and children) for various income-dwelling combina-tions. For nontenants the largest family-size (8.4) was in the entire F3 in-come range, 8,001 to 16,000 pesos monthly. Richest and poorest familieswere smallest. Similarly, occupants of H2 housing had the largest house-holds with 8.3 members, and those in best and worst housing had the small-est families. As one might suspect, the eleven F3 households occupying H2housing had the most members (10.4). Households in the extreme cornersof the stock-user matrix had the smallest families. The richest and besthoused and the poorest and worst housed had a family of four. Since in-come and value of housing were highly correlated, one can see that familysize is correlated with neither. If anything, the association was slightlynegative (Table 4-18, column 3).
Housing Finance
Income and the size and age structure of a family are not enough todetermine effective demand for dwellings. Access to land and finance areimportant contributing factors. Since dwellings are expensive but durableand can serve as collateral, the use of long-term finance for their acquisi-tion is natural and was common, as shown in Table 4-12. By controllingthe loan terms for different income groups, governments can easily addelements of penalty and subsidy that either reinforce or offset the effects oftaxes and charges for public utilities. For many owner-occupants, housing

EFFECTIVE DEMAND AND HOUSING FINANCE 53
demand is expressed mainly through this medium of long-term finance,mingling the desire for housing with that for an investment and a capitalgain. Some studies have arbitrarily divided monthly payments into equalparts for housing and investment. To the monthly payments should be ad-ded the opportunity cost of any down payments. Whether the unit pricesof housing services are constant, so that a larger expenditure implies agreater purchase, is a complicating issue that will come up later in thischapter. At this point, however, it seems appropriate to discuss first thetwo principal institutions of housing finance in Cartagena before analyzingincome-value elasticities.
In purchasing housing with credit, down payments were required ex-cept for some evacuees from Chambacui. The down payments averaged19.1 percent (standard error 2.6 percent). On the average, these downpayments did not cover the share of the serviced lot in total value, or41.6 percent. For ICT minimal housing, the share of the lot was about 37percent, for basic housing 27 percent, and for the intermediate 13.7 per-cent, according to 1977-78 information provided by the agency. The1973 census reported that 25.2 percent of Cartagena housing had beenfinanced by the ICT and BCH (Banco Central Hipotecario), and our samplefound 20.8 percent.
Mean monthlyincome of Mean value
Source of household of dwelling Value-income Number ofloan (pesos) (pesos) ratio casesICT 8,059 285,000 35.4 48
BCH 12,808 790,000 61.7 13
BCH loans went to higher-income families who could afford larger downpayments and price-indexed repayment rates. ICT loans were supposed togo to lower-income families, but not all income was declared, and somehouseholds experienced an increase in income soon afterward.
Territorial Credit Institute (ICT)
In our sample thirty-nine dwellings had current icT mortgages, mean-ing 18.8 percent of all those occupied by owners. Five years earlier thecensus had reported a 15.8 percent share, but icT had financed a lot ofbuilding since then: El Socorro, Las Gaviotas, Nuevo Bosque, Los Cala-mares, and others. With its continual experiments in design, finance, andorganization, ICT ranks easily among the most creative housing institu-tions in the world.2
Since 1977 the work of Icr has been organized in four programs. Thefirst program calls for "progressive development of subnormal districts."

Table 4-11. Household Size Matrix for Income-Dwelling Combinations, for Tenants and Others
Dwelling value (pesos)
Hi H2 H3 H4Household income HO (40,001- (80,001- (160,001- (320,001- H5(pesos per month) (0-40,000) 80,000) 160,000 320,000) 640,000) (640,001+) SF
FO (0-2,000) 4.1 7.4 4.5 5.6Fl (2,001-4,000) 6.7 6.5 5.1 5.1 4.3 5.8
(5.0) (6.5) (5.9)F2 (4,001-8,000) 7.9 7.7 9.1 7.5 7.6 5,7 7.8
(5.6) (7.6) (8.0) (2.5) (6.6)
F3 (8,001-16,000) 10.3 10.4 7.6 7.4 8.7 8.4(5.3) (5.6) (6.9) (4.0) (5.8)
F4 (16,001-32,000) 4.5 8.5 6.6 6.7(7.0) (4.2) (5.1)
F5 (32,000+) (3.7) 4.0 4.7
EH 6.3 7.5 8.3 7.1 7.3 6.9 7.3(5.5) (6.6) (7.3) (5.6) (4.4) (6.0)
Note: Average household sizes for tenants are in parentheses. Housing categories for tenants are as in Table 4-14. Single observations in somecells (4 tenants, 1 other) are omitted.
Source: Cartagena household survey, 1978.
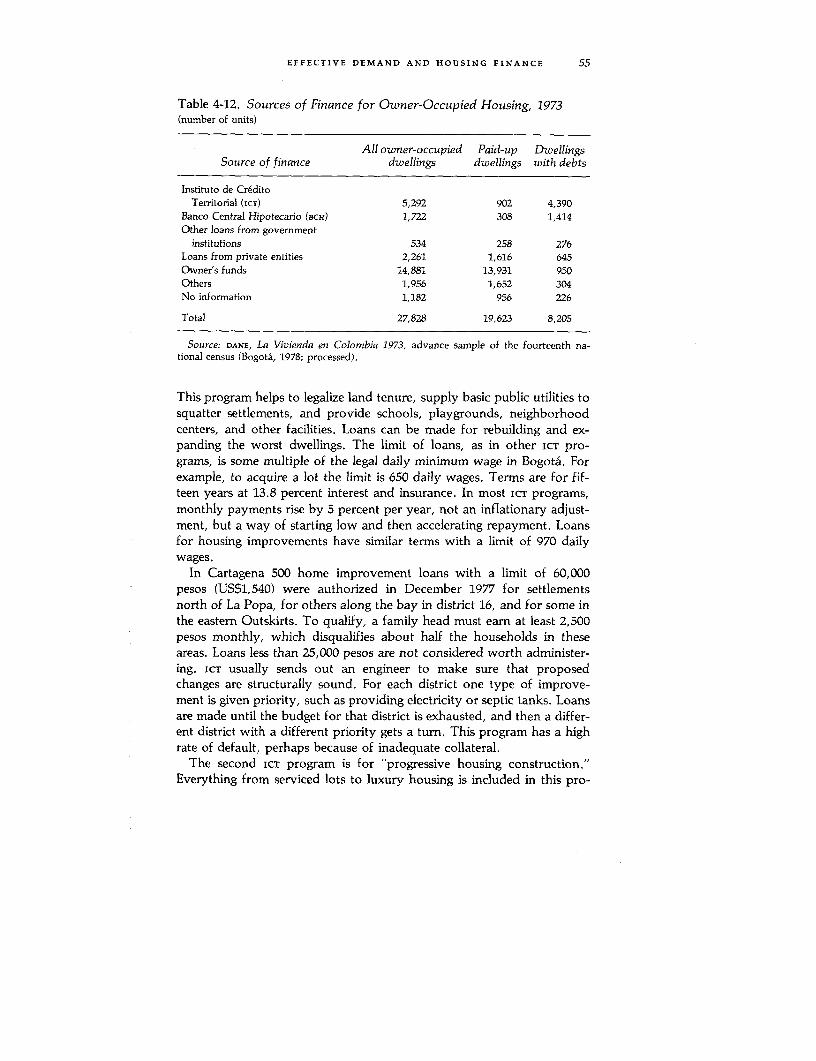
EFFECTIVE DEMAND AND HOUSING FINANCE 55
Table 4-12. Sources of Finance for Owner-Occupied Housing, 1973(number of units)
All owner-occupied Paid-up DwellingsSource of finance dwellings dwellings with debts
Instituto de CreditoTerritorial (IcT) 5,292 902 4,390
Banco Central Hipotecario (BCH) 1,722 308 1,414
Other loans from govemmentinstitutions 534 258 276
Loans from private entities 2,261 1,616 645Owner's funds 14,881 13,931 950
Others 1,956 1,652 304
No information 1,182 956 226
Total 27,828 19,623 8,205
Soujrce: DANE, La Vivienda en Colombia 1973, advance sample of the fourteenth na-tional census (Bogota, 1978; processed).
This program helps to legalize land tenure, supply basic public utilities tosquatter settlements, and provide schools, playgrounds, neighborhoodcenters, and other facilities. Loans can be made for rebuilding and ex-panding the worst dwellings. The limit of loans, as in other ICT pro-grams, is some multiple of the legal daily minimum wage in Bogota. Forexample, to acquire a lot the limit is 650 daily wages. Terms are for fif-teen years at 13.8 percent interest and insurance. In most ICT programs,monthly payments rise by 5 percent per year, not an inflationary adjust-ment, but a way of starting low and then accelerating repayment. Loansfor housing improvements have similar terms with a limit of 970 dailywages.
In Cartagena 500 home improvement loans with a limit of 60,000pesos (US$1,540) were authorized in December 1977 for settlementsnorth of La Popa, for others along the bay in district 16, and for some inthe eastem Outskirts. To qualify, a family head must eam at least 2,500pesos monthly, which disqualifies about half the households in theseareas. Loans less than 25,000 pesos are not considered worth administer-ing. IcT usually sends out an engineer to make sure that proposedchanges are structurally sound. For each district one type of improve-ment is given priority, such as providing electricity or septic tanks. Loansare made until the budget for that district is exhausted, and then a differ-ent district with a different priority gets a tum. This program has a highrate of default, perhaps because of inadequate collateral.
The second ICT program is for "progressive housing construction."Everything from serviced lots to luxury housing is included in this pro-
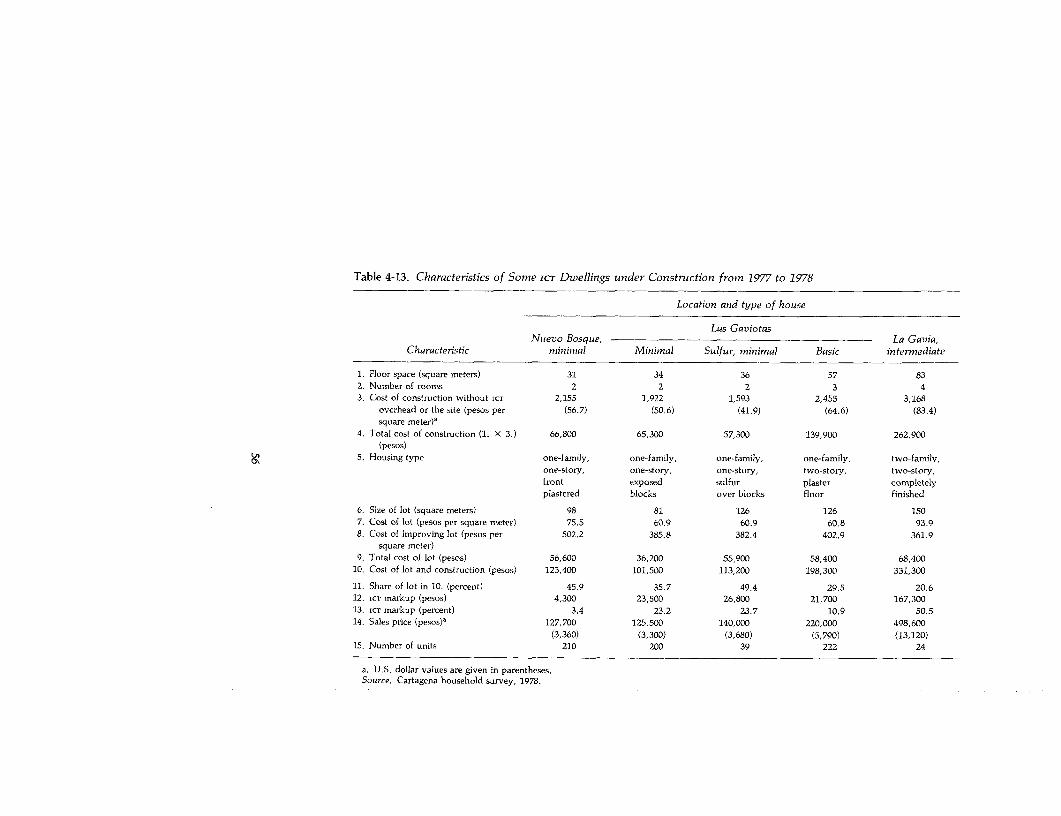
Table 4-13. Characteristics of Some ICT Dwellings under Construction from 1977 to 1978
Location and type of house
Las GaviotasNuevo Bosque, La Gavia,
Characteristic minimal Minimal Sulfur, minimal Basic intermediate
1. Floor space (square meters) 31 34 36 57 832. Number of rooms 2 2 2 3 43. Cost of construction without ICT 2,155 1,922 1,593 2,455 3,168
overhead or the site (pesos per (56.7) (50.6) (41.9) (64.6) (83.4)square meter)'
4. Total cost of construction (1. X 3.) 66,800 65,300 57,300 139,900 262,900(pesos)
5. Housing type one-family, one-family, one-family, one-family, two-family,one-story, one-story, one-story, two-story, two-story,front exposed sulfur plaster completelyplastered blocks over blocks floor finished
6. Size of lot (square meters) 98 81 126 126 1507. Cost of lot (pesos per square meter) 75.5 60.9 60.9 60.8 93.98. Cost of improving lot (pesos per 502.2 385.8 382.4 402.9 361.9
square meter)9. Total cost of lot (pesos) 56,600 36,200 55,900 58,400 68,400
10. Cost of lot and construction (pesos) 123,400 101,500 113,200 198,300 331,300
11. Share of lot in 10. (percent) 45.9 35.7 49.4 29,5 20.612. ICT markup (pesos) 4,300 23,500 26,800 21,700 167,30013. ICT markup (percent) 3.4 23.2 23.7 10.9 50.514. Sales price (pesos)' 127,700 125,500 140,000 220,000 498,600
(3,360) (3,300) (3,680) (5,790) (13,120)15. Number of units 210 200 39 222 24
a. U.S. dollar values are given in parentheses.Source: Cartagena household survey, 1978.

EFFECTIVE DEMAND AND HOUSING FINANCE 57
gram, but naturally the upper limits in terms of MDW (minimum dailylegal wages) and the terms of financing vary. The limit for a lot is 400MDW; for a lot with a plumbing core, 650 MDW; for a minimal house,1,290 MDW; for a basic house, 1,935 MDW; for an intermediate dwelling,3,225 MDW; and for maximal dwellings, 6,456 MDW.3 Except for dwellingsthat ICT builds jointly with other agencies, the maximum floor space is100 square meters. One such exception was to be the 115-square-meterdesign for 1.15- million-peso apartments planned for Chambacu beforethat terrain of 9 hectares had to be sold to the BCH. Owners of lots canreceive 1,290 MDW to help them organize construction. In other cases, ICT
will hire the contractors and supervise the construction of several hun-dred units of a type.
Financial terms are more rigorous for the more expensive dwellingtypes. Amortization periods range from a dozen years for minimalhouses to fifteen years for basic and better houses. Minimal (130,000pesos of 1978) houses have only 10 percent down payment required,basic dwellings (225,000 pesos of 1978) call for 15 percent, and others 20percent. Interest and insurance are 14 percent for the minimal, 16 to 19.5percent for the basic, and 7 percent on the outstanding but price-indexedbalance for more expensive housing. Intermediate dwellings are indexedat only 65 percent of the UPAC (units of constant purchasing power) rate,and maximal dwellings at 75, 85, and 100 percent as their value rises. Theprogressive aspect of these dwellings, however, is not only the differentrate of financing, but also their design which facilitates improvementsand expansion. The smaller the house is, the more likely it is to bedelivered unplastered, unpainted, and with rudimentary doors, win-dows, and floors. All have electricity, kitchens, water, and toilets con-nected to sewerage systems.
In Table 4-13, the first three columns give information about minimalhouses in Cartagena. Even more minimal 20-square-meter dwellingswere begun in Los Calamares in 1980. The 34-square-meter, two-roomhouse for Gaviotas required 6,300 pesos for a down payment and 1,392pesos in monthly payments. This amount was 30 percent of the4,640-peso minimum family income needed to qualify.
For a Gaviotas basic house, the down payment was 44,000 pesos, andthe initial level of monthly payments was 1,855 pesos. Households withincomes below 8,250 pesos did not qualify. Those at the minimum levelpaid 22.5 percent of their incomes on the mortgage. To afford this typeof house the family had to be in the upper half of the Cartagena incomedistribution. Indeed, housing finance was in such short supply and thesefinancial terms with their mere 5 percent annual increase in payments ona nonindexed balance were so favorable that buyers had to be chosen bylottery.

58 EFFECTIVE DEMAND AND HOUSING FINANCE
The gain to ICT depended not only on the financial terms, however,but also on the markup. For the Nuevo Bosque minimal house, the markupwas only 3.4 percent, but for the La Gavia intermediate dwellings it was50.5 percent. Nevertheless, accelerating inflation decapitalized ICT. Afternational subsidies to ICT were curtailed for macroeconomic, anti-infla-tionary reasons during 1977-80, most ICT residential construction had tobe delayed, and for a while nothing was built.
The third ICT program helps to finance public and commercial installa-tions, and the fourth program promotes community improvementsthrough cooperatives and training. Some ot these are prerequisites for up-grading of housing but will not be described further.
There are several restrictions on ICT loans. They must not go to anyfamily that has assets more than ten times the value of the loan, that ownsdwellings or lots, or that has lived less than a minimum number of yearsin a city (for Cartagena the minimum is four years). An upper limit to in-comes is not specified, but social workers can decide that a family drawnby lot is not really suitable for a neighborhood for a given income class.Families may take three months to improve and add to the dwellingbefore moving in, and this practice is widespread. After five years of oc-cupancy, the dwelling may be sold to ICT and the equity recovered. Al-tematively the entire debt may be paid off and the dwelling sold toanother directly, a transaction that is likely to be far more lucrative,given inflation. Inspections exist to make sure that first buyers occupytheir premises and do not become landlords who go off to Venezuela for ajob. Some ICT policies have been influenced by the Caja de Vivienda Pop-ular of Bogota, which is described in Appendix J.
Banco Central Hipotecario (BCH)
The BCH deals only with private employees. After three years of em-ployment, workers can obtain a loan twenty-seven times the monthlyeamings (salaries plus fringe benefits). Public employees have a similarsystem administered through the Caja de Previsi6n Social. Alternatively,one can borrow 90 percent of the value of the house, whichever is less.The house must be less than one year old. The employers must pay to theBCH all the amount including interest that would have gone into cesan-tias, the retirement fund. This interest includes a price-indexed amount.If the pay increase has been very large, then an arrangement can be madewhereby only 85 percent of the cesantias (plus all the interest) is paid tothe BCH. The maximum amortization period is fifteen years. A houseworth 200,000 to be paid for in fifteen years by an employee with onlythree years of employment requires a job that pays 7,400 pesos monthly.

EFFECTIVE DEMAND AND HOUSING FINANCE 59
For dwellings in the 200,001-400,000 peso range, BCH lent 80 percentor twenty-seven monthly earning equivalents, whichever was less. In thefirst year, monthly payments had to be 12 percent of the previous year'sincome of the head of the household from all sources. In the second yearpayments were stable at a rate 8 percent above the first year's payments.Through the fifteenth year payments would thus rise at 8 percent com-pounded: 0.12 Y (1.08)". Of course, the loan may be paid off earlier atthe owner's discretion.
Older houses less than fifteen years old are financed by a differentscheme. Any amount will be lent, but the outstanding balance is due interms of units of constant purchasing power (UPAC). Thus amortizationand interest are indexed in a complex manner that originally kept upwith, but now lags behind, the rate of inflation. Since the ancient walledhistorical center of Cartagena is a special case, loans can be acquired forrebuilding old dwellings, but each structure is investigated individuallyfor its merits.
Real Estate Taxes
Real estate taxes are part of housing costs to the family, yet they divertspending from shelter itself. The system of taxes in Cartagena makes itdifficult to assess their effect, but they do not seem important. Dwellingsfinanced by a public institution such as ICT or BCH were charged no taxesat all for ten years on the grounds that government institutions are taxexempt. Since this exemption applied to dwellings worth less than120,000 pesos, inflation had eroded its significance. Inflation also made itimpossible to know the rate of taxation, nominally 1.4 percent, becausethe time of assessment had been changed from every two years to everyfour years. Since construction costs had tripled in four years, the initialpercentage fell rapidly.
Land was assessed separately from structures, and in the best commer-cial zones and tourist sectors-La Matuna and El Laguito-land pricesrose faster than building costs, from 1,500 to 5,000 pesos per squaremeter during 1976-78. A few choice spots were sold for double or triplethe latter value. The Oficina Nacional del Catastro de Bolivar had mapsof isobars of land values of Cartagena, but these were confidential.
A typical case concerned a 158-square-meter house built in 1955 on334 square meters of land near Bazurto. In 1966 the house was worth sixtimes as much as the land. Five years later the site value had risen somuch that the house was worth only 2.6 times as much. When the citymarket moved to a location a few blocks away, the site value movedwithin 8 percent of structural value.

60 EFFECTIVE DEMAND AND HOUSING FINANCE
Site value (pesos) Structural value (pesos) Total (pesos)1966 8,800 53,500 62,300
1971 24,400 62,800 87,200
1978 152,600 165,200 317,800
Most important, however, is that in Cartagena only a limited attemptis made to collect real estate taxes regularly. Those who wish to pay cando so and have the amount added to their regular charges for water,light, sewerage, garbage collection, police protection, and other services.Since 1976 such collections have been computerized. But those who donot wish to pay need not do so. Taxes in arrears are collected whenever aproperty becomes involved in a legal transaction, a sale, or an inheritance.
At the time of our survey, a description of the system in 1975 still ap-peared valid:
The assessment procedures are biased towards lower than marketvalue assessments, occur too infrequently, and do not appear to con-centrate on the high value and rapid growth areas, when partial assess-ments are required. Complex and poorly designed rate structures, col-lection problems, and lags in the application of reassessed propertyvalues for tax purposes cause further difficulties . 4
Property was assessed by the National Geographic Institute "AgustinCodazzi" in a system that involved much self-assessment by realtors andowners. Tax and service charge rates were set by various levels of govern-ment, and Empresas Publicas Municipales (EPM) did the collecting. Waterand sewerage service charges, like the taxes, were in proportion to prop-erty values. These values were the sum of separate assessments of landand improvements. Land value assessment began by estimating severalhundred "key sites" on the basis of recent sales and then interpolatingcontours of equal value throughout the city. Size and specific characteris-tics would then modify the value of each site from that suggested by thecontours. Improvements were assessed separately on the basis of a pointsystem for materials, finish, state of conservation, and age. The pointswere multiplied by a price index from construction surveys in an area.Adjustments were then made for the dimensions of the structure andother features to get the final value.
The average assessment of property values along the Coast (Zone 1)was 3.5 times that in Lomas (Zone 4) in 1972, which compares with a 4.2ratio according to the estimates of sample owner-occupants in 1978. Theaverage Lomas property, in turn, had 3.5 times the value of a Southeastsector (Zone 3) property according to the 1972 assessment, comparedwith 3.2 times in our survey. Coastal rents in 1978 were 2.7 times those ofLomas, which were 1.7 times those of the Southeast. In 1972 pesos, theaverage values were: Zone 1, 360,000 pesos; Zone 4, 100,000 pesos; andZone 3, 30,000 pesos. The changes in relative values from 1973 to 1978

EFFECTIVE DEMAND AND HOUSING FINANCE 61
seem plausible, given such factors as the tourist boom in Bocagrande. Inaddition, income in 1978 on the Coast was 2.3 times that of Lomas, whichin tum was 1.7 times that of the Southeast. Differences in housing valueswere greater than the differences in the owners' incomes.
Tax and service charge collections grew at a slower rate over time thanproperty values during 1961-72, although perhaps at the same rate as percapita income.5 This trend continued during the rest of the 1970s. None ofthe families surveyed said they did or did not move, buy, build, or ex-pand because of taxes.
The Demand for Land and Location
Dwellings come linked to public utilities, land, a neighborhood, anddistances to employment centers and other urban activities. For manyyears the amount and cost of space and the distance of journeys to workwere considered the key determinants of residential choice in theoriesabout different income groups in developed countries. Lately this em-phasis has faded, and maintenance and improvement of structures in pre-ferred neighborhoods regardless of density or distance has seemed moreplausible.6 In a medium-size city such as Cartagena, density and distancewere definitely of secondary importance compared with neighborhoodand access to utilities.
The average Cartagenian travels fifteen minutes or 2 or 3 kilometers towork, but this need is not especially associated with incomes or densityof settlement. Size of a lot correlates significantly with income and thenumber of adults in a household but not with the distance that principalworkers must travel daily. Indeed, the sign is wrong, and those with thelonger commutes have smaller lots. Around a mean lot size of 251 squaremeters the standard deviation is 185 square meters, and income accountsfor only 3.2 percent of the variation. Qualities other than size or distanceexplain why the rich picked their 333-square-meter lots compared withthe 200-square-meter lots of the poor, as shown below.
Average distancefrom work(kilometers;
Average lot size total for(square meters; two principal
Monthly income (pesos) N = 285) workers)0-4,000 199 4.6
4,001-8,000 241 4.5
8,001-16,000 263 6.0
16,001+ 333 3.9
Weighted average 251 4.8

62 EFFECTIVE DEMAND AND HOUSING FINANCE
Bringing in the number of adults in a household raises the R2 from 0.032to 0.097.
What mattered was not the size or distance of the lot but whether ithad water and public sewerage service and whether it was located in aprestigious district. In the highest income range, lot size was even nega-tively (and significantly) associated with income. The best land in Boca-grande and the Centro was scarce, expensive, and subdivided into smallparcels.
Of course, occupants realized that conversion to commercial use couldaffect their property values. This effect was most marked among the fivedwellings that tumed up in the Pie de la Popa district near the intersec-tion of Zones 1, 3, and 4. Pie de la Popa was the principal crossroads ofCartagena. Much traffic had to pass by here below the steep promontoryof La Popa and the lagoon Cafio Bazurto. Some of it went along thenorth-south route from Torices to Manga, but more went between theCentro and Bocagrande on the east to the numerous poorer quarters tothe west. Transfer of the municipal market from Getsemani, near the cen-ter, to Bazurto further raised the commercial value of sites in this sector.
Owners of dwellings were well aware of the way economic and popu-lation growth had raised the value of their assets. Elsewhere in the citywe usually found that multiplication of the purchase price of a house bythe construction cost index, with some allowance for improvements,came astonishingly close to the price people thought they could sell theirhouse for. But in Pie de la Popa, three respondents out of five believedthat they could charge about double the price-index-corrected amount;and one believed he could charge more than ten times as much. This lastfamily owned 1,350 square meters on the Avenida Don Pedro de Here-dia, the principal highway. They had bought the site in 1946 and builttheir present house in 1948. As an exception, the owner of a four-roomhouse in a little dead-end alley thought his value had only tripled whenthe price index would have suggested a quintupling.
Moves and Location
According to a 1976 survey of migrants to Cartagena, 81 percent hadremained more than four years in the first residential area occupied afterarrival. The proportion was the same whether the migrants settled in es-tablished housing, slums, squatter settlements, or nearby communities.Whether mobility was not sought or was too costly is not clear. They didmove within their areas, however, and only a few had remained in onedwelling. A substantial number of those with long periods of residencehad become owners.

EFFECTIVE DEMAND AND HOUSING FINANCE 63
The same study found that half the employers were natives of Car-tagena, but that they all had lived two or more years in larger Colombiancities or abroad. Second-level managers came primarily from the inte-rior. According to the employers, office workers and laborers camemainly from the Department of Bolivar (including Cartagena) or fromthe rest of the coast.
One employer made revealing comments about housing as an obstacleto recruiting technicians from the interior who, in turn, could raise localproductivity through better supervision:
The cost of living is very high and Cartagenian society is very polar-ized ... as can be confirmed by a simple look at the city. Rent for ahouse or a comfortable apartment is very high, partly due to the com-petition of tourists ... It differs from cities like Bogota, Manizales,Bucaramanga, and others where one can live comfortably in inter-mediate neighborhoods. Although we pay technicians from elsewheregood salaries, it's hard for them to live as well here as they did in Bo-gotA, for example; and, therefore, after one or two trial years, theyprefer to go back. 7
The relation between type of tenure and mobility in 1978 is shown inTable 4-14.
More than two-thirds of Cartagenians had lived ten years or less attheir present site, and more than half five years or less. At the time of ourinterviews, 13.6 percent of households-one in seven-was thinking ofmoving again. Table 4-15 compares the reasons for moving the previoustime with those for moving again.
Becoming an owner had been the primary reason the previous timeand would again be a motive for those new households, tenants, freeusers, and prospective migrants who were not yet part of the population.
Table 4-14. Relation between Mobility and Type of Tenure
Number of years Total Southeast ICT
at present site sample Tenants Others zone zone
1-5 51.0 84.1 41.8 50.0 60.86-10 17.0 11.1 18.7 14.5 19.6
11-15 11.5 3.2 13.8 11.3 13.7
16-20 9.0 0.0 11.6 9.7 5.9
21-30 5.9 1.6 7.1 9.7 0.031+ 5.6 0.0 7.1 4.8 0.0
Source: Cartagena household survey, 1978.

64 EFFECTIVE DEMAND AND HOUSING FINANCE
Table 4-15. Reasons for Moving to Another Dwelling(percent)
Reason Previous time Next time
Become an owner 56.2 13.2Be in better neighborhood 6.4 13.2Pay less 6.4 0Have a bigger house 3.5 5.3Be closer to work 3.5 0Be closer to relatives 3.2 0Have better quality dwelling 2.1 26.3Have better public utilities 2.1 13.2Have a shop, store, or office 1.1 0Move away from relatives 1.1 2.6Other 14.5 26.3
Source: Cartagena household survey, 1978.
Hence this reason would not fall as much in importance as the table sug-gests. Improved quality of dwelling, better neighborhood, and betterpublic utilities would otherwise be the principal motives. Compared withalternative reasons, these reasons reflected higher income levels andhigher aspirations.
In 64.5 percent of the ninety-three dwellings that had had previous oc-cupants, the present owners felt that their predecessors had been approx-imately as well off as their own family. Some 14.0 percent thought theprevious occupants had been somewhat richer, and 16.1 percent saidsomewhat poorer. Only 5.4 percent thought that substantial upward ordownward filtering had occurred. By the same token, 76.4 percentthought that they were about as well-off as their neighbors, and only 1.1percent thought there was much of a difference in economic status. Ifanything, the neighbors were richer.
At the time of moving the average family size had been 6.3 (standarderror 0.2), which was not much below the current average family size of7.0. Perhaps these households were about to grow from somewhat belowto substantially above average, whereas some others formed new smallhouseholds.
Travel time to a job was not a very important criterion of housingchoice. More than half the family heads and principal second workerstraveled by bus, as shown in Table 4-16.
After moving, average travel time had not changed dramatically forfamily heads, meaning an increase of 20.6 percent (standard error 9.7percent). For the spouse or other second worker, time had risen by a sta-
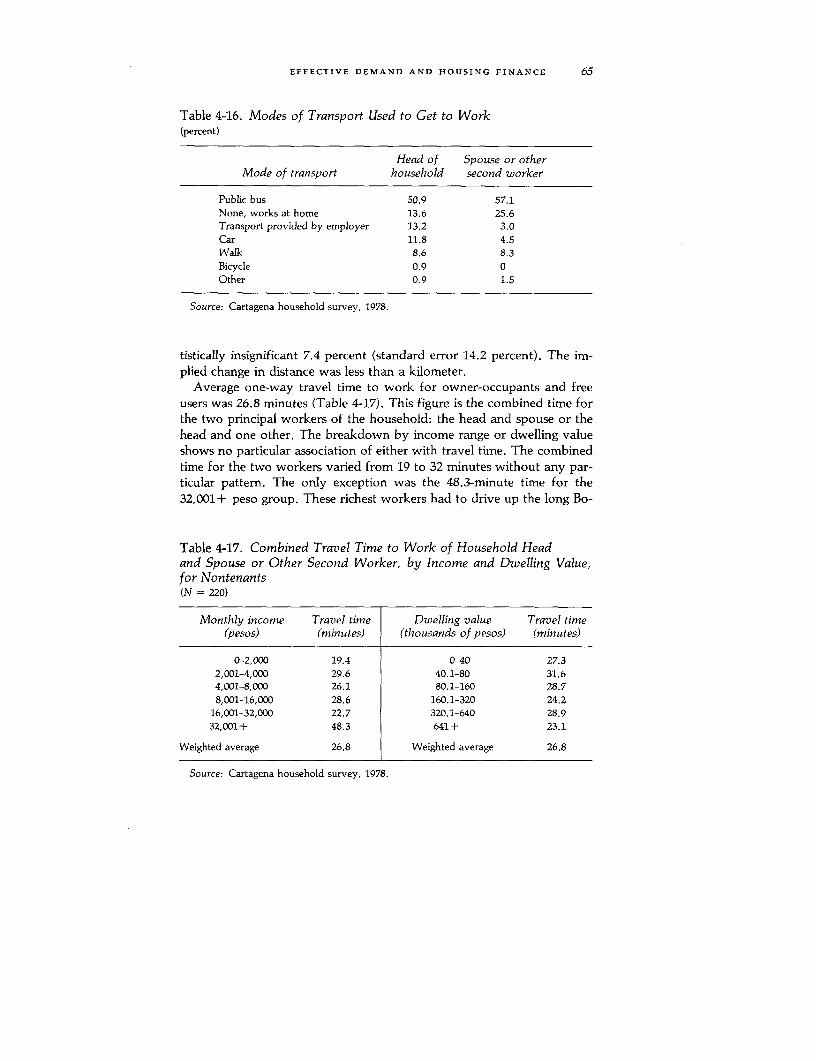
EFFECTIVE DEMAND AND HOUSING FINANCE 65
Table 4-16. Modes of Transport Used to Get to Work(percent)
Head of Spouse or otherMode of transport household second worker
Public bus 50.9 57.1None, works at home 13.6 25.6Transport provided by employer 13.2 3.0Car 11.8 4.5Walk 8.6 8.3Bicycle 0.9 0Other 0.9 1.5
Source: Cartagena household survey, 1978.
tistically insignificant 7.4 percent (standard error 14.2 percent). The im-plied change in distance was less than a kilometer.
Average one-way travel time to work for owner-occupants and freeusers was 26.8 minutes (Table 4-17). This figure is the combined time forthe two principal workers of the household: the head and spouse or thehead and one other. The breakdown by income range or dwelling valueshows no particular association of either with travel time. The combinedtime for the two workers varied from 19 to 32 minutes without any par-ticular pattem. The only exception was the 48.3-minute time for the32,001 + peso group. These richest workers had to drive up the long Bo-
Table 4-17. Combined Travel Time to Work of Household Headand Spouse or Other Second Worker, by Income and Dwelling Value,for Nontenants(N = 220)
Monthly income Travel time Dwelling value Travel time(pesos) (minutes) (thousands of pesos) (minutes)
0-2,000 19.4 0-40 27.32,001-4,000 29.6 40.1-80 31.64,001-8,000 26.1 80.1-160 28.78,001-16,000 28.6 160.1-320 24.2
16,001-32,000 22.7 320.1-640 28.932,001+ 48.3 641+ 23.1
Weighted average 26.8 Weighted average 26.8
Source: Cartagena household survey, 1978.
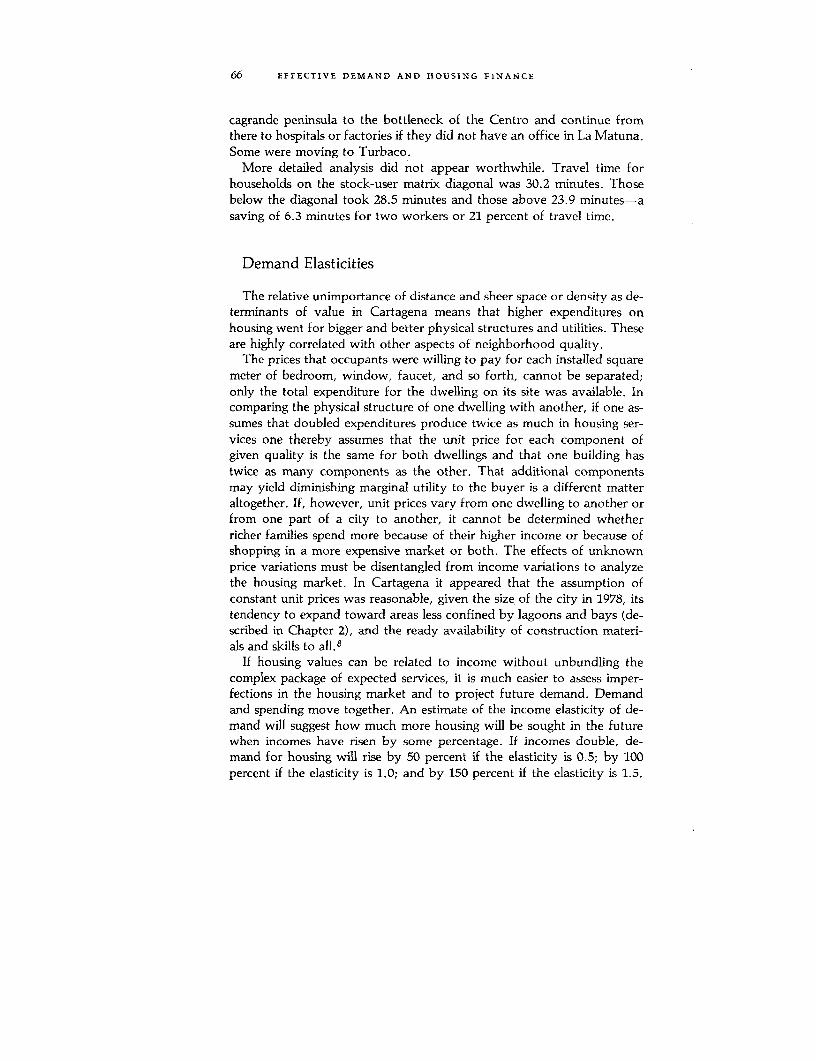
66 EFFECTIVE DEMAND AND HOUSING FINANCE
cagrande peninsula to the bottleneck of the Centro and continue fromthere to hospitals or factories if they did not have an office in La Matuna.Some were moving to Turbaco.
More detailed analysis did not appear worthwhile. Travel time forhouseholds on the stock-user matrix diagonal was 30.2 minutes. Thosebelow the diagonal took 28.5 minutes and those above 23.9 minutes-asaving of 6.3 minutes for two workers or 21 percent of travel time.
Demand Elasticities
The relative unimportance of distance and sheer space or density as de-terminants of value in Cartagena means that higher expenditures onhousing went for bigger and better physical structures and utilities. Theseare highly correlated with other aspects of neighborhood quality.
The prices that occupants were willing to pay for each installed squaremeter of bedroom, window, faucet, and so forth, cannot be separated;only the total expenditure for the dwelling on its site was available. Incomparing the physical structure of one dwelling with another, if one as-sumes that doubled expenditures produce twice as much in housing ser-vices one thereby assumes that the unit price for each component ofgiven quality is the same for both dwellings and that one building hastwice as many components as the other. That additional componentsmay yield diminishing marginal utility to the buyer is a different matteraltogether. If, however, unit prices vary from one dwelling to another orfrom one part of a city to another, it cannot be determined whetherricher families spend more because of their higher income or because ofshopping in a more expensive market or both. The effects of unknownprice variations must be disentangled from income variations to analyzethe housing market. In Cartagena it appeared that the assumption ofconstant unit prices was reasonable, given the size, of the city in 1978, itstendency to expand toward areas less confined by lagoons and bays (de-scribed in Chapter 2), and the ready availability of construction materi-als and skills to all.8
If housing values can be related to income without unbundling thecomplex package of expected services, it is much easier to assess imper-fections in the housing market and to project future demand. Demandand spending move together. An estimate of the income elasticity of de-mand will suggest how much more housing will be sought in the futurewhen incomes have risen by some percentage. If incomes double, de-mand for housing will rise by 50 percent if the elasticity is 0.5; by 100percent if the elasticity is 1.0; and by 150 percent if the elasticity is 1.5.

EFFECTIVE DEMAND AND HOUSING FINANCE 67
Of course, these percentages have to be translated into space, materials,finishes, and components by suppliers. The way in which the demand ismet-by adding to and transforming the housing stock-is the topic ofcoming chapters.
Housing markets are subject to imperfections, especially barriers to theflow of capital under inflationary conditions. Families may have no op-portunity to devote a fifth or so of their income to amortizing a fifteen-year mortgage at a realistic rate of interest, one that reflects the scarcityof savings. Until they expand their dwelling, they may be "out of equilib-rium": living in premises that are too small and otherwise inferior. Undersome circumstances, the shortage of housing may have raised the price ofthe inadequate dwelling together with the rest of the housing stock, andthe household will pay its expected share for housing without receivingthe expected utility. In an imperfect market, housing that is actually oc-cupied and prices that are actually paid are an uncertain guide to futuredemand.
If the income elasticity of demand has been estimated accurately byobserving behavior and comparing willingness to pay with actual pay-ments, including improvements, the extent to which households are indesired housing "on their demand function" can be determined. It is en-tirely possible that because of reductions in family size with age or imper-fections in housing and other markets, some households will be in betterhousing than might have been expected. The tendency to invest tran-sitory income in the best available outlet may also lead to this situation.If, however, high-income households appear to live in surprisingly goodhousing, the income elasticity of demand may simply have been underes-timated.
Only if the income elasticity of demand has been properly assessed willthe diagonal of the stock-user matrix have normative implications: asmany households should be above as below. Typically F2 householdswil live in H2 dwellings, F3 households in H3 dwellings, and so forth. Ifthe elasticity of demand is 1.5, a doubling in the range of housing valuesin the columns of the cross-tabulation goes with a two-thirds rise in thelevel of household income for the rows. A normative implication of thematrix is that moving any out-of-equilibrium household from one cellbelow the diagonal to the diagonal is as good as moving any other. Itrepresents an equal percentage improvement. For a given amount of re-sources, more poor than rich households can be moved to the diagonal toan extent that outweighs any downward transfers from the rich to thepoor or "filtering."9
The overall housing-income elasticity for owners was estimated withregression analysis to be 1.18 and thus higher than that of 0.87 for mort-
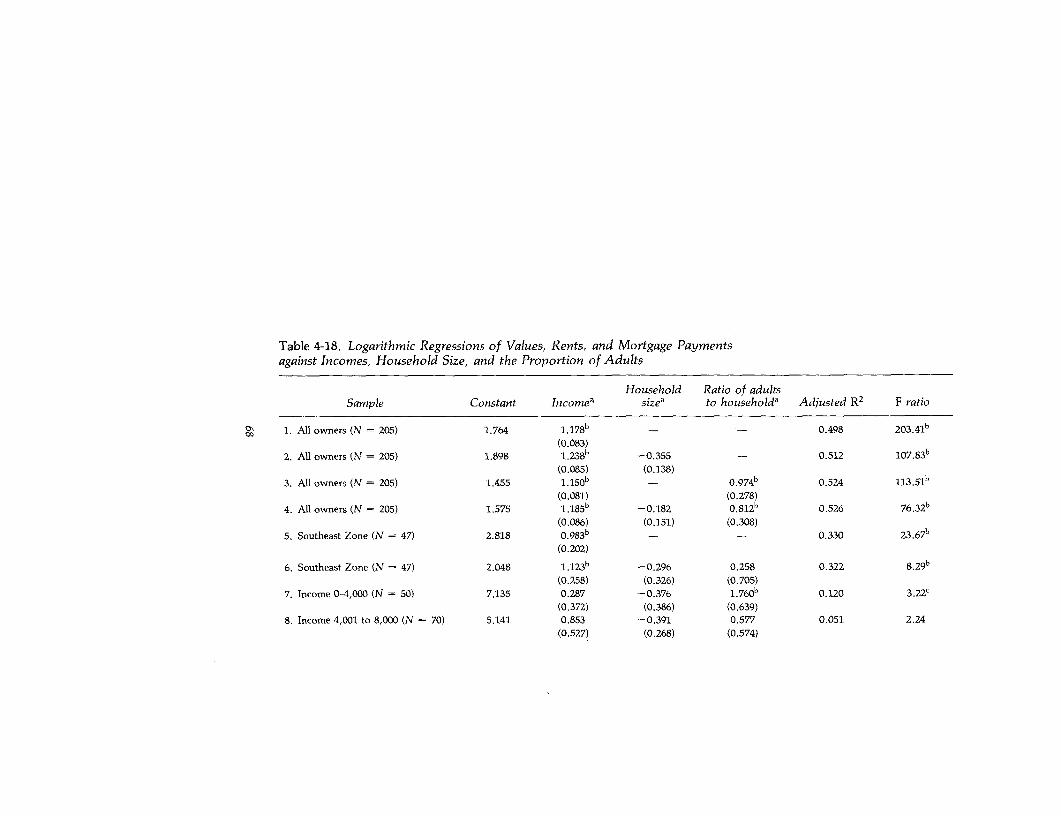
Table 4-18. Logarithmic Regressions of Values, Rents, and Mortgage Paymentsagainst Incomes, Household Size, and the Proportion of Adults
Household Ratio of adultsSample Constant Incomea sizea to household& Adjusted R2 F ratio
ca 1. All owners (N = 205) 1.764 1 .1 7 8 b l b 0.498
(0.083)2. All owners (N = 205) 1.898 1.23e -0.355 - 0.512 107.83b
(0.085) (0.138)3. All owners (N = 205) 1.455 1 .15 0 b - 0 9 74 b 0.524 113.51b
(0.081) (0.278)4. All owners (N = 205) 1.575 I,185b -0.182 0.812b 0.526 76 .3 2 b
(0.086) (0.151) (0.308)5. Southeast Zone (N = 47) 2.818 0 .9 8 3 b _ _ 0.330 2 3 .6 7 b
(0.202)
6. Southeast Zone (N = 47) 2.048 1 .12 3 b -0.296 0.258 0.322 8 .2 9 b
(0.258) (0.326) (0.705)7. Income 0-4,000 (N = 50) 7.135 0.287 -0.376 1 . 76 0b 0.120 3.22c
(0.372) (0.386) (0.639)8. Income 4,001 to 8,000 (N = 70) 5.141 0.853 -0.391 0.577 0.051 2.24
(0.527) (0.268) (0.574)

9. Income 8,001 to 16,000 (N = 55) -2.377 1.615" -0.171 0.434 0.108 3.22c
(0.556) (0.247) (0.565)
10. Income 16,001+ (N = 29) 6.792 0.635 0.261 0.369 0.058 0.48
(0.571) (0.507) (0.824)
11. All tenants (N = 65) -0.024 0 .7 86 b - - 0.440 51.25b
(0.110)
12. All tenants (N = 65) 0.515 0.777b -0.258 -0.311 0.437 17 53b
(0.111) (0.233) (0.424)
13. All mortgagors (N = 50) -0.619 0.873 - - 0.156 10.08b
(0.275)14. All mortgagors (N = 50) -1.319 0.940 -1.215 0.918 0.267 6 .9 5 b
(0.258) (0.418) (0.884)
Note: The dependent variable for the first ten equations is the logarithm of the estimated value of the dwelling. For the last four it is the logarithm
of monthly rent or mortgage payment. Substituting actual values for the logarithms of income and household size did not significantly change
results. Adults were defined as aged 18 and more. Household size in line 14 is the log of the number of adults.
-Not applicable.a. Standard error is given in parentheses.b. Significance = 0.01.c. Significance = 0.05.Source: Cartagena household survey, 1978.
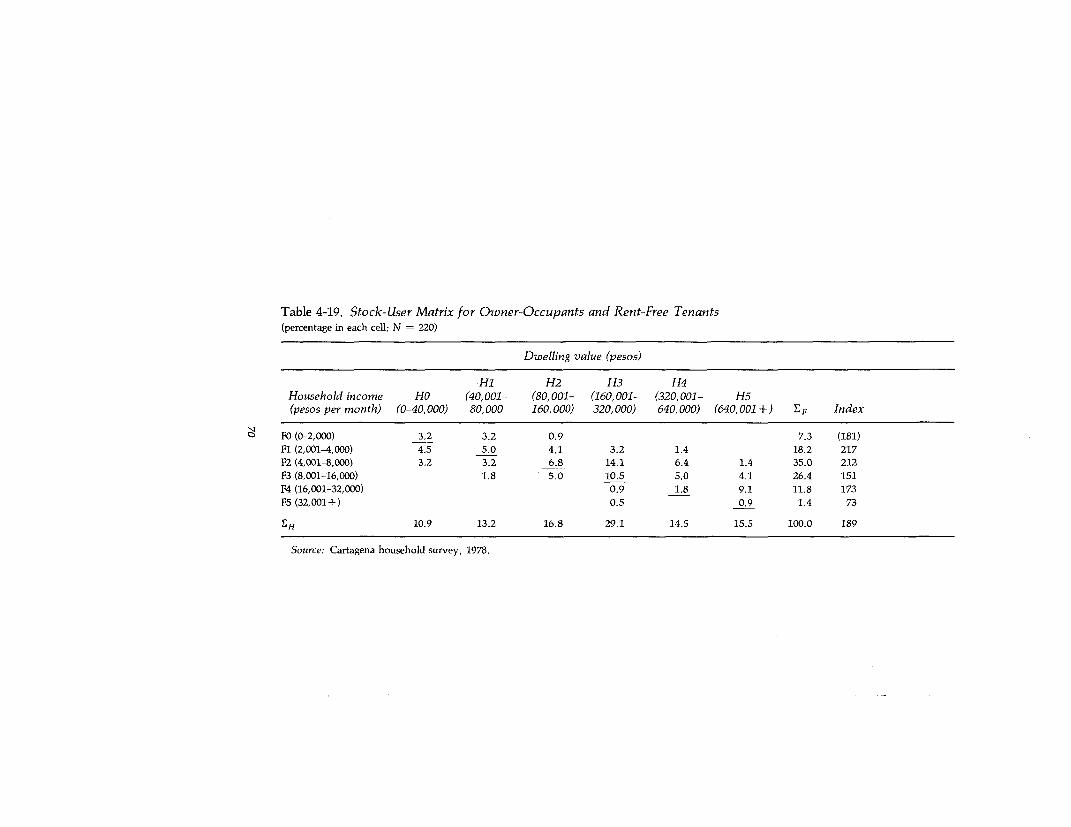
Table 4-19. Stock-User Matrix for Owner-Occupants and Rent-Free Tenants(percentage in each cell; N = 220)
Dwelling value (pesos)
HI H2 H3 H4Household income HO (40,001- (80,001- (160,001- (320,001- H5(pesos per month) (0-40,000) 80,000 160,000) 320,000) 640,000) (640,001+) EF Index
8 FO (0-2,000) 3,2 3.2 0.9 7.3 (181)Fl (2,001-4,000) 4.5 5.0 4.1 3.2 1.4 18.2 217F2 (4,001-8,000) 3,2 3.2 6.8 14.1 6.4 1.4 35.0 212F3 (8,001-16,000) 1.8 5.0 10.5 5.0 4.1 26.4 151F4 (16,001-32,000) 0.9 1.8 9.1 11.8 173F5 (32,001+) 0.5 0.9 1.4 73
SH 10.9 13.2 16.8 29.1 14.5 15.5 100.0 189
Source: Cartagena household survey, 1978.
EFFECTIVE DEMAND AND HOUSING FINANCE 71
gagors only or the 0.79 that has already been reported for tenants. Incor-porating household size or the share of adults in the household (as a life-cycle proxy) changed these elasticities only slightly. Household size addslittle to explaining the variance, but the life-cycle proxy raises the ad-justed R2 from 0.498 to 0.524, and like income is highly significant (Table4-18).
Except for the ICT sector, the income elasticity was also close to unityand highly significant within zones: Coast, 0.801; North, 0.896; South-east, 0.983; Lomas, 0.734; and Outskirts, 1.102. For the ICT Zone it is0.111 and not significant. ICT dwellings were administratively allocated.The regression constant for the ICT sector was correspondingly high,11.5, or four times that for the Southeast's 2.8. The intercepts for Zones1, 2, and 4 were 6.1, 4.1, and 6.0, respectively, and may reflect an up-ward shift because of upgrading. In the new Outskirts that had not yetoccurred, as may be expected, and the intercept was 2.7.
Elasticities were also not high within all income ranges for the entire city.For incomes of 0-4,000 pesos monthly and 4,001-8,000 pesos, the elastic-ities were 0.287 and 0.853, respectively. For 8,001-16,000 pesos, the elas-ticity doubled to 1.615; and for 16,001 pesos and above it fell back to0.635. Only the high elasticity for 8,001-16,000 pesos is statistically sig-nificant. If the regressions are run, not against value, but against themonthly payments a respondent would be willing to make for the oc-cupied dwelling, the elasticities for ranges become significant: 0.658,1.047, 1.621, respectively, and 1.484 (not significant) for those above16,000 pesos monthly. The overall willingness-to-pay elasticity is 0.973.
An elasticity of 1.0 thus seems most plausible and was used to set up thestock-user matrix of Table 4-19. The population is generally distributedalong and above the matrix diagonal from northwest to southeast, as aunitary overall elasticity would suggest. The northeast and southwestcorners are empty. But within each row, a substantial dispersion never-theless exists: by investing windfall income-from inheritances, Venezue-lan remittances, and even smuggling-in new housing or improvements,households had put themselves above the diagonal and had brought theoverall index of housing to 189. The overall index would be 120 if posi-tions above the diagonal were weighted at a diminishing rate of increase:150, 175, and 187.5. At an index of 100 everyone would be on the diagonal.
The index of housing for tenants was only 71 (Table 4-9). (If cellsabove the diagonal were weighted as 150, not 200, the index would be66.) Tenants were hardly likely to invest in their landlord's property ifthey had a windfall of income. Rather, the very lack of windfall incometo cover a down payment may explain their tenant status. In any case,tenants were mainly below the diagonal.

72 EFFECTIVE DEMAND AND HOUSING FINANCE
Closest to the diagonal were the households with incomes of8,001-16,000 pesos and with the high elasticity of 1.615. Forty percent ofthese were on the diagonal, 26 percent were below, and 34 percent wereabove. Why this group of skilled technicians and fairly young managersshould behave somewhat differently than others is not clear. In this in-come range, improvement may have ceased on upgraded H2 housing atthe low end, and a large effort to acquire something close to H4 housingmay have been made at the high end. Physical characteristics of thesehousing types are described in the next chapter, suggesting a discontinu-ity between the two extremes. Neighborhood effects have already beenmentioned. Perhaps these households are also too rich to accept windfallremittances from family migrants in Venezuela and too poor to get thesort of windfall gains associated with managing property.
The significant finding from all this is more general: the overall incomeelasticity of demand for housing appears close to unity-somewhathigher for owners and somewhat lower for tenants. Provided there wasaccess to indoor piped water, owners would expand their dwellings sothat about half would live above the matrix diagonal in housing twice asgood as might otherwise be expected. Tenants lived below the diagonalwith about half in housing that is half as good as might otherwise be ex-pected from the level of income.
Summary
Median monthly income in Cartagena in the summer of 1978 was7,500 pesos per household, and average income was 9,900 pesos. Per capitaaverage annual income was 17,000 pesos (US$440), and per capita prod-uct may have been 20 percent higher than that. Thirteen percent of house-holds received pensions, and 21 percent received interpersonal remit-tances, especially from Venezuela. For 17 percent of households, thesewere the primary sources of income and were large enough to leave themclose to the median level.
Residential mobility was high among households, with one-half of thehouseholds having been at their present site for five years or less, andwith less than one-third having been there for more than ten years. Mo-bility was especially high among tenants. Roughly one-third of owner-oc-cupants had bought used dwellings, one-third had bought formally con-structed new houses, and one-third had built their own. The measuredincome elasticity of demand was 0.8 for tenants and 1.2 for owner-occu-pants with variations within income ranges. Corrections for market im-perfections might bring both of these estimates closer to unity. Invest-
EFFECTIVE DEMAND AND HOUSING FINANCE 73
ment of temporary income in housing expansion on lots with water hadput nearly half of owner-occupants in better housing than would other-wise be expected. Household size and stage in the life cycle, as measuredhere, did not greatly affect housing demand apart from income effects.Other unimportant factors were density of settlement, lot size, distancefrom work, and real estate taxes.
Notes to Chapter 4
1. Marta Izabel Gutierrez de G6mez, "Politica Tarifaria y Distribuci6n de Ingresos"(Bogota: National Planning Department, 1975; processed), cited by Johannes Linn, Policiesfor Cities in the Developing World: Their Equitable and Efficient Growth (New York: Ox-ford University Press, 1982), p. 283.
2. Its history will not be recounted here, but a good account in English is Rafael Steven-son, "Housing Programs and Policies in Bogota: A Historical and Descriptive Analysis,"Urban and Regional Report no. 79-8 (Washington, D.C.: World Bank, June 1978; pro-cessed).
3. These categories are described in Chapter 5.4. Johannes F. Linn, "Urban Public Finances in Developing Countries: A Case Study of
Cartagena, Colombia," The World Bank, Urban and Regional Report no. 77-1 (Washing-ton, D.C.; January 1975; processed), vol. 1, p. 4.
5. Ibid.6. William C. Wheaton, "Monocentric Models of Urban Land Use: Contributions and
Criticisms," and John Quigley, "What Have We Learned about Urban Housing Markets?"in Current Issues in Urban Economics, ed. Peter Mieszkowski and Mahlon Straszheim (Bal-timore, Md.: Johns Hopkins University Press, 1979), pp. 107-29, 391-429.
7. Ministerio de Desarrollo Econ6mico, "Zona Franca Industrial y Comercial de Car-tagena: Area de Poblaci6n y Medio Ambiente: Informe Final," vol. 1 (Bogota, December1976; processed).
8. Gregory K. Ingram has applied an ingenious way of representing intrametropolitanprice variations to Bogota in "Housing Demand in the Developing Metropolis," paper pre-sented at the Econometric Society Meetings, Atlanta, Georgia, December 1979. He seg-mented the housing market according to the location of the work place of the householdhead among renters. Income elasticities ranged from 0.5 to 0.8, and price elasticities clus-tered around -0.8.
9. A semilogarithmic utility function for housing services is assumed. See W. PaulStrassmann, "Housing Priorities in Developing Countries: A Planning Model," Land Eco-nomics (August 1977), pp. 310-27.
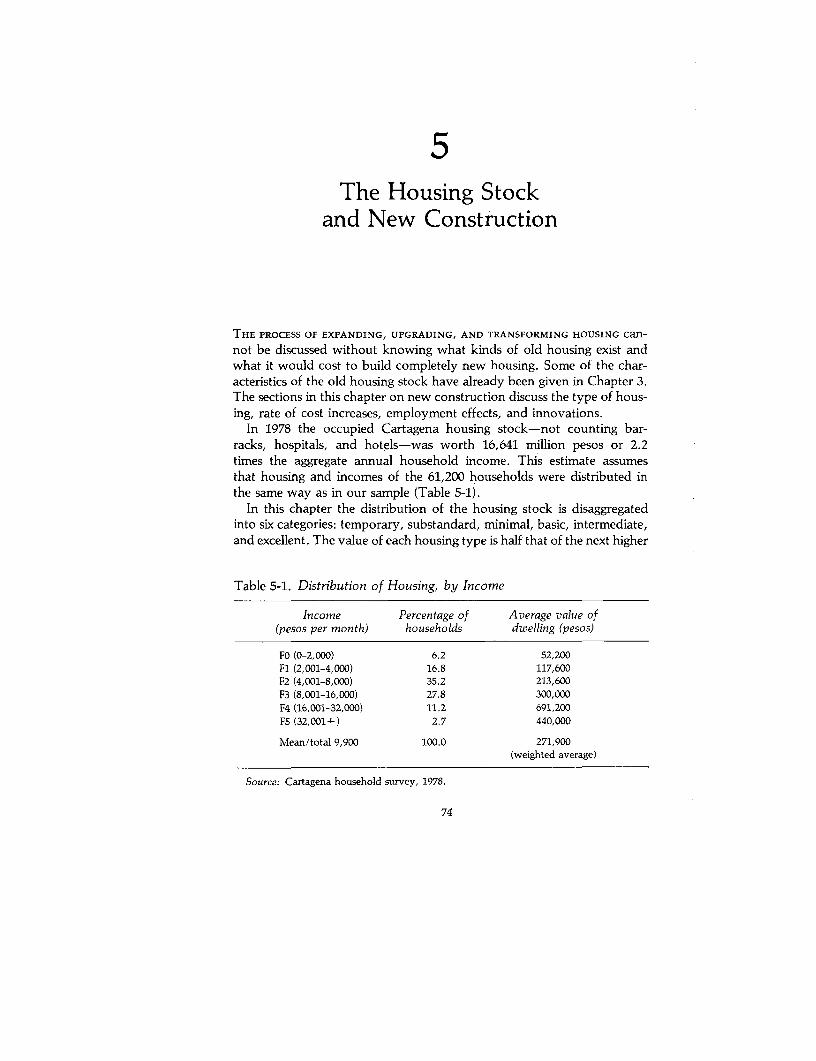
5The Housing Stock
and New Construction
THE PROCESS OF EXPANDING, UPGRADING, AND TRANSFORMING HOUSING can-not be discussed without knowing what kinds of old housing exist andwhat it would cost to build completely new housing. Some of the char-acteristics of the old housing stock have already been given in Chapter 3.The sections in this chapter on new construction discuss the type of hous-ing, rate of cost increases, employment effects, and innovations.
In 1978 the occupied Cartagena housing stock-not counting bar-racks, hospitals, and hotels-was worth 16,641 million pesos or 2.2times the aggregate annual household income. This estimate assumesthat housing and incomes of the 61,200 households were distributed inthe same way as in our sample (Table 5-1).
In this chapter the distribution of the housing stock is disaggregatedinto six categories: temporary, substandard, minimal, basic, intermediate,and excellent. The value of each housing type is half that of the next higher
Table 5-1. Distribution of Housing, by Income
Income Percentage of Average value of(pesos per month) households dwelling (pesos)
FO (0-2,000) 6.2 52,200Fl (2,001-4,000) 16.8 117,600F2 (4,001-8,000) 35.2 213,600F3 (8,001-16,000) 27.8 300,000F4 (16,001-32,000) 11.2 691,200F5 (32,001+) 2.7 440,000
Mean/total 9,900 100.0 271,900(weighted average)
Source: Cartagena household survey, 1978.
74
HOUSING STOCK AND NEW CONSTRUCTION 75
type. The cross-tabulation (stock-user matrix) of Table 5-2 shows whattype of housing is occupied by households in the six income ranges. Thus,of the 3,800 households that receive less than 2,000 pesos monthly, 1,800live in some of the 8,000 dwellings that are classified as temporary. As ex-plained in the previous chapter, the income ranges were selected to fit theincome elasticity of demand, so that the average household will be in equi-librium when in a cell on the diagonal: as many households should beabove the average as are below it. Since the distribution is the result ofinteraction between supply and demand, much of the analysis is deferreduntil Chapter 7.
Characteristics of the Housing Stock
As is well known, housing has many components and features thatrange from neighborhood amenities, public services, and access totransport to security, durability, space, and aesthetic design. The valueof a house reflects the combination of all these factors, and with hedonicanalysis the relative contribution of each component to the total can bedetermined. Except for space, better housing characteristics are highlycorrelated with one another, and only minor tradeoffs occur at themargin. That space can contradict this pattern can be shown by compar-ing remote, waterless Boston-Tesca (district 8) with the fashionableLaguito section of Bocagrande (district 1). The three Laguito apartmentsin our sample had an average value of 1.4 million pesos (US$36,000) andan average size of 41 square meters. Six Boston-Tesca houses were worthan average of only 98,000 pesos (US$2,500), but their floor space was 76square meters. The poor had 85 percent more space, but its value wasonly 1,300 pesos per square meter, compared with 34,000 pesos inLaguito-twenty-six times as much.
Three-quarters of the dwellings were made of concrete blocks, and 60percent had asbestos cement sheet roofs. Most of the 18.5 percent ofdwellings made of wood or adobe were considered inferior and werepartly roofed with metal sheets or cardboard. Only 9 percent of dwell-ings were made of the preferred wall materials (bricks or reinforced con-crete), but 29 percent had tile or reinforced concrete roofs, as shown inTable 5-3.
Ninety percent of the households sampled lived in single-family hous-ing, and, of these, 94 percent were in single-story dwellings. Twelvefamilies or 4.1 percent of the total were in low-rise apartments or build-ings with five or fewer stories. A mere four households (1.4 percent) werein high-rise apartments. Thirteen families (4.4 percent) had rooms in out-buildings (piezas accesorias or inquilinatos).

Table 5-2. Distribution of the Occupied Housing Stock(thousands of household-dwelling combinations; percentages of the total in parentheses)
Dwelling type
H4Household income HO HI H2 H3 (inter- H5(pesos per month) (temporary) (substandard) (minimal) (basic) mediate) (excellent) EF Index
F0 (0-2,000) 1.8 1.5 0.4 3.8 174(3.0) (2.5) (0.7) (6.2)
Fl (2,001-4,000) 2.9 3.2 2.0 1.4 0.7 10.3 196(4.8) (5.3) (3.2) (2.3) (1.2) (16.8)
F2 (4,001-8,000) 3.2 3.2 4.4 6.7 3.4 0.6 21.6 178(5.2) (5.3) (7.2) (11.0) (5.6) (0.9) (35.2)
F3 (8,001-16,000) 2.1 4.0 6.1 3.2 1.6 17.0 125(3.5) (6.5) (10.0) (5.2) (2.6) (27.8)
F4 (16,001-32,000) 0.2 0.8 2.2 3.6 6.9 144(0.4) (1.3) (3.6) (5.9) (11.2)
F5 (32,001+) 0.2 0.8 0.2 0.4 1.7 44(0.4) (1.3) (0.4) (0.6) (2.7)
EH 8.0 10.4 11.0 15.9 9.8 6.1 61.2 157(13.0) (17.0) (18.0) (26.0) (16.0) (10.0) (100)
Note: The overall index is computed only for those households that can afford more than a temporary dwelling, Fl to F5. If dwellings above thediagonal are weighted as 150, 175, and 187.5 (not 200, 400, and 800), the overall index falls from 157 to 115. The justification would be diminishingmarginal utility of additional housing sufficient to match the 50, 25, 12.5 sequence of values to the left of the diagonal.
Source: Cartagena household survey, 1978.

HOUSING STOCK AND NEW CONSTRUCTION 77
Table 5-3. Wall and Roofing Materials Used in Dwellings(percent)
Wall materials Roofing materials
Concrete blocks 74.3 Asbestos cement sheets 60.4Wood 16.8 Clay tiles 22.2Reinforced concrete 4.5 Reinforced concrete 6.5Bricks 2.4 Metal sheets 6.5Adobe 1.7 Concrete blocks 3.4Other 0.3 Wood or cardboard 1.0
Total 100.0 Total 100.0
Source: Cartagena household survey, 1978.
Among the characteristics of Cartagena housing in 1973, reported inChapter 3, was the number of rooms (Table 3-3). About 11.7 percent hadone room, 26.9 percent had two rooms, 25.1 percent had three, 25.4 per-cent had four or five, and 11 percent had more. Table 3-2 showed thataccording to the census only 18.2 percent lacked electricity, and 25.2 per-cent lacked piped water, but 71.4 percent had no connection with asewerage system. The northern parts of the city, Torices and LeMaitre,had had sewerage pipes installed since the 1950s, but the system hadnever been completed with pumping stations and the like, as previouslydescribed. If such dwellings had access to piped water, they could make aseptic tank function.
Further details on the distribution of plumbing facilities appear inTable 5-4. Some of the inhabitants in dwellings that had piped watercombined with latrines may have disconnected their toilets because they
Table 5-4. Type of Plumbing Facilities in Housing, 1973 and 1978
PercentType ofhousing Type of plumbing facility 1973 1978
H3-5 Piped water and sewerage connection 27.9 34.8H2-4 Septic tanks 32.9 35.3H1-2 Latrines and piped water 12.9 6.1HO-1 Latrines but no piped water 7.3 10.2HO-1 No sanitary facilities, but piped water 5.9 1.0Ho No sanitary facilities and no water 13.1 12.6
Total 100.0 100.0
Source: DANE and Cartagena household survey, 1978.

78 HOUSING STOCK AND NEW CONSTRUCTION
could be flushed only a few hours each day, that is, when the city al-lowed water to flow that way. Dwellings with water but no sanitaryfacilities are often in areas so close to sea level that latrines cannot bedug. Some of the owners may have paid extra to get the water connec-tion to become water retailers to the neighborhood, as previouslydescribed. On the average their extra income seems to have been around3,000 pesos (US$77) monthly in 1978.
Six Types of Housing
The Cartagena housing stock can be divided into six categories, basedon plumbing, number of rooms, materials, and a few other features: tem-porary, substandard, minimal, basic, intermediate, and luxury. The num-ber of rooms overlaps more categories (as many as three), than do othercharacteristics, since space was the main characteristic that some house-holds traded off against other improvements. Plumbing facilities are usu-ally the best indicator of value, but in Cartagena their presence or absencewas mainly due to the wavering priorities of government. For the con-struction of new housing, other than those of ICT and other official de-velopments, more prosperous families would bid for and acquire sites inneighborhoods equipped with piped water and sewerage systems. Poorerfamilies would acquire unequipped lots, and the poorest would take sitesthat were so remote or so close to sea level that they were unlikely to beserviced soon. The importance of public utilities is shown by the first ques-tion that potential buyers asked in Cartagena when they saw a "For sale"sign outside a house. It was not "How many rooms does it have?," but"During what hours does it get water?" In this climate the late-afternoonshower is a must and an unflushed toilet a calamity. Once a dwelling hadaccess to piped water, it would be upgraded rapidly, as shown in the nextchapter. With a slight lag, therefore, better plumbing and higher valuewill go together.
Materials are another good indicator of value. Temporary (HO) hous-ing may be temporary in name only and have earth floors, cardboardroofs, and walls made of scrap lumber. Some lack windows. Fences aremade of bamboo. Substandard (HI) housing will not only be somewhatlarger, but have unplastered concrete block walls and metal or asbestoscement corrugated roofs.
Minimal (H2) housing will never have metal roofs or earth floors.Foundations will allow for expansion without loss of stability, and thefront wall will often be plastered, as in ICT houses of this category in LasGaviotas and Nuevo Bosque. Basic (H3) housing resembles low-costhousing projects throughout the world (the least that most governments
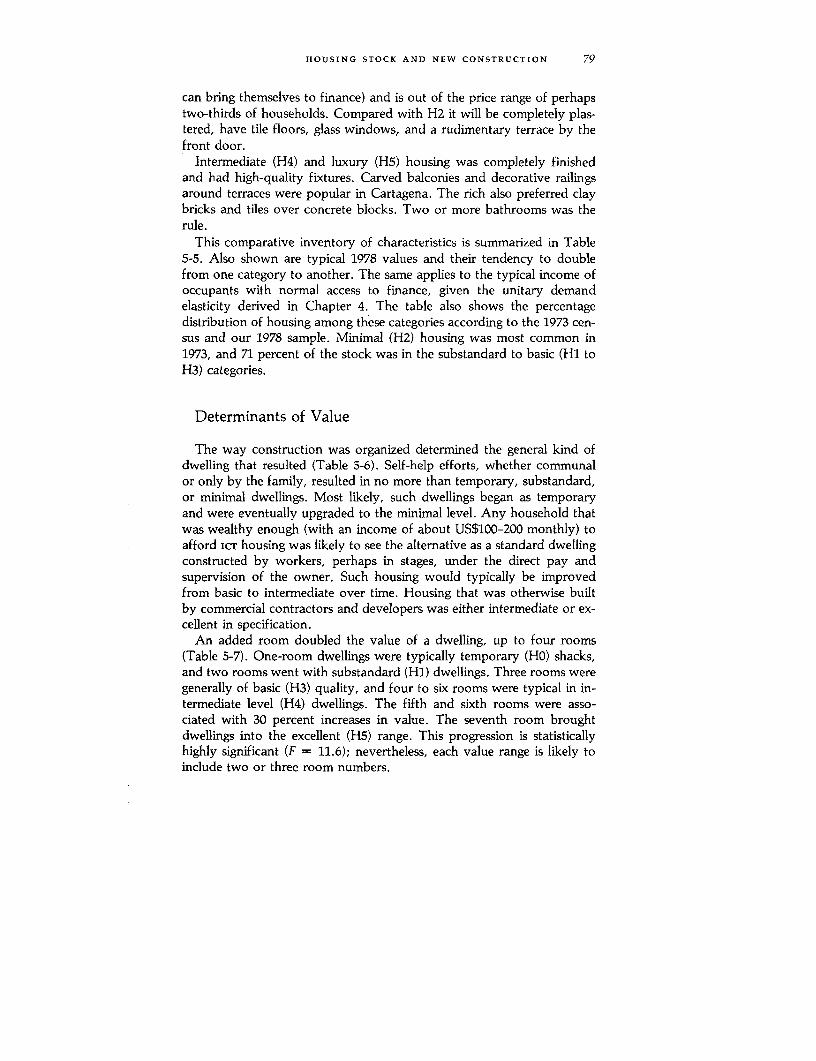
HOUSING STOCK AND NEW CONSTRUCTION 79
can bring themselves to finance) and is out of the price range of perhapstwo-thirds of households. Compared with H2 it will be completely plas-tered, have tile floors, glass windows, and a rudimentary terrace by thefront door.
Intermediate (H4) and luxury (H5) housing was completely finishedand had high-quality fixtures. Carved balconies and decorative railingsaround terraces were popular in Cartagena. The rich also preferred claybricks and tiles over concrete blocks. Two or more bathrooms was therule.
This comparative inventory of characteristics is summarized in Table5-5. Also shown are typical 1978 values and their tendency to doublefrom one category to another. The same applies to the typical income ofoccupants with normal access to finance, given the unitary demandelasticity derived in Chapter 4. The table also shows the percentagedistribution of housing among these categories according to the 1973 cen-sus and our 1978 sample. Minimal (H2) housing was most common in1973, and 71 percent of the stock was in the substandard to basic (Hi toH3) categories.
Determinants of Value
The way construction was organized determined the general kind ofdwelling that resulted (Table 5-6). Self-help efforts, whether communalor only by the family, resulted in no more than temporary, substandard,or minimal dwellings. Most likely, such dwellings began as temporaryand were eventually upgraded to the minimal level. Any household thatwas wealthy enough (with an income of about US$100-200 monthly) toafford icT housing was likely to see the altemative as a standard dwellingconstructed by workers, perhaps in stages, under the direct pay andsupervision of the owner. Such housing would typically be improvedfrom basic to intermediate over time. Housing that was otherwise builtby commercial contractors and developers was either intermediate or ex-cellent in specification.
An added room doubled the value of a dwelling, up to four rooms(Table 5-7). One-room dwellings were typically temporary (HO) shacks,and two rooms went with substandard (HI) dwellings. Three rooms weregenerally of basic (H3) quality, and four to six rooms were typical in in-termediate level (H4) dwellings. The fifth and sixth rooms were asso-ciated with 30 percent increases in value. The seventh room broughtdwellings into the excellent (H5) range. This progression is statisticallyhighly significant (F = 11.6); nevertheless, each value range is likely toinclude two or three room numbers.
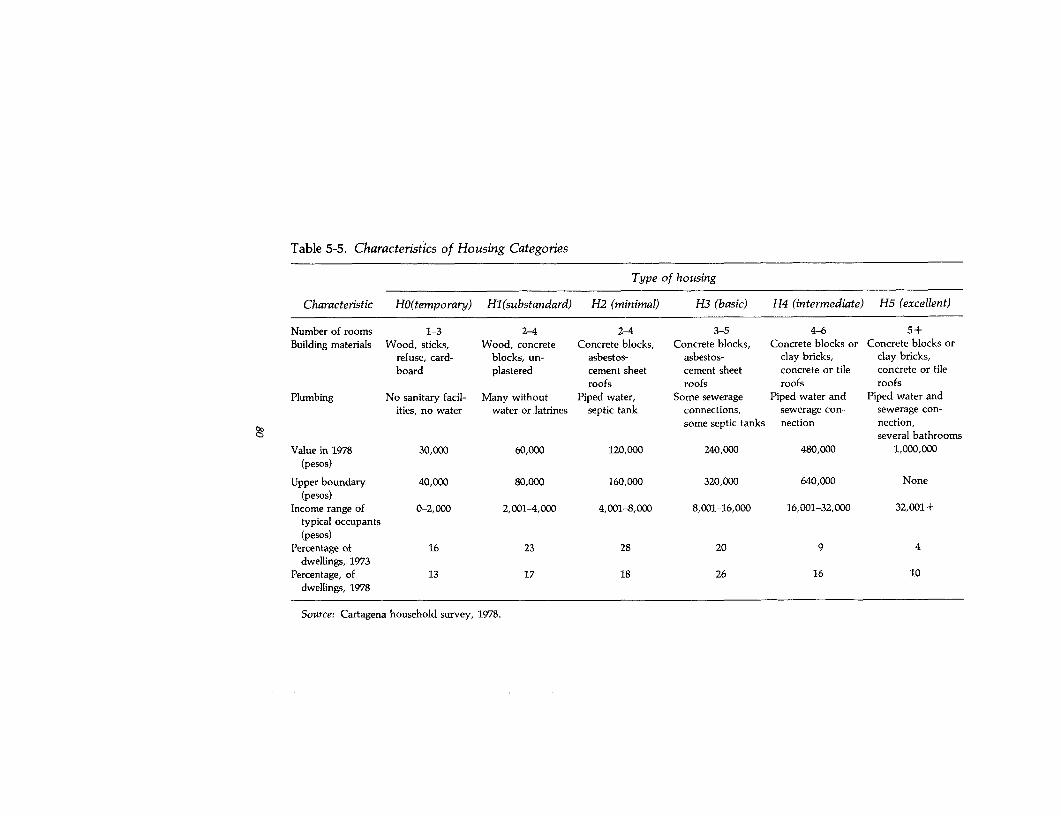
Table 5-5. Characteristics of Housing Categories
Type of housing
Characteristic HO(temporary) Hl(substandard) H2 (minimal) H3 (basic) H4 (intermediate) H5 (excellent)
Number of rooms 1-3 2-4 2-4 3-5 4-6 5+Building materials Wood, sticks, Wood, concrete Concrete blocks, Concrete blocks, Concrete blocks or Concrete blocks or
refuse, card- blocks, un- asbestos- asbestos- clay bricks, clay bricks,board plastered cement sheet cement sheet concrete or tile concrete or tile
roofs roofs roofs roofsPlumbing No sanitary facil- Many without Piped water, Some sewerage Piped water and Piped water and
ities, no water water or latrines septic tank connections, sewerage con- sewerage con-some septic tanks nection nection,
several bathroomsValue in 1978 30,000 60,000 120,000 240,000 480,000 1,000,000
(pesos)
Upper boundary 40,000 80,000 160,000 320,000 640,000 None(pesos)
Income range of 0-2,000 2,001-4,000 4,001-8,000 8,001-16,000 16,001-32,000 32,001+typical occupants(pesos)
Percentage of 16 23 28 20 9 4dwellings, 1973
Percentage, of 13 17 18 26 16 10dwellings, 1978
Source: Cartagena household survey, 1978.

HOUSING STOCK AND NEW CONSTRUCTION 87
Table 5-6. Value of Owner-Occupied Dwellings, by Type of Builder(N 220)
ValueType of builder (pesos) Percent Type
Mutual aid or communal effort 69,500 1.9 HO-1Self-help by the family 81,900 14.5 H1-2Workers paid directly by the family head 303,000 22.7 H3-4ICT 270,000 17.9 H3-4Family chose contractor's plan 385,000 3.4 H4
House acquired from previous occupants 642,000 29.0 H4-5Architect-designed, contractor-built 710,000 5.3 H4-5Private developer on speculation 927,000 4.8 H5Other 100,000 0.5 -
Total 417,000 100.0 HO-H5
- Few observations.Source: Cartagena household survey, 1978.
Lack of piped water and sanitary facilities consisting of a latrine ornothing clearly put a dwelling in one of the lowest value categories, HOor Hi (Table 5-8). The basic (H3) or intermediate (H4) categoriesgenerally had a sewer-connected toilet or a septic tank and a rudimentaryor complete bathroom with piped water. Multiple bathrooms and toiletswould usually be found in dwellings worth more than 1 million pesos(US$25,600).
Table 5-7. Number of Rooms and Value of Owner-Occupied Housing(N = 220)
Average value Percentage Change in PercentageNumber of rooms (pesos) of total value change
1 36,000 2.7 - -
2 73,000 5.9 37,000 1033 182,000 27.7 109,000 1494 364,000 29.1 182,000 1005 473,000 14.5 109,000 306 616,000 11.4 143,000 306+ 1,350,000 8.6 - -
Total/average 417,000 100.0 - 95
- Not applicable.Source: Cartagena household survey, 1978.
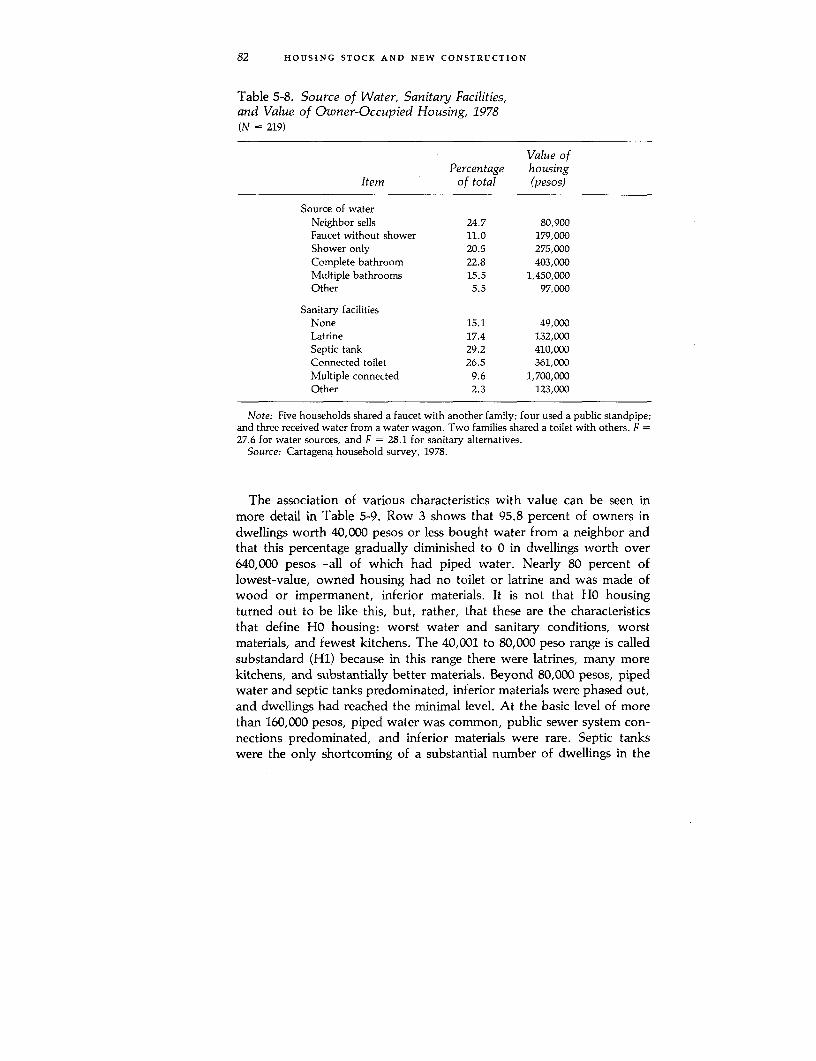
82 HOUSING STOCK AND NEW CONSTRUCTION
Table 5-8. Source of Water, Sanitary Facilities,and Value of Owner-Occupied Housing, 1978(N = 219)
Value ofPercentage housing
Item of total (pesos)
Source of waterNeighbor sells 24.7 80,900Faucet without shower 11.0 179,000Shower only 20.5 275,000Complete bathroom 22.8 403,000Multiple bathrooms 15.5 1,450,000Other 5.5 97,000
Sanitary facilitiesNone 15.1 49,000Latrine 17.4 132,000Septic tank 29.2 410,000Connected toilet 26.5 361,000Multiple connected 9.6 1,700,000Other 2.3 123,000
Note: Five households shared a faucet with another family; four used a public standpipe;and three received water from a water wagon. Two families shared a toilet with others. F27.6 for water sources, and F = 28.1 for sanitary alternatives.
Source: Cartagena household survey, 1978.
The association of various characteristics with value can be seen inmore detail in Table 5-9. Row 3 shows that 95.8 percent of owners indwellings worth 40,000 pesos or less bought water from a neighbor andthat this percentage gradually diminished to 0 in dwellings worth over640,000 pesos-all of which had piped water. Nearly 80 percent oflowest-value, owned housing had no toilet or latrine and was made ofwood or impermanent, inferior materials. It is not that HO housingturned out to be like this, but, rather, that these are the characteristicsthat define HO housing: worst water and sanitary conditions, worstmaterials, and fewest kitchens. The 40,001 to 80,000 peso range is calledsubstandard (HI) because in this range there were latrines, many morekitchens, and substantially better materials. Beyond 80,000 pesos, pipedwater and septic tanks predominated, inferior materials were phased out,and dwellings had reached the minimal level. At the basic level of morethan 160,000 pesos, piped water was common, public sewer system con-nections predominated, and inferior materials were rare. Septic tankswere the only shortcoming of a substantial number of dwellings in the
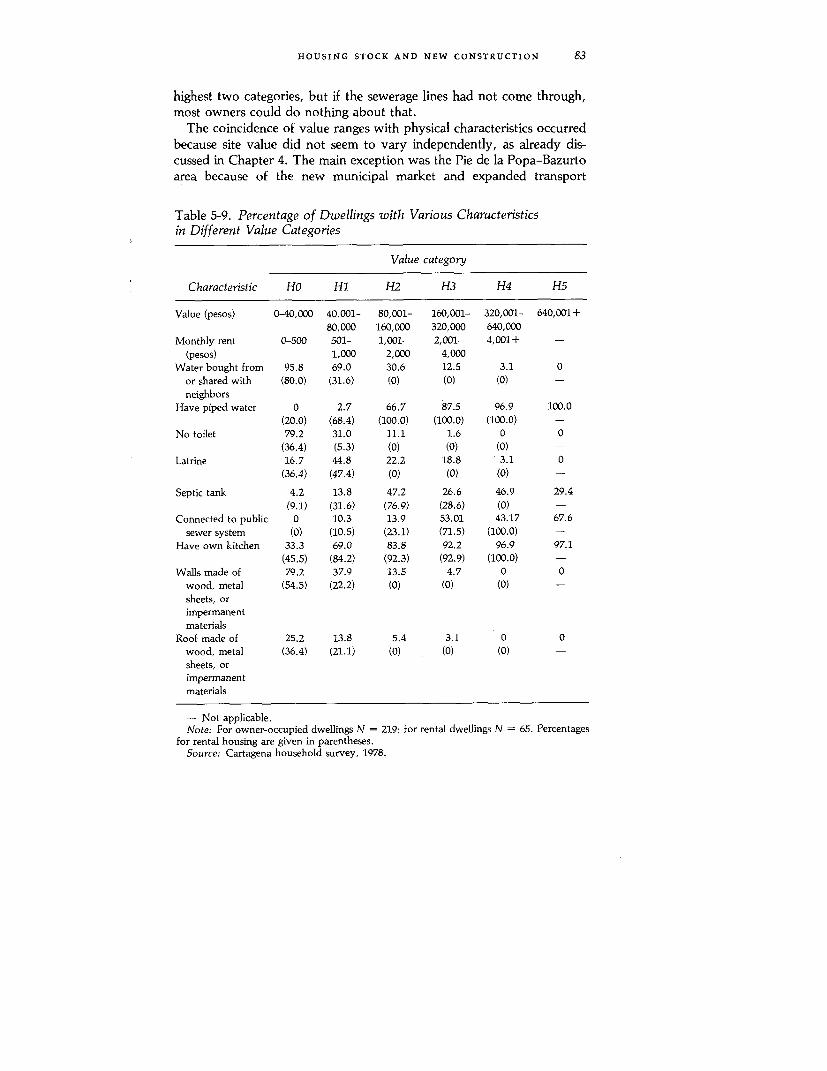
HOUSING STOCK AND NEW CONSTRUCTION 83
highest two categories, but if the sewerage lines had not come through,most owners could do nothing about that.
The coincidence of value ranges with physical characteristics occurredbecause site value did not seem to vary independently, as already dis-cussed in Chapter 4. The main exception was the Pie de la Popa-Bazurtoarea because of the new municipal market and expanded transport
Table 5-9. Percentage of Dwellings with Various Characteristicsin Different Value Categories
Value category
Characteristic Ho HI H2 H3 H4 H5
Value (pesos) 0-40,000 40,001- 80,001- 160,001- 320,001- 640,001+80,000 160,000 320,000 640,000
Monthly rent 0-500 501- 1,001- 2,001- 4,001+ -
(pesos) 1,000 2,000 4,000Water bought from 95.8 69.0 30.6 12.5 3.1 0
or shared with (80.0) (31.6) (0) (0) (0) -
neighborsHave piped water 0 2.7 66.7 87.5 96.9 100.0
(20.0) (68.4) (100.0) (100.0) (100.0) -No toilet 79.2 31.0 11.1 1.6 0 0
(36.4) (5.3) (0) (0) (0) -Latrine 16.7 44.8 22.2 18.8 3.1 0
(36.4) (47.4) (0) (0) (0) -
Septic tank 4.2 13.8 47.2 26.6 46.9 29.4(9.1) (31.6) (76.9) (28.6) (0) -
Connected to public 0 10.3 13.9 53.01 43.17 67.6sewer system (0) (10.5) (23.1) (71.5) (100.0) -
Have own kitchen 33.3 69.0 83.8 92.2 96.9 97.1(45.5) (84.2) (92.3) (92.9) (100.0) -
Walls made of 79.2 37.9 13.5 4.7 0 0wood, metal (54.5) (22.2) (0) (0) (0) -
sheets, orimpermanentmaterials
Roof made of 25.2 13.8 5.4 3.1 0 0wood, metal (36.4) (21.1) (0) (0) (0) -
sheets, orimpermanentmaterials
- Not applicable.Note: For owner-occupied dwellings N = 219; for rental dwellings N = 65. Percentages
for rental housing are given in parentheses.Source: Cartagena household survey, 1978.

84 HOUSING STOCK AND NEW CONSTRUCTION
routes. About 1,000 households lived in this section, a part of the Mangadistrict, which in turn was part of the Coastal Zone. It represented lessthan 2 percent of the Cartagena population.
Amount and Value of Space
The typical dwelling in Cartagena had 100 square meters of space di-vided into four rooms plus kitchen and washroom. As can be seen inTables 5-10 and 5-11, three-quarters of smaller dwellings had at least 50square meters of space and were divided into three rooms. Around 11percent of the stock consisted of one- and two-room dwellings with lessthan 50 square meters. At the other end of the scale, less than a quarter ofthe housing stock had a floor space of more than 200 square meters ormore than five rooms.
As the tables show, these distributions varied with the type of tenure.Owner-occupied houses without mortgages were the largest in size, with27 percent of these having areas of 200 square meters or more, and 25percent having six or more rooms. Nearly half of mortgaged dwellingswere in the 50 to 99 square-meter range, reflecting primarily the sort ofstructure that ICT was selling. By the time the mortgage would be paidoff, many of these dwellings would be considerably larger.
Rental units were typically somewhat larger than owner-occupiedhousing that was new enough to be still under amortization. Only 30.7percent of rental dwellings were less than 100 square meters, compared
Table 5-10. Amount of Floor Space, by Type of Tenure(percent)
Owner-occupied
WithFloor space mortgage No mortgage Rented Other All
(square meters) (N = 52) (N = 150) (N = 62) (N = 20) (N = 284)
1-49 13.5 10.7 11.3 15.0 11.650-99 46.2 34.7 19.4 40.0 33.8
100-149 11.5 16.0 27.4 10.0 17.3150-199 15.4 11.3 17.7 10.0 13.4200-299 11.5 14.0 16.1 10.0 13.7300+ 1.9 13.3 8.1 15.0 10.2
Total 100.0 100.0 100.0 100.0 100.0
Source: Cartagena household survey, 1978.

HOUSING STOCK AND NEW CONSTRUCTION 85
Table 5-11. Number of Rooms, by Type of Tenure(percent)
Withmortgage No mortgage Rented Other All
Number of rooms (N = 53) (N = 154) (N = 65) (N = 21) (N = 293)
1 0 3.9 1.5 4.8 2.72 9.4 4.5 16.9 9.5 8.53 32.1 24.7 26.2 33.3 27.04 32.1 27.9 30.8 33.3 29.75 17.0 13.6 9.2 14.3 13.36 5.7 14.3 7.7 4.8 10.66+ 3.8 11.0 7.7 0 8.2
Total 100.0 100.0 100.0 100.0 100.0
Source: Cartagena household survey, 1978.
with 48.6 percent for all others. Only 8.1 percent reached 300 squaremeters, however, compared with 15.3 percent for the owner-occupieddwellings without a mortgage. Only 24.6 percent of rental dwellings hadfive or more rooms compared with 34.2 percent for all others.
Not only did the amount of space matter, but also its quality or valueper square meter. Type of plumbing, location, and a large number ofother factors helped to determine this value. The average value persquare meter of owner-occupied housing was 3,491 pesos (standard error418 pesos). New ICT housing sold for about 3,900 pesos per square meterif it was minimal or basic and for 6,000 if it was intermediate. Value ofthe 1978 housing stock per square meter, by income group, was
Monthly income (pesos) Value per square meter (pesos)0- 2,000 986
2,001- 4,000 1,4624,001- 8,000 2,0898,001-16,000 3,573
16,001-32,000 9,65332,000+ 17,333
Hedonic Analysis
A hedonic price index was estimated to determine how much indoorpiped water and other elements contributed to value of owner-occupiedhousing (Table 5-12).1 The thirteen explanatory variables were often cor-related with one another but most of all with water. More than any othervariable, water was correlated with floor space, number of rooms, a
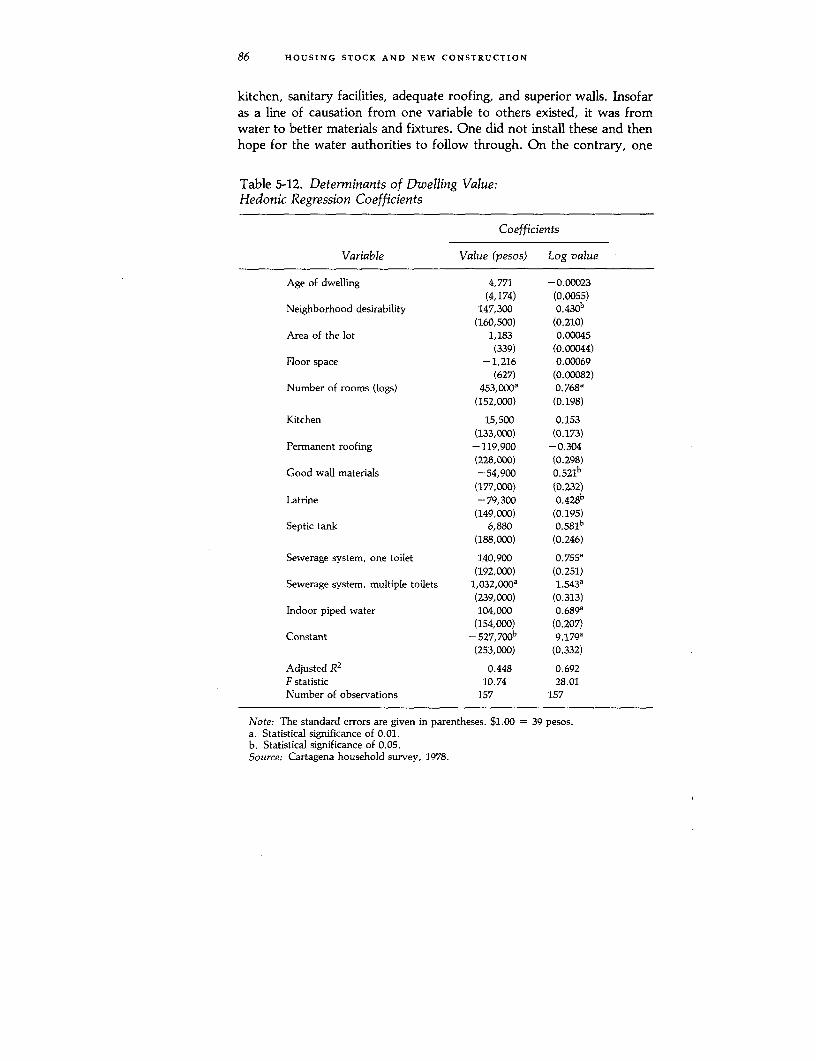
86 HOUSING STOCK AND NEW CONSTRUCTION
kitchen, sanitary facilities, adequate roofing, and superior walls. Insofaras a line of causation from one variable to others existed, it was fromwater to better materials and fixtures. One did not install these and thenhope for the water authorities to follow through. On the contrary, one
Table 5-12. Determinants of Dwelling Value:Hedonic Regression Coefficients
Coefficients
Variable Value (pesos) Log value
Age of dwelling 4,771 -0.00023(4,174) (0.0055)
Neighborhood desirability 147,300 0.430b(160,500) (0.210)
Area of the lot 1,183 0.00045(339) (0.00044)
Floor space -1,216 0.00069(627) (0.00082)
Number of rooms (logs) 453,000a 0.768a(152,000) (0.198)
Kitchen 15,500 0.153(133,000) (0.173)
Permanent roofing -119,900 -0.304(228,000) (0.298)
Good wall materials -54,900 0.521b(177,000) (0.232)
Latrine -79,300 0.428b(149,000) (0.195)
Septic tank 6,880 0.581b
(188,000) (0.246)
Sewerage system, one toilet 140,900 0.755a(192,000) (0.251)
Sewerage system, multiple toilets 1,032,000a 1.543a
(239,000) (0.313)Indoor piped water 104,000 0.689a
(154,000) (0.207)Constant - 52 7,7 0 0 b 9.179a
(253,000) (0.332)
Adjusted R2 0.448 0.692
F statistic 10.74 28.01Number of observations 157 157
Note: The standard errors are given in parentheses. $1.00 = 39 pesos.a. Statistical significance of 0.01.b. Statistical significance of 0.05.Source: Cartagena household survey, 1978.

HOUSING STOCK AND NEW CONSTRUCTION 87
might have installed one's own well and then discouraged the coming ofpublic utilities and extra charges.
The coefficient for indoor piped water in column 1 of the table suggeststhat it always added 104,000 pesos to the value of a house, but this figurelacks statistical significance. The coefficient based on a logarithmic re-gression in column 2 becomes highly significant, however, and impliesthat water nearly doubled the value of a dwelling, say, from 80,000 to159,000 pesos or from 160,000 to 319,000 pesos. Alternatively, it seemsplausible that a million-peso dwelling would lose nearly half its value ifthe occupants had to carry water in lard cans.
If a 160,000-peso (US$4,100) dwelling switched from a latrine to a sep-tic tank, its value rose by 16.5 percent to 186,400 pesos. Connection to apublic sewerage system and installation of one toilet would raise thevalue by a further 19.0 percent to 220,000 pesos. But if the neighborhoodwas undesirable (that is, settled by families with lower incomes), thenvalue would be 35 percent less. Inferior wall materials would cost adwelling 41 percent of its value. Important as they are, these factors didnot matter as much as piped water. The stock-user matrixes of AppendixC present more detail on housing characteristics and their associationwith value and the income of occupants.
Housing Eradication
In the early 1960s social housing had to meet rather extravagant stan-dards despite economic realities. The typical Blas de Lezo house hadthree large rooms besides the kitchen and bathroom, making a total floorspace of 120 square meters. A cost of 40,000 pesos in 1963 made themequivalent to an intermediate (H4) 360,000-peso (US$9,200) house in1978.
In those years the way to convert and to upgrade a slum was toeradicate all the huts and to start over. The case of Chambacu has beenmentioned several times in this study. Over several decades 4,000 squat-ter households had made their own land during the dry season by fillingin the lagoon between the Fortress of San Felipe and the business districtof La Matuna. In 1965 the first squatters were removed to create spacefor the broad Avenida Don Pedro de Heredia. They were paid a mere 500pesos (worth 3,600 in 1978, or US$92) for their lost improvements. Noequivalent housing could be obtained for less than twenty times thatcompensation.
As the idea of removing the entire eyesore caught on, opposition be-came vehement, as might be expected in a democracy. Compensation for

88 HOUSING STOCK AND NEW CONSTRUCTION
squatters was raised to the value of a serviced site at an alternative loca-tion plus a 1.0 percent, twenty-year ICT loan with no down payment for aminimal house. Owners were given 42-square-meter houses with bath-rooms in Chiquinquira or La Republica de Venezuela or an indemnity of20,000 pesos (1978 US$2,200). A survey of 1,509 households remainingin Chambacui was made to determine who needed what and who couldafford what. But incomes were unpredictable, and some households losttheir new dwellings when they failed to keep up payments.
The reluctance to move was great; but after several false starts, theeradication process went smoothly during 1970-73. Band music accom-panied the demolition. Holdouts were allowed to stay in huts here andthere, but trucks moved in and dumped vast amounts of fill to be shovedaround by bulldozers. The holdouts therefore found themselves in dis-agreeable, possibly unsafe holes. The Chambacu eradication, althoughnonviolent, was nevertheless so traumatic and costly that it was notrepeated. On the contrary, ICT is in charge of redeveloping the SoutheastZone without extensive demolitions. As fear of being evicted fadedthroughout the city, poor access to water remained the principal inhibi-tion to self-help improvement. According to present regulations, evictionof squatters is difficult after a month of occupancy. During 1978-80more squatters appeared on the back of La Popa, in the Lomas (NuevoBosque) Zone, in the Outskirts at La Temera and at Policarpa Zalabrietaon the road to Pasacaballos, behind the ICT development of El Socorro,in the Southeast Zone, and at the former country club where they wereevicted.
From time to time, eviction and demolition nevertheless remain neces-sary as space is reallocated from one use to another in the public interest.As one of his last official acts, on July 24, 1978, President LopezMichelsen laid the cornerstone for the Internafional Convention Centeron the site of the former Public Market of Getsemani. Everything hadbeen cleared except for La Carbonera, eighteen squatter shacks of formercharcoal sellers, built partly on the quays of Playa del Arsenal and partlyon posts in the bay. These families refused to move.
In February 1978, the Department of Municipal Public Works in-formed the families that their shacks would be demolished after June 30.In July all of them were still there. They were told that on Sunday morn-ing, August 13, bulldozers and troops would clear them out.
When we arrived on the site shortly before 8:00 AM that day, the pro-cess of clearing was under way. Some fifty troops with clubs and whitearm bands loitered in the shade of buildings on one side of the street, anda bulldozer was knocking down a shack on the other, raising a cloud ofdust. The heat was like midday.

HOUSING STOCK AND NEW CONSTRUCTION 89
Down the street men and boys were dismantling metal and asbestos ce-ment sheets from roofs. Supporting lumber, aluminum pans, and otherhousehold goods were being loaded on small trucks. Occasionally atrooper crossed the street and exchanged a few words with some head ofa family. Everything went slowly in the heat but without trouble. Themost pitiful, windowless shacks of some old couples were passed by.Dogs slept in the dust, chickens scratched for food in clumps of weeds,and children played as if nothing were happening. Perhaps it was likethat at Chambacu.
Housing Construction by ICT
The most reliable figures on new construction costs come from ICT,
although these include the contractor's profits. Data from DANE (the na-tional census department) and CAMACOL (the national chamber of theconstruction industry) are sometimes contradictory. A reconciled serieson costs is published by a National Center for Construction Studies(CENAC). Some of the data from all these sources are presented here.
Minimal (H2), basic (H3), and intermediate (H4) icT houses werewithin the ranges of values just given for those categories (Table 4-13).Unfinished two-room minimal houses were sold for around 125,000pesos (US$3,200). Some had an extra room or extra land that raised theirvalue by 20 percent. Basic units were sold for about 200,000 pesos(US$5,100), and intermediate ones for 500,000 (US$12,800). The luxuryunits planned for Chambacu were to be sold for twice that, adjusted forinflation. But these sales prices included ICT markups that ranged from 3to 50 percent, which the buyer was willing to pay to get the financing anda variety of locational advantages. Construction cost and value are notthe same thing.
For building a minimal house, contractors in 1977-78 charged ICT
around 2,000 pesos (US$51) per square meter. When construction re-sumed in 1980 after a two-year financial crisis caused by the decapitaliza-tion of ICT because of inflation, costs had nearly doubled. A basic housecost 2,500 pesos (US$65) in 1978, and an intermediate one 3,200 pesos(US$83) per square meter. Floor space increased from 34 to 57 to 83square meters for the three types. Lot sizes increased from 70 to 150square meters from minimal to intermediate, and their square-meter costwent from 60 to 95 pesos. The site improvement cost of 380 to 500 pesosper square meter had to be added, but that cost depended more on thetype of terrain than on the type of structure to be built. Altogether the lotcost ranged from 35,000 to 70,000 pesos in 1977-78. For minimal houses
90 HOUSING STOCK AND NEW CONSTRUCTION
this amounted to around 40 percent of the total cost, for the basic units30 percent, and for the intermediate units 20 percent.
The layout of minimal ICT houses can be shown with some cases fromLas Gaviotas and El Bosque. In the fourth stage of Las Gaviotas, 20240-square-meter units with three rooms were built on 81-square-meterlots. Lots were 9 meters wide, and houses had three equal rooms side byside along the front, with one set back a little to allow for a terrace.Behind the middle room were the kitchen and bathroom, back to back.Behind the other two rooms, occupants could build expansions.
Since buyers complained about back-to-back kitchens and toilets,given the irregularity of water and possibility of a stench, some later ICT
houses such as Nuevo Bosque type A avoided this arrangement. A5.7-square-meter room was on one side of the lot, and an 11-square-meter room was on the other, but set back substantially. The bathroomwas behind the forward room, and the kitchen was behind the other. Ad-ditions could be made behind the bathroom or in front of the large set-back room. Details of this unit are given in Table 4-14.
Since water is expected to flow regularly everywhere when worn-outpipes have been replaced and connected to the new reservoirs, back-to-back kitchen and toilets should cease to be objectionable. For the LosCalamares development, ICT planned minimal houses that consisted ofsuch a combination on the side of a single 11.7-square-meter room. Thetotal was a 20-square-meter dwelling that could have one 7.7-square-meter room added in back and another in front. Without the ICT markup,cost of the initial units would have been around 78,000 (1978) pesos(US$2,000), including the lot (72-square-meters at 32,000 pesos). Onlythe poorest quarter of households, those receiving less than 4,000 pesosmonthly, would have been unable to afford this unit. By the time groundwas finally broken for these units in November 1980, costs had doubled,but ICT planned to quadruple prices as an inflation hedge.
What large families with varied cultural backgrounds will accept andexpand cannot, however, be easily foreseen. For example, communalwashing and sanitary facilities in the middle of a cluster of half a dozensmall houses was unacceptable in Cartagena. Houses could be designedto allow friendly interaction with neighbors on the street side, butprivacy was demanded for backyard patios, no matter how small. ICT of-ficials in Cartagena felt that their effectiveness rose substantially after1974 when they were given more control over housing design.
Housing Construction by Other Developers
Apart from ICT, which controlled approximately one-quarter of thelicensed residential construction, both licensed and unlicensed devel-
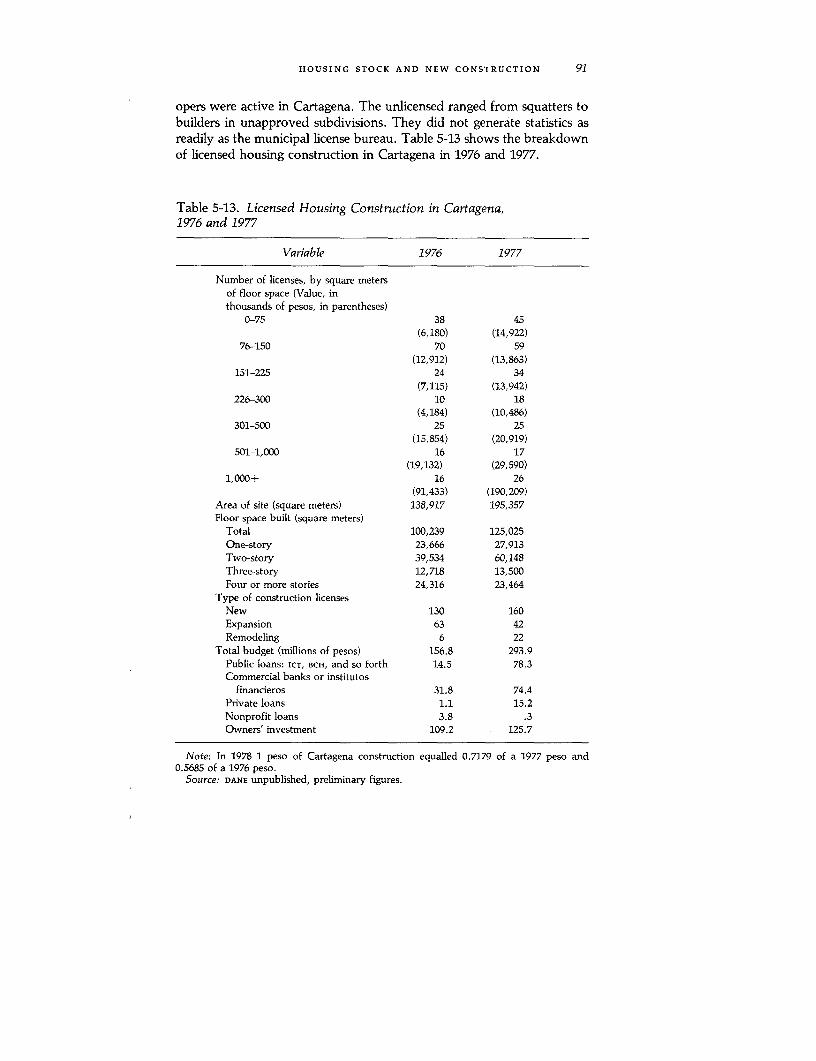
HOUSING STOCK AND NEW CONSTRUCTION 91
opers were active in Cartagena. The unlicensed ranged from squatters tobuilders in unapproved subdivisions. They did not generate statistics asreadily as the municipal license bureau. Table 5-13 shows the breakdownof licensed housing construction in Cartagena in 1976 and 1977.
Table 5-13. Licensed Housing Construction in Cartagena,1976 and 1977
Variable 1976 1977
Number of licenses, by square metersof floor space (Value, inthousands of pesos, in parentheses)
0-75 38 45(6,180) (14,922)
76-150 70 59(12,912) (13,863)
151-225 24 34(7,115) (13,942)
226-300 10 18(4,184) (10,486)
301-500 25 25(15,854) (20,919)
501-1,000 16 17(19,132) (29,590)
1,000+ 16 26(91,433) (190,209)
Area of site (square meters) 138,917 195,357Floor space built (square meters)
Total 100,239 125,025One-story 23,666 27,913Two-story 39,534 60,148Three-story 12,718 13,500Four or more stories 24,316 23,464
Type of construction licensesNew 130 160Expansion 63 42Remodeling 6 22
Total budget (millions of pesos) 156.8 293.9Public loans: ICT, BCH, and so forth 14.5 78.3Commercial banks or institutos
financieros 31.8 74.4Private loans 1.1 15.2Nonprofit loans 3.8 .3Owners' investment 109.2 125.7
Note: In 1978 1 peso of Cartagena construction equalled 0.7179 of a 1977 peso and0.5685 of a 1976 peso.
Source: DANE unpublished, preliminary figures.
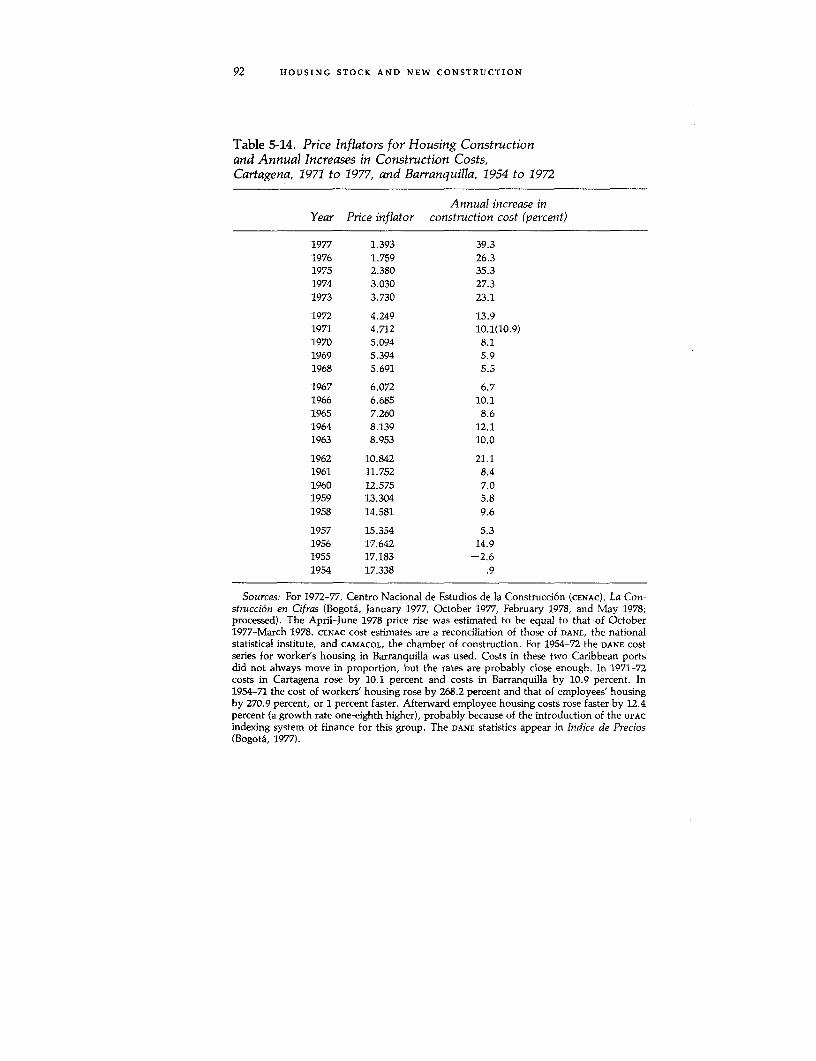
92 HOUSING STOCK AND NEW CONSTRUCTION
Table 5-14. Price Inflators for Housing Constructionand Annual Increases in Construction Costs,Cartagena, 1971 to 1977, and Barranquilla, 1954 to 1972
Annual increase inYear Price inflator construction cost (percent)
1977 1.393 39.31976 1.759 26.31975 2.380 35.31974 3.030 27.31973 3.730 23.1
1972 4.249 13.91971 4.712 10.1(10.9)1970 5.094 8.11969 5.394 5.91968 5.691 5.5
1967 6.072 6.71966 6.685 10.11965 7.260 8.61964 8.139 12.11963 8.953 10.0
1962 10.842 21.11961 11.752 8.41960 12.575 7.01959 13.304 5.81958 14.581 9.6
1957 15.354 5.31956 17.642 14.91955 17.183 -2.61954 17.338 .9
Sources: For 1972-77, Centro Nacional de Estudios de la Construcci6n (CENAC), La Con-strucci6n en Cifras (Bogoti, January 1977, October 1977, February 1978, and May 1978;processed). The April-June 1978 price rise was estimated to be equal to that of October1977-March 1978. CENAC cost estimates are a reconciliation of those of DANE, the nationalstatistical institute, and CAMACOL, the chamber of construction. For 1954-72 the DANE costseries for worker's housing in Barranquilla was used. Costs in these two Caribbean portsdid not always move in proportion, but the rates are probably close enough. In 1971-72costs in Cartagena rose by 10.1 percent and costs in Barranquilla by 10.9 percent. In1954-71 the cost of workers' housing rose by 268.2 percent and that of employees' housingby 270.9 percent, or 1 percent faster. Afterward employee housing costs rose faster by 12.4percent (a growth rate one-eighth higher), probably because of the introduction of the uPAc
indexing system of finance for this group. The DANE statistics appear in Indice de Precios(Bogota, 1977).

HOUSING STOCK AND NEW CONSTRUCTION 93
Owners were the most important source of investment funds and pro-vided 69.6 percent in 1976 and 42.8 percent in 1977. Two-story houseswere the most important category (accounting for 48 percent of the totalfloor space). Apartments with four and more stories (18.8 percent) werealmost as important as single-story houses (22.3 percent). In both 1976and 1977 the most licenses were given for dwellings between 76 and 150square meters, but more was spent on apartment buildings, mostly inBocagrande, with over 1,000 square meters allocated among separateunits.
Apart from the large number of small contractors and individual la-borers working on their own account, all this construction was carriedout by seventy-three construction firms that in 1976 employed an aver-age of thirty-three workers. In the leaner years of 1975, 1977, and 1978about half the workers were laid off.
Housing construction costs rose after 1976, and the average compoundcost increase for 1973-78 was 30.1 percent annually, as may be seen inTable 5-14. During the preceding five years, the average increase wasonly 8.8 percent. Throughout this period construction prices laggedbehind costs in other economic sectors.
Inflation and Relative Price Changes
During the 1970s construction costs rose at a much lower rate than thegeneral rate of inflation-a pattern that had begun in the 1950s. With1954-55 as the base, by December 1969 the national housing cost indexfor workers was 394.0 compared with a general level of 437.1. By June1977 the workers' housing cost index was 1,188, and the general workers'cost of living index was 1,843. On the Atlantic coast the difference waseven more pronounced. Here the general index had reached 1,886 forBarranquilla, or double that of housing with 945. The pattern will not beanalyzed in detail here. An important factor is that construction was acompetitive labor-intensive activity, which used local materials thatwere also made by labor-intensive activity.
In Cartagena, housing costs reached an index level of about 370 (1970= 100) in mid-1978, much less than the (Barranquilla) workers' cost ofliving index of 655. The index for construction labor reached only 363, asmay be seen in Table 5-15. The concrete blocks used in workers' housingrose only to 348, but the clay bricks used for better middle-class housingrose to 605. A relative shortage of bricks had been created by the shift infinance to the price-indexed Corporaciones de Ahorro y Vivienda.2
Plumbing, finishes, electrical fixtures, and cement (including asbestos ce-

94 HOUSING STOCK AND NEW CONSTRUCTION
Table 5-15. Index of Housing Construction Costsfor Three Basic Housing Types, May 1978(January-December 1971 = 100)
Commercial,162 square Intermediate, 75
meters, three square meters, Basic, 48 squareCost category baths one bath meters, one bath
Materials 401.9 374.7 360.0Aggregate 242.0 242.6 242.2Cement 401.6 401.6 401.6Electrical fixtures and 367.3 382.9 381.2
wiringBricks or concrete blocks 604.8 347.6 347.6Wood products 360.6 477.1 360.6
Plumbing 378.1 378.1 378.1Roofing 344.0 379.0 404.6Bathroom fixtures 283.6 285.6 274.0Finishes 475.1 475.1 475.1
Labor 363.4 363.4 363.4Foreman or master 330.8 330.8 330.8Skilled worker 335.2 335.2 335.2Unskilled worker 396.0 396.0 396.0
Source: DANE, unpublished data, 1978.
ment roofing) also rose faster than construction wages. Cement aggre-gates, wood products (doors), and bathroom fixtures rose at a lowerrate. According to DANE, the incomes of less-skilled workers rose fasterthan those of more-skilled workers. Since the materials index for mini-mal houses was about the same level as the construction workers' wageindex, this type of housing did not become relatively more costly forthose who built them.
Construction and Employment
Little is known about the effects of construction on employmentbecause the contractors do not keep records of the number of peopleemployed. Large builders may hire as many as 60 percent of theirworkers because they are big enough for vertical integration, but thesmall builders in residential construction hire only 30 percent of theworkers needed. The rest are hired by a series of subcontractors who bid
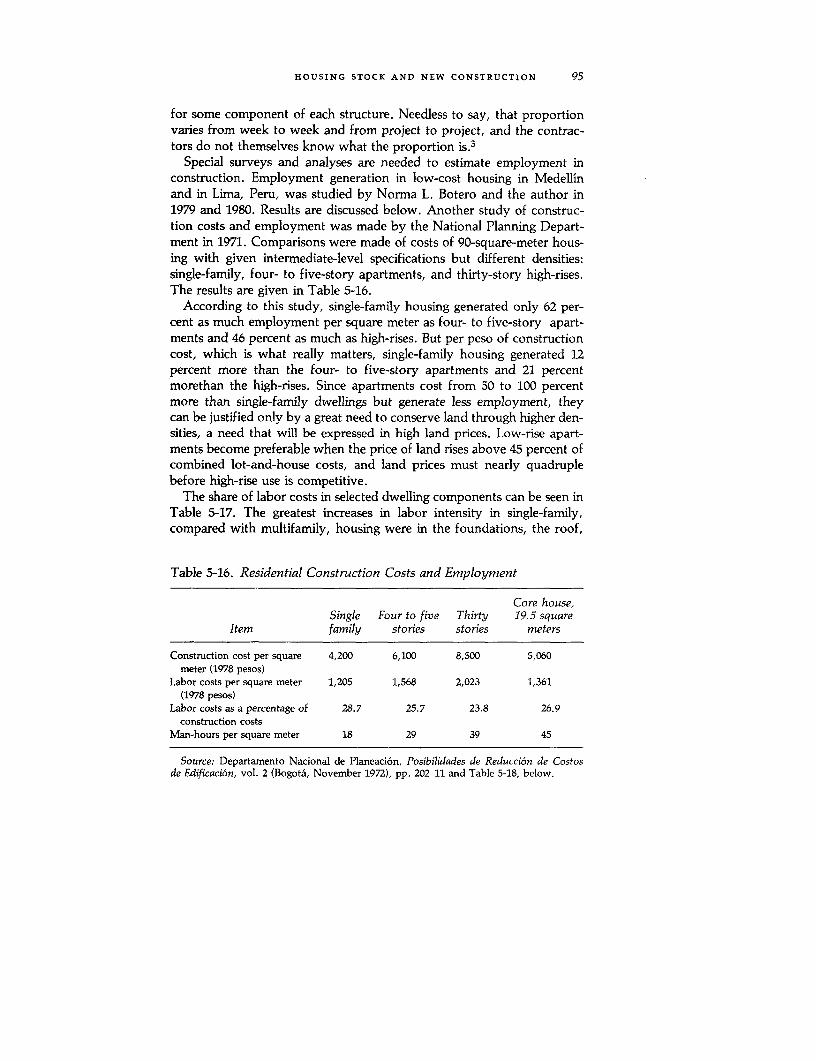
HOUSING STOCK AND NEW CONSTRUCTION 95
for some component of each structure. Needless to say, that proportionvaries from week to week and from project to project, and the contrac-tors do not themselves know what the proportion is.3
Special surveys and analyses are needed to estimate employment inconstruction. Employment generation in low-cost housing in Medellinand in Lima, Peru, was studied by Norma L. Botero and the author in1979 and 1980. Results are discussed below. Another study of construc-tion costs and employment was made by the National Planning Depart-ment in 1971. Comparisons were made of costs of 90-square-meter hous-ing with given intermediate-level specifications but different densities:single-family, four- to five-story apartments, and thirty-story high-rises.The results are given in Table 5-16.
According to this study, single-family housing generated only 62 per-cent as much employment per square meter as four- to five-story apart-ments and 46 percent as much as high-rises. But per peso of constructioncost, which is what really matters, single-family housing generated 12percent more than the four- to five-story apartments and 21 percentmorethan the high-rises. Since apartments cost from 50 to 100 percentmore than single-family dwellings but generate less employment, theycan be justified only by a great need to conserve land through higher den-sities, a need that will be expressed in high land prices. Low-rise apart-ments become preferable when the price of land rises above 45 percent ofcombined lot-and-house costs, and land prices must nearly quadruplebefore high-rise use is competitive.
The share of labor costs in selected dwelling components can be seen inTable 5-17. The greatest increases in labor intensity in single-family,compared with multifamily, housing were in the foundations, the roof,
Table 5-16. Residential Construction Costs and Employment
Core house,Single Four to five Thirty 19.5 square
Item family stories stories meters
Construction cost per square 4,200 6,100 8,500 5,060meter (1978 pesos)
Labor costs per square meter 1,205 1,568 2,023 1,361(1978 pesos)
Labor costs as a percentage of 28.7 25.7 23.8 26.9construction costs
Man-hours per square meter 18 29 39 45
Source: Departamento Nacional de Planeaci6n, Posibilidades de Reducci6n de Costosde Edificaci6n, vol. 2 (Bogota, November 1972), pp. 202-11 and Table 5-18, below.

96 HOUSING STOCK AND NEW CONSTRUCTION
Table 5-17. Share of Labor Costs in Costs of Selected Componentsof Dwellings, Colombia, 1971(percent)
Single family Multifamily
Component 1 story 2 stories 4-5 stories 12 stories 30 stories
Foundations 30 35 30 10 15Structural - 28 25 20 20
frameworkMasonry 35 35 35 35 40Roof 25 20 20 15 -Floors and closets 25 25 25 20 19Plumbing 20 25 25 25 25Carpentry and 15 12 12 10 10
fixtures
Total cost 31.5 31.4 29.7 26.8 25.8
- Not applicable.Source: Departamento Nacional de Planeaci6n, Posibilidades de Reducci6n de Costos
de Edificaci6n, vol 2 (Bogota, November 1972), table 6.6.
and carpentry. In addition, walls could be built of labor-intensive, load-bearing masonry, not a capital-intensive, steel-reinforced framework.
The 1977 study by the Colombian Chamber of Construction foundthat the share of labor in direct costs was 22 percent for single-familyhousing and 23 percent in multifamily housing. Per 1,000 square metersof construction, an isolated house generated nineteen man-years of con-struction labor, that is, 1.5 years for an 80-square-meter dwelling. Thesame 1,000 square meters would yield only seven man-years in multi-unit developments, about 0.56 of a man-year per apartment. Per 1,000square meters, projects of less than 200 square meters generated thirtyman-years, and larger ones thirteen man-years. One out of eleven con-struction workers would be off the site in an administrative job. Forevery three workers in construction, the chamber estimated that twoothers would be employed making materials.
This proportion is about the same as that found elsewhere. Materialshad a labor intensity of about one-fifth if the labor content of inputs intothe materials was added. In Mexico the labor share of materials costs wasstable, at around 22 percent. Since materials make up a larger share ofmore expensive and multifamily, multistory dwellings, more indirectlabor is also required for such buildings. In single-family basic housing itwas 12.1 percent of structural cost, and in luxury housing it was 15.5 per-cent. In low-cost four- to five-story apartments, it was 12.8 percent; and
HOUSING STOCK AND NEW CONSTRUCTION 97
in high-rise luxury apartments, 17 percent.4 In Peru, Rufino CebrecosRevilla found that indirect employment was 28 percent of total employ-ment in low-cost single-story housing and 35 percent in good housing orin ten-story apartments. Nevertheless, total employment for a given ex-penditure would be 18 percent less in high-rise buildings.5 In Rio deJaneiro the author found indirect employment equal to 18 percent ofemployment in minimal 33-square-meter housing, and equal to 21 per-cent in eight-story apartments. Once more the apartments failed togenerate more employment.6 No doubt the pattem was similar in Colom-bia.
Among the on-site workers, 48.4 percent were reported as unskilledworkers. Among the skilled workers 43.4 percent were oficiales, and 8.2percent were highly skilled workers and supervisors (maestros andcapaces). Eighty percent were masons.7
In connection with later research in Medellin, a building firm wasasked to estimate the cost and employment implied by one of the Expand-able Core House plans proposed by ICT for the Calamares developmentin Cartagena. The results are shown in Table 5-18. The dwelling had ex-terior dimensions of 6 by 3.25 meters or 19.5 square meters. It was builtwith concrete blocks on a slab, had a reinforced concrete collar beam,and a slanted roof of corrugated asbestos cement sheets. Two-thirds ofthe floor space consisted of a multiple-use room with a door to the streetand another toward the back. The rest of the space was divided betweena kitchen and a bathroom with toilet and shower. There was a washbasinoutside the bathroom, a sink in the kitchen, and a laundry tub outsidethe kitchen window. The four windows had open concrete work, notglass. Plans showed how two rooms can be added at ground level to dou-ble the floor space.
A contractor estimated that this dwelling would cost 106,300 pesos in1979 (US$2,530) if 100 units were built (this amounts to about US$2,000at 1978 prices and exchange rates). If only one unit were built, costwould be 12 percent higher, and 7 percent more jobs would be created.There would be fourteen more workdays per unit in labor-intensive sitepreparation for one unit than for 100, but other components would re-quire eight extra workdays per unit for the larger volume, a total of 109.The main findings were that labor costs made up one-quarter of the total(including the builder's off-site costs), that the shell cost 57 percent, andthat it provided two-thirds of the employment (see Table 5-18). At the un-skilled wage rate of about 168 pesos (US$4) daily, it would be economicalto mechanize site clearing but not excavation and trenching for 100 units.The wage difference of from 66 to 200 percent for skills in Medellin wasvery high; nevertheless, apart from excavation, only about one unskilledman (or less) was used with each skilled one in all other activities.

Table 5-18. Employment and Cost to Build a 19.5-Square-Meter Expandable House, by Component
Percentage Ratio of skilled UnskilledCost distribution Share of labor to unskilled employed per Employment
Component (U.S. dollars) of cost in costs wages skilled worker (workdays)
Site preparation 89 3.5 0.135 3.0 1.0 1.5(88) (3.1) (0.750) (2.174) (0.20) (15.1)
Excavation and trenching 40 1.6 0.594 1.666 15.0 5.7(42) (1.5) (0.538) (5.4)
Shell 1,455 57.5 0.324 2.735 1.230 66.3(1,628) (57.4) (0.273) (62.5)
Carpentry 458 18.1 0.135 2.608 1.00 8.6(537) (18.9) (0.109) (8.1)
Painting 96 3.8 0.475 2.608 .20 7.4(104) (3.7) (0.417) (7.1)
Plumbing 251 9.9 0.298 1.856 .60 12.1(282) (10.0) (0.250) (11.5)
Electrical 140 5.5 0.295 1.790 1.00 7.4(157) (5.5) (0.250) (7.0)
Total 2,530 100.0 0.269 2.438 1.112 109.0(2,838) (100.0) (0.263) (2.432) (1.406) (116.7)
Note: Estimates are per unit at a volume of 100 units. Estimates for single units are in parentheses if different.Source: The floor plan and specifications for this dwelling were provided by the ICT office of Cartagena. The plan was to be used in the
Calamares development. Cost estimates were made by a construction firm in Medellin and were collected by Norma Botero. The extent to whichthe estimates apply to Cartagena is uncertain.

HOUSING STOCK AND NEW CONSTRUCTION 99
The more detailed unpublished study of costs in Lima, Peru, by theauthor and Norma Botero in 1980 showed how costs and employmentper square meter rose from 45-square-meter minimal H2 housing to75-square-meter basic H3 housing and more. Costs rose from US$56 toUS$71 per square meter. On-site employment rose from 3.6 to 4.2 work-days per square meter. In H5 luxury housing costs reached US$100 persquare meter and generated 5.5 workdays for each. The proportions inCartagena did not appear much different: US$51 and US$77 per squaremeter for minimal and intermediate housing, respectively. Without asurvey of contractors, employment estimates could not be made.
Total employment in Cartagena construction could double or fall byhalf, and when times were bad workers tended to move to the interiorand to Venezuela. Shortages were noticeable only during the beginningof construction booms, before the word got around. The national ap-prenticeship service (SENA) had three or four instructors in constructionskills in Cartagena, but officials felt that the sector was too unstable andthat rises in productivity merely benefited the contractor because wageswould not rise as a result. The best newly trained workers would be en-ticed away by Venezuelan recruiting agencies and would not benefit thelocal economy directly. SENA preferred training people for more stableand lucrative careers. They found that construction workers and un-skilled labor made up 15 percent of employed workers in Esperanza(district 7) and earned only 1,800 pesos monthly, which was the lowestwage except for domestic servants.
In our sample, 6.8 percent of household heads were in construction,which is close to the 6.5 percent reported for 1975 (Table 2-1). In thismini-sample of twenty, the least skilled earned less than 2,000 pesos andmade ends meet only with aid from some absent family members andwith money from street peddling and petty trade by other familymembers. Skilled and relatively fully employed masons and painterseamed from 3,400 to 4,500 pesos monthly. Two small contractors earned7,000 and 8,500 pesos monthly. These incomes should be compared withthe 11,000 earned by skilled electricians with nonconstruction firms. Con-struction was indeed a low-paid sector, and no doubt that feature helpedkeep it labor-intensive and lagging behind other sectors in cost inflation.
That the labor-intensity of construction cannot be taken for grantedmay be illustrated by the experience of Peru. In that country militantunions were effective in gaining benefits and having them enforced. Dur-ing 1955-67, daily earnings rose 14.6 percent a year compared with 8.7percent for both construction materials and the consumer price index, or9.1 percent for the GNP deflator. By 1967 unskilled construction workersreceived 40 percent more than unskilled workers in manufacturing. Butskilled construction workers legally received only 7 percent more than
100 HOUSING STOCK AND NEW CONSTRUCTION
the unskilled by the late 1970s by law, but perhaps 30 percent more inreality. A comparatively high degree of mechanization and substitutionof skilled for unskilled workers held back employment. Because of labor-saving changes during 1955-67, construction costs rose only 9.3 percent,not 11.3 percent.8 In a detailed analysis of cost estimates for building twotypes of identical 24.9-square-meter core houses in six developing coun-tries in 1979, the author found that doubling wages eventually loweredemployment by nearly half.9 The pattern applied to the structure as awhole and to all principal components (such as the roof, plumbing, andso forth) separately. Elasticities of labor-nonlabor substitution were be-tween 0.5 and 1.0.
Innovations in Building Materials
In Cartagena, as elsewhere in Colombia, the houses of the rich werelikely to be built out of hollow clay bricks, or, in the case of apartments,reinforced concrete. Cost-oriented innovations were more likely to in-volve the concrete blocks used in houses for the poor.
Concrete blocks when properly mixed and cured should have astrength of 350 pounds per square inch. The price of a 4-inch block inCartagena was slightly above 5 pesos in 1978, and there was someresistance to paying more. Consequently architects noted a tendency toadulterate the mixture with an excessive amount of sand, so that astrength of 80 pounds per square inch was more typical of blocks madeon a small scale with aluminum forms and manual pressure. Blocks froma new factory, founded by a company based in Medellin, were moredependable and not more expensive considering the reduction in wastefrom more regular blocks.
For emergency use, some twenty-seven dwellings were built out ofasbestos sheets in the village of Zambrano in 1972 when the Magdalenaflooded; but, though cheap and quickly built, these "Colombit" houseswere not likely to find wider use in the tropical climate, according to ar-chitects. In effect, they competed with refuse and bamboo. Light con-crete panels have also been tried without spectacular effects in the districtRepublica de Chile and at Las Gaviotas.
More significant have been the houses that glue concrete blockstogether by painting them with a mixture of sulfur, talc, glass or asbestosfiber, and dicyclopentadine, a process developed by the SouthwestResearch Institute of San Antonio, Texas, and sponsored by AID.
ICT first built forty such houses in the Repuiblica de Chile section andthen another thirty-nine in Las Gaviotas during June 1976 to December
HOUSING STOCK AND NEW CONSTRUCTION 101
1977. The strength of the sulfur mixture meant that architects had to beless concerned about possible losses in stability when people changedwalls in rearranging their dwellings. After the earthquake of 1975 onlythe sulfur houses were without cracks in Republica de Chile. Cracks hadappeared in some Gaviotas houses, but apparently these were primarilyin the poor-quality blocks. A special advantage of the sulfur design isthat blocks can be joined easily to make ceiling beams that otherwisewould cost as much as 20 percent of the structure.
When blocks are merely laid one on the other without mortar, ir-regularities may occasionally call for small wedges. Architects who havesupervised the two projects estimated that the cost of a structure could bereduced by one-quarter by painting the mortarless block walls withsulfur. In addition, the resulting structure is more stable and waterproof.Nevertheless, the process will depend on the continued availability atcompetitive prices of the key ingredients, especially fuel. Moreover,requirements for the proper 150-degree-centigrade temperature call forbetter supervision. A cooler temperature may mean a less spreadablemixture, and higher heat may make the material too sticky, possibly im-pairing structural quality. Working with the heat and unpleasant odors isdisagreeable but not dangerous and had led to no organized oppositionamong workers. The real problem was that the skills involved are some-what unusual and therefore such workers were more likely to be lured toVenezuela.
It is still too early to assess the potential of the sulfur bonding as areplacement for mortar and reinforced ceiling beams. Perhaps projects ofseveral hundred dwellings will need to be built. Use on a small scale byhome improvers depends on the development of a marketing network forthe ingredients and the spread of skills, especially willingness to use athermometer. Perhaps it will be most attractive to areas that are moreseismic than Colombia's north coast. Of course, the sulfur technologyalso has other uses, such as making concrete sewer pipes more resistantto corrosion and possibly cheaper than the alternative of clay or asbestospipes.
The best assessment of the potential of sulfur houses at this point canbe made by referring back to Table 4-10, which contains data on twominimal two-bedroom dwellings in Las Gaviotas. The sulfur house cost113.2 thousand pesos, 11.5 percent more than the conventional blockdwelling. With 36 square meters of floor space, however, it was 6 percentlarger; and its 126-square-meter lot was 56 percent larger. Constructioncost as a whole was 12.3 percent less or 17.1 percent less per squaremeter. Further experiments with sulfur bonding appear warranted.
102 HOUSING STOCK AND NEW CONSTRUCTION
Notes to Chapter 5
1. The coefficients of Table 5-12 or "hedonic prices" are neither supply nor demandcurves, but are the result of the interaction between them. They are the most that differenthouseholds will pay for the various components (given the presence of all the others) andthe least that different suppliers will accept for producing them. In technical terms, they arethe upper envelope of the bid-rent functions of households and the lower envelope of theoffer functions of different suppliers. They equate marginal utility for the households andprofits at the short-run margin for the suppliers and are therefore based on the usual com-petitive equilibrium assumptions. Being a joint determination, the coefficients do not revealanything about supply and demand characteristics separately. See John M. Quigley, "WhatHave We Learned about Housing Demand," in Peter Mieszkowski and Mahlon Straszheim,Current Issues in Urban Economics (Baltimore, Md.: Johns Hopkins University Press,1979), p. 402; and Sherwin Rosen, "Hedonic Prices and Implicit Markets: Product Differen-tiation in Pure Competition," Journal of Political Economy (January 1974), pp. 34-55.
2. Throughout Colombia during the mid-1970s the demand for upper-middle-class brickhousing rose in accordance with the theories and policies of Lauchlin Currie, the economicadvisor to President Misael Pastrana.
3. CAMACOL, Empleo Generado por la Construcci6n en Colombia (Bogota, October1977), p. 5.
4. Christian Araud, Gerard Boon, Victor Urquidi, and Paul Strassmann, Studies onEmployment in the Mexican Housing Industry, Development Center Studies, EmploymentSeries no. 10 (Paris: OECD, 1973), pp. 80, 163.
5. Rufino Cebrecos Revilla, "Construcci6n de Vivienda y Empleo" (Lima: Departamentode Economia, Pontificia Universidad Catolica del Peru, April 1978; processed), p. 39.
6. W. Paul Strassmann, "Employment Generation through Residential Construction inRio de Janeiro," report for the U.S. Agency for International Development (Washington,D.C., October 1975; processed).
7. CAMACOL, Empleo Generado, 1977.8. David Greene and W. Paul Strassmann, "Peruvian Construction Statistics and Pro-
ductivity Changes," Journal of Development Studies (January 1971), pp. 189-95; andW. Paul Strassmann, "Innovation and Employment in Building: The Experience of Peru,"Oxford Economic Papers (July 1970), pp. 243-59.
9. W. Paul Strassmann, "Employment in Core House Building: A Comparison ofEstimates from Six Cities in Six Countries" (East Lansing: Housing-in-Development Unit,Michigan State University, 1980; processed). The cities studied were Medellin, Tunis,Nairobi, Lusaka, Rawalpindi, and Colombo.

6Transformation of
the Old Housing Stock
MAINTENANCE, SUBDIVISION, CONVERSION, AND IMPROVEMENT of the oldhousing stock give jobs to the poor and better housing to all incomegroups. People are expanding and improving all types of urban housingon a vast scale in developing countries, using both commercial and infor-mal organization. Within the constraints of income and time, this en-ables households to get better shelter more cheaply than by moving tonewly built dwellings. Since the process is largely informal, poorly docu-mented, and little understood, it has received meager support from pub-lic agencies and financial institutions in many countries. Indeed, officialsoften hinder the process. This tendency may now be reversed, however,as suitable financial mechanisms are developed and as governments limitthemselves merely to preventing what is unsafe. Such programs have ahigh potential for raising urban welfare if they are designed, not in a pa-ternalistic or utopian manner, but in terms of the priorities and capabili-ties of different types of occupants. The prerequisites are security oftenure and access to piped water and subsequent drainage.
In describing the upgrading behavior of owner-occupants of Carta-gena, distinctions are made between the rich, the poor, and those at theintermediate or ICT level (earning between 4,001 and 12,000 pesosmonthly, averaging 8,900 pesos). How much and what types of improve-ment are likely to be carried out by each type of household in variouskinds of dwellings in the short and long run? With data on the distribu-tion of incomes and dwellings, the rate of improvement of that part ofthe housing stock can be projected. The amount of employment gen-erated depends on the labor intensity of both the building activity andthe types of materials used. Unfortunately informal building is character-ized by lack of records and poor data.
Better records are kept by landlords who must keep track of rent pay-ments and who presumably compare a given investment with other pos-sibilities. Whether the landlord operates through a rental agency or han-dles his affairs personally, whether houses are leased to families or rooms
103
104 TRANSFORMATION OF OLD HOUSING STOCK
to lodgers, and whether the landlord is a profit-seeking individual or abranch of government, all affect maintenance and upgrading decisions.In our sample 22 percent of dwellings were rented quarters. As men-tioned before, in the census of 1973 the rental share was 30.4 percent.The decline since that year has been due partly to the disincentive ofstrictly enforced rent controls during inflation and partly to illusion, be-cause nonrented shacks were undercounted by the census, according tolocal experts.
This chapter also discusses actual and potential government and finan-cial policies toward housing improvements. In Cartagena access to pub-lic water and sewerage disposal systems was the critical factor that madehouseholds think their dwellings were worthy of continual transforma-tion. This assertion is supported by several econometric tests.
Housing Analysis
The analysis of housing markets and policies in Colombia, as any-where else, is complicated by the relatively high cost, durability, hetero-geneity, and fixed location of dwelling units. The rent or mortgage pay-ment that a household is willing to make depends partly on the bundle ofservices provided by the structure-space, security, convenience, com-fort, beauty-and partly on that provided by the site-access to work,public goods, and neighborhood amenities. If there were only threelevels of quality for the structure and three for the site, and if the best,medium, and worst of each were always associated with that of theother, only three combinations of dwelling and site would exist. In fact,however, many more options and combinations exist with complex andpoorly understood tradeoffs.
Entrepreneurs-either developers, owner-occupants, or landlords-should respond to existing prices and vacancy rates with new con-struction or transformation of old units at locations where the rate ofreturn appears highest, thus again altering prices and vacancy rates. Asequilibrium is approached, the volume of new building and conversionshould fall, as should each household's desire to move, until it reaches anew income level or stage in the life cycle.
In principle these elements applied in Cartagena. Specific results, how-ever, reflected great variations in the characteristics of households, thegeneral spatial configuration, the public utilities network, and the actualopportunities for combining factors of production. Within a budget andcredit constraint, households will seek the best yield from the combina-tion of site and structure, and a few may even quantify their decision inmonetary terms and seek maximum profits with given risk preferences.

TRANSFORMATION OF OLD HOUSING STOCK 105
Any housing survey should cover both the locational and structuralaspects of housing choices. In exploring specific analytical points, how-ever, one may concentrate on either the structural or the locationalaspect and hold the other constant. For example, as in many earlymodels, one may examine only which household locates where (distancesand densities) without stressing what they occupy at that spot. Alter-natively one can focus on what is built, expanded, or subdivided andassume that one location is more or less like another. One can begineither way and then see if the results are plausible and robust enough towithstand complications with other elements. In any case it must not beforgotten that simplifications involve omissions. Beyond the dual prob-lems of investment yields and consumption streams with respect to siteand structure, are those involving the general competition for space andother resources in an urban economy. (See Appendix D for a more rigor-ous statement of some of these issues.)
Improvements by Owner-Occupants
An analysis of housing transformation can begin by simply recordingthe number and types of changes made-description first, explanationlater. Our interviewers probed for the number of improvements in vari-ous ways. One way was to investigate improvements only by category,regardless of their extent or cost. Any owner-occupant who had im-proved a kitchen in any way was thus in the category of kitchen im-prover. After the trial interviews, thirteen improvement categories andone for "other" were set up, as shown in Table 6-1.
Most of the owner-occupants (88 percent) had made some kind of im-provement, with an average of 2.9 types of changes. The remaining 12percent had made no changes because they considered that their dwellingwas finished and that nothing else was needed. The average number forchangers and nonchangers combined was 2.7. All the changes mentionedin the table were planned by the owners when they acquired the dwell-ing. No one said that they had not planned to make any changes al-though some were needed.
Much improvement in the Southeast Zone consisted of better mate-rials. Improvement in roofs progressed from cardboard (stage A) to cor-rugated metal (stage B) and to tile or asbestos cement sheets (stage C).According to the 1976 census of the Boston sector of the Southeast Zoneconducted for ICT, only 5 percent of owner-occupied dwellings were stillin stage A, and 8 percent were in stage B, whereas 87 percent had gone tostage C in roughly equal proportions between the two materials. Becausethey provide comfort and security, roofs have high priority.

106 TRANSFORMATION OF OLD HOUSING STOCK
Table 6-1. Owners Making Specific Changes,by Years of Occupancy(percent)
Years of occupancy
Type of improvement 1-2 3-5 6-10 10+ Total
Sample size (N) 36 42 32 74 184
Add room(s) 25.0 42.9 45.0 50.0 39.7Plaster or paint 30.6 52.4 45.0 43.8 35.9Improve kitchen 13.9 19.0 35.0 34.4 26.6Improve toilet 11.1 19.0 25.0 25.0 25.0Improve windows or doors 13.9 31.0 35.0 37.5 23.9
Improve basic wall materials 16.7 23.8 27.5 31.3 23.4Improve flooring 11.1 26.2 27.5 28.1 19.6Improve roofing materials 11.1 16.7 15.0 15.6 18.5Add earth fill to site 8.3 9.5 5.0 3.1 9.2Add more convenient water
connection 0.0 19.0 7.5 9.4 4.9
Totally reconstruct the house 2.8 0.0 2.5 3.1 3.8Add terrace and railing 5.6 2.4 2.5 3.1 2.7Finish inside ceiling 0.0 4.8 2.5 3.1 1.6Other 16.7 21.4 20.0 18.8 19.6
Average number of changes 1.9 2.8 3.0 2.9 2.7
Source: Cartagena household survey, 1978.
With respect to floors, 45 percent of the households had only an earthfloor (stage A), another 46 percent had stopped with uncovered cementfloors (B), and only 7 percent had gone to ceramic tiles (C).
Only 19 percent had gone to stage C in walls, plastered concreteblocks. Unplastered concrete blocks (B) characterized 5 percent, and 76percent had wooden walls of various quality levels (A). The censusshowed that four of the 1,064 dwellings were thought to be between fortyand forty-nine years old, and four were between fifty and fifty-nineyears old, that is, built around 1920.
Additional Rooms
Additional rooms or more space was the most popular change thatowners could accomplish on their own. Access to water (if lacking) waseven more desirable, but changing that was not within the capability ofmany households. The average household that had lived three or moreyears in a dwelling had added 0.83 rooms (standard error 0.09). For
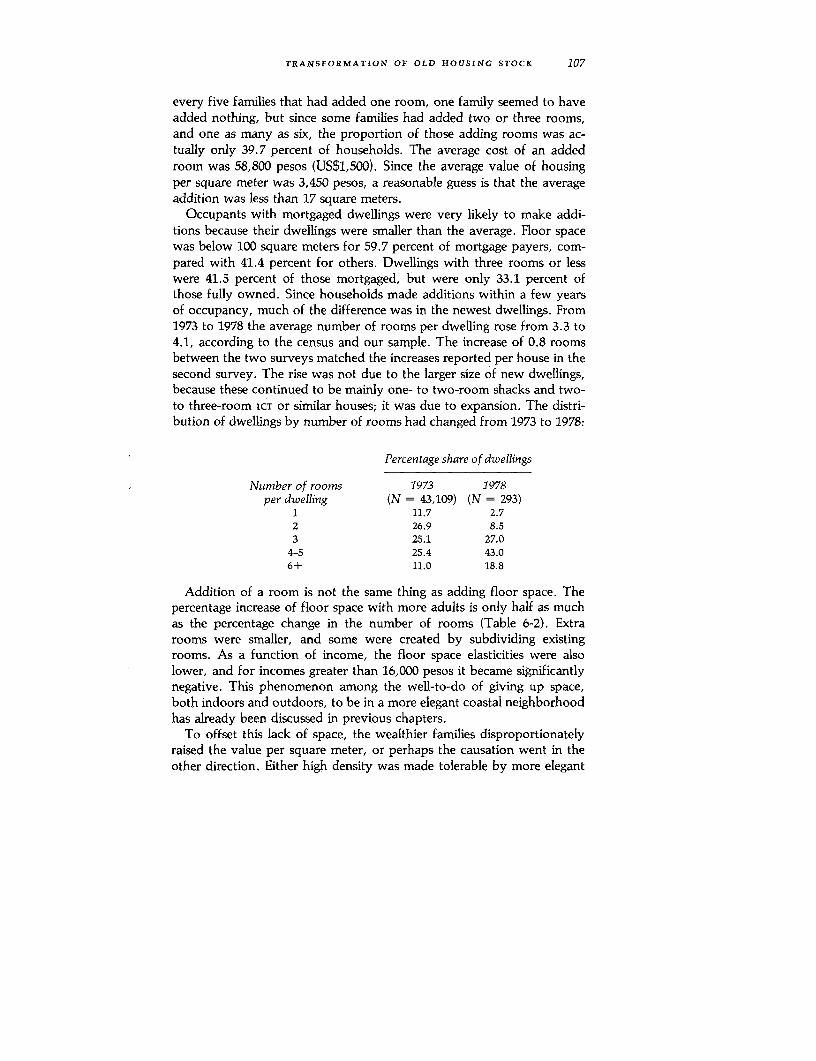
TRANSFORMATION OF OLD HOUSING STOCK 107
every five families that had added one room, one family seemed to haveadded nothing, but since some families had added two or three rooms,and one as many as six, the proportion of those adding rooms was ac-tually only 39.7 percent of households. The average cost of an addedroom was 58,800 pesos (US$1,500). Since the average value of housingper square meter was 3,450 pesos, a reasonable guess is that the averageaddition was less than 17 square meters.
Occupants with mortgaged dwellings were very likely to make addi-tions because their dwellings were smaller than the average. Floor spacewas below 100 square meters for 59.7 percent of mortgage payers, com-pared with 41.4 percent for others. Dwellings with three rooms or lesswere 41.5 percent of those mortgaged, but were only 33.1 percent ofthose fully owned. Since households made additions within a few yearsof occupancy, much of the difference was in the newest dwellings. From1973 to 1978 the average number of rooms per dwelling rose from 3.3 to4.1, according to the census and our sample. The increase of 0.8 roomsbetween the two surveys matched the increases reported per house in thesecond survey. The rise was not due to the larger size of new dwellings,because these continued to be mainly one- to two-room shacks and two-to three-room ICT or similar houses; it was due to expansion. The distri-bution of dwellings by number of rooms had changed from 1973 to 1978:
Percentage share of dwellings
Number of rooms 1973 1978per dwelling (N = 43,109) (N = 293)
1 11.7 2.72 26.9 8.53 25.1 27.0
4-5 25.4 43.06+ 11.0 18.8
Addition of a room is not the same thing as adding floor space. Thepercentage increase of floor space with more adults is only half as muchas the percentage change in the number of rooms (Table 6-2). Extrarooms were smaller, and some were created by subdividing existingrooms. As a function of income, the floor space elasticities were alsolower, and for incomes greater than 16,000 pesos it became significantlynegative. This phenomenon among the well-to-do of giving up space,both indoors and outdoors, to be in a more elegant coastal neighborhoodhas already been discussed in previous chapters.
To offset this lack of space, the wealthier families disproportionatelyraised the value per square meter, or perhaps the causation went in theother direction. Either high density was made tolerable by more elegant
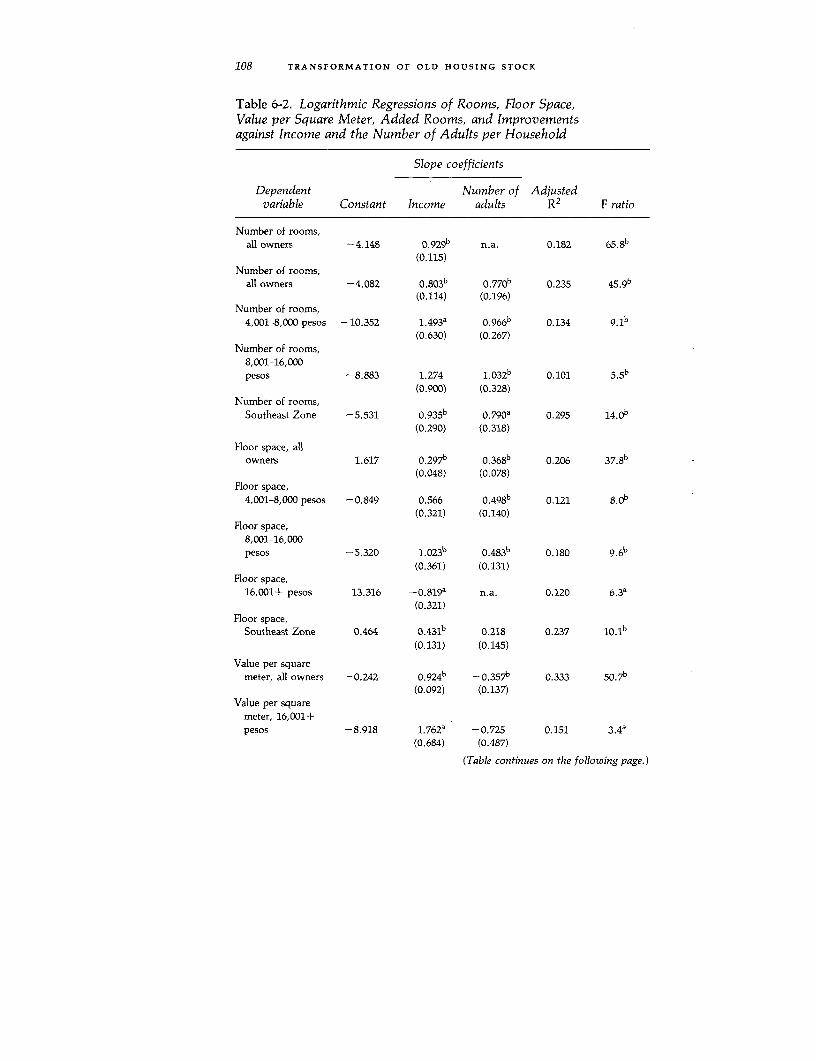
108 TRANSFORMATION OF OLD HOUSING STOCK
Table 6-2. Logarithmic Regressions of Rooms, Floor Space,Value per Square Meter, Added Rooms, and Improvementsagainst Income and the Number of Adults per Household
Slope coefficients
Dependent Number of Adjustedvariable Constant Income adults R2 F ratio
Number of rooms,all owners -4.148 0 ,9 2 9 b n.a. 0.182 6 5 .8 b
(0.115)Number of rooms,
all owners -4.082 0 .80 3b 0 .770 b 0.235 4 5,9 b(0.114) (0.196)
Number of rooms,4,001-8,000 pesos -10.352 1,493a 0 .96 6 b 0.134 9.lb
(0.630) (0.267)Number of rooms,
8,001-16,000pesos -8.883 1.274 1.032b 0.101 5 .5 b
(0.900) (0.328)Number of rooms,
Southeast Zone -5.531 0 .9 35 b 0.790a 0.295 14 ob
(0.290) (0.318)
Floor space, allowners 1.617 0.297b 0.368b 0.206 3 7 8 b
(0.048) (0.078)Floor space,
4,001-8,000 pesos -0.849 0.566 0 .4 9 8 b 0.121 8.0"(0.321) (0.140)
Floor space,8,001-16,000pesos -5.320 1.023b 0.483b 0.180 9 .6b
(0.361) (0.131)Floor space,
16,001+ pesos 13.316 -0.819a n.a. 0.120 6.3a
(0.321)Floor space,
Southeast Zone 0.464 0 .43 1 b 0.218 0.237 10.1b
(0.131) (0.145)
Value per squaremeter, all owners -0.242 0 .9 2 4 b -0.357b 0.333 50.7b
(0.092) (0.137)Value per square
meter, 16,001+pesos -8.918 1.762a -0.725 0.151 3.4a
(0.684) (0.487)
(Table continues on the following page.)
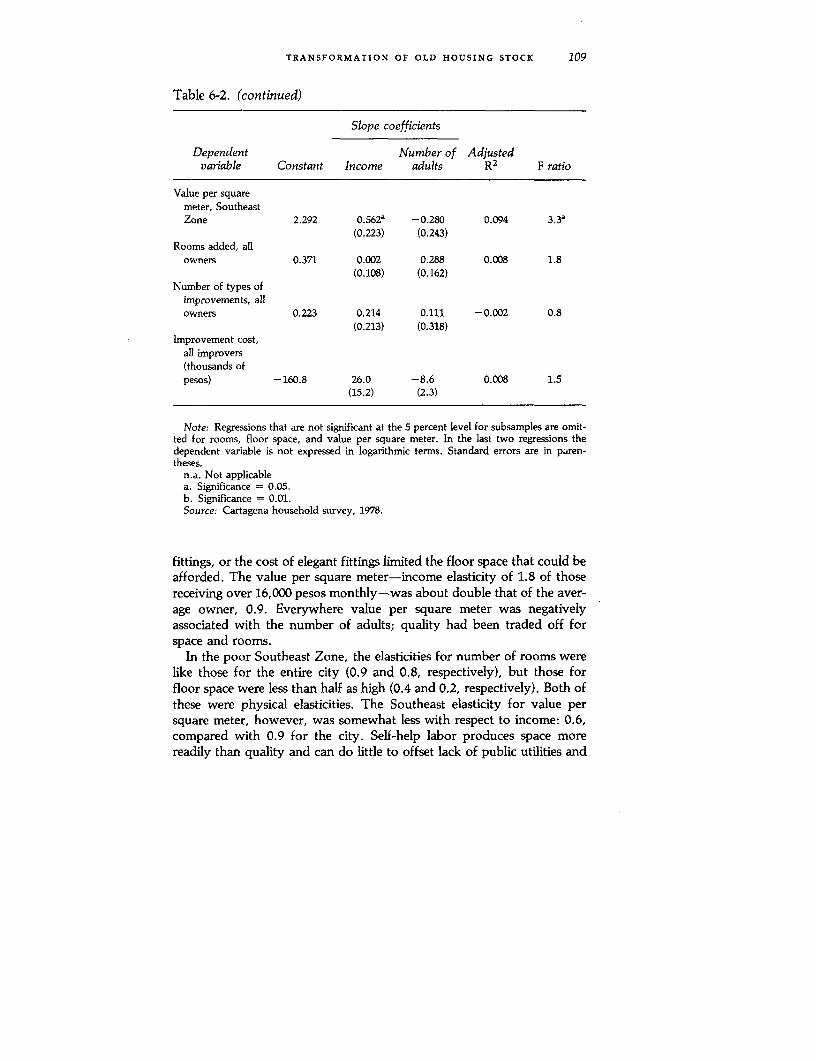
TRANSFORMATION OF OLD HOUSING STOCK 109
Table 6-2. (continued)
Slope coefficients
Dependent Number of Adjustedvariable Constant Income adults R2 F ratio
Value per squaremeter, SoutheastZone 2.292 0.562a -0.280 0.094 3.3a
(0.223) (0.243)Rooms added, all
owners 0.371 0.002 0.288 0.008 1.8(0.108) (0.162)
Number of types ofimprovements, allowners 0.223 0.214 0.111 -0.002 0.8
(0.213) (0.318)Improvement cost,
all improvers(thousands ofpesos) -160.8 26.0 -8.6 0.008 1.5
(15.2) (2.3)
Note: Regressions that are not significant at the 5 percent level for subsamples are omit-ted for rooms, floor space, and value per square meter. In the last two regressions thedependent variable is not expressed in logarithmic terms. Standard errors are in paren-theses.
n.a. Not applicablea. Significance = 0.05.b. Significance = 0.01.Source: Cartagena household survey, 1978.
fittings, or the cost of elegant fittings limited the floor space that could beafforded. The value per square meter-income elasticity of 1.8 of thosereceiving over 16,000 pesos monthly-was about double that of the aver-age owner, 0.9. Everywhere value per square meter was negativelyassociated with the number of adults; quality had been traded off forspace and rooms.
In the poor Southeast Zone, the elasticities for number of rooms werelike those for the entire city (0.9 and 0.8, respectively), but those forfloor space were less than half as high (0.4 and 0.2, respectively). Both ofthese were physical elasticities. The Southeast elasticity for value persquare meter, however, was somewhat less with respect to income: 0.6,compared with 0.9 for the city. Self-help labor produces space morereadily than quality and can do little to offset lack of public utilities and
110 TRANSFORMATION OF OLD HOUSING STOCK
low neighborhood prestige. Indeed, in the Southeast self-help wasdiscouraged by the lack of water and other infrastructure.
The principal reason for building additional rooms was the addition ofpeople to the household. Children provided the need for more spaceabout twice as often as did other relatives. Together these two reasonsaccounted for 50.5 percent of additions. Other reasons, such as space forlodgers, pure investment, need for a workshop, or space as an end initself explained less than 10 percent of additions. Nearly two-thirds ofrooms had been added within the past five years, and the average age ofadded rooms was 5.2 years. Only 9 percent of rooms were known tohave been added more than ten years ago. Of course, the 29 percent ofhouseholds that had acquired their dwellings from previous owners wereunaware of additions that might have been made previously. Tenantsalso had little knowledge of the history of their current premises.
The total number of rooms that a household occupied was highly cor-related with income and the number of adults, but that correlation didnot apply to the number of rooms added or to spending on improve-ments (mostly for added rooms) as shown in Table 6-2. The total rooms-income elasticity fell from 0.9 to 0.8 with allowance for the number ofadults. If the poorest and richest families (below 4,000 pesos and above16,000 pesos monthly) were excluded, the rooms-adults elasticity was1.0, meaning the number of rooms doubled when the number of adultsdoubled. The income elasticity was higher, but far from the same 0.01percent level of significance. But added rooms were only slightlyassociated with the number of adults and not at all with income. The R2
for both was a mere 0.008. Cartagena families seemed to move fairlyoften, and when they encountered a house that was too small, or whenthe family grew, rooms were added until the size of the house was ap-propriate for the income and size of the family. If the family had no sav-ings, the room was added by self-help or with money from temporary in-comes, as will be discussed later.
Eighty-five percent of households lived in single-family single-storyhousing, and, therefore, it was physically easy to add on at the groundlevel. Consequently the share of added rooms on the ground level was77.8 percent. Of these, about one-fifth combined adding a room withsubdividing an existing room. For example, part of a wall might be re-moved, with the added room consisting of both new and existing space.A new panel or other division made an existing room smaller. In only18.9 percent of cases did the added room come only through subdividingexisting space. Adding rooms above ground level and other forms of ad-dition came to only 3.3 percent of added rooms.
TRANSFORMATION OF OLD HOUSING STOCK 1II
Improved Kitchens
In the discussion of rooms, kitchens were not included. Among bothtenants and others, 83 percent had indoor kitchens. An additional 12 per-cent of tenants and 11 percent of others cooked indoors but had no sepa-rate kitchen. Five and 6 percent of tenants and others, respectively,cooked outside. The most common fuel was kerosene, followed by bot-tled gas. The rare use of charcoal explains the depressed state of the char-coal sellers who had to be evicted from La Carbonera. The percentagedistribution of cooking fuel used in Cartagena in 1978 by 293 householdswas
Fuel All occupants Tenants OthersKerosene or gasoline 48.1 44.6 49.1Bottled gas 38.9 43.1 37.7Electricity 8.5 7.7 8.8Charcoal or coal 3.1 1.5 3.5Wood 1.0 3.1 0.4Other 0.3 - 0.4
One-quarter of the owners had installed a better kitchen in their dwell-ing at an average cost of 19,500 pesos. With a standard error of 3,100,the significance of that average cost is rather low.
Improved Plumbing
One-quarter of all owner-occupants tried to improve their sanitaryfacilities, but only 5 percent tried make better use of what water theyhad, since that was more difficult. Eleven percent of those with only oneor two years at a site had already tried to improve their sanitary facil-ities; and of those who had lived more than ten years in their house, 35percent had made such improvements (see Table 6-1). Installing a septictank at an average cost of 21,000 (1978) pesos was the most common im-provement, closely followed by digging and setting up a latrine for 5,000pesos. Changes involving flush toilets were more expensive, with anaverage cost of 30,000 pesos. The average plumbing improvement costwas 17,700 pesos (standard error 6,500 pesos).
No household with less than three years at a site had improved waterfacilities. Nineteen percent had brought in water or added an extra bath-room if they had lived three to five years at a site. Of those with six ormore years in a dwelling, only 7 percent had made such changes. Aver-age cost was 24,000 pesos. Improved water installation depended on theavailability of public services more than other changes. In our sample,
112 TRANSFORMATION OF OLD HOUSING STOCK
6.8 percent of septic tanks and 7.0 percent of sewer-connected toilets didnot work because the water system had not been extended or was notfunctioning as expected.
The average monthly expenditure on public utilities was 626 pesos(standard error 46 pesos). By income range it was
Monthly income (pesos) Monthly utility expenditures (pesos)0- 2,000 234
2,001- 4,000 3014,001- 8,000 4068,001-16,000 531
16,001-32,000 1,73632,001+ 1,225
The income share spent on utilities falls from 10 percent below 4,000pesos to 4.4 percent in the 8,001 to 16,000 pesos range and then rises to7.2 percent above 16,000 pesos. The relation is V-shaped. The highest in-come range with merely eight observations is ignored.
Overall Improvement
Only two respondents thought their dwellings were in "much worse"shape now than at the time of acquisition, and only seven thought theywere "worse, but not much worse." By contrast, 77.6 percent thoughttheir dwellings were now in better shape, including 35.8 percent whobelieved them to be "much better." For those with incomes above 16,000pesos, this last opinion was that of the majority, 54.2 percent. As can beseen in Table 6-3, dwelling condition was strongly correlated with in-come. By the same token, those households who wanted to make
Table 6-3. Dwelling Condition in 1978 Compared with Thatat the Time of Acquisition, by Itcome Level
Percentage in row
Monthly income Much Somewhat Much Percentage(pesos) better better Same Worse worse of row
0-4,000 25.6 46.2 20.5 5.1 2.6 23.64,001-8,000 31.1 39.3 23.0 4.9 1.6 37.08,001-16,000 41.5 43.9 9.8 4.9 0 24.8
16,001 + 54.2 37.2 8.3 0 0 14.5
Total 35.8 41.8 17.0 4.2 1.2 100.0
Source: Cartagena household survey, 1978.

TRANSFORMATION OF OLD HOUSING STOCK 113
changes but had not yet made them gave lack of money as the reason in88.6 percent of cases. Hardly any respondents attributed failure to im-prove to lack of space, time, or adverse regulations.
Of interest is the rapidity with which changes are made. Table 6-1shows that occupants with three or more years in a dwelling typicallymade about three types of changes. But two types of changes are likely tohave been made during the first year. The early changes could also berepeated by these households in future years. If a room had already beenadded, they could add another. Indeed, 25 percent added a room withinthe first two years, and 31 percent added plaster and paint. Installing bet-ter windows and doors was especially important for those with fromthree to ten years in a dwelling. More than one-third of households withmore than five years at a site had installed a better kitchen.
By income category, all types of households earning more than 2,000pesos monthly had made an average of 2.5 changes to their dwellings,provided they had lived there three or more years. Those earning 2,000pesos and less had made only 1.4 changes, showing that such poverty im-pairs self-help. Households in the 4,001-8,000 pesos income range (F2)had made more than 3.5 different types of changes if they lived in in-termediate (H4) or luxurious (H5) housing, that is, far above the stock-user matrix diagonal. Upgrading brought them there.
The two poorest and the best housing types, HO, HI, and H5, had ex-perienced the fewest types of changes, two or less. The middle categorieshad experienced the most improvement, with H4 housing typically un-dergoing 3.3 types of changes. These changes are what brought much ofthis housing to the H4 level.
Age and Value
If dwellings are steadily improved by their occupants, dwelling valuewould be expected to rise with age, as is shown in Table 6-4. It appearsthat the typical dwelling began at the basic (H3) level and became in-termediate (H4) after some ten years. Both older and newer housing hadan average of three types of improvement, but the difference came fromthe number of times each improvement was repeated.
Since there were more new than old dwellings, old dwellings mighthave been more likely to survive and be owner-occupied if they were ofhigh quality and high value. At Cartagena's rate of population growth of4.4 percent, the population doubled in 16 years; thus only half the hous-ing stock would be expected to be less than sixteen years old. In fact, 72percent of the owner-occupied housing stock was fifteen years old orless. Much older housing has either been demolished or converted to ren-
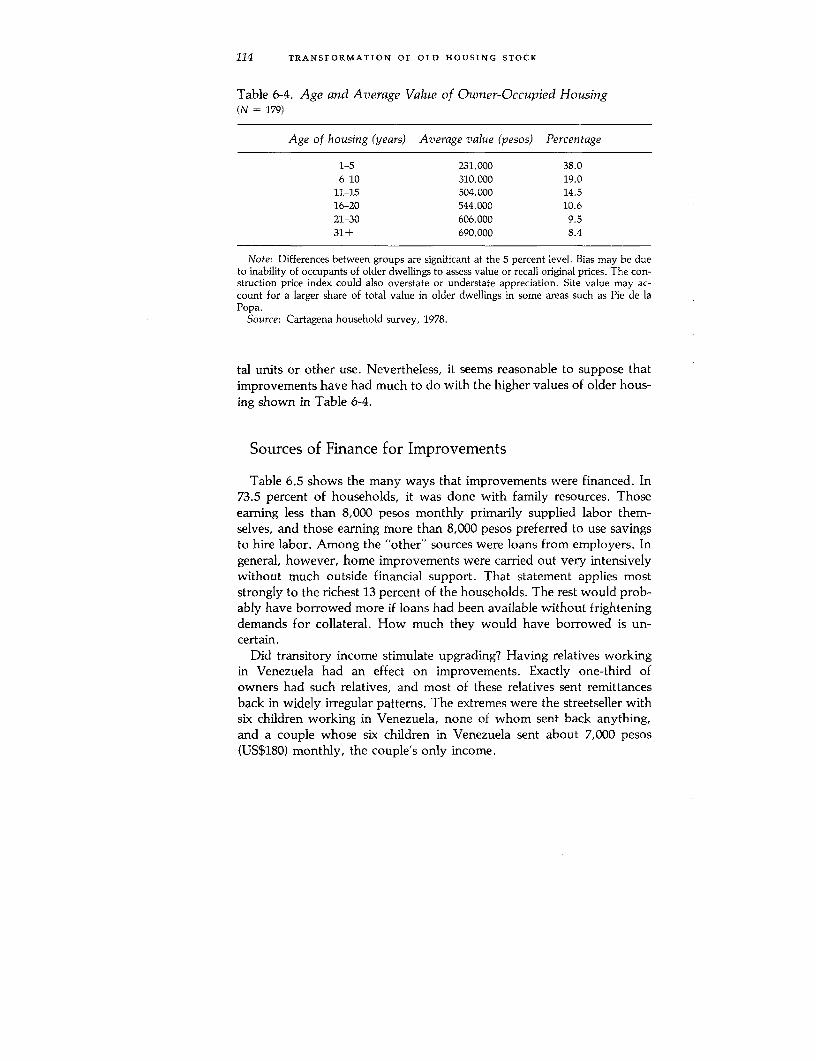
114 TRANSFORMATION OF OLD HOUSING STOCK
Table 6-4. Age and Average Value of Owner-Occupied Housing(N = 179)
Age of housing (years) Average value (pesos) Percentage
1-5 231,000 38.06-10 310,000 19.0
11-15 504,000 14.516-20 544,000 10.621-30 606,000 9.531+ 690,000 8.4
Note: Differences between groups are significant at the 5 percent level. Bias may be dueto inability of occupants of older dwellings to assess value or recall original prices. The con-struction price index could also overstate or understate appreciation. Site value may ac-count for a larger share of total value in older dwellings in some areas such as Pie de laPopa.
Source: Cartagena household survey, 1978.
tal units or other use. Nevertheless, it seems reasonable to suppose thatimprovements have had much to do with the higher values of older hous-ing shown in Table 6-4.
Sources of Finance for Improvements
Table 6.5 shows the many ways that improvements were financed. In73.5 percent of households, it was done with family resources. Thoseearning less than 8,000 pesos monthly primarily supplied labor them-selves, and those earning more than 8,000 pesos preferred to use savingsto hire labor. Among the "other" sources were loans from employers. Ingeneral, however, home improvements were carried out very intensivelywithout much outside financial support. That statement applies moststrongly to the richest 13 percent of the households. The rest would prob-ably have borrowed more if loans had been available without frighteningdemands for collateral. How much they would have borrowed is un-certain.
Did transitory income stimulate upgrading? Having relatives workingin Venezuela had an effect on improvements. Exactly one-third ofowners had such relatives, and most of these relatives sent remittancesback in widely irregular patterns. The extremes were the streetseller withsix children working in Venezuela, none of whom sent back anything,and a couple whose six children in Venezuela sent about 7,000 pesos(US$180) monthly, the couple's only income.

TRANSFORMATION OF OLD HOUSING STOCK 115
To what extent did such flows seem to raise the probability of adding aroom or of making more than the average three types of improvements?Coefficients of two logit estimating equations are given in Table 6-6, andprobabilities for households with seven members and a forty-year-oldhead of household are given in Table 6-7. Relatives in Venezuela raisedthe chance of adding a room from 25.4 to 30.8 percent for dwellingswithout water, and from 31.3 to 39.3 percent for dwellings with water.This rise is comparatively low and of doubtful statistical significancesince the t ratio is only 0.81.
For making at least three types of improvements, the significance ofrelatives in Venezuela was much higher (t = 2.21). The probability ofimproving dwellings without water rose from 47.2 to 66.9 percent andfor those with water from 59.0 to 75.3 percent. The departure ofrelatives, usually adults, for work abroad made additional space lessneeded or less desirable than improved quality.
Although these improvements raised the value of housing, they didnot bring it to above-average levels, since households with relatives inVenezuela generally had worse or smaller housing to begin with. Forty-
Table 6-S5. Most Important Source of Finance for Home Improvements,by Income Level(percent, N = 200)
Monthly income (pesos)
Source of finance 0-4,000 4,001-8,000 8,001-16,000 16,001+ Total
Self-help labor, 10.5 14.0 8.5 1.5 34.5cash for materials
Self-help labor, 1.5 1.0 1.0 0.5 4.0loan for materials
Labor and materials 6.5 13.5 9.5 9.5 39.0purchased withsavings or a loanfrom relatives
Labor and materials 0 2.5 1.0 1.0 4.5purchased withretirement funds
Labor and materials 1.0 1.0 0 0 2.0paid for with Icr,BCH, or CAV loan
Other 5.5 7.0 3.0 .5 16.0
Total 25.0 39.0 23.0 13.0 100.0
Source: Cartagena household survey, 1978.
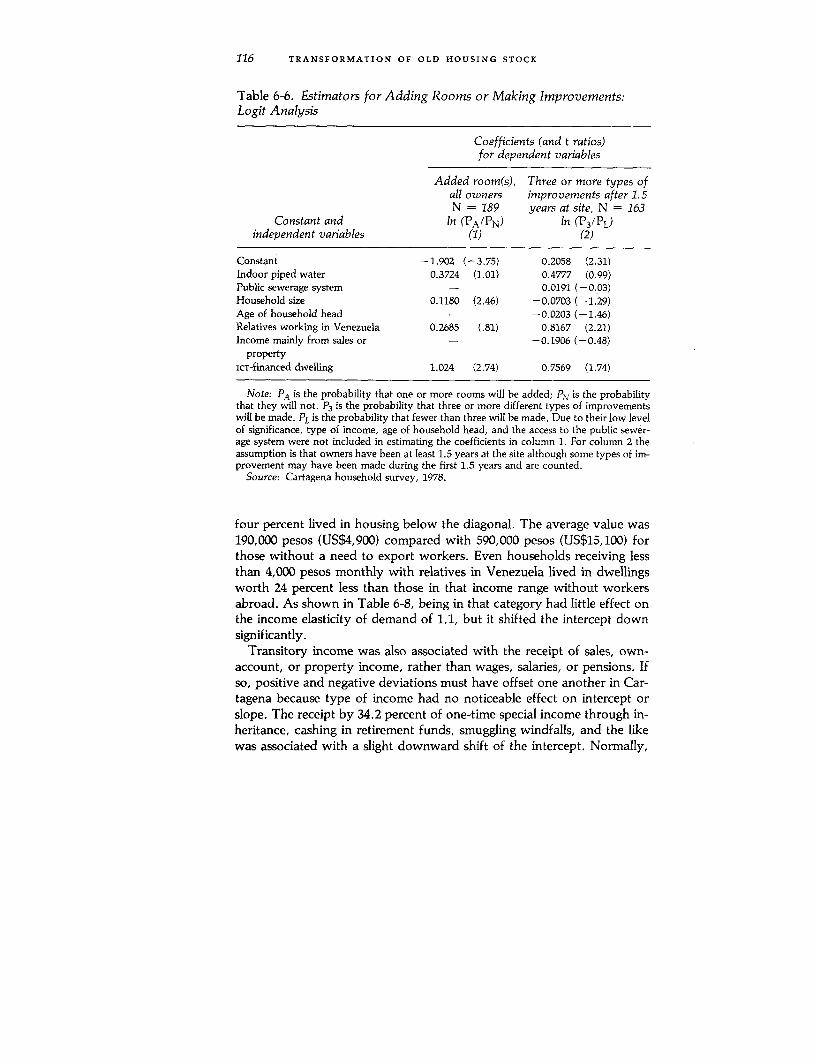
116 TRANSFORMATION OF OLD HOUSING STOCK
Table 6-6. Estimators for Adding Rooms or Making Improvements:Logit Analysis
Coefficients (and t ratios)for dependent variables
Added room(s), Three or more types ofall owners improvements after 1.5N = 189 years at site, N = 163
Constant and In (PA/PN) In (P3/PL)independent variables (1) (2)
Constant -1.902 (-3.75) 0.2058 (2.31)Indoor piped water 0.3724 (1.01) 0.4777 (0.99)Public sewerage system - 0.0191 (-0.03)Household size 0.1180 (2.46) -0.0703 (-1.29)Age of household head - -0.0203 (-1.46)Relatives working in Venezuela 0.2685 (.81) 0.8167 (2.21)Income mainly from sales or - -0.1906 (-0.48)
propertyicT-financed dwelling 1.024 (2.74) 0.7569 (1.74)
Note: PA is the probability that one or more rooms will be added; PN is the probabilitythat they will not. P3 is the probability that three or more different types of improvementswill be made. PL is the probability that fewer than three will be made. Due to their low levelof significance, type of income, age of household head, and the access to the public sewer-age system were not included in estimating the coefficients in column 1. For column 2 theassumption is that owners have been at least 1.5 years at the site although some types of im-provement may have been made during the first 1.5 years and are counted.
Source: Cartagena household survey, 1978.
four percent lived in housing below the diagonal. The average value was190,000 pesos (US$4,900) compared with 590,000 pesos (US$15,100) forthose without a need to export workers. Even households receiving lessthan 4,000 pesos monthly with relatives in Venezuela lived in dwellingsworth 24 percent less than those in that income range without workersabroad. As shown in Table 6-8, being in that category had little effect onthe income elasticity of demand of 1.1, but it shifted the intercept downsignificantly.
Transitory income was also associated with the receipt of sales, own-account, or property income, rather than wages, salaries, or pensions. Ifso, positive and negative deviations must have offset one another in Car-tagena because type of income had no noticeable effect on intercept orslope. The receipt by 34.2 percent of one-time special income through in-heritance, cashing in retirement funds, smuggling windfalls, and the likewas associated with a slight downward shift of the intercept. Normally,
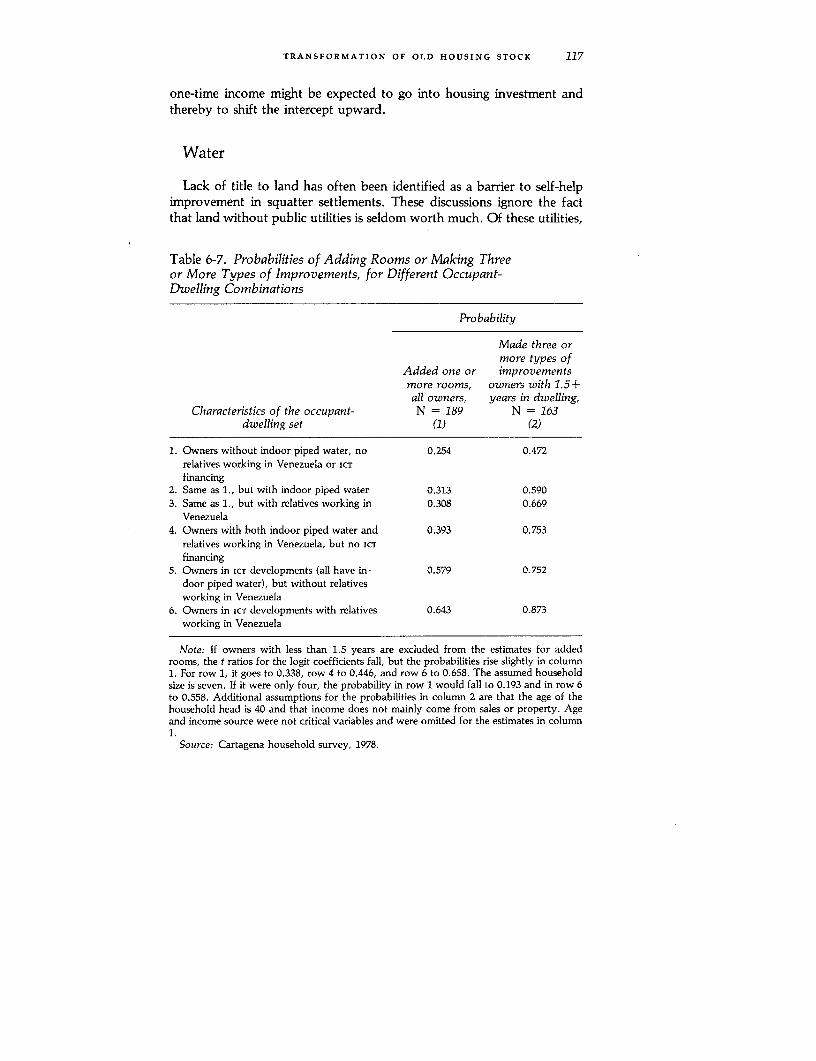
TRANSFORMATION OF OLD HOUSING STOCK 117
one-time income might be expected to go into housing investment andthereby to shift the intercept upward.
Water
Lack of title to land has often been identified as a barrier to self-helpimprovement in squatter settlements. These discussions ignore the factthat land without public utilities is seldom worth much. Of these utilities,
Table 6-7. Probabilities of Adding Rooms or Making Threeor More Types of Improvements, for Different Occupant-Dwelling Combinations
Probability
Made three ormore types of
Added one or improvementsmore rooms, owners with 1.5+all owners, years in dwelling,
Characteristics of the occupant- N = 189 N = 163dwelling set (1) (2)
1. Owners without indoor piped water, no 0.254 0.472relatives working in Venezuela or ICT
financing2. Same as 1., but with indoor piped water 0.313 0.5903. Same as 1., but with relatives working in 0.308 0.669
Venezuela4. Owners with both indoor piped water and 0.393 0.753
relatives working in Venezuela, but no icTfinancing
5. Owners in ICT developments (all have in- 0.579 0.752door piped water), but without relativesworking in Venezuela
6. Owners in icT developments with relatives 0.643 0.873working in Venezuela
Note: If owners with less than 1.5 years are excluded from the estimates for addedrooms, the t ratios for the logit coefficients fall, but the probabilities rise slightly in column1. For row 1, it goes to 0.338, row 4 to 0.446, and row 6 to 0.658. The assumed householdsize is seven. If it were only four, the probability in row 1 would fall to 0.193 and in row 6to 0.558. Additional assumptions for the probabilities in column 2 are that the age of thehousehold head is 40 and that income does not mainly come from sales or property. Ageand income source were not critical variables and were omitted for the estimates in column1.
Source: Cartagena household survey, 1978.
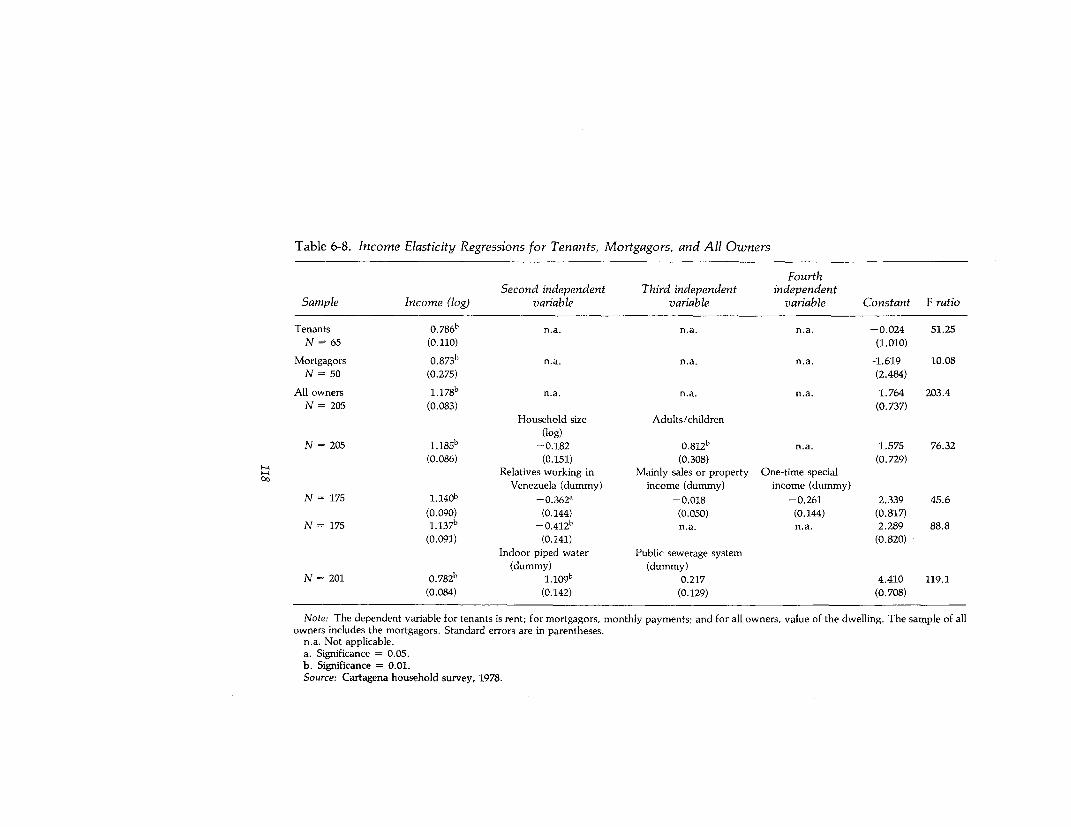
Table 6-8. Income Elasticity Regressions for Tenants, Mortgagors, and All Owners
FourthSecond independent Third independent independent
Sample Income (log) variable variable variable Constant F ratio
Tenants 0.786b n.a. n.a. n.a. -0.024 51.25
N= 65 (0.110) (1.010)
Mortgagors 0.873b n.a. n.a. n.a. -1.619 10.08
N= 50 (0.275) (2.484)
All owners 1.178b n.a. n.a. n.a. 1.764 203.4
N = 205 (0.083) (0.737)Household size Adults/children
(log)N = 205 1.185b -0.182 0.812b n.a. 1.575 76.32
(0.086) (0.151) (0.308) (0.729)Relatives working in Mainly sales or property One-time special
Venezuela (dummy) income (dummy) income (dummy)N = 175 1.140b -0.362a -0.018 -0.261 2.339 45.6
(0.090) (0.144) (0.050) (0.144) (0.817)
N= 175 1.137b -0.412b n.a. n.a. 2.289 88.8
(0.091) (0.141) (0.820)Indoor piped water Public sewerage system
(dummy) (dummy)N = 201 0.782b 1.109b 0.217 4.410 119.1
(0.084) (0.142) (0.129) (0.708)
Note: The dependent variable for tenants is rent; for mortgagors, monthly payments; and for all owners, value of the dwelling. The sample of allowners includes the mortgagors. Standard errors are in parentheses.
n.a. Not applicable.a. Significance = 0.05.b. Significance = 0.01.Source: Cartagena household survey, 1978.
TRANSFORMATION OF OLD HOUSING STOCK 119
the most important is water. Most households will not be deeply at-tached to sites that mean four daily hikes (of several hundred meters)with five-gallon cans of water. Once water mains had arrived in Carta-gena neighborhoods, the cost of making an individual connection andadding minimal fixtures was estimated as only about 9,800 pesos(US$250), mainly in materials. Installing a complete bathroom cost30,000 pesos (US$770), and a septic tank was 21,000 pesos (US$540).
Stimulant to Home Improvements
As much as tenure, access to water rouses owner-occupants towardmaking other expansions and improvement. For the Cartagena house-hold specified in Table 6-7, water connections increased the probabilityof adding a room from 25.4 to 57.9 percent if the dwelling had ICT financ-ing. The probability of having made three or more types of improve-ments rose from 47.2 to 59.0 percent without or to 75.2 percent with icTfinancing. Since ICT houses were smaller (30 to 85 square meters) andwere left partly unplastered and unpainted, they were expected to spurimprovements; and they did.
Access to water was more important than access to the public sewer-age system, since latrines and septic tanks were relatively acceptablemethods for waste disposal. Dwellings lacking water connections had anaverage value of only 82,000 pesos (US$2,100) compared with 250,000pesos (US$6,400) for those lacking sewerage connections. The averagedwelling with water was worth seven times as much as one without,whereas the average dwelling with a sewerage connection was worthonly three times as much as one without. If access to water and the publicsewerage system are added as dummy variables to income elasticityregressions, water shifts the intercept up more and is statistically highlysignificant (t = 7.79), whereas a sewerage system connection is marginal(t = 1.69, see Table 6-8). Recall that the hedonic estimates (Table 5-12)also suggested that, other things equal, indoor piped water doubled thevalue of a dwelling.
In some future year we may expect water pipes to have reached mostof the city, while the sewerage system will still be far from complete. Atthat time a sewerage system connection is likely to be a better predictorof variations in home improvement. At least, this seems to be the case inLima, Peru, where the author organized a similar survey in 1980. Even inthe squatter settlements around Lima, 61 percent of dwellings had pipedwater but only 36 percent were connected to the sewerage system.1
As can be noted from Turbaco, uncertainty about water was as dis-couraging to the rich as to the poor. After 1978 it became apparent thatthe municipality would not soon extend water lines to the proposed lux-

120 TRANSFORMATION OF OLD HOUSING STOCK
ury settlement and that electricity was too undependable to keep thepumps of private wells going. As a result, development practicallyceased, although streets and lights were already in place. Land values fellin real terms.
Access to water and the resulting faith in improvements showed up instatistics for different parts of the city as an upward shift in the interceptof the demand function for housing. The income elasticities of demandfell somewhat but remain close to unity, as already reported in Chapter4. For the largely unserviced Southeast Zone and the Outskirts of town,the intercepts were 2.8 and 2.7, and the elasticities were 0.98 and 1.10. Inthe northern quarters with water, but septic tanks instead of a sewerageconnection, the intercept rose to 4.1, and the elasticity remained 0.90. Inthe fully serviced western or coastal parts of the city (Zone 1), the in-tercept rose to 6.0, and the elasticity was 0.80. All these coefficients arestatistically significant at the 0.01 level.
No Proxy for Neighborhood Quality
The possibility arises that indoor piped water is merely a proxy forneighborhood quality in general. To check that, a regression was runwith dummy variables for each of the six major zones of the city. Asshown in Table 6-9 the coefficient for water was 1.105. The coefficientfor access to the public sewerage system ceased to be statistically signifi-cant and was slightly negative at that. Since the most expensive housingexisted along the Coast and the eastern Outskirts, the coefficients werehighest for these two areas. Lowest were those for the North and theSoutheast-the zones with the cheapest housing. But only the Coast andthe Southeast had strong (over 0.500) positive or negative correlationswith water. The ICT sector was intermediate with 0.257. Regardless of thegeneral quality of settlement in a sector, a dwelling without water wouldprobably lose far more value than the simple cost of that installation,and it would remain small and unimproved.
Inclusion of the dummies for urban zones did not change the apparenteffect of water on value. For given income levels, housing values wouldbe higher in the better districts, yet lack of water could more than offsetthis effect within a district. A household with a 10,000-peso (US$256) in-come was likely to have a 394,000-peso (US$10,000) house if it lived inLomas, and one worth only 217,000 pesos (US$5,560) if it lived in theSoutheast Zone, provided both had water. But if the Lomas site lackedwater, that household would have no more than a 130,000-peso(US$3,340) dwelling. Reluctance to make improvements on a poor site isa reasonable explanation.

TRANSFORMATION OF OLD HOUSING STOCK 121
Table 6-9. Value-Income Elasticities for Housing,with Dummies for Public Utilities and Location
Regression StandardIndependent variable coefficient error Significance F ratio
Log of income 0.527 0.084 0.000 39.7
DummiesIndoor piped water 1.105 0.137 0.000 65.4Public sewerage system -0.118 0.158 0.455 0.6
Zonal dummies (average income;correlation with water)North 0.172 0.163 0.295 1.1(8,521; -0.011)IcT 0.396 0.197 0.045 4.1(9,673; -0.257)Lomas 0.596 0.162 0.000 13.5(9,201; 0.152)Outskirts 0.676 0.206 0.001 10.8(6,685; 0.103)Coast 1.542 0.238 0.000 42.1(20,923; 0.523)Constant 6.328 0.698 0.000 82.1
Note: The sample consists of 201 owner-occupants. The dependent variable was the logof the declared value. Average monthly incomes per household are given in parenthesesand apply to all residents in a zone. Correlation coefficients are those for indoor pipedwater with residence in a zone. The Southeast Zone values are implied when all other zonaldummies are zero: average monthly income was 5,488 pesos in July 1978; correlation withresidence and indoor piped water was -0.504. The overall F ratio for the regression was64.4, which is significant at the 0.01 level. The adjusted R2 was 0.717.
Source: Cartagena household survey, 1978.
In terms of averages, incomes in the Southeast were 49.1 percent ashigh as in the rest of the city, but housing was worth only 22.5 percent asmuch. Given the demand elasticity, the value was below a level explic-able by poverty alone. What was lacking were the conditions for inspir-ing upgrading with the hope of resale to others. In the Southeast 24.2percent of households had lived more than fifteen years at a site, com-pared with only 19.5 percent for the rest of the city and with 18.6 percentfor the western Coastal Zone, the oldest part of the city. Incomes in thewestern and coastal quarter were 2.1 times as high as those of the city asa whole, but the average value of housing was 3.6 times as high. If thepoor did less improving than others, it may have been largely due to thephysical conditions of the part of the city where they lived since, asreported above, upgrading was not generally associated with income.

122 TRANSFORMATION OF OLD HOUSING STOCK
Because of the upgrading the Gini coefficient of 0.305 for housing showsthat shelter was more equitably distributed than income with 0.419.WNhere sites were serviced, households could distribute this product tothemselves.
ICT Financing
The ICT has gradually moved toward support for upgrading and is stillexperimenting with policies and physical designs. Since it has been one ofthe world's pioneers in creative social housing policies, no doubt its ex-periments will continue to be instructive.
Loan Conditions and Policies
A program of loans for upgrading older housing was initiated by ICT inOctober 1977 as part of an integral plan for improving subnormal urbanzones. First priority went to legalizing tenure. After that came in-stallation of water, sewerage connections, improved roads, and electric-ity, preferably in that order, although sewerage systems are the mostcomplex and costly and often, in fact, lagged. The occupants had to useloans to make kitchens and bathrooms adequate, followed by improve-ment of the existing walls and roof. Only then were expansions allowed.
Recipients of loans had to be family heads with adequate incomes andcollateral or a cosigner for the loan. No more than 57,000 pesos could belent for obtaining tenure in 1978, meaning the equivalent of 650 dailyminimum wages for Bogota. No more than 84,000 pesos or 970 minimumwages could be lent for subsequent home improvements. Loans had to berepaid in fifteen years with payments that rose 5 percent annually and arate of interest and insurance of 14 percent-given the rate of inflation, anegative rate.
Loans for upgrading were not to be used to pay for the labor of theowner-occupants themselves. Funds for materials were to be disbursed aswork progressed, as verified by a supervising ICT architect. Materialsfrom ICT warehouses and ICT-associated enterprises were to be usedwhenever possible, and prefabricated plumbing and structural units wererecommended. No loans were to be made to owners with lodgers or te-nant families on the premises. ICT did not still object to tenants per se, butit did not see its role as financier of landlords, even if small and probablytemporary. To qualify for loans, landlords first had to sell those parts oftheir premises to the occupants.
In December 1977 the Cartagena branch of the ICT was authorized tolend 30 million pesos (US$770,000) for home improvement. In poor

TRANSFORMATION OF OLD HOUSING STOCK 123
neighborhoods along the bay in the southern parts of District 16, Bos-que, 540 loans of up to 50,000 pesos were made as a result. An educa-tional program had to first persuade squatters of the advantages oflegalizing tenure and committing part of their future incomes. Manywere afraid that agreeing to relocate on better-sited lots was a steptoward eradication. Others doubted that the proposed improvementswere worth the financial commitments. Without a sewerage system onlyseptic tanks were possible in that sector, and even they depended onpromised water connections. After the arrival of water, ICT promised fur-ther 10,000-peso loans for making the connection. To qualify for all this,the head of the family had to eam at least 2,500 pesos monthly, a re-quirement that eliminated nearly one-third of households in Albomozand nearly one-half in La Cartagenita. Improvement loans were notgranted to shacks that engineers designated as too dilapidated to be safe.
Without collateral or mortgaged dwellings at stake, recipients of loanssoon lagged behind in payments. Collection costs were so high that theprogram was considered a financial failure by 1980. Families with uncer-tain income were reluctant to gamble with their only asset, the house. Tokeep lending institutions solvent without foreclosing on mortgagors withtemporary inability to pay, a more comprehensive insurance system isneeded. In Bogota such a system in the form of the Corporaci6n Distritalde Garantias has already been set up with initial funding of 4 millionpesos. Subscribers are a number of official and private financial institu-tions. Operations are in part delegated to ICT, the Caja de ViviendaPopular, and the Corporaci6n Financiera Popular. For an effective lend-ing program for home improvement, Cartagena may need somethingsimilar. The simplest system, however, would be to sell materials at alarge discount to qualified households that have accumulated a targetamount of prior savings, similar to the system that the Banco de Materi-ales introduced in Peru in the fall of 1980.
Minimal Improvable Housing
An ICT program of the late 1960s that was not tried on a large scale inCartagena was organized mutual aid. Elsewhere in Colombia icT foundthat this program was expensive to administer, slow in execution, tied upmuch capital, and that prospective owners subcontracted as much oftheir own labor obligation as they could afford, up to 90 percent. Profes-sional contractors could build more efficiently, so a policy of minimalsemifinished housing was introduced. In Chapter 4 this type of housingwas described as consisting of two rooms and about 33 square meters offloor space at a 1978 price of 125,000 pesos (US$3,200). One-roomhouses with 19.5 square meters were begun at Las Calamares with a sav-

124 TRANSFORMATION OF OLD HOUSING STOCK
ing of perhaps 20 percent. Finishing and fixtures were rudimentary, butthe foundations were there for expansions. A cost estimate was given inChapter 5.
ICT was moving in the direction of anticipating expansion and remodel-ing by the occupants. In certain of its two-story dwellings, called cepillos or"brushes," steep roofs came down to make up part of a second-story wall.Occupants commonly raised the roof to a more obtuse angle to gain floorspace on the second story. If such houses were properly designed, thechange would not impair lighting and ventilation. Some architects worriedabout the waste involved in building components of houses only to haveamateurs destroy them. Others deplored the increased costs because oflack of building skill and inability to buy materials wholesale.2 Theyseemed to miss the point that poor families could bear these costs but notthe risk of mortgaging their assets in a formal arrangement with thebuilding industry.
Case histories of ICT housing
The scarcity of housing and finance, especially when offered at subsi-dized rates, causes pressures that modify the housing stock and assign it tooccupants other than those designated by social nonmarket criteria. Low-income housing filters up to the well-to-do who then upgrade it in the vari-ous ways described earlier. Alternatively, the poor subdivide and over-crowd housing that would otherwise have brought one household up tosocially prescribed minimum, but overly expensive, standards. These pat-terns and variations can be illustrated by cases from the ICT.
When the centrally located slum of Chambacu was eradicated, some ofits occupants were resettled 7 kilometers to the west in the Repuiblicade Venezuela section. Here they received 63-square-meter three-roomhouses on 96-square-meter lots. The dockworker who occupied one ofthese in our sample traveled ninety minutes back and forth to work in-stead of thirty minutes. Through subdivision and a slight extension, hehad added a room to accommodate some additional relatives. Sevenadults and five children now occupied the house which they called a ca-jita de f6sforos (little matchbox).
In nearby Chiquinquira even smaller (about 50-square-meter) housescost 60,000 pesos in 1974 (180,000 1978 pesos, US$4,600). Within twoyears the construction foreman, who had acquired the house, had spent50,000 pesos to add two rooms, increasing the size to 92 square meters.Five adults-four with jobs-and three children occupied this house.
A similar icT Chiquinquira house was originally occupied by the fam-ily of a jewelry repairman and that of his brother. Antagonism betweenthe wives caused the families to put up a wall that divided the house and
TRANSFORMATION OF OLD HOUSING STOCK 125
the patio. The jewelry man, his wife (who had married him at the age of13), and their three children were now left with a 21-square-meter dwell-ing without kitchen or bathroom. The family cooked outside and usedthe bathroom of the husband's mother who lived a block away.
In the Paraguay development, ICT had given another family a lot aftereviction from Chambac6 and a 20,000-peso loan for a three-bedroomhouse. Apart from installing better windows and doors, this family offour adults and two children had made no further improvements andplanned none. The husband was a guard at a Mamonal plant, and thewife worked in a fish-packing enterprise. Together they earned 10,000pesos monthly. Three nearby non-Chambacui families earned half asmuch but had added rooms, gutters, a terrace, a flat ceiling, had plas-tered and painted, and were planning further changes.
Houses in the Gaviotas development were similar in size and price tothose at Chiquinquira, adjusted for inflation, and were being constructedand occupied during 1977-78. Four households turned up in our sample.Their average income of 16,700 pesos monthly was 2.7 times that of theChiquinquira and Republica de Venezuela households. They included ahighly skilled petrochemical worker, a denture maker, a dentist-physi-cian couple, and a bus driver. To the 150,000-peso cost of their house,the dentist-physician couple immediately added 90,000 pesos to get a bet-ter kitchen, bathroom, windows, doors, roof, walls, and floors thanthose specified by ICT. The regular ICT contractors did the work. Themoney was borrowed from friends. The petrochemical worker and thedenture maker used savings to make extensive changes in their ICT housebefore moving in. They had walls plastered and painted and additionalrooms built on, and substituted better materials here and there. Two ofthese families replaced the asbestos cement sheet roof with flat reinforcedconcrete to allow later installation of a second story.
Only the bus driver with his monthly income of 9,000 pesos could notafford to make changes before moving in. But as soon as he had done so,he and his sons began making improvements on weekends: plasteringand painting the walls, making a partition to separate the kitchen fromthe living room, and building more solid and higher patio walls. As soonas money would be available, he planned to put in tile floors, to improvethe bathroom, and to add more rooms. With seven members, his was thelargest Gaviotas household sampled, and at age forty he was the oldesthousehold head. Perhaps he was also the only genuine member of the ICT
target income group. Given their incomes, the other three families werenot really prepared to move into the sort of house that ICT was offering.
Upgrading houses during construction is probably not as efficient asbeginning with a better design in the first place, but for the buyers theseinefficiencies were more than offset by the benefits of subsidized credit.
126 TRANSFORMATION OF OLD HOUSING STOCK
The government was subsidizing H3 dwellings for young households thatwere only temporarily in the F3 income category. Soon they would haveF4 incomes and would live in H4 housing. The fact that richer familiesspent their income on local labor and building materials-instead of onluxury goods with a high import content-must, however, be counted asgain to the local economy.
An Improved House in El Socorro
Not enough detailed cases can be presented in a short study to give anaccurate portrait of a city, but presentation of only statistics on hundredsof cases also gives an incomplete view. A few cases can show what isbehind the numbers. This one concerns a small family with an averageCartagena income of around 10,000 pesos (US$260) monthly living in anicT house in El Socorro.
The father, Augusto, a photographer, had been abandoned by his firstwife and lived with his teenage son and new common-law wife. Thirtyyears ago, Augusto had moved from Monteria to Cartagena as a boywhen his own father had abandoned his family and the mother had de-cided to move in with a sister. There were five sons and a daughter. Asthe years passed the family stayed together but moved from theCanapote-LeMaitre district in the North, to Getsemani in the Center, toPie de la Popa further east, and finally to an ICT corner house in Blas deLezo in 1967. By this time several sons were married. The Blas de Lezohouse was expanded to five rooms and equipped with a front porch and alarge louvered picture window. The front was plastered with decorativegranite chips, and a side window was enlarged to make one room a smallgrocery store.
After seven years in that house, the brothers decided to split up intoseveral nuclear families and sold the Blas de Lezo house to an owner ofsmall commercial boats. The house rented for 2,500 pesos monthly in1978. When the house sold for 135,000 pesos in 1974, a 10,000-peso bal-ance had to be paid to ICT plus seven years of accumulated real estate tax.
Augusto used part of his share of the proceeds to make a down pay-ment of 6,000 pesos on the 40,700-peso El Socorro house when he wonan ICT drawing. The new house consisted of 84 square meters of floorspace in two stories on an 84-square-meter lot. His monthly mortgagepayments were 375 pesos in 1978 and 394 pesos in 1979. Monthly pay-ments were 159 pesos for electricity, 80 pesos for water, 15 pesos forsewerage service, 30 pesos for garbage collection (every other day), and42 pesos for police protection and street planting-a total of 326 pesos.Real estate taxes were an additional 100 pesos monthly.
TRANSFORMATION OF OLD HOUSING STOCK 127
Within four years, Augusto had plastered his house inside and out andhad painted it turquoise. His front door was beautifully carved and hadan elaborate lock. For 6,000 pesos he had a large louvered window in-stalled in front, together with several 1-inch plumbing pipes as bars tosecure the window against burglars. With 9,000 pesos in materials,Augusto added two rooms in the back, one above the other. Prefabri-cated beams supported the concrete panels that made up the secondstory. Built-in closets had been added to the upstairs rooms. The patiowas then too small for a garden and was, therefore, cemented in com-pletely. With such a small family and an inexpensive ICT loan, Augustohad enough income left over during these years to buy a television setand refrigerator. He estimated the value of his house as 275,000 pesos,more than double his original investment, even after tripling that toallow for inflation. He had brought it from H2 to almost H4, from belowthe stock-user matrix diagonal to almost above.
Rental Housing
Twenty-two percent of the dwellings in our sample were rented, andfew tenants had any idea about the year of construction or subsequentimprovements. Most had been occupants for only two or three years.Often they even lacked clear knowledge about who the owner or rentalagency was and where they were located. Some families simply knewthat once a month someone came by to collect rent. The prevailing viewwas that landlords never made improvements.
A Brief Survey
We chose a quarter of the rented dwellings, all those with fairly in-telligible addresses for owners or agencies, and made a brief survey.Seventeen dwellings were involved: ten handled by agencies and sevenby the owners themselves. In three cases the agencies claimed to have norecord of the particular dwelling. Three of the owners' addresses wereunhelpful. One address did not exist at all. Another produced a relativein charge of collecting rent, not the actual owner. A third person at firstadmitted to being the owner and then changed his mind. Useful informa-tion came from the remaining seven agency houses and four owners.
The average rent collected by the agencies was 3,900 pesos (US$100)monthly. The owners who handled their rented dwellings personally,mostly elderly people, collected an average of 3,400 pesos (US$86). Thefour dwellings that they rented out were thirty years old and were esti-
128 TRANSFORMATION OF OLD HOUSING STOCK
mated to be worth an average of 688,000 pesos (US$17,600). Thusmonthly rent was claimed as 0.5 percent of the value of the dwelling.One owner had just sold the dwelling in question, so the stated value of 1million pesos may be considered the actual market value. In his case therent reported by owner and tenant coincided at 6,000 pesos. The tenant,however, was willing to pay 8,000 pesos for this 720-square-meter housein an excellent neighborhood.
The level of rent as reported by the agencies coincided with that re-ported by tenants in four of the seven cases. In the other three, the agen-cies claimed that rent was one-quarter less. Two of the managing ownersagreed with tenants on the amount of rent: one claimed to collect less,and the other more. Half of the tenants willing to comment on the issuewere willing to pay 40 percent more rent than they reported paying. Theother half were satisfied with things as they were, but would not paymore. The typical tenant had been there two and one-half years, andnone had been there more than four, so the rate of turnover was high.Some tenants had been dislodged from their previous dwellings, and onewas currently protesting an attempt to raise the rent by 25 percent andwas making his payments to an escrow account in a bank, as prescribedby the Colombian rent control law.
Improvements
Given inflation and rent control laws, owning dwellings was profitableonly if tenants voluntarily agreed to periodic increases or if they weredislodged through a variety of legal stratagems. While the dwellings wereempty, landlords authorized improvements. Four types of improvementshad been made in the average dwelling in our sample. Owners usingagencies had authorized only two or three types of improvements;managing owners had authorized six types. Painting and plastering wasnaturally the most widespread type of improvement, followed by hook-ing up to the public sewerage system when possible-a compulsory mea-sure. The frequency of improvements was:
Improvement FrequencyPaint and plaster 9Connect with sewerage system 8Improve windows or doors 6Improve floors 4Improve kitchen; improve roofing 3Add rooms, water connection, terrace and railing; finish ceiling 2Replace walls 1
The average income of this group of tenants was 18,600 pesosmonthly, and the median income was 13,000 pesos, a relatively high
TRANSFORMATION OF OLD HOUSING STOCK 129
level. Tenants with lower incomes typically had less education and wereless able to give accurate landlord addresses.
Problems of Landlords
One function of the real estate agencies was to spare the owners all theirritations of dealing with tenants and with the government in the pres-ence of unrealistic rent controls. The law dates back to the mid-1950s,but its enforcement was strengthened in the mid-1970s at the very timethat accelerating inflation made its effects more damaging to the rationaluse of the housing stock. Colombians who worked abroad, including themany in Venezuela, preferred to leave their house vacant or in free oc-cupancy by guarding friends rather than become involved with rentallegislation. Even when occupants voluntarily agreed to rent increasesthat matched inflation, they could change their mind after some yearsand recover all the excess from the landlords through the courts.
Occupants could be dislodged only if they failed to make payments fortwo months or if the owner needed the house for himself. In this lattercase, the tenant could challenge the owner's sincerity in the courts, andthe process of eviction would take at least four months and possibly upto a year. In this frustrating situation, many owners preferred to have aslittle to do with their property as possible and to leave everything to theagencies. These guaranteed payment of monthly rent on schedule andwould use the funds to make various tax, school, and other payments forthe owners. The infrequency of long-term tenancy indicated that, afterinflation had eroded the real value of rental payments, owners did takethe necessary steps to restore their incomes even if it meant selling theproperty.
The best landlord-tenant relations existed when there was some kindof direct personal understanding between the two, regardless of laws.This was the case among the elderly couples whose extra houses weretheir investment and hedge against inflation for old age. Under these cir-cumstances the most improvements were undertaken. We found this in-terest and willingness among landlords both in fashionable Bocagrandeand in poor sectors. In Bocagrande we found a landlord who rented theother floor of his own house and who had built a second rental unit to-ward the side of his property. He had made more improvements thananyone.
A poor landlord, who had taught band music in a high school, lived ina wooden shack and had lodgers in other shacks at the back of his prop-erty. Open sewers ran past these shacks. Nearby was another house thathe had built as a rental unit in 1938. Among the improvements on thishouse were a new straw roof and a latrine. The current occupant dropped
130 TRANSFORMATION OF OLD HOUSING STOCK
in for a visit during the interview with the landlord. She supported her-self and three children by selling contraband from Venezuela, earning6,000 pesos monthly. She had been in the house less than a year. Eighttypes of improvements had been made on her house before she came.
One managing landlord who owned several units of low quality hadmade comparatively few changes, but one of these was interesting andsignificant. He had installed his own sewerage system, which emptiedinto a creek that flowed into the Cienaga de la Tesca o Virgen. Unfor-tunately sewerage from unconnected dwellings of others at higher levelsstill flowed into his terrain. This characteristic and the lack of serviceablestreets led him to claim that the unit in the sample could be sold for only250,000 pesos-not the 553,000-peso assessed value.
The Government as Landlord
Government agencies usually make the worst landlords. In Cartagenathis tendency was illustrated by two dwellings in Barrio Militar, aquarter for noncommissioned officers at the northern tip of the city, lo-cated in angle between the runway of the airport and the Caribbean.Both units were intermediate 135-square-meter dwellings with one bath-room, built on 200-square-meter lots in 1966 for 94,500 pesos. SinceCartagena construction costs had sextupled since then, their 1978 re-placement cost was around 600,000 pesos
Initially the Navy had planned to sell these dwellings to its personnel,but soon found that some families would have resold them and movedout. Title was, therefore, given to a Fondo Rotario de la Armada, andrents were put at such a low level that the temptation to move out wasgone. A sergeant in his twenties earned 5,700 pesos monthly and paidonly 250 pesos (US$6.40) in rent-4.4 percent of his income. Anothersergeant in his forties earned 12,000 pesos and paid 800 pesos (US$21)rent or 6.7 percent. Both paid an approximate 600 pesos for services.
No improvements or additions had been made in either dwelling, afailure that is most unusual in Cartagena. When asked how much of amonthly payment a house of this quality was worth, the youngersergeant said 1,100 pesos, and the older 1,500 pesos. They compared itwith Basic ICT four-room dwellings currently offered at Nuevo Bosque.But these have only 61 square meters on 126-square-meter lots and sellfor 235,000 pesos. The implication may be that the Barrio Militar houseshad lost half their value through deterioration. Both owners complainedthat they still had septic tanks instead of sewers and that streets hadnever been paved. The city thought that the Navy should pay for these,but the Navy was leaving it to the city. The Navy made up some of its
TRANSFORMATION OF OLD HOUSING STOCK 131
losses on housing by not providing the customary transport for the6.5-kilometer daily trip to the base.
Rooms for Rent in the Ancient Center
Dwellings tell the story of both particular families and entire cities.During the early 1950s people feared that the ancient center would bedesignated a hopeless slum to be demolished. The railway and nearbyparts of La Matuna were in fact demolished, and values of structures felleverywhere in anticipation of more destruction. At this time a youngclerk cashed in her retirement fund and bought a two-room house forherself and her mother for 8,500 pesos (US$3,800, 1978). Enough moneywas left over to add four other rooms in the back, to make repairs, toplaster and paint, to improve the kitchen, and to install better windowsand doors.
In time, the mother, who had only one year of schooling in her home-town of Sincelejo, retired from her job at the Hospital Santa Clara, andthe daughter found a husband in 1971 and moved out. At this time waterand a better bathroom were installed for 6,000 pesos (US$725, 1978), andthe mother, aged seventy-one, began renting three of the rooms to ten-ants, single men, especially students. Another room went to a servantwho helped in various ways, including selling soft drinks to the lodgers.The daughter, as owner, did not charge rent to her mother, thus forego-ing possibly 5,000 pesos monthly. The 1978 value of the structure wasestimated as 500,000 pesos (US$12,800). The mother said her total in-come from her pension, the lodgers, and petty sales was 6,500 pesos.Electricity, water, and public services cost 500 pesos monthly.
Summary
The average Cartagena homeowner had made three types of changeson his dwelling, including addition of a room. From 1973 to 1975 the av-erage dwelling expanded from 3.3 to 4.1 rooms. The total number ofrooms, amount of floor space, and value per square meter were signifi-cantly associated with income and the number of adults in a household,but the number of rooms added or amounts spent on improvement werenot. Need and feasibility came together in various ways at different in-come levels. With self-help many poor and intermediate-income house-holds rapidly brought themselves up to and beyond the stock-user matrixdiagonal. Regressions, cross-tabulations (Appendix C), and case studieselaborate on these generalizations.
132 TRANSFORMATION OF OLD HOUSING STOCK
Tenants generally occupied housing that was on or below the stock-user matrix diagonal. They were unaware of improvements on theirdwellings, but interviews with landlords showed that improvements hadnevertheless been made, usually when units were vacant. Some analystshave concluded that expanding and remodeling for tenants by landlordsis a desirable way to expand low-cost housing (Appendix E).
Colombian housing authorities have gradually moved away fromslum eradication toward a policy of providing upgradable semifinishedhousing of smaller and smaller dimensions. Such physical designs mustbe complemented by guaranteed loans that are not too risky for house-holds with low and fluctuating incomes that wish to upgrade their dwell-ings. Selling building materials at a discount may be the best way to helpthe poor after roads, drainage, and piped water have been installed. Dur-ing the 1960s and 1970s Cartagena dwellings with indoor piped waterwere improved to an extent that cannot be explained by the cost of thewater installation itself, by the income level of occupants, or by the gen-eral quality of a district. Water, like security of tenure, released a zeal toexpand and transform.
Notes to Chapter 6
1. W. Paul Strassmann, "Housing Policy and Improvements by Owner Occupants: AComparison of Neighborhoods in Lima, Peru" (East Lansing: Michigan State University,September 1981; processed).
2. Nicolas Rueda Garcia, Centro de Planificaci6n y Urbanismo, University of the Andes,quoted in El Tiempo (August 19, 1978).

7The Housing Market
THE WAY SUPPLY AND DEMAND INTERACT in the overall housing market istoo complex to be summarized briefly and accurately: brevity withoutomissions and oversimplifications is impossible. Dwellings from shacksto mansions are built, improved, converted, and demolished. Neighbor-hoods change in quality and access to the rest of a city. Households arecreated through formal or informal marriage, then the members moveaway from or toward relatives, change occupations, have children, ac-cumulate assets, and die. Each change can make a dwelling unsuitable.Households can consist of lodgers, tenants, owners, or landlords. Gov-ernments influence decisions by controlling use of land, providing infra-structure, charging taxes, limiting rents, guiding credit, and changing therate of inflation.
Housing Used by Four Income Groups
A summary for Cartagena must at least distinguish four incomelevels. Twenty-two percent were the poor with jobs such as domestic ser-vice, street selling, messengers, dockworkers, and other unskilled workof a type that will largely disappear in the course of economic develop-ment. These FO and Fl households earned less than 4,000 pesos (US$103)monthly, and half lived in the Southeast Zone. Only 12 percent weretenants renting waterless huts that were somewhat smaller than the100,000-peso (US$2,600) houses that most would eventually acquire orbuild. The typical household contained six persons. Nearly half hadrelatives working in Venezuela.
The lower-middle group with incomes between 4,001 and 8,000 pesos(F2) had the most households, 36 percent of the total. Mechanics,shopkeepers, office workers, and drivers were in this category. The 21percent who were tenants lived in three-room H2 houses with their fam-ilies of six or seven members. Few dwellings had sewerage system con-
133

134 THE HOUSING MARKET
nections. As households grew to eight and nine members, often throughdoubling up with adult siblings or adult children, they became ownersand added a room, usually with self-help but rarely if indoor piped watercould not be installed. Thirty percent of owners in this income range,with households averaging 7.8 members, had not expanded their dwell-ings to four rooms or beyond the substandard Hi level in quality becauseof the lack of indoor water. Low value was not simply due to the mereabsence of a water facility in itself; nor was small size due to lower need(smaller families) or lower per capita income (larger families).
Half of the IcT-financed dwellings had reached the higher levels of theF2 income group, usually in connection with some past eradication.These houses were designed to be expandable. The F2 households livedthroughout the city, from the higher elevations of the Southeast Zone toothers in Getsemani apartments.
The upper-middle group (F3) consisted of highly skilled workers inmechanical, chemical, or electrical tasks, foremen, cashiers, bank clerks,private teachers, and people with fairly responsible positions in businessor government. They earned between 8,001 and 16,000 pesos, not allfrom wages and salaries of one worker, and they were all above the me-dian income level. They made up 28 percent of households. Newhouseholds in this income range avoided waterless dwellings withlatrines and were likely to rent until they inherited a house or could af-ford to buy something adequate. Hence, a large proportion were tenants(27.5 percent) and had two or three fewer members than households ofowners. The household size for owners was 8.4 persons: 10.4 persons forhouseholds below the diagonal and 7.7 elsewhere. Hence lower percapita income had prevented expansion for some. The household size fortenants was 5.8 persons. Rents were disproportionately higher than rentsat lower income levels.
As the head of an F3 household reached his mid-thirties, he acquiredeither an old house or a new expandable one with an ICT loan. Bothtenants and owners were likely to move every five years, either becausethe landlord reclaimed his property or later because the owned dwellingcould be sold for a better one. After all, dwellings on small lots cannot beexpanded beyond a certain point. Houses could also be turned into rentalproperty. After a room was added, still with much self-help, the averagedwelling acquired by F3s was transformed into an H3 or H4 dwelling offour to six rooms with indoor water and sewerage connection, worth300,000 pesos (US$7,700). Apart from taxis and tools, it was the family'sbest investment opportunity. Households in this income range typicallylived in the ICT and Lomas zones, but they could be found anywhere, ex-cept perhaps in the Southeast.
THE HOUSING MARKET 135
Finally, some 14 percent of households earned over 16,000 pesos(US$410) monthly and were the upper class, unless that term is reservedfor the 2.7 percent who received more than 32,000 pesos or those withdistinguished family names. This F4-F5 group consisted of people such asowners of businesses, plant superintendents, doctors, and lawyers, muchof whose income came from investments. If one of these households ac-quired a new dwelling, it was probably custom-designed and financedwith family assets or a loan through the Banco Central Hipotecario or aCorporaci6n de Vivienda. These households insisted on living in CoastalZone 1 or Turbaco and were willing to occupy a small unit to make thatpossible. Hence 31 percent were tenants who paid fairly high rents whenfirst moving into a unit and thus did not necessarily acquire a suitable H4or H5 good-to-excellent unit on the diagonal. All nevertheless had waterand flushing toilets. Accelerating inflation and rent control invariablybrought rents down to bargain levels after a year or two, and that en-couraged repossession by landlords and conversion to other commercialuses in Bocagrande. Conversion or expansion in the historical center wasforbidden unless the dwelling remained white Spanish Colonial and insome areas not even then.
Thus the housing shortage in Cartagena, given incomes, was greatestfor the rich and the poor. Most of the rich owners had tried to add aroom, bringing the number of rooms to six, the same number as the sizeof the family. (Two persons per room was the average in all lower in-come groups.) The unfulfilled demand or high prices for excellent hous-ing created a possibility for cross-subsidization from rich to poor, andfor a while ICT tried to exploit that possibility by building profitable lux-ury apartments in the area where the slums of Chambacu had been eradi-cated. After pilings for 1,400 apartments had been hammered in, how-ever, the land had to be sold, as previously discussed.
The major drawback of the preceding discussion is that it compart-mentalizes the population into four income classes. It gives the impres-sion that if new households joined one of the classes as tenants and thenbecame owners and upgraded their dwelling, they still would stay withinthe class. If the data base had not been a cross-section but a time series ofseveral decades, we could have reported the movement up from one classto the next. Illiterates have trouble moving up, and doctors begin high,but in between, earnings do rise with experience, promotions, and prop-erty accumulation.
Income also depended on the changing number of working adults, notjust the career of one person. The median Cartagena household had threeadults and four children under eighteen, some of them working. Ill healthand accidents often brought early retirement, however, and many

136 THE HOUSING MARKET
Table 7-1. Income, Rent, and Dwelling Value per Adultin Households with Different Numbers of Adults
Number of adults, Income per adult Rent per adult Dwelling value perexcluding ser-oants (pesos) (pesos) adult (pesos)
1 13,100 1,830 563,0002 4,900 1,090 182,0003 3,000 690 137,0004 2,500 510 93,5005 1,700 240 59,6006+ 1,700 140 86,600
Source: Cartagena household survey, 1978.
adults, such as wives with small children, the aged, and invalids, wereunemployed and thus had no earnings. Yet about two-thirds of house-holds had more than one working member, as might be expected whentwo-thirds have three or more adults present. Income per adult fellsharply as the number of adults per household increased, mainly becausesecond workers had worse jobs but partly because the poor were morelikely to double up. Rent per adult and dwelling value per adult also fellas the number of adults per household rose, as can be seen in Table 7-1.Compared with households of two adults, households with only fiveadults had one-third the income per adult, and the dwelling value peradult was also only one-third as high. As discussed in Chapter 2, familystructure in Cartagena was complex, and the patterns and prospects fordoubling up and undoubling can only be guessed at without a studyaimed primarily at that issue.
The Southeast Zone and Squatters
Throughout the study, conditions in the Southeast Zone have beencompared with other zones and with those in the city as a whole. TheSoutheast population of 85,000 was one-fifth that of the city. Its averagehousehold size of 7.0 was the same as the entire city; but the average in-come of 5,500 pesos monthly was less than half that of others. Here 68percent of dwellings were less than eleven years old, and 65 percent ofoccupants had lived in them less than eleven years. For the city as awhole, the same proportion-68 percent-had occupied a dwelling forless than eleven years. Those who rented paid an average of 860 pesos inthe Southeast, less than half of the 1,960 pesos paid in the city. Thisrepresented 13.6 percent of their income instead of 18 percent. Thegreatest difference was in the value for nonrental housing: 418,000 pesos

THE HOUSING MARKET 137
for the city and only 113,000 pesos for the Southeast, 27 percent. Ex-cluding the Southeast, income in the rest of the city averaged 11,200pesos and housing 503,000 pesos. The Southeast's income was 49.1 per-cent as high, but its housing was valued at only 22.5 percent of the valueof the city's other housing. Half of Cartagena's HO and Hi housing wasthere. Since demand patterns appear similar, the housing in this area wasbelow a level explicable by poverty alone-a failure of supply due to theinability or reluctance of occupants to upgrade their dwellings.
In the Southeast 68 percent of households obtained water from watersellers or from public standpipes, compared with only 29 percent for thecity. Sanitary facilities were latrines or less in 71 percent of housing in theSoutheast, compared with 32 percent for the city. The income elasticitiesof demand for number of rooms in the Southeast was 0.935; forfloor space, 0.431; for value per square meter, 0.562; and for total value,1.123 (given family size and the life cycle stage)-all close to those for theentire city. When it came to housing, the inhabitants of the Southeastwere not different, just poorer. Most of the analysis in this report has,therefore, been by income group, not by location. Specifically, densityof settlement, lot size, distance from work, or real estate taxes did notseem to be an important influence on housing decisions. Future researchmight explore the threshold population size that makes these factors im-portant, and how the transition comes about.
The number of poor households who occupied terrain without legal ti-tle is unknown. Part of the problem was that many of these householdsobtained the land themselves by filling in marshes so that sites werenever illegally "invaded." Moreover asking about legality of tenure was asensitive issue among people who clearly remembered the massiveeradication at Chambac6. In our survey we decided not to probe for doc-uments of legality. The 1976 census by ICT of the Boston-Tesca sector ofthe Southeast Zone did ask for documentary proof, and interviewers en-countered much antagonism: "Very few showed ownership documents;most simply said that they had this or that document and displayedmuch suspicion and hostility in answering the question."1
Tenure among the 1,064 households was said to be documented asfollows:
Document or type of tenure Percentage of households
Owners; escritura (deed) 19.1Owners; minuta (certificate of occupancy) 28.0Receipt or certificate of sale 2.6Certificate of inspection 0.6None 32.0Dwelling granted or lent without charge 4.0Tenant 13.7
Total 100.0

138 THE HOUSING MARKET
With this information, one can only proceed with a variety of conjec-tures. If 33 percent of households in Boston-Tesca were without title orlegality, perhaps the proportion was the same in the rest of the SoutheastZone. In that case, 4,000 households could be classified as squatters inthis area. If an equal number was squatting throughout the rest of thecity along the Juan de Angola Channel, at El Milagro, around El Poz6n,and so forth, the total would come to 8,000 households, exactly thenumber estimated to be in HO temporary dwellings. If 20 to 25 percent ofoccupants of HI substandard dwellings were squatters, the total mightcome to 10,000 to 11,000 households or 73,000 persons, perhaps 17 per-cent of the population. Since a policy of no eradication (unless ICT landwas invaded) and legalization of tenure was underway, no matter howthe land had been originally acquired, the legal concept of squatting hadless meaning than the physical characteristics of dwellings. Knowledgeabout this policy, however, diffused slowly. According to the 1976survey, 88 percent of households had no members that belonged to anytype of communal organization, and 34 percent had either not heard ofthe Southeast Zone upgrading program or "expressed a low opinion ofthe govemment and ICT and believed they would be evicted like those ofChambac(i."2
The current policy amounted to a tacit understanding that, after thirtydays, squatters would not be disturbed except for the possible construc-tion of public facilities such as roads, drainage systems, and markets.Giving title involved an expense since it required surveying and drawingup legal documents. Depending on the amount of surveying and demar-cation already carried out as part of civil engineering work, titles couldbe processed for 1,000 to 2,000 pesos each. In 1978 ICT had a 12.1-million-peso program to regularize land tenure in this manner. House-holds qualified if they had lived two years or longer at a site and if theywere able to repay the cost over fifteen years at 14 percent, including in-surance. Plans to extend water and sewerage systems to other dwellingsin an area were also reassuring to those who could not yet afford connec-tions. The more explicit such programs become and the more they aresupported by small loans or below-cost sales of materials, the faster HOand HI housing will be transformed into something better.
The Overall Housing Matrix for 1978
The main 1978 stock-user matrix (Table 5-2) showed the wayhouseholds with various incomes occupied houses of various grades. Forexample, 6,130 households (36 percent) in the 8,001 to 16,000-peso in-
THE HOUSING MARKET 139
come range of F3 occupied H3 housing worth 160,000 to 320,000 pesos or2,000 to 4,000 pesos in monthly rent. To repeat, such housing typicallyhad four rooms, piped water, and a septic tank or sewerage connections.If it was built by ICT, it was called "basic," and one of the rooms was sup-posed to be added by the owner.
A striking characteristic of the matrix was the proportion ofhouseholds in cells above the diagonal, 41.1 percent, with 13.3 percentsubstantially above, or two cells to the right. Only 29.1 percent werebelow the diagonal, with 10.8 percent substantially below. This varia-tion can be quantified by ranking a position on the diagonal as 100, aposition to the left as 50, and one to the right as 200. This corresponds tothe doubling in value from one column to the next but remains relative toincome or capacity to pay. According to this system, a weighted indexfor all Cartagena housing, except that of FO households, gives a value of157, a number that is unusually high compared with findings elsewhere.3
It shows that for every household that is on the diagonal in the kind ofhousing that on the average it would be willing to pay for on unsubsi-dized market terms, another is in housing twice as good. The householdcan afford to be in that kind of housing because it has been upgraded byself-help and with remittances from Venezuela, among other sources.The lag of building costs behind inflation may also have shifted demandin this direction more than might have been expected.
The diagonal of the matrix is defined as representing where the averagehousehold would prefer to live. If more households in any income rangeprefer to be above than below (or vice versa), that is due either to marketimperfections or to an improper choice of income or housing price rangesfor the matrix. The ranges should reflect the income elasticity of demand:the percentage change in preferred housing expenditures at given pricesthat results from a percentage change in income.
Actual expenditures can hardly be trustworthy guides to incomeelasticities untinged by market imperfections, since spending takes placein the world as it is. The physical characteristics of each of the six hous-ing types can be related, however, to new construction costs of each typeand that can be related to monthly payments over fifteen years plus arealistic interest rate. In what income range would households be willingto make the monthly payments that fit each type? Would householdsearning twice as much be willing to pay double for a dwelling built withtwice as much labor and materials? Would they want something still bet-ter? Market imperfections, shortages, and overbuilding make payments(actual or implicit) vary from this level. Clues about imperfections can befound through statistical techniques, through noting the extent of rentcontrol and credit rationing, by examining distortions in land markets
140 THE HOUSING MARKET
and utility allocation, by comparing price trends in different parts of theeconomy, and perhaps by naively asking questions directly. All thesetechniques were used, and they pointed toward an elasticity of aboutunity. This means little more than that 0.7 is definitely too low and 1.3too high. An unduly low elasticity would put an incredible number ofhouseholds above the diagonal at high income levels and too manybelow at low income levels. An unduly high elasticity would have thereverse effect.
Descriptions, interpretations, and policy conclusions of this study arenot, however, sensitive to having ascertained perfectly what the true in-come elasticity of demand for housing is, hence the matrix diagonal. Apoorly set up matrix would still show that improvements and expansionshave put many households in cells to the right of ones that they wouldotherwise occupy. The widespread willingness and ability to improvehousing at all income levels is the important finding about Cartagena. Inmaking projections to a future year, it is more important to keep boun-daries between income and value ranges unchanged than to worry aboutminor errors in the implied income elasticity. One can specify a goal ofkeeping housing conditions from deteriorating for households in anyincome range without being sure whether initially one-fifth or one-thirdwere out of equilibrium. A correctly specified diagonal is analytically at-tractive and, like a Gini coefficient, makes it possible to compare one citywith another at a different stage of development. For policy purposes it isneeded if the goal is undefined except to maximize housing welfare underan investment constraint. Then one tries to move as many households asclose to the diagonal as possible, and a wrong diagonal would be mis-leading. But if the housing targets have been determined in some othermanner, then a correct diagonal is not critical.4
The stated willingness of both tenants and mortgagors to pay more fortheir premises than they were being charged does not necessarily provethe existence of market imperfections. In a competitive market withmany homogeneous buyers, sellers, and commodities, only a few are atthe margin, unwilling to pay a penny more for benefits received. Theprice was lowered to bring in these marginal buyers, and everyone elsethereby received "consumer surplus."
Such market conditions obviously do not prevail in housing. At best,competition is monopolistic with great differentiation among buyers,sellers, and dwellings. No doubt, some tenants or buyers may gain bypaying little for premises that have been vacant unduly long in the opin-ion of owners. But the cases we encountered were otherwise. Controlsand inflation had made rents and mortgage payments less than house-holds were willing to pay; information was imperfect at the time of con-tracting, and payments did not vary with market conditions. A different
THE HOUSING MARKET 141
case applied to some tenants who paid more than they consideredreasonable for their current dwelling but less than they would have beenwilling to pay for something larger and better. In this case, the supplyresponse was faulty.
As can be seen in Table 7-2, the index of housing quality in Cartagenain 1973 was probably between 93 and 115-not bad, given income levels,but much below the 1978 index of 157. The great upsurge in home im-provement since 1973 was due to a combination of factors. It began froma low physical base, after policy was reoriented because of the Cham-bacu eradication, and at the same time as the increased migration to andremittances from Venezuela began after the first OPEC price increase.
Upgrading and housing transformation was carried on by everyone,but especially by Fl and F2 households earning between 2,001 and 8,000pesos monthly. Consequently, these reached an index level of around185, compared with 125 for those in the 8,001-to-16,000-peso range.Thus, housing was distributed more equally than was income. The Car-tagenian housing Gini was 0.305, whereas the income Gini was 0.419. Bycontrast, urban Sri Lanka in 1971 had an income Gini of 0.408 and ahousing Gini of 0.551. San Juan and Ponce, Puerto Rico, in 1970 had in-come Ginis of 0.480 and 0.516, but these cities benefited from all the U.S.housing and urban development programs. So their housing Ginis weremerely 0.196 and 0.320.5
The Cartagena housing Gini was brought down partly by the inabilityof high-income tenants to find suitable housing at sufficiently low initialrents. Highest income families may also have understated the value oftheir premises more than that of their income, although we have nospecial reason to suspect that.
From 1973 to 1978 the average value of Cartagena housing, owned andrented combined, increased from 183,000 pesos (US$4,700) to 275,000pesos (US$7,000)-a growth rate of 8.5 percent, perhaps three times thatof household income. Since this increase in value is in real terms, it maynot be typical of developing countries. Linn notes:
In the aggregate the supply of housing, as reflected by the rate of in-crease in dwelling units due to new construction and renovation, hasgenerally not expanded by more than 1 to 3 percent per annum(Grimes, 1976), but that at unchanged prices demand for housingwould be expected to increase by 8 to 10 percent a year ... Real hous-ing prices will tend to rise in the rapidly growing cities of the develop-ing countries.6
In Cartagena, the average house still under amortization was worth308,000 pesos (US$7,900) and had three rooms, whereas owner-occupiedhouses without mortgages were worth 480,000 pesos (US$12,300) and
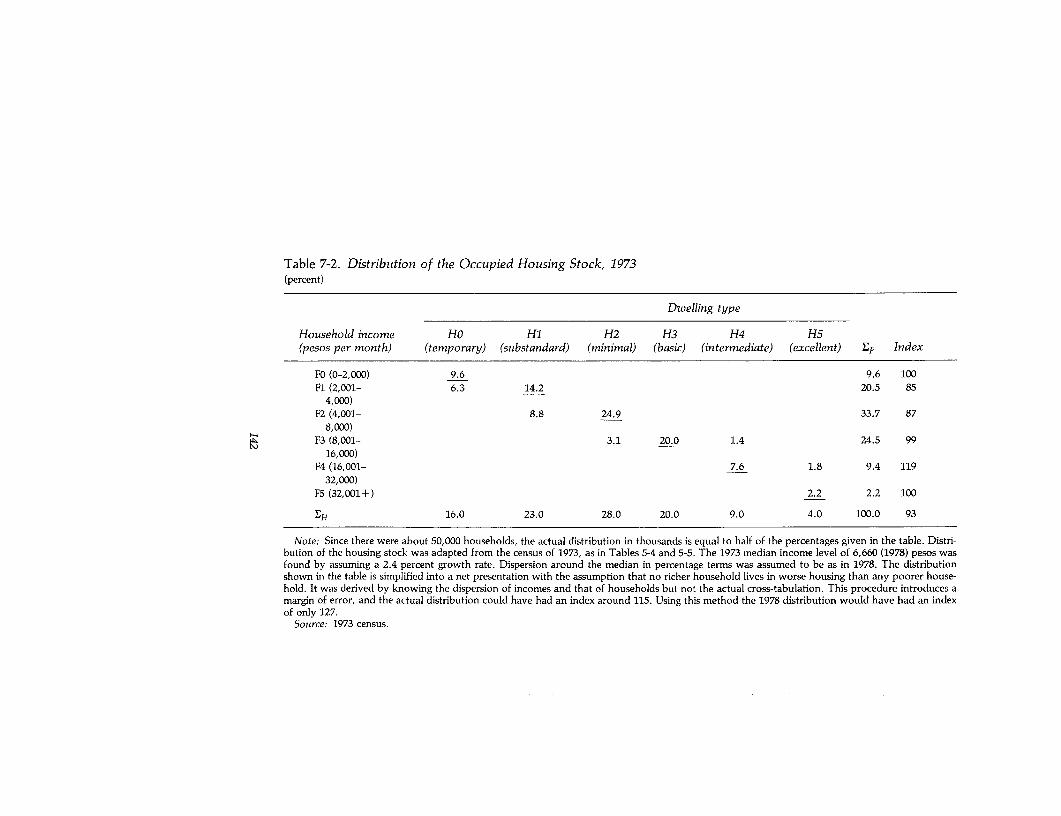
Table 7-2. Distribution of the Occupied Housing Stock, 1973(percent)
Dwelling type
Household income HO HI H2 H3 H4 H5(pesos per month) (temporary) (substandard) (minimal) (basic) (intermediate) (excellent) EF Index
FO (0-2,000) 9.6 9.6 100Fl (2,001- 6.3 14.2 20.5 85
4,000)F2 (4,001- 8.8 24.9 33.7 87
8,000)F3 (8,001- 3.1 20.0 1.4 24.5 99
16,000)F4 (16,001- 7.6 1.8 9.4 119
32,000)F5 (32,001+) 2.2 2.2 100
EH 16.0 23.0 28.0 20.0 9.0 4.0 100.0 93
Note: Since there were about 50,000 households, the actual distribution in thousands is equal to half of the percentages given in the table. Distri-bution of the housing stock was adapted from the census of 1973, as in Tables 5-4 and 5-5. The 1973 median income level of 6,660 (1978) pesos wasfound by assuming a 2.4 percent growth rate. Dispersion around the median in percentage terms was assumed to be as in 1978. The distributionshown in the table is simplified into a net presentation with the assumption that no richer household lives in worse housing than any poorer house-hold. It was derived by knowing the dispersion of incomes and that of households but not the actual cross-tabulation. This procedure introduces amargin of error, and the actual distribution could have had an index around 115. Using this method the 1978 distribution would have had an indexof only 127.
Source: 1973 census.

THE HOUSING MARKET 143
had four rooms. Owner-occupied dwellings five years old or less wereworth 230,000 pesos (US$5,900), and those between twenty-one andthirty years old were worth 605,000 pesos (US$15,500).
These increases in value did not seem to be due to the rising amount orvalue of land and transport advantages. A distance from work of 2 to 3kilometers was not significantly associated with incomes or density ofsettlement. Indeed the sign is wrong, and the longer commuters hadsmaller lots. What mattered for site value was not the size or distance ofthe lot, but whether or not it had water and public sewerage service andwhether or not it was located in a prestigious district. When families in agiven income range lived in more valuable housing, it was usually aphysically better structure with better sanitary and water facilities.
The combination of new construction, maintenance, upgrading, andpublic works during 1973-78 was financed by savings, remittances fromVenezuela, self-help, taxes, and subsidies. The share of the top threehousing categories (H3, H4, and H5) rose from less than one-third toone-half, and that of the top two housing categories doubled from 13 to26 percent.
The share of substandard and temporary housing, HO and HI, fellfrom 39 to 30 percent, but this figure still represents some 18,000 dwell-ing units. These were dwellings worth less than 80,000 pesos, mostlyshacks with latrines or no sanitary facilities whatsoever. The SoutheastZone had 48 percent of these dwellings. Clearly much remained to bedone. What could be done, and what had already been accomplishedmust be judged in terms of income levels and what a city could afford.
Projections to 1990
Since dwellings and urban facilities are durable, policies to promoteupgrading or new construction must look at least a dozen years ahead.During those years few dwellings will be demolished, but households willproliferate, incomes will grow, and the two will interact. It is a fairlyplausible assumption that the population of a city like Cartagena willcontinue to grow at no more than 4.4 percent a year, that household in-come will grow 2.4 percent per year, and that the inequality of incomedistribution will remain about the same, that is, the dispersion aroundthe median. Thus the median level of income rises gradually over theyears, but, within an income range of from 20 percent below to 20 per-cent above the median income, the same percentage of households willbe found. In the absence of convincing information to the contrary, suchpersistence must be expected since it is in line with experience elsewhere.
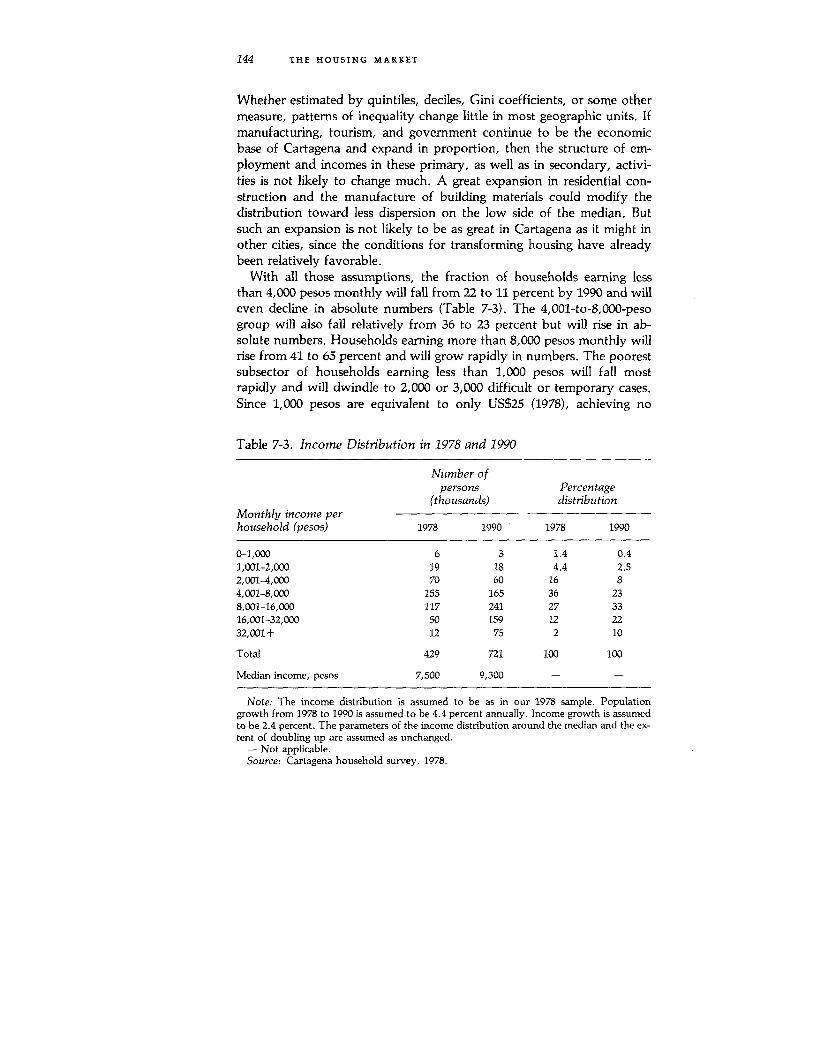
144 THE HOUSING MARKET
Whether estimated by quintiles, deciles, Gini coefficients, or some othermeasure, patterns of inequality change little in most geographic units. Ifmanufacturing, tourism, and government continue to be the economicbase of Cartagena and expand in proportion, then the structure of em-ployment and incomes in these primary, as well as in secondary, activi-ties is not likely to change much. A great expansion in residential con-struction and the manufacture of building materials could modify thedistribution toward less dispersion on the low side of the median. Butsuch an expansion is not likely to be as great in Cartagena as it might inother cities, since the conditions for transforming housing have alreadybeen relatively favorable.
With all those assumptions, the fraction of households earning lessthan 4,000 pesos monthly will fall from 22 to 11 percent by 1990 and willeven decline in absolute numbers (Table 7-3). The 4,001-to-8,000-pesogroup will also fall relatively from 36 to 23 percent but will rise in ab-solute numbers. Households earning more than 8,000 pesos monthly willrise from 41 to 65 percent and will grow rapidly in numbers. The poorestsubsector of households earning less than 1,000 pesos will fall mostrapidly and will dwindle to 2,000 or 3,000 difficult or temporary cases.Since 1,000 pesos are equivalent to only US$25 (1978), achieving no
Table 7-3. Income Distribution in 1978 and 1990
Number ofpersons Percentage
(thousands) distributionMonthly income perhousehold (pesos) 1978 1990 1978 1990
0-1,000 6 3 1.4 0.41,001-2,000 19 18 4.4 2.52,001-4,000 70 60 16 84,001-8,000 155 165 36 238,001-16,000 117 241 27 3316,001-32,000 50 159 12 2232,001+ 12 75 2 10
Total 429 721 100 100
Median income, pesos 7,500 9,300 - -
Note: The income distribution is assumed to be as in our 1978 sample. Populationgrowth from 1978 to 1990 is assumed to be 4.4 percent annually. Income growth is assumedto be 2.4 percent. The parameters of the income distribution around the median and the ex-tent of doubling up are assumed as unchanged.
- Not applicable.Source: Cartagena household survey, 1978.
THE HOUSING MARKET 145
more than that would hardly be reassuring. At the high end of the range,more than 32,000 pesos monthly, the number of households should risesixfold or from 2 to 10 percent of the total. This pattern has been com-mon throughout the world.
Although housing problems have usually grown worse in the course ofeconomic development, the demographic and income pattern justdescribed implies that the worsening has been unnecessary. Housingshould become more manageable as the chance for cross-subsidizationfrom the more-than-8,000-peso group to the less-than-4,000-peso grouprises. The numerical ratio of these two groups goes from about 2:1 to6:1. More or less stable in between these two groups are the 4,001-to-8,000-peso (US$100 to US$200) households that should continue to besupplied with semifinished, expandable, minimal housing.
Building to Meet the Demand
Let us not attempt to predict what will be built, but, rather, to estimatewhat should be built if housing conditions for each income level are to re-main about what they were in 1978. Assume that all F5 (more than32,000 pesos monthly) households will occupy luxury H5 housing. At allother income levels, assume that the index of housing welfare will be 150,meaning half on the diagonal and half of one cell to the right in housingtwice as good. Let us assume, optimistically, that maintenance keeps all1978 H2 to H5 housing from deteriorating and that none needs to bedemolished for nonresidential use. Subtracting this remaining stock fromwhat will be needed in 1990 produces the number of dwellings that haveto be built (Table 7-4): 5,140 H2s, 10,770 H3s, 18,480 H4s, and 19,200H5s. Including infrastructure cost, but not the site, these dwellings wouldeach cost approximately 110,000 pesos, 220,000 pesos, 440,000 pesos,and 920,000 pesos, respectively. The pure site value is assumed to be 8percent. Total construction cost would come to 38,682 million pesosover the twelve-year period, or 3,224 million pesos annually. Thisamount is 7.9 times as much as the 409 million pesos that was spent forlicensed residential construction in 1977 measured in 1978 pesos.
All of these figures are to be understood as orders of magnitude thatcould vary substantially with different assumptions. If licensed construc-tion by commercial contractors were to supply all the dwellings neededto keep housing conditions as they were in 1978 for each income group, itwould have to grow at an annual rate of about 33 percent. Sharply dif-ferent but still plausible assumptions could not bring that figure down bya great deal. Hence, the needed volume of building must continue to
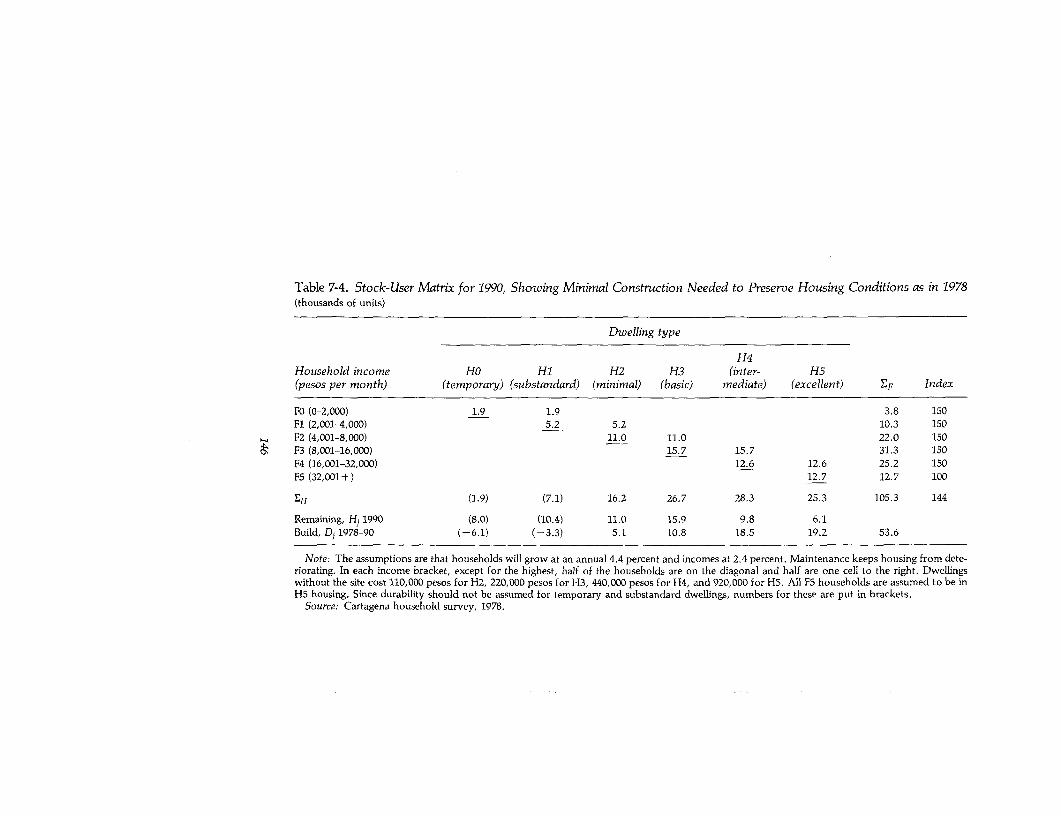
Table 7-4. Stock-User Matrix for 1990, Showing Minimal Construction Needed to Preserve Housing Conditions as in 1978(thousands of units)
Dwelling type
H4Household income HO Hi H2 H3 (inter- H5(pesos per month) (temporary) (substandard) (minimal) (basic) mediate) (excellent) EF Index
FO (0-2,000) 1.9 1.9 3.8 150Fl (2,001-4,000) 5.2 5.2 10.3 150F2 (4,001-8,000) 11.0 11.0 22.0 150F3 (8,001-16,000) 15.7 15.7 31.3 150F4 (16,001-32,000) 12.6 12.6 25.2 150F5 (32,001+) 12.7 12.7 100
EH (1.9) (7.1) 16.2 26.7 28.3 25.3 105.3 144
Remaining, Hj 1990 (8.0) (10.4) 11.0 15.9 9.8 6.1Build, Di 1978-90 (-6.1) (-3.3) 5.1 10.8 18.5 19.2 53.6
Note: The assumptions are that households will grow at an annual 4.4 percent and incomes at 2.4 percent. Maintenance keeps housing from dete-riorating. In each income bracket, except for the highest, half of the households are on the diagonal and half are one cell to the right. Dwellingswithout the site cost 110,000 pesos for H2, 220,000 pesos for H3, 440,000 pesos for H4, and 920,000 for HS. All F5 households are assumed to be inH5 housing. Since durability should not be assumed for temporary and substandard dwellings, numbers for these are put in brackets.
Source: Cartagena household survey, 1978.

THE HOUSING MARKET 147
come, as it has in recent years, to a great extent from upgrading and self-help construction in a variety of ways-some informal, others partlycommercial. Government policy should, therefore, continue to concen-trate on facilitating this process by expanding the infrastructure, bybuilding expandable housing, and by providing credit and guarantees forsmall improvement loans.
The absolute number of households earning less than 4,000 pesosmonthly may hardly change from around 14,000 households. That thisamount will be only 13 percent, not 23 percent, of the total is no consola-tion for those in that bracket. By 1990 some of the original 18,000 HO andHi housing units will have been improved to the level of better housingtypes, and others will have collapsed. Many of the original 14,000households will have moved on to higher income brackets, and otherswill have dissolved through death and perhaps emigration. A strongtendency will exist for new poor households to raise new unsanitary, un-safe shacks. It would not cost much to bring these households up to theH2 level through heavily subsidized sales of sites and materials. The costof 14,000 H2 dwellings would be 1,540 million pesos, less than half ofwhat would otherwise be needed for residential construction in a singleyear, or about 3.8 percent of the total building program. If the poor canbe brought to save half and to pay that much, the cost to others would beless than 2 percent of the building program. If such a small amount is setup as a target, a variety of programs could be the mechanism formobilization. The 25-billion-to-30-billion-peso volume of H4 and H5building could be tapped in part for cross-subsidies, as ICT and the Cajade Vivienda Popular (cvp) of Bogota were already planning to do.
Housing problems in a city like Cartagena cannot be expected to disap-pear in a dozen years. Nevertheless, a normal amount of income growthwill make the problem more manageable in relative terms. The poor willbe a smaller share of a richer community. Their temporary and substan-dard shacks without water or sanitary facilities can be replaced with de-cent minimal housing at a comparatively modest annual cost. A largeamount of self-help and informal upgrading must nevertheless be sought,not only from the poor, but also from households in the middle-incomecategories. Experience in Cartagena shows that under favorable circum-stances people are willing to make that effort.
Notes to Chapter 7
1. Instituto de Credito Territorial, "Censo de Propietarios en la Zona Suroriental, SectorII" (Cartagena, 1976; processed), p. 6.
2. Ibid., p. 55.
148 THE HOUSING MARKET
3. For other areas the indexes were as follows: Urban Sri Lanka (1971), 57: Tunis (1975),81; and Lima (1970-71), 81. For Mexico, indexes were estimated for two years, 1960 and1970: Mexico City, 68, 65; Monterrey, 68, 66; Puebla, 72, 68; Chihuahua, 73, 72; andMorelia, 75, 75. W. Paul Strassmann, "Alternative Housing Strategies for Sri Lanka,"Marga Quarterly Journal, no. 2 (1977), p. 30. Agency for International Development, Of-fice of Housing, Tunisia: Shelter Sector Assessment (Washington, D.C., January 1979), p.49. Jesus Yaiiez Orviz, "Optimal Allocation of Housing Investment in Five Mexican Cities,1960-70, 1970-85," Ph.D. dissertation, Michigan State University, East Lansing, 1976, pp.116-23. The Lima estimate is unpublished work by the author.
4. W. Paul Strassmann, "Housing Priorities in Developing Countries: A PlanningModel," Land Economics (August 1977), pp. 310-27.
5. A Gini coefficient of 1.0 indicates perfect inequality with one recipient having all andthe rest nothing. When all share equally, the Gini is zero. Lower Ginis mean greater equal-ity. Estimates were made with U.S. census data and with data from Marga Institute, Hous-ing in Sri Lanka (Colombo, 1976).
6. Johannes Linn, Cities in the Developing World: Policies for Their Equitable and Effi-cient Growth (New York: Oxford University Press, 1982).
8Lessons from Experience
UNEMPLOYMENT, POVERTY, AND POOR HOUSING CONDITIONS reinforce oneanother in virtually all developing countries. The poor cannot be em-ployed formally to build housing because more than half of the urbanpopulation cannot afford a commercially built dwelling with standardlow-cost specifications. National housing institutions and internationaldonors, including the World Bank, have therefore turned toward pro-viding housing cores, serviced sites, and loans for upgrading substandardhousing as an alternative approach. Dwellings would be built or im-proved by the occupants in a comparatively informal manner. Much evi-dence supports the belief that this strategy has worked well and shouldbe expanded. What is uncertain is the formn that additional supportshould take: whether more resources should be better controlled to avoidwaste, or whether constraints, including rent control, should be removedto generate resources from the building and occupying population. Eitherway, can programs to improve dwellings be self-expanding or replicable?
Review
This study has attempted to explore these issues in the context of theentire urban housing market under the assumption that there is no sepa-rate, insulated housing sector for the poor. The housing market may betoo fractured to justify a sophisticated neoclassical equilibrium model,but still no part can be understood without reference to the whole. In thisstudy specific issues have been illustrated with experience in Cartagena.
Housing needs in terms of mere numbers of units can be derived frompopulation growth and average household size. For Cartagena, a popula-tion growth of from 429,000 to 721,000 between 1978 and 1990 wouldmean the addition of at least 44,000 dwellings. Their minimum quality,however, can only be socially-not physically-determined. Actual stan-dards will depend on income and access to finance, land, and public
149
150 LESSONS FROM EXPERIENCE
utilities. The most likely income distribution is log-normal with a Paretotail; and with a substantial variance, the income elasticity of demand islikely to be close to unity. In Cartagena, median income in 1978 was7,500 pesos (US$192), but log-normality and the Pareto tail brought theaverage up to 9,900 pesos (US$254). The apparent income elasticity ofdemand of observed payments and values was 0.8 for tenants, 0.9 formortgagors, and 1.2 for all owners. Adjustments for market disequilib-rium seemed to bring all three groups closer to unity.
On the supply side, the housing stock was divided into the usual sixcategories: temporary, substandard, minimal, basic, intermediate, andexcellent. In Cartagena, the share of the top three categories rose fromone-third to slightly over one-half of the housing stock during 1973-78.Still only one-third had both piped water and a connection to thesewerage system. Wherever such infrastructure was lacking, self-helpimprovements were considered less worthwhile by owners, and housingvalues were correspondingly lower. The average house was worth275,000 pesos (US$7,000) and had a floor space of 145 square metersdivided among four rooms. In recent years about one-half had been builtby the owner, more or less informally; and one-quarter had been sup-plied by the ICT with highly subsidized credit. Nearly 90 percent ofowners had made improvements on their dwellings, usually three dif-ferent types of changes. On the average they had added 0.8 rooms, anamount that is confirmed by comparing sizes in 1978 with those of the1973 census. Two other types of improvement had also been made, usu-ally within two years of moving in. This high rate of improvement ex-plains why Cartagena owner-occupants generally had better dwellingsthan could be explained on the basis of income alone.
Becoming an owner of a relatively adequate dwelling was easier forpoorer families who were willing to squat and build for themselves or formiddle-income families who had access to subsidized credit than forricher families. Hence the average monthly income of tenants, 12,800pesos, was 36 percent above the 9,500 pesos of owners without mort-gages. Tenants spent 18 percent of their income on rent, but for everytwo households that lived in housing they considered appropriate fortheir income level, three households lived in less adequate housing. Sincetenants were willing to pay 50 percent more for their current premises ifnecessary, and still more for something better, their inadequate housingmay have been, as in so many other countries, the effect of rent control.Making a tenant move by selling or reoccupying premises oneself tem-porarily was the only sure way for an owner to raise rent in Colombia.This cumbersome technique and others were used so often that tenantsmoved twice as much as owners. Only 16 percent of tenants had lived
LESSONS FROM EXPERIENCE 151
more than five years at a site, compared with 58 percent of others. Inter-views with a small subsample of landlords suggested that they madeabout as many different types of changes as owner-occupants whenevertheir property was vacant. Improved housing supplies and more con-struction employment would result from removing constraints onlandlords of all types.
For new housing, construction costs in 1978 ranged from 2,000 pesos(US$51) per square meter for minimal housing to 3,000 pesos (US$77) persquare meter for intermediate housing, not including the cost of the site,site improvement, development, and sales promotion. Site costs variedfrom 35,000 to 70,000 pesos and amounted to 20 percent of the costs ofintermediate housing and 40 percent of minimal housing. Without sub-sidies, the most minimal 20-square-meter unfinished housing could havebeen sold for perhaps 80,000 pesos (US$2,000). If monthly incomes of4,000 pesos were considered the minimum for financing such an amount,78 percent of Cartagena households could have afforded this quality ofnew house or better. If costs proved to be one-third higher, only 67 per-cent of households could afford that much. The remainder had to dependon self-help, upgrading, or filtering.
Lack of reliable data at the national, urban, enterprise, and householdlevel made it difficult to assess the effects of alternative housing strategieson employment. One source, however, estimated that on-site employ-ment to build single-family housing required eighteen man-hours persquare meter and 29 percent of construction costs. Another made theshare 31.5 percent. A third study put the share at only 22 percent andconcluded that an 80-square-meter dwelling would generate 1.5 work-years of work on the site. The employment share is less partly becauselarger and better housing is less labor-intensive. For any type, about halfthe work would be unskilled.
Small builders in residential construction had subcontractors hiremore than two-thirds of the workers used and did not really know howmany masons, helpers, or diggers were employed. Nor did self-helpbuilders keep track of how long each family member worked on what.At least it can be stated that the labor intensity of this sector had beenpreserved, and that its costs had risen at a rate only half that of the costof living. All this had been accomplished without remarkable innova-tions. Experiments with sulfur bonding, however, suggest that construc-tion costs could be dramatically reduced by one-quarter if the price ofsulfur stays low and workers learn the technique.
In Appendix D, conditions in Cartagena are illustrated with cross-tab-ulations of households and housing, called stock-user matrixes. Theseshow the characteristics of household-dwelling combinations for six in-

152 LESSONS FROM EXPERIENCE
come ranges and six rent or value ranges. In Chapter 7 rental and valuematrixes were combined in a single set and were projected to 1990. Suchmatrixes have shown, first, the share of the population in each cell and,second, other characteristics of the households and dwellings. If the in-come and value categories have been set up to reflect the income elastic-ity of the demand for housing, the combinations on the diagonal can beused as the standard for housing welfare, adjusted for relative economiccapacity. Thus we found that, because of upgrading, owner-occupantswere unusually well off-and tenants not so well. Projections of theseconditions under alternative assumptions would be a worthwhile subjectof future research.
Households in different cells varied greatly in size. In general, tenantshad smaller households. For dwellings we reported floor space, numberof rooms, number of rooms added, adequacy of materials, type of watersource, type of plumbing facility, and the like. Thus one can see whydwellings in a certain cell happened to be in that value range and whattype of household tended to prefer these characteristics. Some of theresults were further tested with multiple regressions and logit analysis.Among other things, a strong association was found between indoorpiped water and home improvement. More adults in a household raisedthe number of rooms and floor space occupied but reduced the value persquare meter. Household size was negatively associated with both valueand rent, but not at a highly significant level. By life cycle, new and oldhouseholds tended to spend more on housing than those with many chil-dren, at least among owner-occupants.
In most cities in developing countries, residential construction lagsbehind other output, income, and demand, with the result that rents anddwelling prices rise more than inflation. In Cartagena during 1973-78 thereverse appears to have been true: dwelling prices rose less than others,and construction (especially informal upgrading) expanded to such anextent that the real value of the stock rose for the average household. TheGini coefficient showed more equality in housing consumption than in-come, and the stock-user index of housing quality rose from about 93 to157. If this level is to be retained to 1990, the city must amplify suchpolicies as regularizing land tenure, extending utilities networks, buildingsmall but expandable dwellings or sanitary cores, and selling buildingmaterials with small loans or matching grants. Rental of rooms shouldalso be encouraged as a way to raise capital and expand the housingstock.
What has happened in Cartagena on a large scale has been observedelsewhere for individual projects. Madavo, Haldane, and Cameron re-viewed serviced-site and slum upgrading projects assisted by the WorldBank and concluded that:
LESSONS FROM EXPERIENCE 153
Houses are being built and built quickly. Once lots are serviced andallocated, virtually all families entitled to take out materials loans doso and usually take out the full amounts they are entitled to ...
Participants also appear to build their houses more quickly whenleft to organize their own construction efforts and to choose the mix ofself help, group or mutual help, and hiring artisan contractors fromthe informal sector... The use of small contractors in the projects hasbeen one unanticipated but important result of site and services andupgrading...
Another important finding has been that the houses coming up onsite in almost all projects are very substantial structures, more sub-stantial than anticipated .... Some of them can mobilize substantialsavings of their own, not revealed by their monthly income flows, orof family and friends. It also seems that most families accept a muchtighter budget than normal during the short period of construc-tion.... Individual households appear to be carrying on improve-ments beyond the project requirements. In Jamaica, roughly 70 per-cent of the houses provided under the project are being extended. InZambia and Botswana, where the reticulation supplying the stand-pipes was planned to provide up to 50 percent of the households withindividual connections, many residents have hooked up their own in-dividual connections. 1
Surveying the same experience, Linn reported that the important con-straints on low-income shelter construction were building codes, zoningrequirements, rent control, lack of collateral for loans, capital rationingdue to submarket interest rates, and insufficient accessible serviced land.Actual construction could be carried out by families and hired artisans ata cost of from 20 to 50 percent below that of similar work using normalgovernment contracting methods, as reported for Manila:
In the case of the first urban development project in Manila financedby the World Bank, it was found that building materials loans contri-buted significantly to the stimulation of private housing investment.In the same project, it was furthermore found that with regularizationof land titles and basic services provision considerable amounts of in-formal capital (from relatives, friends, and so forth) became availableto finance land acquisition charges and shelter construction costs.2
Finally, a number of issues tumed up for further exploration. For ex-ample, 17 percent of owner-occupied households were headed by women.Average value of their dwellings was only 216,000 pesos (an H3 basic),less than half that of H4 intermediate dwellings headed by men andworth an average of 458,000 pesos. Were the female-headed households

154 LESSONS FROM EXPERIENCE
less able to organize improvements, and are they therefore good can-didates for assistance? Or were they also in a different income and life cy-cle stage? Absence of a male head of household generally removes onesource of income and presumably lowers the total. Households with onlyone source of income occupied housing worth an average of 349,000pesos, whereas those with multiple sources occupied housing worth 48percent more or 516,000 pesos.
Obstacles to Transformation
What inhibits the transformation of housing for and by the poor?Their poverty is the main factor, but to build for oneself is to become lesspoor, and growth can begin with a few more concrete blocks and pipeshere and there. What factors besides poverty frustrate expansion?
To begin, the poor build less and less well than they could because ofignorance and fear that is often well founded. Ignorance results in lessbuilding because of excessive costs due to improper designs. Architectssay that plumbing could be arranged more conveniently, that founda-tions could be simpler, and that prestressed beams could save ceilingcosts. Unfortunately, where building has to be clandestine, official chan-nels for advice on better designs are not likely to be set up or used.Knowledge of and access to conventional materials does not seem to be aproblem. Technological difficulties are minor.
More important is the fear of losing one's investment. The catalytic ef-fects of giving squatters title to their land, if at all possible, are now wellknown, and programs to eradicate slums have become anachronisticthroughout the world. Nowadays the poor are more afraid of losing theirinvestment if they are unable to make regular payments on their debts.One does not borrow for an improvement like an added room if bad luckon the job can jeopardize ownership of an entire house. Even if the equityis repaid by the creditors, fears are that a similar house without the im-provement cannot be bought with that amount. A flexible, sensitive, andgenerous insurance system is needed to prevent unnecessary hardshipfrom default.
Opportunities are also missed not only because fears are generated,but because hope is not aroused. Access to water and public seweragesystems fosters confidence in the future of a district and in the yield fromhousing improvements. It therefore inspires upgrading activities. If house-holds doubt that their neighborhoods will shortly or ever be included inutility network expansion, the transformation of housing through self-help will be discouraged. Public utility networks thus generate benefits
LESSONS FROM EXPERIENCE 155
not only from water and waste disposal, but from externalities in theform of other construction and employment. Delays in network expan-sion have a cost.
Another fear of the poor is that investment in improvements may belost because their structure may violate some regulation. Since the poordo not like to build physically unsafe and unsanitary buildings, the regu-lations that threaten them are likely to have other objectives. One ofthese is that new buildings must come up to minimum standards of spaceand quality in other respects. At this point conflict arises between thewishes of the poor and those of groups in power with whom they mustdeal.
That elite groups find slums unaesthetic and would rather see some-thing else is well known, possibly understandable, but this preference isno longer a threat to the shelter of the poor, as mentioned above. A morereal threat is an attitude that may be called "gap mentality." Those withthis attitude feel that there is a gap between decent and less-than-decenthousing, and that this gap can only be narrowed by progressively build-ing more and more decent housing; anything less will not help to closethe gap. Such an attitude often has little relation to what a country canafford in macroeconomic and demographic terms. As economic sophisti-cation spreads among those in public authority, gap mentality vanishes.
Closely related, however, is paternalism, the attitude that the poor donot really know what is good for them, and that priorities must be estab-lished for them through regulations. Each regulation of that type may in-hibit the flow of credit, the generation of savings, the speed of grantingpermits, and will generally get in the way of what would otherwise behappening. No one treats the clothing of the poor that way, however,and they manage to sew and tailor for themselves quite satisfactorily.
Finally, there is outright suspicion of the poor-that they must be care-fully supervised and controlled or they will do evil things like exploitingone another. They may build housing to rent to each other at excessiveprices. That these prices reflect the shortage of housing and may well in-cite a supply response is often ignored. After all, the government agen-cies are doing the best they can to supply housing. Recipients of govern-ment housing at bargain terms, according to this view, should not benefitby subdividing their dwellings to let other families share space or to oper-ate a workshop or store. Was not the housing program set up to bringhousing prices down and to eliminate overcrowding? One can see thatsuspicion easily merges with gap mentality. Whenever market pressuresare such that some poor nevertheless remodel their houses to have a shopor to take in tenants, this activity is forbidden and has to be undertakenin a clandestine fashion. Naturally there will be less of it as a result, and
156 LESSONS FROM EXPERIENCE
it will receive no official support in the form of credit and technical assis-tance. Some public housing may even be deliberately designed so that ex-pansion and subdivision for shops and tenants is difficult. Such policiesshould be reversed.
Housing Prospects
The prospects for housing transformation are different for the poor,the well-off, and those in between. All can benefit from better incentivesfor building, but for the poor these incentives should include a carefullydesigned transfer of resources from the top group. The middle group canbe fully self-supporting. The next sections will give the reasons.
For the Poor
A fully self-supporting, replicable urban program of any type is unreal-istic for those with an income of less than 4,000 pesos (US$100) monthly.The humanitarian gains and economic externalities from clean water andsafely disposed sewerage are such, however, that subsidies for these ser-vices are fully justified. Convenient access roads and adequate drainageare also investments that probably raise productivity in proportion tocosts, or more. A program of well-designed serviced sites is thereforelogical. As mentioned above, programs should not mean large-scale de-struction of existing assets, although these may seem like slums to out-siders. Now almost everyone knows that.
Whatever savings can be mobilized from this poor sector andwhatever supporting labor can be generated are a gain for the program.To insist on mobilizing them to a fully self-financing level, however,amounts to giving up. Assistance to the poor should have realistic goalsand should be justified in the context of the entire urban program and itspossibilities for cross-subsidization. If small loans can be extended to thepoor and conveniently collected through neighborhood institutions, fine.But if not, a system of matching grants against prior savings is worth atry. If the grants are paid in the form of building materials, it amounts toselling materials at a loss, hardly a replicable program. Nevertheless, it isworthwhile in the total urban context. Subsidized sales can stimulatesavings better at that level than can subsidized credit, and they bothamount to the same thing in principle. The difference is simply the ratioof subsidy to the recipient's contribution-which, inevitably, would behigher for the poor. The main problem is to avoid fraud by making surethat materials bought are indeed incorporated in the purchaser's dwell-ing. If not, that household should receive no more bargain sales.

LESSONS FROM EXPERIENCE 157
A further gain would arise if the recipient of subsidized materials saleswere required to help produce and distribute the materials as well aswork on urban infrastructure in his own neighborhood. The actual con-tributions would still not make the total program financially viable in anarrow sense. Justification of the plan depends on its external effects, andamong these, the educational effects of participating responsibly must beincluded, although they are hardly quantifiable. ICT has had such pro-grams jointly with SENA, the vocational training agency, in Combeimanear Ibague, Tolima, and in Venadillo, Tolima, and that experienceshould be studied carefully. The training of local leaders through the ex-tensive Acci6n Comunal system is also a good example worth expand-ing. In Esperanza, district 7, a communal materials shop was beingplanned in 1978 with the idea of paying workers in blocks, not money. Aproblem was finding someone with collateral to back the credit for theinitial installation. International support could take the form of under-writing the probable losses of an insurance or guarantee system, such asthe one organized for Bogoti.
All programs of subsidies are rightly viewed with skepticism. But tworeassuring elements exist. One is that within a dozen years, in countriesthat have reached the income level of Colombia, the target population isvery likely to decrease. In Cartagena it should fall from around 95,000 to81,000 or from 22 to 11 percent of the population. The other elementcomes from our survey: the astonishing zeal with which poor householdsimprove housing. One grandmother said "rellenar o comer" (to fill in earthor to eat) was almost a daily decision that often went in favor of rellenar.Some observers have even feared that the poor build at the expense oftheir health, but that seems a little extreme: building as the "opium of thepeople."3
For the Middle-Income Group
The large group with incomes of from 4,001 to 8,000 (1978) pesos canafford minimal semifinished housing without subsidies. At the low endof the range, households seem willing to pay from 801 to 1,000 (1978)pesos monthly for housing and simply need terms and maturities thatwill bring a dwelling worth from 80,001 to 100,000 pesos within range-not an unreasonable condition. Since such a dwelling is not likely to ex-ceed 20 square meters plus kitchen and washroom, it must be expand-able. Payments must rise annually at as close to the rate of inflation ofbuilding costs as possible; and for families who cannot meet that ratebecause of some misfortune, the mortgage maturity must be extended.On the same terms, three-bedroom, semifinished dwellings can be sold

158 LESSONS FROM EXPERIENCE
for 160,000 pesos to households at the top of the income range. Givenpopulation growth, transport costs, and the need for increased density,the introduction of low-rise multifamily housing is farsighted. But multi-story housing must be expandable and improvable. Once architectsmade their reputation by including everything in their plans; now theyneed to be able to leave things out in an ingenious way. A few models al-ready exist in ICT housing at Rio Negro near Medellin. If housing poli-cies in Cartagena had not been relatively successful in stimulatingupgrading in the past at this level, not as many families would be indwellings above the diagonal. As the city grows, that activity must beencouraged in new ways.
For the Upper-Income Group
Since households with incomes below 4,000 pesos need subsidies, andsince those with incomes between 4,001 and 8,000 pesos can only be self-sustaining, the households earning more than 8,000 pesos must providethe surplus capital needed. They could do so in a general way throughhigher taxes, or they could have that contribution linked to the acquisi-tion of better housing. Much can be said about the theoretical welfare ad-vantages of unlinked taxation. In practice, tax collections or induced sav-ings can be generated most easily when linked to benefits or permitsdisbursed by collecting institutions. Currently, urban housing policies inColombia and other countries do the reverse and subsidize upper-incomefamilies by letting them acquire capital gains from general urban im-provement, and by giving them subsidized loans. About half of the ICT
mortgagors in our sample were at this high income level and were receiv-ing public loans at negative real interest rates. The fact that they had notbeen in that high range when the mortgage was signed proves that theirpayments could have risen faster than the 5 percent annual rate. Theyshould have taken out price-indexed mortgages with the Banco CentralHipotecario or one of the Corporaciones de Vivienda.
The advantage of multiple lending systems is competition; the disad-vantage is that surpluses from institutions for one tier are not readilytransferred to those for another. This barrier was to be avoided by pro-grams like the icT redevelopment of Chambacu for those with incomesgreater than 25,000 monthly, by charging a 50 percent markup. Presum-ably, enough families can be found to pay that much for such a conve-nient location and ingenious designs. If several lending agencies covermost of the range of incomes, then all can be involved in cross-subsidyprograms for the poor and can compete with one another. In Bogota, icT
LESSONS FROM EXPERIENCE 159
and cvp are already competing and learning from one another. Both do alittle cross-subsidizing.
But if upper-income groups are to pay more, perhaps they should alsobe granted some conveniences in exchange for their contributions.Perhaps finance for selling used housing should be made more easilyavailable, so that they would have the liquidity to seek the new housingthat generates the surpluses. Rent control should be abandoned. It de-stroys maintenance incentives and therefore much of the old housingstock. In Cartagena it absurdly forces landlords to pretend to reoccupypremises to evict recalcitrant tenants. If the rich could buy and sell andmove around as their needs changed, they could benefit more from thepart of the housing stock that is theirs. They could, of course, be chargedfor the privilege. They should pay a bit more than the full cost of sites,roads, and services.
Completing the Circle
After we had talked to all the officials, read their documents, and re-viewed our own sample of interviews of households, all of the ideas ex-pressed above gradually emerged. To check them one more time, we re-tumed to Fredonia, the poorest and the most distant part of theSoutheast Zone, where Cafno Calicanto and the last road merged into aswamp of sewerage. The cab driver took us as far as he could go and saidbe careful and not stay too long. Municipal officials had told us that onlytwo former Franciscan nuns and university volunteers were helping thissector, and that it was simply beyond their own range and resources.They had enough problems elsewhere. But we had begun our interviewshere, and so it seemed appropriate to finish here, to see it now in a dif-ferent perspective, and to compare ideas with the former Franciscans,Sister Amparo and Cruz Elena Ramirez.
No, said Sister Amparo, a system of loans would not work here. Peo-ple had other priorities, some worthwhile, others not. They would notrepay loans, even small ones on the grounds that "El gobierno o el obispotiene plata. Nosotros somos pobres." (The government or the bishophave money. We are poor.) Matching prior savings for building materi-als with an equivalent amount had possibilities. Some communal workon roads and ditches might even be induced with such an incentive.Without incentives some people would always shirk their duties, and therest would become demoralized. Nothing could get done that way. If itcould, these paths would not be such a morass.
160 LESSONS FROM EXPERIENCE
We walked past a makeshift school with bamboo walls that provided astrip of shade. In it a line of small boys did calisthenics under the direc-tion of a college student. Sister Amparo showed us where a GermanCatholic charity was helping to build a new school on the newest islandsalvaged from the marsh. Construction lagged because clean water formaking concrete blocks had to be trucked in on a little causeway fi-nanced by the Germans. Anyway, Fredonia had not been totally ne-glected by the outside world. Sister Amparo hoped that a playground forchildren would rise out in the marsh where the herons now stalkedamong the mangroves.
As we left the area, a young woman came to us, and asked if our clip-boards meant we were some kind of officials taking reports. A drunkenneighbor had broken down the bamboo fence between their yards andhad beaten her. Now he was in there with her children and would notleave. No one was at the small police station on Calle 32B. We showedher the house where she could find Sister Amparo.
Notes to Chapter 8
1. Callisto Madavo, Donna Haldane, and Sally Cameron, "Site and Services andUpgrading: A Review of World-Bank-Assisted Projects," Urban Projects Department(Washington, D.C.: World Bank, January 1978; processed), pp. 15-18.
2. Johannes Linn, Cities in the Developing World: Policies for Their Equitable and Effi-cient Growth (New York: Oxford University Press, 1982).
3. El Tiempo, August 19, 1978, quotes the architect Nicolas Rueda Garcia as insisting ona distinction between the capacity to save and the capacity for self-deprivation. Accordingto him much autoconstruction comes "with a sacrifice of vital necessities."
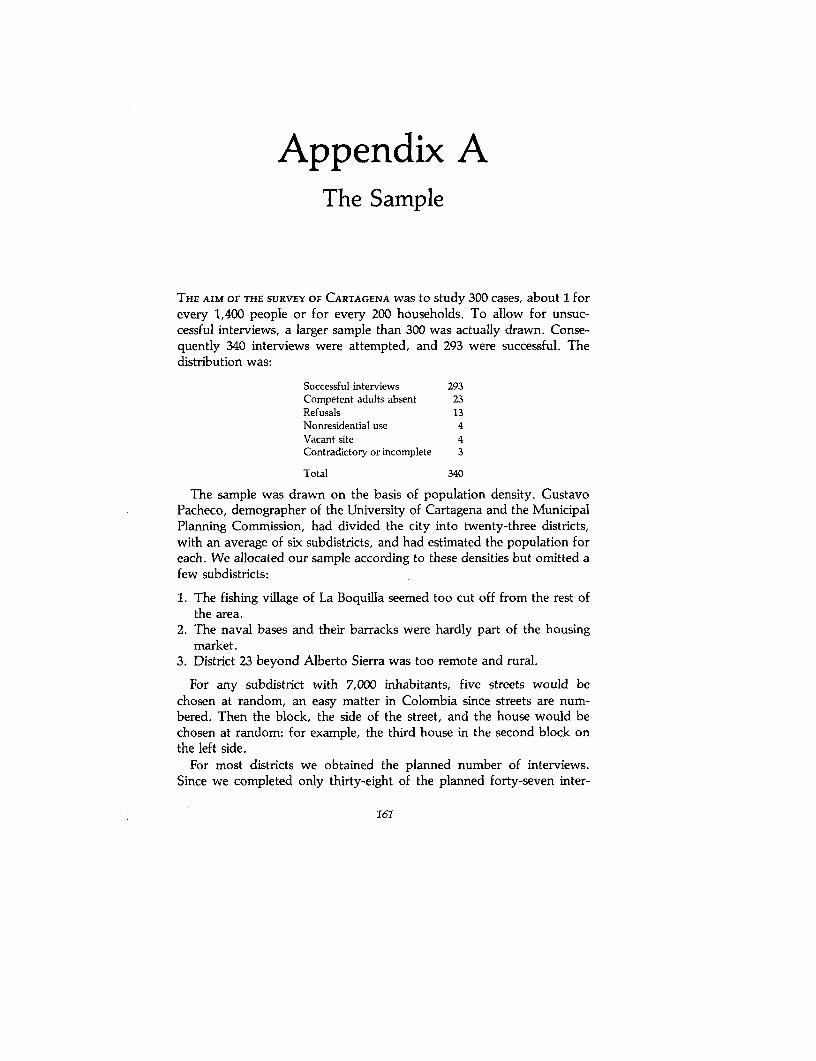
Appendix AThe Sample
THE AIM OF THE SURVEY OF CARTAGENA was to study 300 cases, about 1 forevery 1,400 people or for every 200 households. To allow for unsuc-cessful interviews, a larger sample than 300 was actually drawn. Conse-quently 340 interviews were attempted, and 293 were successful. Thedistribution was:
Successful interviews 293Competent adults absent 23Refusals 13Nonresidential use 4Vacant site 4Contradictory or incomplete 3
Total 340
The sample was drawn on the basis of population density. GustavoPacheco, demographer of the University of Cartagena and the MunicipalPlanning Commission, had divided the city into twenty-three districts,with an average of six subdistricts, and had estimated the population foreach. We allocated our sample according to these densities but omitted afew subdistricts:
1. The fishing village of La Boquilla seemed too cut off from the rest ofthe area.
2. The naval bases and their barracks were hardly part of the housingmarket.
3. District 23 beyond Alberto Sierra was too remote and rural.
For any subdistrict with 7,000 inhabitants, five streets would bechosen at random, an easy matter in Colombia since streets are num-bered. Then the block, the side of the street, and the house would bechosen at random: for example, the third house in the second block onthe left side.
For most districts we obtained the planned number of interviews.Since we completed only thirty-eight of the planned forty-seven inter-
161

162 APPENDIXES
views in Bocagrande, Centro, and Manga (districts 1, 2, 6), high-incomehouseholds are underrepresented in the sample. Twenty-one of thefailures occurred here. Since we oversampled the area somewhat, expect-ing nonresponses, the net loss was only nine.
We also expected lack of cooperation in Esperanza, district 7, becausethis first sectQr in the Southeast Zone had been studied often but hadreceived little help, causing cynicism and hostility toward any inter-views. Thirty-nine interviews were attempted, and thirty-one were com-pleted, so that we had four more than the twenty-seven that would havebeen in proportion to population. After that experience, we limited ourinterviews to the maximum number needed for any subsector, but madesure that attempts were evenly distributed within the area. Nevertheless,we were two interviews short in district 13 where the ICT development ofLos Calamares was still uninhabited.
The Preliminary Questionnaire
Although the questionnaire had been developed as carefully as possi-ble, using models of similar efforts and showing the results to colleaguesfor revision, actual trial led to surprises. No answers were possible at allin the first modest dwelling sampled in the Esperanza quarter of theSoutheast Zone. A grandmother who was taking care of three childrenwas amiable but said, frankly, she had no idea how much anything costor what was planned. She did not even know the whereabouts of herson, the father of the children. The four of them were supported byremittances from the mother who worked as a maid in Caracas,Venezuela.
The head of the second household nearby was another grandmotherwho worked as a maid herself in the fashionable Bocagrande section,receiving meals and 1,800 pesos monthly. Her house was a rather large(170 square meter) concrete block single-story structure without win-dows, but it opened toward a 35-square-meter courtyard in back thatwas surrounded by an assortment of lumber. This lumber had made uptwo walls of the shack in which the family had lived for a dozen yearsuntil the father died. With the retirement pay that the mother received athis death, the family bought concrete blocks and enlarged the shack. Thetwo walls that would now have been an interior division were disman-tled and used for the backyard fence. A new latrine was installed andequipped with a porcelain toilet bowl. But the house still lacked sewerageconnections, and water was bought from a neighbor. Apart from themother, who was forty-five years old, four of her children lived in the
THE SAMPLE 163
house, including an unmarried daughter with three children of her own.Fumiture consisted of straw mats for sleeping and boxes for sitting. Thefloor was dirt. The only decoration was a sign, "Viva el Socialismo." Fewof the answers resembled our precoded ones, but after more trials, weknew some revisions that would be helpful.
The Final Questionnaire
The questions are divided into thirteen groups by topics: A. GeneralInformation, B. The Dwelling, C. Additional Rooms, D. The Kitchen, E.Water, F. Sanitary Facilities, G. General Questions about Dwelling Im-provements, H. Finances, I. Moves, J. The Household, K. The Head ofthe Household and Employment, L. Transport, and M. Income. The se-quence was determined by interviewing effectiveness rather than by logicin subsequent analysis. If respondents are told that information aboutimprovements is sought, one had better get around to that subjectquickly, as soon as the occupant and owner have been identified and theprincipal characteristics of the structure have been noted. Five sections(C-G) cover improvements and their cost. The section on finances (H)goes back to considering the dwelling as a whole. Value, monthly pay-ments, and household income (M) remain the basic coordinates of anyeconomic analysis of housing. But income, as the most touchy matter, isbest left for last.
Value and income belong in some context. Neighborhood effects andlocation are explored in the sections on moves and transport (1,L). In be-tween is the demographic section about the household (J) and the sectionabout employment, unemployment, age, education, and so forth (K). Ifincomes and costs do not explain behavior, knowing these characteristicsmay be helpful.
The basic cross-tabulation involves monthly income (question 100)and monthly rent (question 42) or current market value of the dwelling(question 54). Other information either modifies this relationship or is re-lated separately to either income or value. A closer examination of thequestionnaire and its interpretation should, therefore, begin with ques-tions 100 and 54/42.
In only three cases out of 296 were interviews rejected from the samplebecause of unreliable income information. The rejects all were in thehighest income category and lived in the better residential districts. Inone case the nominal head of the household was a sixteen-year-old girlwho had been sent to study in Cartagena by her rich physician-rancherfather. Four brothers and sisters and two servants shared the 3-million-

164 APPENDIXES
peso (US$77,000) dwelling and received a monthly allowance of 20,000pesos, but upkeep and improvement of the dwelling did not really comeout of that. In two other cases income levels were given that were unreal-istically low and inconsistent with other answers. Five other high-incomehouseholds simply declined to be interviewed. There were eight other re-fusals in the rest of the city. Still other failures occurred, as noted above,simply because no one was present or because the address turned out tobe nonresidential, including one house of prostitution.
In some cases respondents preferred to limit themselves to indicatingthe range in which their income fell in question 99. In such cases the mid-point was inserted in question 100. For the category of more than 16,000pesos, 27,000 pesos was used since that was the typical income given byrespondents who did answer. Only one household fell in the category ofless than 700 pesos. Question 97 about the different sources of incomewas supposed to make the respondents think of sources other than sala-ries. Detailed information on each source would not have been forth-coming from many respondents and would have been very time-consum-ing to explore and to straighten out. The relative importance is thereforeassessed only by question 98, which asks if any source accounted formore than half of the household income. Workers who received meals onthe job usually came close to agreeing with the 1,000-peso estimate thatwas used. Employers and government officials thought a substantial var-iance around 1,000 pesos existed, but roughly an equal number thoughtit was too high or too low. The figure does put the 1,000-peso income ofdomestic workers on a par with the 2,000-peso wages of unskilled work-ers. Imputed income from owner-occupied housing was not counted inquestion 100.
Rental information (question 42) was checked with a small sample oflandlords (see Chapter 6) and seems comparatively devoid of problems.However, tenants were not interested in the market value of their dwell-ing (54). It was important to note how long they had been on thepremises (4) and if their rent had risen (43) in spite of rent control. Utilitycharges are paid by the tenant, not the landlord. Sixty-eight dwellings,about one-fourth of the sample, were rented and had to be analyzedseparately. The tenure breakdown (question 5) is:
Type of tenure Number of cases PercentOwner-occupied, with a mortgage 53 18.1Owner-occupied, no mortgage 154 52.6Rented 65 22.1Granted, lent without charge, and so
forth 21 7.2
Total 293 100.0

THE SAMPLE 165
Analysis
Apart from household income, the current market value of a dwellingis the principal characteristic around which the analysis is built for 228cases or 77 percent of the sample. Value can be obtained either by usingthe owner's estimate of the current situation or by applying a price indexto past expenditures. In a high share of cases the two approaches gavealmost identical results. If anything, respondents were better at apprais-ing the current market (54) than at remembering past construction costsand values. In a few cases the construction cost index for Barranquilla-Cartagena did give a substantially higher current value than the owner'sestimate. We then checked whether age and lack of education or otherfactors might have impaired the respondent's understanding of ac-celerating inflation. Alternatively, the dwelling might be unimproved ordeteriorated (40) and unsuitable for the neighborhood (64). In clear casesof underestimation, the cost-indexed amount was substituted in question54. Apparent overestimates were far more unusual and were usuallyrelated to a change in the value of the site, for example, in the neighbor-hood to which the municipal market, Bazurto, was transferred.
The first objective of the interviews, therefore, was to assess inmonetary terms the current household-dwelling combinations in Car-tagena. Next comes association of households by income category withother household characteristics, such as family size, number of children,changes in family size, age and education of the family head, number ofworkers, and type of occupation, sections J and K.
Similarly the value or monthly rent of the structure can be related toits age, manner of construction, area, basic materials, number of rooms,type of kitchen, and plumbing facilities, sections A-F.
At a more complex level, combinations of size and value in structurescan be related to combinations of income and family size in households.Both of these can be separated further by district in Cartagena. Variousother permutations are also possible and will not be listed here.
Most important to this study, however, is explaining the types of im-provements in a dwelling-those already carried out, those planned, andthose needed but beyond the capacity of the occupants. In cross-tabulations each of these changes can be related to dwelling type byvalue, type of household by income level, and combinations of incomeand value. The number of combinations rises to 100 if there are tencategories of income and ten of value, as in questions 47 and 99. On theone hand, there is the average number and cost of changes that improv-ing households undertake; and, on the other, there is the percentage of
166 APPENDIXES
all households that undertake some kind of improvement. The averageactual change for the total population (A) is equal to the average changeamong improvers (C) times their percentage, a kind of probability (p).A = p C.
Most of the statistical analysis, however, has been concerned withsimply determining the characteristics, question by question, of thehousing stock and the occupants in various subgroups. Regressions canbe used to explain the value of changes, the rent levels, total value, andincome. Shares of rent or mortgage payments in income can be found (42or 46 divided by 100). Income elasticities of demand can also beestimated (42, 46, or 54 and 100) for families of varying sizes and stagesin the life cycle (section J).
In a similar manner, neighborhood and locational elements (sections Iand L) can be related to housing values and income levels. One can ex-pect that in a medium-size but rapidly growing city like Cartagena thesehave not had overriding importance. Far more important has been theuneven and partial availability of water and a public sewerage system.Correction of these deficiencies does not, however, depend on householdbehavior and, as discussed in the text, seems to be fairly well under waywith the help of various national and international loans.
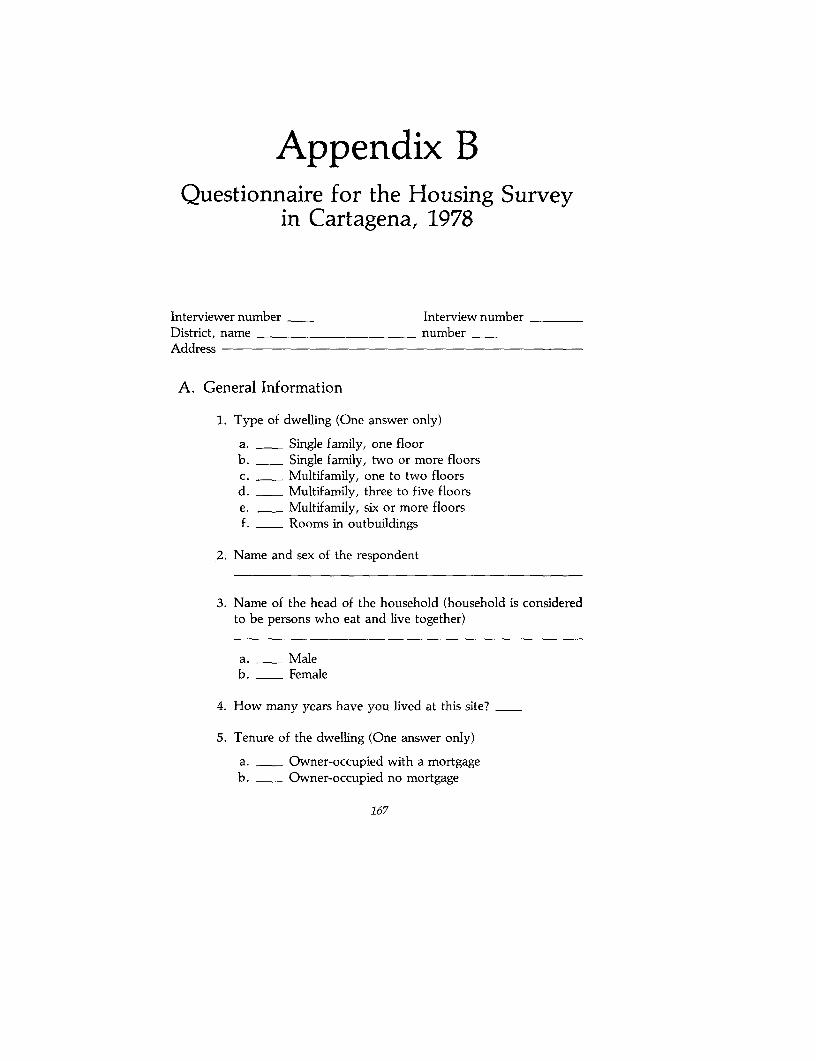
Appendix BQuestionnaire for the Housing Survey
in Cartagena, 1978
Interviewer number Interview numberDistrict, name numberAddress
A. General Information
1. Type of dwelling (One answer only)
a. Single family, one floorb. - Single family, two or more floorsc. Multifamily, one to two floorsd. Multifamily, three to five floorse. Multifamily, six or more floorsf. - Rooms in outbuildings
2. Name and sex of the respondent
3. Name of the head of the household (household is consideredto be persons who eat and live together)
a. Maleb. Female
4. How many years have you lived at this site?
5. Tenure of the dwelling (One answer only)
a. Owner-occupied with a mortgageb. - Owner-occupied no mortgage
167

168 APPENDIXES
c. Rentedd. _ Granted or lent without chargee. Family propertyf. Other (explain)
6. If the house is not yours, what is the name and address of theowner or rental agency?
B. The Dwelling
7. How many years ago was this dwelling built?
8. Who built this dwelling? (One answer only)
a. _ The household; self-helpb. - Workers paid by the head of the household; a direct
arrangementc. A contractor; using one of his own plans chosen by
the head of the householdd. A contractor; using a plan designed for the head of
the householde. A private developer; this is the first occupantf.- icI designed and builtg. Mutual aid or communal efforth. Dwelling not new; another household had
previously occupied iti. Other (explain)
9. Area of the lot:___ meters by - meters = - square meters
10. Floor space:___ meters by meters = - square meters
11. Wall materials (If several, choose the principal material)
a. Reinforced concreteb. Concrete blocksc. Clay bricks (tiles)d. Woode. _ Adobe
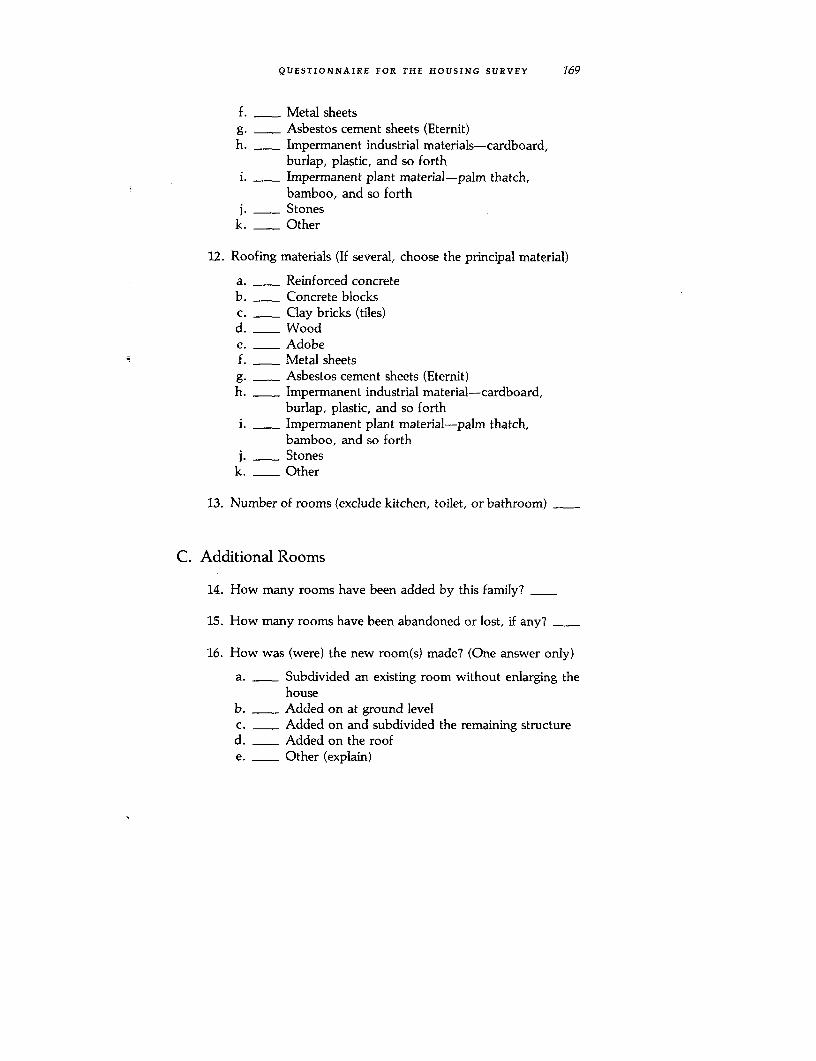
QUESTIONNAIRE FOR THE HOUSING SURVEY 169
f. Metal sheetsg. Asbestos cement sheets (Etemit)h. Impermanent industrial materials-cardboard,
burlap, plastic, and so forthi. Impermanent plant material-palm thatch,
bamboo, and so forthj. Stones
k. Other
12. Roofing materials (If several, choose the principal material)
a. Reinforced concreteb. Concrete blocksc. Clay bricks (tiles)d. Woode. Adobef. Metal sheetsg. Asbestos cement sheets (Etemit)h. Impermanent industrial material-cardboard,
burlap, plastic, and so forthi. Impermanent plant material-palm thatch,
bamboo, and so forthj.__ Stones
k. _ Other
13. Number of rooms (exclude kitchen, toilet, or bathroom)
C. Additional Rooms
14. How many rooms have been added by this family?
15. How many rooms have been abandoned or lost, if any?
16. How was (were) the new room(s) made? (One answer only)
a. - Subdivided an existing room without enlarging thehouse
b. - Added on at ground levelc. - Added on and subdivided the remaining structured. Added on the roofe. Other (explain)

170 APPENDIXES
17. How many years ago was the room built?
18. How many pesos did the room(s) cost?
19. How many days of work did it take?
20. Why did you add the room(s)?
a. Had additional childrenb. Gained additional relativesc. Could afford more space; had higher incomed. Wanted to earn rent from lodgerse. Wanted a workshop or storef. Wanted a long-term investmentg. Other (explain)
D. The Kitchen
21. With what type of fuel do you cook?
a. Woodb. Charcoal or coalc. Gasoline or kerosened. Bottled gase. Electricityf. Other (explain)
22. Where do you cook?
a. Outsideb. Inside without a kitchenc. Share kitchen with another householdd. Have own separate kitchen
23. (If chose 22c. or 22d.) How many years ago was this kitcheninstalled? -
24. (If chose 22c. or 22d.) How much did the installationcost? pesos

QUESTIONNAIRE FOR THE HOUSING SURVEY 171
E. Water
25. What is your source of water? What type of facility do youhave? (If several, mark the most important)
a. River, springb. Rain, cisternc. Welld. Public standpipee. Water wagonf. Neighborhood vendorg. Faucet, shared with another family (public service)h. Faucet, private, but no shower or bathi. Showerj. Complete bathroom
k. Two or more bathrooms
26. (If chose 25h.-25k.) How many years ago was this sourceinstalled?
27. (If chose 25h.-25k.) How many pesos did the installationcost? _
28. (If chose 25h.-25k.) How many days of work did ittake? -
29. Is there running hot water?
a. Yesb. No
F. Sanitary Facilities
30. What kind of sanitary facilities does this household have?(If several, mark the best)
a. Noneb. Pit latrinec. Toilet shared with others; communald. Septic tank

172 APPENDIXES
e. - Toilet connected to public sewerage systemf. - Two or more toilets connected to the public
sewerage systemg. - Other (explain)
31. How many years ago was this facility installed?
32. How many pesos did the installation cost?
33. How many days of work did it take?
34. Today:
a. The toilet worksb. The toilet does not workc. The toilet does not work because there is no waterd. Other
G. General Questions about Dwelling Improvements
35. When you acquired the dwelling, which of the changes thatyou have already made did you plan to make definitely?
a. Additional room(s)b. Better kitchenc. ___More convenient waterd. Better toilete. Improved basic wall materialsf. Improved roofing materialsg.- Plaster and painth.- Improved flooringi. Better windows or doorsj. Earth fill
k. None, the dwelling was finished1. Others, not specified
m. None, although some were neededn. Terrace or railingo. Finished inside ceilingp. Connection with the public sewerage systemq. Total reconstructionr. Other (explain)
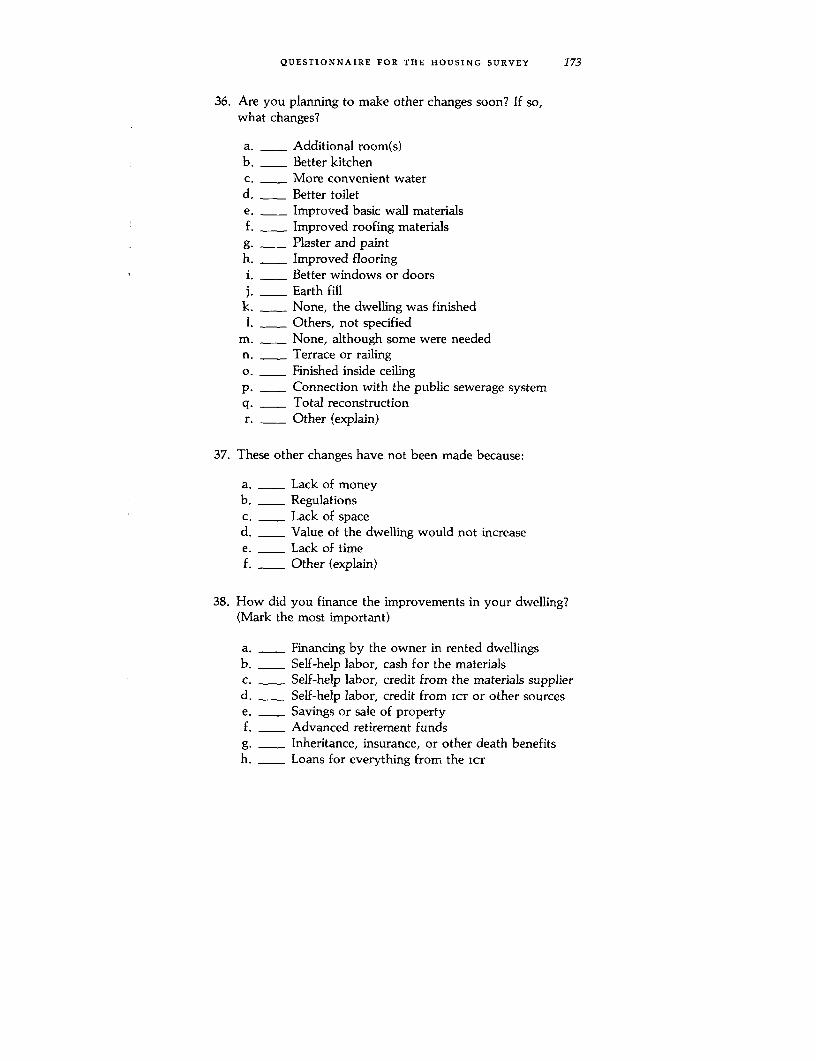
QUESTIONNAIRE FOR THE HOUSING SURVEY 173
36. Are you planning to make other changes soon? If so,what changes?
a. Additional room(s)b. Better kitchenc. More convenient waterd. Better toilete. Improved basic wall materialsf. Improved roofing materialsg.- Plaster and painth.- Improved flooringi. Better windows or doorsj. Earth fill
k. None, the dwelling was finished1. Others, not specified
m. None, although some were neededn. Terrace or railingo. Finished inside ceilingp. Connection with the public sewerage systemq. Total reconstructionr. Other (explain)
37. These other changes have not been made because:
a. Lack of moneyb. Regulationsc.- Lack of spaced. Value of the dwelling would not increasee. Lack of timef. Other (explain)
38. How did you finance the improvements in your dwelling?(Mark the most important)
a.- Financing by the owner in rented dwellingsb. Self-help labor, cash for the materialsc. Self-help labor, credit from the materials supplierd. Self-help labor, credit from ICT or other sourcese.- Savings or sale of propertyf. Advanced retirement fundsg. Inheritance, insurance, or other death benefitsh. Loans for everything from the ICT

174 APPENDIXES
i._- Loans for everything from the BCH or a CAV
j. - Loans from relatives or friendsk. - Other (explain)
39. What other type of work does your house still need?
a. Additional room(s)b. _ Better kitchenc. More convenient waterd. Better toilete. Improved basic wall materialsf. Improved roofing materialsg. _ Plaster and painth. Improved flooringi. Better windows or doorsj. Earth fill
k. None, the dwelling was finishedl. _ Others, not specified
m. - None, although some were neededn. - Terrace or railingo. - Finished inside ceilingp. - Connection with the public sewerage systemq. Total reconstructionr. _ Other (explain)
40. How would you compare the condition of the dwelling nowwith its condition when you acquired it?
a. _ Much betterb. Somewhat betterc. Samed. Worsee. Much worse
41. To keep it in this condition how many days of maintenanceper month are needed? (The minimum is 1.) _
H. Finances
42. How many pesos do you pay for rent each month? _
43. How many months ago did it increase? -
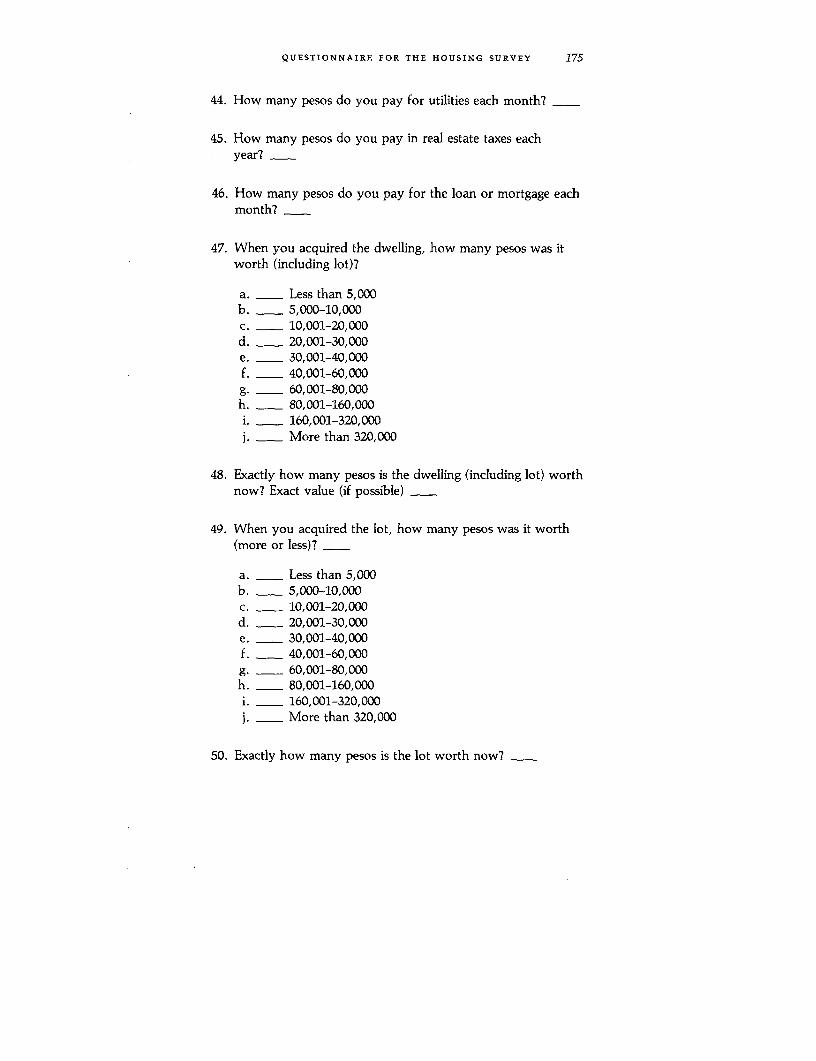
QUESTIONNAIRE FOR THE HOUSING SURVEY 175
44. How many pesos do you pay for utilities each month?
45. How many pesos do you pay in real estate taxes eachyear?
46. How many pesos do you pay for the loan or mortgage eachmonth? -
47. When you acquired the dwelling, how many pesos was itworth (including lot)?
a. Less than 5,000b. 5,000-10,000
c. 10,001-20,000
d. 20,001-30,000
e. 30,001-40,000
f. 40,001-60,000
g. 60,001-80,000h. 80,001-160,000i. 160,001-320,000
J.- More than 320,000
48. Exactly how many pesos is the dwelling (including lot) worthnow? Exact value (if possible)
49. When you acquired the lot, how many pesos was it worth(more or less)?
a. Less than 5,000b. - 5,000-10,000
c. 10,001-20,000
d. 20,001-30,000
e. 30,001-40,000
f. 40,001-60,000
g. 60,001-80,000h. 80,001-160,000i. 160,001-320,000
j.- More than 320,000
50. Exactly how many pesos is the lot worth now?
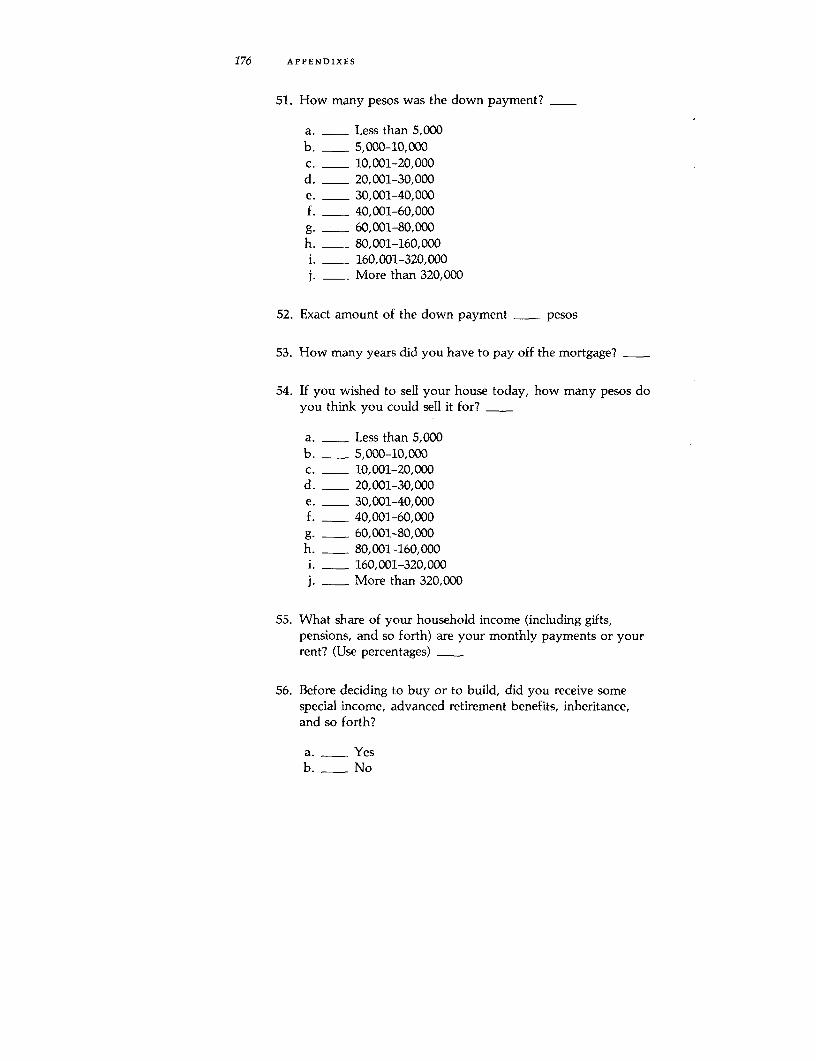
176 APPENDIXES
51. How many pesos was the down payment?
a. Less than 5,000b. 5,000-10,000
c. 10,001-20,000
d. 20,001-30,000
e. 30,001-40,000
f. 40,001-60,000
g. 60,001-80,000h. 80,001-160,000i. 160,001-320,000j. More than 320,000
52. Exact amount of the down payment pesos
53. How many years did you have to pay off the mortgage?
54. If you wished to sell your house today, how many pesos doyou think you could sell it for?
a. Less than 5,000b. 5,000-10,000c. 10,001-20,000d. _ 20,001-30,000e. 30,001-40,000f. 40,001-60,000g. 60,001-80,000h. 80,001-160,000i. 160,001-320,000j. More than 320,000
55. What share of your household income (including gifts,pensions, and so forth) are your monthly payments or yourrent? (Use percentages)
56. Before deciding to buy or to build, did you receive somespecial income, advanced retirement benefits, inheritance,and so forth?
a. Yesb. No
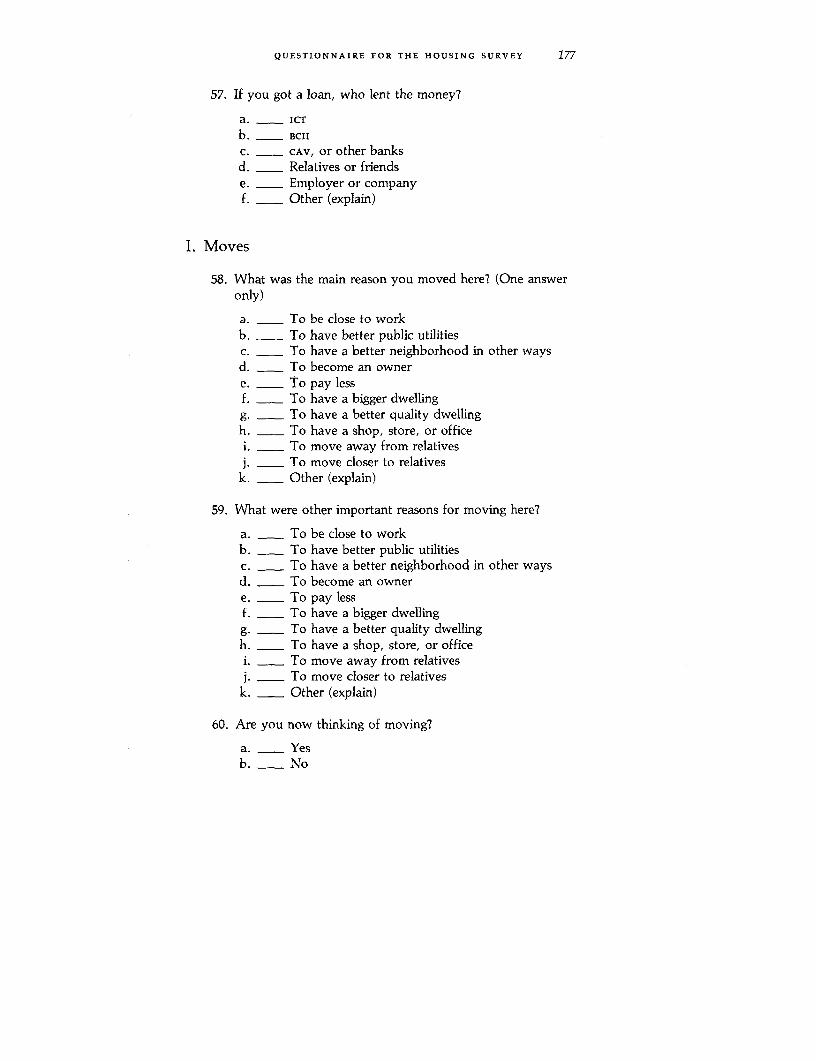
QUESTIONNAIRE FOR THE HOUSING SURVEY 177
57. If you got a loan, who lent the money?
a. ICT
b. BCH
C. CAV, or other banksd. Relatives or friendse. Employer or companyf. Other (explain)
I. Moves
58. What was the main reason you moved here? (One answeronly)
a. To be close to workb. To have better public utilitiesc. To have a better neighborhood in other waysd. To become an ownere. To pay lessf. - To have a bigger dwellingg. _ To have a better quality dwellingh. - To have a shop, store, or officei. - To move away from relativesj. To move closer to relatives
k. Other (explain)
59. What were other important reasons for moving here?
a. To be close to workb. To have better public utilitiesc. To have a better neighborhood in other waysd. To become an ownere. To pay lessf. To have a bigger dwellingg. To have a better quality dwellingh. To have a shop, store, or officei. To move away from relativesj. To move closer to relatives
k. Other (explain)
60. Are you now thinking of moving?
a. Yesb. No
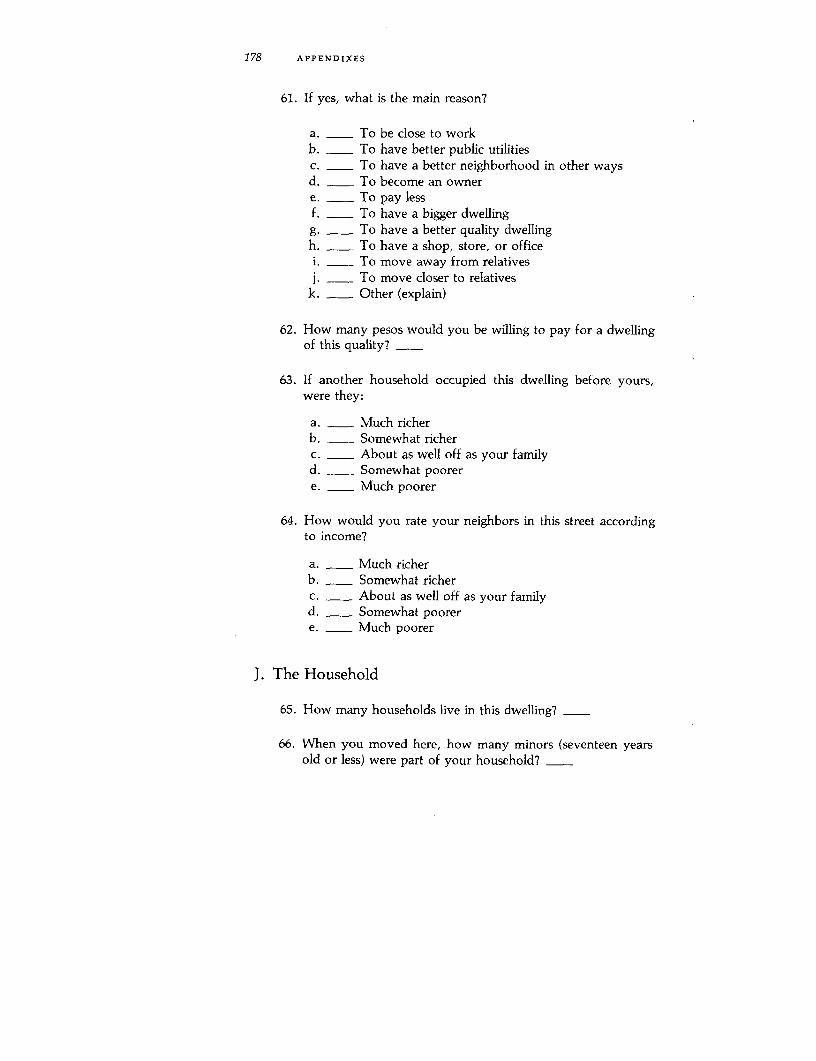
178 APPENDIXES
61. If yes, what is the main reason?
a. To be close to workb. To have better public utilitiesc. To have a better neighborhood in other waysd. To become an ownere. To pay lessf. To have a bigger dwellingg. To have a better quality dwellingh. To have a shop, store, or officei. To move away from relativesj. To move closer to relatives
k. Other (explain)
62. How many pesos would you be willing to pay for a dwellingof this quality7
63. If another household occupied this dwelling before yours,were they:
a. Much richerb. Somewhat richerc. About as well off as your familyd. Somewhat poorere. Much poorer
64. How would you rate your neighbors in this street accordingto income?
a. - Much richerb. - Somewhat richerc. - About as well off as your familyd. - Somewhat poorere. - Much poorer
J. The Household
65. How many households live in this dwelling?
66. When you moved here, how many minors (seventeen yearsold or less) were part of your household?
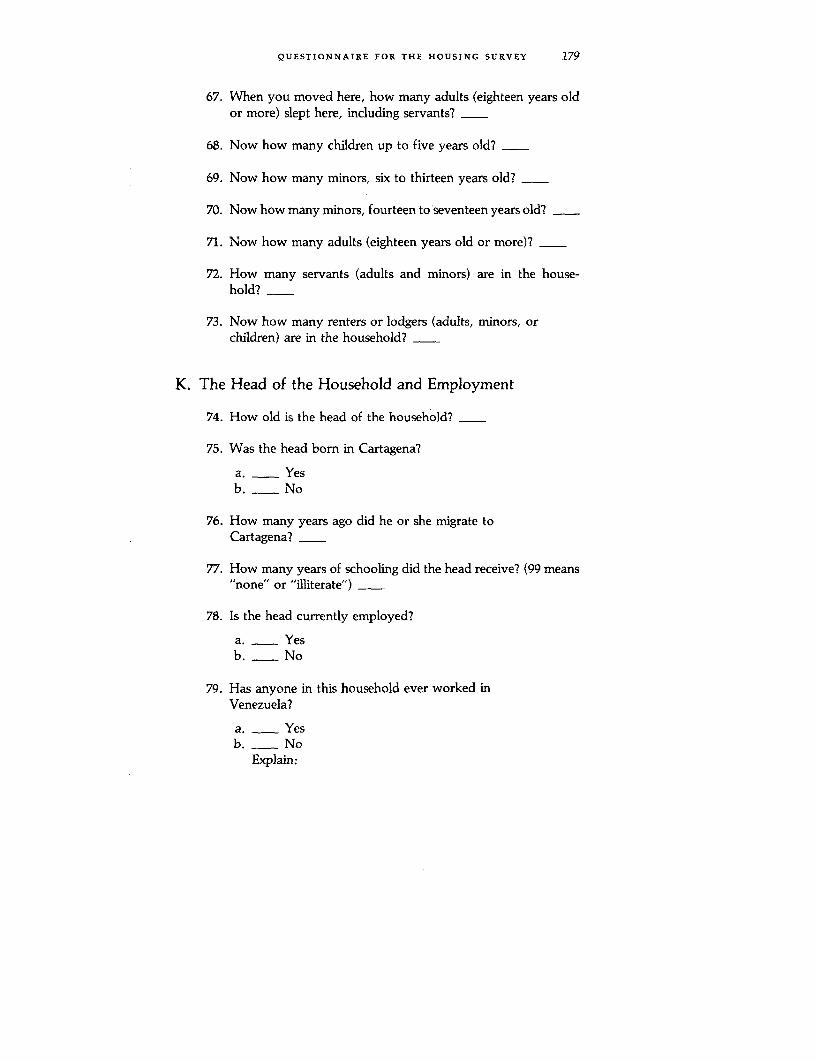
QUESTIONNAIRE FOR THE HOUSING SURVEY 179
67. When you moved here, how many adults (eighteen years oldor more) slept here, including servants? _
68. Now how many children up to five years old?
69. Now how many minors, six to thirteen years old?
70. Now how many minors, fourteen to seventeen years old?
71. Now how many adults (eighteen years old or more)?
72. How many servants (adults and minors) are in the house-hold? -
73. Now how many renters or lodgers (adults, minors, orchildren) are in the household? -
K. The Head of the Household and Employment
74. How old is the head of the household?
75. Was the head bom in Cartagena?
a. Yesb. No
76. How many years ago did he or she migrate toCartagena?
77. How many years of schooling did the head receive? (99 means"none" or "illiterate")
78. Is the head currently employed?
a. Yesb. No
79. Has anyone in this household ever worked inVenezuela?
a. Yesb. No
Explain:

180 APPENDIXES
80. What is the occupation of the head of the household?
a. Unskilled workerb. Skilled workerc. Highly skilled workerd. Office workere. Foremanf. Technician, semiprofessionalg. Professionalh. Street vendori. Other salespersonj. Owner of a store or business
k. Domestic service1. Other personal services
m. Other (explain; includes retirement)n. Police or military
Write the name of the job
81. What is the occupation of the spouse?
a. Unskilled workerb. Skilled workerc. Highly skilled workerd. Office workere. Foremanf. Technician, semiprofessionalg. Professionalh. Street vendori. Other salespersonj. Owner of a store or business
k. Domestic service1. Other personal services
M. Other (explain; includes retirement)n. Police or military
Write the name of the job
82. What is the occupation of the first other worker, if any?
a. Unskilled workerb. Skilled workerc. Highly skilled workerd. Office workere. Foreman

QUESTIONNAIRE FOR THE HOUSING SURVEY 181
f. - Technician, semiprofessionalg. Professionalh. _ Street vendori. - Other salespersonj. - Owner of a store or business
k. - Domestic service1. - Other personal services
m. _ Other (explain; includes retirement)n. _ Police or military
Write the name of the job
83. What is the occupation of the second other worker, if any?
a. Unskilled workerb. Skilled workerc. Highly skilled workerd. Office workere. Foremanf. Technician, semiprofessionalg. Professionalh. - Street vendori. - Other salespersonj. - Owner of a store or business
k. Domestic service1. Other personal services
m. __ Other (explain; includes retirement)n. Police or military
Write the name of the job
84. What is the occupation of the third other worker, if any?
a. Unskilled workerb. _ Skilled workerc. Highly skilled workerd. Office workere. Foremanf. Technician, semiprofessionalg. Professionalh. Street vendori. Other salespersonj. Owner of a store or business
k. Domestic service

182 APPENDIXES
1. - Other personal servicesm. - Other (explain; includes retirement)n. - Police or military
Write the name of the job
85. How many unemployed workers live here?
L. Transport
86. Where does the head of the household work?(Name of district)(Number)
87. How many kilometers must the head of the household travelto work? (If unknown, insert later from table) -
88. How many minutes does it take for the head of the householdto travel to work? -
89. Before moving, how many minutes was the trip?
90. How does the head of the household travel to work?a. Works hereb. Footc. Bicycled. Motorcyclee. Automobilef. Busg. Transport provided by the employerh. Other (explain)
91. Where does the spouse or other major worker work?(Name of district)
92. How many kilometers must he or she travel to work?(Use table) -
93. How many minutes does it take for him or her to travel towork? -
94. Before moving, how many minutes was the trip?

QUESTIONNAIRE FOR THE HOUSING SURVEY 183
95. How does he or she travel to work?a. Works hereb. Footc. Bicycled. Motorcyclee. Automobilef. Busg. Transport provided by the employerh. Other (explain)
M. Income
96. How many persons receive meals (paid for by others) awayfrom home?
97. What are the sources of funds that members of this householdcan spend?a. Wages and salariesb. Sales or work on one's own accountc. Rent from lodgers who live hered. Other rent, property income, interest, or dividendse. Pensionsf. Aid in cash from family members who do not live
hereg. Aid from othersh. Other (explain)
98. Does one of these sources of income produce more than half(more than 51 percent) of the income of all the rest combined?
99. What was the total income (pesos) from all these sources foryour household during the past month? (If meals were re-ceived at work, add 1,000 pesos for each recipient. Explain tohigh-income respondents that we only need these very broadcategories.)a. Less than 700b. 700-1,000c. 1,001-2,000d. 2,001-3,000e. 3,001-4,000

184 APPENDIXES
f.- 4,001-5,000g. 5,001-6,000h.- 6,001-8,000i.- 8,001-12,000j.- 12,001-16,000
k. _ More than 16,000
100. Exact amount pesos
Note: The survey was administered in Spanish.

Appendix CValue, Income, and
Housing Characteristics
DETAILS ABOUT HOUSING CHARACTERISTICS and their association with hous-ing value or with the income of occupants can be shown in stock-usercross-tabulations, such as Table C-1. Numbers in the cells show the aver-age number of rooms. Houses worth less than 40,000 pesos occupied byhouseholds earning less than 2,000 pesos (the upper-left cell) have 2.5rooms. Looking down the column, one can see that households in higherincome ranges occupying lowest-value housing also have 2.5 rooms. Butthe average number of persons per household rises from 4 to 6.5 to 8 inthe higher income ranges. There is more income and more crowding. Aslightly lower percentage-71 not 86 percent-is made of inferior ma-terials as income rises, but none have piped water, and 79 percent haveno type of sanitation (not even latrines).
Other ranges of housing value show a similar pattern. A more prosper-ous household in a given value range will not occupy more rooms than apoorer household. At the same time the higher income is associated witha larger family size. The extreme case is that of occupants of H2 housing,with 4.5 family members in the FO range and 10.5 in the F3 range.
The higher income-or larger family size-is, however, associatedwith better materials. Few households that earn more than 8,000 pesosoccupy housing made of inferior materials, and no H4 or H5 housing isbuilt with them. The same applies to any type of housing that puts its oc-cupants considerably to the right of the matrix diagonal. Within an in-come range, these are likely to be smaller households. Housing abovethe diagonal is likely to have both more rooms and be made of better ma-terials. By the same token, housing below the diagonal has fewer rooms,a higher proportion is made of worse materials, and most are occupiedby larger families. Extra family members bring in more income but notenough to prevent a deterioration of housing conditions. Table C-2shows the number of persons per room in different cells of the matrix.Table C-3 gives household size per cell for tenants.
185
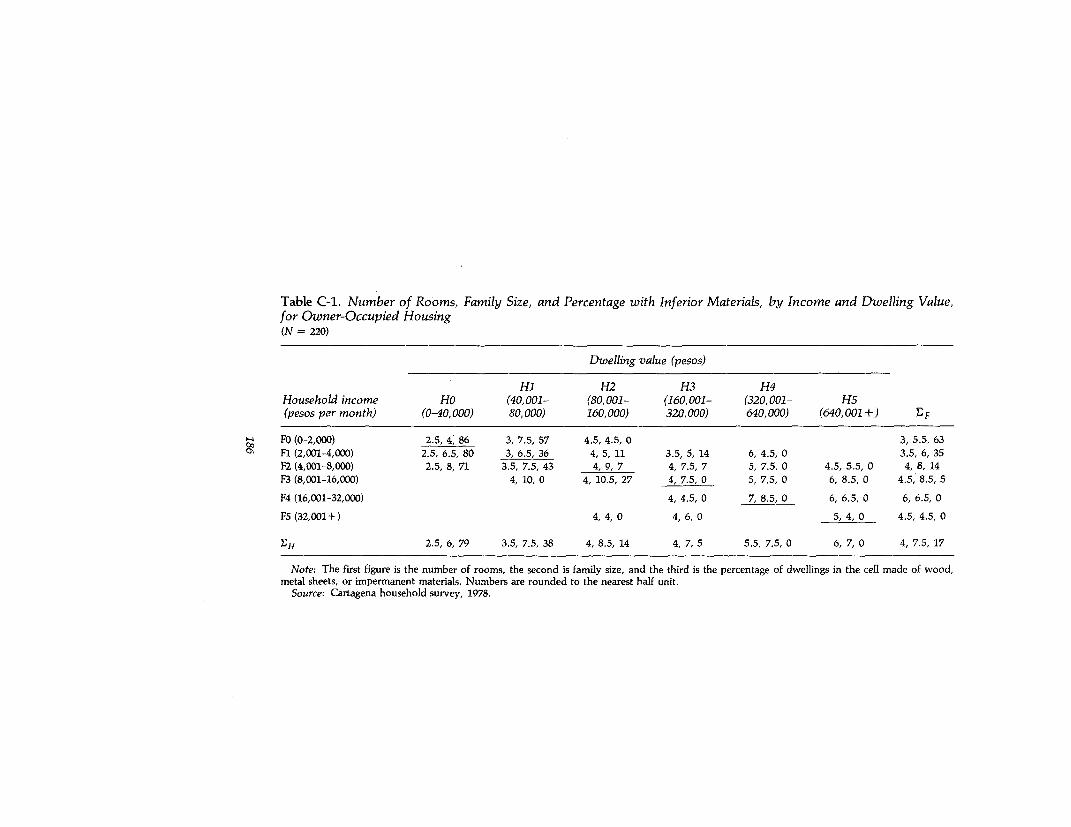
Table C-1. Number of Rooms, Family Size, and Percentage with Inferior Materials, by Income and Dwelling Value,for Owner-Occupied Housing(N = 220)
Dwelling value (pesos)
Hi H2 H3 H4Household income Ho (40,001- (80,001- (160,001- (320,001- H5(pesos per month) (0-40,000) 80,000) 160,000) 320,000) 640,000) (640,001+) EF
"-a F0 (0-2,000) 2.5, 4, 86 3, 7.5, 57 4.5, 4.5, 0 3, 5.5, 63t' Fl (2,001-4,000) 2.5, 6.5, 80 3, 6.5, 36 4, 5, 11 3.5, 5, 14 6, 4.5, 0 3.5, 6, 35
F2 (4,001-8,000) 2.5, 8, 71 3.5, 7.5, 43 4, 9, 7 4, 7.5, 7 5, 7.5, 0 4.5, 5.5, 0 4, 8, 14F3 (8,001-16,000) 4, 10, 0 4, 10.5, 27 4, 7.5, 0 5, 7.5, 0 6, 8.5, 0 4.5, 8.5, 5F4 (16,001-32,000) 4, 4.5, 0 7, 8.5, 0 6, 6.5, 0 6, 6.5, 0F5 (32,001+) 4, 4, 0 4, 6, 0 5, 4, 0 4.5, 4.5, 0
-UH 2.5, 6, 79 3.5, 7.5, 38 4, 8.5, 14 4, 7, 5 5.5, 7.5, 0 6, 7, 0 4, 7.5, 17
Note: The first figure is the number of rooms, the second is family size, and the third is the percentage of dwellings in the cell made of wood,metal sheets, or impermanent materials. Numbers are rounded to the nearest half unit.
Source: Cartagena household survey, 1978.

Table C-2. Persons per Room, by Income and Dwelling Value, for Owner-Occupants(N = 220)
Dwelling value (pesos)
Hi H2 H3 H4
Household income HO (40,001- (80,001- (160,001- (320,001- H5
(pesos per month) (0-40,000) 80,000) 160,000) 320,000) 640,000) (640,001+) EF
FO (0-2000) 1.6 2.5 1.0 1.8
W Fl (2,001-4,000) 2.6 2.2 1.3 1.4 0.8 1.7
'-ii F2 (4,001-8,000) 3.2 2.1 2.3 1.9 1.5 1.2 2
F3 (8,001-16,000) 2.5 2.6 1.9 1.5 1.4 1.9
F4 (16,001-32,000) 1.1 1.2 1.1 1.1
F5 (32,001+) 1.5 0.8 1.0
FH 14 2.4 2.1 2.1 1.8 1.4 1.2 1.9
Note: Housing of higher value is progressively less crowded until the number of persons per room has fallen by half. However, by income level
crowding rises to a peak in the middle categories with incomes between 4,001 and 16,000 pesos. These are also the ranges with the largest household
sizes (from eight to nine persons), with many households living below the diagonal. Extra adults bring in more earnings but not enough to make bet-
ter housing affordable, given the extra children.Source: Cartagena household survey, 1978.
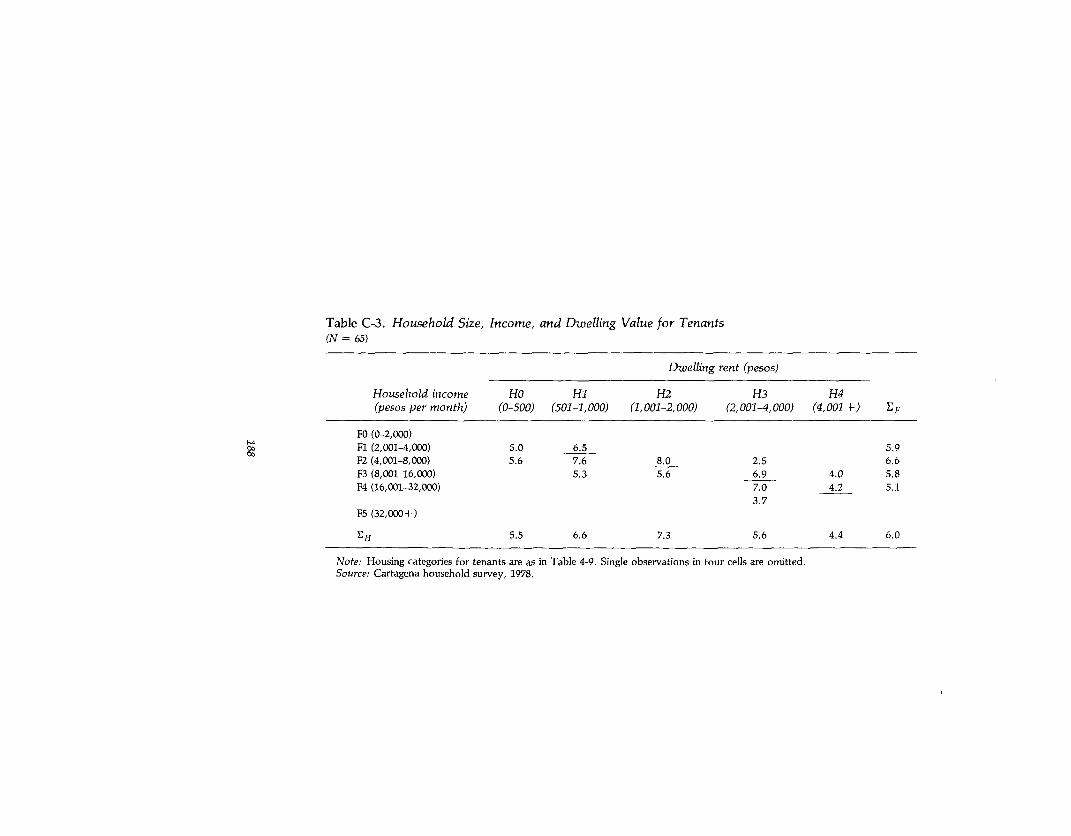
Table C-3. Household Size, Income, and Dwelling Value for Tenants(N 65)
Dwelling rent (pesos)
Household income HO Hi H2 H3 H4(pesos per month) (0-500) (501-1,000) (1,001-2,000) (2,001-4,000) (4,001+) EF
FO (0-2,000)Fl (2,001-4,000) 5.0 6.5 5.9F2 (4,001-8,000) 5.6 7.6 8.0 2.5 6.6F3 (8,001-16,000) 5.3 5.6 6.9 4.0 5.8F4 (16,001-32,000) 7.0 4.2 5.1
3.7F5 (32,000+)
EH 5.5 6.6 7.3 5.6 4.4 6.0
Note: Housing categories for tenants are as in Table 4-9. Single observations in four cells are omitted.Source: Cartagena household survey, 1978.

VALUE, INCOME, AND HOUSING CHARACTERISTICS 189
A similar pattern can be observed with respect to water sources andsanitary facilities. Table C-4 shows only the absence of piped water andall sanitary facilities (including latrines), but matrixes for other plumbingcharacteristics have been worked out, and they confirm this pattern.When families within a given income range live in housing above thediagonal, they usually have better sanitary and water facilities. In fact,access to these inspires the improvements that bring the dwellings abovethe diagonal. Those who live below the diagonal are more likely to havelatrines or nothing and to buy water in lard cans from neighbors.
These results may be interpreted as follows. A larger family makes iteasier to improve the materials of a given structure but makes it harder toacquire a larger dwelling with much better plumbing and access toutilities. In only one out of eleven cells above the diagonal is the averagefamily size equal to eight or more persons. Two out of six diagonal cellshave family sizes of eight or more, as do three out of eight below thediagonal. Income can put families in housing above the diagonal, pro-vided it is not needed to feed and clothe a larger number of people. Thisnegative association of value with household size is analyzed in Chapter4 with multiple regressions.
Tables C-5 through C-8 are cross-tabulations of income with dwellingvalue and with rent, and show floor space, number of rooms, androoms added in the appropriate cells. The summary rows show the aver-age number of rooms for different income ranges, and the columns showdifferent value or rental ranges. The lower right corner gives the overallaverages. Rental houses have 3.8 rooms with 145 square meters, whereasothers have 4.2 rooms with 143 square meters. Rental dwellings belowthe diagonal usually have less floor space and fewer rooms, but the dif-ference is less for upper-income groups and more expensive housing.
Among owned dwellings the increase in floor space, although ir-regular, is also clear from positions below to those above the diagonal.The number of rooms increases from two to three for the poor in the up-per left to from five to seven for the rich in the lower right. But, exceptfor Hi dwellings and the richest and poorest households, the rise is notconsistent.
Irregularity is greatest, as might be expected, for the number of roomsadded. Fl families added the most rooms (0.9), an activity that puts 14percent of them into H3 housing. But the most added-on housing type isH4. Here an average of 1.2 more rooms has brought the housing size upfrom 4.2 to 5.4 rooms. Particularly energetic were F2 families, who in-creased 3.5 rooms to 5.1 rooms and F4 families who had increased 5.2-room houses to 7.0 rooms. These two income ranges occupied 58 percentof H4 housing other than rentals.
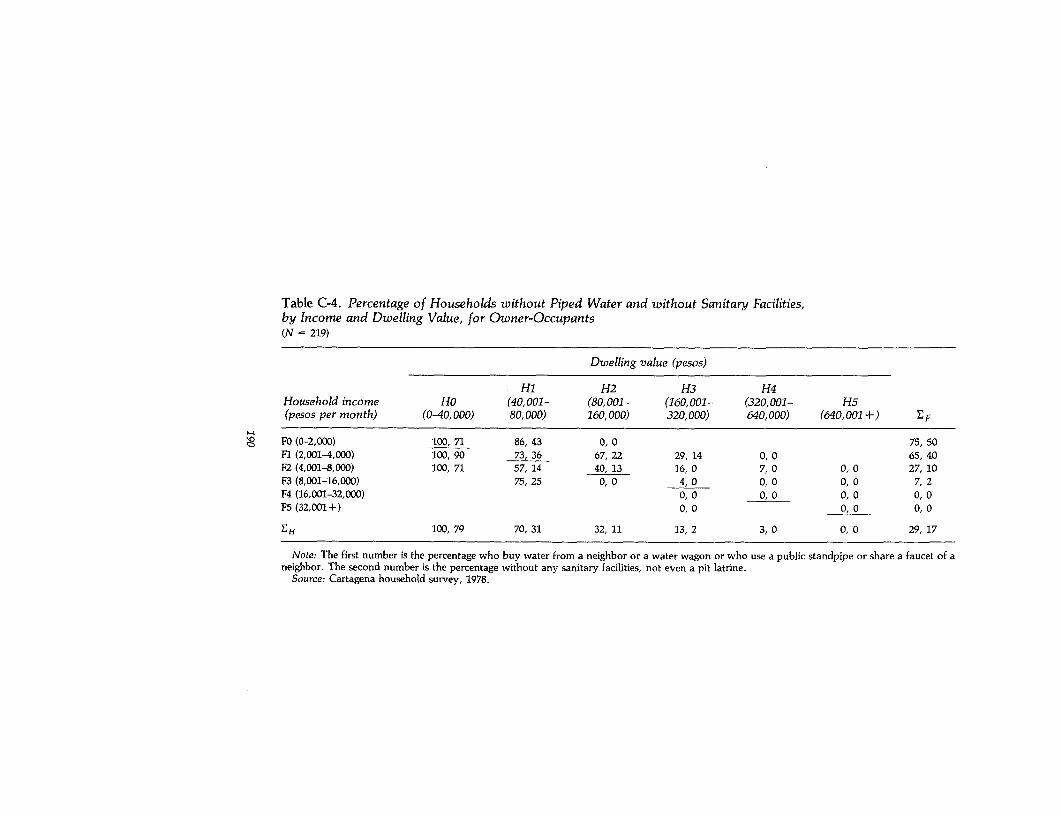
Table C-4. Percentage of Households without Piped Water and without Sanitary Facilities,by Income and Dwelling Value, for Owner-Occupants(N = 219)
Dwelling value (pesos)
Hi H2 H3 H4Household income Ho (40,001- (80,001- (160,001- (320,001- H5(pesos per month) (0-40,000) 80,000) 160,000) 320,000) 640,000) (640,001+) LF
#3 F0 (0-2,000) 100, 71 86, 43 0, 0 75, 50Fl (2,001-4,000) 100, 90 73, 36 67, 22 29, 14 0, 0 65, 40F2 (4,001-8,000) 100, 71 57, 14 40, 13 16, 0 7, 0 0, 0 27, 10F3 (8,001-16,000) 75, 25 0, 0 4, 0 0, 0 0, 0 7, 2F4 (16,001-32,000) 0, 0 0, 0 0, 0 0, 0F5 (32,001+) 0,0 0,0 0,0
EH 100, 79 70, 31 32, 11 13, 2 3, 0 0, 0 29, 17
Note: The first number is the percentage who buy water from a neighbor or a water wagon or who use a public standpipe or share a faucet of aneighbor. The second number is the percentage without any sanitary facilities, not even a pit latrine.
Source: Cartagena household survey, 1978.

Table C-5. Average Floor Space (in Square Meters), by Income and Dwelling Rent(N = 62)
Dwelling rent (pesos)
Household income HO Hi H2 H3 H4(pesos per month) (0-500) (501-1,000) (1,001-2,000) (2,001-4,000) (4,001+) 'F N
F0 (0-2,000) 24.0 24.0 1Fl (2,001-4,000) 66.7 126.0 100.6 7
(53.7)
,^ F2 (4,001-8,000) 116.1 128.0 213.8 60.0 138.5 20(102.6)
F3 (8,001-16,000) 102.0 136.0 153.7 226.0 140.5 22(76.7)
F4 (16,001-32,000) 125.0 234.0 248.0 229.1 8(120.8)
F5 (32,001+) 100.0 165.0 160.0 147.5 4(48.6)
EH 94.3 118.2 163.1 153.3 231.5 145.4 62(70.6) (51.1) (107.2) (79.7) (133.7) (93.8)
Note: Standard deviations are in parentheses.Source: Cartagena household survey, 1978.
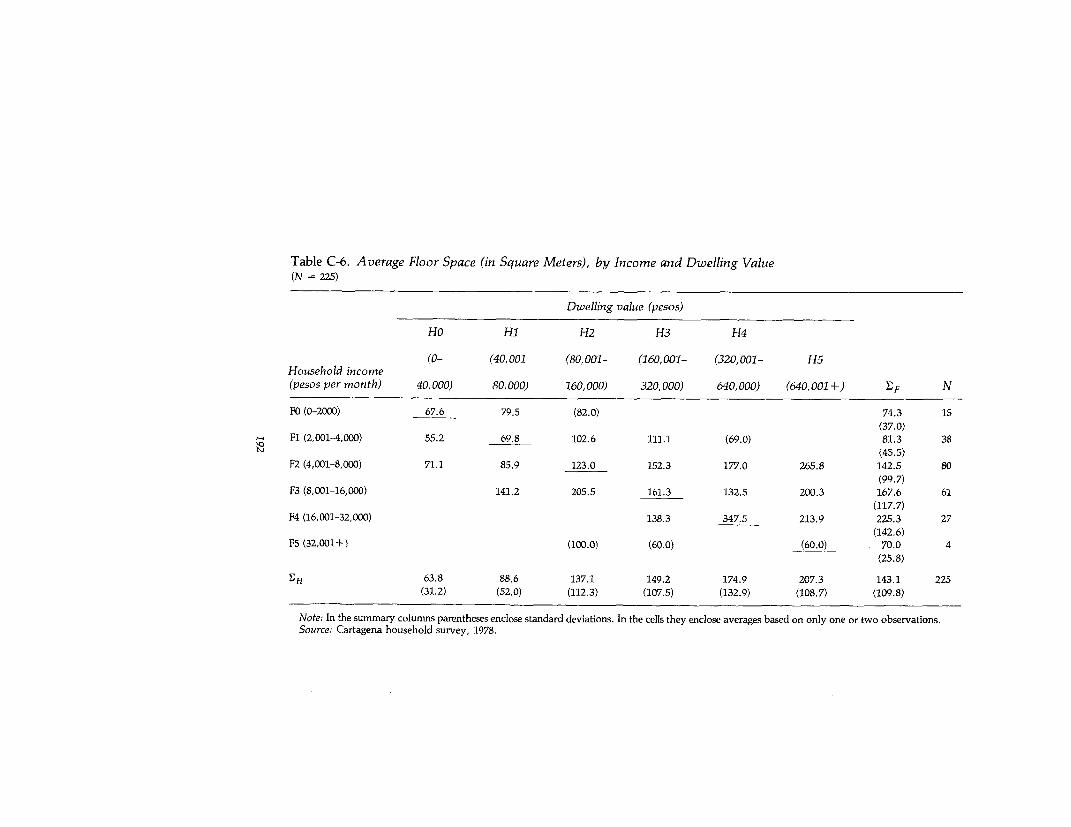
Table C-6. Average Floor Space (in Square Meters), by Income and Dwelling Value(N = 225)
Dwelling value (pesos)
HO HI H2 H3 H4
(0- (40,001- (80,001- (160,001- (320,001- H5Household income(pesos per month) 40,000) 80,000) 160,000) 320,000) 640,000) (640,001+) SF N
FO (0-2000) 67.6 79.5 (82.0) 74.3 15(37.0)
Fl (2,001-4,000) 55.2 69.8 102.6 111.1 (69.0) 81.3 38
(45.5)F2 (4,001-8,000) 71.1 85.9 123.0 152.3 177.0 265.8 142.5 80
(99.7)F3 (8,001-16,000) 141.2 205.5 161.3 132.5 200.3 167.6 61
(117.7)F4 (16,001-32,000) 138.3 347.5 213.9 225.3 27
(142.6)F5 (32,001+) (100.0) (60.0) (60.0) 70.0 4
(25.8)
rH 63.8 88.6 137.1 149.2 174.9 207.3 143.1 225(31.2) (52.0) (112.3) (107.5) (132.9) (108.7) (109.8)
Note: In the summary columns parentheses enclose standard deviations. In the cells they enclose averages based on only one or two observations.Source: Cartagena household survey, 1978.
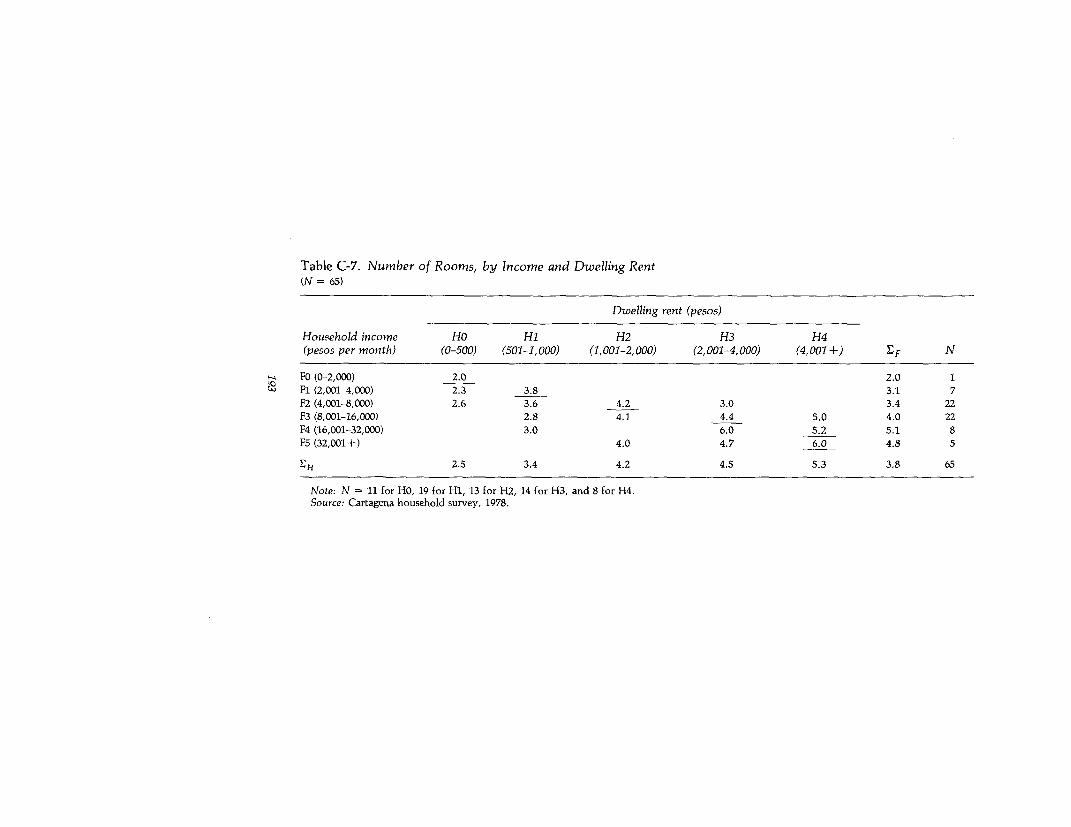
Table C-7. Number of Rooms, by Income and Dwelling Rent(N = 65)
Dwelling rent (pesos)
Household income HO Hi H2 H3 H4(pesos per month) (0-500) (501-1,000) (1,001-2,000) (2,001-4,000) (4,001+) SF N
FO (0-2,000) 2.0 2.0 1
Fl (2,001-4,000) 2.3 3.8 3.1 7
F2 (4,001-8,000) 2.6 3.6 4.2 3.0 3.4 22
F3 (8,001-16,000) 2.8 4.1 4.4 5.0 4.0 22
F4 (16,001-32,000) 3.0 6.0 5.2 5.1 8
F5 (32,001+) 4.0 4.7 6.0 4.8 5
EH 2.5 3.4 4.2 4.5 5.3 3.8 65
Note: N = 11 for HO, 19 for HI, 13 for H2, 14 for H3, and 8 for H4.Source: Cartagena household survey, 1978.

Table C-8. Number of Rooms and Rooms Added, by Income and Dwelling Value(N = 231)
Dwelling value (pesos)
HO Hi H2 H3 H4Household income (0- (40,001- (80,001- 160,001- 320,001- H5(pe5os per month) 40,000) 80,000) 160,000) 320,000) 640,000) (640,001+) ;F N
FO (0-2,000) 2.6 2.9 4.5 2.9 16(0.3) (0.4) (0) (0.5)
Fl (2,001-4,000) 2.3 3.2 3.9 3.4 6.0 3.4 40(0.6) (0.5) (0.1) (1.0) (0.7) (0.9)
' F2 (4,001-8,000) 2.3 3.4 3.9 4.2 5.1 4.7 4.1 81(0.8) (0.4) (0.5) (0.7) (1.6) (0.5) (0.8)
F3 (8,001-16,000) 3.8 4.2 4.0 5.0 5.9 4.5 62(1.4) (0.6) (0.9) (0.7) (0.6) (0.8)
F4 (16,001-32,000) 3.7 7.0 6.3 6.1 28(1.0) (1.8) (0.4) (0.7)
F5 (32,001+) 4.0 4.0 5.0 4.5 4(0) (0) (0.5) (0.3)
EH 2.4 3.3 4.0 4.0 5.4 5.9 4.2 231(0.6) (0.6) (0.4) (0.8) (1.2) (0.5) (0.7)
Note: N = 25 for HO, 30 for HI, 39 for H2, 67 for H3, 33 for H4, and 37 for H5. Rooms added by the occupying household are given in paren-theses. Standard deviation for the sample mean is 1.065 for rooms added; 1.692 for number of rooms.
Source: Cartagena household survey, 1978.

Table C-9. Share of Households Receiving Primarily Wage Income or Having Relatives in Venezuela,by Income and Dwelling Value, for Owner-Occupants(N = 220 for the income source; 203 for relatives in Venezuela)
Dwelling value (pesos)
Ho Hi H2 H3 H4Household income (0- (40,001- (80,001- (160,001- (320,001- H5(pesos per month) 40,000) 80,000) 160,000) 320,000) 640,000) (640,001+) SF
FO (0-2,000) 0.286 0.286 0 0.250(0.200) (0) (0) (0.083)
Fl (2,001-4,000) 0.500 0.636 0.333 0.714 0.667 0.550(0.571) (0.400) (0.375) (0.714) (0) (0.471)
F2 (4,001-8,000) 0.571 0.571 0.267 0.452 0.643 0.333 0.468(0.600) (0.143) (0.467) (0.571) (0.214) (0) (0.417)
F3 (8,001-16,000) 0.251 0.818 0.739 0.455 0.222 0.586(0.500) (0.400) (0.364) (0.273) (0) (0.304)
F4 (16,001-32,000) 0 0.250 0.500 0.423(1.00) (0.250) (0) (0.115)
F5 (32,001+) (1.00) 0 0.333
(0) (0) (0)
E, H0.458 0.483 0.432 0.578 0.531 0.382 0.491(0.471) (0.269) (0.400) (0.517) (0.226) (0) (0.33)
Note: Share with relatives working in Venezuela is given in parentheses.Source: Cartagena household survey, 1978.
196 APPENDIXES
Possibly important for housing improvement was temporary income,the kind that is more likely to be saved. Three-quarters or more of hous-ing improvements were financed by funds generated internally by thefamily, that is, without involving the government or borrowing fromothers. What kind of household is most likely to receive unexpected in-come flows7 One might hazard a guess that it is not those with primarilywage income, and, as Table C-9 shows, such households are more likelyto live below the matrix diagonal. It is most typical of the 8,001-to-16,000-peso income range, however, the same group that has the high1.6 income elasticity of demand that is also the best statistical fit for anyrange.
Another possible source of temporary income was relatives sendingremittances from Venezuela. But for owner-occupants, it turned out that44 percent of those below the diagonal had such relatives, compared withonly 28 percent of those above. That does not fit. What does fit is that 33percent of all owner-occupants had such relatives compared with only 19percent of tenants. The regressions reported in Table 6-8 did not supportthese propositions, however.
Appendix DHousing Models and
Density of Settlement
CHOICE OF RESIDENTIAL LOCATION was worked out during the early 1960sin terms of journeys to work through areas of increasing density of settle-ment to a central business district. Important factors such as theheterogeneity and durability of dwellings, the difficulty of modifyingthem, and consequent effects on demand and stock adjustment were ig-nored. The models were only partial equilibrium solutions. They ignoredneighborhood effects, ethnic preferences and prejudices, and interactionswith local governments. A realistic model must also incorporate the dif-ferent behavior of owner-occupants and landlords. For example, the twogroups may be taxed differently or perceive housing as unlike blends ofinvestment and consumption components. Each of these complicationsinvolves elements more complicated than distance and density. Inmeasuring and testing urban models, problems of aggregation and disag-gregation arise in a manner that is especially baffling.
The safe and usual procedure is to complicate models by no more thanone or two elements at a time. For example, Richard Muth has incor-porated age of the dwelling unit in a residential location and incomemodel and has found it an unimportant factor.' Most analysts hadassumed that the flow of housing services gained from a given dwellingunit falls steadily as the unit ages and that it will from time to time betransferred to families with successively lower incomes, that is, filtereddown. Unanticipated immigration of poor families would accelerate thefiltering process. But this theory has had to be reconciled with the factthat some neighborhoods remain with high income groups for longperiods while others are transferred rapidly.
More important than age is the decision to maintain and even torehabilitate and to improve a dwelling. According to William C.Wheaton, that decision is not much influenced by the interplay of de-mand for low density versus that for proximity to work. Those two ef-
197

198 APPENDIXES
fects almost cancel each other so that the rich barely outbid the poor forperipheral locations. In San Francisco, California, for example, it is byless than 10 percent. What the richer families really seek in deciding onlocation are the externalities of less noise, less pollution, less crime, andlower taxes compared with public services, a choice possible due to ur-ban political and fiscal fragmentation in the United States. Measures ofthese elements may be found in the pupil-teacher ratio, tax rates, crimerates, percentage of the population on welfare, and so forth.
On the supply side, most of the standard complications come from im-perfections in the capital market and from variations in the price of land.Labor and materials are usually in elastic supply and can be lumpedtogether as nonland inputs. If their elasticity of substitution for land isbelow unity, the land cost share of housing will be higher near the citycenter. This model obviously does not allow for high-rise solutions.Single-family housing can be more elastically supplied further from thecenter of the city in part because there is more vacant land. Speculatorswith distant land probably have more risk preference than those who stillhope for further improvements in potential uses near the center. Thevacancy rate together with price is what motivates entrepreneurs to buildor not, here or there.
Upgrading and Conversion
Filtering implies downward transfers, but upward transfers are alsopossible when incomes and demand rise faster than new construction ofbetter units. Such upward transfers are typically accompanied by in-creased investment in the old dwelling units. Usually one thinks of in-vestment in old dwelling units as maintenance and repair-steps that aresupposed to prevent a decrease in value. But rehabilitation, im-provements, and expansion to increase value can be as important,especially in fast growing cities. Housing theorists have usually omittedor postponed analysis of improvements because their tasks were alreadycomplex enough without adding that.
Moreover, an assumption of sharply decreasing returns to scale inmaintenance and conversion implies that it is hard to prevent or to slowdown deterioration, let alone foster improvements. This assumptionseems to be widely held, but it needs to be questioned, especially for therudimentary housing of poor people in developing countries. Abstractly,and with a simulation that roughly fits rented apartments in Boston, theassumption has been relaxed and the implications explored by GregoryIngram and Yitzhak Oron.2 Their paper illustrates the difficulties ofrigorous theorizing in this complex field. Apart from complexity one

HOUSING MODELS AND DENSITY OF SETTLEMENT 199
runs into rigidities, interdependence, externalities, uncertainties, andother market failures.
The Ingram-Oron Model
In the Ingram-Oron model, landlords maximize profits and house-holds maximize utilities by changing the flow of housing services from anexisting housing stock. Some of these services come from accessibilityand neighborhood quality, and these characteristics cannot be changedin the model. Landlords can vary operating inputs and housing capital.This capital consists of extremely durable structure capital and of qualitycapital that depreciates in about ten years. Structure capital is the foun-dation and shell, their size, materials, and plumbing. Quality capital canbe varied through changing repairs, decorations, and minor appliances.In their critiques of the model, Rothenberg and Steele charge that themost important types of conversion are omitted, meaning either expan-sion of the shell or its subdivision into additional rooms-the verychanges that are of primary concern in developing countries. Ingram andOron treat such conversions as a type of new construction that competeswith other new building since it produces brand new units.
With conversion cost Cii landlords will change a unit of structure type ito type j if the sum of discounted net revenues VX from type j is biggerthan (V, + Cij), which also must be less than building costs of a new unitof type j. The present value V depends on gross rent per unit R, thevolume of operating inputs Ot and their prices P., the amount ofmaintenance Mt and its unit price Pm, and fixed costs apart from financ-ing F, plus the interest rate r
o0 1
V = tFo IRt-PoOt-PmMt-Ft] (1 + r)t
If this framework is to be applied to upgrading by owner-occupants orlandlords with a few lodgers in poor countries, one must assume thatthey have clear expectations about the volume and unit prices of inputsused and services obtained. Almost as much information is required forthe types of decision that Ingram and Oron consider: choice of thevolume of operating inputs and of maintenance or quality investment.
The landlord presumably knows how gross rents will vary withchanges in operating inputs, and he chooses a volume to satisfy the first-order conditions
dR (0; K, t)dO

200 APPENDIXES
The price of a unit of capital flow Pk gives the first-order conditions foran equilibrium level of capital in the housing unit:
d (R -PO)dK= Pk
Pk for a unit of quality capital is Pm, the price of a unit of maintenance,which must be converted to a flow basis with the depreciation rate d andthe interest rate r:
Pk = Pm (d + r).
Maintenance expenditures are set to bring the capital per unit from thecurrent level, K (1 - d), to the optimal level K* within, say, five years.In a dynamic framework with changing expectations, a stationary statewill never be attained, and the five-year interval rolls along, always withredefined objectives.
Ingram and Oron show that, even with further drastic simplifications,such a model cannot be easily applied to a concrete case. Only two typesof neighborhood and two types of structure are considered: good andbad; high-rise and walk-up apartments. For each type, eight qualitylevels are possible. Rent per room is used as the index of capital quality,although rent actually reflects the combined vagaries of both supply anddemand, including variations in location and neighborhoods.
Landlords are assumed to maximize their returns by varying mainte-nance (quality capital) and operating expenditures in accordance with acEs production function. The distribution and substitution parameters ofthis function are plausible inventions by the authors, which theirdiscussants were inclined to reject, even reversing relative magnitudes.Rothenberg would not even accept the assumption of constant returns toscale. For one thing, the greater the amount of maintenance and conver-sion, the higher will be the opportunity cost of lost revenue from unitsmade temporarily vacant by being worked on. New construction is notsubject to that loss.
Implications of the model are sought with a simulation that assigns 200hypothetical dwelling units to 200 households in six income categories.Rents for structural and neighborhood attributes are changed with eachiteration, and quality capital is augmented or allowed to deteriorate untilthe market is cleared. The long-run equilibrium capital stock has thenbeen reached. The overall implication is that incremental investment inquality capital is often a superior alternative to new construction, a con-clusion that follows from the assumption of constant returns to scale.
In spite of much ingenuity, little general significance can be attributedto any specific numbers or orders of magnitude that Ingram and Oron
HOUSING MODELS AND DENSITY OF SETTLEMENT 201
found. Some criticism of the model focuses on its neglect of neighbor-hood quality as endogenous, as well as on assumptions about the trade-offs that rich and poor will make for that neighborhood quality, meaningthe cross-elasticity of demand. Steele suggests that if structural conver-sion or adding rooms were given full status as a fifth housing option (inaddition to structure type, quality, accessibility, and neighborhood),then conversion would look better compared with neighborhood qualitythan the authors believe and would absorb a larger share of possiblefederal housing allowances. It would make these more palatable tovoters. Taxpayers want the poor to have better shelter, not just to bid upreal estate values in better neighborhoods.
Similarly, Rothenberg approves of the idea of adding an intermediatesupply adjustment to those of the very long and the very short run forhousing. But he has the reservations that have already been mentioned,as well as others involving distinctions among tenure classes, marketstructure, and neighborhoods. The exclusion of capital market imperfec-tions, tax effects, and the difficulty of prediction, of knowing what is "inthe works" by others in this long-gestation sector all may cause seriousbiases. Perhaps analytical rigor and simulation elegance can only be at-tained at excessive cost. The pioneering analytical efforts made so farshould be welcome as simply points of reference for exploring the verydifferent setting of housing in a developing country.
Notes to Appendix D
1. Richard F. Muth, "The Influence of Age of Dwellings on Housing Expenditures and onthe Location of Households," in Residential Location and Urban Housing Markets, ed.Gregory K. Ingram (Cambridge, Mass.: National Bureau of Economic Research, 1977), pp.3-22; "Comments" by William C. Wheaton, pp. 23-26. See also, William C. Wheaton, "In-come and Urban Residence: An Analysis of Consumer Demand for Location," AmericanEconomic Review (September 1977), pp. 620-31. Since the income elasticities of demandfor land and time appear "remarkably similar," their interaction or "the long-run theory ofurban land markets is empirically an unimportant determinant of income spatial patterns inAmerican cities."
2. Gregory K. Ingram and Yitzhak Oron, "The Production of Housing Services from Ex-isting Dwelling Units," in Residential Location and Urban Housing Markets, ed. GregoryK. Ingram (Cambridge, Mass.: National Bureau of Economic Research, 1977), pp. 273-314, followed by "Comments" by Jerome Rothenberg and Marion Steele, pp. 315-25.
Appendix ESubdivision and Expansionin Ciudad Kennedy, Bogota
SUBDIVISION AND EXPANSION often occur together, as has been shown in adetailed study of landlords and renters in Ciudad Kennedy, a suburb ofBogotS.1 The low-cost houses and apartments had been sold at below-market terms in 1963 by the ICT to families that presumably owned noother housing. In 1975 a random sample of 594 of these dwellingsshowed that 160 had been subdivided and rented to tenants. Detailed in-formation was available on 136 of the subdivided dwellings. Seventy-onepercent had been remodeled. On the average 2.2 rooms had been added,and two-thirds of the remodeled units had a new kitchen or bathroom. In92 percent of cases the landlord continued to share the dwelling.
Family income of the landlords-4,470 pesos monthly, includingrent-was only 42 percent above that of the tenants' average 3,140 monthly.Average rent was 736 pesos or 16.5 percent of the landlords' income(23.4 percent of the tenants' income). Tenant families were newer andsmaller (3.9 members) than landlord families (7.3 members), and,therefore, actually had a higher per capita income of 813 pesos monthlythan the landlords' 508 pesos. More than half of the landlords hadthemselves lived as renters in a subdivided house before coming toCiudad Kennedy. Some 11.5 percent had previously owned otherhouses.
Only 4 out of the 160 subdivided dwellings were apartments, so onemay conclude that apartment construction discouraged such initiatives,reduced flexibility in the housing stock, and made life harder for somenewly formed, low-income families. Raising the value of their propertywas the main reason that owners let in tenants (56 percent), followed bya desire for other goods and services (28 percent).
Remodeling was financed with personal savings and retirement fundsin 58 percent of the cases. Loans from banks or employing firms ac-counted for 29 percent of sources, and 13 percent used personal loans.
202
EXPANSION IN CIUDAD KENNEDY, BOGOTA 203
The gross yield from remodeling was estimated to be about 26 percent,and the net yield ranged from 3 percent for those who used personalloans at 24 percent annually to 20 percent for owners who used their ownsavings. These returns were viewed by the authors of the study as beingin line with other investment opportunities available to the landlords.
In general, Zorro and Reveiz concluded that renting rooms in sub-divided dwellings was a relatively satisfactory way to provide low-costhousing in a country at Colombia's stage of development. Instead of op-posing the landlords' capitalization of their housing subsidies, thegovernment should encourage and anticipate that activity. Dwellingsshould be designed to facilitate future remodeling, and potentiallandlords should perhaps be the only recipients of subsidized housing in-stead of being regarded as unsavory profiteers, a group to be excluded ifpossible.2
Notes to Appendix E
1. Carlos Zorro Sanchez and Edgar Reveiz Roldan, Estudio sobre Los Inquilinatos (Vi-vienda Compartida en Arrendamiento) en Bogota (Bogota: Centro de Estudios sobreDesarrollo Econ6mico, University of the Andes, Etapa I February 1974 and Segunda Partelune 1976).
2. Ibid., Segunda Parte, pp. 114-15.
Appendix FA 1970 Survey
of the Southeast Zone
A 1970 SURVEY BY HUMBERTO TRIANA Y ANTORVEZA found that 30 percentof housing in these four southeast districts (7, 8, 9, 10) needed partialrebuilding, and 45 percent needed total rebuilding. 1 Twenty-three per-cent of dwellings were occupied by more than one family, and 4 percentby three families or more. In addition, 69 percent of families kept dogs,cats, pigs, chickens, ducks, pigeons, and other animals and birds. Morethan half of the households consisted of from five to ten members: one tofour persons, 28 percent; eleven and more persons, 16 percent; and six-teen or more persons, 6 percent.
The extent of overcrowding can be seen by the finding that 70.5 per-cent of dwellings had only one or two rooms (16 and 54.5 percent,respectively). Sixteen percent had three rooms, 11 percent had four, and2.5 percent had five rooms. The average number per bed or hammockwas 2.2.
Household income was mainly in the range of from 501 to 1,000 pesosper month. Less was earned by 32 percent, and more by 21 percent. Ifthese eamings are compared with the classification of Cort6s, the in-habitants of the southeast sectors become not only poor, but the poorestof the poor.2 That is why they have been surveyed so often that future in-terviewers may encounter skepticism and resistance.
Notes to Appendix F
1. Humberto Triana y Antorveza, Cultura del Tugurio en Cartagena (Bogota: Impresaen Italgraf for UNICEF, 1974). Owners were 82 percent, renters 15 percent, and unchargedguarding occupants 3 percent. Housing was 20 percent of the budget.
2. Lacydes Cortes Dias, Familia y Sociedad en Cartagena (Departamento de Investiga-ci6n Econ6mica y Social, Universidad de Cartagena, July 1971).
204
Appendix GA 1976 Census of the
Southeast Zone: Boston-Tesca
IN 1976 A CENSUS OF 1,064 DWELLINGS occupied by 5,118 people was con-ducted in district 8 by ICT.1 About 46 percent of the population werechildren under sixteen years old. Forty-seven percent were between six-teen and fifty years of age, and only 7 percent were fifty-one or older.
Among the economically active population between the ages of sixteenand fifty, 28 percent were unemployed, that is, 682 out of 2,419. Mer-chants and street sellers were the leading occupational group (30percent). Then came domestic servants (17 percent) and building workers(13 percent). Others were drivers, unskilled labor, and public employees.Income distribution was:
Monthly income (pesos) PercentNone 1.9
80-1,000 19.51,001-2,000 15.22,001-3,000 19.83,001-4,000 9.44,001-5,000 10.05,001-6,000 7.86,001-7,000 5.87,001-8,000 3.18,001-9,000 1.89,001-10,000 0.9
10,001+ 4.7
Only 55 percent of dwellings were occupied by single families.Another 26 percent were occupied by two families, 12 percent by threefamilies, 4 percent by four families, and 2.4 percent or thirty-five dwell-ings by five families. Since 23 percent of dwellings were occupied byfrom ten to nineteen persons and 55 percent by from five to nine persons,undoubling was a critical housing need.
205
206 APPENDIXES
In this district 13.7 percent of households were tenants, and 4.0 per-cent occupied the premises of others without charge. The lots of ownerswere typically 200 square meters in area; those of tenants 150 squaremeters. Rental property was owned by 3.7 percent of households, withabout 80 percent within the same district. The rest were in neighboringdistricts. ICT classified 21.4 percent of dwellings as being in bad condi-tion, consisting of one room built out of inferior materials with no floorand no latrine. Only 18.1 percent were classified as good, with at leastfour well-finished rooms, water, and connection to the sewerage system.
The average owner with a deed had lived in the area ten years and ninemonths, but only 9.6 percent of tenants had occupied their premisesmore than five years. From one to five years had been the length of stayof 48.6 percent of tenants, and 41.7 percent had been there less than ayear.
Note to Appendix G
1. Instituto de Credito Territorial, "Censo de Propietarios en la Zona Suroriental, Sector2" (Cartagena, 1976; processed).

Appendix HA 1978 Study of Employment
in the Southeast Zone: Esperanza
A SURVEY oF 160 FAMILIES living in 140 dwellings was made in early 1978by SENA (Servicio Nacional de Aprendizaje), the national vocationaltraining institution.1 In general this group found that so many studieshad been made in "La Esperanza" that people had become hostile to anyofficial concern about them. They felt like guinea pigs who gained noth-ing from such attention. What was most needed, according to theauthors, was to train people with leadership talent in a way that wouldnot dissipate into mere politics.
The survey found that 83 percent of dwellings were occupied by theirowners, 75 percent by single families, and that 63 percent were physi-cally inadequate. Some 53 percent of families had been in the area formore than a decade. The first settlers had come in 1916, putting uphouses along the shores of creeks. Some land was bought from rich Car-tagena families named Dadger, Badel, and Roman; whereas the land ofthe Granger family was simply appropriated by squatters who illegallysold parcels to others. In the Pescadores (Fisherman) sector, land hadbeen reclaimed from the lagoon. With rising pollution, the fish were dis-appearing and becoming genetically deformed.
Income levels per occupation corresponded to those we found fivemonths later. Full-time employment is assumed in these figures.
Occupation Earnings (pesos) Share of employment (percent)Domestic servant 1,000 32Construction worker and 1,800 15
unskilled laborDriver 2,500 8Dressmaker 3,000 5Carpenter 3,500 6Salesman 6,000 25Others 2,000 9
Total 100
207
208 APPENDIXES
One may assume that the domestic servants approximately doubledtheir income through meals and other benefits received on the job. Hence1,800 pesos was something like the minimum effective wage. The rela-tively high level that salesmen earned explains the attraction of opening asmall shop or selling in the street as a way of beginning.
Since the SENA survey did not include income from pensions, rent,food on the job, transfers from absent family members, and the like, asdid our survey, income levels per family were naturally lower.
Income level (pesos) Percentage of families0-1,000 28.1
1,001-2,000 30.62,001-3,000 15.03,001-4,000 10.64,001-5,000 9.35,001-6,000 6.4
Total 100.0
A problem with this distribution is that a quarter of the labor force wasreported as being salesmen, earning 6,000 pesos if fully employed. If anyother family members were employed, a category higher than5,001-6,000 pesos would be needed. But the income distribution only in-cluded earnings of heads of families.
Note to Appendix H
1. Gloria Amparo Gomez de Gongora, Aura Miranda de Hernandez, and Edgar GalofreVega, "Diagn6stico Socio-Econ6mico del Barrio 'La Esperanza'" (Cartagena: SENA, Feb-ruary 1978; processed).
Appendix IHousing in Latin American
Budget Surveys
WITHOUT EXAMINING THE WAY HOUSING has been specified, one can easilymisinterpret budget surveys. Organizers of the Latin American surveyssponsored by the Brookings Institution during 1966-75 (Estudios Con-juntos sobre Integraci6n Econ6mica Latinoamericana-ECIEL) werethoroughly aware of this problem.1 For owner-occupants housing wasspecified in alternative ways: either as all of the imputed rent or as half ofactual mortgage payments (regardless of the proportion of interest andamortization components). The second specification assumes arbitrarilythat half of housing payments are saving. Changing the specification inthis manner turned out not to actually matter much unless the effects ofage or life-cycle on the relation between consumption and income werebeing studied. The propensity to save does, however, appear to be lessfor renters than for owner-occupants (in ten cities in Venezuela, Colom-bia, Ecuador, Peru, and Chile), even if all imputed rent is treated as con-sumption and the increased equity is disregarded. The dwelling is theasset owned by the greatest number of households, often the only signifi-cant asset. Total consumption was not affected by whether a dwellingwas a house or apartment, nor by its materials of construction. Buthouseholds of a given size that occupied more rooms had a higher pro-pensity to consume. Subtracting imputed rent from the consumption andincome of older households makes them appear more thrifty than mighthave been expected-that is, their spending does not exceed income, as inindustrialized countries. Imperfections in the capital market and inflationmay cause this pattern.
Expenditures on Housing as a Share of Incomein Four Colombian CitiesDuring 1967-68 information on housing expenditures (among others)
was collected under the direction of Rafael Prieto D., Centro de Estudios
209
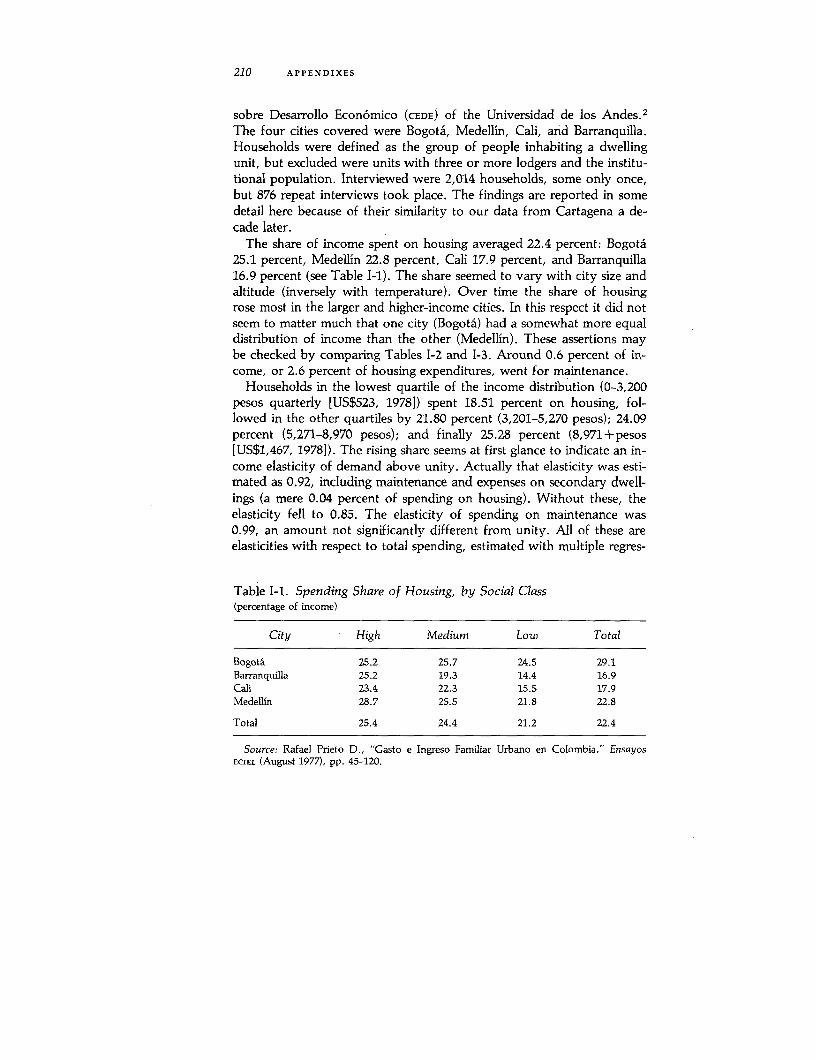
210 APPENDIXES
sobre Desarrollo Econ6mico (CEDE) of the Universidad de los Andes.2
The four cities covered were Bogota, Medellin, Cali, and Barranquilla.Households were defined as the group of people inhabiting a dwellingunit, but excluded were units with three or more lodgers and the institu-tional population. Interviewed were 2,014 households, some only once,but 876 repeat interviews took place. The findings are reported in somedetail here because of their similarity to our data from Cartagena a de-cade later.
The share of income spent on housing averaged 22.4 percent: BogotA25.1 percent, Medellin 22.8 percent, Cali 17.9 percent, and Barranquilla16.9 percent (see Table I-1). The share seemed to vary with city size andaltitude (inversely with temperature). Over time the share of housingrose most in the larger and higher-income cities. In this respect it did notseem to matter much that one city (Bogota) had a somewhat more equaldistribution of income than the other (Medellin). These assertions maybe checked by comparing Tables 1-2 and I-3. Around 0.6 percent of in-come, or 2.6 percent of housing expenditures, went for maintenance.
Households in the lowest quartile of the income distribution (0-3,200pesos quarterly [US$523, 1978]) spent 18.51 percent on housing, fol-lowed in the other quartiles by 21.80 percent (3,201-5,270 pesos); 24.09percent (5,271-8,970 pesos); and finally 25.28 percent (8,971+pesos[US$1,467, 1978]). The rising share seems at first glance to indicate an in-come elasticity of demand above unity. Actually that elasticity was esti-mated as 0.92, including maintenance and expenses on secondary dwell-ings (a mere 0.04 percent of spending on housing). Without these, theelasticity fell to 0.85. The elasticity of spending on maintenance was0.99, an amount not significantly different from unity. All of these areelasticities with respect to total spending, estimated with multiple regres-
Table I-1. Spending Share of Housing, by Social Class(percentage of income)
City High Medium Low Total
Bogota 25.2 25.7 24.5 29.1Barranquilla 25.2 19.3 14.4 16.9Cali 23.4 22.3 15.5 17.9Medellin 28.7 25.5 21.8 22.8
Total 25.4 24.4 21.2 22.4
Source: Rafael Prieto D., "Gasto e Ingreso Familiar Urbano en Colombia," EnsayosECIEL (August 1977), pp. 45-120.

LATIN AMERICAN BUDGET SURVEYS 211
Table 1-2. Share of Housing in Expenditures for Comparable Groupsin Four Colombian Cities, 1953, 1967-68, and 1970
CEDE 1967-68 DANE 1970,DANE 1953, $5,001-$10,000
City total Total Middle class income range
Bogota 20.3 25.1 25.7 27.0Barranquilla 18.8 18.5 19.3 20.2Cali 21.7 19.6 22.3 22.2Medellin 19.0 24.3 25.5 26.2
Source: Same as Table l-1.
Table 1-3. Income Distribution According to the Income of the FamilyHead and Gini Coefficients in Four Colombian Cities, 1967-68
Income level (pesosper trimester) Bogota Barranquilla Cali Medellin Total
Income share (percent)0-3,200 18.3 28.8 34.4 29.5 25.2
3,201-5,270 22.3 28.7 25.3 27.5 24.95,271-8,970 29.2 21.5 19.0 22.3 24.78,971+ 30.1 21.0 21.3 20.7 25.2
Gini coefficient 0.472 0.463 0.479 0.499 0.473Income (pesos) 9,450 7,530 7,220 7,930 8,033aShare of top 10 percent 37.6 37.3 38.6 41.8 38.8Bottom 40 percent 13.8 12.7 13.5 12.8 13.4
a. Unweighted average.Source: Same as Table 1-1.
sions that include other variables discussed below. The figures in TableI-1 suggest that the spending elasticity for housing was higher in thepoorer, warmer cities, Cali and Barranquilla. Their upper classes spentas large a share on housing as in the other cities, but their poor spentmuch less.
Other Determinants of Housing Expenditures
Some variables affected housing expenditures much less than might beexpected. For example, larger families tended to crowd up or spend less
212 APPENDIXES
on quality, compared with space, to an extent that their housing shareactually fell slightly, from 22.9 percent for from three to five members,to 21.7 percent for from six to eight members, or 21.3 percent for house-holds with nine or more members. This decline of 1.6 percent roughlymatches the rise of 1.8 percent spent on food and drink. Households withfrom one to two members spent the largest share on housing, 27.6 per-cent. Put differently, households without children spent 26.0 percent;those with one or two spent 21.9; with from three to five, 21.0 percent;and those with six or more, 21.1 percent. The same 21 percent applies tothe middle stages of the life cycle, compared with 27.9 at the beginningand 33.0 at the end. Alternatively, when the head of the household wasmore than sixty-four years old, the share was 32.9 percent.
Education had little effect on spending for housing. When the head ofthe household had university, primary, or no education, 22 percent wasspent. Only when the head of the household had secondary educationwas a bit more spent (23.9 percent). A similar factor that made little dif-ference was type of occupation. The share did fall slightly, to 19.5 per-cent, if the wife was employed, showing that more of her income had togo for other things. Such households made up about 10 percent of thesample.
Owner-occupants spent 25.2 percent, or substantially more than rent-ers (21.4 percent). The owners' share included 1.0 percent on mainte-nance or 3.9 percent of spending on housing. By contrast, renters leftmaintenance to landlords, adding only 0.04 percent to their rental pay-ments. Basically, becoming an owner meant multiplying the value ofone's maintenance decisions by ten. About 5.6 percent of households livedin dwellings that were neither owned nor rented, and they paid only 2.9percent of their income for these, including 14.0 percent of that onmaintenance.
The ECIEL study did not explore the extent to which the variations inspending on housing might have been due to the general demographic sit-uation of a city, its size, and rate of growth. Thus we find that Cali grewmore than 8 percent during the 1940s and 6.3 percent annually during1951-64. Medellin grew at a similar rate of 6 percent. By the years1965-70 the rate of immigration to Bogota and Cali had reached 3.4 and3.6 percent, respectively, whereas Medellin had 2.6 percent and Barran-quilla only 1.6 percent. These rates must be weighed together with thoseof employment and unemployment. In Medellin the unemployment ratewas lowest (14.5 percent), and in Barranquilla it was highest (18.4 per-cent). Cali had the lowest male unemployment rate (11.1 percent) andone of the highest female rates (22.3 percent).
LATIN AMERICAN BUDGET SURVEYS 213
Notes to Appendix I
1. Philip Musgrove, "Determinants of Urban Household Consumption in Latin Amer-ica: A Summary of Evidence from the ECIEL Surveys," Economic Development and CulturalChange (April 1978), pp. 441-65.
2. Rafael Prieto D., Estructura del Gasto y Distribuci6n del Ingreso Familiar en CuatroCiudades Colombianas, 1967-68 (Bogota: CEDE, 1971); Rafael Prieto D., "Gasto e IngresoFamiliar Urbano en Colombia," Ensayos ECIEL (August 1977), pp. 45-120. This study waspart of the ECIEL Program of Joint Studies on Latin American Economic Integration. SeePhilip Musgrove, Income and Spending of Urban Families in Latin America: The ECIEL
Consumption Study (Washington, D.C.: Brookings Institution, 1978).
Appendix JCVP Housing Projects in Bogotai
SOME ICT POLICIES were influenced by the experiments of the Caja de Vi-vienda Popular of Bogota (cvp), so a brief description of that programfollows.
After building 291 minimal houses in the Manuelita neighborhood ofBogota during 1972-73, the cvp undertook a new project of 2,697 dwell-ings at Las Guacamayas. The size of minimal units was raised from 11 to12 square meters and the lot size from 54 to 64 square meters. This lastchange and the new hexagonal honeycomb layout for groups of lots low-ered the density from eighty-two to fifty-two housing units per hectare.Money was saved, however, by letting the occupants build a temporaryshed around the sanitary outlet instead of building a brick structure forthem. Moreover, the outlet was moved from a corner of the lot to its cen-ter, where the bathroom of the final dwelling would be. Pipes to the mainsewerage line would no longer have to be relocated. Minor changes werealso made in the suggested layout of the ultimate two-story, six-roomhouse.
Occupants did not have to expand their dwellings according to cvp de-signs. They could use different materials, for example, concrete blocksinstead of the recommended bricks, and they did not have to follow anypredetermined set of priorities. Expansions needed approval to ensurestructural soundness and to prevent impinging on neighbors. But suchapproval could be obtained in written form without delay from one ofthe three architects who were part of the seven-person cvp staff on thesite. Visits to model units and training programs for new occupants were,however, expected to channel construction into preferred forms.
The greater size of Guacamayas and its greater distance from shoppingareas did promote a larger number of shops and stores in dwellings thanhad been the case at La Manuelita, and the cvp welcomed this change.Several units had been converted to rental use, however, a change thatcvp disapproved of because it seemed to be unfair to profit from publicsubsidies and to perpetuate the sort of overcrowding that cvp wanted to
214
CVP HOUSING PROJECTS IN BOGOTA 215
correct. The institution had a minimal occupancy requirement of twoyears, but it did not really want to police the occupants rigorously, to setup disagreeable mechanisms of control and eviction, or even to put sub-stantial resources into such work when more dwellings could be built in-stead. Rather, it chose to evaluate Guacamayas with a sixty-four-itemquestionnaire that might identify the kind of family most or least temp-ted to convert its dwelling into a rental unit.
Officials of cvp acknowledged that even Guacamayas solved only asmall portion of the growing housing deficit among the poor. Though thehousing was inexpensive, subsidies were still needed, so imitation of theproject by large-scale private builders was unlikely. With other demandson the city budget of Bogota, the best way for cvp to mobilize additionalresources seemed to be to construct expensive apartments in the richernorthem parts of the city. In 1978 construction of 500 62-square-meterunits costing from 500,000 to 600,000 pesos began. At the same time veryrudimentary rental units costing only 200 pesos monthly had been builtat Los Laches. They consisted of one room, outside cooking facilities,and communal plumbing. Occupants were allowed to remain only twoyears and were supposed to save enough to qualify for something like theGuacamayas project. The forty-eight units of this project were still con-sidered experimental.
References
The word "processed" indicates works that are reproduced by mimeograph,xerography, or similar means; such works may not be cataloged or commonlyavailable through libraries, or may be subject to restricted circulation.
Agency for International Development, Comptroller General. Agency for Inter-national Development's Housing Investment Guaranty Program. Report toCongress. Washington, D.C.: U.S. General Accounting Office, September 6,1978.
Agency for International Development, Office of Housing. Tunisia: Shelter Sec-tor Assessment. Washington, D.C., January 1979.
Ahumada Sulbaran, Regulo. "A Medias Qued6 el Censo de Cartagena." El Espec-tador (August 11, 1978).
Araud, Christian, Gerard Boon, Victor Urquidi, and Paul Strassmann. Studies onEmployment in the Mexican Housing Industry. Development Center Studies,Employment Series no. 10. Paris: OECD, 1973, pp. 80, 163.
Asociaci6n Nacional de Industriales. Monografia Industrial de Cartagena, 1976.Cartagena, 1977, pp. 22-23.
Bureau of Educational Research. "The Residents of Umoja Housing Estate." Uni-versity of Nairobi, March 1978. Processed.
Burns, Leland S., and Leo Grebler. The Housing of Nations: Analysis and Policyin a Comparative Framework. London: Macmillan, 1977.
CAMACOL. Empieo Generado por la Construcci6n en Colombia (Bogota, October1977), p. 5.
Cameron, Sally. "Local Participation in Bank-Supported Urban DevelopmentProjects." Washington, D.C, World Bank, Urban Projects Department, 1978.Processed.
Cardona, Ramiro. Migraci6n y Fuerza de Trabajo en el Departamento de Bolivar,vol. 1 and 2. Bogota: Consorcio de Ingenierias e Investigaciones, Consultores,August 1977, p. 71.
Cebrecos Revilla, Rufino. "Construcci6n de Vivienda y Empleo." Lima, Departa-mento de Econ6mia, Pontificia Universidad Catolica del Peru, April 1978, p.39. Processed.
Centro Nacional de Estudios de la Construcci6n (CENAC). Deficit de Vivienda enColombia 1964-1973 y Proyecciones 1974-1980. Bogota, December 1976. Pro-cessed.
216
REFERENCES 217
. La Construcci6n en Cifras. Bogota, January 1977, October 1977,February 1978, May 1978. Processed.
Churchill, Anthony A., and Margaret Lycette. Shelter. Poverty and Basic NeedsSeries. Washington, D.C.: World Bank, 1980.
Collier, David. Squatters and Oligarchs: Authoritarian Rule and PolicyChange in Peru. Baltimore, Md.: Johns Hopkins University Press, 1976.
Cort6s Diaz, Lacydes. Familia y Sociedad en Cartagena. Departamento deInvestigaci6n Econ6mica y Social, Universidad de Cartagena, July 1971.
DANE. Indice de Precios. Bogota, 1977.
-_____ La Vivienda en Colombia, 1973. Advance sample of the fourteenth na-
tional census. Bogota, 1978. Processed.
Departamento Nacional de Planeaci6n. Posibilidades de Reducci6n deCostos de Edificaci6n, vol. 2. BogotA, November 1972.
Drakakis-Smith, David. "Low-Cost Housing Provision in the Third World." InHousing in Third World Countries. Edited by H. S. Murison and J. P. Lea.New York: St. Martin's Press, 1979.
Farrell, Robert V., and Lacydes Cortes. "Four Walls Are Not Enough: A CaseStudy of Education and Housing in Cartagena, Colombia." International Jour-nal for Housing Science and Its Applications, vol. 4, no. 5 (1980), pp. 425-26.
Gallin, Bernard. Hsin Hsing, Taiwan: A Chinese Village in Change. Berkeley,Calif.: University of California Press, 1966.
G6mez de Gongora, Gloria Amparo, Aura Miranda de Hernandez, and EdgarGalofre Vega. "Diagn6stico Socio-Econ6mico del Barrio 'La Esperanza'." Car-tagena, SENA, February 1978. Processed.
Greene, David, and W. Paul Strassmann. "Peruvian Construction Statistics andProductivity Changes." Journal of Development Studies (January 1971), pp.189-95.
Grimes, Orville F. Housing for Low-Income Urban Families. Baltimore, Md.:Johns Hopkins University Press, 1976.
Gutierrez de Gomez, Marta Isabel. "Politica Tarifaria y Distribucion de Ingresos."BogotA, National Planning Department, 1975. Processed.
Gutierrez Pineda, Virginia. Familia y Cultura en Colombia. Bogota: EdicionesTercer Mundo, 1968.
Ingram, Gregory K. "Housing Demand in the Developing Metropolis." Paperpresented at the Econometric Society Meetings, Atlanta, Ga., December 1979.
Ingram, Gregory K., and Yitzhak Oron. "The Production of Housing Servicesfrom Existing Dwelling Units." In Residential Location and Urban HousingMarkets. Edited by Gregory K. Ingram. Cambridge, Mass.: National Bureau ofEconomic Research, 1977.
Instituto de Credito Territorial. "Censo de Propietarios en la Zona Suroriental,Sector 2." Cartagena, 1976. Processed.
_- "Inventario de Zonas Subnormales de Vivienda y Proyectos de Desar-
rollo Progresivo." Bogota, 1972. Processed.
218 APPENDIXES
Jellicoe, Marguerite. "Credit and Housing Associations among Luo Immigrants inKampala." In Urban Challenge in East Africa. Edited by John Hutton. Nairobi:East Africa Publishing House, 1970.
Laquian, A. A. "Squatters and Slum Dwellers." In Housing Asia's Millions. Editedby Stephen H. K. Yeh and A. A. Laquian. Ottawa: International DevelopmentResearch Center, 1979.
Linn, Johannes. Cities in the Developing World: Policies for Their Equitable andEfficient Growth. New York: Oxford University Press, 1982.
_ . "Urban Public Finances in Developing Countries: A Case Study of Carta-gena, Colombia." Urban and Regional Report no. 77-1. Washington, D.C.,World Bank, January 1975. Processed.
Lowry, Ira S., Mack Ott, and Charles Noland. "Housing Allowances and House-hold Behavior." Rand Corporation note prepared for the Department of Hous-ing and Urban Development. Santa Monica, Calif., March 1973. Processed.
Madavo, Callisto, Donna Haldane, and Sally Cameron. "Site and Services andUpgrading: A Review of World-Bank-Assisted Projects," Urban ProjectsDepartment. Washington, D.C, World Bank, January 1978. Processed.
Marga Institute. Housing in Sri Lanka. Colombo, 1976.
Mazingira Institute. "Post-Habitat Evaluation Report on Human Settlements."Nairobi, July 1978. Processed.
Ministerio de Desarrollo Econ6mico. "Zona Franca Industrial y Comercial deCartagena: Una Vision Nueva de Una Region en Desarrollo." Cartagena,August 1976.
____. "Zona Franca Industrial y Comercial de Cartagena: Area de Poblaci6n yMedio Ambiente: Informe Final," vol. 1, Bogota, December 1976. Processed.
Mohan, Rakesh. Urban Economic and Planning Models: Assessing the Potentialfor Cities in Developing Countries. Baltimore, Md.: Johns Hopkins UniversityPress, 1979.
Muller, M. S. "House Building in Site and Services Schemes: Some Observa-tions." University of Nairobi, Housing Research and Development Unit, June1977. Processed.
Musgrove, Philip. "Determinants of Household Consumption in Latin America:A Summary of Evidence form ECIEL Surveys." Economic Development andCultural Change (April 1978), pp. 441-65.
_____. Income and Spending of Urban Families in Latin America: The ECIEL
Consumption Study. Washington, D.C.: Brookings Institution, 1978.
Muth, Richard F. "The Influence of Age of Dwellings on Housing Expendituresand on the Location of Households." In Residential Location and Urban Hous-ing Markets. Edited by Gregory K. Ingram. Cambridge, Mass.: NationalBureau of Economic Research, 1977.
Payne, Geoffrey K. Urban Housing in the Third World. London: Leonard Hill,1977.
Prakash, Ved. New Towns in India. Durham, N.C.: Duke University Program inComparative Studies on Southern Asia, 1969.
REFERENCES 219
Prieto D., Rafael. Estructura del Gasto y Distribuci6n del Ingreso Familiar enCuatro Ciudades Colombianas, 1967-68. Bogota: CEDE, 1971.
-_____ "Gasto e Ingreso Familar Urbano en Colombia." Ensayos ECIEL (August1977), pp. 45-120.
Quigley, John. "What Have We Learned about Urban Housing Markets." In Cur-rent Issues in Urban Economics. Edited by Peter Mieszkowski and MahlonStraszheim. Baltimore, Md.: Johns Hopkins University Press, 1979.
Renaud, Bertrand. National Urbanization Policy in Developing Countries. NewYork: Oxford University Press, 1981.
Rosen, Sherwin. "Hedonic Prices and Implicit Markets: Product Differentiationin Pure Competition." Journal of Political Economy (January 1974), pp. 34-55.
Rueda Garcia, Nicolas. Centor de Planificaci6n y Urbanismo, Universityof the Andes, quoted in El Tiempo (August 19, 1978).
Serna Gomez, Humberto, and Francisco Rodriguez Urrego. Area de Promo-ci6n Humana y Desarrollo Tecnol6gico, Informe Segunda Etapa. Bogota:Ministerio de Desarrollo Econ6mico, September 1976.
Stevenson, Rafael. "Housing Programs and Policies in Bogota: A Historicaland Descriptive Analysis." Urban and Regional Report no. 79-8. Washington,D.C., World Bank, June 1978. Processed.
Strassmann, W. Paul. "Alternative Housing Strategies for Sri Lanka." MargaQuarterly Journal, no. 2 (1977), p. 30.
-_____ "Employment in Core House Building: A Comparison of Estimates fromSix Cities in Six Countries." East Lansing, Housing-in-Development Unit,Michigan State University, 1980. Processed.
- "Employment Generation through Residential Construction in Rio deJaneiro." Report for the U.S. Agency for International Development, Washing-ton, D.C., October 1975. Processed.
-_____ Housing and Building Technology in Developing Countries. MSU Interna-tional Business and Economic Studies. East Lansing: Michigan State Univer-sity, 1978.
_. "Housing Policy and Improvements by Owner-Occupants: A Com-parison of Neighborhoods in Lima, Peru." East Lansing: Michigan State Uni-versity, September 1981. Processed.
- "Housing Priorities in Developing Countries: A Planning Model." LandEconomics (August 1977), pp. 310-27.
-_____ "Innovation and Employment in Building: The Experience of Peru." Ox-ford Economic Papers (July 1970), pp. 243-59.
Triana y Antorveza, Humberto. Cultura del Tugurio en Cartagena. Bogota: Im-presa en Italgraf for UNICEF, 1974.
Turner, John F. C. Housing by People: Towards Autonomy in Building En-vironments. New York: Pantheon Books, 1976.
Ward, Barbara. The Home of Man. Toronto: McClelland and Stewart, 1976.
Wheaton, William C. "Income and Urban Residence: An Analysis of Consumer
220 APPENDIXES
Demand for Location." American Economic Review (September 1977), pp.620-31.
-_____ "Monocentric Models of Urban Land Use: Contributions and Criticisms."In Current Issues in Urban Economics. Edited by Peter Mieszkowski andMahlon Straszheim. Baltimore, Md.: Johns Hopkins University Press, 1979.
World Bank. Housing. Sector Policy Paper. Washington, D.C., 1975.
Yafiez Orviz, Jesus. "Optimal Allocation of Housing Investment in Five MexicanCities, 1960-70, 1970-85," Ph.D. dissertation, Michigan State University, EastLansing, 1976, pp. 116-23.
Zorro Sanchez, Carlos, and Edgar Reveiz Roldan. Estudio sobre Los Inquilinatos(Vivienda Compartida en Arrendamiento) en Bogota. Bogota: Centro de Es-tudios sobre Desarrollo Econ6mico, University of the Andes, Etapa I February1974 and Segunda Parte June 1976.

Index
Age of dwelling, 113-14 gram for, 55-58; new housing and, 78;Amortization periods, 49, 57, 59; dwelling program for, 145-47; residential, 152,
value and, 141 153; self-financed, 50Apprenticeship. See National apprentice- Construction costs: employment and, 95-
ship service (SENA) 99; ICT and, 89-90; inflation and, 93-94;Assessments, 59-60 for new housing, 151; sextupled, 130;Attitudes. See Gap mentality; Paternalism sulfur bonding and, 101
Construction material, 127, 159; discount-ing costs of, 132; dwelling value and, 78;
Banco Central Hipotecario (BCH): loan innovations in, 100-01, 151; loans for,policy of, 53, 58-59; real estate tax ex- 153; owner-occupants and, 106-07; sub-emption and, 59 sidizing for poor, 156-57
Basic needs, 22; water and, 32-33 Contractors: icT and, 89-93, 123; incomeBenefits, flows of, 23 of, 99; small, 153Botero, Norma L., 95, 99 Cort6s Diaz, Lacydes, 27-29Botswana, 153 Costs. See Construction costsBudget surveys (housing), 209-12 cvp. See Caja de Vivienda Popular of BogotaBuilding material. See Construction ma- (cvp)
terialDemand, 6, 7; income elasticities of, 66-72,
75, 120, 150; land and location and, 61-Caja de Vivienda Popular of Bogota (cvp), 62. See also Housing needs
147; housing projects of, 214-15; IcT and, Demolition. See Housing eradication58 Density, 15, 137; housing models and, 197-
Cartagena: employment in formal sector 201; of settlement, 24; standards for, 23-of, 15-17; free port project in, 17-18; his- 24; study sample and, 161tory of, 10-12; overview (tour) of, 18-21; Developers, 90-92, 104population and economy (1970s) of, 12- Down payments, 53, 5715 Drainage, 35, 36
Cebrecos Revilla, Rufina, 97 Dwelling value: access to water and, 119,CENAC (National Center of Construction 120-22; assessment and, 59-60; averaged,
Studies), 26 49-50; determinants of, 79-84; familyCiudad Kennedy (Bogota), 202-03 size and, 51-52; floor space and, 84-85;Collection (tax and service), 60-61 hedonic analysis and, 85-87; housing typeCommuting, 21, 61-62; housing choice and, and, 74, 75; ICT and, 89; improvements
64-65 and, 113-14; income elasticity of demandCompensation (eradication), 87-88 and, 66-67; inflation and, 92-94; lot sizeConstruction: developers and, 90-93; em- and, 62; materials and, 78; plumbing
ployment and, 94-100; GNP and, 23; facilities and, 78; study matrix and, 140,housing type and, 75; icT layout and, 90; 141-43, 152, 185-96; study sample and,ICT and new, 89-90; icr progressive pro- 165; willingness to pay and, 45-46
221

222 INDEX
Economic development: housing and, 3-5; 157-58; owner-occupied, 49-51; the poorin 1970s, 12-15 and, 154-57; projections to 1990 and,
Education, 13 143-45; stock-user matrix and, 138-43,Electricity, 77 151-52, 185-96; types of, 77-79; upper-El Milagro (squatter settlement), 19-20 income group and, 158-59; worker re-El Socorro, 126-27 cruitment and, 63Employment: construction and, 94-100, Housing category: building program (future)
151; in formal sector, 15-17; housing and, 145, 147; household heads and, 153-and, 3; in 1970s, 12; in Southeast, 207-08 54; improvements and, 113-14; owner-
Eradication. See Housing eradication occupant improvements and, 113; studyExpansion (Ciudad Kennedy), 202-03 matrix and, 139, 143Exports, 17 Housing eradication, 124, 131, 137; analy-
sis of, 87-89; policy toward, 132; study
Family structure, 26-29. See also House- projections and, 143holds Housing market, 149; analysis of, 104-05;
Financing, 8; BHc and, 58-59; of construc- income variations and, 66-67; social classtion, 50; general view of, 52-53; ICT and, and, 133-3653-58, 119, 122-27; improvements and, Housing models (study), 197-201114-17; income and, 151; the poor and, Housing needs, 24, 36, 14951 Housing stock, 6, 7, 166; characteristics of,
Floor space, 131, 152; dwelling value and, 75-78; population growth and, 26; study84-85; new construction and, 89; in matrix and, 138-43; subdivisions and, 7owner-occupant houses, 107-09; study Housing survey study: housing models and,matrix and, 189 197-201; overview of, 5-8; questionnaire
Free port, 17-18 for, 6, 162-64, 167-84; sample used in,Fuel (cooking), 111 161-66; stock-user matrixes and, 185-96
Housing value. See Dwelling value
Gap mentality, 155 ICT. See Territorial Credit Institute (ICT)
Government: building policy suggestions Improvements, 7, 8, 62, 103-04, 150, 153,and, 145-47; of Cartagena, 12; as land- 165-66; in Ciudad Kennedy (Bogota),lord, 130-31; the poor and, 155 202-03; dwelling value and, 79; eradica-
tion policy and, 132; icT loans for, 55;Hedonic analysis, 85-87 owner-occupants and, 105-13; the poorHome improvement. See Improvements and obstacles to, 154-56, 157; rentalHousehold heads, 153-54 housing and, 127-31; strategy for, 3-4,Households: building program (future) and, 149; study housing models and, 198-99;
147; defined, 26-29; housing market study matrix and, 140, 152, 196analysis and, 104, 135-36; income esti- Income: construction employment and, 99;mates and, 38-41, 42-44; stock-user ma- elasticities of demand, 66-72, 75, 120,trixes and, 151-52; study matrix and, 139 150; floor space and, 85; household, 38-
Household size: housing market and, 134, 41; household structure and, 27, 29;135, 149; housing value and, 51-52; lot housing market and, 133-36; housingsize and, 61; in 1978, 31-32; projections standards and, 149-50; housing valueand, 37; room additions and, 110; ten- and, 52; ICT financing and, 125; improve-ants and, 49, 152 ments and transitory, 114-16; improve-
Housing: budget survey (Latin America) of ments and water and, 120-22; landlord209-12; commuting and choice of, 64-65; (Ciudad Kennedy), 202; from meals atdeficit in 1973 and, 29-31; economic de- work, 39, 40; median (1978), 72; in 1970s,velopment and, 3-5; financial overview 12-13; occupations and levels of, 41-45;of, 52-59; middle-income group and, owner-occupants and, 50-51, 113; study
INDEX 223
matrix and, 139, 185-96; study projec- National apprenticeship service (SENA), 157;tions and, 143-45; tenure and, 46-47; of construction employment and, 99water sellers, 33; the zones and, 44-45 National Center of Construction Studies
Income distribution, 38, 150; study projec- (CENAC), 26tions and, 143-45
Inflation, 92-94 Occupations, income and, 41-45Ingram-Oron model, 199-201 Output, 17
Owner-occupants: access to water and, 119;additional rooms and, 106-10; floor space
Jamaica, 153 and, 84, 85; housing and, 49-51, 150,151, 153; improvements and, 103, 152;
Kitchens, 88; owner-occupants and, 111, income for housing and, 46113
Pacheco, Gustavo, 24-26, 161Paternalism, 155
Land, 15; assessment of, 59-60 Payments, 45-46, 47; ICT loan, 123Landlords: the government as, 130-31; ICT Peru, 119, 123; construction employment
loans and, 122; income of (in Ciudad in, 95, 97, 99Kennedy), 202; rental housing and, 129- Piped water, 150; demand elasticities and,30, 132, 151 72; dwelling value and, 78, 81-82; hous-
Latin America (housing budget survey), ing type and, 77; improvements and,209-12 132; owner-occupants and, 51; percent of
Linn, Johannes, 141, 153 dwellings with, 33Loans, 158; 8cH, 53, 58-59; building ma- Plumbing: dwelling value and, 78, 81, 82;
terial, 153; ICT home improvement, 55, housing type and, 77; layout and, 90;58, 122-27 owner-occupant houses and, 51, 111-12;
Location, 104, 105; demand and, 61-62; study matrix and, 189housing models and, 197-98; moving The Poor: building program (future) and,and, 62-66 147; concrete block houses for, 100; dis-
Lots, 137; cost of, 89; location and value of, counting materials costs to, 132; financ-61-62 ing and, 51; housing market and, 133;
Low-income housing, 124, 153 housing prospects for, 156-57; housingstrategy and, 3-5; obstacles to improve-ments and, 154-56; room additions and,
Manila, 153 8; tenure and, 137-38. See also SocialMarriage customs, 27-29 classMaterial. See Construction material Population of Cartagena, 113, 149; 1811,Mexico, 96 10, 1950s, 11; 1905-1912, 11: 1970s, 12-Middle-income group: housing market and, 15; projections of, 24-26, 36, 143
133-34; housing prospects for, 157-58. Privacy, 90See also Social class Property value. See Dwelling value; Site
Migrants: mobility and, 62, 63; of 1950s, value11; to Venezuela, 141 Public housing developments, 19
Mobility. See MovingMortgages, 126; floor space and, 84; ICT,
53; payment willingness and, 45-46, 104, Questionnaire (study), 6; development of,study matrix and, 141 162-64; example of, 167-84
Moving, 7, 72, 110; location and, 62-66;payments and, 45; upper-income house- Racial prejudice, 27holds and, 45 Real estate taxes, 126, 137; general system
Muth, Richard, 197 of, 59-61
224 INDEX
Regulations, improvement investments and, Social class: family structure and, 27; house-155 hold definition and, 29; household size
Remittances from Venezuela, 51, 139, 141, and, 37; housing categories and, 139;143; improvements and, 114-16; income housing market analysis and, 133-36;elasticities calculations and, 71, 72; in- housing prospects and, 156-59; improve-come estimates and, 41; percent of house- ments and, 103; ownership and, 150. Seeholds receiving, 72 also Middle-income group; The Poor;
Renaud, Bertrand, 8ni The RichRent: analysis of, 47-49; average, 127-28, Southeast Zone: census (1976), 205-06;
136; imputed, 40; payment willingness dwelling value and, 121; employment in,and, 45-46, 104; raised, 150; study ma- 207-08; floor space in, 109; housingtrix and, 189 market and, 136-38; physical description
Rental housing: floor space and, 84-85; of, 20; study overview and, 6, 159-60;government and, 130-31; improvements survey (1970), 204; urban developmentand, 128-29; landlords and, 129-30; plan and, 15rooms as, 131; study matrix and, 189; Squatters, 5, 89, 90, 117, 119; in El Milagro,survey of, 127-28 19-20; first (1955), 11; housing eradica-
Rent control, 128, 129, 159 tion and, 87; housing market and, 136-The Rich: housing market and, 135; hous- 38; icT financing and, 123; income sources
ing prospects for, 158-59; mobility of, and, 40; in Southeast Zone, 20; tenure45; room additions and, 8; as tenants, 45. and, 154See also Social class Standards: density, 23-24; housing, 23,
Roofs: cepillos, 124; owner-occupant im- 149-50provements and, 106 Subdivision: in Ciudad Kennedy, 202-03;
Room additions, 8, 124, 125; owner-occu- housing stock and, 7pants and, 106-10, 113; renting of, 131 Subsidies, 143, 158; credit, 125-26; housing
Rooms, 85, 152; dwelling value and, 79; strategies and, 3; infrastructure, 23; ma-floor space and, 84; housing type and, terials and, 156-5777; for rent, 131; study matrix and, 189 Sulfur bonded houses, 100-01, 151
Supply, 6, 7. See also Housing stock.
Sanitary facilities. See Piped water; Plumb-ing; Septic tanks; Sewerage systems;Toilets; Washing facilities Taxes, 143; sewerage, 35; upper-income
Self-help, 79, 143, 147, 150, 154 group and, 158. See also Real estate taxesSENA. See National apprenticeship service Tenants: analysis of, 47-49; high-income
(SENA) families as, 45; household size and, 152;Septic tanks, 35, 77, 82, 87, 123; owner- housing market and, 134, 135; improve-
occupants and, 111-12 ments and, 128, 129, 132; income of, 150;Services, 130, 131, 156; case history of im- income elasticities of demand and, 71,
provement, 126; charges for, 60-61; flows 72; mobility of, 72; study matrix and, 152of, 22-23; lot size and value and, 62; pay- Tenure: floor space and, 84; ICT financingment and, 104; water installation and, and, 123; income and, 46-47; mobility111 and, 63; poor households and, 137-38;
Sewerage systems, 123, 150; access to, 104; squatters and, 154dwelling value and, 82; housing type Territorial Credit Institute (icr), 147, 156;and, 77; improvements and, 119; percent- alternative housing and, 79; developmentage of dwellings with, 33-36; property programs of, 53-58; house layout and,value and, 62; pumping stations in, 35; 90; improvement financing by, 119, 122-service charges and, 60-61 27; new housing and, 89-90; public hous-
Site value, 83-84, 143, 151 ing and, 19; real estate tax exemption
INDEX 225
and, 59; sanitation infrastructure and, Water: access to, 104, 119, 120, 154; dwell-35, 36; squatters and, 19-20 ing value and, 78, 82; hedonic analysis
Toilets, 77, 81, 90; owner-occupants and, and, 85-87; housing type and, 77; im-111-12 provements and, 117-22, 132; owner-
Tourism, 13, 18 occupant houses and, 111; price of, 32-Triana y Antorveza, Humberto, 27 33; property value and, 62; service
charges and, 60-61; in Southeast, 136.Unemployment, 12, 41 See also Piped water; Plumbing; SepticUpgrading. See Improvements tanks; Sewerage systems; Toilets; Wash-Urban physical development plan (1978), ing facilities
13-15 Water sellers, 136; income of, 33; waterUtilities, 8; importance of, 78; improve- connections and, 77
ments and, 117-18; need for public, 24; Wheaton, William C., 197owner-occupants and, 112 World Bank, 5, 35, 149, 152, 153
Valdez, Rocky, 44 Zambia, 153Value. See Dwelling value; Site value Zona Franca Industrial y Commercial deVenezuela. See Remittances from Venezuela Cartagena (zFIc), 17-18
Zones, 24-26; assessment procedures and,Walls, 107; dividing, 124-25 59, 60-61; income characteristics and,Washing facilities, 90 44-45; value and location in, 62
The full range of World Bank publications, bothfree and for sale, is described in the Catalog ofWorld Bank Publications; the continuing researchprogram is outlined in World Bank Research Pro-gram: Abstracts of Current Studies. Both bookletsare updated annually; the most recent edition ofeach is available without charge from the Publica-tions Distribution Unit (Dept. B), World Bank,1818 H Street, N.W., Washington, D.C. 20433,U.S.A.
W. Paul Strassmann is professor of economicsand director of the Housing in Development Unitat Michigan State University and is a consultant tothe World Bank.


0