belize - World Bank Documents & Reports
155
A WORLD BANK COUNTRY STUDY e ~ t BELIZE Economic Report I/ &N Public Disclosure Authorized Public Disclosure Authorized Public Disclosure Authorized Public Disclosure Authorized
-
Upload
khangminh22 -
Category
Documents
-
view
3 -
download
0
Transcript of belize - World Bank Documents & Reports

A WORLD BANK COUNTRY STUDY e ~ t
BELIZEEconomic Report
I/
&N
Pub
lic D
iscl
osur
e A
utho
rized
Pub
lic D
iscl
osur
e A
utho
rized
Pub
lic D
iscl
osur
e A
utho
rized
Pub
lic D
iscl
osur
e A
utho
rized

IBRD ~7615B~00 a8~30~ ~j8B~00 'i 8~30' OCTCJP.ER 1983
f~ ....-....CheiUnal MEXICO i8~30,-"Chan I .. ~ j
Chen Canseio
icon *. C/wi jnw/ 8~y /Corozal I /M E X ICC 2-~ ~ S ./
Lob,mIIC /Fh~5C i"i9 ~Ji
San j ~5IDouglas -... Progresso
) I CA~! BEAN SEASanAntonio COROZAL
' Yo Oronge DISTRICT /jCreek Wall'
Carmel~a "s' - AMBERGRIS I8~ 00/ Augusi
( L..~ PineR~dge ~?San Pedro
I Neusia&
Son FeIpe ~ I MaskallSan tan
-. ORANGE WAL K Chicago /DISTRICT r Y K
(Bermud ~ SandCC Boom/ Hill
jtandng Ci / I
< (Ranc ai7C30 /Dalaresj1 BELIZE Behze ~ "'
Haitievitle '-. ~ 1r' ~1 TURNEFFE5 3
/0 ISLANDS 7
Orange '--- IDISTRIf~7V i / .* ~i,4iA7~r','
t~ LS"IBELMOPAN . ~'
'It
}i'ii.c del Carmen BELl ZE t~00'bC1 C~AYO DISTRICT ,~) AliaVisia
Dangriga ~ j Main Roads6' ____________ Other Roads
U National Capital7 DISTRICT ' 0 District Capitols
) I*,R;~ersdole ki a Towns and Villages
e"Se,ne Bghi *~iag'~ ~ '''~ ' kind Boundaries5 Piacenr~a - -. International Boundaries 30
1 ~ Medino flank ~'" KILOMETERS 9 19 2p 39 49 5,0*1 MILESiTOLEDOHeiIgO.- DISTRICT 0-"" ~ 0 ID 20 30
USA '/ Sin Aviv's Bi~ Fall - SAPODILLACAYS ,,- .- 'C~p~ BAH-sM'-iS
MEXiCO JTi~~ Punto Gorda JAMAICA
uAirsr.aJ
I I6~~G '~*'~ of H~ dc,ras I6~00 BELIZE EULCHONDURAS
/ s'"t
- C '~ VENEZuELAIOU ~ ' SALVADOR . COLOMBiAI A F A -- t 3 '~--o P,,erro Care,,.' HONDuRAS.' I ______________________________________________________
A WORLD BANK COUNTRY STUDY
BELIZEEconomic Report
The World BankWashington, D.C., U.S.A.
Copyright @ 1984The International Bank for Reconstructionand Development/ The World Bank1818 H Street, N.W.Washington, D.C. 20433, U.S.A.
First printing February 1984All rights reservedManufactured in the United States of America
World Bank Country Studies are reports originally prepared for internal use as partof the continuing analysis by the Bank of the economic and related conditions ofits developing member countries and of its dialogues with the governments. Someof the reports are published informally with the least possible delay for the use ofgovernments and the academic, business and financial, and development commu-nities. Thus, the typescript has not been prepared in accordance with the proce-dures appropriate to formal printed texts, and the World Bank accepts no responsi-bility for errors. The publication is supplied at a token charge to defray part of thecost of manufacture and distribution.
Any maps used have been prepared solely for the convenience of the readers;the denominations used and the boundaries shown do not imply, on the part ofthe World Bank and its affiliates, any judgment on the legal status of any territoryor any endorsement or acceptance of such boundaries.
The full range of World Bank publications is described in the Catalog of WorldBank Publications; the continuing research program of the Bank is outlined in WorldBank Research Program: Abstracts of Current Studies. Both booklets are updated annu-ally; the most recent edition of each is available without charge from World BankPublications in either Washington or Paris (see the back cover for addresses).
Library of Congress Cataloging in Publication DataMain entry under title:
Belize, economic report.
(A World Bank country study)1. Belize--Economic conditions. 2. Belize--Economic
policy. 3. Belize--Foreign economic relations.I. World Bank. II. Series.H1C142.B45 1984 330.97282'052 83-25970ISBN 0-8213-0308-2

- 111 -
PREFACE AND ABSTRACT
This report is based on the findings of an economic mission to Belizeduring November 1982. The mission consisted of: Carlos Elbirt, Chief (IBRD),Joe Eory (IBRD), Jorge Garcia Garcia (Consultant), Allan Slusher (CDB), VilaySoulatha (IBRD), and Dolores Velasco (IBRD).
The report has four main objectives. First, description of the economyof Belize. Second, analysis of current economic policies and development issues.Third, analysis of the public sector investment program. Fourth, assessment ofthe prospects of the Belizean economy and of the country's creditworthiness,
The Belizean economy expanded steadily during the 1960's and most of the1970's. But economic growth slowed sharply during 1978-82 mainly because of theinternational recession and diseases affecting sugarcane, the main activity.
Central Government finances have been managed soundly while those ofseveral statutory bodies typically have not. But with a weakened economy evenCentral Government's finances have deteriorated in recent years. As a result,domestic credit to the public sector has been growing very rapidly.
National savings and current account balance of payments deficits havefluctuated sharply, reflecting fluctuations in sugar export earnings. Bothaveraged about 13% of GNP during the last quinquennium. Investments account for25% to 30% of GDP. A sizeable part of public investment, about 70% of the total,has been financed by external capital, mostly in the form of grants and loans onconcessional terms.
The public sector investment program gives high priority to the execu-tion of those infrastructural projects that constitute a prerequisite to produc-tive investments; namely electricity, roads and ports.
Belize has physical resources to develop further its economy in agri-culture, agroprocessing, fishing and tourism, Development policies are, by andlarge, sound. But the country lacks financial and human resources. Because ofthe small size of the domestic market, development efforts should concentrate onexport-oriented activities, Prospects for economic growth and balance of paymentssustainability look favorable provided that there is a recovery in the worldeconomy.
The public debt service ratio has been low, less than 5% of exports butis projected to increase reaching about 10% by 1995 as more loans in conventionalterms are contracted.
- iV -
PREFACIO Y EXTRACTO
Este informe se basa en las conclusiones alcanzadas por una misi6necon6mica que visit6 Belice en noviembre de 1982. La misi6n estuvo compuesta delas siguientes personas: Carlos Elbirt, Jefe (BIRF), Joe Eory (BIRF), JorgeGarcia Garcia (consultor), Allan Slusher (BDC), Vilay Soulatha (BIRF) y DoloresVelasco (BIRF).
El informe tiene cuatro objetivos principales: primero, descripci6nde la economia de Belice; segundo, anAlisis de las actuales politicas econ6micasy cuestiones relativas al desarrollo; tercero, anAlisis del programa de inver-siones del sector p6iblico, y cuarto, evaluaci6n de las perspectivas de la econo-mia de Belice y de la capacidad crediticia del pals.
La economia de Belice creci6 constantemente durante el decenio de 1960y la mayor parte del de 1970. Sin embargo, el crecimiento econ6mico disminuy6pronunciadamente durante el perlodo de 1978-82, principalmente debido a la rece-si6n internacional y alas enfermedades que afectaron a la cafia de azalcar, cuyocultivo constituye la principal actividad del pals.
Las finanzas del Gobierno central han sido administradas adecuada-mente, en tanto que las de varios organismos de derecho palblico normalmente nolo han sido. No obstante, con una economia debilitada, incluso las finanzas delGobierno central se han deteriorado en los 61timos afios. Como resultado dee110, el cr6dito interno al sector paiblico ha crecido muy rApidamente.
Los d4ficit del ahorro nacional y de la balanza de pagos en cuentacorriente han fluctuado pronunciadamente, como reflejo a su vez de fluctuacionesen los ingresos de exportaci6n del azalcar. Ambos representaron como promedioaproximadamente el 13% del PNB durante el ii1timo quinquenio. Las inversionesrepresentan de 25% a 30% del PIB. Una cuantiosa parte de la inversi6n paiblica,mis o menos el 70% del total, se ha financiado mediante capital externo, en sumayor parte en forma de donaciones y prestamos en condiciones concesionarias.
El programa de inversiones del sector palblico da prioridad a la ejecu-ci6n de los proyectos de infraestructura que constituyen un requisito para lasinversiones productivas, a saber, electricidad, caminos y puertos.
Belice tiene recursos fisicos para desarrollar ain mis su economia enlos sectores de agricultura, agroindustria, pesca y turismo. Las politicas dedesarrollo son en general adecuadas. No obstante, el pals carece de recursosfinancieros y humanos. Debido al pequefio tamalo del mercado interno, losesfuerzos de desarrollo deben concentrarse en actividades orientadas a la expor-taci6n. Las perspectivas de crecimiento econ6mico y de viabilidad de la balanzade pagos se yen favorables, siempre que haya una recuperaci6n en la economiamundial.
El coeficiente del servicio de la deuda pGiblica ha sido bajo, inferioral 5% de las exportaciones, pero se preve que aumentar& a aproximadamente 10% en1995 a medida que se obtengan mis prestamos en condiciones ordinarias.

- v -
Ce rapport est fond6 sur les conclusions d'une mission economiquecompos&e de MM. Carlos Elbirt, Chef de mission (BIRD), Joe Eory (BIRD), JorgeGarcia Garcia (Consultant), Allan Slusher (BDC), Vilay Soulatha (BIRD) et deMmne Dolores Veleasco (BIRD), qui s'test rendue au Belize en novembre 1982.
Les quatre principaux objectifs de ce rapport sont de decrire 1'eco-nomie du Belize, d'analyser sa politique economique actuelle et ses problAmesde developpement, d'examiner le programme d'investissements publics et enf in,d'6valuer les perspectives de 1'e6conomie et la capacit& d'emnprunt du pays.
L'economie du Belize s'est d6veloppee sans A-coups pendant lesann6es 60 et la majeure partie des annees 70, mais sa croissance s'testconsiderablement ralentie entre 1978 et 1982, principalement en raison de larecession mondiale et des maladies qui ont compromis la production de canne Asucre, principale activiti du pays.
Contrairement A celles de plusieurs organismes dtEtat, les financespubliques sont convenablement gerees. Elles ont n4anmoins subi, elles aussi,le contrecoup du flechissement de 1'activit6 enregistre depuis quelquesannees. Cela s 'est traduit par un gonflement tres rapide du cridit int6rieurau secteur public.
L'6pargne interieure at le deficit de la balance des paiementscourants ont accusA de fortes fluctuations, reflitant celles des recettesprovenant des exportations de sucre. Leur niveau moyen s'est etabli a 13 %environ du PNB au cours des cinq dernies ann6es. Les investissements absor-bent de 25 A 30 % du PIB. Une part importante de 1'investissement public,equivalente A 70 % environ du total, est financee par des capitaux exterieursprovenant essentiellement de dons et de prAts assortis de conditions liberales.
Le programme d'investissements publics attribue un haut rang depriorit6 aux projets d'equipement qui conditionnent la r4alisation d'inves-tissements productifs, A savoir les projets d'Alectricit& et d'amenagementroutier et portuaire.
Le Belize dispose des ressources matirielles nicessaires pour deve-lopper davantage son 4conomie et, en particulier, les secteurs de 1'agricul-ture, des agroindustries, de la pAche et du tourisme. Dans 1'ensemble, sastrat6gie de dAveloppement est bien conque. Toutefois, il manque de ressourcesfinancieres et humaines. Vu l'etroitesse du marche interieur, il devraitfaire porter ses efforts de d&veloppement sur les activites orientees vers1'exportation. Les perspectives de croissance 4conomique et de redressementdurable de la balance des paiements semblent favorables, mais elles dependentde la reprise de 1'economie mondiale.
Le ratio du service de la dette publique est faible puisqu'il repre-sente moins de 5 % de la valeur des exportations, mais il devrait passer A10 % environ d'ici A 1995, A mesure que le pays contractera davantaged'emprunts aux conditions du marche.


- vii -
TABLE OF CONTENTS
Page No.
PREFACE AND ABSTRACT
COUNTRY DATA
SUMMARY AND CONCLUSIONS....*****...................xi
I. POPULATION AND EMPLOYMENT............................1
II. ECONOMIC BACKGROUND................................6Output and Economic Growth.........................6The Public Sector............................. 9Balance of Payments.............................12Foreign Currency Controls..........................17Money and Credit............................ 18
III. POLICIES ON PRICES, IMPORT LICENSES AND INCENTIVES..................21Introduction ......................................... *....... 21Import Tariffs..................................................... 21Price Controls ................................................ 21The Marketing Board and the Price Policy...................22Import Licensing...............................23Import Duty Exemptions..............................24Development Incentives.............................24Conclusions....................................25
IV. MAJOR SECTORAL ISSUES.............................27A. Agriculture.................................................. 27B. Fisheries...................................................... 32C. Tourism............................... 32D. Power............................... 34E. Transport..................................35F. Social Infrastructure..........................37
Education................................37Health...........................**............38Social Security...............................38Telecommunications...........................39
V. PUBLIC SECTOR INVESTMENT PROGRA.....................40
VI. OUTLOOK.....................................45A. Output, Income and Expenditure.....................45B. Balance of Payments****.........................47C. Creditworthiness..............................49
Projection of Capital Inflows.......................50Conclusion*...............................51
ANNEX A - Government's Project List....................53
STATISTICAL APPENDIX............................59
MAP

- v111 -
CURRENCY EQUIVALENTS
Currency Unit: Belize Dollar
Since its creation the Belize Dollar (formerly the British Honduras Dollar) was
tied to sterling at the rate Li = Bz$4.00. In May 1976 the link with sterling wasbroken and the Belize Dollar was aligned with the US dollar at the rate US$1.00=
Bz$2.00.
Since May 1976:
Bz$1.00 = US$0.50 or
US$1.00 = Bz$2.00

- lX -.
Page 1 of 2
COUNTRY DATA - BELIZE
AREA POPULATION DENSITY22,960 km2 145,353 (1980 Census) 6 per km2
Rate of Growth: 1.9 (from 1970 to 1980) 15 per km2 of arable land
POPULATION CHARACTERISTICS (1980) HEALTH (1980)Crude Birth Rate (per 1,000) 43.1 Population per physician 2202Crude Death Rate (per 1,000) 4.9 Population per hospital bed 261Infant Mortality (per 1,000 live births) 30.2
INCOME DISTRIBUTION 1975 DISTRIBUTION OF LAND OWNERSHIP% of national income, highest quintile .. X owned by top 10% of owners .
lowest quintile .. % owned by smallest 10% of owners .
ACCESS TO PIPED WATER (1980) ACCESS TO ELECTRICITY (1980)% of households - urban 87.5 % of households - urban) 86.5
- rural 29.5 - rural) 29.1
NUTRITION (1977) .EDUCATION (1980)Calorie intake as % of requirements 125.0 Adult literacy rate % 92.0Per capita protein intake (gm/day) 69.3 Primary school enrollment % 85.0
GNP PER CAPITA in 1981: US$1,070
GROSS NATIONAL PRODUCT IN 1981 ANNUAL RATE OF GROWTH (%, constant prices)
US$ M1n. %_ 1978-81 1981-82
GNP at Market Prices 160.7 100.0 4.9 0.1Gross Domestic Investment 44.6 27.7 4.1 -16.6Gross National Saving 22.4 13.9 -4.6 -54.3Current Account Balance -22.2 -13.8..Exports of Goods, NFS 145.9 90.7 0.0 -13.0Imports of Gobds, NFS 176.0 109.5 5.9 -10.9
OUTPUT IN 1981
Value AddedUS$ M1n. %
Agriculture 57.6 - 43.5Industry and Construction 19.5 14.7
Services 55.2 41.7
Tota1. 132.3 100.0
GOVERNMENT FINANCE. Consolidated Public Sector Central Government
*' ( Bz$ M1n.) % of GDP ( Bz$ M1n.) % of GDP1980/81 1981/82 1980/81 1981/82 1980/81 1981/82 1980/81 1981/82
Current Receipts ., ,, .. .. 81.9 83.9 27.2 25.4Current Expenditure .. .. .. .. 64.2 75.1 21.4 22.8Current Surplus 16.3 9.3 5.4 2.8 17.7 8.8 5.8 2.5Capital Expenditures 45.9 50.6 15.3 15.4 27.1 30.9 9.0 9.4External Assistance (net) 20.3 29.4 6.8 8.9 5.1 15.3 1.7 4.6
.not available
.not applicable
Page 2 of 2
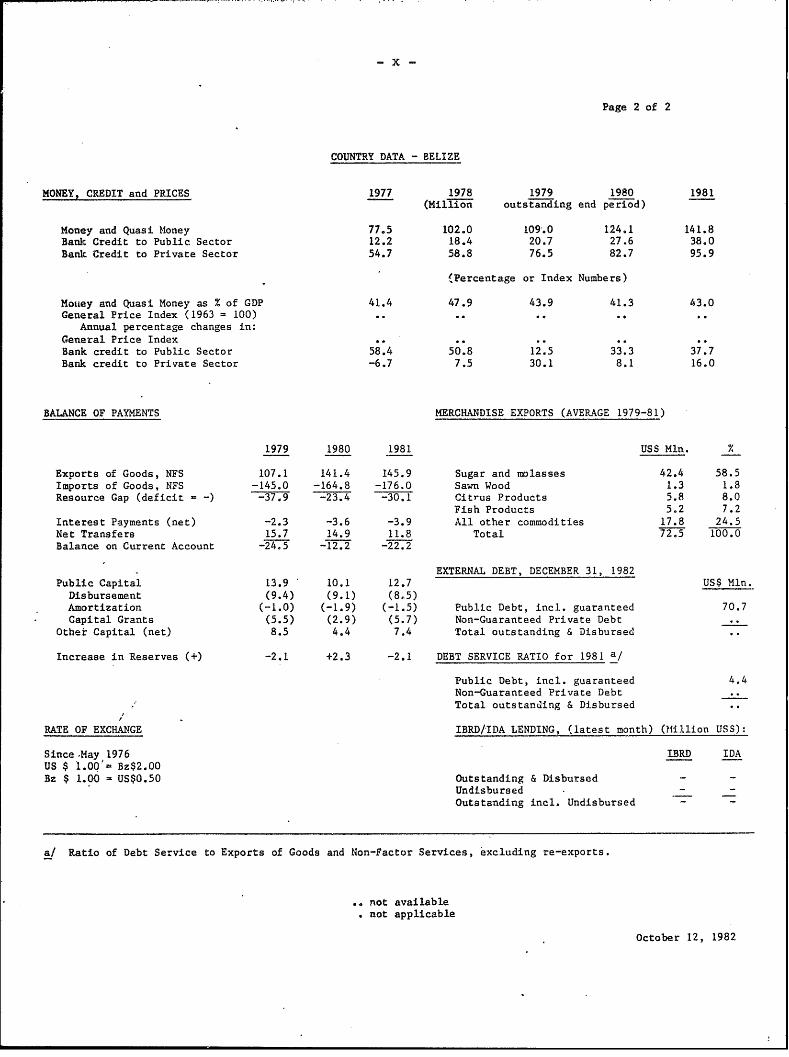
COUNTRY DATA - BELIZE
MONEY, CREDIT and PRICES 1977 1978 1979 1980 1981___________________ - (Million outstand~ing end period)
Money and Quasi Money 77.5 102.0 109.0 124.1 141.8Bank Credit to Public Sector 12.2 18.4 20.7 27.6 38.0Bank Credit to Private Sector 54.7 58.8 76.5 82.7 95.9
(Percentage or Index Numbers)
Money and Quasi Money as % of GDP 41.4 47.9 43.9 41.3 43.0General Price Index (1963 =100) .. .. . ..
Annual percentage changes in:General Price Index . .. ..Bank credit to Public Sector 58.4 50.8 12.5 33.3 37.7Bank credit to Private Sector -6.7 7.5 30.1 8.1 16.0
BALANCE OF PAYMENTS MERCHANDISE EXPORTS (AVERAGE 1979-81)
1979 1980 1981 USS M1n. %
Exports of Goods, NFS 107.1 141.4 145.9 Sugar and molasses 42.4 58.5Imports of Goods, NFS -145.0 -164.8 -176.0 Sawn Wood 1.3 1.8Resource Gap (deficit = -) -37.9 -23.4 -30.1 Citrus Products 5.8 8.0
Fish Products 5.2 7.2Interest Payments (net) -2.3 -3.6 -3.9 All other commodities 17.8 24.5Net Transfers 15.7 14.9 11.8 Total 72.5 100.0Balance on Current Account -24.5 -12.2 -22.2
EXTERNAL DEBT, DECEMBER 31, 1982Public Capital 13.9 10.1 12.7 UJSS M1n.
Disbursement (9.4) (9.1) (8.5)Amortization (-1.0) (-1.9) (-1.5) Public Debt, inc. guaranteed 70.7Capital Grants (5.5) (2.9) (5.7) Non-Guaranteed Private Debt .._
Other Capital (net) 8.5 4.4 7.4 Total outstanding & Disbursed .
Increase in Reserves (+) -2.1 +2.3 -2.1 DEBT SERVICE RATIO for 1981 af
Public Debt, inc. guaranteed 4.4Non-Guaranteed Private Debt .Total outstanding & Di.sbursed .
RATE OF EXCHANGE IBRD/IDA LENDING, (latest month) (Million USS):
Since .May 1976 IBRD IDAUS $ 1.00'= Bz$2.00Bz $ 1.00 =US$0.50 Outstanding & Disbursed - -
Undisbursed .- -
Outstanding inc. Undisbursed - -
a/ Ratio of Debt Service to Exports of Goods and Non-Factor Services, excluding re-exports.
.not available.not applicable
October 12, 1982

- X1 -
SUMMARY AND CONCLUSIONS
i. Belize, located on the Yucatan Peninsula, Central America, attained in-dependence from the UK on September 21, 1981. With 145,000 people living in anarea of 23,000 Kin2, the country has one of the lowest population densities in theworld, six persons per Km2. An English speaking country, Belize is the homelandof peoples with varied backgrounds: Creole, Mestizos, Mayans, Garifunas, Euro-peans and Arabs.
ii. The population has been growing relatively slowly at 2% per year inrecent times. This is caused by large-scale emigration; as the natural populationincrease is relatively high, about 3.4% per year. About 15% the total population,20,000 Belizeans, have emigrated to the US during the 1970s.
iii. Belize's economy is based on sugar, bananas, citrus, fishing, some lightindustry and tourism. Economic activities are mostly export-oriented; on theother hand, there is heavy reliance on imports to satisfy a sizeable part ofdomestic consumption and practically all investment requirements. The last fewyears have seen the development of transshipment to Mexico as a significant con-tributor to the economy, especially in Belize City.
iv. GNP per capita is around US$1,000 and appears to be relatively evenlydistributed. Ownership of the economy is principally in the hands of the privatesector. Foreign investment dominates manufacturing, banking, insurance, sugarcaneprocessing and forestry. Local investment is important in agriculture, distribu-tion and tourism. The Government owns large tracts of mostly unutilized lands.
v. The Belizean economy expanded steadily during the 1960s and most of the1970s; real GDP grew 4 to 5% per year. Agriculture expanded rapidly as sugar pro-duction increased and the banana industry was reestablished. Manufacturing alsogrew fast as a number of import-substituting industries and an export-orientedgarment factory were established. But economic growth slowed sharply during1978-1981 with real GDP growing by an annual average of only about 1.8% duringthis period. Sugar, which accounts for about 25% of GDP, explains to a largeextent this performance. Sugar production declined by 13% in 1979 as a result ofsmut disease. Some recovery took place in 1980 but it was followed by anotherdecline in 1981. These fluctuations in sugar production are explained by twomain factors: first, replanting with smut-resistance varieties has taken placegradually, thus the disease has not been totally erradicated; and, second, the newsmut-resistant varieties have less sugar content than the ones they replace.Non-sugar agriculture and manufacturing performed satisfactorily during 1978-81.

- X11 -
vi. The Belizean economy suffered from the international recession in 1982.The decline in prices of sugar and citrus and the adverse impact on the bananaindustry of the appreciation of the US dollar against the pound sterling, have re-sulted in a 4.5% decline in the real gross domestic income during 1982. On theproduction side, sugar production increased by about 8% thus partially compensat-ing for the decline in construction, trade, and garments. As a result, GDPdeclined by about 0,3%.
vii. The economy had been generating relatively high levels of savings.National savings have averaged about 14% of GNP in the last five years. However,savings are subject to sharp fluctuations associated with fluctuations in sugarexport earnings. For instance savings accounted for about 20% of GNP in 1980 butthey dropped to 9% in 1982. The private sector generates about 70% of the totalsavings. On the other hand, domestic investment accounts for 26 to 31% of GNP.Therefore, national savings have been financing about a half of the investment.
viii. Unemployment is an acute problem in Belize City and among the young.Overall unemployment was estimated at 14.3% in 1980. About 67% of the unemployedworkers are youngsters in the 15-19 year old bracket; more than half live inBelize City. As female participation in the labor force increased rapidly, thelabor force has been growing at about 3.4% per yrear during the last decade. Ifthe labor force continues to grow at this rate, unemployment could become a veryserious problem unless the economy expands very fast so as to provide new jobs.The economy would have to grow more than 6% per year just to absorb the newworkers coming into the labor market.
ix. Unemployment in Belize presents some complex features. The countryoff ers a great deal of opportunity to work in agriculture which seems to meetneither the expectation nor the training of large segments of the population,particularly those living in Belize City, about 30% of the total, As a result,there is seasonal shortage of labor in rural areas and workers are employed fromneighboring countries. For this reason, the Government has implemented an openimmigration policy which resulted in new settlers coming into Belize.
x. Public sector activities repre.sent around 30% of GDP. They include tra-ditional services (water, electricity, ports, communications and social security)and some involvement in productive activities (bananas and, to a lesser extent,beef). The public sector is made up of the National Government, nine statutorybodies, and two financial institutions (the Central Bank and the DevelopmentFinance Corporation).
xi. National Governmnent's finances have been managed soundly while those ofseveral statutory bodies typically have not. But with a weakened economy even theNational Government's finances have faced problems in recent years. In fact,National Government's current savings which traditionally amounted to 5% of GDP

- X111 -
declined to 2.8% in FY1981/82. With the implementation of expenditure controls,savings are estimated to have increased to 3.7% of GDP in FY1982/83. The financesof the statutory bodies have been generally poor and deteriorated during 1982.The consolidated account of the statutory bodies shows operational deficits forpractically every year in the last quinquennium. This is chiefly associated withinefficiencies and with subsidies prevailing in some statutory bodies.
xii. Rapid increases in the wage bill have weakened the National Government'sfinances. These increases are largely associated with the situation created byBelize's independence and by the need to provide new type of services. Neverthe-less, a close control of the wage bill is needed. This should not however preventthe authorities from undertaking a careful study of the salary structure in viewof the increasing shortage of highly qualified personnel.
xiii. In spite of successive drops in real domestic income, the NationalGovernment's current revenues have been kept at high levels, about 27% of GDP.There is some room for increasing revenues mainly by reducing import duty exemp-tions. However, any substantial increase in the overall taxation could have anegative impact on private sector activities and does not, therefore, appearadvisable.
xiv. The poor financial performance of the statutory bodies are associatedmainly to the operational deficits of the Electricity Board, the Banana ControlBoard, and the Marketing Board. The Government is taking some actions to improvethe performance of these statutory bodies but major decisions remain to be taken.Management and administration at the Electricity Board need to be reorganized andstrengthened, the distribution system should to be interconnected so as to reduceenergy losses, and the level and structure of rates need to be reviewed. Inrelation to the Banana Control Board, since banana production is below the break-even level a rapid expansion in production is necessary. This expansion isalready being undertaken by private farmers and by BCB. It should be noted thatwithin the presently envisioned expansion, this industry does not have a marketconstraint. An additional problem is the high transportation costs due to thelack of proper port facilities; bananas are barged to Honduras and transshippedthere to ocean-going vessels. Resolution of this problem will be examined as apart of the Master Transportation Plan Study currently under way. Finally, thekey element for improving the financial performance of the Marketing Board is theelimination of subsidies to producers particularly those on corn.
xv. Public investments have played an important role in Belize's develop-ment. They represent 60 to 70% of the total domestic investment and about 15% ofGDP. The level of execution and the establishment of project priorities havebeen, overall, satisfactory. External assistance has played an increasinglyimportant role in the financing of public investments as well as in the provisionof much needed technical assistance. This assistance was provided for the execu-

- X1V -
tion of several projects such as the Belize City Port, the Northern Highway, theWestern Highway, and water and sewerage expansion.
xvi. The public sector has faced some major constraints affecting timting andquality of project execution. They include shortages of cash to cover local costsand bridge-financing; administrative weaknesses in the monitoring of projectexecution; and shortage of local personnel to participate in project executionwhich prevents the country from absorbing all the external technical assistanceprovided by donors/lenders.
xvii. Belize's balance of payments reflects an open economy. Imports re-presents around 100% of GDP; exports about 80%. The openness of the economy isalso reflected in large amounts of remittances sent by Belizeans living abroad, inincreasingly important re-export trade with neighbouring countries and in size-able inflows of capital.
xviii. The country relies heavily on imports for all its capital goods and fora considerable amount of consumption goods. The population has developed asophisticated pattern of consumption and often prefers imported goods to local.The country imports all needed oil although there are good prospects for findingoil and gas in commercial quantities. Finally, there are some export-orientedindustries that import their basic materials, for example garments. Externaltrade is conducted mainly with the USA and UK.
xix. Export performance depends mainly on sugar which accounts for around 60%of domestic exports. Sugar production and international prices have fluctuatedsharply. For instance, production reached 113,000 long tons in 1978, a recordlevel after only 62,000 tons in 1976 when the worst drought on record took place.Belize sugar exports benefit from the Loin Agreement and from the InternationalSugar Act but those agreements have not eliminated sharp fluctuations in theaverage price received by the country: US$296 per long ton in 1978; US$491 in198C; and US$320 in 1982.
xx. Current account balance of payments deficits have fluctuated sharply asa result of fluctuations in sugar export earnings. While in 1975 the deficit wasUS$5.2 million or 5.4% of GDP, in 1979 it reached US$24.5 million or 19.8% ofGDP. Current account deficits have averaged about 13% of GDP during the lastquinquennium. Since investments averaged about 26%, external resources havefinanced about a half of the total investment.
xxi. External capital inflows to the public sector have financed about 70% ofthe current accounrt balance of payments deficits. Foreign private investmentsappear to have been modest in recent times although they are encouraged by arelatively liberal currency exchange system in which regulations have been admini-stered flexibly and pragmatically. Moreover, the fixed exchange rate policy has

- xv -
been supported by a consistent monetary policy. Inflows of capital to the publicsector have been provided mostly in the form of grants and concessional loans,from bilateral and multilateral sources, mainly for development programs. Theamount of official reserves has been traditionally low and declined to about fourweeks of imports in 1982 (excluding re-exports). Since this decline has beencaused by unfavorable terms of trade, the country is negotiating a CompensatoryFinancing loan with the IMF.
xxii. Domestic credit to the public sector has been growing very rapidly; itcurrently represents about a third of the total domestic credit. This is attribu-table to the recent deterioration in public finances and, therefore, to the publicsector's increasing reliance on domestic credits for financing investment and,sometimes, current expenditures.
xxiii. The investment climate is favorable. Official policies are, on thewhole, favorable to foreign and domestic investments, complemented by a fairlyliberal immigration policy. But concerns among potential investors about thepolitical situation in the region are a deterrent to private investment. TheGovernment is trying to allay these concerns to the extent possible by promotingthe country outside, emphasizing its characteristics as astable democracy.Concerns shown by investors include the still unresolved issue with Guatemalawhich now appears to be gradually dissipating.
xxiv. Price controls are imposed on some imported and locally producedgoods. On imported goods, through maximum mark-ups; on locally produced goods,through maximum prices. Import licenses have been required for some commoditiessince 1974. Originally the process of granting import license was a simple one;now it is being tightened. On the other hand, some local activities enjoydevelopment incentives through exemptions from income tax and from import dutieson capital goods and occasionally on raw materials. Price controls, importlicenses and development incentives do not appear to have had much impact on theeconomy. Part of the reason for this may be because they often neutralize eachother. In addition these policies are applied in a relaxed fashion.Nevertheless, they create administrative costs and raise some unnecessary concerns.among potential private investors. Therefore, it is recommended that measures beimplemented in a coordinated fashion, aimed at:
(a) relaxing price controls and enforcing them only in cases ofmonopoly;
(b) relaxing import restrictions in a manner consistent with balance ofpayments sustainability;
(c) minimizing import duty exemptions; and(d) giving priority in future development incentives to export-oriented
activities based on the use of local raw materials.
- XV1 -
xxv. Present land tenure policies encourage development. First, theGovernment owns more than one million acres of land suitable for agriculture whichare being made available to locals or foreigners at relatively low prices so longas the land is developed according to a plan agreed with the Government. Second,a new land tax on unimproved value is being introduced to encourage landdevelopment but the success of this tax will depend on how well it is implemented.
xxvi. Prospects for economic growth in Belize largely depend on the inter-national situation. Belize's economy is very open, and given the small size ofthe domestic market any significant growth in production needs to be export-oriented. To the extent that a recovery appears to be emerging in the worldeconomy, Belize's prospects for economic growth look promising. Moreover, thecountry has several competitive advantages. First, abundant natural resources;second, sound Government policies; and third, a climate for domestic and foreigninvestment which is good and industrial relations which are, on the whole,smooth. Provided that an international recovery takes place, a 3% economic growthis projected by the mission for 1983, accelerating to 4% in 1984 and to 5% from1985 on. Growth is expected from sugar (until production reaches the maximumlevel given the present plant capacity of 115,000 tons plus a planned expansion of5,000 tons to be executed in 1984), citrus, bananas, livestock, fish farming,poultry, rice, corn, and other non-traditional agricultural products. Construc-tion, food processing and tourism are also expected to grow steadily.
xxvii. Efforts need to be undertaken to increase national savings. The publicsector is expected to increase its savings from the present level of 3% of GNP to5% by 1985. This should not be difficult because this level of public savingshas been prevailing in previous years. Nevertheless, to sustain this 5% levelwill require close monitoring, as among other things, the financial surplus of thenew Social Security System could potentially decline in future years. Privatesavings which averaged about 9% of GNP in the last quinquennium, can be expectedto increase to about 13% in 1990. This implies that the rate of increase inprivate consumption will be slightly lower than that of the GNP, but will stillallow a significant improvement in real per capita consumption.
xxviii. The medium- and long-term balance of payments position can be expectedto improve. This improvement is predicated upon an export-oriented strategy thatemphasizes non-sugar exports so as to make the economy of Belize less vulnerableto the cyclical behavior of sugar. On the import side, a key element in improvingthe balance of payments performance is a slowdown in the growth of imports offood, fuel and durable consumption goods. To reduce the growth in imports,several measures need to be taken, such as the gradual elimination of import dutyexemptions and the implementation of energy-savings projects particuarly in rela-tion to electricity. In the short-term, the balance of payments is expected tobenefit from an improvement in the terms of trade.

- XVlli -
xxix. The current account balance of payments deficits is projected to fallgradually from 16% of GDP in 1982 to 8% in 1990, remaining at that level in futureyears. In order to finance the current account balance of payments deficits aswell as a modest increase in foreign reserves, net capital inflows averaging aboutUS$25 million per year will be necessary during the rest of the 1980s and aboutUS$40 million per year during 1990-95. Net external capital inflows to theprivate sector are projected to provide about 30% of these requirements. Thisshould be well within the realm of possibility given the very wide range ofprivate investment opportunities in Belize, which will become even more attractiveas the world economy recovers. Net external capital inflows to the public sectorare projected to average about US$18 million per year during the rest of the 1980sand about US$28 million during 1990-95.
xxx. The public sector investment program gives high priority to those infra-structural projects that constitute a prerequisite to productive investments;namely electricity, roads and ports. Therefore, this investment program iscrucial for the resumption of economic growth. Total public sector investmentsfor the FY1983/84 - FY1987/88 period amount to US$142 million, or about US$28million per year. This investment is projected to be financed as follows: (a)public sector savings, 38%; (b) net external capital inflows, 55%; and (c) netdomestic borrowing and domestic capital revenues, 7%.
xxxi. Successful execution of the public sector investment program has severalrequirements. First, public savings should increase to about 5% of GDP. Thisshould be achieved mainly by improving the financial performance of the Electri-city Board, the Marketing Board and the Banana Control Board. Second, externalfunds should be secured. In this regard, prospects appear favorable as evidencedby the fact that required external funds for 1983 and 1984 are already in thepipeline. Third, other domestic funds, particularly borrowing from domesticsources, should decline sharply leaving more resources available to the privatesector.
xxxii. The external public debt has been increasing rapidly in recent years.There is no available information on external private debt but indications arethat loans have been contracted mostly for investment purposes. External publicand publicly guaranteed loans at the end of 1982 were estimated at about US$70million, or 45% of GDP. The service on public debt has been low, less than 5% ofdomestic exports (excluding re-exports). This resulted from a favorable structureof the debt and from the concessionality of most loans, The debt services isprojected to increase to about 12% in 1983 and 1984 as several loans start to berepayable and because the Government, in response to the financial difficulties of1981-82, contracted several loans on conventional terms.
xxxiii. The public sector expects to obtain funds from several concessional andconventional sources during the next decade. Conventional loans are projected to

- XV111 -
increase from the current 35% of the total disbursements to about 60% in 1990 andto 76% in 1995. The debt service ratio, however, is projected to decline from 12%in 1983 to about 7% in the late 1980s as export earnings increase. Then, it isprojected to increase again as increasing amounts of loans on conventional termsare contracted, reaching 10% in the mid-1990s. The debt service ratio *is, there-fore, projected to remain within manageable limits. On this basis, Belize shouldbe considered creditworthy for limited borrowing on conventional terms providedthat the Government continues to pursue an export-oriented development strategy aswell as prudent financial policies; that the public statutory bodies improve theirfinancial performance; and that the public investment concentrates on highpriority projects with acceptable rates of return.

- xix -
RESUMEN Y CONCLUSIONES
i. Belice, pais situado en la peninsula de Yucat&n, en America Central,obtuvo su independencia del Reino Unido el 21 de septiembre de 1981. Con unapoblaci6n de 145.000 personas en una superficie de 23.000 kmn2, tiene una de lasdensidades demogr&ficas mis bajas del mundo: seis personas por kil6metro cua-drado. Belice es un pais de habla inglesa cuyos habitantes tienen origenes muydiversos: criollos, mestizos, mayas, garifunas, europeos y Arabes.
ii. La poblaci6n ha aumentado a una tasa relativamente lenta de 2% al afioen 6pocas recientes. La causa de e110 ha sido una emigraci6n en' gran escala,puesto que el crecimiento natural de la poblaci6n es bastante alto, de alrededorde 3,4% al afio. Unos 20,000 beliceios --aproximadamente el 15% de la poblaci6ntotal-- emigraron a los Estados Unidos durante el decenio de 1970.
iii. La economia de Belice se basa en el aziicar, el banano, los citricos,la pesca, alga de industria ligera y el turismo. Las actividades econ6micasestin orientadas en su mayor parte a la exportaci6n; por otro lado, se dependeen gran medida de las importaciones para satisfacer una proporci6n considerabledel consumo interno y pr&cticamente todas las necesidades de inversi6n. Durantelos 61ltimos afios, los reembarques a M6xico se han desarrollado coma una activi-dad que contribuye en grado considerable a la economia, especialmente en CiudadBelice.
iv. El producto nacional bruto (PNB) per ci.pita es de alrededor deUS$1.000 y parece estar distribuido en farina bastante pareja. La propiedad dela economia esti. principalmente en manos del sector privado. Las inversionesextranjeras predominan en las manufacturas, la banca, los seguros, la elabora-ci6n de cafia de azuicar y la silvicultura. Las inversiones locales son importan-tes en la agricultura, las actividades de distribuci6n y el turismo. ElGobierno posee vastas extensiones de tierras en su mayor parte sin utilizar.
v. La economia de Belice creci6 con firmeza durante el decenio de 1960, yla mayor parte del de 1970; el producto interno bruto (PIB) real aument6 en 4% a5% al aijo. La agricultura creci6 r&pidamente a medida que se in,crement6 la pro-ducci6n de azilcar y se reestableci6 la industria bananera. Las manufacturastambi6n se desarrollaron con rapidez al establecerse varias industrias de susti-tuci6n de importaciones y una fibrica de prendas de vestir orientada a la expor-taci6n. Sin embargo, el crecimiento econ6mico se hizo pronunciadamente mi.slento durante el periodo de 1978-81, en el que el PIB real creci6 a una tasamedia anual de apenas 1,8%. El aziicar, que representa mAs o menos un 25% delPIB, explica en gran medida este resultado; su producci6n disminuy6 en 13% en1979, como consecuencia de la enfermedad 11amada tiz6n del azulcar; hubo ciertarecuperaci6n en 1980, pero le sigui6 otra baja en 1981. Estas fluctuaciones en.la producci6n de aziicar tienen como causa dos factores principales: primera, laplantaci6n de variedades resistentes al tiz6n ha ocurrido en forma gradual, parlo que la enfermedad no se ha erradicado totalmente, y, segundo, esas nuevasvariedades tienen menor contenido de aziicar que aquellas a las que reemplaza-ran. El resto de las actividades agricolas y el sector manufacturero tuvieronresultados satisfactorios durante el periodo de 1978-81.

- xx -
vi. La economia belicefia sufri6 las consecuencias de la recesi6n interna-cional de 1982. La disminuci6n de los precios del azilcar y los citricos y losperjudiciales efectos en la industria bananera de la valorizaci6n del d61ar delos Estados Unidos frente a la libra esterlina han tenido coma consecuencia unadisminuci6n de 4,5% del ingreso interno bruto real durante 1982. En 10 queatafie a la producci6n de azilcar, esta aument6 en alrededor de 8%, compensandoparcialmente la baja en las sectores de la construcci6n, el comercio y lasprendas de vestir. Como resultado de ella, el PIB disminuy6 en cerca de 0,3%.
vii. Hasta entonces la economia habia venido generando niveles relativa-mente altos de aharro. El ahorro nacional ila sido coma promedio un 14% del PNBen los (a1timos cinco anoas; sin embargo, estA sujeto a pronunciadas fluctuacionesasociadas con los altibajos en los ingresos de exportaci6n del aziicar. Parejemplo, el ahorro represent6 mis a menas un 20% del PNB en 1980, pero descendi6a 9% en 1982. El sector privado genera aproximadamente un 70% del ahorrototal. Par atra parte, la inversi6n interna representa de 26% a 31% del PNB.Asi pues, el ahorro nacional ha financiado mis a menos la mitad de la inversion.
viii. El desempleo constituye un problema serio en Ciudad Belice y entre losj6venes. Su nivel total se estim6 en 14,3% en 1980. Aproximadamente el 67% delos trabajadores sin empleo son j6venes de 15 a 19 afios y de el10s m&s de lamitad vive en Ciudad Belice. Coma resultado del ri.pido aumento de la participa-ci6n de las mujeres en la fuerza laboral, esta ha crecido a un ritmo de mis amenos 3,4% al afio durante el il1timo decenio. Si continua increment&ndose enesta farina, el desempleo podria convertirse en un problema muy grave, a menosque la economia se desarrolle con gran rapidez a fin de crear empleos. S6opara poder absorber a los nuevos trabajadores que ingresan al mercado laboraltendria que crecer en mis de 6% al an0.
ix. El desempleo de Belice tiene algunas caracteristicas complejas. Elpals ofrece una gran cantidad de oportunidades de trabajo en la agricultura,pero 6stas no parecen satisfacer las expectativas ni ajustarse a la capacitaci6nde amplios sectores de la poblaci6n, especialmente los que viven en CiudadBelice, que constituyen mis a menos el 30% del total. Coma resultado de ella,hay escasez estacional de mano de obra en las zonas rurales y se emnplea a traba-jadores de paises vecinos. Par esta raz6n, el Gobierno ha puesto en pr&cticauna politica abierta de inmnigraci6n que ha tenido coma consecuencia que acudan aBelice nuevas pobladores.
x. Las actividades del sector pilblico representan aproximadamente un 30%del PIB. Comprenden los servicios ordinarios (agua, electricidad, puertos,comnunicaciones y seguridad social) y alguna participaci6n en actividades produc-tivas (banana y, en menor medida, carne de vacuno). El sector pilblico est& cam-puesto par el Gobierno nacional, nueve organismos de derecho pilblico y dos ins-tituciones financieras (el Banco Central y la Saciedad Financiera de Desarrollo).
xi. La finanzas del Gobierno nacional se han administrado adecuadamente,en tanto que las de varios de los organismos de derecho pdblico en general no lohan sido. Sin embargo, con una economia debilitada, incluso las finanzas delGobierno nacional se han enfrentado a problemas en los ii1timos aflos. De hecho,

- XX1 -
el ahorro corriente del Gobierno nacional, que habitualmente alcanzaba a 5% delPIB, disminuy6 a 2,8% en el ejercicio econ6mico de 1981/82. Con la puesta enprActica de controles de gastos, se estima que el ahorro ha aurnentado a 3,7% delPIB en el ejercicio de 1982/83. Las finanzas de los organismos de derechopiiblico han sido en general deficientes y empeoraron diurante 1982. Su cuentaconsolidada muestra d4ficit de explotaci6n pr&cticamente en todos los afios deluiltimo quinquenio. Esto se asocia sobre todo con la ineficacia y las subven-ciones prevalecientes en algunos de estos organismos.
xii. Los rApidos aumentos de los costos salariales han debilitado lasfinanzas del Gobierno nacional. Estos aumentos se relacionan en gran medida conla situaci6n creada por la independencia de Belice y por la necesidad de propor-cionar nuevos tipos de servicios. No obstante, es preciso que se establezca unestrecho control de los costos salariales. E110 no deberia en todo caso impedira las autoridades la realizaci6n de un estudio cuidadoso de la estructura sala-rial, an vista de la escasez cada vez mayor de personal altamente id6neo.
xiii. A pesar de sucesivas disminuciones del ingreso interno real, losingresos corrientes del Gobierno nacional se han mantenido a niveles altos, esdecir, en alrededor de 27% del PIB. Hay lugar para aumentar los ingresos,principalmente mediante la reducci6n de las exenciones de los derechos deimportaci6n. Sin embargo, cualquier aumento considerable de la tributaci6ngeneral podria tener un efecto negativo en las actividades del sector privado y,por 10 tanto, no parece aconsejable.
xiv. La deficiente actuaci6n financiera de los organismos de derechop'iblico se relaciona principalmente con los dAficit de explotaci6n de la Juntade Electricidad, la Junta de Control del Banano y la Junta de Comercializaci6n.El Gobierno estA aplicando algunas medidas para mejorar el desempeiio de estosorganismos, pero es necesario ain que se adopten otras decisiones importantes.La direcci6n y administraci6n de la Junta de Electricidad deben reorganizarse yfortalecerse; se tendria que interconectar el sistema de distribuci6n con el finde reducir p6rdidas de energia, y es preciso examinar el nivel y la estructurade las tarifas. En cuanto a la Junta de Control del Banano, es necesario lograrun rApido aumento de la producci6n de esa fruta, ya que se halla por debajo delnivel de equilibrio. Los agricultores privados y la Junta de Control del Bananoya han adoptado medidas para lograr este aumento, respecto del cualcabe decirque actualmente esta industria no tiene limitaciones de mercado. Un problemaadicional son los altos costos del transporte, debidos a la falta de instala-ciones portuarias adecuadas; los bananos se envian en barcazas a Honduras, dondese reembarcan en buques de navegaci6n oc4anica. La soluci6n de este problema seexaminarA como parte del estudio que se realiza actualmente para elaborar unplan maestro del sector de transportes. Por fi1timo, el elemento fundamentalpara mejorar la actuaci6n financiera de la Junta de Comercializaci6n es la eli-minaci6n de los subsidios a los productores, especialmente los aplicados al maiz.
xv. Las inversiones pidblicas han cumplido un papel importante en el desa-rrollo de Belice. Representan de 60% a 70% de la inversi6n interna total yalrededor de 15% del PIB3. El nivel de ejecuci6n de proyectos y el estableci-miento de prioridades al respecto han sido en general satisfactorios. La asis-tencia externa ha desempeshado una funci6n cada vez mis importante en el finan-ciamiento de inversiones pCiblicas asi como en el suministro de asistencia

- XX11 -
ticnica, sumamente necesaria. Esta asistencia se prest6 para la ejecuci6n devarios proyectos, como el del puerto de Ciudad Belice, las carreteras septen-trional y occidental y la ampliaci6n de los servicios de agua y alcantarillado.
xvi. El sector p iblico ha enfrentado algunas limitaciones importantes quehan afectado a la oportunidad y calidad die la ejecuci6n de los proyectos. Entreellas cabe citar la escasez de efectivo para sufragar costos en moneda local yfinanciamiento transitorio, deficiencias administrativas en la verificaci6n dela ejecuci6n de los proyectos y escasez de personal local para participar endicha ejecuci6n, 10 que impide que el pais absorba toda la asistencia tecnicaexterna proporcianada par las danantes y prestamistas.
xvii. La balanza de pagos de Belice es reflejo de una economia abierta. Lasimipartaciones representan alrededor de 100% del PIB y las expartaciones mis amenos el 80%. La abierto de la economia se observa tambi4n en las grandescantidades de remesas de divisas enviadas par los belicejos que viven en elexterior, en el comercia de reexpartaci6n con los paises vecinos, cada vez mAsimpartante, y en la cuantiasa afluencia de capitales.
xviii. El pals depende fuertemnente de las importaciones para obtener todossus bienes de capital y una cantidad considerable de biences de cansumo. Lapoblaci6n ha desarrallado caracteristicas ref inadas de consumo y a menudo pre-fiere las productos importados a los nacionales. Se imparta todo el petr61eonecesario, aunque hay buenas perspectivas de encontrar petr61eo y gas en canti-dades comerciales. Finalmente, hay algunas industrias orientadas a la exparta-ci6n, par ejemplo la de prendas de vestir, que importan sus materiales bAsi-cas. El comercia exterior se realiza principalmente con los Estados Unidos y elReino Unido.
xix. Las resultados de las exportaciones dependen sabre todo del azilcar,que representa apraximadamente un 60% de esta actividad. La producci6n y lasprecios internacionales del azi.car han registrado pronuncidas fluctuaciones.Par ejemplo, la producci6n alcanz6 113.000 toneladas largas en 1978, nivel sinprecedentes despu4s de haberse logrado solamente 62.000 toneladas en 1976,cuando acurri6 la pear sequia de la historia del pais. Las exportacianes deazilcar de Belice se benefician de la Convenci6n de Lome y del Convenio Interna-cional del Azicar, pero estos acuerdos no han eliminado las grandes oscilacionesque ha experimentado el precio media que recibe el pals: US$296 par toneladalarga en 1978, US$491 en 1980 y US$320 en 1982.
xx. Las d6ficit de la balanza de pagos en cuenta carriente han sufridomarcadas fluctuacianes coma resultado de las variaciones en los ingresos deexportaci6n del aziicar. Mientras en 1975 el d6ficit fue de USq5,2 millones, asdecir, 5,4% del PIB, en 1979 alcanz6 US$24,5 millones, a sea, 19,8% del PIB.Las deficit en cuenta carriente han sido coma promedio de apraximadamente 13%del PIB durante el U1timo quinquenia. Puesto que las inversianes fueron dealrededor de 26% coma promedio, los recursas externas han financiado mis a menosla mitad de la inversi6n total.

- XX111 -
xxi. La afluencia de capital externo al sector piiblico ha financiado cercade 70% de los d4ficit de la balanza de pagos en cuenta corriente. Las inversio-nes privadas extranjeras parecen haber sido moderadas 61ltimamente, aunque tienenel estimulo de un sistema cambiario bastante tolerante en el que los reglamentosse han aplicado con flexibilidad y pragmatismo. AdemAs, la adopci6n de un tipode cambio fijo ha tenido el apoyo de una politica monetaria consecuente. Laafluencia de capital al sector pdiblico ha consistido principalmente en donacio-nes y pr4stamos en condiciones concesionarias, de fuentes bilaterales y multila-terales, sobre todo para programas de desarrollo. El monto de reservas oficia-les ha sido tradicionalmente bajo y disminuy6 a alrededor de cuatro semanas deimportaciones en 1982 (excluidas las reexportaciones). En vista de que estadisminuci6n ha sido causada por una relaci6n de intercambio desfavorable, elpais negocia actualmente con el Fondo Monetario Internacional (FMI) un pr4stamoal amnparo del servicio de financiamiento compensatorio.
xxii. El cr4dito interno al sector pilblico ha aumentado muy r&pidamente.Representa en la actualidad mis o menos una tercera parte del credito internototal. Esto es atribuible al reciente empeoramiento de las finanzas piablicas y,por 10 tanto, a la dependencia cada vez mayor del sector piablico de los creditosinternos para financiar las inversiones, y a veces los gastos corrientes.
xxiii. El clina para las inversiones es favorable. Las politicas oficialesson, en general, propicias a las inversiones extranjeras y nacionales, y a ellose agrega una politica de inmigraci6n bastante liberal. Sin embargo, ha inquie-tud de los posibles inversionistas acerca de ha situaci6n politica en la regi6nes un obsticulo para la inversi6n privada. El Gobierno trata de mitigar estainquietud en la medida de 10 posible promoviendo ha imagen del pais en el exte-rior, haciendo hincapid en los aspectos que 10 destacan como una democraciaestable. Uno de los elementos que inquietan a los inversionistas es el problemaaian no resuelto con Guatemala, que parece ahora ir disipindose gradualmente.
xxiv. Se imponen controles de precios a algunos bienes, tanto importadoscomo producidos en el pais, a los primeros mediante m&rgenes de utilidad mAximosy a los segundos a trav6s de precios maximos. Se exigen licencias de importa-ci6n para algunos productos bAsicos desde 1974; originalmente el proceso deotorgar estas licencias era sencillo, pero en la actualidad se procede a hacerlomis estricto. Por otra parte, algunas actividades locales gozan de incentivospara su desarrollo consistentes en exenciones del impuesto a ha renta y de losderechos de importaci6n sobre bienes de capital y, en ocasiones, sobre las mate-rias primas. Los controles de precios, las licencias de importaci6n y losincentivos al desarrollo no parecen haber tenido mucho efecto sobre ha econo-mia. En parte, la raz6n de esto puede ser que a menudo se neutralizan mutua-mente; ademis, se aplican sin rigurosidad. No obstante, estas politicas tienencostos administrativos y dan origen a inquietudes innecesarias entre los posi-bles inversionistas privados, por ho que se recomienda ha adopci6n coordinada demedidas destinadas a:
a) Relajar los controles de precios y ponerlos en vigor s610 encasos de monopolio;
b) Rehajar las restricciones alhas importaciones en forma coherentecon ha sustentabilidad de ha balanza de pagos;

- X1V -
c) Reducir al minima las exencionies de los derechos de importaci6n, y
d) Dar prioridad, en los incentivos al desarrollo que se ofrezcan enel futuro, a las actividades orientadas a la exportaci6n que sebasen en el uso de materias primas nacionales.
xxy. Las actuales politicas en materia de tenencia de la tierra estimulanel desarrollo. Primero, el Gobierno es propietario de mis de 400.000 ha detierras adecuadas para la agricultura que se estin poniendo a disposici6n de losnacionales del pais a de extranjeros a precios relativamente bajos, a condici6nde que se exploten de acuerdo con un plan acordado con el Gobierno. Segundo, seva a introducir una nueva contribuci6n territorial sobre el valor de la tierrano bonificada, a fin de estimular su explotaci6n, pero el buen 6xito de esteimpuesto depended de la forma en que se ponga en prictica.
xxvi. Las perspectivas de crecimiento econ6mico de Belice dependen en ungrado considerable de la situaci6n internacional. La economia del pais es muyabierta y, dado el pequeio tamafio del mercado interno, cualquier aumento consi-derable de la producci6n necesita estar orientado a la exportaci6n. En lamedida en que se haga efectiva la aparente recuperaci6n de la economia mundial,Belice tiene buenas posibilidades de mejoramiento econ6mico. Ademis, el paisgoza de varias ventajas competitivas: primero, tiene abundantes recursos natu-rales; segundo, las politicas gubernamentales son apropiadas, y tercero, elclima para las inversiones nacionales y extranjeras es favorable y las relacio-nes industriales son ei general buenas. Siempre que ocurra una recuperaci6ninternacional, la misi6n pronostica para 1983 un crecimiento econ6mico de 3%,que se acelerarA. a 4% en 1984 y a 5% de 1985 en adelante. Se prev6 que regis-trarAn crecimniento los rubros siguientes: azilcar (hasta que la producci6nalcance el nivel mAximo con la actual capacidad de plantaci6n de 115.000 tonela-das, m&s una ampliaci6n planeada de 5.000 toneladas a 11evarse a cabo en 1984),citricos, bananos, ganado, piscicultura, ayes de corral, arroz, maiz y otrosproductos agricolas no tradicionales. Tambi6n se espera un crecimiento firme enla construcci6n, la elaboraci6n de alimentos y el turismo.
xxvii. Es necesario hacer esfuerzos para aumentar el ahorro nacional. Sepreve que el sector pdiblico aumentar& su ahorro desde el nivel actual de 3% delPNB a 5% en 1985. Esto no deberia resultar dificil, ya que 6ste es el nivel deahorro pilblico que ha prevalecido en afios anteriores. Ahora bien, mantener estenivel de 5% exigird. practicar una cuidadosa vigilancia, ya que entre otras cosasel superivit financiero del nuevo sistema de seguridad social podria disminuiren los afios venideros. Cabe esperar que el ahorro privado, que fue como prome-dio de aproximadamente 9% del PNB en el il1timo quinquenio, aumente a cerca de13% en 1990. Esto significa que la tasa de crecimiento del consumo privado serAligeramente inferior a la del PNB, pero permitirA a6.n alcanzar un mejoramientoconsiderable del consumno per cApita real.
xxviii. Puede preverse que mejorarA la situaci6n de balanza de pagos a medianoy largo plazos. Esta mejora se funda en una estrategia orientada a la exporta-ci6n que hace hincapid en productos distintos del azdlcar con el fin de lograrque la economia de Belice sea mnenos vulnerable a las tendencias ciclicas de estearticulo. En cuanto a las importaciones, un elemento fundamental en el mejora-miento de la balanza de pagos es una desaceleraci6n del crecimiento de las

- xxy -
importaciones de alimentos, combustibles y bienes de consumo duraderos. Faraello, deben adoptarse varias medidas, tales como la eliminaci6n gradual de lasexenciones de los derechos de importaci6n y la ejecuci6n de proyectos queahorren energia, especialmente en relaci6n con la electricidad. A corto plazo,se prev6 que la balanza de pagos se beneficiarA de un majoramiento de la rela-ci6n de intercambio.
xxix. Las proyecciones indican una baja gradual de los d6ficit de la balanzade pagos en cuenta corriente, de 16% del FIB en 1982 a 8% en 1990, para permane-cer en ese nivel con posterio.ridad. Con el fin de financiar estos d6ficit, asicomo un aumento moderado de las reservas de divisas, serA necesaria una afluen-cia neta de capital de US$25 millones al afio como promedio durante el resto deldecenio de 1980 y de unos US$40 millones al afio durante el periodo de 199C-95.Se prev6 que la afluencia neta de capital externo al sector privado cubraaproximadamente el 30% de estas necesidades, 10 que estA muy en el terreno de 10posible dada la amplia gama de oportunidades de inversi6n privada que hay enBelice, que seran auln mas atractivas a medida que se recupere la economia mun-dial. Las proyecciones de la afluencia neta de capital externo al sectorpdablico muestran un promedio aproximado de US$18 millones al aflo durante elresto del decenio de 1980 y de unos US$28 millones anuales durante el periodode 1990-95.
xxx. El programa de inversiones del sector piiblico otorga prioridad a losproyectos de infraestructura que constituyen un requisito para las inversionesproductivas, es decir, los de electricidad, carreteras y puertos. For 10 tanto,este programa de inversiones es decisivo para la reanudaci6n del crecimientoecon6mico. El total de inversiones del sector pdlblico para el periodo que abar-can los ejercicios de 1983/84 a 1987/88 asciende a US$142 millones, es decir,aproximadamente US$28 millones al aijo. Las proyecciones de financiamiento deestas inversiones son las siguientes: a) ahorro del sector p(6blico, 38%;b) afluencia neta de capital externo, 55%, y c) empr6stitos internos netos eingresos internos de capital, 7%.
xxxi. El buen 6xito en la ejecuci6n del pr:ograma de inversiones del sectorpfiblico tiene varios requisitos. Primero, el ahorro pdiblico deberia aumentar aalrededor de 5% del FIB. Esto tendria que lograrse principalmente mediante elmejoramiento de la actuaci6n financiera de la Junta de Electricidad, la Junta deComercializaci6n y la Junta de Control del Banano. Segundo, deberian obtenersefondos externos; a este respecto las perspectivas parecen favorables, como 10prueba el hecho de que los fondos externos necesarios para 1983 y 1984 ya sehallan en tramitaci6n. Tercero, otros fondos nacionales, en especial losempr4stitos de fuentes internas, deberian disminuir pronunciadamente, dejandoasi mas recursos disponibles para el sector privado.
xxxii. La deuda piiblica externa ha aumentado con rapidez en los ii1timosafias. No hay informaci6n disponible sobre la deuda privada externa, pero siindicios de que se han contraido pr&stamos principalmente para fines de inver-si6n. Los pristamos externos pilblicos y con garantia piTblica se estimaron afines de 1982 en unos US$70 millones, es decir, 45% del FIB. El servicio de ladeuda piiblica ha sido bajo, menos de 5% de las exportaciones del pais (excluidas

- XXVI -
las reexportaciones). Esto fue resultado de una estructura favorable de ladeuda y de las condiciones concesionarias de la mayoria de los pr6stamos. Lasproyecciones indican un aumento del servicio de la deuda a aproximadamente 12%en 1983 y 1984, a medida que varios prestamos sc hagan pagaderos, y tambiendebido a que el Gobierno contrajo varios pr4stamnos en condiciones ordiinariascomo respuesta a las dificultades financieras de 1981-82.
xxxiii. El sector pilblco espera obtener fondos de varias fuentes concesiona-rias y ordinarias durante el pr6ximo decenio. Se preve que los prestamos ordi-narios aumentarin del actual 35% de los desembolsos totales a mis o menos 60% en1990 y a 76% en 1995. Sin embargo, se estima que el coeficiente del servicio dela deuda disminuirA de 12% en 1983 a alrededor de 7% a fines del decenio de1980, a medida que aumenten los ingresos de exportaci6n; luego subirA nueva-mnente, segiin se obtengan cantidades cada vez mnayores de prestamos en condicionesordinarias, alcanzando un 10% a mediados del decenio de 1990. For 10 tanto, lasproyecciones del coeficiente del servicio de la deuda muestran que 4ste permane-cerA dentro de limites gobernables. Conforme a esto, deberia considerarse aBelice con capacidad crediticia para obtener tin volumen limitado de pristamos encondiciones ordinarias, siempre que el Gobierno siga una estrategia de desa-rrollo orientada a la exportaci6n y politicas financieras prudentes, que losorganismos de derecho pilblico mejoren sui actuaci6n financiera y que la inversi6npdiblica se concentre en proyectos prioritarios con tasas de rentabilidadaceptables.

- XXV11 -
RESUME ET CONCLUSIONS
i. Le Belize est situ6 dans la peninsule du Yucatan en Am&riquecentrale. Ancienne colonie britannique, il est devenu independant le21 septembre 1981. Il couvre 23.000 km2 et compte 145.000 habitants. Ladensit6 de la population, de six personnes au k2, eSt 1'une des plus faiblesdu monde. Pays anglophone, le Belize est une mosaique d'ethnies :Cr6oles,"Mestizos", Mayas, Garifunas, Europeans et Arabes.
ii. Au cours des dernidres decennies, la croissance demographique aetrelativement lente (2 % par an), bien que 1'accroissement naturel de la popu-lation alt &t6 assez rapide (3,4 % environ par an). Ce ph6nomene est impu-table A une 6migration massive :20.000 Beliziens, soit pres de 15 % de lapopulation totale, ont emigre aux Etats-Unis dans les annees 70.
iii. L'&conomie du Belize repose sur la production de sucre, de bananeset dtagrumes, ainsi que sur la p&che, une industrie legere peu d4velopp6e etle tourisme. L'activit& 6conomique est largement axee sur l'exportation.Mais le pays est aussi largement tributaire des importations, qui satisfontune bonne part de la consommation interieure et la quasi-totalit6 de lademande de biens d'e.quipement. On assiste depuis quelques ann6es au d6velop-pement des activit6s de transit vers le Mexique, qui jouent un r61e importantdans 1'6conomie du pays et en particulier A Belize.
iv. De 1'ordre de 1.000 dollars par habitant, le PNB semble assez equi-tablement r6parti. L'economie est principalement contr61ee par le secteurpriv6. Les investisseurs 6trangers occupent une place pr6dominante dans lessecteurs des industries manufacturieres, des banques, des assurances, de1'industrie sucridre et de la sylviculture. Le r6le des investisseurs locauxest important dans les secteurs de 1'agriculture, de la distribution et dutourisme. L'Etat posshde de vastes etendues de terres, generalement laisseesen friche.
v. L'Aconomie s'est d&velopp6e sans A-coups pendant les annies 60 etla majeure partie des annees 70. Le PIB rdel a en effet augmente de 4 A 5 %par an. L'agriculture a connu un essor rapide grAce A 1'augmentation de laproduction sucridre et au rdtablissement de 1'industrie bananidre. Le secteurmanufacturier a lui aussi progress4 rapidement, suite A la creation de plu-sieurs industries r6ductrices d'importations et d'une fabrique de v&tementsdestines A 1' exportation. Toutefois, 1'expansion s'1est consid6rablementralentie entre 1978 et 1981 et le taux de croissance annuelle du BIB r6elnta plus 4te que de 1,8 % environ en moyenne. Cet 4tat de choses est impu-table pour une bonne part A la production sucridre, qui represente 25 % environdu PIB et qui a diminu4 de 13 % en 1979 A cause des deg&ts provoquis par lecharbon. Aprds un mieux en 1980, el1e a de nouveau marqu4 le pas en 1981.Ces fluctuations tiennent principalement A deux facteurs :premierement, leremplacement des cannes par de nouvelles varidt6s resistantes au charbon ne

- XXV111 -
se fait que progressivement, si bien que la maladie n'est pas compl6tementjugul6e et, deuxiemement, les nouvelles varidtes contiennent moins de sucreque les vari6t6s cultiv6es auparavant. De 1978 A 1981, les autres activitisagricoles et le secteur manufacturier ont donne des r6sultats satisfaisants.
vi. En 1982, la recession mondiale a atteint 1'6conomie du Belize. Lachute des prix du sucre et des agrumes et la hausse du dollar par rapport A lalivre sterling, d6favorable A l'industrie bananiAre, ont provoqu4 cette ann6e-lA une diminution de 4,5 % du revenu int6rieur brut r6el. Cependant, laproduction sucriere a augments de 8 % environ, ce qui a partiellement compensele recul enregistre dans les secteurs de la construction, du commerce et de1'habillement. En consiquence, le PIB a diminu6 de 0,3 % environ.
vii. L'e6pargne int6rieure est relativement importante. Au cours des cinqdernidres annees, elle a repr4sent6 en moyenne 14 % environ du PNB. E11e acependant accus6 de brusques fluctuations, ref letant celles des recettesprovenant des exportations de sucre. Ainsi, el1e est tombie d'environ 20 %du PNB en 1980 A 9 % en 1982. Environ 70 % de 1'4pargne totale proviennentdu secteur priv&. Par ailleurs, 1'investissement int6rieur absorbe de 26 A31 % du PNB. L'dpargne nationale a donc financ6 pres de la moiti6 desinvestisseme{nts.
viii. Le ch6mage, notamment parmi les jeunes, pose de graves problemes ABelize. En 1980, le taux de ch6mage total 4tait estimb A 14,3 %. PrAs de67 % des ch6meurs sont des jeunes Ages de 15 A 19 ans. Plus de la moiti6habitent A Belize. Du fait de 1'augmentation rapide du nombre des femmes quitravaillent, la population active a augment6 de 3,4 % par -n environ au coursdes dix dernidres ann6es. Si cette progression se poursuit, le ch6mage risquede devenir un problhme extr&mement grave, A moins qu'une expansion trAs rapidede 1 'Aconomie ne permette de crier des emplois. Il faudrait que le taux decroissance d6passe 6 % par an pour que 1'Aoonomie parvienne A 6ponger 1'exc6-dent de main-d'oeuvre arrivant sur le march& de 1'emploi.
ix. Le problAme du ch6mage au Belize est complexe. Il existe denombreuses possibilit6s d'emplois dans 1'agriculture, mais elles ne semblentcorrespondre ni A l'attente ni A la formation de vastes couches de la popu-lation, notamment parmi les habitants de Belize qui repr6sentent 30 % environde la population totale. Cela se traduit par une penurie saisonniAre de main-d'oeuvre agricole, qu'il faut pallier par 1'emploi de travailleurs de paysvoisins. Les pouvoirs publics ont donc 6td amen6s A poursuivre une politiqued'immnigration ouverte qui a favorisk 1'arrivee au Belize de nouveaux colons.
x. Les activit4s du secteur public representent 30 % environ du PIB.Aux services traditionnels (eau, electriciti, ports, communications et s&cu-rite sociale) s'ajoutent quelques activit6s productives (bananes et, dans unemoindre mesure, viande de boeuf). Le secteur public comprend l'administrationcentrale, neuf organismes d'Etat et daux institutions financiAres (la Banquecentrale et la Soci6tdi financiAre de diveloppement).

- XX1X -
xi. Contrairement A celles des organismes d'Etat, les finances publiquessont convenablement g6r4es. Elles ont n&anmoins subi, elles aussi, le contre-coup du fl&chissement de 1'activit& Aconomique enregistr& au cours des derniA-res annd6es. En fait, 1 'epargne courante de 1'Etat, qui repr4sentait d'ordi-naire 5 % du PIB, est tombee A 2,8 % au cours de 1'exercice 1981/82. L'enca-drament des d6penses publiques a permis une reprise de 1'epargne qui seraitpass6e, selon les estimations, A 3,7 % du PIB pendant 1 'exercice 1982/83. Lasituation financiAre des organismes d'Etat, gen6ralement m6diocre, s 'estaggravAe en 1982. Ces cinq dernidres ann4es, leur compte consolid6 a presquetoujours fait ressortir un deficit d'exploitation. Cela tient principalementau manque d'efficacite de certains de ces organismes et aux subventions qu'ilsaccordent.
xii. Les finances de l'Etat ont souffert de 1'accroissement rapide de lamasse salariale, dfi pour une bonne part A la situation qui a suivi la procla-mation de 1'ind4pendance et A la n4cessite de mettre en place de nouveauxservices. UJn contrble 6troit de la masse salariale s'impose donc. Mais celane doit pas empAcher les pouvoirs publics de reviser avec soin la structuredes traitements pour rem4dier A la penurie croissante de personnel trAsqualifid.
xiii. Malgr6 plusieurs baisses cons6cutives du revenu interieur reel, lesrecettes courantes de 1'Etat sont resties importantes; elles repr6sentent 27 %environ du PIB. Il serait possible de les augmenter, notamment en reduisantles exonerations de droits d'entree. Toutefois, il ne semble pas opportund'alourdir les imp6ts, car cela risquerait de contrarier les activit6s dusecteur prive.
xiv. Les pietres resultats financiers des organismes d'Etat sont impu-tables principalement au deficit de fonctionnement de 1'Electricity Board, duBanana Control Board et du Marketing Board. Les pouvoirs publics tentent deredresser la situation, mais il leur reste encore A prendre des mesures d4ci-sives. Il leur faudrait notamment rdorganiser et renforcer la gestion et1'administration de 1'Electricity Board, connecter les r&seaux de distributionentre eux pour r6duire les pertes d'6lectricit& et r6viser le niveau et lastructure des tarifs. En ce qui concerne le Banana Control Board (BCB), ilfaudrait d&velopper rapidement la production de bananes, qui est actuellementen degi du seuil de rentabilit&. Les planteurs individuels a.t le BCB s'appliquent d6ja. Il convient de noter que le march6 peut absorber la produc-tion suppl6mentaire. Il faudrait aussi regler le problAme du cofit eleve destransports, dil A 1'insuffisance des installations portuaires :les r6gimes debananes doivent en effet Stre acheminds en p6niche jusqu'au Honduras oui ilssont charges sur des cargos bananiers. Une solution sera recherchee dans lecadre de 1'6tude du plan directeur des transports, en cours de realisation.Enf in, pour am6liorer les r6sultats financiers du Marketing Board, il estessentiel de supprimer les subventions accorddes aux producteurs, n!otammentaux producteurs de ma'is.

- xxx -
xv. L'investissement public joue un r6le important dans le d&veloppementdu pays. Il reprisente de 60 A 70 % de 1'investissement interieur total et15 % environ du PIB. Dans 1'ensemble, la d6finition des prioritis et 1'ex6-cution des programmes sont satisfaisantes. Les investissements publics etl'assistance technique, dont le pays a grand besoin, sont de plus en plusfinanc6s par des capitaux exterieurs. Plusieurs projets ont bendficid d'uneaide ext6rieure, notamment les projets d'amenagement du port de Belize, deremise en etat des routes principales dans le nord et 1'ouest et d'extensiondes r6seaux d'alimentation en eau et d'assainissement.
xvi. Le secteur public se heurte A de graves probl6mes qui nuisent Al'ex6cution des projets et entrainent des retards. Ces problemes sontnotamment :le manque de liquidites pour financer les depenses en monnaienationale et le manque de credits de soudure; des insuffisances adminis-tratives au niveau de la supervision des projets et la penurie de personnellocal pouvant participer A leur execution, qui empiche le pays de tirer plei-nement parti de 1'assistance technique exterieure fournie par les donateurs etles bailleurs de fonds.
xvii. L'6conomie du Belize est ouverte sur 1'exterieur, comme en t6moignesa balance des paiements :les importations reprisentent pres de 100 % du PIBet les exportations environ 80 %. Le volume consid6rable des envois de fondsdes Beliziens expatries, 11'importance croissante du commaerce de reexportationvers les pays voisins et les entrees de capitaux en sont d'autres preuves.
xviii. Le pays est largement tributaire de l'dtranger, puisqu'il importe latotalite de ses biens d'equipement et une tres importante partie de ses biensde consommation. La population, qui a acquis des habitudes de consommationassez evoluees, pr6fe souvent les produits import6s aux produits nationaux.Le Belize importe tout le p6trole dont il a besoin, alors qu'il y a de bonneschances de decouvrir des gisements de petrole et de gaz naturel commercia-lement exploitables. Enf in, certains secteurs produisant pour 1'exportation(notamment le secteur de 1'habillement) importent leurs matiAres premibres.Les principaux partenaires commerciaux du Belize sont les Etats-Unis et leRoyaume-Uni.
xix. Les r4sultats A 1'exportation d&pendent principalement du sure,qui represente pres de 60 % du total des exportations nationales. Or, laproduction sucridre et les cours mondiaux fluctuent fortement. Ainsi, laproduction de sucre a atteint le niveau record de 113.000 tonnes longuesen 1978, contre 62.000 tonnes seulement en 1976, ann6e ofi la s&chceresse a &t6catastrophique. Bien qu'ils aient un effet favorable sur les exportations desucre, la Convention de Lome et 1'Accord international sur le sucre n'ont passupprim6 les fortes fluctuations du prix moyen obtenu par le pays :296 dollarsla tonne longue en 1978, 491 dollars en 1980 et 320 dollars en 1982.

- XXX1 -
xx. Le deficit de la balance des paiements courants a enregistr6 d'amplesvariations, sous 1'effet des fluctuations des recettes provenant des expor-tations de sucre. De 5,2 millions de dollars en 1975 (5,4 % du FIB), il aatteint en 1979 24,5 millions de dollars, soit 19,8 % du FIB. Il s 'est 4tabliA environ 13 % du FIB en moyenne au cours de ces cinq dernidres annees. Commeles investissements repr6sentaient en moyenne 26 % environ du FIB, ils ontdonc &te financ4s pour moitid par des ressources exterieures.
xxi. Les apports de capitaux ext4rieurs au secteur public permettent definancer pres de 70 % du deficit de la balance des paiements courants. Ilsemble que les investissements etrangers prives aient At peu importants cesdernidres ann4es, bien qu'ils soient encourages par un regime de change rela-tivement lib&ral, appliqu6 de fagon souple et pragmatique. En outre, la pra-tique du taux de change fixe est soutenue par une politique monetaire coh6-rente. Les capitaux proviennent essentiellement de dons et de pr&ts assortisde conditions lib&rales, consentis par des organismes d'aide bilatArale etmultilat6rale, essentiellement pour des programmes de diveloppement. Levolume des reserves officielles, qui a toujours 4tA faible, ne reprisentaitplus en 1982 que quatre semaines d'importations environ (non compris lesreexportations). Comme cette diminution resulte de la ddterioration destermes de 1'dchange, le pays n6gocie avec le FMI un prdt au titre du mecanismede financement compensatoire.
xxii. Le credit interieur au secteur public augmente trds rapidement.Il repr6sente actuellement un tiers environ du credit int6rieur total. Celatient au fait que les finances publiques se sont recemment deteriorees et quele secteur public d6pend donc de plus en plus de cr&dits interieurs pourfinancer ses investissements et, dans certains cas, ses d6penses courantes.
xxiii. Les conditions sont favorables A 1'investissement. Dans 1'ensemble,la politique officielle, et en particulier la politique d'immigration qui estrelativement libbrale, favorisent 1'investissement etranger et national.Toutefois, les inqui6tudes suscit6es par la situation politique dans la r6giontendent A decourager les investissements prives. Les pouvoirs publics mettenttout en oeuvre pour apaiser ces inqui4tudes, en s'efforgant de projeter A~1'etranger 1'image d'un pays stable et d6mocratique. Ltune des questions quipri.1ccupe les investisseurs est le diff6rend qui oppose encore le Belize auGuatemala mais qui semble desormais s 'attinuar peu A peu.
xxiv. Certains produits importes et certains produits locaux sont soumisau contrble des prix, les premiers, par le biais de taux de marge maximumset les seconds, par le biais de prix plafonds. Depuis 1974, des licencesd'importation sont exigees pour certains produits. A 1'origine, ces licences6taient faciles A obtenir mais les conditions d'octroi ont et durcies. Farailleurs, les pouvoirs publics ont voulu encourager le d&veloppement decertaines branches d'activit6 en les exon6rant de 1'impbt sur les b4ndf ices etdes droits d'entrAe sur les biens d'6quipement et, parfois, sur les matidrespremihres. Toutefois, le contr6le des prix, les licences d'importation et les
- XXX11 -
incitations au d&veloppement ne semblent pas avoir beaucoup d'effet sur1'Aconomie. Cela tient peut-Stre en partie a ce que dans bien des cas, cesmesures se neutralisent. En outre, elles ne sont pas appliqu6es rigoureu-sement. Quoi qu'il en soit, elles impliquent des d4penses d'administration etsuscitent de vaines inqui4tudes parmi les investisseurs priv6s potentiels. Ilest donc recommand6 d'adopter et d'appliquer de fagon coordonnde les mesuressuivantes:
a) assouplir le contr61e des prix et ne 1'appliquer que dans lecas des monopoles;
b) liberaliser les importations sans compromettre le redressementde la balance des paiements;
c) r&duire au minimum les exon6rations de droits d'entree;
d) donner desormais la priorit6 aux incitations visant A encou-rager le d6veloppement des activitis tourndes vers 1'expor-tation et employant des matidres premidres locales.
xxv. Le regime foncier en vigueur est favorable au d4veloppement. D'unepart, 1'Etat posshde prds de 500.000 hectares de terres agricoles qu'il of fre,A relativement bas prix, A la population locale ou aux 6trangers, A conditionque ceux-ci les mettent en valeur conformement A un plan arr&t6 avec lespouvoirs publics. D'autre part, le fisc est en train d'instituer un nouvelimp6t foncier sur les sols non exploit6s pour encourager la mise en valeur desterres. L'efficacit6 de cette mesure d6pendra de la manidre dont elle est.ppliqu6e.
xxvi. Les perspectives de croissance economique sont 6troitement li6es A1'Avolution de la conjoncture internationale. Comme 1'Aconomie du pays esttres ouverte et que le march& int&rieur est peu important, on ne peut accroi-tre sensiblement la production qu'e 1'orientant vers 1'exportation. Puisquela reprise 6conomique mondiale semble s'amorger, les perspectives de crois-sance du Belize paraissent encourageantes. En outre, le pays jouit d'unavantage comparatif dans plusieurs domaines. Premidrement, il posshde d'abon-dantes ressources naturelles; deuxi&mement, la politique suivie par les pou-voirs publics est judicieuse, et troisiemement, les conditions sont favorablesA 1'investissement int6rieur et 6tranger et, dans 1'ensemhble, les relationsprofessionnelles sont harmonieuses. Si la reprise de l'&conomie mondiale seconfirme, le taux de croissance devrait atre, d'apris les projections de lamission, de 3 % en 1983, et passer a 4 % en 1984 puis A 5 % A partir de 1985.La croissance devrait reposer sur les secteurs suivants :sucre (jusqu'a ceque la capacit& des sucreries, soit 115.000 tonnes actuellement, auxquelles ondoit ajouter une capacit6 de 5.000 tonnes en 1984, soit pleinement exploitie),agrumes, bananes, elevage, pisciculture, aviculture, riz, mals et autrescultures non traditionnelles. La construction, 1'industrie alimentaire etle tourisme devraient 6galement progresser r6gulibrement.

- XXX.111 -
xxvii. Les pouvoirs publics doivent s'ef forcer d'encourager 1'epargnenationale. On s'attend A une augmentation de 1'epargne du secteur public,qui devrait passer de 3 % du PNB actuellement A 5 % d'ici A 1985. Ce niveau,ddjA atteint dans le passe, devrait pouvoir 1'Atre A nouveau sans difficultd.N6anmoins, pour le maintenir, il faudra faire preuve d'une grande vigilance,notamment parce que 1'exc6dent financier du nouveau systeme de s6curit6sociale risque de diminuer dans les annees A venir. L'epargne priv6e qui,ces cing dernieres anndes, a represent& en moyenne 9 % environ du PNB devraitpasser a 13 % environ en 1990. Cela signifie que le taux de croissance de laconsommation privee sera legArement inferieur A ce1ui du PNB; il sera n6anmoinssuffisant pour permettre une augmentation sensible de la consommation reellepar habitant.
xxviii. On peut s 'attendre a une amelioration de la position de la balancedes paiements A moyen et A long terme. Ce redressement est subordonn4 Al'application d'une strategie de developpement axee sur la diversification desexportations, qui permettrait de proteger 1'economie du Belize contre lesfluctuations cycliques du sure. ILl est essentiel, pour r66quilibrer labalance des paiements, de freiner la croissance des importations de produitsalimentaires, de combustibles et de biens de consommation durables. Poury parvenir, il faut prendre plusieurs mesures :en particulier supprimerprogressivement les exonerations de droits d'entree et mettre en oeuvredes projets ax6s su~r les 4conomies d'energie, notamment des projets d'elec-tricit4. Dans 1'imm6diat, 1'am4lioration des termes de 1'6change devraitavoir un effet favorable sur la balance des paiements.
xxix. Le d6ficit de la balance des paiements courants devrait diminuerprogressivement, tombant de 16 % du PIB en 1982 A 8 % en 1990 et au-deli.Pour financer ce deficit et augmenter legArement les reserves de devises,ii faudrait que les entrees annuelles nettes de capitaux soient de l'ordre de25 millions de dollars en moyenne jusqu'A la fin de la decennie et de l'ordrede 40 millions de dollars de 1990 A 1995. Les apports nets de capitaux ext6-rieurs au secteur prive devraient couvrir pres de 30 % des besoins. Cetteprojection pourrait fort bien se v6rifier, car le secteur priv6 of fre denombreuses possibilit6s d'investissement, situation qui ne pourra que s'abliorer avec la reprise de 1'economie mondiale. Les apports annuels netsde capitaux ext6rieurs au secteur public devraient Stre de 1'ordre de18 millions de dollars en moyenne jusqu 'A la fin de la decennie et de 1'ordrede 28 millions de dollars de 1990 A 1995.
xxx. Le programme d'investissements publics conf Are un haut rang depriorite aux projets d'equipement qui conditionnent la realisation d'inves-tissements productifs, A savoir les projets d'4lectrification et d'am6nagementroutier et portuaire. Ce programme est donc essentiel pour la relance de1'Aconomie. Les investissements publics pr6vus pour les exercices 1983/84A 1987/88 s'61Avenit A 142 millions de dollars, soit environ 28 millions dedollars par an. ILls devraient Atre financ4s comme suit :a) 6pargne dusecteur public, 38 %; b) entr6es nettes de capitaux exterieurs, 55 %; etc) emprunts int&rieurs nets et recettes interieures en capital, 7 %.

- XXX1V -
xxxi. La reussite du programme d'investissements publics depend de plu-sieurs facteurs. Premierement, ii faudrait que 1'epargne du secteur publicatteigne 5 % environ du PIB. Pour cela, il faudrait tout d'abord ameliorerles r4sultats financiers de 1'Electricity Board, du Marketing Board et duBanana Control Board. Deuxiemement, 11 faudrait obtenir des capitaux exte-rneurs, ce qui ne devrait pas poser de problemes; en effet, le Belize s'estdej& assur6 les ressources necessaires pour 1983 et 1984. Troisiemement, ilfaudrait reduire considerablement la part des capitaux interieurs consacr6eaux investissements publics, et en particulier les emprunts contractis loca-lement, de maniere que le secteur priv4 dispose de davantage de ressources.
xxxii. La dette publique exterieure a augment6 rapidement ces dernidresanndes. Bien que 1'on ne dispose pas de renseignements sur la dette ext6-rieure du secteur priv6, on sait qu'il a contracts des emprunts principalement& des fins d'investissement. A la fin de 1982, le montant des emprunts exth-rieurs contractes ou garantis par 1'Etat etait estime A. 70 millions de dollarsenviron, soit 45 % du PIB. Le ratio du service de la dette publique 4taitfaible :moins de 5 % de la valeur des exportations (non compris les rdexpor-tations). Cela tenait A ce que la structure de la dette 6tait favorable etque la plupart des emprunts 4taient assortis de conditions liberales. Leratio du service de la dette devrait passer a. pres de 12 % en 1983 et 1984; eneffet, divers emprunts arrivent & Ach6ance et les pouvoirs publics ont diGcontracter plusieurs emprunts aux conditions du march6, pour faire face auxdifficult6s financieres de 1981-82.
xxxiii. Au cours de la prochaine decennie, le secteur public compte obtenirdes fonds aupres de diverses sources, A des conditions lib6rales et aux con-ditions du march&. Le volume des emprunts aux conditions du march& devraitaugmenter, passant de 35 % du total des d4caissements &. environ 60 % en 1990et A 76 % en 1995. On prevoit cependant que le ratio du service de la dettetombera de 12 % en 1983 & 7 % environ & la fin des anndes 80, A mesure que lesrecettes d'exportation augmenteront. Ii devrait ensuite s'taccroitre de nou-veau, parallelement au volume des emprunts contract4s aux conditions du mar-che, pour atteindre 10 % au milieu des ann6es 90. Le ratio du service de ladette devrait donc rester dans des limites raisonnables. Par cons4quent, leBelize devrait pouvoir contracter des emprunts limitAs aux conditions du mar-chi, si les pouvoirs publics continuent d'appliquer une strat4gie de develop-pement ax6e sur l'exportation et une politique financiere avisee, si les orga-nismes d'Etat ameliorent leurs resultats financiers et si les investissementspublics sont consacres & des projets hautement prioritaires ayant un taux derentabilite satisfaisant.

I. POPULATION AND EMPLOYMENT
1. Belize, located on the Yucatan Peninsula in Central America, attainedindependence from the UK on September 21, 1981. The country has many differentraces, cultures and languages; the Creole population comprises about 40% of the145,000 inhabitants, Mestizos account for 33% and Amerindians for 17%. The restincludes people of European, Arabic, East Indian, Garifuna, and Chinesebackground.
2. Belize has the lowest population density.in Central America and one ofthe lowest in the world, 6 persons per km2. This seem to be explained by theswampy and barren land near the coast which discouraged intensive settlement andthe limestone mountains covered with tropical forest in the interior whichhampered both communications and settlement. Moreover, being the only Englishspeaking country in Central America has kept Belize more isolated from theneighbouring countries and has strengthened its links with more distant countries:the U.S. A., UK, and the Caribbean English speaking countries.
3. Increasing relations with, and significant migration from CentralAmerica have developed in recent years. As a sizeable part of the population nowspeaks Spanish, 32% of the total, the country is building up its communicationinfrastructure with Mexico, Central America and the Caribbean and is projectingits image as a new independent and multicultural political entity. This processis expected to bring significant economic and cultural advantages to Belize. Itmay also raise some complex social and political issues in the years to come.
4. The average annual rate of population growth during the period 1970-80was 1.95%, fairly modest in relation to the economic potential of the country andits capacity to sustain a significantly larger population. This slow populationgrowth has resulted mainly from a large emigration, mostly to the U.S.A. wheremore than 20,000 Belizeans have settled since 1970. However, as the naturalpopulation increase has remained relatively high, around 3.4% per annum, becauseof high birth rates (about 40 per thousand) and declining death rates (from 7 perthousand in 1970 to less than 5 in 1980), the prospects are for significantpopulation increases in the years to come, particularly if the economy maintains asignificant rate of economic growth.

- 2-
Table 1: Population Trends 1970-1980
Number of
People %__
Population - 1970 Census 119,934 100.0
Total births - 1970/1980 53,295 44.4
Total deaths - 1970/1980 7,482 6.2
Net Migration - 1970/1980 -20,394 -17.0
Population - 1980 Census 145,353 121.2
Source: Abstract of Statistics 1981, Central Planning Unit.
5. Belize City, the former capital, has always been the center ofpopulation. After Hurricane Hattie severely damaged Belize City in November 1961,a decision was taken to move the capital to Belmopan, some 80 kilometers inland.The Government continues to spend considerable sums to improve the infrastructureand social services of Belize City which, nevertheless, remain poor because of theCity's swampy location. The population of Belize City has stagnated over the lastten years at about 39,000 inhabitants, thus declining as percentage of the totalpopulation from 33% in 1970 to 27% in 1980.
6. Female participation in the labor force increased dramatically duringthe last twenty years. While the labor force participation rate of males has re-mained at about 98% during the past two decades, the female participation hasincreased from 20% in 1960 to 30% in 1980. As a result, the total labor force hasincreased as a percentage of the work age population from 58% in 1960 to 60% in1970 and to 65% in 1980.

-3 -
Table 2. Employment: Structure
1960 1970 1980
Population at working age-Total 46,335 55,624 71,510Females 23,739 27,845 35,096Males 22,596 27,779 36,414
Economically active population-Total 27,006 33,360 46,457Females 4,883 6,012 10,627Males 22,123 27,348 35,830
Employment - Total 24,477 31,465 39,806Females 4,498 5,981 8,024Males 19,979 25,484 31,782
Labor force participation (%) 58.3 60.0 65.0Females 20.6 21.6 30.3Males 97.9 98.4 98.4
Unemployment (%) 9.4 5.7 14.3Females 7.9 0.5 24.5Males 9.7 6.8 11.3
Source: 1960, 1970 and 1980 Census.
7. The structure of employment by economic sectors has not experienced anysignificant change during the past decade. Agriculture, forestry and fishingcontinued to be the most important sector, accounting for one third of the laborforce. Industry and transport ranked second with about 24%. The rest of thelabor force is employed in the service sector. A relevant element, however, isthe difference between the sectoral allocation of males and females. Females areemployed mostly in the service sectors, while agriculture and industry remainlargely male occupations.

Table 3. Structure of Employment by Economic Sectors
(%)1970 1980
Males Females Total Males Females Total
Professional andTechnicians 4.8 23.7 8.4 5.4 23.1 9.0
Administrative and
Managerial 0.6 0.3 0.5 0.7 0.4 0.6Clerical 3.9 12.6 5,5 4.6 16.9 7,1Sales 6.1 12.4 7.3 5.3 11.8 6.6Service 4.6 28.8 9.2 4.9 24.4 8.8Agriculture, Fores try
and Fishing 39.4 8.1 33.5 40.8 4.9 33.6Industry and
Transport 27.8 12.6 24.9 26.0 14.8 23.7Other 12.8 1.5 10.7 12.3 3.7 10.6
TOTAL 100.0 100.0 100.0 100.0 100,0 100.0
Source: 1970 and 1980 Census.
8. Unemployment is an acute problem in Belize City and among the young.The unemployment rate was estimated at 14.3% in 1980 or about 6,800 workers, ofwhich 67% were in the 15-19 year old bracket and almost 50% lived in Belize City.Unemployment has increased sharply from 5.7% in 1970 to 14.3% in 1980. Unemploy-ment in the sugar area continues to be minimal.
Table 4: Unemployment
Labor Country Belize City 15-19 Years OldForce % #% #% #/
TOTAL 46,457 14.3 6,652 21.8 3,284 40.0 4,520MALE 35,830 11.3 4,048 20.3 1,983 33.4 2,569FEMALE 10,627 24.5 2,604 24.5 1,301 54.2 1,951
Source: 1980 Census.
9. Future patterns of employment will largely depend on emigration andincorporation of females into the labor market. Two basic scenarios are forseen:
(a) the labor force will grow at the same rate as the total workingage population during the 1970s, about 2.5% per year. This growthrate is based on two key assumptions: female labor force

- 5-
participation will remain at about 30% and net outmigration willaccount for 1% of the population per year. Under this scenario theeconomy will have to grow an annual average of about 4% to 5% Inorder to employ the 1,200 new workers per year; or
(b) the labor force will grow, at least, as fast as during the 1970's,3.4% per year. This implies that female participation in the labormarket will continue to increase and that outmigration willcontinue at the same rate. Under this scenario, the economy willhave to grow more than 6% per year just to absorb the new workerscoming into the market.
As scenario (b) is more likely, an increase in unemployment is to be expected un-less the economy grows very rapidly. This is a serious situation as unemploymentis already high, thus the issue is to provide jobs not only to new workers butalso to unemployed ones. Unemployment is however a complex issue. The countryoffers considerable employment opportunities in agriculture which appear to meetneither the expectations nor the training of large segments of the population,particularly those persons living in Belize City, who are reputedly the mostinclined to emigrate. As a result, there is a seasonal shortage of labor in ruralareas and some 1,500 workers from neighboring countries are needed every year inthe sugar and citrus areas during crop season. At the same time the Governmenthas not discouraged new settlers from neighboring countries from coming to Belize,and they have done so in increasing numbers during the last three years. Further-more, the Government is also considering a scheme for Haitian emigrants ex-perienced in agriculture, in addition to the UN project for Salvadorian-BelizeanSettlement in the Valley of Peace,
10. The Government has recently implemented an open immigration policy in anattempt to attract greater numbers of people interested and experienced in agri-culture. Access to government-owned land is easy and cheap provided that the landwill be productively exploited. Within the context of this policy, the Governmentis implementing a rural development project for the settlement of Salvadoreanrefugees and Belizean families who want to work the land. The project, funded bythe U.N., appears to be well designed and managed with the relevant economic andsociological elements properly dealt with. So far 44 families have been settled.Each family receives 50 acres, pays no land tax during the first three years, withany further land tax or royalty payment to be set off against the purchase. Forthe continuation and enlargement of this project 15,000 acres of land will be madeavailable in the Valley of Peace, near Belmopan.

- 6-
II. ECONOMIC BACKGROUND
Output and Economic Growth
11. During the eighteenth and nineteenth centuries forestry was the maineconomic activity of Belize and perhaps the chief reason for the existence of aBritish settlement in Central America. A declining trend in the forest industrybegan to be noticeable at the beginning of the twentieth century. By the end ofthe Second World War the decline was evident in both absolute and relative termsas forest resources has become largely depleted.
12. A transition to agriculture started at the end of the 19th century;large estates exported bananas to the United States as early as in the 1880s.After a rapid expansion in the Stann Creek Valley, banana cultivation declinedrapidly as a result of the Panama disease and by the end of the 1930s bananas as acommercial crop had practically disappeared.1! The industry was reestablished inthe early 1960s for export to the UK. Sugar played practically no role in thecountry's economy until the middle of the 19th century. It is believed thatmestizos fleeing from the Yucatan during the "cast wars" in the 1850's, came withsticks of cane and gave the first major impetus to sugar activities. By the endof the 19th century there were about twelve small sugar mills in the north ofBelize operating under primitive methods. Around 1870 there were also over 10small sugar mills in the southern Toledo district, operated by Americans whosettled in Belize after the American Civil War using labor from India. The largeexpansion of the sugar industry took place in the 1960s and made this activity themost important one in Belize. Exports of citrus started around 1925 and expandedrapidly twenty years later. Citrus was initially produced on large estates, butoutgrowers, who bring their products to the estates for processing now account forhalf tie output.
13. Agriculture and services are the most important sectors of the Belizeaneconomy, each of them accounting for 40% of GDP. Sugarcane, citrus and bananasare dominant in agriculture; trade, public administration and tourism inservices. Manufacturing, is about 8% of GDP but this includes sugar and citrusprocessing. Construction is a dynamic sector which traditionally contributes morethan 5% of GDP, a percentage that may increase as large investment projects areimplemented. It should be noted that trade and transportation include the valueadded generated by re-exports to Mexico which had until recently been an expandingactivity. Mining and quarrying is a very small sector; it accounts for less than0.5% of GDP.
1/ This caused the closure of the railway system that had been operating since1892.

- 7-
Table 5. GDP by Sector
(%)
1978 1979 1980 1981 1982
Agriculture, Forestry andFishing 47.5 44.7 4623 43.6 39.6
Manufacturing 7.9 7.6 8.4 8.2 7.0Construction 5.4 6.3 5.7 6.6 5.7Mining and Quarrying 0.4 0.4 0.3 0.3 0.3Services 38.8 41.0 39.3 41.3 47.4
100.0 100.0 100.0 100.0 100.0
Source: Mission estimates.
14. The Belizean economy expanded steadily during the 1960s. Real GDP grewabout 4.5% per annum, or 1.6% in per capita terms, as the country, assisted byBritish aid, recovered from the devastation of Hlurricane Hattie which hit in1961. The purchase and expansion of sugar mills by Tate and Lyle in 1964 accele-rated sugar exports, a key element in the growth performance.
15. Econ.omic growth continued during the 1970s, with real GDP growing by anannual average of neairly 5%. But growth in Belize is subject to fluctuations asthe economy is small and thus very sensitive to fluctuations in major activitiessuch as sugar production and to the pace of implementation of new activities.During the period 1970-78 agriculture expanded about 5% per year as sugarproduction increased and the banana industry was being reestablished.Manufacturing also grew fast as a number of import-substituting industriesincluding cigarettes, flour mills, beer, fertilizer mixing, and an export-orientedgarment factory were established.
16. A slowdown occured during 1978-81 with real GDP slowing to an annualaverage of 1.8%. Sugar, which accounts for about 25% of GDP, explains to a largeextent this perf?ormance. In 1979 sugar production declined by 13% causing adecline in GDP of 1.4%. Some decline in sugar production had been expected in1979 because the previous year had been exceptionally good, however, smut diseasesmade the decline even deeper than expected. Sugar production grew by 5% in 1980while the whole economy grew almost the same, increases in citrus and garmentproductions were also significant that year.
17. In 1981, sugar production declined by 5%, but other sectors particularlyconstruction, fishing, livestock, poultry, corn, and rice performed well. Thus,the trends were offsetting with real GDP increasing by 2.6%. The decline in sugarproduction in 1981 resulted from a combination of bad weather and smut disease

- 8-
which has not been totally eradicated. An additional factor is having an impacton sugar production: the smut-resistant varieties being planted have in the earlystages, lower sugar content than traditional varieties.
18. The Belizean economy suffered from the international economic recessionin 1982, real GDP is estimated to have declined by 0.3%. Agriculture grew 2%thanks to sugarcane production whose increase was large enough to offset thedecline experienced in other agricultural products. Manufacturing grew about 5%mainly as a result of the increase in sugar production, citrus processing andbeer, but the production of other manufactured products particularly garments andcigarettes declined. The combined service sector declined by an estimated 1%, aperformance associated with the 10% decline in "Trade, Restaurants and Hotels"which constitute 25% of the service sector. This 10% decline is, in turn, chieflyassociated with the general recession affecting particularly transshipment tradewith Mexico and tourism. Construction declined by 21.5% in 1982. This wasrelated to several factors such as the completion of some major public projects,the slowdown in the execution of new ones due to financial constraints and thedecline in private construction because of the drop in income.
Table 6. GDP Growth By Sector
1979 1980 1981 1982
Agriculture, Forestry andFishing -7.0 4,9 2.7 2.0Manufacturing -7.1 10.7 -1.8 5.0Construction 7.7 0.5 12.5 -21.5Mining and Quarrying 0.0 0.8 0.0 0.0Services 6.2 2.9 2.0 -1.0GDP -1.4 4.3 2.6 -0.3
Source: Mission estimates.
19. Belize's economy is vulnerable to external shocks because of itsdependance on sugar. As such, the country has suffered from unfavorable terms oftrade in recent years, particularly in 1982. The decline in prices of sugar andcitrus and the adverse impact on the banana industry of the appreciation of the USdollar against the pound sterling, have resulted in a drop in the real GrossDomestic Income of about 5% during 1982.
20. The economy has been able to generate relatively high levels of savings,national savings have averaging about 14% of GNP in the last five years. However,savings are subject to sharp fluctuations associated with fluctuations in sugarexport earnings. For instance national savings accounted for 20% of GNP in 1980

-9 -
but dropped to 9% in 1982. The association is evident; in 1980 sugar prices werehigh; in 1982 they dropped sharply. The private sector generates about 70% of thetotal savings. Gross fixed capital formation has been fluctuating between 25 and30% of GDP during the last quinquennimum. Therefore, national savings have beenfinancing, as an average, about a half of the capital formation (investment) whilethe rest has been financed by external resources.
Table 7. Investment and its financing(% of GDP)
Balance of
PaymentGross National Savings Current Account
Year Investment Total Public Private (Deficit)1978 28.1 17.6 4.5 13.1 10.51979 30.8 11.0 3.9 7.1 19.81980 27.8 19.8 5.4 14.4 8.01981 27.1 13.6 2.8 10.8 13.51982 25.2 8.9 3.1 5.8 16.3
Source: Mission estimates
The Public Sector
21. The public sector comprises the National Government and nine statutorybodies. 2/ The Government also owns two financial institutions: the DevelopmentFinance Corporation (DFC) and the Central Bank; their operations are discussed inthe money and credit section of this report.
22. Public sector activities represent about 30% of GDP. Involvement of thepublic sector in the economy is basically through traditional services: electri-city, airport, port, communications and social security. There is, however, someinvolvement in agriculture, mainly banana and, to a lesser extent, beefproduction.
23, The National Government is the most important component of the publicsector, It employs about 4,000 people, including temporary workers. The NationalGovernment's main revenues are import duties and direct taxes. On the expenditureside, the wage bill accounts for 45% of the total current expenditures, whilegoods and services account for about 30%.
24. Import Duties are the most important current revenues for the NationalGovernment; they provide about 35% of the total. Import duties are charged ongoods imported into the country excluding goods in transit which are subject to a2% fee. Belize has adopted the Caricom Common External Tariff whose maincharacteristics are:
2/ Water and Sewerage Authority, Belize Electricity Board, TelecommunicationsAuthority, Belize Marketing Board, Belize Meats Ind., Banana Control Board,Port Authority, Social Security, and Reconstruction and DevelopmentCorporation & Housing (RECONDEV).

- 10 -
(a) the highest nominal tariff is 45 percent;(b) the lowest nominal tariff is zero percent;(c) import tariffs increase according to the degree of processing of
commodities; and(d) in some cases, specific duties are used instead of ad-valorem ones.
25. Direct taxes provide around 20% of the current revenue. They includeincome tax, personal and company, and land tax. Rates on personal income -tax arevariable; up to a maximum of 50% on taxable annual income, of US$30,000 or more.Companies pay a flat rate of 45% on their income. Land tax is paid according tothe type of land, with rates rising when the land is close to a road maintainedwith public funds or is coastland.
26. Other taxes provide for most of the rest of National Government'scurrent revenues. They are:
(a) export duties (2% on sugar; 5% on the rest);(b) excise on spirits, beer and cigarettes;(c) stamp duties; and(d) fee on goods in transit (2%).
27. The National Government's finances have in general been managed soundlywhile those of several statutory bodies typically have not. The NationalGovernmment's current savings traditionally amounted to about 5% of GDP but theydeclined to 2.8% in FY1981/82 and 3.7% in FY1982/83. These declines in currentsavings are associated with increases in the wage bill and with reductions infiscal revenues resulting from the drop in export prices. The financial situationof the statutory bodies has been generally poor and continued to deteriorateduring 1982. This poor performance is associated with both inefficiencies as wellas subsidies imposed by the government in major statutory bodies.
28. National Government's current expenditures have been growing fast mainlyas a result of the growth in the wage bill. This growth is largely associatedwith Belize's independence because of the need to provide new type of services.Nevertheless, close control of the wage bill is needed; a control that shouldrefer to both salaries and number of employees. However, the increasing shortageof qualified personnel in the public sector suggests a careful study of the salarystructure with a view to selected increases.
29. The National Governmment's current revenues have remained at high levelsin recent years, about 27% of GDP. While there is some room for increasingrevenues, especially by reducing import duty exemptions, any substantial increasein the overall tax burden could have a negative impact on the economy.
30. The savings generated by the Telecommunications Authority, the PortAuthority, the Social Security and, lately, RECONDEV (housing) have generally notbeen able to compensate for the current deficits of the Electricity Board, theBanana Control Board, the Marketing Board, Belize Meats and the Water & SewerageAuthority. The situation has deteriorated further in 1982.
31. The Government is committed to the improvement of the financialperformance of the statutory bodies but major decisions are yet to be taken.Subsidies to producers, inefficiencies, and the international economic situationare responsible for the situation of the major statutory bodies:

- 11 -
(a) The Marketing Board has been purchasing and selling the localproduction of rice, corn, beans, and sorghum. These operationscontain an element of subsidy as profit margins have been too smallto cover overhead costs or, in some operations, have even beennegative. Heavy losses were made on corn operations during 1982because the price paid to the growers was far above theinternational and domestic prices at which the corn had to besold. The Marketing Board lost about US$0.5 million in FY1981/82and about US$0.7 million in FY1982/83. The government now appearsmore cautious about subsidies but, nevertheless, a clear resolutionto discontinue this type of operations is advisable;
(b) The Electricity Board (BEB). The electricity system is fragmentedand inefficient; as a result energy losses are substantial, andcurrent financial losses for FY 1982/83 are estimated at US$1million. Several requirements appear to be needed to improve BEB'sfinances. First, management and administration need to bereorganized and strengthened; second, the distribution systemshould be interconnected so as to reduce energy losses; and third,the level and structure of rates should be reviewed. To solvethese issues a number of projects are envisaged by the authorities;and
(c) The Banana Control Board. This board has the monopoly on bananaexports and controls practically all the banana production inBelize. Its finances have been negatively affected by two mainelements. First, the level of activities is not large enough tomake the industry profitable; in particular transportation costsper unit are high; and second, while sales are in sterling, costsare in US dollars thus the depreciation of the Pound Sterling inthe last year has reduced export earnings from bananas. BCB'soperational losses, were more than US$1 million in 1981 and 1982.To solve this problem, the Government has taken the followingapproach: (i) over the course of time BCB will retain its onlyexport functions; banana lots will be sold to farmers currentlyemployed by BCB who have demonstrated sound management conditionsafter a training period; (ii) new farmers, already experienced inagriculture, are expanding banana production. The Government isencouraging this development because it has been estimated that4,000 acres (3 times the present size) should be in production tomake the industry economically and financially viable; and (iii)resolution of the transportation problem will be examined as a partof the Master Transportation Plan Study. High transportation costsare due partly to the lack of port facilities; bananas are bargedto Honduras and transshipped there to ocean-going vessels.
32. Public investment has played an important role in the economic devel-opment of Belize representing between 60 to 70% of total domestic investment andabout 15% of the GDP. The public sector has executed infrastructure projects suchas the Northern Highway, the Western Highway, the Belize City Port, electricity

- 12 -
expansion, and water and sewerage expansion. Execution of projects, however, hasslowed as declining public savings has limited the domestic resources available tofinance investment. As a result, public investment is estimated to have declinedin real terms during FY 1982/83.
33. The Public Sector has relied increasingly on external funds to financeits investments. In 1975, external capital funded 27.2% of the total publicinvestment; in FY1982/83, more than 70%. The use of other domestic resources,mostly credit from the domestic financial system, has been increasing becausesavings have not grown in line with investment. However, this situation wasimproved somewhat in FY1982/83 as a result of the increase in external fundinflows, on one hand, and the reduction in public investment, on th other,
Table 8. Public Sector Capital Expenditures: Sources of Financing(%)
PublicSector Net Other
Current External DomesticYear Savings Financing Sources 2/ Total
75 70.9 27.2 1.9 100.076 26.9 58.3 14.8 100.077 8.2 66.4 25.4 100.078 23.7 58.5 17.8 100.079/80 1/ 25.1 52.7 22.2 100.080/81 -~ 35.6 44.2 20.2 100.081/82 18.4 58.1 23.5 100.082/83 17,2 78.7 3/ 4.1 100.0
1/ January 1, 1979 to March 31, 1980.2/ Includes: a) Capital revenues; b) Credit from the financial system; and c)
suppliers and other credits.3/ Includes borrowing from local banks denominated in US dollar.
Balance of Payments
34. Belize's balance of payments reflects an open economy: total importstraditionally represent around 100% of GDP; exports around 80%. The openness ofthe economy is also reflected in large amounts of remittances sent by Belizeansliving abroad, in increasingly important re-export trade with neighboringcountries, and in sizeable inflows of capital.

- 13 -
Table 9. Exports and Imports as Percentages of GDP
Year Exports of Imports of ResourceGoods and NFS Goods and NFS Gap
1975 70.9 90.1 19.21976 59.9 95.1 35.21977 73.7 95.6 21.91978 90.3 111.8 21.51979 86.4 116.9 30.51980 94.0 109,7 15.71981 88.6 106.7 18.11982 74.0 96.4 22.4
Source: Mission estimates.
35. Belize's commodity export base is narrow and depends heavily on sugar.Exports of citrus (fruit and concentrates), fish and bananas are increasinglyimportant. Other exports include garments, where the local value added onimported material is fairly low; wood, which experiences fluctuations along along-term declining trend; and meat, which is still small but has a goodpotential.
Table 10. Exports by Products a/(% of Domestic Exports)
CitrusYear Sugar and Molasses Products Fish Bananas Other Total
1978 61,5 7.6 3.3 3.1 24.5 100.01979 55.0 7.3 7.2 5.6 24.9 100.01980 60.8 7.8 5.0 4.3 22.1 100.01981 62.1 8.7 9.7 2.9 16.6 100.01982 55.7 12.0 11.1 4.0 17.2 100.0
a! Not including unrecorded exports.
Source: Mission estimates.
36. Belize's balance of payments performance is, therefore, largely depen-dent on production and prices of sugar, citrus, bananas and fish. Sugar has beenaffected by droughts, by diseases and by sharp changes in international prices.Production reached 113,000 long tons in 1978, a record level, after only 62,000long tons in 1976 when the worst drought in the century took place. Sugar prices

have also been very unstable; although Belize benefits from the Loin Agreement andfrom the International Sugar Agreement (ISA), these agreements have not eliminatedsharp fluctuations in the average price received by the country. In 1978, thecountry received a low US$296 per long ton and two years later in 1980 the averageprice reached a high US$491 per long ton. Since that time, sugar prices havedropped about 35%. Export earnings from citrus concentrates have been steadilyincreasing in recent years; increases in production more than offsetting the 30%drop in prices since 1980. Volumes of fish exports have not changed very much inrecent years; however, export earnings show an increasing trend because theactivity has become more concentrated on high value species such as lobster.Banana production and prices have both moved along a declining trend during thelast quinquennium, however new plantations in the Big Greek area should produce asignificant increase in volume in the next four years.
37. The country relies heavily on imports. There are several reasons forthis. First of all, the small size of the market makes it unprofitable to producecapital goods and, in many cases, consumption goods. Second, the population beingso close to North America has developed a sophisticated pattern of consumption andoften prefers imported goods to local. Third, the country depends on imported oilfor its energy requirements, although there are good prospects for finding oil andgas in commercial quantities as well as for using hydro-energy. Finally, thereare some export-oriented industries that import their basic materials, for examplegarments. Except for fuels, the structure has experienced only marginal changesin recent years. Food represents between 20 to 25% of the total imports. Fuelsincreased from about 5% of total value of imports before the 1973 oil shock tomore than 15% in 1981, Imports of manufactured goods represent around 15%;machinery and transport, an investment-related item, around 20%.
Table 11. Import Structure(%)
1973 1975 1977 1979 1980 1981
Food 26.1 26.1 22,3 24.5 21.9 24.6Fuels 6.7 8.3 13.0 12.6 18.2 15.8Manufactured Goods 19,5 17.9 15.9 14.7 13.9 12.2Machinery and Transport 21.0 23.7 25.2 21,5 19.3 17.8Other 26.7 24.0 23.6 26.7 26.7 29.6*Total 100.0 100.07 100.0 100.0 100.0 100.0
Source: Mission estimates.
38. Exports of domestic goods are largely directed to the USA and UK.Exports to the USA have increased in both absolute and relative terms andcurrently, more than half of exports of domestic goods are directed to the USA.Exports to UK, on the other hand, declined in relative terms from around 40% ofthe total in the mid-70s to about 27% in 1981, The volume of sugar exports to theUSA has increased faster than those to the UK; this chiefly explain the change inthe relative composition of export trade. Exports to CARICOM are still small;

-15 -
they amounted to US$3 million or 4% of the total during 1981. Practically all theexports to CARICOM countries are to Jamaica and Trinidad and Tobago.
Table 12. Direction of TradeExports of Domestic Goods
(%)
Year USA UK CARICOM Other Total
1970 37.8 31.0 5.7 25.5 100.01975 51.6 41.9 3.4 3.1 100.01978 43.5 48.1 3.4 5.0 100.01979 44.1 38.9 5.1 11.9 100.01980 52.5 28.7 4.5 14.3 100.01981 52.7 26.7 3.9 16.7 100.0
Source: Mission estimates.
39. Goods are imported mainly from the USA and UK. Imports from othercountries particularly Mexico, Netherlands and Japan have been increasingsteadily. Imports from the CARICOM region are very small; about 2% of the total,and practically all such imports are from Jamaica.
40. Trade with neighboring countries is becoming increasingly important;particularly trade with Mexico and, to a lesser extent, Guatemala, This trade in-cludes both re-exports and transshipments, which are not the same. The first is aregular import which may or may not be re-exported. Transshipment, on the otherhand, is sent immediately to the third country. In the re-export trade, theBelizean traders buy the merchandise and sell it to other countries, if and whenthe market allows. In the transshipment trade Belize contributes itsfacilities--port and roads--for which it charges a 2% fee. The balance of pay-ments data include recorded re-exports on both sides, imports and exports, butonly reflect transshipments as the 2% fee, which is included in non-factor serviceearnings.
41. Re-exports have increased sharply in recent years, In 1975, theyamounted to US$12 million, or 20% of total recorded exports of goods; by 1981,they had increased to US$44 million, or 36% of the total. Transshipments havealso increased sharply in recent years, reaching US$48 million in 1981. Bothre-exports and transshipments, were adversely affected by the Mexican crisis in1982.
42. Balance of payments transfers to Belize are substantial. They comemainly from two sources. One is remittances sent to Belize by nationals livingabroad. About 20,000 Belizeans have settled in industrial countries, mainly the

- 16 -
USA, and regularly send money to their relatives in Belize. The other main source
is the transfers for the British Army stationed in Belize. Consequently, nettransfers, have financed a sizeable--but decreasing--part of the resource gap.
Table 13. Transfers and Resource Gap(US$ million)
Net Transfers/Resource Gap
Year Net Transfers Resource Gap (%)
1975 15.0 18.5 81.11976 15.0 32.5 46.21977 15.2 22.3 68.21978 15.3 23.0 66.51979 15.7 37.9 41.11980 14.8 23.4 63.21981 11.8 30.1 39.21982 13.2 34.7 38.0
Source: Mission estimates.
43. Current account balance of payments deficits have fluctuated sharply asa result of fluctuations in sugar export earnings but have averaged about 13% ofGDP during the last quinquennium. For instance, while in 1975 the deficit was US$5.2 million or 5.4% of GDP, in 1979 it reached US$24.5 million or 19.8% of GDP.Current account deficits while manageable can be reduced in the long run by: (a)expanding exports, mainly non-sugar exports; (b) improving electricity and roadservices--therefore reducing fuel requirements--; (c) cutting food imports throughefficient import-substitution; and (d) reducing imports of durable consumptiongoods by reducing exemptions on import duties.
Table 14. Balance of Payments: Current Account Deficit
Year US$ Million % of GDP
1975 5.2 5.41976 19.4 20.91977 8.8 8.61978 11.1 10.51979 24.5 19.81980 12.2 8.01981 22.2 13.51982 25.2 16.3
Source: Nission estimates.

- 17 -
44, Current account deficits have been financed by inflows of capital,primarily to the public sector. These inflows include substantial amounts of
grants and soft loans from the UK, CDB, CIDA, EEC, and the USA. Capital inflowsto the private sector have been modest but are expected to increase in the futurein response to the good opportunities for foreign private investment in Belize.International official reserves have been traditionally low, and had declined by$0.6 millions to about 4 weeks of imports (excluding re-exports) by the end of1982. Since this decline has been caused partly by unfavorable terms of trade,the country is negotiating a Compensatory Financing loan with the IMF.
45. The balance of payments deteriorated in 1982, a situation largely causedby the international recession. Export earnings dropped more than 20% mainly as aresult of the reduction in export prices--sugar, bananas and citrus--and thecontraction of the re-export business. Imports also fell by about 15% as bothconsumption and investment declined. As a result, the current account balance ofpayments deficit reached. US$25 million or 16% of GDP. Capital inflows to thepublic sector increased but those to the private sector declined.
Foreign Currency Controls
46. Only the Central Bank and authorized dealers can legally buy and sellforeign currency. Authorized dealers include commercial banks, which can retainsome foreign currency. Transactions in foreign currency are subject to thefollowing rules:
(a) importers obtain foreign currency by presenting the invoice and, ifthe import requires a license, the authorization granted by theMinistries of Trade and Finance, Overinvoicing or undervoicing areconsidered fiscal offenses rather than breaking of foreign exchangeregulations;
(b) business travellers can obtain foreign currency up to BZ$6,000 peryear; non-business travellers up to BZ$1,500 per year. Thesepurchases can be made directly from authorized dealers butrequirements in excess of these amounts need the Central Bank'sauthorization;
(c) foreign investors have no limit on the amount of profits that theycan send abroad. When a foreign investment has not been registeredand the owner wants to repatriate profits, he has to demonstrate tothe Central Bank the origin of the profits and the realization ofthe investment;
(d) residents are not normally allowed to own accounts denominated inforeign currency. However, exceptions are made when a need forsuch an account can be demonstrated;
(e) emigrants are authorized to take their capital with them (largeamounts of money are authorized in annual installments);

- 18 -
(f) borrowing abroad is subject to permission if the borrower wants torepay interest and principal with foreign currency supplied by theCentral Bank;
(g) exports require permits by Customs; and
(h) re-exporters have to demonstrate that in a reasonable time--up tosix months--the foreign currency will be sold to the Central Bank.
47. Belize's exchange control system is relatively liberal because theexchange control regulations have been administered flexibly and pragmatically.The law, however, gives ample room to policy makers to operate in a morerestrictive fashion if they so wish. As a key element in Belize's developmentstrategy is to maximize capital inflows, the imposition of restrictions wouldadversely affect this objective and thus although present balance of paymentsdifficulties may encourage a restrictive application of exchange controlregulations, such action should have low priority.
Money and Credit
48. The financial sector of Belize is made up by the recently createdCentral Bank and by four commercial banks which are branches of foreign banks.There is also an active Development Finance Corporation, owned by the Government,and about 50 credit unions, although not all of them are currently operating.
49. The Monetary Authority became the Central Bank in November, 1982.3/The change was mainly institutional since few operational changes have beenintroduced. The newly established Central Bank will continue to wield the powerthat the Monetary Authority had in relation to other financial institutions:controls on liquidity, and on volume, terms and condition of credit, and inaddition control on interest rates. The Act establishing the Central Bank statesthat one of its main objectives is "monetary stability especially as regardsstability of the exchange rate".
50. Restrictions on fiduciary issue capacity are contained in the Actcreating the Central Bank. It is stated that the Bank shall maintain a reserve ofexternal assets of not less than forty percent of the aggregate amount of currencyin circulation and of the Bank's liabilities for its sight and time deposits.Previously, a ratio of fifty percent was required. Outstanding loan advances tothe Government, on the other hand, shall not exceed fifteen percent of theestimated current revenue of the Government for the current fiscal year. Thereare also limits to the Bank's holding of Government Treasury Bills and othersecurities.
51. The money supply has been increasing at an irregular rate. This"erratic" money supply movement is consistent with the fixed exchange rate policyapplied in an economy largely dependent on primary agricultural exports and,therefore, subject to sharp changes in its nominal income.
3/ Legislation converting the Monetary Authority into the Central Bank was passedin November 1982 with retroactive effect from January 1, 1982.

- 19 -
Table 15. Money Supply(In millions of Bz$)
dM/MYear dM M (%)1977 3.3 21.8 15.11978 12.2 25.1 48.61979 1.1 37.3 2.91980 4.4 38.4 11.51981 -0.7 42.8 -1.61982 0.1 a/ 42.1 0.2
a! December 1981 - June 1982.
dM - Increase in money supply (currency with public plus demand deposits).M - Money supply at the end of the previous year.
Source: Central Bank.
52. Domestic credit to the public sector has been growing fast. At the endof 1976, total outstanding net credit to the public sector represented 11.6% ofthe total domestic credit. This percentage rose to 28.4 at the end of 1981, and33.0 by the end of June 1982. This is associated with an increasing reliance onthe part of the public sector on domestic credit to finance capital and--in somecases--current expenditures.
Table 16. Domestic Credit a!(Outstanding - December 317
(Million Bz$ (%)To Public To Private To Public To Private
Year Total Sector Sector Total Sector Sector
1976 66.3 7.7 58.6 100 11.6 88.41977 66.9 12.2 54.7 100 18.2 81.81978 77.2 18.4 58.8 100 23.8 76.21979 97.2 20,7 76.5 100 21.3 78.71980 110.3 27.6 82.7 100 25.0 75.01981 133.9 38.0 95.9 100 28e4 71.61982 b/ 144.4 47.7 96.7 100 33.0 67.0
a! Includes Monetary Authority and commercial banks.
b/ June 30.
Source: Central Bank.
53. Agriculture and trade are the principal borrowing sectors from thecommercial banks. Agriculture was the largest recipient sector until 1979, sincethen, trade, stimulated by the growing trade with Mexico, has taken the lead with

- 20 -
about one-third of the total loans and advances from the commercial banks.Manufacturing and construction, each account for more than 10% of lending, whilepersonal loans account for almost 10% of the total.
540 Interest rates on loans and deposits have been steadily increasing since1980. Given the openness of the economy and the fact that the domiestic inflationseems to move in line with the international one, domestic interest rates reflectthe conditions prevailing in the international financial market. Therefore, it isexpected that domestic interest rates will decrease following the current trendsobserved in the international market.
Table 17, Commercial Banks - Weighted Average Interest
(%)End of Period Loans & Advances Deposits
1976 11.5 4.71977 11.3 4.31978 11.3 4.41979 11.6 4.41980 16.5 7.81981 19.5 9.91982 (June) 19,3 10.2
Source: Central Bank.

- 21 -
III. POLICIES ON PRICES, IMPORT LICENSES AND INCENTIVES
Introduction
55. The economy of Belize is principally in the hands of the private sectorbut the Government plays a very active role. This role is exercised through theprovision of public services and infrastructure (general administration, roads,electricity, port facilities, etc.); through some involvement in productiveactivities (mainly bananas); and through economic policies. In this chapterpolicies that appear to have some impact on resource allocation and, therefore, oneconomic development are analyzed. Those policies are:
(a) import tariffs;(b) price controls;(c) import licences;(d) import duty exemptions; and(e) development incentives.
Import Tariffs
56. Belize adopted the CARICOM Common external tariff (CET) in 1976. Themain characteristics of these tariffs is that import duties increase according tothe degree of processing of the commodities. This implies a reduction in theterms of trade of agriculture relative to other activities and thus adiscrimination against agriculture. However, the agricultural industry benefitsfrom exemptions on the importation of its capital equipment. Nevertheless, theauthorities may wish to examine the impact of the CET in the Belize economy andpossibly propose changes to CARICOM.
Price Controls
57. Price controls have been imposed on some imported and locally producedcommodities since 1963. On imported commodities, they work mostly throughcontrols on mark-ups, at both wholesale and retail levels; on locally producedcommodities, they consist of maximum prices. A wide range of products are subjectto price controls including groceries, hardware, drugs, bread, beer, and corn.
58. Maximum mark-ups on imports vary according to the type of commodity.Basic commodities, such as groceries, are allowed low mark-ups: between 5 and 15%over landed costs are allowed to the importer, plus 10 to 25% added by theretailer. Motor spares, on the other hand, are allowed the highest mark-ups: 25to 45% over landed costs plus 20 to 25% added by the retailer. In several cases,maximum mark-ups have been recently increased.
59. Local producers need Government's authorization to increase prices ofdomestic goods subject to price controls, They must request theincrease--accompanied by a cost justification--to the Ministry of Tr'ade andIndustry. Final decisions on prices, however, are taken by Cabinet. Therefore,this authorization can be a lengthy process involving extensive efforts fromMinistries, government officers and private sector managers.

- 22 -
60. Price controls on imported commodities operate more flexibly than onlocally produced commodities because mark-ups are automatically applied overlanded costs while increases in prices of domestic goods need previousauthorization. This results in an incentive for imports as opposed to localproduction. The following example may be illustrative: the price level, asmeasured by the implicit price deflator of national accounts,4! more than doubledbetween 1972 and 1981, but only for conch fish and beer were authorized pricesincreased accordingly; for other local products, the increases ranged between 40and 60%.
61. Various purposes appear to be associated with price controls. Forexample, locally produced beer is subject to price control while imported beer isfree of controls. The reverse situation applies to milk where there is a mark-uplimit on imported milk while local milk is free of control. Thus the purpose ofthese controls is sometimes not entirely clear. Moreover, the final result ofprice controls on incentives and resource allocation varies from product toproduct because price controls coexist with import licenses and tax exemptionswhich, sometimes, serve to neutralize the impact of price controls.
62. Price control on some items are imposed by the Government to keep downthe cost of living. However, its enforcement of price controls is diff3.cul.t and,sometimes, even impossible. Full enforcement--if possible--of the regulationswould require the establishment of a very costly organization (prcsently there areonly four inspectors to cover the whole country). Moreover, price controls can beavoided without necessarily violating the law. For example, many restaurants sellsoft drinks by the glass rather than by the bottle because the regulations referto bottles, not to glasses. Some places do not sell local beer because its priceis controlled while prices of imported beer are not. The price of bread isestablished on a per weight basis without any specification on quality, and thisthen becomes the adjusting factor. On the import side small allowable mark-upscombined with low--or nonexistent--import duties encourage overinvoicing.
63. The preceding suggests that the price control system should be relaxed.This would be a continuation of some measures already taken by the Government suchas the elimination of price controls on certain cuts of meats. Additional stepscould be taken by eliminating price controls in hotels, restaurants and othertourist establishments where the Belizean consumer protection argument is notparticularly relevant, and where controls on local products lead to increasedimports of uncontrolled foreign substitutes.
The Marketing Board and Price Policy
64. The Belize Marketing Board (BMB) is a statutory body that operates ricemills and buys and sells local products such as rice, corn, and red kidney beans.Presently, BMB imports only milk.
4/ No official price indices are available in Belize.

- 23 -
65. The BMB has been used as a tool to stimulate the production of rice,corn and red kidney beans. Although, purchase prices paid by the BMB have.generally been in line with international prices this has not been the case withcorn prices in which subsidies to producers have been granted. In 1982, wheninternational corn prices were falling rapidly, the BMB bought 4.0 million poundsof corn at US 12 cents per pound and sold them at US 7.5 cents per pound.
66. In general the BMB has been selling products with little or no mark-up.As a result, its financial situation has been poor in recent years and deteri-orated substantially in 1982 with the losses in corn. The cost/sales ratiosindicate that practically all goods produced profits in some years and losses inothers; although operations with corn and milled rice have consistently producedlarge losses. In addition, management and administrative problems have worsenedthe BMB's financial situation.
67, If well managed, the B3MB can play an active role in storage and milling,for which it has the necessary plant. The B3MB can also promote development bygiving advice on market conditions to small and medium-size farmers, placing lessemphasis on commercial operations as they are a serious burden on the Government'sfinances.
Import Licensing
68. The Import License System was established in 1974. Presently, importlicenses are required for 75 commodities, of which 42 are food products. Importsunder license amounted to US$28 million in 1981 or about 18% of total imports.
69. It appears that import licenses are used for different and sometimescontradictory purposes. It is claimed that the license system is used to easebalance of payments constraints, but this is in some cases neutralized by thesubstantial number of duty exemptions granted for imports, both those requiring aswell as those not requiring licenses. The licensing system is also claimed to beused to protect the local producer but, again, this is in some case neutralized byduty exemptions and by price controls aimed at protecting local consumers.
70. The processing for approval of import licenses is being tightened.Until April of 1982, the process of granting import licenses was rather simple;decisions being taken at the technical level. Government officials claim thatthis process was relatively smooth and fast. Since that time however, approvalhas had to be granted by the Ministers of Trade and Finance. Although temporary

- 24 -
difficulties on the balance of payments are the justification of this action,experience shows that once such restrictions have been established1 they have atendency to become permanent.
Import Duty Exemptions
71. As mentioned before, exemptions on import duties are substantial.Imports amounting to US$60 million, or 50% of the total, were exempted in 1981.Of this total, US$10 million were for goods requiring import licenses, They aregranted for investment and consumption products; they are granted to promoteindustries or to benefit individuals; exemptions are granted for the full amountof the duty or for part of it. Estimates of government revenues foregone byimport duty exemptions amounted to US$10 million in 1981, or 25% of total currentrevenues, It should be noted, however, that some imports probably might not takenplace if they had not been duty exempted. The following table shows the nominaland actually paid duties on some selected imports.
Table 18. Average Import Duties for Selected Commodities, 1981
(%)
Name Nominal Actually Paid
Furniture made of wood, metalor any other material 45 14
Cement 25 18Pimento 30 21Wood Articles 45 10 to 29Sugar Confectionery 42 26Barbed Wire 25 13Nails 15 9Staples 15 9Mattresses 45 23Bread & Bakery Products 30 11Jeans 45 11Shirts 45 25 to 41
Source: Mission estimates.
72. Therefore, in view of the present balance of payments and financialdifficulties, it appears appropriate to reduce exemptions significantly. It wouldalso be desirable to establish a clear policy on when and how to grant exemptionsso as to minimize administrative costs and to simplify the decision makingprocess.
Development Incentives
73. The Government promotes certain industries by granting developmentincentives. These incentives consist primarily of exemptions from income tax andfrom import duties on capital goods and occasionally on raw materials. Tax

- 25 -
exemptions are granted for a maximum of 15 years depending on the ratio of valueadded to the amount of sales. There are cases where the local producer enjoysprotection, or even a monopoly, in the domestic market as an implicit element ofthe development incentive. This protection is provided through the application ofthe import licence system.
74. No evaluation has been made of the development incentives alr-<dygranted. The beneficiaries have been 27 enterprises in very different fields ofactivities including hotels, garments, soap powder, fishing, bananas, flour, andfertilizer, some of which generate little value added or employment. Considera-tion should be given to the fact that in some import-substituting industries, theprotection enjoyed by the local producer may have resulted in prices above theinternational level.
75. A thorough review of the policy of development incentives should be con-ducted. Clear objectives and rules should be established in relation to:
(a) the type of activities to be promoted. In general, the small sizeof the domestic market makes it difficult for import-substitutingindustries to be competitive. Therefore, priority should begiven to export-oriented activities based on the use of local rawproducts (agriculture, livestock, fishing and forestry);
(b) the type of benefit. Presently, the legislation provides only ageneral framework on tax concessions to be applied at the discretionof the authorities. For example, for similar companies the lengthof tax holiday may be different, or the import duty exemptions caninclude all imports in one case or only machinery and equipment inthe other; and
(c) the renewal of concessions. As a general rule, if the industry isalready viable it does not need a renewal of the concession and ifit is not viable after enjoying many years of concession, thenserious questions can be voiced concerning its continued existence.Nevertheless, in recent months there have been concession renewalsof viable industries, granted under the implicit threat of closingand creating unemployment if renewal had not been made.
Conclusions
76. After analyzing price control, licensing and incentive policies, it isvery difficult to draw definitive conclusions regarding their impact on theeconomy as they are not always applied in a consistent manner. The evidence isthat, overall, these policies have not had'much impact on resource allocation.Moreover, there are no shortage of consumption of goods. Nevertheless, thesepolicies create administrative costs and, in some cases, raise unnecessary concernamong potential investors. It is recommended that measures be implemented in acoordinated fashion, aimed at:
- 26 -
(a) relaxing price controls and maintaining them only in cases ofmonopolies;
(b) minimizing the commercial operations of the Belize Marketing Board;(c) relaxing import restrictions in a manner consistent with balance of
of payment sustainability;(d) minimizing import duty exemptions; and(e) given priority in future development incentives to export-oriented
activities based on the use of local products.

- 27 -
IV. MAJOR SECTORALI ISSUES
A. Agriculture
Land Tenure and Taxation
76. Of the total land area of 5.7 million acres, about 2.2 million acres areclassified as suitable for agriculture and about 3.0 million acres for forestry(mahogany, cedar, rosewood and other commercial timbers). It is estimated thatless than 15% of the land suitable for agriculture is being farmed.
78. Land tenure policies are sound. This conclusion is based on two mainfactors. First, the Government owns more than one million acres of land suitablefor agriculture which are available for development by farmers or businessmen,local or foreigner, at relatively low prices. The main condition which has to besatisfied in order to obtain title to land provided by the Government is theimplementation of a development plan agreed to with the authorities when the landis acquired. Second, a new land tax is being implemented; it will tax theunimproved value of privately owned agricultural land. This tax is expected toencourage land development by making it too expensive to hold undeveloped land.Its success, however, will depend on several factors such as: (a) the level ofthe rates to be imposed by the Minister of Natural Resources (they should not beso low as to nullify their impact or so high that it will not be possible tocollect); (b) the fairness of the land valuation which will be revised every threeyears according to the new law; and (c) the power and strength of theadministrative machinery that will enforce the new tax.
79. Efforts to solve land tenure problems started in the 1960s. In fact, aland reform program had been introduced at that time to change the land tenurepattern which had been heavily influenced by the early alienation of land in largeblocks at high prices. Only wealthy persons could afford to buy land so thatneither local small farmers nor prospective immigrants could take up farming ontheir own account. As an illustration, a United Nations mission found in 1963that over two million acres of land were owned by 102 persons, some them absenteelandlords. This was certainly a contributing factor to the poor utilization ofland.
80. Under the land reform program, the Gov aent is allowed to acquire landfrom owners and to subsequently sell it to farmers already settled under previoustenancy arrangements. This land reform was complemented by a Rural LandUtilization Tax, introduced in 1966 to stop large-scale land speculation and toencourage land settlement, The tax was designed to induce owners either tocultivate their land or sell it at the current market price. While steadyprogress has been made in the land reform program, the impact of the Rural LandUtilization Tax seems to have been minor mainly because of low taxation andcollections. As mentioned before, this land tax has been replaced in 1983 by atax on unimproved values.
The Sugar Industry
81. The sugar industry has been the largest contributor to the Btelizeaneconomy since the 1960s, providing about 20% of GDP and 60% of domestic exports.There are two sugar factories and about 60,000 acres under sugarcane cultivation,

- 28 -
located in the north of the country. The factories are owned and operated byBelize Sugar Industries Ltd (BSI), a subsidiary of Tate & Lyle of England. The
sugar plantations belong to more than 4,000 farmers. BSI sold most of its land to
selected farmers in 1972, retaining only 1,000 acres for cane research.
82. An expansion in 1978 brought the total capacity of the factories to
115,000 long tons of sugar. Production has been well below this capacity, withthe exception of 1977-78.
Table 19. Sugar: Production and Acreage Harvested
"Co"er Sugar Molasses Cane AcreageProduction Production Delivered Harvested
________ '000 Tons '000 Tons '000 Tons '000 Acres
1975/76 61.7 19.7 607.0 53.0
1976/77 91.1 29.6 935.6 56.0
1977/78 113.5 39.9 1,123.1 59.01978/79 98.6 33.0 989.3 61.0
1979/80 103.3 32.3 1,013.5 61.0
1980/81 97.7 32.0 970.1 61,0
1981/82 106.0 37.7 1,095.5 n.a.
83. Belize has a secure market for about 117,000 tons of sugar, somewhat
more than its current plant capacity, made up as follows: (a) local demand, 9,000
tons; (b) under the agreement between the ACP (Asian-Caribbean-Pacific) countries
and the European Economic Community (EEC), 41,000 tons; (c) to the USA under GSPstatus, 30,000 tons; and (d) to the free market, 37,000 tons. Under the EEC
agreement, Belizean sugar traditionally goes to the United Kingdom at prices
periodically negotiated between the ACP countries and the EEC under the LomeConventions. These prices provide some security to the industry, especially in
years of low world prices. After filling the EEC quota 5/ and the USA GSP quota
the country sells the remaining sugar in the world market.
84. Incomes of farmers and BSI are tied directly to the price. The farmers
get 65% of the net value of the sugar sold; BSI 35%. Net value is approximately
equal to the amount of sales of all sugar and molasses minus freight, insurance,
brokerage and other selling expenses. Payments to each farmer are adjusted
according to the sugar content of cane supplied.
85. Employment provided by the sugar sector is quite important. There are
more than 4,000 farmers, of which 45% have less than 6 acres. The two factories
employ about 1,100 people. During the crop season about 5,000 workers are
required for cropping, some of them braceros from Mexico.
5/ Otherwise Belize would risk having its quota lowered in future years.

- 29 -
86. The declining trend in production during recent years can be attributedto smut disease, inadequate husbandry and froghopper infestation. Farmers havetaken appropriate action; they have replaced a great deal of diseased cane andhave also improved cultural practices. However, there are still 10,000 acres tobe replanted with smut resistant varieties. It should be noted that smutresistant varieties have, in the initial stages, lower yields (sugar content) thanthe varieties they replace.
87. Research and extension programs on sugarcane seem to be adequate. Theyare carried out by the Cane Farmers Association (CFA), BSI and the Belize SugarBoard (BSB). While the CFA and the BSB provide extension services through fourofficers, BSI researches variety selection, plant protection, variety testingagainst smut and rust, froghopper prevention and the issue of intensive versusextensive cultivation of sugarcane. In cooperation with the University of PuertoRico, BSI[ is also preparing a manual on endemic sugarcane diseases in Belize,
88. Additional measures could increase productivity. Better coordinationamong the growers and the factories could minimize delays in transport anddelivery thereby maximizing the sugar content of the cane. In order to encouragefarmers to obtain higher sugar content, it may be advisable to introduce changesin the payments system, if administratively feasible. At present, farmers arepaid according to the average sugar content of the cane delivered by the branch ofthe Sugar Growers Association they belong to, not according to individualperformance.
89. The industry is considering an expansion in the plant capacity of 5,000to 6,000 tons of sugar. This expansion would take place in both factories; butits financing has not as yet been arranged. If this expansion is implemented theplant capacity would be 120,000 tons of sugar. Any further expansion beyond thislevel should be carefully studied, because it would: (a) require a new costlyfactory, an investment unlikely to be carried ou: by the private sector alone; (b)deepen Belize's economic dependence on an activity subject to sharp fluctuations;(c) raise production levels above existing, protectLed markets; (d) require newport facilities; and (e) add to the significant overcapacity that exists in theCaribbean region.
Citrus
90. The citrus industry in Belize is based mainly on the production oforange and grapefruit concentrates. It ranks second in importance to the sugarindustry as an agricultural export earner, accounting for about 10% of domesticexports. Most of the estimated 360 growers are located in the Stann Creek Valleynear the two processing companies; a few are located in the Cayo District, Theindustry employs about 700-1,000 seasonal workers each year.
91, One processor, the locally-owned Citrus Company of Belize, operates anold plant built in 1950. The other, Belize Food Products, operates a plant builtin 1963; it was recently bought by a foreign company from another foreigncompany. The total capacity of the two plants is sufficient to handle currentproduction. However, if the industry is expanded, the old plant which isoperating at 50% of installed capacity, would need to be modernized, and thestorage capacity of the other plant would need to be increased.

- 30 -
£2. The total citrus area is 9,000 acres; about 6,500 acres are planted with
orange and 2,500 acres with grapefruit. Processors own about 46% of the totalarea and produce 52% of the total crop. AnnaelJ citrus production has increasedsubstantially during the last five years, from about 900,000 boxes in 1976-77 (80lb. per box of oranges; 90 lb. per box of grapefruit) to over 1,700,000 boxes in1981 /82. Average yields fluctuate between 175 and 250 boxes per acre, but yieldsof about 350 boxes per acre can be obtained under good management.
93. The citrus industry faces some market constraints. Belizean exports ofconcentrates enjoy protection in CARICOM and the EEC but prospects outside thesemarkets are uncertain. In addition, market prospects for grapefruit are notfavorable; therefore oranges should gradually replace grapefruit, which currentlyrepresents about 40% of the total citrus production. A major problem facing theindustry is that grapefruit production is concentrated in small farms with olderfarmers. Phasing out of grapefruit will thus entail a certain amount ofdisruption in the industry.
94. Disputes between processors and growers over revenue-sharingarrangements have delayed the harvest on several occasions. The problem has itsorigin in the fact that the industry was established by the estates withoutgrowers being encouraged on a marginal basis. While the output of individualfarmers was small they had to accept whatever payment the industry was willing togive them. Now that their production is close to one half of the total, thefarmers want a larger share of the profit made by the citrus industry. Theprocessors for their part feel that a larger share to the growers would cause theplant, on occasion, to be run at a loss and thus be subsidized by their growingoperation. A sound, permanent arrangement should be achieved if the industry isto establish a reputation as a regular and reliable exporter. The Government isusing its leverage to help the citrus industry to settle this issue.
95. The small scale of the industry raises problems of timely shipping toexport markets. Citrus is barged in containers from Dangriga to Belize Cityharbor where they are transhipped. The recently constructed wharf at CommerceBight (near Dangriga) cannot at present handle barges and citrus traffic continuesto be handled at primitive facilities. Resolution of this problem will be studiedas a part of the master plan on export transportation.
96. A study made by the Commonwealth Development Corporation (CDC) in 1979concluded that it would be economically sound to rehabilitate and expand thecitrus industry. Consequently, CDC granted a loan of US$3.2 million torehabilitate the citrus industry. However, the expansion of the industry willrequire sizeable amounts of additional investment,
Bananas
97. Banana production has a long history in Belize. It started in the late1800s with exports to USA and prospered until the Panama disease stoppedproduction almost completely in the 1930s. The banana industry was rehabilitatedwith British aid in the early 1960s. Unfortunately, it has suffered a series ofmajor setbacks in the 1970s as hurricanes caused severe demage in 1975 and 1978.

- 31 -
98, The Banana Control Board (BOB), a government statutory body, runs theindustry in Belize. The BCB centralizes all the exports and has undertaken theexploitation of practically all the 1500 acres now under plantation. Because ofvery low productivity in small farmers? plantations primarily at Cowpen, the BCB,in 1981, took over their leases. The farmers then became employees of the BOB andare receiving training to manage plantations efficiently. Subsequently, the BOBwill sell banana lots back to those farmers who have demonstrated sound managementability during their training period. At the same time, private investment inbananas are still undertaken by medium-size farmers, and two large plantations,one foreign-owned, have been recently established. These investments are mostlyin their preparatory stage but look promising. Considerable expansion is nowunderway at Bladen-Trio utilizing a loan from CDB.
99, Belize enjoys a protected market in the UK. Exports are made throughFyffes, a subsidiary of United Fruit, which also provides technical assistance toBOB through its local company, Riverside Services Inc.
100. The key issue for the industry is to expand rapidly to 4,000 acres, theminimum estimated size needed for it to be economically and financially viable.There is a case for supporting the industry on the grounds of:
(a) the available, protected export market;(b) ~the existing basic infrastructure, albeit needilng improvement and
expansion;(c) the employment generation which, on 4,000 acres, would be about 700
permanent workers;(d) the availability of land suitable for expanding banana cultivation;
and(e) the existing pool of local knowledge and expertise built up in
recent years that provides a foundation for a rehabilitation andexpansion program.
101. New private investment in the industry largely depends on theGovenment's possibilities of improving economic and social infrastructure in thebanana area. Steps need to be taken to:
(a) provide social facilities for workers in the area (housing,schools, health centers) otherwise there may be manpower shortages;
(b) improve road and port facilities; and(c) make agricultural credit available to independent farmers.
102. Shipments are costly and uncertain because of the small quantities. Ifthe industry were to expand to supply about 50,000 boxes per week in a regularbasis, transportation costs could be greatly reduced and, according to presentarrangements, there would be a premium in the price paid by Fyffes. Exportspresently go through Puerto Cortez, Honduras, a costly and time consumingarrangement. Higher volume and improved port facilities could make directshipment to the UK a definite possibility. Finally, expansion of cultivation to4,000 acres, or 50,000 boxes per week, the breakeven point for the industry, wouldmake the banana industry viable, eliminating the BCB's large operational deficits,and reducing the strain on Central Government's finances,

- 32 -
B. FISHERIES
103. Fishing represents about 8% of f. 2 domestic exports of Belize. Itprovides good income and a comparatively high standard of living to the fishingcommunities. The industry is controlled by five cooperatives, although there arealso some independent fishermen working mostly part-time. The main products arelobster, conch, shrimp and fish.
104. Domestic prices of fish are fixed by the Government at about 20 to 40%of the international prices. Fishermen are obliged to sell to the local market apercentage of the total production which varies according to the type of fish; forinstance, 5% of the lobster catch and 10% of the conch.
105. Laws and regulations to protect the activity appear to be adequate.Special emphasis is given to the protection of lobster from overfishing by banningthe catch of small ones. However, there are significant indications ofoverfishing as inshore fishing has apparently reached its peak production. Arelated issue is the high level of illegal fish exports resulting from theregulations against overfishing and, to some extent, from controls on domesticprices. The key element to prevent overfishing and illegal exports seems to bethe enforcement of existing regulations. The Fisheries Unit needs to be properi.*staffed and equipped to carry out this task utilizing whatever assistance mightpotentially be forthcoming from the Belize Defense Force, Moreover, a significantamount of fishing, particularly at the southern end of the reef, by non-Belizeansappears to be taking place. Local enforcement capacity against this type ofactivity is inadequate.
106. The sector can be developed further by introducing deepsea and farmfishing. Preliminary studies indicate that there are large supplies ofunexploited fish outside the barrier reef. Belize's coast, on the other hand,appears to be suitable for farm fishing, and a private firm is alreadyestablishing a fish farm (shrimp) in the Toledo District. Both undertakingsrequire large in-estments, somewhat sophihAcated technology, and experiencedmanagement.
C. TOURISM
107. Belize's full potential for tourism is yet to be developed. Althoughthe sector has been growing relatively rapidly, most of the natural and historicalattraction of the country remain basically uneapped. They are:
(a) the Cayes and the coral reef;(b) the Mayan ruins; and(c) the fauna, flora and picturesque limestone scenery.
The Cayes and the coral reef are a distinctive, unspoiled attraction. Anembryonic tourist industry has existed there for sometime, particularly inAmbergris Caye, a white sandy island in the north of Belize. Some 175 islands andcayes and 174 miles of reef, the largest in the western hemisphere, provide many

- 33 -
locations for sea-excursions, scuba diving, snorkeling and fishing. The BlueHole, a volcano that collapsed into the sea and contains a wide variety of faunaand flora, is also a potential attraction. Belize contains over 100 Mayan sitesbut only two have been excavated and access to them is very difficult, especiallyduring the rainy season. The mountains of inland Belize, its lofty waterfalls andmore than 500 species of tropical birds also offer significant opportunities fortrips into the country. Hunting is another attractive activity offered by thecountry.
108. The Government's overall policy towards tourism was formulated in 1979.Although most of the investment efforts are expected to come from the privatesector, local and foreign, it is essential that the Government state very clearlywhat sort and size of tourism is wanted. That there are concerns, evenapprehension, at the prospect of high-volume tourism which in a country with apopulation as small as Belize are certainly understandable. However, tourism cancontinue to develop somewhat along its present lines, concentrating mainly onmiddle-age, middle-income tourists and on outdoor activities such as scuba diving,snorkeling, sea excursions, fishing, hunting and visits to Mayan ruins and forestsites, thereby minimizing any negative social impact. An additional advantage of
.this type of tourism is the fact that it does not exclude the local population; onthe contrary it facilitates contacts between local people and foreign visitors.
109. The authorities and the private sector have envisaged a market strategyfor tourism. It calls for industry-wide cooperation: local hoteliers, touristoperators, regional airlines and Government of Belize. Two main and distinctmarkets can be identified: USA and Canada, on one hand, and Europe and Mexico, onthe other. At present, Belize shares a very small part of the US/Canada touristmarket to the Caribbean; only 0.4%, One sound way to enlarge this market would beto extend the peak season from its current January/March period through June.
110, By the same token, tourism from Mexico and Europe can be increased.Since preferred times for Mexicans and European travellers is the August-Octoberperiod, this would complement the US/Canada market whiich falls-off at that time.Mexicans are travelling to Central America in increasing numbers, about 50,000 peryear, and Belize is part of the Mayan experience that many of them are attractedto. In this regard, road entry to Belize may be emphasized until regular airservices between Mexico and Belize are established. In relation to tourists fromEurope, it must be taken into account that Cancun, Mexico, is a ajor resortdestination for Europeans travelling to the Americas. Since the length of stayfor Europeans is longer than that of USA/Canada visitors to the region, this mightallow for a siphoning off of some European traffic to include Belize as an elementin the Mayan experience.
111. The Belize Tourist Board needs to be strengthened if it is to play anactiv,e role in tourist development. Presently, it mainly administers hotel taxesand enforces regulations on the hotel industry. Staffed with only half a dozenpeople, the Tourist Board is unable to carry out a comprehensive promotion programor to coordinate properly the isolated promotional efforts of the private sector.A strengthened Tourist Board would also be able to provide statistical informationand to look into and control the tourist-related services such as hotels,transportation and food.

- 34 -
112. The underutilization of hotels in tourist areas and the few visitors tothe Mayan sites illustrate the potential for increasing tourism. Occupancy ratesreached 35% in 1981 and 1982; many hotels are reportedly operating at breakevenpoint or below. The low number of foreign visitors to Xunantunich and Altun Ha,the two open Mayan ruins, appears to be related to the poor services offered atthe sites themselves: no restaurants, coffee shops or toilet facilities. Anaggresive promotion could increase hotel occupancy; while more visitors to theMayan ruins would require construction of facilities at the ruin sites. In thisregard, mobilization of private sector initiatives needs to be considered.
Table 20. Visitors to Mayan Sites
Xunantunich Altun Ha TotalYear F N T F N T F N T
1977 751 2,444 3,195 4,024 2,244 6,268 4,775 4,688 9,4631978 974 386 1,360 4,102 322 4,424 5,076 708 5,7841979 1,262 244 1,506 4,117 356 4,473 5,379 600 5,9791980 1,519 512 2,031 3,866 372 4,238 5,385 884 6,2691981 1,281 518 1,799 4,652 436 5,088 5,933 954 6,887
F =ForeignersN = NationalsT = Totals
Source: Belize Tourist Board.
D. POWER
Electricity
113. Electricity supply is unreliable and expensive, lIt is provided by theBelize Electricity Board (BEB), a government-controlled stdtutory body. About 60%of the population has electricity service. Electricity is generated by isolateddiesel sets, which depend on Mexican fuel. Load centers are not interconnected,except for a 13-mile transmission line between Ladyville and Belize City, and theprimary and secondary distribution networks are weak. BEB's estimates that thecapacity of privately-owned generators is as much as the public service capacity(about 13 MW).
114, BEB's management should be improved and strengthened. BEB has madeeither losses or very small operating surpluses in recent years. The financialsituation has worsened particularly during 1982 with operational losses rising tonearly US$1 million. Since rates are already high (US$ cents 17/Kwh) and sinceBEB's service is poor, there is a general reluctance to increase rates. However,achieving the break-even point is a basic requirement for any further expansion inelectric!ty. This should be done by reducing energy losses and other systeminefficiencies --through interconnection-- and by reviewing the rate levels andthe rate structure.

- 35-
115. The country's short-term strategy is to improve reli.ability of supplyand to execute a rural electrification program. This would be achieved byimproving the transmission and distribution system, by adding diesel capacity andby completing a transmission line to enable the country to purchase bulk powerfrom Mexico. Over the long term the country may wish to utilize its renewablenatural resources: hydraulic potential, wood and sugar-cane bagasse. These ofcourse would require proper feasiblity studies.
Oil
116. Belize is largely dependent on imported oil for its energyrequirements. The country imports more than 500,000 barrels of oil per yearamounting to about US$25 million or 15% of total imports.
117. Geological evidence indicates a good possibility that Belize hassignificant deposits of oil and gas both onshore and offshore. Explorationsstarted in 1938; the first license was obtained by Shell who made geologicalsurveys and photogeological studies. The outbreak of World War II in 1939 stoppedexplorations until 1949 when a subsidiary of Gulf was awarded a license thatcovered the entire country and its territorial waters. Six years later, in 1955,Gulf drilled the first well. Since then, 40 wells totalling 250,000 ft have beendrilled in Belize and about 6,000 line miles of seismic surveys have beenconducted by several companies. Presently there are nine companies carrying outoil exploration in the country. Various findings have been reported, but therehave been no reports of discoveries of either oil or gas in commercial quantitiesso far.
118. The laws governing licenses for explorations of oil and gas are regardedas among the most liberal in the world. Exploration licenses are awarded for arenewable 3 to 5 year period. If oil is found, a mining lease would be awardedfor 20 years. The agreements with the oil companies are based on an old"contract-model" that may need to be updated to take into account changes in theworld situation experienced in the last decade. By the same token, control ofexploration appears necessary. UNDP is providing technical assistance in thisarea by financing an expatriate petroleum geologist working at the Ministry ofNatural Resources. The long-run success of this assistance will depend on theability of both the Government and UNDP to build up the local expertise to takecare of these responsibilities in the near future. It appears desirable that theauthorities consider an overall strategy and a contingent plan to deal with thedevelopment problems that finding oil and/or gas in commercial quantities wouldcreate.
E. TRANSPORT
119, Belize's transport network is comprised of:
(a) 1,085 miles of improved road, of which 250 miles are paved; 200miles of unimproved roads and tracks; and 250 miles of urbanstreets;
(b) a semi-deepwater port at Belize City, 17 ft. deep, and severaljetties and piers along the coast for lighterage; and

- 36 -
(c) an international and a domestic airport at Belize City, 11Government airstrips, and 8 private airstrips.
120. A major issue in transport is the high per capita cost ofinfrastructure, a direct result of the low population density. This is aggravatedby the long distances between widely scattered, sparsely populated regions whichalso makes distribution costs very high.
121. Maintenance and rehabilitation of roads should be given priority.Although the road network linking Belize's main towns is well established,inadequate road maintenance, combined with problems such as frequent flooding andinadequate drainage has led to the generally unsatisfactory condition of thenetwork.
122, Expenditures on road maintenance are insufficient; This somewhatreflects a diversion of funds since road user charges are generally adequate.Between 1977 and 1980/81 an average of US$8.8 million a year was spent on roads,70% on new construction and improvement and 30% on maintenance. Expenditures onmaintenance (excluding equipment costs) declined sharply in 1982/83 reflectingincreasing budgetary constraints. Present levels of expenditure, aboutUS$1,600/mile, are sufficient for routine maintenance, but do not cover periodicmaintenance, such as resealing and regravelling.
123. Road user charges are generally adequate although the distribution ofcharges by class of vehicle may need to be revised. The retail price of gasolineis US$1.63/gallon, and of diesel fuel, US$1.45/gallon. The tax component on thesefuels is US$0.43 for gasoline and US$0.31/gallon for diesel fuel, Based on fuelconsumption estimates, revenues from fuel taxes were in the order of US$4 millionin 1981. Receipts from import duties on motor vehicles in 1980, totalled US$4.3million and from license and registration fees, US$0.5 million. Together,receipts from these taxes covered all recurrent expenditures and about 70% ofcapital expenditures in 1980/81.
124. The road transport industry is not regulated in Belize, The law permitsthe Government to regulate vehicle weights and dimensions but specific limits havenot been adopted. While overloading of trucks at the Belize City port--headingfor Mexico--and in the sugarcane area is reported to be a problem, the extent ofoverloading is not known, nor has the impact of imposing strict regulations onvehicle utilization been estimated. Consequently, the Government will consider aprogram to determine, first, the extent of overloading; second, the economicdesirability of controlling axle weights and dimensions; and, finally, ifeconomically desirable, the appropriate limits on axle weights and dimensions andthe characteristics of an enforcement policy.
125, One of th'e Government's highest priorities is the improvement of theinfrastructure for maritime transport of imports (mainly containerized) andagricultural exports (mainly sugar, bananas, citrus and frozen juiceconcentrate), The Belize City Port handles all maritime imports but very littleexport, only 4% of the total. Sugar, the most important export, is loaded ontoships moored in deep water in the Belize Harbor, Bananas are barged from Big

- 37 -
Creek in the south to Puerto Cortez, Honduras, Citrus is barged in containersfrom Dangriga to the Belize Harbor where it is transshipped. Container traffic,which represents more than 50% of the total cargo is handled at the port rollon-roil off berth. About 30 to 40% of all the containerized cargo is destined forneighboring countries: Mexico and, to a lesser extent, Guatemala.
126. A study to determine the most efficient means of transporting exportswill be undertaken. This study will include a selection of at least one of thefollowing proposals:
()deepening of the Belize City Port from 17 to 32 ft to accommodatebulk sugar vessels and large ocean-going ships, at an estimatedcost of US$15 - 25 million;
()construction of a new deepwater port somewhere to the south ofBelize City. This solution would require less dredging thanproposal (a) but would probably require construction of a coastalroad to link it to Belize City;
()construction of a sugar handling facility in a deepwater islandsuch as Robinson Point, about 6 miles south of Belize City andabout 1 mile off the coast, at an estimated cost of US$12 - 15million;
d)improvement of the banana loading facilities at Big Creek toaccommodate ocean-going banana freighters and to provide forlighterage of fresh fruit, timber and rice from this region; at theestimated cost of US$2 - 3 million; and
(e) development of roll on-roll off barge facilities in places such asRiversdale and/or Dangriga for the transport of containerizedbananas and juice concentrate to ocean-going vessels moored inBelize City harbor, as an alternative to (d).
F. SOCIAL INFRASTRUCTURE
Education
127, Educational standards in Belize are relatively high; 85-90% of allchildren complete 8 years of primary education, mainly through the "Church-Statepartnership System". Of the 209 primary schools, 187 are denominational, Inthese schools, the State pays all salaries; other recurrent and capital costs areshared equally by the State and by the Church, Total enrollment in 1981 was35,000, increasing at a rate of about 2.5% a year. There are in addition 15private primary schools with an enrollment of 1,000 children. The Rural Educationand Agriculture Program (REAP) has now spread to 23 primary schools, and aims tochange attitudes towards agriculture to develop relevant skills at an early age.This program has been successful and should be expanded.
128. Secondary education is largely located in Belize City, a situation thatwill change when the rural secondary schools project is completed in 1983. Totalsecondary enrollment is 6,600, of which 600 are at Belize Technical College (Sixth

- 38 -
Form, Secretarial and Trades) and a further 4,000 in Belize City. Beyond thesecondary level, there is only the Belize College of Arts, Science and Technology(BELCAST) with 58 students, and Belize Teachers' College with 170 students. Asmall expansion of BELCAST into other areas such as accounting, is to beencouraged. For university education, Belizeans attend mostly to the Universityof the West Indies, and also to USA and UK universities.
129. Educational policies are generally sound, but it will take time to adaptthe academically oriented colonial system to a curriculum more suited to Belize'spresent needs. The authorities are making efforts in the right direction; forexample, a manpower survey is being conducted in conjunction with UNDP to identifycurrent employment patterns and employers' requirements for various skills in thefuture.
Health
130. Belize has a relatively comprehensive health network. There are 9hospitals comprising 544 beds and 20 health centers. Over 20 doctors are inprivate practice. The public service employs 35 doctors, of which 12 areBelizean. A major project identified for the sector is a new hospital for BelizeCity, The French Government has been approached to fund this project and a newdesign study is being evaluated.
131. Improvements of regional health centers have been carried out; there areother projects in this area either underway or planned. However, staffing remainsa critical problem because of severe losses of trained doctors, and high attritionrates (over 50%) in the nurses' school.
Social Security
132. Like several countries in the Commonwealth Caribbean, Belize recentlyintroduced a new Social Security Scheme, designed and implemented with assistancefrom the International Labor Organization (ILO). The scheme began operating onJune 1st 1981, and partly as the result of an intensive publicity campaign, madean excellent start. The actuarial study of the scheme estimated a maximumpotential coverage of 28,500 persons (at peak employment); by June 1st, 22,000persons had been registered. There are three types of benefits:
(a) Long term - pensions;(b) Short term - maternity, sickness, etc.; and(c) Injury benefits - pensions.
Separate actuarial calculations were made for the three branches and individualaccounts are maintained. Contributions are 7% (6% employer, 1% employee) onearnings up to a maximum of US$3,250 per annum. The scheme is designed to reach'equilibrium' after 15 years. Major surpluses are expected in the early years,although because of the earnings ceiling, these will be lower than in some otherCaribbean countries. A surplus of US$1.1 million was obtained in FY1981/82.

- 39 -
133. The Social Security Scheme is sensibly designed, well managed, and hasgood accounting services. The smoothness and efficiency with which the scheme hasbeen introduced is a major achievement. Therefore, the major issue for comningyears is the wise investment of surplus to ensure future payments of benefits.
Telecommunications
134. The telephone system is operated by two separate entities. Belize Tele-communications Authority (BTA) operates the national telephone system; Cable andWireless Ltd., a British company, the international one under a contract extendeduntil 1988, Until recently, the system was not operating in satisfactoryfashion; for example, communications between Belmopan and Belize City were verypoor.
135. Telephone communications have improved in recent years. In early 1979,BTA began a major expansion program to double the number of lines from 4,050 to8,100 by installing 9 new exchanges. The number of connections increased from3,400 in 1981 to 5,000 in 1982, and is projected to increase annually by 1,000 forseveral years. The system is designed for easy and cost-effective expansion ofexchanges. This expansion has been facilitated by a good financial performance ofBTA in recent years.
136. The only broadcasting facilities are those of Radio Belize. Trans-mission and reception have been greatly improved. About 25% of all programs arein Spanish. No public television service exists, but BTA has issued permits forreceiving satellite transmissions. Since some operators are rebroadcasting pro-grams to individual receivers, the Government is considering legislation toregulate these activities.

- 40 -
V. PUBLIC SECTOR INVESTMENT PROGRAM
137. The public sector investment program has played an important role inBelize, and has been a major determinant of the level of economic activity.Public investments are executed by the Central Government and by the statutorybodies. Development loans--or equity--to private companies are provided by theDevelopment Finance Corporation (DFC), a government-owned corporation. DFC'soperations are not, strictly speaking, part of the public sector investmentprogram but because of their importance in the economy, they are assessed in thischapter. Detailed information on ongoing and new projects are shown in Annex A.This chapter is a summary of the main findings and issues concerning projectexecution.
138. Execution of the public sector investment program has been generallysatisfactory. First, the level of public investment, around 15% of GDP, shows theGovernment's commitment to execute needed projects; however, any substantialincrease above this level would probably exceed the absorptive capacity of thepublic sector. Second, public investments have been generally well allocatedamong productive, infrastructure, and social programs. Third, priorities havebeen, overall, well established.
139. Publi' investment reached about Bz$50 million in both FY 1981/82 and FY1982/83. Investments by sector are shown in the following table.
PUBLIC INVESTMENT BY SECTOR
PreliminaryFY 1981/82 1/ FY 1982/83Bz$M % Bz$M %
Agriculture 10.4 20.5 11.2 22.7Indus try 1.6 3.2 1.2 2.4Tourism - - 0.9 1.8Transportation 13,4 26.5 5.9 12.0Power 8.5 16.8 13.6 27.6Water and Sewerage 0.4 0.8 3,4 6.9Education 2.5 4.9 3.9 7.9Health 1.7 3.4 1.9 3.9Comunications 7,7 15,2 3.8 7.7Others 4.4 8.7 3.5 7,1Total 50.6 100.0 49.3 100.0
Source: Mission estimates.1/ Fiscal year from April to March.
The main projects under execution during FY 1981/82 and FY 1982/83 were:
(a) Agriculture: (i) Banana rehabilitation, consisting of irrigation equipmentand expansion of acreage under BCB's cultivation.
(ii) Development of the Toledo Area (south), through ruralroads and research on agriculture.

- 41 -
(b) Industry: An abbatoir and a meat packing plant which are scheduledto be completed in FY 1983/84.
(c) Tourism: The Belmnopan Hotel, which has experienced some delays butis projected to be completed in FY83/84.
(d) Transportation: The Northern Highway, almost completed.Ce) Power: Electricity expansions
(f) Social Sectors: Rural Junior Secondary School, Primary Schools, and waterand sewerage in Belize City.
140. External assistance has played a key role in the execution of the publicsector investment program. This assistance includes financial and technicalsupport; both have been increasing in recent years. Technical assistance has beenprovided by attaching it to the execution of externally funded projects and byfinancing specialized personnel working for the Central Government or publicenterprises.
141. Belize confronts four major constraints affecting timing and quality ofproject execution. They are:
(a) shortage of cash to cover local costs or bridge-financing forexternally funded projects. This situation is chiefly associatedwith the recent deterioration in public finances. Although fundsfrom the USA (Caribbean Basin Initiative) to cover local costs ofprojects have temporarily ameliorated this problem, the long-termsolution depends on the financial improvement of those public enter-prises that are performing poorly;
(b) administrative weaknesses in the capacity of the public sector tomonitor and control project execution. For example, application forreimbursements on externally funded on projects are habituallydelayed;
(c) lack of local personnel to participate in project execution. Thisprevents Belize from absorbing all the technical assistance providedby donors/lenders; and
(d) management problems of some public enterprises such as the M4arketingBoard and the Electricity Board.
The Development Finance Corporation
142. DFC is a Government statutory corporation that offers medium- to long-term development loans and makes equity investment in selected cases. DEC hasplayed an active role in the development of Belize. DFC's annual disbursementsare about US$1.5 million, or US$10 per capita; its outstanding loans amount toUS$12 million, or 17% of Belize's financial system.

- 42 -
143. DFC's operations include a wide range of activities. About 3,000 loanshave been approved for agriculture (41% of the total), housing (30%), tourism(8%)A manufacture (7%), fishing (4%), and services (10%), In addition, DFC holdsequity in five companies in the amount of US$1.1 million. 6/144. DFC's loan conditions are more favorable than thK ones prevailing in themarket. While commercial banks charge 19 to 20% per year, DFC charges between 9and 12%. Moreover, commercial banks lend for up to one year; DFC lends for more
145, DFC's resources come mainly from external agencies. In fact, whilecapital and reserves amount to about US$2 million; foreign liabilities amount toabout US$11 million, The external agencies that finance DFC are: CDB (about 75%of total external resources); CIDA (13%); UK (8%), and EDF (4%).
146, DFC should be strengthened. Although it is staffed with 54 people,which is adequate to carry out its current operations, DFC faces several problems:
(a) low collection rate on loans; only 75% of total collectable isactually received;
(b) poor performance of the enterprises in which DFC has equityinvestment; and
(c) high administrative costs, especially in approving and disbursingCDB loans that must incorporate terms and conditions imposed on CDBby its lenders.
The Public Sector Investment Program For The Period FY 1983/84-FY 1987/88
147. The investment program for the next five years focusses mainly on thefollowing projects:
In Economic Infrastructure(a) road maintenance and rehabilitation;(b) electricity (transmition distribution and rural electrification);Cc) port development (subject to the Master Plan study to be
undertaken);
In Directly Productive Projects(d) rural development (Toledo Area);(e) factory shells construction;(f) development credits to the private sector through the Development
Finance Corporation;
In The Social Sectors(g) extension of water and sewerage services;(h) expansion of the Belize College, Arts, Sciences and Technology; and(i) housing development.
6/ Belwood Manufacturing Co., Belize Garment Manufacturing Co., Belize BeefCorporation, Belize Food Processing Company and DFC Investment Company.

- 43 -
ACTUAL AND PROJECTED FINANCING OF PUBLIC SECTOR INVESTMENTFY1981 /82-FY1987/88
(Bz$ million)
Actual Prelim. Projected1981/82 1982/83 1983/4 1984/5 1985/6 1986/7 1987/8 Total %
UsesCapital Expenditures 50.6 49.3 50.0 52.0 56.0 60.0 66.0 284.0 78.5Amort.of Ext.Loans 2.9 3.4 12.0 3'5.0 16.0 17.0 18.0 78.0 21.5
Total T3C 357~ W2ETU 67.0 72.0 77.07 1931 190T 100.
SourcesPublic Savings 9.3 8.5 11.0 17.0 23.0 28.0 30.0 109.0 30.1Gross ExternalInflows 32,3 42.2 48.0 46.0 46.0 45.0 49.0 234.0 64.5
Net DomesticBorrowing 10.7 1.0 1.0 1.0 1.0 100 2,0 6.0 1.6
Capital Revenue 1.2 1.0 2.0 3.0 2.0 3.0 3.0 13.0 3.7
Total 53.5 52.7 62.0 67.0 72.0 77.0 84.0 362.0 100.0
148. The main elements of this projected public sector investment program andits financing are:
(a) public sector capital expenditures are projected to reach Bz$284million; or about 13% of GDP, or 55% of the total investment ofBelize. Projects to be executed are listed in Annex A; they areconsistent with the development strategy previously analyzed;
(b) the projected level of public investment is in line with theabsortive capacity of the public sector; in fact, it is notsignificantly higher than the public investment executed in recentyears;
(c) the financing appears feasible. It requires that public savings.increase progressively to reach about 5% of GDP a rate which hadbeen already achieved in the early and mid-1970s. This increase inpublic savings could be achieved mainly by improving the financialperformance of public enterprises;
(d) external capital sources are projected to continue funding a largepart of public investment, 65%. Gross external inflows to thepublic sector should reach about US$117 million for the period, orUS$23 million per year. This is achievable: about US$37 million arealready committed; about US$50 million are expected to be committedwithin the next three years; and US$30 million in new commitmentsneed to be secured. Required external inflows for the immediateyears, 1983 and 1984, are almost completely obtained; and

(e) borrowing from domestic sources is projected to decline to minimallevels. Less than 2% of the total financial requirements would befunded from these sources. Therefore, the public sector would useless funds from the domestic banking system leaving more resourcesavailable to the private sector.

- 45 -
VIe OUTLOOK
A. Output, Income and Expenditure
149. The prospects for economic growth in Belize largely depend on theinternational economic situation. Belize's economy is very open, and given thesmall size of the domestic market any significant growth in production needs to beexport-oriented. To the extent that a recovery appears to be emerging in theworld economy, Belize's prospects for economic growth look promising. Moreover,the country has several competitive advantages. First, abundant naturalresources; second, sound Government policies; and third, a climate for domesticand foreign investment which is good and industrial relations which are, on thewhole, smooth.
150, The Government is making efforts to solve some of the significantconstraints to development1 The lack of proper infrastructure (mainly roads,electricity and port facilities) is expected to be largely solved during thisdecade by the execution of appropriate projects. The shortage of managers andskilled personnel, another serious constraint to development, is being addressedby a liberal immigration policy and by the provision of student loans toBelizeans. In addition, to allay concerns of potential investors about thepolitical stability in Belize, the Government is promoting the country abroad,emphasizing its characteristics as a stable democracy.
151. Provided that an international recovery takes place, Belize can beexpected to resume steady economic growth. A 3% economic growth is projected bythe mission for 1983, accelerating to 4% in 1984 and to 5% from 1985 on. The mainsources from which this economic growth is expected are:
(a) Sugar. Production is expected to increase from about 105,000 Tonsin 1982 to 120,000 Tons in 1985. This is the maximum productionlevel given the present plant capacity of 115,000 Tons plus aplanned expansion of 5,000 Tons to be executed in 1984;
(b) Citrus. Production is expected to increase by about 6% per yearduring the next decade. This target, although ambitious isattainable: green Belizean oranges have a good market potential inthe EEC while CARICOM markets for fruit and processed citrus inwhich Belize has a comparative advantage can be pursued moreactively. The growth in production may require the additionalprocessing plant currently being contemplated by the industry.However, any substainable growth in citrus production requires adefinitive settlement of the on-going dispute between growers andprocessors over the pricing-share formula;
(c) Bananas. Within the present envisioned expansion this industrydoes not have a market constraint; moreover, as production iscurrently below the break-even level, a rapid expansion isnecessary. Private and public investments in banana production aretaking place and they are likely to continue in the immediatefuture. Banana production is thus projected to quadruple duringthe next ten years;

- 46 -
(d) Livestock, fish farming, poultry, rice, corn, and other non-tradi-tional agricultural products. Several new undertaking are envisag-ed by the private sector in these areas. Since sugar production isprojected to remain at about 120,000 Tons, once this level isreached, these products will play a crucial role in the growth ofthe agricultural sector in the future;
(e) Manufacturing. Once sugar refining reaches full capacity, thegrowth of this sector depends on citrus processing and new foodprocessing industries. In relation to the latter, several pro-posals are being considered by both the private and the publicsector including edible oil using wild nuts, meat processing, andfish cakes;
(f) Construction. After the 22% decline during 1982 this sector isprojected to recover rapidly as a result of the execution of majorpublic sector projects as well as the resumption of privateconstruction which should be stimulated by the increased incomeassociated with the expected recovery in sugar prices; and
(g) Tourism. The underlying assumption for the rapid growth projectedin tourism, about 7% per year, is the success of the present-marketing strategy: (i) siphoning off of European tourists going toCancun, Mexico, for a relatively long stay; (ii) more penetrationinto the US/Canada Market (Belize has only a 0.4% share of theUS/Canada tourist market to the Caribbean); and (iii) extention ofpeak season from its current January/March period through June,
Actual and Projected Real Growth by Sectors
Average Actual Prelim. Projected Average1972-80 1981 1982 1983 1984 1985 1986 1987 1987-95
Agriculture,forestry, fishingand mining 1.3 2.7 2.0 4.0 4.0 5.0 5,0 5.0 5.0
Manufacturing 7.3 -1.8 5.0 2.0 3.0 3.0 3.0 3,0 4.0
Construction 10,1 12.5 -21.5 5.0 5.0 6.0 7.0 7.0 6.3
Services 4.3 2.0 -1.0 2.0 4.0 5.0 5,0 5.0 5.0
GDP 4.4 2,6 -0.3 3.0 4.0 5.0 5.0 5.0 5.0
152. On the expenditure side, the projections reflect the efforts which needto be undertaken by Belize so as to increase national savings. Domesticinvestments are projected to remain at relatively high levels, about 25% of GDP.In 1982, national savings accounted for 9% of GDP and financed only 35% of the

- 47 -
domestic investment; by 1990, national savings should account for about 17% ofGDF and would finance 65% of the domestic investment. This situation is projectedto continue during 1990-95. The projected increase in national savings isexpected from both the public and the private sectors. The public sector shouldincrease its savings from the present level of 3% of GDP to 5% by 1985. Tosustain this 5% level will require a substantial improvement in the financialperformance of the major public enterprises and a close monitoring, as among otherthings, the financial surplus of the new Social Security System could potentiallydecline in future years. Private savings which average~d about 8% of GDP in thelast quinquennium, are projected to increase to about 12% in 1990. This impliesthat the rate of increase in private consumption will be slightly lower than thatof the GDP, but will still be sufficient to allow a significant improvement inreal per capita consumption.
Expenditure Coinponents of GDP
Average annualgrowth rate Composition
1978-81 1982-90 1990-95 1982 1985 1990
GDP 1.8 4.6 5.0 100.0 100.0 100.0
Investment 4.1 5.1 5.2 25.2 23.8 25.1
Private Consumption 7.9 4.1 4.4 78.1 72.3 70.9
Public Consumption 9.3 2.0 2.1 19.0 17.8 13.6
National Savings -4.6 19,0 4.7 8.9 14.1 16.9
B. Balance of Payments
153. The medium- and long-term balance of payments projections are based onan export-oriented strategy that emphasizes non-sugar exports so as to make theeconomy of Belize less vulnerable to the cyclical behavior of sugar. On theimport side, a key element in improving the balance of payments performance is aslowdown in the growth of imports of food, fuel and durable consumption goods.
154. The growth of exports of goods and non-factor services, in real terms,is expected to average 5.5% a year during 1982-1990 ani 5.0% during 1990-95. Thiswill entail significant efforts as the volume of nugar exports are projected toincrease only during the next three years and then to remain constant; thereforeexport growth will have to c6me from other products such as citrus, fish, bananas,timber and beef. Earnings from non factor services should increase in line withan expected increase in tourism.
155. Imports are projected to increase in real terms by about 2.9% during1982-90 and by 3.7% during 1990-95. Imports grew faster in :acent years, but thisgrowth was associated with re-exports and with imports finaAced with earnings from

- 48 -
illegal exports. It is assumed that re-exports wLil. slowdown while illegalexports will be gradually eliminated. This projectl.on also reflects several as-sumptions. First, the food bill which represent about 33% of the total merchan-dise imports, is projected to increase at an annual growth rate of about onefourth of that of the GDY during 1982-90 and about one half during 1990-95.Second, fuel imports are projected to increase by about one half of the GDP growthduring 1982-90. This will require the implementation of energy-conservation mea-sures as well as energy-savings projects particularly in relation to electricity.The projection does not however assume any significant domestic production ofpetroleum. Third, other iTh irts, which include investment-telated goods and dura-ble consumption goods, are projected to grow somewhat slower than GDP. Althoughinvestmient is projected to grow at about the same rate as GD'P, a slowdown inimports of consumption goods should be possible by eliminating import dutyexemptions.
156. The balance of payments projections also include:
(a) an expected increase in sugar prices which in 1985 are projected toreach a level similar in real terms to the one prevailing in 1981;
(b) an expected decline in oil prices although this situation is pro-jected to reverse in 1985 and steady increases in oil prices areassumed from that year on;
(c) a resulting improvement in the terms of trade until 1989, reachinga level slightly better than the one prevailing in 1981. From 1989on the projected terms of trade show a slightly deteriorating trendassociated with declining export prices for bananas and citrus andsteady increases in oil prices;
(d) a diversification of exports so that earnings become less dependanton sugar. Since volume of sugar exports are projected to increasefrom 98,000 Tons in 1982 to 110,000 Tons in 1985 and to remain atthat level, sugar exports earnings are projected to decline inrelative terms from 50% of the total merchandise export earnings in1981 to about 40% in 1985 and to 32% in 1995; and
(e) conservative assumptions in projecting factor income payments andnet transfers. It is assumed that factor income payments willincrease in line with interest payments; thus projected factorincome payments in 1990 are three times the amount prevailing in1982 in nominal terms; in 1995 they are six times the amount of1982. In relation to transfers, it is assumed that they willremain constant in real terms.
157. The current account balance of payments deficit is projected to fallgradually as a percentage of GDP, from 16% in 1983 to 8% in 1990, remaining atthat level until 1995. Financing of this deficit is projected to be equivalent toabout 35% of the domestic investment.
158. In order to finance the current account balance of payments deficits aswell as a modest increase in foreign reserves, net capital inflow averaging aboutUS$25 million per year will be necessary during the rest of the 1980s and about

- 49 -
US$40 million per year during 1990-95. Net external capital inflows to theprivate sector are projected to provide about 30% of these requirements. Thisshould be well within the realm of possibility given the very wide range ofprivate investment opportunities in Belize, which will become even more attractiveas the world economy recovers. Net external capital inflows to the public sector
are projected to average about US$18 2illion per year during the rest of the 1980sand about US$28 million during 1990-95.
Actual and Projected Exports and Importsof Goods and Non-Factor Services
(In 1981 US$million)
Annual increasePrelim Projected (%)19V2 1990 1995 1982-90 1990-95
Export
Sugar 43.7 51.8 51.8 2.1 0.0Citrus 7.1 11.3 15.1 6.0 6.0Fish 6.2 9.9 13.9 6.0 7.0Bananas 2.5 8.5 16.9 16.0 14.0Other 11.1 24.8 33.9 10.6 6.4Non-Factor Services 10.5 17.8 26.8 6.8 8.5Goods and NFS a! 81.1 124.1 158.4 5.5 5.0
Imports
Food 43.2 48.1 54.1 1.4 2.4Fuel 24.9 30.6 36.8 2.6 3.8Other 45.9 61.6 76.3 3.8 4.3Non-Factor Services 10.4 15.7 19.7 5.2 4.6Goods and NFS a! 124.4 156.0 186.9 2.9 3.7
a! Excludes re-exports
C.* Creditworthiness
Present debt
159. Belize has in recent years received large amounts of external assistancemostly in the form of grants and concessional loans. Grants have accounted forabout 30% of the gross inflow of external capital to the public sector, thelargest grant received by Belize, being the Independence Grant provided by theU.K.; amounting to 6.0 million Pounds Sterling of which about 50% is yet to bedisbursed.

- 50 -
160. The structure and terms of the loans commited between 1970 and 1982 havebeen favorable as evidenced by the fact that:
(a) interest-free loans account for 13% of the total; loans payinginterest of up to 4% account for about 41%;
(b) the average maturity period is 22 years; loans with a repaymentperiod of more than 25 years account for 25% of the total; and
(c) the grant element amounts to about 30%-
Concessional loans have been received from various countries and agenciesincluding the UK, CIDA, USA, EEC, and CDB. These concessional loans have financedseveral projects such as grain storage, port, water and sewerage, hurricanerehabilitation, banana rehabilitation, education, and roads.
161. The public and publicly guaranteed debt at the end of 1982 accounted forabout US$70 million or 45% of GDP. However, because of the favorable term struc-ture and concessionality of most loans, the debt service has been low, less than5% of domestic exports (excluding re-exports). It should be noted that the debtservice ratio will increase sharply in 1983 because of two main reasons: (i) inresponse to the financial difficulties of 1982, the Government contracted severalloans on commercial terms (five years; Libor plus 2%) from the local branches offoreign banks; these loans are denominated in US dollars and amount to about US$6.0 million; and (ii) several concessional loans start to be repayable in 1983.
162. There is no available information on external private debt. Foreign in-vestment, on the other hand, appears to have been modest in recent times. Itappears that recent developments in Mexico have adversely affected the balance ofpayments position of Belize. High interest rates prevailing in Mexico until re-cently may have caused some outflow of capital from Belize to Mexico while thefinancial crisis of 1982 has reduced Belizean re-export trade as well as purchasesof Belizean goods by Mexicans. An outflow of private capital could place heavypressure on the balance of payments but such a situation is not envisaged becauseof the good investment climate, smooth industrial relations, and stable policies.
Projection of Capital Inflows
163. Capital inflows to the public sector are projected to continue financingmost of the current account balance of payments deficits. However, they are pro-jected to decline from about 80% of the deficit in 1982 to about 70% in 1990 andto 55% in 1995. It is assumed, therefore, that increased private capital inflowswill take place; an assumption consistent with the projected economic growth inareas where private foreign participation will be crucial.
164. External public debt is projected to remain constant as a percentage ofGDP at about 46% in the next thirteen years. It is expected that the publicsector will obtain external funds from the following sources: (i) disbursements ofloans and grants already committed; (ii) new loans from international agencies(EEC, IBRD, CDC and CDB); and (iii) unidentified sources (commercial banks andsuppliers). From the analysis of the projected inflows we can conclude:

- 51 -
(a) required external funds for public investments during 1983 and 1984are for the most part already in the pipeline. Moreover, tocompensate for the decline in foreign reserves associated with lowsugar prices prevailing during 1982 and 1983, the IMF is consider-ing Compensatory Financing for Belize;
(b) new loans to be obtained from international agencies such as EECand CDB would be a continuation of present lending programs;
(c) loans from unidentified sources, mostly commercial banks, are pro-jected to be increasingly important particularly by the late 1980s;and
(d) disbursements of loans on conventional terms, from identified andnon-icdentified sources currently about 35% of disbursements, areprojected to account for about 60% of the total disbursements in1990 and for about 76% in 1995. Thus, although declining inrelative terms, external concessional assistance will continue torepresent a sizeable part of the public sector capital require-ments.
165. The debt service ratio is projected to remain within manageable limits.It is projected to increase to about 12% (excluding re-exports) in 1983 and 1984.However, as export earnings increase the debt service ratio is projected togradually decline to about 7% in the late 1980s. Then, it is projected toincrease again as increasing amounts of loans on conventional terms arecontracted, reaching 10% in the mid 1990s.
Conclusion
166. Based on the previous analysis, Belize should be considered creditworthyfor limited borrowing on conventional terms provided that the Government continuesto pursue prudient economic policies. This conclusion is based on the followingfact ~ors:
(a) the prospects f or growth appear favorable;(b) the prospects for achieving balance of payments sustainability are
also favorable in light of the export-oriented development strategybeing pursued by the Government; and
(c) public and publicly guaranteed debt service ratios are projected toremain within manageable limits.
167. However, in order to maintain creditworthiness the Government will haveto pay special attention to the following issues:

- 52 -
(a) the finances of some major statutory bodies must be improved;particularly the Electricity Board, the Marketing Board, and theBanana Control Board;
(b) the public sector should only execute priority projects with highrates of return. Given the small size of the Belizean economy, anyproject which does not meet these conditions could adversely affectthe country's creditworthiness; and
(c) in order to keep the debt service within manageable limits, con-traction of new debt should be carefully monitored so a to minimizethe financial costs of borrowing from conventional sources and toavoid excessive short-term loans.

- 53 -
ANNEX A
GOVERNMENT 'S PROJECT LIST

- 54 -
TABL! 1: BELIZE - MAJOR ONGOING PROJECTS
(US$ '000)
Total Financing Interest Amortisation Grace Period Counterpart financingCoat Secured Source 1 (Yeard) (Years) Amount I
DirectlyjProductive ProjectsAgriculture Research and
Development - Toledo 2,771 2,771 UK Grant - - - -Veterinary Laboratory 950 650 EDF Grant - - 300 32Banana I 8,787 8,117 */I 7 * . 670 8
(3, 600) (3, 600) CDC 7 10 1 (-) (-)(1,000) (1,000) TT 8 3 (-) (-)(4,187) (3,517) CDB 8 15 5 (670) (6)
(-) (1,300) b/ Supp. Credit 7-1/4 5 2 - -Coconut Rehabilitation 711 226 UK Grant - - - -CARICOM Farms Ltd (regional) 2,700 2,700 EDF Grant - - - -Fores try Equipment Scheme 460 460 UK Grant - - - -Toledo Rural Roads 2,575 1,137 UK Grant - - - -Coconut Seed Garden 56 56 UK Grant - - - -Belmopan Hotel 1,135 750 CDB 8 15 5 385 36Abeattoir and Meat Packing
Plant 672 584 CDB 4 15 5 .88 13534 534 CDB Grant - - - -
BML Improvement - T.A. 157 117 CDB Grant - 6 0 25Industrial Estate III c/ 505 505 CDB 4 15 5 - -Agricultural and Industrial
Credit IV c/ 1,000 1,000 CDB 4 20 5 - -Farm Improvement CreditVIII c/ 1,000 1,000 CDB 4 20 5 - -
Small Industry CreditIII & IV c/ 1,000 1,000 CDB 4 20 5 - -
Agricultural ProductionCredit c/ 1,245 1,245 CDB 4 20 5 - -
Industrial Credit c/ 1,465 1,465 CIlDA - - -- -Small Farmers CredTt c/ 520 520 EDF 1 30 10 - -DFC Crop Loan Scheme ~/ 180 180 UK Grant - - - '-
Economic InfrastructureNorthern Highway 18,336 18,336 UK Grant - - - -Western Highway - Drainage
Study 75 75 UK Grant - - - -Western Highway - San
Ignacio/Border Study 75 75 UK Grant - - - -
Wes tern Highway - Camalote/Esperanza 1,100 1,100 UK Grant - - - -
Belize City Streets - Study 75 75 UK Grant - - - -Rlawksvorth Bridge-Study 45 45 UK Grant - - - -Coastal Protection 175 175 UK Grant - - - -Harbour Board 200 200 UK Grant - - - -Beli.ze Inter'1 Airport-Apron 750 700 EDF 1 30 10 50 7District ElectricityExpansion 8,000 6,367 Supp. Credits 7-1/4 5 2 1,633 20
Belize City ElectricityExpansion 10,000 7,900,. . . 2,100 21
(5,000) CDI 6 18 4 (.) (.)(2,900) Supp. Credits 7-1/4 5 2 (.) (,)
Other ProjectsEnergy Development 367 367 UNDP Grant - - - -San Ignacio - Water Supply 65 65 UK Grant - - - -Orange Walk - Water Supply 400 400 UK Grant - - - -Corozal Town - Water Supply 352 352 UK Grant - - - -Rural Junior Secondary School 813 813 EDF 1 30 10 - -Primary Schools 800 800 USAID/COD Grant - - - -Youth Development Center 203 203 UK Grant - - - -Hopkins Health Center 68 68 UK Grant - - - -Independence Health Centre 59 59 UK Grant - - - -Airport Fire Station 175 175 UK Grant - - - -Fire Fighting Equipmnt 500 500 UK Grant - - - -Radio Belize FM 715 715 EDF 1 30 10 - -Basic Human Needs 345 345 USAID/CDB Grant - - - -Public Investment Project 334 334 UNDP Grant - - - -UK Scholarships 240 240 UK Grant - - - -Student Loans c/ 336 336 CDB 4 20 15 - -Sites and Services 305 305 UK Grant - - - -
a/ Excludes $1.3 million for operating expenses.b/ Loan for operating expenses,c/ Loans to DFC; guaranteed by the Central Government,

- 55 -
Table II: BELIZE - MAJOR NEW PROJECTS AND SOURCE OF FINANCING(US$ '000)
Total External Counterpart FinancingCost Financing Required Sour ce Amount %
Directly Productive ProjectsCrop Diversification 1,500 1,200 - Unknown 300 20Toledo Rural Development Project 14,650 12,500 UK/Unknown 2,150 15Central Belize Land Development
Project 12,000 10,000 Unknown 2,000 17Agriculture Training School 780 780 UK/Unknown - -
Toledo Timber Project 3,250 2,500 Unknown 750 23Edible Oils and Fats a/ 3,000 1,800 CDB/CFC/Unknown 1,200 40Credits b/ 6,000 6,000 CDB/Unknown - -
.Shrisp Farm a/ 6,000 6,000 Unknown 500 33Sugar Factor Expansion }/ 5,000 1,500 Unknown 3,500 70Industrial Estates IV b/ 1,500 1,000 CDB 500 33Coolshade Farms Ltd. aT 3,552 1,900 IFC 1,652 46Dairy Industry Project a/ 2,160 2,000 Unknown 160 7Big Falls Ranch Ltd. a, 2,000 2,000 Unknown - -
Rural/Industrial Growth Centre 6,500 6,000 Unknown 500 8
Economic InfrastructureMini-hydro Scheme 669 407 CDB 262 39Hydro-electricity Basibili ty
Study 150 100 Unknown 50 33Power Project I 47,100 35,100 Unknown 12,000 25
Road Maintenance and Rehab.c/ 19,000 17,200 UK & Possibly 1,800 10IBRD
Belize International AirportTerminal 4,000 4,000 Unknown - -
Airport Navigational Equipment 360 360 Unknown - -
Runway Extension - Belize Int'l.Airport 1,700 1,700 Unknown - -
Big Creek Port 3,500 2,500 Unknown 1,000 29
Other ProjectsBelize City Hospital 15,000 11,250 Unknown 3,750 25Hospital Equipment 160 160 Poss. UK - -
Renovation of Health Centers 125 112 UK 13 10Public Health Vehicles 160 160 Unknown - -
Belize City Water and SewerageSystem II 25,000 21,272 CIDA 3,728 15
Rural Water Supply 400 400 Poss. UK - -Museupe Archives 425 425 Poms. Germany - -Expansion of Belize Junior Secondary
School and Construction of Schoolsin Corozal and Stann Creek 1,400 1,200 Unknown 200 14
Vocational Training Centre 300 300 UK - -Public Sector Training Center 100 100 Unknown - -Primary School Teachers' Houses 350 310 Unknown 40 11Expansion of Rural Education and.Agriculture Progran (REAP) 120 110 Unknown 10 9
£xpansion of the Belize College ofArts, Sciences and Technology(BELCAST) 12,000 10,000 .EDF,Unknown 2,000 17
National Vocational Training 350 316 Unknown 34 10Educational Television Project 2,000 1,000 EDF 1,000 50Nousing Development 15,000 12,000 EDF,US,Unknown 3,000 20Fire Staition - Belize City 250 250 Unknown --New Post Office 750 675 Unknown 75 10
s/ Private sector.b/ Development Finance Corporation.c/ load Maintenance Unit and Southern Highway Bridges already approved.

~~7s 7?I9~2~

STATISTICAL APPENDIX

ye §& 1<

- 59 -
BELIZE
STATISTICAL APPENDIX
Table
I. Population and Labor Force
1.1 Population Estimates, 1980 Census1.2 Population Trends, 1974-811.3 Population Distribution by Age and by Sex, 1980 Census
II. National Accounts
2.1 GDP by Industrial Origin at Factor Cost, 1978-822.2 GDP by Industrial Origin at Factor Cost, 1980 Prices, 19782.3 National Accounts Summary, 1978-822.4 National Accounts Summnary (1980 Prices), 1978-822.5 GDP by Industrial Origin, 1978-822.6 GDP: Annual Growth Rate, 1979-822.7 GDP and Employment by Sector, 19802.8 Actual and Projected GDP by Sectors2.9 Actual and Projected Use of Resources
III. Balance of Payments
3.1 Balance of Payments, 1975-823.2 Value of Domestic Exports by Product Category (SITC), 1970-813.3 Value of Imports by Product Category (SITC), 1970-813.4 Value of Domestic Exports by Principal Trading Areas, 1970-813.5 Value of Imports by Principal Trading Areas, 1970-813.6 Quarterly and Annual Exports of Main Commodities, 1977-823.7 Merchandise Exports by Major Commodities, 1978-823.8 Actual and Projected Balance of Payments, 1981-953.9 Export Projections3.10 Import Projections3.11 Sugar: Export Projection
IV. External Public Debt
4.1 External Assistance4.2 Interest Rate Structure of External Public Debt4.3 External Public Debt: Maturity4.4 Debt Serv7ice4.5 Projections - Capital Inflows to the Public Sector4.6 Projected Public Debt Service

- 60 -
Table
V. Public Sector Finances
5.1 National Government Current Expenditures, 1975-82/835.2 National Government Current Revenue, 1975-82/835.3 National Government Operations, 1975-82/835.4 Financing of Public Sector Investment, 1975-82/835.5 Actual and Projected National Government Savings, 1981/82-87/885.6 Actual and Projected Financing of Public Sector Investment, 1981/82-87/885.7 Public Sector Investment Program, 1982/83 - 85/86 (On-going)S.7 Public Sector Investment Program, 1982/83 - 85/86 (New Projects)5.8 Import Duty: Actual Ad-valoremn Rate, 1979-81
VI. Money and Banking
6.1 Consolidated Accounts of the Financial System, 1976-826.2 Changes in Foreign Assets, Credit and Liabilities to Private Sector,
1977-826.3 Changes in Net Foreign Assets, 1977-826.4 Commercial Banks - Distribution of Loans and Advances, 1976-826.5 Domestic Credit, 1977-82
VII. Money and Banking
7.1 Sugar Production and Use, 1971-817.2 Cane Deliveries to the Sugar Factories, Sugar and Molasses Production,
197 1-817.3 Citrus Production, 1955/56 - 1981/827.4 Marketing Board: Purchase/Sale Ratios7.5 Production of Main Agricultural Commodities, 1970-19817.6 Citrus Processing by Company, 1980/81 - 1981/827.7 Industrial Production, 1975-817.8 Tourist Statistics, 1975-81

- 61 -
Table 1.1: BELIZE - POPULATION ESTIMATES, 1980 CENSUS
1970 1980 1980 1980 1980Total Total Males Females Households
Belize City North Side 13,582 14,378 6,935 7,443 3,083" " South Side 25,468 25,393 12,240 13,153 5,354
Belize City Total 39,050 39,771 19,175 20,596 8,437Belize District Rural 10,305 11,030 5,830 5,200 2,222
Belize District Total 49,355 50,801 25,005 25,796 10,659
Corozal Town 4,682 6,899 3,454 3,445 1,322Corozal Rural 10,869 16,003 8,546 7,457 2,734
Corozal District Total 15,551 22,902 12,000 10,902 4,056
Orange Walk Town 5,539 8,439 4,264 4,175 1,485Orange Walk Rural 11,502 14,431 7,740 6,691 2,518
Orange Walk District Total 17,041 22,870 12,004 10,866 4,003
Dangriga 6,967 6,661 3,188 3,473 1,371
Stann Creek Rural 6,056 7,520 3,952 3,568 1,563
Stann Creek District Total 13,023 14,181 7,140 7,041 2,934
Punta Gorda 2,131 2,396 1,129 1,267 509Monkey River Town 277 190 898 92 32Toledo Rural 6,581 9,176 4,692 4,484 1,748
Toledo District Total 8,989 11,762 5,919 5,843 2,289
San Ignacio 4,327 5,616 2,669 2,947 982Benque Viejo del Carmen 1,903 2,435 1,181 1,254 452Cayo Rural 9,471 11,851 6,216 5,635 2,093Belomnopan 274 2,935 1,483 1,452 669
Cayo District Total 15,973 22,837 11,549 11,288 4,196
Belize Total 119,934 145,353 73,617 71,736 28,137
Source: Central Planning Unit, Ministry of Finance.

- 62 -
Table 1.2: BELIZE - POPULATION TRENDS, 1974-81
1974 1975 1976 1977 1978a/ 1979a/ 1980b/ 1981
Total End-of -Year Population 128, 328 128, 897 127, 407' 132, 270 135, 684 139, 984 145, 353 148, 300
Crude Birth Rate of Mid-YearEstimated Population(per'000) 39.8 40.4 40.8 41.8 39.7 40.0 43.1 40.7
CruA' Death Rate of Mid-YearEstimated Population(per'000) 5.7 5.7 6.7 5.8 6.5 5.1 4.9 4.8
Rate of Natural Increase ofMid-Year Estimated Population(per'000) 34.1 34.7 34.1 36.0 33.2 34.9 38.2 35.9
Total Births 5,039 5,201 5,340 5,570 5,384 5,523 6,264 5,781
Total Deaths 728 733 881 767 885 710 717 681
Natural Population Increase 4,311 4,468 4,459 4,803 4,499 4,813 5,547 5,100
Net Migration -4,188 -3,899 -5,949 60 -1,085 -513 -178 2,153
Net Population Increase 123 569 -1,490 4,863 3,414 4,.300 5,369 -2,947
a/ Provisional.b/ 1980 Census.

- 63 -
Table 1.3: BELIZE - POPULATION DISTRIBUTION BY AGE AND BY SEX,1980 CENSUS
(%)
Total Male FemaleAge Group Total By SexYears Absolute Cummulative Male Female
0 - 4 16.7 16.7 16.7 16.8
5 - 9 15.6 32.3 15.6 15.7
10 - 14 13.8 46.1 13.8 13.9
15 - 19 12.0 58.1 12.0 12.1
20 - 24 8.9 67.0 9.0 8.8
25 - 29 6.2 73.2 6.2 6.3
30 - 34 4.7 77.9 4.7 4.6
35 - 39 3.6 81.5 3.6 3.6
40 - 44 3.5 85.0 3.6 3.4
45 - 49 3.2 88.2 3.2 3.2
50 - 54 3.0 91.2 3.1 2.8
55 - 59 2.2 93.4 2.2 2.1
60 - 64 1.9 95.3 1.9 1.8
65 - 69 1.7 97.0 1,6 1.7
70+ 2.9 99.9 2.7 3.0
TOTAL a/ 100.0 100.0 100.0 100.0
Total Population 145,353 73,617 71,736
a! Percentages may not add to 100 due to rounding.
Source: Central Planning Unit, Ministry of Finance.

- 64 -
Table 2.1: BELIZE - GDP BY INDUSTRIAL ORIGIN AT FACTOR COST, 1978-82
(Bz$ '000)
Prel.1978 1979 1980 1981 1982
Agriculture 82,690 89,145 113,896 115,288 96,362Sugarcane (41,056) (43,009) (60,717) (51,292) (36,525)Other Crops andLivestocks (31,509) (31,575) (41,751) (45,968) (42,963)
Forestry (3,918) (6,661) (4,400) (5,473) (4,658)Fishing (6,207) (7,900) (7,028) (12,555) (12,216)
Mining and Quarrying 735 735 760 760 760
Manufacturing 13,711 15,109 20,602 21,602 16,867
Construction 9,425 12,535 13,978 17,364 13,889
Electricity and Water 1,803 3,133 3,873 5,119 5,630
Trade, Restaurants andHotels 19,361 22,888 28,739 32,354 29,405
Transport, Storage and Comm. 6,463 8,134 9,706 11,918 13,979
Financing & Insurance 1,982 2,365 3,004 3,312 .3,947
Ownership of Dwellings 9,749 12,359 14,239 16,741 18,783
Public Administration 23,059 27,340 30,853 32,583 34,864
All Other Services 4,831 5,556 6,170 7,605 8,824
GDP 173,809 199,299 245,820 264,646 243,310
Source: Mission estimates.
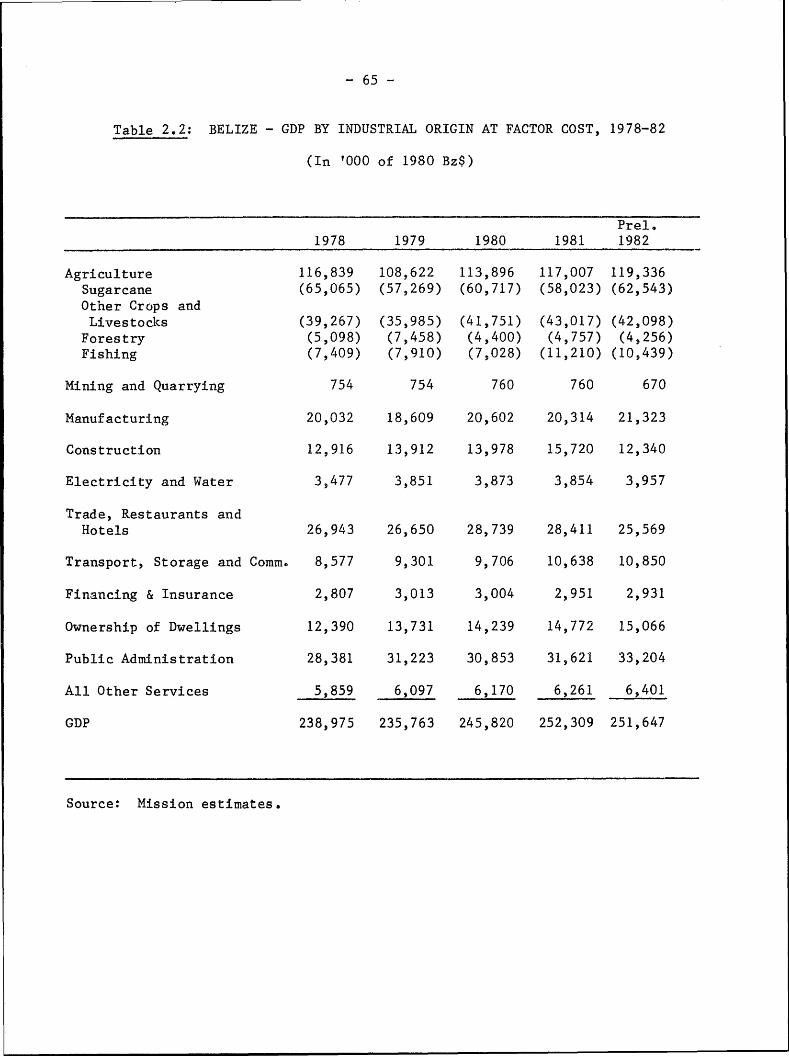
- 65 -
Table 2.2: BELIZE - GDP BY INDUSTRIAL ORIGIN AT FACTOR COST, 1978-82
(In '000~ of 1980 Bz$)
Prel.1978 1979 1980 1981 1982
Agriculture 116,839 108,622 113,896 117,007 119,336Sugarcane (65,065) (57,269) (60,717) (58,023) (62,543)Other Crops andLivestocks (39,267) (35,985) (41,751) (43,017) (42,098)
Forestry (5,098) (7,458) (4,400) (4,757) (4,256)Fishing (7,409) (7,910) (7,028) (11,210) (10,439)
Mining and Quarrying 754 754 760 760 670
Manufacturing 20,032 18,609 20,602 20,314 21,323
Construction 12,916 13,912 13,978 15,720 12,340
Electricity and Water 3,477 3,851 3,873 3,854 3,957
Trade, Restaurants andHotels 26,943 26,650 28,739 28,411 25,569
Transport, Storage and Comm. 8,577 9,301 9,706 10,638 10,850
Financing & Insurance 2,807 3,013 3,004 2,951 2,931
Ownership of Dwellings 12,390 13,731 14,239 14,772 15,066
Public Administration 28,381 31,223 30,853 31,621 33,204
All Other Services 5,859 6,097 6,170 6,261 6,401
GDP 238,975 235,763 245,820 252,309 251,647
Source: Mission estimates.

- 66 -
Table 2.3: BELIZE - NATIONAL ACCOUNTS SUMMARY, 1978-82
(In '000 Bz$)
Prel.
1978 1979 1980 1981 1982
Gross Domestic Product 212,784 247,939 300,459 329,386 309,400
Resource Gap 45,956 75,778 46,956 60,156 69,284
Imports (G&NFS) 237,996 289,894 329,624 351,970 298,170
Exports (G&NFS) 192,040 214,116 282,668 291,814 228,886
Total Expenditures 258,740 323,717 347,415 389,542 378,684
Consumption 198,892 247,425 263,663 300,314 300,650
General Government (40,000) (52,679) (58,143) (66,225) (68,424)
Privatea/ (158,892) (194,746) (205,520) (234,089 (232,226)
Gross Fixed Capital
Formation 59,848 76,292 83,752 89,228 78,034
Domestic Saving 13,892 514 36,796 29,072 8,750
Net Factor Income -6,854 -4,518 -7,180 -7,922 -7,500
Net Private Transfer 30,578 31,312 29,762 23,656 26,350
National Saving 37,616 27,308 59,378 44,806 27,600
Gross National Product 205,930 243,421 293,279 321,464 301,900
a! Includes change in stocks.
Source: Mission estimates.

- 67 -
Table 2.4: BELIZE - NATIONAL ACCOUNTS SUMMARY, 1978-82
(in '000 of 1980 Bz$)
Prel.
1978 1979 1980 1981 1982
Gross Domestic Product 292,076 288,140 300,459 308,361 307,580
Terms of Trade Effect -44,747 -28,194 - 6,341 -7,076
Gross Domestic Income 247,329 259,946 300,459 314,702 300,504
Resource Gap 55,037 82,547 46,956 57,898 70,123
Imports (G&NFS) 285,025 315,789 329,624 338,758 301,789
Capacity to Import 229,988 233,242 282,668 280,860 231,666
Exports (G&NFS) 274,735 261,436 282,668 274,519 238,742
Total Expenditure 302,366 342,493 347,415 372,600 370,627
Consumption 226,775 258,475 263,663 287,436 299,623
General Government 49,261 58,994 58,143 64,296 65,166
Privatea/ 177,514 199,841 205,520 223,140 234,457
Gross Fixed CapitalFormation 75,591 84,018 83,752 85,164 71,004
Gross National Product 248,002 283,334 293,279 300,795 301,235
Deflators (1980=100)Gross Domestic Product 72.9 86.0 100.0 106.8 100.6
Imports (G&NFS) 83.5 91.8 100.0 103.9 98.8
Exports (G&NFS) 69.9 81.9 100.0 106.3 95.8
Total Expenditure 85.6 94.5 100.0 104.5 102.2
Gross Fixed Investment 79.2 90.8 100.0 104.8 109.9
a! Residual, includes inventories.
Source: Mission estimates.

- 68 -
Table 2.5: BELIZE - GDP BY INDUSTRIAL ORIGIN, 1978-82
(%)
Est.1978 1979 1980 1981 1982
Agriculture 47.5 44.7 46.3 43.6 39.6Sugarcane (23.6) (21.6) (24.7) (19.4) (15.0)Other Crops and Livestocks (18.2) (15.8) (17.0) (17.4) (17.7)Forestry (2,2) (3.3) (1.8) (2.1) (1.9)Fishing (3.5) (4.0) (2.8) (4.7) (5.0)
Mining and Quarrying 0.4 0.4 0.3 0.3 0.3
Manufacturing 7.9 7.6 8.4 8,2 7.0
Construction 5.4 6.3 5.7 6.6 5.7
Electricity and Water 1.1 1.6 1.6 1.9 2.3
Trade, Restaurants and Hotels 11.1 11.5 11.7 12.2 12.1
Transport, Storage and Comm. 3.7 4.0 3.9 4.5 5.8
Financing and Insurance 1.2 1.2 1.2 1.2 1.6
Ownership of Dwellings 5.6 6.2 5.8 6.3 7.7
Public Administration 13,3 13.7 12.6 12.3 14.3
All Other Services 2.8 2.8 2.5 2.9 3.6
GDP 100.0 100.0 100.0 100.0 100.0
Source: Mission estimates.

- 69 -
Table 2.6: BELIZE - GDP: ANNUAL GROWTH RATE, 1979-82
(%)
1979 1980 1981 1982
Agriculture -7.0 4.9 2.7 2.0Sugarcane (-12.0) (6.0) (04.4) (7.8)Other Crops and Livestocks (-8.4) (16.0) (3.0) (-2.1)Forestry (42.3) (-41.0) (8.1) (-10.5)Fishing (6.8) (-11.1) (59.5) (-6.9)
Mining and Quarrying -0.8 - -
Manufacturing -7.1 10.7 -1.4 5.0
Construction 7.7 0.5 12.5 -21.5
Electricity and Water 10.7 0.6 -0.5 2.7
Trade, Restaurants and Hotels -1.1 7.8 -1.2 -10.0
Transport, Storage and Comm. 8.4 4.4 9.6 2.0
Financing and Insurance 7.3 -0.3 -1.8 -0.7
Ownership of Dwellings 10.8 3.7 3.7 2.0
Public Administration 10.0 -1.2 2.5 5.0
All Other Services 4.1 1.2 1.5 2.2
GDP -1.3 4.3 2.6 -0.3
Source: Mission estimates,

- 70 -
Table 2.7: BELIZE - GDP AND EMPLOYMENT BY SECTOR, 1980
Employed GDP GDP/EmployeePopulation (Bz$'000) Bz$
Total 39,806 245,820 6,175
Agriculture 14,745 113,896 7,724
Manufacturing 4,142 20,602 4,974
Electricity and Water 604 3,873 6,412
Construction and Quarrying 1,804 14,738 8,170
Finance and Insurance 360 3,004 8,344
Government 4,639 30,853 6,651
Trade, Restaurants and Hotelsa! 6,146 28,739 4,676
Transportation and Comm.b! 1,726 9,706 4,581
All Other Servicesc/ 5,640 20,409 3,619
a! The 1980 Population Census probably includes many part-time and family-runretail trades and restaurants.
b/ Many private cars registered as taxi to reduce the higher license fee.Thus, they become part-time taxi drivers.
cI Includes volunteers, priests and domestic servants.
Source? Mission estimates.

Table 2.8: BELIZE - ACTUAL AND PROJECTED GDP BY SECTORS
(1981 B$ million)
Actual Estire. ProjectedT~1T 1982 1983 1984 1985 1986 1987 1988 1989 1990 1991 1992 1993 1994 1995
Agricuilturea/ 116.05 118.25 122.98 127.80 134.30 141.01 148.06 155.47 163.24 171.40 179.97 168.97 198.42 208.34 218.76Manufacturing 21.60 22.67 23.13 23.82 24.54 25.27 26.03 27.07 28.16 29.28 30.45 31.67 32.94 34.26 35.63Construction 17.36 13.63 14.31 15.03 15.93 17.04 18.24 19.39 20.61 21.91 23.29 24.75 26.31 27.97 29.73Services 109.64 109.39 111.44 115.99 122.12 128.39 134.98 141.75 148.86 . 156.31 164.14 172.34 180.96 189.99 199.47
GDPb/ 264.65 263.95 271.97 282.74 296.88 311.72 327.31 343.68 360.86 378.90 397.85 417.74 438.63 460.56 483.59GDP Growth 2.60 -0.25 3.00 4.00 5.00 5.00 5.00 5.00 5.00 5.00 5.00 5.00 5.00 5.00 5.00
a/ Includes fishing, livestock, forestry, and mining.T/ GDP at factor costs.
Source: Mission estimsates

Table 2.9: BELIZE - ACTUAL AND PROJECTED USE OF RESOURCES(1981 B$ million)
Actual Estim. Projected1981 1982 1983 1984 1985 1986 1987 1988 1989 1990 1991 1992 1993 1994 1995
GDP 329.39 328.51 338.37 351.91 369.50 387.98 407.37 427.74 449.13 471.59 495.17 519.92 545.92 573.22 601.88Terms of Trade Adjust. 0.00 -13.19 -12.88 -6.42 10.28 10.97 11.54 14.64 16.97 16.37 15.76 14.28 11.84 8.30 3.63GDY 329.38 315.32 325.49 345.48 379.78 398.94 418.92 442.38 466.10 487.96 510.92 534.20 557.76 581.52 605.51
Exports 291.81 253.78 230.72 242.52 239.40 248.18 256.40 265.62 274.28 284.98 297.54 310.68 324.44 338.80 355.06Capacity to Import 291.81 240.59 217.84 236.10 249.68 259.15 267.94 280.26 291.25 301.35 313.30 324.96 336.28 347.10 358.69Imports 351.97 313.56 289.26 293.74 301.06 310.84 312.92 332.12 341.50 349.66 360.06 373.32 387.16 401.60 413.16
Total expenditure 389.54 388.29 396.91 403.13 431.16 450.64 472.89 494.24 516.35 536.27 557.69 582.56 608.64 636.02 659.98
Investment 89.23 74.42 81.22 84.46 88.69 93.12 97.78 106.94 112.29 117.91 123.80 129.99 136.46 143.32 151.00
Consumption 300.31 313.87 315.69 318.67 342.47 357.52 375.11 387.30 404.06 418.36 433.89 452.57 472.18 492.70 508.98Public 66.23 67.12 67.86 68.40 70.77 72.37 74.16 75.83 77.53 79.03 80.60 82.40 84.25 86.14 88.00Private 234.08 246.75 247.83 250.27 271.70 285.15 300.95 311.47 326.53 339.33 353.29 370.17 387.93 406.56 420.98
Domestic Savings 29.07 1.45 9.80 26.82 37.31 41.43 43.80 55.08 62.04 69.60 77.04 81.63 65.58 88.82 96.53
Factor Serv. Income 7.92 7.36 11.70 13.02 13.32 12.58 13.00 12.84 13.46 14.68 15.66 17.10 18.14 19.44 20.42
Transfers 23.66 26.24 28.00 28.02 28.02 28.00 28.00 28.00 28.00 28.00 28.00 28.00 28.00 28.00 28.00
National Savings 44.80 20.33 26.10 41.82 52.01 56.87 58.80 70.24 76.58 82.92 89.38 92.53 95.44 97.38 104.11Public 10.50 8.50 13.64 17.60 18.48 19.40 20.37 21.39 22.46 23.58 24.76 26.00 27, 30 28.66 31.00Private 34.30 11.83 .12.56 24.22 33.53 37.47 38.43 48.85 54.12 59.34 64.62 66.33 68.14 68.72 73.11
GNP 321.46 321.15 326.67 338.89 356.18 375.40 394.37 414.90 435.67 456.91 479.51 502.82 527.78 553.78 581.46
GNS/GNP 0.14 0.06 0.08 0,15 0.15 0.15 0.17 0.18 0.19 0.18 0.18 0.18 0.18 0.18 0.18
Source: Mission estimates

Table 3.1: BELIZE - BALANCE OF PAYMENTS, 1975-1982
(In Millions of US$)
Prelim.1975 1976 1977 1978 1979 1980 1981 11
Domestic exports of goods, f.o.b. 48.0 34.1 44.5 55.3 60.7 82.1 74.7 57.8Re-exports of goods, f.o.b. 12.2 12.9 17.6 24.9 30.2 28.8 44.3 32.7Total exports of goods, f.o.b. 60.2 47.0 62.1 80.2 90,9 110.9 119.0 90.5Non-recorded exports - - 4.5 5.0 6.3 20.2 16.4 13.3Non-factor services earnings 8.3 8.5 9.0 10.8 9.9 10.3 10.5 10.5Exports of Goods and n.f.s. 68.5 55.5 75.6 96.0 107.1 141.4 145.9 114.4Imports of Goods for domestic consumption, e.i.f. -67.4 -67.8 -72.5 -81.6 -101.7 -121.0 -118.0 -106.05Imports of Goods for re-exports, f.o.b. -12.2 -12.9 -17.6 -24.9 -30.2 -28.8 -44.0 -32.7Total Imports of Goods -79.6 -80.7 -90.1 -106.5 -131.9 -149.8 . -162.0 -138.7Imports of n.f.s. -7.4 -7.5 -7.8 -12.5 -13.1 -15.0 -14.0 -10.4Imports of Goods and n.f.s. -87.0 -88.2 -97.9 -119.0 -145.0 -164.8 -176.0 -149.1Resource Balance -18.5 -32.7 -22.3 -23.0 -37.9 -23.4 -30.1 -34.7Net Factor Income -1.7 -1.7 -1.7 -3.4 -2.3 -3.6 -3.9 -3.7Transfers, net 15.0 15.0 15.2 15.3 15.7 14.8 11.8 13.2Current Account Balance -5.2 -19.4 -8.8 -11.1 -24.5 -12.2 -22,2 -25.2Official Capital 6.2 7.5 8.5 14.3 13.9 10.1 12.7 21.4
Grants (4.0) (4.1) (4.1) (3.8) (5.5) (2.9) (5.7) (7.5)Loan Disbursements (1.7) (2.1) (4.3) (9.5) (8.5) (7.7) (7.9) (14.4)Amortization (-1.3) (-1.0) (-1.0) (-0.5) (-1.0) (-1.9) (-1.5) (-1.7)Public Financial Institutions (1.8) (2.3) (1.1) (1.5) (0.9) (1.4) (0.6) (1.2)
Commercial Banks -1.2 6.7 -2.1 -4.1 2.2 -2.3 2.1 -1.4Private Capital and Errors and Omissions 4.2 2.9 4.5 - 5.0 6.3 6.7 5.3 4.6Capital Account Balance 9.2 17.1 10.9 15.2 22.4 14.5 20.1 24.6Change in Official International Reserves
(-increase) -4.0 2,3 -2.1 -4.1 2.1 -2.3 2.1 0.6
Source: Central Planning Unit, Central Bank and mission estinates.

Table 3.2: BELIZE - VALUE OF DOMESTIC EXPORTS BY PRODUCT CATEGORY (SITC), 1970 - 1981
(In thousands of Bz$)
1970 1971 1972 1973 1974 1975 1976 1977 1978 1979 1980 1981
Total Domestic Exports 23,238 24 72 31 ,806 2 17
0 62}7 95,929 68,161 88,987 11 4 121,456 164,120 14 4)
SITC Sections
0. Food 19,110 20,396 25,260 31,638 49,454 85,393 51,443 65,963 86,790 92,196 130,075 122,981
1. Beverages &Tobacco - - 1 - 2 - - 2 - - - 1
2. Crude Materials 2,185 1,767 2,274 4,017 4,154 2,768 4,157 2,965 4,075 6,620 4,707 3,359
4. Oils and Fats - - - - 2 16 31 - - 10 6 4
5. Chemicals 81 103 110 171 505 86 245 43 451 507 673 . 543
6. Manufactured Goods - - 2 - 14 43 89 349 24 67 32 135 *
7. Machinery & Transport 20 99 - 6 3 72 13 - - 13 12 116
8. Misc. Manufactured Goods 1,558 1,955 3,938 6,278 8,409 7,490 12,150 19,125 18,952 21,399 28,382 22,088
9. Miscellaneous 284 407 221 60 29 60 33 540 348 644 233 245
Source: Central Planning Unit.

Table 3.3: BELIZE - VALUE OF IMPORTS BY PRODUCT CATEGORY (SITC), 1970 - 1981
(In thousands of Bz$)
1970 1971 1972 1973 1974 1975 1976 1977 1978 1979 1980 1981
Total Imports edi.f . 55,611 58,590 69, 257 72, 323 109, 182 159, 227 161, 510 180, 151 212, 991 263, 754 299, 509 323,3
SITC Sections
0. Food 14, 207 15, 145 17, 242 18, 840 18, 136 41, 564 38, 940 40, 110 51,516 64,565 65, 659 79, 808
1. Beverages and Tobacco 3, 207 2, 888 2, 344 2, 980 4, 130 2, 881 3, 332 3,810 5, 823 6, 632 6, 448 7, 115
2. Crude Matrials 334 292 433 596 1,191 974 781 1,376 1,122 2,040 2,366 4,9163. Fuels -2,761 3,346 3,511 4,879 11,451 13,180 18,742 23,359 22,039 33,139 54.475 51,334
4. Oils and Fats 96 149 131 134 227 284 587 357 479 698 1,367 1,0235. Chemicals 5,792 5,027 6,866 6,609 10,444 18,824 12,758 12,648 15,188 20,699 19,480 22,8716. Manufactured Goods 11,793 11,219 13,518 14,132 19,132 28,586 24,007 28,616 37,999 38,839 41,617 39,466
7. Machinery & Transport 10,506 13,612 15,755 15,175 20,236 37,691 40,411 45,319 45,833 56,786 57,907 57,532 -8. Misc. M4fd. Goods 6,357 6,419 8,885 8,368 13,645 14,854 21,325 23,752 31,891 39,236 47,968 58,277
9.HMiscellaneous 558 493 572 610 590 389 627 804 1,101 1,121 2,222 1,592
Source: Central Planning Unit.

Table 3.4: BELIZE - VALUE OF DOMESTIC EXPORTS BY PRINCIPAL TRADING AREAS, 1970 - 1981
(In thousands of Bz$)
1970 1971 1972 1973 1974 1975 1976 1977 1978 1979 1980 1981
Total Domestic Exportsf.o.b. 23,238 24,726 31,806 42,170 62,572 95,929 68,161 88,987 110,640 a/ 121,456 a/ 164,120 a/ 149,472 5/
Sterling Area 8,569 8,155 9,624 10,490 11,197 43,594 3 ! 42,350 57,040 53,534 61,761 54,499
U.K. 7,207 6,725 8,500 7,349 8,087 40,247 33,081 38,991 53,302 47,264 52,354 46,037
CARICOM 1,329 1,392 1,109 3,134 3,095 3,201 3,535 2,731 3,734 6,153 9,150 - 7,799 -
Others 33 38 15 7 15 146 298 628 4 177 257 663
Total North America 12,979 15,838 20,772 30,467 47,908 51,276 29,571 41,911 48,102 54,138 95,955 91,840
USA 8,780 9,931 17,645 25,553 46,582 49,517 25,449 41,641 48,094 53,559 95,846 90,879
Canada 4, 199 5, 907 3, 127 4, 914 1, 326 1, 759 4, 122 270 8 57 9 109 961
EEC-Excluding UK 630 208 .900 676 637 895 1,891 2±@ 3@ 3 § 2,039
Rest of the World 1, 060 525 500 537 1, 613 42 781 2@ 2, 373 2, 416 3, 286 1,094
a! Details may not add to totals due to the latest revision of the total domestic exports.
Source: Central Planning Unit.

Table 3.5: BELIZE - VALUE OF IMPORTS BY PRINCIPAL TRADING AREAS, 1970-1981
(In thousands of Bz$)
1970 1971 1972 1973 1974 1975 1976 1977 1978 1979 1980 1981
Total Imports, edJ.f. 55,611 58,590 69,257 72,323 109,182 159,227 161,510 180,151 212,991 263,754 299,509 323,934
Sterling Area
Total 20,814 23,847 22,488 23,419 30,914 45,612 57,089 53,904 61,352 58,520 58,373 59,217
UK 14,127 16,550 14,301 14,891 21,682 35,076 32,980 27,511 37,288 46,885 47,265 45,789
CARICOM4 4,084 4,446 4,504 5,8~46 6,296 5,578 4,233 4,097 4,125 6,488 4,662 6,409
Others 2,603 2,851 3,683 2,682 2,936 4,958 19,876 22,296 19,939 5,148 6,446 7,019
Principal Dollar Areas
Total 20,809 20,118 27,412 27,045 40,698 66,964 60,321 79,099 91,543 102,624 111,396 121,567
USA 18,741 17,984 24,435 24,352 36,802 62,146 56,423 75,132 82,751 93,900 104,319 114,682
Canada 2,068 2,134 2,977 2,693 3,896 4,818 3,898 3,967 8,792 8,724 7,077 6,885EEC - Excluding UK 6,975 7,502 7,639 7,871 11,365 12,919 13,260 13,196 17,151 22,034 11,108 28,315
Rest of the World 7,013 7,123 11,718 13,988 26,205 33,732 30,840 33,952 42,945 80,576 118,632 114,835
Source: Central Planning Unit.

Table 3.6: BELIZE - QUARTERLY AND ANNUAL EXPORTS OF MAIN COMMODITIES, 1977-1982
(Values in Thousands of Bz$)
Sugar Molasses Citrus Bananas Fish Products Sawn WoodConcen- 42-lb.
Long *Long trates BoxesTons Value Tons Value (gals.) Value (000) Value (000 lbs.) Value (000 brd. ft.) Value
19773rd Quarter 25,500 19,172 11,880 662 14 116 151 1,021 418 1,498 390 3904th Quarter 14,960 9,914 5,130 644 41 393 108 733 401 1,110 375 375
19781st Quarter 23,750 11,928 4,139 112 232 2,772 167 1,112 381 1,076 340 4282nd Quarter 35,135 18,913 9,094 270 292 3,790 161 1,071 207 277 609 591
3rd Quarter 33,104 23,130 15,898 733 122 1,740 160 1,064 308 1,374 280 3194th Quarter 19,583 11,929 6,800 1,016 - - 32 209 428 891 369 454Total 111,572 65,900 35,931 2,131 647 8,302 520 3,456 1,324 3,618 1,598 1,792
19791st Quarter 17,452 10,758 3,648 397 279 4,024 77 ' 615 345 2,391 575 7532nd Quarter 29,879 17,364 9,946 1,045 19 347 262 2,103 131 464 1,028 1,0393rd Quarter 28,090 25,039 12,732 1,535 217 3,008 272 2,180 299 3,334 472 561,4th Quarter 16,022 9,752 4,722 935 119 1,533 231 1,850 414 2,582 623 797Total 91,643 62,913 31,048 3,912 634 8,912 6,478 1,189 8,771 2,698 3,150
19801st Quarter 25,312 18,127 6,555 824 321 4,634 289 2,528 266 2,198 380 5632nd Quarter 29,436 24,232 8,876 1,136 379 5,179 186 1,622 101 298 686 6573rd Quarter 38,074 43,027 14,385 1,963 40 599 107 978 299 2,959 283 3494th Quarter 4,330 10,017 400 454 172 2,326 203 1,859 409 2,683 361 571Total 97,152 95,403 30,216 4,377 912 12,738 785 6,987 1,075 8,138 1,710 2,140
19811st Quarter 22,682 20,296 5,961 525 296 3,095 151 1,340 425 2,696 308 5122nd Quarter 28,571 21,916 8,070 711 581 6,743 129 1,041 169 513 546 843
3rd Quarter 26,316 34,793 13,475 1,183 263 2,837 169 1,189 463 6,483 281 4654th Quarter 12,855 8,272 - - 30 329 102 741 411 4,751 376 574Total 90,424 85,277 27,456 2,419 1,170 13,004 551 4,311 14,443 1,511 2,394
19821st Quarter 21, 385 15, 945 4, 659 238 582 5, 907 55 424 400 3, 600 821 1, 2572nd Quarter 26,874 15,588 18,964 967 362 3,984 82 611 201 641 707 8183rd Quarter 34,543 23,018 11,471 585 281 2,616 218 1,621 349 4,328 371 5554th Quarter 15,676 7,393 13,611 694 150 1,397 211 1,923 373 4,275 489 734Total 98,478 61,944 48,075 2,484 1,375 13,904 566 4,579 1,323 12,844 2,388 3,264
Source: Central Planning Unit.
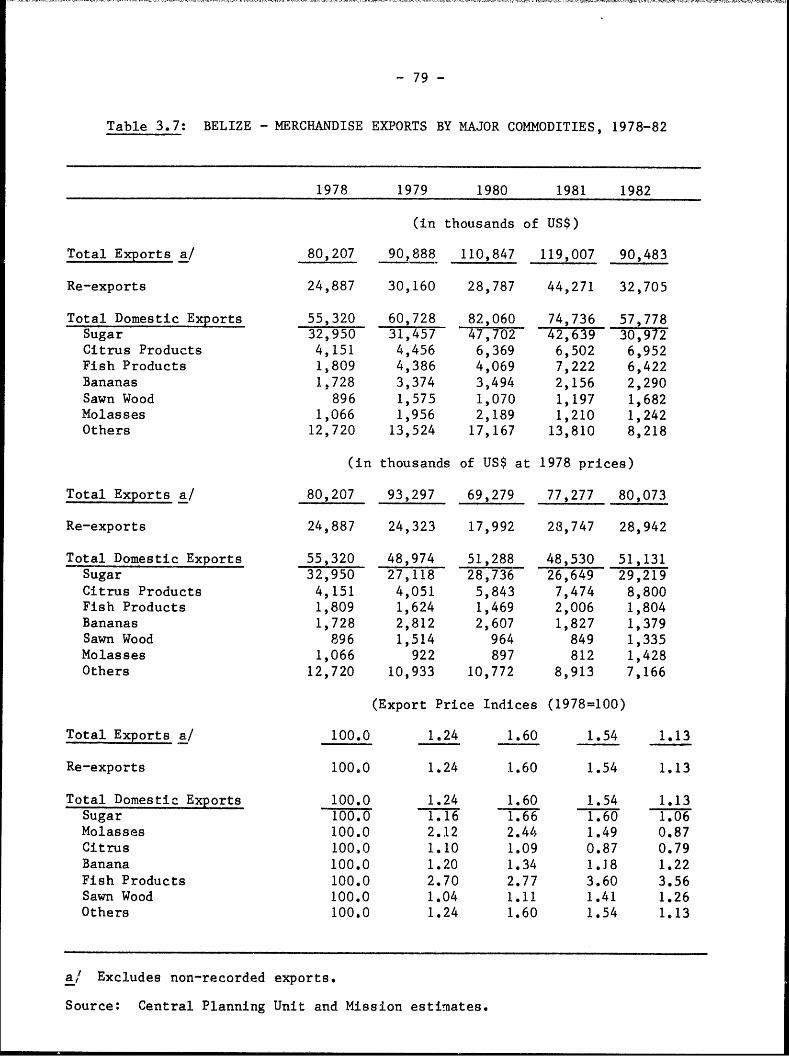
- 79 -
Table 3.7: BELIZE - MERCHANDISE EXPORTS BY MAJOR COMMODITIES, 1978-82
1978 1979 1980 1981 1982
(in thousands of US$)
Total Exports a! 80,207 90,888 110,847 119,007 90,483
Re-exports 24,887 30,160 28,787 44,271 32,705
Total Domestic Exports 55,320 60,728 82,060 74,736 57,778Sugar 32,950 31,457 47,702 42,39 0,72Citrus Products 4,151 4,456 6,369 6,502 6,952Fish Products 1,809 4,386 4,069 7,222 6,422Bananas 1,728 3,374 3,494 2,156 2,290Sawn Wood 896 1,575 1,070 1,197 1,682Molasses 1,066 1,956 2,189 1,210 1,242Others 12,720 13,524 17,167 13,810 8,218
(in thousands of US$ at 1978 prices)
Total Exports a! 80,207 93,297 69,279 77,277 80,073
Re-exports 24,887 24,323 17,992 28,747 28,942
Total Domestic Exports 55,320 48,974 51,288 48,530 51,131Sugar 32,950 27,118 28,736 26,649 29,219Citrus Products 4,151 4,051 5,843 7,474 8,800Fish Products 1,809 1,624 1,469 2,006 1,804Bananas 1,728 2,812 2,607 1,827 1,379Sawin Wood 896 1,514 964 849 1,335Molasses 1,066 922 897 812 1,428Others 12,720 10,933 10,772 8,913 7,166
(Export Price Indices (1978=100)
Total Exports a! 100.0 1.24 1.60 1.54 1.13
Re-exports 100.0 1.24 1.60 1.54 1.13
Total Domestic Exports 100.0 1.24 1.60 1.54 1.13Sugar 100.0 1.16 1.66 1.60 1.06Molasses 100.0 2.12 2.44 1.49 0.87Citrus 100.0 1.10 1.09 0.87 0.79Banana 100.0 1.20 1.34 1.18 1.22Fish Products 100.0 2.70 2.77 3.60 3.56Sawn Wood 100.0 1.04 1.11 1.41 1.26Others 100.0 1.24 1.60 1.54 1.13
a! Excludes non-recorded exports.
Source: Central Planning Unit and Mission estimates.

Table 3.8: BELIZE - ACTUAL AND PROJECTED BALANCE OF PA!MENTS(US$ million)
Actual Est. Projected1981 198 93 1984 1985 1986 1987 1968 1989 1990 1995
Exports 145.90 114.40 108.16 128.04 146.38. 162.07 178.71 199.23 220.66 243.30 397.00lsports 175.90 149.10 143.62 159.30 176.50 194.40 214.71 236.10 258.73 282.30 457.29Resource Balance -30.00 -34.70 -35.46 -31.26 -30.12 -32.33 -36.01 -36.87 -38.06 -39.01 -60.28Net Fac. Incomue P. -3.90 -3.70 -6.27 -7.57 -8.32 -8.33 -9.13 -9.56 -10.62 -12.27 -22.84Interest 1.40 1.30 3.27 4.47 4.52 4.33 4.43 4.66 5.02 5.97 14.84Dividends/Roy 2.20 2.10 2.50 2.50 3.00 3.00 3.50 3.50 4.00 4.50 6.00Foreign Work 0.30 0.30 0.50 0.60 0.80 1.00 1.20 1.40 1.60 1.80 2.00RemittancesTransfers 11.80 13.20 15.00 16.28 17.50 18.55 19.66 20.84 22.09 23.41 31.33Current Account -22.10 -25.20 -26.73 -22.55 -20.95 -22.11 -25.48 -25.59 -26.59 -27.86 -51.80Grants 5.70 7.50 6.50 7.00 4.00 4.00 4.00 5.00 4.00 3.00 2.00
Net Public Cap. 7.00 ]3.90 11.38 8.53 11.13 9.45 11.43 10.70 11.60 17.46 27.08D'isburement 8.50 15.60 17.50 16.00 19.00 18.00 20.50 17.50 19.00 25.00 50.50Amortization 1.50 1.70 6.12 7.47 7.87 8.55 9.07 6.80 7.40 7.54 23.42 0Private Capital 7.30 3.20 5.25 7.02 7.12 9.76 10.05 9.89 ' 10.99 9.40 22.72
Reserves Changes 2.10 0.60 3.60 0.00 -6.00 -3.00 0.00 0.00 0.00 -2.00 0.00(Increase)
Reserves Level 10.13 9.53 5.93 5.93 11.93 14.93 14.93 14.93 14.93 16.93 26.93
Reserves level/Imports 0.69 0.77 0.50 0.45 0.81 0.92 0.83 0.76 0.69 0.72 0.71
Current Account/GDP 0.13 0.16 0.16 0.12 0.10 0.09 0.10 0.09 0.08 0.08 0.06
Source: Mission estimates

- 81 -
Table 3.9: BELIZE - EXPORT PROJECTIONS(US$ million)
1981 1982 1983 1984 1985 1986 1987 1988 1989 1990 1995
VolumeSugar 42.60 43.68 47.05 51.83 51.83 51.83 51.83 51.83 51.83 51.83 51.83Citrus 6.50 7.14 7.49 7.94 8.42 8.92 9.46 10.03 10.63 11.27 15.08Fish 7.20 6.15 6.46 6.85 7.33 7.78 8.27 8.78 9.32 9.90 13.89Bananas 2.10 2.46 2.58 3.10 3.87 4.84 5.57 6.40 '7.36 8.47 16.94Other 16.30 11.14 11.70 12.40 13.64 15.69 18.04 20.75 22.83 24.88 33.92Total Mr 74.70 70.57 75.29 82.13 85.10 89.07 93.17 97.79 101.97 106.35 131.65NFS 10.50 10.45 10.97 11.63 12.44 13.31 14.25 15.24 16.31 17.78 26.84Reexport 44.30 32.54 18.77 18.77 18.73 18.69 18.65 18.44 18.23 18.36 19.04NonRecor 16.40 13.11 10.33 8.73 3.43 3.01 2.13 1.34 0.63 0.00 0.00Total-GN 145.90 126.89 115.36 121.26 119.70 124.09 128.20 132.81 137.14 142.49 177.53
PricesSugar 100.00 70.97 76.40 95.01 122.66 130.06 137.09 145.38 155.01 165.97 225.42Citrus 100.00 96.70 100.00 107.00 114.10 115.16 116.22 117.28 118.34 119.40 157.16Fish 100.00 104.00 110.20 118.50 126.80 134.41 142.47 151.02 160.68 169.69 227.08Bananas 100.00 93.52 94.76 101.97 109.73 114.62 119.72 125.05 130.61 136.42 166.38Other 100.00 100.50 106.53 114.52 122.54 131.11 140.29 151.51 163.64 173.45 232.12Total Kr 100.00 81.90 86.96 101.34 121.56 128.29 135.03 142.98 151.82 160.78 211.91NFS 100.00 100.50 107.03 116.67 125.42 132.94 140.92 149.37 158.33 167.83 224.60Reexport 100.00 100.50 107.03 116.67 125.42 132.94 140.92 149.37 158.33 167.83 224.60Nonrecor 100.00 100.50 107.03 116.67 125.42 132.94 140.92 149.37 158.33 167.83 224.60Total-GN 100.00 90.15 93.76 105.59 122.28 130.61 139.40 150.01 160.00 170.75 223.62
ValueSugar 42.60 31.00 35.95 49.25 63.58 67.41 71.06 75.35 80.35 86.03 116.84Citrus 6.50 6.90 7.49 8.50 9.61 10.28 10.99 11.76 12.58 13.45 23.69Fish 7.20 6.40 7.12 8.12 9.29 10.46 11.78 13.26 14.92 16.80 31.53Bananas 2.10 2.30 2.45 3.16 4.25 5.55 6.67 8.01 9.62 11.55 28.18Other 16.30 11.20 12.47 14.20 16.72 20.57 25.31 31.44 37.35 43.16 78.74Total Mere 74.70 57.80 65.47 83.23 103.45 114.27 25.81 139.82 154.82 170.99 278.98NFS 10.50 10.50 11.69 13.32 15.67 19.29 23.73 29.48 35.02 40.46 73.82Re-Export 44.30 32.70 20.00 21.50 22.96 24.51 26.17 27.94 29.83 31.85 44.20Non-Recor 16.40 13.40 11.00 10.00 4.30 4.00 3.00 2.00 1.00 0.00TOTAL GNS 145.90 114.40 106.16 128.04 146.38 162.07 178.71 199.23 220.66 243.30 397.00
Source: Mission estimates

Table 3.10: BELIZE - IMPORT PROJECTIONS(US$ million)
1981 1982 1983 1984 1985 1986 1987 1988 1989 1990 1995
ValueFood 40.00 43.17 43.08 42.65 42.65 43.07 43.94 45.25 46.61 48.01 54.05Fuel 25.60 24.86 24.86 25.35 26.11 27.16 28.25 29.38 29.96 30.56 36.8-3Other 52.00 45.87 47.25 49.14 51.59 54.17 56.88 58.59 60.35 61.55 76.33
Total Mer- 117.60 113.89 115.18 117.14 120.36 124.41 129.06 133.22 136.93 140.12 167.21chandise
Re-export 44.30 32.54 18.69 18.43 18.30 18.44 18.57 18.71 18.84 -18.98 19.68NFS 14.00 10.35 10.76 11.30 11.87 12.58 13.33 14.13 14.98 '15.73 19.69
TOTAL-GNS 175.90 156.78 144.63 146.87 150.53 155.42 160.96 166.06 170.75 174.83 206.58
PricesFood 100.00 83.17 87.13 94.53 101.62 107.72 114.19 121.04 128.30 136.00 181.99Fuel 100.00 96.55 96.55 106.39 117.23 127.93 139.62 152.36 166.27 181.45 268.97Other 100.00 100.50 107.03 116.67 125.42 132.94 140.92 149.37 158.33 167.83 224.60
Total Her- 100.00.- 93.07 97.33 106.38 115.21 123.12 131.53 140.41 149.85 159.90 220.60chandise
Re-export 100.00 100.50 107.03 116.67 125.42 132.94 140.92 149.37 158.33 167.83 224.60NFS 100.00 100.50 107.03 116.67 125.42 132.94 140.92 149.37 158.33 167.83 224.60
TOTAL-GNS 100.00 95.10 99.30 108.47 117.25 125.08 133.39 142.18 152.53 161.47 221.36
ValuesFood 40.00 35.90 37.53 40.32 43.34 46.40 50.17 54.77 59.80 65.29 98.38Fuel 25.60 24.00 24.00 26.97 30.61 34.75 39.44 44.76 49.82 55.46 99.05Other 52.00 46.10 50.57 57.33 64.71 72.02 80.15 87.52 95.55 103.30 171.44
Total Mer- 117.60 106.00 112.10 124.62 138.66 153.17 169.76 187.05 205.18 224.05 368.86chandise
Re-export 44.30 32.70 20.00 21.50 22.96 24.51 26.17 27.94 29.83 31.85 44.20NFS 14.00 10.40 11.52 13.18 14.88 . 16.72 18.79 21.11 23.72 26.40 44.23
TOTAl-GNS 175.90 149.10 143.62 159.30 176.50 194.40 214.71 236.10 258.73 282.30 457.29
Source: Mission estimates

Table -3.11: BELIZE - SUGAR: EXPORT PROJECTION(US$ million)
1982 1983 1981. 1985 1986 1987 1988 1989 1990 1995Volumne (Ta)
UK/EEC 41.0 41.0 41.00 '41.00 41.00 41.00 41.00 41.00 41.00 41.00USA 39.0 28.0 30.00 32.00. 32.00 32.00 32.00 35.00 35.00 35.00Other 15.0 33.0 39.00 37.00 37.00 , 37.00 37.00 34.00 34.00 34.00Total 95.0 102.0 110.00 110.00 110.00 110.00 110.00 110.00 110.00 110.00
Prices (US$/Tas) s/
UK/EEC 380.50 410.00 424.90 546.10 587.10 631.10 678.40 729.30 787.00 1,097.80USA 330.76 460.00 620.80 747.20 782.10 810.90 848.50 879.30 929.80 1,241.10Other 170.00 192.40 338.50 467.00 495.00 519.80 551.00 578.50 624.00 835.00Average 326.31 352.40 447.69 578.00 612.85 645.97 685.03 730.42 782.05 1,062.17
Value (US$ million)
UK/EEC 15.60 16.80 17.42 22.39 24.07 25.88 27.8 1 29.30 32.27 45.01USA 12.90 12.80 18.62 23.91 25.03 25.95 27.15 30.78 32.34 4.3.44Other 2.55 6.35 13.20 17.28 18.32 19.23 20.39 19.67 21.22 28.39I
Total 31.05 35.95 49.25 63.58 67.41 71.06 75.35 80.35 -86.03 116.84
a/ The asaumptions of projected pricea ate:1
(1) real price. for "Other" (free market) will increase until 1985 reashing in that year the level of 1981 and keeping that level from 1985 on;
(ii) USA prices for 1983, based on actual contract. as of March 1982. It is assumed that the ratio of US price. to free market prices will be, from 1985 on, the same as the oesprevailing in 1981 (since real prices in the free market are projected to return to the 1981 level); and
(iii) UK/EEC prices are projected to increase in line with prices for food products.
Source: isasion estimates.

Table 4.1: BELIEZE - EXTERNAL ASSISTANCE
US$ million
Total
*Year Grants Loans (Gross) Grants/Total (%)
1976 4.1 4.4 8.5 48.2
1977 4.1 5.4 9.5 43.2
1978 3.8 1100 14.8 25.7
1979 5.5 9.4 14.9 36.9
1980 2.9 9.1 12.0 24.2
1981 5.7 9.5 15.2 37.5
1982 7.5 15.6 23.1 32.5
Source: Mission estimates

- 85 -
Table 4.2: BELIZE - INTEREST RATE STRUCTURE OF EXTERNAL PUBLIC DEBTa!
Interest (%) % of total
0.00-3.99 -54.5
4.00-4.99 11.7
5.00-10.50 9.1
over 10.5 24.7-
average 5.8
a/ Based on commitments, January 1, 1970 - December 31, 1982.
Source: Mission estimates

. - 86 -
Tabel 4.3: BELIZE - EXTERNAL PUBLIC DEBT: MATURITY8/
Period (Years) % of total
0 - 5 0.3
5.1 - 10 24.4
10.1 - 15 9.1
15.1 - 20 11.8 .
20.1 - 25 29.5
over 25 24.9
average 21.9
a/ Based on commitments, January 1, 1970 December 31, 1982.
Source: Mision 6stimates

- 87 -
Table 4.4: BELIZE - DEBT SERVICEUS$ million
Debt Debt Servicea/Year Interest Amortization Service Ratio %1977 0.8 1.0 1.8 3.31978 1.1 0.5 1.6 2.41979 1.1 1.0 2.-1 2.91980 1.2 1.9 .3.1 3.31981 1.4 -1.5 2.9 3.41982 1.3 1.7 3.0 4.4
a/ Excludes re-exports and non-recorded exports.
Source: Mission estimates

- 88 -
Table 4.5: BELIZE - PROJECTIONS - CAPITAL INFLOWS TO THE PUBLIC SECTOR(US$ million)
Proj ec ted
Identified Sources Non-IdentifiedGrants and Loans
Year already committed Grants Conc. Loans Non-Conc.Loan Non-Concessional TOTAL
1983 20.4 - - 3.6 - 24.0'1984 6.8 7.0 5.8 3.4 - 23.01985 5.0 4.0 9.9 3.8 0.3 23.01986 3.1 4.0 11.0 3.2 0.7 22.01987 1.5 4.0 10.0 4.1 4.9 24.51988 0.9 5.0 7.0 5.6 4.0 22.51989 0.2 4.0 10.5 6.0 2.3 23.01990 - 3.0 8.0 6.5 10.5 28.01991 - 3.0 12.0 7.0 11.0 33.01992 - 2.0 7.5 10.0 18.5 38.01993 - 2.0 13.5 10.0 20.5 46.01994 - 2.0 11.5 12.0 24.0 49,51995 - 2.0 10.5 13.0 27.0 52.5
Source: Mission estimates.

- 89-
Table 4.6: BELIZE - PROJECTED PUBLIC DEBT SERVICE. (US$ million)
Debt. Service
Ratio0 a,Year Amortization Interest Total (%)
1983 6.1 3.3 9.4 12.21984 7.5 4.5 11.9 12.41985 7.8 4.5 12.3 10.41986 8.6 4.3 12.9 9.61987 9.1 4.4 13.5 '9.01988 6.8 4.7 11.5 7,01989 7.4 5.0 12.4 6.51990 7.5 6.0 13.5 6.41991 10.4 7.2 17.6 7.51992 12.5 9.1 21.6 8.31993 16.1 10.7 26.8 9.21994 19.4 12.8 32.2 10.11995 23.4 14.8 38.2 10.8
a/ Excludes re-exports.
Source: Mission estimates

Table 5.1: BELIZE - NATIONAL GOVERNMENT CURRENT EXPENDITURE, 1975-82/83(in millions of Bz$)
--------Calendar Year----- --- Fiscal Year b/--1975 1976 1977 1978 1979/80 a/ 1980/81 1981/82 1982/83c/
Current Expenditure 27.5 35.7 38.3 43.3 68.0 64.2 75.1 76.4
Current Budgetary Expenditure 27.3 35.5 38.1 42.5 67.0 63.0 73.9 75.2Wages and Salaries 13.8 16.6 18.0 19.5 24.7 27.8 33.9 37.3Goods and Services 9.2 11.7 13.6 15.6 31.8 25.0 24.1 20.3oInterest 0.6 0.8 1.1 1.4 3.2 3.0 4.7 5.0Pensions 1.8 2.0 2.2 2.7 3.9 3.3 4.3 4.7Transfers 1.9 4.4 3.2 3.3 3.4 3.9 6.9 7.9Rest of Public Sector (0.7) (1.2) (1.2) (1.5) (1.9) (1.9) (2.0) (2.3)Private Sector (1.2) (3.2) (2.0) (1.8) (1.5) (2.0) (3.6) (4.1)Social Security (-) (-) (-) (-) (-) (-) (1.3) (1.5)
Current Extra Budgetary Outlay d/ 0.2 0.2 0.2 0.8 1.0 1.2 1.2 1.2
a/ Fifteen month period (from January 1979 to March 1980).~5/ April to March.c/ Revised Estimate.
~/Expenditure of Official Charities Fund.
Sources: Ministry of Finance and Planning; Accountant General's Office; and mission estimates.

Table 5.2: BELIZE - NATIONAL GOVERNMENT CURRENT REVENUE, 1975-82/83(in millions of Bz$)
-- Calendar Year ----------- Fisal Year b/ ---1975 1976 1977 1978 1979/80 a/ 1980/81 1981/82 1982/83c1
Total Current Revenue 40.1 43.5 44.0 56.6 81.2 81.9 83.9 87.1
Current Budgetary Revenue 39.5 42.1 42.8 55.5 79.6 80.6 82.8 86.1Tax Revenue 32.5 35.5 36.2 48[.5 68.8 70.5 69.1 72.6Direct Taxes (10.2) (12.8) (12.2) (15.9) (19.3) (23.3) (14.6) (19.6)Import Duties (13.1) (15.6) (17.3) (23.0) (33.8) (30.7) (31.9) (31.0)Excise Taxes (2.4) (2.9) (2.9) (3.0) (4.0) (4.8) (6.4) ..(6.7)Licenses (0.8) (0.8) (0.8) (1.0) (1.8) (1.5) (1.6) (1.8)Other Tax Revenue (6.0) (3.4) (3.0) (5.6) (9.9) (10.2) (14.6) (13.5)Non-tax Revenue 7.0 6.6 6.6 7.0 10.8 10.1 13.7 13.5
Current Extrabudgetary Revenue d/ 0.6 1.4 1.2 1.1 1.6 1.1 1.1 1.0
a/ Fifteen month period (from January 1979 to March 1980).5/ April to March.T/ Revised Estimate.7/1 Revenue of Official Charities Fund.-
Sources: Ministry of Finance and Planning; Accountant General's Office; and mission estimates.
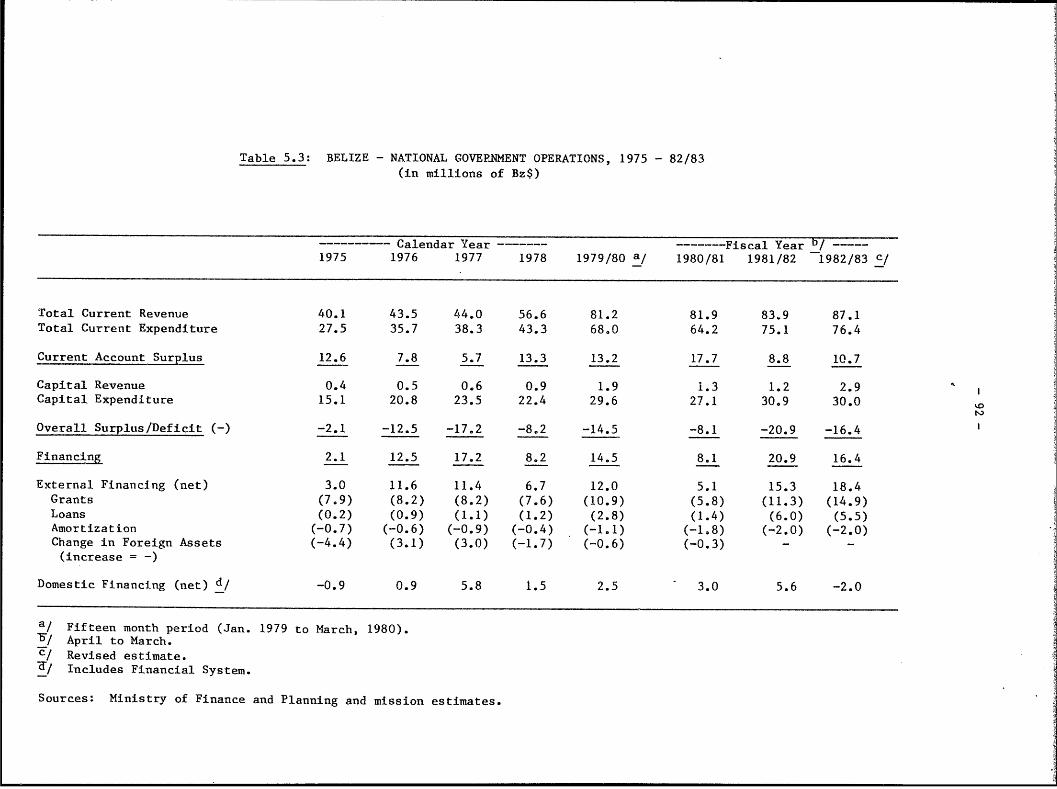
Table 5.3: BELIZE - NATIONAL GOVERNMENT OPERATIONS, 1975 - 82/83(in millions of Bz$)
------ Calendar Year ---- --- Fiscal Year by _1975 1976 1977 1978 1979/80 a/ 1980/81 1981/82 1982/83 c/
Total Current Revenue 40.1 43.5 44.0 56.6 81.2 81.9 83,.9 87.1Total Current Expenditure 27.5 35.7 38.3 43.3 68.0 64.2 75.1 76.4
Current Account Surplus 12.6 7.8 5.7 13.3 13.2 17.7 8.8 10.7
Capital Revenue 0.4 0.5 0.6 0.9 1.9 1.3 1.2 2.9Capital Expenditure 15.1 20.8 23.5 22.4 29.6 27.1 30.9 30.0
Overall Surplus/Deficit (-) -2.1 -12.5 -17.2 -8.2 -14.5 -8.1 -20.9 -16.4
Financin~g 2.1 12.5 17.2 8.2 14,5 8.1 20.9 16.4
External Financing (net) 3.0 11.6 11.4 6.7 12.0 5.1 15.3 18.4Grants (7.9) (8.2) (8.2) (7.6) (10.9) (5.8) (11.3) (14.9)Loans (0.2) (0.9) (1.1) (1.2) (2.8) (1.4) (6.0) (5.5)Amortization (-0.7) (-0.6) (-0.9) (-0.4) (-1.1) (-1.8) (-2.0) (-2.0)Change in Foreign Assets (-4.4) (3.1) (3.0) (-1.7) (-0.6) (-0.3) - -(increase =-)
Domestic Financing (net) d/ -0.9 0.9 5.8 1.5 2.5 3.0 5.6 -2.0
a/ Fifteen month period (Jan. 1979 to March, 1980).F/ April to March.c/ Revised estimate.
/~ Includes Financial System.
Sources: Ministry of Finance and Planning and mission estimates.

Table 5.4: BELIZE - FINANCING OF PUBLIC SECTOR INVESTMENT, 1975-82/83(in millions of Bz$)
------- Calendar Year ---- --- Fiscal Year bf.---1975 1976 1977 1978 1979/80 a/ 1980/81 1981/82 1982/83 C/
Public Sector Caital Expenditure 15.1 23.0 26.8 41.0 48.2 45.9 50.6 49.3Central Government 11.6 19.3 19.7 20.7 28.5 25.2 29.2 28.2Rest of Public Sector 3.5 3.7 7.1 20.3 19.7 20.7 21.4 21.1
Finane±ng - Total 15.1 23.0 26.8 41.0 48.2 45.9 50.6 49.3
Public Sector Savings 10.7 6.2 2.2 9.7 12.1 16.3 9.3 8.5
Capital Revenue 0.4 0.5 0.6 0.9 1.9 1.3 1.2 1.0
Net Domestic Borrowing -0.1 2.9 6.2 6.4 8.8 8.0 10.7 1.0Financial System -0.9 29 4.5 6.2 4.7 5.5 11.7 1.0Other 0.8 - 1.7 0.2 4.1 2.5 -1.0 -
Net External Financing 4.1 13.4 17.8 24.0 25.4 20.3 29.4 38.8Grants 7.9 8.2 8.2 7.6 10.9 5.8 11.3 14.9Loans 3.1 4.1 8.5 19.0 17.0 18.6 21.0 27.3Amortization -2.5 -2.0 -1.9 -0.9 -1.9 -3.8 -2.9 -3.4Change in Foreign Assets -4.4 3.1 3.0 -1.7 -0.6 -0.3 --
a/ Fifteen month period (Jan. 1979 to March 1980).F/ April to March.c/ Revised estimate.
Sources: Ministry of Finance and Planning; and mission estimates.

- 94 -
Table 5.5: BELIZE - ACTUAL AND PROJECTED NATIONAL GOVERNMENT SAVINGS, 1981/82 - 87/88
(In millions of Bz$)
Actual Estimate ____________________________
1981/82 1982/83 1983/84 1984/85 1985/86 1986/87 1987/8
Current Revenue 83.9 87.1 98.0 109.0 121.0 136.0 150.0Direct Taxes 14.6 19.6 . 22.0 25.0 27.0 30.0 33.0Indirect Taxes 54.5 53.0 58.0 64.0 71.0 80.0 88.0Non-tax Revenue 14.8 14.5 18.0 20.0 23.0 26.0 29.0
Current Expenditure 75.1 76.4 85.0 94.0 104.0 114.0 126.0Wages and Salaries 33.9 37.3 TT6TE 3.5~75 3,Goods and Services 24.1 20.3 23.0 26.0 29.0 31.0 34.0Other Expenditues 17.1 18.8 20.0 22.0 23.0 26.0 30.0
Current Account Surplus 8.8 10.7 13.0 15.0 17.0 22.0 24.0
Source: Mission estimates.

- 95 -
Table 5.6: BELIZE - ACTUAL AND PROJECTED FINANCING OF PUBLIC SECTORSINVESTENT FY1981/82-FY1987/88
(Bz$ million)
Actual Prelim. Projected
1981/82 1982/83 1983/4 1984/5 1985/6 1986/7 1987/8 total %
Uses
Capital Expenditures 50.6 49.3 50.0 52.0 56.0 60.0 66.0 284.0 78.5Amort.of Ext.Loans 2.9 3.4 12.0 15.0 16.0 17.0 18.0 78.0 21.5
Total 53.5 52.7 62.0 67.0 72.0 77.0 84,0 362.0 100.0
Sources
Public Savings 9.3 8.5 11.0 17.0 23.0 28.0 30.0 109.0 30.1Gross ExternalInflows 32.3 42.2 48.0 46.0 46.0 45,0 49.0 234.0 64.5
Net DomesticBorrowing 10.7 1.0 1.0 1.0 1.0 1.0 2.0 6.0 1.6
Capital Revenue 1.2 1.0 2.0 3.0 2.0 3.0 3.0 13.0 3.7
Total 53.5 52.7 62.0 67.0 72.0 77.0 84.0 362.0 100.0
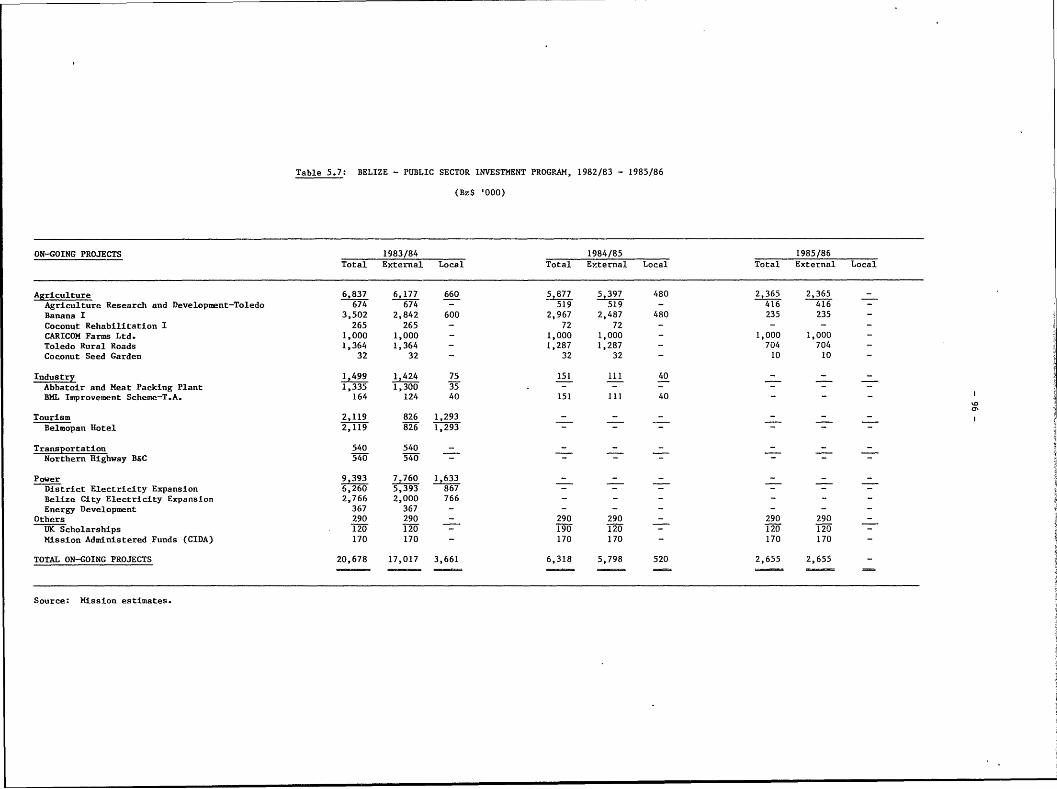
Table 5.7: BELIZE - PUBLIC SECTOR INVESTMENT PROGRAM, 1982/83 - 1985/86
(Bz$ '000)
ON-GOING PROJECTS 1983/84 1984/85 1985/86Total External Local Total External Local Total External Local
Agriculture 6, 837 6, 177 660 5,87 5, 397 480 2 X 2, 365 -Agriculture Reaearch and Development-Toledo 674 674 - -519 519 - 416 416 -Banana I 3,502 2,842 600 2,967 2,487 480 235 235 -Coconut Rehabilitation I 265 265 -72 72 - - - -CARICOM Fars Ltd. 1,000 1,000 - 1,000 1,000 -1,000 1,000 -Toledo Rural Roads 1,364 1,364 - 1,287 1,287 - 704 704 -Coconut Seed Garden 32 32 - 32 32 - 10 10 -
Indusry1,499 1,424 75 151 111 40 - - -Abbatoir and Meat Packing Plant 1,335 1,300 35 . -- - --BML Improvement Scheme-T.A. 164 124 40 151 111 40 - - -
Touriam 2,119 826 1,293 - -- - - -Belmopan Hotel 2,119 826 1,293 - - - - - -
Transportation 540 540 --Northern Highway B&C 540 540 -
Power 9,393 7,760 gDistrict Electricity Expansion 6,6 5,393 867-- - - - -Belize City Electricity Expansion 2,766 2,000 766 - - - ---Energy Development 367 367 -- - - - - -
Others 290 290 - 290 290 - 290 290 -UKScholarships 120 120 - 190 120 - 120 120 -Mission Administered Funds (CIDA) 170 170 - 170 170 - 170 170 -
TOTAL ON-GOING PROJECTS 20,678 17,017 3,661 6,318 5,798 520 2,655 2,655 -
Source: Mission estimates.

Table 5.7: BELIZE - PUBLIC SECTOR INVESTMENT PROGRAM, 1982/83 - 1985/86
(Bz$ '000)
NEW PROJECTS 1983/84 1984/85 1985/86Total External Local Total External Local Total External Local
Agriculture If962 500 3,774 2,57 1,20 6,200 4,548 1,5Agriculture Training School 150 150 500 500 --- -Crop Diversification - - - 400 300 100 1,600 1,292 308Toledo Rural Development Projects 812 812 - 1,274 674 600 1,800 1,286 514Central Belize Land Development Proj. -- -200 - 200 800 400 400Toledo Timber Project 500 - 500 1,000 800 200 1,000 800 200Rural/Industrial Growth Centre - - - 400 300 100 1,000 770 230
l{n-Hydro Scheme 0 030a5 3 1 2Hydro-Electricty Feaaibility Study -- - 100 50 50 100 50 SOPower Project I - - 13,740 7,500 6)240 23,700 12,600 11,100
TRad Maneance & Rehabilitation 1,2 ,2 ,0 230 1,0 000 1,0
C i zei Inrnational Airport Terminal-- --- 1,0 150 -Airport Navigational Equipment 720 720 --- ---
eize City Hospital - - . ~21 0Hospital Equipment 160 160 - 160 160 -- -Renovation of Health Centera 66 60 6 88 80 8 96 84 12Public Health Vehicles 160 160 - 160 160 - ---
Water and Severage g 3,200 3,2 g 5,200 1,000 4,00 3,20 1,0Belize City Water & Sewerage System II 6,120 3,000 3,120 6,000 5,000 1,000 4,000 3,000 1,000Rural Water Supply 200 200 - 200 200 - 200 200 -
Education g I,20 260 5,760 5,090 670 5,311 6,251 1,6Museum Archives 400 400 - 250 250 - - - -Expansion of Belize Junior Secondary School 400 200 200 1,000 1,000 - 400 400 -Vocational Training Center 200 200 - 400 400 - - - -Public Sector Training Center-- - - - - - - -Primary School Teachera ' Housea - - - 240 200 40 340 300 40Expanaion of Rural Education and AgricultureProgram (REAP) 110 100 10 110 100 10 20 20 -Expansion of the Belize College of Arta,Sciencea & Technology (BELCAST) 240 200 40 3,600 3,000 600 4,000 3,000 1,000National Vocational Training 110 100 10 160 140 20 160 140 20Educational Television Project - - - - -- 391 391 -
Hosng Development5,0 2,0 2,02,0 100 10080 20Sites & Services 488 488 - - - - - -
Others 2,116 2 113 3 550 550 - --
TOTAL NEW PROJECTS 29,322 18,983 10,339 45,682 35,250 10,432 53,345 37,874 15,498sumary
Total of Ongoing and New Projects 50,000 36,000 14,000 52,000 41,048 10,952 56,000 40,502 15,498

- 98 -
Table 5.8: BELIZE - IMPORT DUTY: ACTUAL AD-VALOREM RATE, 1979-81
(%)
Years1979 1980 1981
Food 8.1 7.6 8.1
Beverages and Tobacco 161.9 192.3 190.1
Crude Materials 1.7 1.8 2.8
Fuel 23.1 14.1 17.3
Animals and Vegetable Oil 26.8 31.3 53.6
Chemicals 13.8 15.4 12.9
Manufactured Goods 13.5 11.8 12.2
Machinery 13.8 12.8 11.9
Miscellaneous Manufactured Goods 14.1 12.7 17.5
Miscellaneous Commodities 7.1 2.6 -
Average Total 17.3 15.4 16.9
Source: Mission estimates.

- 99 -
Table 6.1: BELIZE - CONSOLIDATED ACCOUNTS OF THE FINANCIAL SYSTEM,'1976-82 a,
(in millions of Bz$ - December 31)
1976 1977 1978 1979 1980 1981 18b
Net InternationalAssets 3.4 10.6 24.8 11.8 13.8 7.9 5.6
Domestic Credit 66.3 66.9 77.2 97.2 110.3 133.9 144.4To Government 3.7 7.8 12.2 12.6 20.2 29.2 37.9To Rest of PublicSector 4.0 4.4 6.2 8.1 7.4 8.8 9.8
. Total Public Sector 7.7 12.2 18.4 20.7 27.6 38.0 47.7Private Sector 58.6 54.7 58.8 76.5 82.7 95.9 96.7
Money & Quasi-Money 69.7 77.5 102.0 109.0 124.1 141.8 150.0M1c/ 21.8 25.1 37.3 38.4 42.8 42.1 42.2M2aT/ 50.1 49.1 57.8 60.2 68.4 82.3 90.4Other Items (net) -2.2 3.3 6.9 10.4 12.9 17.4 17.4
a! Includes Monetary Authority and commercial banks.b/ June 1982.c/ Currency with Public and Demand Deposits.d/ Savings and Time Deposits.
Source: Central Bank.

- 100 -
Table 6.2: BELIZE - CHANGES IN FOREIGN ASSETS, CREDIT AND LIABILITIESTO PRIVATE SECTOR, 1977-82
(in millions of Bz$)
Year FA C C(a) C(b) LP
1977 7.2 0.6 4.5 -3.9 7.81978 14.2 10.3 6.2 4.1 24.51979 -13.0 20.0 2.3 17.7 7.01980 2.0 13.1 6.9 6.2 15.11981 -5.9 23.6 10.4 13.2 17.7
192/-2.3 10.5 9.7 0.8 8.2
a! June 1982 - December 1981.
FA - Increase in Foreign Assets.C - Increase in Domestic Credit.
C(a) - Increase in Domestic Credit to the Public Sector.C(b) - Increase in Domestic Credit to the Private Sector.LP - Increase in Liabilities to Private Sector,
Source: Central Bank.

- 101 -
Table 6.3: BELIZE - CHANGES IN NET FOREIGN ASSETS, 1977-82
(in millions of Bz$)
Year FA PA(a) FA(b)
1977 7.2 3.2 4.01978 14.2 8.5 5.71979 -13.0 -4.4 -8.61980 2.0 4.6 -2.61981 -5.9 -3.6 -2.31982a/ -2,3 -0.3 -2.0
a! June 1982 - December 1981.
FA -Total increase in foreign assets.FA(a) -Total increase in foreign assets held by the Monetary
Authority (now Central Bank),FA(b) -Total increase in foreign assets held by the commercial
banks.
Source: Central Bank.

- 102 -
Table 6.*4: BELIZE - COMMIERCIAL BANKS - DISTRIBUTION OF LOANS AND ADVANCES,1976-82
1976 1977 1978 1979 1980 1981 18a
Government Services 5.1 0.6 - 2.3 2.7 3.8 6.4
Public Utilities 1.9 1.8 1.6 0.9 0.2 0.8 0.9
Agriculture 33.5 28.0 27.9 27.1 26.2 22.1 21.7
Manufacturing 8.7 13.5 11.1 11.9 13.6 10.9 10.7
Building & Construction 6.8 10.0 11.1 10.63 10.1 10.9 10.2
Distribution 28.4 22.8 22.9 27.2 27.4 33.3 32.5
Personal Loans 8.5 11.3 11.6 10.8 10.4 10.0 9.8
Other 7.1 12.0 13.8 9.0 9.4 8.2 7.8
Total 100.0 100.0 100.0 100.0 100.0 100.0 100.0
a! June 1982.
Source: Central Bank.

- 103 -
Table 6.5: BELIZE - DOMESTIC CREDIT, 1977-82
(in millions of Bz$)
dC /CYear diC C (%)
1977 0.6 66.3 0.91978 10.3 66.9 15.41979 20.0 77.2 25.91980 13.1 97.2 13.51981 23.6 110.3 21.41982 10.5a/ 133.9 7.8
a! June 1982 - December 1981.
dC -Increase in Domestic Credit,
C -Domestic Credit of the previous year.
Source: Central Bank.

Table 7.1: BELIZE - SUGAR PRODUCTION AND USE, 1971-1981
(In long tons)
1971 1972 1973 1974 1975 1976 1977 1978 1979 1980 1981
A. Total Sugar Production 64,851 69,967 70,170 88,897 82,874 61,99 91,853 113,555 98,600 103,276 97,725
B. Exports 61,251 66,202 65,773 83,725 77,699 55,705 85,049 107,596 91,412 97,115 90,4241. To UK 20,500 24,444 20,500 28,900 37,419 43,170 46,325 41,229 40,973 .35,248 41,5262. USA 12,774 34,408 41,648 54,825 40,280 12,535 38,724 66,367 50,439 61,867 48,8983. Canada 27,977 7,350 3,625 - - - - - - - -
C. Domestic Consumption 3,401 3,517 4,017 4,755 4,870 5,607 5,854 4,820 6,505 6,152 7,125
D1, Claims 4 - 133 4 136 127 338 896 230 37 -
E. Store Differences 195 248 247 413 169 360 612 243 453 (28) 176
a! EEC from 1975.
Source: Central Planning Unit.

Table 7.2: BELIZE - CANE DELIVERIES TO THE SUGAR FACTORIES, SUGAR AND MOLASSES PRODUCTION, 1971-1981
1971 1972 1973 1974 1975 1976 1977 1978 1979 1980 1981A. Cane Deliveries (lang tons) 632, 629 g 718, 231 824, 074 783, 118 607, 022 935, 626 1, 123, 145 989, 258 1,03 5 970, 100
1. To Corozal Factory 329, 681 364,67 383,0OS6 407, 855 364, 448 303, 953 403, 276 4 55,0O20 445, 364 412, 144 395, 585a. By Corozal District 328,435 362,641 383,056 407,855 364,448 303,953 403,276 4,24 443,299 412,144 395,585b. By Orange Walk District 1,246 2,226 296 2,0652. To Tower Hill Factory 30,98 302,786 335,175 416,219 418,670 303,6 532,350 668,125 543,894 601,311 574,515a. By Corozal District 59,753 94,358 64,994 134,055 120,258b. By Orange Walk District 302,948 302,786 335,175 416,219 418,670 303,069 472,597 573,767 478,900 467,256 454,257
B. Sugar Production (long tons) 64,851 69,967 70,170 88,89 82,874 61,799 91,853 113,555 98,600 103,276 901. At Corozal Factory 35,923 39,503 38,779 44,956 40,474 31,506 43,661 50,385 47,392 42,285 41,3452. At Tower Hill Factory 28,928 30,464 31,391 43,941 42,400 30,293 48,192 63,170 51,208 60,991 56,380
C. Molasses Production (long tons) 22, 960 24 3j 26, 130 g 28,068 20 29, 597 36,113 2 32, 278 31, 9801. At Corozal Factory 12, 262 13, 406 13, 167 12, 684 12, 583 10, 155 10, 666 13, 182 12, 697 12, 713 12, 8912. At Orange Walk Factory 10,698 11,115 12,963 14,358 15,485 10,594 18,931 23,931 20,263 19,565 19,089
Source: Central Planning Unit.

- 106 -
Table 7.3: BELIZE - CITRUS PRODUCTION,1955/56 - 1981/82
(boxes)
Grapefruit OrangesCrop Year (boxes of 80 ibs) (boxes of 90 lbs)
1955/56 265,015 155,2051956/57 115,941 93,2931957/58 182,554 195,4051958/59 197,493 281,6881959/60 217,393 477,275
1960/61 260,954 717,6901961/62 106,109 44,3871962/63 172,640 757,5771963/64 267,743 858,6101964/65 243,073 856,264
1965/66 247,627 952,0641966/67 235,904 699,5451967/68 233,433 733,8381968/69 281,310 849,1661969/70 256,749 558,454
1970/71 375,842 924,6521971/72 421,049 894,1171972/73 390,483 971,1371973/74 427,321 1,100,9961974/75 530,953 905,873
1975/76 407,060 802,1601976/77 237,902 633,4571977/78 301,467 685,9851978/79 187,597 567,6881979/80 408,399 1,109,041
1980/81 586,073 1,062,8051981/82 702,817 1,065,377
Source: Central Planning Unit and Citrus Growers Association.
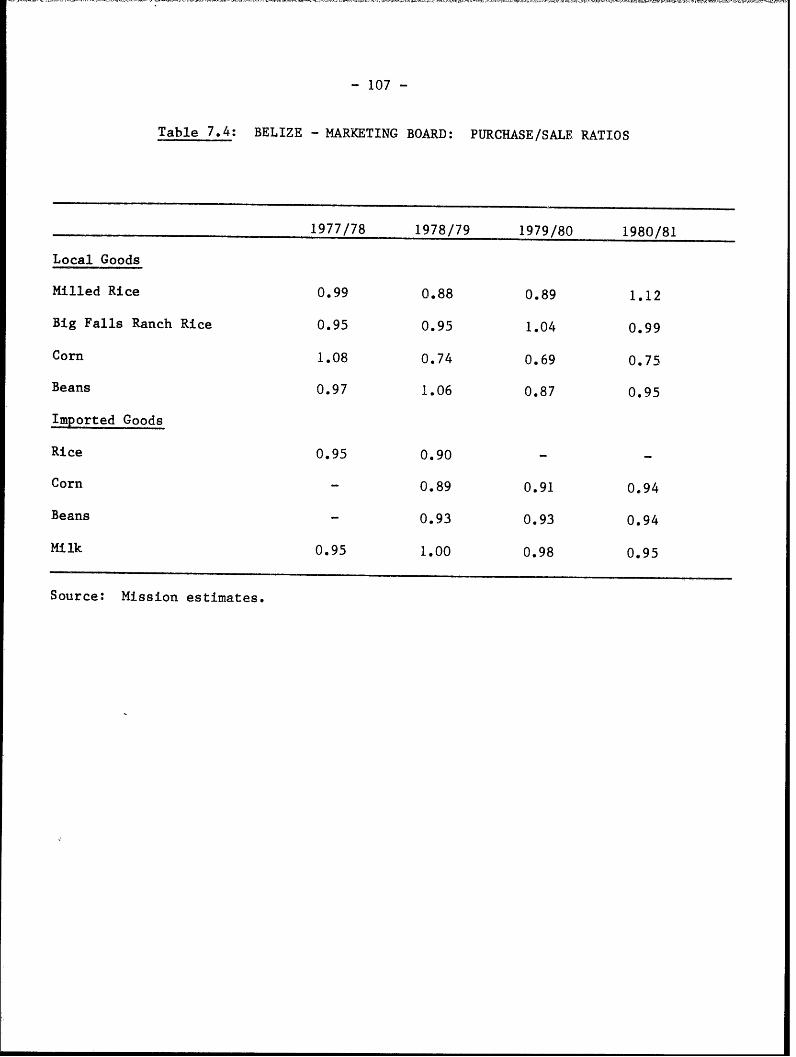
- 107 -
Table 7.4: BELIZE - MARKETING BOARD: PURCHASE/SALE RATIOS
1977/78 1978/79 1979/80 1980/81
Local Goods
Milled Rice 0.99 0.88 0.89 1.12
Big Falls Ranch Rice 0.95 0.95 1.04 0.99
Corn 1.08 0.74 0. 69 0. 75
Beans 0.97 1.06 0.87 0.95
Imported Goods
Rice 0.95 0.90--
Corn - 0.89 0.91 0.94
Beans - 0.93 0.93 0.94
Milk 0.95 1.00 0.98 0.95
Source: Mission estimates.

Table 7.5: BELIZE - PRODUCTION OF MAIN AGRICULTURAL COMMODITIES, 1970-1981
1970 1971 1972 1973 1974 1975 1976 1977 1978 1979 1980 1981
Rice Paddy ('000 lbs.) 7,700 10,026 12,785 18,000 16,600 10,700 13,798 18,935 14,000 14,700 19,000 23,900Corn ('000 lbs.) 35,000 35,000 32,209 35,500 28,200 23,000 40,000 37,600 43,000 34,000 41,500 47,000Beans ('000 lbs.) 5,174 4,050 2,490 2,500 2,750 2,500 2,400 24210 2,160 2,240 3,073 3,800
Bananas ('000 42 lb. boxes) - - - - - 30,780 357,736 547,812 519,812 842,419 784,885 549,000Oranges ('000 90 lb. boxes) 558 925 894 971 1,101 801 802 633 686 568 1,109 1,063Grapefruit ('000 80 lb. boxes) 257 376 421 390 427 535 407 238 301 188 408 SRF
Honey ('000 lbs.) n.a. n.a. 185 292 364 298 655 368 416 493 496 478
Cattle slaughtered (no.) 3,310 4,390 5,004 6,886 5,670 5,798 6,000 6,300 7,276 7,100 6,600 6,400Dressed weight ('000 lbs.) 1,045 1,500 1,694 2,265 1,908 1,805 2,079 2,472 2,577 2,562 2,310 2,216
Pigs slaughtered (no.)a/ 6,542 8,526 9,902 9,439 5,795 5,925 4,163 5,693 7,104 6,864 6,490 5,212Dressed weight ('000 lbs.) 448 729 891 652 426 451 371 546 764 659 487 365
Sugar cane ('000 long tons) 676 633 668 718 824 783 607 936 1,123 989 1,014 970Molasses ('000 long tons) 26 23 25 26 27 28 20 30 40 32 32 32Sugar ('000 long tons) 66.8 64.9 70.0 70.2 88.9 82.9 61.8 91.9 113.5 98.6 103.3 97.7Sugar per acre (tons) 2.2 2.2 2.1 2.1 2.2 1.7 1.2 1.7 1.9 1.6 1.7 1.6Tons Cane/Tons Sugar 10.1 9.8 9.5 10.2 9.3 9.5 9.8 10.2 9.9 10.0 9.8 9.9
Timber ('000 bd. ft.) n.a. n.a. n.a. n.a. n.a. 9,799 7,583 6,283 8,180 9,333 9,500
a! Slaughterhouse figures represent about 30-40% of the total.
Source: Central Planning Unit.

- 109 -
Table 7.6: BELIZE - CITRUS FROCESSING BY COMPANY, 1980/81 - 1981/82(Boxes)
Citrus of Citrus ofTOTAL Processors Growers
1981/82 1980/81 1981/82 1980/81 1981/82 1980/81
I. INDUSTRY TOTALS
a) Oranges (boxes of 90 lbs.) 1,065,377 1,062,805 572,555 586,874 492,822 475,931b) Grapefruit (boxes of 80 lbs.) 702,817 586,073 159,481 136,585 543,336 449,488c) Total Citrus 1,768,194 1,648,878 732,036 723,459 1,036,158 925,419II. CITRUS COMPANY OF BELIZE
a) Oranges (boxes of 90 lbs.) 479,745 381,508 297,348 264,604 182,397 116,904b) Grapefruit (boxes of 80 lbs.) 362,467 210,282 117,573 74,362 244,394 135,920c) Total Citrus 842,212 591,790 414,921 338,966 427,291 252,824III. BELIZE FOOD PRODUCTS
a) Oranges (boxes of 90 lbs.) 585,632 681,297 275,207 322,270 310,425 359,027b) Grapefruit (boxes of 80 lbs.) 340,350 375,791 41,908 62,223 298,442 313,568e) Total Citrus 925,982 1,057,088 317,115 384,493 608,867 672,595
Source: Central Planning Unit and Citrus Growers Association.

- 110 -
Table 7.7: BELIZE - INDUSTRIAL PRODUCTION, 1975-81
1975 1976 1977 1978 1979 1980 1981
Cigarettes (million) 91.7 85.1 73.0 68.8 62.8 63.4 68.3
Beer ('000 gal) 807 812 909 642 731 689 889
Batteries (number) 2,500 2,200 3,000 3,156 3,431 4,100 4,500
Flour ('000 lb) 6,700 14,000 15,886 15,157 15,821 14,554 9,100
Fertilzer (short tons) 4,475 3,263 3,275 3,275 3,210 3,002 3,125
Nails ('000 lb) -- 128 223 321 345 301 308
Roofing ('000 lb) -- 87 380 753 758 579 592
Garments ('000) 879 1,128 1,400 1,238 1,400 1,600 1,200
Fish Products ('000 lb) 1,493 1,204 910 841 847 699 925
Source: Central Planning Unit.

- 111 -
Table 7.8: BELIZE - TOURIST STATISTICS, 1975-81
1975 1976 1977 1978 1979 1980 1981
Tourists (long/short
stay) 54,598 52,694 54,633 59,911 61,712 63,735 62,262
originUnited Kingdom 2,255 3,017 1,432 1,693 1,524 2,421 1,496Europe 3,288 2,274 5,424 8,448 5,186 3,985 5,172United States 18,734 16,590 18,255 19,823 20,172 9,187 18,057Canada 2,783 2,584 2,913 3,346 2,990 2,249 2,046Other 27,538 28,229 26,609 26,601 31,840 25,895 35,491
ArrivalsBy sea 1,426 513 833 948 860 766 536By air 22,796 17,411 28,142 31,056 20,749 19,625 17421Overland 30,376 34,770 25,658 27,907 40,103 43,344 44,305
Long stay visitors,3 nights or over 34,511 31,825 35,645 40,957 34,442 41,528 40,568Short stay visitors,under 3 nights 20,082 20,869 18,988 18,954 27,270 22,207 21,294
Cruise ship passengers 3,293 8,779 439 676 2 23 .
Grand total (long/short
stay and cruise shippassengers) 57,891 61,473 55,072 60,587 61,714 63,735 62,263
Number of touristnights ('000)a/ 305.1 294.2 306.9 344.2 322.9 357.3 349.1
Tourism receipts(US$'000) 2,400 2,750 3,850 4,500 6,700 7,000 7,500
a! Estimated on basis of seven nights for long stay visitors,three nights for short stay ,visitors and one night for cruise shippassengers.
Source: Tourist Board.

World Hank
of Related
Interest
Bangladesh: Current Trends arclua rwh fesrci- Bai:Itgaeand Development Issues medtosfrplcchne.DvomntfteCarl A. B. Jayarajah, 18.29pgs(nldn ne, NrhetFotechief of mission, and others saitclapni) ensJ aa,cifoProvides an update on currentISN0521.ISN08100-4 miso,adthrdevelopment with emphasis on rural $0pprak onsotta h rzla otwsand Industrial development and hsteptnilt eoeadomestic resource mobilization and Ipratarclua n ibrsuggests that more funds should be rzl ua eore rdcigrgo,a ela lcchanneled Into agriculture, education,SpcaReotwremgnsfomthratsohealth, and population control. PtrT ih,msincif h onr a epoutvl n
March 1979. x + 116 pages (Including . iad .Mrn euycif eraetystldo ml-clmap, annexes, ofthprgiensduretlxoe)f hStock flo. RC-7904. $5.00 paperback. Dicsethdoiatptenof hgprrtesfteBazlngvr-
Agricsdeogahiulttryadrhe met.Otlneodveomctilasso
Revew cagricua,lttougureaBazlinetrnformacilncdiatos;aneconmychsegownlwicBasaastas cnsierscssustardercammnda
Bail:a Rtetinisgi to thruraio,tegothpoes tonleae th dnifcto nArdticltual Poeen ecnoihwlar adbaiajesoetlmet adonirolna
Reviews ~~~~~~~agricultural pefrac n aifcinagrwh vafrios peoum- coerspoliiesir razl i recnt ecaes. tendatops that policie t ihn esePatIulr ttntonIsgientorual prdutiit otsdeth1mden8un.181259+10 pages (incluingdnnex
credI, whch hs bee themajo t~i sectorfthe appenomix). rcil ane)
usd yth gvrnen o rooe o ciein or eutalescl- tckNo C-1$11$.0 paperback.
aceraing progr esnteovsio
inceasdcianciaepo inrbu
istiutionalh problmnns pterso
Bil's map gr4annexes). yanhotok to.g the 7909. $2000 ebcon-

The Commonwealth Carib- TeCnoo:Polm n hc a ealvae faddbbean: The Integration Popcso ml,Iln ioosefr nptoemepoaExperience adohr c~m inadarvso ftedmsiSidney E. CherrnnickMils aiend rie oic froeroeuhdrvaivs
Broad issues of regional integration msin n tesJl 99 vi+63pgs(nldwith special attention paid toDeciethprniafetrsoth irg4thialnex,saitclunemployment and mechanisms ecnmansumrzstemi apedx.ngshanSais.crucial to the success~ of such instru- scoa n tutia osrit o SokNs C70-,R-98Sments as the Caribbean Free Trade deeomn.otsta,ivewfis $200perckAssociation and the Caribbeanexrm port,heC ooswlCommon Market.reurasusailinowf
The Johns Hlopkins University Press, reoreantehilassacen Egp: cnmc1978. 536 pages (including appen- thfuueAsttsiaaneprvds aagmtinaPiodixes, statistical appendix, index),.oiladeooi aantihldhrmadohrLC 77-17246. ISBNf 0-8018-2089-8, ohrieaalbe$30.00 (221.00) hardcover; Tems ealdeaiaino hISBNY 0-8018-2090-1, $9.95 (f 7.00) Jl 99 i 7 ae icuig Eyta cnm oapa icpaperback. adSaih mhsso cnmcmngmn
Chile: An Economy in P-70-.$.0pprak h on okn nvriyPesTransition 18.44pgs(nldn ttsiaFred D). Levy, chief of mission, DoiiaReulcitapndxidx)and othersManEooiDeeo- L8052ISN01814,$.0Traces the development of the mn rbes(~95)hrcvrChilean economy since the Great IB 8121~,$15 ~.0Depression of the 1930s and empha- LisLna,cefomssn, percksizes economic policies and events of adohrthe 1970s and their effects on Chile's Noeth,dspeisacmlsheconomic prospects. Finds that the metintewyosaig,frgn ESlvd:Dmgapcultimate success of the governments ivsmn,tuim xot,ad Ise nrsetpolicies depends on its ability to grwho.rs oetc rdc 'rdDajdemonstrate that efficient resource (0',teDmncnRpbi tlallocation and accelerated growth can fcssvr oet n nmly icse h onr' retnebe made consistent with an equitable metSugsseooireom to tfruleanrbntaegtodldistribution of income and the relief steghnteeooystmltwihrwngp ulinsrsesbof absolute poverty. jbceto,addvriyeprs etn roiisfrpbi net
January 1980. u, lii vili + 584 pages Dcme17.x 6 ae h iis n unn h lwo(including map, 2 appendixes,(icuigmp,saitclapni) mgrtstpod tves.96 tables, glossary). -EgihadSaih coe17.i 9pgs(nldn
Stock00Yo.ap-8001.k$20.0 paperback
Economic Growth of SokHs C 90E C 90SColombia: Problems and Euao:Dvlpet$.0aerckProspects Polm n rsetDragoslay Avramovic AeadrQ oik,cifoand othersmiso,adohr_____Assesses the country's needs and ReiwthconrsmanTeaba:BicNdsnmakes recommendations for future scocnmcscosadfcss TeGmigrowth.ontetaiinlqaiyo cuds
The Johns Hopkins University Press, bigtebnft fmdr eeo- cifadcodntn uhr1972. 530 pages (including statistical mn oamjrt ftep~r eeVnedis nannex, maps).Dicsethexctdsotali AnMcNmrLC 78-1865 01. ISBNf 0-8018-1389-1, frinecag n iclrvne$30.00 (218.00) hardcover; cmae otecutysnes hseototie ai edISBNY 0-8018-139 7-2, $9.95 (i6.00) ba oenetadteWrdBn
paperback. n makingcpoicyfdacisioslthatlwil
Descrreasethheprhanceslofeatseesurfival

for that country's people. The Gambia ubnlbrmres n omlts fricesdpbi xedtr ois extremely poor; the rural popula- emlmetadicm poiybscndsercs,uhasdc-tion is worse off than those living in isustaarimotninade- tonhal,wtr,ndosngurban areas; and women and igIdnsaslne-emAge htarpddciei etltchildren, who make up 30 to 40deeomnstaeywilfciaethipeettonfpercent of the population, are the tegvrmn' omtett hmost disadvantaged group and suffer Juy18.xi+18pae(icuig posonfbscned,uthttemost from poor health and apni,2anxs.stsato fbscnes uhamalnutrition. A strategy is proposed StcNoRC80.$.0pprak euain,sanmotntntuetthat is aimed at improving the health frscrn oe etlt.Epoeand nutritional status of pregnantthsoienmcdtriatsfwomen and lactating mothers by IoyCat h hleg et1t h urn ttso h oncombating endemic disease,ofScestysfmlpanigrga,thimproving the supply and distribution atanAdeTinesoalttuofwmnnderltyof food, improving eating habits, andanmkerco edtisfrasupplying clean water in rural areas. an otescmrhsvep ulinplcy
December 1981. xi + 142 pages Ivsiae h ocle IoinJl 90 ii+25pgs(nldn(Including 2 annexes).Mial"adwytomitigr th blorpy)
Stock No. RC-8104. $5.00 paperback. icm eesadopruiisfr SokN.R-00 1.0pprak
Guatemala: Economic and TeJhsHpisUiest rs, Kra oiyIse oSocial Position and19846pae(icungapn LogTrDvlpmt
John R. Hansen, chief of L 6479.IB -0813-, cnloe' rwhrt otnewtmission, and others $85 ~00)hrcvr rae osdrtoso qiyConcludes that, despite currentISN081-095$1.5(62) srcuachnetomianteproblems due to the fall in coffeepaebc.om rtiedvngsofoenprices, the economy is financially eprs n e oe o oensound and has good future growth mn nrsos ocagnprospects. Kna noteScn oetcadetra odtos
August 1978. 181 pages (includingDe deTeJhstpknUivrtyPs,statistical annex, map annex). Aaye ey' atpc fdvlp pedxs ne)Stock INo. RC-7801. $5.00 paperback. mn n t oeta n cp o C7 239 SN081-289
India: Economic Issues inISN081-297,$50(.77)the Power Sector TeJhsHpisUiest rs, pprakC. 'Paylor apnie,saitcltbe,catReviewing the country's demand for idx.Kra rbesadIseelectricity, points out that economic LC7-09.IB0818754,iaRpdlGo ingrowth in India depends critically on $30(180)hrcv;Eonmthe development of the power sectorand suggests that public funds be IB -081752 1.0(~.0 're aasupplemented by increased tariffs to paebc.A lysthpenm alco miaugment the internal cash generation pors aeb oe ic hof the State Electricity Boards, as wellas provide for a more efficient use of Kna ouainadery16spower resources.DeeomnThJonHoknUnvriyPs,
Nlovember1979. ill + 175 pages Rsi aue,cifo 96 9 ae icuigmp(including map, 3 annexes, 3 graphs, miso,adohrapedx,stitclapni,idx)organization chart).SttstafetltinKnaihih LC7-728IBN0011648Stock Nlo. RC-7911. $5.00 paperback. apast eicesn,adsos $00 ~20)hrcvr
Indonesia: Employment and sau.Rcgie htrpdppl- Mdgsa:RcnIncome Distribution intingotisrsligithned EomcDvlpetadIndonesia Ftr rsetMark Leiserson, mission chief FC oh,msincif nand coordinating author ohrExamines demographic, employ- Eaie,i h ih frcnment, wage, and income trends;goenetsbjcis,hetrey
analyzesthatearenimportantoinraddress-

underlying both the 1978-80 pirte o h onr nte18s Idsr ors,eeg nDevelopment Plan and those plans to anthroeoexenlsssac.rnprain,swllshu nbe implemented subsequently. Pointsreocedvlpntout that the overall performance of Dcme18.v 7 aethe economy has been disappointing (ncdngSanxssttsiaDeebr99 iiivi+12pgs
. in recent years, but that the govern- apedx.(nligmp,2neesstttclment has been able to focus onStcN.RC804$50paebc. peni)certain important social objectives: SokN.R-71.$.0pprakthe satisfaction of basic needs, reduc-tion of urban-rural income disparities, Mxc:MnfcuigScand the protection of living standardstoprsesanPlies Ngi:Otosfrof low-income urban groups. Pro-poses a policy frameworkAeane LNicicifo LngerDelpmncharacterized by increased reliance msin n tesWue isadohron external assistance, vigorousexport promotion, and a general Epaie he ai betvsfr Eaie rset hog h alrelaxation of economic controls, and deeoigtemnfcuigids 180,whdtaldecrponfconsiders the feasibility and tyrpdadefcetgot fteptoemidsr n reappropriateness of this strategy in prdconmaaeetoaset diusonfeuain,giulr,relation to thebaaneroepymnt,rcidthsThofhn HptisenierstyPrssomy and long-term development ceto fpoutv osfrte 17;2dpitn,17.x 5goals of the country. cutysrpdygoiglbrfre ae icuigsaitclanx
NYovember 1980. 111 + 504 pagesMac19917pge(ilungmp)(Including 6 annexes, 4 appendixes). Sanxs.L 5-95.IB -0810 5English and Trench.
Stock NYos. RC-8015-E, RC-8013-F. $15.00 IB -0810 5 60 p.5paperback._______p erak
Malaysia: Growth and Equity Mrco cnmcadLau e una tin a Multiracial SocietyKevin Young, Willem B3ussink, Sca eeomn eot Eooi iuto nand P'arvez Hasan CrsinMrt oriaig Gog .SlwnadohrRapid growth is essential to achieving ato,adohrMalaysia's economic and social objec- Thssuyeaiethgrwhad co mcslfeineadfnniltives; favorable resource prospects stutrlcagste orcacedwrhissbdvlpngonare conducive to such growth.ecnmhaexeineduigte sdrbeaualeore.
The Johns Hopkins University Press, deemnthreutthtcnbTeJo sHpksUivstyPs,1980. 564 pages (including appen- exeedfo thanulpaso198xv+22ags(clIgdixes, index),.iaca dutetta oiae pedxs ttsia pedxLC 79-567 7. ISBNY 0-8018-2584 -6, thpeid17-0adloshad blogpy)$25.00 (217.50) hardcover;toteoealpopcsfrteen LC7-72.ISN008291XISSBN 0-8018-2585 -4, $12.95 (25.50) oydrn h eid18-0paperback.cosdrgrwhpolmatte $.0(45)pebck
The Maldives: An Introduc- pusigtory Economic Report Otbr91 xi+42pgsPpaNwGie:SlceK. Sarwar Lateef, chief of (nldn ttsia pedx.Egih DvlpetIsemission, and others adFec.AieGlno,cifoProvides a brief introduction to theMaldives, a nation that is among the StcNs.C803ERC13-.miio,ad thrtwenty poorest countries in the world, $00 aebc.Ti eotcntttspr facnand points out that the fisheries sec- tnigdaou ewe h oltor accounts for 44 percent of Bn n h oeneto auemployment and nearly all visible Nea:DvlpetPrNwGunaoawieagefexport earnings and discusses other fomneadPopcscnmiadsctrsus.timportant sectors-agriculture, tour- YknHag he ffcsso e pcfcaestaism, cottage industries, health, and msin n teswr gedt eaogtems
education.Outlines hepdeveloment imporanteforutercountryshdevelop
athe rot Dlopet n sance. htth ao oa aigth onrDecemey opt ion fo+h Sixt P lannte il et rviersn
key Pspectucs agrices noe o t epeadpoutv
livelihood frnitsfgroientlaborwforce

Discusses, in particular, the employ- eooi n iaca rssi h hlpie:Pirtement, agriculture, forestry, fisheries, 17-8 xmnstesaiiain n rset oand industry sectors.ecnmcrcvrprgathDeeoen
1982. 280 pages (including 4 annexes). ntstit nsieo h rga' usl .Ceta ,EwrStock NYo. RC-8201. $10.00. sces h rsn cnmcsta i akn,adohr
Prga:EconomicprsetfogrwhadpjcsMemorandumagiutrlpouto,rpdppl-dvlpetsrtgonelymtManmohan Agarwal and others to rwh n iepedpvry adicm itiuinReviews Paraguay's high economic Cnieskyplc esrstagrowth rate generated by expanded aencsayt rvd oi ai h on okn nu~iyPesagricultural production and the con- fomeimtr anlogtm19654pgs(ncung asstruction of two huge hydroelectric dvlpetefrs pedxs ttsiaplants. Highlights the need toJue18.ii+20pgs(nldg apnixidx)improve support services in the 3 nee,saitclapni) L 6123 SN081-831countryside, promote industrialdevelopment increase expenditures EnlsanSpih.$50(60)aerckon education, health, and rural SokNs C80-,R-12Sdevelopment, and improve the $00 aebc.Prua:Arcluatax base.
June 1979. v + 178 pages (including ThPhipne:Aecso JaqsKou,heffmap, annex, statistical appendix). teFnnilSco iso-,adohrStock NYo. RC- 7906. $5.00 paperback. EdadKHain,cefo Aalzstemnisusf
Paraguay: Regional Pcsso h mlctoso r- tfe netrnesfrftr olDevelopment in Eastern psl omv h onr' akn akcnieainParaguay igadsget ast oiie (nldn pedxs 0anxsAlfredo Gutierrez, chief of svnst teghntefnnil mp)mission, and otherssctrReviews recent economic develop- AJonWrlBakIfSuyMyments and provides a framework for 190ix+9pae(icungmp PotalCretadpolicy actions and investmentprojects designed to make maximum 3apnie)use of development possibilities, and SokN.R-06 50 aebc. PopcieEooisuggests the need to coordinate Trndpublic-sector activities in a siKaakyc efogeographic and sectoral dimension to Piipns nutilmsin nexploit the eastern region's natural DeeomnStagynd urdaAawaresources.PoiisDsussoruasdifcltan-
August1l978. viii + 50 pages (includ- 5redAde rischeofinatrtervluonf1947ing maps, statistical appendix). English msin n tesadntsta h onr aand Spanish. Otie h onr' nutilsudeooi ae u ilhvStock NYos. RC- 7802 -E, 1C- 7802-S. deeomnstaeyitmaotoc etoerswhtesrou$3.00 paperback. ojcie,adidsra netet uepomn rbe,ices
Peru: Major Development diesol otnewt nrae giutrlpoutvtPolicy reinIadtatplcisures om icldn saitiaappni,da)RecommendationsinutissolberretdUlrich Thumm, chief of wr etrueo aia n tc o C70.$.0pprakmission, and othersdoetcrsuesadmeNotes that expansionary monetary epomn rain oai:TeIdsraiaand fiscal policies pursued during My18.i 31pgs(nldn ino nArra cnmmost of the 1970s led to high public- stttia pni,9aex).udrSc lstP nigsector and balance-of-paymentsdeficits and to increased recourse to StcNoRC00.$50paebk. ndas.Tsnsadforeign financing. The situation, RyPpeexacerbated by a sharp deterioration TefrtcmrhniesL yo hof the country's terms of trade during Rmna cnm,tesuycn
1977578.,Examinesahedstabilization

tains a data base of the economy and dicsesoeothdeemnns hagtatbanntemdlefdescribes the planning and manage- o oet,teipc fsco h 9hcnuywt eeomnment system.ecnmcadpltclfcosoth baeprmrlonidgnucpil
The Johns liopkins University Press, bained dpoetFomles inoforgnecooy1979. 742 pages (including maps, udlnsfrpoiisamdaappendixes, bibliography),.leitn oet n rmtn Mrh18.xv+22pgs(nld
LC 79-84315. ISBlY 0-8018-2269-6, eutbegot.Cmainppr igsaitclapni)$55.00 (222.75) hardcover; t hiad oadaDvlpet SokN.R-02 1.0pprakISBli 0-8018-2262 -9, $15.00 (&7.00) Staey fFulPrcpton
paperback. Mrh18.Tre:Plce n
Seychelles: Economic2anee,mp)VioDbe,isoncefMemorandumStcNoRC01.$.0pprak hilarq,dptmsinRobert Maubouche andche,adoerN'aimeh Iiadjitarkhani Taln:Idsra ttsta vrl cnmcgot
Traces the development of Seychelles' DvlpetSrtg n drn h 90 n oto heconomy from its primary depen- Thiad97swsgocmprditohedence on the export of copra and Bl aas,cifo iso, dvlpn onre.Cnldscinnamon to a service economy with anoteshwvrtatheectsaptourism as its major industry. Con- ices nolpie a nufvrcludes that the country's management Ntsta h oni a not beipc ntecutyadtacapability is impressive and its sadn cnmcrcr uigte rsmto fssanbegotdevelopme.nt strategy well designed, pswrpro,epcal ewe eed nteaoto fabut that it is likely to be confronted 16 n 93 u onsotta xotoine taey nplcewith financial constraints in the near thrisasodw integotof imdticesngoetcsvnsfuture, and its investment program Ta xot htwl aeangtv n tkeigageaedmn owill require increased domestic efc nteeooyEaie h eore nln ihageaespefforts, as well as substantial levels of popcsfrftr xot fpo l;ado h upr o hsexternal capital aid. c'sdfo n auatrdgos plce yvrosdmr n h
July 1980. if + 71 pages (including tieav tgenthsprdc.statistical appendix).Cosdrthnedfrteeooi Mac190xxi+36pgs(cu-
Stockprjecs;lxamnesmeaure0of Stok$N..0080pap15.0rpperkck
The Solomon Islands: An tinshesadqetosrlig ______
Introductory reomenainsooracoernReportinutildvlpetsrtgfoEdward K. Hawkins, chief of tecutyta samda nra- Uad:CutyEooimission, Nlizar Jetha, deputy ininutalepomt,eordmchief, and others epnigsaladmdu-ie akBid iso edrStates that the country faces fourdadoftepo.Tiisheirtcnmcrprtp-main development issues: (1) creatingsufficient jobs for a fast-growing work Jn 90 9pgs ae yteWrdsn nUadforce; (2) increasing the opportunities SokN.R- 1.$.0pprak ne16.I eiw vnspirtfor earning cash incomes in rural te17-9wraddvlpetareas; (3) balancing regional snetewr nldn h oendisparities: and (4) improving educa- ThiadToadaDvlp metsnwfacalrga.tional and training facilities at allmetSr eg of ulOuinshepoiyaesfrfrhrlevels to raise the supply of ato n h mlctoso hadministrators, managers, and Priiainblneo-amnsotokfradprofessionals. E .Lm he fmsin eurmn'.Amr ealdrve
April 1980. viii + 134 pages (including JonSiln,dptche,fteprbmsadsusinivstatistical appendix).an otesmjrscosgiulr,idsryStock 1No. RC-8004. $5.00 paperback. hsrp nssn lodsusd
Thailand: Income Growth alagexetthruapoltin clpedx)and Poverty Alleviationhanobeeie.Srsethtte SN082-07X.$00pebckJohn Shilling,' chief of mission,conrshudotflwatyeoand others btsol ou nriigtepo
Synthesizes the results of four special dciiyadicmso h ors
rtudes o povrtyrelaed isuesand fapovert. Ths stratg oul bcioecogoic condpoitical ofators eonomic

Uruguay: EconomicYuolvaDeeomn Zar:CrntEnmiMemorandumwihDcnrlztoSiutoanCosansAlfredo Gutierrez, chief of VndDbyadohr eso ao,cifomission, and othersEvlaethconrsprgaian msin,ndtesExamines the governments liberaliza-dyaiaprahstecnmc rsnsannegtdaalisote
tdon policies designed to improve polm n t eea omt ifcliseprecdb h araresource allocation and emphasizes mn oa pnmre-retd eooybten17 n h isthat these will need to be molded into eooy mrvdefcec f hl f17 n ugssta ha policy framework conducive to rapiddoetciusranhihrontyedsorvmptsntt-development,.iigsadrs in n issse ficnie nJanuary 1979. util + 201 pages TeJhsHpisUiest rs, aotplce htwl a h ona(Including map, statistical appendix). 19550pae(icuig5apn tinfradvlmntatrnhtStock Hto. RC- 7902. $5.00 paperback. dxs lsay ilorpy ttsia hne ntewrdeooy
Yemen Arab Republic: $75 .1.0 adoe;mp ne,saitclapni)Development of a Tradi- IB -0811-,$.5(~.0 nls n rnhtional Economypaebc.SokNsRC85-,C805fOtto Maiss, chief of mission, $.0pprakand othersYuolvaSefMng- Nt:hecutistaarteOutlines the far-reaching changes in metScaimadtesbctothWrl anCutythe socioeconomic and political struc-ture of the Yemen Arab Republic since CalegsoDeeomn Sudsudrthsedi,adthe 1962 revolution and discusses MatnShnhCruAraa, onrisndegnshtaemajor development issues of the late adNwlA l ~mnindi ilso umr1970s and the 1980s. dsrpin ne te ujcJanuary 1979. 2, xxvili + 305 pages adteoealpromneo h h n fteCtlg(Including 3 maps, 7 annexes, statisti- ecnm,soigtathnwcal appendix, selected bibliography),. cnmcfaeoko h 90Stock NYo. RIC-7901. $10.00 paperback. loetmcecn icevladt
People's Democraticexednsefmagetprc-Republic of Yemen: A Review pe otemcocnmclvlof Economic and SocialThJonHoksUivrtyPe,Development19941pae(icungm,Shahid A. Chaudhry, chief of aped,glsryinx)mission, and others L 9856 SN081~237Reviews the governments economic $2.0(175)hrcv;policies and the socialization of the ISN081-275,$.9(.67)economy between 1971 and 1978 pprakand concludes that the absence ofsignificant natural resources willinevitably influence the country'sdevelopment, which must concentrateon solving urban/rural disparity,increasing productivity, and usingmanpower efficiently.
March 1979. vi + 169 pages (includingmap, annex, statistical appendix).
Stock No.ugoslavia:5.00epaperback

WORLD BANK PUBLICATIONSORDER FORM
SEND TO:WORLD BANK PUBLICATIONS WORLD BANK PUBLICATIONSP.O. BOX 37525 or 66, AVENUE D'IENAWASHINGTON, D.C. 20013 75116 PARIS, FRANCEU.S.A.
Name. __________
Adres:
Stock or ISBN # Author, Title Qty. Price Total
Sub-Total Cost:______
Postage & handling fee for more than two free items ($1.00 each):Total copies: _ ____Air mail surcharge ($2.00 each):
TOTAL PAYMENT ENCLOSED:_____Make checks payable: WORLD BANK PUBLICATIONS
Prepayment on orders from individuals is requested. Purchase orders are accepted from booksellers, library suppliers, libraries, and institutions.All prices include cost of postage by the least expensive means. The prices and publication dates quoted in this Catalog are subject to changewithout notice.No refunds will be given for items that can not be filled, Credit will be applied towards future orders,No more than two free publications will be provided without charge. Requests for additional copies will be filled at a charge of US $1.00 percopy to cover handling and postage costs.Airmail delivery will require a prepayment of US $2.00 per copy.Mail-order payment to the World Bank need not be in U.S. dollars, but the amount remitted must be at the rate of exchange on the day theorder is placed. The World Bank will also accept Unesco coupons.