47608 - World Bank Documents & Reports
276
DIRECTIONS IN DEVELOPMENT Human Development HIV and AIDS in South Asia An Economic Development Risk 47608 Public Disclosure Authorized Public Disclosure Authorized Public Disclosure Authorized ublic Disclosure Authorized Public Disclosure Authorized Public Disclosure Authorized Public Disclosure Authorized ublic Disclosure Authorized
-
Upload
khangminh22 -
Category
Documents
-
view
0 -
download
0
Transcript of 47608 - World Bank Documents & Reports

D I R E C T I O N S I N D E V E L O P M E N T
Human Development
HIV and AIDS in South AsiaAn Economic Development Risk
47608
Pub
lic D
iscl
osur
e A
utho
rized
Pub
lic D
iscl
osur
e A
utho
rized
Pub
lic D
iscl
osur
e A
utho
rized
Pub
lic D
iscl
osur
e A
utho
rized
Pub
lic D
iscl
osur
e A
utho
rized
Pub
lic D
iscl
osur
e A
utho
rized
Pub
lic D
iscl
osur
e A
utho
rized
Pub
lic D
iscl
osur
e A
utho
rized

HIV and AIDS in South Asia


HIV and AIDS in South AsiaAn Economic Development Risk
Markus Haacker and Mariam Claeson, Editors

© 2009 The International Bank for Reconstruction and Development / The World Bank
1818 H Street NWWashington DC 20433Telephone: 202-473-1000Internet: www.worldbank.orgE-mail: [email protected]
All rights reserved
1 2 3 4 5 13 12 11 10 09
This volume is a product of the staff of the International Bank for Reconstruction andDevelopment / The World Bank. The findings, interpretations, and conclusions expressed in thisvolume do not necessarily reflect the views of the Executive Directors of The World Bank or thegovernments they represent.
The World Bank does not guarantee the accuracy of the data included in this work. The bound-aries, colors, denominations, and other information shown on any map in this work do not implyany judgement on the part of The World Bank concerning the legal status of any territory or theendorsement or acceptance of such boundaries.
Rights and Permissions
The material in this publication is copyrighted. Copying and/or transmitting portions or all of thiswork without permission may be a violation of applicable law. The International Bank forReconstruction and Development / The World Bank encourages dissemination of its work and willnormally grant permission to reproduce portions of the work promptly.
For permission to photocopy or reprint any part of this work, please send a request with completeinformation to the Copyright Clearance Center Inc., 222 Rosewood Drive, Danvers, MA 01923,USA; telephone: 978-750-8400; fax: 978-750-4470; Internet: www.copyright.com.
All other queries on rights and licenses, including subsidiary rights, should be addressed to theOffice of the Publisher, The World Bank, 1818 H Street NW, Washington, DC 20433, USA; fax:202-522-2422; e-mail: [email protected].
ISBN-13: 978-0-8213-7800-7eISBN-13: 978-0-8213-7826-7DOI: 10.1596/978-0-8213-7800-7
Cover photo: © Thomas Sennet / World Bank
Library of Congress Cataloging-in-Publication Data
HIV and AIDS in South Asia : an economic development risk / edited by Markus Haacker andMariam Claeson.
p. ; cm.Includes bibliographical references and index.ISBN 978-0-8213-7800-71. AIDS (Disease)—Economic aspects—South Asia. I. Haacker, Markus. II. Claeson, Mariam.
III. World Bank. [DNLM: 1. HIV Infections—economics—Asia—Statistics. 2. HIV Infections—epidemiology—
Asia. 3. Demography—Asia—Statistics. 4. Developing Countries—Asia—Statistics. 5. Financing,Government—statistics & numerical data—Asia. WC 503 H67337 2009]RA643.86.S67H58 2009362.196’979200954—dc22
2008049854

Foreword xiiiAcknowledgments xvExecutive Summary xvii
PART I The Epidemiology of HIV and Prevention Strategies 1
Chapter 1 Dynamics of the HIV Epidemic in South Asia 3David Wilson and Mariam Claeson
Introduction 3The Global Context 4HIV Transmission Patterns in South Asia 12What Works—Lessons from HIV Prevention
Interventions and Programs 27Conclusions: Prevention Priorities for South Asia 32References 36
Contents
v
Chapter 2 Responding to HIV in Afghanistan 41Jed Friedman and Edit V. Velenyi
Introduction 41The State of the Epidemic in Afghanistan 42Evidence on the Effectiveness and Cost-
Effectiveness of HIV Prevention 47HIV Prevention in Afghanistan—An Economic
Perspective 50Conclusions 56Notes 65References 66
PART II The Economic and Development Impacts of HIV and AIDS 73
Chapter 3 Development Impact of HIV and AIDS in South Asia 75Markus Haacker
Introduction 75Health and Demographic Impacts of HIV and AIDS 77The Economic Impact of HIV and AIDS:
Aggregate Approaches 84Beyond Aggregate Measures of the Impact
of HIV and AIDS 90Economic Development Aspects of the
Response to HIV and AIDS 99Summary and Conclusions 112Notes 114References 117
Chapter 4 Economic Cost of HIV and AIDS in India 123Sanghamitra Das, Abhiroop Mukhopadhyay,
and Tridip Ray
Introduction 123Context 125A Survey of Households Affected by HIV and AIDS 127Outline of the Model 141
vi Contents

Estimating the Costs of HIV and AIDS 143Concluding Remarks 147Notes 149References 151
PART III The Burden of HIV and AIDS on the Health Sector 155
Chapter 5 The Fiscal Burden of AIDS Treatment on South Asian Health Care Systems 157Mead Over
Introduction 157Overview of AIDS Cases and Treatment
in South Asia 158Future Growth of South Asian Treatment Costs 163Health Care Financing in South Asian Countries 167Access to Private Health Care and the
Risk of Poverty 170Quality of Private vs. Public ART 175Conclusions 177Notes 187References 189
Chapter 6 Recurrent Costs of India’s Free ART Program 191Indrani Gupta, Mayur Trivedi, and
Subodh Kandamuthan
Introduction 191India’s Free ART Program 193Methodology and Data Collection 196Overview of the Selected Sites 201Key Assumptions and Parameters 205Costs of the ART Program 210Out-of-pocket Expenditure 216Projected Costs of India’s Free ART Program 218Discussion of Findings 220Outlook 223Notes 234References 236
Index 239
Contents vii
Figures1.1 Antenatal and Population-Based Estimates of
HIV Prevalence 51.2 HIV Infectiousness by Disease Stage 71.3 Percent of Adults Reporting Two or More Regular
Partners in Last Year 81.4 Male Circumcision and HIV Prevalence in Asia 91.5 HIV Prevalence in Different Indian Regions 151.6 HIV Trends among Pregnant Women
Aged 15–24 in India 161.7 HIV Trends among Injecting Drug Users and Sex
Workers in Kathmandu 181.8 HIV Trends among Sex Workers in Nepal by
Migration Status 181.9 HIV Trends among Vulnerable Groups in Pakistan 191.10 HIV Trends among Injecting Drug Users in Bangladesh 201.11 HIV Prevalence among Other Groups in Bangladesh 211.12 HIV Prevalence among Male and Female Injecting
Drug Users in Bangladesh 211.13 Coverage of High-risk Networks with Targeted
Interventions in South and Southeast Asia 271.14 Reduced HIV Transmission in Thailand 291.15 Reduced HIV Transmission in Cambodia 291.16 The Sonagachi Project, West Bengal, India 301.17 Reductions in Unprotected Sex in Tamil Nadu,
1996–2003 313.1 South Asia and India: Contribution of AIDS
to Mortality 793.2 India: HIV/AIDS and Mortality by Age and Sex 823.3 Evaluating the Loss from Reduced Life Expectancy 833.4 Access to Treatment and Key Development Indicators 934.1 Estimating the Cost of HIV/AIDS 1455.1 South Asia and India: Contribution of HIV/AIDS
to Mortality 1595.2 HIV Treatment in Centers Supported by the Indian
National AIDS Control Organisation, April 2004 through January 2007 161
5.3 Percent of Physicians Who Report Prescribing ART “Frequently” by Type of Institutional Affiliation in India in 2002 162
viii Contents
5.4 Projected AIDS Treatment Burden in India Assuming Rapid Scale Up 164
5.5 Projected AIDS Treatment Burden in Nepal Assuming Rapid Scale Up 165
5.6 Total Health Expenditure per Capita Is Similar in Most South Asian and Sub-Saharan African Countries 167
5.7 South Asian Countries Offer Less Public Financing and Less Insurance Financing Than Most African Governments 169
5.8 Impact of Health Expenditure on Household Net Consumption Patterns in Bangladesh 171
6.1 Trend in Pretest Counseling at VCTC 2036.2 Adherence and Reasons for Drop-out across Study Sites 2066.3 Distribution of ART Clients across Drug Regimens 2106.4 Unit Costs and Number of Patients 214
Tables1.1 Overview of HIV Prevalence in South Asia, 2007 141.2 Estimated Number of People Living with HIV
in South Asia 141.3 Revised HIV Estimates in India 151.4 Changes in Sexual Behavior and Condom Usage 312.1 Estimated Costs of HIV and AIDS Prevention
Program in Afghanistan 522.2 HIV Prevention Program: Costs and Years of Life
Lost (YLL) Averted 542.3 Cost Parameters 552.4 HIV Prevention Program: Costs and Outcomes 573.1 South Asia: Key HIV and AIDS Statistics 783.2 The Demographic Impact of HIV and AIDS in Selected
South and East Asian Countries 813.3 South Asia: Welfare Effects of Reduced
Life Expectancy, 2005 893.4 Household Savings by Income Category 953.5 Access of Orphans to Education, Six Countries 983.6 Enrollment Rates by Income Category, Ages 6–14 993.7 HIV Awareness across Population Groups 1013.8 Access to Antiretroviral Treatment in South Asia 1033.9 The Costs of Antiretroviral Treatment 106
3.10 Expanding Access to Antiretroviral Treatment 108
Contents ix
3.11 Antenatal Care Visits to a Medically Trained Person 1114.1 Regional Distribution of Sample 1314.2 Age Distribution and Occupation of HIV-infected
Individuals 1334.3 Time since HIV Detection 1344.4 Distribution of Households by Family Type 1344.5 Health Indices 1364.6 Mental Health: Relative Frequency 1374.7 HIV Patients Who Do Not Disclose Their Infection 1384.8 Transition in Employment Status Following
HIV Diagnosis 1394.9 State of Health by HIV Status and Gender 1394.10 Indicators for Impact of HIV and AIDS on
Labor Productivity 1404.11 HIV and AIDS and Children’s Enrollment 1414.12 Per Capita Inflow and Outflow of funds 1424.13 Losses by Family Types 1455.1 Estimated Numbers of People Requiring
and Receiving ART, end of 2007 1605.2 Shares of Private and Public Health Care
Production in India 1685.3 Poverty Head Counts: Effect of Accounting for
Out-of-Pocket Payments for Health Care, Various Years 1736.1 Clients Receiving ART in India’s Free ART Program 1956.2 Overview of the Selected Sites 2016.3 Reference Period for Study 2026.4 Volume on ART – Alternative Definitions 2066.5 Per-Client Cost across Sites and Items 2116.6 Annual Costs across Selected Sites, by Year 2146.7 Estimated Unit Costs with Reduced Prices of ARV
Drugs and CD4 Test Kits 2156.8 Distribution of Costs across Sites 2166.9 Out-of-pocket Expenditure to Access ART 2176.10 Projections of Costs of ART Programs 219
Boxes1.1 Key Principles and Policy Implications for HIV
Prevention in South Asia 334.1 Case Studies of Financial Impact of HIV and AIDS 128
x Contents
6.1 Studies of the Costs of National Antiretroviral Treatment Programs 197
6.2 Summary of Key Findings 221
MapTwo Major Drug-Producing Areas That Affect South Asia 11
Annex Figures5.1 Projected Fiscal Burden of AIDS Treatment in Four
South Asian Countries 1795.2 Projected Fiscal Burden of AIDS Treatment for
South Asia & Sub-Saharan Africa 1835.3 Flow Diagram for Aidsproj Model Predicting the Future
Growth of AIDS Treatment Cost 186
Annex Tables1.1 HIV Prevention Interventions 352.1 Estimated HIV Transmission Probabilities by Exposure 582.2 Evidence on Effectiveness of Harm Reduction
in Injecting Drug Users (IDUs), and Other Preventive Measures 59
2.3 Evidence on Cost-Effectiveness of Harm Reduction in Injecting Drug Users (IDUs) and Other Prevention and Treatment Measures 62
4.1 Summary Statistics 1484.2 Determinants of Male Labor Supply 1495.4 Projected Annual Cost of Treating AIDS Patients in
Six South Asian Countries by Uptake and Prevention Scenarios 186
6.1 Additional Assumptions Underlying Cost Estimates 2246.2 Site-specific Details and Assumptions 2266.3 List of Compulsory Tests 2336.4 Time Allocation of NACO Staff to ART Clinic
Program in Selected Hospitals 2346.5 Time Allocation of SACS Staff to Selected ART
Clinic Programs 234
Contents xi

The South Asia region is characterized by relatively rapid economicgrowth, averaging about 6 percent a year, and low HIV prevalence—lessthan 1 percent. Does this mean that AIDS is not a “problem” for SouthAsia? This book answers this question with an unequivocal “No.” The rea-son is that HIV and AIDS pose a risk to economic and social developmentin the subcontinent.
First, even if the overall prevalence rate is low, as the chapter by Claesonand Wilson shows, there is high and rising HIV prevalence among vulnera-ble groups at high risk, such as sex workers and their clients, and injectingdrug users and their partners, throughout the region. Without scaling upprevention interventions among those at highest risk, these concentratedepidemics can further escalate. There is already a spread into rural areas insome states of India, and a relative increase among women compared withmen in those parts.
Second, the threat of contracting HIV imposes a large burden on thewelfare of both HIV-positive and -negative individuals. As the paper byDas and co-authors shows, people’s mental health can be affected by thespecter of HIV and AIDS in society. When one adds the fact that inmany South Asian societies there is a stigma attached with behaviorassociated with HIV, and that people living with HIV and AIDS and
Foreword
xiii
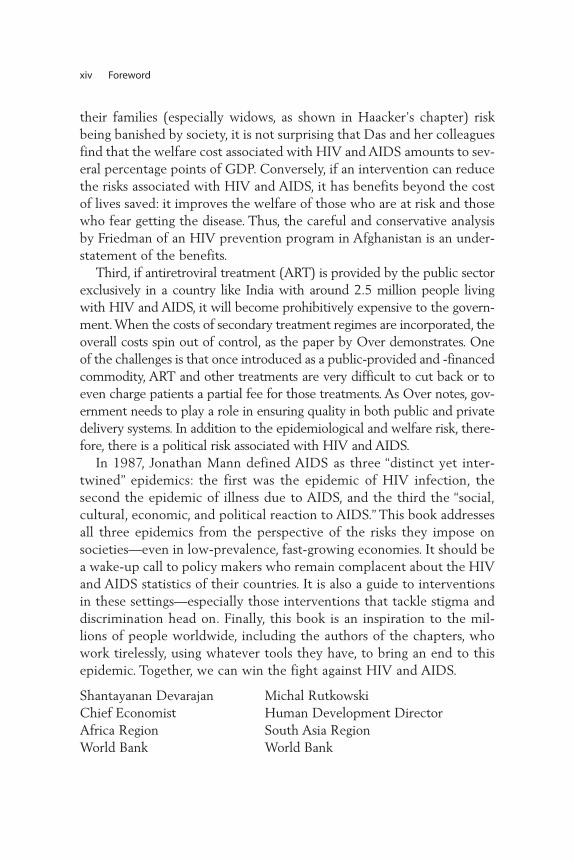
their families (especially widows, as shown in Haacker’s chapter) riskbeing banished by society, it is not surprising that Das and her colleaguesfind that the welfare cost associated with HIV and AIDS amounts to sev-eral percentage points of GDP. Conversely, if an intervention can reducethe risks associated with HIV and AIDS, it has benefits beyond the costof lives saved: it improves the welfare of those who are at risk and thosewho fear getting the disease. Thus, the careful and conservative analysisby Friedman of an HIV prevention program in Afghanistan is an under-statement of the benefits.
Third, if antiretroviral treatment (ART) is provided by the public sectorexclusively in a country like India with around 2.5 million people livingwith HIV and AIDS, it will become prohibitively expensive to the govern-ment. When the costs of secondary treatment regimes are incorporated, theoverall costs spin out of control, as the paper by Over demonstrates. Oneof the challenges is that once introduced as a public-provided and -financedcommodity, ART and other treatments are very difficult to cut back or toeven charge patients a partial fee for those treatments. As Over notes, gov-ernment needs to play a role in ensuring quality in both public and privatedelivery systems. In addition to the epidemiological and welfare risk, there-fore, there is a political risk associated with HIV and AIDS.
In 1987, Jonathan Mann defined AIDS as three “distinct yet inter-twined” epidemics: the first was the epidemic of HIV infection, thesecond the epidemic of illness due to AIDS, and the third the “social,cultural, economic, and political reaction to AIDS.” This book addressesall three epidemics from the perspective of the risks they impose onsocieties—even in low-prevalence, fast-growing economies. It should bea wake-up call to policy makers who remain complacent about the HIVand AIDS statistics of their countries. It is also a guide to interventionsin these settings—especially those interventions that tackle stigma anddiscrimination head on. Finally, this book is an inspiration to the mil-lions of people worldwide, including the authors of the chapters, whowork tirelessly, using whatever tools they have, to bring an end to thisepidemic. Together, we can win the fight against HIV and AIDS.
Shantayanan Devarajan Michal RutkowskiChief Economist Human Development DirectorAfrica Region South Asia RegionWorld Bank World Bank
xiv Foreword

This report was prepared and edited by Markus Haacker and MariamClaeson. The authors of the individual chapters were David Wilson,Mariam Claeson, Jed Friedman, Edit Velenyi, Markus Haacker, SanghamitraDas, Abhiroop Mukhopadhyay, Tridip Ray, Mead Over, Indrani Gupta,Mayur Trivedi, and Subodh Kandamuthan. Sandra Rosenhouse contributedto the chapter on the epidemiology of the epidemic. Michele Gragnolatiand Damien de Walque oversaw the original analysis of the chapters on theeconomic cost of HIV and AIDS in India and the recurrent cost of India’sFree ART Program.
The peer reviewers of the draft report were Martha Ainsworth, OlusojiAdeyi, Prabhat Jha, and Ruth Levine. Julie Mclaughlin, Paolo Belli, RajeevAhuja, Lynn Brown, Agnes Couffinal, and Tania Dmytraczenko providedhelpful comments and inputs.
The editors would like to thank Richard Hooley and the AmericanCommittee on Asian Economic Studies, who hosted a session on “TheEconomics of HIV/AIDS in Asia: Economic Development Risks” at the2007 AEA Conference in Chicago, where some of the chapters includedin this book were first presented. We would also like to thank the AfricaDepartment of the International Monetary Fund for their support dur-ing the production of this book, and Shantayanan Devarajan, then chief
Acknowledgments
xv

economist of the South Asia Region Department of the World Bank, whoprovided guidance from the inception of this book.
Many others inside and outside the World Bank provided helpful com-ments, contributed to the chapters, and participated in the internationalconsultation on the initial draft report at the “8th International Congresson AIDS in Asia and the Pacific,” in Colombo, Sri Lanka, in August 2007,chaired by Chakravarthi Rangarajan.
The editors want to thank Kyoko Okamoto, Asnia Asim, and PhoebeFolger for superb research assistance, and Silvia Albert and Roselind Rajanfor their assistance at different stages of the production of the book.
The book design, editing, and production were coordinated by theWorld Bank Office of the Publisher, under the supervision of PatriciaKatayama, Rick Ludwick and Denise Bergeron.
xvi Acknowledgments

This book offers an original perspective on HIV and AIDS as a develop-ment issue in South Asia, a region with a heterogeneous epidemic andestimated national HIV prevalence rates of up to 0.5 percent. The analy-sis challenges the common perception of HIV and AIDS, which has beenshaped to a large extent by analysis of HIV and AIDS in regions withmuch higher prevalence rates. Three risks to development are associatedwith HIV and AIDS in the region:
First, the risk of escalation of concentrated epidemics. HIV preva-lence rates so far remain low in the South Asia region, although there areareas with concentrated epidemics and high and rapidly increasing HIVprevalence rates among vulnerable groups at high risk. The main risk fac-tors that drive the epidemic are sex work and injecting drug use (IDU),especially where these factors intersect. Therefore, prevention measurestargeted at injecting drug use and sex work are crucial, and the financingof effective prevention programs, such as comprehensive harm reductionincluding clean needle exchange, condom use, and treatment of sexuallytransmitted infection (STI), are sound economic investments in low-prevalence countries with concentrated epidemics.
Second, the economic welfare costs. The impacts of HIV and AIDS oneconomic growth in the region appear to be very small. But, the epidemic
Executive Summary
xvii

has a disproportionate impact on key population groups. HIV and AIDSfrequently results in and exacerbates poverty, as shown by estimates ofthe economic impact on households and the ability to cope with stigmaand other structural amplifiers. Uneven access to health services withincountries is also a matter of concern. Available indicators for access to pre-vention and treatment are correlated with socioeconomic parameters likegender, educational attainment, and wealth. At the same time, the abilityto cope with catastrophic illnesses such as AIDS on the household levelis limited for households below or in the vicinity of poverty thresholds.Reflecting infection patterns and the low socioeconomic status of wid-ows, women are particularly vulnerable to the social and economic con-sequences of HIV and AIDS. In addition to the epidemiological benefits,investments in comprehensive prevention efforts, therefore, contribute tocontaining poverty.
Third, the fiscal costs of scaling up treatment. Access to treatment inthe region is low at present, even when compared to countries withmuch higher HIV prevalence. The weak capacities of health systems inthe region contribute to low access and utilization of treatment services.Looking ahead, the fiscal and other challenges of a comprehensive scal-ing up of antiretroviral treatment (ART) are substantial, underscoringthe crucial role of effective prevention now. There are several implica-tions of the findings regarding access to and the financing of ART, includ-ing the medical costs of HIV and AIDS alone that put a substantialproportion of the population at risk of poverty, and the economic con-straints that may lead to adherence problems in privately financed ART.The limited ability of many households to pay “catastrophic” healthexpenses associated with ART, and the negative externalities associatedwith poor adherence, suggest a large and central role for the public sec-tor in the provision of ART.
HIV—An Economic Development Risk in South Asia
Chapter OverviewThe chapters, most of which were commissioned specifically for this vol-ume, can be grouped in three broad themes—the epidemiology of HIVand prevention strategies (chapters 1 and 2), economic and developmentimpacts of HIV and AIDS (chapters 3 and 4), and the implications of HIVand AIDS for the health sector (chapters 5 and 6). Within each theme,one chapter provides a more general discussion of the respective issuesin the region (chapters 1, 3, and 5), and one chapter highlights aspects of
xviii Executive Summary
the respective issue in one particular country (with chapter 2 dealing withHIV in Afghanistan, and chapters 4 and 6 discus sing aspects of the impactof or the response to HIV and AIDS in India).
Regarding the broad development themes identified by this book,chapters 1 and 2 highlight the epidemiological risks. Chapter 3 surveysthe intersection of HIV and AIDS and key development objectives, andis complemented by chapters 4 and 5. The forward-looking discussion ofthe challenges of scaling up (chapter 5) is complemented by an analysisof the costs of ART in India (chapter 6) and a cross-country analysis ofaccess to treatment (in chapter 3).
I. The Epidemiology of HIV and Prevention Strategies
David Wilson and Mariam Claeson (Chapter 1—Dynamics of the HIVEpidemic in South Asia) review the experience with the global HIV epi-demic, and lessons learned regarding key factors in HIV transmission.Against this background, they describe the situation in each country inSouth Asia and derive policy priorities for HIV prevention.
Wilson and Claeson identify three factors that play a major role inunderstanding HIV transmission: the rate and pattern of sexual partnerchange, the presence or absence of male circumcision, and injectingdrug use. The limited data available suggest that concurrent sexual part-nerships are less common in Asia to date than in many of the worstaffected countries, suggesting that the potential for widespread sexualepidemics is also lower. Male circumcision could be a factor in explain-ing the pattern of HIV prevalence in Asia—no country with high cir-cumcision rates reports an HIV prevalence rate exceeding 0.1 percent.However, Wilson and Claeson argue that injecting drug use—frequentlycoupled with sex work—may ignite epidemics in contexts where theywould otherwise be unlikely; and this applies in particular to parts ofSouth Asia, a region that includes some major centers of global drugproduction and trafficking.
The overall size of the Asian epidemic thus depends on the prevalenceand transmission of HIV within and between these vulnerable groupsat high risk and the wider community. In many Asian countries, drug-injecting prisoners constitute a priority group in their own right. Mobilitycan amplify the problem, putting truckers and their helpers, migrants,and refugees at higher risk, as is the case in, for example, Afghanistan.Cross-border mobility of sex workers also contributes to different expo-sure risks, as in Nepal.
Executive Summary xix

Based on a discussion of the experience in the different South Asiancountries, and with prevention interventions in general, Wilson andClaeson conclude that the future size of South Asia’s epidemics willdepend on the scope and effectiveness of programs for sex workers andtheir clients, injecting drug users and their sexual partners, and men hav-ing sex with men and their other sexual partners. Experience has shownthat prevention programs targeting these vulnerable groups at high riskwork, they are relatively inexpensive, and they provide a high return oninvestment. Early, effective programs actively involving sex workers,injecting drug users, men having sex with men, and the sexual partners ofthese communities can therefore prevent HIV from becoming morewidely established in the general population.
Jed Friedman and Edit V. Velenyi (Chapter 2—Responding to HIV inAfghanistan) discuss the state of the HIV epidemic in Afghanistan, fea-turing a low-prevalence country in the region with an early-stage epi-demic and where HIV prevention efforts have only recently taken off.Based on a discussion of the effectiveness of HIV prevention, they pres-ent a framework for assessing the cost-effectiveness of an HIV preventionprogram being implemented in the country.
Friedman and Velenyi find that the number of recorded cases ofHIV infection is low at present. UNAIDS estimated that fewer than1,000 people were infected at the end of 2006. However, there are fac-tors that point at a risk of an escalation in HIV prevalence. Notably,almost all reported HIV cases at present are due to injecting drug use,and HIV prevalence in this group—judging from the experience ofother countries—can increase dramatically within short time periods.A factor exacerbating the situation in Afghanistan is the long history ofconflict, resulting in widespread poverty, low levels of education, andlow capacities of health systems. Notably, there is some evidence thatthe large number of refugees is contributing to the spread of HIV andAIDS. A 2005 study suggested that a large share of injecting drug usersin Afghanistan had been refugees in the Islamic Republic of Iran andstarted using drugs there, before returning to Afghanistan.
Building on an analysis of the effectiveness of prevention measures,Friedman and Velenyi apply a simple framework for assessing the eco-nomic benefits and cost-effectiveness of an HIV prevention programbeing implemented in Afghanistan that is geared toward scaling up ofprevention programs targeting high-risk behaviors, notably injecting druguse and unsafe sex, and involving vulnerable groups at high risk, likeIDUs, sex workers and their clients, truckers, and prisoners. One notable
xx Executive Summary
aspect of their approach is the application of a randomized frameworkto describe the effectiveness of the program, reflecting the large uncer-tainties involved in estimating the effectiveness of interventions based onvery weak data. Based on an estimate of lost earnings (a fairly restrictiveestimate of the economic costs of HIV, see chapters 3 and 4), the medianestimates return a cost-benefit ratio of 3.3, which increases to 4.2 whenfiscal savings arising from reduced demand for public health services aretaken into account.
II. The Economic and Development Impacts of HIV and AIDS
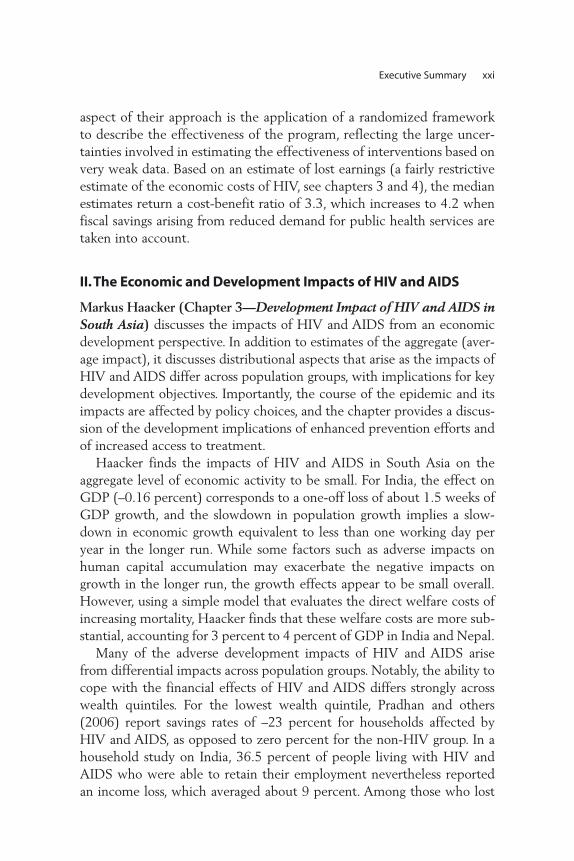
Markus Haacker (Chapter 3—Development Impact of HIV and AIDS inSouth Asia) discusses the impacts of HIV and AIDS from an economicdevelopment perspective. In addition to estimates of the aggregate (aver-age impact), it discusses distributional aspects that arise as the impacts ofHIV and AIDS differ across population groups, with implications for keydevelopment objectives. Importantly, the course of the epidemic and itsimpacts are affected by policy choices, and the chapter provides a discus-sion of the development implications of enhanced prevention efforts andof increased access to treatment.
Haacker finds the impacts of HIV and AIDS in South Asia on theaggregate level of economic activity to be small. For India, the effect onGDP (–0.16 percent) corresponds to a one-off loss of about 1.5 weeks ofGDP growth, and the slowdown in population growth implies a slow-down in economic growth equivalent to less than one working day peryear in the longer run. While some factors such as adverse impacts onhuman capital accumulation may exacerbate the negative impacts ongrowth in the longer run, the growth effects appear to be small overall.However, using a simple model that evaluates the direct welfare costs ofincreasing mortality, Haacker finds that these welfare costs are more sub-stantial, accounting for 3 percent to 4 percent of GDP in India and Nepal.
Many of the adverse development impacts of HIV and AIDS arisefrom differential impacts across population groups. Notably, the ability tocope with the financial effects of HIV and AIDS differs strongly acrosswealth quintiles. For the lowest wealth quintile, Pradhan and others(2006) report savings rates of –23 percent for households affected byHIV and AIDS, as opposed to zero percent for the non-HIV group. In ahousehold study on India, 36.5 percent of people living with HIV andAIDS who were able to retain their employment nevertheless reportedan income loss, which averaged about 9 percent. Among those who lost
Executive Summary xxi
their employment (about 9 percent of the sample of people living withHIV and AIDS), the income loss was severe, at about 66 percent.
Based on household data from India, Haacker finds that the situationof HIV-positive widows is worse than for other people living with HIVand AIDS, probably reflecting the low socioeconomic status of widows ingeneral. The infection pattern whereby many women are infected by hus-bands who acquire the virus earlier and are more likely to die before theirwives, together with the low socioeconomic status of women, means thatHIV and AIDS have a disproportionate economic impact on women. InIndia and Nepal, the number of orphans (here used to mean children whohave lost at least one parent) will increase to about 0.4 percent of theyoung population. By age 17, about 0.9 percent of the young populationwill have experienced orphanhood owing to HIV and AIDS.
Access to antiretroviral treatment in the region (about 20 percent inIndia, and less than 10 percent in the other countries) is low in an inter-national context. In many countries in the region, one key factor thatappears to limit progress in scaling-up is the low capacity of nationalhealth systems.
While the data situation is weak, the available evidence points towardinequities both in the reach of prevention efforts and in access to treat-ment. HIV awareness is substantially lower for the lower wealth quintilesand, within quintiles, awareness is lower for women and rural households.Data on access to treatment across population groups are not available atpresent. Access to related forms of health services, such as reproductivehealth services, indicate inequities in access to health services acrosssocioeconomic groups. To the extent that these inequities also extend toaccess to antiretroviral treatment, they exacerbate the disproportionateimpact of HIV and AIDS on poorer population groups.
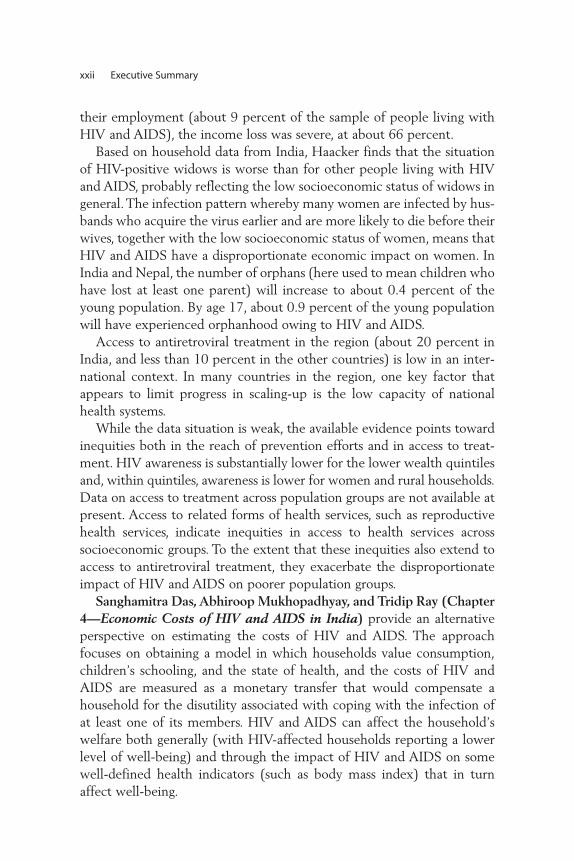
Sanghamitra Das, Abhiroop Mukhopadhyay, and Tridip Ray (Chapter4—Economic Costs of HIV and AIDS in India) provide an alternativeperspective on estimating the costs of HIV and AIDS. The approachfocuses on obtaining a model in which households value consumption,children’s schooling, and the state of health, and the costs of HIV andAIDS are measured as a monetary transfer that would compensate ahousehold for the disutility associated with coping with the infection ofat least one of its members. HIV and AIDS can affect the household’swelfare both generally (with HIV-affected households reporting a lowerlevel of well-being) and through the impact of HIV and AIDS on somewell-defined health indicators (such as body mass index) that in turnaffect well-being.
xxii Executive Summary
Das and others find that the total welfare loss (defined as a compen-sating income variation) is Rs. 67,601 for a male and Rs. 65,120 for afemale. Based on an estimate of 2.5 million people living with HIV andAIDS in India, this loss would add up to about Rs. 167 billion per month,corresponding to about 7 percent of GDP. Thus, the estimates by Das andothers are several times higher than any estimates of the direct economiccosts (in terms of income lost, costs of treatment, and so forth), and alsoexceed the estimates of the welfare costs of increased mortality owing toHIV and AIDS (discussed by Haacker, this volume).
However, it is important to note that this measure of welfare or costsis fundamentally different from those used in the other studies. Das andothers attempt to estimate the amount required to restore an individual’swell-being after the individual is infected by a serious disease that couldwell (and, according to their estimates, does) exceed the individual’sincome several times. Other approaches estimate the income lossescaused by HIV and AIDS, or the income loss that would be equivalent tothe welfare loss associated with an infection.
III. The Burden of HIV and AIDS on the Health Sector
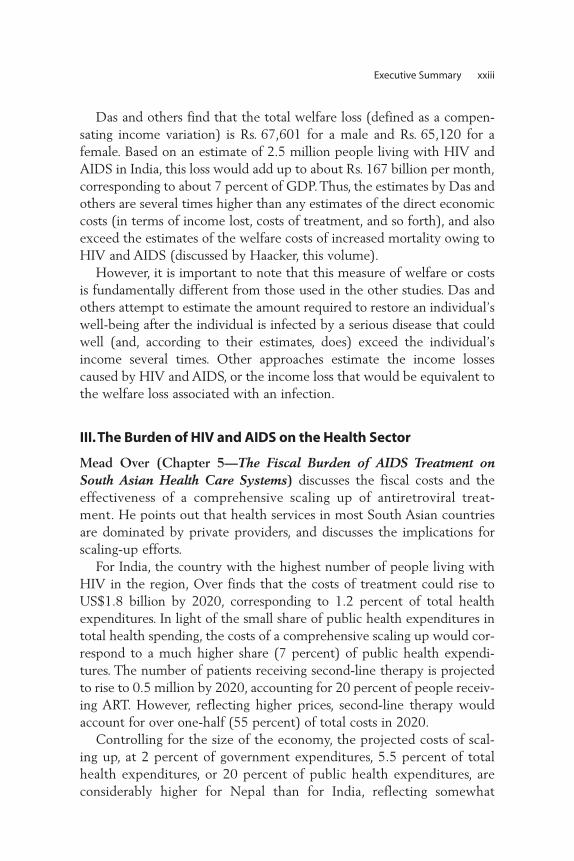
Mead Over (Chapter 5—The Fiscal Burden of AIDS Treatment onSouth Asian Health Care Systems) discusses the fiscal costs and theeffectiveness of a comprehensive scaling up of antiretroviral treat-ment. He points out that health services in most South Asian countriesare dominated by private providers, and discusses the implications forscaling- up efforts.
For India, the country with the highest number of people living withHIV in the region, Over finds that the costs of treatment could rise toUS$1.8 billion by 2020, corresponding to 1.2 percent of total healthexpenditures. In light of the small share of public health expenditures intotal health spending, the costs of a comprehensive scaling up would cor-respond to a much higher share (7 percent) of public health expendi-tures. The number of patients receiving second-line therapy is projectedto rise to 0.5 million by 2020, accounting for 20 percent of people receiv-ing ART. However, reflecting higher prices, second-line therapy wouldaccount for over one-half (55 percent) of total costs in 2020.
Controlling for the size of the economy, the projected costs of scal-ing up, at 2 percent of government expenditures, 5.5 percent of totalhealth expenditures, or 20 percent of public health expenditures, areconsiderably higher for Nepal than for India, reflecting somewhat
Executive Summary xxiii
higher estimates of HIV prevalence and a higher share of public healthexpenditures in Nepal, but primarily Nepal’s lower level of GDP percapita. Another notable finding regards Pakistan, where the costs oftreatment are projected to rise to 6.4 percent of public health expendi-tures, reflecting both a low share of public health expenditures in totalhealth expenditures and a low overall level of health spending.
Analyzing the structure of health care financing in South Asia,Over finds that the share of public financing and of third-partyfinancing in most South Asian countries is low in an international con-text; that is, most health services are financed out of pocket, withoutthe benefit of health insurance. The dominant role of the private sec-tor could potentially mitigate the fiscal burden of scaling up, to theextent that privately financed health providers could be mobilized inscaling up treatment. However, in light of the small role of privateinsurance and the costs of treatment, especially regarding a transitionto second-line treatment, ART may not be affordable for a large num-ber of households.
The latter point is accentuated by an assessment of the costs of treat-ment against the income distribution (using India as an example). For afour-person household, the costs of first-line ART would push a house-hold at the 40th percentile of the income distribution down to thepoverty line, that is, to a level of consumption at par with the 20th per-centile of the income distribution. The costs of second-line treatmentwould exceed the entire income of a four-person household for morethan half of the population.
There are several consequences from these findings regarding access toand the financing of ART. In the absence of public (and free) ART orsome form of insurance, the medical costs of HIV infection alone (not tomention the broader costs described in chapters 3 or 4) put a large pro-portion of the population at risk of poverty. One implication of this is thateconomic constraints may lead to problems with adherence to treatmentin privately financed ART. Further, the limited ability of many householdsto pay “catastrophic” health expenses associated with ART, and the nega-tive externalities associated with poor adherence, suggest a larger role forthe public sector in the provision of ART than is the case for overall pub-lic health services. Finally, the major role of the private sector in SouthAsia gives prominence to the issue of the quality of private vs. publichealth services, and the chapter concludes by summarizing the limitedevidence in this direction.
xxiv Executive Summary
Indrani Gupta, Mayur Trivedi, and Subodh Kandamuthan (Chapter6—Recurrent Costs of India’s Free ART Program) develop a detailedframework for analyzing the recurrent costs of India’s Free AntiretroviralTreatment (ART) Program, illustrating the complexities of obtainingaccurate estimates of unit costs that could be used in planning a scaling-up program.
India’s Free ART Program was launched in 2004, with the objectiveof initially expanding access to antiretroviral treatment in the high-prevalence states, and with the plan of subsequent expansion to otherstates. As of March 2006, there were about 39,000 patients receivingART under the program. The estimates and projections are based on anassumed increase in coverage to 146,000 by 2011, roughly in line withthe program’s objectives.
Gupta and others primarily distinguish among the costs of antiretrovi-ral (ARV) drugs, treatment of opportunistic infections (OI), diagnostictests, outpatient services, and inpatient services, providing detailed docu-mentation of the data sources and assumptions used in deriving the costestimates, and of the types of services rendered at the five participatinghospitals. Recurrent costs that cannot be attributed to ART directly (forexample, hospital staff that is paid a fixed salary, but only spends part ofits time rendering ART services) are assigned to the ART program basedon different measures of utilization.
There is some considerable variation in the costs of ART across par-ticipating sites, with costs ranging from Rs. 971 to Rs. 1,847 per month,with an average of Rs. 1,287. The most important cost componentswere ARV drugs (47 percent on average), CD4 kits and reagents (20percent) and human resources (20 percent). The unit costs of treatmentappear to decline substantially with the number of patients (at least inthe range between 200 and 800 patients per site) and—for two sitesthat started early—between year one and year two of participating inthe Free ART program.
One important finding regards the out-of-pocket expenses of partici-pating in the Free ART program, based on a survey of patients participat-ing in the ART program. These were estimated at Rs. 911 per month. Thelargest items were (additional) food (23 percent), transport (17 percent),and drugs for opportunistic infections (12 percent). Thus, even thoughART treatment is free, the private costs of accessing treatment andother medical costs amount, on average, to about 70 percent of the costsof ART.
Executive Summary xxv

Overall, Gupta and others estimate the recurrent costs of the FreeART Program at Rs. 1,517 million, or US$35 million in 2007 (based onan assumed number of patients of 100,000), and corresponding to about1.5 percent of the total health and family welfare budget.
xxvi Executive Summary

PA R T I
The Epidemiology of HIV andPrevention Strategies

Introduction
After almost three decades, the understanding of the epidemiology ofHIV has greatly improved with respect to the global distribution anddiversity of HIV, the HIV transmission dynamics in different contexts,and effective prevention responses. The dynamics of the epidemic areincreasingly apparent, with sufficient similarities across the continent tospeak broadly of an “Asian” epidemic pattern. Within the Asian epidemic,however, there are important variations.
Experience over the last decades has shown that it is critical to ensurethat the responses to HIV and AIDS are based on a rigorous and objec-tive analysis of the biobehavioral determinants of HIV transmission, andthat they are tailored to address the major drivers of transmission. Often,national and regional responses to HIV and AIDS have been underminedby generic approaches, which do not address the major local drivers of theepidemic in each context. An understanding of both the underlying sim-ilarities and the variations of the pattern of HIV across the region is there-fore central to effective responses to the epidemic in South Asia.
Alongside an improved understanding of the transmission dynamics, wehave learned how important it is to identify and invest in effective, provenHIV interventions, and to monitor their coverage. Crucially, effective
Dynamics of the HIV Epidemic in South Asia
David Wilson and Mariam Claeson
3
C H A P T E R 1

approaches must be undertaken on a large scale and reach a majority ofthose at risk of infection. These principles are particularly important inAsia, where the complexities and disparities within and between countriesregarding the spread and the transmission of HIV compel a well-informedepidemiological reading and effective, focused responses.
This chapter takes stock of the improved knowledge of the epidemiol-ogy of HIV. It provides an overview of the scale and heterogeneity of theHIV epidemic, drawing some lessons from the global experience and dis-cussing the situation in South Asia in some detail. It reviews the regionaltransmission patterns and analyzes key factors and underlying determi-nants that contribute to it. Finally, it summarizes what is known about thestatus of implementation of effective prevention interventions and pro-grams in countries. Understanding the epidemic and applying the lessonslearned about what works have important implications for current prior-ities and the future direction of the epidemic in South Asia.
The Global Context
Before discussing the situation in South Asia in more detail, we summa-rize some lessons learned regarding the global HIV epidemic, to accentu-ate the specific features of the situation in South Asia and provide somebackground for a discussion of links between the profile of the epidemicand prevention priorities. In particular, we discuss improvements in esti-mates of the scale of the HIV epidemic, and key differences in terms ofthe major HIV drivers and transmission modes across countries.
The Scale and Heterogeneity of the Global HIV EpidemicImproved surveillance has yielded important results and insights. Mostimportant, estimates of HIV prevalence used to be primarily based ondata from antenatal clinics (ANCs). Estimating HIV prevalence for theoverall population based on a (possibly small) sample of blood tests frompregnant women poses substantial challenges. In the last five years, theseestimates have been complemented by findings from large-scale popula-tion health surveys in numerous countries, including Cambodia, PapuaNew Guinea, Indonesia, and India. These surveys have enabled us torefine and revise previous estimates of HIV prevalence derived from ante-natal surveys, and have given us more accurate global HIV prevalenceestimates. The results of antenatal and population-based HIV surveillancefor the countries that have completed national population-based HIVsurveys appear below in figure 1.1.
4 Wilson and Claeson

As figure 1.1 shows, population-based estimates are lower than ante-natal estimates in almost all cases, and significantly lower in many cases.The differences are particularly pronounced in parts of East Africa(notably Rwanda and Ethiopia), much of West Africa (including SierraLeone, Burkina Faso, and Ghana), and in Asia. Cambodia’s population-based HIV prevalence of 0.6 percent is also far lower than its antenatalestimate of 2.6 percent, as are the differences in India, discussed below.
Although the estimates based on ANC surveillance show higher levelsthan subsequent population-based estimates, the ANC monitoring con-tinues to serve an important purpose in following and analyzing nationaltrends and alerting policy makers to generalized spread of the epidemicin areas of high prevalence. However, improved and expanded biobehav-ioral surveillance has given us greater insight into the heterogeneity ofHIV globally, enabling national governments and development partnersto prepare more differentiated national AIDS strategies and programs.
The global HIV epidemic is far more heterogeneous than previouslyrecognized, with strong linkages between the HIV caseload, the majortransmission routes, and the optimal prevention interventions and strate-gies required to curb transmission. A generalized epidemic, as seen inSouth Africa and Papua New Guinea, is predominantly driven by unsafesex among the general population. Where HIV is predominantly drivenby injecting drug use and unsafe sex among vulnerable groups at highest
Dynamics of the HIV Epidemic in South Asia 5
0
10
20
30
40
Bo
tsw
ana
Leso
tho
Sou
th A
fric
a
Zam
bia
Mal
awi
Ken
ya
Ug
and
a
Tan
zan
ia
Rwan
da
Eth
iop
ia
Cô
te d
’Ivo
ire
Bu
rkin
a
countries
Sier
ra L
eon
e
Cam
ero
on
Gu
inea
Gh
ana
Sen
egal
Mal
i
Cam
bo
dia
Hai
ti
Do
min
ican
Rep
ub
lic
Peru
antenatal population
HIV
pre
vale
nce
(%)
Figure 1.1 Antenatal and Population-Based Estimates of HIV Prevalence(percent of population, ages 15–49)
Source: UNAIDS, DHS.

risk, such as sex workers and their clients, and men having sex with men,a pattern of concentrated epidemics evolve. However, these are notmutually exclusive epidemic patterns, and several other key factors, suchas concurrent partnership and male circumcision, contribute to the epi-demic dynamics. Although South Asia primarily has concentrated epi-demics, injecting drug use (IDU) can jump start a rapidly spreadingepidemic within and beyond the IDU community, fueled by sexual trans-mission among partners, and through a nexus of injecting drug use andcommercial sex work, as shown in China and Indonesia. This is a situa-tion to be alert to in several parts of South Asia (Afghanistan, Nepal,northeast India, Pakistan, and Bangladesh).
Key Factors in HIV TransmissionThere is increasing evidence that two factors appear to play a major rolein understanding HIV transmission globally and the nature of concen-trated epidemics specifically: the first factor is acute infection, coupledwith concurrent sexual partnerships, and the second is the presence (orabsence) of male circumcision. These factors, and the role that injectingdrug use plays in the Asian epidemic dynamics, will be discussed here, asthey are critical pieces in our understanding of why South Asia is unlikelyto face generalized epidemics and why our discussion on the impact ofthe epidemic and the risk to development in the following chapters arenot centered around hypotheses and projections of large-scale generalizedepidemics, but instead on the size, spread, and consequences of concen-trated epidemics.
The size of an HIV epidemic is significantly influenced by both the rateand patterns of sexual partner change. While there is a robust associationbetween the number of sexual partners and HIV infection in many con-texts, patterns of partner change may be at least as important (Halperin andEpstein 2004). Growing biological evidence shows that HIV viral load, andthus infectivity, is far higher during acute HIV infection, that is, in the ini-tial weeks after HIV infection (Chao et al. 1994; Quinn et al. 2000). Thisleads to the important distinction between serial and concurrent sexualpatterns (Halperin and Epstein 2004). In serial partnerships, one typicallyhas one ongoing sexual relationship at a time. In concurrent partnerships,one may be in a sexual network with more than one ongoing sexual rela-tionship at a time. Whereas serial partnerships limit exposure to a partnerwith acute HIV infection (who has higher infectivity), concurrent partner-ships expose everybody in an ongoing sexual network to greater risk.Mathematical models suggest that concurrent sexual partnerships may
6 Wilson and Claeson

increase HIV transmission tenfold—projections that are firmly supportedby growing biological evidence of variability in viral load and infectivity(Morris et al. 1997).
As shown in figure 1.2 below, HIV infectiousness varies over the dis-ease stage, with infectiousness far higher in the first weeks or months afterinitial seroconversion, during viremia. Infectiousness then declines duringasymptomatic infection, before climbing again during HIV illness.
If a person has multiple concurrent sexual partnerships during acuteinfection, he or she may infect several partners. If they in turn have con-current sexual partnerships, a cascading chain of infections may rapidlyoccur. In contrast, serial or sequential sexual partnerships may limit thenumber of partners who are exposed during acute infection, essentiallytrapping the virus in a dyadic relationship.
There is some preliminary evidence that concurrent sexual partner-ships may be lower in Asia than Africa, suggesting a lower potentialfor widespread sexual epidemics in Asia. These data are presented infigure 1.3 below.
These patterns tentatively suggest that generalized epidemics areunlikely to occur in East Asia. The extent to which we can extrapolateand generalize from these studies to the South Asian epidemic is debat-able since more data is needed from South Asian populations on sexualnetworks and practices, including the frequency of multiple sexual part-ners. Data from the district level in India, for example from the Bagalkotdistrict of Karnataka state, show a heterogeneous picture, with signifi-cant differences in sexual networks and practices between neighboring
Dynamics of the HIV Epidemic in South Asia 7
Figure 1.2 HIV Infectiousness by Disease Stage
1/25 - 1/1,000
disease stage
seroconversion(acute infection)
three weeks months to years
asymptomaticinfection
HIV progression(falling CD4 count)
AIDS
2
3
(log
10 c
op
ies
ml–1
)
4
5
1/100 - 1/1,000
1/50 - 1/1,000
Risk oftransmission
1/1,000 - 1/10,000
Source: Galvin and Cohen 2004.

districts and subdistricts influencing HIV prevalence rates (India-CanadaCollaborative HIV/AIDS Project (ICHAP) 2004).
An association between HIV and the absence of male circumcision hasbeen noted in high HIV prevalence areas since the late 1980s. The follow-ing analysis is not intended as an argument for male circumcision as a pri-ority public health intervention in South Asia, but as a heuristic tounderstand epidemic potential in South Asia. Scientists have noted anassociation between male circumcision and HIV rates since the 1980s(Bongaarts et al. 1989), including in India (Reynolds et al. 2004). Foryears, the evidence was considered plausible, but many observers haveargued that it is difficult to disentangle other factors, such as religion, cul-ture, sexual behavior, and geography as potential confounding factors.However, the weight of evidence has grown stronger. A meta-analysisof 38 studies from Africa concluded that uncircumcised men weremore than twice as likely to have HIV as uncircumcised men (Weiss etal. 1999). A longitudinal study of male sexual partners of HIV-positivewomen in Rakai, Uganda, found that 40 out of 137 uncircumcised menand 0 out of 50 circumcised men acquired HIV (Grey et al. 2000).Ecological evidence demonstrates an increasingly close geographic
8 Wilson and Claeson
Figure 1.3 Percent of Adults Reporting Two or More Regular Partners in Last Year
0
10
20
30
40
50
60
Singapore
Sri Lanka
Thailand
Manila
Kenya
Tanzania
Lusaka
Côte d
’Ivoire
Lesoth
o
malefemale
% a
du
lts
rep
ort
ing
2 o
r mo
rere
gu
lar p
artn
ers
in la
st y
ear
countries or cities
Source: Halperin and Epstein 2004, adapted from the Lancet.
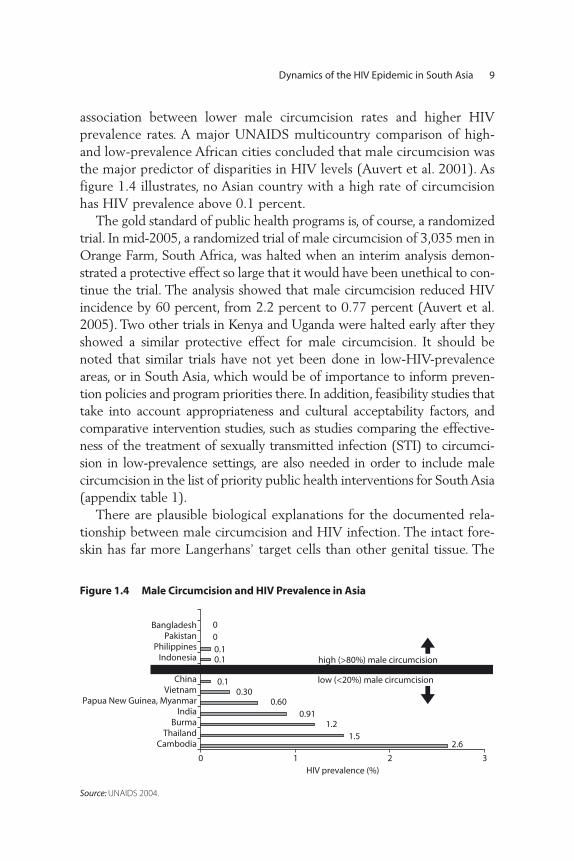
association between lower male circumcision rates and higher HIVprevalence rates. A major UNAIDS multicountry comparison of high-and low-prevalence African cities concluded that male circumcision wasthe major predictor of disparities in HIV levels (Auvert et al. 2001). Asfigure 1.4 illustrates, no Asian country with a high rate of circumcisionhas HIV prevalence above 0.1 percent.
The gold standard of public health programs is, of course, a randomizedtrial. In mid-2005, a randomized trial of male circumcision of 3,035 men inOrange Farm, South Africa, was halted when an interim analysis demon-strated a protective effect so large that it would have been unethical to con-tinue the trial. The analysis showed that male circumcision reduced HIVincidence by 60 percent, from 2.2 percent to 0.77 percent (Auvert et al.2005). Two other trials in Kenya and Uganda were halted early after theyshowed a similar protective effect for male circumcision. It should benoted that similar trials have not yet been done in low-HIV-prevalenceareas, or in South Asia, which would be of importance to inform preven-tion policies and program priorities there. In addition, feasibility studies thattake into account appropriateness and cultural acceptability factors, andcomparative intervention studies, such as studies comparing the effective-ness of the treatment of sexually transmitted infection (STI) to circumci-sion in low-prevalence settings, are also needed in order to include malecircumcision in the list of priority public health interventions for South Asia(appendix table 1).
There are plausible biological explanations for the documented rela-tionship between male circumcision and HIV infection. The intact fore-skin has far more Langerhans’ target cells than other genital tissue. The
Dynamics of the HIV Epidemic in South Asia 9
Figure 1.4 Male Circumcision and HIV Prevalence in Asia
0 21 3
CambodiaThailand
BurmaIndia
Papua New Guinea, MyanmarVietnam
ChinaFiji
IndonesiaPhilippines
PakistanBangladesh
low (<20%) male circumcision
HIV prevalence (%)
high (>80%) male circumcision
2.6
0
1.51.2
0.910.60
0.300.1
0.10.10
Source: UNAIDS 2004.

internal foreskin has a soft mucosal surface, unlike the hardened skin-likesurface of the external foreskin. Circumcision results in keratinization, ortoughening of the glans. An intact foreskin provides the optimal environ-ment for infectious agents (Patterson et al. 2002; Szabo et al. 2000).
The implications of these data for the South Asia region may be sum-marized as follows. Male circumcision is an important explanatory fac-tor in our understanding of the epidemic potential and the nature ofconcentrated versus generalized epidemics. Male circumcision is wide-spread in Pakistan, Bangladesh, and Afghanistan, and uncommon else-where in the region. Thus, Pakistan, Bangladesh, and Afghanistan mayhave a more limited potential for heterosexual HIV epidemics. However,injecting drug use may ignite potential epidemics, particularly if thereis a nexus between injecting drug use and sex work. HIV transmissionamong men having sex with men may also play a proportionatelygreater role in Pakistan, Bangladesh, and Afghanistan, because of greatertransmission efficiency related to anal intercourse, even among circum-cised men. Conversely, the absence of extensive male circumcision mayincrease the relative epidemic potential in other South Asian countries,particularly where it coincides with other behavioral and structural fac-tors, as discussed below.
Injecting drug use may trigger heterosexual HIV transmission in con-texts where it may otherwise have been unlikely, including in Pakistan,Bangladesh, and Afghanistan, and amplify it where the potential alreadyexists. A nexus between injecting drug use and sex work may play a par-ticularly important role in igniting and amplifying HIV transmission. TheGolden Crescent, which is the nerve center of the global opium trade,straddles South Asia, the Golden Triangle flanks South Asia, and traffick-ing routes transect the entire region. Four countries in South Asia aredirectly affected by these production areas—Afghanistan and Pakistan bythe Golden Crescent, and India and Bangladesh by the Golden Triangle(United Nations Office on Drugs and Crime (UNODC) 2004). It is clearfrom map 1.1, showing the two major drug-producing areas in Asia, thatHIV risk transcends national borders and requires transregional program-ming, linking drug-related HIV prevention activities in Afghanistan andparts of Pakistan more closely to Iran, and Central Asia and parts of Indiaand Bangladesh more closely to Myanmar and East Asia.
Drug use contributes to the HIV epidemic mainly through the use ofcontaminated needles, syringes, and other injecting equipment, and fueledby the practice of sharing among drug users (Ohiri 2006). Injecting drugusers are therefore at increased risk, while other drug users also havepotential risks from high-risk sexual behavior. The synergy between
10 Wilson and Claeson

Dynamics of the HIV Epidemic in South Asia 11
Map 1.1 Two Major Drug-Producing Areas that Affect South Asia
injecting drug use and sex work is implicated in the ignition and contin-uation of most epidemics in Asia.
Globally, there are about 13.2 million injecting drug users, of whombetween 1.3 million and 5.3 million live in South and Southeast Asia(UNODC 2006). IDUs tend to be particularly vulnerable to HIV infec-tion because of their highly stigmatized and hidden behavior, and therapid and efficient way in which HIV spreads through the sharing of con-taminated needles, syringes, and other drug use equipment. The demandfor drugs is relatively inelastic to price, whereas the demand for a specifictype or preparation of a drug (such as the pure form of inhaled heroin) isprice elastic. Therefore, a drug addict will continue to demand drugs untilhe or she is cured of his or her addiction, and when the cost of a partic-ular drug increases (or the drug becomes scarce), the user quickly shiftsto other cheaper substitutes, which are often injected.
There is evidence of increased injecting and sharing of injecting equip-ment in the South Asian region. There is an association between increasedinjecting risk behavior and (i) length of injecting career (the longer a per-son has been injecting, the more likely he or she is to share); (ii) fre-quency of injection (the more frequent, the greater likelihood of sharingand reusing needles); (iii) type of drug used (increased sharing is oftenobserved in heroin users, and some drugs need to be mixed with bloodbefore they are injected (Ohiri 2006)). If such drugs are shared, then therisk of infection increases. The reasons often given for sharing injecting
Source: UNODC 2004.

equipment include the unavailability of needles and syringes, due to theirhigh relative cost and inaccessibility; fear of being caught with injectingparaphernalia, which in many places remains illegal; inadequate knowl-edge about HIV and AIDS, other diseases, and the risk of sharing needlesand syringes; the use of shooting galleries and professional injectors,where injecting equipment is shared and reused; and group norms and rit-uals associated with injecting.
Thus, we have examined some of the factors that explain the dynam-ics of HIV transmission. To understand HIV transmission in general, andthe heterogeneity in South Asia specifically, we need to take into consid-eration these key biological and behavioral factors and how they interact:infectivity during early HIV infection, concurrent unprotected sexualpartnership, sexual networks, including male-to-male sex and commercialsex work, male circumcision, and injecting drug use practices and theirsocioeconomic determinants. In the next section of this chapter we willexamine how these factors play out in the South Asian region.
HIV Transmission Patterns in South Asia
In South Asia, as in the rest of Asia, the epidemic is driven by the preva-lence of risky practices, such as injecting drug use and unprotected sex,among vulnerable groups. The overall size of the Asian epidemic dependson the prevalence and transmission of HIV within and between vulnerablegroups at high risk; their size; number of sexual or injecting partners; unpro-tected sex with partners, spouses, and clients; and the extent of preventivemeasures, such as condom use and clean needle exchange.
In some Asian countries, such as Thailand, Cambodia, and parts ofIndia, the scale and frequency of commercial unprotected sex havebeen sufficient to ignite sexual epidemics among sex workers, theirclients, and a growing number of the clients’ sexual partners. In manycountries, such as Indonesia and China, injecting drug use triggers epi-demics that spread to sex workers, then to their clients and beyond. Inmany Asian countries, prisoners inject drugs and they constitute a pri-ority group in their own right. Mobility can amplify the problem, put-ting truckers and their helpers, migrants, and refugees at higher risk, asis the case, for example, in Afghanistan. Cross-border mobility of sexworkers also contributes to different exposure risks, as shown by thedifferent HIV prevalence rates among sex workers in Nepal, for exam-ple, who cross the border to India to sell sex. As will be discussed infuture sections, in the absence of effective prevention responses among
12 Wilson and Claeson

Dynamics of the HIV Epidemic in South Asia 13
vulnerable groups in South Asia, HIV spreads inexorably among vulner-able groups and to their immediate sexual partners.
An understanding of sexual and injecting practices, and their determi-nants in each context, is central to an informed response that requiresboth an understanding of vulnerability and risk, and how to engage andreach vulnerable groups with effective responses. Widespread stigmamakes it harder to reach vulnerable groups and to implement provenapproaches. An informed sociobehavioral understanding and compellingevidence base will better assist countries to develop effective approachesto reaching and working with vulnerable groups.
The South Asian countries demonstrate all these complexities. Thereis a growing body of biological and behavioral surveillance and researchin South Asia, which provides the basis for a better understanding ofSouth Asia’s epidemics. India’s data-driven response can serve as a modelfor evidence-based planning and programming (Claeson and Alexander2008); however, most studies are seldom analyzed and interpreted in anintegrated, analytical manner. There is a continuing need for rigorousanalysis and synthesis of the major biobehavioral factors and drivers ofthe epidemic, the structural determinants, and the trends in South Asia’sHIV epidemic, reinforced by an equally rigorous review of the evidencebase for various interventions, and a review of the scope and reach ofexisting programs. Such analyses are particularly important at the locallevel. It is vital to examine the heterogeneity of the epidemic across andwithin South Asia. The notion of regional or even national epidemicsbelies the reality of multiple, variegated local epidemics.
By the early 2000s, most countries in South Asia had established someform of sentinel serological surveillance. In addition, India, Nepal,Pakistan, and Bangladesh have initiated second-generation surveillance,and have conducted at least two rounds of behavioral surveillance. Basedon these data, South Asia’s epidemic is summarized in table 1.1.
South Asia’s most severe epidemics are in India and Nepal, where sig-nificant transmission occurs through sex work, injecting drug use, andunprotected sex between men. Significant numbers of both men andwomen have HIV. Both Pakistan and Bangladesh face growing epidemics,primarily among men sharing injecting equipment and men having sexwith men. HIV rates remain low among sex workers and there is still anopportunity to avert a heterosexual epidemic. Although there are limitedHIV data for Afghanistan, it must act urgently to limit HIV infection inits growing population of injecting drug users. Other countries—Bhutan,the Maldives, and Sri Lanka—have low HIV prevalence rates.

14 Wilson and Claeson
Table 1.2 Estimated Number of PeopleLiving with HIV in South Asia
CountryEstimated number of
people with HIV
Afghanistan >1,000
Bangladesh 11,000
Bhutan >500
India 2,450,000
Maldives n.a.
Nepal 75,000
Pakistan 80,000
Sri Lanka 5,000
Source: World Bank 2007.
Based on data from UNAIDS, the World Bank estimates that 2 millionto 3.5 million people in South Asia may have HIV (table 1.2). This esti-mate is dominated by India, which has an estimated 2.45 million peopleliving with HIV, with a 95 percent confidence interval of 1.75 million to3.15 million people living with HIV.
IndiaIndia’s HIV estimates were revised significantly in July 2007, after theresults of the National Family Health Survey, India’s first nationalpopulation-based HIV survey, yielded a lower adjusted HIV prevalencerate (0.41) than previous estimates (0.92) based on antenatal data. Therevised and previous estimates are summarized in table 1.3 below.
With approximately 30 percent of Asia’s population, India has overone-half of the continent’s estimated HIV infections. The heterogeneity of
Table 1.1 Overview of HIV Prevalence in South Asia, 2007(Percent)
CountryAdult HIV
prevalence
SW HIV prevalence
MSM HIVprevalence
IDU HIVprevalence
India 0.36 2.6–60 2–20 0–50
Nepal 0.49 1.4–16 n.a. 22–68
Pakistan 0 0–0.5 0–2 0.5–23
Bangladesh 0 0–1.7 0–0.8 0–4.9
Afghanistan 0 n.a. n.a. 0–3
Sri Lanka 0 0–1 0–1 n.a.
Bhutan 0 n.a. n.a. n.a.
Source: World Bank 2007.

Dynamics of the HIV Epidemic in South Asia 15
the HIV epidemic in India is critically important. Given India’s size andcomplexity, it is best analyzed as a continent, some of whose states arelarger than many African countries, and many of whose districts are largerthan some African countries. When its size and diversity are acknowledgedin this manner, the heterogeneity of its epidemic becomes easier to recog-nize. HIV in India is concentrated in a few high-prevalence states—insouth, west and northeast India—specifically Tamil Nadu, Karnataka, andAndhra Pradesh in south India; Maharashtra and Goa in west India; andMizoram, Manipur, and Nagaland in northeast India. Data from Kumaret al. (2004) suggest that HIV prevalence in south, west and northeastIndia is approximately four- to five-fold higher than the rest of India(figure 1.5). Data also suggest that people in south and west India havesignificantly more sexual partners.
Table 1.3 Revised HIV Estimates in India
Old official estimate New official estimate
People living with HIV (PLHIV), point
estimate
5.7 million 2.45 million
PLHIV, 95% confidence interval 1.75–3.15 Million
Adult number of PLHIV (ages 15–9) 5.2 million 2.3 million
Adult HIV prevalence rate (ages 15–49,
percent)
0.92 0.41
Source: NACO 2008.
Figure 1.5 HIV Prevalence in Different Indian Regions
0
0.5
1
1.5
HIV
pre
vale
nce 2
2.5
3
1998 1999 2000 2001years
2002 2003
northeast south north
Source: Kumar et al 2005.
16 Wilson and Claeson
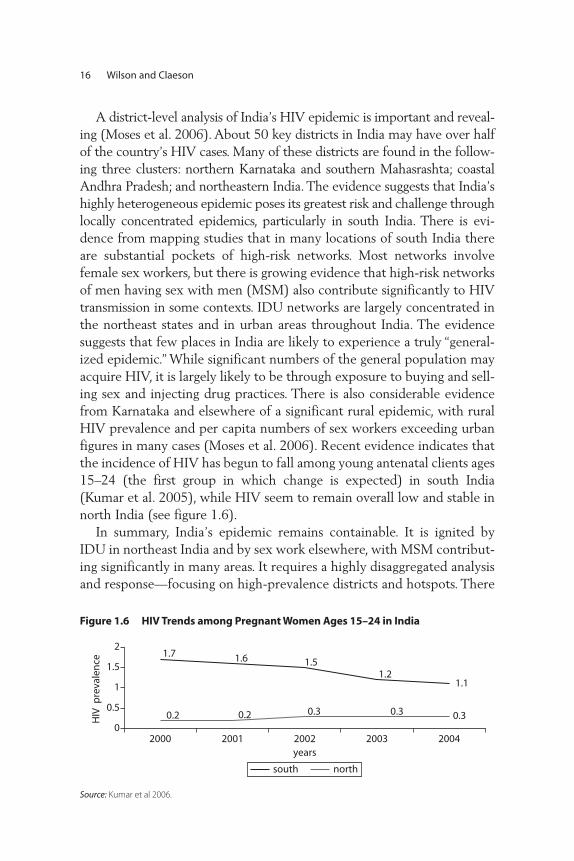
Figure 1.6 HIV Trends among Pregnant Women Ages 15–24 in India
1.7 1.6 1.51.2
1.1
0.2 0.2 0.3 0.3 0.30
0.5
1
1.5
2
2000 2001 2002 2003 2004years
HIV
pre
vale
nce
south north
Source: Kumar et al 2006.
A district-level analysis of India’s HIV epidemic is important and reveal-ing (Moses et al. 2006). About 50 key districts in India may have over halfof the country’s HIV cases. Many of these districts are found in the follow-ing three clusters: northern Karnataka and southern Mahasrashta; coastalAndhra Pradesh; and northeastern India. The evidence suggests that India’shighly heterogeneous epidemic poses its greatest risk and challenge throughlocally concentrated epidemics, particularly in south India. There is evi-dence from mapping studies that in many locations of south India thereare substantial pockets of high-risk networks. Most networks involvefemale sex workers, but there is growing evidence that high-risk networksof men having sex with men (MSM) also contribute significantly to HIVtransmission in some contexts. IDU networks are largely concentrated inthe northeast states and in urban areas throughout India. The evidencesuggests that few places in India are likely to experience a truly “general-ized epidemic.” While significant numbers of the general population mayacquire HIV, it is largely likely to be through exposure to buying and sell-ing sex and injecting drug practices. There is also considerable evidencefrom Karnataka and elsewhere of a significant rural epidemic, with ruralHIV prevalence and per capita numbers of sex workers exceeding urbanfigures in many cases (Moses et al. 2006). Recent evidence indicates thatthe incidence of HIV has begun to fall among young antenatal clients ages15–24 (the first group in which change is expected) in south India(Kumar et al. 2005), while HIV seem to remain overall low and stable innorth India (s ee figure 1.6).
In summary, India’s epidemic remains containable. It is ignited byIDU in northeast India and by sex work elsewhere, with MSM contribut-ing significantly in many areas. It requires a highly disaggregated analysisand response—focusing on high-prevalence districts and hotspots. There

Dynamics of the HIV Epidemic in South Asia 17
is evidence of a significant rural epidemic in parts of south India.Encouragingly, HIV appears to be falling in south India. India has mademajor strides and recorded notable successes in its response to the HIVepidemic, discussed more in subsequent sections. Nationally, the epi-demic has slowed and may be stabilizing or falling in south India. In thestate with one of the earliest and most severe epidemics in India, TamilNadu, several indicators point to encouraging trends, although vulnera-bility and risk remain a challenge.
NepalAlthough surveillance in Nepal is limited and has been disrupted bypolitical unrest, the epidemic appears to be more severe than recog-nized. It is somewhat similar in character to that observed in parts ofIndia and it appears to have the potential for a significant epidemicamong vulnerable groups at high risk, especially sex workers and inject-ing drug users. Injecting drug use is widespread in Nepal and overlapswith commercial sex. Migration to India, in particular to Mumbai, is alsoassociated with increased HIV prevalence. However, with better data athand, it appears the HIV prevalence rate stabilized between 2004 and2006. These include surveillance data among populations at higher risk(that is, integrated biological and behavioral surveys among female sexworkers (FSW), IDUs, MSM, and migrants, antenatal clinic data, popu-lation-based surveys such as the Nepali Demographic and HealthSurvey, and case reporting (HIV estimations briefing by the NationalCenter for AIDS and STD Control, April 2008). HIV prevalence amongadults is estimated at 0.49 percent, with a consistent distribution acrossregions. Almost 50 percent of all HIV infections are in the area aroundthe Terai Highway and 20 percent are in the far Western hills.
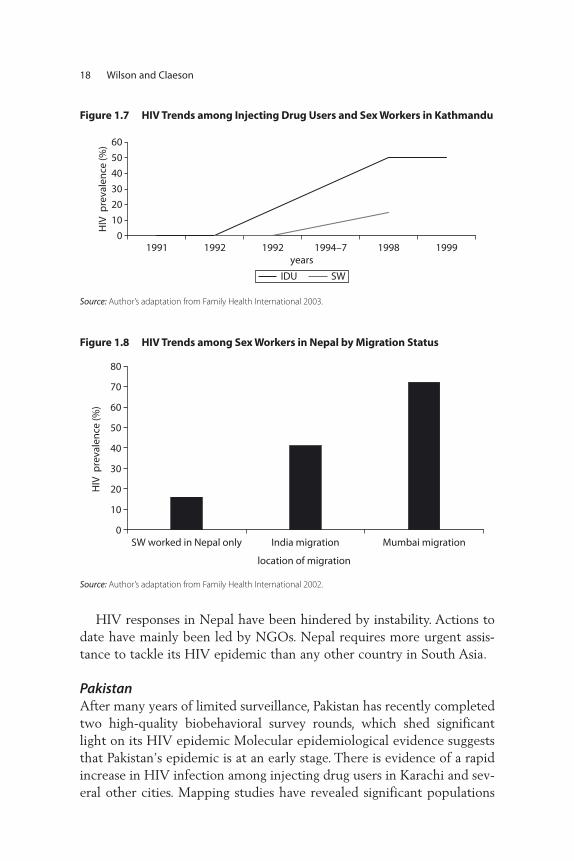
As elsewhere in South Asia, the HIV epidemic in Nepal is likely tocontinue to be largely driven by injecting drug use and sex work—and inparticular, the nexus between the two. As figure 1.7 shows, HIV increasedsharply among injecting drug users and sex workers in Kathmandu over aperiod in the mid- to late 1990s, and these rates seem to have stabilizedamong FSW and IDUs in recent years (2004–06). HIV prevalence ratesin a study of 400 MSM show 6.7 percent HIV prevalence among malesex workers (MSW) and 2.3 percent among non sex workers (MSM)(Family Health International 2007).
The extent to which migration to India is a risk factor is compellinglyillustrated in figure 1.8 below. An estimated 40 percent of Nepal’s epi-demic is linked to migration to India, and particularly Mumbai.
18 Wilson and Claeson
Figure 1.8 HIV Trends among Sex Workers in Nepal by Migration Status
0
10
20
30
40
50
60
70
80
SW worked in Nepal only India migration Mumbai migration
HIV
pre
vale
nce
(%)
location of migration
Source: Author’s adaptation from Family Health International 2002.
HIV responses in Nepal have been hindered by instability. Actions todate have mainly been led by NGOs. Nepal requires more urgent assis-tance to tackle its HIV epidemic than any other country in South Asia.
PakistanAfter many years of limited surveillance, Pakistan has recently completedtwo high-quality biobehavioral survey rounds, which shed significantlight on its HIV epidemic Molecular epidemiological evidence suggeststhat Pakistan’s epidemic is at an early stage. There is evidence of a rapidincrease in HIV infection among injecting drug users in Karachi and sev-eral other cities. Mapping studies have revealed significant populations
Figure 1.7 HIV Trends among Injecting Drug Users and Sex Workers in Kathmandu
0
10
20
30
40
50
60
1991 1992 1992 1994–7 1998 1999years
HIV
pre
vale
nce
(%)
IDU SW
Source: Author’s adaptation from Family Health International 2003.
Dynamics of the HIV Epidemic in South Asia 19
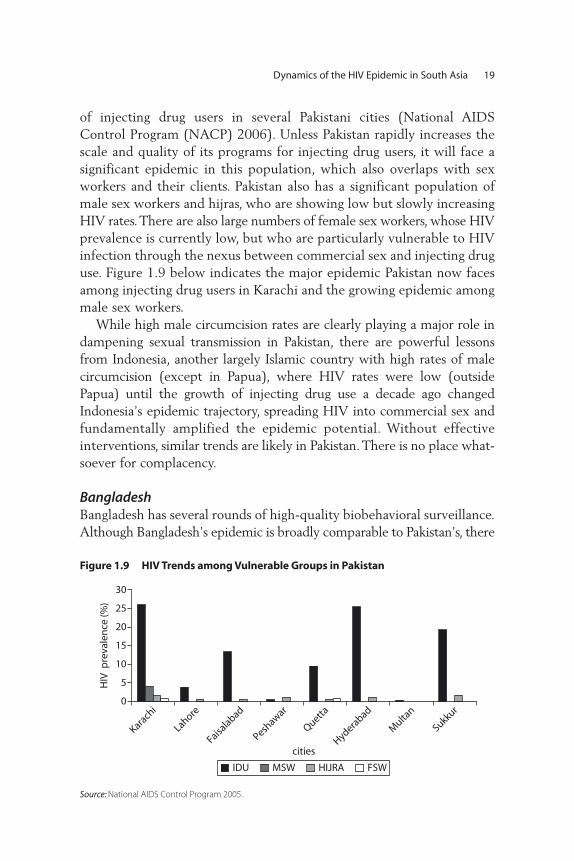
of injecting drug users in several Pakistani cities (National AIDSControl Program (NACP) 2006). Unless Pakistan rapidly increases thescale and quality of its programs for injecting drug users, it will face asignificant epidemic in this population, which also overlaps with sexworkers and their clients. Pakistan also has a significant population ofmale sex workers and hijras, who are showing low but slowly increasingHIV rates. There are also large numbers of female sex workers, whose HIVprevalence is currently low, but who are particularly vulnerable to HIVinfection through the nexus between commercial sex and injecting druguse. Figure 1.9 below indicates the major epidemic Pakistan now facesamong injecting drug users in Karachi and the growing epidemic amongmale sex workers.
While high male circumcision rates are clearly playing a major role indampening sexual transmission in Pakistan, there are powerful lessonsfrom Indonesia, another largely Islamic country with high rates of malecircumcision (except in Papua), where HIV rates were low (outsidePapua) until the growth of injecting drug use a decade ago changedIndonesia’s epidemic trajectory, spreading HIV into commercial sex andfundamentally amplified the epidemic potential. Without effectiveinterventions, similar trends are likely in Pakistan. There is no place what-soever for complacency.
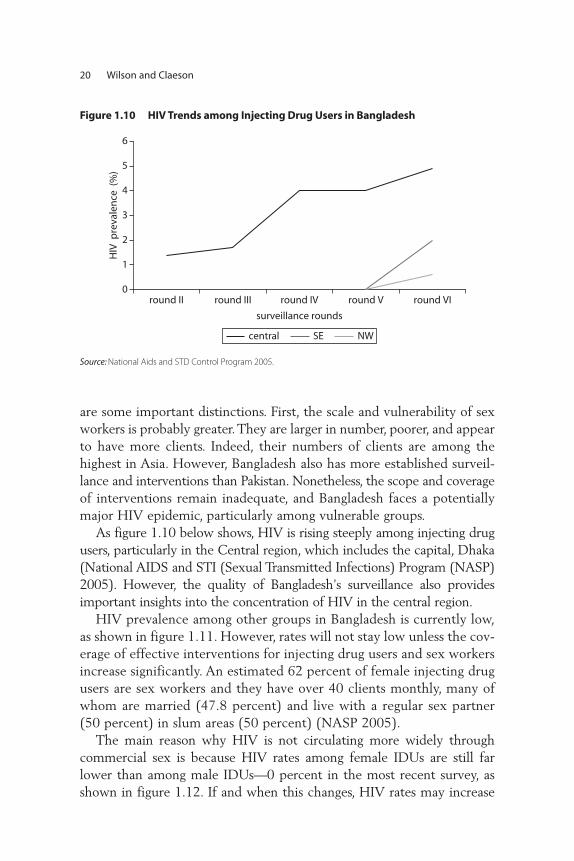
BangladeshBangladesh has several rounds of high-quality biobehavioral surveillance.Although Bangladesh’s epidemic is broadly comparable to Pakistan’s, there
Figure 1.9 HIV Trends among Vulnerable Groups in Pakistan
0
5
10
15
20
25
30
Karach
i
Lahore
Faisalabad
Peshawar
Quetta
Hyderabad
Multa
n
Sukkur
HIV
pre
vale
nce
(%)
cities
IDU MSW HIJRA FSW
Source: National AIDS Control Program 2005.
20 Wilson and Claeson
Figure 1.10 HIV Trends among Injecting Drug Users in Bangladesh
0
1
2
3
4
5
6
round II round III round IV round V round VI
surveillance rounds
HIV
pre
vale
nce
(%
)
central SE NW
Source: National Aids and STD Control Program 2005.
are some important distinctions. First, the scale and vulnerability of sexworkers is probably greater. They are larger in number, poorer, and appearto have more clients. Indeed, their numbers of clients are among thehighest in Asia. However, Bangladesh also has more established surveil-lance and interventions than Pakistan. Nonetheless, the scope and coverageof interventions remain inadequate, and Bangladesh faces a potentiallymajor HIV epidemic, particularly among vulnerable groups.
As figure 1.10 below shows, HIV is rising steeply among injecting drugusers, particularly in the Central region, which includes the capital, Dhaka(National AIDS and STI (Sexual Transmitted Infections) Program (NASP)2005). However, the quality of Bangladesh’s surveillance also providesimportant insights into the concentration of HIV in the central region.
HIV prevalence among other groups in Bangladesh is currently low,as shown in figure 1.11. However, rates will not stay low unless the cov-erage of effective interventions for injecting drug users and sex workersincrease significantly. An estimated 62 percent of female injecting drugusers are sex workers and they have over 40 clients monthly, many ofwhom are married (47.8 percent) and live with a regular sex partner(50 percent) in slum areas (50 percent) (NASP 2005).
The main reason why HIV is not circulating more widely throughcommercial sex is because HIV rates among female IDUs are still farlower than among male IDUs—0 percent in the most recent survey, asshown in figure 1.12. If and when this changes, HIV rates may increase

Dynamics of the HIV Epidemic in South Asia 21
steeply among clients buying sex. Such evidence underscores the pivotalrole that effective programs for injecting drug users will play in determin-ing the future of Bangladesh’s HIV epidemic.
The record on programmatic effectiveness in preventing the spreadof HIV to date is mixed. While large-scale needle and syringe exchangeprograms (NSEPs) for IDUs in Bangladesh have shown strong associa-tions between participation in those programs and lower rates of shar-ing equipment and less likelihood of reported STIs, the HIV
Figure 1.11 HIV Prevalence among Other Groups in Bangladesh
0.2 00.4
0
0.6 0.40.01
0
1
2
3
4
5
SW HIJRA MSM
HIV
pre
vale
nce
(%)
years
central NE SE NW
Source: NASCP 2005.
Figure 1.12 HIV Prevalence among Male and Female Injecting Drug Users inBangladesh
00
1
2
3
4
5
6
7
8
male IDU female IDU
Central A1 Central A2 Central A
HIV
pre
vale
nce
(%)
Source: NASCP 2005.

22 Wilson and Claeson
prevalence rates (2004) have varied from 4 percent (16 out of 403) inone geographic area to zero percent (none out of 605) in another area(The Monitoring the AIDS Pandemic (MAP) Report 2005. Morerecent data have shown similar differences in behavior change out-comes and HIV prevalence rates among locations. For example, needleand syringe sharing among IDUs has worsened or remained unchangedin the cities sampled for biobehavioral surveys, with the exception ofDhaka, where there has been a reduction in reported sharing from 85percent to 55 percent. However, Dhaka, with the greatest reduction inneedle sharing, is also where HIV has been increasing among IDUs,reaching 10 percent in some pockets, illustrating that it is imperativeto scale up comprehensive harm reduction approaches and carefullymonitor the quality of the services.
AfghanistanThe HIV epidemic is at an early stage in Afghanistan, concentratedamong high-risk groups, mainly IDUs and their partners. Due to thecurrent increase in injecting drug use, there is great potential for therapid spread of HIV, as has been the case in neighboring countries andin other parts of Asia. A study among IDUs in Kabul city found that 3percent of the IDUs were already HIV positive (Todd et al. 2006), andthe officially reported number of HIV-positive cases in Kabul was 245(August 2008), most of them men. UNAIDS and WHO, however, esti-mate that there may be more than 2,000 HIV-positive cases inAfghanistan. Evidence from ex-inmates suggests that injecting drug usetakes place in Afghan prisons, a situation also found in many othercountries. Long-distance truck drivers and their helpers, and the manyabandoned street children are also vulnerable groups, potentially at riskfor HIV infection. A social mapping and situation assessment of keypopulations at high risk of HIV in three cities of Afghanistan showedquite different injecting practices (Chase et al. 2007). Most of the sur-veyed IDUs had injected within the previous six months, varying from77 percent to 29 percent in different cities. Most IDUs injected in openspaces in one city, whereas those in another city were more likely toinject at home or in other venues. Most IDUs in the cities injectedheroin. Overall, 75 percent of IDUs reported ever having sex with afemale, and almost 50 percent had paid a female for sex. Approximately21 percent of IDUs reported ever having had sex with another male.However, those reporting they had paid for sex with a female or sexwith another man within the past six months was uncommon. Condom
use appears to be low, with over 80 percent of IDUs who had paid forsex reporting never using a condom during paid sex.
Several other factors contribute to the high risk for the rapid spread ofHIV, including war and conflict, migration, displacement, and poverty.Approximately 8 million Afghans spent some time living abroad asrefugees, in Pakistan (5 million) and Iran (3 million). Today, about 1 millionwidows and 1.6 million orphans, 4 million returnees, and 500,000 inter-nally displaced persons reside in Afghanistan, while almost 4 millionAfghan refugees still live in Pakistan and Iran. In addition, the literacy ratein the general population is very low (36 percent and lowest amongwomen, at 21 percent), with little awareness about HIV and AIDS andalmost no condom use. Unsafe blood transfusion adds to the risk ofspreading HIV to the general population, with only 30 percent of trans-fused blood being tested for HIV.
The current drug situation is amplifying the problem. Production ofopium in Afghanistan increased by 59 percent in 2006, and now exceeds6,000 tons (equivalent to 600 tons of heroin) representing 92 percent ofthe opium produced in the world. The opium crop is estimated to provideUS$2.7 billion to Afghanistan, representing 36 percent of the nondrug or27 percent of the entire national economy. Although almost all of theopium and heroin produced in the country was previously exported, it isnow estimated that 2 percent of the output is consumed locally. A 2005survey estimated that Afghanistan has almost 1 million drug users, includ-ing 200,000 opium users and 19,000 drug injectors, of whom 12,000inject prescription drugs and 7,000 inject heroin (UNODC 2005). A 2006survey in Kabul estimated that several categories of drug use had increasedby more than 200 percent in 12 months (UNODC 2006). The over-whelming majority of drug users are male, but the proportion of femalesusing prescription drugs is relatively high. As the overall drug problem inAfghanistan continues to receive international attention and most coun-ternarcotics efforts focus largely on supply reduction, there is a risk thatopium users will turn to injecting heroin, thus amplifying the risk ofHIV transmission.
HIV programs to date have been fragmented and on a small scale.There are a few local and international NGOs and development part-ners that provide prevention services to high-risk and vulnerable popu-lations, mainly HIV prevention interventions for IDUs, including harmreduction activities. A limited number of interventions have also beendesigned and launched among sex workers, MSM, truck drivers, andpolice and prison staff, mainly focusing on HIV and AIDS awareness,
Dynamics of the HIV Epidemic in South Asia 23
condom distribution, and counseling. These activities utilize peer- andcommunity-based education, but are limited in coverage and need tobe expanded rapidly. Among the priorities of the national plan are:strengthening communications and advocacy; improving surveillance;providing targeted interventions for people at highest risk; and buildingprogram management capacity. To tackle stigma, a HIV code of ethicsto protect vulnerable groups that are at high risk has been drafted,which serves as best practice for the region.
Sri Lanka While Sri Lanka is a low-prevalence country, several conditions con-tribute to high vulnerability, such as the current conflict, high mobility ofthe military, internally displaced persons, and separation of spouses due tooverseas employment. These structural factors could amplify the prob-lem. Moreover, new economic developments such as the expansion ofinternal free trade zones, and broad social changes, including the increas-ing migration of young adults from rural areas to large urban centers,increase their vulnerability and potential exposure to HIV.
Sri Lanka has conducted sentinel serosurveillance surveys on anannual basis among several subpopulations since 1993 (including sexu-ally transmitted disease patients, TB patients, those undergoing pre-employment testing, armed service personnel, antenatal clinic patients,and female sex workers). Available evidence indicates that Sri Lankacontinues to have very low prevalence of HIV. Current surveillance esti-mates (2007) indicate that there are about 5,000 adults and 100 chil-dren (under 15 years) infected with HIV, i.e. less than 0.1 percent ofadults. Surveillance data on the most at-risk populations (MARPs) areavailable only for sex workers, who continue to have very low rates ofHIV (also below 0.1 percent). While data suggest injecting drug use isuncommon, there are several subpopulations of MSM. However, neitherIDU nor MSM have been included in surveillance surveys, and thus lit-tle is known of their HIV prevalence, although there are some behavioraldata that shed some light on the vulnerability of these population groupsat high risk.
The first behavioral surveillance survey (2006–07) collected infor-mation related to sex workers, MSM, three-wheeler drivers, drug users,and free trade zone factory workers that indicate relatively high levelsof risky behaviors among some of them. Although it is unclear if thedrug users surveyed include any IDUs, there are considerable data on
24 Wilson and Claeson

sex workers and MSM that note very varied levels of risky behaviors,such as the condom use among sex workers with clients, which variesfrom 40 percent to 81 percent, and hovers around 10 percent for non-paying clients. Data indicate that MSM have sex with both men andwomen, and have low to medium condom use with male partners, andeven lower use with female partners. One-quarter of MSM and 80 per-cent of beach boys had had sex with women in the last year. It is diffi-cult to assess levels of risk as the questionnaire asks only about sex inthe last 12 months, and thus no distinction can be made regarding fre-quency of sexual encounters. But given that condom use was less than50 percent in casual male encounters, and much lower with women,particularly with regular partners, there is a significant potential forHIV transmission. And, while drug users rarely inject drugs, they fre-quently engage in unprotected sex. The survey indicates lack of knowl-edge among all groups about how HIV is transmitted.
The survey also includes a sample of free trade zone male and femalefactory workers, most of them internal migrants. Contrary to commonperceptions about risk and vulnerability among these internal migrants,the survey noted very low risky behavior, with only half of men andone-third of women having had sex in the last 12 months, and most didso with their regular partner. Only 5 percent of those sampled had hadcommercial sex, and 90 percent had used a condom in that event. Therisks were higher among three-wheeler drivers. Only 20 percent hadhad sex with casual partners in the last year, and condom use withcasual partners was only 31 percent. Twelve percent had had sex withsex workers in the last year and most (78 percent) reported having useda condom with these partners.
While the national program has focused on the general population andgenerated awareness about HIV, data show that overall knowledge abouthow HIV is transmitted remains low. The national AIDS program needsto shift its focus from awareness to behavior change interventions, andfrom a general population focus to reaching and involving vulnerablegroups at highest risk, with continuation of behavior surveillance surveysthat can monitor the effectiveness of such programs.
Bhutan Data in Bhutan are very limited. Serosurveillance has been conducted ona biannual basis since 2000 and large numbers of ANC patients havebeen tested, as have most in the armed forces. Both of these groups have
Dynamics of the HIV Epidemic in South Asia 25
shown extremely low HIV prevalence rates. UNAIDS estimates thatabout 500 people out of a total population of 700,000, could have beenliving with HIV and AIDS at the end of 2005, which would amount toa prevalence of less than 0.1 percent of the population. Informationabout sex work and IDU is limited, and there is no data on MSM.
While HIV prevalence among the general population is very low,there are some risk factors that indicate the need for a good biobehav-ioral surveillance system to monitor trends and ensure that prevalenceremains low. Data from the general population survey of 2006 notedthat multiple concurrent relationships are common. One-fifth of allmarried people have engaged in extramarital sex in the last year, and 14percent of unmarried people had sex in the last year. Rates are consid-erably higher among urban males (43 percent had extramarital sex inthe last year, and 42 percent of urban single men had sex in the lastyear). Condom use with extramarital sex partners is high (76 percent inurban areas, 64 percent rural areas), and ranges from 84 percent forurban males to 44 percent for urban females. Condom use in premari-tal sex is also high, at 73 percent in both rural and urban areas. Amongmen having sex with nonregular partners, 15 percent frequent sexworkers. While overall this is a small number (4 percent to 5 percent ofall men), casual attitudes toward sex in this small, sexually active sub-group of the population, combined with unsafe sex, could eventuallylead to small, truncated epidemics.
The open discussion of sexual and reproductive health issues is a pos-itive factor in setting set the stage for effective prevention programs,although Bhutan faces several implementation challenges, such ashuman resource constraints and lack of local NGOs and community-based organizations (CBOs) that have the necessary experience to workon HIV prevention, targeting interventions and working with thosemost at risk of HIV.
MaldivesAs in the case of Bhutan and Sri Lanka, the Maldives currently has verylow HIV prevalence, even among vulnerable groups, such as sex workersand MSM, and the IDU population is very small.
Thus, throughout South Asia, increasing the coverage of high-qualityinterventions for vulnerable groups at high risk, such as sex workers, menhaving sex with men, and injecting drug users, is critical to sustain the lowprevalence rate. The lessons learned of what works are discussed in thenext section.
26 Wilson and Claeson
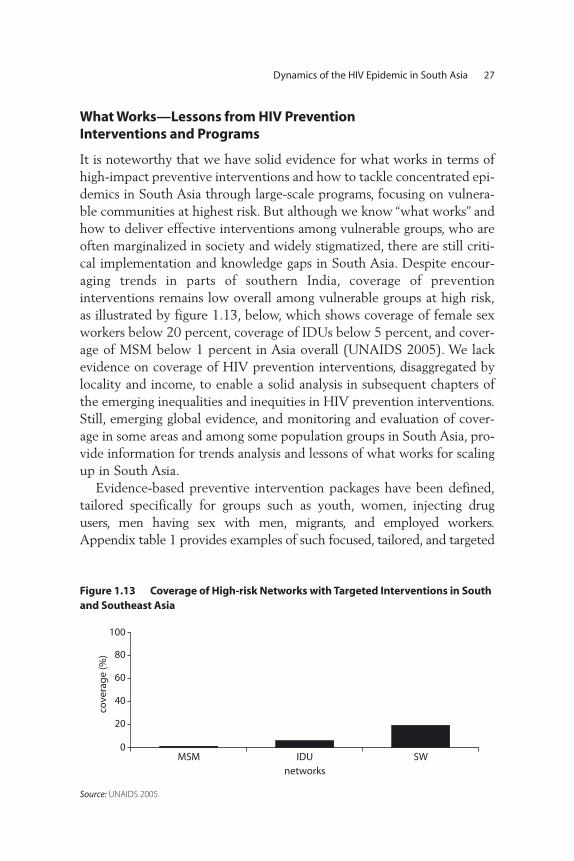
What Works—Lessons from HIV Prevention Interventions and Programs
It is noteworthy that we have solid evidence for what works in terms ofhigh-impact preventive interventions and how to tackle concentrated epi-demics in South Asia through large-scale programs, focusing on vulnera-ble communities at highest risk. But although we know “what works” andhow to deliver effective interventions among vulnerable groups, who areoften marginalized in society and widely stigmatized, there are still criti-cal implementation and knowledge gaps in South Asia. Despite encour-aging trends in parts of southern India, coverage of preventioninterventions remains low overall among vulnerable groups at high risk,as illustrated by figure 1.13, below, which shows coverage of female sexworkers below 20 percent, coverage of IDUs below 5 percent, and cover-age of MSM below 1 percent in Asia overall (UNAIDS 2005). We lackevidence on coverage of HIV prevention interventions, disaggregated bylocality and income, to enable a solid analysis in subsequent chapters ofthe emerging inequalities and inequities in HIV prevention interventions.Still, emerging global evidence, and monitoring and evaluation of cover-age in some areas and among some population groups in South Asia, pro-vide information for trends analysis and lessons of what works for scalingup in South Asia.
Evidence-based preventive intervention packages have been defined,tailored specifically for groups such as youth, women, injecting drugusers, men having sex with men, migrants, and employed workers.Appendix table 1 provides examples of such focused, tailored, and targeted
Dynamics of the HIV Epidemic in South Asia 27
Figure 1.13 Coverage of High-risk Networks with Targeted Interventions in Southand Southeast Asia
0
20
40
60
80
100
SWIDUMSM
cove
rag
e (%
)
networks
Source: UNAIDS 2005.
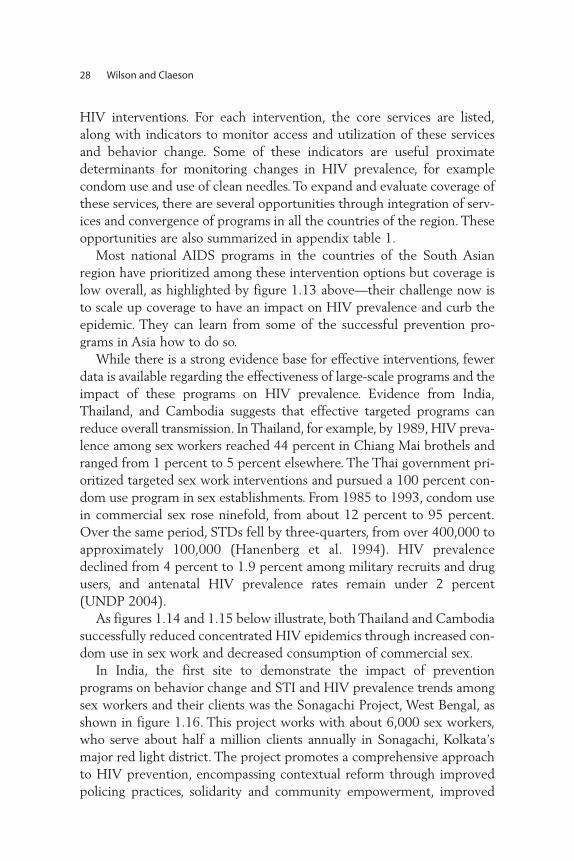
28 Wilson and Claeson
HIV interventions. For each intervention, the core services are listed,along with indicators to monitor access and utilization of these servicesand behavior change. Some of these indicators are useful proximatedeterminants for monitoring changes in HIV prevalence, for examplecondom use and use of clean needles. To expand and evaluate coverage ofthese services, there are several opportunities through integration of serv-ices and convergence of programs in all the countries of the region. Theseopportunities are also summarized in appendix table 1.
Most national AIDS programs in the countries of the South Asianregion have prioritized among these intervention options but coverage islow overall, as highlighted by figure 1.13 above—their challenge now isto scale up coverage to have an impact on HIV prevalence and curb theepidemic. They can learn from some of the successful prevention pro-grams in Asia how to do so.
While there is a strong evidence base for effective interventions, fewerdata is available regarding the effectiveness of large-scale programs and theimpact of these programs on HIV prevalence. Evidence from India,Thailand, and Cambodia suggests that effective targeted programs canreduce overall transmission. In Thailand, for example, by 1989, HIV preva-lence among sex workers reached 44 percent in Chiang Mai brothels andranged from 1 percent to 5 percent elsewhere. The Thai government pri-oritized targeted sex work interventions and pursued a 100 percent con-dom use program in sex establishments. From 1985 to 1993, condom usein commercial sex rose ninefold, from about 12 percent to 95 percent.Over the same period, STDs fell by three-quarters, from over 400,000 toapproximately 100,000 (Hanenberg et al. 1994). HIV prevalencedeclined from 4 percent to 1.9 percent among military recruits and drugusers, and antenatal HIV prevalence rates remain under 2 percent(UNDP 2004).
As figures 1.14 and 1.15 below illustrate, both Thailand and Cambodiasuccessfully reduced concentrated HIV epidemics through increased con-dom use in sex work and decreased consumption of commercial sex.
In India, the first site to demonstrate the impact of prevention programs on behavior change and STI and HIV prevalence trends amongsex workers and their clients was the Sonagachi Project, West Bengal, asshown in figure 1.16. This project works with about 6,000 sex workers,who serve about half a million clients annually in Sonagachi, Kolkata’smajor red light district. The project promotes a comprehensive approachto HIV prevention, encompassing contextual reform through improvedpolicing practices, solidarity and community empowerment, improved
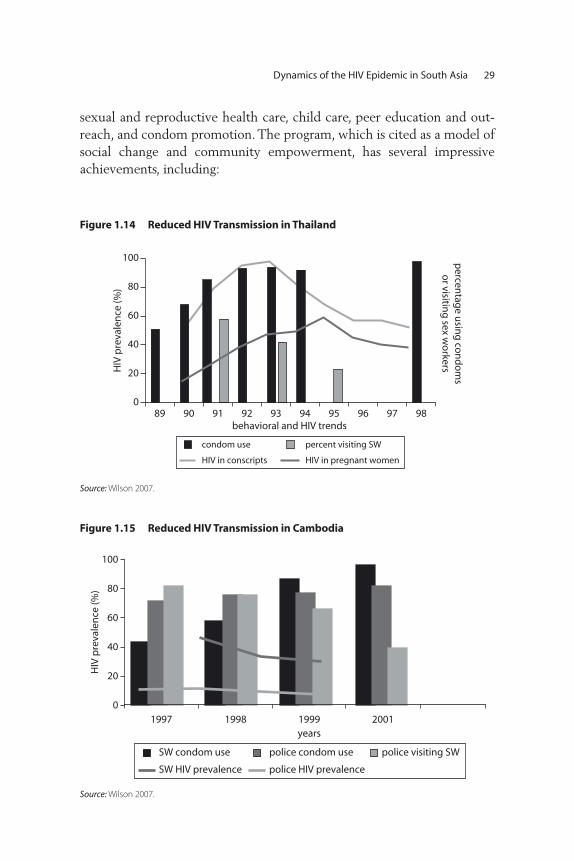
Dynamics of the HIV Epidemic in South Asia 29
sexual and reproductive health care, child care, peer education and out-reach, and condom promotion. The program, which is cited as a model ofsocial change and community empowerment, has several impressiveachievements, including:
Figure 1.14 Reduced HIV Transmission in Thailand
0
20
40
60
80
100
95 9689 90 91 92 93 94 97 98
HIV
pre
vale
nce
(%)
percen
tage u
sing
con
do
ms
or visitin
g sex w
orkers
behavioral and HIV trends
HIV in conscripts HIV in pregnant women
condom use percent visiting SW
Source: Wilson 2007.
Figure 1.15 Reduced HIV Transmission in Cambodia
0
20
40
60
80
100
1997 1998 1999years
2001
HIV
pre
vale
nce
(%)
SW condom use
police HIV prevalenceSW HIV prevalence
police condom use police visiting SW
Source: Wilson 2007.

30 Wilson and Claeson
• Increasing condom use in sex work from 3 percent in 1992, to 70 percent in 1994, to 90 percent in 1998. By 1998, these rates were farhigher than those observed in surrounding red light areas.
• Reducing STI rates among sex workers by over 75 percent: recentsyphilis and genital ulcer cases fell from 28 percent and 7 percent, respectively, in 1992, to 11 percent and 2 percent in 1998.
• Stabilizing HIV prevalence among sex workers at 1 percent to 2 percent from 1992 to 1994. However, in 1996, it rose to 11 percentand remained at this level in 1997. HIV rates among sex workers else-where in India have generally risen more steeply.
There is also growing evidence that HIV may be declining in southIndia, particularly in states and districts with well-established HIVprevention responses. The decline is shown in figure 1.5, in the precedingdiscussion. Changes in unprotected commercial sex attributed to targetedprevention efforts are illustrated by figure 1.17, below, which shows adecline among truck drivers who were buying sex. Similar trends havebeen observed among sex workers.
These southern India trends in coverage of preventive services andbehavior change, measured in Tamil Nadu, influence the overall declinein India since the southern states contribute so much to the overallnational HIV burden. Most illuminating are the results of the NationalFamily Health Survey that further validate the effectiveness of existingprevention programs. Table 1.4 below shows some of the selected find-ings from the India national behavioral surveillance survey, the largest of
Figure 1.16 The Sonagachi Project, West Bengal, India
0
20
40
60
80
100
1992 1994 1998
HIV
, gen
ital
ulc
er a
nd
syp
hili
s p
reva
len
ce (%
)co
nd
om
use
condom use in sex work syphilis
genital ulcers HIV
Source: US Bureau of the Census 2008.

Dynamics of the HIV Epidemic in South Asia 31
Figure 1.17 Reductions in Unprotected Sex in Tamil Nadu, 1996–2003 (percent of respondent truck drivers and helpers)
50
40
30
20
1014
45
30
96
3 31 2 2
22
950
1996 1997 1998 1999 2000 2001 2002 2003
45
35
25
per
cen
t
15
Recent unprotected commercial sex
last paid sex was unprotectedpaid for sex in last year
Source: NACO 2007.
Table 1.4 Changes in Sexual Behavior and Condom Usage
India national behavioral surveillance survey 2001 2006
Female sex workersCondom usage during last nonregular sex 49.3 66.1
Consistent condom usage in nonregular sex during last 12
months 32.4 49.7
General populationCondom can be procured within 30 minutes 49.6 79.9
Condom usage with paying partners in last sex (Base: All
Respondents) 74.5 85.0
Consistent condom usage with paid partners (Base: All
Respondents) 57.3 73.9
Condom usage with casual partners in last sex (Base: All
Respondents who had casual sex in last 3 months) 32.8 50.4
Source: NACO 2007.
its kind globally, which enables a comparison of risky behaviors between2001 and 2006.
The successful prevention programs to date have a few characteristicsin common: they all invest in evidence-based targeted interventions, suchas condom promotion and treatment of sexually transmitted infections;they engage peer educators in outreach; they are well monitored and evaluated, focusing on coverage of effective prevention interventions; and,technical, human, and financial resources are available. There have beensimilar successful intervention programs among injecting drug users, but

32 Wilson and Claeson
on a smaller scale. These HIV prevention programs have also been charac-terized by outreach and peer education, in addition to comprehensiveharm reduction, including clean needle exchange. Evidence from theStopping HIV/ AIDS through Knowledge and Training Initiative(SHAKTI) in Bangladesh suggests it also works in resource-constrainedsettings. The project reaches an estimated 5,000 IDUs in Dhaka, provid-ing them with drop-in centers, detoxification services, HIV preventioneducation and individual counseling, and safe injecting equipment. Anevaluation (Tasnim, Hussein, Kelly 2005) showed that HIV prevalence hasremained relatively low among IDUs, and risky sexual practices havedeclined. However, needle sharing soared, climbing from 66 percent in2002 to 86 percent in 2004. Fieldworkers attribute the increase to policeactions against those carrying injecting equipment, which underscores theimportance of legal reform to support harm reduction.
The last example highlights one of the challenges to scaling up effec-tive interventions in the region: stigma—especially among the generalpopulation toward vulnerable groups engaged in high-risk practices. Lackof awareness and low capacity remain common obstacles to scaling up.Box 1.1, below summarizes some of the principles for scaling up in SouthAsia, drawing from implementation lessons learned on how to tackle thecommon constraints across the region. Large-scale programs with highcoverage interventions that reflect these principles can achieve at leastthree critical things. Specifically, they can greatly reduce the size of SouthAsia’s HIV epidemic; prevent HIV from becoming widely established inthe general population; and markedly reduce AIDS treatment and othercosts, providing a high return on investment.
Conclusions: Prevention Priorities for South Asia
As shown in the preceding sections, the future size of South Asia’s epi-demics will depend on the scope and effectiveness of programs for sexworkers and their clients, injecting drug users and their sexual partners,and men having sex with men and their other sexual partners. Theeffectiveness of efforts to address the underlying socioeconomic deter-minants of the epidemic, and to reduce the stigma and discriminationtoward people living with HIV, will also be critical to scaling up andsustaining the response.
South Asia’s epidemic is highly preventable. Programs for sex workers,injecting drug users, and men having sex with men, work to a large extent.We do know what to do and how to do it. Achieving high coverage is the
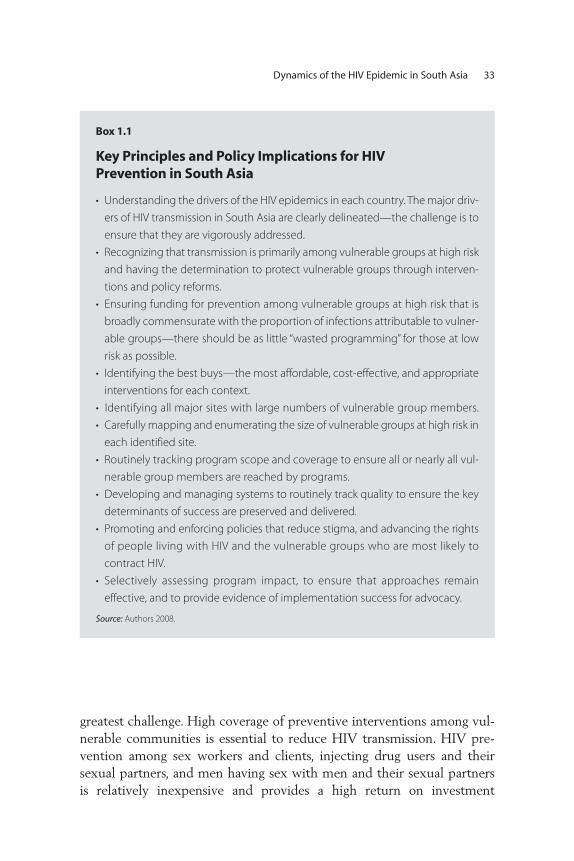
Dynamics of the HIV Epidemic in South Asia 33
greatest challenge. High coverage of preventive interventions among vul-nerable communities is essential to reduce HIV transmission. HIV pre-vention among sex workers and clients, injecting drug users and theirsexual partners, and men having sex with men and their sexual partnersis relatively inexpensive and provides a high return on investment
Box 1.1
Key Principles and Policy Implications for HIV Prevention in South Asia
• Understanding the drivers of the HIV epidemics in each country. The major driv-
ers of HIV transmission in South Asia are clearly delineated—the challenge is to
ensure that they are vigorously addressed.
• Recognizing that transmission is primarily among vulnerable groups at high risk
and having the determination to protect vulnerable groups through interven-
tions and policy reforms.
• Ensuring funding for prevention among vulnerable groups at high risk that is
broadly commensurate with the proportion of infections attributable to vulner-
able groups—there should be as little “wasted programming” for those at low
risk as possible.
• Identifying the best buys—the most affordable, cost-effective, and appropriate
interventions for each context.
• Identifying all major sites with large numbers of vulnerable group members.
• Carefully mapping and enumerating the size of vulnerable groups at high risk in
each identified site.
• Routinely tracking program scope and coverage to ensure all or nearly all vul-
nerable group members are reached by programs.
• Developing and managing systems to routinely track quality to ensure the key
determinants of success are preserved and delivered.
• Promoting and enforcing policies that reduce stigma, and advancing the rights
of people living with HIV and the vulnerable groups who are most likely to
contract HIV.
• Selectively assessing program impact, to ensure that approaches remain
effective, and to provide evidence of implementation success for advocacy.
Source: Authors 2008.
(Disease Control Priorities by Jamison et al. 2006). Effective programs forsex workers, injecting drug users, men having sex with men, and the sex-ual partners of these communities can still prevent HIV from becomingwidely established in the general population, and such action greatlyreduces the need for treatment, care, and other costs. HIV priorities andinvestments should closely reflect the transmission patterns and their keystructural determinants at the subnational level.
Regarding the situation in each of the South Asian countries (Moseset al. 2006), the key conclusions about the HIV epidemiology and theimplications for the response to HIV are the following:
The future size of India’s HIV epidemic will depend above all onthe scope and effectiveness of programs for sex workers and clients,and also significantly on the scope and effectiveness of programs formen having sex with men and their other sexual partners, and inject-ing drug users and their sexual partners, particularly in the northeast.Throughout India, it remains vital to tackle stigma and discriminationtoward people living with HIV. HIV prevention and AIDS treatmenthave reciprocal benefits: HIV prevention makes AIDS treatment moreaffordable and AIDS treatment creates important opportunities forenhanced HIV prevention.
The future size of Nepal’s HIV epidemic will depend above all on thescope, coverage, and effectiveness of programs for injecting drug users andtheir sexual partners, and sex workers and clients. Sex between men con-stitutes a further risk, which must also be addressed. Nepal’s longstand-ing political difficulties mean that civil society’s already important role iseven more critical, and that effective and creatively deployed interna-tional assistance is urgently needed.
Pakistan and Bangladesh’s HIV epidemic will depend above all onthe scope and effectiveness of programs for injecting drug users andtheir sexual partners, and men having sex with men and their sexualpartners. Infection among sex workers is low and can be kept lowthrough intensive programs for sex workers and clients, including amajor focus on sex workers who inject drugs or whose sexual partnersinject drugs. Stigma reduction is essential in order to achieve high-quality,high-coverage programs.
Despite limited data, Afghanistan has a large drug-using populationand a growing injecting drug use community, who are highly vulnerableto HIV infection. It must act urgently to limit HIV infection in its largepopulation of injecting drug users. For different reasons, Bhutan, theMaldives, and Sri Lanka have very low HIV prevalence and relatively
34 Wilson and Claeson
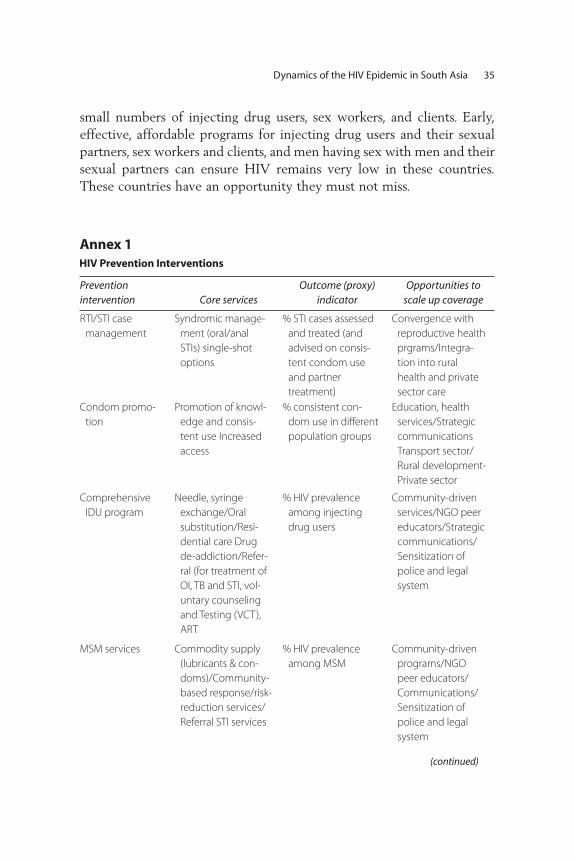
Dynamics of the HIV Epidemic in South Asia 35
small numbers of injecting drug users, sex workers, and clients. Early,effective, affordable programs for injecting drug users and their sexualpartners, sex workers and clients, and men having sex with men and theirsexual partners can ensure HIV remains very low in these countries.These countries have an opportunity they must not miss.
Prevention intervention Core services
Outcome (proxy) indicator
Opportunities toscale up coverage
RTI/STI case
management
Syndromic manage-
ment (oral/anal
STIs) single-shot
options
% STI cases assessed
and treated (and
advised on consis-
tent condom use
and partner
treatment)
Convergence with
reproductive health
prgrams/Integra -
tion into rural
health and private
sector care
Condom promo-
tion
Promotion of knowl-
edge and consis-
tent use Increased
access
% consistent con-
dom use in different
population groups
Education, health
services/Strategic
communications
Transport sector/
Rural development-
Private sector
Comprehensive
IDU program
Needle, syringe
exchange/Oral
substitution/Resi-
dential care Drug
de-addiction/Refer-
ral (for treatment of
OI, TB and STI, vol-
untary counseling
and Testing (VCT),
ART
% HIV prevalence
among injecting
drug users
Community-driven
services/NGO peer
educators/Strategic
communications/
Sensitization of
police and legal
system
MSM services Commodity supply
(lubricants & con-
doms)/Community-
based response/risk-
reduction services/
Referral STI services
% HIV prevalence
among MSM
Community-driven
programs/NGO
peer educators/
Communications/
Sensitization of
police and legal
system
Annex 1
(continued)
HIV Prevention Interventions
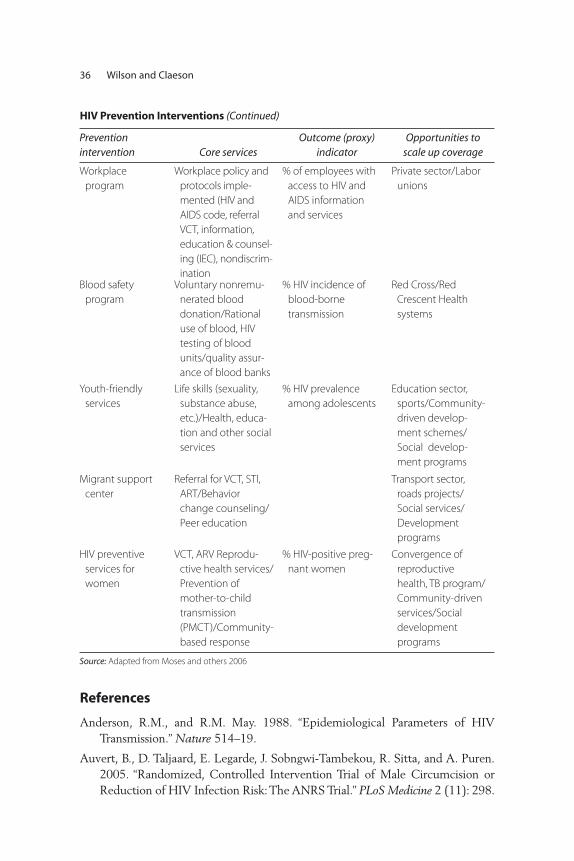
36 Wilson and Claeson
Prevention intervention Core services
Outcome (proxy) indicator
Opportunities toscale up coverage
Workplace
program
Workplace policy and
protocols imple-
mented (HIV and
AIDS code, referral
VCT, information,
education & counsel-
ing (IEC), nondiscrim-
ination
% of employees with
access to HIV and
AIDS information
and services
Private sector/Labor
unions
Blood safety
program
Voluntary nonremu-
nerated blood
donation/Rational
use of blood, HIV
testing of blood
units/quality assur-
ance of blood banks
% HIV incidence of
blood-borne
transmission
Red Cross/Red
Crescent Health
systems
Youth-friendly
services
Life skills (sexuality,
substance abuse,
etc.)/Health, educa-
tion and other social
services
% HIV prevalence
among adolescents
Education sector,
sports/Community-
driven develop-
ment schemes/
Social develop-
ment programs
Migrant support
center
Referral for VCT, STI,
ART/Behavior
change counseling/
Peer education
Transport sector,
roads projects/
Social services/
Development
programs
HIV preventive
services for
women
VCT, ARV Reprodu-
ctive health services/
Prevention of
mother-to-child
transmission
(PMCT)/Community-
based response
% HIV-positive preg-
nant women
Convergence of
reproductive
health, TB program/
Community-driven
services/Social
development
programs
Source: Adapted from Moses and others 2006
References
Anderson, R.M., and R.M. May. 1988. “Epidemiological Parameters of HIVTransmission.” Nature 514–19.
Auvert, B., D. Taljaard, E. Legarde, J. Sobngwi-Tambekou, R. Sitta, and A. Puren.2005. “Randomized, Controlled Intervention Trial of Male Circumcision orReduction of HIV Infection Risk: The ANRS Trial.” PLoS Medicine 2 (11): 298.
HIV Prevention Interventions (Continued)

Dynamics of the HIV Epidemic in South Asia 37
Bertozzi, Stefano, and others. 2006. “HIV/AIDS Prevention and Treatment.” InDisease Control Priorities in Developing Countries, 2nd ed., ed. Dean T. Jamisonand others, 331–70. Washington, DC: Oxford University Press and World Bank.
Bongaarts, J., P. Way, and F. Conant. 1989. “The Relationship between MaleCircumcision and HIV Infection in African Populations.” AIDS 373–77.
Chao, A., M. Bulterys, F. Musanganire, P. Habimana, P. Nawrocki, E. Taylor, A.Dushimimana, and A. Saah. 1994. “Risk Factors Associated with PrevalentHIV-1 Infection among Pregnant Women in Rwanda.” International Journal ofEpidemiology 23: 371–80.
Chase R., J. Foran, A. Rasheed, J.D. O’Neil, S. Moses, and J.F. Blanchard. 2008.“Mapping and Situation Assessment of Key Populations at High Risk of HIVin Three Key Cities of Afghanistan.” Research paper, Human Development,South Asia Region, World Bank, Washington, DC.
Claeson M., and A. Alexander. 2008. “Tackling HIV in India: Evidence-BasedPriority Setting and Programming.” Health Affairs 27 (4): 1091–1102.
Family Health International, New Era, STD/AIDS Counseling and TrainingService. 2002. “Kathmandu Female Sex Worker HIV/STI Prevalence Study.”Family Health International, Kathmandu, Nepal.
Family Health International, New Era, and STD/AIDS Counseling and TrainingService. 2003. “Behavioral and Sero-prevalence Survey among Male InjectingDrug Users in the Pokhara Valley.” Family Health International, Kathmandu,Nepal.
Family Health International, New Era. 2008. Integrated Bio-Behavioural Survey(IBBS) among Men who have Sex with Men in the Kathmandu Valley 2007.Kathmandu, Napal.
Galvin, S.R., and M.S. Cohen. 2004. “The Role of Sexually Transmitted Diseasesin HIV Infection.” Nature Reviews Microbiology 2 (1): 33–42.
Gray, R., et al. 2000. “Male Circumcision and HIV Acquisition and Transmission:Cohort Studies in Rakai, Uganda,” AIDS 14 (15): 2371–81.
Halperin, D.T., and H. Epstein. 2004. “Concurrent Sexual Partnerships Help toExplain Africa’s High HIV Prevalence: Implications for Prevention.” The Lancet363: 4–6.
Hanenberg, R.S., W. Rojanapithayakorn, P. Kunasol, and D.C. Sokal. 1994. “Impactof Thailand’s HIV-control Programme as Indicated by the Decline of SexuallyTransmitted Diseases.” The Lancet 344: 243–45.
ICHAP (India-Canada Collaborative HIV/AIDS Project). 2004. “Community-based HIV Prevalence Study in IHCAP Demonstration Project Areas, KeyFindings.” ICHAP, Bangalore, India.
Kretzschmar, M. 1997. “Concurrent Partnerships and the Spread of HIV.” AIDS11: 641–48.

Kumar, R., P. Jha, P. Arora, and N.J. Dhingra. Indian Studies of HIV/AIDS workinggroup. 2005. “HIV-1 Trends, Risk Factors and Growth in India.” NCMHBackground Papers—Burden of Disease in India, National Commission onMacroeconomics and Health, Delhi, India.
May, R.M., and R.M. Anderson. 1987. “Transmission Dynamics of HIV.” Nature326: 137–42.
Moses, S., J.F. Blanchard, H. Kang, F. Emmanuel, S.R. Paul, M.L. Becker, D. Wilson,and M. Claeson. AIDS in South Asia: Understanding and Responding to aHeterogeneous Epidemic. Washington, DC: World Bank.
National AIDS Control Organisation: Government of India, Ministry of Healthand Family Welfare. 2005. “An Overview of the Spread and Prevalence ofHIV/AIDS in India.” National AIDS Control Organisation, New Delhi, India.www.nacoonline.org/facts_overview.htm.
National AIDS Control Programme, Government of Pakistan, Ministry of Health.2006. “AIDS/HIV Surveillance Report: October–December 2004.” NationalAIDS Control Programme, Islamabad, Pakistan.
National AIDS Control Programme, Government of Pakistan, Ministry of Health.2005. “HIV Second Generation Surveillance in Pakistan.” National AIDSControl Programme, Islamabad, Pakistan.
National AIDS and STD Control Program. Government of Bangladesh, Ministryof Health. 2005. “Serological Surveillance for HIV in Bangladesh Round VI2004–2005.” Draft paper, Dhaka, Bangladesh.
Ohiri. K., M. Claeson, E. Razzaghi, B. Nassirimanesh, P. Afshar, and R. Powers. 2006.“HIV/AIDS Prevention among Injecting Drug Users, Learning from HarmReduction in Iran.” World Bank discussion paper, World Bank, Washington, DC.http://siteresources.worldbank.org/INTSAREGTOPHIVAIDS/Resources/LancetHarmReductionIran.pf.
Patterson, B.K., A. Landay, J.N. Siegel, Z. Flener, D. Pessis, A. Chaviano, R.C. Bailey.2002. “Susceptibility to Human Immunodeficiency Virus-1 Infection of HumanForeskin and Cervical Tissue Grown in Explant Culture.” American Journal ofPathology 161: 867–73.
Reynolds, S.J., M.E. Shepard, A.R. Risbud, R.R. Gangakhedkar, R.S. Brookmeyer,A.D. Divekar, S.M. Mehendale, and R.C. Bollinger. 2004. “Male Circumcisionand Risk of HIV-1 and Other Sexually Transmitted Infections in India.” TheLancet 363: 1039–40.
Todd Catherine, Abdullah Abed, Steffanie Strathdee, Boulos Botros,Naqibullah Safi, and Kenneth Earhart. 2006. “Prevalence of HIV, ViralHepatitis, Syphilis, and Risk Behaviors among IDUs in Kabul, Afghanistan.”Presentation at the International AIDS Conference Toronto, Canada.www.aegis.com/conferences/iac/2006/TuAc0304.ppt.
38 Wilson and Claeson
United Nations Office on Drugs and Crime (UNODC). 2006. World Drug Report2006. Vienna, Austria: UNODC.
———. 2004. World Drug Report 2004. Vienna, Austria: UNDOC.
———, and Ministry of Counter Narcotics of the Government of Afghanistan.2005. Afghanistan Drug Use Survey 2005. Vienna, Austria: UNDOC.
UNAIDS (The Joint United Nations Programme on HIV/AIDS). 2002. Report onthe Global HIV/AIDS Epidemic. Geneva, Switzerland: UNAIDS.
UNAIDS (The Joint United Nations Programme on HIV/AIDS). 2004. Report onGlobal AIDS Epidemic—Fourth Global Report. Geneva, Switzerland,UNAIDS.
UNAIDS (The Joint United Nations Programme on HIV/AIDS). 2005. AIDSEpidemic Update 2005. Geneva, Switzerland: UNAIDS.
UNDP (United Nations Development Programme). 2004. Thailand’s Response toHIV/AIDS—Progress and Challenges. Bangkok, Thailand: UNDP.
U.S. Bureau of the Census. HIV/AIDS Surveillance Data Base. 2008. www.census.gov/ipc/www/hivaidsn.html.
Weiss, H., M. Quigley, and R. Hayes. 2000. “Male Circumcision and Risk of HIVInfection in Sub-Saharan Africa: A Systematic Review and Meta Analysis.”AIDS 14: 2361–70.
Wilson David, 2007. “Knowing our Epidemics.” Paper presented at theInternational HIV Implementors Meeting, Kigali, Rwanda, June 17.
Yorke, J.A., H.W. Heathcote, and A. Nold. 1978. “Dynamics and Control of theTransmission of Gonorrhea.” Sexually Transmitted Diseases Volume 5: 51–7.
Dynamics of the HIV Epidemic in South Asia 39


Introduction
Following almost three decades of war, Afghanistan is one of the poorestcountries in the world. GDP per capita is estimated at about US$360 for2007 (IMF 2007a). Life expectancy at birth is only 44.5 years (UNDP2008), and maternal and child mortality are among the highest in theworld. The literacy rate in the general population is very low (36 percent),especially for women (13 percent) (World Bank 2007).
There are very limited data available on the state of HIV and AIDS inAfghanistan. The number of known cases of HIV infections has beenrelatively low so far. However, there is a risk of an escalation in HIVprevalence owing to a high and increasing number of injecting drug usersin the country. The experience from other countries across Asia suggeststhe potential for rapid spread of HIV within the drug-injecting popula-tion and onward transmission of the virus (Friedman and Des Jarlais1991; Riehman 1998; Monitoring of the AIDS Pandemic (MAP) 2005;Ohiri 2006). At the same time, opium production in Afghanistan reachedrecord levels in 2007 (IMF 2007b).
Keeping HIV prevalence low is one of the development objectives inAfghanistan. An increase in HIV and AIDS also has the potential to com-plicate progress in the attainment of other key development objectives.
Responding to HIV in Afghanistan
Jed Friedman and Edit V. Velenyi
41
C H A P T E R 2

A recent mapping of groups at high risk for HIV—IDUs and sex workersin three cities of Afghanistan (Chase 2008)—sheds some light on vulner-able groups at high risk in urban Afghanistan. The large numbers ofreturning refugees contribute to the spread of the epidemic, as many ofthem started injecting drugs while abroad. At the same time, lack of com-prehensive harm reduction to prevent the spread of HIV and limitedhealth system capacities imply that adequate prevention, care, or treat-ment are not available to many. The low social status of many affected byHIV and AIDS and the stigma associated with both risky behaviorsand HIV and AIDS add to the challenges.
Against this background, control of HIV infections is a developmentpriority in Afghanistan. While the level of HIV prevalence arguablyremains low, the available evidence suggests that high vulnerability andrisk are present and may contribute to an escalation of new HIV infectionsin Afghanistan. On the other hand, timely intervention activities proven tobe cost-effective in a variety of settings may forestall or prevent such anoccurrence. The first national HIV prevention project was launched in2007, with a focus on targeted prevention programs, surveillance, strength-ening management capacity and advocacy, and communications.
Section 2 discusses the state of the HIV epidemic in Afghanistan,summarizing the available data, discussing the social and economiccontext, and analyzing factors affecting the risk of transmission ofHIV. Section 3 reviews the evidence on the effectiveness and cost-effectiveness of HIV preventions, with emphasis on interventions tar-geted at injecting drug users. Section 4 attempts an economic analysisof an HIV prevention program for Afghanistan and provides somemeasures of the economic effects of such a program. Section 5 sum-marizes the findings.
The State of the Epidemic in Afghanistan
An effective disease control strategy must respond to the nature andscope of the relevant disease patterns. We start out by summarizingthe limited information available on the state of the epidemic inAfghanistan. Next, we discuss the social and economic context of theepidemic, including the country’s history of conflict, which has resultedin destitution and a large number of refugees. The remainder of the sec-tion focuses on the role of injecting drug use and its implications forHIV transmission.
42 Friedman and Velenyi
Stage and Scope of the EpidemicThe number of recorded AIDS cases in Afghanistan is low at present.The Ministry of Public Heath reported a total of 69 cases of HIV infec-tion in Afghanistan in late January 2007, based on data from the Kabulblood bank and an HIV seroprevalence survey of injecting drug users inKabul. A few months later (August 2007), the government reported 245cases of HIV infection in Afghanistan (Saif-ur-Rehman et al. 2007).These data, however, likely substantially understate the actual number ofpeople living with HIV in Afghanistan. UNAIDS (2006b) put HIVprevalence in Afghanistan at 1,000 people, with an “upper-range” esti-mate of up to 2,000 people, most of whom are male, and recent esti-mates have doubled.
Almost all the known cases of HIV infection in Afghanistan todayare due to injecting drug use (IDU). A study of 464 injecting drugusers in Kabul showed an HIV prevalence rate of above 3 percent, andhighlighted the extremely high risk of the spread of the disease amonginjecting drug users and their partners, and to the general population(Todd et al. 2007).
While prevalence in the general population seems to be negligible,evidence shows that under a combination of unfavorable conditions1
HIV prevalence in vulnerable groups can increase dramatically withinshort periods (see Claeson and Wilson, this volume). These conditionsinclude the existence of multifaceted high-risk behavior, low educationand social status, as well as weak health systems, severe public resourceconstraints, limited social responsibility, and lack of information, healtheducation/promotion, and social marketing. According to a global review,in some of the 80 countries where HIV infections have been reportedamong IDUs, HIV has spread extremely rapidly within this group, withincreases in seroprevalence of 20 to 40 percentage points within a singleyear (Friedman and Des Jarlais 1991). More generally, while HIV infec-tions at present appear to be concentrated among IDUs, there is oftenintersection between IDU and sex work. HIV transmission among IDUsoften serves as the entry point for HIV to spread to other vulnerablegroups and the general population (Jha et al. 2001).
Given the initial stage of the epidemic in Afghanistan and the paucityof information, it is natural to also look to Afghanistan’s neighbors as potential examples of future development. Central and South Asiaare experiencing a rapid increase in HIV cases, with injecting drug useand the commercial sex trade as the major sources of HIV transmission
Responding to HIV in Afghanistan 43
(UNAIDS 2006a). Iran has the highest rate of heroin addiction in theworld: 20 percent of Iranians ages 15 to 60 are engaged in drug abuse,and between 9 percent and 16 percent of these inject drugs. In Tehran,23 percent of IDUs are HIV positive; just one year earlier this prevalencestood at 15 percent (Zamani et al. 2005).
ContextFuture transmission patterns of HIV in Afghanistan depend on the eco-nomic and social context and behavioral factors that determine riskprofiles and transmission probabilities. Afghanistan is a conflict country,devastated by protracted armed conflicts since 1978. As a consequence,many factors associated with an increased risk of HIV transmission arepresent, including poverty, displacement of a population with high HIVprevalence to areas of lower prevalence, and sexual abuse or use of sexas a survival commodity.2 The low levels of education, literacy, andhealth education contribute to the continuation of risky behaviors, par-ticularly among IDUs. Illiteracy presents a severe barrier to HIV aware-ness and prevention. The literacy rate in the general population is verylow (36 percent) and lower still among women (13 percent), with littlepopular awareness of HIV and AIDS and the protective effects of con-dom use (World Bank 2008). Women in Afghanistan experience one ofthe lowest social positions in the world. Denied access to education andjobs, and often not allowed to leave their homes without a male relative,they lack access to information on how to protect themselves (WorldBank 2007).
The war has resulted in over 1 million widows, 1.6 million orphans, 0.5million internally displaced people (DP), and 4 million Afghan refugeeswho returned from neighboring Pakistan and Iran (World Bank 2008).Today, still, about 4 million Afghans live in these countries, which haverapidly growing IDU-driven HIV epidemics of their own. Spillover of theepidemics from these countries raises grave concerns.
During the recent decades of conflict, up to 8 million Afghans fled toneighboring countries. Some Afghans began using and injecting heroinduring their difficult years as refugees. In Quetta, a town in Pakistanbordering Afghanistan, for example, an HIV prevalence of 24 percenthas been reported in a cluster of injecting drug users. These data haveincreased the fear of an epidemic in Afghanistan, since an estimated 4million Afghans have returned home in the past few years.
The Iranian experience may be particularly relevant for the future ofthe epidemic in Afghanistan. HIV and AIDS is closely associated with
44 Friedman and Velenyi
injecting drug use in both countries, and a 2005 United Nations Office onDrugs and Crime (UNODC) report found that at least 50 percent ofIDUs in Afghanistan reported to have started in Iran.
Iran has an estimated 200,000 injecting drug users (Razzaghi et al.2006). Recent data indicate that 67.3 percent of HIV-positive cases and85 percent of AIDS cases have a history of injecting drug use (Ministry ofHealth and Medical Education (MOHME) 2003). Furthermore, the HIVand AIDS epidemic in Iran appears to be accelerating rapidly. Between2003 and 2005, the estimated population of those with HIV in Iran hasincreased from 37,000 to 66,000, the latter corresponding to 0.2 percentof the adult population (UNAIDS/WHO 2006).
Poverty in Afghanistan is both deep and broad, and can lead toincreased risk of HIV infection. Impoverished, socially marginalized,and disempowered populations face access barriers to even basic careand information. There is an acute shortage of health facilities andtrained staff, particularly female staff, in most rural areas. Of the facili-ties that exist, most are ill-equipped and unable to treat opportunisticinfections or prevent mother-to-child transmission (MTCT) of HIV.Unsafe blood transfusion adds to the risk of HIV spreading to the gen-eral population, with only 30 percent of transfused blood being testedfor HIV. People engaged in high-risk behaviors often have limited accessto health care (World Bank 2007). At the same time, because it islocated in the Golden Crescent, one of the major drug-producing areasand trafficking routs globally, access to drugs in Afghanistan is easy(Saifurrehman 2007; Ohiri 2006; World Bank 2007). Production ofopium in Afghanistan reached record levels in 2007, with the estimatedamount produced reaching 8,200 metric tons, an increase from the pre-vious year of 34 percent, and amounting to 93 percent of the world’ssupply. The 2006 opium crop was estimated to have provided US$3.1billion to Afghanistan, representing 32 percent of the entire nationaleconomy. Whereas almost all of the opium and heroin produced in thecountry was previously exported, 2 percent of the output is nowbelieved to be consumed locally (UNODC 2007). Since production isnow believed to exceed worldwide demand by a vast margin, largequantities are probably being stockpiled.
Behavior and Transmission RiskAs in many other traditional and deeply religious countries, estimationof the scale of the spread of HIV associated with IDUs, sex workers(SW), or men who have sex with men (MSM) is difficult in Afghanistan.
Responding to HIV in Afghanistan 45
Local opinion varies as to the importance of these factors. Ex-inmatesreport that a substantial amount of drug injection occurs in Afghanprisons, a situation also reported in many other countries. Vulnerablegroups potentially at risk of HIV infection include long-distance truckdrivers and their helpers and the many abandoned children. Only 30percent of transfused blood or blood products is currently tested forHIV (UNAIDS 2006b), which will be of increasing concern as HIVprevalence rises. There is much re-use of injecting equipment andother medical equipment in the formal and informal health care sec-tors, although there is little documentation about the extent and dis-tribution of this practice.
As for the behavioral context and consequent risk of transmission, thesharing of contaminated injecting equipment is thought to confer thegreatest risk of contracting HIV compared with other risk factors.Although the dominant routes of drug use in Afghanistan have previouslybeen oral and inhalation, injecting practices are becoming increasinglyprevalent. A 2005 survey estimated that Afghanistan has almost 1 milliondrug users, including 200,000 opium users and 19,000 injecting users, ofwhom 12,000 inject prescription drugs and 7,000 inject heroin. A 2006survey in Kabul estimated that several categories of drug use had increasedby more than 200 percent in 12 months (World Bank 2007). Most drugusers were men, although the proportion of women among people usingprescription drugs was high.
A recent study of the IDU population in Kabul showed that high-risk behaviors were very common: 35 percent had ever shared syringes;76 percent had ever paid for sex with a woman; 27 percent of menhad ever had sex with men; 23 percent had received so-called thera-peutic injections in the previous six months; 4 percent had ever beenpaid for donating blood; and 35 percent had injected drugs in prison(Todd et al. 2006). The four viral samples assessed in the study hadthe same genome sequences previously identified in injecting drugusers in Iran, where HIV prevalence is known to be much higher thanAfghanistan. Moreover, the prevalence of hepatitis C—also predomi-nantly spread by the sharing of injecting equipment—was already 37percent, which indicates the very high risk of spreading blood-borneviruses in this population.
The high number of refugees and displaced people in Afghanistan,and of Afghan refugees and displaced people living in neighboringcountries, is exacerbating the risk. Compared to Pakistani heroin users,
46 Friedman and Velenyi

displaced Afghan heroin users exhibit less knowledge regarding HIVtransmission and engage in high-risk behavior (Zafar at al. 2003).They are also at risk due to isolation from their families and lack ofmeans to support themselves.
The use of contaminated needles results in much higher risk of trans-mission than almost all other types of exposure (see annex table 2.1 fora comparison of risk behavior); hence reduction in these harmful prac-tices is a policy priority. Injection frequency, size of the sharing network,and probability of sharing, drive changes in incidence. The higher theprevalence of HIV within a community, the more likely an instance ofsharing can result in HIV transmission (Ball 1998; Hankins, Gendron andTran 1994). For example, in a population with 10 percent HIV seropos-itivity, a new user injecting once a day has a 90 percent chance of usingan infected needle within 21.5 days from onset of injecting. If the userinjects three times a day, the number of days drops to seven; at a rate offive times a day, a new user has a 90 percent chance of using an infectedneedle within four days (Riehman 1998).
Simple estimates of expected incidence for different vulnerablegroups (measures of risky behavior and HIV prevalence) have been use-ful to guide HIV prevention (Pisani et al. 2003). In the context ofAfghanistan, the existing described facts, estimates, and listed behav-ioral risks pose a strong call for more qualitative analysis, simulations,and collection of observational data in order to better model the futurecourse of disease transmission and to determine the most effectivepolicy responses.
Evidence on the Effectiveness and Cost-Effectiveness of HIV Prevention
Policy makers are aware of the possibility that without preventive meas-ures, Afghanistan may transition from the current low epidemic profileinto the stage of concentrated epidemic, where HIV prevalence in keypopulations is above 5 percent. However, health policy decisions incountries such as Afghanistan are made under extreme resource con-straints and informational uncertainty; a difficult double challenge.Additionally, reliable cost-effectiveness studies are lacking in low-income settings, and especially so in this context. Nevertheless, a reviewof cost-effective disease interventions offers some general lessons forpolicy priorities.
Responding to HIV in Afghanistan 47
Effectiveness of PreventionA general principle for prevention, especially relevant in the context ofa low to concentrated epidemiological course, is that it is more impor-tant to change behavior of people with high-level or risk behavior thanthose with low risk (Bertozzi et al. 2006). Interventions targeting keypopulations with high-risk behavior are expected to be the most effec-tive and efficient. Global experience suggests that if HIV epidemics asso-ciated with IDUs can be prevented or slowed, then the overall HIVepidemic can also be delayed (Ball, Rana, and Dehne 1998). Given theAfghan context, we primarily focus the discussion on the effectivenessand cost-effectiveness of preventive measures related to IDU.
Rapid increases of HIV prevalence among IDUs have usually beenassociated with a lack of awareness of AIDS as a local problem amongIDUs, scarcity of sterile injection equipment, and the presence of othermechanisms for rapid and efficient transmission, such as law enforcementefforts that spur frequent movement among drug users (Des Jarlais andFriedman 1996). Harm reduction activities targeted to IDUs provide possi-ble antidotes to these major drivers of risk (Needle et al. 1998). Harmreduction programs include simultaneously changing drug use practices(reduced injecting, use of alternate, noninjectable substances), needle prac-tices (cleaning and reduced sharing of needles and syringes), and sexualbehaviors (Ball 1998). Injection drug use also contributes to sexual trans-mission of HIV. Evidence from China indicates that younger IDUs havemore sexual partners and are unlikely to use condoms (Wu et al. 1997).There is an association between injection drug use and commercial sexwork for women (Ball 1998). Its spread among injection drug user popula-tions to their non-IDU sex partners and their offspring is dependent on themixing patterns between populations, as well as safer sex behavior practices.HIV prevention efforts targeting individuals injecting drugs should thereforeinclude efforts aimed at reducing risks resulting from unprotected sex.
Annexes 2.2 and 2.3 in the annex provides a summary of interventioneffectiveness and cost-effectiveness based on systematic review of the lit-erature. General lessons that emerge from this review are the following:
• A number of regional reviews, which examine cost-effectiveness ofHIV prevention in low-income countries, agree that health benefitscan be best maximized if the next increment of funding is devoted toprevention, some non-highly active antiretroviral therapy (HAART)treatment, and care (Marseille, Hofmann, and Kahn 2002; Creeseet al. 2002; Masaki et al. 2003; Hogan et al. 2005).
48 Friedman and Velenyi
• While there is difficulty in teasing out which components are most effective in reducing HIV risk behaviors among IDUs, there is clearevidence that needle exchange programs, peer outreach, and oralsubstitution therapy are effective (Jha et al. 2001).
• Possibly effective interventions to interrupt HIV transmission amongIDUs and between IDUs and other groups include programs promot-ing detoxification and abstinence, and programs targeting risky sexualbehaviors of IDUs.
• Efforts to halt drug trafficking through increased surveillance, stiffercriminal penalties for suppliers and users, and other measures in the“war against drugs” generally have not been successful. New drug traf-ficking routes emerge as existing ones are patrolled or cut. A conse-quence of market globalization has been the diffusion of drugs intocountries or regions that before had no history of injection drug use(Stimson, Adelekan, and Rhodes 1995).
Little has been published on the cost-effectiveness of harm reductionin a low-income context, partly because these interventions are notwidely implemented. Given the low cost of syringes, the extremely highefficiency of HIV transmission by this route, and the demonstratedeffectiveness of harm reduction programs in changing syringe-sharingbehavior, needle exchange programs should be one of the most cost-effective interventions (Bertozzi et al. 2006).
Three studies on a harm reduction strategy in Belarus (Kumaranayakeet al. 2004), Russia (Bobrik et al. 2004), and Ukraine (Vickerman et al.2006), have explored the costs and cost-effectiveness of a harm reduc-tion project working with IDUs. The results show that harm reduction iseffective, with a cost of US$359 per HIV infection averted and US$18per disability-adjusted life year (DALY) (Belarus); US$564 per HIVinfection averted and US$28 per DALY (Russia); and US$97 per HIVinfection averted (Ukraine). Two studies on a harm reduction strategyin Svetlogorsk, Belarus, have explored the costs and cost-effectivenessof a harm reduction project working with IDUs. Walker et al. (2003)found that the cost per person reached was US$1.19, and the cost perdisposable syringe distributed was US$0.39. Using a mathematicalmodel (Vickerman and Watts 2002), the cost-effectiveness of theNeedle Exchange Program (NEP) project was estimated to be US$71per HIV infection averted (Kumaranayake et. al. 2000). Yet studiesnote that as prevalence increases, harm reduction is likely not sufficient,but must be combined with other measures. In high-prevalence settings,
Responding to HIV in Afghanistan 49
harm reduction may reduce incidence, but not as much that it alsoreduces prevalence in the short term. This speaks to the need forassuring an effective harm reduction program in Afghanistan targetedtoward IDUs in as timely a manner as possible.
There is some evidence on the cost-effectiveness of outreach toIDUs. In general, HIV prevention strategies for IDUs are highly targeted(Kumarayanake et al. 2000). Much of the behavior change and AIDSrisk reduction that occurs among IDUs appears to occur through socialprocesses (Trotter, Rothenberg, and Coyle 1995). For example, in astudy of AIDS risk reduction among IDUs in Bangkok, Glasgow, NewYork, and Rio de Janeiro, talking with one’s drug-using peers aboutAIDS was the one factor associated with risk reduction in all four cities(Seidman 1983; Des Jarlais and Friedman 1995). As for costs, an IDUoutreach project in Kathmandu, Nepal, which relied on street-basedoutreach on foot, had a cost per client contact of US$3.21 (Söderlundet al. 1993).
The evidence indicates that harm reduction should be applied early inhigh-risk populations so the epidemic is controlled before it gets to thestage where additional resources and interventions are required even justto maintain the status quo. Alongside this international evidence, locallyspecific estimates of the relative social efficiency of investments in harmreduction activities can also help guide policy. The next section demon-strates a simple method to generate such estimates.
HIV Prevention in Afghanistan—An Economic Perspective
Building on our observations on the epidemiological situation inAfghanistan, and the lessons from our discussion of the effectiveness of pre-vention measures, the present section provides an economic perspective ona national HIV and AIDS prevention program being implemented inAfghanistan, specifically the activities supported by the Afghanistan HIVand AIDS Prevention Project supported by the World Bank.3
In our earlier discussion, we described the central role of injecting druguse in the transmission of HIV in Afghanistan. More generally, Wilson andClaeson (this volume) point at the intersection of injecting drug use andhigh-risk sexual behavior in the transmission of HIV. The AfghanistanHIV and AIDS Prevention Project (AHAPP) therefore is geared towardscaling up of prevention programs targeting people engaged in high-riskbehaviors, notably injecting drug use and unsafe sex, including vulnerablegroups at high risk, like IDUs, sex workers and their clients, truckers, and
50 Friedman and Velenyi

prisoners. Additionally, the project aims to improve the knowledge ofHIV prevention among the general population, strengthen surveillanceof HIV prevalence and high-risk behaviors, map and estimate the sizes ofgroups engaged in high-risk behavior, and use communications and advo-cacy to reduce stigma related to HIV and AIDS.
As noted earlier, obtaining an accurate picture of Afghanistan’s currentepidemiologic situation, let alone forecasting the future course of disease, isfraught with difficulties in this data-scarce environment. Nevertheless cap-turing and conveying the economic impact of prevention efforts requiresforecasts of possible future courses of the disease. Afghanistan’s neighborsmay serve as one example. If Afghanistan were to follow the Iranianexample described above, then an increase from less than 0.1 percent ofthe general adult population (ages 15–49) to 0.2 over five years repre-sents a minimum of 16,000 new infections.4 This hypothetical course ofthe epidemic in the absence of enhanced disease prevention serves asthe baseline progression of the disease in Afghanistan for the economicanalysis below.
There are numerous approaches commonly applied to assessing theeconomic consequences of HIV prevention measures. The two most com-mon approaches are (1) an assessment that relates the costs of somemeasures to the benefits in terms of years of life saved or some otherhealth measure such as the number of infections prevented, or (2) anassessment that relates the economic benefits of some intervention to itscosts. Below, we apply each approach to assess the postulated economicbenefits of an HIV prevention program in Afghanistan.
Afghanistan, with support from the World Bank, is planning to spendUS$10 million over the next three years on the HIV and AIDS preven-tion project. This is part of a larger national operational program towhich other donors also contribute, notably the Global Fund to FightAIDS, Tuberculosis and Malaria. The World Bank support corresponds toa net present value of US$9.4 million.5 Subsequently, the expectedannual costs will be somewhat lower than in the initial period, at aroundUS$3 million per year (table 2.1).
For the purposes of this exercise, the assumed impact of the projectin its entirety on transmission is set at the deliberately conservativeexpected value of a 30 percent reduction in expected infections overthe period 2007–10 (approximately equal to 4,800 infections averted).A conservative assumption of hypothesized impacts seems particu-larly germane given the information uncertainties previously dis-cussed. With this assumption, disease prevalence in the overall adult
Responding to HIV in Afghanistan 51
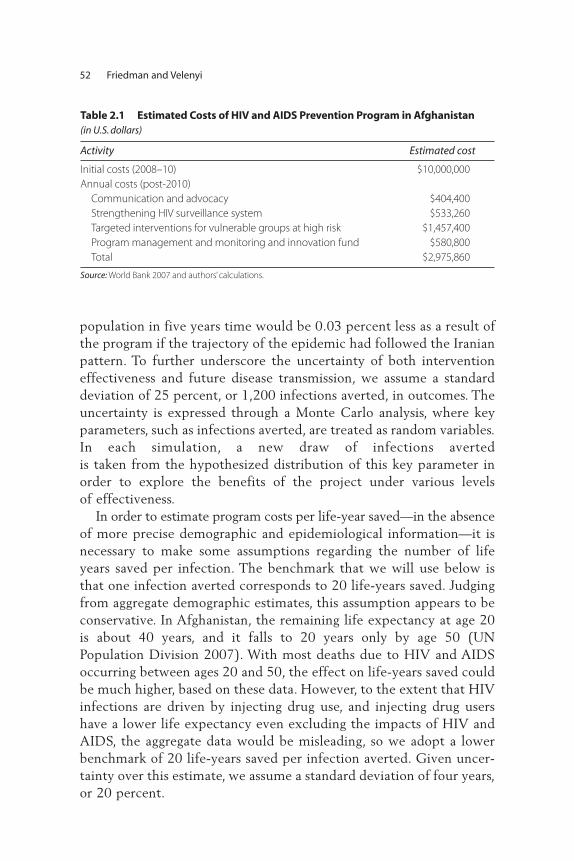
population in five years time would be 0.03 percent less as a result ofthe program if the trajectory of the epidemic had followed the Iranianpattern. To further underscore the uncertainty of both interventioneffectiveness and future disease transmission, we assume a standarddeviation of 25 percent, or 1,200 infections averted, in outcomes. Theuncertainty is expressed through a Monte Carlo analysis, where keyparameters, such as infections averted, are treated as random variables.In each simulation, a new draw of infections averted is taken from the hypothesized distribution of this key parameter inorder to explore the benefits of the project under various levels of effectiveness.
In order to estimate program costs per life-year saved—in the absenceof more precise demographic and epidemiological information—it isnecessary to make some assumptions regarding the number of lifeyears saved per infection. The benchmark that we will use below isthat one infection averted corresponds to 20 life-years saved. Judgingfrom aggregate demographic estimates, this assumption appears to beconservative. In Afghanistan, the remaining life expectancy at age 20is about 40 years, and it falls to 20 years only by age 50 (UNPopulation Division 2007). With most deaths due to HIV and AIDSoccurring between ages 20 and 50, the effect on life-years saved couldbe much higher, based on these data. However, to the extent that HIVinfections are driven by injecting drug use, and injecting drug usershave a lower life expectancy even excluding the impacts of HIV andAIDS, the aggregate data would be misleading, so we adopt a lowerbenchmark of 20 life-years saved per infection averted. Given uncer-tainty over this estimate, we assume a standard deviation of four years,or 20 percent.
52 Friedman and Velenyi
Table 2.1 Estimated Costs of HIV and AIDS Prevention Program in Afghanistan (in U.S. dollars)
Activity Estimated cost
Initial costs (2008–10) $10,000,000
Annual costs (post-2010)
Communication and advocacy $404,400
Strengthening HIV surveillance system $533,260
Targeted interventions for vulnerable groups at high risk $1,457,400
Program management and monitoring and innovation fund $580,800
Total $2,975,860
Source: World Bank 2007 and authors’ calculations.

With discounted estimated project costs of US$9.4 million overthe first three years, and an estimated 4,800 infections averted, themean costs per infection averted comes out at US$1,960 per infectionprevented. As the 4,800 preventions averted correspond to about96,000 life-years saved, this translates into a cost of about US$98 perlife-year saved. Given the stochastic assumptions concerning theeffectiveness of prevention and the uncertainty over life-years saved,the cost per life-year saved ranges from US$47 to US$439. These esti-mates are summarized in table 2.2, which presents various benchmarkpercentiles in estimated outcomes. The majority of estimates, con-tained in the 10th to 90th percentiles, range over the shorter intervalsof (3,194, 6,452) infections averted and (US$69, US$161) per year oflife saved.
With additional assumptions, the benefits from prevention activitiescan be translated into a monetary equivalent in order to compare directlywith program costs. The monetized benefits from a reduced number ofHIV infections are here determined as the sum of three factors: the costsof medical treatment forgone, the value of lost earnings for people livingwith HIV and AIDS (PLWHAs) given increased mortality, and the valueof lost earnings for the typically familial and unpaid caretakers. These aresome of the more direct costs of infection. Additional costs require evenfurther assumptions and so the analysis makes no attempt either to directlyvalue the years of life lost due to premature mortality or to cost the pecu-niary savings from a reduction in tuberculosis and other opportunisticinfections transmitted to HIV-negative individuals. Clearly, taking thesevalues into account will substantially increase the estimated benefitsdepicted here.
Wage and earnings information for Afghan workers is incompleteand often of questionable validity. One careful small-scale longitudi-nal study conducted in three urban centers (Kabul, Herat, Jalalabad)estimate mean annual earnings to be US$425 (Beall and Schutte2006) (see table 2.3). Since this study spans a 12-month period, itincludes seasonal spells of underemployment and unemployment.Approximately 80 percent of earners are male, so this wage estimate isheavily weighted toward male earners. There are no direct estimates ofwage earnings among IDUs or their likely sexual partners. Furthermore,there are no direct estimates of wages earned by recovered IDUs whoare no longer injecting. Given these uncertainties, and the fact thatthe majority of IDUs are male, this study directly adopts the estimateof earnings mentioned above. Real wages are set to grow an average of
Responding to HIV in Afghanistan 53

Table 2.2 HIV Prevention Program: Costs and Years of Life Lost (YLL) Averted (costs in U.S. dollars)
Percentile
1st 10th 25th 50th 75th 90th 99th
Total program cost 10,000,000 10,000,000 10,000,000 10,000,000 10,000,000 10,000,000 10,000,000
Present value of total program cost 9,399,600 9,399,600 9,399,600 9,399,600 9,399,600 9,399,600 9,399,600
Number of infections averted 2,087 3,184 3,891 4,907 5,764 6,452 7,202
Total averted YLL 35,908 58,283 72,991 95,152 119,173 136,899 185,777
Present value of cost of YLL averted 262 161 129 99 79 69 51
Source: Authors’ calculations.
54
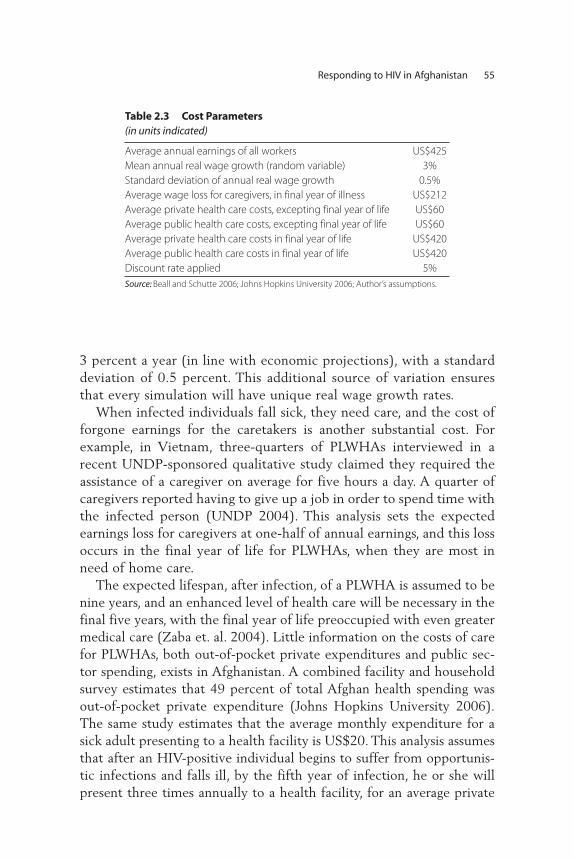
3 percent a year (in line with economic projections), with a standarddeviation of 0.5 percent. This additional source of variation ensuresthat every simulation will have unique real wage growth rates.
When infected individuals fall sick, they need care, and the cost offorgone earnings for the caretakers is another substantial cost. Forexample, in Vietnam, three-quarters of PLWHAs interviewed in arecent UNDP-sponsored qualitative study claimed they required theassistance of a caregiver on average for five hours a day. A quarter ofcaregivers reported having to give up a job in order to spend time withthe infected person (UNDP 2004). This analysis sets the expectedearnings loss for caregivers at one-half of annual earnings, and this lossoccurs in the final year of life for PLWHAs, when they are most inneed of home care.
The expected lifespan, after infection, of a PLWHA is assumed to benine years, and an enhanced level of health care will be necessary in thefinal five years, with the final year of life preoccupied with even greatermedical care (Zaba et. al. 2004). Little information on the costs of carefor PLWHAs, both out-of-pocket private expenditures and public sec-tor spending, exists in Afghanistan. A combined facility and householdsurvey estimates that 49 percent of total Afghan health spending wasout-of-pocket private expenditure (Johns Hopkins University 2006).The same study estimates that the average monthly expenditure for asick adult presenting to a health facility is US$20. This analysis assumesthat after an HIV-positive individual begins to suffer from opportunis-tic infections and falls ill, by the fifth year of infection, he or she willpresent three times annually to a health facility, for an average private
Responding to HIV in Afghanistan 55
Table 2.3 Cost Parameters (in units indicated)
Average annual earnings of all workers US$425
Mean annual real wage growth (random variable) 3%
Standard deviation of annual real wage growth 0.5%
Average wage loss for caregivers, in final year of illness US$212
Average private health care costs, excepting final year of life US$60
Average public health care costs, excepting final year of life US$60
Average private health care costs in final year of life US$420
Average public health care costs in final year of life US$420
Discount rate applied 5%
Source: Beall and Schutte 2006; Johns Hopkins University 2006; Author’s assumptions.
cost of US$60 a year. The study further assumes an equal amount ofresources in the public sector is devoted to that individual’s care (sincethe amount of spending in the health system from private and publicsources is estimated to be roughly equal).
It is to be expected that this level of care, including the maintenanceof opportunistic infections, will be necessary for several years, while inthe final year the costs are expected to rise substantially. The sameUNDP-sponsored Vietnam study referenced above found that the aver-age per-capita health expenditure per PLWHA rose sevenfold in the finalyear of life (UNDP 2004). This study takes the same multiplier andapplies it in the Afghan context. Hence, public and private spendingeach averages US$420 in the final year of life for a PLWHA.
Table 2.4 summarizes the results of our estimates and simulations.The median present value of total costs averted is estimated at US$30.8million, yielding a gross benefit-cost ratio of 3.28. Indeed, almost everypoint in the range of possible outcomes is associated with a substantiallyhigher present value of total costs averted. In only one simulation (outof 500) is the estimated gross benefit less than cost. Given that theserough calculations—based on deliberately conservative assumptions—show a positive return, and often a substantially positive return, we findthat effective harm reduction activities can result in significant savingsfor Afghanistan as a whole.
These savings are further increased when reduced demand for healthservices is also taken into account. The median present value of savings tothe health care system due to reduced system expenditures on PLWHAsis estimated at US$2.04 million, resulting in a net program cost ofUS$7.36 million and a net benefit-cost ratio of 4.19. Between the 1stand the 99th percentile, the benefit-cost ratio ranges between 1.47 and7.59. These ranges of gross and net benefit-cost ratios calculated here areconsistent with the ratios found in other countries in the region, espe-cially when the conservative estimates of program impact are taken intoaccount. Even with these very conservative assumptions on programimpact, made in a data-scarce environment, the anticipated net benefitsare substantial.
Conclusions
While HIV prevalence in Afghanistan is low, the large number of IDUssuggests the potential for an escalation of HIV prevalence, both within thedrug-injecting population, and onward transmission of the virus. Many of
56 Friedman and Velenyi

Table 2.4 HIV Prevention Program: Costs and Outcomes (costs in U.S. dollars)
Percentile
1st 10th 25th 50th 75th 90th 99th
Total program cost 10,000,000 10,000,000 10,000,000 10,000,000 10,000,000 10,000,000 10,000,000
Present value of total program cost 9,399,600 9,399,600 9,399,600 9,399,600 9,399,600 9,399,600 9,399,600
Number of infections averted 2,087 3,184 3,891 4,907 5,764 6,452 7,202
Present value of total costs averted 12,539,100 19,481,900 24,545,100 30,801,800 36,647,600 41,415,300 48,592,700
Present value of public costs averted 869,100 1,326,100 1,620,600 2,044,000 2,400,800 2,687,400 2,999,800
Net program cost 8,530,500 8,073,500 7,779,000 7,355,600 6,998,800 6,712,200 6,399,800
Gross program costs per HIV infection
averted 4,504 2,952 2,416 1,916 1,631 1,457 1,305
Gross benefit-cost ratio 1.33 2.07 2.61 3.28 3.9 4.41 5.17
Net program costs per HIV infection
averted 4,087 2,536 1,999 1,499 1,214 1,040 889
Net benefit-cost ratio 1.47 2.41 3.16 4.19 5.24 6.17 7.59
Source: Author’s calculations.
57
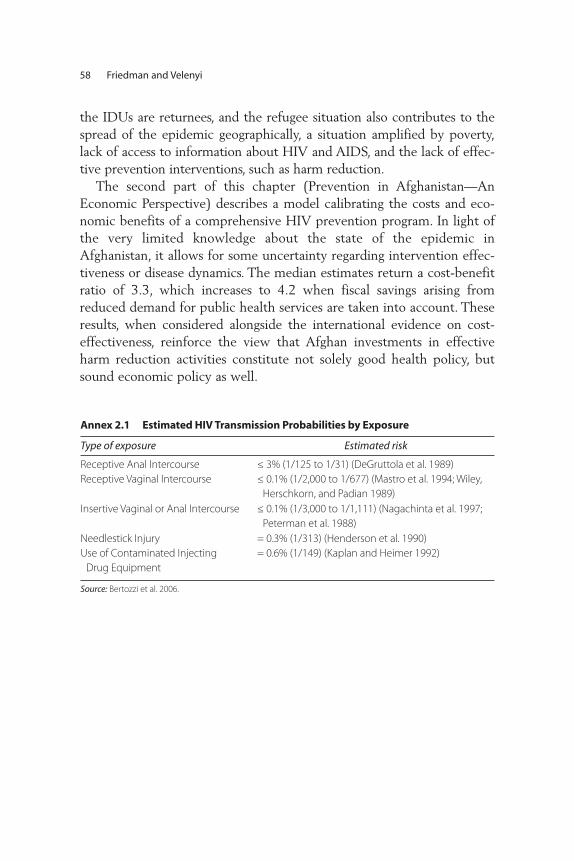
the IDUs are returnees, and the refugee situation also contributes to thespread of the epidemic geographically, a situation amplified by poverty,lack of access to information about HIV and AIDS, and the lack of effec-tive prevention interventions, such as harm reduction.
The second part of this chapter (Prevention in Afghanistan—AnEconomic Perspective) describes a model calibrating the costs and eco-nomic benefits of a comprehensive HIV prevention program. In light ofthe very limited knowledge about the state of the epidemic inAfghanistan, it allows for some uncertainty regarding intervention effec-tiveness or disease dynamics. The median estimates return a cost-benefitratio of 3.3, which increases to 4.2 when fiscal savings arising fromreduced demand for public health services are taken into account. Theseresults, when considered alongside the international evidence on cost-effectiveness, reinforce the view that Afghan investments in effectiveharm reduction activities constitute not solely good health policy, butsound economic policy as well.
58 Friedman and Velenyi
Annex 2.1 Estimated HIV Transmission Probabilities by Exposure
Type of exposure Estimated risk
Receptive Anal Intercourse ≤ 3% (1/125 to 1/31) (DeGruttola et al. 1989)
Receptive Vaginal Intercourse ≤ 0.1% (1/2,000 to 1/677) (Mastro et al. 1994; Wiley,
Herschkorn, and Padian 1989)
Insertive Vaginal or Anal Intercourse ≤ 0.1% (1/3,000 to 1/1,111) (Nagachinta et al. 1997;
Peterman et al. 1988)
Needlestick Injury = 0.3% (1/313) (Henderson et al. 1990)
Use of Contaminated Injecting
Drug Equipment
= 0.6% (1/149) (Kaplan and Heimer 1992)
Source: Bertozzi et al. 2006.

(continued)
Annex 2.2 Evidence on Effectiveness of Harm Reduction in Injecting Drug Users (IDUs), and Other Preventive Measures
Intervention Outcome Impact/policy implication Methodology Country/region Source
Various Methods
of Harm
Reduction
HIV Incidence Significant reduction in HIV incidence in
the intervention group was found in
both studies.
Meta-analysis Global6 Des Jarlais and
Friedman 1996
Outreach to IDUs Reduced risk
behavior
The baseline to follow-up measurements showed
substantial reductions in HIV risk behavior in the
National AIDS Demonstration Research studies.
However, only a few of the NADR projects showed
significantly greater risk reduction in the
“enhanced” versus the “standard” interventions.7
Randomized
clinical trial
50 cities in
the United States
Friedman and Des
Jarlais 1991
Bleach
Disinfection
HIV incidence 2 studies (Baltimore and New York) found no
protective effect of self-reported bleach
disinfection, while the third (Miami) found a
moderately strong protective effect.8
Cohort studies
using multivariate
analysis
Baltimore, New York,
and Miami
Vlahov et al. 1994;
Titus et al. 1994;
Weatherby et al.
(in Des Jarlais and
Friedman 1996)
Bleach
Disinfection
Life-years saved
and change in
cohort HIV
prevalence
Bleach programs can produce the greatest life-year
(LY) savings in areas of low HIV prevalence. In the
lowest prevalence scenario (0.02), the projected
LY savings is 2.3 years/HIV negative drug user,
compared with 1.7 and 1.3 under medium (0.25)
and high prevalence (0.60). The results suggest
the introduction of bleach programs early, when
prevalence is still comparatively low in the IDU
population.
Markov model
simulation
4 hypothetical
cohorts of IDUs
Data for simulation:
urban health study,
San Francisco
Siegel et al. 1991
59
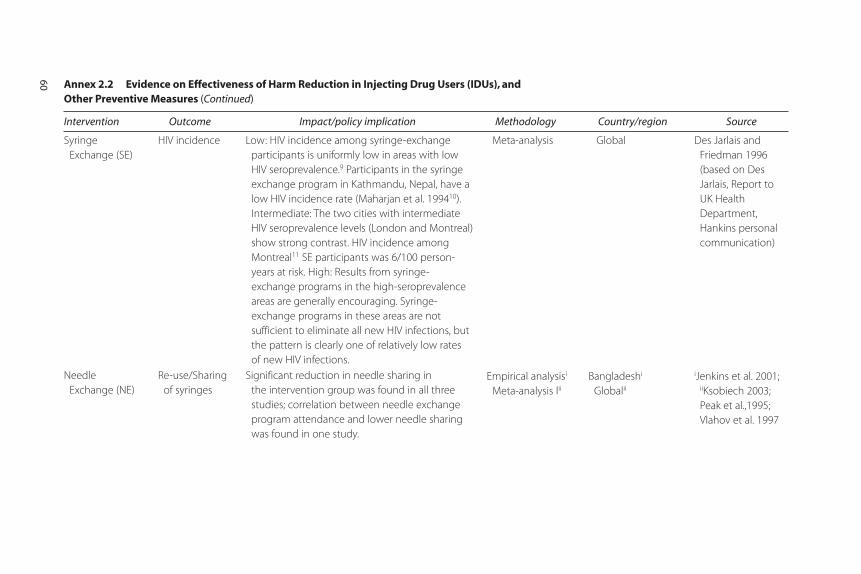
Annex 2.2 Evidence on Effectiveness of Harm Reduction in Injecting Drug Users (IDUs), and Other Preventive Measures (Continued)
Intervention Outcome Impact/policy implication Methodology Country/region Source
Syringe
Exchange (SE)
HIV incidence Low: HIV incidence among syringe-exchange
participants is uniformly low in areas with low
HIV seroprevalence.9 Participants in the syringe
exchange program in Kathmandu, Nepal, have a
low HIV incidence rate (Maharjan et al. 199410).
Intermediate: The two cities with intermediate
HIV seroprevalence levels (London and Montreal)
show strong contrast. HIV incidence among
Montreal11 SE participants was 6/100 person-
years at risk. High: Results from syringe-
exchange programs in the high-seroprevalence
areas are generally encouraging. Syringe-
exchange programs in these areas are not
sufficient to eliminate all new HIV infections, but
the pattern is clearly one of relatively low rates
of new HIV infections.
Meta-analysis Global Des Jarlais and
Friedman 1996
(based on Des
Jarlais, Report to
UK Health
Department,
Hankins personal
communication)
Needle
Exchange (NE)
Re-use/Sharing
of syringes
Significant reduction in needle sharing in
the intervention group was found in all three
studies; correlation between needle exchange
program attendance and lower needle sharing
was found in one study.
Empirical analysisi
Meta-analysis liiBangladeshi
Globalii
iJenkins et al. 2001;iiKsobiech 2003;
Peak et al.,1995;
Vlahov et al. 1997
60

Needle
Exchange (NE)
HIV infection On average, seroprevalence increased by 5.9%
per year in the 52 cities without NE programs
(NEPs), and decreased by 5.8% per year in the
29 cities with NEPs. The average annual change
in seroprevalence was 11% lower in cities with
NEPs (95% CI –17.6 to –3.9, p = 0.004). Results,
together with the clear theoretical mechanisms
by which NEPs could reduce HIV incidence,
strongly support the view that NEPs
are effective.
Meta-analysis of
NEPs in 80 cities,
combined with
unpublished
information from
the CDC on
seroprevalence of
IDUs entering
treatment in the
United States
between 1988
and 1993.
Global Hurley, Jolley, and
Kaldor 1997
Needle
Exchange (NE)
HIV infection Starting from prevalence rates for 23% (whites)
and 88% (natives), based on 24 seroconversions
among 257 follow-up visits, estimated HIV
incidence was 18.6 per 100 person-years (95%
confidence interval, 11.1–26.0). Despite having the
largest NEP in North America, Vancouver has been
experiencing an ongoing HIV epidemic. Whereas
NEPs are crucial for sterile syringe provision, they
should be considered one component of a
comprehensive program including counseling,
support, and education.
Prospective study.
logistical
regression of
semiannual
case-control
data on 1,000
IDUs, reached
through street
outreach or
self-referred
to NEP
Vancouver Strathdee et al. 1997
61
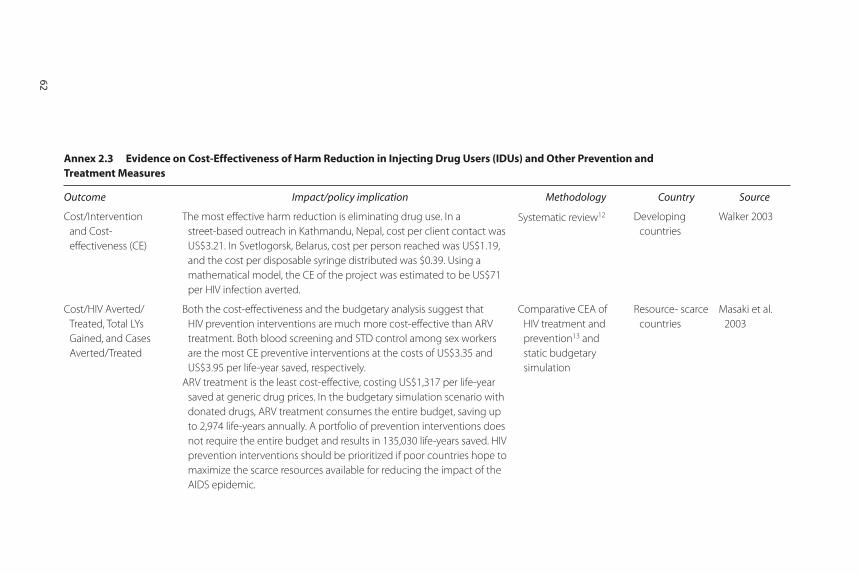
62
Annex 2.3 Evidence on Cost-Effectiveness of Harm Reduction in Injecting Drug Users (IDUs) and Other Prevention and Treatment Measures (Continued)
Outcome Impact/policy implication Methodology Country Source
Cost/Intervention
and Cost-
effectiveness (CE)
The most effective harm reduction is eliminating drug use. In a
street-based outreach in Kathmandu, Nepal, cost per client contact was
US$3.21. In Svetlogorsk, Belarus, cost per person reached was US$1.19,
and the cost per disposable syringe distributed was $0.39. Using a
mathematical model, the CE of the project was estimated to be US$71
per HIV infection averted.
Systematic review12 Developing
countries
Walker 2003
Cost/HIV Averted/
Treated, Total LYs
Gained, and Cases
Averted/Treated
Both the cost-effectiveness and the budgetary analysis suggest that
HIV prevention interventions are much more cost-effective than ARV
treatment. Both blood screening and STD control among sex workers
are the most CE preventive interventions at the costs of US$3.35 and
US$3.95 per life-year saved, respectively.
ARV treatment is the least cost-effective, costing US$1,317 per life-year
saved at generic drug prices. In the budgetary simulation scenario with
donated drugs, ARV treatment consumes the entire budget, saving up
to 2,974 life-years annually. A portfolio of prevention interventions does
not require the entire budget and results in 135,030 life-years saved. HIV
prevention interventions should be prioritized if poor countries hope to
maximize the scarce resources available for reducing the impact of the
AIDS epidemic.
Comparative CEA of
HIV treatment and
prevention13 and
static budgetary
simulation
Resource- scarce
countries
Masaki et al.
2003

63
(continued)
Annex 2.3 Evidence on Cost-Effectiveness of Harm Reduction in Injecting Drug Users (IDUs) and Other Prevention and Treatment Measures (Continued)
Outcome Impact/policy implication Methodology Country Source
Cost/Intervention and
Cost-effectiveness (CE)
(i) Median costs in NEP per participant contact range from US$1.35 in the
United States to US$3.21 in Nepal. Cost-benefit analysis (CBA) of NEPs
found ranges of the cost per HIV infection averted in the United States
to be between US$3,800 to almost US$100,000, below the estimated
lifetime cost of treating an HIV-infected person (Lurie et al.1997).
(ii) Annual costs of methadone maintenance in the United States run
US$5,250 per person, based on an analysis of 600 programs conducted
by Barnett et al. 2001. (iii) The supply control strategies being
employed in many African countries, for example, have demonstrated
only limited effectiveness based on reports of increasing trading
activities and drug availability.
Systematic review of
effectiveness and
cost-effectiveness
Low- and
middle-income
countries
Jha et al. 2001
HIV Infection and
DALYs
US$359/HIV Infection
US$18/DALY
CEA (Financial and
economic cost)
modeling14
Belarus Kumaranayake
et al. 2004
HIV Infection and
DALYs
US$564/HIV infection
US$28/DALY
Empirical Russia Bobrik 2004
HIV Infection US$97/HIV infection (Between 1999 and 2000, at the coverage of between
20% to 38%, and an IDU HIV prevalence of 54%, projections suggest
792 HIV infections were averted, a 22% decrease in IDU HIV incidence,
but a 1% increase in IDU HIV prevalence. Cost per HIV infection averted
was US$97. Scaling up the intervention to reach 60% of IDUs remains CE
and reduces HIV prevalence by 4% over five years. At the current cover-
age, the harm reduction intervention in Odessa is CE but is unlikely to
reduce IDU HIV prevalence in the short term. To reduce HIV prevalence,
more resources are needed to increase coverage.
Mathematical modeling
of economic providers’
costs with empirical
data
Odessa, Ukraine Vickerman et al.
2006

Annex 2.3 Evidence on Cost-Effectiveness of Harm Reduction in Injecting Drug Users (IDUs) and Other Prevention and Treatment Measures (Continued)
Outcome Impact/policy implication Methodology Country Source
HIV Infection CER CER US$20,947/HIV infection CEA using cost and
process data.
Alternative estimates
calculated using
published data and
simplified circulation
model. HIV treatment
cost taken from
literature.
New York Laufer 2001
Source: Authors (Expanded from Bertozzi et al. 2006).
64

Responding to HIV in Afghanistan 65
Notes
1. Unfavorable conditions include rate and pattern of sexual partner change, thepresence or absence of male circumcision, and injecting drug use—frequentlycoupled with sex work. War—through increased mobility and psychologicaldistress—can amplify the problem, increasing the number of displaced peopleand refugees, and drug-injecting prisoners. Disempowerment of women andfragmented social networks are further contributing factors to increased like-lihood of HIV transmission in vulnerable groups.
2. Wollants et al. (1995), and Smallman-Raynor and Cliff (1991) discuss theimplications of armed conflict for the spread of HIV/AIDS in El Salvadorand the Central African Republic, respectively.
3. For more information, see http://go.worldbank.org/GL463NSC10.
4. This assumes a mortality rate of 15 percent over the next five years for indi-viduals already or soon to be HIV positive).
5. Our analysis adopts a discount rate of 5 percent, a typical value for the eval-uation of health projects.
6. Studies classified as “global” are skewed toward research in developed countries.
7. The National AIDS Demonstration Research (NADR) program was an out-reach program to IDUs not in treatment in 50 cities in the United States, whichrandomly assigned individual subjects to “enhanced outreach” intervention(treatment group) and “standard outreach” (control group). Standard Interventionincludes: risk behavior interview, HIV counseling and testing (VCT), and basicAIDS education. Enhanced Intervention includes: additional hours of individual orsmall-group counseling and skills training
8. Potential reasons for failure of bleach disinfection: IDUs not following adequatedisinfection procedures; formidable measurement problems (difficult to meas-ure “good” disinfection and therefore identify valid control group); need to dis-tinguish between IDUs using only sterile/unused equipment, IDUs using bleachdisinfection, and IDUs not using bleach disinfection; and IDU injection prac-tices vary (Des Jarlais and Friedman 1996).
9. This in part reflects the dynamics of HIV transmission, where “equal” risk-reduction programs will have greater impact if they are implemented whenseroprevalence is low.
10. Maharjan et al. (1994) was the first report of a successful SE program in adeveloping country.
11. The reasons for the high incidence rate among Montreal syringe-exchangeparticipants have not yet been determined (Bruneau, personal communica-tion by Des Jarlais), but may include: (1) attracting a group of participants atextremely high risk for HIV infection; and (2) an insufficient number of

syringes exchanged per visit, given the high frequency of drug injectionamong the participants.
12. Databases: Medline, HealthStar, Popline, Health Economic EvaluationDatabase (HEED), ISI, Science and Social Sciences, Embase, and Cab Health;and correspondence with donor organizations.
13. This study examined five prevention interventions: (1) voluntary counselingand testing; (2) prevention of mother-to-child transmission; (3) STD masstreatment for general population; (4) STD management for sex workers; and(5) blood screening, and four drug price scenarios for ART for HIV-positivepatients.
14. Kumaranayake et al. (2004) undertake an analysis of the cost-effectivenessof a harm reduction and HIV prevention project for IDUs in EasternEurope. Economic evaluation methods were adapted to consider the effectof an eight-month financing gap that negatively impacted project imple-mentation. Financial and economic costs of implementing the interventionwere analyzed retrospectively. The data were also modeled to estimate thecosts of a fully functioning project. Estimates of the intervention impact onsexual and drug injecting behavior were obtained from existing pre- andpostintervention behavioral surveys of IDUs. A dynamic mathematicalmodel was used to translate these changes into estimates of HIV infectionsaverted among IDUs and their sexual partners. Projections of the potentialeffect of the shortfall in funding on the impact and cost-effectiveness of theintervention were made. In Svetlogorsk, Belarus, where in 1997 the IDUHIV prevalence was 74 percent, the intervention averted 176 HIV infec-tions (95 percent CI 60–270) with cost-effectiveness of US$359 per HIVinfection averted (95 percent CI US$234–US$1,054). Without theUS$2,311 reduction (7 percent) in financing, the estimated cost-effective-ness ratio of the project would have been 11 percent lower. The costingmethods used to measure donated mass media can substantially influencecost and cost-effectiveness estimates. Harm reduction activities amongIDUs can be cost-effective, even when IDU HIV prevalence and inci-dence is high. Relatively small shortfalls in funding reduce impact andcost-effectiveness. Increased and consistent allocation of resources toharm reduction projects could significantly reduce the pace of the HIVepidemic in Eastern Europe.
References
Ball, A.L. 1998. “Overview: Policies and Interventions to Stem HIV-1 EpidemicsAssociated with Injecting Drug Use. In Drug Injecting and HIV Infection: GlobalDimensions and Local Responses, ed. G.V. Stimson, et al., 201–33. London:UCL Press Limited.
66 Friedman and Velenyi

Responding to HIV in Afghanistan 67
Ball A., S. Rana, and K. Dehne. 1998. “HIV Prevention among Injecting DrugUsers: Responses in Developing and Transitional Countries.” Public HealthReports 113 (Supplement 1): 170–81.
Beall, Jo, and Stefan Schutte. 2006. “Urban Livelihoods in Afghanistan.” SynthesisPaper Series, Afghanistan Research and Evaluation Unit, Kabul, Afghanistan.
Bertozzi, Stefano, and others. 2006. “HIV/AIDS Prevention and Treatment.” InDisease Control Priorities in Developing Countries, 2nd ed., ed. Dean T. Jamisonand others, 331–370. Washington DC: Oxford University Press and World Bank.
Bobrik, A. 2004. “HIV Prevention among IDUs in Russia: A Cost-EffectivenessAnalysis.” Paper presented at the 14th International Conference on theReduction of Drug-Related Harm, Chiang Mai, Thailand, April.
Robert Chase, John Foran, Abdul Rasheed, John D. O’Neil , Stephen Moses, andJames F. Blanchard. 2008. Mapping and Situation Assessment of Key Populationsat High Risk of HIV in Three Cities of Afghanistan. Washington, DC: World Bank.
Creese A., K. Floyd, A. Alban, and L. Guinness. 2002 “Cost-effectiveness ofHIV/AIDS Interventions in Africa: A Systematic Review of the Evidence.” TheLancet 359:1635–43.
Des Jarlais, D.C., and S.R. Friedman. 1996. “HIV Epidemiology and Interventionsamong Injecting Drug Users.” International Journal of STD & AIDS 7(Supplement 2): 57–61.
Des Jarlais D.C., S.R. Friedman, P. Friedmann, et al. 1995. “HIV/AIDS-relatedBehavior Change among Injecting Drug Users in Different National Settings.”AIDS 9: 611–17.
Friedman, S.R., and D.C. Des Jarlais. 1991. “HIV among Drug Injectors: TheEpidemic and the Response.” AIDS Care 3: 239–50.
Friedman, S.R., A. Neaigus, B. Jose, R. Curtis, M. Goldstein, G. Ildefonso, R.B.Rothenberg, and D.C. Des Jarlais, D.C. 1997. “Sociometric Risk Networksand Risk for HIV Infection.” American Journal of Public Health 87 (8):1289–96.
Hankins C., S. Gendron, and T. Tran. 1994. “Montreal Needle Exchange AttendersVersus Non-Attenders: What’s the Difference?” Paper presented at the 10thInternational Conference on AIDS, Yokohama, Japan.
Hogan, D.R., R. Baltussen, C. Hayashi, J.A. Lauer, and J. Salomon. 2005. “CostEffectiveness Analysis of Strategies to Combat HIV/AIDS in DevelopingCountries.” British Medical Journal 331: 1431–37.
Hurley, S.F., D.J. Jolley, and J. M. Kaldor. 1997. “Effectiveness of Needle-ExchangeProgrammes for Prevention of HIV Infection.” The Lancet 349 (9068):1797–800.
International Monetary Fund (IMF). 2006. “Islamic Republic of Afghanistan—Draft Staff Report for First Review under the Three-Year Arrangement under
the Poverty Reduction and Growth Facility.” International Monetary Fund,WashiFngton, DC.
International Monetary Fund (IMF). 2007a. World Economic Outlook Database—October 2007 Edition. IMF, Washington, DC. http://www.imf.org/external/pubs/ft/weo/2007/02/ weodata/index.aspx.
International Monetary Fund (IMF). 2007b. “Islamic Republic of Afghanistan:Second Review Under the Three-Year Arrangement Under the PovertyReduction and Growth Facility.” IMF Country Report No. 07/252, Washington,DC.
IRINews.org. “Bitter-sweet Harvest: Afghanistan’s New War: IRIN Web Special onthe Threat of Opium to Afghanistan and the Region. Addiction: Drug Abusein Kabul City and Beyond.” UN Office for the Coordination of HumanitarianAffairs. July 2007. http://www.irinnews.org/webspecials/Opium/addadd.asp(accessed Sept. 12, 2008).
Jenkins, C., H. Rahman, T. Saidel, S. Jana, and A.M. Hussain. 2001. “Measuring theImpact of Needle Exchange Programs among Injecting Drug Users throughthe National Behavioural Surveillance in Bangladesh.” AIDS Education andPrevention 13 (5): 452–61.
Jha, P., J.D. Nagelkerke, E.N. Ngugi et al. 2001. “Reducing HIV Transmission inDeveloping Countries,” Science 292 (5515): 224–25.
Johns Hopkins University Third Party Evaluation Team. 2006. “Health SeekingBehavior, Health Expenditures, and Cost Sharing Practices in Afghanistan.”Draft manuscript.
Kumaranayake L., J. Pepperall, H. Goodman, et al. 2000. “Costing Guidelinesfor HIV/AIDS Prevention Strategies. UNAIDS Best Practice Collection-Key Materials.” UNAIDS, Geneva, Switzerland. http://www.unaids.org/html/pub/publications/irc-pub05/jc412 n_pdf.pdf.
Kumaranayake, L., P. Vickerman, D. Walker, S. Samoshkin, V. Romantzov, Z.Emelyanova, et al. 2004. “The Cost-Effectiveness of HIV Preventive Measuresamong Injecting Drug Users in Svetlogorsk, Belarus.” Addiction 99 (12):1565–76.
Ksobiech, K., 2003. “A Meta-Analysis of Needle Sharing, Lending, and BorrowingBehaviors of Needle Exchange Program Attenders.” AIDS Education andPrevention 15 (3): 257–68.
Laufer, F.N. 2001. “Cost-Effectiveness of Syringe Exchange as an HIV PreventionStrategy.” JAIDS Journal of Acquired Immune Deficiency Syndromes 28 (3):273–78.
Maharjan S.H., A. Peak, S. Rana, N. Crofts. 1994. “Declining Risk for HIVamong IDUs in Kathmandu: Impact of a Harm Reduction Program.” Paperpresented at the 10th International Conference on AIDS, Yokohama,Japan.
68 Friedman and Velenyi
Responding to HIV in Afghanistan 69
MAP (Monitoring the AIDS Pandemic). 2004. AIDS in Asia: Face the Facts—AComprehensive Analysis of the AIDS Epidemic in Asia. Washington, DC: MAP.
MAP (Monitoring the AIDS Pandemic. 2005. Drug Injection and HIV/AIDS inAsia. Washington, DC: MAP.
Marseille, E., P.B. Hofmann, and J.G. Kahn. 2002. “HIV prevention beforeHAART in Sub-Saharan Africa.” The Lancet 359 (9320): 1851–56.
Masaki, E., R. Green, F. Greig, J. Walsh, and M. Potts. 2003. “Cost-Effectiveness ofHIV Interventions for Resource Scarce Countries: Setting Priorities forHIV/AIDS.” eScholarship Repository, Bay Area International Group,University of California, Berkeley, CA.
Ministry of Health and Medical Education, Iran. 2003. Statistics on HIV/AIDS inIran. Tehran, Iran: Ministry of Health and Medical Education.
Needle, R.H., S.L. Coyle, J. Normand, E. Lambert, and H. Cesari. 1998. “HIVPrevention with Drug-using Populations—Current Status and FutureProspects: Introduction and Overview.” Public Health Reports 113 (Supplement1): 4–18.
Ohiri, K. et al. 2006. “HIV/AIDS Prevention among Injecting Drug Users:Learning from Harm Reduction in Iran.” Conference proceeding. Teheran, Iran.siteresources.worldbank.org/INTSAREGTOPHIVAIDS/Resources/LancetHarmReductionIran.pdf
Peak, A., S. Rana, S. H. Maharjan, D. Jolley, and N. Crofts. 1995. “Declining Riskfor HIV among Injecting Drug Users in Kathmandu, Nepal: The Impact of aHarm-Reduction Programme.” AIDS 9 (9): 1067–70.
Pisani E., G.P. Garnett, N.C. Grassy, T. Brown, J. Stover, C. Hankins, N. Walker, P.D.Ghys. 2003. “Back to Basics in HIV Prevention: Focus on Exposure.”Education and Debate. British Medical Journal 326 (June 21): 1384–87.
Razzaghi, E.M., A.R. Movaghar, T.C. Green, K. Khoshnood. 2006. “Profiles ofRisk: A Qualitative Study of Injecting Drug Users in Tehran, Iran.” HarmReduction Journal 3: 12.
Riehman, K.S. 1998. “Injecting Drug Use and AIDS in Developing Countries.” InConfronting AIDS: Evidence from the Developing World—Selected BackgroundPapers for the World Bank Policy Research Report, Confronting AIDS: PublicPriorities in a Global Epidemic, ed. M. Ainsworth, et al., 175–206. Washington,DC: European Commission.
Saidel, T. et al. 2003. “Potential Impacts of HIV among IDUs on HeterosexualTransmission in Asian Settings: Scenarios from the Asian Epidemic Model.”International Journal of Drug Policy 14: 63–74.
Saif-ur-Rehman, Mohammad Zafar Rasoul, Alex Wodak, Mariam Claeson, JedFriedman, and Ghulam Dastagir Sayed. 2007. “Responding to HIV inAfghanistan.” The Lancet 370: 2167–69.

Seidman, S,B. 1983. “Network Structure and Minimum Degree.” Society Networks5: 269–87.
Siegel, J.E., M.C. Weinstein, H.V. and Fineberg. 1991. “Bleach Programs forPreventing AIDS among IV Drug Users: Modeling the Impact of HIVPrevalence.” American Journal of Public Health 81 (10): 1273–79.
Smallman-Raynor, M.R., and A.D. Cliff. 1991. “Civil War and the Spread of AIDSin Central Africa.” Epidemiology and Infection 107: 69–80.
Söderlund N., J. Broomberg, J. Lavis, A. Mills. 1993. “The Costs of HIV/AIDS Prevention Strategies in Developing Countries.” WHO Bulletin 71(5): 595–604.
Stimson, G.V., M. Adelekan, and T. Rhodes. 1995. “The Diffusion of DrugInjecting in Developing Countries.” Paper presented at Sixth InternationalConference on the Reduction of Drug Related Harm, Florence, Italy.
Strathdee, S.A., D.M. Patrick, S.L. Currie, P.G.A. Cornelisse, M.L. Rekart, et al.1997. AIDS 11: F59–65.
Titus S., M. Marmor, D.C. Des Jarlais, M. Kim, H. Wolfe, S. Beatrice. 1994. “BleachUse and HIV Seroconversion among New York City Injection Drug Users.”Journal of Acquired Immune Deficiency Syndromes, 7: 700–04.
Todd, Catherine, Abdullah Abed, Steffanie Strathdee, Boulos Botros, NaqibullahSafi, and Kenneth Earhart. 2006. “Prevalence of HIV, Viral Hepatitis, Syphilis,and Risk Behaviors among IDUs in Kabul, Afghanistan.” Presentation at theInternational AIDS Conference Toronto, Canada. www.aegis.com/conferences/iac/2006/TuAc0304.ppt
Trotter, R.T. II, R.B. Rothenberg, and S. Coyle. 1995. “Drug Abuse and HIVPrevention Research: Expanding Paradigms and Network Contributions toRisk Reduction.” Connections 1 (8): 29–45.
UNAIDS (The Joint United Nations Programme on HIV/AIDS). 2006a. HighCoverage Sites: HIV Prevention among Injecting Drug Users in Transitionaland Developing Countries. Case Studies, UNAIDS Best Practice Collection.WHO, Geneva.
UNAIDS (Joint United Nations Programme on HIV/AIDS). 2006b. Report on theGlobal AIDS Epidemic, 2006. Geneva, Switzerland: World Health Organization.
UNDP (United Nations Development Programme). 2008. “Afghanistan at aGlance.” The HIV/AIDS Portal for Asia Pacific, UNDP Regional HIV andDevelopment Programme for South and North East Asia (REACH BeyondBorders) http://www.youandaids.org/Asia%20Pacific%20at%20a%20Glance/Afghanistan/.
UNDP (United Nations Development Programme). 2004. “Socio-EconomicImpact of HIV/AIDS in Viet Nam.” Draft consultant report.
70 Friedman and Velenyi
Responding to HIV in Afghanistan 71
UNODC (United Nations Office on Drugs and Crime) and Government ofAfghanistan Ministry of Counter Narcotics. 2005. Afghanistan Drug Use Survey,2005. Kabul, Afghanistan: UNODC and Ministry of Counter Narcotics.
UNODC. (United Nations Office on Drugs and Crime). 2006. World DrugReport. Geneva, Switzerland: UNODC.
UN Population Division. 2007. World Population Prospects: The 2006 Revision.New York: United Nations.
Vickerman, P., L. Kumaranayake, O. Balakireva, L. Guiness, O. Artyukh, T.Semikop, O. Yaramenko, C. Watts. 2006. “The Cost-Effectiveness of ExpandingHarm Reduction Activities for Injecting Drug Users in Odessa, Ukraine.”Sexually Transmitted Diseases 33 (10, October Supplement): S89–S102.
Vickerman P., and C.H. Watts. 2003. “Injecting Drug Use and the SexualTransmission of HIV: Simple Model Insights.” International Journal of DrugPolicy 14: 89–93.
Vlahov D., J. Astemborsk, L. Solomon, K.E. Nelson. 1994. “Field Effectiveness ofNeedle Disinfection among Injecting Drug Users.” Journal of Acquired ImmuneDeficiency Syndromes 7: 760–66.
Vlahov, D., B. Junge, R. Brookmeyer, S. Cohn, E. Riley, H. Armenian, et al. 1997.“Reductions in High-Risk Drug Use Behaviors among Participants in theBaltimore Needle Exchange Program.” Journal of Acquired Immune DeficiencySyndrome and Human Retrovirology 16 (5): 400–66.
Wagstaff, A. 2005. “The Economic Consequences of Health Shocks.” PolicyResearch Working Paper Series #3644, World Bank, Washington, DC.
Walker, D. 2003. “Cost and Cost-effectiveness of HIV/AIDS Prevention Strategiesin Developing Countries: Is There an Evidence Base?” Health Policy andPlanning 18 (1):4–17.
Walker D., L. Kumaranayake, V. Romantsov, S. Samoshkin, V. Zviagin. 2003.“What Does it Cost? An Economic Analysis of a Harm ReductionIntervention in Svetlogorsk, Belarus.” Drugs: Education, Prevention andPolicy 8: 385–95.
Wollants, E., M. Schoenenberg, C. Figueroa, G. Shor-Posner, W. Klaskala, andM.K. Baum. 1995. “Risk Factors and Patterns of HIV-1 Transmission in theEl Salvador Military during War Time.” AIDS 9: 1291–92. http://www.worldbank.org/saraids.
World Bank, 2007. HIV/AIDS in Afghanistan. Country HIV/AIDS Brief.
Wu, Z., J. Zhang, R. Detels, V.C. Li, H. Cheng, S. Duan, Z. Li, L. Dong, S. Huang,M. Jia, and X. Bi. 1997. “Characteristics of Risk-taking Behaviors, HIV andAIDS Knowledge, and Risk Perception among Young Males in SouthwestChina.” AIDS Education & Prevention 9 (2): 147–60.
Zaba, Basia, Alan Whiteside, and J. Ties Boerma. 2004. “Demographic and Socio-economic Impact of AIDS: Taking Stock of the Empirical Evidence. AIDS 18(Supplement 2): S1–S7.
Zafar, T., H. Brahmbhatt, G. Imam, S. ul Hassan, S.A. Strathelee. 2003. “HIVKnowledge and Risk Behaviors among Pakistani and Afghani Drug Users inQuetta, Pakistan.” Journal of Acquired Immune Deficiency Syndromes 32(4):394–98
Zamani, S., et al. 2005. “Prevalence of and Factors Associated with HIV-1 Infectionamong Drug Users Visiting Treatment Centers in Tehran, Iran.” AIDS 19 (7):709–16.
Zamani, S. et al. 2006. “High Prevalence of HIV Infections Associated withIncarceration among Community-based Injecting Drug Users in Tehran, Iran.”Journal of Acquired Immune Deficiency Syndromes 42: 342–46.
72 Friedman and Velenyi
PA R T I I
The Economic and DevelopmentImpacts of HIV and AIDS

Introduction
The epidemiology of HIV and AIDS in the countries of South Asia andthe economic context in which the epidemic takes place are very differ-ent from those in high-prevalence countries, which have motivated mostof the studies on the economic development implications of HIV andAIDS. The extent to which South Asia can learn from the literature istherefore unclear. Against this background, the present chapter takesstock of the development impacts of HIV and AIDS. Specifically, thechapter addresses two objectives. First, in addition to providing somesummary indicators of the impacts of HIV and AIDS (such as key healthindicators, or economic growth), the chapter analyzes the impacts of HIVand AIDS on a microeconomic level and across population groups.Second, the chapter discusses the interactions of the ongoing response toHIV and AIDS with development impacts across population groups.
Among the consequences of HIV and AIDS that can be most directlymeasured or estimated are the health and related demographic impacts(section 2). In light of the overall low HIV prevalence rates in the region,the section discusses the contribution of HIV and AIDS to the burden ofdisease (including comparisons with other diseases). Next, it providesestimates of the impacts of HIV and AIDS on key demographic variables,
Development Impact of HIV and AIDS in South Asia
Markus Haacker
75
C H A P T E R 3

such as the mortality rate, the population growth rate, and lifeexpectancy. Finally, it discusses some of the consequences of the socioe-conomic profile of the epidemic.
Section 3 addresses aggregate measures of the economic impact ofHIV and AIDS. First, we discuss the magnitude of the impact of HIV andAIDS on economic growth. Second, we present estimates of the welfareeffects of HIV and AIDS that more explicitly account for the increasedrisks to health and life. The section concludes with a discussion of theshortcomings of such aggregate approaches; in particular, they do not cap-ture development implications of HIV and AIDS that arise when theimpact of HIV and AIDS is asymmetric across population groups.
Section 4 summarizes the available information on the impact of HIVand AIDS across population groups. The main part of this section dealswith the economic impact and coping, discussing issues such as the incomeand employment losses associated with HIV and AIDS, other adverseimpacts like stigma, the role of caregiving, and the burden of medicalexpenditures. Where available, we present data on differences in the impactof HIV and AIDS across population groups, for example, differentiating bywealth. One item on which we place particular emphasis throughout thissection is the gender dimension of HIV and AIDS (HIV awareness, eco-nomic impact); a separate section deals with the impact on orphans.
Section 5 focuses on challenges associated with and developmentaspects of the response to HIV and AIDS. One key aspect of the responseis access to prevention. Effective prevention is crucial not only in terms ofcontaining the scale of the epidemic and its economic impact, but also fora successful and sustainable scaling up of treatment, with the aim of con-taining pressures on health services in the future. Meanwhile, access totreatment has the potential of mitigating the health and economic impactsof HIV and AIDS. At the same time, inequities in access to treatment canbe an important source of inequities in the development impact of HIVand AIDS, and exacerbate its impact on key development indicators,e.g., those related to poverty. We focus on two main issues. First, we ana-lyze access to treatment on the country level (which—in an internationalcontext—is low in South Asia), and discuss potential impediments to thescaling up of treatment in South Asia. Second, we discuss the limited evi-dence regarding inequities in access to treatment, using both data on accessto health services in general and summarizing the (very limited) direct evi-dence on access to antiretroviral treatment across population groups.
The picture that emerges regarding the economic development impactsof HIV and AIDS is complex. We find the impact of HIV and AIDS on
76 Haacker

economic growth in South Asia to be very small, especially when com-pared with the high growth rates realized in most of the region. However,the welfare implications, taking into account the impact of increasedmortality, are by no means negligible. Meanwhile, we find that the mostrelevant implications of HIV and AIDS in an economic development con-text arise on a subnational level, in terms of inequities according tosocioeconomic status (wealth, access to education) regarding the suscep-tibility to HIV and AIDS and the ability to cope with the economicimpact. Also, we present evidence regarding an asymmetric impact ofHIV and AIDS on women, arising particularly from the socioeconomicconsequences of widowhood. Finally, we note that access to treatment inthe region is low in an international context, and present evidence thatpoints to weaknesses in health systems as a factor not only impedingprogress in extending access to treatment, but also as a factor in exacer-bating inequities in terms of the socioeconomic impact of HIV and AIDS.
Health and Demographic Impacts of HIV and AIDS
HIV prevalence in Asia is relatively low in an international context,especially when compared against regions that have inspired much of the literature on economic or development impacts of HIV andAIDS. The role of HIV and AIDS as an economic development issuein the region—particularly in the context of the broader developmentagenda objectives, such as the MDGs—therefore is not as prominentor obvious as for countries where HIV and AIDS have assumed cata-strophic proportions.
One of the recognizable aspects of the health impact of HIV and AIDSis increasing mortality. Estimates of mortality attributable to AIDS andother diseases and conditions provide an indicator for the relative contri-bution of AIDS to the burden of disease in a country or region. WHO(2006c) also allows assessments of the burden of disease in terms of lossesof disability-adjusted life years (DALYs). The findings are similar to theone presented here for mortality, with AIDS accounting for 1.3 percentof DALYs lost in South Asia overall, and 1.8 percent of DALYs lost inIndia. This partly reflects that HIV and AIDS primarily affect working-age adults, while diseases primarily affecting children have a larger weightin terms of losses of DALYs, and diseases associated with old age corre-spondingly carry a lower weight. The average loss in DALYs associatedwith an AIDS-related death thus happens to be close to the average lossin DALYs across all deaths. Estimates of the causes of deaths by country
Development Impact of HIV and AIDS in South Asia 77
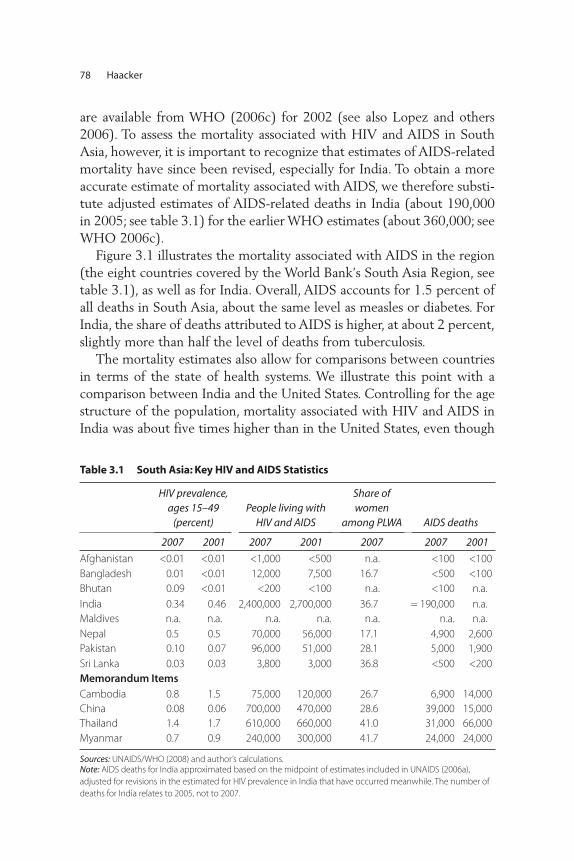
are available from WHO (2006c) for 2002 (see also Lopez and others2006). To assess the mortality associated with HIV and AIDS in SouthAsia, however, it is important to recognize that estimates of AIDS-relatedmortality have since been revised, especially for India. To obtain a moreaccurate estimate of mortality associated with AIDS, we therefore substi-tute adjusted estimates of AIDS-related deaths in India (about 190,000in 2005; see table 3.1) for the earlier WHO estimates (about 360,000; seeWHO 2006c).
Figure 3.1 illustrates the mortality associated with AIDS in the region(the eight countries covered by the World Bank’s South Asia Region, seetable 3.1), as well as for India. Overall, AIDS accounts for 1.5 percent ofall deaths in South Asia, about the same level as measles or diabetes. ForIndia, the share of deaths attributed to AIDS is higher, at about 2 percent,slightly more than half the level of deaths from tuberculosis.
The mortality estimates also allow for comparisons between countriesin terms of the state of health systems. We illustrate this point with acomparison between India and the United States. Controlling for the agestructure of the population, mortality associated with HIV and AIDS inIndia was about five times higher than in the United States, even though
78 Haacker
Table 3.1 South Asia: Key HIV and AIDS Statistics
HIV prevalence,ages 15–49
(percent)People living with
HIV and AIDS
Share ofwomen
among PLWA AIDS deaths
2007 2001 2007 2001 2007 2007 2001
Afghanistan <0.01 <0.01 <1,000 <500 n.a. <100 <100
Bangladesh 0.01 <0.01 12,000 7,500 16.7 <500 <100
Bhutan 0.09 <0.01 <200 <100 n.a. <100 n.a.
India 0.34 0.46 2,400,000 2,700,000 36.7 = 190,000 n.a.
Maldives n.a. n.a. n.a. n.a. n.a. n.a. n.a.
Nepal 0.5 0.5 70,000 56,000 17.1 4,900 2,600
Pakistan 0.10 0.07 96,000 51,000 28.1 5,000 1,900
Sri Lanka 0.03 0.03 3,800 3,000 36.8 <500 <200
Memorandum ItemsCambodia 0.8 1.5 75,000 120,000 26.7 6,900 14,000
China 0.08 0.06 700,000 470,000 28.6 39,000 15,000
Thailand 1.4 1.7 610,000 660,000 41.0 31,000 66,000
Myanmar 0.7 0.9 240,000 300,000 41.7 24,000 24,000
Sources: UNAIDS/WHO (2008) and author’s calculations.Note: AIDS deaths for India approximated based on the midpoint of estimates included in UNAIDS (2006a),
adjusted for revisions in the estimated for HIV prevalence in India that have occurred meanwhile. The number of
deaths for India relates to 2005, not to 2007.
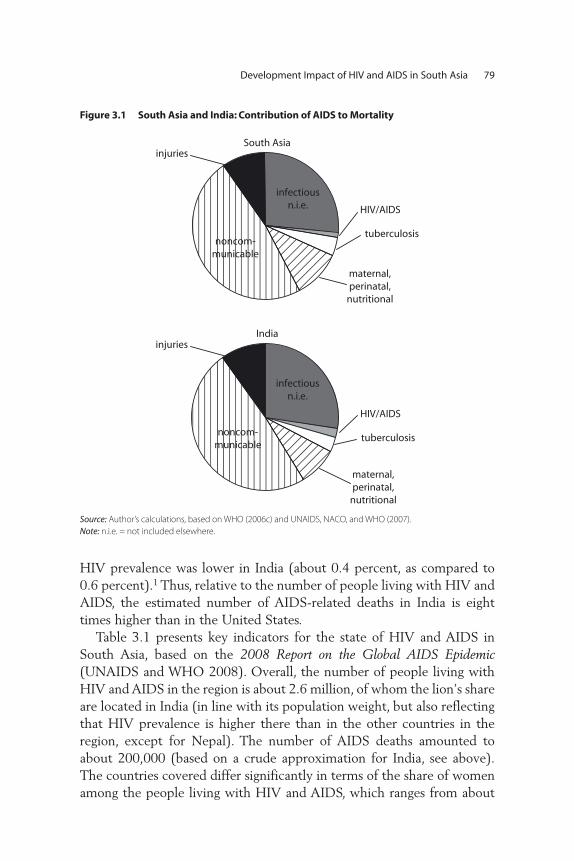
HIV prevalence was lower in India (about 0.4 percent, as compared to0.6 percent).1 Thus, relative to the number of people living with HIV andAIDS, the estimated number of AIDS-related deaths in India is eighttimes higher than in the United States.
Table 3.1 presents key indicators for the state of HIV and AIDS inSouth Asia, based on the 2008 Report on the Global AIDS Epidemic(UNAIDS and WHO 2008). Overall, the number of people living withHIV and AIDS in the region is about 2.6 million, of whom the lion’s shareare located in India (in line with its population weight, but also reflectingthat HIV prevalence is higher there than in the other countries in theregion, except for Nepal). The number of AIDS deaths amounted toabout 200,000 (based on a crude approximation for India, see above).The countries covered differ significantly in terms of the share of womenamong the people living with HIV and AIDS, which ranges from about
Development Impact of HIV and AIDS in South Asia 79
Figure 3.1 South Asia and India: Contribution of AIDS to Mortality
infectiousn.i.e.
noncom-municable
injuries
HIV/AIDS
tuberculosis
maternal,perinatal,
nutritional
maternal,perinatal,
nutritional
India
South Asia
infectiousn.i.e.
noncom-municable
injuries
HIV/AIDS
tuberculosis
Source: Author’s calculations, based on WHO (2006c) and UNAIDS, NACO, and WHO (2007).
Note: n.i.e. = not included elsewhere.
17 percent (Bangladesh, Nepal) to about 37 percent (India, Sri Lanka).Overall, the number of people living with HIV and AIDS in the region isestimated to have declined between 2001 and 2007, owing to an esti-mated decline in the number of people living with HIV and AIDS inIndia, while the estimated numbers increased for every other country inSouth Asia where estimates were available.
One point worth noting about table 3.1 regards the availability of esti-mates of the scale of the epidemic in some countries under consideration.First, no estimates are available for Maldives; for this reason, the countrywill not be included in the tables summarizing the demographic or eco-nomic impacts of HIV and AIDS. Point estimates for most variables arealso not available for Afghanistan and Bhutan, so these countries will alsonot be included in our analysis below.
In order to address the impact of HIV and AIDS for the economies inquestion, it is necessary to understand the impacts of HIV and AIDS onkey demographic indicators. To this end, we face several challenges. Themost comprehensive estimates of the demographic impacts of HIV andAIDS are those by the UN Population Division. However, among the 62countries for which the UN Population Division (2007) provides coun-terfactual estimates of a “no-AIDS” demographic scenario, there is onlyone South Asian country (India). For this country, the demographic pro-jections are based on estimates of HIV prevalence that have been super-seded by the more recent ones discussed above. Our estimates of thedemographic impact of HIV and AIDS in India are therefore based onthose from the UN Population Division (2007), but scaled to account foran updated lower estimate of HIV prevalence. For the other countries, weassume that the impacts of HIV and AIDS on key demographic indica-tors, adjusted for the scale of the epidemic, are similar to those in India,and therefore apply coefficients derived from the estimates for India.2 Toprovide a wider regional context, we also report demographic indicatorsfor some other Asian countries, especially those with large numbers ofpeople living with HIV and AIDS.
We find that HIV and AIDS do have a perceptible impact on keydemographic indicators (table 3.2). Life expectancy at birth in India andNepal declines by about half a year, the rate of population growthdeclines by about one-tenth of a percentage point, and mortality ratesincrease by 0.2–0.3 per 1,000 (meaning that in India and Nepal, one in36 or one in 25 deaths, respectively, are estimated to be AIDS-related).Taking a broader Asian perspective, we see that, in the countries whereestimated HIV prevalence exceeded 1 percent (Cambodia, Thailand), life
80 Haacker
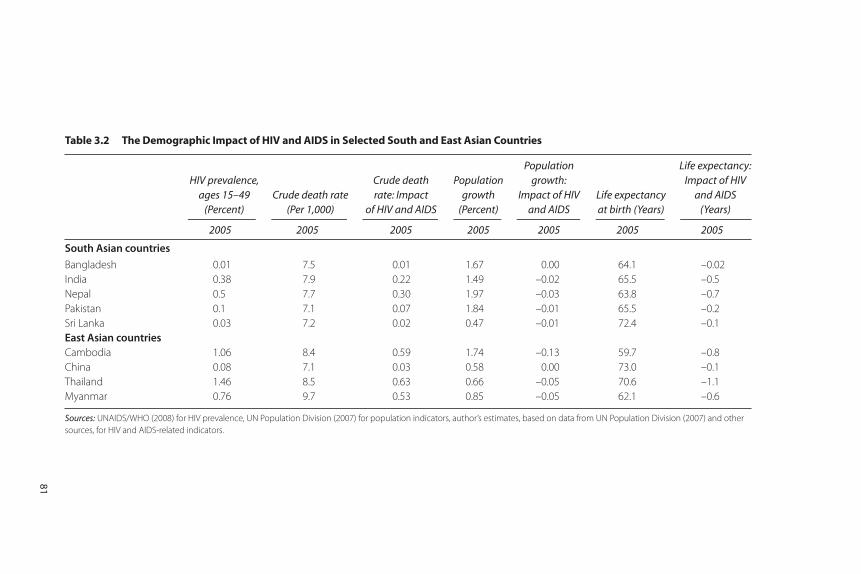
Table 3.2 The Demographic Impact of HIV and AIDS in Selected South and East Asian Countries
HIV prevalence, ages 15–49
(Percent)Crude death rate
(Per 1,000)
Crude death rate: Impact
of HIV and AIDS
Populationgrowth
(Percent)
Populationgrowth:
Impact of HIVand AIDS
Life expectancy at birth (Years)
Life expectancy:Impact of HIV
and AIDS(Years)
2005 2005 2005 2005 2005 2005 2005
South Asian countries
Bangladesh 0.01 7.5 0.01 1.67 0.00 64.1 –0.02
India 0.38 7.9 0.22 1.49 –0.02 65.5 –0.5
Nepal 0.5 7.7 0.30 1.97 –0.03 63.8 –0.7
Pakistan 0.1 7.1 0.07 1.84 –0.01 65.5 –0.2
Sri Lanka 0.03 7.2 0.02 0.47 –0.01 72.4 –0.1
East Asian countriesCambodia 1.06 8.4 0.59 1.74 –0.13 59.7 –0.8
China 0.08 7.1 0.03 0.58 0.00 73.0 –0.1
Thailand 1.46 8.5 0.63 0.66 –0.05 70.6 –1.1
Myanmar 0.76 9.7 0.53 0.85 –0.05 62.1 –0.6
Sources: UNAIDS/WHO (2008) for HIV prevalence, UN Population Division (2007) for population indicators, author’s estimates, based on data from UN Population Division (2007) and other
sources, for HIV and AIDS-related indicators.
81
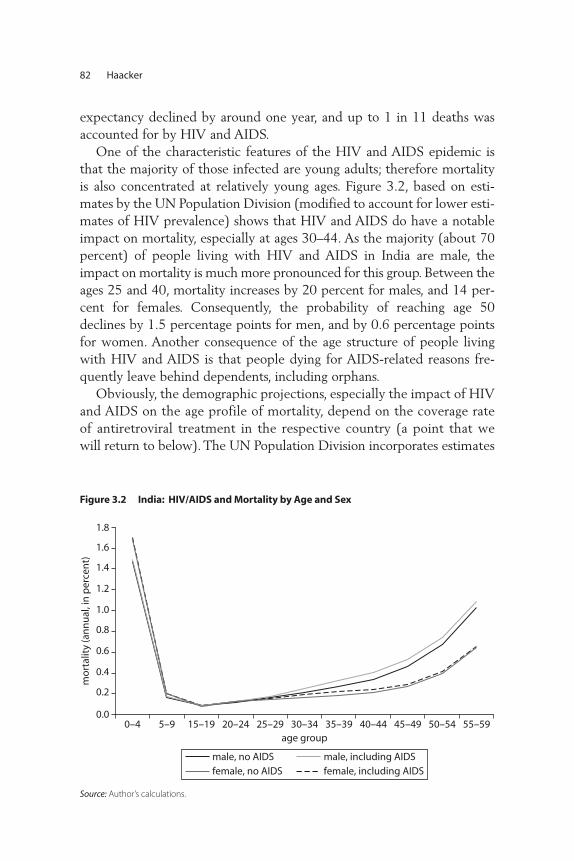
expectancy declined by around one year, and up to 1 in 11 deaths wasaccounted for by HIV and AIDS.
One of the characteristic features of the HIV and AIDS epidemic isthat the majority of those infected are young adults; therefore mortalityis also concentrated at relatively young ages. Figure 3.2, based on esti-mates by the UN Population Division (modified to account for lower esti-mates of HIV prevalence) shows that HIV and AIDS do have a notableimpact on mortality, especially at ages 30–44. As the majority (about 70percent) of people living with HIV and AIDS in India are male, theimpact on mortality is much more pronounced for this group. Between theages 25 and 40, mortality increases by 20 percent for males, and 14 per-cent for females. Consequently, the probability of reaching age 50declines by 1.5 percentage points for men, and by 0.6 percentage pointsfor women. Another consequence of the age structure of people livingwith HIV and AIDS is that people dying for AIDS-related reasons fre-quently leave behind dependents, including orphans.
Obviously, the demographic projections, especially the impact of HIVand AIDS on the age profile of mortality, depend on the coverage rateof antiretroviral treatment in the respective country (a point that wewill return to below). The UN Population Division incorporates estimates
82 Haacker
Figure 3.2 India: HIV/AIDS and Mortality by Age and Sex
Source: Author’s calculations.
0.0
0.2
0.4
0.6
0.8
1.0
1.2
1.4
1.6
1.8
0–4 5–9 15–19 20–24 25–29 30–34 35–39 40–44 45–49 50–54 55–59age group
mo
rtal
ity
(an
nu
al, i
n p
erce
nt)
male, no AIDSfemale, no AIDS
male, including AIDSfemale, including AIDS

of the coverage rate of antiretroviral treatment in their demographicprojections, in line with WHO (2006). According to those estimates,access to antiretroviral treatment in India was limited in 2005 (about7 percent), and therefore had limited impact on the estimated mortal-ity rates shown in figure 3.3 below. However, the more recent esti-mates of the scale of the epidemic suggest that the coverage ratesachieved in India were higher, around 15 percent to 20 percent.3
Nevertheless, even with complete coverage of antiretroviral treatment,figure 3.3 would still show a significant increase in mortality amongyoung adults, as the UN Population Division assumed that the medianand average survival times of adults after initiation of treatment are 6.6years and 9.5 years, respectively.4
While the most readily available estimates of the demographic impactsof HIV and AIDS presented here provide some indicators for the averageimpact of HIV and AIDS on the population, they fall short from an eco-nomic perspective as they do not capture the socioeconomic profile ofthe epidemic. Most important, the available evidence suggests that themost important drivers of the HIV epidemic in South Asia are injectingdrug use and sex work (see the discussion by Claeson and Wilson, thisvolume). These findings, however, do not easily translate into socioeco-nomic categories commonly used in analyzing distributional aspects ofhealth developments.
Development Impact of HIV and AIDS in South Asia 83
Figure 3.3 Evaluating the Loss from Reduced Life Expectancy
Source: Author’s calculation.
life expectancyL0
ann
ual
inco
me
L1
y1
y0
y2
EV
CV
The Economic Impact of HIV and AIDS: Aggregate Approaches
The scale of the demographic impact of HIV and AIDS in some regionshas motivated studies of the actual or potential economic impact of HIVand AIDS, most of which discuss the effects on economic growth, GDP,or GDP per capita. While the earlier studies employed a neoclassicalgrowth framework to derive estimates of the growth impact of HIV andAIDS from its direct impacts on (physical and, sometimes, human) capi-tal accumulation and the demographic implications, some more recentstudies also consider longer-run effects, for example, through access toand decisions on education. A somewhat different approach is based onthe premise that the most direct and severe impact of HIV and AIDS onwelfare arises from the increased risk to health and life associated with it.Accordingly, some studies attempt to quantify the welfare losses causedby increased mortality and deteriorated health. Finally, in a context ofincreasing access to treatment, it is also important to consider therepercussions of access to treatment for the economic impact.
Economic GrowthMany studies of the impact of HIV and AIDS on economic growthemploy a neoclassical growth model in which HIV and AIDS affectparameters or factors of production that enter an aggregate productionfunction.5 To capture the essence of these earlier studies, and as a ref-erence point for a discussion of some more recent efforts to calibratethe macroeconomic impact of HIV and AIDS, we briefly present a sim-ple version as a “workhorse.” We distinguish two production factors,capital K and labor L, and two productivity parameters, A (total factorproductivity) and h, which is a measure of the average level of humancapital and affects the productivity of labor. Thus, Y = AKa(hL)(1–a). Toobtain GDP per capita, it is necessary to divide Y by the size of thetotal population P, which yields
(1)
where y � Y/P stands for GDP per capita, k � K/P, and l � L/P. Inequilibrium,
(2)
In this framework, HIV and AIDS has a level effect on steady-state GDPper capita, which can be attributed to changes in total factor productiv-ity A, labor productivity or human capital h, the labor force participation
y A hl s n= +( )− −1 (1 ) (1 )( ) .α α α
/ δ
y A hl k= −( ) ,(1 )α α
84 Haacker
rate l, the savings rate s, and the population growth rate n (assuming thatthe parameters a and the depreciation rate d remain constant).
What are the implications of HIV and AIDS for GDP per capita inthis framework? As an example, we illustrate the predicted effects forIndia, assuming an HIV prevalence rate of 0.36 percent, and settingthe parameters a and d equal to 0.35 and 0.08, respectively. Haacker(2004b) summarizes some of the most commonly quoted productivityeffects, suggesting that an HIV prevalence of 20 percent would be consis-tent with a productivity loss of 2 percent to 3 percent; for India, the impliedloss in GDP per capita through this channel would be about 0.08 per-cent.6 Changes in labor force participation would reflect both peopleliving with HIV and AIDS withdrawing from the labor market, anddemographic shifts (specifically, a change in the share of the working-agepopulation in the total population). Regarding the former, assuming that5 percent of people living with HIV and AIDS withdraw from the labormarket appears to be on the high side, this would translate into a declinein l by 0.02 percent. Regarding the role of induced demographic shifts,we use data from the UN Population Division (2007), suggesting that theimpact at present is minimal (0.02 percent), but that it will rise to around0.1 percent by 2020. Overall, the impact of HIV and AIDS on l wouldamount to 0.05 percent in 2005, but may rise to about 0.1 percent by 2020.
The potential impact of HIV and AIDS on savings and investment ismore difficult to establish, and we consider the following as a plausibleguess for the purpose of our numerical exercise. From microeconomicstudies, we note that households affected by HIV and AIDS tend to dis-save to finance treatment and care. This, however, applies less to wealthyhouseholds, which carry a disproportionate weight in national savings.Somewhat arbitrarily, we assume that national savings decline by 0.1percent (corresponding to 0.03 percentage points, given a savings rate ofabout 30 percent). Finally, based on estimates by the UN PopulationDivision (2007), we assume that population growth slows from 1.51percent to 1.49 percent (for 2005–10), which would raise GDP percapita by about 0.1 percent.
Overall, the impact of HIV and AIDS on steady-state GDP per capitain India, through the direct effects described, appears to be very small.Adding up the various channels, we arrive at an overall negative impactof 0.16 percent, owing to the productivity effect (–0.12 percent), thedecline in the share of the working-age population (–0.10 percent), anda decline in savings (–0.05 percent), partly offset by the slowdown inpopulation growth (+0.12 percent). To understand the magnitude of this
Development Impact of HIV and AIDS in South Asia 85

effect, it is instructive to relate it to the annual rate of growth of GDP percapita (about 6 percent annually in 2001–06). A decline in the level ofsteady-state GDP per capita of 0.16 percent thus corresponds to a one-off loss of about 1.5 weeks of GDP growth. This would be barely percep-tible, especially as the adjustment to the new steady-state level of GDPper capita would take several years, so that the slowdown in growthwould be spread accordingly.
While focusing on the impacts of HIV and AIDS on the level andgrowth of GDP per capita above, it is also important to understand theimpact on long-term GDP growth. For this, it is convenient to think ofGDP as the product of GDP per capita and the size of the population.Regarding GDP per capita, the most concrete effects of HIV and AIDS onGDP we describe relate to the level, but not the rate of growth, of GDPper capita. The key channel through which HIV and AIDS affects GDPgrowth in our preliminary analysis is the rate of population growth, whichin India slows down by about 0.02 percentage points in 2005–15, afterwhich the negative impact gradually tapers off through 2050 (accordingto the UN Population Division 2007). Overall, the level of the populationis projected to be 0.5 percent lower than in the absence of HIV and AIDSby 2050 (a small change relative to the projected increase of 44 percentbetween 2006 and 2050). Assuming an average GDP growth rate of 5percent over this period, the slowdown in GDP growth owing to an HIVand AIDS-related slowdown in population growth would thus be rela-tively modest, corresponding to the loss of about one-200th of the averagegrowth rate attained through 2050.7
Two aspects of the impact of HIV and AIDS on growth could resultin a somewhat more adverse outcome than the one described above.First, if reduced expectations of economic growth or higher productioncosts result in a decline in investment, this could exacerbate the impacton growth. We have not modeled this channel, as HIV and AIDS are notnormally rated among key factors affecting growth prospects or produc-tion costs in South Asia,8 and apparently do not factor into investmentdecisions in the region. Second, HIV and AIDS may affect the rate ofaccumulation of human capital, including through impaired access toeducation (both formal and within the family) for an increasing numberof orphans. While we do provide some evidence that access to educationmay be an issue, we cannot adequately quantify the implications for eco-nomic growth without better knowledge about the impact of HIV andAIDS on orphans, the socioeconomic profile of the epidemic, and theconsequences of orphanhood in the region.
86 Haacker

On the other hand, aggregate economic models of the type used heremay overestimate the impact of an epidemic on economic growth if thedistributional aspects of the epidemic matter. There are two factors thatmay suggest that the growth impacts of HIV and AIDS are lower than themodel above suggests. To the extent that the contribution of high-riskpopulation groups—notably injecting drug users and sex workers—toGDP is below average GDP per capita, and if the epidemic is concen-trated among these groups, an aggregate model such as the one employedhere may overstate the impact on GDP.9 A second factor not capturedhere regards access to treatment. If the economically most active seg-ments of the populations have privileged access to treatment, the impactsof HIV and AIDS on GDP growth could be milder than suggested byaggregate demographic indicators (while poverty outcomes could beworse). The limited access to treatment in South Asia so far (table 3.8),and the important role of private out-of-pocket spending in the healthsystems of most South Asian countries (see Over, this volume), suggeststhat this is a relevant consideration.
WelfareWhile the scale of the impact of HIV and AIDS on GDP or GDP percapita is important for many reasons, observers agree that the adverseimpact of HIV and AIDS is not adequately described by these measures.There are two main approaches to developing more substantial (in thesense of providing policy guidance) measures of the economic impacts ofHIV and AIDS. One line of reasoning emphasizes the distributionalaspects of HIV and AIDS, which arise if the risk of infection, the abilityto cope with the economic impact, and the access to care and treatmentare correlated with income or other poverty-related indicators. Theseissues are at the heart of many of the policy issues regarding the responseto HIV and AIDS, and are discussed in more detail further below. Asecond approach, which we now turn to, focuses on the direct implica-tions of HIV and AIDS on health and mortality, and attempts to estimatethe economic costs of risks to health and life. The logic behind thisapproach (and its relation to the estimates of the impact on GDP percapita, above) can be summarized by an equation describing an individual’swelfare over his or her lifetime, depending on consumption, the state ofhealth, and expected survival rates, for example:
(3)W h u S D h u ct t t ti ti i ii t
T
= +⎡
⎣⎢⎢
⎤
⎦⎥⎥= +
∑(c ) ( ) .1
E
Development Impact of HIV and AIDS in South Asia 87
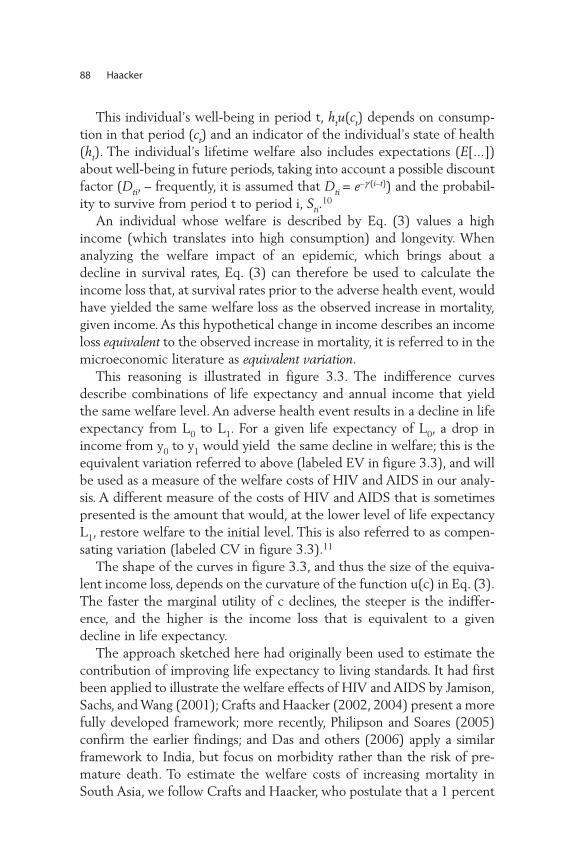
This individual’s well-being in period t, htu(ct) depends on consump-tion in that period (ct) and an indicator of the individual’s state of health(ht). The individual’s lifetime welfare also includes expectations (E[...])about well-being in future periods, taking into account a possible discountfactor (Dti, – frequently, it is assumed that Dti = e–g (i–t)) and the probabil-ity to survive from period t to period i, Sti.
10
An individual whose welfare is described by Eq. (3) values a highincome (which translates into high consumption) and longevity. Whenanalyzing the welfare impact of an epidemic, which brings about adecline in survival rates, Eq. (3) can therefore be used to calculate theincome loss that, at survival rates prior to the adverse health event, wouldhave yielded the same welfare loss as the observed increase in mortality,given income. As this hypothetical change in income describes an incomeloss equivalent to the observed increase in mortality, it is referred to in themicroeconomic literature as equivalent variation.
This reasoning is illustrated in figure 3.3. The indifference curvesdescribe combinations of life expectancy and annual income that yieldthe same welfare level. An adverse health event results in a decline in lifeexpectancy from L0 to L1. For a given life expectancy of L0, a drop inincome from y0 to y1 would yield the same decline in welfare; this is theequivalent variation referred to above (labeled EV in figure 3.3), and willbe used as a measure of the welfare costs of HIV and AIDS in our analy-sis. A different measure of the costs of HIV and AIDS that is sometimespresented is the amount that would, at the lower level of life expectancyL1, restore welfare to the initial level. This is also referred to as compen-sating variation (labeled CV in figure 3.3).11
The shape of the curves in figure 3.3, and thus the size of the equiva-lent income loss, depends on the curvature of the function u(c) in Eq. (3).The faster the marginal utility of c declines, the steeper is the indiffer-ence, and the higher is the income loss that is equivalent to a givendecline in life expectancy.
The approach sketched here had originally been used to estimate thecontribution of improving life expectancy to living standards. It had firstbeen applied to illustrate the welfare effects of HIV and AIDS by Jamison,Sachs, and Wang (2001); Crafts and Haacker (2002, 2004) present a morefully developed framework; more recently, Philipson and Soares (2005)confirm the earlier findings; and Das and others (2006) apply a similarframework to India, but focus on morbidity rather than the risk of pre-mature death. To estimate the welfare costs of increasing mortality inSouth Asia, we follow Crafts and Haacker, who postulate that a 1 percent
88 Haacker
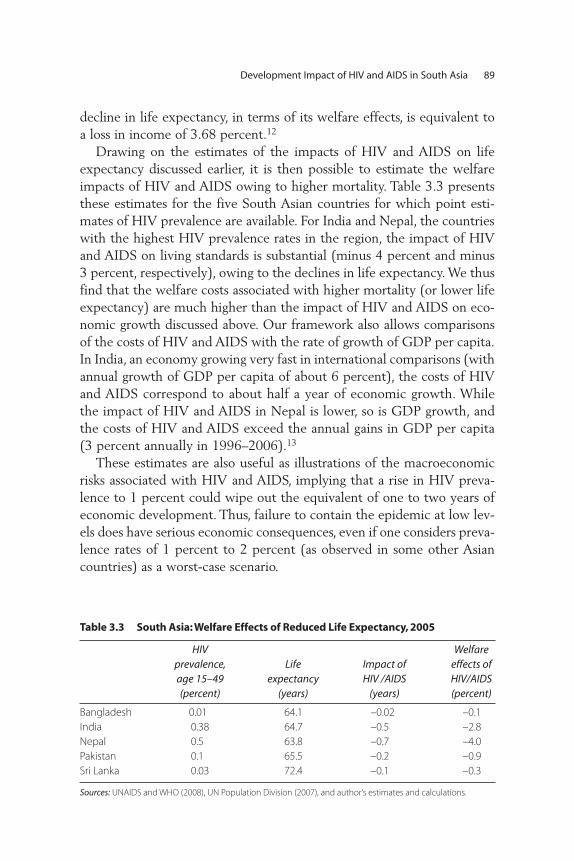
decline in life expectancy, in terms of its welfare effects, is equivalent toa loss in income of 3.68 percent.12
Drawing on the estimates of the impacts of HIV and AIDS on lifeexpectancy discussed earlier, it is then possible to estimate the welfareimpacts of HIV and AIDS owing to higher mortality. Table 3.3 presentsthese estimates for the five South Asian countries for which point esti-mates of HIV prevalence are available. For India and Nepal, the countrieswith the highest HIV prevalence rates in the region, the impact of HIVand AIDS on living standards is substantial (minus 4 percent and minus3 percent, respectively), owing to the declines in life expectancy. We thusfind that the welfare costs associated with higher mortality (or lower lifeexpectancy) are much higher than the impact of HIV and AIDS on eco-nomic growth discussed above. Our framework also allows comparisonsof the costs of HIV and AIDS with the rate of growth of GDP per capita.In India, an economy growing very fast in international comparisons (withannual growth of GDP per capita of about 6 percent), the costs of HIVand AIDS correspond to about half a year of economic growth. Whilethe impact of HIV and AIDS in Nepal is lower, so is GDP growth, andthe costs of HIV and AIDS exceed the annual gains in GDP per capita(3 percent annually in 1996–2006).13
These estimates are also useful as illustrations of the macroeconomicrisks associated with HIV and AIDS, implying that a rise in HIV preva-lence to 1 percent could wipe out the equivalent of one to two years ofeconomic development. Thus, failure to contain the epidemic at low lev-els does have serious economic consequences, even if one considers preva-lence rates of 1 percent to 2 percent (as observed in some other Asiancountries) as a worst-case scenario.
Development Impact of HIV and AIDS in South Asia 89
Table 3.3 South Asia: Welfare Effects of Reduced Life Expectancy, 2005
HIV prevalence,age 15–49(percent)
Life expectancy
(years)
Impact ofHIV /AIDS
(years)
Welfareeffects of HIV/AIDS(percent)
Bangladesh 0.01 64.1 –0.02 –0.1
India 0.38 64.7 –0.5 –2.8
Nepal 0.5 63.8 –0.7 –4.0
Pakistan 0.1 65.5 –0.2 –0.9
Sri Lanka 0.03 72.4 –0.1 –0.3
Sources: UNAIDS and WHO (2008), UN Population Division (2007), and author’s estimates and calculations.

Summary of FindingsThere are two main findings we draw from our discussion of the aggre-gate effects of HIV. First, the welfare effects, in the specific sense of thecost of increased mortality, are by no means small, corresponding to theequivalent of one-half to one year of economic growth in India andNepal. In an adverse scenario, which has HIV prevalence rising to 1 per-cent, the welfare costs could rise to the equivalent of one to two years ofeconomic growth. Second, most of the welfare costs are associated withthe direct health impact of HIV (we focus on mortality), whereas theimpact on economic growth or income per capita appears minor in SouthAsia. This finding is important as it means that the response to HIV andAIDS will not be complicated by any macroeconomic repercussions.
However, in terms of understanding the impact of the epidemic onsociety, designing policies to address the impact, and implementing theresponse to HIV and AIDS, the broad measures of the size of the impactcarry little information. To this end, it is important to gain a better under-standing of who is affected by the epidemic. Further, we need to under-stand how the epidemic affects key development goals (for example, inthe areas of poverty reduction, education, and gender, in addition to thedirect health impact); we will turn to this issue next.
Beyond Aggregate Measures of the Impact of HIV and AIDS
As noted above, much of the economic development impact of HIV andAIDS cannot be captured by the aggregate measures presented above.First, the impact is uneven. The impacts are concentrated in and can bevery severe for the households directly affected by HIV and AIDS. Thisis a situation, in terms of welfare effects or policy implications, verydifferent from a setting in which the adverse impacts are distributedevenly. Second, the ability of households to cope with the economicimpact of illness (for example, regarding the costs of care and treat-ment or the need to compensate for the loss of a breadwinner) dif-fers according to socioeconomic status. Third, HIV and AIDSparticularly affect certain population groups (for example, orphans);also, a low economic status of women can translate into increased vul-nerabilities regarding the risk of infection or the economic consequencesof infection or widowhood. Finally, access to prevention and treatmentmay differ across population groups. While this is an issue that is clearlyrelevant here, we take it up later in the context of our discussion of theresponse to HIV and AIDS.
90 Haacker
Impact and CopingOur analysis proceeds in two steps. First, we discuss some of the directimpacts, focusing on household income, health, and stigma. Second, weaddress how households cope with the demands associated with an HIVinfection, looking at caregiving, increased medical expenditures, and thefinancing of any additional household needs (or of income shortfalls asso-ciated with HIV and AIDS). Owing to data limitations, most of our dis-cussion in this section draws on two studies of the household-levelimpacts of HIV and AIDS in India (Das and others 2006, and Pradhanand others 2006), with some additional pieces of information added,where available. Two key aspects of the impact of HIV and AIDS—theimplications of orphanhood and access to treatment, are treated in dedi-cated sections below.
HIV and AIDS can be associated with employment loss or reducedincome as people living with HIV and AIDS (or caregiving householdmembers) have to take time off from paid employment. Both Pradhanand others (2006) and Das and others (2006) find that unemploymentrates among people living with HIV and AIDS are higher than for therespective control groups. The former report an unemployment rate forHIV-positive men of 14.2 percent (non-HIV positive: 4.3 percent) andfor women of 4.5 percent (non-HIV positive: 2.9 percent); the latter findsan unemployment rate among males living with HIV and AIDS of 13 per-cent (non-HIV positive: 5 percent). For women, Das and others (2006)find that some HIV-positive women enter employment; many of theseare widows whose household has lost an income earner.
The most detailed data on employment loss associated with HIV andAIDS are those of Pradhan and others (2006), who find that 36.5 percentof people living with HIV and AIDS who were able to retain theiremployment nevertheless reported an income loss, which averaged about9 percent. Among those who lost their employment (about 9 percent ofthe sample of people living with HIV and AIDS), the income loss wassevere, at about 66 percent. In rural areas, the reported income losseswere somewhat higher (75 percent, compared with 60 percent in urbanareas). Additionally, households may lose the income of caregivers; how-ever, the average loss in income of caregivers is relatively modest (3.5 per-cent), and caregivers had to give up employment in only 0.5 percent ofthe surveyed households affected by HIV and AIDS).
Another important aspect of the adverse income effects is the lossesassociated with the death of a person living with HIV and AIDS. Onearea where such losses are particularly pervasive is the situation of
Development Impact of HIV and AIDS in South Asia 91

HIV-positive widows. As noted in Pradhan and others (2006), widowsaccount for a substantial share of women living with HIV and AIDS; thisstudy also reports that about half of the households headed by widowshave an annual income of less than Rs. 20,000, compared to about one-sixth of other households affected by HIV and AIDS, and 10 percent ofthe households not affected by HIV and AIDS. However, as this studydoes not provide more information on the composition of householdsheaded by widows, it is difficult to interpret these findings. Das and oth-ers (2006) report much lower income for households headed by widowscompared to households with widowers.
The medical aspects of HIV and AIDS are largely beyond the scope ofthe present study. In an economic development context, Das and others(2006) provide some indicators of the negative impact of HIV on healthindicators such as the body mass index or an index intended to measurethe extent of morbidity, and also discuss indicators based on subjectivewell-being, and provide estimates of the welfare costs of such declines inthe heath of affected individuals, based on a compensating variation (seefigure 3.4 on a similar example of the concept, in the context of our discus-sion of the welfare implications of increased mortality). Pradhan and others(2006) report data on the incidence of episodes of illness and the types ofillnesses affecting people living with HIV and AIDS in their sample.
An additional component of the adverse effects of HIV and AIDS isthe stigma associated with it, and both Das and others (2006) and Pradhanand others (2006) provide some evidence for its relevance for assessingthe impacts of HIV and AIDS on affected individuals and households.According to Pradhan and others (2006), about 10 percent of respon-dents living with HIV and AIDS reported being “treated differently orbadly.” Among these, the most common forms of stigma are neglect andisolation (about two-thirds), verbal abuse, children’s isolation, or beingsocially excluded (about one-third each, multiple responses possible).About 2 percent of respondents were asked to vacate their housebecause of their HIV status. Regarding discrimination at the workplace,only about one-quarter of respondents disclosed their HIV status there,and about 40 percent of these reported some form of stigmatization(most commonly denial of promotion, refusal of loan, isolation, or namecalling). Among those who did not disclose their HIV status at the work-place (three-quarters of respondents), concern about losing their jobplayed an important role. Similarly, Das and others report for their sam-ple that about three-quarters of people living with HIV and AIDS didnot disclose their HIV status to family and friends, and 85 percent did
92 Haacker

0
20
40
60
80
100
GDP per capita, 2005 (US$)
Figure 3.4.1(Countries with HIV prevalence < 1 percent)
Figure 3.4.2(Countries with HIV prevalence < 3 percent)
Figure 3.4.3(Countries with HIV prevalence < 1 percent)
Figure 3.4.4(All countries)
Figure 3.4.5(All countries)
Figure 3.4.6(All countries)
0
20
40
60
80
100
GDP per capita, 2005 (US$)
acce
ss t
o a
nti
retr
ovi
ral
trea
tmen
t, en
d-2
006
(per
cen
t)
acce
ss t
o a
nti
retr
ovi
ral
trea
tmen
t, en
d-2
006
(per
cen
t)
acce
ss t
o a
nti
retr
ovi
ral
trea
tmen
t, en
d-2
006
(per
cen
t)
acce
ss t
o a
nti
retr
ovi
ral
trea
tmen
t, en
d-2
006
(per
cen
t)
acce
ss t
o a
nti
retr
ovi
ral
trea
tmen
t, en
d-2
006
(per
cen
t)
acce
ss t
o a
nti
retr
ovi
ral
trea
tmen
t, en
d-2
006
(per
cen
t)
0
20
40
60
80
100
HIV/AIDS-related aid per capita, 2005 (US$)
0
20
40
60
80
100
HIV/AIDS-related aid per capita, 2005 (US$)
0
20
40
60
80
100
access to antenatal care (percent)
0
20
40
60
80
100
0 2000 4000 6000 8000
0 2000 4000 6000 8000 10000 12000
0 5 10 15 20
0 5 10 15 20 25
0 20 40 60 80 100
0 20 40 60 80 100access to antenatal care (percent)
Figure 3.4 Access to Treatment and Key Development Indicators
Sources: IMF (2007), OECD (2007), and WHO, UNAIDS, and UNICEF (2007).
Note: Data points relating to South Asian countries are shown in bold.93

not disclose it at the workplace, out of concerns about negative conse-quences for themselves or their family.
While it is clear from our discussion of the income effects of HIV andAIDS that many households experience shortfalls in income, which insome cases can be very significant, HIV and AIDS is also associated withan increased demand for health services, and increased household expen-ditures on care and treatment. According to Pradhan and others (2006),medical expenditures account for 11 percent of total expenditure of HIVand AIDS-affected households, as compared with 3 percent for house-holds not affected by HIV and AIDS. This comparison, however, under-states the impact of HIV and AIDS as households affected by HIV andAIDS increase their total expenditure as well. When measured againstexpenditure of the non-HIV and AIDS control group, the increase there-fore comes out somewhat more pronounced (9.4 percent rather than 8percent). The findings by Das and others (2006) are broadly in line withthese findings.
Regarding medical expenditures, one key aspect is the financing ofantiretroviral treatment, and Pradhan and others (2006) provide somedata on different channels of access to ART and the associated costs.More than half of the respondents with access to antiretroviral treatment(about 15 percent of the respondents living with HIV and AIDS) receiveit at government hospitals, and an additional 5 percent through NGOs.With monthly costs of antiretroviral treatment through private providersbetween Rs. 1,141 (through chemist shops) and Rs. 1,669 (through pri-vate nursing homes or doctors), and the latter exceeding total monthlyhousehold expenditure for many households affected by HIV and AIDS,government facilities (Rs. 246) and NGOs (Rs. 547) clearly are the onlymodes of provision of antiretroviral treatment accessible to a large shareof people living with HIV and AIDS. Also, it is important to bear in mindthat—reflecting that only 15 percent of people living with HIV andAIDS among the respondents receive treatment—the reported increasesin medical expenditures largely reflect the pre-ART stage of HIV andAIDS, and likely understate the eventual impact of HIV and AIDS onmedical expenditures.
As incomes shrink while the need for expenditures on care and treat-ment increases, households affected by HIV and AIDS frequently borrowor dissave by selling off or drawing down household assets. Pradhan andothers (2006) observe that 46 percent of households affected by HIV andAIDS borrow, but only 27 percent in the control group, with a modestlyhigher average borrowing. Among households that borrowed, the amount
94 Haacker
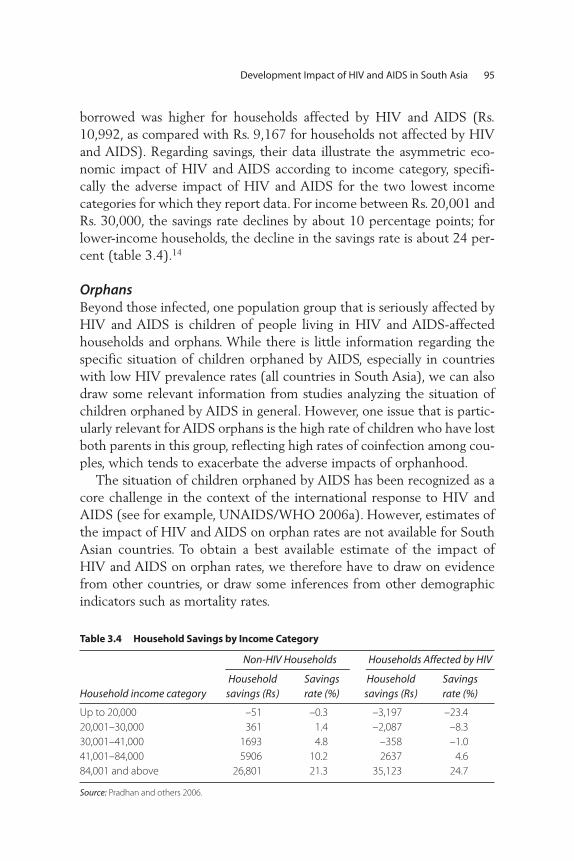
borrowed was higher for households affected by HIV and AIDS (Rs.10,992, as compared with Rs. 9,167 for households not affected by HIVand AIDS). Regarding savings, their data illustrate the asymmetric eco-nomic impact of HIV and AIDS according to income category, specifi-cally the adverse impact of HIV and AIDS for the two lowest incomecategories for which they report data. For income between Rs. 20,001 andRs. 30,000, the savings rate declines by about 10 percentage points; forlower-income households, the decline in the savings rate is about 24 per-cent (table 3.4).14
OrphansBeyond those infected, one population group that is seriously affected byHIV and AIDS is children of people living in HIV and AIDS-affectedhouseholds and orphans. While there is little information regarding thespecific situation of children orphaned by AIDS, especially in countrieswith low HIV prevalence rates (all countries in South Asia), we can alsodraw some relevant information from studies analyzing the situation ofchildren orphaned by AIDS in general. However, one issue that is partic-ularly relevant for AIDS orphans is the high rate of children who have lostboth parents in this group, reflecting high rates of coinfection among cou-ples, which tends to exacerbate the adverse impacts of orphanhood.
The situation of children orphaned by AIDS has been recognized as acore challenge in the context of the international response to HIV andAIDS (see for example, UNAIDS/WHO 2006a). However, estimates ofthe impact of HIV and AIDS on orphan rates are not available for SouthAsian countries. To obtain a best available estimate of the impact ofHIV and AIDS on orphan rates, we therefore have to draw on evidencefrom other countries, or draw some inferences from other demographicindicators such as mortality rates.
Development Impact of HIV and AIDS in South Asia 95
Table 3.4 Household Savings by Income Category
Household income category
Non-HIV Households Households Affected by HIV
Householdsavings (Rs)
Savings rate (%)
Householdsavings (Rs)
Savings rate (%)
Up to 20,000 –51 –0.3 –3,197 –23.4
20,001–30,000 361 1.4 –2,087 –8.3
30,001–41,000 1693 4.8 –358 –1.0
41,001–84,000 5906 10.2 2637 4.6
84,001 and above 26,801 21.3 35,123 24.7
Source: Pradhan and others 2006.
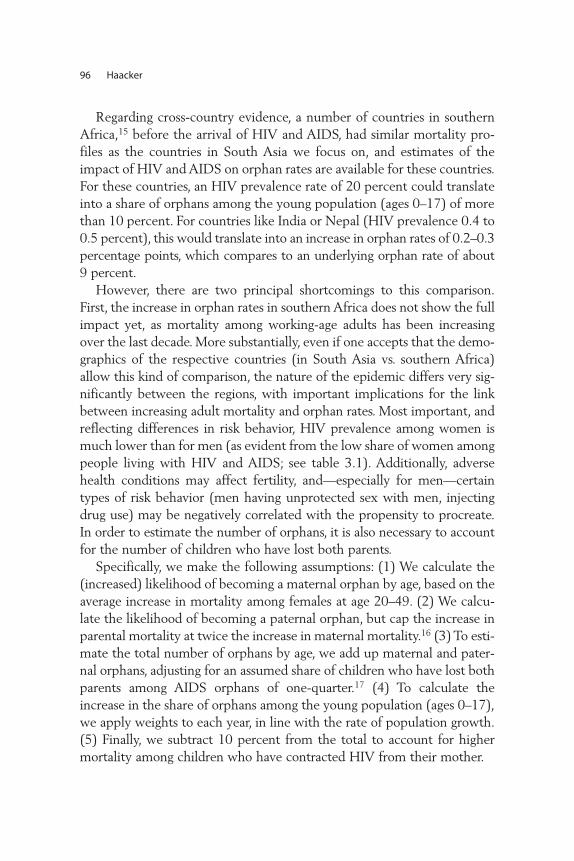
Regarding cross-country evidence, a number of countries in southernAfrica,15 before the arrival of HIV and AIDS, had similar mortality pro-files as the countries in South Asia we focus on, and estimates of theimpact of HIV and AIDS on orphan rates are available for these countries.For these countries, an HIV prevalence rate of 20 percent could translateinto a share of orphans among the young population (ages 0–17) of morethan 10 percent. For countries like India or Nepal (HIV prevalence 0.4 to0.5 percent), this would translate into an increase in orphan rates of 0.2–0.3percentage points, which compares to an underlying orphan rate of about9 percent.
However, there are two principal shortcomings to this comparison.First, the increase in orphan rates in southern Africa does not show the fullimpact yet, as mortality among working-age adults has been increasingover the last decade. More substantially, even if one accepts that the demo-graphics of the respective countries (in South Asia vs. southern Africa)allow this kind of comparison, the nature of the epidemic differs very sig-nificantly between the regions, with important implications for the linkbetween increasing adult mortality and orphan rates. Most important, andreflecting differences in risk behavior, HIV prevalence among women ismuch lower than for men (as evident from the low share of women amongpeople living with HIV and AIDS; see table 3.1). Additionally, adversehealth conditions may affect fertility, and—especially for men—certaintypes of risk behavior (men having unprotected sex with men, injectingdrug use) may be negatively correlated with the propensity to procreate.In order to estimate the number of orphans, it is also necessary to accountfor the number of children who have lost both parents.
Specifically, we make the following assumptions: (1) We calculate the(increased) likelihood of becoming a maternal orphan by age, based on theaverage increase in mortality among females at age 20–49. (2) We calcu-late the likelihood of becoming a paternal orphan, but cap the increase inparental mortality at twice the increase in maternal mortality.16 (3) To esti-mate the total number of orphans by age, we add up maternal and pater-nal orphans, adjusting for an assumed share of children who have lost bothparents among AIDS orphans of one-quarter.17 (4) To calculate theincrease in the share of orphans among the young population (ages 0–17),we apply weights to each year, in line with the rate of population growth.(5) Finally, we subtract 10 percent from the total to account for highermortality among children who have contracted HIV from their mother.
96 Haacker
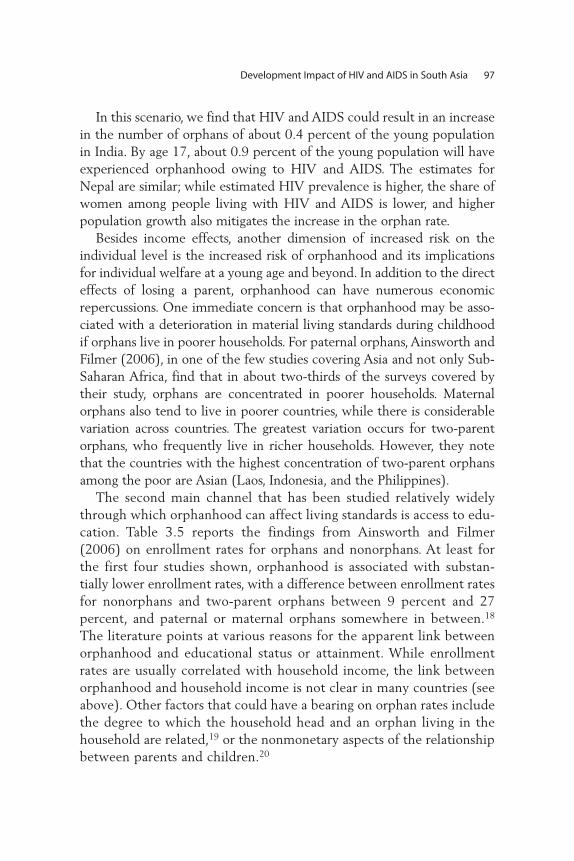
In this scenario, we find that HIV and AIDS could result in an increasein the number of orphans of about 0.4 percent of the young populationin India. By age 17, about 0.9 percent of the young population will haveexperienced orphanhood owing to HIV and AIDS. The estimates forNepal are similar; while estimated HIV prevalence is higher, the share ofwomen among people living with HIV and AIDS is lower, and higherpopulation growth also mitigates the increase in the orphan rate.
Besides income effects, another dimension of increased risk on theindividual level is the increased risk of orphanhood and its implicationsfor individual welfare at a young age and beyond. In addition to the directeffects of losing a parent, orphanhood can have numerous economicrepercussions. One immediate concern is that orphanhood may be asso-ciated with a deterioration in material living standards during childhoodif orphans live in poorer households. For paternal orphans, Ainsworth andFilmer (2006), in one of the few studies covering Asia and not only Sub-Saharan Africa, find that in about two-thirds of the surveys covered bytheir study, orphans are concentrated in poorer households. Maternalorphans also tend to live in poorer countries, while there is considerablevariation across countries. The greatest variation occurs for two-parentorphans, who frequently live in richer households. However, they notethat the countries with the highest concentration of two-parent orphansamong the poor are Asian (Laos, Indonesia, and the Philippines).
The second main channel that has been studied relatively widelythrough which orphanhood can affect living standards is access to edu-cation. Table 3.5 reports the findings from Ainsworth and Filmer(2006) on enrollment rates for orphans and nonorphans. At least forthe first four studies shown, orphanhood is associated with substan-tially lower enrollment rates, with a difference between enrollment ratesfor nonorphans and two-parent orphans between 9 percent and 27percent, and paternal or maternal orphans somewhere in between.18
The literature points at various reasons for the apparent link betweenorphanhood and educational status or attainment. While enrollmentrates are usually correlated with household income, the link betweenorphanhood and household income is not clear in many countries (seeabove). Other factors that could have a bearing on orphan rates includethe degree to which the household head and an orphan living in thehousehold are related,19 or the nonmonetary aspects of the relationshipbetween parents and children.20
Development Impact of HIV and AIDS in South Asia 97
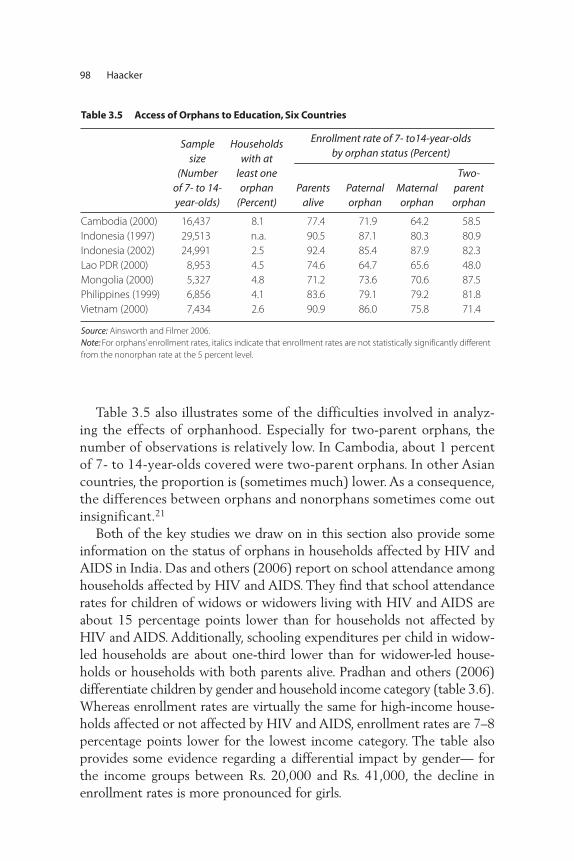
Table 3.5 also illustrates some of the difficulties involved in analyz-ing the effects of orphanhood. Especially for two-parent orphans, thenumber of observations is relatively low. In Cambodia, about 1 percentof 7- to 14-year-olds covered were two-parent orphans. In other Asiancountries, the proportion is (sometimes much) lower. As a consequence,the differences between orphans and nonorphans sometimes come outinsignificant.21
Both of the key studies we draw on in this section also provide someinformation on the status of orphans in households affected by HIV andAIDS in India. Das and others (2006) report on school attendance amonghouseholds affected by HIV and AIDS. They find that school attendancerates for children of widows or widowers living with HIV and AIDS areabout 15 percentage points lower than for households not affected byHIV and AIDS. Additionally, schooling expenditures per child in widow-led households are about one-third lower than for widower-led house-holds or households with both parents alive. Pradhan and others (2006)differentiate children by gender and household income category (table 3.6).Whereas enrollment rates are virtually the same for high-income house-holds affected or not affected by HIV and AIDS, enrollment rates are 7–8percentage points lower for the lowest income category. The table alsoprovides some evidence regarding a differential impact by gender— forthe income groups between Rs. 20,000 and Rs. 41,000, the decline inenrollment rates is more pronounced for girls.
98 Haacker
Table 3.5 Access of Orphans to Education, Six Countries
Samplesize
(Numberof 7- to 14-year-olds)
Householdswith at
least oneorphan
(Percent)
Enrollment rate of 7- to14-year-olds by orphan status (Percent)
Parentsalive
Paternalorphan
Maternalorphan
Two-parentorphan
Cambodia (2000) 16,437 8.1 77.4 71.9 64.2 58.5
Indonesia (1997) 29,513 n.a. 90.5 87.1 80.3 80.9
Indonesia (2002) 24,991 2.5 92.4 85.4 87.9 82.3
Lao PDR (2000) 8,953 4.5 74.6 64.7 65.6 48.0
Mongolia (2000) 5,327 4.8 71.2 73.6 70.6 87.5
Philippines (1999) 6,856 4.1 83.6 79.1 79.2 81.8
Vietnam (2000) 7,434 2.6 90.9 86.0 75.8 71.4
Source: Ainsworth and Filmer 2006.
Note: For orphans’ enrollment rates, italics indicate that enrollment rates are not statistically significantly different
from the nonorphan rate at the 5 percent level.
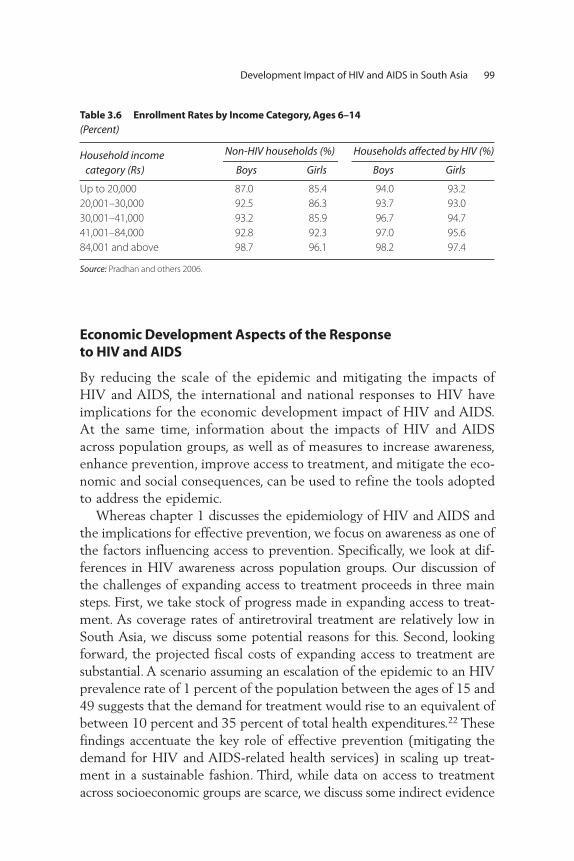
Economic Development Aspects of the Response to HIV and AIDS
By reducing the scale of the epidemic and mitigating the impacts ofHIV and AIDS, the international and national responses to HIV haveimplications for the economic development impact of HIV and AIDS.At the same time, information about the impacts of HIV and AIDSacross population groups, as well as of measures to increase awareness,enhance prevention, improve access to treatment, and mitigate the eco-nomic and social consequences, can be used to refine the tools adoptedto address the epidemic.
Whereas chapter 1 discusses the epidemiology of HIV and AIDS andthe implications for effective prevention, we focus on awareness as one ofthe factors influencing access to prevention. Specifically, we look at dif-ferences in HIV awareness across population groups. Our discussion ofthe challenges of expanding access to treatment proceeds in three mainsteps. First, we take stock of progress made in expanding access to treat-ment. As coverage rates of antiretroviral treatment are relatively low inSouth Asia, we discuss some potential reasons for this. Second, lookingforward, the projected fiscal costs of expanding access to treatment aresubstantial. A scenario assuming an escalation of the epidemic to an HIVprevalence rate of 1 percent of the population between the ages of 15 and49 suggests that the demand for treatment would rise to an equivalent ofbetween 10 percent and 35 percent of total health expenditures.22 Thesefindings accentuate the key role of effective prevention (mitigating thedemand for HIV and AIDS-related health services) in scaling up treat-ment in a sustainable fashion. Third, while data on access to treatmentacross socioeconomic groups are scarce, we discuss some indirect evidence
Development Impact of HIV and AIDS in South Asia 99
Table 3.6 Enrollment Rates by Income Category, Ages 6–14 (Percent)
Household income category (Rs)
Non-HIV households (%) Households affected by HIV (%)
Boys Girls Boys Girls
Up to 20,000 87.0 85.4 94.0 93.2
20,001–30,000 92.5 86.3 93.7 93.0
30,001–41,000 93.2 85.9 96.7 94.7
41,001–84,000 92.8 92.3 97.0 95.6
84,001 and above 98.7 96.1 98.2 97.4
Source: Pradhan and others 2006.
on access to treatment across population groups, looking at—amongother factors—access to antenatal care.
Distributional Aspects on Access to Information about HIV In addition to the ability to cope with the economic consequences of HIVand AIDS (discussed above) and access to treatment, knowledge andaccess to prevention services are key factors that affect an individual’s orhousehold’s vulnerability to HIV and AIDS. As spending on preventionmeasures or other inputs to prevention programs cannot easily be attrib-uted to individuals, an analysis of the socioeconomic dimension of accessto prevention primarily relies on outputs to prevention programs, forexample, changes in sexual and injecting risk behavior such as condomuse and use of clean needles.
While not an ideal indicator in terms of measuring the success of pre-vention efforts (as it does not necessarily translate into behavior change),data on knowledge about the sexual transmission of HIV are interesting inthe context of our discussion of the socioeconomic aspects of HIV andAIDS, as data on knowledge are available across certain socioeconomic cat-egories and across countries. Lacking data on access to and use of preven-tion services or of behavior change by income, our discussion will thereforefocus on knowledge about HIV across economic quintiles. Table 3.7 sum-marizes available data on knowledge about sexual transmission of HIV andAIDS for Bangladesh, India, and Nepal, and also reports data on knowledgeabout HIV prevention from the recently completed 2005–2006 NationalFamily Health Survey for India. We find a fairly regular pattern of HIVawareness by socioeconomic status across countries, with HIV awareness inthe lowest wealth quintile only a fraction of the level of awareness in thehighest quintile. Second, there are large differences between men andwomen, with average HIV awareness among women only about 50 percentto 60 percent of the level of awareness among men. Moreover, the “wealthgap” and the “gender gap” tend to reinforce each other—by far the lowestlevels of awareness are recorded for women in the lowest wealth quintile;and the gap between the highest and lowest quintile is much higher forwomen. One possible explanation for these gaps is access to education. Inthe countries covered, the patterns of HIV awareness resemble data onschool completion rates, and studies differentiating by years of schooling(such as International Institute for Population Science (IIPS) 2007; seelower panel of table 3.7) find a similar pattern by level of education.
To understand how differences in HIV awareness, risk behavior, andother factors translate into a socioeconomic profile of HIV and AIDS
100 Haacker

across the population, we would ideally be able to draw on the results ofpopulation studies identifying households and individuals affected byHIV and AIDS and those not affected, and compare the respective groups.Hopefully, this will be possible for India when the full dataset of the2005–2006 National Family Health Survey is released. Until then, themain data sources are surveys that compare households affected by HIVand AIDS with unaffected households in the same area. While this approachis geared toward identifying household impacts of HIV and AIDS, it con-tains little information on the composition of the population living withHIV and AIDS, because the sample is confined to households that havebeen identified because they receive some HIV-related medical services,and thus are not representative of the entire population living with HIVand AIDS.
A few conclusions regarding susceptibility can nevertheless be drawnfrom these studies. For example, they illustrate the differences in riskbehavior between men and women. While married men most commonly
Development Impact of HIV and AIDS in South Asia 101
Table 3.7 HIV Awareness across Population Groups(Percent)
Knowledge about sexual transmission of HIV
Average Lowest 2nd 3rd 4th Highest
Urban(Average)
Rural(Average)
Bangladesh (2004)Men 51.5 27.5 36.6 47.6 59.8 78.4 69.7 45.7
Women 31.6 9.7 17.0 26.4 40.2 64.2 51.7 25.7
India (1998/99)Women 25.3 4.6 8.7 19.3 33.6 59.6 62.8 48.5
Nepal (2001)Men 63.4 49.8 55.8 60.5 64.1 84.2 n.a. n.a.
Women 28.9 10.9 19.1 23.8 33.6 59.6 64.3 49.5
Knowledge that consistent condom use can reduce chance of acquiring HIV
AverageNo
education <8 years 8–9 years>=10years
Urban(Average)
Rural(Average)
India (2006)Men 68.1 33.9 62.8 82.0 93.2 85.6 59.5
Women 34.7 12.5 34.9 57.6 81.0 56.3 25.1
Sources: Gwatkin and others 2007a, 2007b, and 2007c, and IIPS 2007.
Note: For Nepal (2001), the numbers included in Gwatkin and others (2007c) for rural vs. urban HIV awareness
are inconsistent with the aggregates, as the average for both urban and rural HIV awareness is higher than the
average for the aggregate.
Wealth Quintile

acquire HIV from other sexual partners, women frequently becomeinfected by their husbands. In surveys of households affected by HIV andAIDS, this results in high rates of coinfection (both partners infected) andin high rates of HIV-positive widows, whereas the numbers of HIV- positive widowers is generally low. This is most likely explained by aninfection pattern whereby the husband acquires HIV earlier and—in manycases—passes it on to the spouse. For example, Das and others (2006)report that “in 54 percent of the ‘currently married’ families affected byHIV and AIDS, both adults are infected with HIV, while in 42 percent ofthem only the male adult is infected, and in only 6 percent of cases onlythe female adult is infected,” and that 76 percent of household heads whowere “ever married” (largely widows and widowers) are female. Similarly,Pradhan (2006) finds that 36 percent of women living with HIV andAIDS are widowed, but only 4 percent of the men are widowers.
Another key dimension of differences in susceptibility to HIV and AIDSare groups engaging in high-risk behaviors, such as sex workers and theirclients, men who have sex with men, and injecting drug users and theirpartners. While much of the literature regarding prevention strategiesfocuses on such vulnerable groups (see Wilson 2007), we have little infor-mation on the socioeconomic profile of these population groups, as theyare not easily accessible using standard survey techniques. While they aresome obvious linkages among HIV and AIDS, the propensity to engage inhigh-risk behavior, and development outcomes (most obviously for thelink between prostitution and poverty), we unfortunately cannot providean adequate discussion owing to data limitations.
The Challenge of Expanding Access to TreatmentAccess to care and treatment has the potential to mitigate the health andeconomic impacts of HIV and AIDS. However, access to treatment isuneven across and within countries. To the extent that access to treatmentis positively correlated with key development indicators, it may exacer-bate inequalities in living standards. At the same time, expanding accessto treatment represents a substantial logistical and financial challenge.With these basic considerations in mind, we will proceed along the fol-lowing lines. First we discuss the current situation in terms of access totreatment, and the scale of the challenge of expanding treatment. Whilethe data situation is very weak, we then provide some conjectures regard-ing the determinants of access to treatment within countries.
Table 3.8 summarizes the available data on access to treatment in SouthAsia. Generally, access to treatment is low in an international context.
102 Haacker

WHO, UNAIDS, and UNICEF (2007) estimate that the coverage rate forlow- and middle-income countries had risen to 28 percent as of the endof 2006; for Asia, they report an average coverage rate of 19 percent. If anadjustment is made for the revised estimates for India, the estimated cov-erage rate would rise to 31 percent globally and 33 percent for Asia. Formost countries in South Asia, the coverage rates attained so far are muchlower; only for India is the upper range of the estimates for treatmentaccess in the vicinity of the global average. There are two sets of factorsthat may help explain the low rates of access to treatment in South Asia—limited economic or health sector capacities, and the composition of peo-ple in need of treatment.
In this regard, we explore several indicators for the capacities of SouthAsian economies, or their health sectors, to address the demand forincreased health services associated with HIV and AIDS (figure 3.4).First, high levels of GDP per capita indicate both the availability of pub-lic financial resources to address increasing demand for health servicesassociated with HIV and AIDS, but also a higher capacity among resi-dents to privately pay for some of the costs of treatment, at least for part
Development Impact of HIV and AIDS in South Asia 103
Table 3.8 Access to Antiretroviral Treatment in South Asia
HIVprevalence,end of 2007
(ages 15–49)(Percent)
Estimatednumber of
peoplerequiring
treatment,end of 2007
Estimatednumber of
peoplereceiving
treatment,end of 2007
Antiretroviraltreatmentcoverage,
end of 2007(Percent)
Antiretroviraltreatmentcoverage,
end of 2005(Percent)
Afghanistan <0.01 n.a. 0 n.a. n.a.
Bangladesh 0.01 2,400 170 7 1
Bhutan 0.09 <100 18 n.a. n.a.
India 0.34 n.a. 158,000 n.a. 16
Maldives n.a. n.a. 1 n.a. 0
Nepal 0.5 20,000 1,400 7 1
Pakistan 0.10 20,000 600 3 2
Sri Lanka 0.03 780 107 14 6
Memorandum ItemsChina 0.08 190,000 35,000 19 25
Thailand 1.4 250,000 153,000 61 60
Myanmar 0.7 76,000 11,000 15 7
Source: WHO (2006a); UNAIDS and WHO (2008); WHO, UNAIDS, and UNICEF (2006); and WHO, UNAIDS, and
UNICEF (2008).
Note: The percent of people in India receiving ART comes from author’s calculations, based on WHO, UNAIDS,
and UNICEF (2006), making adjustments for subsequent revisions to estimated HIV prevalence.

of the population. Second, a country’s response to HIV may benefit fromexternal aid, including for scaling up access to treatment. We thereforeillustrate the correlation between HIV and AIDS-related aid and accessto treatment. Third, we look at the link between access to treatment andaccess to antenatal care as an indicator for the coverage rate of basic healthservices. Finally, as the situation regarding constraints to scaling up maydiffer very significantly across high- and low-prevalence countries, we showthe data for all countries where the data are available, and also for thesubset of countries with an HIV prevalence rate lower than 1 percent.
Figure 3.4 illustrates the correlation of access to antiretroviral treat-ment with these development indicators. The data on access to treatmentare based on the Progress Report by WHO, UNAIDS, and UNICEF (2007),and include all countries where point estimates on access to treatmentwere available (for South Asia: Bangladesh, Nepal, Pakistan, and Sri Lanka),plus India, where a point estimate for access to treatment was constructedfrom the midpoint estimates for people requiring and receiving treatmentreported in table 3.8.
Our findings include the following:
• South Asian economies are among the economies with the lowest lev-els of GDP per capita among countries with low HIV prevalence, andalso feature comparatively low rates of access to treatment within thisgroup. However, GDP per capita is not a convincing determinant of alow level of access to treatment in South Asia, as many low-incomecountries with higher levels of HIV prevalence (in the full sample)feature rates of access that are much higher than those attained inSouth Asia.23
• There is no indication that differences in access to external aid mayexplain the relatively low levels of access to treatment in South Asia.For both the low-prevalence countries and the full sample, access totreatment in South Asia is comparatively low relative to countries re-ceiving similar levels of external aid.
• Our data indicate that low access to treatment in South Asia is relatedto the low capacity of health systems in the region. Four of the SouthAsian countries are among the bottom five countries in terms of accessto antenatal care for the low-prevalence sample, and they are amongthe bottom 10 countries for the full sample. Especially among thelow-prevalence sample, access to treatment is positively correlatedwith the rate of access to antenatal care.
104 Haacker

• However, the case of Sri Lanka, with a very high level of antenatalcare, but an extremely low rate of access to treatment, amply illus-trates that limited capacities of health services only partly explain thelow levels of treatment in South Asia. At the same time, the exampleof Cambodia (with access to antenatal care of 38 percent, but accessto treatment at 83 percent) shows that low capacities in basic healthservices need not be an insurmountable obstacle to attaining high cov-erage rates of antiretroviral treatment.
The findings from our discussion of the correlation between access totreatment and key development indicators are confirmed by an econo-metric analysis, based on the full sample.24 Eq. (4) suggests that anincrease in HIV prevalence of 1 percentage point translates into a treat-ment coverage rate that is lower by 1.1 percentage points, that a differ-ence in GDP per capita of US$1,000 is associated with a difference intreatment access of 7 percentage points, that an additional US$1 in exter-nal aid per capita corresponds to a treatment access rate that is 2.9 per-centage points higher; and a rate of access to antenatal care that is 1percentage point higher translates into a treatment coverage rate that is0.3 percentage points higher. As in our more informal discussion, the lat-ter factor emerges as the most important one in terms of explaining dif-ferences in access to treatment in South Asia and other regions.
(4)
The Costs of TreatmentIn light of the findings of the previous section, estimates of the costs of scal-ing up of antiretroviral treatment should be treated with caution, as scalingup takes place in the context of national health systems, and as the capaci-ties of these systems in terms of financial resources, human resources, or theeffectiveness of the health sector, may complicate the tasks of scaling up, ormay pose constraints that cannot easily be overcome by additional financialresources only.
Nevertheless, estimates of the costs of scaling up provide importantinformation relevant for planning national responses to HIV. Most directly,it is important for budgeting to know the financial implications of anygiven target for the coverage rate of antiretroviral treatment. Second,
TREAT HIV GDPPC= − − ⋅ + ⋅
+
− −6 0 1 11 0 007
2 90
0 5 2 4 6 9. . .
.
( . ) ( . )
**
( . )
***
(( . )
***
( . )
**. ,
. .
6 9 2 2
2 25
0 3
0 49
⋅ + ⋅
=
AIDPC ANCCARE
with R
Development Impact of HIV and AIDS in South Asia 105

relating the required funding to overall health expenditure provides anadditional indicator for the scale of the national response to HIV in thespecific national context. Third, a comprehensive scaling up is normallyassociated with a sustained increase in the number of people requiringtreatment (as survival rates for patients receiving treatment rise, whileadditional people living with HIV and AIDS reach the stage at whichthey also require treatment). To ensure the viability of the national treat-ment program in the future, it is therefore important to project the num-ber of people who will participate in a treatment program or requiretreatment, and to ensure that the required resources (human, financial,drugs, and so on) are provided.
In line with international developments, the costs of treatment—mostdecisively, the prices of antiretroviral drugs—have fallen in Asia over thelast years. Table 3.9 summarizes some of the latest available data. Allowingfor some data collection and publication lag (the table quotes only recentstudies published in 2006), these estimates suggest that the costs of anti-retroviral treatment in low- and middle-income countries in Asia werearound US$400–600 per year in 2004. To illustrate the progress made inimproving the affordability of these drugs over the last years, in China, thecosts were as high as US$10,000 in 2001 and US$4,000–5,000 in 2002.
To understand the full financial implications of expanded access totreatment, it is necessary also to account for the costs of administering thedrugs and monitoring the treatment. More comprehensive cost estimatesare available only for a subset of countries, suggesting an annual cost ofaround US$400. In the absence of estimates of the total costs of treatment
106 Haacker
Table 3.9 The Costs of Antiretroviral Treatment(Annual Costs, per Patient, in U.S. dollars)
Costs of drugsCosts of
monitoring, etc. Total
Cambodia 350 — —
China 400 — —
India 340 — —
India 397 420 817
Indonesia 600 — —
The Philippines 456–576 407 863–983
Sources: Morineau and others 2006 for Cambodia; Ma and others 2006 for China; Priya and others 2006 and
Gupta, Trivedi, and Kandamuthan 2006 for India; Gunawan, Kosen, and Simms 2006 for Indonesia; and Monzon
and Poblete 2006 for the Philippines.
for a wider set of countries, we will use this estimate throughout, using anindicative estimate of US$800 for the annual costs of treatment perpatient across countries.26 There are two principal uncertainties regardingthis estimate. First, the prices of drugs or other supplies (for example, CD4test kits) may fall, reducing the costs of treatment.27 Second, drug resist-ance or other treatment failure may result in an increasing demand formore expensive (“second-line”) drug combinations, especially as the num-ber of patients who have been on antiretroviral treatment for some timeincreases. The average unit costs of treatment may therefore increase.
Based on these estimates, we provide three scenarios for the actual orpotential costs of treatment (see table 3.10). Scenario 1 represents anestimate of the current cost of treatment, based on the latest estimatesof the numbers of people receiving treatment as of the end of 2006(from WHO, UNAIDS, and UNICEF (2007)). Scenario 2 presents thehypothetical costs of providing treatment to all people living with HIVand AIDS requiring treatment as of the end of 2006; that is, it corre-sponds to a coverage rate of treatment of 100 percent. Looking forward,one point that needs to be taken into account in estimating the poten-tial costs of a comprehensive treatment program is that the number ofpeople living with HIV and AIDS is endogenous (see Over 2004).Owing to reduced mortality and increased life expectancy, an expansionof treatment, controlling for other factors, is associated with an increasein the number of people living with HIV and AIDS and, even more pro-nounced, an increase in the number of people requiring treatment. Forthis reason, we report both estimates of the short-run costs (of provid-ing treatment to all patients requiring it as of the end of 2006) and esti-mates of the longer-term costs.
Specifically, Scenario 2 makes the following assumptions: (1) It takes thenumber of people living with HIV and AIDS as given (as reported in table3.1). (2) Regarding the immediate costs of a scenario with full access totreatment, it assumes that 20 percent of people living with HIV and AIDSrequire treatment.28 (3) Regarding the longer term, it assumes that—as aconsequence of a comprehensive treatment program—the number of peo-ple living with HIV and AIDS would rise by 80 percent, and that 60 per-cent of the people living with HIV and AIDS in this scenario receivetreatment. The scenario is based on the assumption that life expectancy inthe absence of treatment is 10 years after infection, that patients wouldrequire treatment after 7 years, and that treatment extends the lifespan by8 years (that is, 11 years after initiation of treatment).29
Development Impact of HIV and AIDS in South Asia 107
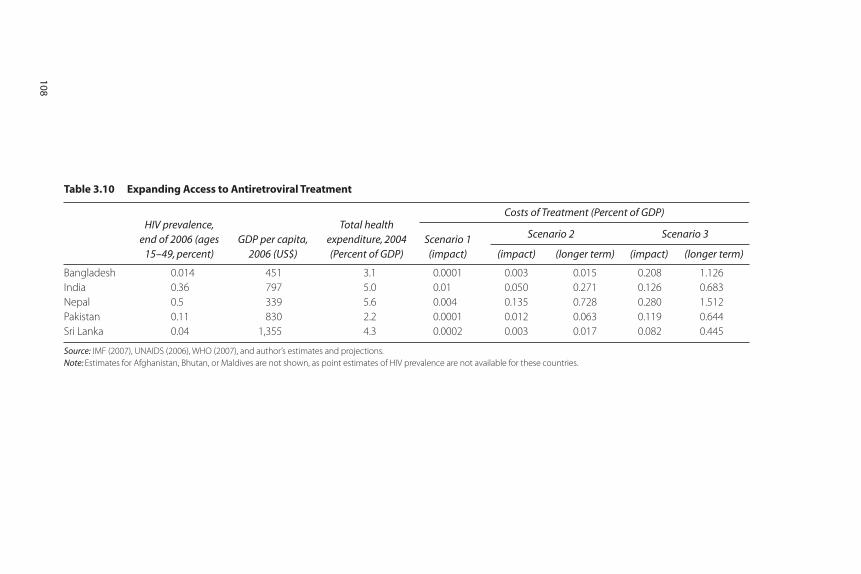
Table 3.10 Expanding Access to Antiretroviral Treatment
HIV prevalence,end of 2006 (ages
15–49, percent)GDP per capita,
2006 (US$)
Total healthexpenditure, 2004(Percent of GDP)
Scenario 1(impact) (impact) (longer term) (impact) (longer term)
Bangladesh 0.014 451 3.1 0.0001 0.003 0.015 0.208 1.126
India 0.36 797 5.0 0.01 0.050 0.271 0.126 0.683
Nepal 0.5 339 5.6 0.004 0.135 0.728 0.280 1.512
Pakistan 0.11 830 2.2 0.0001 0.012 0.063 0.119 0.644
Sri Lanka 0.04 1,355 4.3 0.0002 0.003 0.017 0.082 0.445
Source: IMF (2007), UNAIDS (2006), WHO (2007), and author’s estimates and projections.
Note: Estimates for Afghanistan, Bhutan, or Maldives are not shown, as point estimates of HIV prevalence are not available for these countries.
108
Costs of Treatment (Percent of GDP)
Scenario 2 Scenario 3

Scenario 3 is built in the same way as Scenario 2, but assumes thatunderlying HIV prevalence among the population between the ages of15 and 49 rises to 1 percent in all countries (plus the increase in HIVprevalence owing to longer survival times because of improved access totreatment). Estimating what would represent a credible adverse scenarioregarding the evolution of the HIV epidemic(s) in the region is beyondthe scope of this paper; our “1 percent” scenario is motivated simply byproviding a common indicator for the vulnerability of the respectivecountries’ health sectors to an escalation of the epidemic, “normalizing”the estimates with respect to the level of HIV prevalence.
We find that the current costs of providing treatment to people livingwith HIV and AIDS are modest both from a fiscal perspective and rela-tive to total health expenditures. Based on the numbers of patientsreceiving treatment as of the end of 2006, the costs were highest inIndia, at 0.01 percent of GDP, corresponding to 0.2 percent of totalhealth expenditures. If treatment coverage were to rise to 100 percent,the costs of treatment in India would rise to 0.05 percent of GDP, andto 0.27 percent of GDP in the longer run (about 5 percent of totalhealth expenditure). In Nepal, the country with the highest HIV preva-lence rate and the lowest level of GDP per capita, the costs would bemore substantial, eventually rising to 0.7 percent of GDP, and about 10percent of total health expenditure. This analysis of the longer-term costsalso accentuates the issue of sustainability of treatment programs, as thelong-term costs come out about five times higher than at initiation of theprogram. Finally, Scenario 3 provides some indication of the implicationsof a hypothetical escalation of the epidemic(s) to a prevalence rate of 1percent. In four countries (Bangladesh, Nepal, Pakistan, and Sri Lanka),the demand for treatment would exceed the equivalent of 5 percent oftotal health expenditure early on, and—in a comprehensive treatmentscenario—would eventually rise to between 10 percent and 35 percentof total health expenditure.
Distributional Aspects of Access to TreatmentAs we have argued above (in our discussion of socioeconomic impacts ofHIV and AIDS), it is important to understand the impact of HIV andAIDS across population groups in order to fully grasp the developmentimpact. This basic conjecture also applies to access to treatment, and ourdiscussion here continues the earlier analysis of characteristics of house-holds affected by HIV and AIDS and differences in the impact of HIVand AIDS across population groups. One principal obstacle to an analysis
Development Impact of HIV and AIDS in South Asia 109
of the distributional aspects of access to antiretroviral treatment is lack ofsocioeconomic data on people receiving antiretroviral treatment. As astarting point, we therefore discuss socioeconomic differences in access tohealth services for which some cross-country data are available for SouthAsia (antenatal care visits to a medically trained person). Our discussionthen closes with a review of some evidence regarding differences in accessto treatment across population groups, focusing on differences by genderand access to treatment for injecting drug users (an important groupamong people living with HIV and AIDS in many South Asian countries).
Our choice of antenatal care visits to a medically trained person as anindicator for access to health services across population groups has beenmotivated by several considerations. One important aspect is data avail-ability, as this is an indicator that has consistently been included in majorhealth surveys across countries. Also, HIV and AIDS-related health serv-ices are typically delivered in larger health facilities rather than clinicscatering only to people affected by HIV and AIDS. The data on antena-tal care—as they carry some information on access to health facilities ingeneral—may therefore provide a proxy for access to HIV and AIDS-related services. Antenatal care is also associated with antiretroviral treat-ment for prevention of mother-to-child transmission of HIV, and—thoughless directly—with access to antiretroviral treatment for adults, as tests atantenatal clinics may result in the detection of an infection. One primaryshortcoming of this indicator, in the context of South Asia, is that antena-tal care is utilized by women, whereas the majority of people living withHIV and AIDS are men. Table 3.11 summarizes data on antenatal carevisits for Bangladesh, India, and Nepal.
We find a fairly regular pattern of antenatal care visits across countries.First, there are substantial differences in access across wealth quintiles. Inthis regard, India is the most equitable country, with access for the high-est quintile about double the access for the lowest quintile, while the cor-responding factor is higher than three for Bangladesh. Second, differencesin the quality of services reinforce inequalities in overall access. While thewealthiest quintile predominantly draws on the services of a doctor, thepoorer quintiles frequently (in the case of Nepal predominantly) onlyhave access to a nurse or trained midwife. Third, controlling for wealth,there are gaps in access to services between the urban and rural popula-tions, especially for the lower wealth quintiles.30
Another potential dimension of inequities in access to treatmentregards differences by gender. While this is an important aspect of thesocioeconomic impacts of HIV and AIDS, access to treatment seems to
110 Haacker

Development Impact of HIV and AIDS in South Asia 111
Table 3.11 Antenatal Care Visits to a Medically Trained Person (Percent)
Wealth Quintile
Average Lowest 2nd 3rd 4th Highest
Bangladesh (2004) 48.8 24.9 38.6 48.8 60.6 81.1
to doctor 31.3 12.3 18.9 26.8 42.0 65.6
to nurse or trained
midwife 17.5 12.6 19.7 22.0 18.6 15.5
Rural 43.0 24.1 37.0 46.7 59.3 74.2
Urban 71.0 33.9 52.9 62.0 66.7 85.7
India (1998/99) 65.7 44.1 55.3 68.6 80.3 92.8
to doctor 49.3 26.9 37.0 48.6 65.1 83.3
to nurse or trained
midwife 16.5 17.2 18.3 20.0 15.2 9.5
Rural 59.8 43.5 54.2 67.3 78.5 90.1
Urban 86.4 64.6 74.1 76.2 83.4 94.1
Nepal (2001) 48.6 30.4 37.9 50.8 57.5 79.5
to doctor 16.6 6.2 8.5 12.7 18.5 48.2
to nurse or trained
midwife 31.9 24.2 29.4 38.0 39.0 31.3
Rural 46.1 30.4 37.7 50.8 56.7 75.9
Urban 80.9 n.a. (51.8) (49.7) 77.4 85.8
Source: Gwatkin and others 2007a, 2007b, and 2007c.
Note: Numbers in brackets “indicate the absence of adequate observations to produce acceptably reliable values”
(Gwatkin 2007c).
be fairly even across sexes, with a slight advantage for women in mostcountries. For Asia overall, WHO, UNAIDS, and UNICEF (2007) findthat women account for 39 percent of people receiving antiretroviraltreatment, which is higher than their share in the population of peopleliving with HIV and AIDS (32 percent). The only South Asian countryfor which these data are available is India, with a share of women amongpeople living with HIV and AIDS of 39 percent, while they account for33 percent of people receiving treatment.
Finally, one factor that may be relevant regarding inequities in accessto treatment in South Asia is the role of injecting drug users. Aceijas(2006) reports that they accounted for 1.4 percent of people receivingtreatment in India at the end of 2004. Given that injecting drug use isconsidered the main factor in the spread of HIV in northeast India, andan important factor in other areas, this rate is certainly much lower thanthe share of injecting drug users among people living with HIV andAIDS. Thus, this factor points at the possibility that difficulties involved

in providing treatment to high-risk populations contribute to low ratesof access to treatment.
Summary and Conclusions
The picture that emerges regarding the economic development impactsof HIV and AIDS is complex; key findings include the following:
• The impacts of HIV and AIDS on GDP per capita are small. For India,the level effect on GDP per capita (–0.16 percent) corresponds to theequivalent of a one-off loss of about 1.5 weeks of GDP growth, andthe slowdown in population growth implies a slowdown GDP growthof 0.02 percentage points through 2015, and a smaller decline lateron. (Some factors, for example, regarding human capital accumula-tion, may exacerbate the negative impacts in the longer run, but wehave no data suitable for quantifying these effects at present.)
• Using a simple model that evaluates the direct welfare costs of increas-ing mortality, we find that these welfare costs are substantial, account-ing for 3 percent to 4 percent of GDP in India and Nepal, the countrieswith the highest prevalence rates in the region.
• HIV awareness is substantially lower for the lower wealth quintiles.Within quintiles, awareness is lower for women and for rural households.
• In a household study on India, 36.5 percent of people living with HIVand AIDS who were able to retain their employment nevertheless report-ed an income loss, which averaged about 9 percent. Among those wholost their employment (about 9 percent of the sample of people livingwith HIV and AIDS), the income loss was severe, at about 66 percent.
• The ability to cope with the financial effects of HIV and AIDS dif-fers strongly across wealth quintiles. For the lowest wealth quintile,Pradhan and others (2006) report savings rates of –23 percent forhouseholds affected by HIV and AIDS, as opposed to 0 percent for thenon-HIV group.
• Based on household data from India, we find that the situation of HIV-positive widows is worse than for other people living with HIV andAIDS, probably reflecting the status of widows in general. As manywomen living with HIV and AIDS are widows (reflecting an infectionpattern whereby women frequently are infected by their husbands,who acquire the virus through various forms of risky behavior), thismeans that HIV and AIDS does have a disproportionate economic impact on women.
112 Haacker

• In India and Nepal, the number of orphans will increase by about0.4 percent. By age 17, about 0.9 percent of the young population willhave experienced orphanhood owing to HIV and AIDS.
• We find access to antiretroviral treatment (about 20 percent in India,and less than 10 percent in the other countries) in the region to be lowin an international context. In many countries in the region, one keyfactor that appears to limit progress in scaling up is the low capacityof national health systems, as well as less support from internationalinitiatives (countries in other regions with low capacity and weak sys-tems have higher ART coverage).
• Using largely circumstantial evidence (for example, access to otherforms health services), we find indications for inequities in access tohealth services across socioeconomic groups. To the extent that theseinequities also extend to access to antiretroviral treatment, they exac-erbate the disproportionate impact on poorer population groups.
One point that needs emphasizing is the lack of data on the socioeco-nomic dimension of HIV and AIDS in South Asia, especially beyondIndia. Our discussion of the impacts of HIV and AIDS largely rests onsurveys matching households affected by HIV and AIDS with a controlgroup; while this may represent a best-available approach, it is problem-atic because it rests on first identifying households affected by HIV andAIDS, which means that the sample largely consists of people living withHIV and AIDS who receive some kind of HIV and AIDS-related medicalattention, and who likely are not representative of the population affectedby HIV and AIDS. At least for India, the recently completed 2005–2006National Family Health Survey may provide some improved insightsregarding the socioeconomic dimension of HIV and AIDS. Along the samelines, our knowledge of the extent and determinants of access to anti-retroviral treatment is very limited, beyond estimates of the overall num-ber of people receiving it on a national level.
In terms of policy implications and a research agenda, the key findingsfrom our analysis (data permitting) relate to the socioeconomic profile ofthe epidemic. In terms of the susceptibility to HIV, as well as the impli-cations for living standards, we find that the vulnerability to and the impactof the epidemic differs strongly across population groups by wealth, educa-tion, and gender. This is an important finding toward understanding theimpacts of the epidemic, as many of the implications of HIV and AIDSin the context of attaining the Millennium Development Goals arisefrom these discrepancies across population groups. At the same time, our
Development Impact of HIV and AIDS in South Asia 113

findings highlight the complexities of the response to HIV, as evident,for example, from our findings regarding the linkages of access to treat-ment and the strength of health systems, or the apparent relationshipbetween access to education and HIV awareness.
Notes
1. This comparison is based on age-standardized estimates of mortality fromWHO (2006c). AIDS-related mortality for India was scaled in line withupdated estimates of HIV prevalence and mortality for this country.
2. A different approach would involve obtaining such coefficients based on thelarger set of countries for which estimates of the impact of HIV and AIDS areavailable. We have therefore run regressions, using estimates for the 62 coun-tries covered by UN Population Division (2007), to obtain more preciseapproximations for the underlying demographic model that could be used tofill in the blanks. However, we adopt the simpler approach because HIVprevalence explained most of the variation in key indicators in these regres-sions (typically, around 95 percent), the role of interactions with other vari-ables is limited, and because the data set of 62 countries, including countrieswith very different demographic profiles compared to the South Asian coun-tries we focus on, may be less representative of the South Asian countries(excluding India) than India is.
3. While adjusting for the overestimates of the scale of the epidemic by scalingthe estimated demographic impacts accordingly, we are not able to disentan-gle the effects that the corresponding underestimate of the coverage rate oftreatment had on the estimated indicators of the demographic impact of HIVand AIDS.
4. More recent surveys of the available literature, for example, UNAIDS (2007)and Coffie and others (2007), suggest somewhat longer survival periods.
5. Haacker (2004b) provides an overview; Bloom and others (2004) discuss thisand other approaches and draw some inferences regarding the impact of HIVand AIDS in Asia.
6. This assumes a direct effect productivity of 0.05 percent, in the interior of therange quoted. The multiplier effect (taking A to the power (1/(1–α); seeequation (2)) increases the direct effect to about 0.08 percent.
7. Similar to our simple analysis, many studies of the economic impacts of HIVand AIDS in various African countries find large declines in GDP (relative toa baseline scenario), but much smaller declines in GDP per capita. In otherwords, the slowdown in GDP is dominated by a decline in population growth.
8. For example, Shantayanan and Nabi (2006) do not identify HIV and AIDSamong the challenges to sustaining growth in South Asia. Some earlier
114 Haacker
studies, such as Eberstadt (2002), predicted a more significant impact onlonger-term growth, but on the basis of demographic scenarios that havenot borne out.
9. A finer point is that the impact of HIV and AIDS may not be fully capturedin national income accounts, for example, when commercial sex work takesplace in the informal sector.
10. A note is in order regarding the role of surviving dependents, especially chil-dren, who are not included in the above presentation, but could well be cap-tured in the individual’s welfare function by adding a term describing theappropriately weighted welfare of an individual’s offspring to eq. [(3)]. Thiswould not yield fundamentally different results, especially when the individ-ual expects that his or her children would be affected by an epidemic likeHIV in a similar fashion.
11. As the compensating variation, in our context, is always larger than the equiv-alent variation, it is important to make clear which measure is used. If we donot state so explicitly, all our estimates of welfare costs of HIV and AIDSrelate to the equivalent variation.
12. This estimate is motivated by empirical studies analyzing the link betweenwage differentials and differences in mortality risk across occupations. Thefact that the “conversion factor” is higher than one reflects risk aversion andthe declining marginal utility of consumption. Philipson and Soares (2005),drawing on similar sources, use a somewhat lower value (about 2.9, obtainedas the inverse of the consumption elasticity of the utility function of 0.346quoted in their study).
13. An alternative approach that is sometimes used values the economic losses tohouseholds based on earnings lost owing to premature death. Under certainassumptions (full employment, fully integrated labor market), the earningslost are equal to the accumulated losses to GDP over time owing to a prema-ture death (but substantially understate the individual costs of the risk of pre-mature mortality according to the micro-based framework we apply). Usingthis approach, the Asian Development Bank and UNAIDS (2004a, 2004b)estimated that the cost of HIV and AIDS amounted to US$13.7 billion in2004, corresponding to about US$17,000 per AIDS death.
14. The declines in the savings rate may be larger than reported in table 3.4, as itis not clear whether household borrowing is factored in.
15. For example, Botswana, Namibia, or South Africa.
16. The assumed cap on paternal mortality is consistent with the scant evidencesuggesting high rates of coinfection among couples, which would not allow forlarge differences in HIV prevalence between parent couples. Alternatively,this adjustment is consistent with an assumption that men engaging in high-risk behavior may have a lower propensity to procreate.
Development Impact of HIV and AIDS in South Asia 115
17. A rate of double orphans among AIDS orphans of one-quarter is lowerthan in countries for which estimates exist (essentially, Sub-Saharan Africa,where double orphans account for about one-third of AIDS orphans).However, the differences in male vs. female HIV prevalence imply a lowershare of double orphans.
18. These findings are similar to estimates by Case, Paxson, and Ableidinger(2002) for Sub-Saharan Africa.
19. On this issue, see Case and Paxson (2006), or Case, Paxson, and Ableidinger(2002); however, both studies are dealing with Sub-Saharan Africa.
20. See Gertler, Levine, and Martinez (2006) for a study using data from Indonesia.
21. For example, the studies quoted for Mongolia and Vietnam only have 24 and11 observations, respectively, for two-parent orphans.
22. The range primarily reflects differences in GDP per capita across countries,although differences in health spending across countries also play a role (seetable 3.10).
23. The upper panel of figure 3.4 also illustrates another aspect of the correlationbetween HIV and AIDS and GDP per capita regarding South Asia. The SouthAsian economies are among the few low-income economies that have beensuccessful in containing HIV prevalence at levels below 1 percent.
24. See Haacker (2008) for more details.
25. Standard errors in parentheses. Three and two stars indicate coefficients sig-nificant at the 1 and 5 percent confidence levels, respectively.
26. As the costs of monitoring include personnel costs, they may differ acrosscountries in line with different levels of income and, on a macroeconomiclevel, GDP per capita. However, GDP per capita for most countries shown iswithin or close to the range spanned by India and the Philippines (aboutUS$500–US$1,000), so these estimates probably are not unreasonable formost low- and low-middle-income countries in the region.
27. Das and others (2006) provide a discussion of the quantitative impact ofchanges in prices of antiretroviral drugs and CD4 test kits.
28. Depending on the state of the epidemic, the share of people requiring treat-ment may differ across countries. For example, in the context of an escalatingepidemic, following a rise in HIV prevalence, the share of people living withHIV and AIDS requiring treatment would be relatively low. Using a commonbenchmark for the share of PLWH requiring treatment neutralizes this short-term effect on our cost estimates.
29. These assumptions are inspired by UNAIDS 2007, and Coffie and others 2007.
30. This finding about the urban/rural differential is in line with findingsreported in Pradhan and others (2006), who report that 17.7 percent of thepeople living with HIV and AIDS they surveyed were receiving antiretro-viral treatment in urban areas, as compared to 10.3 percent in rural areas.
116 Haacker
(As the sample includes people living with HIV and AIDS already identifiedand receiving some kind of medical attention, the share in this group receiv-ing treatment is much higher than for the general population).
References
Aceijas, Carmen, and others. 2006. “Antiretroviral Treatment for Injecting DrugUsers in Developing and Transitional Countries 1 Year Before the End of the‘Treating 3 Million by 2005. Making it Happen. The WHO Wtrategy’ ‘3by5’.”Addiction 101 (9): 1246–53.
Ainsworth, Martha, and Deon Filmer. 2006. “Inequalities in Children’sSchooling: AIDS, Orphanhood, Poverty, and Gender.” World Development 34(6): 1099–1128.
Asian Development Bank and UNAIDS (Joint United Nations Programme onHIV/AIDS). 2004a. Asia-Pacific’s Opportunity: Investing To Avert an HIV/AIDSCrisis. Manila, the Philippines and Geneva, Switzerland: Asian DevelopmentBank and UNAIDS.
———. 2004b. “Socio-Economic Impact of HIV/AIDS in Asia and the Pacific:Current and Future Scenario.” Study Series, Paper No. IV, AsianDevelopment Bank and UNAIDS, Manila, the Philippines and Geneva,Switzerland.
Bloom, David E., and others. 2004. Asia’s Economies and the Challenge of AIDS.Manila, the Philippines: Asian Development Bank.
Bloom, David E., and Peter Godwin, eds. 1997. The Economics of HIV/AIDS—TheCase of South and South East Asia. Oxford and New York: Oxford UniversityPress.
Case, Anne, and Christina Paxson. 2006. “The Care and Future of Orphans inAfrica.” Presented at Amsterdam Institute for International Developmentworkshop on “The Economic Consequences of HIV/AIDS,” December.
——— and Joseph Ableidinger. 2002. “Orphans in Africa,” Working Paper No.9213, National Bureau of Economic Research, Cambridge, MA.
Coffie, Patrick Ahuatchi, Raoul Moh, Didier Koumavi Ekouevi, and FrançoisDabis. 2007. Survival of HIV-infected Adults and Children on AntiretroviralTherapy in Low- and Middle-Income Countries. Bordeaux, France: Institut deSanté Publique, Epidémiologie et Développement (ISPED) and UniversitéVictor Segalen—Bordeaux.
Commission on AIDS in Asia. 2008. “Redefining AIDS in Asia—Crafting anEffective Response.” Report of the Commission on AIDS in Asia, OxfordUniversity Press, New Delhi, India.
Crafts, Nicholas, and Markus Haacker. 2002. “Welfare Implications of HIV/AIDS.”Working Paper 03/118, International Monetary Fund, Washington, DC.
Development Impact of HIV and AIDS in South Asia 117

———. 2004. “Welfare Implications of HIV/AIDS.” In Macroeconomics ofHIV/AIDS, ed. M. Haacker, 182–197. Washington, DC: InternationalMonetary Fund.
Das, Sanghamitra, Abhiroop Mukhopadhyay, and Tridip Ray. 2006. “TowardsMeasuring the Economic Cost of HIV/AIDS: The Indian Experience.”Unpublished manuscript, Indian Statistical Institute, Delhi Centre, Delhi, India.
Devarajan, Shantayanan, and Ijaz Nabi. 2006. Economic Growth in South Asia:Promising, Un-equalizing, ...Sustainable? Washington, DC: World Bank.
Eberstadt, Nicholas. 2002. “The Future of AIDS.” Foreign Affairs 81 (6): 22–45.
Gertler, Paul, David Levine, and Sebastian Martinez. 2006. “The Presence andPresents of Parents: How Parental Death and Disability Affects Children.” Paperpresented at Amsterdam Institute for International Development workshop on“The Economic Consequences of HIV/AIDS,” December. Amsterdam.
Gunawan, Suriadi, Soewarta Kosen, and Chris Simms. 2006. “Indonesia.” In TheHIV Pandemic—Local and Global Implications, ed. Eduard Beck and others,317–332. Oxford and New York: Oxford University Press.
Gupta, Indrani, Mayur Trivedi, and Subodh Kandamuthan. 2006. “An Analysis ofRecurrent Costs of the Free ART Programme of the Government of India.”Discussion Paper No. 18, South Asian Human Development Sector, WorldBank, Washington, DC.
Gwatkin, Davidson R., and others. 2007a. India—Socio-Economic Differences inHealth, Nutrition, and Population. Washington, DC: World Bank.
Gwatkin, Davidson R., and others. 2007b. Bangladesh—Socio-Economic Differencesin Health, Nutrition, and Population. Washington, DC: World Bank.
Gwatkin, Davidson R., and others. 2007c. Nepal—Socio-Economic Differences inHealth, Nutrition, and Population. Washington, DC: World Bank.
Haacker, Markus, 2007. “Financing the Response to HIV/AIDS: Some Fiscal andMacroeconomic Considerations.” Unpublished manuscript, based on presen-tation at conference on HIV/AIDS Interventions in Developing Countries,Harvard School of Public Health, Boston, September 13–15, 2006.
Haacker, Markus. 2004. “HIV/AIDS: The Impact on the Social Fabric and theEconomy.” In The Macroeconomics of HIV/AIDS, ed. Markus Haacker, 41–95Washington, DC: International Monetary Fund.
International Institute for Population Sciences (IIPS). 2007. “2005–2006 NationalFamily Health Survey (NFHS-3)—National Fact Sheet India (ProvisionalData)” IIPS, Deonar, Mumbai, India.
Jamison, Dean T., Jeffrey D. Sachs, and Jia Wang. 2001. “The Effect of the AIDSEpidemic on Economic Welfare in Sub-Saharan Africa.” Working Paper SeriesNo.WG1:13, Commission on Macroeconomics and Health, World HealthOrganization, Geneva, Switzerland.
118 Haacker
Lopez, Alan D., Colin D. Mathers, Majid Ezzati, Dean T. Jamison, and ChristopherJ.L. Murray. 2006. Global Burden of Disease and Risk Factors. Washington, DC:World Bank.
Monzon, Ofelia T., and Roderick E. Poblete. 2006. “The Philippines.” In The HIVPandemic—Local and Global Implications, ed. Eduard Beck and others. Oxfordand New York: Oxford University Press.
Morineau, Guy, and others. 2006. “Cambodia.” In The HIV Pandemic—Local andGlobal Implications, ed. Eduard Beck and others, 270–281. Oxford and NewYork: Oxford University Press.
National Institute of Public Health (NIPH), National Institute of Statistics(NIS), and ORC Macro. 2007. Cambodia Demographic and Health Survey2005. Phnom Penh, Cambodia, and Calverton, MD: NIPH, NIS, and ORCMacro.
National AIDS Control Organisation (NACO). 2007. HIV Sentinel Surveillanceand HIV Estimation, 2006. New Delh, India: NACO.
Ojha, Vijay P., and Basanta K. Pradhan. 2006. The Macro-Economic and SectoralImpacts of HIV and AIDS in India—A CGE Analysis. New Delhi, India:United Nations Development Programme.
Over, Mead. 2004. “Impact of the HIV/AIDS Epidemic on the Health Sectors ofDeveloping Countries.” In The Macroeconomics of HIV/AIDS, ed. MarkusHaacker, 311–344. Washington, DC: International Monetary Fund.
Over, Mead, Peter Heywood, Julian Gold, Indrani Gupta, Subhash Hira, and ElliotMarseille. 2006. HIV/AIDS Treatment and Prevention in India—Modeling theCost and Consequences. Washington, DC: World Bank.
Philipson, Thomas J., and Rodrigo R. Soares. 2005. “The Economic Cost of AIDS inSub-Sahran Africa: A Reassessment.” In Health and Economic Growth: Findingsand Policy Implications, ed. Guillem López-Casasnovas, Berta Rivera, and LuisCurrais, 315–36. Cambridge, MA: MIT Press.
Pradhan, Basanta K., Ramamani Sundar, and Shalabh K. Singh. 2006. Socio-Economic Impact of HIV and AIDS in India. New Delhi, India: United NationsDevelopment Programme.
Pradhan, Basanta K., Ramamani Sundar, and Shalabh K. Singh. 2006. Gender Impactof HIV and AIDS in India. New Delhi, India: United Nations DevelopmentProgramme.
Priya, R., and others. 2006. “India.” In The HIV Pandemic—Local and GlobalImplications, ed. Eduard Beck and others, 300–16. Oxford and New York:Oxford University Press.
Shao-Jun, Ma, and others. 2006. “China.” In The HIV Pandemic—Local and GlobalImplications, ed. Eduard Beck and others, 282–99. Oxford and New York:Oxford University Press.
Development Impact of HIV and AIDS in South Asia 119

Sundar, Ramamani. 2005. “The Household Impact of HIV/AIDS on the Educationof Children—A Study of HIV High Prevalence States of India.” Paper presentedat XXV International Population Conference, Tours, France, July 18–23.
UNAIDS (Joint United Nations Programme on HIV/AIDS). 2007. “ImprovingParameter Estimation, Projection Methods, Uncertainty Estimation, andEpidemic Classification.” Report of a meeting of the UNAIDS Reference Groupon Estimates, Modeling and Projections held in Prague, Czech Republic, Nov.29–Dec. 1.
UNAIDS (Joint United Nations Programme on HIV/AIDS) and World HealthOrganization (WHO). 2006a. 2006 Report on the Global AIDS Epidemic.Geneva, Switzerland: UNAIDS and WHO.
UNAIDS (Joint United Nations Programme on HIV/AIDS) and World HealthOrganization (WHO). 2006b. AIDS Epidemic Update—December 2006Geneva, Switzerland: UNAIDS and WHO.
UNAIDS (Joint United Nations Programme on HIV/AIDS), National AIDSControl Organisation (NACO), and World Health Organization (WHO).2007. “2.5 Million People in India Living with HIV, According to NewEstimates.” Press Release, July 6.
UNAIDS (Joint United Nations Programme on HIV/AIDS), United NationsChildren’s Fund (UNICEF), and U.S. Agency for International Development(USAID). 2004. Children on the Brink 2004. Geneva, Switzerland, New York,and Washington: UNAIDS, UNICEF, and USAID.
United Nations Population Division. 2007a. World Population Prospects: The 2006Revision—Highlights. New York: United Nations.
United Nations Population Division. 2007b. World Population Prospects: The 2006Revision Population Database. New York: United Nations.
World Health Organization (WHO). 2006a. Progress on Global Access to HIVAntiretroviral Therapy—A Report on “3 by 5” and Beyond. Geneva, Switzerland:WHO.
———. 2006b. India—Epidemiological Fact Sheet on HIV/AIDS and SexuallyTransmitted Infections. Geneva, Switzerland: WHO.
———. 2006c. “Death and DALY Estimates for 2002 by Cause for WHOMember States.” Geneva, Switzerland. http://www.who.int/healthinfo/bod/en/ index.html.
———. 2007. World Health Statistics 2007. Geneva, Switzerland: WHO.
———. Regional Office for South-East Asia. 2007. HIV/AIDS in the South-EastAsia Region. New Delhi, India: WHO Regional Office for South-East Asia.
World Health Organization (WHO), Joint United Nations Programme onHIV/AIDS (UNAIDS), and United Nations Children’s Fund (UNICEF). 2008.Towards Universal Access—Scaling up Priority HIV/AIDS Interventions in the
120 Haacker
Health Sector. Geneva, Switzerland, and New York: WHO, UNAIDS, andUNICEF.
World Health Organization (WHO), Joint United Nations Programme onHIV/AIDS (UNAIDS), and United Nations Children’s Fund (UNICEF).2006. Towards Universal Access—Scaling up Priority HIV/AIDS Interventionsin the Health Sector. Geneva, Switzerland, and New York: WHO, UNAIDS,and UNICEF.
Development Impact of HIV and AIDS in South Asia 121

Introduction
According to the latest available estimates, there are currently about2.5 million people living with HIV or AIDS in India, corresponding to aHIV prevalence rate of 0.36 percent for the population ages 15–49 (IIPS2007). While HIV prevalence thus remains relatively low, there are sev-eral factors that are unique to India’s HIV epidemic, and need to be takeninto account when assessing the impact of HIV and AIDS. (1) The scaleof the epidemic and patterns of infection differ across states, and evenbetween neighboring districts (see Wilson, this volume). Together with thefact that some of these states and districts are larger than many Africancountries affected by HIV and AIDS, this illustrates the complexities ofthe response to HIV and AIDS in India. (2) Of the two types of HIVvirus—a slow-progressing one and a fast-progressing one that kills withinsix to nine years without any antiretroviral therapy—the latter type ofvirus is the predominant one in India. (3) India is a predominantly poorcountry with low levels of nutrition and high exposure to various typesof bacteria and viruses, including tuberculosis—factors that exacerbatethe morbidity and mortality of HIV and AIDS.
Economic Cost of HIV and AIDS in India
Sanghamitra Das, Abhiroop Mukhopadhyay, and Tridip Ray
123
C H A P T E R 4
Against this background, our study of the economic costs of HIV andAIDS in India relates to two different strands of literature on the eco-nomic implications of HIV and AIDS.
• Studies estimating the aggregate economic impact of HIV and AIDS.The most important approaches under this heading are (1) studiesfocusing on the impacts on GDP or GDP per capita, and (2) studiesestimating welfare costs, which are defined more broadly, includingby making explicit allowance for the impacts of HIV and AIDS onmortality.
• Studies focusing on the household-level effects of HIV and AIDS.Findings from such studies frequently accentuate not only the highcosts of HIV and AIDS to the affected households and individuals, butalso differences in the vulnerability to and the impacts of HIV acrosspopulation groups.
Our study draws from and builds on both of these strands of literature. Interms of the theoretical framework, it is related to prior studies using anexplicit utility framework to capture the welfare costs of increased mortal-ity (see the discussion by Haacker, this volume). One important shortcom-ing of these approaches is that they put strong emphasis on the welfareeffects of increased mortality, while estimates of the impacts of HIV andAIDS based on household surveys typically suggest a much more compleximpact on the well-being of household members.
Meanwhile, much of the evidence of the impacts of HIV and AIDSobtained from household surveys is indirect. One reason for this is that,owing to the generally low HIV prevalence in South Asia, household stud-ies include few questions that offer direct insights regarding the impactsof HIV and AIDS. For example, much of our understanding of the impli-cations of HIV and AIDS on orphanhood or widowhood derives fromstudies focusing on the status of orphans and widows in general, but arenot specific to HIV and AIDS.
Our study provides added value relative to both of these strands ofliterature. First, we offer a theoretical framework that captures more ofthe richness of the impacts of HIV and AIDS evident from householdsurveys. A key aspect of the impacts of HIV and AIDS in this frameworkis the impact on “mental health” (as opposed to physical health), whichwe measure based on survey responses regarding the subjective well-being of respondents. Second, our survey is designed from the outset to
124 Das, Mukhopadhyay and Ray
capture the multiple impacts of HIV and AIDS. In addition to data on theeconomic impacts and consequences of HIV and AIDS (income, medicalexpenditure, wealth), we obtain measures of the impact of HIV and AIDSon both mental health and physical health.
The chapter is organized as follows. We start out by discussing in moredetail the context of our chapter in terms of the available studies of theeconomic impacts of HIV and AIDS in terms of the impacts on growth,GDP, or income, and in terms of the broader welfare effects (typicallyfocusing on increased mortality). Additionally, we also introduce some ofthe literature from which our notion of “mental health” draws. This sec-tion is followed by a summary of our findings from a survey of householdsaffected by HIV and AIDS. This is followed by an outline of the model usedto analyze the costs of HIV and AIDS to the households affected, and asection describing the process of estimating the costs of HIV and AIDS andpresenting our findings. A concluding section closes the chapter.
Context
Most of the studies projecting the impact of HIV and AIDS on the growthrate of per capita GDP use some version of the neoclassical growth modeland typically estimate declines of 0.5 percent to 1.5 percent, even for theworst affected countries with more than 20 percent HIV prevalencerates.1 For countries like India, with an HIV prevalence rate of less than0.5 percent, this translates into very small effects of HIV and AIDS ongrowth (see Haacker, this volume). Somewhat differently, Young (2005)emphasizes the decline of fertility associated with the HIV epidemic.Using South African data, he estimated that the positive effects of lowerpopulation growth on real wages would be strong enough to offset otheradverse effects.
A growing body of relatively recent literature (see, for example, Ferreiraand Pessoa 2003; Bell, Devarajan, and Gersbach 2004, 2006; Corrigan,Gloom, and Mendez 2004, 2005) emphasizes the transmission of humancapital across generations and concludes that by disrupting the mechanismthat drives the process of the transmission of knowledge and abilities fromone generation to the next, the AIDS epidemic will result in a substantialslowdown of economic growth. Part of the analysis relies on the dynamicimplication of the mechanism that AIDS lowers investment in humancapital of children since “. . . the expected pay-off ( from this investment)depends on the level of premature mortality among the children when they
Economic Cost of HIV AND AIDS in India 125

attain adulthood” (see Bell, Devarajan, and Gersbach 2006, page 59; ouritalics). This mechanism may be applicable for high-prevalence countriessuch as South Africa, but is not quite relevant for India, with a prevalencerate of just 0.36 percent and where there are many other compelling rea-sons for not sending children to school. Overall, it thus appears likely thatthe adverse impacts of HIV and AIDS on economic growth or GDP percapita in India will remain limited.
A different approach estimated the welfare impacts of HIV and AIDSas a decline in the utility that can be derived from a consumption streamover the lifetime of an individual. Using this type of model, Crafts andHaacker (2003, 2004) find that the primary impact of HIV and AIDSarises from its impacts on mortality (reducing the expected duration ofthe lifetime consumption stream). For India, Haacker (this volume), usingthis approach, estimates that the annual welfare costs of HIV and AIDSamount to around 3 percent of GDP, much higher than any estimates ofthe impact of HIV and AIDS on GDP.2
However, this approach is also not very well suited to capture the com-plexities and the implications of the impacts of HIV and AIDS at thehousehold level. The most significant household survey regarding theimpacts of HIV and AIDS in India to date is the one by Pradhan and oth-ers (2006, also discussed by Haacker, this volume). Their findings high-light the adverse impacts of HIV and AIDS in particular on householdsin poorer wealth quintiles and on widows affected by HIV and AIDS.More generally (not specific to India), studies using household data finda considerable impact of HIV and AIDS on income, consumption, andchildren’s education. Booysen and Bachmann (2002) find that the declinein per capita income in HIV households in South Africa is 40 percent to50 percent. while the fall in per capita food expenditure is 20 percent to30 percent. In Indonesia, Gertler et al. (2003) find that death of a malein his prime is associated with a 27 percent reduction in mean per capitahousehold consumption. Many studies have reported a negative impactof HIV and AIDS on children’s schooling. Deininger et al. (2003) showthat foster children were at a distinct disadvantage in both primary andsecondary school attendance before introduction of universal primaryeducation. Gertler et al. (2003) find that orphans are less likely to startschool and more likely to drop out. Yamano and Jayne (2005) and Evansand Miguel (2005) find the negative impact of adult mortality on schoolattendance of children to be more severe in poor households.
Finally, we provide some background that motivates our interest inintegrating mental health in the evaluation of the welfare costs of HIV
126 Das, Mukhopadhyay and Ray

and AIDS. Most directly, counselors and doctors working with HIVpatients in India are unanimous in their opinion that the psychologicaland emotional costs on the HIV patients and their families are enormous.The medical science literature has long appreciated this aspect of termi-nal illnesses (see, for example, Emanuel et al. 2000; Grunfeld et al. 2004for some recent work). In social sciences, this is related to an emergingbody of literature on happiness and mental well-being (see, among oth-ers, Easterlin 1974, 2003; Blanchflower and Oswald 2004, 2007; Clarkand Oswald 1997; Frey and Stulzer 2002; Gilbert 2006; Graham 2007;Helliwell 2006; Kahneman et al. 2006; Layard 2005; Lucas et al. 2004;Smith et al. 2005; Ubel et al. 2005). The mental well-being research isproven to be well suited in situations with limited information on welfareeffects of unemployment, divorce, smoking, and so on. This approach canbe used to evaluate effects of HIV and AIDS on significant fear of earlydeath and stigma. While researchers have worked in painstaking details toinvestigate the determinants of happiness and mental well-being (see, forexample, Andres 2004; Blanchflower and Oswald 2004, 2007; Case andDeaton 2006; Helliwell 2006), very little research has been done to quan-tify the value of mental health.3 Given the importance of the psycholog-ical and emotional costs, the HIV experience in India gives us this uniqueopportunity to integrate mental health in welfare evaluation and to quan-tify its significance in welfare loss of the family.
A Survey of Households Affected by HIV and AIDS
In light of the low level of HIV prevalence in the population, oursampling process involves identifying households affected by HIVand AIDS through networks of physicians. The control group of “non-HIV households” is based on interviews of households from similarlocations (villages, residential clusters). This process and other issuesregarding the sampling process are discussed among our considerationsregarding data collection. The presentation of our findings then pro-ceeds in two steps. First, we present data on socioeconomic characteris-tics of individuals and families affected by HIV and AIDS. Second, wediscuss our findings regarding variables included in the survey to serveas indicators of the impact of HIV and AIDS, such as measures of phys-ical health, mental health, or the impact of HIV and AIDS on thehousehold’s labor supply and income. Our discussion is rounded outby a presentation of several case studies of households affected byHIV and AIDS (box 4.1).
Economic Cost of HIV AND AIDS in India 127
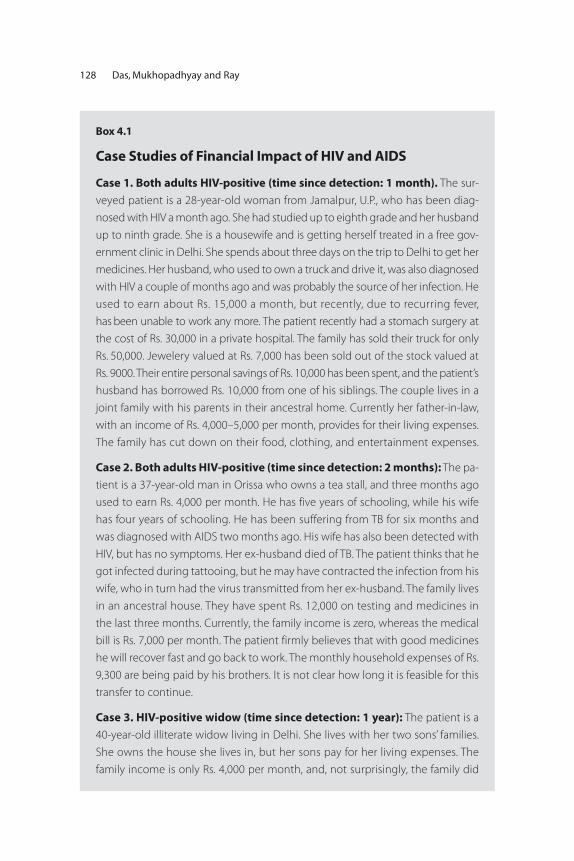
128 Das, Mukhopadhyay and Ray
Box 4.1
Case Studies of Financial Impact of HIV and AIDS
Case 1. Both adults HIV-positive (time since detection: 1 month). The sur-
veyed patient is a 28-year-old woman from Jamalpur, U.P., who has been diag-
nosed with HIV a month ago. She had studied up to eighth grade and her husband
up to ninth grade. She is a housewife and is getting herself treated in a free gov-
ernment clinic in Delhi. She spends about three days on the trip to Delhi to get her
medicines. Her husband, who used to own a truck and drive it, was also diagnosed
with HIV a couple of months ago and was probably the source of her infection. He
used to earn about Rs. 15,000 a month, but recently, due to recurring fever,
has been unable to work any more. The patient recently had a stomach surgery at
the cost of Rs. 30,000 in a private hospital. The family has sold their truck for only
Rs. 50,000. Jewelery valued at Rs. 7,000 has been sold out of the stock valued at
Rs. 9000. Their entire personal savings of Rs. 10,000 has been spent, and the patient’s
husband has borrowed Rs. 10,000 from one of his siblings. The couple lives in a
joint family with his parents in their ancestral home. Currently her father-in-law,
with an income of Rs. 4,000–5,000 per month, provides for their living expenses.
The family has cut down on their food, clothing, and entertainment expenses.
Case 2. Both adults HIV-positive (time since detection: 2 months): The pa-
tient is a 37-year-old man in Orissa who owns a tea stall, and three months ago
used to earn Rs. 4,000 per month. He has five years of schooling, while his wife
has four years of schooling. He has been suffering from TB for six months and
was diagnosed with AIDS two months ago. His wife has also been detected with
HIV, but has no symptoms. Her ex-husband died of TB. The patient thinks that he
got infected during tattooing, but he may have contracted the infection from his
wife, who in turn had the virus transmitted from her ex-husband. The family lives
in an ancestral house. They have spent Rs. 12,000 on testing and medicines in
the last three months. Currently, the family income is zero, whereas the medical
bill is Rs. 7,000 per month. The patient firmly believes that with good medicines
he will recover fast and go back to work. The monthly household expenses of Rs.
9,300 are being paid by his brothers. It is not clear how long it is feasible for this
transfer to continue.
Case 3. HIV-positive widow (time since detection: 1 year): The patient is a
40-year-old illiterate widow living in Delhi. She lives with her two sons’ families.
She owns the house she lives in, but her sons pay for her living expenses. The
family income is only Rs. 4,000 per month, and, not surprisingly, the family did
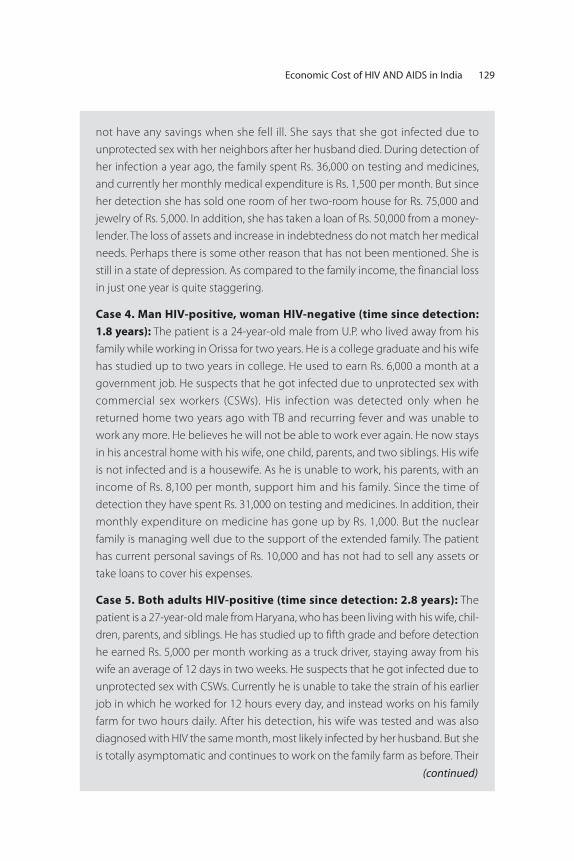
Economic Cost of HIV AND AIDS in India 129
not have any savings when she fell ill. She says that she got infected due to
unprotected sex with her neighbors after her husband died. During detection of
her infection a year ago, the family spent Rs. 36,000 on testing and medicines,
and currently her monthly medical expenditure is Rs. 1,500 per month. But since
her detection she has sold one room of her two-room house for Rs. 75,000 and
jewelry of Rs. 5,000. In addition, she has taken a loan of Rs. 50,000 from a money-
lender. The loss of assets and increase in indebtedness do not match her medical
needs. Perhaps there is some other reason that has not been mentioned. She is
still in a state of depression. As compared to the family income, the financial loss
in just one year is quite staggering.
Case 4. Man HIV-positive, woman HIV-negative (time since detection:
1.8 years): The patient is a 24-year-old male from U.P. who lived away from his
family while working in Orissa for two years. He is a college graduate and his wife
has studied up to two years in college. He used to earn Rs. 6,000 a month at a
government job. He suspects that he got infected due to unprotected sex with
commercial sex workers (CSWs). His infection was detected only when he
returned home two years ago with TB and recurring fever and was unable to
work any more. He believes he will not be able to work ever again. He now stays
in his ancestral home with his wife, one child, parents, and two siblings. His wife
is not infected and is a housewife. As he is unable to work, his parents, with an
income of Rs. 8,100 per month, support him and his family. Since the time of
detection they have spent Rs. 31,000 on testing and medicines. In addition, their
monthly expenditure on medicine has gone up by Rs. 1,000. But the nuclear
family is managing well due to the support of the extended family. The patient
has current personal savings of Rs. 10,000 and has not had to sell any assets or
take loans to cover his expenses.
Case 5. Both adults HIV-positive (time since detection: 2.8 years): The
patient is a 27-year-old male from Haryana, who has been living with his wife, chil-
dren, parents, and siblings. He has studied up to fifth grade and before detection
he earned Rs. 5,000 per month working as a truck driver, staying away from his
wife an average of 12 days in two weeks. He suspects that he got infected due to
unprotected sex with CSWs. Currently he is unable to take the strain of his earlier
job in which he worked for 12 hours every day, and instead works on his family
farm for two hours daily. After his detection, his wife was tested and was also
diagnosed with HIV the same month, most likely infected by her husband. But she
is totally asymptomatic and continues to work on the family farm as before. Their
(continued)
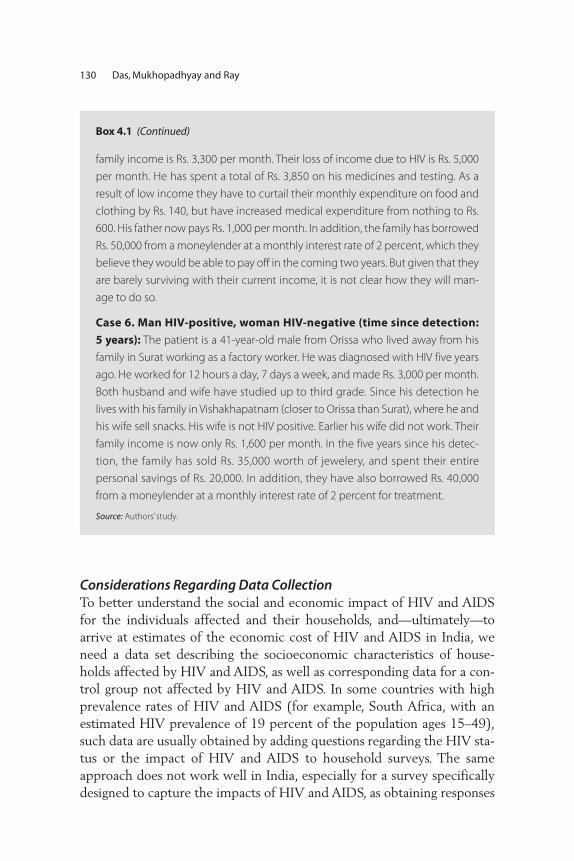
130 Das, Mukhopadhyay and Ray
Box 4.1 (Continued)
family income is Rs. 3,300 per month. Their loss of income due to HIV is Rs. 5,000
per month. He has spent a total of Rs. 3,850 on his medicines and testing. As a
result of low income they have to curtail their monthly expenditure on food and
clothing by Rs. 140, but have increased medical expenditure from nothing to Rs.
600. His father now pays Rs. 1,000 per month. In addition, the family has borrowed
Rs. 50,000 from a moneylender at a monthly interest rate of 2 percent, which they
believe they would be able to pay off in the coming two years. But given that they
are barely surviving with their current income, it is not clear how they will man-
age to do so.
Case 6. Man HIV-positive, woman HIV-negative (time since detection:
5 years): The patient is a 41-year-old male from Orissa who lived away from his
family in Surat working as a factory worker. He was diagnosed with HIV five years
ago. He worked for 12 hours a day, 7 days a week, and made Rs. 3,000 per month.
Both husband and wife have studied up to third grade. Since his detection he
lives with his family in Vishakhapatnam (closer to Orissa than Surat), where he and
his wife sell snacks. His wife is not HIV positive. Earlier his wife did not work. Their
family income is now only Rs. 1,600 per month. In the five years since his detec-
tion, the family has sold Rs. 35,000 worth of jewelery, and spent their entire
personal savings of Rs. 20,000. In addition, they have also borrowed Rs. 40,000
from a moneylender at a monthly interest rate of 2 percent for treatment.
Source: Authors’ study.
Considerations Regarding Data CollectionTo better understand the social and economic impact of HIV and AIDSfor the individuals affected and their households, and—ultimately—toarrive at estimates of the economic cost of HIV and AIDS in India, weneed a data set describing the socioeconomic characteristics of house-holds affected by HIV and AIDS, as well as corresponding data for a con-trol group not affected by HIV and AIDS. In some countries with highprevalence rates of HIV and AIDS (for example, South Africa, with anestimated HIV prevalence of 19 percent of the population ages 15–49),such data are usually obtained by adding questions regarding the HIV sta-tus or the impact of HIV and AIDS to household surveys. The sameapproach does not work well in India, especially for a survey specificallydesigned to capture the impacts of HIV and AIDS, as obtaining responses
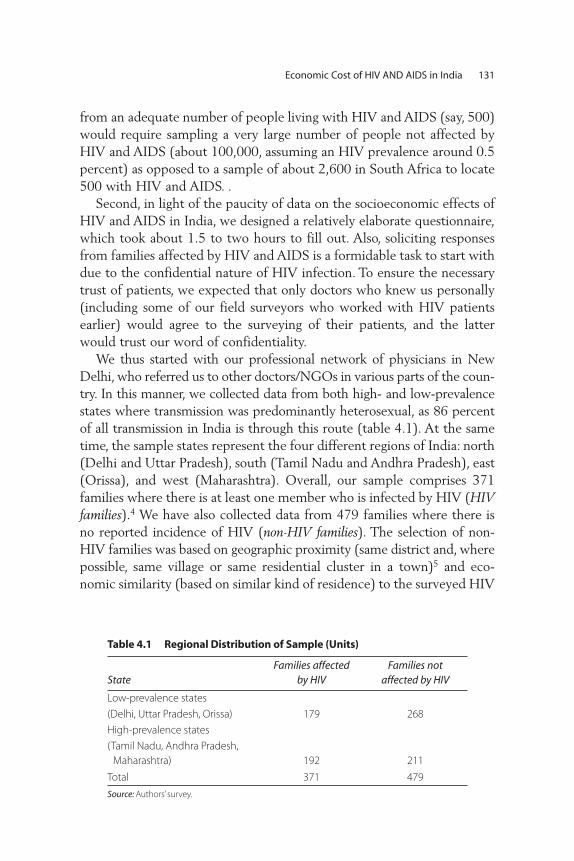
Economic Cost of HIV AND AIDS in India 131
Table 4.1 Regional Distribution of Sample (Units)
StateFamilies affected
by HIVFamilies not
affected by HIV
Low-prevalence states
(Delhi, Uttar Pradesh, Orissa) 179 268
High-prevalence states
(Tamil Nadu, Andhra Pradesh,
Maharashtra) 192 211
Total 371 479
Source: Authors’ survey.
from an adequate number of people living with HIV and AIDS (say, 500)would require sampling a very large number of people not affected byHIV and AIDS (about 100,000, assuming an HIV prevalence around 0.5percent) as opposed to a sample of about 2,600 in South Africa to locate500 with HIV and AIDS. .
Second, in light of the paucity of data on the socioeconomic effects ofHIV and AIDS in India, we designed a relatively elaborate questionnaire,which took about 1.5 to two hours to fill out. Also, soliciting responsesfrom families affected by HIV and AIDS is a formidable task to start withdue to the confidential nature of HIV infection. To ensure the necessarytrust of patients, we expected that only doctors who knew us personally(including some of our field surveyors who worked with HIV patientsearlier) would agree to the surveying of their patients, and the latterwould trust our word of confidentiality.
We thus started with our professional network of physicians in NewDelhi, who referred us to other doctors/NGOs in various parts of the coun-try. In this manner, we collected data from both high- and low-prevalencestates where transmission was predominantly heterosexual, as 86 percentof all transmission in India is through this route (table 4.1). At the sametime, the sample states represent the four different regions of India: north(Delhi and Uttar Pradesh), south (Tamil Nadu and Andhra Pradesh), east(Orissa), and west (Maharashtra). Overall, our sample comprises 371families where there is at least one member who is infected by HIV (HIVfamilies).4 We have also collected data from 479 families where there isno reported incidence of HIV (non-HIV families). The selection of non-HIV families was based on geographic proximity (same district and, wherepossible, same village or same residential cluster in a town)5 and eco-nomic similarity (based on similar kind of residence) to the surveyed HIV
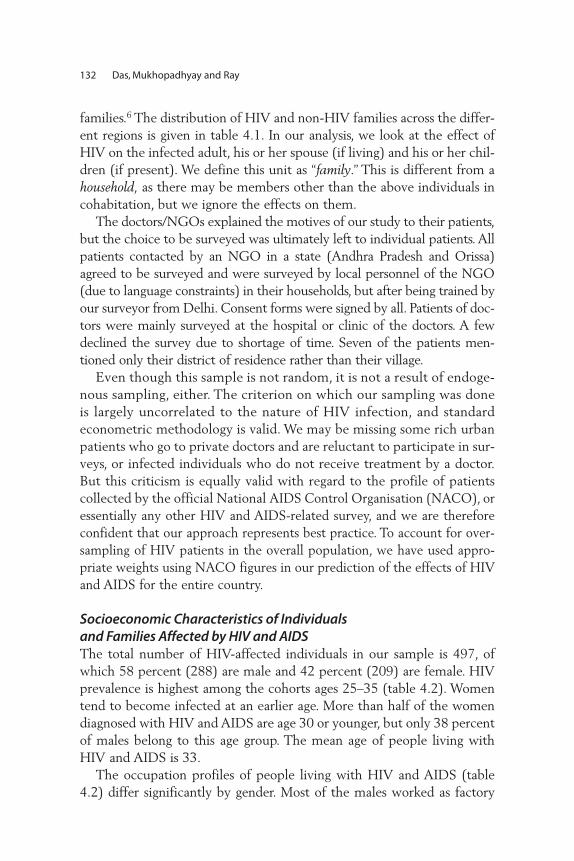
families.6 The distribution of HIV and non-HIV families across the differ-ent regions is given in table 4.1. In our analysis, we look at the effect ofHIV on the infected adult, his or her spouse (if living) and his or her chil-dren (if present). We define this unit as “family.” This is different from ahousehold, as there may be members other than the above individuals incohabitation, but we ignore the effects on them.
The doctors/NGOs explained the motives of our study to their patients,but the choice to be surveyed was ultimately left to individual patients. Allpatients contacted by an NGO in a state (Andhra Pradesh and Orissa)agreed to be surveyed and were surveyed by local personnel of the NGO(due to language constraints) in their households, but after being trained byour surveyor from Delhi. Consent forms were signed by all. Patients of doc-tors were mainly surveyed at the hospital or clinic of the doctors. A fewdeclined the survey due to shortage of time. Seven of the patients men-tioned only their district of residence rather than their village.
Even though this sample is not random, it is not a result of endoge-nous sampling, either. The criterion on which our sampling was doneis largely uncorrelated to the nature of HIV infection, and standardeconometric methodology is valid. We may be missing some rich urbanpatients who go to private doctors and are reluctant to participate in sur-veys, or infected individuals who do not receive treatment by a doctor.But this criticism is equally valid with regard to the profile of patientscollected by the official National AIDS Control Organisation (NACO), oressentially any other HIV and AIDS - related survey, and we are thereforeconfident that our approach represents best practice. To account for over-sampling of HIV patients in the overall population, we have used appro-priate weights using NACO figures in our prediction of the effects of HIVand AIDS for the entire country.
Socioeconomic Characteristics of Individuals and Families Affected by HIV and AIDSThe total number of HIV-affected individuals in our sample is 497, ofwhich 58 percent (288) are male and 42 percent (209) are female. HIVprevalence is highest among the cohorts ages 25–35 (table 4.2). Womentend to become infected at an earlier age. More than half of the womendiagnosed with HIV and AIDS are age 30 or younger, but only 38 percentof males belong to this age group. The mean age of people living withHIV and AIDS is 33.
The occupation profiles of people living with HIV and AIDS (table4.2) differ significantly by gender. Most of the males worked as factory
132 Das, Mukhopadhyay and Ray
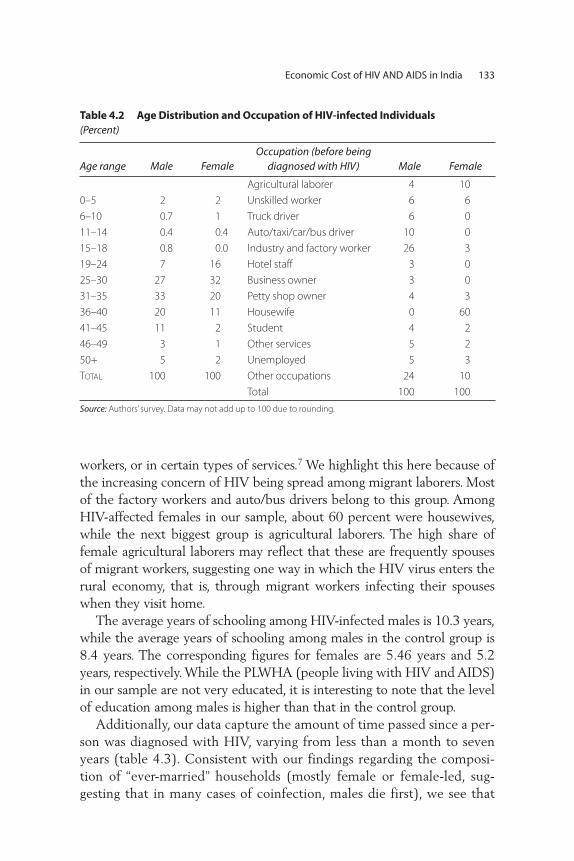
workers, or in certain types of services.7 We highlight this here because ofthe increasing concern of HIV being spread among migrant laborers. Mostof the factory workers and auto/bus drivers belong to this group. AmongHIV-affected females in our sample, about 60 percent were housewives,while the next biggest group is agricultural laborers. The high share offemale agricultural laborers may reflect that these are frequently spousesof migrant workers, suggesting one way in which the HIV virus enters therural economy, that is, through migrant workers infecting their spouseswhen they visit home.
The average years of schooling among HIV-infected males is 10.3 years,while the average years of schooling among males in the control group is8.4 years. The corresponding figures for females are 5.46 years and 5.2years, respectively. While the PLWHA (people living with HIV and AIDS)in our sample are not very educated, it is interesting to note that the levelof education among males is higher than that in the control group.
Additionally, our data capture the amount of time passed since a per-son was diagnosed with HIV, varying from less than a month to sevenyears (table 4.3). Consistent with our findings regarding the composi-tion of “ever-married” households (mostly female or female-led, sug-gesting that in many cases of coinfection, males die first), we see that
Economic Cost of HIV AND AIDS in India 133
Table 4.2 Age Distribution and Occupation of HIV-infected Individuals (Percent)
Age range Male FemaleOccupation (before being
diagnosed with HIV) Male Female
Agricultural laborer 4 10
0–5 2 2 Unskilled worker 6 6
6–10 0.7 1 Truck driver 6 0
11–14 0.4 0.4 Auto/taxi/car/bus driver 10 0
15–18 0.8 0.0 Industry and factory worker 26 3
19–24 7 16 Hotel staff 3 0
25–30 27 32 Business owner 3 0
31–35 33 20 Petty shop owner 4 3
36–40 20 11 Housewife 0 60
41–45 11 2 Student 4 2
46–49 3 1 Other services 5 2
50+ 5 2 Unemployed 5 3
TOTAL 100 100 Other occupations 24 10
Total 100 100
Source: Authors’ survey. Data may not add up to 100 due to rounding.
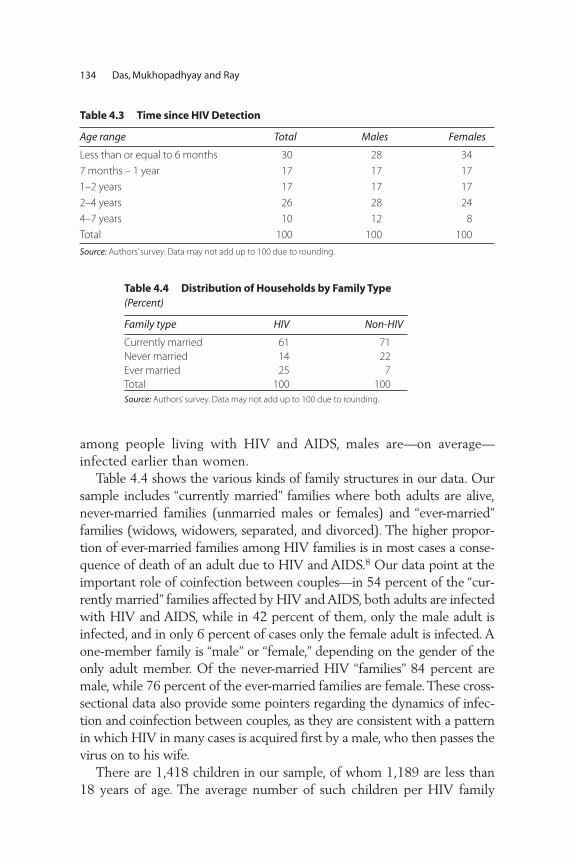
among people living with HIV and AIDS, males are—on average—infected earlier than women.
Table 4.4 shows the various kinds of family structures in our data. Oursample includes “currently married” families where both adults are alive,never-married families (unmarried males or females) and “ever-married”families (widows, widowers, separated, and divorced). The higher propor-tion of ever-married families among HIV families is in most cases a conse-quence of death of an adult due to HIV and AIDS.8 Our data point at theimportant role of coinfection between couples—in 54 percent of the “cur-rently married” families affected by HIV and AIDS, both adults are infectedwith HIV and AIDS, while in 42 percent of them, only the male adult isinfected, and in only 6 percent of cases only the female adult is infected. Aone-member family is “male” or “female,” depending on the gender of theonly adult member. Of the never-married HIV “families” 84 percent aremale, while 76 percent of the ever-married families are female. These cross-sectional data also provide some pointers regarding the dynamics of infec-tion and coinfection between couples, as they are consistent with a patternin which HIV in many cases is acquired first by a male, who then passes thevirus on to his wife.
There are 1,418 children in our sample, of whom 1,189 are less than18 years of age. The average number of such children per HIV family
134 Das, Mukhopadhyay and Ray
Table 4.3 Time since HIV Detection
Age range Total Males Females
Less than or equal to 6 months 30 28 34
7 months – 1 year 17 17 17
1–2 years 17 17 17
2–4 years 26 28 24
4–7 years 10 12 8
Total 100 100 100
Source: Authors’ survey. Data may not add up to 100 due to rounding.
Table 4.4 Distribution of Households by Family Type (Percent)
Family type HIV Non-HIV
Currently married 61 71
Never married 14 22
Ever married 25 7
Total 100 100
Source: Authors’ survey. Data may not add up to 100 due to rounding.
(among families who have children) is 2.16, while the average number ofsuch children per non-HIV family is 2.22. We assume that parents makedecisions for children who are 18 years old or younger, and that childrenolder than 18 are able to make decisions for themselves. For obvious rea-sons, schooling decisions are considered only for children of age 6 andolder. The total number of such children is 892. Among HIV families, theaverage number of such children is 1.9, while the corresponding numberfor non-HIV families is 2.1.
Indicators of the Impact of HIV and AIDSWhile the preceding section focused on indicators of the socioeconomicstructure of families and individuals affected by HIV and AIDS, thepresent section discusses findings regarding variables that capture theimpacts of HIV and AIDS on health, well-being, and the economic sta-tus of those affected.
Physical health status (H). The survey asked a number of questions onthe occurrence of common symptoms of infection (fever, diarrhea, coughand cold, loss of appetite, general body ache, headache), and regardingsome diseases and symptoms that are seen more often in HIV patientsthan non-HIV, such as tuberculosis, oral ulcers, and genital ulcers. The ref-erence period for the above symptoms was the last three months.9
Given the symptoms, we enlisted an expert on HIV and AIDS assess-ment and treatment at a government antiretroviral treatment (ART) clinic,who assigned a numerical index based on the symptoms for all of the HIVand non-HIV respondents. This study uses that index as a measure of mor-bidity. The index ranges from 1 to 11, with 11 being the healthiest and 1being the worst health. Where possible, we also tried to measure heightand weight of individuals to be able to calculate a body mass index (BMI),which is commonly used as a measure of physical health. We also askedHIV patients to recall their normal weight before HIV detection, but inmany cases where we felt the patient was not sure we did not record hisor her weight. Table 4.5 summarizes various health indices by gender andHIV status.
Our data suggest a moderate decline in BMI following detection, anda lower BMI for people living with HIV and AIDS relative to the non-HIV group. However, none of these differences are statistically significantat a 5 percent confidence level. The health index based on morbidity issignificantly lower for HIV individuals as compared to that of non-HIVindividuals (t value of 16.5; significant at 1 percent under the alternative
Economic Cost of HIV AND AIDS in India 135
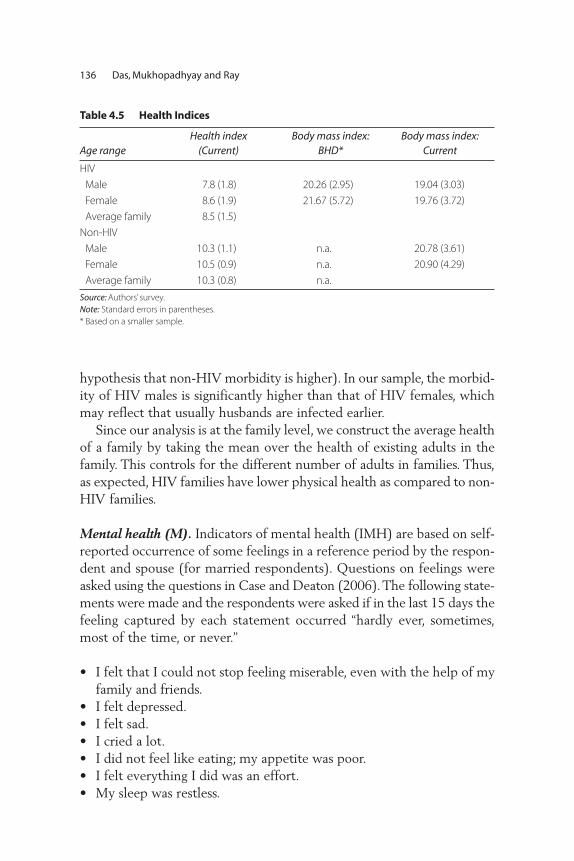
hypothesis that non-HIV morbidity is higher). In our sample, the morbid-ity of HIV males is significantly higher than that of HIV females, whichmay reflect that usually husbands are infected earlier.
Since our analysis is at the family level, we construct the average healthof a family by taking the mean over the health of existing adults in thefamily. This controls for the different number of adults in families. Thus,as expected, HIV families have lower physical health as compared to non-HIV families.
Mental health (M). Indicators of mental health (IMH) are based on self-reported occurrence of some feelings in a reference period by the respon-dent and spouse (for married respondents). Questions on feelings wereasked using the questions in Case and Deaton (2006). The following state-ments were made and the respondents were asked if in the last 15 days thefeeling captured by each statement occurred “hardly ever, sometimes,most of the time, or never.”
• I felt that I could not stop feeling miserable, even with the help of myfamily and friends.
• I felt depressed.• I felt sad.• I cried a lot. • I did not feel like eating; my appetite was poor.• I felt everything I did was an effort. • My sleep was restless.
136 Das, Mukhopadhyay and Ray
Table 4.5 Health Indices
Age rangeHealth index
(Current)Body mass index:
BHD*Body mass index:
Current
HIV
Male 7.8 (1.8) 20.26 (2.95) 19.04 (3.03)
Female 8.6 (1.9) 21.67 (5.72) 19.76 (3.72)
Average family 8.5 (1.5)
Non-HIV
Male 10.3 (1.1) n.a. 20.78 (3.61)
Female 10.5 (0.9) n.a. 20.90 (4.29)
Average family 10.3 (0.8) n.a.
Source: Authors’ survey.
Note: Standard errors in parentheses.
* Based on a smaller sample.
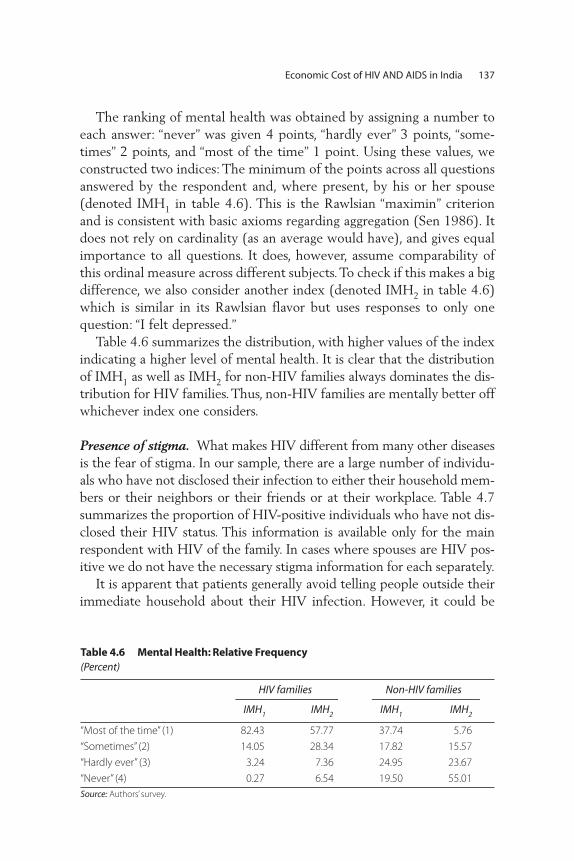
The ranking of mental health was obtained by assigning a number toeach answer: “never” was given 4 points, “hardly ever” 3 points, “some-times” 2 points, and “most of the time” 1 point. Using these values, weconstructed two indices: The minimum of the points across all questionsanswered by the respondent and, where present, by his or her spouse(denoted IMH1 in table 4.6). This is the Rawlsian “maximin” criterionand is consistent with basic axioms regarding aggregation (Sen 1986). Itdoes not rely on cardinality (as an average would have), and gives equalimportance to all questions. It does, however, assume comparability ofthis ordinal measure across different subjects. To check if this makes a bigdifference, we also consider another index (denoted IMH2 in table 4.6)which is similar in its Rawlsian flavor but uses responses to only onequestion: “I felt depressed.”
Table 4.6 summarizes the distribution, with higher values of the indexindicating a higher level of mental health. It is clear that the distributionof IMH1 as well as IMH2 for non-HIV families always dominates the dis-tribution for HIV families. Thus, non-HIV families are mentally better offwhichever index one considers.
Presence of stigma. What makes HIV different from many other diseasesis the fear of stigma. In our sample, there are a large number of individu-als who have not disclosed their infection to either their household mem-bers or their neighbors or their friends or at their workplace. Table 4.7summarizes the proportion of HIV-positive individuals who have not dis-closed their HIV status. This information is available only for the mainrespondent with HIV of the family. In cases where spouses are HIV pos-itive we do not have the necessary stigma information for each separately.
It is apparent that patients generally avoid telling people outside theirimmediate household about their HIV infection. However, it could be
Economic Cost of HIV AND AIDS in India 137
Table 4.6 Mental Health: Relative Frequency (Percent)
HIV families Non-HIV families
IMH1 IMH2 IMH1 IMH2
“Most of the time” (1) 82.43 57.77 37.74 5.76
“Sometimes” (2) 14.05 28.34 17.82 15.57
“Hardly ever” (3) 3.24 7.36 24.95 23.67
“Never” (4) 0.27 6.54 19.50 55.01
Source: Authors’ survey.

argued that this is merely a personal choice and not because of fear of dis-crimination. In our sample, among those who chose not to tell some ofthe above list of people, 64 percent reported that they did not do sobecause of one of the following reasons:
• They would think I was a person with bad moral values.• They would force me to leave the community.• My family would get a bad name.• They would reject my whole family.
Thus the fear of stigma is not unfounded.
Labor supply. Our data regarding the employment status of people liv-ing with HIV and AIDS illustrate the impact of HIV and AIDS, but alsothe differences in the socioeconomic status of men and women. Table 4.8shows that, for an employed HIV-positive male, the probability ofbecoming unemployed upon the HIV-positive status being detected andthe workplace finding out is 20 percent. While some of that is offset bymales who have gained employment since being diagnosed with HIV, thedata point to a negative impact of HIV and AIDS on employment.Similarly, the sample unemployment rate among males living with HIVand AIDS (13 percent) is much higher than the rate of 5 percent for thisgroup before being diagnosed with HIV (table 4.8). The picture forwomen is different: 21 of the 132 women living in families with HIV andAIDS who were unemployed or housewives before detection subse-quently gained employment. One key factor behind this appears to be theloss of an income earner in the family, as 13 of these 21 women were wid-ows.
Table 4.9 shows a similar picture. As expected, the health status ofnon-HIV males supplying labor outside the household is higher than formales living with HIV and AIDS, as well as for the non-HIV males whodo not supply labor outside of the household. While the causality behindthis correlation may run either way, we note that the gap between those
138 Das, Mukhopadhyay and Ray
Table 4.7 HIV Patients Who Do Not Disclose Their Infection (Percent)
Not disclosed to household members 25
Not disclosed to neighbors 74
Not disclosed to friends 72
Not disclosed at the workplace 85
Source: Authors’ survey.

supplying labor and those who don’t is much higher for people livingwith HIV and AIDS, suggesting that the impaired health status is causingthe withdrawal from the labor market. For women, the health status ofthe group not supplying labor outside the household is somewhathigher than for those supplying labor outside the household, especiallyfor women living with HIV and not supplying labor. This may reflectthat the group not supplying labor is dominated by women fromwealthier households, who withdraw from the labor market voluntarilyand are in a better position to cope with the impact of the epidemic.
The effect of HIV can also be observed in terms of the quality of laborthat is supplied. Table 4.10 highlights the self-reported effects on concen-tration during work and on problem-solving abilities. While in the shortrun these may not affect the wage earnings of the employed, they defi-nitely affect their productivity and hence will affect the economy. Since
Economic Cost of HIV AND AIDS in India 139
Table 4.8 Transition in Employment Status Following HIV Diagnosis (Percent)
Probability of Changing Status to:
Status before HIV diagnosis; Employed Unemployed Housewife
Employed
Males 80 20 0
Females 90 8 2
Unemployed
Males 7 93 0
Females 29 71 0
Housewife
Nonwidow 11 0 89
Widow 35 0 65
Proportion of people living with HIV
and AIDS by different status 74 15 11
Source: Authors’ survey.
Table 4.9 State of Health by HIV Status and Gender (index)
Non-HIV HIV
Male labor supply is positive 10.34 (0.97) 8.09 (1.72)
Male labor supply is zero 10.08 (1.66) 7.02 (2.03)
Female labor supply is positive 10.45 (0.99) 8.53 (1.75)
Female labor supply is zero 10.57 (0.82) 8.72 (2.00)
Source: Authors’ survey.
Note: Standard errors in parentheses. For details on the definition of the health index, see the discussion of the
physical health status and table 4.5 above.
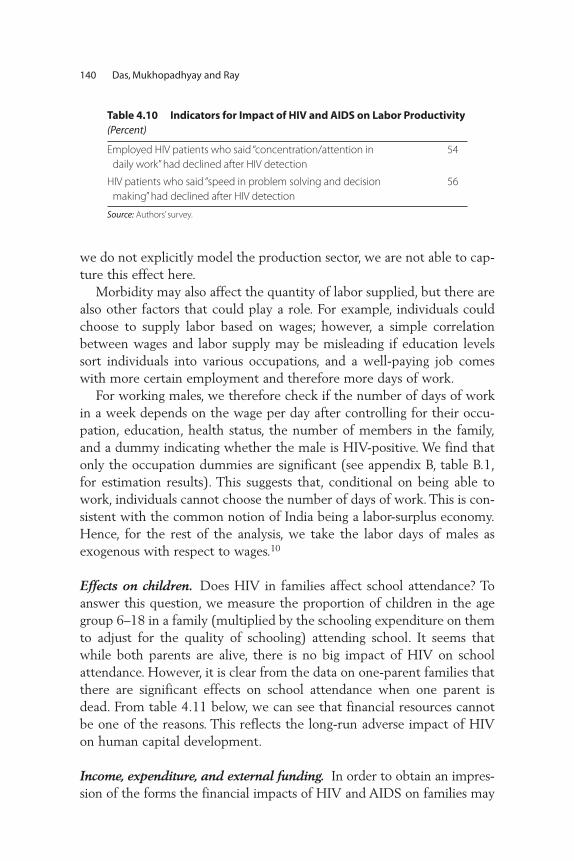
we do not explicitly model the production sector, we are not able to cap-ture this effect here.
Morbidity may also affect the quantity of labor supplied, but there arealso other factors that could play a role. For example, individuals couldchoose to supply labor based on wages; however, a simple correlationbetween wages and labor supply may be misleading if education levelssort individuals into various occupations, and a well-paying job comeswith more certain employment and therefore more days of work.
For working males, we therefore check if the number of days of workin a week depends on the wage per day after controlling for their occu-pation, education, health status, the number of members in the family,and a dummy indicating whether the male is HIV-positive. We find thatonly the occupation dummies are significant (see appendix B, table B.1,for estimation results). This suggests that, conditional on being able towork, individuals cannot choose the number of days of work. This is con-sistent with the common notion of India being a labor-surplus economy.Hence, for the rest of the analysis, we take the labor days of males asexogenous with respect to wages.10
Effects on children. Does HIV in families affect school attendance? Toanswer this question, we measure the proportion of children in the agegroup 6–18 in a family (multiplied by the schooling expenditure on themto adjust for the quality of schooling) attending school. It seems thatwhile both parents are alive, there is no big impact of HIV on schoolattendance. However, it is clear from the data on one-parent families thatthere are significant effects on school attendance when one parent isdead. From table 4.11 below, we can see that financial resources cannotbe one of the reasons. This reflects the long-run adverse impact of HIVon human capital development.
Income, expenditure, and external funding. In order to obtain an impres-sion of the forms the financial impacts of HIV and AIDS on families may
140 Das, Mukhopadhyay and Ray
Table 4.10 Indicators for Impact of HIV and AIDS on Labor Productivity (Percent)
Employed HIV patients who said “concentration/attention in
daily work” had declined after HIV detection
54
HIV patients who said “speed in problem solving and decision
making” had declined after HIV detection
56
Source: Authors’ survey.
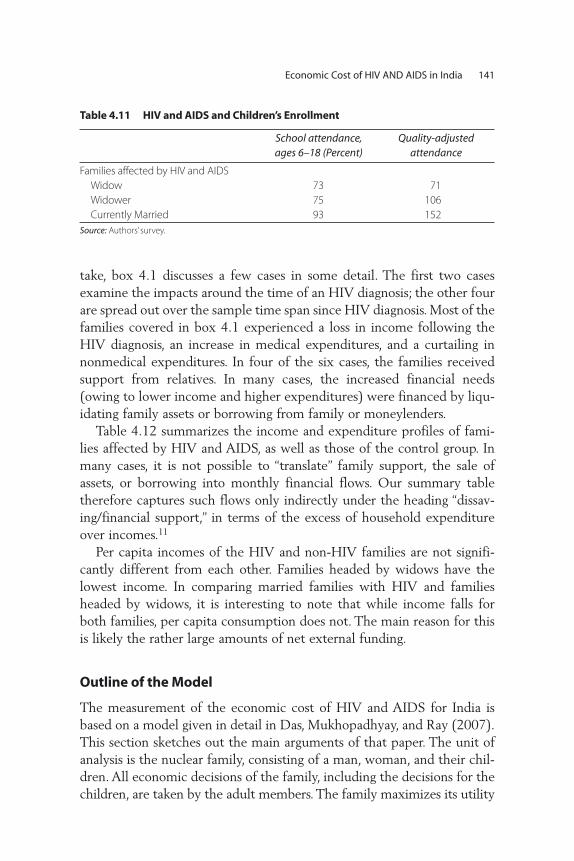
take, box 4.1 discusses a few cases in some detail. The first two casesexamine the impacts around the time of an HIV diagnosis; the other fourare spread out over the sample time span since HIV diagnosis. Most of thefamilies covered in box 4.1 experienced a loss in income following theHIV diagnosis, an increase in medical expenditures, and a curtailing innonmedical expenditures. In four of the six cases, the families receivedsupport from relatives. In many cases, the increased financial needs(owing to lower income and higher expenditures) were financed by liqu -idating family assets or borrowing from family or moneylenders.
Table 4.12 summarizes the income and expenditure profiles of fami-lies affected by HIV and AIDS, as well as those of the control group. Inmany cases, it is not possible to “translate” family support, the sale ofassets, or borrowing into monthly financial flows. Our summary tabletherefore captures such flows only indirectly under the heading “dissav-ing/financial support,” in terms of the excess of household expenditureover incomes.11
Per capita incomes of the HIV and non-HIV families are not signifi-cantly different from each other. Families headed by widows have thelowest income. In comparing married families with HIV and familiesheaded by widows, it is interesting to note that while income falls forboth families, per capita consumption does not. The main reason for thisis likely the rather large amounts of net external funding.
Outline of the Model
The measurement of the economic cost of HIV and AIDS for India isbased on a model given in detail in Das, Mukhopadhyay, and Ray (2007).This section sketches out the main arguments of that paper. The unit ofanalysis is the nuclear family, consisting of a man, woman, and their chil-dren. All economic decisions of the family, including the decisions for thechildren, are taken by the adult members. The family maximizes its utility
Economic Cost of HIV AND AIDS in India 141
Table 4.11 HIV and AIDS and Children’s Enrollment
School attendance,ages 6–18 (Percent)
Quality-adjusted attendance
Families affected by HIV and AIDS
Widow 73 71
Widower 75 106
Currently Married 93 152
Source: Authors’ survey.
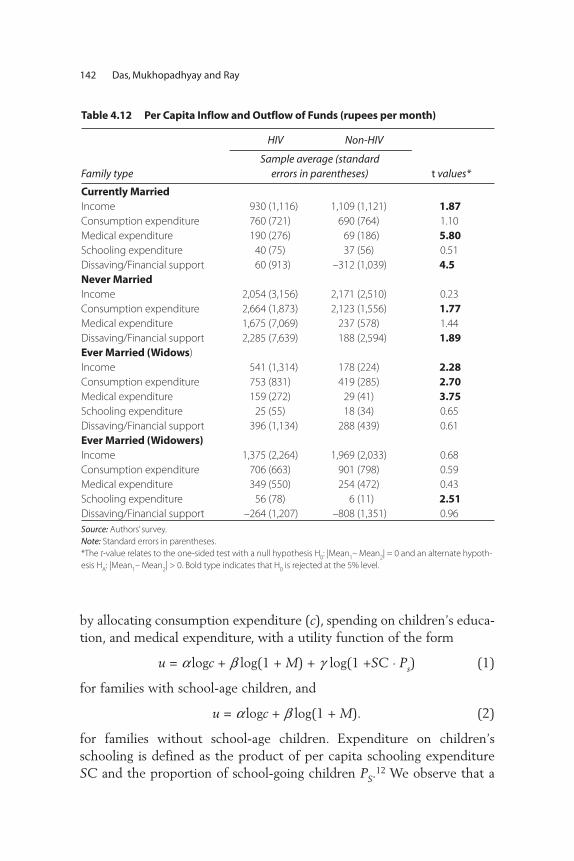
by allocating consumption expenditure (c), spending on children’s educa-tion, and medical expenditure, with a utility function of the form
u = a logc + b log(1 + M) + g log(1 +SC . Ps) (1)
for families with school-age children, and
u = a logc + b log(1 + M). (2)
for families without school-age children. Expenditure on children’sschooling is defined as the product of per capita schooling expenditureSC and the proportion of school-going children PS.
12 We observe that a
142 Das, Mukhopadhyay and Ray
Table 4.12 Per Capita Inflow and Outflow of Funds (rupees per month)
HIV Non-HIV
Family typeSample average (standard
errors in parentheses) t values*
Currently Married
Income 930 (1,116) 1,109 (1,121) 1.87
Consumption expenditure 760 (721) 690 (764) 1.10
Medical expenditure 190 (276) 69 (186) 5.80
Schooling expenditure 40 (75) 37 (56) 0.51
Dissaving/Financial support 60 (913) –312 (1,039) 4.5
Never Married
Income 2,054 (3,156) 2,171 (2,510) 0.23
Consumption expenditure 2,664 (1,873) 2,123 (1,556) 1.77
Medical expenditure 1,675 (7,069) 237 (578) 1.44
Dissaving/Financial support 2,285 (7,639) 188 (2,594) 1.89
Ever Married (Widows)
Income 541 (1,314) 178 (224) 2.28
Consumption expenditure 753 (831) 419 (285) 2.70
Medical expenditure 159 (272) 29 (41) 3.75
Schooling expenditure 25 (55) 18 (34) 0.65
Dissaving/Financial support 396 (1,134) 288 (439) 0.61
Ever Married (Widowers)
Income 1,375 (2,264) 1,969 (2,033) 0.68
Consumption expenditure 706 (663) 901 (798) 0.59
Medical expenditure 349 (550) 254 (472) 0.43
Schooling expenditure 56 (78) 6 (11) 2.51
Dissaving/Financial support –264 (1,207) –808 (1,351) 0.96
Source: Authors’ survey.
Note: Standard errors in parentheses.
*The t-value relates to the one-sided test with a null hypothesis H0: |Mean
1– Mean
2| = 0 and an alternate hypoth-
esis HA: |Mean
1– Mean
2| > 0. Bold type indicates that H
0is rejected at the 5% level.
significant proportion of families in our sample (48 percent) do not haveany children. We assume that these families do not put any weight onchildren’s education, and hence maximize their utility only with respectto consumption and medical expenditure. Medical expenditure (md)enters the households’ utility function indirectly as it affects the level ofmental health (M), which is determined by
M = d0 + d1. md + d2
. H + d3HIV + l . X. (3)
Specifically, the link between medical expenditure and mental healthmay reflect the positive effect on expected future health for a given levelof current health. Other key factors affecting mental health are the stateof physical health H and whether a household is affected by HIV andAIDS (captured by an HIV dummy), as well as other household charac-teristics captured by the vector X (such as wealth, employment status,age, and gender) used in the recent literature on mental health and sub-jective well-being.13
Estimating the Costs of HIV and AIDS
In all our estimated equations we have pooled the relevant HIV and non-HIV samples. Since we have oversampled the former, we put low weightson those observations and higher weights on the non-HIV observations, soas to be representative of the Indian population (for details see Das et al.).The weights are computed using the overall prevalence data of the IIPS(2007) and the gender composition that is available from the NationalAIDS Control Organisation’s last annual report.
We first estimate the mental health technology for all types of fami-lies for both indices of mental health—minimum mental health based onresponses to all questions (IMH1), and minimum mental health based onthe question “I felt depressed” (IMH2). Note that our mental health dataare in discrete form, whereas the utility function uses a continuousmeasure. We easily obtain a continuous measure from the underlyinglatent variable obtained by estimating the mental health equation byordered probit, which is appropriate for our observed ordered discretemeasure of mental health. This is what we use in our utility function andempirical analysis below.
For both IMH1 and IMH2, better current health leads to better mentalhealth. As hypothesized, controlling for health or HIV status, the higherthe medical expenditure, the higher is mental health. This is an important
Economic Cost of HIV AND AIDS in India 143
result for our model. We also find that HIV infection affects mentalhealth negatively, irrespective of which measure one chooses. For the restof the analysis, we report the results based on the mental health measureIMH1 as it is a comprehensive measure based on all questions asked relat-ing to mental health.
Given the continuous mental health measure, we then estimate theparameters of the optimum conditions of utility maximization separatelyfor families with and without school-age children. In each case we poolHIV and non-HIV families. These estimates pin down our indirect utilityfunctions for the families. Then the impact of the HIV epidemic at thefamily level is calculated by comparing the indirect utility functions ofthe families affected by HIV and AIDS with those of families notaffected. To distinguish among different types of families, we representthe status of a family by the vector (i,j), with i representing the maleadult, and j the female adult. The markers i or j can take the values +, –, 0,or na to indicate whether the respective family member is HIV-positive(+), HIV-negative (–), deceased (0), or not available for unmarried, one-adult families. The position of na is determined by the missing gender inthe family adult vector.
Let V (i, j)(S) denote the indirect utility function when the family HIVstatus is (i,j), as defined above.14 The loss to the country then is:
where m(i, j) stands for the measure of families with HIV status (i, j). Tocalculate the amount that would be required to compensate a family forthe losses associated with HIV and AIDS, we introduce the parameter t todenote the hypothetical transfer that is needed to equate the indirect util-ity of a given type of HIV family with the reference non-HIV family. Inother words, the monetary equivalent of the loss to the family (i,j) is givenby the transfer (t (i,j)) measuring the compensating variation to the family(i, j) and is defined by:
V (i, j)(S|t) = V (–,–)(S|0)–15.
Our findings are summarized in figure 4.1 and table 4.13. First, in termsof the direct impacts of HIV on mental health, we find that most of thereduced mental health can be attributed to impaired physical health(table 4.5) and to the HIV dummy, which may capture the implicationsfor future health as well as some of the economic repercussions discussed
V S V S d i, ji,j
i,j
( ) (
( )
( ) ( ) ( )− − −( )∫ , ) ,⋅ μ
144 Das, Mukhopadhyay and Ray

above. The impact of HIV and AIDS can therefore be summarized as acontraction in the combinations of mental health on one hand, andspending on consumption and schooling on the other hand, which canbe attained by the household, with the shift from A to D in figure 4.1representing this direct impact. As a consequence of this shift, the house-hold, after reallocating its expenditures, may find itself at point B, repre-senting a lower level of utility than before. To return to its previous levelof utility, it would require a transfer corresponding to the distancebetween points B and C (compensating variation).16
Economic Cost of HIV AND AIDS in India 145
Figure 4.1 Estimating the Cost of HIV/AIDS
mental health(M)
AC
B
D
spen
din
g o
n c
on
sum
pti
on
and
sch
oo
ling
Source: Authors’ calculation.
Table 4.13 Losses by Family Types
Utility loss (per family per month):
IMH1 (Rs)
Utility loss (per family per month):
IMH2 (Rs)
Loss from transfers(per family per
month) (Rs)
Currently Married
Only male HIV 85,727 89,631 1,363
Only female HIV 68,502 83,658 574
Both HIV 91,663 101,266 1,327
Ever Married
Widow HIV 94,394 106,063 2,214
Widower HIV 78,764 61,808 901
Never Married
Males 86,324 61,039 2,084
Females 87,148 99,655 2,134
Source: Authors’ estimates.

Table 4.13 reports the money equivalent of welfare losses in the firsttwo columns for both measures of mental health, in terms of the compen-sating variation illustrated in figure 4.1. We use a married non-HIV familyas the reference group because being a widow, a widower, or unmarriedcan be a consequence of HIV infection. The losses for each category areweighed by the sample proportions of families with children and withoutchildren to calculate the current loss to each kind of family.
Table 4.13 shows that in the case of “currently married” families, the loss(using either measure), as expected, is greatest when both members areHIV positive. The highest loss among all family types occurs for widows liv-ing with HIV and AIDS or widow-led families. For this group, the adverseimpacts of HIV and AIDS are exacerbated by a drop in family income.
In the last column of table 4.13, we report the losses associated withdissaving for each type of family (again with married non-HIV families asthe reference group). These are positive because of lower savings orbecause of increases in money transfers from relatives. We treat these aslosses as they represent reductions in the material wealth of the respectivehouseholds due to loss of labor income and increased medical expendi-ture. These losses are the highest for the unmarried families and widows.
In order to obtain estimates of the costs of HIV and AIDS for all of India,we need to “scale up” our family-level estimates. However, we only haveestimates of the total number of males and females living with HIV andAIDS in India, but no breakdown across the different types of “HIV” fami-lies listed above. We therefore use our estimates to impute the loss for malesand females in our sample, and then impute estimates for India, assumingthat the distribution of various family types is the same as in our data. Tothis end, we first compute the loss to each family (depending on its type).For married couples with one infected member, widow, widowers, andunmarried individuals, we ascribe the whole loss to the infected member.For married couples where both members are infected, we split the lossequally between both members. We then add up all the losses for our sam-ple, and derive the loss per male and per female. We then scale these up inproportion to the number of HIV-positive males and females in India.
The total loss (using IMH1) per month is Rs. 67,601 for a male livingwith HIV and AIDS and Rs. 65,120 for a female (the respective figuresusing IMH2 are Rs. 76,986 for males and Rs. 84,272 for females). Basedon a total number of 1.55 million males and 950,000 females living withHIV and AIDS in India,17 this implies that the loss to the male popula-tion living with HIV and AIDS in India (using IMH1) is Rs. 104.78 billionper month, and that for the female population is Rs. 61.86 billion per
146 Das, Mukhopadhyay and Ray

month, adding up to a total of Rs. 166.64 billion per month. The totalannual cost of HIV and AIDS per year, with 0.36 percent of the popula-tion affected, comes out at Rs. 1,999.8 billion (7 percent of GDP), whichis more than the annual health expenditure of Rs. 1,356 billion (2004) forall ailments in India!
One obvious point of comparison for our findings is the literature esti-mating the costs of increased mortality. Haacker (this volume) summa-rizes this literature, and estimates these costs at about 3 percent of GDPfor India (based on the most recent data on HIV prevalence), a similarorder of magnitude (though somewhat lower) as our estimates. While itmay be tempting, on the face of it, to add up these estimates of theimpacts of increased mortality and our findings of the costs of HIV andAIDS based on mental health, the two approaches overlap more thanit appears at first sight. First, mortality-based estimates such as the onesdiscussed and applied by Haacker are based on valuations of mortalityrisks implied by data on wages and professional mortality risks. However,these underlying estimates do not generally separate the adverse effects ofthe possibility of premature death and the expectation of a period of sick-ness; the estimated impacts of the welfare effects of increased mortalitytherefore also capture an increased expectation of sickness. Second, ourestimates of mental health likely also capture the expectation of a pre-mature death. Against this background, the fact that the two differentapproaches return broadly similar estimates of the costs of HIV andAIDS is encouraging.18
Concluding Remarks
Using primary household data, we estimate household utility functionparameters that measure the relative importance of consumption, school-ing of children, and mental and physical health effects of HIV and AIDSin India. Since mental health is not directly observable, we first computean ordinal measure based on a series of questions following Case andDeaton (2006). Then we use an ordered probit model to obtain a contin-uous measure, which is then used to estimate the parameters of the fam-ily utility function. The welfare loss due to HIV is then obtained using theprinciple of willingness to pay to come up to the utility level of non-HIVmarried families, used as the benchmark.
We find that mental health effects are far more important than the effectof consumption or children’s schooling in determining utility and the totalwelfare loss per month. The total annual loss for the entire country exceeds
Economic Cost of HIV AND AIDS in India 147
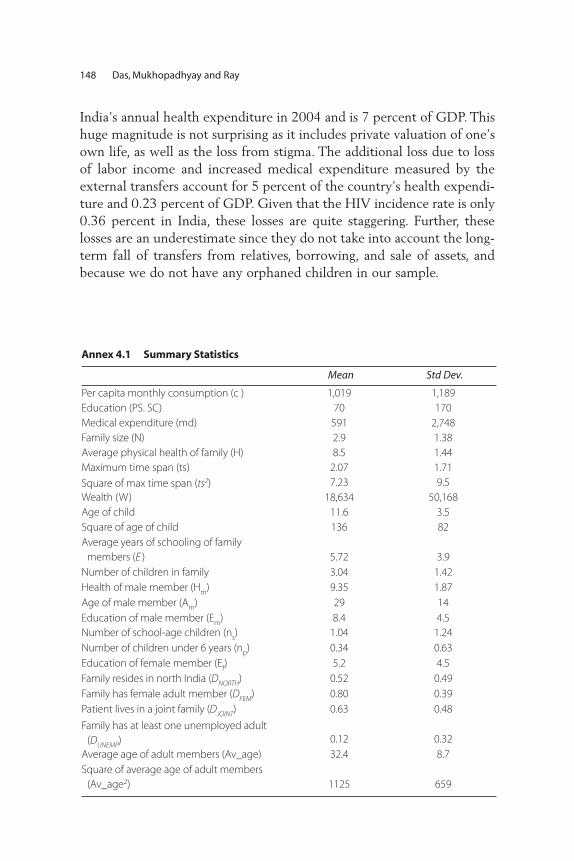
India’s annual health expenditure in 2004 and is 7 percent of GDP. Thishuge magnitude is not surprising as it includes private valuation of one’sown life, as well as the loss from stigma. The additional loss due to lossof labor income and increased medical expenditure measured by theexternal transfers account for 5 percent of the country’s health expendi-ture and 0.23 percent of GDP. Given that the HIV incidence rate is only0.36 percent in India, these losses are quite staggering. Further, theselosses are an underestimate since they do not take into account the long-term fall of transfers from relatives, borrowing, and sale of assets, andbecause we do not have any orphaned children in our sample.
148 Das, Mukhopadhyay and Ray
Annex 4.1 Summary Statistics
Mean Std Dev.
Per capita monthly consumption (c ) 1,019 1,189
Education (PS. SC) 70 170
Medical expenditure (md) 591 2,748
Family size (N) 2.9 1.38
Average physical health of family (H) 8.5 1.44
Maximum time span (ts) 2.07 1.71
Square of max time span (ts2) 7.23 9.5
Wealth (W) 18,634 50,168
Age of child 11.6 3.5
Square of age of child 136 82
Average years of schooling of family
members (E ) 5.72 3.9
Number of children in family 3.04 1.42
Health of male member (Hm
) 9.35 1.87
Age of male member (Am
) 29 14
Education of male member (Em
) 8.4 4.5
Number of school-age children (ns) 1.04 1.24
Number of children under 6 years (np) 0.34 0.63
Education of female member (Ef) 5.2 4.5
Family resides in north India (DNORTH) 0.52 0.49
Family has female adult member (DFEM) 0.80 0.39
Patient lives in a joint family (DJOINT) 0.63 0.48
Family has at least one unemployed adult
(DUNEMP) 0.12 0.32
Average age of adult members (Av_age) 32.4 8.7
Square of average age of adult members
(Av_age2) 1125 659

Notes
1. See, for example, Kambou, Devarajan, and Over (1992); Cuddington (1993aand 1993b); Cuddington and Hancock (1994); Bloom and Mahal (1997);Arndt and Lewis (2000); Bonnel (2000); and the Joint United NationsProgramme on HIV and AIDS (UNAIDS 2004). Recent reviews of this liter-ature can be found in Haacker (2004), Bell, Devarajan, and Gersbach (2006),and Corrigan, Gloom, and Mendez (2005).
2. Other papers using a similar approach include Bell (2005) and Philipson andSoares (2005).
3. Blanchflower and Oswald (2004) is the only work we are aware of that hasused the coefficients of a subjective well-being equation to estimate welfarelosses from incidents like divorce or unemployment. We compare our workwith Blanchflower and Oswald (2004) in section 9.
4. Since an extremely small proportion of HIV patients in India get direct sup-port from NGOs such as YRG CARE in Tamil Nadu, where the HIV familieslive in an HIV community, we did not survey such families even though wecould have done so relatively easily.
Economic Cost of HIV AND AIDS in India 149
Annex 4.2 Determinants of Male Labor Supply
Male Labor Supply (p-values)
Male wage (wm) –0.005 (0.603)
Male education (Em) –0.01 (0.198)
Female education (Ef) 0.007 (0.488)
W 0.0000006 (0.41)
Health of male (Hm) 0.0055 (0.84)
Number of school-age children (ns) 0.02 (0.447)
D (Male member is HIV = 1) –0.111 (0.173)
D (Unskilled laborer = 1) 0.59 (0.013)
D (Truck driver = 1 ) 0.77 (0.017)
D (Auto driver = 1 ) 0.84 (0.00)
D (Industry and factory workers = 1) 0.75 (0.00)
D (Hotel staff = 1) 0.79 (0.00)
D (Business owners = 1) 0.60 (0.04)
D (Shopkeepers = 1) 1.07 (0.00)
D (Service sector = 1) 0.65 (0.02)
D (Self-employed = 1) 0.57 (0.07)
D (Agriculture = 1) 1.58 (0.00)
D (Others = 1) 0.762 (0.00)
Number of observations
R2
642
0.12
Source: Authors’ survey and calculations
Note: Unskilled labor excludes agriculture laborers.
5. In Delhi and Maharashtra, HIV patients were surveyed in the hospitals. Wehave home addresses of all these patients except seven for whom we haveonly the district. Hence in most cases it was feasible to sample non-HIV fam-ilies from the same neighborhoods. In a few exceptions, the non-HIV familieswere sampled from neighborhoods with similar wealth levels in the same dis-tricts as the patients.
6. Since the data have not been collected to calculate prevalence, the propor-tions of HIV to non-HIV families should not be used to deduce prevalence.
7. We do not report current occupation data here as that is endogenous. Whilewe do not use recall data for most of our analysis as it is unreliable, it isunlikely that the occupation before HIV detection will be misreported.Hence we use this part of the recall data.
8. While in many cases widows do not list AIDS as the reason for death of theirspouse, they mention diseases like TB, which make it likely that the spousedid suffer from HIV but it was not detected.
9. We are aware that health experts are in favor of much shorter referenceperiods, for example last 15 days. We extended the period to pick up thefact that PLWHA do, on the average, have higher morbidity but go throughperiods of “normal” health and so we wanted a long enough period to pickup this difference.
10. It appears unreasonable to assume that in mainstream Indian society, notworking is a choice for males, and only 6 percent of males not infected withHIV (who are less health constrained than those living with HIV and AIDS)do not work. Female labor supply is ignored because, as seen in table 4.2, 65percent of them did not work before HIV detection in the family, and after itonly a few do so.
11. Apart from labor income, in some cases, there are rental incomes, which weadd to calculate total income of a family.
12. Proportion seems to be the right weight rather than the total number.Multiplying with the total number has the undesirable property that it givesundue advantage to having more children. We focus on the quality of a rep-resentative child.
13. While medical expenditures can be considered to improve health, poor healthtriggers higher medical expenditures. Consequently, medical expenditure andcurrent health are negatively correlated in our sample. With our data set, weare not able to disentangle these two effects and therefore treat the currentstate of health as predetermined.
14. Here S stands for all the exogenous variables in the model: S = (Y, H, N, ns,W, ts, DHIV, DFEM, DJOINT, Av_age).
15. We do not differentiate between the equivalent variation (an income lossequivalent to the welfare loss associated with the impacts of HIV and AIDS
150 Das, Mukhopadhyay and Ray

on economic status, physical health, and mental health) and the compensat-ing variation (a transfer that would return the household to the same utilitylevel as it enjoyed before the onset of HIV and AIDS, because the log-linearstructure of the utility function, coupled with the linear mental health speci-fication, mean that these two measures coincide.
16. Differences in the composition of households would change the shape of theindifference curves in figure 4.1. As we find that such changes have a minorimpact on our findings, figure 4.1, for illustrative purposes, abstracts fromthis effect.
17. This assumption is in line with the latest estimates of the total number of peo-ple living with HIV and AIDS in India (2.5 million), while assuming the samebreakdown by sex as NACO.
18. Another reference point is the literature attempting to quantify subjectivewell-being. For example, Blanchflower and Oswald (2004) estimate large fig-ures for welfare loss associated with adverse events. For example, they esti-mate that a typical individual in the United States or Britain would needUS$100,000 per annum to compensate for the loss in well-being resultingfrom divorce. The corresponding figure for job loss for an average male isUS$60,000 per annum.
References
Arndt, C., and J.D. Lewis. 2000. “The Macro Implications of HIV/AIDS in SouthAfrica: A Preliminary Assessment.” South African Journal of Economics 68 (5):856–87.
Andres, A.R. 2004. “Determinants of Self-reported Mental Health Using theBritish Household Panel Survey.” Journal of Mental Health Policy andEconomics 7(3): 99–106.
Bell, C. 2005. “Estimating the Costs of Sickness and Premature Adult Mortality.”Mimeo, South Asia Institute, University of Heidelberg, Heidelberg, Germany.
Bell, C., S. Devarajan, and H. Gersbach. 2004. “Thinking about the Long-RunEconomic Costs of AIDS.” In The Macroeconomics of HIV/AIDS, ed. MarkusHaacker, 96–133 Washington, DC: International Monetary Fund.
Bell, C., S. Devarajan, and H. Gersbach. 2003. “The Long-run Economic Costs ofAIDS: Theory and an Application to South Africa.” Policy Research WorkingPaper No. 3152, World Bank, Washington, DC.
Blanchflower, D.G., and A.J. Oswald. 2004. “Well-being over Time in Britain andthe USA.” Journal of Public Economics 88 (7-8): 1359–86.
Blanchflower, D.G., and A.J. Oswald. 2007. “Is Well-being U-shaped over the LifeCycle?” Working Paper No. 12935, National Bureau of Economic Research,Cambridge, MA.
Economic Cost of HIV AND AIDS in India 151
Bloom, D.E., and A.S. Mahal. 1997. “Does the AIDS Epidemic ThreatenEconomic Growth?” Journal of Econometrics 77 (1): 105–24.
Bonnel, R. 2000. “HIV/AIDS and Economic Growth: A Global Perspective.” SouthAfrican Journal of Economics 68 (5): 820–55.
Booysen, F. le R., and M. Bachmann. 2002. “HIV/AIDS, Poverty and Growth:Evidence from a Household Impact Study Conducted in the Free StateProvince, South Africa.” Paper presented at the annual conference of theCentre for the Study of African Economies, Oxford, March 18–19.
Case, A., and A. Deaton. 2006. “Health and Well-Being in Udaipur and SouthAfrica.” Working paper, Princeton University, Princeton, N.J.
Clark, A., and A. Oswald. 1997. “Happiness and Economic Performance.” EconomicJournal 107 (445): 1815–31.
Corrigan, P., G. Glomm, and F. Mendez. 2005. “AIDS Crisis and Growth.” Journalof Development Economics 77 (1): 107–24.
Corrigan, P., G. Glomm, and F. Mendez. 2004. “AIDS, Human Capital andGrowth.” Mimeo, Working Paper Series, Social Science Research Network.
Crafts, N., and M. Haacker. 2004. “Welfare Implications of HIV/AIDS.” In TheMacroeconomics of HIV/AIDS, ed. Markus Haacker, 182–97 Washington, DC:International Monetary Fund.
Cuddington, J.T. 1993a. “Modeling the Macroeconomic Effects of AIDS with anApplication to Tanzania.” World Bank Economic Review 7 (2): 173–89.
Cuddington, J.T. 1993b. “Further Results on the Macroeconomic Effects of AIDS:The Dualistic Labor-Surplus Economy.” World Bank Economic Review 7 (3):403–17.
Cuddington, J.T., and J.D. Hancock. 1994. “Assessing the Impact of AIDS on theGrowth Path of the Malawian Economy.” Journal of Developing Economics 43(2): 363–68.
Das, Sanghamitra, Abhiroop Mukhopadhyay, and Tridip Ray. 2007. “NegativeReality of the HIV Positives: Integrating Mental Health in Welfare Evaluation.”processed (Delhi: Indian Statistical Institute). Working paper, unpublished,Indian Statistical Institute, Delhi, India.
Deininger, K., M. Garcia, and K. Subbarao. 2003. “AIDS-Induced Orphanhood asa Systemic Shock: Magnitude, Impact and Program Interventions in Africa.”World Development 1201–20.
Easterlin, R. 1974. “Does Economic Growth Improve the Human Lot? SomeEmpirical Evidence.” In Nations and Households in Economic Growth, ed.P. David and M. Reder, 89–125. New York: Academic Press.
Easterlin, R. 2003. “Explaining Happiness.” Proceedings of the National Academy ofSciences 100 (19): 11176–83.
152 Das, Mukhopadhyay and Ray
Emanuel, E.J., D.L. Fairclough, J. Slutsman, and L.L. Emanuel. 2000. “UnderstandingEconomic and other Burdens of Terminal Illness: The Experience of Patientsand their Caregivers.” Annals of Internal Medicine 132 (6): 451–59.
Evans, D., and E. Miguel. 2005. “Orphans and Schooling in Africa: A LongitudinalAnalysis.” Working Paper No. C05–143, Centre for International andDevelopment Economics Research, University of California, Berkeley, CA.
Ferreira, C.P., and S. Pessoa. 2003. “The Long-Run Impact of AIDS.” Mimeo,Graduate School of Economics, Fundacao Getulio Vargas, Rio de Janeiro, Brazil.
Frey, B.S., and A. Stulzer. 2002. Happiness and Economics. Princeton, N.J.:Princeton University Press.
Gertler, P., S. Martinez, D. Levine, and S. Bertozzi. 2003. “Losing the Presenceand Presents of Parents: How Parental Death Affects Children.” Unpublishedworking paper. Gilbert, D. 2006. Stumbling on Happiness. New York: AlfredA Knopf.
Graham, C. 2008. “The Economics of Happiness.” In The New Palgrave Dictionaryof Economics, 2nd ed., ed. S. Durlauf and L. Blume.
Grunfeld, E., D. Coyle, T. Whelan, J. Clinch, L. Reyno, C.C. Earle, A. Willan,R. Viola, M. Coristine, T. Janz, and R. Glossop. 2004. “Family CaregiverBurden: Results of a Longitudinal Study of Breast Cancer Patients andtheir Principal Caregivers.” Canadian Medical Association Journal 170(12): 1795–1801.
Helliwell, J.F. 2006. “Well-being, Social Capital and Public Policy: What’s New?”Economic Journal 116 (510): C34–C45.
International Institute for Population Sciences (IIPS). 2007. “2005–2006 NationalFamily Health Survey (NFHS-3)—National Fact Sheet India (ProvisionalData).” IIPS, Deonar, Mumbai, India.
Kahneman, D., A.B. Krueger, D. Schkade, N. Schwarz, and A.A. Stone. 2006.“Would You be Happier if You were Richer? A Focusing illusion.” Science 312(5782): 1908–10.
Kambou, G., S. Devarajan, and M. Over. 1992. “The Economic Impact of AIDS inan African Country: Simulations with a General Equilibrium Model forCameroon.” Journal of African Economies: 1 (1): 109–30.
Layard, R. 2005. Happiness: Lessons from a New Science. London: Allen Lane.
Lucas, R.E., A.E. Clark, Y. Georgellis, and E. Diener. 2004. “Unemployment Altersthe Set Point for Life Satisfaction.” Psychological Science 15 (1): 8–13.
McDonald, S., and J. Roberts. 2006. “AIDS and Economic Growth: A HumanCapital Approach.” Journal of Development Economics 80 (1): 228–50.
National AIDS Control Organisation (NACO). Various years. Annual Reports.New Delhi: NACO. http://www.nacoonline.org/
Economic Cost of HIV AND AIDS in India 153
Pradhan, Basanta K., Ramamani Sundar, and Shalabh K. Singh. 2006. Socio-Economic Impact of HIV and AIDS in India. New Delhi, India: United NationsDevelopment Programme.
Sen, A. 1986. “Social Choice Theory.” Handbook of Mathematical Economics. 2nded., vol. 3, ed. K.J. Arrow and M.D. Intriligator, 1073–181. North Holland:Elsevier.
Smith, D.M., M. Langa, M.U. Kabeto, and P.A. Ubel. 2005. “Health, Wealth andHappiness.” Psychological Science 16 (9): 663–66.
Ubel, P.A., G. Loewenstein, and C. Jepson. 2005. “Disability and Sunshine: CanHedonic Predictions be Improved by Drawing Attention to Focusing Illusionsor Emotional Adaptation?” Journal of Experimental Psychology 11 (2): 111–23.
Yamano, T., and T.S. Jayne. 2005. “Working-Age Adult Mortality and PrimarySchool Attendance in Rural Kenya.” Economic Development and CulturalChange 53 (3): 619–53.
Young, A. 2005. “The Gift of the Dying: The Tragedy of Aids and the Welfare ofFuture African Generations.” Quarterly Journal of Economics 120 (2): 423–66.
154 Das, Mukhopadhyay and Ray
PA R T I I I
The Burden of HIV and AIDS on theHealth Sector

Introduction
In South Asia, HIV and AIDS are less prevalent than in Sub-SaharanAfrica or in severely affected countries of the Caribbean, SoutheastAsia, or the Pacific Islands. The slower spread of AIDS, combined with thefact that most South Asian countries have higher per capita incomes thanthe most severely affected countries of other regions, suggest that the var-ious impacts of the disease will be smaller in South Asia than in otherregions. While this conclusion is generally justified with respect to theimpact of the disease on economic output, poverty, or orphanhood, itdoes not necessarily follow with respect to the health sector, where par-ticular features of supply and demand can magnify the impact of anygiven rate of HIV infection.
Our analysis is broadly divided into two main parts. The first part ofthe chapter takes stock of the scale of the challenge to health sectorsin South Asia. This part sets out with an overview of the estimatednumbers of AIDS cases and the availability of treatment in South Asia(section 2), including a review of the available evidence regarding theprovision of antiretroviral therapy through public and private healthservices. Section 3 looks forward, providing new estimates of the costs ofAIDS treatment through the year 2020 for six South Asian countries,1
The Fiscal Burden of AIDS Treatmenton South Asian Health Care Systems
Mead Over
157
C H A P T E R 5

on the assumption that countries will attempt to provide universal accessto AIDS treatment.
The second part of the chapter considers the implications of specificfeatures of the supply and demand for health care in South Asia for theimpact of the projected increased demand for AIDS treatment on SouthAsian health sectors, focusing on the roles of private vs. public health careproviders. This emphasis reflects the fact that the public health systemsof the South Asian region provide a much smaller proportion of their cit-izens’ health care than do the systems of countries outside the region thatare severely affected by AIDS (section 4). With the notable exception ofSri Lanka, three-quarters or more of health expenditures in the region arefinanced privately, and little or none of the private payments are medi-ated by third-party payers like insurance agencies. The fact that much ofSouth Asia is poorly provided with public facilities or public sector healthfinances suggests that many of these people who would frequent publicfacilities in other countries will instead seek care from a nearby privatepractitioner, either modern or traditional.
In a context where public health services and third-party payers likeinsurance agencies play a relatively minor role, the high costs of ART haveimplications for access to such treatment and expose households to therisk of poverty. Section 5 discusses the impact of health expenditures onpoverty in general, and arrives at conjectures regarding the impacts ofHIV AND AIDS-related health expenditures on poverty.
Since AIDS treatment cannot be presumed to slow HIV transmissionand may speed it, the usual argument for paying for such treatmentwith public funds is on equity grounds—that it will prevent poverty andorphanhood. However, section 6 of this chapter argues that publiclyprovided AIDS treatment might crowd out lower-quality private AIDStreatment, thereby preventing some negative spillovers of poor-qualitytreat ment. The section reviews the evidence that suggests that thiseffect of public treatment might be sufficient to justify governmentsupport on efficiency grounds.
Finally, a concluding section summarizes the findings of the chapter,and suggests their policy implications for South Asian governments.
Overview of AIDS Cases and Treatment in South Asia
Knowledge of the burden of AIDS in South Asia became dramaticallymore precise with the release in 2006 of India’s first population-basedsurvey, which collected and analyzed blood samples in order to accurately
158 Over

measure the proportion of India’s population that is infected with HIV.Since India is the region’s largest country, the adjustment of its estimatedprevalence rate from almost 1 percent early in 2006 down to approxi-mately 0.3 percent after release of the survey has erased more than 3 mil-lion putative cases of HIV infection from the region.
In other chapters in this volume, the implications of this correction forthe epidemiology and the economic impact of AIDS in India are spelledout (Haacker, chapter 3; Claeson and Wilson, chapter 1). Here it is suffi-cient to note that a smaller prevalence rate means that the epidemic hascaused a smaller increase in the demand for health care than might pre-viously have been conjectured. Figure 5.1 repeats Haacker’s pie chart ofthe current burden of disease, showing that HIV and AIDS account for1.5 percent of all deaths in South Asia and about 2 percent of all deathsin India. Haacker (chapter 3) points out that these numbers of deaths arecomparable to the numbers from diabetes, tuberculosis, and measles.
What will these pie charts look like in the future? Recent evidencesuggests that, in accordance with the pattern typically observed during anepidemiologic transition, measles is declining as a cause of death in theregion, while diabetes and tuberculosis are both increasing. While dia-betes is a lifestyle disease associated with the increasing prevalence ofobesity, tuberculosis is an opportunistic illness that takes advantage ofweakened immune systems, and thus can be spread by AIDS. Thus, if HIVcontinues to spread at the rate it has in the past, it is likely to grow to besubstantially more important than measles and may outpace diabetes.Whether HIV or TB will grow faster will depend on the vigor of programsto prevent and treat them.
The Fiscal Burden of AIDS Treatment on South Asian Health Care Systems 159
Figure 5.1 South Asia and India: Contribution of HIV/AIDS to Mortality
South Asia
infectiousn.i.e.
noncom-municable
noncom-municable
injuries
HIV/AIDS
tubercu-losis
maternal,perinatal,
nutritional
maternal,perinatal,
nutritional
India
infectiousn.i.e.
injuries
HIV/AIDS
tubercu-losis
Source: Haacker (present volume).
Note: n.i.e. = not included elsewhere.
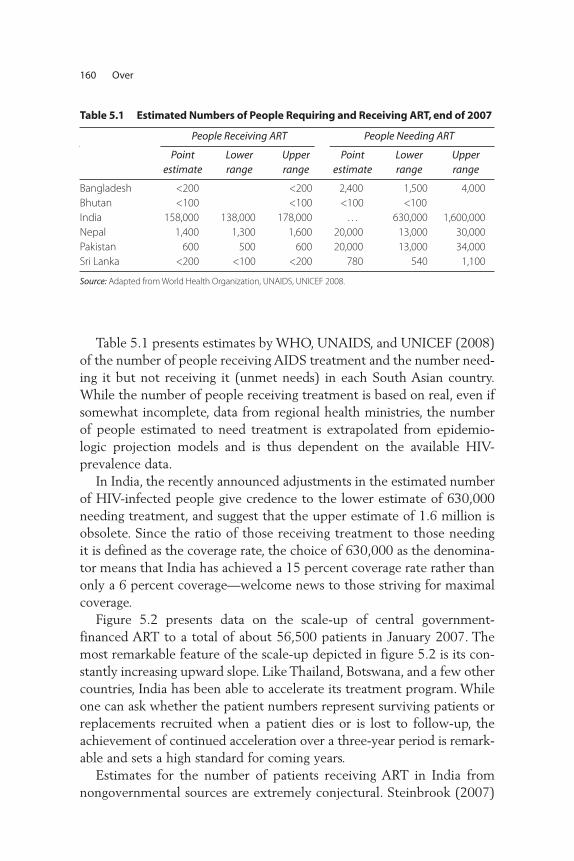
Table 5.1 presents estimates by WHO, UNAIDS, and UNICEF (2008)of the number of people receiving AIDS treatment and the number need-ing it but not receiving it (unmet needs) in each South Asian country.While the number of people receiving treatment is based on real, even ifsomewhat incomplete, data from regional health ministries, the numberof people estimated to need treatment is extrapolated from epidemio-logic projection models and is thus dependent on the available HIV-prevalence data.
In India, the recently announced adjustments in the estimated numberof HIV-infected people give credence to the lower estimate of 630,000needing treatment, and suggest that the upper estimate of 1.6 million isobsolete. Since the ratio of those receiving treatment to those needingit is defined as the coverage rate, the choice of 630,000 as the denomina-tor means that India has achieved a 15 percent coverage rate rather thanonly a 6 percent coverage—welcome news to those striving for maximalcoverage.
Figure 5.2 presents data on the scale-up of central government-financed ART to a total of about 56,500 patients in January 2007. Themost remarkable feature of the scale-up depicted in figure 5.2 is its con-stantly increasing upward slope. Like Thailand, Botswana, and a few othercountries, India has been able to accelerate its treatment program. Whileone can ask whether the patient numbers represent surviving patients orreplacements recruited when a patient dies or is lost to follow-up, theachievement of continued acceleration over a three-year period is remark -able and sets a high standard for coming years.
Estimates for the number of patients receiving ART in India fromnongovernmental sources are extremely conjectural. Steinbrook (2007)
160 Over
Table 5.1 Estimated Numbers of People Requiring and Receiving ART, end of 2007
People Receiving ART People Needing ART
Point estimate
Lowerrange
Upperrange
Point estimate
Lowerrange
Upperrange
Bangladesh <200 <200 2,400 1,500 4,000
Bhutan <100 <100 <100 <100
India 158,000 138,000 178,000 . . . 630,000 1,600,000
Nepal 1,400 1,300 1,600 20,000 13,000 30,000
Pakistan 600 500 600 20,000 13,000 34,000
Sri Lanka <200 <100 <200 780 540 1,100
Source: Adapted from World Health Organization, UNAIDS, UNICEF 2008.

estimates they number between 10,000 and 20,000. WHO’s April 2007progress report gives an estimate of 25,000 receiving ART in the unor-ganized or “unstructured” private health sector (see WHO, UNAIDS, andUNICEF 2007). This brings the estimated total under treatment in 2006to about 95,000. By December 2007, the updated WHO report esti-mates a total of 158,000 under treatment, including about 5,000 treatedby NGOs, and 35,000 in the for-profit private sector. Thus, for two yearsrunning, the Indian government has estimated that it is treating threeout of four Indian ART patients, with one out of four being treated inthe formal and informal private sectors. Since the private sector providesover 80 percent of all health care in India, these estimates suggest thatIndians depend much more on the public sector for AIDS treatmentthan they do for other health care services.
It is also possible, however, that NACO and WHO have greatly under-estimated the amount of private sector provision. For example, using datafrom two surveys of Indian physicians, one by mail and another con-ducted by the representatives of a major pharmaceutical firm, a studyperformed in 2002 found substantial prescribing of ART among non-government physicians (Hira 2002). The representativeness of neither ofthese samples can be assured. The former suffered from a response rateof only 30 percent, while the latter was a convenience sample selectedby the pharmaceutical company, which is likely to be biased toward high-volume prescribers. Within the sample collected by the pharmaceutical
The Fiscal Burden of AIDS Treatment on South Asian Health Care Systems 161
Figure 5.2. HIV Treatment in Centers Supported by the Indian National AIDS Control Organisation, April 2004 through January 2007
60
50
40
30
no.
of p
atie
nts
rece
ivin
g a
nti
retr
ovir
altr
eatm
ent
(th
ou
san
ds)
20
10
0
Apr.2004
No. oftreatment
centers8 10 25 40 54 85 96 101 103
Jan.2005
Jan.2006
Jan.2007
Source: NACO as cited by Steinbrook 2007.
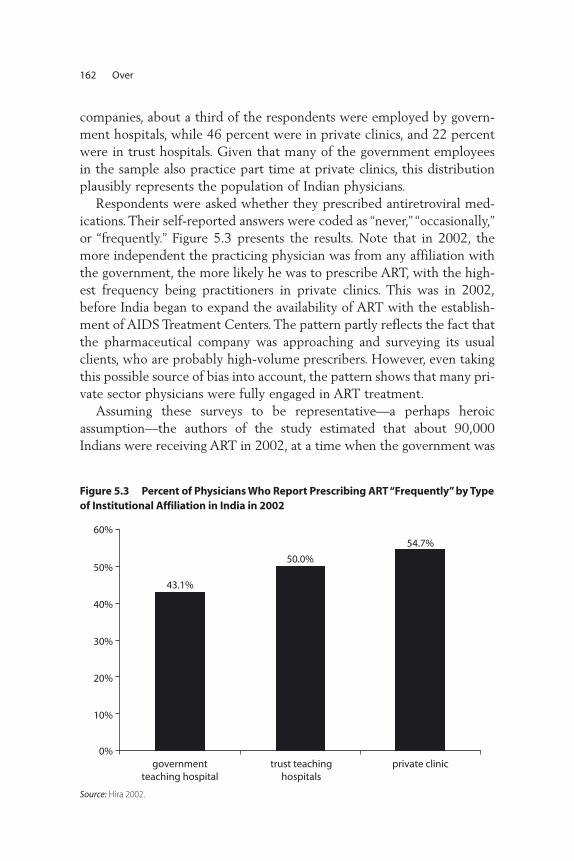
companies, about a third of the respondents were employed by govern-ment hospitals, while 46 percent were in private clinics, and 22 percentwere in trust hospitals. Given that many of the government employeesin the sample also practice part time at private clinics, this distributionplausibly represents the population of Indian physicians.
Respondents were asked whether they prescribed antiretroviral med-ications. Their self-reported answers were coded as “never,” “occasionally,”or “frequently.” Figure 5.3 presents the results. Note that in 2002, themore independent the practicing physician was from any affiliation withthe government, the more likely he was to prescribe ART, with the high-est frequency being practitioners in private clinics. This was in 2002,before India began to expand the availability of ART with the establish-ment of AIDS Treatment Centers. The pattern partly reflects the fact thatthe pharmaceutical company was approaching and surveying its usualclients, who are probably high-volume prescribers. However, even takingthis possible source of bias into account, the pattern shows that many pri-vate sector physicians were fully engaged in ART treatment.
Assuming these surveys to be representative—a perhaps heroicassumption—the authors of the study estimated that about 90,000Indians were receiving ART in 2002, at a time when the government was
162 Over
Figure 5.3 Percent of Physicians Who Report Prescribing ART “Frequently” by Typeof Institutional Affiliation in India in 2002
50.0%
43.1%
54.7%
0%
10%
20%
30%
40%
50%
60%
governmentteaching hospital
trust teachinghospitals
private clinic
Source: Hira 2002.
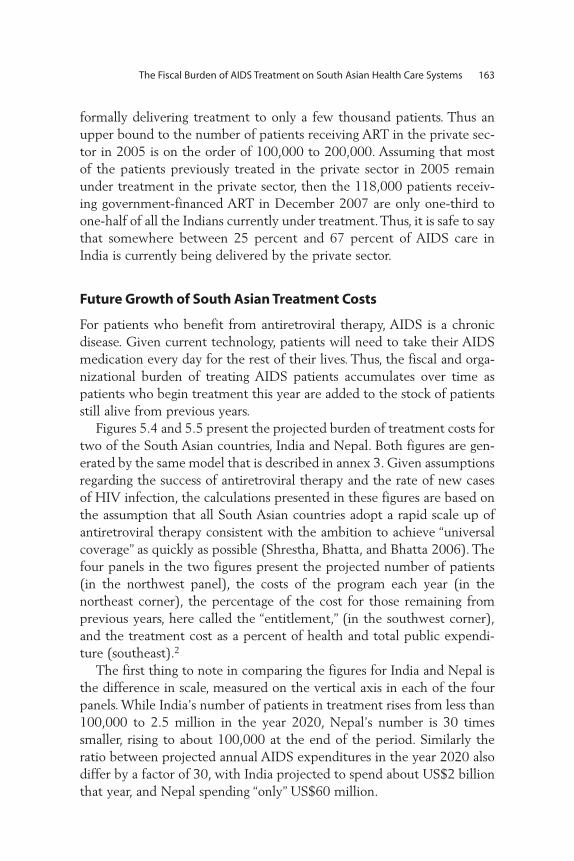
formally delivering treatment to only a few thousand patients. Thus anupper bound to the number of patients receiving ART in the private sec-tor in 2005 is on the order of 100,000 to 200,000. Assuming that mostof the patients previously treated in the private sector in 2005 remainunder treatment in the private sector, then the 118,000 patients receiv-ing government-financed ART in December 2007 are only one-third toone-half of all the Indians currently under treatment. Thus, it is safe to saythat somewhere between 25 percent and 67 percent of AIDS care inIndia is currently being delivered by the private sector.
Future Growth of South Asian Treatment Costs
For patients who benefit from antiretroviral therapy, AIDS is a chronicdisease. Given current technology, patients will need to take their AIDSmedication every day for the rest of their lives. Thus, the fiscal and orga-nizational burden of treating AIDS patients accumulates over time aspatients who begin treatment this year are added to the stock of patientsstill alive from previous years.
Figures 5.4 and 5.5 present the projected burden of treatment costs fortwo of the South Asian countries, India and Nepal. Both figures are gen-erated by the same model that is described in annex 3. Given assumptionsregarding the success of antiretroviral therapy and the rate of new casesof HIV infection, the calculations presented in these figures are based onthe assumption that all South Asian countries adopt a rapid scale up ofantiretroviral therapy consistent with the ambition to achieve “universalcoverage” as quickly as possible (Shrestha, Bhatta, and Bhatta 2006). Thefour panels in the two figures present the projected number of patients(in the northwest panel), the costs of the program each year (in thenortheast corner), the percentage of the cost for those remaining fromprevious years, here called the “entitlement,” (in the southwest corner),and the treatment cost as a percent of health and total public expendi-ture (southeast).2
The first thing to note in comparing the figures for India and Nepal isthe difference in scale, measured on the vertical axis in each of the fourpanels. While India’s number of patients in treatment rises from less than100,000 to 2.5 million in the year 2020, Nepal’s number is 30 timessmaller, rising to about 100,000 at the end of the period. Similarly theratio between projected annual AIDS expenditures in the year 2020 alsodiffer by a factor of 30, with India projected to spend about US$2 billionthat year, and Nepal spending “only” US$60 million.
The Fiscal Burden of AIDS Treatment on South Asian Health Care Systems 163
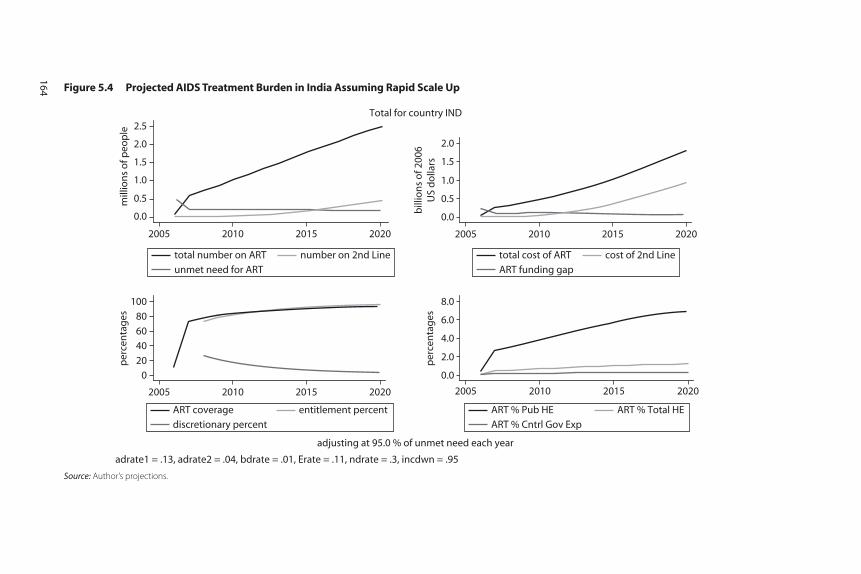
Figure 5.4 Projected AIDS Treatment Burden in India Assuming Rapid Scale Up
0.0
0.5
1.0
1.5
2.0
bill
ion
s o
f 200
6U
S d
olla
rs
2005 2010 2015 2020
0
20
40
60
80
100
per
cen
tag
es
2005 2010 2015 2020
0.0
2.0
4.0
6.0
8.0
per
cen
tag
es
2005 2010 2015 2020
adjusting at 95.0 % of unmet need each year
adrate1 = .13, adrate2 = .04, bdrate = .01, Erate = .11, ndrate = .3, incdwn = .95
Total for country IND
0.0
0.5
1.0
1.5
2.0
2.5m
illio
ns
of p
eop
le
2005 2010 2015 2020
unmet need for ART
total number on ART number on 2nd Line
discretionary percent
ART coverage entitlement percent
ART % Cntrl Gov Exp
ART % Pub HE ART % Total HE
ART funding gap
total cost of ART cost of 2nd Line
Source: Author’s projections.
164
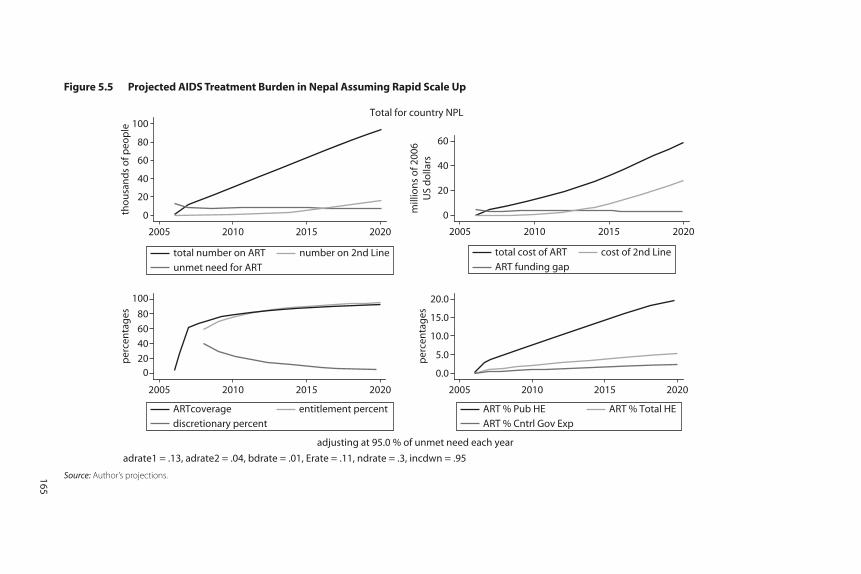
Figure 5.5 Projected AIDS Treatment Burden in Nepal Assuming Rapid Scale Up
Source: Author’s projections.
0
20
40
60
mill
ion
s o
f 200
6U
S d
olla
rs
020
40
60
80
100
per
cen
tag
es
0.0
5.0
10.0
15.0
20.0
per
cen
tag
es
adjusting at 95.0 % of unmet need each year
adrate1 = .13, adrate2 = .04, bdrate = .01, Erate = .11, ndrate = .3, incdwn = .95
Total for country NPL
0
20
40
60
80
100th
ou
san
ds
of p
eop
le
unmet need for ART
total number on ART number on 2nd Line
2005 2010 2015 2020
ART funding gap
total cost of ART cost of 2nd Line
2005 2010 2015 2020
2005 2010 2015 2020
discretionary percent
ARTcoverage entitlement percent
2005 2010 2015 2020
ART % Cntrl Gov Exp
ART % Pub HE ART % Total HE
165
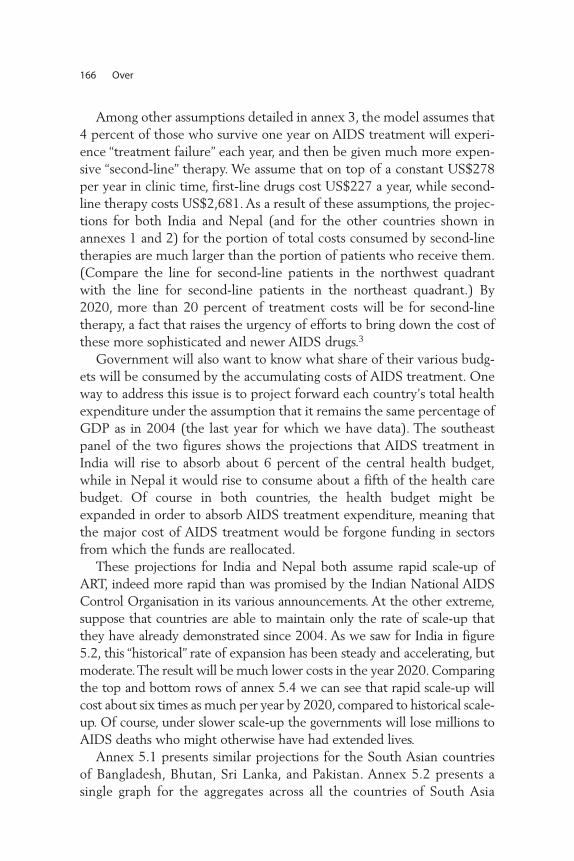
Among other assumptions detailed in annex 3, the model assumes that4 percent of those who survive one year on AIDS treatment will experi-ence “treatment failure” each year, and then be given much more expen-sive “second-line” therapy. We assume that on top of a constant US$278per year in clinic time, first-line drugs cost US$227 a year, while second-line therapy costs US$2,681. As a result of these assumptions, the projec-tions for both India and Nepal (and for the other countries shown inannexes 1 and 2) for the portion of total costs consumed by second-linetherapies are much larger than the portion of patients who receive them.(Compare the line for second-line patients in the northwest quadrantwith the line for second-line patients in the northeast quadrant.) By2020, more than 20 percent of treatment costs will be for second-linetherapy, a fact that raises the urgency of efforts to bring down the cost ofthese more sophisticated and newer AIDS drugs.3
Government will also want to know what share of their various budg-ets will be consumed by the accumulating costs of AIDS treatment. Oneway to address this issue is to project forward each country’s total healthexpenditure under the assumption that it remains the same percentage ofGDP as in 2004 (the last year for which we have data). The southeastpanel of the two figures shows the projections that AIDS treatment inIndia will rise to absorb about 6 percent of the central health budget,while in Nepal it would rise to consume about a fifth of the health carebudget. Of course in both countries, the health budget might beexpanded in order to absorb AIDS treatment expenditure, meaning thatthe major cost of AIDS treatment would be forgone funding in sectorsfrom which the funds are reallocated.
These projections for India and Nepal both assume rapid scale-up ofART, indeed more rapid than was promised by the Indian National AIDSControl Organisation in its various announcements. At the other extreme,suppose that countries are able to maintain only the rate of scale-up thatthey have already demonstrated since 2004. As we saw for India in figure5.2, this “historical” rate of expansion has been steady and accelerating, butmoderate. The result will be much lower costs in the year 2020. Comparingthe top and bottom rows of annex 5.4 we can see that rapid scale-up willcost about six times as much per year by 2020, compared to historical scale-up. Of course, under slower scale-up the governments will lose millions toAIDS deaths who might otherwise have had extended lives.
Annex 5.1 presents similar projections for the South Asian countriesof Bangladesh, Bhutan, Sri Lanka, and Pakistan. Annex 5.2 presents asingle graph for the aggregates across all the countries of South Asia
166 Over
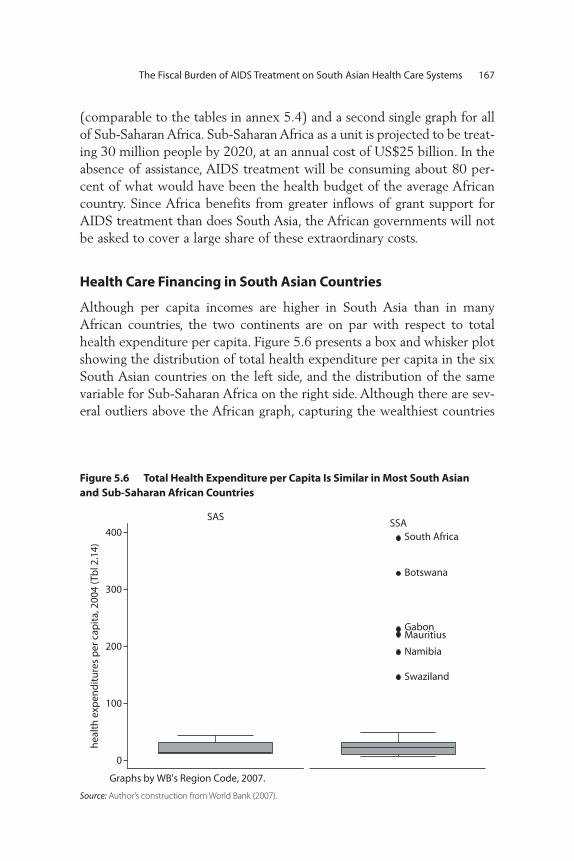
(comparable to the tables in annex 5.4) and a second single graph for allof Sub-Saharan Africa. Sub-Saharan Africa as a unit is projected to be treat-ing 30 million people by 2020, at an annual cost of US$25 billion. In theabsence of assistance, AIDS treatment will be consuming about 80 per-cent of what would have been the health budget of the average Africancountry. Since Africa benefits from greater inflows of grant support forAIDS treatment than does South Asia, the African governments will notbe asked to cover a large share of these extraordinary costs.
Health Care Financing in South Asian Countries
Although per capita incomes are higher in South Asia than in manyAfrican countries, the two continents are on par with respect to totalhealth expenditure per capita. Figure 5.6 presents a box and whisker plotshowing the distribution of total health expenditure per capita in the sixSouth Asian countries on the left side, and the distribution of the samevariable for Sub-Saharan Africa on the right side. Although there are sev-eral outliers above the African graph, capturing the wealthiest countries
The Fiscal Burden of AIDS Treatment on South Asian Health Care Systems 167
Figure 5.6 Total Health Expenditure per Capita Is Similar in Most South Asianand Sub-Saharan African Countries
South Africa
Botswana
GabonMauritius
Namibia
Swaziland
0
100
200
300
400
SASSSA
hea
lth
exp
end
itu
res
per
cap
ita,
200
4 (T
bl 2
.14)
Graphs by WB's Region Code, 2007.
Source: Author’s construction from World Bank (2007).

on that continent, the center of the distribution is similar in both cases,with the median for both distributions being under US$20 per person.
The importance of the private health care sector in a country can beanalyzed from either the production or the expenditure perspective.Table 5.2 presents data on the production side of the Indian health sec-tor for 1986–95. The public share of both public and private health careproduction clearly declined in that decade, with the private share reaching80 percent of outpatient care and almost 60 percent of inpatient care(Sengupta and Nundy 2005). Data from the 2004 National Sample Surveyshows no change in private sector dominance of outpatient care andincreased private sector dominance of inpatient care.4 In view of thegrowth of the private sector Indian economy since 1995 and the greatlyincreased inequality of the income distribution, it would not be surpris-ing to find that the private component accounted for an even largershare of the health care sector in 2008 than it did in 2004. Since success-ful AIDS treatment is delivered on an outpatient basis, these data sup-port the view that many Indian patients are likely to seek and receiveART from the private sector.
The two panels of figure 5.7 analyze the public and private roles fromthe expenditure perspective, comparing the South Asia region to Sub-Saharan Africa. Panel (a) of figure 5.6 shows that unlike total healthexpenditure, public health expenditure is distributed very differently inthe two regions, with African governments being typically more generousthan South Asian ones. While the median country in South Asia coversonly about one-fifth of health care costs out of public money (with Indiacovering even less and Sri Lanka much more), the median country inAfrica covers about half of health expenditure.
168 Over
Table 5.2 Shares of Private and Public Health Care Production in India
1986–87 1995–96 2004
Rural Urban Rural Urban Rural Urban
Not treated 18 11 17 9 18 11
Treated as outpatients
Public 26 28 19 20 22 19
Private 74 72 81 80 78 81
Treated as inpatients
Public 60 60 44 43 42 38
Private 40 40 56 57 58 62
Source: Indian National Sample Survey Organization (1992, 1998) as cited in Peters, Yazbeck, and others, Better
Health Systems for India’s Poor, 2002, Chapter 2, Table 2.4, p. 48.
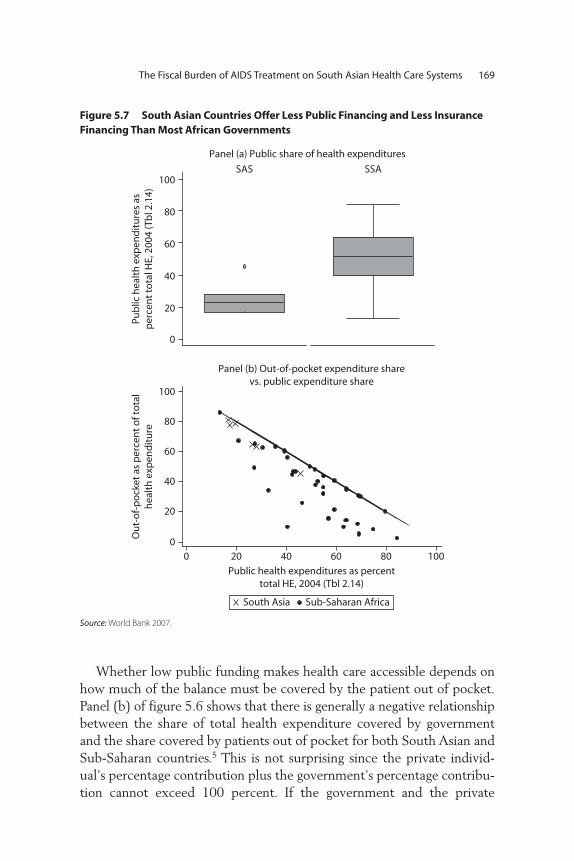
Whether low public funding makes health care accessible depends onhow much of the balance must be covered by the patient out of pocket.Panel (b) of figure 5.6 shows that there is generally a negative relationshipbetween the share of total health expenditure covered by governmentand the share covered by patients out of pocket for both South Asian andSub-Saharan countries.5 This is not surprising since the private individ-ual’s percentage contribution plus the government’s percentage contribu-tion cannot exceed 100 percent. If the government and the private
The Fiscal Burden of AIDS Treatment on South Asian Health Care Systems 169
Figure 5.7 South Asian Countries Offer Less Public Financing and Less InsuranceFinancing Than Most African Governments
0
20
40
60
80
100SAS SSA
Pub
lic h
ealt
h e
xpen
dit
ure
s as
per
cen
t to
tal H
E, 2
004
(Tb
l 2.1
4)
0
20
40
60
80
100
Ou
t-o
f-p
ock
et a
s p
erce
nt
of t
ota
lh
ealt
h e
xpen
dit
ure
0 20 40 60 80 100
Public health expenditures as percenttotal HE, 2004 (Tbl 2.14)
South Asia Sub-Saharan Africa
Panel (b) Out-of-pocket expenditure sharevs. public expenditure share
Panel (a) Public share of health expenditures
Source: World Bank 2007.
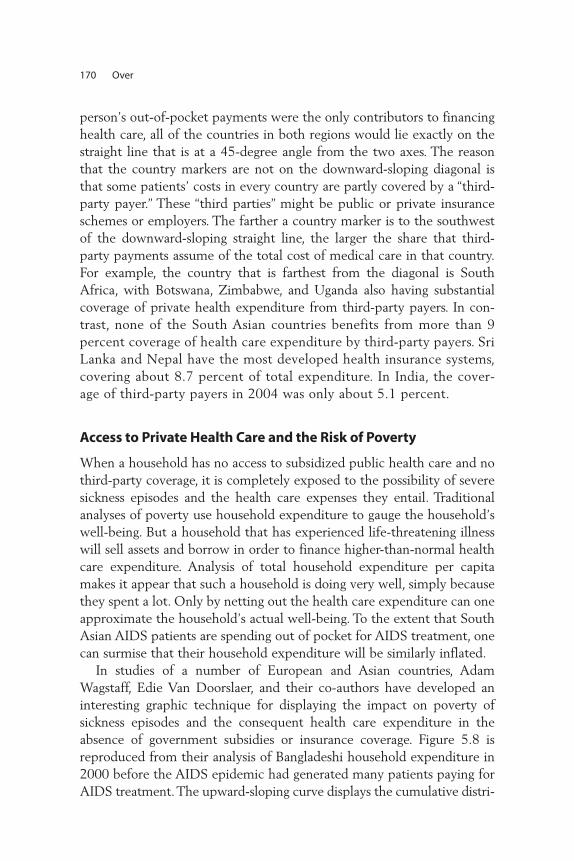
person’s out-of-pocket payments were the only contributors to financinghealth care, all of the countries in both regions would lie exactly on thestraight line that is at a 45-degree angle from the two axes. The reasonthat the country markers are not on the downward-sloping diagonal isthat some patients’ costs in every country are partly covered by a “third-party payer.” These “third parties” might be public or private insuranceschemes or employers. The farther a country marker is to the southwestof the downward-sloping straight line, the larger the share that third-party payments assume of the total cost of medical care in that country.For example, the country that is farthest from the diagonal is SouthAfrica, with Botswana, Zimbabwe, and Uganda also having substantialcoverage of private health expenditure from third-party payers. In con-trast, none of the South Asian countries benefits from more than 9percent coverage of health care expenditure by third-party payers. SriLanka and Nepal have the most developed health insurance systems,covering about 8.7 percent of total expenditure. In India, the cover-age of third-party payers in 2004 was only about 5.1 percent.
Access to Private Health Care and the Risk of Poverty
When a household has no access to subsidized public health care and nothird-party coverage, it is completely exposed to the possibility of severesickness episodes and the health care expenses they entail. Traditionalanalyses of poverty use household expenditure to gauge the household’swell-being. But a household that has experienced life-threatening illnesswill sell assets and borrow in order to finance higher-than-normal healthcare expenditure. Analysis of total household expenditure per capitamakes it appear that such a household is doing very well, simply becausethey spent a lot. Only by netting out the health care expenditure can oneapproximate the household’s actual well-being. To the extent that SouthAsian AIDS patients are spending out of pocket for AIDS treatment, onecan surmise that their household expenditure will be similarly inflated.
In studies of a number of European and Asian countries, AdamWagstaff, Edie Van Doorslaer, and their co-authors have developed aninteresting graphic technique for displaying the impact on poverty ofsickness episodes and the consequent health care expenditure in theabsence of government subsidies or insurance coverage. Figure 5.8 isreproduced from their analysis of Bangladeshi household expenditure in2000 before the AIDS epidemic had generated many patients paying forAIDS treatment. The upward-sloping curve displays the cumulative distri-
170 Over
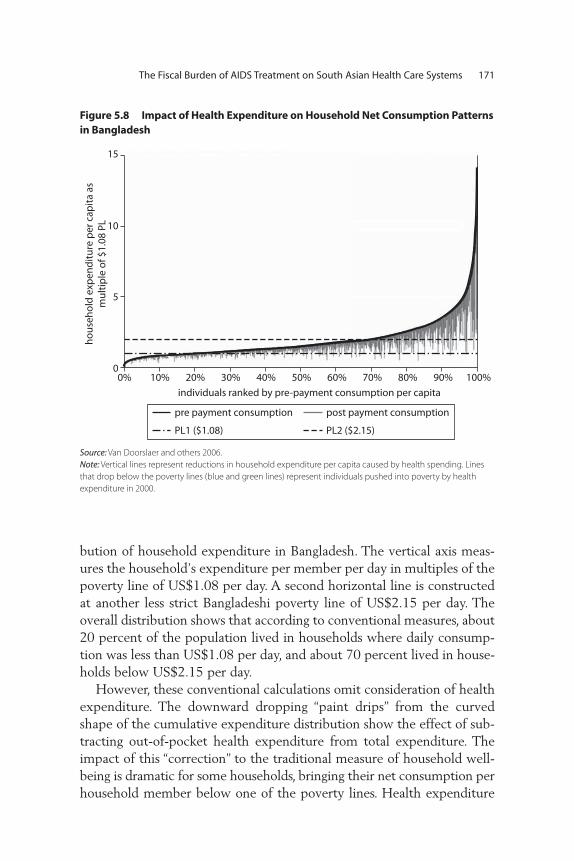
bution of household expenditure in Bangladesh. The vertical axis meas-ures the household’s expenditure per member per day in multiples of thepoverty line of US$1.08 per day. A second horizontal line is constructedat another less strict Bangladeshi poverty line of US$2.15 per day. Theoverall distribution shows that according to conventional measures, about20 percent of the population lived in households where daily consump-tion was less than US$1.08 per day, and about 70 percent lived in house-holds below US$2.15 per day.
However, these conventional calculations omit consideration of healthexpenditure. The downward dropping “paint drips” from the curvedshape of the cumulative expenditure distribution show the effect of sub-tracting out-of-pocket health expenditure from total expenditure. Theimpact of this “correction” to the traditional measure of household well-being is dramatic for some households, bringing their net consumption perhousehold member below one of the poverty lines. Health expenditure
The Fiscal Burden of AIDS Treatment on South Asian Health Care Systems 171
Figure 5.8 Impact of Health Expenditure on Household Net Consumption Patternsin Bangladesh
hous
ehol
d ex
pend
iture
per
cap
ita a
sm
ultip
le o
f $1.
08 P
L
15
10
5
00% 10% 20%
individuals ranked by pre-payment consumption per capita30% 40% 50% 60% 70% 80% 90% 100%
pre payment consumption post payment consumption
PL1 ($1.08) PL2 ($2.15)
Source: Van Doorslaer and others 2006.
Note: Vertical lines represent reductions in household expenditure per capita caused by health spending. Lines
that drop below the poverty lines (blue and green lines) represent individuals pushed into poverty by health
expenditure in 2000.

large enough to reduce a family to penury can be fairly classified as “cat-astrophic.” Note that even households that would otherwise have been inthe top decile of household expenditure were reduced to poverty by oneof the two measures once health expenditure was netted out of theirannual consumption.6
Figure 5.8 dramatically depicts the problem of catastrophic healthexpenditure in Bangladesh, but unavoidably overstates the prevalence ofthe problem. For one of the vertical “paint drips” to be visible, the linemust have a certain width. Given the horizontal dimension of the printedpage, even a small number of “paint drips” will occlude the surface of thepage, making it look as if virtually all households suffer substantial reduc-tions in well-being from health expenditure. Consequently, the only wayto assess the prevalence of the problem of catastrophic out-of-pockethealth expenditure is to consider a table that gives the percentage of indi-viduals whose household expenditure net of health care costs is in factbelow the poverty line.
Table 5.3, which is excerpted from Van Doorslaer et al. (2004), pres-ents the impact on poverty in four South Asian countries by analyzinghousehold expenditure per capita net of health expenditure. In India, thisredefinition of poverty would push an additional 20.6 million below thehigher poverty line, and 37.4 million people below the lower one, increas-ing the proportion of Indians suffering from the most extreme form ofpoverty by 12 percent. In Bangladesh, Nepal, and Sri Lanka, healthexpenditure increases the number of those below the lower poverty lineby 17 percent, 6 percent, and 8 percent, respectively. Although theseincreases in measured poverty are smaller than might be inferred fromfigure 5.8, they are nevertheless substantial.
Many who have sought private sector treatment for AIDS are likely tohave been pushed below the poverty line. Suppose that an individualspends approximately US$365 a year out of pocket on AIDS treatment,which is enough to cover the full cost of first-line triple-drug therapy atgeneric prices, plus doctor visits and some laboratory tests. In a four-personhousehold, this would add US$0.25 per member to daily health expen-ditures. From figure 5.7 we can see that households at about the 40th per-centile of India’s expenditure distribution, which had no other healthexpenditure, would be pushed down below the lower Indian poverty lineby a single AIDS patient, to be on a par with households at the 20th per-centile. Two AIDS patients in a household would severely impoverish ahousehold that had previously been at the 45th percentile of the expen-diture distribution.
172 Over

Table 5.3 Poverty Head Counts: Effect of Accounting for Out-of-Pocket Payments for Health Care, Various Years
Poverty Line of US$1.08 per DayChange in poverty head count
Poverty Line of US$2.15 per DayChange in poverty head count
Prepaymenthead
count*
Postpaymenthead count
Percentagepoint
change†
Number of
individuals‡Percentage
change§
Prepaymenthead
count*
Postpaymenthead count
Percentagepoint
change†
Number of
individuals‡Percentage
change§
Bangladesh 22.5% 26.3% 3.8% 4,940,585 16.8% 73.0% 76.5% 3.6% 4,653,875 4.9%
India 31.1% 34.8% 3.7% 37,358,760 11.9% 80.3% 82.4% 2.1% 20,638,361 2.6%
Nepal 39.3% 41.6% 2.2% 515,933 5.7% 80.4% 81.7% 1.3% 290,280 1.6%
Sri Lanka 3.8% 4.1% 0.3% 60,116 8.3% 39.1% 40.8% 1.7% 325,783 4.3%
Sources: Van Doorslaer et al. Table 4 and the Equitap project working papers.
173

Suppose that all of the 500,000 to 1.6 million people who are esti-mated to be living with AIDS in India are in households that would oth-erwise be above the US$1.08 poverty line, but not above the 40thpercentile of the Indian income distribution. Since there were between300 and 500 million Indians living under the US$1.08 poverty line in2000, AIDS would increase the number of “strictly” poor by less than halfof a percent. In so doing, it would increase the percentage of the popula-tion below the stricter poverty line from about 35 percent to 38 percent.
This analysis does not take into account the fact that AIDS treatmentmust continue for the rest of the patient’s life. Most of the “paint drips”in figure 5.8 are probably associated with acute illness, not chronic illness.A household might recover its economic status after a single catastrophicexpenditure depresses their net expenditure for a single year. But thatsame household would need more robust coping strategies to deal with astream of equivalently catastrophic expenditure every year. To analyzechronic disease, one would need a graph like figure 5.8, which would beconstructed for wealth (or “permanent income”) instead of expenditure.
In order to push this analysis further, it would be useful to have infor-mation on the distribution of South Asian HIV infections across theincome or expenditure distributions depicted in graphs like figure 5.8. Itwould be useful to know whether a poor person in South Asia is more orless likely to have HIV infection than a person of middle or higherincome. Reports of mostly poor people accessing government subsidizedantiretroviral therapy in the last few years can be set against anecdotesand rumors about the spread of AIDS among the relatively wealthy inBollywood. Unfortunately, until recently there has been no population-based information available on the distribution of HIV infection bysocioeconomic class in India, or indeed in almost any country in theworld.7 The fact that India’s recent reassessment of the extent of HIVinfection was based on a household survey offers hope that India will beable to correlate HIV infection to socioeconomic status for the first time.
Even without data on the socioeconomic distribution of HIV infectionin South Asia, the absence of either a large public presence in health caredelivery or significant health insurance coverage for 19 of 20 South Asiancitizens renders the population unusually vulnerable to the financial riskof catastrophic health expenditures to treat AIDS. The efforts by govern-ments in the region to assume public sector responsibility for rolling outAIDS treatment is a movement against the trend toward private sectordominance in the health care market. The next section presents projec-tions of the growing number of patients needing treatment, and poses the
174 Over
question whether government-subsidized care can grow fast enough tomeet all of that demand.
Quality of Private vs. Public ART
The consequences of private sector health care for AIDS are largelyunknown. One view is that the newer formulations of antiretroviral drugsare so inexpensive, convenient, and easy to understand that private sectorcare might be as high quality as public sector care, and might extendtreatment access to many people who could not otherwise obtain it in theSouth Asian countries. An alternative view is that private providers haveinsufficient incentive to ensure patient adherence to the drug regimen,without which the treatment will fail, and the patient may transmit aresistant form of HIV and then die. The worst possibility one can imag-ine is that private sector distribution would expand rapidly in the form ofcasual over-the-counter sales of a mixture of full-strength, diluted, andcounterfeit antiretroviral medications, without any prescription or med-ical supervision. This kind of private sector expansion is a recipe for exac-erbating both the spread and the cost of the AIDS epidemic. Within thecomplex private health care sectors in South Asian countries, there aresurely examples of both adherence-maximizing and adherence-minimizingprivate care. The heterogeneity of private care between these two extremesremains to be determined. Of course, similar questions can also be raisedabout the quality of public sector care.
To the extent that private care is less successful at supporting patientadherence to ART regimes than the average public care facility, publicfinancing of public sector ART delivery can be seen as crowding out someof the private sector care. If public sector care is less expensive to thepatient than private care, and patients have at least a little knowledge ofthe relative merits of different service providers, the public sector carewill crowd out the worst of the private care, thus preserving patient liveswhile stemming the development and spread of resistant strains of HIV.
The possibility that publicly provided AIDS treatment might crowdout lower-quality private care is an unusual and notable feature of publicsector AIDS treatment in South Asia. Usually, when public subsidy orsubsidized provision of a good or service crowds out private provision,any redistributive benefits that accrue must be weighed against the con-sequent efficiency losses. In this case, assuming that the public sector suc-ceeds more than the low-quality private sector at facilitating patientadherence, the crowding out is preventing negative spillovers and is thus
The Fiscal Burden of AIDS Treatment on South Asian Health Care Systems 175
contributing to an improvement in efficiency. Given the right magnitudesfor these various effects, crowding out could provide a sufficient justifica-tion for public financing and provision even in the absence of the distrib-utive arguments.
Model delivery of ART includes the following essential components:(i) standardized, competency-based training of physicians in ART man-agement; (ii) prescription of a standard triple-drug regimen; (iii) supportfrom a multidisciplinary team, including a counselor and a nutritionist;(iv) regular clinical and laboratory-based monitoring of the patient’streatment status; (v) counseling to prevent transmission; (vi) prophylaxisfor opportunistic illnesses when indicated; and (vii) diagnosis and treat-ment of opportunistic illnesses (Over and others 2006). Thus, the ques-tion of whether private sector delivery of ART would improve or worsenthe quality of care in South Asia depends on what proportion of the pri-vately delivered ART meets these criteria.
In previous work, this author and his coauthors have conjectured thatthe private sector care used by India’s poorest AIDS patients would be“unstructured” in the sense that it would not typically include theseseven essential components (Over and others 2004). Since the publica-tion of that book, only a single study has been published that addressesthis conjecture. Sheikh and co-authors interviewed 215 providers inPune, India, and found that three-quarters had been consulted by HIV-infected clients. Of these, 14 percent had prescribed ART, “sometimeswithout adequate knowledge of the guidelines for their use” (Sheikh andothers 2005).
On the other hand, it is not clear that public sector ART programs willnecessarily be of higher quality. One study analyzed the treatment of 32HIV-infected patients prior to 2004 at the B.P. Koirala Institute of HealthSciences, a major teaching hospital in eastern Nepal (Shrestha, Bhatta,and Bhatta 2006). Thirteen of these were discharged with virtually nocare. Among the rest, six of the seven prescriptions to fight opportunisticinfections, and all four ART prescriptions were incorrect. The authorsconcluded that “the care of HIV-infected patients even at a major tertiarycare teaching hospital in Nepal was sub-optimal.” Since the Nepalese gov-ernment has invested in the expansion of ART since 2003, a new studywould hopefully reveal substantial improvement.
In a study of the quality of the delivery of general outpatient medicalservices (where there was no HIV diagnosis), Das and Hammer foundthat quality was extremely variable in the public as well as the privateprograms (Das and Hammer 2004). But deviations from best practice
176 Over

care occurred in different directions and for different reasons in the twosectors. According to the authors, “in the public sector providers are morelikely to commit errors of omission—they are less likely to exert effortcompared with their private counterparts. In the private sector, providersare prone to errors of commission—they are more likely to behaveaccording to the patient’s expectations, resulting in the inappropriate useof medications, the overuse of antibiotics, and increased expenditures.”
Both types of errors, of omission or commission, threaten the qualityand therefore the success of AIDS treatment in India. Either can lead toearly treatment failure for the patient and transmission by the patient ofa drug-resistant strain of HIV to someone who consequently requiresmuch more expensive second-line or salvage drug therapy. Thus, a gov-ernment that is committed to providing subsidized AIDS treatment to allhas an important role to play in assuring minimum quality standards forAIDS care in the private as well as the public sector.8
Conclusions
To the extent that patients seek out and obtain good-quality AIDS treat-ment from the private sector, South Asian governments can achieve thebenefits of rapid scale-up without directly bearing the costs. However, itis difficult to project what the share of private treatment is now or willbe in the future. If HIV infections are evenly distributed across the rangeof South Asian living standards, then only 30 percent of the cases wouldbe above the more generous poverty line of US$2.15 given in figure 5.8.And the poorest 10 percent of these (the third decile of the expendituredistribution) would be pushed down into poverty by AIDS treatmentexpenditures. Under these assumptions, only 20 percent of AIDS patientscould afford to pay for treatment without becoming impoverished.Without government subsidy, AIDS treatment would be beyond thereach of 80 percent of patients.
Against this background, the South Asian governments have threechoices. They can strive to meet the goal of universal access as best theycan with public delivery of ART. This policy will lead to the greatestexpansion in costs and incidentally will swim against the current of theincreasing privatization of South Asian health services.9 They can allowthe expansion of private AIDS care for those who can afford it, while try-ing to reduce its cost and assure its quality. Or they can use the AIDS epi-demic as one more incentive to push for greater health insurance andother third-party payment of health care costs. The latter policy would be
The Fiscal Burden of AIDS Treatment on South Asian Health Care Systems 177
difficult to follow in a population with extremely high prevalence rates,because AIDS treatment is an expensive risk and would raise issues ofadverse selection. But a policy to expand health insurance that includescoverage of AIDS treatment may succeed in India and other South Asiancountries where an HIV-positive diagnosis is still relatively rare.
Whether or not the South Asian governments decide to explicitlyencourage the private sector in AIDS care, they have a fundamentalresponsibility to collect data on the quality of private AIDS care as itoccurs, beyond the easy observation of government health workers. Onlythrough data collection on private AIDS care will it be possible to gaugethe severity of the quality difference between the local public and privatedelivery systems. Since private providers may have little incentive toretain clients over the many months and years required for treating thischronic illness, regulation of the private AIDS treatment sector is recom-mended. Depending on the findings of such a data collection and moni-toring project, the government could decide to accelerate publicprovision (in order to crowd out the lowest end of the AIDS care spec-trum) or to develop explicit strategies for delegating a part of the careburden to the private sector. It might be necessary to do both, each witha different segment of the private market.
178 Over
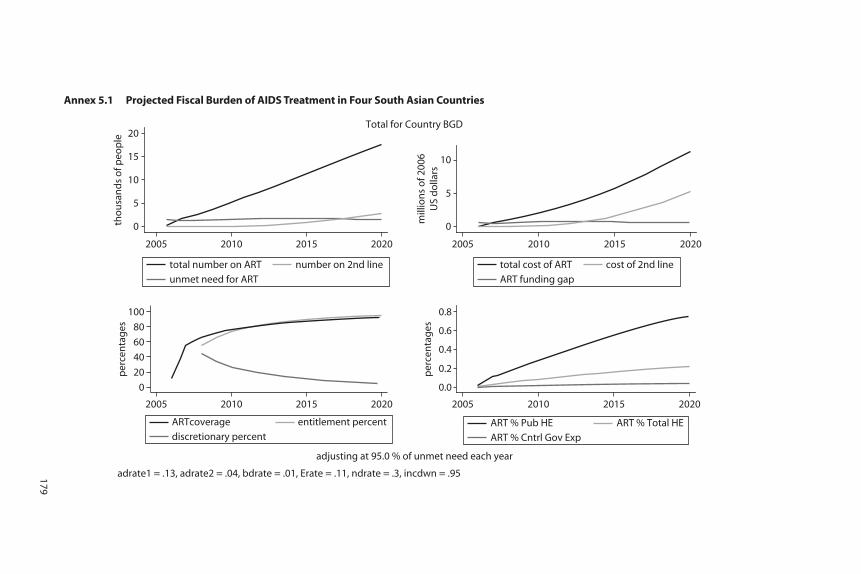
0
5
10
15
20
tho
usa
nd
s o
f peo
ple
0
5
10
mill
ion
s o
f 200
6U
S d
olla
rs
0
20
40
60
80
100
per
cen
tag
es
0.0
0.2
0.4
0.6
0.8
per
cen
tag
es
adjusting at 95.0 % of unmet need each year
adrate1 = .13, adrate2 = .04, bdrate = .01, Erate = .11, ndrate = .3, incdwn = .95
Total for Country BGD
unmet need for ART
total number on ART number on 2nd line
2005 2010 2015 2020
ART funding gap
total cost of ART cost of 2nd line
2005 2010 2015 2020
2005 2010 2015 2020
discretionary percent
ARTcoverage entitlement percent
2005 2010 2015 2020
ART % Cntrl Gov Exp
ART % Pub HE ART % Total HE
Annex 5.1 Projected Fiscal Burden of AIDS Treatment in Four South Asian Countries
179

Annex 5.1 Projected Fiscal Burden of AIDS Treatment in Four South Asian Countries (continued)
0.0
0.5
1.0
1.5
2.0
tho
usa
nd
s o
f peo
ple
0.0
0.5
1.0
1.5
mill
ion
s o
f 200
6U
S d
olla
rs
0
20
40
60
80
100
per
cen
tag
es
0.10.10.10.20.30.3
per
cen
tag
es
adjusting at 95.0 % of unmet need each yearadrate1 = .13, adrate2 = .04, bdrate = .01, Erate = .11, ndrate = .3, incdwn = .95
Total for Country BTN
unmet need for ART
total number on ART number on 2nd line
2005 2010 2015 2020
ART funding gap
total cost of ART cost of 2nd line
2005 2010 2015 2020
2005 2010 2015 2020
2005 2010 2015 2020
discretionary percent
ART coverage entitlement percent
ART % Cntrl Gov Exp
ART % Pub HE ART % Total HE
180
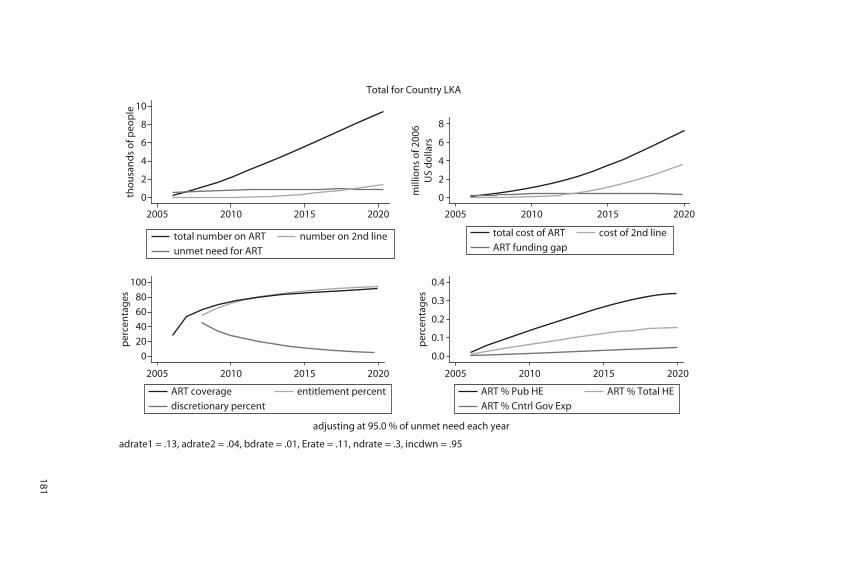
0
2
4
6
8
10
tho
usa
nd
s o
f peo
ple
0
2
4
6
8
mill
ion
s o
f 200
6U
S d
olla
rs
0
20
40
60
80
100
per
cen
tag
es
0.0
0.1
0.2
0.3
0.4
per
cen
tag
esadjusting at 95.0 % of unmet need each year
adrate1 = .13, adrate2 = .04, bdrate = .01, Erate = .11, ndrate = .3, incdwn = .95
Total for Country LKA
unmet need for ART
total number on ART number on 2nd line
2005 2010 2015 2020
ART funding gap
total cost of ART cost of 2nd line
2005 2010 2015 2020
2005 2010 2015 2020
2005 2010 2015 2020
discretionary percent
ART coverage entitlement percent
ART % Cntrl Gov Exp
ART % Pub HE ART % Total HE
181
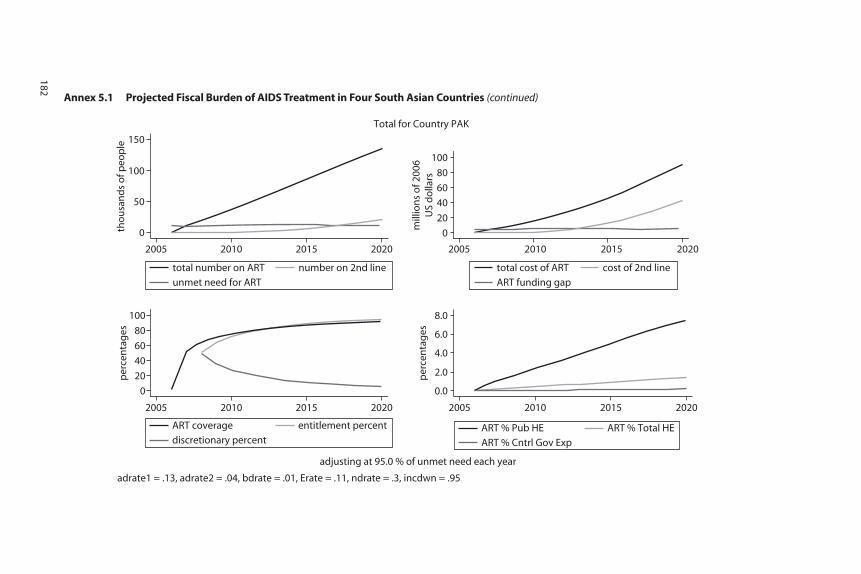
Annex 5.1 Projected Fiscal Burden of AIDS Treatment in Four South Asian Countries (continued)
0
50
100
150
tho
usa
nd
s o
f peo
ple
0
20
40
60
80
100
mill
ion
s o
f 200
6U
S d
olla
rs
0
20
40
60
80
100
per
cen
tag
es
0.0
2.0
4.0
6.0
8.0
per
cen
tag
es
adjusting at 95.0 % of unmet need each year
adrate1 = .13, adrate2 = .04, bdrate = .01, Erate = .11, ndrate = .3, incdwn = .95
Total for Country PAK
unmet need for ART
total number on ART number on 2nd line
2005 2010 2015 2020
ART funding gap
total cost of ART cost of 2nd line
2005 2010 2015 2020
2005 2010 2015 2020
2005 2010 2015 2020
discretionary percent
ART coverage entitlement percent
ART % Cntrl Gov Exp
ART % Pub HE ART % Total HE
182

0.0
1.0
2.0
3.0
mill
ion
s o
f peo
ple
0.0
0.5
1.0
1.5
2.0
bill
ion
s o
f 200
6U
S d
olla
rs
0
20
40
60
80
100
per
cen
tag
es
0.0
2.0
4.0
6.0
8.0
per
cen
tag
es
adjusting at 95.0 % of unmet need each year
adrate1 = .13, adrate2 = .04, bdrate = .01, Erate = .11, ndrate = .3, incdwn = .95
Total for Region SAS
unmet need for ART
total number on ART number on 2nd line
2005 2010 2015 2020
ART funding gap
total cost of ART cost of 2nd line
2005 2010 2015 2020
2005 2010 2015 2020
2005 2010 2015 2020
discretionary percent
ART coverage entitlement percent
ART % Cntrl Gov Exp
ART % Pub HE ART % Total HE
183
Annex 5.2 Projected Fiscal Burden of AIDS Treatment for South Asia & Sub-Saharan Africa

Annex 5.2 Projected Fiscal Burden of AIDS Treatment for South Asia & Sub-Saharan Africa (continued)
0
10
20
30
mill
ion
s o
f peo
ple
0
5
10
15
20
25
bill
ion
s o
f 200
6U
S d
olla
rs
0
20
40
60
80
100
per
cen
tag
es
0.0
20.0
40.0
60.0
80.0
per
cen
tag
es
adjusting at 95.0 % of unmet need each year
adrate1 = .13, adrate2 = .04, bdrate = .01, Erate = .11, ndrate = .3, incdwn = .95
Total for Region SSA
unmet need for ART
total number on ART number on 2nd line
2005 2010 2015 2020
ART funding gap
total cost of ART cost of 2nd line
2005 2010 2015 2020
2005 2010 2015 2020
2005 2010 2015 2020
discretionary percent
ART coverage entitlement percent
ART % Cntrl Gov Exp
ART % Pub HE ART % Total HE
184
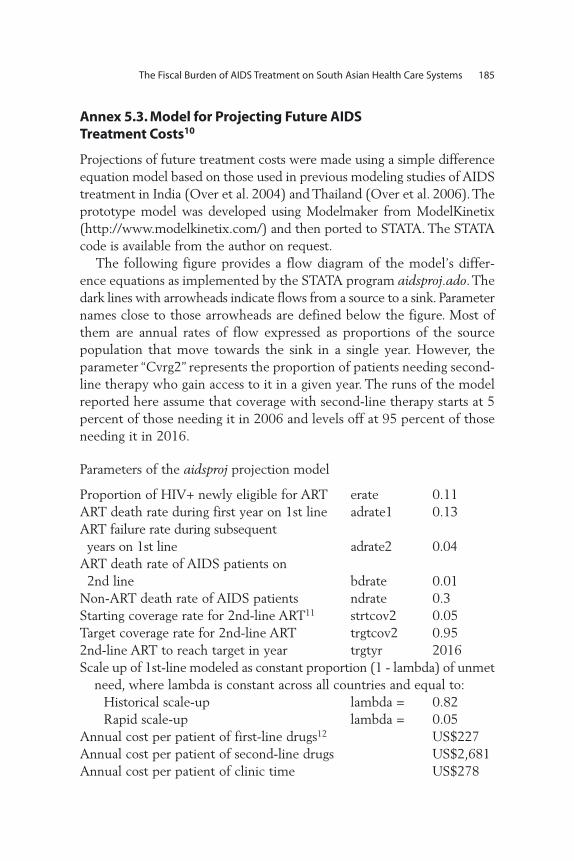
Annex 5.3. Model for Projecting Future AIDS Treatment Costs10
Projections of future treatment costs were made using a simple differenceequation model based on those used in previous modeling studies of AIDStreatment in India (Over et al. 2004) and Thailand (Over et al. 2006). Theprototype model was developed using Modelmaker from ModelKinetix(http://www.modelkinetix.com/) and then ported to STATA. The STATAcode is available from the author on request.
The following figure provides a flow diagram of the model’s differ-ence equations as implemented by the STATA program aidsproj.ado. Thedark lines with arrowheads indicate flows from a source to a sink. Parameternames close to those arrowheads are defined below the figure. Most ofthem are annual rates of flow expressed as proportions of the sourcepopulation that move towards the sink in a single year. However, theparameter “Cvrg2” represents the proportion of patients needing second-line therapy who gain access to it in a given year. The runs of the modelreported here assume that coverage with second-line therapy starts at 5percent of those needing it in 2006 and levels off at 95 percent of thoseneeding it in 2016.
Parameters of the aidsproj projection model
Proportion of HIV+ newly eligible for ART erate 0.11ART death rate during first year on 1st line adrate1 0.13ART failure rate during subsequent years on 1st line adrate2 0.04
ART death rate of AIDS patients on2nd line bdrate 0.01
Non-ART death rate of AIDS patients ndrate 0.3Starting coverage rate for 2nd-line ART11 strtcov2 0.05Target coverage rate for 2nd-line ART trgtcov2 0.952nd-line ART to reach target in year trgtyr 2016Scale up of 1st-line modeled as constant proportion (1 - lambda) of unmet
need, where lambda is constant across all countries and equal to:Historical scale-up lambda = 0.82Rapid scale-up lambda = 0.05
Annual cost per patient of first-line drugs12 US$227Annual cost per patient of second-line drugs US$2,681Annual cost per patient of clinic time US$278
The Fiscal Burden of AIDS Treatment on South Asian Health Care Systems 185
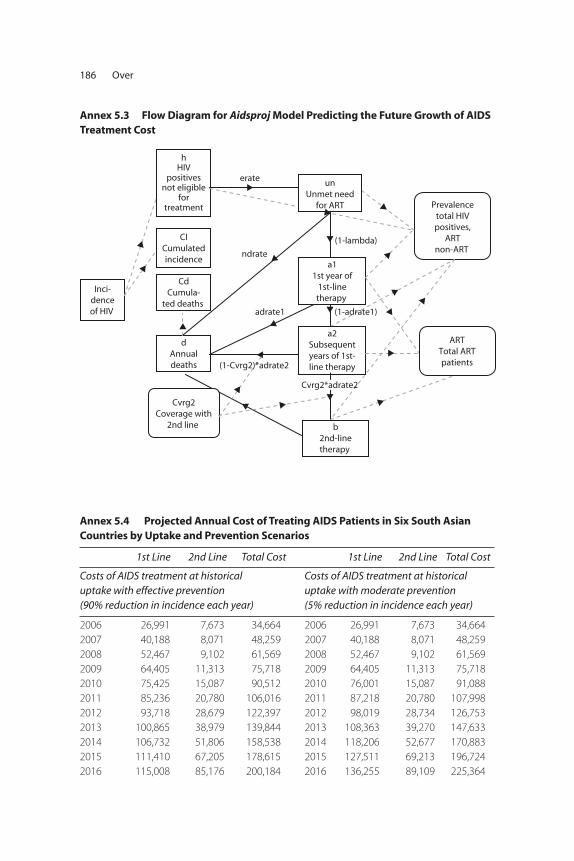
186 Over
Inci-denceof HIV
hHIV
positivesnot eligible
fortreatment
CICumulatedincidence
dAnnualdeaths
Cvrg2Coverage with
2nd line
a11st year of
1st-linetherapy
b2nd-linetherapy
Prevalencetotal HIVpositives,
ARTnon-ART
ARTTotal ARTpatients
CdCumula-
ted deaths
a2Subsequentyears of 1st-line therapy
erate
ndrate
adrate1
(1-Cvrg2)*adrate2
(1-adrate1)
(1-lambda)
unUnmet need
for ART
Cvrg2*adrate2
Annex 5.3 Flow Diagram for Aidsproj Model Predicting the Future Growth of AIDSTreatment Cost
Annex 5.4 Projected Annual Cost of Treating AIDS Patients in Six South Asian Countries by Uptake and Prevention Scenarios
1st Line 2nd Line Total Cost 1st Line 2nd Line Total Cost
Costs of AIDS treatment at historical uptake with effective prevention (90% reduction in incidence each year)
Costs of AIDS treatment at historicaluptake with moderate prevention(5% reduction in incidence each year)
2006 26,991 7,673 34,664 2006 26,991 7,673 34,664
2007 40,188 8,071 48,259 2007 40,188 8,071 48,259
2008 52,467 9,102 61,569 2008 52,467 9,102 61,569
2009 64,405 11,313 75,718 2009 64,405 11,313 75,718
2010 75,425 15,087 90,512 2010 76,001 15,087 91,088
2011 85,236 20,780 106,016 2011 87,218 20,780 107,998
2012 93,718 28,679 122,397 2012 98,019 28,734 126,753
2013 100,865 38,979 139,844 2013 108,363 39,270 147,633
2014 106,732 51,806 158,538 2014 118,206 52,677 170,883
2015 111,410 67,205 178,615 2015 127,511 69,213 196,724
2016 115,008 85,176 200,184 2016 136,255 89,109 225,364
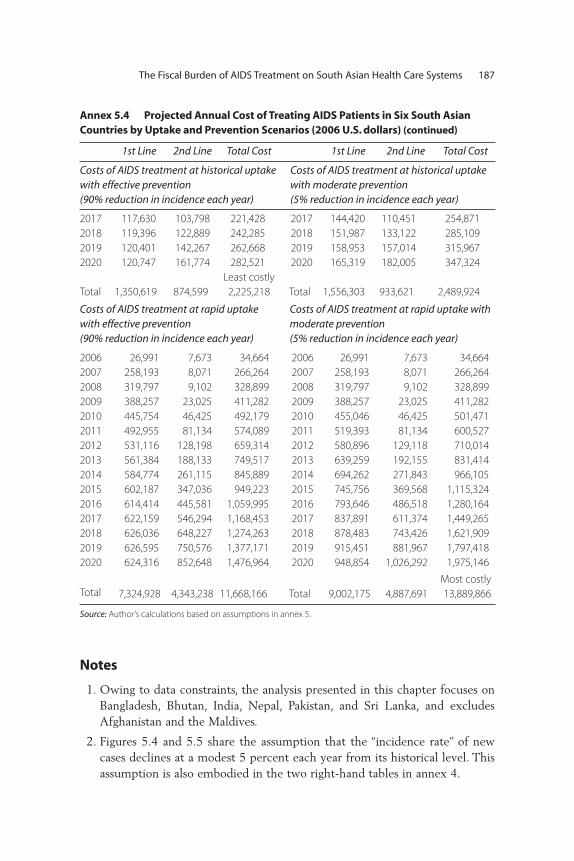
Notes
1. Owing to data constraints, the analysis presented in this chapter focuses onBangladesh, Bhutan, India, Nepal, Pakistan, and Sri Lanka, and excludesAfghanistan and the Maldives.
2. Figures 5.4 and 5.5 share the assumption that the “incidence rate” of newcases declines at a modest 5 percent each year from its historical level. Thisassumption is also embodied in the two right-hand tables in annex 4.
The Fiscal Burden of AIDS Treatment on South Asian Health Care Systems 187
Annex 5.4 Projected Annual Cost of Treating AIDS Patients in Six South Asian Countries by Uptake and Prevention Scenarios (2006 U.S. dollars) (continued)
1st Line 2nd Line Total Cost 1st Line 2nd Line Total Cost
Costs of AIDS treatment at historical uptakewith effective prevention (90% reduction in incidence each year)
Costs of AIDS treatment at historical uptakewith moderate prevention(5% reduction in incidence each year)
2017 117,630 103,798 221,428 2017 144,420 110,451 254,871
2018 119,396 122,889 242,285 2018 151,987 133,122 285,109
2019 120,401 142,267 262,668 2019 158,953 157,014 315,967
2020 120,747 161,774 282,521 2020 165,319 182,005 347,324
Total 1,350,619 874,599
Least costly
2,225,218 Total 1,556,303 933,621 2,489,924
Costs of AIDS treatment at rapid uptakewith effective prevention (90% reduction in incidence each year)
Costs of AIDS treatment at rapid uptake withmoderate prevention(5% reduction in incidence each year)
2006 26,991 7,673 34,664 2006 26,991 7,673 34,664
2007 258,193 8,071 266,264 2007 258,193 8,071 266,264
2008 319,797 9,102 328,899 2008 319,797 9,102 328,899
2009 388,257 23,025 411,282 2009 388,257 23,025 411,282
2010 445,754 46,425 492,179 2010 455,046 46,425 501,471
2011 492,955 81,134 574,089 2011 519,393 81,134 600,527
2012 531,116 128,198 659,314 2012 580,896 129,118 710,014
2013 561,384 188,133 749,517 2013 639,259 192,155 831,414
2014 584,774 261,115 845,889 2014 694,262 271,843 966,105
2015 602,187 347,036 949,223 2015 745,756 369,568 1,115,324
2016 614,414 445,581 1,059,995 2016 793,646 486,518 1,280,164
2017 622,159 546,294 1,168,453 2017 837,891 611,374 1,449,265
2018 626,036 648,227 1,274,263 2018 878,483 743,426 1,621,909
2019 626,595 750,576 1,377,171 2019 915,451 881,967 1,797,418
2020 624,316 852,648 1,476,964 2020 948,854 1,026,292 1,975,146
Total 7,324,928 4,343,238 11,668,166 Total 9,002,175 4,887,691
Most costly
13,889,866
Source: Author’s calculations based on assumptions in annex 5.
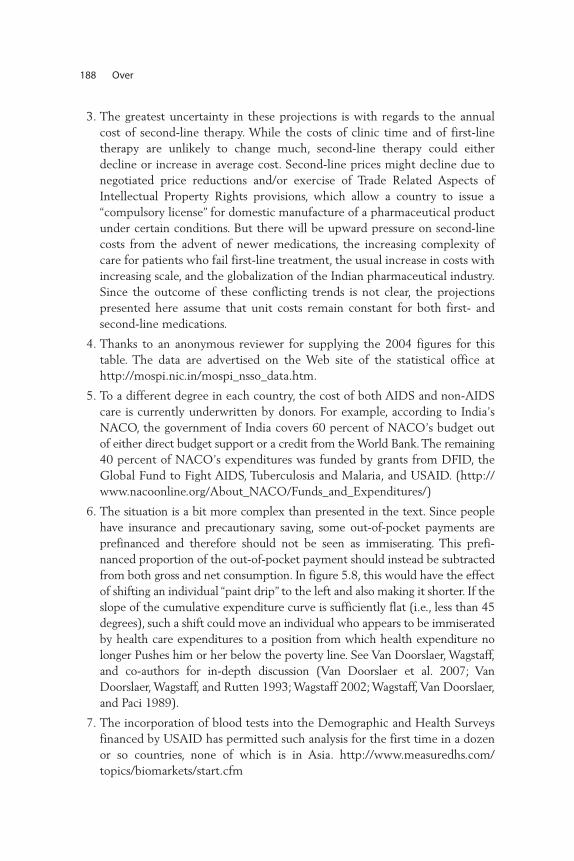
3. The greatest uncertainty in these projections is with regards to the annualcost of second-line therapy. While the costs of clinic time and of first-linetherapy are unlikely to change much, second-line therapy could eitherdecline or increase in average cost. Second-line prices might decline due tonegotiated price reductions and/or exercise of Trade Related Aspects ofIntellectual Property Rights provisions, which allow a country to issue a“compulsory license” for domestic manufacture of a pharmaceutical productunder certain conditions. But there will be upward pressure on second-linecosts from the advent of newer medications, the increasing complexity ofcare for patients who fail first-line treatment, the usual increase in costs withincreasing scale, and the globalization of the Indian pharmaceutical industry.Since the outcome of these conflicting trends is not clear, the projectionspresented here assume that unit costs remain constant for both first- and second-line medications.
4. Thanks to an anonymous reviewer for supplying the 2004 figures for thistable. The data are advertised on the Web site of the statistical office athttp://mospi.nic.in/mospi_nsso_data.htm.
5. To a different degree in each country, the cost of both AIDS and non-AIDScare is currently underwritten by donors. For example, according to India’sNACO, the government of India covers 60 percent of NACO’s budget outof either direct budget support or a credit from the World Bank. The remaining40 percent of NACO’s expenditures was funded by grants from DFID, theGlobal Fund to Fight AIDS, Tuberculosis and Malaria, and USAID. (http://www.nacoonline.org/About_NACO/Funds_and_Expenditures/)
6. The situation is a bit more complex than presented in the text. Since peoplehave insurance and precautionary saving, some out-of-pocket payments areprefinanced and therefore should not be seen as immiserating. This prefi-nanced proportion of the out-of-pocket payment should instead be subtractedfrom both gross and net consumption. In figure 5.8, this would have the effectof shifting an individual “paint drip” to the left and also making it shorter. If theslope of the cumulative expenditure curve is sufficiently flat (i.e., less than 45degrees), such a shift could move an individual who appears to be immiseratedby health care expenditures to a position from which health expenditure nolonger Pushes him or her below the poverty line. See Van Doorslaer, Wagstaff,and co-authors for in-depth discussion (Van Doorslaer et al. 2007; VanDoorslaer, Wagstaff, and Rutten 1993; Wagstaff 2002; Wagstaff, Van Doorslaer,and Paci 1989).
7. The incorporation of blood tests into the Demographic and Health Surveysfinanced by USAID has permitted such analysis for the first time in a dozenor so countries, none of which is in Asia. http://www.measuredhs.com/topics/biomarkets/start.cfm
188 Over
8. High-quality AIDS treatment will not only maximize adherence, and thuspatient survival, but will also minimize transmission in the communitythrough outreach programs. Potential mechanisms to achieve this goal arediscussed in Over and others (2006) and Over and others (2007).
9. A reviewer points out that the government of India has recently committedto increasing health expenditure from its present 1 percent of GDP to 2 per-cent to 3 percent of GDP by 2012. This paper shows that expansion of AIDStreatment could potentially absorb all of such an increase.
10. See the Spectrum projection model for an alternative approach: http://www.futuresinstitute.org/.
11. The model embodies the assumption that, for those people who fail first-lineART, access to second-line ART expands along a logistic curve from about 5 percent of all patients needing it now to 95 percent of all patients needingit in 2016.
12. Drug costs are assumed to vary across countries with the 2006 GDP percapita of the country according to the patterns observed by WHO in thatyear, and then to remain constant (in constant dollars) in any given countryover time. While the costs of drugs may be reduced as markets for antiretro-viral drugs become more contestable, the unit costs of achieving high ARTuptake and strong adherence may increase at the same rate, leaving averagecosts per patient unchanged.
References
Das J., and J.S. Hammer. 2004. “Strained Mercy: The Quality of Medical Care inDelhi.” Policy Research Working Paper No. 3228, World Bank, Washington, DC.
Hira, Subhash K. 2003. “ART Prescribing Physicians in India.” Background paperto HIV/AIDS Treatment and Prevention in India, Modeling the cost and con-sequences, M. Over and others, 2004. Health, Nutrition Population Series,Human Development, The World Bank, DC.
Over M., E. Marseille, K. Sudhakar, J. Gold, I. Gupta, A. Indrayan, S. Hira,N. Nagelkerke, A.S. Rao, and P. Heywood. 2006. “Antiretroviral Therapy andHIV Prevention in India: Modeling Costs and Consequences of PolicyOptions. Sexually Transmitted Diseases 33 (Supplement 10): S145–S152.
Over M., A. Revenga, E. Masaki, W. Peerapatanapokin, J. Gold, V.Tangcharoensathien, and S. Thanprasertsuk. 2007. “The Economics of EffectiveAIDS Treatment in Thailand.” AIDS 21 (Supplement 4): S105–S116.
Over M., P. Heywood, E. Marseille, I. Gupta, S. Hira, N. Nagelkerke, and A.S. Rao.2004. HIV/AIDS Treatment and Prevention in India: Modeling the Costs andConsequences. Washington, DC: World Bank.
The Fiscal Burden of AIDS Treatment on South Asian Health Care Systems 189

Peters, David H., Abdo S. Yazbeck, Rashmi R. Sharma, G.N.V. Ramana, Lant H.Pritchett, and Adam Wagstaff. 2002. A Better Health Systems for India’s Poor:Findings, Analysis, and Options. Washington, DC: World Bank.
Sengupta A., S. Nundy. 2005. “The Private Health Sector in India.” British MedicalJournal 331 (7526): 1157–8.
Sheikh K., S. Rangan, D. Deshmukh, Y. Dholakia, and J. Porter. 2005. “Urban PrivatePractitioners: Potential Partners in the Care of Patients with HIV/AIDS.”National Medical Journal of India 18 (1): 32–6.
Shrestha N.K., Na. Bhatta, and N. Bhatta. 2006. “Current Status of Inpatient HIVCare at a Tertiary Care Center in Nepal.” Scandinavian Journal of InfectiousDiseases 38 (5): 366–70.
Steinbrook, Robert. 2007. “HIV in India—The Challenges Ahead.” New EnglandJournal of Medicine 356 (12): 1197–201.
van Doorslaer, E., and others. 2006. “Effect of Payments for Health Care onPoverty Estimates in 11 Countries in Asia: An Analysis of Household SurveyData.” The Lancet 368 (9544): 1357–64.
van Doorslaer E., and others. 2007. “Catastrophic Payments for Health Care inAsia.” Health Economics. 16 (11): 1159–84.
van Doorslaer E., A. Wagstaff, and F.F.H. Rutten. 1993. Equity in the Finance andDelivery of Health Care: An International Perspective. Oxford: Oxford UniversityPress.
Wagstaff A. 2002. Inequalities in Health in Developing Countries: Swimming againstthe Tide? Washington, DC: World Bank, Development Research Group, PublicServices, and Human Development Network, Health, Nutrition, andPopulation Team.
Wagstaff A., E. van Doorslaer, and P. Paci. 1989. “Equity in the Finance andDelivery of Health Care: Some Tentative Cross-country Comparisons.”OxfordReview of Economic Policy 5 (1): 89–112.
World Bank. 2007. World Development Indicators. Washington, DC: World Bank.
World Health Organization (WHO), Joint United Nations Programme onHIV/AIDS (UNAIDS), and United Nations Children’s Fund (UNICEF).2007. Towards Universal Access—Scaling up Priority HIV/AIDS Interventionsin the Health Sector. Geneva, Switzerland and New York: WHO, UNAIDS, andUNICEF.
World Health Organization (WHO), Joint United Nations Programme onHIV/AIDS (UNAIDS), and United Nations Children’s Fund (UNICEF). 2008.Towards Universal Access—Scaling up Priority HIV/AIDS Interventions in theHealth Sector. Geneva, Switzerland and New York: WHO, UNAIDS, andUNICEF.
190 Over

In April 2004, the government of India announced the Free AntiretroviralTreatment (ART) Program, which brought first-line antiretroviral (ARV)drugs within the reach of a much larger pool of ARV-eligible individuals.However, the full costs of providing treatment, the share of costs across enti-ties involved directly or indirectly in the program, and the possible financialimplications of a more scaled-up program were not much discussed or ana-lyzed in the country, leaving open many questions regarding the cost of theprogram and the implications of scaling up access to treatment. The presentstudy attempts to fill this gap by carrying out a financial analysis of the recur-rent costs of the ART program of the government of India, with a viewto understanding the per-client cost of provision of ART by the govern-ment, the share of various components of the program in total cost, thedistribution of costs across the different bearers of such costs, the resourceimplications of scaling up, and the long-run sustainability of the program.
Introduction
The availability of antiretroviral drugs at reduced cost and the example oflarge-scale antiretroviral treatment programs in countries like Brazil have
Recurrent Costs of India’s Free ART Program
Indrani Gupta, Mayur Trivedi, and SubodhKandamuthan
191
C H A P T E R 6
spurred many other developing countries to start their own ARV treatmentprograms, including India, which launched its Free ART Program in April2004, with the objective of expanding access to antiretroviral treatment,initially in high-prevalence states, and with the plan to subsequently expandto other states.
This chapter discusses the financial implications of scaling up the FreeART Program, and of expanding it on an all-India basis. Most of the analy-sis focuses on estimating unit cost data, which are critical for estimatingthe resource needs, and for any analysis of cost-effectiveness and impactevaluation. Comprehensive estimates of the costs of treatment with ARV,in sufficient breadth and detail to allow for such a scaling-up exercise,were not available so far, either in the public or in the private sector.
The only study of the costs of ARV treatment in India is a recent oneby Bhat and Saha (2006), which uses an incremental cost approach to cal-culate per-client cost of providing ART for a site in Gujarat, and arrives ata figure of Rs. 668 per month. However, these calculations are based onlyon the direct provision of ART and do not take into account other sharedcosts incurred by the different departments of the hospital. To that extent,this figure underestimates the per-client cost, although it provides a veryuseful benchmark for which to compare our results.
From the perspective of the government, however, it is crucial toobtain estimates of such overhead costs, to understand the total recurrentcosts at present, to know how the burden is distributed among differententities, and to understand the feasibility of sustaining the program overthe years. In particular, it is important to understand the extent to whichcore government funds are being spent to sustain the program, as a signif-icant part of the costs of running the program is being borne by the (gov-ernment-funded) hospitals that are actually treating the patients. In orderto fully understand the financial costs of India’s Free ART Program, andto effectively plan and implement the program, it is important to under-stand the actual financial distribution of the costs. Understanding the fullcosts is also necessary to assess the feasibility and sustainability of an ARVtreatment program.
Another objective of the costing exercise is to understand the compo-nent of total cost that is borne by individuals. This is important not onlyfrom a financial perspective, but also in terms of the potential impacts ofHIV and AIDS on the household level. As will be shown below, the “free”program does not imply that the entire ARV treatment is free; individualsbear a significant burden of accessing ART, which needs to be analyzed tounderstand whether such costs impose a barrier to the available treatment.
192 Gupta, Trivedi, and Kandamuthan

The present study thus attempts a full financial analysis of the recur-rent costs of the ART program of the government of India, with a view tounderstand the following:
• The per-client cost of provision of ART by the government • The share of various components of the program in total cost • The distribution of costs across the different bearers of such costs• The resource implications of scaling up and the long-run sustainability
of the program.
The study was completed in consultation with the National AIDSControl Organisation (NACO)1, which also helped in selection of thestudy sites. In addition, in each of the sites, the hospital staff and the con-cerned State AIDS Prevention and Control Societies (SACS) offices wereactively involved in facilitating the research and data collection.
The chapter is organized along the following lines: At the outset, weprovide some background on India’s Free ART Program. The analysisthen proceeds broadly in three main steps. First, we discuss themethodology and the process of data collection, and present informa-tion on the various sites where the study has been conducted. Second,we outline the key assumptions and parameters underlying our unitcost estimates, and present our estimates of unit costs of treatment andof out-of-pocket expenditures associated with care and treatment.Third, we provide estimates of the aggregate costs of India’s Free ARTProgram, and discuss how these would change as the number ofpatients increases or as the prices of key components of treatmentchange. Finally, a discussion of findings highlights some of the keyresults of our study, and a concluding section discusses how these find-ings may help guide policy makers and stakeholders in planning andimplementing India’s Free ART Program.
India’s Free ART Program
While the exact number of infected individuals in the country is sub-ject to debate, NACO estimates indicate that currently there areapproximately 5.2 million people living with HIV and AIDS in India(NACO 2006). In response to the epidemic, NACO is implementing acomprehensive program comprising targeted interventions for groups athigh risk, preventive interventions for the general community, low-costAIDS care, institutional strengthening, and intersectoral collaboration.
Recurrent Costs of India’s Free ART Program 193
Until 2003, access to ART in India was quite limited; it was estimatedthat out of 750,000 ART-eligible individuals in need of treatment, only13,000, or 2 percent of the total, were receiving ART by the end of 2003.At that time, ART was delivered mainly through the private sector.Although ARVs were also provided in the public sector through variousgovernment institutions like the Central Government Health Scheme(CGHS), Employees State Insurance Corporation (ESIC), the ArmedForces Medical Services, and the railways, these arrangements were notsystematic or by design, and were in place mainly as part of medical ben-efit schemes in these government organizations. Clearly, there was onlyvery limited access to ARVs in the country till 2003, with most of the indi-viduals requiring ART accessing private providers, who were more likelyoffering “unstructured” ART (Over et al. 2004). The health financing situ-ation in the country continued to present a somewhat bleak scenario, withtotal health expenditure at about 5.2 percent of GDP, of which only 1 per-cent was from the government sector (World Bank 2001). Many studiescorroborated the fact that the major part of health expenditure in Indiawas on curative care, and it was financed mostly out of pocket (Ministryof Health and Family Welfare (MoHFW) 2005). Given the high level ofsustained financing required for ART, as well as the limited access to drugs,it was clear that ART was neither affordable nor available to a vast major-ity of infected individuals, who were already reeling under significant out-of-pocket expenditure for other health issues. Most important, with ARTbeing offered by the unregulated private sector, where adherence andmonitoring were serious issues, the situation was ripe for an interventionlike the subsequent government program.
Thus, with domestic and international pressures to respond to theincreasing treatment need—and despite concerns raised around the abilityof the health system to handle a complex therapy like ART—the govern-ment, on the eve of World AIDS Day 2003, announced its program of freedistribution of ARVs in selected states. In June 2004, the Global Fund onAIDS, TB, and Malaria (GFATM) awarded a financial grant of US$165million to provide ART in the public sector and through public-privatepartnerships to 100,000 people living with AIDS over a five-year period(see http://www.nacoonline.org/directory_arv.htm).
As announced by the then-health minister, the actual plan aimed atnot only providing free antiretroviral treatment to 100,000 people livingwith HIV and AIDS by the end of 2005, but to provide treatment to anadditional 15 percent to 20 percent of AIDS cases each year thereafter,for a period of five years. The rollout started in April 2004, and covered
194 Gupta, Trivedi, and Kandamuthan
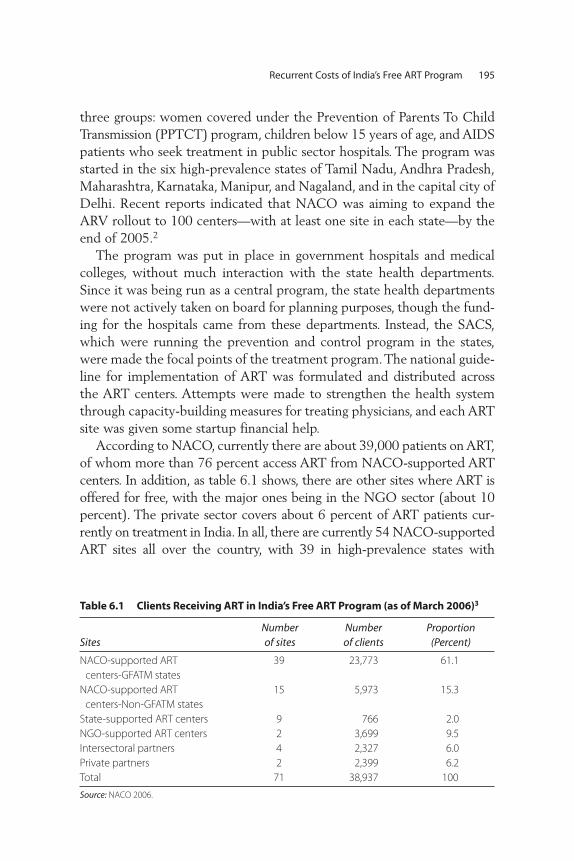
three groups: women covered under the Prevention of Parents To ChildTransmission (PPTCT) program, children below 15 years of age, and AIDSpatients who seek treatment in public sector hospitals. The program wasstarted in the six high-prevalence states of Tamil Nadu, Andhra Pradesh,Maharashtra, Karnataka, Manipur, and Nagaland, and in the capital city ofDelhi. Recent reports indicated that NACO was aiming to expand theARV rollout to 100 centers—with at least one site in each state—by theend of 2005.2
The program was put in place in government hospitals and medicalcolleges, without much interaction with the state health departments.Since it was being run as a central program, the state health departmentswere not actively taken on board for planning purposes, though the fund-ing for the hospitals came from these departments. Instead, the SACS,which were running the prevention and control program in the states,were made the focal points of the treatment program. The national guide-line for implementation of ART was formulated and distributed acrossthe ART centers. Attempts were made to strengthen the health systemthrough capacity-building measures for treating physicians, and each ARTsite was given some startup financial help.
According to NACO, currently there are about 39,000 patients on ART,of whom more than 76 percent access ART from NACO-supported ARTcenters. In addition, as table 6.1 shows, there are other sites where ART isoffered for free, with the major ones being in the NGO sector (about 10percent). The private sector covers about 6 percent of ART patients cur-rently on treatment in India. In all, there are currently 54 NACO-supportedART sites all over the country, with 39 in high-prevalence states with
Recurrent Costs of India’s Free ART Program 195
Table 6.1 Clients Receiving ART in India’s Free ART Program (as of March 2006)3
SitesNumber of sites
Number of clients
Proportion(Percent)
NACO-supported ART
centers-GFATM states
39 23,773 61.1
NACO-supported ART
centers-Non-GFATM states
15 5,973 15.3
State-supported ART centers 9 766 2.0
NGO-supported ART centers 2 3,699 9.5
Intersectoral partners 4 2,327 6.0
Private partners 2 2,399 6.2
Total 71 38,937 100
Source: NACO 2006.

GFATM-supported programs (Tamil Nadu, Maharashtra, Andhra Pradesh,Karnataka, Manipur, Nagaland, and Delhi). Another 15 sites are inmedium- to low-prevalence states that are not being funded through theGFATM grant.
Methodology and Data Collection
The unit cost of any intervention is measured as the total cost divided bythe output measure. It is an average figure and indicates the cost neededper intervention. An economic cost analysis involves a broader evaluationof resources used, regardless of who actually pays for those resources.Calculation of unit economic costs includes financial costs, and values allresources that go into the program, at costs that reflect their true value inalternative uses.
To arrive at unit costs, it is necessary to first identify the componentsof the program, and then to cost each of these components in its entirety.Different approaches have been adopted for arriving at the functionalcomponents of an ART program, but we broadly distinguish the follow-ing components:
• ARV drugs• OI treatment• Diagnostic tests • Outpatient department (OPD) service• Inpatient department (IPD) service
Ideally, a full costing exercise should include both recurrent and capitalcosts, as well as fixed recurrent costs that are applicable every few years,like costs of training and maintenance. However, in this analysis, the capi-tal costs have not been considered for three main reasons.
First, from the scaling-up perspective, the recurrent costs are moreuseful to policy makers, and equipment purchase—which in resource-poor settings often means a CD4 machine—can be treated as a separateitem, whenever relevant. Second, the relevant capital costs for the ARTcenter seemed to be a small component of total capital costs in the sam-ple hospitals, so excluding these from calculations was unlikely to biasthe unit costs estimates too much. Finally, and in view of the earlierpoints made, it did not seem worthwhile to pursue a tracking of capitalcosts in these hospitals, since the data on dates of purchase of machinesand their lifespan were very difficult to obtain.
196 Gupta, Trivedi, and Kandamuthan
A key component of our costing exercise involves estimating sharedcosts, that is, costs of inputs that are not obviously part of the ART pro-gram, but indirectly are important for the program to run. In India, theprogram is being run in government hospitals, and a significant part ofthe ART program costs is being borne by the hospitals themselves, whichis included in our analysis.
Regarding the costs incurred at the outpatient and inpatient depart-ments, in addition to drugs and other costs, these would include humanresources. Physicians’ time (and that of other health care personnel) tolook at patients, treat opportunistic infections (OI), or run the diagnostictests are, in principle, already counted under these headings. However, ifthese individuals are spending additional time on the ART program, thevalue of additional time would need to be attributed to the program.
The analysis calculates mainly financial costs, rather than economiccosts, using shadow prices. In the absence of capital costs, the relevance ofshadow prices in the ART program comes mostly from the value of per-sonnel in the program; however, since the perspective is programmatic,rather than societal (except for the component of costs incurred by anindividual), only costs accruing to the government have been considered.It is recognized that physicians trained in the ART centers have highopportunity costs in the private sector, but if the government wants toscale up the program, it would have to hire the physicians at rates that aredetermined within the public sector pay scale, which does not allow foradditional incentives.
Recurrent Costs of India’s Free ART Program 197
Box 6.1
Studies of the Costs of National Antiretroviral TreatmentPrograms
At the macro level, cost studies can help track and assess the impact of funds and
provide information for estimation of future resource requirements. There have
been studies done on costing of ART programs with a view to informing policy on
scaling up. The first country to offer a public program with ARV was Brazil, which
triggered a spate of studies on cost and cost-effectiveness of ART (see, for exam-
ple, Bastos et al. 2001). While pointing out the cost-effectiveness of ART, these
studies also documented issues of program management and implementation.
The more recent studies have taken as given the cost-effectiveness of giving ART,
but have focused more on scaling up and their financial implications.
(continued)

198 Gupta, Trivedi, and Kandamuthan
Box 6.1 (Continued)
A review of several costing studies on South Africa (see Boulle et al. 2003) indicate
that anticipated coverage remains the key uncertainty in cost estimates, and em-
phasize service capacity and readiness—rather than resources—as critical issues
in scaling up. More recent costing studies look at resource requirements. For exam-
ple, a study based on Nigeria (Kombe and others 2004) estimates the total cost of
ARV in the public sector in Nigeria, and includes costs of voluntary counseling
and testing, treatment of opportunistic infections, and other resource require-
ments of implementing the national program. They find that drugs comprise the
largest single component (50 percent) of the total cost of the program, followed
by monitoring tests and labor costs. Significantly, the study also finds that a large
proportion of the treatment costs are borne by the patients for both tests and
drugs. A similar study done for Zambia (Kombe et al. 2003) brings out the need for
caution in scaling up based on estimates of per-unit cost of the government pro-
gram, and from the perspective of sustainability.
A recent study from Thailand (Supakankunti 2004) evaluates the economic
costs associated with the national program and analyzes the costs borne by pa-
tients and their productivity changes. In 2006, a national report for policy advice
prepared by the World Bank (The Economics of Effective AIDS Treatment: Evalu-
ating Policy Options for Thailand) evaluates the costs of various policy options by
estimating the average costs of ART per patient by modes of service delivery,
types of drug regimens, and stages of disease. The report concludes with the
finding that under its primary set of assumptions, the Thai program to treat
AIDS patients has the potential to save millions of lives, although the program
is less cost-effective than a similar program with first-line therapy.
Extensive studies on ART costing in the context of South Asian countries are rel-
atively rare, with the most recent one conducted in Gujarat using an incremental
cost approach to calculate per-client cost of providing ART (Bhat and Saha 2006).
Cost analysis is a powerful tool, and programs can use the data generated to
develop realistic budgets, calculate the efficient use of resources, and under-
stand the demands of scale-up or replication (Guinness 2004). The interest in,
and relevance of, costing also prompted a few attempts at coming up with a
standardized costing tool; for example, the Cape Town Antiretroviral Costing
model developed by Boulle et al. (2004) was aimed at researchers and planners
for estimating the cost of ART programs using a series of simple worksheets.
Source: Authors.

Recurrent Costs of India’s Free ART Program 199
Since the NACO program created an ART center at each site, andfunded most of it, for estimating the cost associated with the ART clinic,this exercise entailed a straightforward collation of costs, mainly cost datafrom the SACS offices. Mostly, these were costs borne by NACO, butwherever any other staff was putting in full-time work, their time andsalary were included as well. Attributing costs at the level of the hospitalsis a more complicated exercise, involving the following steps:
• Identifying the major departments that were involved in treating ARTpatients. Most often the departments involved in the ART includedmedicine, skin/STD, and gynecology4
• Collecting total IPD and OPD data from these departments, as well asnumbers of ART patients being sent to the various departments
• Collecting information on time allocation (for ART) of physicians andother health personnel of these core departments
• Identifying the major diagnostic departments involved in running testsfor ART patients (microbiology, radiology, pathology, and biochemistry)
• Collecting details from each site on the various mandatory tests donefor ART patients and frequency of such tests
• Eliciting from these diagnostic departments volume data on tests, sothat allocations due to the ART program could be done
• Collecting departments’ annual expenditure data for each of the coreand diagnostic departments identified as being directly or indirectlyinvolved in the ART program
• Allocating costs to each of the departments based on volume data• Collecting volume data from voluntary counseling and testing clinics,
which is taken to be the most unambiguous measure of increase inpatient load, to see trends over time
• Collecting expenditures incurred by NACO/SACS on drugs purchased,training, and CD4 test kits and reagents.
Additionally, we collected data on the human resource costs incurredon the level of NACO and SACS that can be attributed to the ART clinicprogram by collecting data on the time allocation of the relevant staff.
Once all the cost components were in, the total cost for each of the siteswas calculated and the unit costs arrived at by a simple division of totalcosts by the number of clients being treated at the end of the study period.An alternative definition of volume, defined by “total client months on
therapy” at the end of study period, was also calculated and used asanother denominator, as will be explained below.
An important component of the total cost of the ART program isexpenditures incurred by the patients themselves in accessing ART fromthe sites. A total of 264 interviews were conducted, spread over all theART sites, with a focused questionnaire that attempted to elicit theamounts individuals had to spend out of pocket to access the free ART atthe sites, such as the costs of ART drugs, OI drugs, tests, transport, lodging,lost wages, and food. Some clients received support from various NGOswhile they were on the government ART program; for lack of data avail-ability, the costs of this support are not being considered in this analysis.
The study was completed in two phases. The first phase was anexploratory phase, where the initially selected sites were visited to under-stand the feasibility of the research. Based upon the analysis and findingsof the first phase, the final list of sites was drawn up, methodology wasfinalized, and activities were mapped out for the next nine months ofthe project.
The following seven sites were selected for the study based on Phase Iof the study, and in consultation with NACO:
• Government Hospital of Thoracic Medicine (GHTM), Tambaram,Chennai, Tamil Nadu
• Regional Institute of Medical Sciences (RIMS), Imphal, Manipur• BJ Medical College, Ahmedabad, Gujarat • Lok Nayak Jai Prakash (LNJP) Hospital, New Delhi • Dr. Ram Manohar Lohia (RML) Hospital, New Delhi• Government Medical College and Hospital, Trivandrum, Kerala• Government Medical College and Hospital, Thrissur, Kerala.
Since the aim was to understand the cost of the Free ART Program, twosites that were initially not supported by NACO, but were also offering freetreatment (supported by the state government) were included as well: theseare the two Kerala sites at Trivandrum Medical College and Thrissur MedicalCollege. The Trivandrum Medical College became a NACO-supported sitein May 2005, and the Thrissur site was inducted into the NACO programin November 2005. This also allowed some analysis of the differencesbetween a state-run program and a NACO-supported program. Over thetwo phases, several field trips, meetings, and discussions were held with avariety of individuals in the hospitals, SACS, and NACO, including themedical superintendents (MS) at hospitals, treating physicians, pharmacists,
200 Gupta, Trivedi, and Kandamuthan
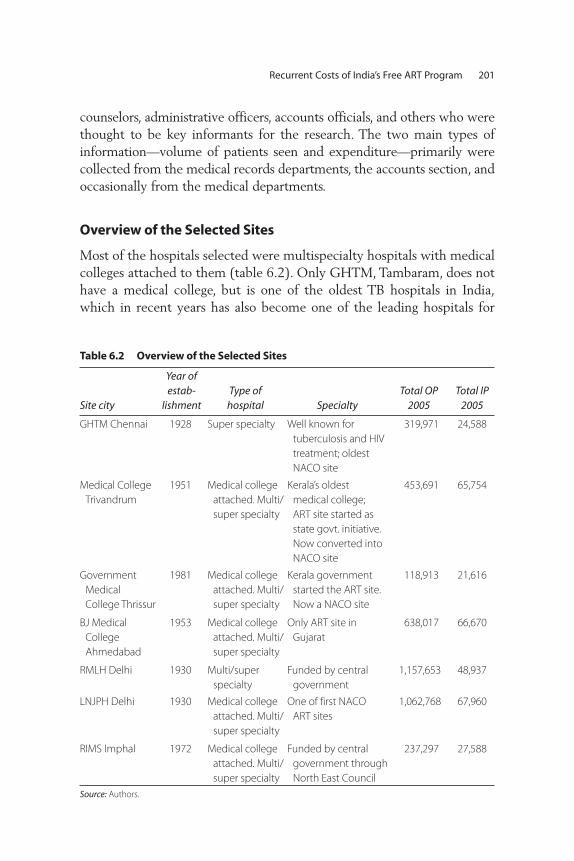
Recurrent Costs of India’s Free ART Program 201
counselors, administrative officers, accounts officials, and others who werethought to be key informants for the research. The two main types ofinformation—volume of patients seen and expenditure—primarily werecollected from the medical records departments, the accounts section, andoccasionally from the medical departments.
Overview of the Selected Sites
Most of the hospitals selected were multispecialty hospitals with medicalcolleges attached to them (table 6.2). Only GHTM, Tambaram, does nothave a medical college, but is one of the oldest TB hospitals in India,which in recent years has also become one of the leading hospitals for
Table 6.2 Overview of the Selected Sites
Site city
Year ofestab-
lishmentType of
hospital SpecialtyTotal OP
2005Total IP
2005
GHTM Chennai 1928 Super specialty Well known for
tuberculosis and HIV
treatment; oldest
NACO site
319,971 24,588
Medical College
Trivandrum
1951 Medical college
attached. Multi/
super specialty
Kerala’s oldest
medical college;
ART site started as
state govt. initiative.
Now converted into
NACO site
453,691 65,754
Government
Medical
College Thrissur
1981 Medical college
attached. Multi/
super specialty
Kerala government
started the ART site.
Now a NACO site
118,913 21,616
BJ Medical
College
Ahmedabad
1953 Medical college
attached. Multi/
super specialty
Only ART site in
Gujarat
638,017 66,670
RMLH Delhi 1930 Multi/super
specialty
Funded by central
government
1,157,653 48,937
LNJPH Delhi 1930 Medical college
attached. Multi/
super specialty
One of first NACO
ART sites
1,062,768 67,960
RIMS Imphal 1972 Medical college
attached. Multi/
super specialty
Funded by central
government through
North East Council
237,297 27,588
Source: Authors.
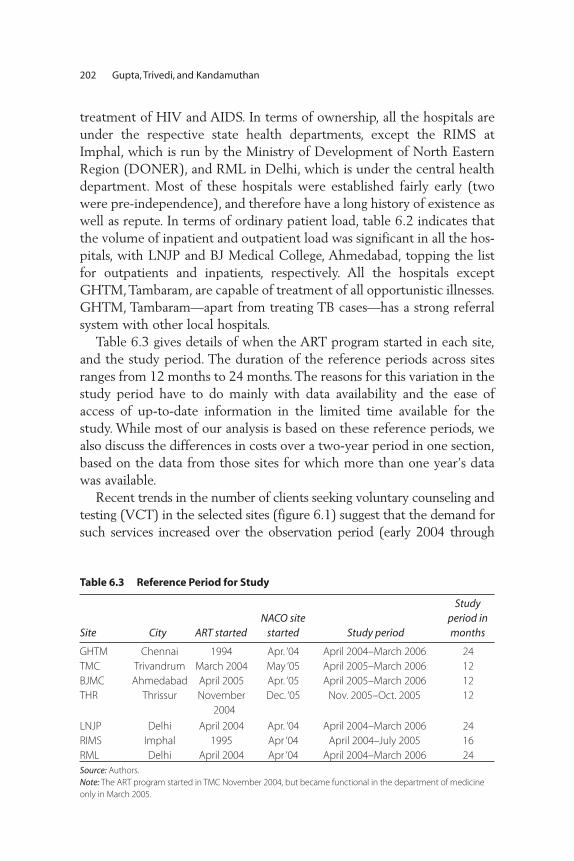
202 Gupta, Trivedi, and Kandamuthan
treatment of HIV and AIDS. In terms of ownership, all the hospitals areunder the respective state health departments, except the RIMS atImphal, which is run by the Ministry of Development of North EasternRegion (DONER), and RML in Delhi, which is under the central healthdepartment. Most of these hospitals were established fairly early (twowere pre-independence), and therefore have a long history of existence aswell as repute. In terms of ordinary patient load, table 6.2 indicates thatthe volume of inpatient and outpatient load was significant in all the hos-pitals, with LNJP and BJ Medical College, Ahmedabad, topping the listfor outpatients and inpatients, respectively. All the hospitals exceptGHTM, Tambaram, are capable of treatment of all opportunistic illnesses.GHTM, Tambaram—apart from treating TB cases—has a strong referralsystem with other local hospitals.
Table 6.3 gives details of when the ART program started in each site,and the study period. The duration of the reference periods across sitesranges from 12 months to 24 months. The reasons for this variation in thestudy period have to do mainly with data availability and the ease ofaccess of up-to-date information in the limited time available for thestudy. While most of our analysis is based on these reference periods, wealso discuss the differences in costs over a two-year period in one section,based on the data from those sites for which more than one year’s datawas available.
Recent trends in the number of clients seeking voluntary counseling andtesting (VCT) in the selected sites (figure 6.1) suggest that the demand forsuch services increased over the observation period (early 2004 through
Table 6.3 Reference Period for Study
Site City ART startedNACO site
started Study period
Studyperiod inmonths
GHTM Chennai 1994 Apr. ‘04 April 2004–March 2006 24
TMC Trivandrum March 2004 May ‘05 April 2005–March 2006 12
BJMC Ahmedabad April 2005 Apr. ‘05 April 2005–March 2006 12
THR Thrissur November
2004
Dec. ‘05 Nov. 2005–Oct. 2005 12
LNJP Delhi April 2004 Apr. ‘04 April 2004–March 2006 24
RIMS Imphal 1995 Apr ‘04 April 2004–July 2005 16
RML Delhi April 2004 Apr ‘04 April 2004–March 2006 24
Source: Authors.
Note: The ART program started in TMC November 2004, but became functional in the department of medicine
only in March 2005.

Recurrent Costs of India’s Free ART Program 203
late 2005). This could reflect an increase in HIV prevalence or the numberof clients requiring treatment, or an increase in HIV awareness.
Before elaborating more on the actual functioning of the sites, briefmention must be made on the initial assistance given by NACO to startthe program in the selected sites. At the time of setting up the sites,NACO had promised to sanction funds for two medical officers (one sen-ior and one junior), one data entry operator (DEO), one counselor, onelab technician, and one recordkeeper/computer operator. In addition, acontingency grant of Rs. 100,000 was to be provided during the first yearof the program, including the cost of a dedicated computer along with aprinter and Internet. From the second year onward, a contingency grantof Rs. 50,000 was also to be given to each ART unit, according to the draftversion of the National Guidelines for Implementation of AntiretroviralTherapy of August 2004.
We found that the study sites differed significantly from one anotherin terms of personnel, procurement of drugs for ART and OI, issues aroundtreatment of opportunistic illnesses, and data management. Below, someof these issues and concerns are listed without mention of specific sites;it must be noted that not all the sites had similar problems.
0
50
100
150
200
250
300
350
400
450
500
2004 2005
nu
mb
er o
f clie
nts
see
kin
g V
CT
year/month
2 5 8 11 2 5 8 11
BJMC LNJP RIMS RML TVM THR
Figure 6.1 Trend in Pretest Counseling at VCTC
Source: NACO-MIS.
• Initial funding for opening the site not always forthcoming.• Dedicated physicians not in place (sites managed by drawing on the
services of other doctors and postgraduate students).• Counselors not appointed, and drawn from VCTC or telecounseling
services.• Smooth supply of drugs not always forthcoming.• No clear guideline for drug dispensing at the sites; practices differed
across sites.• Pharmacist of the hospital overstretched and no allowance for desig-
nated ART pharmacist. Long waiting list for CD4 count investigation.• Reagent supply for CD4 count investigation not always smooth.• Lack of separate infrastructure for the ART site within hospital.• Guidelines for initiating ART not always agreed to by physicians.• Poor data management due to absence of DEO:/recordkeeper or lack
of computerization.
Over the following year, many of these issues were ironed out, but somemanagement concerns continue to plague the program. While costing theprogram in its entirety is important, the management and implementationissues are closely linked to costing: often some of the operational issuescould be solved with careful planning around procurement, personnel, andinfrastructure, all of which can be translated into funding implications. Thefinancial feasibility question is therefore linked closely with the question onthe extent of “structured”-ness of the government ART program. An earlierWorld Bank study (World Bank 2004) had described “structured” ART tomean treatment with the following features:
• Standardized, competency-based training of physicians in ART man-agement
• Prescription of a standard triple-drug regimen• Support from a multidisciplinary team that includes a counselor and a
nutritionist• Regular clinical and lab-based monitoring of the patient’s treatment
status• Counseling to prevent transmission• Prophylaxis for opportunistic illnesses when indicated• Diagnosis and treatment of opportunistic illnesses.
Our study indicates that not all of these characteristics might be presentin all of the sites. In particular, the first three points apparently were not
204 Gupta, Trivedi, and Kandamuthan
always fully satisfied. None of the sites had a dedicated nutritionist whowas helping the patients on ARV. As for prevention, counseling—whileavailable—generally focused on the ART itself rather than prevention; themain task of the counselors was to explain the drugs and how often to takethem. Other operational and management issues included the lack of a ded-icated doctor specialized in ART, the lack of availability of specific drugs forprolonged periods, or the inability to recruit a data management person(which also hampered monitoring of the program to some extent).
Another major finding of the team, not specific to the ART program,regards the general data management in the hospitals, especially book-keeping and accounting. Only one of the hospitals had a breakdown ofexpenditures by department, which meant that the exercise on costapportionment was almost impossible. Lack of proper data implies thatmany additional assumptions have to be made about how the totalannual expenditure of the hospital should be divided among differentdepartments, which renders the costing exercise somewhat tedious aswell as imprecise.
Key Assumptions and Parameters
One of the most important, and conceptually most challenging, variablesthat went into the cost calculations is the number of patients receivingART, that is, the choice of an appropriate denominator for our unit-costcalculations. The number of patients receiving treatment at any pointin time is an imprecise measure, as it does not include patients whohave died, experienced treatment failure, dropped out, or entered orre-entered a program later during the study period. (Also, in a settingwhere the number of people receiving treatment is increasing, the num-ber of patients who have initiated treatment during the study period, orreceived treatment at the end of that time, may be far greater than theaverage number of people receiving treatment during that period.) Thus,matching the cost data (which would relate to costs incurred over alonger period) and the number of people on treatment is not a trivialexercise. Figure 6.2 illustrates this point—of patients who initiated treat-ment during the study period, between 10 percent and 20 percent haddropped out for various reasons in five of the seven sites by the end of thestudy period.
Table 6.4 presents alternative ways of looking at the number of peoplereceiving ART. The first column presents the number of people who everstarted treatment (initiated treatment during the study period), the next
Recurrent Costs of India’s Free ART Program 205

206 Gupta, Trivedi, and Kandamuthan
one indicates the number at the end of the study period, and the third col-umn indicates those who have been on therapy for the entire study period.The last column, which is the ratio of client months to those ever startingtreatment gives an idea of the ability of the program to retain people. Giventhe staggered entry of clients into the program, and attrition due to variousreasons, the number of people receiving treatment at any point in time is avery imprecise indicator of the scale of a treatment program. For this rea-son, our preferred measure of people receiving treatment is “the number ofclient months on treatment,” which gives a much more accurate picture ofthe utilization of the various sites over the study period.5
0%
20%
40%
60%
80%
100%
Tambaram Imphal Ahmedabad LNJP RML Trivandrum Trichur(site)
clients alive and “on therapy”
treatment failure other reasons
net lost to follow-up died
Figure 6.2 Adherence and Reasons for Drop-out across Study Sites
Source: Authors’ compilation of monthly ART reports from study sites.
Table 6.4 Volume on ART – Alternative Definitions
Site
Number ofclients ever
started
Number ofclients at theend of study
period
Number ofclients who
have been ontherapy forentire study
periodEquivalent
client months
Ratio of clientmonths toclients ever
started
Tambaram 2,941 2,606 1,083 25,989 8.8
Imphal 276 226 228 3,642 13.2
Ahmedabad 1,635 1,210 819 9,824 6.0
LNJP 651 523 288 6,901 10.6
RML 1,302 1,205 555 13,317 10.2
Trivandrum 498 498 350 4,200 8.43
Thrissur 353 308 196 2,348 6.7
Source: Generated by authors.
Another important methodological concern is to what extent to attribute the volume of CD4 tests to the ART program. It is a matter ofdebate whether the entire CD4 testing in the reference period should beattributed to the ART program, because CD4 tests were routinely per-formed in many of the sites even before the ART program was put inplace. One could therefore take the costs of only those CD4 tests appliedto people receiving ART. However, this would give an underestimate ofthe cost of the ART programs because a CD4 test is essentially a screen-ing device done prior to putting people on ART. The other option is tolook at the trend in CD4 tests for those centers that had been doing CD4testing prior to the start of ART, project the trend for the referenceperiod, compare that with the actual CD4 tests done, and take the differ-ence as the volume attributable to the ART program.
However, this approach was not easy to adopt. First, only three siteshad CD4 testing facilities well before the start of the respective ART pro-grams. Second, in one of these sites, RIMS, the numbers frequently bouncedaround, mainly due to self-rationing by the hospital, owing to the unavail-ability of drugs, as well as overuse of the machine. Tambaram had a pro-file very different from that of other general hospitals—TB and HIV werethe two major diseases it was dealing with, and the CD4 numbers wereunderstandably much higher than elsewhere. Finally, the CD4 numbersfrom RML, if projected (without ART), seemed similar to the ones withthe ART program.
The issue of additionality of CD4 tests was, therefore, difficult toresolve. In our calculations, we have taken the current CD4 test numbersfor calculating the additional test load, at the risk of slight overestimationof the respective costs. From the point of view of setting up a new sitewith a CD4 machine, there is no easy way to separate the spontaneousdemand for CD4 from demand that is being generated in anticipation ofthe ARV treatment; thus, using the current numbers in the calculationsmay be a reasonable approximation. Regarding the workload for themicrobiologist that can be attributed to the ART program, this seemed tobe around 25 percent to 30 percent of working time on average.
Below, we discuss assumptions, findings, and data sources for the mostimportant components of the costs of the ART program. Additionalassumptions underlying cost estimates are provided in annex 6.1, and anysite-specific assumptions are listed in annex 6.2.
• Human resources to support the ART center. Our research shows thatmany physicians at the hospitals are giving time to the ART centers, in
Recurrent Costs of India’s Free ART Program 207
addition to the ones hired specifically for the program. While the proportion of time spent on treating HIV patients by each practic-ing physician, and the number of physicians contributing to theprogram, varied from site to site—from one to about six physicians—(Tambaram)6 in a general hospital, in no site was the ART center beingrun only by the ART doctor. In some sites, additional health care per-sonnel like nurses were also involved. Most of the extra effort was com-ing from personnel from the medicine department, followed by themicrobiology department.
• Human resources at the ART center. The NACO ART program envis-aged that the following personnel would be required for running eachsite: two medical officers, one DEO, one counselor, one laboratory tech-nician, and one recordkeeper/computer operator. Three out of sevensites did not have two medical officers when they were started, andcounselors were sometimes initially taken from the VCT center. Therest of the personnel were appointed as scheduled in most of the sites;in a few sites the appointments were made late and essentially the hos-pital staffs were running the ART program for a long time. The costs ofART center personnel were straightforward to calculate and could beattributed entirely to NACO or the hospital.
• ARV drugs. The supply of ARV drugs presents a mixed scenario.While NACO was supposed to supply the drugs, the state-initiatedprograms were buying the drugs on their own through the SACS orrelevant state departments. Even after these sites became NACOsites, the drugs continued to be supplied by the state government, atleast for a while. Additionally, there were also instances of NACO-sponsored sites where local-level purchases were made by SACS tofill the demand gaps. The cost of these drugs was obtained from a va-riety of sources: ART monthly reports compiled at the sites (and sub-mitted to the respective SACS) gave figures on consumption of thevarious drugs, which were then used in conjunction with unit prices(obtained from NACO, SACS, or other relevant state agencies7) toarrive at the total cost of drugs consumed. The weighted average ofunit cost was calculated when there was more than one supplier, suchas, both NACO and SACS.
• CD4 kits and reagents. Costs of CD4 tests were calculated based onprices of CD test kits and reagents, as explained in appendix table 6.1.
208 Gupta, Trivedi, and Kandamuthan
• OI & prophylactic drugs. The common prophylactic drug used wasSeptran; the costs of this and other common OI drugs were estimatedusing consumption figures.
• Hospital department support to ART program. Six departments, including four diagnostic departments—radiology, microbiology,pathology, and biochemistry—and medicine and skin departmentswere included in the cost calculations. Departmental costs were themost difficult to obtain, and could be obtained only for one hospi-tal, RIMS, Imphal. Unfortunately, none of the general hospitals keepaccounts separately for each department. Thus, the proportions ondepartmental breakdown of total recurrent costs from RIMS wereused for the other hospitals to arrive at departmental costs for thesesix departments. For medicine and skin, total volume of inpatientadmissions was taken as the denominator, and the admission of ARTpatients as a numerator. Capital costs, such as purchases of equip-ment, were left out of the calculations of the total costs.
• Miscellaneous. This involves refreshments, office charges like printingand stationery by SACS, and other petty expenses, obtained from theSACS office.
• Contingency grant. NACO grants Rs. 50,000 each year for operatingexpenses.
• Training cost. These include the training of an ART team consisting of10 people8 per site. NACO is responsible for arranging and funding alltraining in NACO sites. State programs like those in Kerala followed aslightly different pattern of training. Delhi SACS also arranged sometraining for counselors, which has been included under training costs.For RIMS and Tambaram, which are themselves training sites, therewere no training expenses.
• Establishment grant. Additionally, NACO granted Rs. 50,000 in thefirst year, for example, for the purchase of a computer and printer. Inone site, RIMS, there were expenses for building renovation, whichwere borne by the state SACS.
Before turning to the analysis, it is important to present the differentdrug regimens in some detail, since drugs and drug prices pay a central role
Recurrent Costs of India’s Free ART Program 209
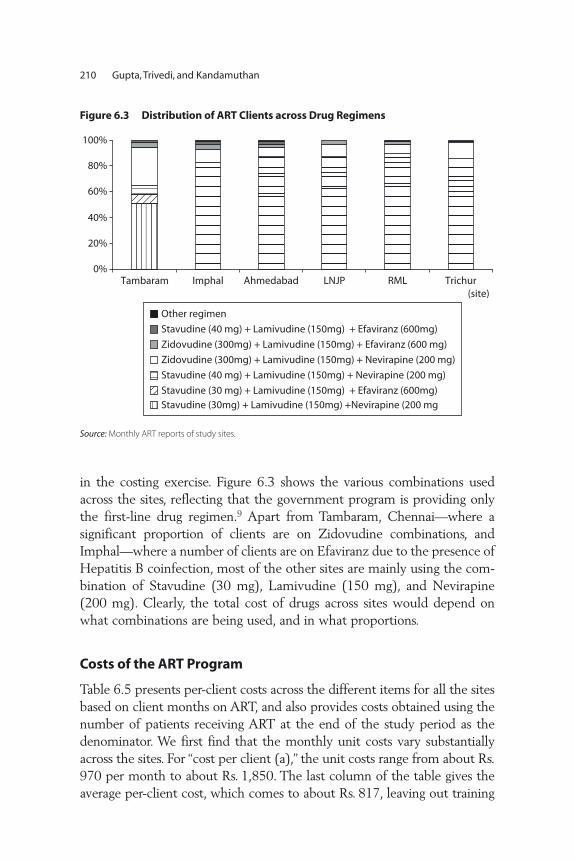
210 Gupta, Trivedi, and Kandamuthan
in the costing exercise. Figure 6.3 shows the various combinations usedacross the sites, reflecting that the government program is providing onlythe first-line drug regimen.9 Apart from Tambaram, Chennai—where a significant proportion of clients are on Zidovudine combinations, andImphal—where a number of clients are on Efaviranz due to the presence ofHepatitis B coinfection, most of the other sites are mainly using the com-bination of Stavudine (30 mg), Lamivudine (150 mg), and Nevirapine(200 mg). Clearly, the total cost of drugs across sites would depend onwhat combinations are being used, and in what proportions.
Costs of the ART Program
Table 6.5 presents per-client costs across the different items for all the sitesbased on client months on ART, and also provides costs obtained using thenumber of patients receiving ART at the end of the study period as thedenominator. We first find that the monthly unit costs vary substantiallyacross the sites. For “cost per client (a),” the unit costs range from about Rs.970 per month to about Rs. 1,850. The last column of the table gives theaverage per-client cost, which comes to about Rs. 817, leaving out training
0%
20%
40%
60%
80%
100%
Tambaram Imphal Ahmedabad LNJP RML Trichur(site)
Other regimen
Stavudine (40 mg) + Lamivudine (150mg) + Efaviranz (600mg)
Zidovudine (300mg) + Lamivudine (150mg) + Efaviranz (600 mg)
Zidovudine (300mg) + Lamivudine (150mg) + Nevirapine (200 mg)
Stavudine (40 mg) + Lamivudine (150mg) + Nevirapine (200 mg)
Stavudine (30 mg) + Lamivudine (150mg) + Efaviranz (600mg)
Stavudine (30mg) + Lamivudine (150mg) +Nevirapine (200 mg
Figure 6.3 Distribution of ART Clients across Drug Regimens
Source: Monthly ART reports of study sites.
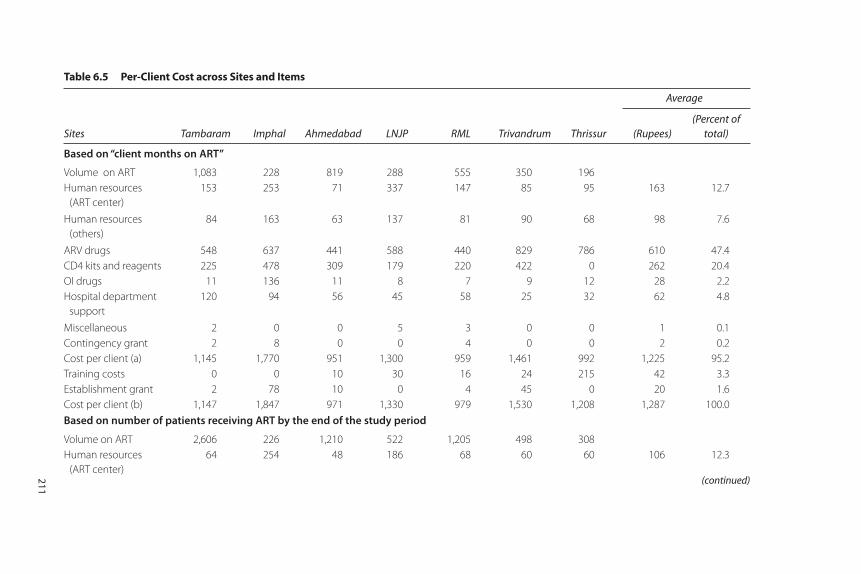
Table 6.5 Per-Client Cost across Sites and Items (continued)
Sites Tambaram Imphal Ahmedabad LNJP RML Trivandrum Thrissur
Average
(Rupees)(Percent of
total)
Based on “client months on ART”
Volume on ART 1,083 228 819 288 555 350 196
Human resources
(ART center)
153 253 71 337 147 85 95 163 12.7
Human resources
(others)
84 163 63 137 81 90 68 98 7.6
ARV drugs 548 637 441 588 440 829 786 610 47.4
CD4 kits and reagents 225 478 309 179 220 422 0 262 20.4
OI drugs 11 136 11 8 7 9 12 28 2.2
Hospital department
support
120 94 56 45 58 25 32 62 4.8
Miscellaneous 2 0 0 5 3 0 0 1 0.1
Contingency grant 2 8 0 0 4 0 0 2 0.2
Cost per client (a) 1,145 1,770 951 1,300 959 1,461 992 1,225 95.2
Training costs 0 0 10 30 16 24 215 42 3.3
Establishment grant 2 78 10 0 4 45 0 20 1.6
Cost per client (b) 1,147 1,847 971 1,330 979 1,530 1,208 1,287 100.0
Based on number of patients receiving ART by the end of the study period
Volume on ART 2,606 226 1,210 522 1,205 498 308
Human resources
(ART center)
64 254 48 186 68 60 60 106 12.3
(continued)211

Table 6.5 Per-Client Cost across Sites and Items (continued)
Sites Tambaram Imphal Ahmedabad LNJP RML Trivandrum Thrissur
Average
(Rupees)(Percent of
total)
Based on “client months on ART”
Human resources
(others)
35 164 42 76 37 63 43 66 7.7
ARV drugs 228 642 299 324 203 583 500 397 46.2
CD4 kits and reagents 93 482 209 99 101 297 0 183 21.3
OI drugs 5 137 7 4 3 6 7 24 2.8
Hospital department
support
50 95 38 25 27 17 20 39 4.5
Miscellaneous 1 0 0 3 1 0 0 1 0.1
Contingency grant 1 8 0 0 2 0 0 2 0.2
Cost per client (a) 476 1,782 644 716 442 1,026 630 817 95.0
Training costs 0 0 7 17 7 17 137 30 3.5
Establishment grant 1 78 6 0 2 32 0 17 2.0
Cost per client (b) 477 1,861 657 733 451 1,075 767 860 100.0
Source: Authors’ estimates.
212

and establishment grants; including these gives a per-client cost of Rs. 860.Table 6.5 also shows the share of each of the items in total costs, obtainedfrom the last column on average unit costs.10 Drugs comprise 47 percent ofthe total costs.11 Costs of CD4 kits and reagents comprise about 25 percent,followed by human resources at the ART center. If we take all humanresources, the proportion comes to about 21 percent.
Table 6.5 also allows for a comparison of the structures of costs acrosssites. Consistently, the major cost driver remains the cost of drugs. More -over, we note that whenever the sites could not take advantage of thebulk purchase done by NACO, the drug costs were high, as was the casewith the Kerala sites and Manipur. Next in importance is cost of CD4tests, which depend on both the volume (which makes it lower) and thenumber of mandated tests, which is hospital specific (Thrissur is anexception because it did not have a CD4 machine). As for human resources,the larger the hospital, the smaller is the burden on human resources;thus for instance, Ahmedabad, RML, and Trivandrum have a very lowshare of costs contributed by human resources.
Table 6.5 also provides the cost estimates obtained by using the num-ber of clients receiving ART at the end of the study period as the denom-inator. This approach returns much lower cost estimates (and a highervariance across estimates), illustrating the pitfalls associated with usingthe number of clients at any point in time as a denominator (rather thanindicators that measure the provision of ART across the study period),and being aware of the possibility of underestimating costs if only thetotal clients on therapy is taken as the denominator (which is easily avail-able from the forms filled out by the sites and sent to NACO, and there-fore may be used more frequently by researchers and other users).
A key issue for estimating or projecting the costs of an ART program isthe extent to which unit costs change as the number of patients receivingtreatment increases, in other words, the question whether there areeconomies of scale. Plotting the unit costs against the volume on ART acrossthe NACO sites only (leaving out Thrissur, Trivandrum, and Tambarambecause it is a specialized hospital), we find that there is some (negative)correlation between unit costs and the number of patients receiving treat-ment, suggesting the presence of economies of scale (figure 6.4).12
Unit costs may also change over time. This is an issue that we canexplore to some extent because the study period extends over twoyears for some of the sites. Differences in unit costs over time mayoccur owing to start-up costs, or because the number of patientsincreases after the initial year. Table 6.6 presents the costs per client for
Recurrent Costs of India’s Free ART Program 213
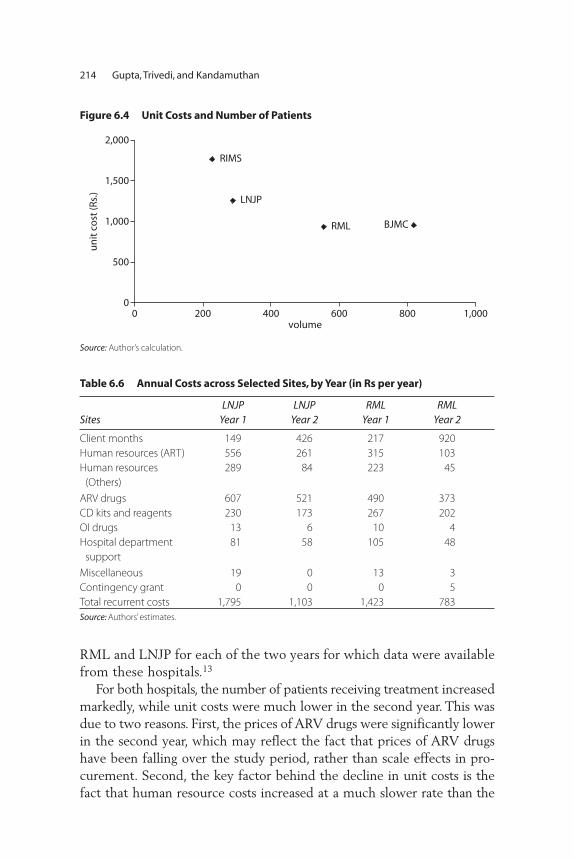
214 Gupta, Trivedi, and Kandamuthan
RML and LNJP for each of the two years for which data were availablefrom these hospitals.13
For both hospitals, the number of patients receiving treatment increasedmarkedly, while unit costs were much lower in the second year. This wasdue to two reasons. First, the prices of ARV drugs were significantly lowerin the second year, which may reflect the fact that prices of ARV drugshave been falling over the study period, rather than scale effects in pro-curement. Second, the key factor behind the decline in unit costs is thefact that human resource costs increased at a much slower rate than the
RIMS
LNJP
RML BJMC
0
500
1,000
1,500
2,000
0 200 400 600 800 1,000volume
un
it c
ost
(Rs.
)
Figure 6.4 Unit Costs and Number of Patients
Source: Author’s calculation.
Table 6.6 Annual Costs across Selected Sites, by Year (in Rs per year)
SitesLNJP
Year 1LNJP
Year 2RML
Year 1RML
Year 2
Client months 149 426 217 920
Human resources (ART) 556 261 315 103
Human resources
(Others)
289 84 223 45
ARV drugs 607 521 490 373
CD kits and reagents 230 173 267 202
OI drugs 13 6 10 4
Hospital department
support
81 58 105 48
Miscellaneous 19 0 13 3
Contingency grant 0 0 0 5
Total recurrent costs 1,795 1,103 1,423 783
Source: Authors’ estimates.

Recurrent Costs of India’s Free ART Program 215
number of patients receiving treatment (accounting for 72 percent (atLNJP) and 61 percent (at RML) of the decline in unit costs). This is animportant finding for the purpose of a scaling-up exercise, as the second-year estimates would be more representative for this purpose.
While the analysis was underway, the prices of ARV drugs had alreadycome down substantially, and NACO was able to procure these drugs at amuch reduced rate. It is easy to see that further reductions in the prices ofARV drugs and CD4 tests kits could significantly reduce the unit costsof the program. Table 6.7 illustrates this point—a reduction in the prices ofARV drugs and CD4 test kits of 50 percent would bring down the costs perclient of the program by about 23 percent. The effects of such reductionson future cost projections will be discussed later in the chapter.
From the perspective of scaling up, and in addition to the overall costs ofthe ART program, it is important to know to which entities these costsare allocated. Table 6.8 shows the distribution of total costs across variousagencies (SACS, NACO, the hospital, and the state government). Whilethe expenditure incurred by the hospitals is also ultimately borne by thestate government (Department of Health), functionally these are differ-ent entities, and the costs incurred are therefore presented separately. Infact, the funds of the various SACS come from NACO as well, but sincethe ART program is a separate subprogram of NACO, the analysis sepa-rates expenditures of SACS from NACO.
Table 6.8 presents the allocation of total recurrent costs (excluding thefixed costs of training and establishment,14 showing that slightly less thanhalf of the total cost of running the program is borne by NACO; the
Table 6.7 Estimated Unit Costs with Reduced Prices of ARV Drugs and CD4 Test Kits
SiteNo change
in prices
Prices of ARV drugs
down by 50%
Prices of ARV drugs and CD4 kits
down by 50%
Tambaram 1,145 871 759
Imphal 1,770 1,451 1,212
Ahmedabad 951 731 576
LNJP 1,300 1,006 916
RML 959 739 629
Trivandrum 1,461 1,046 835
Thrissur 992 599 599
All sites 1,225 920 789
Average 1,264 974 821
Source: Authors’ estimates.
Note: The average excludes Thrissur, since it did not have costs of CD4 tests.

216 Gupta, Trivedi, and Kandamuthan
SACS are also spending a significant amount of funds from other sourcesto run the ART program, mostly on the CD4 kits and reagents. Finally, thehospitals themselves bear some of the burden (mainly through depart-mental support and personnel), though they do not receive any additionalfunding for running the program. A new development is the proposal ofNACO to centralize the purchase of CD4 kits and ARV drugs. Centralizedprocurement of CD4 and ARV drugs by NACO would not only shift theburden of costs away from hospitals (NACO would bear about 78 per-cent of the total program cost), it might also lead to lower aggregate costs,if distributional costs are not too high.
Out-of-pocket Expenditure
From a macroeconomic or general welfare perspective, an importantaspect of the costs of the ART program is the amount of out-of-pocketspending by individuals when they access ART. To analyze this, weobtained a sample of 264 individuals from the seven sites by interview-ing patients coming back for their monthly refill of ARV drugs.15 Outof the sample of 264 individuals, 68 percent were males, and the averageage of respondents was 36. About 74 percent of the respondents were
Table 6.8 Distribution of Costs across Sites (Percent)
Sites SACS NACO Hospital Other
(Actual distribution of costs)
Tambaram 22 51 22 6
Imphal 38 49 13
Ahmedabad 47 41 12
LNJP 24 48 28
RML 31 49 20
Average across selected
NACO sites*
35 47 18
(Distribution of costs if CD4 kits and ARV drugs purchased through NACO)
Tambaram 2 71 22 6
Imphal 9 78 13
Ahmedabad 2 87 12
LNJP 3 70 28
RML 2 78 20
Average across selected
NACO sites*
4 78 18
Source: Authors.
* Imphal, Ahmedabad, RML, and LNJP.
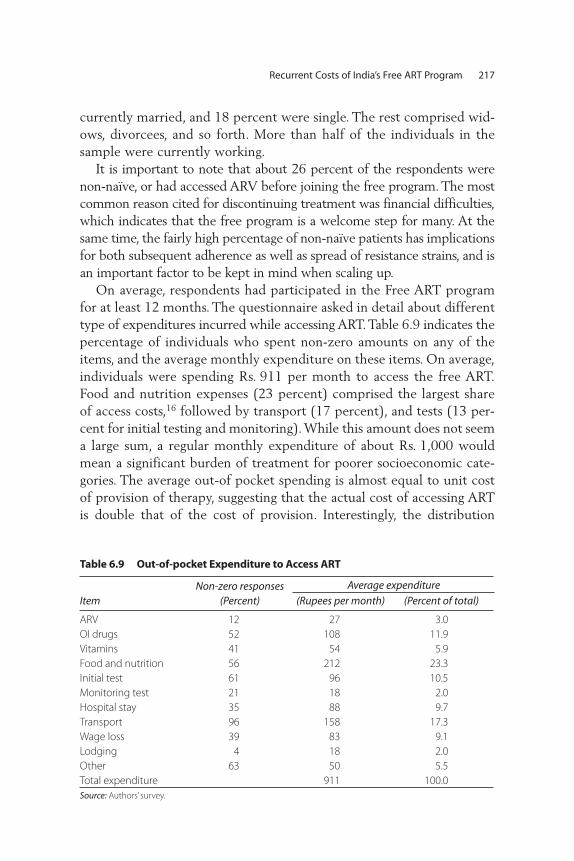
Recurrent Costs of India’s Free ART Program 217
currently married, and 18 percent were single. The rest comprised wid-ows, divorcees, and so forth. More than half of the individuals in thesample were currently working.
It is important to note that about 26 percent of the respondents werenon-naïve, or had accessed ARV before joining the free program. The mostcommon reason cited for discontinuing treatment was financial difficulties,which indicates that the free program is a welcome step for many. At thesame time, the fairly high percentage of non-naïve patients has implicationsfor both subsequent adherence as well as spread of resistance strains, and isan important factor to be kept in mind when scaling up.
On average, respondents had participated in the Free ART programfor at least 12 months. The questionnaire asked in detail about differenttype of expenditures incurred while accessing ART. Table 6.9 indicates thepercentage of individuals who spent non-zero amounts on any of theitems, and the average monthly expenditure on these items. On average,individuals were spending Rs. 911 per month to access the free ART.Food and nutrition expenses (23 percent) comprised the largest shareof access costs,16 followed by transport (17 percent), and tests (13 per-cent for initial testing and monitoring). While this amount does not seema large sum, a regular monthly expenditure of about Rs. 1,000 wouldmean a significant burden of treatment for poorer socioeconomic cate-gories. The average out-of pocket spending is almost equal to unit costof provision of therapy, suggesting that the actual cost of accessing ARTis double that of the cost of provision. Interestingly, the distribution
Table 6.9 Out-of-pocket Expenditure to Access ART
ItemNon-zero responses
(Percent) (Rupees per month) (Percent of total)
ARV 12 27 3.0
OI drugs 52 108 11.9
Vitamins 41 54 5.9
Food and nutrition 56 212 23.3
Initial test 61 96 10.5
Monitoring test 21 18 2.0
Hospital stay 35 88 9.7
Transport 96 158 17.3
Wage loss 39 83 9.1
Lodging 4 18 2.0
Other 63 50 5.5
Total expenditure 911 100.0
Source: Authors’ survey.
Average expenditure
across sites of total out-of-pocket expenditure seems bimodal, with foursites show ing expenditures above Rs. 1,000 per month, and the remain-ing showing expenditures between Rs. 650 and Rs. 850.
The importance of nutrition in ART is now slowly gaining recognition,17
and there is some evidence to suggest that the efficacy of treatment in awell-nourished person is better than in an undernourished one. Presumably,the doctors prescribing the medicines, as well as the counselors, are advis-ing the patients about the kinds of food they should be eating. While mostof the patients who access ART in these clinics are from less well-to-dobackgrounds, the messages are clearly getting across, since a large percent-age of them are found to be taking additional nutrition while on ART. Asfor transport cost, the importance of this in the context of health-seekingbehavior is now well documented. Thus, it is not surprising that transportconstitutes a significant part of the total out-of-pocket expense. Also, ourfindings are comparable to other studies, which have found that tests canimpose a significant burden on individuals and they are less willing to payfor tests than for drugs (Gupta and others 2004). Finally, if economic bur-den is a reason for nonadherence for some clients, our results suggest thatthere is some justification in trying to find alternative sources of financingfor some of the major items, like food, tests, and transport; this may ensurehigher adherence and a better treatment outcome.
Projected Costs of India’s Free ART Program
One of the potential uses of our unit cost estimates is to inform ananalysis of the financial implications of a potential scaling up of India’sFree ART program. Table 6.10 gives an example of a financial planningexercise, based on NACO’s aim to put 100,000 people on ART by theend of the 2007 financial year, and thereafter an additional 15 percentto 20 percent for the next five years (NACO ART Guideline 2004).While such projections do not address the issue of deaths directly, theydo so indirectly, by using the total number of people receiving treat-ment as the basis for calculations, which is net of attrition due to death,nonadherence, and treatment failure. It is important to point out thatthe calculations are based on recurrent costs, and do not include thecosts of new CD4 machines or other fixed costs, which would have tobe calculated separately.
The unit cost underlying the estimates reported in table 6.10 is basedon the one reported in table 6.8. Also, we assume that NACO is goingto bear the costs of CD4 test kits and ARV drugs. Thus, starting with a
218 Gupta, Trivedi, and Kandamuthan

Recurrent Costs of India’s Free ART Program 219
unit cost of Rs. 1,264 per month (which translates into about US$350per year), we find that the total cost of the program over the next fiveyears would be US$215 million, out of which NACO’s share would be81 percent. One important determinant of the future cost of providingART are developments in the prices of ARV drugs. Table 6.10 thereforealso reports cost projections for alternative scenarios—one in which theprices of ARV drugs are reduced by 50 percent from 2007 onward, andone in which the price of CD4 test kits is also reduced by 50 percent.Under these scenarios, the total cost of the program over the five years
Table 6.10 Projections of Costs of ART Programs
Year
Projectednumber of
patients
Annual cost
Rupeemillions
US$ millions SACS NACO Hospital
At current unit cost of Rs. 1,264
2007 100,000 1,517.3 35.3 37.8 1,226.3 253.3
2008 110,000 1,669.1 38.8 41.6 1,348.9 278.6
2009 121,000 1,836.0 42.7 45.7 1,483.8 306.5
2010 133,100 2,019.6 47.0 50.3 1,632.2 337.1
2011 146,410 2,221.5 51.7 55.3 1,795.4 370.8
Total 9,263.5 215.4 230.8 7,486.4 1,546.3
(percent of total) 100 2.5 80.8 16.7
At reduced unit cost of Rs. 974 (owing to lower prices of antiretroviral drugs)
2007 100,000 1,168.9 27.2 37.7 877.9 253.3
2008 110,000 1,285.8 29.9 41.5 965.7 278.7
2009 121,000 1,414.4 32.9 45.6 1,062.2 306.6
2010 133,100 1,555.8 36.2 50.2 1,168.4 337.2
2011 146,410 1,711.4 39.8 55.2 1,285.3 370.9
Total 7,136.5 166.0 230.3 5,359.5 1,546.7
(percent of total) 100 3.2 75.1 21.7
At reduced unit cost of Rs. 821(owing to lower prices of antiretroviral drugs and CD4 tests)
2007 100,000 985.6 22.9 37.7 694.5 253.3
2008 110,000 1,084.1 25.2 41.5 764.0 278.7
2009 121,000 1,192.5 27.7 45.6 840.3 306.6
2010 133,100 1,311.8 30.5 50.2 924.4 337.2
2011 146,410 1,443.0 33.6 55.2 1,016.8 370.9
Total 6,017.0 139.9 230.3 4,240.0 1,546.7
(percent of total) 100 3.8 70.5 25.7
Source: Authors’ estimates and projections.
Costs (in rupee millions) incurred at

under consideration would be reduced from US$215 million toUS$166 million. As the costs of ARV drugs and CD4 test kits areassumed to accrue to NACO in our projections, its share in the overallcosts declines as the respective prices decline, from 81 percent withoutprice changes, to 71 percent in the scenario with falling prices of bothARV drugs and CD4 kits.
One interesting point to note is that whichever entity bears a largershare of the fixed costs of the program (in this case personnel costs borneby hospitals) will increasingly bear a larger share of the total costs, withdecreasing prices of the “consumables” (ARV drugs and CD4 kits). Thisalso explains why, over the three scenarios (baseline, reduced costs ofdrugs, and reduced costs of drugs and kits), SACS show a slight decline inthe total costs, whereas the hospitals experience a slight increase.
Discussion of Findings
Some key results are summarized in box 6.2. However, before discussingthe implications of our findings, some limitations of the research need to bementioned. The first regards sample size. Owing to budget and time con-straints, only seven samples were included in the study. The samples dif-fered based on parameters like initiation date of the ART program, whostarted it (NACO/state), the type of hospital, the number of people receiv-ing ART, and location (high-prevalence states vs. other states). This has ledto some loss of generality in the results. However, we found that the gen-eral hospitals had more or less similar structures of operation, and unit costsappeared to converge in the second year of operation; the fact that our find-ings were quite similar across hospitals thus suggests that the sample sizelimitation may not have hampered the analysis too much.
The second main limitation regards the availability of cost and otherdata from hospitals. Only one hospital was able to provide cost data dis-aggregated by department, which was an important constraint for thisresearch. Moreover, data regarding the number of patients receivingART and the provision of drugs and tests were not computerized insome hospitals, and collection of data from hard copies was both tediousand fraught with potential copying mistakes. The data limitationsextended the process of data collection and revisions by a few months,and squeezed the analysis time. Many innovative ways of cross-checkingthe data collected had to be undertaken and the team had to “revisit” (lit-erally and through many phone calls) the sites many times to get moreaccurate information.
220 Gupta, Trivedi, and Kandamuthan
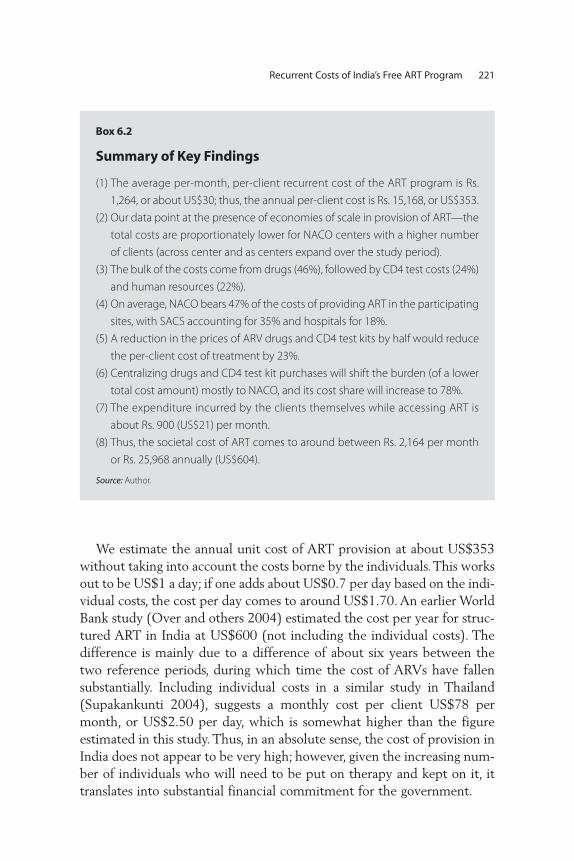
Recurrent Costs of India’s Free ART Program 221
We estimate the annual unit cost of ART provision at about US$353without taking into account the costs borne by the individuals. This worksout to be US$1 a day; if one adds about US$0.7 per day based on the indi-vidual costs, the cost per day comes to around US$1.70. An earlier WorldBank study (Over and others 2004) estimated the cost per year for struc-tured ART in India at US$600 (not including the individual costs). Thedifference is mainly due to a difference of about six years between thetwo reference periods, during which time the cost of ARVs have fallensubstantially. Including individual costs in a similar study in Thailand(Supakankunti 2004), suggests a monthly cost per client US$78 permonth, or US$2.50 per day, which is somewhat higher than the figureestimated in this study. Thus, in an absolute sense, the cost of provision inIndia does not appear to be very high; however, given the increasing num-ber of individuals who will need to be put on therapy and kept on it, ittranslates into substantial financial commitment for the government.
Box 6.2
Summary of Key Findings
(1) The average per-month, per-client recurrent cost of the ART program is Rs.
1,264, or about US$30; thus, the annual per-client cost is Rs. 15,168, or US$353.
(2) Our data point at the presence of economies of scale in provision of ART—the
total costs are proportionately lower for NACO centers with a higher number
of clients (across center and as centers expand over the study period).
(3) The bulk of the costs come from drugs (46%), followed by CD4 test costs (24%)
and human resources (22%).
(4) On average, NACO bears 47% of the costs of providing ART in the participating
sites, with SACS accounting for 35% and hospitals for 18%.
(5) A reduction in the prices of ARV drugs and CD4 test kits by half would reduce
the per-client cost of treatment by 23%.
(6) Centralizing drugs and CD4 test kit purchases will shift the burden (of a lower
total cost amount) mostly to NACO, and its cost share will increase to 78%.
(7) The expenditure incurred by the clients themselves while accessing ART is
about Rs. 900 (US$21) per month.
(8) Thus, the societal cost of ART comes to around between Rs. 2,164 per month
or Rs. 25,968 annually (US$604).
Source: Author.
A crucial variable for estimating annual costs will of course be thenumber of people initiating and receiving ART. The evidence indicatesthat there is a continuous demand for ART; there are sites that are unableto put everyone on it, and have created waiting lists. A related issue is therelation between demand and quality—the quality of the governmentprogram determines to what extent individuals would want to join it, andhow many of them would prefer private providers, despite the cost dif-ference. Again, the evidence gathered from the sites and from the expertsconsulted seems to indicate that the quality of the program has beenquite good, with significantly high levels of adherence at all the sites. Thishas ensured a moderately high level of demand for the government pro-gram. Thus, if the quality is maintained at this level in years to come, theremay be a switch away from the private to the public sector, which willonly help keep up the demand.
How do our estimates of costs compare with the health budget of thecountry? The question of affordability was also raised by the World Bankstudy referred to earlier, which indicated that the cost of the most ambi-tious of the ART programs (to support all those below the poverty line)would be about 70 percent of central health expenditure (Over and oth-ers 2004). However, since then, prices of ARV drugs have come down sig-nificantly. Also, there have been substantial increases in the allocation tothe Ministry of Health and Family Welfare, and restructuring of the pro-grams, so that it is no longer meaningful to talk only about health expen-diture. The revised health and family welfare budget for 2005–06amounted to about US$2,250 million. Our estimates of cost of the ARTprogram for 2007 (without any changes in costs of ARV and test kits),comes to about US$35 million, which is around 1.5 percent of the totalhealth and family welfare budget. A 50 percent reduction in both theprices of drugs and kits reduces the amount to about 1 percent of thehealth and family welfare budget. The comparison with the earlier WorldBank study and the different cost estimates within this study indicate thatthere are substantial savings to the program costs through reductions inprices of drugs and kits. As for NACO’s own resources (excluding GFATMfunds), the budget estimate for 2006–07 is US$148 million (MOHFW2006); using the lower estimates of the ART program, the total ART costfor 2007 would be US$23 million, which is about 16 percent of NACO’score resources. If we assume that only 70 percent of the total cost wouldbe covered by NACO, about 11 percent of total core resources of NACOwould be required for the ART program for 2007.
222 Gupta, Trivedi, and Kandamuthan
The exercise above provided an illustration of the possible implicationsof a scaled-up program. Clearly, the question of financial sustainabilityis critical, and Financial Sustainability Planning, an exercise advocatedand practiced in the case of immunization by the Global Alliance forVaccines and Immunization (GAVI) could be usefully applied in thepresent context, too. While most of the cost would have to be borne byNACO, the sites may need additional help and funds so that their cur-rent services for other departments are not hampered. Additionally, ifadherence of the program is seen as the most critical component of thepublic program, then individuals may need additional assistance, espe-cially in light of the role of nutritional supplements to ensure that theART works optimally.
Currently, NACO’s ART program is being supported by GFATM.However, the sustainability of this funding and the possibility of otherdonors to support a scaled-up program are issues that NACO will needto focus on immediately. Additionally, if NACO plans on adding second-line drugs to the program, this would have significant financial implica-tions for the program.
Careful planning, identifying ways to bring down costs without sacri-ficing quality, and negotiations with donors are strategies that need to beworked on simultaneously in the immediate future to ensure that theART program remains sustainable.
Outlook
There are numerous ways this work can be utilized and extended. Thefirst step involves active dissemination of the results to show thepotential of such costing studies to NACO and the state governmentsthat are running state-level ART programs, and also to give them somepreliminary estimates of costs that they may find useful in their plan-ning activities. It is also important to demonstrate the usefulness ofsuch cost estimates in a financial sustainability planning exercise thatnot only charts out costs over the years, but also records the sourcesof secure and probable funding. This will allow NACO to negotiatewith future donors on the basis of more solid data The results of thisstudy may also be useful to other parts of the government, like theMinistry of Health and Family Welfare and the Planning Commission,to enable them to mainstream HIV and AIDS treatment programsinto national planning activities.
Recurrent Costs of India’s Free ART Program 223

224 Gupta, Trivedi, and Kandamuthan
This study also establishes a baseline of unit costs and can be used forcost-effectiveness analysis, for example, of a second-line ART program. Itcan also be used to understand the implications of (and interactionsbetween) treatment success and adherence, which are bound to have costimplications. For example, our data from six sites show a positive, thoughweak, correlation between duration of exposure to treatment and totaldropouts. Such a correlation can be expected for any disease; however,there are many causes of dropouts in the case of ART, and comprehensiveresearch can be carried out to understand all the determinants of dropoutsand treatment success in conjunction with a costing study, to evaluate theeffectiveness of the program.
Finally, the results of this study could also be useful to the many otherstakeholders involved in the study, in particular the hospitals and SACS.This will enable them to plan resource allocation and negotiate withNACO/state governments with better information. It may hopefully alsoserve as an advocacy tool for greater efficiency and transparency in datamanagement, so that they can continue to be important partners inresearch endeavors that have important implications about their ownwork, as well as national policies.
Clients on ART Available from monthly reports ART centers prepare and send to
respective SACS
Human resources
(NACO)
Estimated proportion of time spent by the NACO staff on the ART
program was arrived at based on discussions. Actual proportion of
time. See annex 6.2.
Human resources
(SACS)
Estimated proportion of time spent by the SACS staff on the ART pro-
gram was arrived at based on discussions. Actual proportion of time.
See annex 6.2.
Human resources
(ART Clinic)
NACO ART guideline specifies the details of staff to be appointed at
the ART clinic. It was verified at respective sites, and actual “in-place”
staff were taken into account. Additionally, details of dedicated ART
clinic staff—other than NACO sponsored—were taken into account.
Human resources
(Hospital staff )
In addition to the ART clinic staff, hospital physicians, especially from
the medicine and microbiology departments, were actively involved
in the ART program. The medicine department physicians’ time was
apportioned to the ART program based on discussions around their
perceptions about involvement in the program at respective sites.
For the microbiology department, 25% of the time of one faculty
was accounted for based on various discussion at all the sites.
Annex 6.1 Additional Assumptions Underlying Cost Estimates

Recurrent Costs of India’s Free ART Program 225
ARV drug
consumption
Available from monthly reports that ART centers prepare and send to
respective SACS.
ARV crug
expenditure
ARV drugs supply and consumption figures are available from monthly
reports. The unit prices of different drug molecules for the years
2004-05 and 2005-06 were obtained from NACO. Since the drug
prices during two years and volumes of drug supplied to different
sites were different, a site-specific weighted average unit cost was
calculated. Finally, the total consumption figures were multiplied
with the weighted average unit prices to get the total expenditure
on ARV. In the case of state-level purchasing of ARVs, a ratio of NACO
and state supply was calculated, and accordingly, the expenditure—
based on two different unit costs—was calculated.
CD4 kits/reagents
expenditure
Unit cost of CD4 test kit was collected from respective SACS. The unit
cost of sheath fluid was calculated based on Delhi SACS data and
applied to all other sites. Total expenditure was calculated based on
unit cost and total consumption.
CD4 test volume Monthly data on CD4 testing, control, and failed tests were available
from microbiology labs. The sum of these yielded total consumption
of CD4 tests. A container of 20 liters of sheath fluid was assumed to
be required for 150 CD4 tests.
Prophylaxis: Septran
(Cotrimoxazole)
consumption
All centers provide Co-trimoxazole—one tablet a day—to all clients
having a CD4 count less than 200 cells till it improved beyond 200
cells. Only Imphal could provide actual consumption data for the
study period. The CD4 count profile of ART clients was only available
from Ahmedabad and thus, this proportion (73% of clients would
take Septran for six months and 11% for a year) was applied to sites
where actual/estimated proportion was not available.
OI drug consumption Only RIMS and Trichur could give data on actual consumption of OI
drugs. For other centers, consumption of OI drugs had to be calcu-
lated based on the profile of OI infections among clients and pre-
scribed dosage, which was available only for Ahmedabad; the pro-
portion of clients with major OIs was calculated for Ahmedabad and
used for other sites.
OI drug expenditure The unit price of OI drugs was available for Manipur, Trivandrum,
Trichur, and Tambaram. The figures obtained from the rate list of the
Directorate of Medical Education, Kerala, for the unit price of OI
drugs were used for those sites where relevant data was unavailable.
Total expenditure was calculated based on unit cost and total
consumption.
Hospital volume
patients
Departmental OP and IP figures available from Medical Records
Department (MRD) for calendar year 2004 and 2005.
Hospital volume
laboratories
Laboratory volume figures (of tests) were available from MRD for cal-
endar year 2004 and 2005.
(continued)
Annex 6.1 Additional Assumptions Underlying Cost Estimates (continued)

226 Gupta, Trivedi, and Kandamuthan
Annex 6.2 Site-specific Details and Assumptions
Government Hospital of Thoracic Medicine (GHTM), Tambaram, Chennai, Tamil Nadu
Prophylaxis—Septran
(Co-trimoxazole)
consumption
CD4 count profile of ART clients could not be made available. However,
discussion with Tamil Nadu SACS (TNSACS) staff indicated a propor-
tion of 85% for six months and 15% for a year.
OI drug consumption GHTM dispenses many OI drugs; however, actual consumption of OI
drugs or profile of OI infection was not available. The proportion of
clients that may have major OI was calculated based on various dis-
cussions. The estimated consumption was calculated based on
dosage and estimated clients that may have different OI infections.
ART clients volume
laboratories
All clients who were on therapy had to undergo a list of tests at differ-
ent laboratories. The volume of these tests was available from
monthly reports. Additionally, it was assumed that the same number
of clients would go in for repeat testing at stipulated time intervals.
This volume was calculated based on “net clients on therapy,” i.e.,
total clients on therapy minus estimated dropouts. List of
compulsory tests is given in annex 6.3 .
Hospital department
support
Mainly two clinical departments (medicine and dermatology) and
four diagnostic departments (pathology, biochemistry, radiology,
and microbiology) were actively involved in the ART program. Only
Manipur could provide departmental expenditure details. No sites
could provide rate lists of various procedures being done at these
laboratories. Thus, the proportion from Manipur was used to calcu-
late departmental costs from total hospital costs, and the rate list of
Manipur was used to calculate the ART lab coefficient. However, the
list of compulsory tests was site specific. The cost apportionment for
these departments was done as discussed below.
Proportion of A dept. cost (%) Pa From Manipur data
ART proportion coefficient_IP(%) Xai ART inpatients/Total in-
patients
ART lab coefficient (%) Xlab Rate of ART tests/Rate of
total tests
ART proportion coefficient_lab (%) Xal # of ART pts tests/total pt
tests
Cost of A department (Ca) = [Total hospital costs * Pa]
ART cost of A department_
inpatient = [Ca * Xai]
ART cost of A department_lab = [Ca * Xlab * Xal]
The methodology is different for Tambaram, which is given in detail in
the annex on specific-site assumptions.
Source: Authors.
Annex 6.1 Additional Assumptions Underlying Cost Estimates (continued)
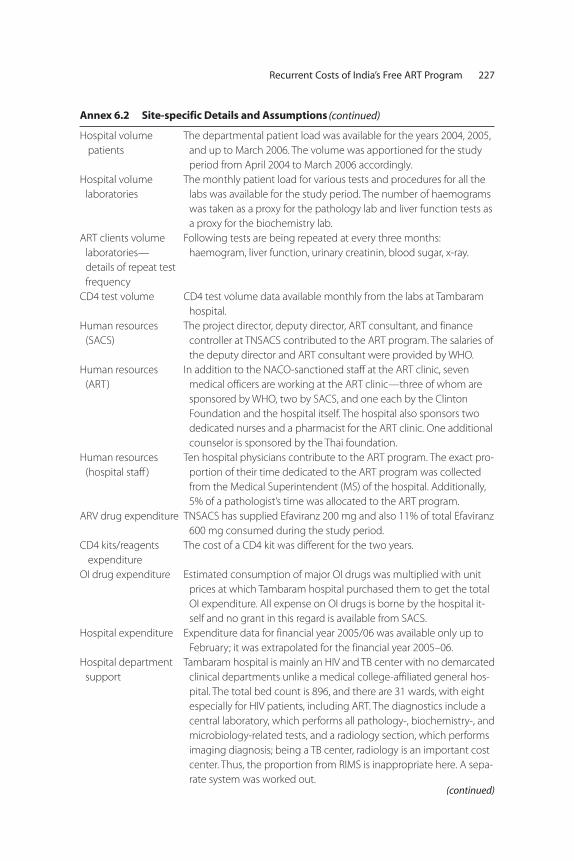
Recurrent Costs of India’s Free ART Program 227
Annex 6.2 Site-specific Details and Assumptions
Hospital volume
patients
The departmental patient load was available for the years 2004, 2005,
and up to March 2006. The volume was apportioned for the study
period from April 2004 to March 2006 accordingly.
Hospital volume
laboratories
The monthly patient load for various tests and procedures for all the
labs was available for the study period. The number of haemograms
was taken as a proxy for the pathology lab and liver function tests as
a proxy for the biochemistry lab.
ART clients volume
laboratories—
details of repeat test
frequency
Following tests are being repeated at every three months:
haemogram, liver function, urinary creatinin, blood sugar, x-ray.
CD4 test volume CD4 test volume data available monthly from the labs at Tambaram
hospital.
Human resources
(SACS)
The project director, deputy director, ART consultant, and finance
controller at TNSACS contributed to the ART program. The salaries of
the deputy director and ART consultant were provided by WHO.
Human resources
(ART)
In addition to the NACO-sanctioned staff at the ART clinic, seven
medical officers are working at the ART clinic—three of whom are
sponsored by WHO, two by SACS, and one each by the Clinton
Foundation and the hospital itself. The hospital also sponsors two
dedicated nurses and a pharmacist for the ART clinic. One additional
counselor is sponsored by the Thai foundation.
Human resources
(hospital staff )
Ten hospital physicians contribute to the ART program. The exact pro-
portion of their time dedicated to the ART program was collected
from the Medical Superintendent (MS) of the hospital. Additionally,
5% of a pathologist’s time was allocated to the ART program.
ARV drug expenditure TNSACS has supplied Efaviranz 200 mg and also 11% of total Efaviranz
600 mg consumed during the study period.
CD4 kits/reagents
expenditure
The cost of a CD4 kit was different for the two years.
OI drug expenditure Estimated consumption of major OI drugs was multiplied with unit
prices at which Tambaram hospital purchased them to get the total
OI expenditure. All expense on OI drugs is borne by the hospital it-
self and no grant in this regard is available from SACS.
Hospital expenditure Expenditure data for financial year 2005/06 was available only up to
February; it was extrapolated for the financial year 2005–06.
Hospital department
support
Tambaram hospital is mainly an HIV and TB center with no demarcated
clinical departments unlike a medical college-affiliated general hos-
pital. The total bed count is 896, and there are 31 wards, with eight
especially for HIV patients, including ART. The diagnostics include a
central laboratory, which performs all pathology-, biochemistry-, and
microbiology-related tests, and a radiology section, which performs
imaging diagnosis; being a TB center, radiology is an important cost
center. Thus, the proportion from RIMS is inappropriate here. A sepa-
rate system was worked out.(continued)
(continued)

228 Gupta, Trivedi, and Kandamuthan
Annex 6.2 Site-specific Details and Assumptions
The estimated costs of rehabilitation center—which is an exclusive
setup with 120 beds—were calculated based on bed proportion,
and deducted from the total expenditure. Since department-level
expenditure was not available, unit costs of different diagnostic units
was worked out based on RML hospital’s volume and expenditure
estimates. The remaining expenditure was divided across IP and OP
in equal proportion given than OP setup is a significant one. The IP
expenditure, which was assumed to have relevance to the ART pro-
gram, was then divided across HIV and non-HIV ward expenditure
based on the number of wards.
ART patient coefficient, ART lab coefficient, and departmental sup-
port expenditure were calculated like other sites, as discussed the
methodology section.
Regional Institute of Medical Sciences (RIMS), Imphal, Manipur RIMS, Imphal
Hospital volume
patients
The patient load for July to August for the years 2003–04 and 2004–05
was used to apportion the total hospital volume for the study period.
Hospital volume
laboratories
Volume of various tests was available from annual reports. Volume of
haemogram was taken as a proxy of volume of the pathology lab;
liver function for biochemistry and HbAsg test was taken as a proxy
for the microbiology lab. Total x-ray volume was used as a volume of
the radiology department. July to August figures for the years
2003–04 and 2004–05 was used to apportion the total hospital
volume for the study period.
ART clients volume
laboratories
There are no mandatory repeat tests, but according to the treating
physician, nearly 50% of patients need to undergo repeat test as
mentioned below: haemogram, liver function test.
Human resources
(SACS)
Delhi SACS estimates of proportion of time in the program were
applied. However, actual salary was available from the Manipur SACS.
Human resources
(hospital staff )
One professor, one associate professor, and three assistant professors
give on an average 6% of their time to the ART clinic. A store officer
looks after entire logistics around ARV and OI medicines and gives
30% of his time to ART program.
ARV drug expenditure. MSACS supplied around 51% of the total Efavirenz 600 mg.
Hospital expenditure Expenditure data for financial year 2004/05 and 2005/06 was
available. Appropriate apportionment was done for April 2004 to
July 2005.
BJ Medical College (BJMC), Ahmedabad, Gujarat
Hospital volume
patients
The patient load for December 2004 to November 2005 was used as a
proxy of financial year 2005–06.
Hospital volume
laboratories
Actual load of different laboratories was available from MRD. The
patient load for December 2004 to November 2005 was used as a
proxy of financial year 2005–06.
ART clients volume
laboratories
Following tests are repeated every six months: haemogram, liver
function. X-ray is repeated every nine months.
(continued)
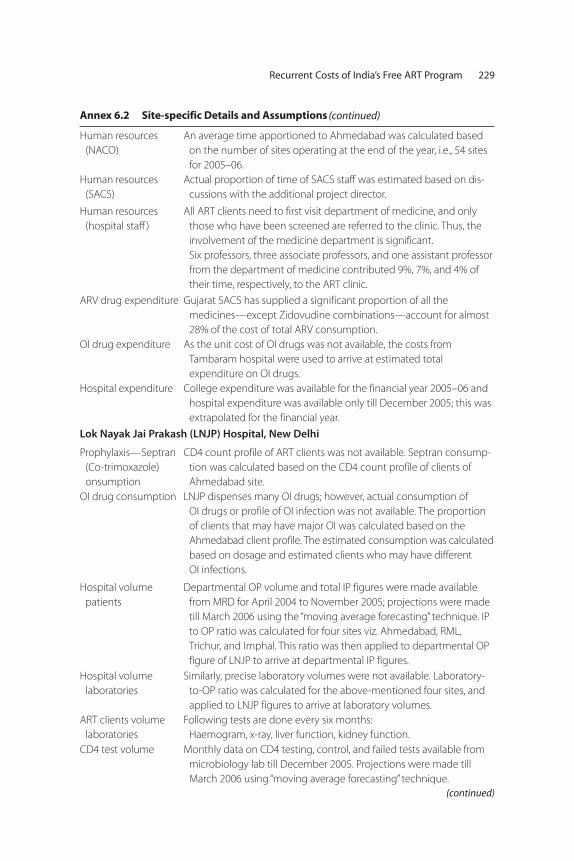
Recurrent Costs of India’s Free ART Program 229
Annex 6.2 Site-specific Details and Assumptions
Human resources
(NACO)
An average time apportioned to Ahmedabad was calculated based
on the number of sites operating at the end of the year, i.e., 54 sites
for 2005–06.
Human resources
(SACS)
Actual proportion of time of SACS staff was estimated based on dis-
cussions with the additional project director.
Human resources
(hospital staff )
All ART clients need to first visit department of medicine, and only
those who have been screened are referred to the clinic. Thus, the
involvement of the medicine department is significant.
Six professors, three associate professors, and one assistant professor
from the department of medicine contributed 9%, 7%, and 4% of
their time, respectively, to the ART clinic.
ARV drug expenditure Gujarat SACS has supplied a significant proportion of all the
medicines—except Zidovudine combinations—account for almost
28% of the cost of total ARV consumption.
OI drug expenditure As the unit cost of OI drugs was not available, the costs from
Tambaram hospital were used to arrive at estimated total
expenditure on OI drugs.
Hospital expenditure College expenditure was available for the financial year 2005–06 and
hospital expenditure was available only till December 2005; this was
extrapolated for the financial year.
Lok Nayak Jai Prakash (LNJP) Hospital, New Delhi
Prophylaxis—Septran
(Co-trimoxazole)
onsumption
CD4 count profile of ART clients was not available. Septran consump-
tion was calculated based on the CD4 count profile of clients of
Ahmedabad site.
OI drug consumption LNJP dispenses many OI drugs; however, actual consumption of
OI drugs or profile of OI infection was not available. The proportion
of clients that may have major OI was calculated based on the
Ahmedabad client profile. The estimated consumption was calculated
based on dosage and estimated clients who may have different
OI infections.
Hospital volume
patients
Departmental OP volume and total IP figures were made available
from MRD for April 2004 to November 2005; projections were made
till March 2006 using the “moving average forecasting” technique. IP
to OP ratio was calculated for four sites viz. Ahmedabad, RML,
Trichur, and Imphal. This ratio was then applied to departmental OP
figure of LNJP to arrive at departmental IP figures.
Hospital volume
laboratories
Similarly, precise laboratory volumes were not available. Laboratory-
to-OP ratio was calculated for the above-mentioned four sites, and
applied to LNJP figures to arrive at laboratory volumes.
ART clients volume
laboratories
Following tests are done every six months:
Haemogram, x-ray, liver function, kidney function.
CD4 test volume Monthly data on CD4 testing, control, and failed tests available from
microbiology lab till December 2005. Projections were made till
March 2006 using “moving average forecasting” technique.
(continued)
(continued)

230 Gupta, Trivedi, and Kandamuthan
Annex 6.2 Site-specific Details and Assumptions
Human resources
(NACO)
An average time apportioned to LNJP was calculated based on the
number of sites operating at the end of the year, i.e., 25 sites for
2004–05 and 54 for 2005–06.
Human resources
(SACS)
Actual proportion of time of SACS staff was estimated based on dis-
cussions with relevant Delhi SACS staff. An average time per site was
calculated based on the number of sites operating at the end of the
year, i.e., two sites for 2004–05 and seven for 2005–06.
Human resources
(ART clinic)
NACO-specified staff was in place by the end of the study period, but
the calculation was done based on actual joining of the ART clinic.
Hospital-sponsored staff includes two nurses, a nursing orderly, and
a pharmacist.
Human resources
(hospital staff )
Four physicians of different levels of seniority spent 10% of their time
on the ART clinic. Since actual salaries of these staff were not avail-
able, average salary of RML physicians was taken as a proxy measure.
ARV drug expenditure Delhi SACS has supplied Efaviranz 200 mg and also 67% of total
Efaviranz 600 mg consumed during the study period.
OI drug expenditure As the unit cost of OI drugs was not available, the cost from Tambaram
hospital was used to arrive at estimated total expenditure on OI drugs.
Ram Manohar Lohia (RML) Hospital, New Delhi
Prophylaxis—Septran
(Co-trimoxazole)
onsumption
CD4 count profile of ART clients was not available. Septran consump-
tion was calculated based on the CD4 count profile of clients of
Ahmedabad site. In RML until August 2005 the patients were given
Septran for 30 days, and after August 2005 for 15 days.
OI drug consumption Hospital does not supply any OI drugs and patients have to purchase
their own.
Hospital volume
patients
The patient load for calendar year 2004 and 2005 assumed to be
same for study year April 2004 to March 2005 and April 2005 to
March 2006, respectively.
Hospital volume
laboratories
The patient load for calendar year 2004 and 2005 assumed to be
same for study year April 2004 to March 2005 and April 2005 to
March 2006, respectively.
ART clients volume
laboratories
Haemogram is repeated every three months. Liver function test and
x-ray are repeated every six months.
Human resources
(NACO)
An average time apportioned to RML was calculated based on the
number of sites operating at the end of the year, i.e., 25 sites for
2004–05 and 54 for 2005–06.
Human resources
(SACS)
Actual proportion of time of SACS staff was estimated based on dis-
cussions with relevant DSCAS staff. An average time apportioned
per site was calculated based on the number of sites operating at
the end of the year, i.e., two sites for 2004-05 and seven for 2005-06.
Human resources
(ART clinic)
NACO-sanctioned ART lab technician for CD4 machine was not filled
till October 2004. Thus, hospital lab technician was taken into
account for seven months. Two nurses are sponsored by hospital
and have been working at the ART clinic during study period.
(continued)

Recurrent Costs of India’s Free ART Program 231
Annex 6.2 Site-specific Details and Assumptions
Human resources
(hospital staff )
Five professors of the medicine department give 10% of their total
time to ART clinic.
ARV drug
expenditure
Delhi SACS has supplied Efaviranz 200 mg and 50% of total Efaviranz
600 mg consumed during the study period.
OI drug expenditure No OI consumption.
Government Medical College and Hospital (GMC), Trivandrum, Kerala
Prophylaxis—Septran
(Co-trimoxazole)
consumption
CD4 count profile of ART clients could not be made available. Septran
consumption calculated based on the CD4 count profile of clients of
Ahmedabad site for the period April 2005 to March 2006.
OI drug consumption The profile of OI consumption is based on the estimates of Ahmed-
abad. Consumption of Doxycyclin tablets was calculated based on
consumption pattern of RIMS.
Hospital volume
patients
The patient load for calendar year 2005 used for the study period
from April 2005 to March 2006.
Hospital volume
laboratories
The patient load for the calendar year 2005 was used for the study peri-
od from April 2005 to March 2006 for all the laboratories. The total
number of haemograms was used as proxy for the total tests at the
pathology lab and number of liver function tests for the biochemistry
lab. Since no compulsory tests were conducted at the microbiology
lab, it was not taken into calculation for departmental support.
ART clients volume
laboratories
Haemogram is repeated every three months, while liver function test
and test for lipid profile are done every six months.
CD4 test volume The only CD4 machine in the state of Kerala is placed at the skin
department of the Trivandrum Medical College. The annual CD4
count figures for 2004 and 2005, and total during January to March
2006, were available. Monthly volume was not available and thus it
was difficult to arrive at precise estimate of CD4 tests during the
study period. During 2004, CD4 count was being done an average of
53 tests per month, which increased to 130 tests per month in 2005.
This growth can be attributed to the ART program. Thus, it was
assumed that during January to March 2005, CD4 tests were done at
the average monthly rate of 53 tests and volume of April to
December 2005 was calculated accordingly by subtracting 160 tests
from the annual figure.
Human resources
(NACO)
Trivandrum became a NACO site in May 2005, and the proportion of
time NACO staff spent during 11 months of the study period was
used in the study. However, since there was no drug supply from
NACO during the study period, the procurement consultant’s time
was not taken into account.
Human resources
(SACS)
Actual proportion of time of SACS staff was estimated based on
discussions with relevant Dehli SCAS staff. An average time
apportioned per site was calculated based on the number of sites
operating at the end of the study period, i.e., five sites in Kerala.
(continued)
(continued)

232 Gupta, Trivedi, and Kandamuthan
Annex 6.2 Site-specific Details and Assumptions
Human resources
(ART)
From May 2005 (the beginning of the program) until November 2005,
postgraduate students of the medical college were running the ART
clinic on a rotation. NACO-sanctioned ART medical officer was in
place from November 2005. The lab technician and recordkeeper
were provided in January 2006. A dedicated laboratory technician
was working on CD4 tests during April to November 2005. A SACS
appointed counselor worked in the ART clinic from April 2005.
Human resources
(hospital staff )
The head of the Department of Medicine spent about 50% of his time
on the ART program. Two professors from the infectious diseases
unit and medicine department respectively gave 15% and 1% of
their time to ART clinic. An associate professor of dermatology who
was in charge of CD4 testing gave about 25% of his time on ART
program.
ARV drug expenditure Started as a state-level initiative, drugs were procured by the
Directorate of Medical Education purchased through the Central
Purchase Committee of the state government. It became NACO-
sponsored site in May 2005, but the drugs consumed during the
study period were from the state-level procurement.
OI expenditure The unit costs of relevant OI drugs were used from the rate list of the
Central Purchase Committee of the government to calculate the
total OI expenditure.
Hospital expenditure The expenditure data for the period April 2005 to December 2005
was available, which was then extrapolated to get the data for the
entire financial year. The actual expense on salaries for the college
staff was not available. The proportion of budget provision for
salaries to actual expenditure for Trichur was used for Trivandrum to
estimate the expenditure for Trivandrum from its budget provision
for 2005–06.
Government Medical College and Hospital (GMC), Thrissur, Kerala
Septran
(Co-trimoxazole)
consumption
CD4 count profile of ART clients was not available. Septran consump-
tion calculated based on the CD4 count profile of clients of Ahmed-
abad site for the period November 2004 to October 2005.
Hospital volume
patients
The patient load for calendar year 2004 and 2005 was apportioned for
the period from November 2004 to October 2005.
Hospital volume labo-
ratories
The patient load for the period November 2004 to October 2005 was
collected from the registers for all the labs. The number of
haemograms was taken as proxy for the pathology lab and number
of liver function tests was taken as proxy for the biochemistry lab.
ART clients volume
laboratories
Following tests are done every six months: haemogram, x-ray, liver
function.
CD4 test volume CD4 machine is not available at Trichur. ART patients either go to
Trivandrum or private labs for CD4 testing.
Human resources
(NACO)
Trichur was not a NACO-sponsored site during the study period, so
NACO staff time was not taken into account.
(continued)

Recurrent Costs of India’s Free ART Program 233
Annex 6.2 Site-specific Details and Assumptions
Human resources
(SACS)
Actual proportion of time of SACS staff was estimated based on
discussions with relevant Kerala SACS staff. An average time appor-
tioned per site was calculated based on the number of sites operat-
ing at the end of the study period, i.e., five sites in Kerala.
Human resources
(ART clinic)
A SACS appointed medical officer and a counselor were in place at
the ART clinic during the study period.
Human resources
(hospital staff )
Two faculty members, from the departments of dermatology and
neurology, give 36% and 10% of their time to the ART clinic,
respectively.
ARV drug expenditure Being a state-level initiative, drugs were procured by the Directorate
of Medical Education purchased through the Central Purchase
Committee of the state government.
CD4 kits/reagents
expenditure
Not applicable.
OI drug expenditure The unit costs of relevant OI drugs were used from the rate list of the
Central Purchase Committee of the government to calculate the
total OI expenditure.
Hospital expenditure Expenditure statements of the Directorate of Medical Education and
Directorate of Health Services accounts were available for the finan-
cial year 2005–06. The salary figures for 2005–06 for the hospital is
based on the revised estimate of fiscal year 2004–05. Additionally,
Hospital Development Committee (HDC) expenses were also taken
into account.
Source: Authors.
Annex 6.3 List of Compulsory Tests
Site Pathology Biochemistry Microbiology Radiology
Tambaram Haemogram Liver function test, urea, crea-
tinin, blood sugar
X-ray
Imphal Haemogram Liver function test, lipid profile,
kidney function test
Hepatitis B
Hepatitis C
X-ray
Ultrasound
Ahmedabad Haemogram Liver function test, lipid profile,
kidney function test
Hepatitis B
Hepatitis C
X-ray
Ultrasound
LNJP,
New Delhi
Haemogram
Urine
Liver function test, lipid profile,
kidney function test
VDRI,
Hepatitis B
Hepatitis C
X-ray
Ultrasound
RML,
New Delhi
Haemogram
Urine
Liver function test, lipid profile VDRI,
Hepatitis B
Hepatitis C
X-ray
Trivandrum Haemogram Liver function test, lipid profile
Trichur Haemogram Liver function test X-ray
(continued)
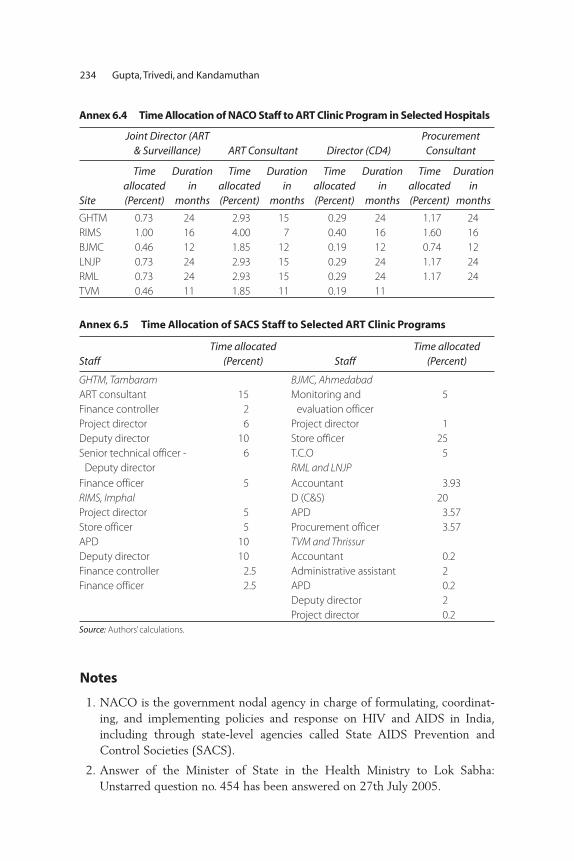
234 Gupta, Trivedi, and Kandamuthan
Annex 6.5 Time Allocation of SACS Staff to Selected ART Clinic Programs
StaffTime allocated
(Percent) StaffTime allocated
(Percent)
GHTM, Tambaram BJMC, AhmedabadART consultant
Finance controller
15
2
Monitoring and
evaluation officer
5
Project director 6 Project director 1
Deputy director 10 Store officer 25
Senior technical officer -
Deputy director
6 T.C.O
RML and LNJP5
Finance officer 5 Accountant 3.93
RIMS, Imphal D (C&S) 20
Project director 5 APD 3.57
Store officer 5 Procurement officer 3.57
APD 10 TVM and ThrissurDeputy director 10 Accountant 0.2
Finance controller 2.5 Administrative assistant 2
Finance officer 2.5 APD 0.2
Deputy director 2
Project director 0.2
Source: Authors’ calculations.
Annex 6.4 Time Allocation of NACO Staff to ART Clinic Program in Selected Hospitals
Joint Director (ART& Surveillance) ART Consultant Director (CD4)
Procurement Consultant
Site
Time allocated(Percent)
Durationin
months
Time allocated(Percent)
Durationin
months
Time allocated(Percent)
Duration in
months
Time allocated(Percent)
Duration in
months
GHTM 0.73 24 2.93 15 0.29 24 1.17 24
RIMS 1.00 16 4.00 7 0.40 16 1.60 16
BJMC 0.46 12 1.85 12 0.19 12 0.74 12
LNJP 0.73 24 2.93 15 0.29 24 1.17 24
RML 0.73 24 2.93 15 0.29 24 1.17 24
TVM 0.46 11 1.85 11 0.19 11
Notes
1. NACO is the government nodal agency in charge of formulating, coordinat-ing, and implementing policies and response on HIV and AIDS in India,including through state-level agencies called State AIDS Prevention andControl Societies (SACS).
2. Answer of the Minister of State in the Health Ministry to Lok Sabha:Unstarred question no. 454 has been answered on 27th July 2005.
Recurrent Costs of India’s Free ART Program 235
3. These numbers pertain to the situation existing a year ago. Currently, as perNACO figures for May 2007, there are about 80,000 individuals in the coun-try on ART. In all, there are currently 117 NACO-supported ART sites allover the country, with 68 of these being in high-prevalence states withGFATM-supported programs catering to some three-fourths of the totalclients on ART.
4. We do not include the large outpatient departments of the general hospitals,as the ART patient loads were a very small part of the total OPD load.
5. One potential pitfall with this approach occurs when a substantial share ofcosts relates to overhead, and average costs would therefore decline stronglywith the number of people receiving treatment (i.e., there are economies ofscale). As the bulk of costs, presented below, can be attributed to the costs oftreatment, rather than overhead, we do not differentiate between treatmentcosts and overhead in this exercise.
6. Tambaram hospital is mainly a TB hospital, catering to a large number of HIV-positive patients. Therefore, the number of physicians involved in the ARTprogram is much higher.
7. For the Kerala sites, the Directorate of Medical Education, Department ofHealth and Family Welfare, purchased the drugs. Even now, after these siteshave become NACO sites, the drugs are not being supplied by NACO.
8. This consists of one physician, one surgeon, one gynecologist, one pediatri-cian, one community medicine specialist, one microbiologist, one psychiatrist,one TB specialist, one STD specialist, and one staff nurse.
9. The distribution across drug regimens was not available from Trivandrum.
10. Thrissur has been left out of this because it did not have a CD4 machine, andincluding it would have yielded inaccurate shares.
11. This is lower than the share of ARV in the Thai national program, which wasestimated at 60 percent (Supakankunti et al. 2003).
12. BJMC, Ahmedabad, may be an outlier because it purchased a large quantityof drugs on its own.
13. Data over two years were also available for Tambaram; as it is a specialty hos-pital, it is not included in this table.
14. Since Trivandrum and Thrissur were initially state programs, the respectivecost shares are not comparable with the other sites; the two sites are thereforereported, but excluded from the analysis of cost shares. Tambaram (as a spe-cialty hospital) is also not used for calculating averages across NACO sites.
15. The distribution of the sample was as follows: Chennai (45), RIMS (28),LNJP (45), RML (41), Ahmedabad (45), Trivandrum (26), and Thrissur (34).The samples have been taken keeping in view the client load across sites.Since the respondents had to be interviewed at the ART clinic, the sampling

was purposive, but the interviews were spread over several days (althoughthere did not seem to be any particular pattern to the type of individualsattending the clinic on any particular day).
16. The question on food was worded carefully, and the interviewers were alsotrained to ask the question so that routine food intakes were not included. Theemphasis was on whether the client has been advised by anyone to eat addi-tional nutritious food like eggs, meat, milk, and fruits.
17. A survey of recent publications on this issue is maintained by the UNStanding Committee on Nutrition, and is available online (as of June 2007)at http://www.unsystem.org/scn/Publications/AnnualMeeting/hiv_reference/SCN_HIV_articles/ARV_and_nutrition_interactions.htm.
References
Bastos, Francisco Inácio, Deanna Kerrigan, Monica Malta, Claudia Carneiro-da-Cunha, and Steffanie A. Strathdee. 2001. “Treatment for HIV/AIDS in Brazil:Strengths, Challenges, and Opportunities for Operations Research.” AIDScience1 (15): November 27, 2001. http://aidscience.org.articles/aidscience012.asp
Bautista, Sergio, Kely Rely, Juan Pablo Gutierrez, Mira Johri, Tania Dmyitraczenko,and Stefano Bertozzia. 2003. HIV/AIDS Care in Mexico. Cuernavaca, Mexico:National Institute of Public Health.
Bhat, Ramesh, and Somen Saha. 2006. “Costing of HIV/AIDS Intervention ofProviding Antiretroviral Therapy.” Working paper, Indian Institute ofManagement, Ahmedabad, India.
Boulle, Andrew, Christopher Kenyon, and Fareed Abdullah. 2003. “A Review ofAntiretroviral Costing Models in South Africa.” In Economics of AIDS andAccess to HIV/AIDS Care ed. Jean Paul Moatti and others, 293–309 Paris:French National Agency on AIDS.
Guinness, Lorna, and others. 2004. “10 Best Resources in . . . Cost Analysis forHIV/AIDS Programs in Low and Middle Income Countries.” Health andPolicy Planning 19 (4): 242–45.
Gupta, Indrani, Abhjit Roy, and Mayur Trivedi. 2004. Access to AntiretroviralTreatment: What Role Can Health Insurance Play in India? New Delhi, India:Population Council.
Gupta, Indrani, and Deepa Sankar. 2003. “Treatment Seeking Behavior and theWillingness to Pay for Antiretroviral Therapy in India.” Working paper,Institute of Economic Growth, New Delhi, India.
Kombe, Gilbert, David Galaty, and Chizoba Nwagbara. 2004. AntiretroviralTreatment in the Public Sector in Nigeria: A Comprehensive Analysis of ResourceRequirements, Bethesda, MD: Abt Associates, Partners for Health Reform Plus.
236 Gupta, Trivedi, and Kandamuthan
Recurrent Costs of India’s Free ART Program 237
Kombe, Gilbert, and Owen Smith. 2003. The Costs of Anti-Retroviral Treatment inZambia, Bethesda, MD: Abt Associates, Partners for Health Reform Plus.
Ministry of Health and Family Welfare (MOHFW), Government of India, 2006,“Demand No. 46,” In Demands for Grants, Ministry of Finance, Governmentof India, 2006, “Union Budget 2006–2007,” http://www.indiabudget.nic.in/ub2006-07/eb/sbe46.pdf.
———. 2005. “National Health Accounts.” Ministry of Health and Family Welfare,New Delhi, India.
Over, Mead, and others. 2006. The Economics of Effective AIDS Treatment:Evaluating Policy Options for Thailand. Washington, DC: World Bank.
Over, Mead, P. Heywood, K. Sudhakar, and others. 2004. HIV/AIDS Treatmentand Prevention of HIV/AIDS in India: Modeling the Costs and Consequences.Washington, DC: World Bank.
Supakankunti, Siripen, Witanee Phetnoi, and Keiko Tsunekawa. 2004. Costing of“The National Access to Antiretroviral Programs for People Living With HIV andAIDS” in Thailand. Thailand: Centre for Health Economics, ChulalongkornUniversity, and World Health Organization.


A
access, universal, 177adherence, 175, 206Afghanistan, 22–24, 34, 41–72
children, abandoned, 46conflict, 44cost effectiveness, 42, 47–50drug production, 23epidemic, state of, 42–47 GDP, 41health care, 45IDU, 10, 22–23, 42, 43incidence, 43poverty, 45prevalence, 41–42, 43, 47prevention economics, 50–56prevention effectiveness, 47–50programs, 23–24sex work, 22–23social welfare, 41, 43, 44
Afghanistan HIV and AIDS PreventionProject (AHAPP), 50–51
age distribution, 133aid, external, 104aidsproj.ado, 185
flow diagram, 186
antenatal care, 110, 111access to, 104, 105
antiretroviral treatment (ART), 83, 94access to, 103, 105, 108, 113delivery, 176failure, 166India, 160–163people receiving vs people needing, 160programs, 176–177, 191–237quality, 175–177scale-up, 105–107, 160, 164, 196–197,
215, 223structured, 204Thailand, 235n.11see also drugs; health care
antiretroviral treatment program costs administrative costs, 209Brazil, 197establishment grant, 209India, 191–237
India, sites, 200–205, 226–233recurrent, 191–237South Africa, 198Thailand, 197see also costs; health care costs
awareness, 99, 100, 101, 112
239
Index

B
Bangladesh, 19–22, 34 AIDS treatment, fiscal burden, 179health care costs, 171 IDU, 10, 21–22poverty, 171, 174 prevalence, 20, 21sex workers, 20–21
behavior, high-risk, 48, 102Afghanistan, 45–47India, 31
Bhutan, 25–26, 34–35AIDS treatment, fiscal burden, 180condom use, 26prevalence, 26sexual partners, 26
BJ Medical College Ahmedabad, 200–205,228–229, 235n.12
bleach disinfection, 65n.8blood
safety program, 36tests, 188n.7transfusions, Af, 46
borrowing, household, 94–95
C
Cambodiaaccess to care, 105transmission, 29
capital, 84case management, 35catastrophic illness, 171–172children, 115n.10, 134–135, 140, 150n.12
abandoned, 46stigma and, 92, 94
China, IDU, 48circumcision, male, 6, 7–10
trials, 9Pakistan, 19
clientsexpenditures, 200number of, 222, 235n.3number receiving ART, 205–206, 213,
214–215coinfection, couples, 115n.16condom use, 30
Afghanistan, 22–23Bhutan, 26India, 31 promotion, 35
conflict, 44, 65nn.1,2
coping, 91–95cost effectiveness, 48–50
Afghanistan, 42, 47–50 harm reduction, Eastern Europe, 66n.14IDU interventions, 62–64
cost estimatesdefinitions, 224–226India, 143–147, 224–226 interventions, 196–197
costs, 89 annual, 214ART, 106–107averted, 56case studies, 128–130distribution, 216drugs, 107, 189n.12, 213, 215, 219,
221, 235n.7economic, India, 123–154estimation, 143–147expenditures, 141, 142FATP, 210–216, 218–220, 224–226financial impacts, 140–141health care budget vs. , 222hospital, 199, 216India, 210–216monitoring, 116n.26overhead, 235n.5per client, 211–212per unit, 196–197, 214, 215, 224private vs public, 221production, 86projected, India, 218–220 training, 209treatment, 99, 105–109
counseling, trend, 203
D
data collection, considerations, 130–132demographic indicators, 80–81development, HIV/AIDS and, 75–121diet, 236n.16disability-adjusted life years (DALYs),
77–78drugs, antiretroviral 191, 208
costs, 107, 189n.12, 213, 215, 219, 221, 235n.7
OI, 209prophylactic, 209regimens, 210, 235n.9resistance, 107
drugs, illegalproduction, 11
240 Index
trafficking, 49see also injecting drug users
E
economic consequences, 51–52economic development, HIV/AIDS and,
76–77, 84–90, 99–112, 114–115n.8aggregate, 124growth rate, 77household-level, 124
education, 133orphans, 97–99women, 100
effectiveness, 3–4employment and loss of employment,
76, 91, 138–140Afghanistan, 53–54India, 112
epidemicheterogeneity, 5–6scale, 4
equivalent variation, 88, 115n.11,150–151n.15
expenditures. See costs
F
family, 146defined, 132losses, 145type, 134, 145
financial impact. See costsforeskin, 9–10Free Antiretroviral Treatment (ART)
Program, recurrent costs, 191–237assumptions and parameters, 205–210costs, 210–216, 218–220, 224–226findings, 220–223methodology and data collection,
196–201outlook, 223–224out-of-pocket expenditure, 216–218recipients, 195sites, 200–205, 226–233, 235–236n.15staff, 234tests, compulsory, 233
G
GDP, 84–86per capita, 103–104, 111, 114n.7,
116nn.22, 23gender gap, information, 100
GHTM Chennai, 200–205, 226–228Government Medical College Thrissur,
200–205, 232–233grant, ART program establishment, 209
H
harm reductioncost-effectiveness, 49–50effectiveness, 59–61IDU, 65n.8, 66n.14
health care, 55–56, 92, 94, 114n.3, 128access to, 76, 90, 93, 99–100, 102–105,
110–111, 170–175antenatal care, 104, 105, 110, 111costs, 99distribution, 109–112fiscal burden, 157–190inequities, 113need, 116n.28Nepal, 163, 164private, 170–175, 178private vs public, 168–170,
175–177quality, 175–177, 189n.8scale-up, 166Sub-Saharan Africa, 167see also antiretroviral treatment
health care costs, 76, 105–109, 163–167,188n.5
annual, 187, 188n.3expenditures, 94, 150n.13, 189n.9expenditures per capita, 167 financing, 167–170household net consumption and, 171India, 163, 164, 166, 189n.9models, 185–186, 189n.11Nepal, 163, 165, 166out-of-pocket payments, 173, 188n.6poverty and, 177second-line therapy, 188n.3, 189n.11see also antiretroviral treatment
program costs; costshealth impact, HIV/AIDS, 75–76, 77–83health indicators, 92health projects, evaluation, 65n.5health status, physical, 135–136, 139hepatitis C, 46HIV, virus types, 123hospitals
ART program, 209costs, 199, 216outpatients, 235n.3
Index 241

households composition, 151n.16coping with economic impacts,
90, 91–95effects of HIV/AIDS, 124, 126
household surveys, 124–125, 126,149n.4, 150n.5
India, 127–141human capital, 86
generations, 125–126human resources, ART centers, 207–208
I
impact of HIV/AIDSdistribution, 90economic, 76–77, 84–90health, 75–77, 77–83other, 76, 90–99
incidence, 14, 80, 151n.17Afghanistan, 43Canada, 65–66n.11India, 160Iran, 44rate, 187n.2
income, 76, 88, 115n.9, 141, 142,150n.11
loss, 91, 94, 128, 141 per capita, 126
India, 28–30, 34AIDS treatment, fiscal burden, 179ART, 160–163behavior, 31costs, 109, 123–154, 163, 164, 166,
143–147, 174, 175, 189n.9employment, 112Free ART Program, 193–196Free ART Program, recurrent costs,
191–237GDP, 85–86poverty, 174, 175high-prevalence states, 15–16household survey, 127–141IDU, 10incidence, 14–17, 160model, 141–143mortality, 79, 159prevalence, 14–17, 30–31, 123,
158–159private vs public health care, 168–169severity of epidemic, 13sex workers, 28–29, 30
STD, 28, 30treatment, 109, 163, 164, 166
infectiousness, by disease stage, 7information, access to, 100–102injecting drug use (IDU), 5, 6, 10–12,
27–28, 32–33, 34, 48 Afghanistan, 22–23, 42, 43–44, 57, 58Bangladesh, 20 Canada, 65–66n.11China, 48cost effectiveness, 62–64equipment and equipment sharing,
11–12, 28, 32, 46–47GDP and, 87harm reduction, 59–61, 65n.8, 66n.14health care, 111–112India, 16interventions, 35, 49, 65n.7Iran, 44–45Nepal, 17, 18recovered, 53, 55Sri Lanka, 24–25US, 65n.7years, 11
insurance, 169interventions, 66n.13
effectiveness, 48–50evidence-based, 31–32
investment, 85Iran
IDU, 44–45prevalence, 44
L
labor supply, 84, 85, 138–140, 150n.10male, 149productivity, 140
lessons learned, 3–12life expectancy, 80, 81, 82, 83, 107,
114n.4welfare and, 89
lifespan, 55living standard, 89, 113–114
orphans, 97see also welfare
LNJPH Delhi, 200–205, 229–230
M
Maldives, 26, 34–35medical aspects. See health care
242 Index
Medical College Trivandrum, 200–205, 231–232
mental health, 124–125, 127, 136–137,143–144, 147–148
men who have sex with men (MSM), 27, 32–33, 34
India, 16services for, 35Sri Lanka, 25
migrants, 133Nepal, 17, 18 Sri Lanka, 25support center, 36see also refugees
mobility, 12–13model outline, India, 141–143molecular epidemiology, Pakistan, 18–19morbidity, 88–89, 140, 150n.9mortality, 65n.4, 77–83, 107, 112,
114n.1, 147India, 159risk, 115n.12welfare and, 89, 90
N
National AIDS Control Organisation(NACO), 193, 234n.1
staff time allocation, 234National AIDS Demonstration Research
(NADR) program, 65n.7Nepal, 34
health care costs and poverty, 174 prevalence, 17severity of epidemic, 13treatment costs, 109, 163, 165, 166
networks, high-risk, 27India, 16
O
occupation, 132–133, 150n.7see also employment
opium production, 45opportunistic infections (OI), 56
drugs, 209orphans, 95–99, 113, 116n.17
rates, 96outlook, India, 223–224out-of-pocket expenditure, 173,
188n.6India, 216–218
P
Pakistan, 34fiscal burden, 182IDU, 10molecular epidemiology, 18–19prevalence, 44trends, 10
patients. See clientsphysicians, costs, 197population growth, 81poverty
Afghanistan, 45health care costs and, 170–175, 177India, 123
pregnant women, India, 16prevalence, 4–5, 14, 75–76, 77, 78,
89, 114n.2, 125, 150n.6, 157Afghanistan, 41–42, 43, 47antenatal vs population-based, 5Bhutan, 26India, 123, 158–159Iran, 44Pakistan, 44Sri Lanka, 24
prevention access to, 76, 99, 90Afghanistan, 47–50, 50–56benefits, 53, 58costs, 52–55, 58drugs, 209economics 50–56effectiveness, 47–50interventions, 27–32, 35–36priorities, 32–36program costs and outcomes,
50–51, 57spending, 51 women, 36
principles and policy implications, 33prisons, Afghanistan, 46productivity, 114n.6proportion, 150n.12
R
recipients, India, 195refugees, 46–47
Afghanistan, 42, 44see also migrants
regional distribution of sample, 131research, global, 65n.6
Index 243
RIMS Imphal, 200–205, 228risk
India, 16reduction programs, 65n.9
RMLH Dellhi, 200–205, 230–231
S
SACS, staff time allocation, 234savings, household, 85, 95, 115n.14
health care costs and, 188n.6rates, 112
school enrollment, 140, 141income category, 99
sexual behavior, 65n.1high-risk, 50–51
sexually transmitted diseases (STD)India, 28, 30Thailand, 28
sexual partners, 6Bhutan, 26 rate and patterns of, 6–7, 8serial vs concurrent, 6–7, 8
sex works, 12–13, 27, 32–33, 34, 46Afghanistan, 22–23Bangladesh, 20drug use and, 11GDP and, 87India, 16, 28–29, 30, 31Nepal, 17, 18Pakistan, 19Thailand, 28
social upheaval, Afghanistan, 23socioeconomics, 32, 110, 113, 132–135Sonagachiu Project, 28–29, 30South Asia, AIDS treatment,
fiscal burden, 183Sri Lanka, 24–25, 34–35
antenatal care, 105 fiscal burden, 181health care costs and poverty, 174 IDU, 24–25migrants, 25MSM, 25prevalence, 24
staff, 235n.8India, 234
stigma, 13, 32, 42, 92–93, 137–138Sub-Saharan Africa, AIDS treatment,
fiscal burden, 184statistics, summary, 148susceptibility, 101–102, 113
T
Tambaram hospital, 235n.6TB, case study, 129tests, compulsory, 233tests and testing, CD4, 207, 208
costs, 213, 221Thailand
sex workers, 28STD, 28transmission, 29
theoretical framework, 124third-party payers, 169, 170Thrissur, 235n.14training costs, 209transmission
Cambodia, 29key factors, 6–12married couples, 101–102, 115n.16patterns, 12–26probabilities, 58Thailand, 29
treatment. See antiretroviral therapy(ART); health care
Trivandrum, 235n.14truck drivers, long-distance, 46
see also migrants
U
urban/rural differential, 116–117n.30
W
wages, 115n.12Afghanistan, 53lost, 115n.13
war, 44, 65nn.1,2welfare, 87–89, 126
costs, 112losses, 146mortality and, 90
well-being, subjective, 149n.3, 151n.18widows, 91–92, 112, 150n.8
case study, 128–129women, 65n.1, 77, 90
employment, 91HIV/AIDS, 78, 79–80, 96, 132preventive services, 36
workplace program, 36
Y
youth-friendly services, 36
244 Index

ECO-AUDIT
Environmental Benefits Statement
The World Bank is committed to preservingendangered forests and natural resources.The Office of the Publisher has chosen toprint HIV and AIDS in South Asia on recy-cled paper with 30 percent post-consumerwaste, in accordance with the recommendedstandards for paper usage set by the GreenPress Initiative, a nonprofit program sup-porting publishers in using fiber that is notsourced from endangered forests. For moreinformation, visit www.greenpressinitiative.org.
Saved:• 6 trees• 4 million BTUs of total
energy• 506 lbs. of CO2
equivalent of green-house gases
• 2,099 gallons of waste water
• 270 pounds of solid waste


HIV and AIDS in South Asia: An Economic Development Risk offers an original perspective on
HIV and AIDS as major development issues for the region. Although the impact of HIV and
AIDS on economic growth appears to be very small, three risks to development are associ-
ated with HIV and AIDS in South Asia: the risk of escalating concentrated epidemics, the
economic welfare costs, and the fiscal costs of scaling up treatment. As the authors show,
South Asian countries have relatively low estimated national HIV prevalence rates, but
prevalence is growing rapidly among vulnerable groups at high risk, such as sex workers
and their clients, men having sex with men, and injecting drug users and their partners.
The cost benefits of targeted prevention programs are high, and the financing of
prevention measures such as comprehensive harm reduction and condom use is a
sound economic investment in low-prevalence countries with concentrated epidemics.
Interventions that reduce the risks and stigma associated with HIV and AIDS have
benefits beyond the cost of lives saved: they improve the welfare of those who are
at risk and those who fear contracting HIV.
Treatment for AIDS in South Asia is limited at present, with weak health systems con-
tributing to low access to and use of services. The challenges of a comprehensive scaling
up of antiretroviral treatment are substantial, underscoring the crucial role of effective
prevention today. The authors conclude that the limited ability of many households to
pay “catastrophic” health expenses associated with treatment, as well as the negative
consequences associated with poor adherence to treatment, suggest a large and central
role for the public sector in the provision of antiretroviral therapy. HIV and AIDS in South
Asia: An Economic Development Risk will be of particular value to readers with interests
in the areas of economic policy, microfinance, public health, and epidemiology.
ISBN 978-0-8213-7800-7
SKU 17800