19923 - World Bank Documents & Reports
258
A WORLD BANK COUNTRY STUDY 19923 November 1999 Hungary Onthe Rcad to the European Union 0--w r ^ ' { @ T~~~~~~~~~~~~~~ S~~~~~~~~ __ t.r '~~~~~ Public Disclosure Authorized Public Disclosure Authorized Public Disclosure Authorized Public Disclosure Authorized Public Disclosure Authorized Public Disclosure Authorized Public Disclosure Authorized Public Disclosure Authorized
-
Upload
khangminh22 -
Category
Documents
-
view
3 -
download
0
Transcript of 19923 - World Bank Documents & Reports

A WORLD BANK COUNTRY STUDY
19923November 1999
HungaryOn the Rc ad to the European Union
0--w r ^ ' { @
T~~~~~~~~~~~~~~
S~~~~~~~~ __
t.r '~~~~~
Pub
lic D
iscl
osur
e A
utho
rized
Pub
lic D
iscl
osur
e A
utho
rized
Pub
lic D
iscl
osur
e A
utho
rized
Pub
lic D
iscl
osur
e A
utho
rized
Pub
lic D
iscl
osur
e A
utho
rized
Pub
lic D
iscl
osur
e A
utho
rized
Pub
lic D
iscl
osur
e A
utho
rized
Pub
lic D
iscl
osur
e A
utho
rized

A WORLD BANK COUNTRY STUDY
HungaryOn the Road to the European Union
The World BankWashington, D. C.
Copyright © 1999The International Bank for Reconstructionand Development/ THE WORLD BANK1818 H Street, N.W.Washington, D.C. 20433, U.S.A.
All rights reservedManufactured in the United States of AmericaFirst printing November 1999
World Bank Country Studies are among the many reports originally prepared for internal use as partof the continuing analysis by the Bank of the economic and related conditions of its developing membercountries and of its dialogues with the governments. Some of the reports are published in this serieswith the least possible delay for the use of governments and the academic, business and financial, anddevelopment communities. The typescript of this paper therefore has not been prepared in accordancewith the procedures appropriate to formal printed texts, and the World Bank accepts no responsibilityfor errors. Some sources cited in this paper may be informal documents that are not readily available.
The findings, interpretations, and conclusions expressed in this paper are entirely those of theauthor(s) and should not be attributed in any manner to the World Bank, to its affiliated organizations,or to members of its Board of Executive Directors or the countries they represent. The World Bank doesnot guarantee the accuracy of the data included in this publication and accepts no responsibility for anyconsequence of their use. The boundaries, colors, denominations, and other information shown on anymap in this volume do not imply on the part of the World Bank Group any judgment on the legal statusof any territory or the endorsement or acceptance of such boundaries.
The material in this publication is copyrighted. The World Bank encourages dissemination of itswork and will normally grant permission promptly.
Permission to photocopy items for internal or personal use, for the internal or personal use ofspecific clients, or for educational classroom use, is granted by the World Bank provided that theappropriate fee is paid directly to Copyright Clearance Center, Inc., 222 Rosewood Drive, Danvers, MA01923, U.S.A., telephone 978-750-8400, fax 978-750-4470. Please contact Copyright Clearance Centerprior to photocopying items.
For permission to reprint individual articles or chapters, please fax your request with completeinformation to the Republication Department, Copyright Clearance Center, fax 978-750-4470.
All other queries on rights and licenses should be addressed to the World Bank at the address above,or fax no. 202-522-2422.
ISBN: 0-8213-4618-0ISSN: 0253-2123
Cover photo: Szechenyi-Ldnchfd (Szechenyi Chain Bridge); courtesy of Csaba Rafael, Hungarian NewsAgency.
Library of Congress Cataloging-in-Publication Data has been applied for.

Contents
Abstract ................................................................. ixCurrency and Equivalent Units ................................................................. xiAcronyms and Abbreviations ................................................................. xiAcknowledgments ................................................................. xiii
Executive Summary ................................................................... l
Chapter 1. Sustaining Growth and Gaining Membership in the European Union .......................... 19Introduction ................................................................. 19Stabilization and Recovery in the Second Half of the 1990s .......................................................... 19
Unsustainable Recovery in the First Half of the 1990s ........................................................ 19Stabilization and Acceleration of Structural Reforms in the Mid- 1990s .............................. 20Impressive Performance in the Second Half of the 1990s .................................................... 22
Recent Pressures on the External Accounts ................................................................. 24Trade and Current Account Developments in 1998 ............................................................. 24Fighting the Turmoil in World Capital Markets ................................................................. 26
EU Membership and Income Convergence ................................................................. 27The Process of Achieving EU Membership ................................................................. 27Relationship Between EU Membership and Income Convergence ...................................... 28Hungary's Initial Conditions on the Eve of EU Accession .................................................. 30
Ensuring the Conditions for Sustained Growth and Rapid Income Convergence .......................... 31Main Elements of a Sustainable High-Growth Strategy ...................................................... 31The Reform Scenario ................................................................. 32The Objective and Structure of the Country Report ............................................................. 35
Chapter 2. A Fiscal Framework for Sustained Growth ................................................................. 37An Overview of Hungary's Medium-Run Fiscal Framework ......................................................... 37
Fiscal Adjustment in the Mid-1990s ................................................................. 37The Medium-Run Fiscal Program and Its Contribution to Savings and Growth ................. 39Sustainability of Fiscal Policy in the Longer Run ................................................................ 41
Pension Reform ......... 42Initial Conditions .................................................. 42Main Components of the Reform .................................................. 43Assessing the Long-Run Impact of the Reform .................................................. 44Pending Policy Issues .................................................. 45Guarantees on Second Pillar Returns .................................................. 46
The Challenges in the Health Sector ................................................... 48Need for Reform in the Health Sector .................................................. 48Main Elements of Health Reform in Hungary .................................................. 50Fiscal Impact of a Reformed System .................................................. 54
Local Government Finances in the Context of EU Accession .................................................. 55Local Government Finances in the First Half of the 1990s .................................................. 55Recent Efforts to Introduce Transparency and Discipline .................................................. 56Policy Options in the Light of EU Accession .................................................. 57
Chapter 3. Foreign Trade and Contestability of Markets .................................................. 59Reorientation of Foreign Trade Toward Market-Driven Patterns .................................................. 59Integration into EU Markets: Export Performance ............................................ 60
Expansion of Exports to the EU: Two Phases ............................................ 60Export Basket: The Shift toward Manufacturers ............................................ 62Change in Competitiveness in EU Markets ............................................ 62Factor Intensities of EU-Oriented Exports over 1989-96 ........................................... 63Changes in the Level of Processing ........................................... 64Environmentally Dirty Products in Exports to the EU ........................................... 65

iv
The Role of FDI in Restructuring and Export Performance ................................................. 66Conclusion: A Demonstrated Capacity to Withstand Competition in a Single Market ...... 67
Contestability of Domestic Markets ...................................................................... 67Foreign Trade Policies ...................................................................... 68Reverse Discrimination in Imports: Higher Cost to Producers and Consumers ................... 70
Trade Policies and'Export Performance ....................................................................... 71Conclusions and Key Recommendations ...................................................................... 73
Chapter 4. Financial Sector Development ...................................................................... 74Introduction ...................................................................... 74Development of the Banking Sector over the Past Decade ............................................................. 75
Background ....................................................................... 75Present Structure and Performance of the Banking System ................................................. 77Resource Mobilization and Allocation by the Banking System ........................................... 79Banking Supervision ...................................................................... 81
The Insurance Sector ...................................................................... 82Capital Markets ...................................................................... 83
Institutional Investors ...................................................................... 85Brokerage Firms ...................................................................... 86
The Challenges Ahead ...................................................................... 86Risk Management ...................................................................... 87Credit Distribution ...................................................................... 88Housing Finance ...................................................................... 89Municipal Finance ...................................................................... 90EU and OECD Compatibility ...................................................................... 92
Conclusion ....................................................................... 93
Chapter 5. Enterprise Sector in Transition ....................................................................... 94Looking Back ...................................................................... 94
The Political Backdrop ...................................................................... 94Creeping Privatization; Meandering Asset Sales ................................................................. 95The Privatization Process ...................................................................... 95Privatization Scoreboard ....................................................................... 96Spending the Receipts ...................................................................... 97Tlhe Role of Foreign Direct Investment . ...................................................................... 97Origins and Recipients of FDI ...................................................................... 97Benefits of FDI ....................................................................... 99Have Firms Restructured? ....................................................................... 99Loss Makers in Utilities ....................................................................... 99Small and Transitory Operating Cash Deficits in Manufacturing ...................................... 100Restructuring and Ownership ...................................................................... 101Tough Bankruptcy Laws Peripheral to Restructuring ........................................................ 104
Taking Stock ...................................................................... 105A Thumbnail Sketch ...................................................................... 106Population and Ownership of Enterprises ...................................................................... 106Enterprise Finance ...................................................................... 107
Summary and Conclusions ....................................................................... 107
Chapter 6. Preparing Infrastructure for EU Accession .................................................................... 110Overview of Recent Reforms in the Electricity, Telecommunications, Gas, and
Transportation Sectors ...................................................................... 111Electricity ....................................................................... 111Telecommunications ....................................................................... 111Natural Gas ...................................................................... 112Transportation ....................................................................... 113
International Policy Developments ...................................................................... 113Current and Forthcoming Substantive Regulatory Issues ............................................................. 116
v
Tariff Rebalancing ................................................................... 117Electricity ................................................................... 117Telecommunications ................................................................... 118Gas ................................................................... 119Interconnection Policy ................................................................... 120Competitively Neutral Mechanisms for Funding Universal Service .................................. 121Competitive Pricing Flexibility ................................................................... 122
Overview of the Transport Sector .................................................................... 122Toward EU Accession: Summary and Recommendations ............................................................ 123
Electricity .................................................................... 124Telecommunications .................................................................... 125Gas ................................................................... 126Roads ................................................................... 126Railways ................................................................... 127Road Transport .................................................................... 128Inland Navigation ................................................................... 128Aviation ................................................................... 129Urban Transport .................................................................... 129
Chapter 7. The Labor Market ................................................................... 130Recent Trends ................................................................... 130
Employment, Labor Force Participation, and Unemployment ........................................... 130Education ................................................................... 133Real Wages ................................................................... 133
To What Extent Has the Labor Market Adjusted? ................................................................... 133Are Policies Adequate to Ensure an Efficient Allocation of Hungary's Human Capital? ............ 135
Wage-Setting Mechanisms ................................................................... 135Employment Legislation ................................................................... 136Support to the Unemployed ................................................................... 137Public Spending on Passive and Active Policies ................................................................ 139Taxes and Social Security Contributions ................................................................... 140Compliance with the Acquis Communautaire ................................................................... 141
Conclusions and Key Recommendations ................................................................... 143
Chapter 8. Public Administration .................................................................... 145Government Employment and Remuneration: Efficiency Issues ................................................. 145
Govermment Employment ................................................................... 145Government Wage Bill Developments ................................................................... 147Remuneration in the Civil Service and Public Service: Efficiency Issues ........................ 148Differences in Public Service and Civil Service Wages ..................................................... 148Differences in Public and Private Remuneration ............................................................... 149New Measures for Civil Service Wage Flexibility ............................................................. 149Civil Service Pay and Employment Issues for European Integration ................................. 149Cost Implications of EU Accession for the Civil Service .................................................. 150
Human Resource Management in the Civil Service ................. 1....................................... ... 151Institutional Framework .151Merit Practices .152Competency Exams .152Performance Appraisal .153Promotion .153Training and Career Development .153
Managing EU Accession .154Institutional Arrangements .155Human Resource Issues .155
Policy Recommendations .156Government Employment and Remuneration .156Human Resource Management in the Civil Service .156
vi
Managing EU Accession ..................................................................... 157
Chapter 9. The Agriculture and Food Sector ..................................................................... 158Overview of Recent Structural Changes ..................................................................... 158Support to Agriculture: A Limited Program in Need of Revision . .............................. 160
Direct Budgetary Support ...................................................................... 160Tax Privileges ..................................................................... 162Registration of Farmers and Tax Evasion ............................................. 162The National Reserves System ..................................................................... 162
Preparation for Accession to the European Union ..................................................................... 162Consistency with Ongoing Agreements with WTO and CEFTA ....................................... 163Proposed Adjustment of the Common Agricultural Policy (CAP) . ......................... 163Hungary's Transition toward a Hypothetical New CAP: Support Prices and Surplus ....... 164Hungary's Transition toward a Hypothetical New CAP: Policy Instrument
and Institutions ..................................................................... 164Other Consequences for Hungary of Full Accession .................................... 165Financing of Structural Changes and Investment ....................................... 166Rural or Regional Development: A Policy Still to be Finalized
and Strengthened ..................................................................... 166Remaining Constraints to Long-Term Efficiency and Innovation . ............................... 167
Factor Markets ..................................................................... 167Product Markets: Instruments and Participation ........................................ 169The Role of State Agencies in Promoting Efficiency and Enforcing
the EU Legal Framework . ............... 171Development of New Marketing Strategies ........................................... 173
Conclusions and Key Recommendations ................................................... 173
Chapter 10. Environment .................................................. 175Overview and Cost Estimates .................................................. 175Directive Costs Falling Exclusively on the Public Sector .................................................. 177Directive Costs Falling Predominantly on the Private Sector ...................................................... 177
The Internal Market .................................................. 177Industrial Pollution .................................................. 177Long-Range Air Pollution .................................................. 178Urban Air Quality .................................................. 178
Directive Costs Falling on Both Public and Private Sector Bodies .............................................. 179Wastewater Collection and Treatment .................................................. 179Drinking Water .................................................. 181Waste Management .................................................. 182
Implications of the Investment Requirements ................................................... 183Implications for the Public Sector .................................................. 183Implications for Utility Trariffs .................................................. 184
Recommendations-for an Implementation Strategy ................................................... 186
References .................................................. 188Statistical Appendix .................................................. 192

vii
Tables
Table 1.1 I Inflation and Growth in Selected CEE Countries, 1993-98 .......................................... 20Table 1.2 Selected Economic Indicators, 1993-98 ........................................................ 21Table 1.3 Ratio of Profit Remittances to the Stock of FDI in Selected Countries, 1993-97 ......... 25Table 1.4 Income Convergence with the EU of Ireland, Greece, Spain, and Portugal ................. 29Table 1.5 Years to Close Income Gap with the EU Under Different Scenarios ........................... 30Table 1.6 Illustrative Medium-Term Framework ......................................................... 34
Table 2.1 An Overview of the General Government Budget (% of GDP), 1993-98 .................... 37Table 2.2 General Revenues, 1994-98 (% of GDP) ......................................................... 38Table 2.3 General Expenditures, 1994-98 (% of GDP) ......................................................... 39Table 2.4 Hungary's Medium-Run Fiscal Program, 1998-2001 (% of GDP) ............................... 40Table 2.5 Replacement Ratios and Internal Returns under Conservative Assumptions ............... 47Table 2.6 Replacement Ratios and Internal Returns if Guarantee is Triggered ............................ 47Table 2.7 Health Expenditures, Total and Public Sector, 1991-98 ............................................... 49Table 2.8 Local Government Accounts, 1993-98 ......................................................... 56
Table 3.1 Two phases of Hungarian Export Expansion ........................................................ 61Table 3.2 Hungarian Exports to the EU in a Comparative Perspective, 1992-97 ......................... 61Table 3.3 Significance of Hungarian Exports into the EU in 1989, 1993, and 1997 .................... 63Table 3.4 Composition of Hungarian Exports to the EU, by Factor Intensity, 1989-97 ............... 64Table 3.5 Changes in Hungary's Exports to the EU by Stage of Processing, 1989-97 ................. 65Table 3.6 Selected Features of Hungary's Dirty Exports to the EU, 1989-97 .............................. 65Table 3.7 Cumulative FDI Inflows in Terms of Per Capita and in Relation to GDP .................... 66
Table 4.1 Assets of Financial Institutions and Market Capitalization, 1990-98 ........................... 74Table 4.2 Present Foreign Ownership in Largest Banks ........................................................ 77Table 4.3 Market Capitalization and Turnover Ratios, 1990-98 ................................................... 84Table 4.4 Annual trade volume by ownership of brokerages ........................................................ 86
Table 5.1 Ownership of Manufacturing Firms ......................................................... 95Table 5.2 FDI Ownership in Manufacturing Firms, 1992 and 1996 ............................................. 98Table 5.3 Enterprise Losses in Hungary ........................................................ 100Table 5.4 Manufacturing Firms' Adjacent Year Cash Flows ...................................................... 101Table 5.5 Forward-looking set, 1992-1997 ......................................................... 102Table 5.6 Backward-looking set, 1992-1997 ......................................................... 102Table 5.7 Registered firms, 1992-1997 ......................................................... 106
Table 6.1 Welfare Gains from Deregulation in the United States in 1990 .................................. 115
Table 7.1 Duration of Unemployment Spells, 1992-97 ........................................................ 132Table 7.2 Distribution of Employment by Sectors, 1980-1997 ................................................... 133Table 7.3 Job Losses and Gains in the Manufacturing Sector, 1992-97 ..................................... 134Table 7.4 Real Value Added per Employee in Manufacturing,
by Types of Firm Ownership, 1992-97 ......................................................... 135Table 7.5 Percentage of Unemployed Receiving Benefits, 1992-97 ........................................... 138Table 7.6 Spending on Active and Passive Labor Market Measures, 1992-97 ........................... 139Table 7.7 Spending on Active and Passive Policies in Hungary and EU Countries, 1996 ......... 140Table 7.8 Income Tax Rates by Income Bracket, 1998-1999 ..................................................... 140Table 7.9 Social Security Contribution Rates as of Percentage of Gross Wage, 1995-2002 ...... 141
Table 8.1 Government Employment in Selected Countries ........................................................ 146Table 8.2 Wage Bill in the Consolidated General Government, 1993-97 ................................... 147
viii
Table 10.1 Costs of EU Environmental Directives for Hungary ................................................... 176Table 10.2 Water Coverage of 81 Largest Companies in Hungary, 1997 ..................................... 180Table 10.3 Investment Costs to Secure Wastewater Collection and Treatment ............................ 180Table 10.4 Household Utility Bills Under Alternative Investment Scenarios ............................... 185
Figures
Figure 1.1 Selected Economic Indicators ........................................................ 23Figure 1.2 External Developments, 1993-98 ........................................................ 25Figure 1.3 Impact of the 1998 International Crisis on the Financial Market .................................. 26
Figure 2.1 Pay As You Go Balance Under Three Different Scenarios .......................................... 43Figure 2.2 Pay As You Go Balances, Private Flows and National Savings ................................... 45Figure 2.3 Comparative Disease Burden, (mortality per 100,000 population) ............................... 49Figure 2.4 Projections for the Health System ........................................................ 54
Figure 3.1 Machinery and Transport Equipment against other EU-Destined Exports ................... 62Figure 3.2 Real Effective Exchange Rate and Developments in Foreign Trade, 1989-97 ............. 72
Figure 4.1 Market Shares by Bank Size ........................................................ 78Figure 4.2 Market Concentration - Herfindhall Indexes ........................................................ 78Figure 4.3 Return on Equity ........................................................ 79Figure 4.4 Assets per Employees ........................................................ 79Figure 4.5 Money, Credit, Interest Rates, and Spreads ........................................................ 80Figure 4.6 Insurance Sector ProfitlLoss ........................................................ 82Figure 4.7 Change in Composition of the Life Insurance Market Gross Premium
of Largest Companies ........................................................ 83Figure 4.8 Trading of Securities in 1997 HUF bn ........................................................ 84Figure 4.9 Corporate Leverage - Debt/Equity Ratio ........................................................ 87.Figure 4.10 Housing Finance ........................................................ 90
Figure 5.1 Bankruptcies in Hungary ........................................................ 105Figure 5.2 Liquidations in Hungary ........................................................ 105
Figure 7.1 Employment Trends in CEE Countries ........................................................ 131Figure 7.2 Unemployment Trends in CEE Countries ........................................................ 131Figure 7.3 Wage Ratio, Higher Education versus Eight Years of Schooling, 1986-1996 ............ 134
Figure 9.1 Shares of Agriculture in GDP and in Employment ..................................................... 159Figure 9.2 Labor Productivity in Agriculture in Selected EU Countries and Hungary, 1996 ...... 159Figure 9.3 Producer Subsidy Equivalents for Selected Countries ................................................ 161Figure 9.4 Consumer Subsidy Equivalents for Selected Countries .............................................. 161
Boxes
Box 4.1 Bank Restructuring Challenges and Responses ........................................................ 76Box 5.1 Hungarian Taxation and Its Effects ........................................................ 107Box 6.1 Market Liberalization and Regulatory Reform in the European Union ...................... 116Box 7.1 Hungary's Labor Market and the Acquis Communautaire ......................................... 142Box 8.1 The Legacy of Earlier Reforms ........................................................ 147Box 8.2 Strategy for Accession ........................................................ 154Box 9.1 Guidelines for a National Program of Harmonization with
the EU Legal Framework .172
ix
Abstract
The objective of this country study is to assess the transformation of the Hungarianeconomy given the country's intention to join the European Union (EU) during the early years ofthe next century. To this end, it analyzes economic developments in Hungary in recent years, inparticular since 1997, and describes institutional improvements and structural reformsimplemented during this same time period. The report is based on the findings of severalmissions that visited Hungary in 1998 and early 1999.
The report's main conclusion is that Hungary is one of the top performers among theCentral European transition countries and is well placed to accede the EU. Hungary'sachievements in constructing the elements of a market economy are impressive. The enterpriseand financial sectors are now mostly private, with strong foreign participation, and increasinglyrobust and efficient. Labor markets have facilitated fundamental restructuring of the economywhile maintaining low levels of unemployment by European standards. Significant progress hasalso been made in privatizing key enterprises in the infrastructure sectors and setting up modemregulatory systems for these sectors. Hungary is also proving to be competitive in internationalmarkets, in particular, most importantly, in the EU market; today, three-quarters of Hungary'sexports are to the EU. Export performance, especially since 1996, has been strong, specifically inhigh-technology intensive and human capital intensive products. While Hungary benefited fromgood initial conditions compared to other transition economies, its strong performance is mainlythe result of the successful stabilization program implemented in the mid-1990's, and of deepstructural reforms that began earlier in the decade and accelerated in subsequent years.
The report also concludes that the challenge facing Hungary today is to consolidatestabilization gains and finalize the structural reforms to ensure that the economy remainscompetitive and that income is placed on a rapid and sustainable convergence path with the EUaverage. In the macroeconomic arena, in order to maintain the ongoing investment expansionwhile at the same time avoiding the emergence of external imbalances, the authorities shouldstrengthen over the medium-term their fiscal adjustment effort. In the structural and institutionalarea, a three prong approach is required. First, policymakers should design and implementreform programs for the health sector, local government, and in infrastructure. While some ofthese new reform programs are not directly related to the legislation that Hungary needs to adoptwith EU membership, they are, however, essential to maintain growth and/or macro stability overthe medium-term. Second, the authorities should complete the successful structural reformefforts already underway in key markets and sectors such as pensions, the financial sector, thelabor market and external trade. Finally, policymakers need to refine and strengthen theinstitutional framework in public administration, environment and agriculture to improvecompliance with EU directives, and ensure a smooth and successful negotiation and entry into theEU's single market.
The report is composed of two parts. Part 1 is the summary report with the main findingsand conclusions. Part 2 is the main report that provides, against the backdrop of prospectivemembership in the EU, an analysis and assessment of the macroeconomic framework, themedium-term fiscal stance, and selected sectors and markets of the Hungarian economy.
Part 2 has 10 chapters and is structured as follows. Chapter I provides an overview ofrecent economic developments, and analyzes prospects for growth and income convergence withthe EU. In particular, it discusses the medium-term macro framework that, based on additionalfiscal adjustment over the medium-term, would both maintain external balances and achieve
x
faster income convergence with the EU. Chapter 2 elaborates on the medium-term fiscalframework and to this end analyzes reforms required in pension, health and intergovernmentalfinance systems. Chapter 3 focuses on foreign trade policies, and identifies additional measuresto be implemented during the pre-accession period that would improve further thecompetitiveness of Hungarian enterprises. Chapter 4 provides an assessment of the Hungarianfinancial sector and discusses how to complete the transition in the sector and ensure fullcompliance with EU directives. Chapter 5 analyzes the transition and restructuring of Hungarianenterprises and makes some recommendations to ensure continued flows of FDI. Chapter 6 looksat the infrastructure sector, and discusses several options for further competitive restructuring andregulatory reform to prepare the sector for competition in EU markets. Chapter 7 explores howlabor markets have contributed to the transition process, and suggests a number of measures toenhance labor market flexibility, employment, and labor productivity. Chapter 8 looks atinstitutional reforms in public administration that are critical for building an efficient andprofessional civil service capable of negotiating and leading the accession into the EU. Chapter 9recommends institutional and policy measures directed at inducing greater productivity andgrowth in agriculture, and at preparing the sector for the implementation of the EU policies anddirectives in this sector. Finally, chapter 10 focuses on the problem of meeting EUenvironmental standards at minimum cost.

xi
CURRENCY AND EQUIVALENT UNITSI ECU = 259 HUFUS$ I = HUF 242
WEIGHTS AND MEASURES
Metric System
FISCAL YEAR
January 1 to December 31
ACRONYMS AND ABBREVIATIONS
AB Allami Biztosito (the national EAGGF European Agricultural Guaranteeinsurance company) and Guidance Fund
ALOS Average Length of Stay ERDF European Regional DevelopmentAPEH Tax and Financial Audit Office FundAPTF Banking and Capital Market ESF European Social Fund
supervision Agency ESOP Employee Stock Ownership PlanAVRt State Holding Company EU European UnionAVU State Property Agency EUROSTAT European Statistical OfficeBB Budapest Bank FDI Foreign Direct InvestmentBCE Budapest Commodity Exchange FHB Land and Mortgage Credit BankBDC Bank and Debtor Conciliation FSU Former Soviet UnionBIS Bank for International Settlements GATT General Agreement on Tariffs andBKV Budapest Urban Transport Company TradeBSE Budapest Stock Exchange GDC Gas Distribution CompanyBUX Budapest Stock Exchange Index GDP Gross Domestic ProductCAD Capital Adequacy Directive (EU) GDR Global Depository ReceiptCAP Common Agricultural Policy HIF Health Insurance FundCAR Capital Adequacy Ratio HIPA Hungarian Institute of PublicCBI Central Budgetary Institution AdministrationCDC County Development Council HR Human ResourcesCEE Central and Eastern Europe HUF Hungarian ForintCEEC Central and Eastern European IAS International Accounting Standards
Countries - IFI International Financial InstitutionCEFTA Central European Free Trade IFO Institut fir Wirtschaftsforschung
Association IFS International Financial StatisticsCIB Central European Investment Bank (IMF publication)CMEA Council for Mutual Economic IPPC Integrated Pollution Prevention and
Assistance Control (EU directive)CSE Consumer Subsidy Equivalents IRC Interest Reconciliation CouncilCPI Consumer Price Index ISPA Infrastructure EU pre-accession fundCSD Civil Service Department (within the K&H Commercial and Credit Bank
Ministry of Interior) KEF Civil Servants' Interest-ConciliationCSO Central Statistical Office ForumEA European Agreements KIKI Central Food Research InstituteEBRD European Bank for Reconstruction KELER Central Clearing House and
and Development DepositoryEC European Commission MAHART Inland Navigation CompanyEEC European Economic Community MATAV Hungarian TelecommunicationsEFTA European Free Trade Association Company
MAV Hungarian State Railways

xii
MCO Managed Care Organization OTC Over the CounterMERP Ministry of Environment and OTP National Savings Bank
Regional Policy PAYG Pay As You GoMFN Most Favored Nation P.E. Person EquivalentMHB Hungarian Credit Bank PIT Personal Income TaxMKB Hungarian Foreign Trade Bank PPI Producer Price IndexMoARD Ministry of Agriculture and PPP Purchasing Power Parity
Regional Development PSE Producer Subsidy EquivalentsMoE Ministry of Energy PSO Public Service ObligationsMoF Ministry of Finance RCA Revealed Comparative AdvantageMoH Ministry of Health (trade index)Mol Ministry of Interior REC Regional Electricity CompanyMOL Hungarian Oil Company SAPARD Agriculture (EU pre-accession fundMSW Municipal Solid Waste SIGMA Support for Improvement inMTCWM Ministry of Transport, Governance and Management in
Communications and Water Central and Eastern EuropeanManagement Countries a joint of the OECD
MVM Hungarian Power Company Center for Cooperation with theMVMT Magyar Villamos Muvek Trust Economies in Transition and the
(electric utility) EU PHARE programN.A. Not Applicable SME Small and Medium EnterprisesNAFTA North American Free Trade SOE State-owned Enterprise
Agreement SPPA State Privatization and PropertyNBH National Bank of Hungary (central Administration Company
bank) SSI State Secretariat for IntegrationNDIF National Deposit Insurance Fund TEN Trans-European NetworksNHP National Health Plan TPA Third Party AccessNIRC National Interest Reconciliation UA Unemployment Assistance
Council UI Unemployment InsuranceNPH National Program of Harmonization UWWT Urban Wastewater Treatment (EUNTB Non-tariff Barrier directive)O&M Operation and Maintenance VAT Value Added TaxOECD Organization for Economic VOLAN Inter-city Bus Company
Cooperation and Development WTO World Trade Organization
xiii
ACKNOWLEDGMENTS
This report was prepared by a World Bank team led by Michelle Riboud (who also workedon the labor chapter). The other members of the team in alphabetical order are: Pedro Alba(team leader during final stages of report preparation), Julia Bucknall (environment), Rita Cestti(environment), Bruce Courtney (macroeconomics), Csaba Csaki (agriculture), Michel Debatisse(agriculture), Armin Fidler (health sector), Imre Hollo (health sector), Bart Kaminski (trade andforeign investment), Ioannis Kessides (infrastructure), Mihaly Kopanyi (financial sector),Philippe Lefevre (banking), Millard Long (financial sector), Barbara Nunberg (publicadministration), Jana Orac (public administration), Agata Pawlowska (private enterprises), S.Ramachandran (private enterprises), Roberto Rocha (macroeconomics and pension reform), andDeborah Wetzel (decentralization) Judit Spat and Anita Papp provided contributions to variouschapters of the report. Judit Spat also gave invaluable support during the discussion of the draftreport with government officials. Rossana Polastri provided research assistance. Deborah Davisand John Karaagac provided editorial assistance. Marinette Guevara processed the report andprovided executive assistance.
The report benefited from valuable comments from many Bank colleagues, especiallyHafez Ghanem, Robert Grawe, Laurens Hoppenbrauer, Roumeen Islam, Franz Kaps, PradeepMitra, Robert Palacios, Kyle Peters, Carlos Silva-Jauregui and Anthony Venables. The reportalso benefited from discussions with colleagues from the International Monetary Fund, theEuropean Commission and the Organization for Economic Cooperation and Development.
The different mission members would like to express their gratitude to all their Hungariancounterparts for the time they spent with the mission in frank and friendly discussion. Theircooperation made this report possible. Indeed, the team members profited from the collaborationand discussion with government officials, among others, from: the Ministry of Finance; Ministryof Foreign Affairs; National Bank of Hungary; Prime Minister's Office; Ministry of Agricultureand Rural Development; Ministry of Industry, Trade and Tourism; Ministry of Transport,Communications and Water Management; Ministry of Labor and Social Affairs; Ministry of theEnvironment; the Communications Authority; the Hungarian Energy Office; the Office ofEconomic Competition Policy; and the Statistical Office. Among the government officials, theteam would like to signal out Peter Ademec, Gustav Bager, Peter Gottfried, Agnes Hegedus, EvaTarjan, and Agnes Vargha. Key issues were also discussed with academicians and researchers atthe Institute of World Economics, Institute of Economics of the Hungarian Academy of Science,Research Institute for Labor, TARKI, Kopint-Datorg, and the Research and Information Institutefor Agricultural Economics.
Vice President: Johannes LinnCountry Director: Roger GraweSector Director: Pradeep MitraSector Leader: Hafez GhanemTeam Leaders: Pedro Alba and
Michelle Riboud


EXECUTIVE SUMMARY
INTRODUCTION
Hungary is one of the top economic performers among Central Eastern European (CEE)countries in transition, as well as one of the strongest candidates for accession to the European Union(EU). Since 1997, real per capita GDP growth has averaged 5 percent per year, and by 1999 inflationhad fallen to 10 percent - 11 percent. The volume of merchandise exports grew by an extraordinary 30percent in 1997 and 20 percent in 1998. Three quarters of Hungary's exports go to the EU, and two-thirdsof exports are high value-added, technology-intensive and human capital-intensive products. Thefinancial sector is among the most robust and efficient in Central Europe, with rapidly emerging capitalmarkets. The enterprise sector is efficient and now mostly private, with substantially increasing laborproductivity and expanding commercial ties with the EU and other international markets. Labor marketshave proven to be flexible, facilitating the restructuring of the economy while maintainingrelatively lowlevels of unemployment. While Hungary has benefited from good initial conditions compared to othertransition economies, this strong performance is mainly the result of the successful stabilization programimplemented in the mid-1990s, and of deep structural reforms that began earlier in the decade andaccelerated in subsequent years.
The challenge facing Hungary today is to consolidate the stabilization gains and finalize thestructural reforms to ensure that its economy remains competitive and that its income levels are placedon a sustainable and rapid convergence path to average EU levels. In the macroeconomic area,additional fiscal adjustment is needed over the medium term to ensure that the investment expansiondriving economic recovery and building future growth potential is not interrupted by a reemergence ofexternal imbalances, as in the past. In the structural arena, policymakers should design and implementreform programs for the health system, certain infrastructure sectors, and local government finance. Inaddition, they should complete the successful structural reform efforts already underway in pensions, thefinancial sector, the labor market, and trade liberalization. Finally, policymakers need to refine theregulatory and institutional framework in public administration, environment, and agriculture,to increasecompliance with EU directives and ensure a smooth and successful entry into the EU's Single Market.
An additional concern facing Hungary pertains to the issue of long-term poverty, especiallyamong the Roma ethnic group. According to the preliminary findings of a Poverty Update Report (to becompleted by the beginning of 2000), about 7.5 percent of the population lived in households thatexperienced poverty four or more times during the period 1992-97. Hence, the data suggest that there isin Hungary a group of long-term poor who are likely to remain poor even with strong economic growth.This development has important implications for Hungary's poverty reduction strategy, since the long-term poor typically need more intensive and expensive policy interventions than those who aretemporarily poor. The data also indicate that poverty and social exclusion tend to be higher among theless educated, those living in rural areas, and those with weak attachments to the labor market. Povertyrates are higher among households with three or more children, or if the head-of-household is under 40years of age or a single parent; single elderly female households also face the risk of severe and
1
2 Hungary - On the Road go the European Union
permanent poverty. Finally, ethnicity is an important factor. Roma households are much more vulnerableto poverty than any other group in Hungarian society; indeed, the data indicate that the majority of thelong-term poor are Roma. The concentration of long-tern poverty among the Roma further complicatesthe design of effective poverty interventions.
Progress during the Transition
Hungary's successful transition from a centrally planned to a market-oriented economy is dueto severalfactors, which together distinguish Hungary from the other CEE countries. First, Hungary hadfavorable initial conditions, including its location, a highly skilled and educated workforce, establishedtrade links with Western Europe, and during the communist regime, the widespread existence (and evenacceptance) of private entrepreneurship and foreign investment. Second, Hungary implemented acomprehensive program of structural reforms early in the transition process, including in financial andlabor markets. The authorities put in place a sound framework of laws and regulations regarding, amongother issues, property rights, bankruptcy laws, and supervision and prudential regulations. Finally, thegovernment has been flexible and responsive to changes in economic circumstances. In particular, itdecisively responded to the significant external imbalances that emerged in 1993-94 by implementing afar-reaching stabilization program that combined fiscal adjustment measures with the acceleration ofstructural reforms.
Unlike many other CEE countries and even under the previous cenatrally planned regime,significant sections of the Hungarian economy were private and open to intei.national trade, includingtrade with non-communist countries. Although most larger industrial enterprises were state owned, smallfirms could be privately owned and operated even in the 1960s. The preservation of the entrepreneurialculture helped during the transformation of the economy after the collapse of the Council of MutualEconomic Assistance (CMEA), the communist counterpart to the European Union. Hungary's GDPtrough was shallower, after the CMEA's collapse, than it was in other transforming economies, and thedevelopment of the private sector has been remarkable: by the end of 1998, it accounted for some 80percent of GDP, up from 20 percent in 1990. In addition, the early start of the privatization process wasfacilitated by cash sales to outsiders (often foreign investors with a majority stake), andcontributed to thegrowing importance of the private sector in the economy. With regard to trade, although the spendingdecisions of exporters remained largely controlled by the state during the previous regime, the statemonopoly over foreign trade was substantially weakened by the end of the 1980s. State-ownedenterprises (SOEs) enjoyed considerable autonomy, and exporters were allowed to retain some portion oftheir hard currency earnings. During the first stages of the transition, most exports came from firms withalready established international links, and through redirection of exports from foirmer CMEA markets.
From the outset of transition, both the magnitude and widespread political acceptance offoreign direct investment (FDI) in Hungary were unique in the region. Hungary has been the mostsuccessful transition country in attracting foreign investors. Between 1990 and 1997, Hungary absorbedapproximately half of all foreign capital invested in Central Europe. Such inflows were not concentratedin the more recent period (as in Poland), but were already a large fraction of GDP (4 percent per annum)during 1990-94, thereby giving such investments considerable time to have an impact on the economy.The shift to "second generation" firms, mostly foreign owned, was thus already well advanced inHungary before 1995, and the revival of the privatization drive during the second half of 1995 acceleratedthis trend.1
1 "Second generation" firrns are either newly established or successfully restructured firms, mostly with foreign participation.

Executive Summary 3
Indeed, FDI has played a pivotal role in reintegrating the Hungarian economy intointernational markets and improving economic performance. A large portion of FDI originates fromlarge multinational corporations with global networks of production and marketing; hence, a significantshare of Hungary's domestic business activity is now incorporated into these networks. Moreover, mostFDI has come to Hungary not as a way of jumping trade barriers, but to take advantage of the overalleconomic environment, including location, production, and transaction costs. Data confirm thatHungarian firms with even a modest FDI stake restructured faster and more intensively, andoutperformed other firms. For example, foreign-owned firms tend to be more export oriented; by 1998firms with foreign capital accounted for three-fourths of total trade turnover. This outcome stemmed fromthe benefits of foreign ownership: FDI gave a large number of Hungarian firms easier access to improvedtechnology and credit, and to better management, marketing, and other business expertise.
The improvement in operational andfinancial performance of Hungarian firms, and the rapidgrowth and change in the composition of exports, confirm the substantial progress achieved inindustrial restructuring. Since 1992, almost all firms, especially in the manufacturing sector, haveimproved their financial performance, and only a few state-owned enterprises with controlled prices arenow incurring losses (most importantly, the railways and the post office). During 1992-96, 80 to 90percent of manufacturing firms had an operating cash surplus, and losses were generally relatively smalland transitory in nature. Helped by recovery in import demand in the EU, exports soared in 1994, andhave continued to grow at double-digit rates since then. The composition of exports has become morediversified, with a notable shift toward high value-added products. Unskilled labor-intensive and naturalresource-intensive products have fallen from roughly two-thirds of exports in 1989 to one-third in 1997,while the share of technology-intensive and human capital- intensive products has increased from one-third to two-thirds of exports during the same period. With an EU share in trade turnover of 60 percentduring 1990-96, Hungary is more integrated with the EU than a number of EU member countries.Integration has increased the intensity of competition from imports coming from EU suppliers; since1995, tariffs have been slashed and by the end of 2000 tariff rates on nearly all EU industrial imports willbe nil. Considering the progress achieved in industrial restructuring and the already intense competition,Hungary seems well poised to compete in the European Single Market.
In addition, Hungary has implemented a comprehensive program of structural reforms in thefinancial market, improving both key institutions and the legal and regulatory infrastructure. Withregard to the latter, the legal framework for banking has been greatly improved, and substantial progresshas been made in harmonizing financial laws and regulations with those of the EU. In addition,Hungary's accounting and auditing rules have been remodeled to international standards. On theinstitutional side, banks and insurance companies have been restructured, recapitalized, and privatized,mostly through sales to strong foreign strategic investors with experience in managing financialinstitutions elsewhere. Institutional investors such as mutual funds and pension funds have grown steadilyin the past five years, and capital markets have developed rapidly in both size and liquidity. The recentlyenacted pension reform is expected to lead to a rapid growth of pension fund assets, further boostingdomestic capital markets. Overall, therefore, the financial sector is also well positioned for EUmembership.
Helped by changes in wage setting mechanisms and employment legislation, labor marketshave proven to be quite flexible during the transition period, facilitating the restructuring of theeconomy. The most striking evidence of labor market flexibility during the 1990s is the substantialreallocation of labor among sectors (away from agriculture and industry, and toward services), rapidproductivity gains, a substantial increase in the education level of the labor force, and a decline inemployment and labor force participation rates. Participation rates are now somewhat below the EU
4 Hungary - On the Road to the European Union
average (71 percent for men and 53 percent for women ages 15-59). While unemployment has emergedas a problem during the transition, it remains below the EU average. These good labor market results aredue, in part, to the reforms implemented during the 1990s in wage setting mechanisms. Hungary's newmechanisms reduce the role of government and are based on a decentralized wage bargaining system thathas helped the wage structure become more responsive to market forces. On the other hand, the transitionhas also brought a steep decline in real wages (which recent increases have not yet offset).
Although these reform efforts helped the Hungarian economy begin to recover from thetransition-induced recession in 1993 and 1994, the incipient upturn was accompanied by largeexternal imbalances. Indeed, at the same time that the economy began to recover, there was a sharp risein the current account deficit, to nearly 10 percent of GDP in 1993 and 1994, and a significant increase inexternal debt. These severe external imbalances were primarily caused by fiscal imbalances of roughlythe same order of magnitude. The country suffered a sharp loss in creditworthiness, caused not only bythese large imbalances, but also by the perception that privatization and other important structural reformshad stalled. Indeed, by mid-1995, only 35 percent of total state assets had been sold. Running disputesbetween state asset management agencies delayed the privatization process, while the Privatization Lawexcluded major utilities from the privatization drive.
Faced with a potential balance of payments crisis, the government implemented a drasticstabilization program in March 1995, while accelerating pace of the structural reforms initiated in theearly 1990s. The stabilization program combined a strong fiscal adjustment (nearly 6 percent of GDP)with an initial sharp (9 percent) exchange rate depreciation, followed by pre-announced but decliningmonthly nominal devaluations to restrain inflation. The program also relied on wage restraint, with realwages declining by 9 and 3 percent in 1995 and 1996, respectively. Among the structural reforms was acomprehensive program of enterprise and bank privatization that included the privatization of all majorutilities, as well as the restructuring and privatization of all major banks.In 1997, the Privatization Lawwas amended to allow the sale of all but the single golden share in 18 firms previously consideredstrategic, including the savings bank (OTP) and the telecommunications company (MATAV). Thedominant form of privatization was direct sale to foreign strategic investors, which led not only to a largeincrease in the volume of FDI, but also, as discussed above, to major efficiency gains. Hungary was alsothe first country in the region to reform its pension system through changes to the public pay-as-you-go(PAYG) scheme, and the introduction of a second, fully funded private pillar. These and other reformsrestored the country's image as the pioneer of structural reforms among the transition countries.
The program of stabilization and structural reforms has yielded impressive results. Growthaccelerated in 1997, driven by strong increases in exports and fixed investment. Unlike in the early1990s, the output recovery in the second half of the decade was accompanied by a sharp decline in thecurrent account deficit (from 9 to 2 percent of GDP between 1994 and 1997), and by a decline inHungary's net external debt (from 45 percent of GDP in 1994 to 25 percent in 1998). Privatization alsogot a much-needed boost, and by end-1997, HUF 790 billion in assets had been sold (in addition to someHUF 65 billion worth of shares transferred to the social security funds and municipalities in 1996).FDIflows were larger than the current account deficit for three consecutive years (1995-97), and includedboth greenfield investment on the order of 2 to 3 percent of GDP per year, as well as large privatizationtransactions. The accumulated stock of FDI amounted to US$16 billion in late 1998 (excluding inter-company loans), the equivalent of one-third of GDP (by far, the largest in the region). This increase inFDI has not only contributed to a sharp drop in Hungary's external indebtedness, but, as noted above,was key to its significant penetration of markets abroad and to its export growth.
Executive Summary 5
Ensuring the Conditions for Sustained Growth and EU Accession
To ensure that the current strong growth performance is sustained and there is realconvergence with its partners in the EU, Hungary needs to consolidate the stabilization gains and
finalize the structural and institutional reform program. These objectives, while not easy, are wellwithin the reach of Hungary's policymakers, and would require, broadly speaking, three types of actions:
* Macroeconomic area: implementing an additional fiscal adjustment on the order of 1.5 percent ofGDP over the next 2 to 3 years to ensure that the ongoing surge in investment and growth is notinterrupted by a reemergence of external imbalances;
* New sector reforms: preparing and implementing programs in key but yet unreformed sectors that inthe medium term have potentially large implications for growth, welfare, and the budget-inparticular, the health sector, transport, and local government finance; and
* More advanced sector reforms: completing the reform programs in several sectors (such as pensionreform, the financial sector, public administration, trade and labor policies), and refining theregulatory and institutional framework in several other areas (such as environmental protection,infrastructure, and agriculture), to finalize the transition process and ensure full compliance with EUdirectives and a smooth entry into the EU.
These actions are described below in more detail.
Maintaining Macroeconomic Stability
With a per capita income of approximately 49 percent of the EU average on a purchasingpower parity (PPP) basis, Hungary will only be able to bridge this income gap by achieving a highergrowth rate than the EU and by sustaining it for a long period without generating macroeconomicimbalances. Higher growth rates will require further increases in the ratio of fixed investment to GDP(24.5 percent projected for 1999), as well as further increases in the efficiency of investment. The scopefor further productivity gains is large, since labor productivity, despite recent gains, still lagsbehind EUlevels significantly in most sectors of the economy. The government has announced a medium-terminvestment target of 28 percent of GDP, with the view of maintaining 5 percentyearly output growth overthe medium term. Fixed investment continues to grow quickly, and the modernization of infrastructureand the prospects of EU membership could very well lead over the next five years to an investment ratenot far from the government's target. At the same time, sustainability implies that the current accountdeficit should be stabilized at around 4 percent of GDP (from 5.2 percent projected for 1999) to maintaina gradually declining external debt to GDP ratio. Together, these two targets imply an increase in nationalsavings of about 5.0 percent of GDP over the next 5 to 7 years, of which 3.0 percent should be during thepre-accession period to meet interim growth and external targets.
The recent instability in international financial markets and the structural changes takingplace in Hungary's balance of payments also suggest the need to rely less on foreign savings. As aresult of its strong fundamentals, Hungary managed to weather well two major external shocks during1998: an increase in profit repatriation by foreign firms, and the Russia crisis. With regard to the former,the current account deficit more than doubled, to 4.8 percent of GDP in 1998, due in part to a sharpincrease in net profit remittances. While this increase partly reflected particular circumstances in ahandful of multinationals, the increase is also an indicator of longer-term trends. The ratio of remittedprofits to the (lagged) stock of FDI increased from 2 percent (the average in 1993-97) to 6 percent in
6 Hungary - On the Road to the European Union
1998, more in line with the average flow/stock ratio in a representative sample of emerging markets.Aprudent medium-run macroeconomic framework should assume a flow/stock ratio of about 5 percentrather than 2 percent, especially as foreign investment in Hungary matures. Despite small directtransmission channels between the two countries, Hungary was also temporarily hard hit by the Russiacrisis. During September and October 1998, there were pressures on the exchange rate, a US$1.5 billiondecrease in external reserves, a 50 percent decline in the stock market, and a brief 500 basis pointincrease in the yield on government bonds. By the end of October, the crisis subsided as investorsregained confidence, in part as a result of several government actions, including the announcement ofconservative parameters for the 1999 budget. Capital flows, among other benefits, can contributesignificantly to the development of the domestic capital market, as they have in the Hungarian case; butthey can also prove disruptive in periods of international turmnoil, even in countries that pursue soundeconomic policies, as Hungary has.
Given these circumstances and objectives, a prudent fiscal program would target an increasein the primary surplus of around 1.5 percent of GDP over the next two years. Public savings should aimto contribute some 2.5 percent of GDP of the required 3.0 percent of GDP increase in national savingsduring the pre-accession period. Assuming that the government misses its 1999 fiscal targets by about 0.5percent of GDP, this public savings effort should include: (i) a 1.5 percent of GDP increase in theprimary surplus (from 1.5 percent in 1999 to 3 percent in 2001, excluding EU grants); (ii) 0.5 percent ofGDP from the recently implemented pension reform; and (iii) 0.5 percent of GDP from EU grants. Thisadjustment would allow investment to continue to expand while reducing the current account deficit.Thisproposed fiscal adjustment would not only contribute to a sustainable increase in investment and output,but would also tend to depreciate the real exchange rate, and hence should allow for a reduction in therate of crawl of the nominal exchange rate. In turn, a lower rate of crawl would facilitate thegovernment's efforts to lower the inflation rate to EU levels. Maintaining a competitive exchange rateshould be an essential part of Hungary's growth strategy, because the incentive to invest in a small openeconomy depends in good part on the future capacity of enterprises to export and compete in foreignmarkets.
The fiscal adjustment should be implemented primarily on the expenditure side of the budget,given the high level of most tax rates in Hungary. In fact, any progress that can be achieved inimproving tax collection and broadening the tax base should be used as an opportunity to lower tax rates,though it would be advisable to ensure that the base is broadened before rates are lowered to avoid a lossof revenue. Within fiscal targets, a shift in expenditures will be necessary. As a new member of NATO,Hungary is commritted to increasing its defense expenditures. Moreover, as EU accession nears, it is vitalthat Hungary increase infrastructure investments, especially in sectors such as environment, transport,and agriculture, in order to have access to EU funds. Accommodating these expenditures may requiresavings in other budgetary areas.
Despite success during the 1990s in fiscal adjustment, there are still important challenges tothe sustainability of fiscal policy and the efficient delivery of public services. Three areas, which arealso critical to complete the structural agenda, seem to be the most important:
* Health sector. The need to improve the poor health status (see below) of the Hungarian populationwill translate into large pressures on expenditures, as will the aging of the population at the end ofthe next decade, unless the health system is rationalized. The recent decline in health expendituresseems not sustainable since it has been, in good part, generated by sharp wage cuts, inadequatemaintenance of hospitals, and postponing the renewal of medical equipment.
Executive Summary 7
* Public administration. Upgrading Hungary's civil service is critical for the authorities to manage theintegration of the Hungarian economy into the EU's Single Market. The improvements in publicadministration may, however, result in expenditure pressures over the medium run, even if thenumber of new hires is more than offset by departures. In this regard, the authorities will need toreduce the excessive wage disparities between public servants and the private sector in order to attractand keep well-qualified personnel. In addition, upgrading and changing the composition of the civilservice may also result in transitory costs, since there may be a need to fund severance payments.
* Local governments. Preparing the public sector for the challenges of EU accession also requiresincreasing the efficiency of local governments in delivering public services. This issue is especiallyimportant since local government will be responsible for receiving and allocating a significantvolume of EU transfers that are expected to follow EU membership.
Improving the Delivery of Local Public Services and the System of Intergovernmental Finance
Although local governments have been able to meet fiscal targets in recent years, there are stillindications of inefficient delivery of services and strains in localfinances. Beginning with the 1995adjustment program, the authorities have managed to introduce greater discipline in local governmentfinance. Between 1995 and 1998, local expenditures declined by 4 percent of GDP to 13 percent of GDP;as a result, although revenues also declined, local governments managed to reduce their overall deficit byI percent of GDP, to 0.5 percent of GDP. This decline in expenditures, however, may not be sustainable,given unmet needs for new or rehabilitated local assets. In addition, despite recent improvements,efficiency in the delivery of public services can still be strengthened. For example, there are unexploredeconomies of scale in organizing effective regional associations. Finally, there is still a systemicimbalance in the intergovernmental finance structure. Expenditure and revenue assignments are not wellmatched, and the transfer system creates perverse incentives. Getting local government finances right andimproving their efficiency is critical given their future role in managing EU structural funds.
Improving the efficiency of local governments will entail actions at both the central and localgovernment levels. The central government needs to clarify the expenditure responsibilities of localgovernment and of intermediate tiers such as regional associations. If the government chooses to allowmulti-county and other functional regional associations to deliver services, it must also allow suchassociations to collect and manage revenues as independent legal entities. More generally, there is a clearneed for local governments to develop their own sources of revenue and depend less on transfers fromother levels of government. Introducing a value-based property tax and gradually increasing vehicle taxescould increase local revenues significantly. The government should also consider ways of rationalizingand simplifying the grant system. This could include setting up a more systematic approach to determinecurrent grants (e.g., the value of current grants could be tied to macroeconomic benchmarks), whilesimplifying and unifying the allocation system. The mechanism for investment grants also needs reviewto ensure that it supports national priorities and equalization purposes.
Increasing Efficiency and Quality in the Health Sector
The health sector faces several of challenges: (i) deteriorating health status of the population;(ii) deficient institutional structure; and (iii) weak finances. The health status of Hungarians is theworst of OECD populations and among the worst for transitional countries. This is largely due to a rapidincrease in premature death, disproportionately affecting men in their productive years because ofunhealthy lifestyles and occupational and environmental risks. The health sector has been operating under
8 Hungary - On the Road to the European Union
a deficient institutional structure; its financial situation is fragile. While expenditures on health as a shareto GDP have recently declined, forecasts suggest that the decline is not sustainable. Health expenditureswill be under increasing pressure as the population ages, as obsolete and badly maintained equipment andinstallations are replaced, as real wages in the sector increase, and as the demand for better health careincreases. Consequently, in a no reform scenario, the annual deficit of the Health Insurance Fund ([HF)could increase to almost 2 percent of GDP by 2010, and increase sharply after that date due to theprojected demographic shock.
In early 1999, the government proposed a number offar-reaching reforms in the health sector,designed to improve efficiency, quality, and access. These reforms imply a health system that includesthe following elements: (i) a basic health care package accessible to the entire population; (ii) a marketfor supplementary health insurance which would provide additional services and improve quality; (iii) asingle agency (the tax authority APEH) responsible for revenue collection and transfer of resources (on arisk-adjusted, capitated basis) to regional funds that may evolve into managed care organizations(MCOs); (iv) regional funds that purchase the basic care package for a defined member population, usingthe allocation from APEH and regulated copayments (these MCOs may at a later stage assume the riskfor delivering health services directly); (v) internal market mechanisms whereby the regional fundspurchase services from public and private providers that comply with minimum accreditation criteria andstandards for service delivery; and (vi) an independent supervisory capacity to ensure that the servicesprovided meet quality and financial regulations.
The main challenges in implementing this health reform program are developing the multi-level health insurance system, strengthening the regulation and policy roles and capacity of theMinistry of Health (MoH), gradually introducing market forces to drive efficiency and quality,improving financial mechanisms, and limiting the fiscal cost of the reform. Among these challenges,the first task that needs to be completed is the development and implementation of the essential elementsof the health care system, including the basic health care package, the supplemental insurance policy, therules regarding copayments, and the mechanisms for reinsurance against catastrophic risks. Thegovernment may wish to carry out the reform in two stages. In the first stage, the [HF could be split intoregional purchasers of health services, while encouraging private insurers to provide supplementalcoverage. In the second stage, the regional organizations could be allowed to compete for members. Inparallel with these basic reforms, the government should also work on transforming the role of the MoH.The ministry should focus on strategic sector issues including policymaking, priority setting, andregulation, as well as monitoring overall performance to ensure that the health system is indeedbecomingmore responsive to public health problems. In addition, throughout this process the government shouldstrive to improve efficiency and quality in the system by increasing competition among health providers.In particular, the regional purchasers would strive to increase competition among a growing set of serviceproviders, including both public and for profit organizations. Finally, improving health outcomes withlimited resources requires changes on both the revenue and expenditure side of the health system.
Enhancing Competition in the Infrastructure Sector
With the exception of transport, the infrastructure sectors have been privatized andrestructured, and their regulatory framework has been greatly improved These reforms place Hungaryin a leading position among transition countries, and in advance of many in Western Europe.Nevertheless, there are several opportunities for further competitive restructuring and regulatory reform,which would give rise to significant new gains in economic performance andease Hungary's accession tothe EU.

Executive Summary 9
Hungary's transport sector faces two main challenges that need to be addressed to prepare forEU accession. The first pertains to the conditions of the transport network and equipment. Largeinvestments are required to construct new infrastructure and renovate existing roads, rail tracks, and thetransport fleet. Hungary should prioritize all its transport investment needs, including the threetrans-european network (TEN) road and rail corridors, using traditional costlbenefit techniques, and shouldprepare an investment and financing plan. It is important not to overlook urban transport needs, whichplay an increasingly important role in Hungary's emerging service economy. Moreover, much can beaccomplished without spending large amounts of resources by reducing bottlenecks atborder crossings,shrinking the backlog of deferred maintenance and rehabilitation, and upgrading existing roads andbridges in terms of speed, traffic capacity, bearing capacity, and safety. These improvements should beplanned on a corridor basis, since benefits are larger if improvements are not implemented in afragmented manner.
Although Hungary has made considerable progress in reforming and commercializingtransport operations during the last decade, reforms are still needed in several areas. Efforts should becontinued to restructure the major state-owned transport companies to improve their market orientation,efficiency, and operational independence, with a view to privatizing them as soon as possible. Thegovernment should conduct a thorough restructuring of the national railway company, MAV, byseparating track operations and creating independent freight and passenger companies. To accelerate theprivatization process of VOLAN (intercity buses), freight and bus operations should be separated and thegovernment should offer lease or lease-purchase arrangements to provide financing. MAHART, the inlandnavigation company, should be reorganized and port operations privatized. BKV, the Budapest urbantransport company, and the Municipality of Budapest should increase tariffs to improve cost recovery.MALEV, the national airline company, should develop a business plan, assuming increasing competition, toassess its best options in a slowly deregulating EU air transport market. Finally, the Ministry of Transport,Communications, and Water Management (MTCWM) should implement laws and legislation on publictransportation to harmonize it with EU requirements, and should deregulate intercity bus and truck services,with the government's role limited to ensuring compliance with safety and environmental regulations. Moregenerally, the Government should refrain from tariff setting in the transport sector and instead strengthen theregulatory environment.
The present system in the electricity sector is still in transition, as it must adapt to therequirements of the EU Directive on Electricity (and other EU standards for safety, environmentalemissions, etc). Prices in the past were below efficient levels, and the structure of prices was unbalanced,with cross-subsidies provided to domestic consumers. These inefficiencies are rooted in distributionalconcerns and may be defensible, as long as they remain of modest size. In any case, during the last yearconsiderable progress has been made in addressing several of these issues. For example, tariffs have beensubstantially rebalanced and current pricing policy is broadly consistent with revenue adequacy. In thefuture, if competition intensifies in response to a more liberal interpretation of the EU ElectricityDirective, a number of regulatory issues will need to be addressed. The most immediate is thatcompetition will create pressure to further align tariffs with costs. If the larger commercial and industrialcustomers have access to competitive markets and are indeed cheaper to serve than residential customers,then further rebalancing of the rates may become necessary. This should not pose regulatory problems,provided the different components of the costs of serving customers are clearly identified (generation atdifferent times of the day, transmission and distribution). Nonetheless, it may require that any remainingsubsidies to residential customers be made explicit to ensure the financial viability of the distributioncompanies (which bear the major differences in the costs of serving high-volume and low-volumecustomers).
10 Hungary - On the Road to the European Union
Issues of the location of power stations and coordination of investments in transmission andgeneration may become more acute as generation is liberalized and as the transmission part of MVMis reformed to operate on market principles. At present, with MVM responsible for planning thelocation of new power stations, this coordination can ensured by systematically comparing the full costsof providing different degrees of transmission reinforcement. The decentralized market approach requiresa careful design of signals to guide the location of new power stations. Such an approach raises issues ofregulation and governance for the national grid, which may require a new set of incentives to provide thenecessary quality of transmission services to new generation. The simplest way to achieve this may be tofollow the model of the British NGC, which is required to invest in sufficient transmission capacity tomeet set quality standards, while being given incentives to minimize the costs of providing transmissionand ancillary services. These incentives take the form of profit sharing: if NGC can lower the cost ofproviding transmission services, it keeps a fraction of the cost saving. Equivalently, if it fails, then it bearssome fraction of the additional cost, up to a limit.
There are three challenges facing Hungary's gas sector. The first is Hungary's dependence on asingle gas supplier. Hungary lacks the capacity, by itself, to address that problem effectively, but there arepotential solutions on the horizon. The most promising would be a prompt and effective implementationof the EU Gas Directive, which aims to create a competitive gas market throughout the EU by providingfor third party access to gas transmission lines. If the directive is fully implemented in the EU, Hungarywill have effective access to multiple competing suppliers, with large resulting benefits to theperformance of the Hungarian gas market. Second, the present regulatory system provides extremelylimited opportunities for competition to provide healthy incentives for market participants. Thatcharacteristic of the regulatory system is understandable, given the lack of access to alternative suppliersto the Hungarian market. Nonetheless, the government needs to be prepared to promptly implement pro-competitive regulatory reforms, as soon as the country obtains access to multiple gas suppliers. Third, thepresent rate structure is inefficient. Residential prices are too low, and there is no difference between theprice of gas purchased off peak and the price of gas purchased on peak. The government needs to addressthis problem promptly by authorizing further increases in the residential price and by creating an on-peak/off-peak price differential.
Hungary has made significant progress in modernizing and reforming its telecommunicationssector, andfuture reforms should aim at promoting greater competitiveness in preparation for joiningthe EU. The government should take an active role in ensuring that efficient competition for non-exclusive services can survive, both currently and in the future, now that there will be viable franchisescreating potentially efficient competition for voice services. Such actions include close scrutiny of allmergers, especially with an eye toward preventing the elimination of potential competition. Theauthorities should also adopt a market-based spectrum policy that will provide benefits incurrent mobilewireless services as well as positioning wireless to be a competitive alternative to wire-line voiceservices. The regulatory authorities also need to reexamine their own roles. They should eliminate anyunnecessary regulatory hurdles that frustrate competition. Regulators also need to set forth clear, efficientrules for the interconnection of networks so that competitors that are considering significant investmentsare not discouraged by lack of certainty.
Reforming Public Administration in Light of EU Accession
The process of preparing for accession to the EU, and negotiating and implementing theacquis, will require high-caliber government. In the last few years, Hungary has made significantprogress toward building a modern and efficient public administration, as well as creating a fullyprofessional civil service. Nonetheless, the government will have to address a number of constraints in
Executive Summary 11
terms of government employment practices and remuneration systems, management of human resourcesin the civil service, and management of the increasingly complex EU accession process.
Public administration suffers from a high turnover of staff, as well as difficulties in staffrecruitment and retention. This stems from significant discrepancies in remuneration between theprivate and public sectors, and between the public and civil service, as well as lack of appropriateincentive systems. In order to address these problems, policy measures will have to be implemented inthree areas:
* First, preparation of a strategy for determining a coherent pay policy on an ongoing basis. This meansdeveloping the capacity to investigate pay differentials between the private and public sectors forbenchmark skills, the collection and publication of turnover and vacancy statistics, and theintroduction of a revised pay and grading system, based on appropriate job evaluation techniques.
* Second, strengthening and systematizing of the new pay flexibility mechanisms, includingperformance pay increments and subtractions, personal salaries, and Euroatlantic Integrationsupplements. A policy framework outlining clear, concrete criteria for individual pay shifts based onperformance or skill grounds needs to be developed.
* Third, addressing the budgetary and staff implications associated with changing skill requirements asa result of EU accession. The authorities should prepare projections of the likely hiring as well asredundancies and relocations of staff; assess the financial implications of these staffing movements;and design a program of redundancy measures. In addition, the authorities should prepare a programto attract the new mix of EU-related skills, and to enhance the existing human resource base through(re)training.
Efficient human resource management and decisionmaking practices in the civil service are ofutmost importance. Since 1990, Hungary has made real progress in establishing an independent civilservice, and creating the legal foundation for merit-based procedures for recruitment, promotion, andperformance evaluation. Nonetheless, several key aspects of human resource management need to bestrengthened. First, the roles, responsibilities, and reporting relationships of each of the institutionsinvolved in civil service management should be clarified and simplified, to better coordinate humanresource policy and regulation. It is also important to strengthen the capacity of personnel departments atboth the central and line ministry levels, and prepare operational manuals and standardized humanresource department structures. Second, further actions are needed to ensure fair, transparent, and merit-based practices in the civil service. Among the most important are: establishing a civil service oversightbody to review civil service human resources policy and standards; and introducing merit-basedrecruitment and promotion procedures and annual performance appraisals. Finally, the authorities shouldprepare a national training strategy, and, among other things, clarify the roles of the different governmentinstitutions involved in training.
Management of the process of accession to the European Union will become increasinglyimportant in the coming years. Thus far, Hungary has developed the necessary institutionalinfrastructure and processes to coordinate the implementation of the Government's Accession Program.However, as the integration process becomes more complex and tasks more numerous, the institutionalarrangements will need strengthening. The key areas of improvement regard technical assistance, theintegration departments in each ministry, and the coordination of these integration activities with overallpublic administration concerns. With regard to technical assistance, there is need to clarify the roles of allthe institutions involved in technical assistance management, and to develop systems for tracking,
12 Hungary - On the Road to the European Union
monitoring, and ensuring compliance in technical assistance projects. With regard to integrationdepartments, it would be useful to review best practice and develop guidelines forstaffing and proceduresfor all EU integration departments. Finally, the EU integration strategy could be updated to incorporateadministrative impact into its analysis, including the longer-term requirements of administering programsin the EU environment
Preparing the Agriculture Sector to Better Compete in a Single Market
Full price liberalization, successful privatization, a sharp decline in sector employment, and aproductivity level comparable to the EU average constitute remarkable achievements in the agricultureandfood sector. Nevertheless, as the accession process unfolds, Hungary must still adjust its policies toprepare for implementation of the acquis communautaire, while pursuing its search for productivitygains.
The support programs will need substantial revision over the coming years, both to complywith ongoing agreements (WTO) and to be compatible with the Common Agricultural Policy (CAP). By2001, export subsidies should already be significantly reduced; and credit subsidies, which arewidespread in agriculture, will have to be discontinued at the time of accession. The government shouldalso, as part of its pre-accession strategy, modify its current method of setting guaranteed prices-acost-plus approach-which does not promote adjustment to market demand and can lead to unbearablebudgetary costs at times of decreasing intemational prices. For similar reasons, the government is alreadyresisting pressures to raise guaranteed prices to the current level of EU intervention prices, a levelthatwill be revised downward in the near future. Even with a substantial reduction in EU intervention prices,Hungary's producer prices for cereals will increase. This, in turn, will create higher producer costs for thepig and poultry producers and a growing exportable surplus of cereals. A continued search forcompetitiveness and a reduction of logistical constraints will be criticalto maintaining Hungary's exportcapacity.
An action plan needs to be designed and implemented to apply and enforce the new legal andregulatory framework. This plan should include, inter alia, a public information campaign, a stafftraining program, a restructuring plan for state agencies involved in consumer protection, animal andplant protection, agricultural research and extension, border control, farm registration, market informationand intervention, and an investment program. While resources made available by the EU during the pre-accession period will be critical to help implementation, it remains essential for the government todevelop a realistic plan and contribute to its financing.
Preparation for negotiations should not overshadow the long-term objectives of greaterefficiency and growth. To achieve these long-term objectives, the government should remove the variouslegal constraints that still affect the land market, and should limit the scope for restructuring andinvestment. It should also privatize the seed companies to allow full access to foreign genetic materialand to make these companies profitable. In addition, the government should continue to improve thefunctioning of the numerous instruments (Budapest Commodity Exchange, warehouse receipt system,Product Councils) that facilitate the marketing and export of agricultural products. Finally, it shouldcollaborate with both the private sector and research institutes to promote the development of newtechnologies and attractive products.
Executive Summary 13
Achieving EU Environmental Standards at the Lowest Fiscal Cost
Joining the EU will require Hungary to adopt and implementEU legislation and standards inthe field of environment. Although environmental protection has an extremely high priority for theEU,it is generally accepted that the investments required to comply with the environmental acquis aresignificant and may not be achievable before Hungary joins.
The investment costs for the adoption of major environmental directives are expected to besignificant, although projections are still uncertain. Various studies have attempted to assess thesecosts, and the range of estimates varies considerably. Total investment costs for Hungary of complyingwith EU environmental directives in air pollution, wastewater treatment, and waste management varybetween ECU 4.1 and 9.3 billion, or 1.7 to 4.5 percent of 1997 GDP per year for 20 years. These costswould be in addition to the 1.6 percent of GDP per year already being spent by the public and privatesectors, and excluding expenditures for administration, monitoring, and enforcement incurred mostly bythe public sector.
By the time of accession, Hungary must adopt all of the 1995 White Paper measures related tothe environment, of which solid waste legislation will be the most costly and most difficult to complywith. This is despite the fact that Hungary is considered further advanced than other accession countriesin managing its municipal solid waste (MSW). Depending on the scale, technical characteristics, andsiting of facilities, the total investment costs of solid waste management are estimated between ECU 1.8and 4.4 billion. Difficulties with compliance stem from the absence of a comprehensive solid wastemanagement act covering all types of waste, and the lack of a reliable information system on wasteproduction and disposal methods. In addition, the disposal facilities are inadequate, good natural sites arescarce, and low tariffs for MSW collection and disposal make investment unattractive for privatedevelopers.
Investment requirements in the field of wastewater management are also substantial. Hungaryhas made significant progress in improving water quality during the 1990s, and has invested heavily incollection and treatment of municipal wastewater. Nonetheless, coverage is still far below that requiredfor compliance with EU standards. The total compliance costs are estimated at ECU 2.1 to 4.3 billion, ofwhich the largest part (approximately ECU 2.1 to 2.7 billion) is associated with the Urban WastewaterTreatment Directive.
Adoption of EU measures relating to chemical substances, air pollution, and radioactivecontamination does not seem to imply a substantialfinancial cost, apart from the necessary efforts toupgrade institutions. Concerns have been expressed regarding urban air pollution, particularly inBudapest, resulting from increased road traffic. Compliance with EU legislation on long-range airpollution does not create significant problems, unless the EU tightens its standards.Rough estimates ofthe total investment costs range between ECU 218 and 618 million, depending on type of technologyadopted.
Investment requirements of such a magnitude will have serious implications for the public andprivate sectors, as well as for the consumers. Most public sector investment is required in sectors that arethe responsibility of municipalities (such as water supply, wastewater treatment, and waste disposal).Currently, several funds provide grants for municipal investment, in addition to significant governmentsubsidies for capital investment. In the future, however, an increasing proportion of the investment costswill have to come from the utilities' own cash flows from operations, which implies charging consumers
14 Hungary - On the Road to the European Union
efficient tariffs. The ability to raise utility tariffs is likely to be a key constraint on the required upgradingof wastewater, waste disposal, and energy generating capacity.
There are five sets of actions that would help Hungary meet the EU requirements mostefficiently and at minimum cost. First, strengthen institutional capacity in order to enforce lawseffectively and to set incentives for improving compliance. This will be essential for developing policiesthat bring the greatest environmental benefits for a given level of expenditure or effort, and that usepublic and external funds most wisely in terms of both maximum environmental benefit and reducingdistortions elsewhere in the economy. Second, conduct negotiations prudently to obtain either derogationor long transition periods in areas with relatively low benefit/cost ratios. Third, utilize public and EUsubsidies to direct investments toward strategic goals, particularly in the area of wastewater collectionand treatment, and municipal solid waste. At the same time, limiting the proportion of grant funding-andthus requiring municipalities to contribute significantly from their own resources-will create anincentive for municipalities to invest more efficiently. Fourth, focus on reducing pollution from thelargest settlements, since these efforts will tend to have the largest environmental impact. Ensure thatinvestment plans take advantage of the substantial economies of scale that can be achieved through multi-municipal cooperation, despite the increased institutional difficulties of such investments. Make use oftechnical assistance from the EU and other sources to help the less efficient utilities improve theirperformance.
Completing Pension Reforms
Hungary was the first transition country to implement a comprehensive pension reformL Themain elements of the reform were the introduction of a mandatory and fully funded second pillar, themaintenance of the voluntary third pillar introduced in 1994, and changes in key parameters of the PAYGfirst pillar. Reforms of PAYG included an increase in the retirement age, an increase in minimum yearsof service for pension eligibility, and a change in the indexing formula for pensions, which will now giveequal weight to prices and wages. Contributions and accrual rates in the PAYG system were reduced byabout one-fourth to make room for increasing contributions to the second pillar (6, 7, and 8 percent in1998, 1999, and 2000, respectively). The new system is mandatory for new entrants to the labor force,but voluntary for existing contributors. It is designed to be attractive to workers under 37 to 40 years ofage, given conservative assumptions on returns. Some 60 percent of the younger workers have alreadyjoined the new system.
The Hungarian pension reform was designed to achieve three interrelated objectives: (i) toensure a reasonable and sustainable income at retirement; (ii) to enhance Hungary's future growthperformance by promoting national savings, developing capital markets, and reducing distortions inthe labor market; and (iii) to ensure greater fairness across generations. Replacing part of the PAYGby a second pillar generates an immediate revenue loss in the PAYG as well as a transitional deficit,because the system must continue paying full PAYG benefits (not downsized) for a number of years.The transitional deficit is not a fiscal deficit in the usual sense, however, because the revenue loss in thepublic sector is matched by private savings of the same magnitude, leaving national savings unchanged.In addition, the transitional deficit is projected to decline during the next decade, because of the reform ofthe parameters of the PAYG. The impact of the full reform on national savings can be ascertained bycombining the flows of private savings (the contributions and returns to the second pillar) and the PAYGbalances. National savings are expected to increase progressively from 2000 on, due to the steadyincrease in private savings and the progressive decline in the PAYG deficit. The combination of the twoeffects will lead national savings to increase by 2 percent of GDP during the next decade-approximately0.2 percent of GDP per year. If the central budget fully offsets the transitional deficit, as implied by the
Executive Summary 15
government's original intention to keep the primary surplus of the general government around at least 2percent of GDP, then the impact of the reform on national savings would be more front loaded. The netsavings gain would be channeled through pension funds in the form of long-term financing flows to theprivate sector, contributing to capital formation in the private sector and enhancing Hungary's growthprospects.
Pending policy issues in the pension area include: increasing the contribution to the secondpillar, as originally planned; reviewing the system of financial guarantees for the second pillar; andstrengthening the regulatory and supervisory framework. Citing unforeseen expenditures, the 1999budget failed to increase the contribution rate to the second pillar to 7 percent, but instead maintained it at6 percent. This decision will not result in an improvement in fiscal policy or in Hungary's overallmacroeconomic performance, since the larger flows to the PAYG will be fully offset by smaller flows tothe second pillar, leaving national savings unchanged. The government should increase the contributionrate to 8 percent, as planned, in 2000. Further delays will not improve national savings but will increaseuncertainty among switchers and pension funds, which require a stable policy framework to makeinformed decisions. The pension reform introduced a system of guarantees to ensure a minimum secondpillar benefit equal to 25 percent of the first pillar. Policymakers may consider measures to make theguarantee system more robust and minimize the risk to the state budget. Detailed calculations should bemade to determine whether or not some increases in the fees charged by the Guarantee Fund would berequired. Also, improvements could be made in the design of the minimum return guarantee. The safetyof the second pillar would also be served by strengthening the institutional and regulatory frameworks.This includes improving the reporting and payment infrastructure, refining the regulatory framework toenhance transparency and safety, and strengthening the supervisory function. The supervisory agencyshould work closely with the insurance and capital market supervision agencies, since pension fundstypically outsource many activities to service providers that are supervised by other agencies.
Completing the Transition in the Financial Sector
In the field of finance, Hungary is in the forefront of reforms among transition countries. Itslegal framework for banking has been greatly improved and is almost fully in compliance with EUlegislation. Its banks have been restructured and sold, for the most part to strong foreign strategicinvestors. Its insurance sector is now healthy, and capital markets have developed rapidly in both size andliquidity. The pension reform is expected to result in a rapid growth in pension assets, further boostingthe development of capital markets.
Completing this remarkable transformation of Hungary's financial system will require actionsto widen access to finance, further strengthen supervision, change regulations and legislation to fullyconform with EU legislation, and motivate further consolidation among providers offinancial services.Although the banking system has substantially improved in terms of the services offered andthe qualityof its assets, small and medium enterprises (SMEs), agriculture, households, and municipalities still havedifficulty gaining access to funding. Most Hungarian firms have surprisingly little debt, but the lack ofaccess to financing is particularly acute for SMEs, since they often cannot access loans from foreignbanks (as firms with FDI can through their foreign parent), or fund themselves through the supply chain(as some small firms can). This is in part a developmental problem that only time and experience willrectify. However, bringing inflation under control and working to clarify property rights in agricultureand housing will certainly help resolve the problem. Property registries should be improved, restrictionson property sales should be removed, and the enforcement of creditor rights should be strengthened.

16 Hungary - On the Road to the European Union
The supervision of financial markets still needs to be strengthened, consolidated, and mademore independent of political pressures. Hungary must clearly move to strengthen its laws, regulations,and institutions to enable the Supervisor to work without political interference. The failure of two banksand six brokerage houses in 1998 has revealed underlying weaknesses in the supervision of banks andcapital market operations. The bank failures were the final outcome of problems well known to theSupervisor. Failure to act in a timely manner resulted in losses amounting to more than 1 percent of GDP.The legal authority of the Supervisor should be strengthened to allow it to issue binding regulations andto intervene in banks based on the results of inspections. Although in the past universal banking was notallowed, many financial institutions defacto operated in this way. Hungarian legislation defines holdingsin such a manner that banks can escape from consolidated supervision by transferring some activities to anon-bank subsidiary. At the beginning of 1999, Hungary adopted full universal banking, as required byEU directives. Though in Hungary the banking and capital market agencies work under one commonchief executive, integration of these two areas is not fully effective. There are also three differentagencies for insurance, pension funds, and asset managers, despite strong overlaps in the ownership andcontrol of such institutions. One option to improve coordination would be to create a capital marketscouncil comprising the chief executives of the agencies supervising the capital markets, and ensuring thatthe different supervising agencies are legally empowered to share information. Another option would beto combine insurance and pension supervision as an interim step toward more integrated supervision.
In the banking, insurance, and brokerage industries, there are too many small and weak firms.In the insurance industry, a substantial number of firms, most of them mutuals, are too small to achieveadequate economies of scale and risk management. In the banking industry, small and medium-sizedbanks may not be able to face the increasing competition in the industry for deposits and loans, andfurther consolidation cannot be ruled out. In the brokerage industry, some small brokers lack appropriateinformation technology and risk management systems, and their safeguards of clients' assets have beenquestionable. A policy of higher capital requirements would lead to mergers of these small units andwould help reduce institutional risk in the market.
Hungary will also need to change certain aspects of laws and regulations regarding thefinancial system, to be in conformity with EU legislation. These include the treatment of foreignbranches, ceilings on deposit insurance, cross-border trade in financial services, capital adequacy, andregulation of capital movements. Despite the challenges that remain, Hungary has a strong track record infinancial sector reform; and in terms of laws, regulations, and institutional strength, it will soonbe readyfor the country's entry into the EU.
Continuing to Facilitate Labor Market Adjustment
The Hungarian labor market has adjusted to the new economic environment and has achievedsubstantial gains in productivity. The rapid decline of the labor force share in agriculture and its rise inthe service sector, the substantial reallocation of labor in manufacturing toward newly established privatefirms, and the sharp increase in the return to skills all support this interpretation. Data also show thatlabor productivity increased dramatically in the manufacturing sector. In five years between 1992 and1997, real productivity more than doubled. This accomplishment was essentially due to the performanceof enterprises with foreign owners and to the increasing proportion of workers in those enterprises.Hungary thus enters the pre-accession stage under favorable conditions and seems well positioned tocope with competitive pressures in Europe's Single Market. On the legal side, harmonization of theregulatory framework with the acquis communautaire is also fairly advanced.
Executive Summary 17
Notwithstanding the gains achieved thus far, successful integration into the EU will requirecontinued productivity increases and job creation. In 1996, labor productivity in manufacturing wasstill only about 30 percent that of Italy and Spain. Maintaining the recent pace of productivity increases isunlikely over the long term. The destruction of many jobs that was linked to the transition is now largelyover; and the bulk of the sale of assets to foreign investors is now complete, as is the sizable reallocationof labor among sectors. From now on, changes are likely to be smaller, and further productivity gains arelikely to be more difficult to achieve. Thus, achieving a substantial increase in the level of employmentwill be difficult. Currently, the employment rate of the population is somewhat below the EU average.This is due mainly to the employment rate of workers aged 55 or more-a rate almost half that ofGermany or France. Workers hit by the process of job destruction and encouraged to retire early will notreturn to the labor force, but those who are young may want later retirement, and it will prove costly tokeep them out of the labor force. Continuous job creation will be critical to keep the unemployment ratedown.
Migration flows are not likely to ease the pressure on the labor market. A number of factorsinduce one to think that labor flows from Hungary to EU countries will probably remain small. First, theincome differences between the EU and Hungary tend to be smaller than necessary to generate sizablemigration. Second, there are no large Hungarian communities in EU countries thatwould be able to workas social networks, and thereby reduce the costs of insertion. Third, the EU countries themselves haveunemployment problems. Finally, during the last wave of accession, the potential migration flowsexpected from Greece, Portugal, and Spain to EU members never materialized, despite the elimination ofborder controls.
Pursuing a strategy conducive to job creation and continuous adjustment to innovation is thusessentialfor Hungary. Although the current labor force, which is younger and more educated than in thepast, will be a great help, the policy framework still matters. The first priority is toreduce the taxes onlabor. This is necessary both to decrease the bias against labor and to help reduce the informal economy.Recent efforts at lowering social security contributions and at widening the tax base are steps in thisdirection. Nonetheless, they remain too modest. The financing of support to the long-term unemployedthrough general revenues should be considered. More importantly, the financing of the health care systemshould be reformed.
There is still room for improvement of programs that support the unemployed. Theunemployment assistance system should be reviewed to avoid threshold effects and poverty traps. Worktests should be enforced to avoid a waste of scarce public resources. Efforts to evaluate and improve theeffectiveness of active policies should also be continued, with special attention to the long-termunemployed. To reduce regional unemployment rate differentials-and reduce long-termunemployment-consideration should be given to other types of policies aimed at increasing labor forcemobility, particularly policies that foster the development of public transportation and mortgagefinancing.
The Hungarian wage formation system seems to have provided adequate flexibility thus far.Returns to skills are increasing, and the minimum wage does not appear to be a binding constraint onemployment. Attention, however, needs to focus on employment protection legislation. Firms seem tofind ways to avoid the impact of some of the regulations on layoffs, and this comes at a social cost.Possible adverse effects on the employment of some population groups (women and older workers) needto be evaluated. If Hungary further improves its policy framework, and if it maintains incentives thatfacilitate the adjustment of the labor market to rapid changes in the economic environment, then it shouldcontinue to benefit from significant productivity increases. Such increases are crucial to ensure a smooth
18 Hungary - On the Road to the European Union
integration into the European Union and to bridge the gap between the country's per capita income andthat of current EU member countries.
Further Liberalizing Foreign Trade
Despite the very significant progress made in liberalizing trade and the extraordinary exportperformance during the past decade, two threats linger. First, a slippage in macroeconomic adjustmentcould trigger a crisis that might adversely affect export performance. This is, however, as discussedabove, not a likely scenario. Second, there is the danger that, with attractiveness of free trade zonesfading, FDI inflows will also decline, in turn harming export performance. Indeed, industrial free tradezones have been an important factor in attracting FDI to Hungary. However, with the emergence of aPan-European system of cumulation of rules of origin, products from free trade zones lose preferentialaccess to Pan-European markets if duties paid on imports of inputs are reimbursed. A move towardfurther trade liberalization would counteract this threat by fostering the continued competitiveness ofHungarian firms, both domestic and foreign owned. While Hungary has a liberal investment regime,conditions in market access are unnecessarily difficult for Most Favored Nation (MFN) suppliers.Hungary still adheres to quantitative restrictions on imports of some industrial products (the so-calledglobal consumer quota), and its tariff rates are substantially higher than those of the EU. As a smallcountry, Hungary could benefit enormously from unilateral liberalization.
The government should liberalize the MFNforeign trade regimefor industrial products. Thisentails significantly reducing the scope of non-tariff measures and adopting EU MFN tariff rates onindustrial products. By the standards of Central European transition economies, the NTB coverage ofimports in Hungary (nearly 20 percent) is high. The global quota on consumer products should beabolished, since it contributes to higher import prices; it also invites lobbying efforts for protection.Furthermore, the government should review products subject to non-automatic licensing in exports andimports. Items that do not meet the test of environmental hazard, national security, or preservation ofcultural values should be removed from the list. Tariff rates on industrial products are substantially higherin Hungary than in the EU. In order to ease adjustment to EU membership and improve economic growthperformance during the pre-accession stage, Hungary should consider adopting the EU's (preferablypost-Uruguay Round) MFN tariff schedule on industrial products. The average MFN tariff rate onindustrial products would fall from 8 percent to around 4 percent. This measure has several advantages. Itwould level the playing field for MFN suppliers with conditions in EU markets. It is simple and easy toimplement. There would be little, if any domestic opposition from import-competing sectors, since theyalready face formidable competitors from the EU. And finally, Hungary could simply lower applied ratesto those of the EU without changing statutory and binding rates, and would not need to notify formallythe WTO.

1. SUSTAINING GROWTH AND GAINING MEMBERSHIP INTHE EUROPEAN UNION
INTRODUCTION
Hungary's economic performance improved dramatically in the second half of the 1990s as aresult of strong stabilization measures and deep structural reforms. During this period, Hungary was ableto move from economic stagnation to strong growth, while also dramatically improving its externalaccounts. Today, Hungary is regarded as a top performer among transitional countries, and has regainedaccess to foreign finance at very favorable rates despite the current turmoil affecting international capitalmarkets. Hungary is also regarded as one of the strongest candidates for accession to the European Union(EU).
The country's challenge now is to consolidate its stabilization gains and finalize its structuralreforms so that the recovery can be sustained for a long period of time. These objectives are well withinthe purview of Hungary's policymakers. In the macroeconomic area, policymakers must ensure that theinvestment expansion which has been driving economic recovery, and which is also building futuregrowth potential, is not interrupted by a reemergence of external imbalances, due toeither a less favorableenvironment or to excessive Government and private consumption at home. Indeed, according to theanalysis in this report, maintaining the pace of investment without causing excessive current accountdeficits will require some additional fiscal adjustments over the medium term.
In the structural area, policymakers need not only to successfully complete key ongoing reformprograms, such as the pension reform; but also to design and implement reforms in other key areas, suchas the health system and local government finance. They also need to refine the regulatory andinstitutional framework in other structural areas, so as to achieve full compliance with EU directives andensure a smooth and successful entry into the single EU market.
This first chapter of the report provides an overview of Hungary's economy and the mainchallenges facing policymakers on the road to EU accession, and is structured as follows. The secondsection reviews Hungary's macroeconomic performance in the 1990s, focusing on the stabilization andrecovery that took place in the second half of the decade. The third section examines the causes of therecent deterioration in the current account, as well as the Government's policy response to the turmoil ininternational capital markets. The fourth section examines the process of achieving EU membership andconvergence to EU income levels. Finally, the fifth section proposes a macroeconomic framework neededfor sustained growth, and sets the stage for the rest of the report.
STABILIZATION AND RECOVERY IN THE SECOND HALF OF THE 1990S
Unsustainable Recovery in the First Half of the 1990s
Hungary experienced a deep recession in the early stages of its transition, as indicated by a 20percent drop in GDP between 1990 and 1993. All other transition economies in Eastern Europe alsoexperienced a similar early recession, which originated primarily from the collapse of exports under
19

20 Hungary - On the Road to the European Union
Council of Mutual Economic Assistance (CMEA) trade arrangements as a result of, inter alia, theliberalization of prices and foreign trade and reductions in subsidies. Together with most of these othereconomies, Hungary began to recover from its early recession in 1993-94 (see Table 1.1). However, whilethe other economies were able to consolidate their recovery in the following years, Hungary experienceda sharp slowdown in economic activity. In the middle of the decade (1995 and 1996), Hungary appearedto have the poorest macroeconomic performance among all Central and Eastern European (CEE)countries, as indicated by the highest rates of inflation and the lowest rates of output growth (Table 1.1).
Table 1.1: Inflation and Growth in Selected CEE Countries, 1993-981993 1994 1995 1996 1997 1998 19991
Inflation (average CPI, in percent per year)Hungary 22.5 18.8 28.2 23.6 18.3 14.3 9.0Czech Republic 20.8 10.1 9.1 8.8 8.5 10.7 2.2Poland 35.3 32.2 27.8 19.9 14.8 11.8 6.8Slovak Republic 23.2 13.4 9.9 5.8 6.2 6.7 11.5
Slovenia 32.9 21.0 13.5 9.9 8.4 7.9 8.0
Real GDP growth (in percent per year)Hungary -0.6 2.9 1.5 1.3 4.6 5.1 4.0
Czech Republic 0.6 2.7 6.4 3.9 1.0 -2.7 -1.0
Poland 3.8 5.2 7.0 6.1 6.9 4.8 4.0Slovak Republic -3.7 4.9 6.9 6.6 6.5 4.4 1.5Slovenia 2.8 5.3 4.1 3.1 3.8 3.9 3.8l Staff projections.
Source: Central statistical offices of the respective countries.
The Hungarian output recovery was interrupted by the emergence of extremely large externalimbalances, as indicated by current account deficits of nearly 10 percent of GDP in 1993 and 1994, andby a significant increase in the external debt (Table 1.2 and Figure 1.1). These severe external imbalanceswere caused primarily by fiscal imbalances of the same order of magnitude (Table 1.2 and Figure 1.1),although the real appreciation of the forint and other factors also played a role.' The country suffered asharp loss in creditworthiness, caused not only by these large imbalances, but also by the perception thatprivatization and other important structural reforms had stalled. By early 1995, Hungary was paying veryhigh spreads in its external borrowings (more than 500 basis points above LIBOR).
Stabilization and Acceleration of Structural Reforms in the Mid-1990s
Faced with the prospect of a balance of payments crisis, the Government implemented a drasticstabilization program in March 1995, while also accelerating the structural reforms initiated in the early1990s. The program included a sharp fiscal adjustment, a 9 percent devaluation of the forint followed by apreannounced crawling peg, and a very rigid wage policy. The extent of fiscal support for the program isrevealed by the sharp decline in the general deficit-from 8.4 percent of GDP in 1994 to 3 percent in1996 (excluding privatization revenues). This decline was made possible by an impressive reduction infiscal expenditures-by 10 percent of GDP in the same period (Table 1.2).2
' See World Bank (1995), Country Economic Memorandum: Hungary: Structural Reforms for Sustainable Growth.
2 These data were provided by the Ministry of Finance and may include double counting in the consolidation of Governmentaccounts. Since this double counting is likely to have been reduced each year, these figures may overstate the overall reductionin expenditures and revenues.

Chapter 1. Sustaining Growth and Gaining Membership in the European Union 21
Table 1.2: Selected Economic Indicators, 1993-981993 1994 1995 1996 1997 1998
Real Sector
(percent change)Real GDP -0.6 2.9 1.5 1.3 4.6 5.1Exports of goods and services (real) -10.1 13.7 13.4 7.4 26.4 16.3Imports of goods and services (real) 20.2 8.8 -0.7 5.7 25.5 22.5Fixed investment (real) 2.0 12.5 4.3 6.7 9.2 11.4Private consumption (real) 1.9 -0.2 -7.1 -2.7 1.7 3.8Average CPI 22.5 18.8 28.2 23.6 18.3 14.3Gross wage growth (real) -0.5 5.1 -8.9 -2.6 3.4 4.4Real effective exchange rate (unit labor cost) 4.3 7.3 19.4 8.6 2.7 8.5Unemployment rate (end of period) 12.6 10.9 10.9 10.7 10.4 9.1
(in percent of GDP)Exports of goods and services 26.4 28.9 37.3 38.9 45.5 49.8Imports of goods and services 34.6 35.4 38.5 39.9 46.0 52.3Fixed investment 18.9 20.1 20.0 21.4 22.1 23.2
General Government
Overall balance (excl. privatization) -6.6 -8.4 -6.4 -3.0 -4.8 4.7Overall balance (incl. privatization) -6.0 -7.5 -3.2 0.8 -1.8 4.4Primary balance (excl. privatization) -2.7 -2.2 2.2 3.7 2.7 1.6Expenditures 60.8 60.4 54.3 49.0 49.2 47.1Public debt 90.4 88.2 86.4 72.8 63.9 60.2
External Accounts
Trade balance -8.4 -8.8 -5.5 -5.9 -3.8 -4.4Current account balance -9.0 -9.5 -5.3 -3.7 -2.1 4.8Foreign direct investment 6.0 2.8 10.0 4.4 3.6 3.0Gross external debt 63.7 68.4 70.9 61.0 51.9 56.3Net external debt 38.7 45.4 36.6 31.4 24.4 26.0
Sources: Ministry of Finance, National Bank of Hungary, Central Statistical Office, and staff estimates.
Fiscal management has remained prudent in more recent years. While there was some loosening offiscal policy in 1997 and 1998, as indicated by the decline in the primary surplus and increase in theoverall deficit, this loosening was smaller than it may appear. This is because the worsening of the fiscalindicators reflects, in part, the absorption of the quasi-fiscal deficit of the National Bank of Hungary(NBH) (a deficit that already existed, but was not explicitly computed),3 and the revenue losses from thepension reform, which are neutral in terms of national savings (Chapter 2). The payment in 1997 ofsome interest that had fallen due in 1996 also distorted the deficit figures somewhat-artificially reducingthe cash deficit in 1996 and increasing it in 1997 (Chapter 2).
See 1995 Country Economic Memorandum, ibid.
22 Hungary - On the Road to the European Union
The 9 percent devaluation of the forint provided an initial gain in competitiveness, although italso contributed to a temporary increase in inflation. The initial devaluation was followed, however, bypreannounced and declining monthly devaluations of the forint vis-A-vis a currency basket, which placedinflation firmly on a downward path. Finally, the use of wage policy as an instrument of stabilization isrevealed by the sharp decline in real gross wages in 1995 and 1996-by 9 and 3 percent, respectively.The low increase in nominal wages not only provided a second nominal anchor, but also improvedenterprise profitability and competitiveness, creating the conditions for the subsequent expansion ofinvestmnent and exports.
The stabilization package of March 1995 was accompanied by an impressive acceleration ofstructural reforms. During the 1995-98 period, Hungary implemented a comprehensive program ofenterprise and bank reforms that included the privatization of all major utilities as well as the restructuringand privatization of all major banks (chapters 4 and 5). Hungary was also the first country in the regionto implement a systemic pension reform, involving reforms to the public pay-as-you-go (PAYG) schemeas well as the introduction of fully funded private pillar (Chapter 2). These and other reforms restored thecountry's image as a pioneer in structural reforms among transition countries, and generated a largeincrease in the volume of foreign direct investment (FDI) and heightened the prospects for majorefficiency gains.
Impressive Perfiormance in the Second Half of the 1990s
Indeed, the program of stabilization and structural reforns initiated in 1995 has yieldedimpressive results. As shown in Table 1.2 and Figure 1.1, the combination of the preannounced anddeclining crawl, the restrictive wage policy, and tighter fiscal policies has resulted in a steady decline inthe rate of inflation to 10 percent - 11 percent in 1999. Although the decelerating devaluations of thenominal exchange rate resulted in some appreciation of the real exchange rate, this real appreciation hasbeen relatively moderate when measured by the relative consumer and producer price indices (CPIs andPPIs). Moreover, the real exchange rate, when measured by relative real unit labor costs, depreciatedfurther in the second half of the 1 990s, as increases in labor productivity outpaced increases in real wagesby a significant margin.
The fiscal adjustment and the restrictive wage policy caused a temporary slowdown in the GDPgrowth rate in 1995-96. As noted above, this was the period when Hungary grew much less than itsneighbors did. However, growth accelerated in 1997, driven by strong increases in exports and fixedinvestment (Table 1.2). Unlike the early 1990s, the output recovery was accompanied by an improvementin the external accounts, as indicated by the sharp decline in the current account deficit (from 9 to 2percent of GDP between 1994 and 1997), and by the decline in Hungary's net external debt (from 45percent of GDP in 1994 to 25 percent in 1998).
The decline in Hungary's levels of indebtedness resulted not only from the decline in the currentaccount deficit, but also from the large flows of FDI in the second half of the 1990s. These flows wereactually larger than the current account deficits for three consecutive years (1995-97), and involved bothgreenfield investments on the order of 2-3 percent of GDP per year, and large privatization transactions(Figure 1.2). The accumulated stock of FDI amounted to US$16 billion4 in late 1998-the equivalent ofone third of GDP (the largest in the region). This increase in FDI has contributed not only to a sharp dropin Hungary's external indebtedness, but also to a greater penetration in markets abroad and to the growthof Hungary's exports.
4This figure excludes inter-company loans.

Chapter 1. Sustaining Growth and Gaining Membership in the European Union 23
Hungary entered 1998 with a much healthier economy and seemed to be finally meeting theconditions for sustained growth. The recovery was driven by exports and investment, and wasunderpinned by important structural reforms. The growth of real wages and pensions resulted in arecovery of private consumption after two years of compression, but the growth of real wages was keptbelow productivity growth, and the increase in private consumption did not outpace GDP growth.
Figure 1.1: Selected Economic Indicators
Noninal Wage Growth Inflation and Exchange Rates GDP Growth (in % p"a.) and Unemployment (end of35% - .. ........ . .................................................... ............. 'penod, in %)
6.0 14
5.0 12
0252.06
15%o1.04
Jan-95 Jul-95 Jan-96 Jul-96 Jan-97 Jul-97 Jan-98 Jul98 -1 0.3 19 99 96- 97 19 0
-l wain --*-Gtass Awveg Wage 1~ Exchage Ratepaest the Basket Ra P -- nnponn
Real Effective Exchange Rates l Fiscal and Cuirent Account Balances (in % of GDP)2 ................ . ..... ----.-.. ---.. --..................................... ............. .
160 -
140 ~~~~~~~~~~~~~~~~~~~~~~~~~~~0- - /\---i140 1993 1994 195 19 7 99-2
120
1006-6
50
60 I
IQ-90 IQ-91 IQ-92 IQ-93 1Q-94 IQ-95 IQ-96 IQ-97 IQ-98 10
| Fisal Balance excl Privattsation +FiscalBalhneincl.Privatisato| REER CPI REERPPI -REE U,,itLabour Cos l C->xrent A--iltl_
Nominal Interest Rates 1993-98 Public Debt and Total external Debt(12 month averages, % p.a.) (end of peribd, in % of GDP)
35% 100 -
30%/oj , % 1 l 80 -
60 -
20% ~~~~~~~~~~~~40- -
20 -
10% 1993 1994 1995 1996 1997 1998
1993 1994 1995 1996 1997 1998 l-Pubhc Debt ! GrossEstemalDebt -*-NetEatemalDebt
- .Treasuy bills -- Tirn deposits Loans
Sources: Ministry of Finance, National Bank of Hungary, and Central Statistical Office.
Although the fiscal situation in 1998 still needed careful monitoring, it did not seem to cause anystrong crowding out of private investment. On the contrary, the fiscal deficit did not seem to be pressingthe real exchange rate or causing problems for export performance, as indicated by the reduction ofrelative real unit labor costs. Public debt had fallen drastically (from 90 to 60 percent of GDP), as a result

24 Hungary - On the Road to the European Union
of the smaller deficits and the large revenues from privatization. Moreover, the share of the private sectorin domestic credits had increased steadily, and nominal and real lending rates had fallen (Figure 1.1 andChapter 4.) All in all, there seemed to be ample room for further expansion in output, without excessivepressure on the current account.
RECENT PRESSURES ON THE EXTERNAL ACCOUNTS
Trade and Current Account Developments in 1998
After three years of steady decline, the current account deficit more than doubled between 1997and 1998 (from 2.1 to 4.8 percent of GDP). The increase in the trade account deficit amounted to 0.6percent of GDP, or only one fourth of the total increase in the current deficit. More important were thedecrease in the surplus of services (1.1 percent of GDP) and the increase in the deficit of income (1.1percent of GDP), the latter largely the result of a nearly US$500 million increase in net profit remittances.The increase in the current account deficit and the decline in the flows of FDI (to a level insufficient tocover the current account deficit) resulted in an increase in gross and net external debts-both in USdollars and as a share of GDP-after three consecutive years of decline.
The worsening of the current deficit after three years of improvement has raised the issue ofwhether the larger deficit is permanent or temporary, and whether it is of such size as to merit policyadjustments. The worsening of the trade deficit does not seem excessive, although the slowdown in exportgrowth in 1998 (Figure 1.2) begs some explanation. To some extent, it is not surprising that exportgrowth should slow from its torrid pace of 1997 (about 30 percent in volume growth), since this unusuallyfast rate was the result of substantial greenfield FDI coming on stream after being initiated earlier in thedecade. Since many exports rely on imported intermediate and investment goods, import growth alsoaccelerated in 1997 and slowed down in 1998, although the continuing expansion of fixed investment andthe renewed growth of private consumption also affected imports and the trade account. The collapse ofthe export markets of Russia and the countries of the former Soviet Union (FSU) in the second half of1998 also contributed to the overall decline in export growth, and a fast recovery of these markets shouldnot be expected. However, the impact of the Russia crisis on Hungary's trade performance should not beexaggerated, as these exports accounted for only a small share of total exports (4 percent) before 1998.Overall, the increase in the trade deficit in 1998 does not seem to be a major cause for concern.
In contrast, the increase in remitted profits was so abrupt and of such magnitude as to meritfurther analysis. As shown in Figure 1.2, the shift in the current account preceded the shift in the tradeaccount and became even more pronounced at the end of the year (both series are constructed on a 12-month rolling basis). This outcome was due in large part to very large profit remittances in June andDecember by a few large companies. Remittances of profits tend to peak in these two months, especiallyin December, but the size of the transfers was unusually large, driving the ratio of remitted profits to the(lagged) stock of FDI from 2 percent (the average in 1993-97) to 6 percent at the end of 1998 (Figure1.2).
There are several possible explanations for this sudden increase in remitted profits. These includethe unanticipated remittance of profits motivated by fears of a devaluation of theforint; and the strategicreassessment of the position of Hungary's enterprises vis-a-vis the markets of the FSU after the Russiacrisis (see next section). However, the increase in profit remittances may also reflect a convergence ofremitted profits from very low initial levels to their long-run equilibrium levels-foreign investors startremitting more profits after an initial period of operational and financial consolidation of theirsubsidiaries.

Chapter 1. Sustaining Growth and Gaining Membership in the European Union 25
Figure 1.2: External Developments, 1993-98
Trade and Current Account Balances, 1993-98 Export and Import Growth(in US$ millions, 12-month mnfing series) (volume growth rate)
-500 & _ _l 30-1000 25.1ooo 20-2000-2500 3-3000 70
-3000 S ,-4000 0
Jan-93 Jtn-94 Jan-95 Jan-96 Jan-97 Jan-98
FDI cover ofthe Current Account Deficit, 1993-98 Profit Renittances/FDl stock, 1993-98(in US$ million, 12 month rolling series) (12 month rolling profits/FDI stock (tm2))
6000 7%-
6% 4000
2000 4
0 3
-2000 1%-
Ja-93 Ja.-94 Jan-93 Jan-96 J-n97 Jan-99 Jan-93 Jan-94 Jan-9S Ja-96 Jan-97 Jan-90
-FIS-Curent ccount Deticto -a- ITJ-rftRmtacsPtSok(-2
Sources: National Bank of Hungary and staff estimates.
It may be possible that the abrupt increase in profit remittances in 1998 was primarily motivatedby particular circumstances and that such remittances will decrease in 1999. At the same time, there is noreason to believe that the level of remitted profits will be significantly smaller in the medium run. On thecontrary, the ratio of remitted profits to the stock of FDI in a sample of eight representative emergingcountries has been 5 to 8 percent (Table 1.3). The average ratio has recently declined to around 5 percent,but this has been due to very large increases in FDI in recent years (the remittance of profits followschanges in the stock of FDI, with a lag). These results indicate that it would not be prudent to construct amedium-run framework based on the assumption of low profit remittances. Instead, Hungarianpolicymakers should calibrate medium-run policies assuming that remitted profits will eventuallystabilize around 5 percent of the FDI stock.
Table 1.3: Ratio of Profit Remittances to the Stock of FDI in Selected Countries, 1993-97(percent)
1993 1994 1995 19% 1997All countries 7.6 7.3 6.8 6.5 5.5Latin American countries 8.1 8.1 7.0 6.6 5.8Asian Countries and Turkey 7.1 6.6 6.5 6.3 5.1
Note: Profit remittances in year (t) overestimated stock at the end of year (t - 1)Sample: Argentina, Brazil, Chile, Indonesia, Republic of Korea, Mexico, Thailand, Turkey.
Source: International Financial Statistics (IFS).
5 It is reasonable to assume that the average return on FDI will be at least 10-12 percent (8 percent for utilities and higher formanufacturing). Assuming an average payout ratio of 50 percent yields a 5 to 6 percent ratio of remitted profits.
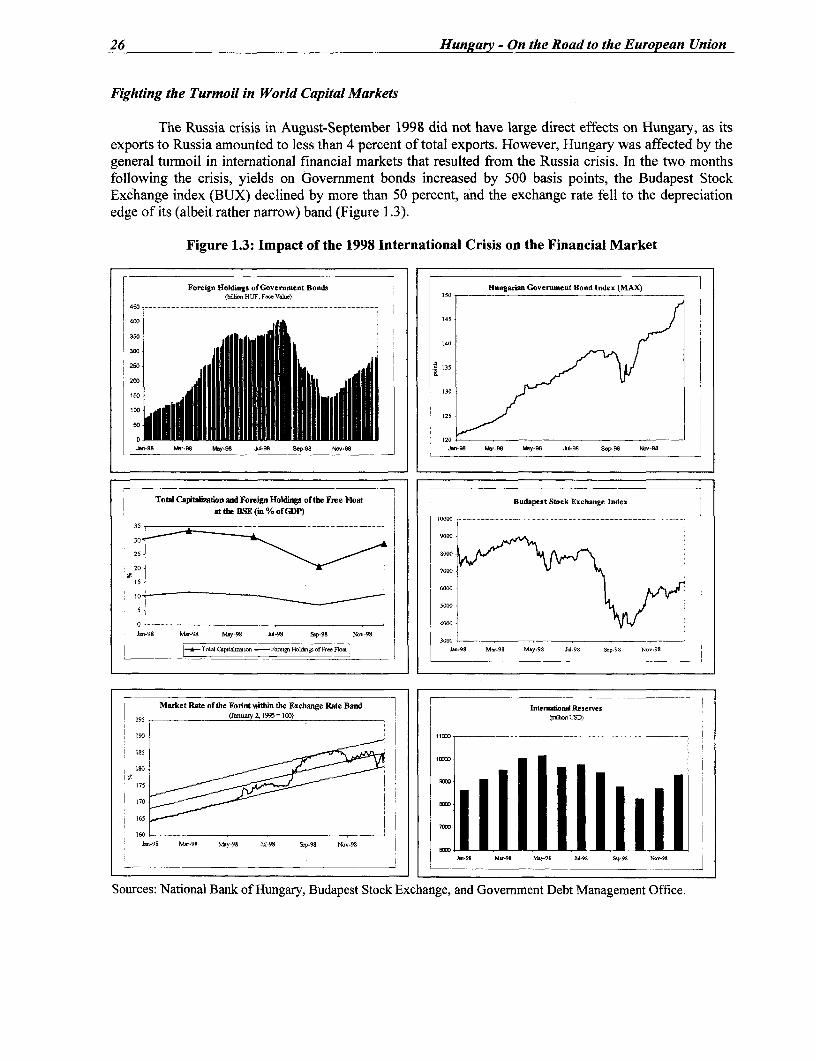
26 Hungary - On the Road to the European Union
Fighting the Turmoil in World Capital Markets
The Russia crisis in August-September 1998 did not have large direct effects on Hungary, as itsexports to Russia amounted to less than 4 percent of total exports. However, Hungary was affected by thegeneral turmoil in international financial markets that resulted from the Russia crisis. In the two monthsfollowing the crisis, yields on Government bonds increased by 500 basis points, the Budapest StockExchange index (BUX) declined by more than 50 percent, and the exchange rate fell to the depreciationedge of its (albeit rather narrow) band (Figure 1.3).
Figure 1.3: Impact of the 1998 International Crisis on the Financial Market
Fomign Holdings ofGovernment Bonds Hungarian Government Bond Index (MAX)bi HUF.FWV-) 150
450 ._ _ ..........................
400 145
350140
300
25013
210 1~~~~~~~~~~~~~~~~~~~~~~~~~~~30
'0012
D I 20.~lt .~-0 My-t JlO S.P-9t N'S-t8 la-9O Pa-9t tty-Ot tO-08 Sop-98 Nla-98
Total CaWaliionand Foreign Holdng ofthe Free Float Budapest Stock Exchange Index
at the BSE (in % of GDP)
ssL~~~~~~~~~~~~~~~~~~~lo ----- -------301~~~~~~~~~~~~~~~~~~~~~~~~00
4000
]aa,o-9t Ma,r-90 May-9S ti.-98 Ss- St -9N 00
|-T.W Capiaithoi, -F Pokisof.rFloat l-9 M.-98 May-98 Oat-S9 &Sp-9S Non-9S
Market Rate of the Fonint within the Exchange Rate Band l Intenaloni Reserves
950 (January 2 1995 =10) (-Ut, USD)
180
'75
170 ___
165 70
160
o rc-9s Nato-na any-90 iH gry- Sayt-O Nv-95 m
1,.595 Ma-9S May,-St 94-98 ST9,-O No-St
Sources: National Bank of Hungary, Budapest Stock Exchange, and Government Debt Management Office.

Chapter 1. Sustaining Growth and Gaining Membership in the European Union 27
Since 1995, foreign investors have played an increasingly large role in Hungary's securitiesmarket. Foreign portfolio flows amounted to 2 to 3 percent of GDP per year in the second half of the1990s, thereby keeping the forint at the appreciation limit of its fluctuation band (Figure 1.3), and forcingthe NBH to undertake costly sterilization efforts. By mid-1998, foreign portfolio investors held theequivalent of 4 percent of GDP in Government securities ( 15 percent of the total amount traded), and theequivalent of 10 percent of GDP in equity (approximately two thirds of the free float). These inflowssignificantly contributed to reducing the Government's borrowing costs (Figure 1.1 and Chapter 4), andto increasing liquidity in the equity market (foreign institutional investors account for approximately twothirds of turnover).
The Russia crisis triggered large portfolio shifts. As shown in Figure 1.3, foreigners sold morethan US$1 billion (HUF 250) worth of Government bonds in August and September, driving down bondprices and contributing to both the weakening of the forint and to the drop in foreign exchange reserves(official reserves fell from US$9.8 billion US$8.3 billion between July and October). The decline inequity prices was also substantial, as indicated by the 50 percent drop in the Budapest Stock Exchangeindex. Unlike the Government bond market, however, the sale of equities apparently did not have asignificant impact on the country's reserves. While many foreign investors sold Hungarian shares, otherswere willing to buy these shares at the reduced prices, resulting in a negligible net capital outflow fromthe equity market.
In response to the weakening of the forint, the NBH announced in August and September itsintention to reduce the rate of crawl in October; the central bank increased its one-month reverse-repo rateby 100 basis points and intervened in the foreign exchange market to demonstrate its support of thecurrency. These measures were backed up by official statements from the NBH, the Ministry of Finance,and the Ministry of the Economy. These statements expressed confidence in the country's economicfundamentals, suggested the possibility of a further reduction in the rate of crawl in January, andannounced the main fiscal parameters for 1999.
By the end of October 1998, the crisis had subsided, as indicated by the strengthening of theforint as well as the recovery of the bond and equity markets (Figure 1.3). By the end of January 1999,the forint had strengthened to the mid-point of its band, the BUX had recovered about half of its crisisdecline, and bond yields had fallen by more than 800 basis points from their crisis peak, although realinterest rates were still higher than their pre-crisis levels (Chapter 4). In December, Standard and Poorsfurther upgraded the rating of Hungary's public debt. In January, the Government's first 1 0-year domesticbond was oversubscribed, and Hungary became the first Central European country to issue a Eurobonddenominated in euros, with a spread of only 85 basis points over German Government bonds.
The developments in 1998 show that, while foreign portfolio inflows have contributedsignificantly to the development-of Hungary's capital market, they can also prove disruptive in periods ofinternational financial turmoil. Although Hungary weathered the crisis very well, the fact remains that itsfinancial markets were subject to substantial volatility despite relatively sound economic fundamentals,despite the low share of Hungarian exports to Russia, and despite a robust banking system with limitedexposure to Russia. These events highlight the need to continue prudent macroeconomic policies in thisera of mercurial international investor sentiment.
EU MEMBERSHIP AND INCOME CONVERGENCE
The Process of Achieving EU Membership
Hungary presented its membership application to the EU in April of 1994. Prior to this, Hungaryand the EU had signed an association agreement (the Europe Agreement) in 1991, which became

28 Hungary - On the Road to the European Union
effective in 1994. This agreement provided the legal basis for relations between Hungary and the EU. Itsaim was to provide a framework for political dialogue, for technical and financial assistance that willserve to support Hungary's integration into the EU, and for promoting the expansion of trade andeconomic relations between the parties.
At the Copenhagen Summit of 1993, the heads of the Governments of the EU decided that theassociated countries of Central and Eastern Europe could become members of the EU as soon as theywere able to assume the obligations of membership. These obligations include: (i) the stability ofinstitutions guaranteeing democracy, the rule of law, and human rights; (ii) a functioning marketeconomy; and (iii) the ability to carry out the other obligations of membership, including full compliancewith the acquis communautaire-the large body of EU legislation. The European Commission's WhitePaper of 1995 provided further guidance on the accession process, by identifying the key measures ineach sector of EU legislation, and by suggesting the sequence in which parallel legislation in the EUaccession countries should be tackled adopted.
In July 1997, the European Commission completed an evaluation of the membership applicationsof 10 candidate countries, and selected 5 countries for early accession: Hungary, the Czech Republic,Estonia, Poland, and Slovenia. In the case of Hungary, the Commission recognized its achievements inthe second half of the 1990s in the areas of macroeconomic management and structural reforms. Formaland detailed negotiations assessing Hungary's level of compliance with EU legislationbegan in the springof 1998. Although the process of harmonization with the large body of EU legislation is likely to take afew more years, it is expected that membership would take place in the 2002-2004 period.
Relationship Between EU Membership and Income Convergence
One of the most important benefits to Hungary of economic integration with the EU is thepossibility of expanding its growth potential and increasing the welfare of its population. There arepotentially three interrelated ways that economic integration can affect growth: (i) faster accumulation ofphysical and human capital; (ii) faster absorption of technology, and (iii) improvement in the overallpolicy framework.6 In particular, joining the EU involves adopting a large body of laws-the acquiscommunautaire-designed to ensure well-defined property rights, rules of competition, and state aidpolicy. Moreover, the EU promotes competition and the efficient allocation of resources through the fourfreedoms (trade, services, capital, and labor). Adopting the acquis usually implies an improvement in thepolicy framework for the new member, and also makes the country more stable and therefore less risky,thus contributing to an improvement in the investment climate. On the technology side, integration bringsthe benefits of faster spillovers of knowledge through several channels, including more FDI.
The growth effects of economic integration with the EU can be illustrated through the experienceof Ireland, Greece, Portugal and Spain.7 As shown in Table 1.4, Ireland's income per capita startedconverging slowly with that of other EU countries soon after accession, but only accelerated in the mid-1990s, 20 years after entry. Spain and Portugal have shown a steady pattern of convergence, althoughPortugal has converged at a faster rate, in part because it started from a lower initial base. Greece'sincome gap with the EU countries actually widened after entry and, although it started catching up in the1990s, its relative position has not improved since the date of membership. Except for Greece, thesecountries experienced investment booms upon accession to the EU' The booms were driven primarily by
6 Baldwin, R and E. Seghezza (1996), Growth and European Integration: Towards an Empirical Assessment.
Ireland joined the EU in 1973, Greece in 1981, and Spain and Portugal in 1986.
8 Baldwin, J. Francois and R. Portes (1997), "The Costs and Benefits of Eastern Enlargement: Impact on the EU and CentralEurope."
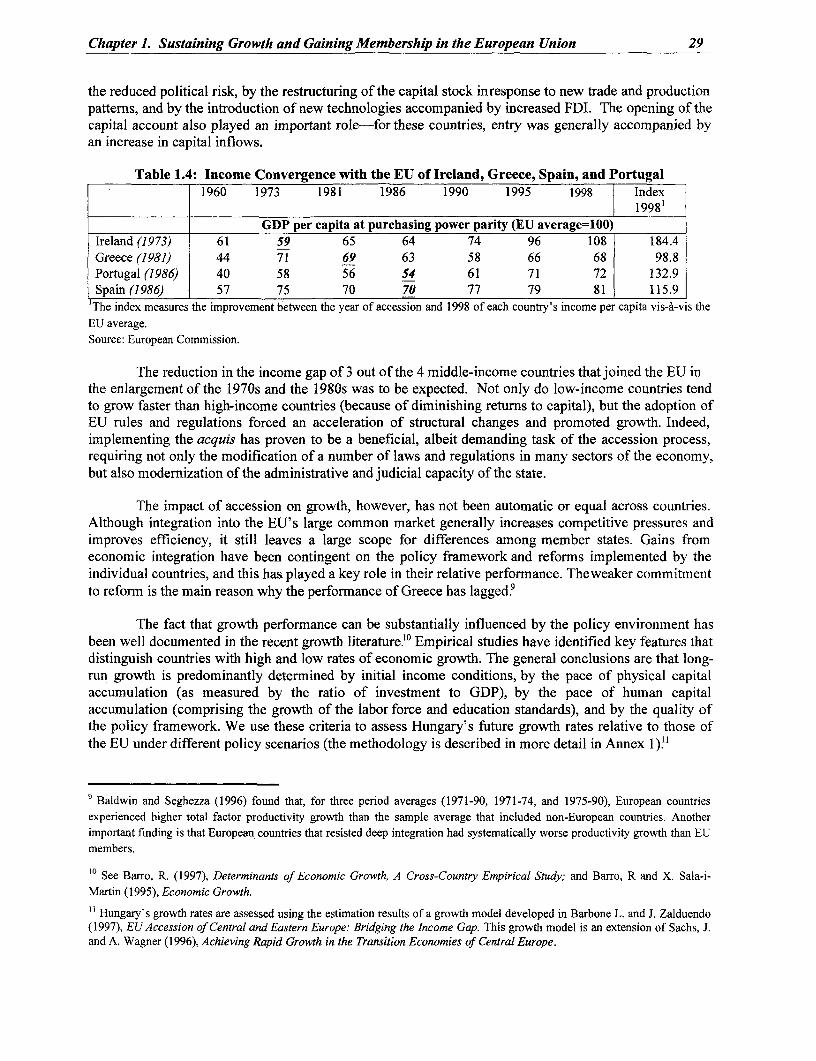
Chapter 1. Sustaining Growth and Gaining Membership in the European Union 29
the reduced political risk, by the restructuring of the capital stock inresponse to new trade and productionpatterns, and by the introduction of new technologies accompanied by increased FDI. The opening of thecapital account also played an important role-for these countries, entry was generally accompanied byan increase in capital inflows.
Table 1.4: Income Convergence with the EU of Ireland, Greece, Spain, and Portugal1960 1973 1981 1986 1990 1995 1998 |Index
GDP per capita at purchasing power parity (EU average=100)Ireland (1973) 61 59 65 64 74 96 108 184.4Greece (1981) 44 71 69 63 58 66 68 98.8Portugal (1986) 40 58 56 54 61 71 72 132.9Spain (1986) 57 75 70 70 77 79 81 115.9
'The index measures the improvement between the year of accession and 1998 of each country's income per capita vis-a-vis theEU average.Source: European Commission.
The reduction in the income gap of 3 out of the 4 middle-income countries that joined the EU inthe enlargement of the 1970s and the 1980s was to be expected. Not only do low-income countries tendto grow faster than high-income countries (because of diminishing returns to capital), but the adoption ofEU rules and regulations forced an acceleration of structural changes and promoted growth. Indeed,implementing the acquis has proven to be a beneficial, albeit demanding task of the accession process,requiring not only the modification of a number of laws and regulations in many sectors of the economy,but also modernization of the administrative and judicial capacity of the state.
The impact of accession on growth, however, has not been automatic or equal across countries.Although integration into the EU's large common market generally increases competitive pressures andimproves efficiency, it still leaves a large scope for differences among member states. Gains fromeconomic integration have been contingent on the policy framework and reforms implemented by theindividual countries, and this has played a key role in their relative performance. Theweaker commitmentto reform is the main reason why the performance of Greece has lagged'
The fact that growth performance can be substantially influenced by the policy environment hasbeen well documented in the recent growth literature.'0 Empirical studies have identified key features thatdistinguish countries with high and low rates of economic growth. The general conclusions are that long-run growth is predominantly determined by initial income conditions, by the pace of physical capitalaccumulation (as measured by the ratio of investment to GDP), by the pace of human capitalaccumulation (comprising the growth of the labor force and education standards), and by the quality ofthe policy framework. We use these criteria to assess Hungary's future growth rates relative to those ofthe EU under different policy scenarios (the methodology is described in more detail in Annex 1)''
9 Baldwin and Seghezza (1996) found that, for three period averages (1971-90, 1971-74, and 1975-90), European countriesexperienced higher total factor productivity growth than the sample average that included non-European countries. Anotherimportant finding is that European countries that resisted deep integration had systematically worse productivity growth than EUmembers.
'° See Barro, R. (1997), Determinants of Economic Growth, A Cross-Country Empirical Study; and Barro, R and X. Sala-i-Martin (1995), Economic Growth.
' Hungary's growth rates are assessed using the estimation results of a growth model developed in Barbone L. and J. Zalduendo(1997), EU Accession of Central and Eastern Europe: Bridging the Income Gap. This growth model is an extension of Sachs, J.and A. Wagner (1996), Achieving Rapid Growth in the Transition Economies of Central Europe.
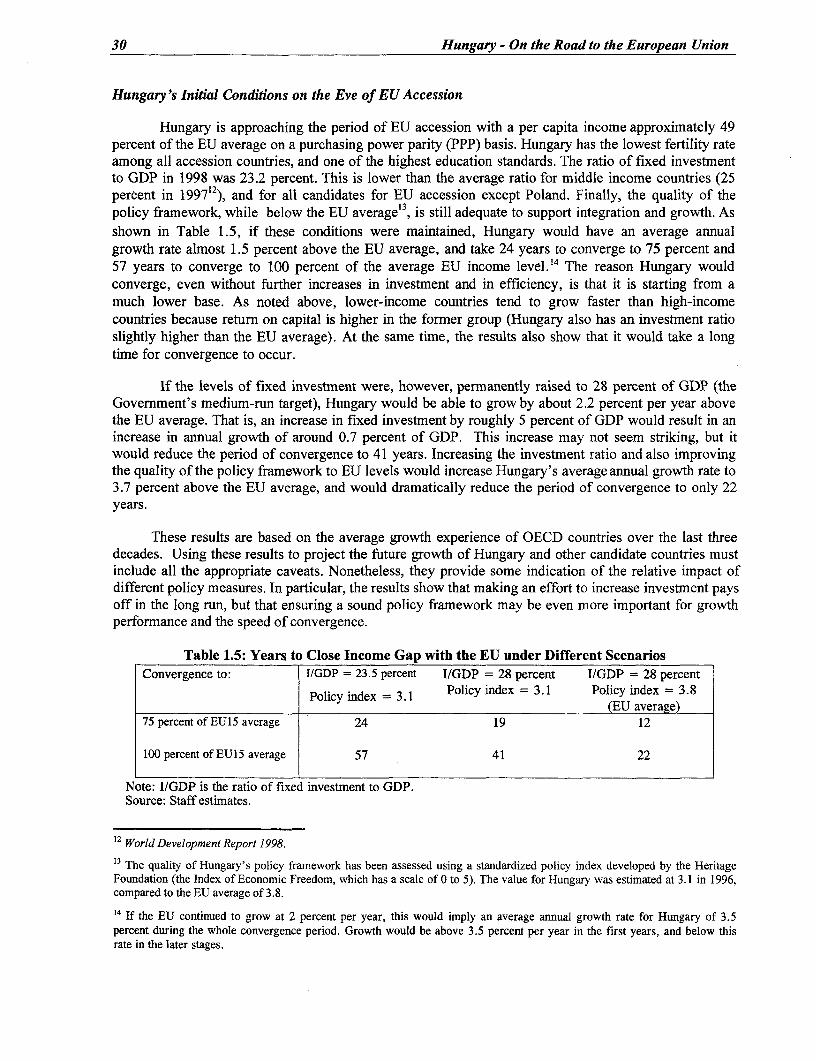
30 Hungary - On the Road to the European Union
Hungary's Initial Conditions on the Eve of EU Accession
Hungary is approaching the period of EU accession with a per capita income approximately 49percent of the EU average on a purchasing power parity (PPP) basis. Hungary has the lowest fertility rateamong all accession countries, and one of the highest education standards. The ratio of fixed investmentto GDP in 1998 was 23.2 percent. This is lower than the average ratio for middle income countries (25percent in 199712), and for all candidates for EU accession except Poland. Finally, the quality of thepolicy framework, while below the EU average'3, is still adequate to support integration and growth. Asshown in Table 1.5, if these conditions were maintained, Hungary would have an average annualgrowth rate almost 1.5 percent above the EU average, and take 24 years to converge to 75 percent and57 years to converge to 100 percent of the average EU income level."4 The reason Hungary wouldconverge, even without further increases in investment and in efficiency, is that it is starting from amuch lower base. As noted above, lower-income countries tend to grow faster than high-incomecountries because return on capital is higher in the former group (Hungary also has an investment ratioslightly higher than the EU average). At the same time, the results also show that it would take a longtime for convergence to occur.
If the levels of fixed investment were, however, permanently raised to 28 percent of GDP (theGovernment's medium-run target), Hungary would be able to grow by about 2.2 percent per year abovethe EU average. That is, an increase in fixed investment by roughly 5 percent of GDP would result in anincrease in annual growth of around 0.7 percent of GDP. This increase may not seem striking, but itwould reduce the period of convergence to 41 years. Increasing the investment ratio and also improvingthe quality of the policy framework to EU levels would increase Hungary's average annual growth rate to3.7 percent above the EU average, and would dramatically reduce the period of convergence to only 22years.
These results are based on the average growth experience of OECD countries over the last threedecades. Using these results to project the future growth of Hungary and other candidate countries mustinclude all the appropriate caveats. Nonetheless, they provide some indication of the relative impact ofdifferent policy measures. In particular, the results show that making an effort to increase investment paysoff in the long run, but that ensuring a sound policy framework may be even more important for growthperfornance and the speed of convergence.
Table 1.5: Years to Close Income Gap with the EU under Different ScenariosConvergence to: I/GDP = 23.5 percent I/GDP = 28 percent I/GDP = 28 percent
Policy index = 3.1 Policy index = 3.1 Policy index = 3.8(EU average)
75 percent of EU15 average 24 19 12
100 percent of EU15 average 57 41 22
Note: I/GDP is the ratio of fixed investment to GDP.Source: Staff estimates.
12 World Development Report 1998.
13 The quality of Hungary's policy framework has been assessed using a standardized policy index developed by the HeritageFoundation (the Index of Economic Freedom, which has a scale of 0 to 5). The value for Hungary was estimated at 3.1 in 1996,compared to the EU average of 3.8.
14 If the EU continued to grow at 2 percent per year, this would imply an average annual growth rate for Hungary of 3.5percent during the whole convergence period. Growth would be above 3.5 percent per year in the first years, and below thisrate in the later stages.

Chapter 1. Sustaining Growth and Gaining Membership in the European Union 31
Hungary has already made substantial progress in stabilizing and transforming its economy inrecent years. These efforts have enabled a recovery of investment which had fallen to less than 19percent of GDP in 1993; they have produced large and visible gains in productivity, and have resulted in arecovery of output and employment. The Government that was elected in May 1998 has set ambitioustargets for the long run, including a further increase in fixed investment to 28 percent of GDP, and percapita income growth rates above 5 percent per year. If these results materialize, Hungary could convergeto average EU income levels in about 25 years. It is important to stress that convergence is defined on aPPP basis, and does not take into account any appreciation of the real exchange rate.
These targets are within the reach of policymakers. The investment expansion is proceeding, andthe modernization of infrastructure and the prospect of EU membership could very well lead investmentto increase to targeted levels. The scope for further productivity gains is also large, as labor productivitystill lags significantly behind EU levels in most sectors of the economy. However, some additional effortsmay be required for this high-growth scenario to materialize, in both the macroeconomic and structuralareas. In the macroeconomic area, it is essential to ensure that the investment expansion proceeds withoutgenerating imbalances in the current account. In the structural area, Hungary must deepen the reformsalready implemented (e.g., banking sector reform, pension reform), and must make an effort to fullymakeits legislation compatible with that of the EU. Hungary must also tackle some remaining problems that arenot strictly related to EU accession, but that could become an obstacle to further increases in efficiencyand to the maintenance of macroeconomic equilibrium (e.g., reform of the health system).
ENSURING THE CONDITIONS FOR SUSTAINED GROWTH AND RAPID INCOME CONVERGENCE
Main Elements of a Sustainable High-Growth Strategy
Hungary's capacity to bridge the income gap with the EU depends not only on achieving higheroutput growth rates than the EU, but also on its ability to sustain these rates for long periods of timewithout generating macroeconomic imbalances. The recent international financial turmoil clearly showsthe importance of avoiding large external imbalances, which pose a risk of disruption to foreignfinancing. Capital flows can contribute significantly to the development of domestic capital markets (asthey have in the Hungarian case), but they can also prove disruptive in periods of international turmoil,even in countries that pursue sound economic policies, as Hungary has.
It would be prudent to target a reduction in the current account deficit to levelsthat would placeexternal debt to GDP ratios on a slowly declining path. Assuming FDI flows are sustained at about 3percent of GDP each year, this target could be achieved with a current account deficit of 4 percent ofGDP."5 The Government of Hungary has adopted this as a reasonable target. Since the current accountdeficit in 1999 is likely to widen to about 5.2 percent of GDP (see below), this will require a moderateimprovement of 1.2 percent of GDP. At the same time, the Government has laid out an ambitiousprogram to further increase the ratio of fixed investment to GDP to 28 percent in the medium-run, from alikely 24.2 percent in 1999.
Together, these targets will require an increase in savings of 5.0 percent of GDP over the next 5 to7 years. Part of the investment financing could be met through transfers from the EU-after accession,Hungary could possibly count on 2 percent of GDP in structural funds. Though transfers from the EU arenot part of domestic savings, they can constitute an important source of non-debt investment financing.However, these funds would only materialize after 2002-2004, and their precise timing and magnitude
15 This assumes a moderate inflow of portfolio investment to the equity market to maintain the non-resident's share of the freefloat. Although this may prove to be a conservative estimate of future portfolio investment, a medium-run strategy should notrely excessively on these capital flows, given their volatility.

32 Hungary - On the Road to the European Union
remains uncertain. In addition, there is a need to maintain investment expansion in the pre-accessionperiod, while also keeping the external situation under control. This would require a pre-accessionincrease in savings of 3.0 percent of GDP.
The expansion of fixed investment in the pre-accession period could, in principle, be financedfrom private savings. However, it is highly unlikely that private savings would grow in the next few yearsto the extent necessary to finance the investment expansion and improve the current account at the sametime. Although the ratios of private savings to disposable income andto GDP do tend to increase duringthe growth process, this increase is usually very gradual. In the particular case of Hungary, one must alsotake into account that real private consumption declined sharply in 1995 and 1996, as a result of the realwage compression during these years. It would be unreasonable to assume that private consumptionwould grow at rates well below GDP growth rates in the next few years.
These considerations reveal the need for some additional fiscal adjustment in order to ensureconsistency between the Government's investment and current account targets. Moreover, the fiscaladjustment is best measured in terms of the primary and real (or operational) deficits, and should take intoconsideration the savings effect of the pension reform implemented in 1998. Changes in the nominaloverall deficit do not provide an accurate indication of the contribution of fiscal policy to savings. Theongoing and projected decline in inflation will produce a decrease in the nominal overall deficit throughlower nominal interest payments, but this decrease does not produce a corresponding increase in nationalsavings (Chapter 2).
As explained in more detail in the next section and in Chapter 2, a prudent fiscal program wouldinvolve an increase in the primary surplus of around 1.5 percent of GDP over the next two years; that is,from 1.5 percent of GDP in 1999 to around 3 percent in 2001. The total contribution of fiscal policy tosavings would amount to approximately 2.0 percent of GDP, taking into account the pension reformeffect and the expected reduction in real interest payments (resulting primarily from some additionalreduction in the ratio of public debt to GDP, but also from some reduction in real interest rates). Thisadjustment would allow investment to continue to expand concurrent with a reduction in the currentaccount deficit. The failure to make an additional fiscal adjustment could force the NBH to tightenmonetary policy in an effort to contain the current account deficit. This policy mix (tight money andrelatively easy fiscal policy) would imply high interest rates, which would likely slow the growth ofinvestment in the pre-accession period.
The proposed fiscal adjustment would not only contribute to a sustainable increase in investmentand output, but also would facilitate a continued reduction in the rate of the crawl of the exchange rate.This would allow the inflation rate to fall toward EU levels, while reducing the risk of a real appreciationduring the disinflation process. Maintaining a competitive exchange rate should be an essential part ofHungary's growth strategy, because the incentive to invest in a small, open economy depends in large parton the future capacity of enterprises to export and compete in foreign markets.
The fiscal adjustment would also enhance the credibility of the Government in the tripartite wagenegotiations (usually conducted at the end of each year), and facilitate the conclusion of wage agreementsinvolving declining nominal wage growth rates. Given the already high level of most tax rates inHungary, the fiscal adjustment should be implemented primarily on the expenditure side of the budget.Infact, any progress that can be achieved in improving tax collection and broadening tax bases should beused as an opportunity to lower tax rates.
The Reform Scenario
The medium-term macroeconomic reform scenario (Table 1.6) assumes that the Government willmake steady progress in approximating EU legislation, deepening the banking sector and pension

Chapter 1. Sustaining Growth and Gaining Membership in the European Union 33
reforms, and tackling the remaining public sector reforms of the health system and local governmentfinance. The scenario also assumes that the Government will increase the primary surplus to 3 percent ofGDP by 2001 to make room for an increase in investment, concurrent with a reduction in the currentaccount deficit. Together, this policy mix would provide the foundation for a sustained GDP growth of 5percent per year in the context of macroeconomic equilibrium (or 5.3 percent per year on a per capitabasis, given the negative growth of Hungary's population).
In 1999, slower growth in the EU (especially in Germany) is likely to lead to a reduction inHungary's exports, which, together with the dampening effects of the Kosovo crisis, will slowHungary'sGDP growth to about 4 percent. Assuming no significant reversals in international energy and commodityprices, inflation (measured by the CPI) is likely to continue to fall, to below 10 percent. This combinationof slower growth and lower inflation is likely to make the revenue targets of the 1999 budgetunachievable, since these targets were based on assumptions of 5 percent GDP growth and 11 percentinflation. To meet the primary surplus target of 2 percent of GDP set in the 1999 budget, expenditureswould need to be reigned in. While the authorities have already announced that the bulk of theextraordinary reserves built into the 1999 budget will not be spent, additional expenditure cuts would benecessary to ensure that the target is met. At the time of writing (July 1999), it appears that such stepswill not be taken, and that the primary surplus will be 1.5 percent of GDP.
Lower than expected inflation is also likely to result in real wage growth of more than 4 percentin 1999. This is likely to lead to robust consumption and, together with an increase in investment, shouldresult in a small increase in the current account deficit, to 5.2 percent of GDP. As a result, the ratio ofgross and net external debt to GDP will increase again in 1999 for the second year in a row.
The scenario assumes that the primary surplus increases by 1.0 percent of GDP in 2000 and by afurther 0.5 percent of GDP in 2001, and then held constant at 3 percent of GDP thereafter. This fiscaltightening should lead to a gradual reduction in the current account deficit to 4 percent of GDP. It isassumed in the current account projections that profit remittances will remain at about 5 percent of thelagged stock of FDI. As discussed above, this ratio will be higher than the average ratio in 1993-97, butlower than the ratio at end-1998, and also lower than the average ratio of a representative sample ofmiddle-income countries.
Though the timing of Hungary's EU accession is still uncertain, it is assumed for purposes of thisreform scenario that accession will take place in 2003. EU membership requires substantial and sustainedincreases in infrastructure investment, especially in sectors such as the environment, transport, andagriculture. It is assumed that investment will increase to 26 percent of GDP by 2002, on the eve of EUaccession, and will increase further to 28 percent of GDP, as envisaged by the Government, after EUaccession. The projected increase in investment in the pre-accession period is feasible, in a scenario offiscal adjustment, macroeconomic equilibrium, and lower real interest rates, combined with the prospectof integration into a large common market.
As noted above, taken together, the current account and investment targets will require anincrease in domestic savings of 3.0 percent of GDP during the pre-accession period (adopting 1999 as thebase year). The additional increase in investment after 2002, amounting to 2 percent of GDP, is assumedto be primarily financed through the EU's structural funds.
While household savings can be expected to increase endogenously as a result of sustained highGDP growth rates, this is likely to be an slow process; it would be unrealistic to rely on substantialincreases in household savings in the next few years. Instead, the bulk of the domestic savings gapshould be filled by increased Government savings. The recent pension reform will contribute slightlymore than 1 percent of GDP to national savings in the pre-accession period (Chapter 2). Since about 50percent of this savings will have already occurred by 1999, the Government can count on about 0.5
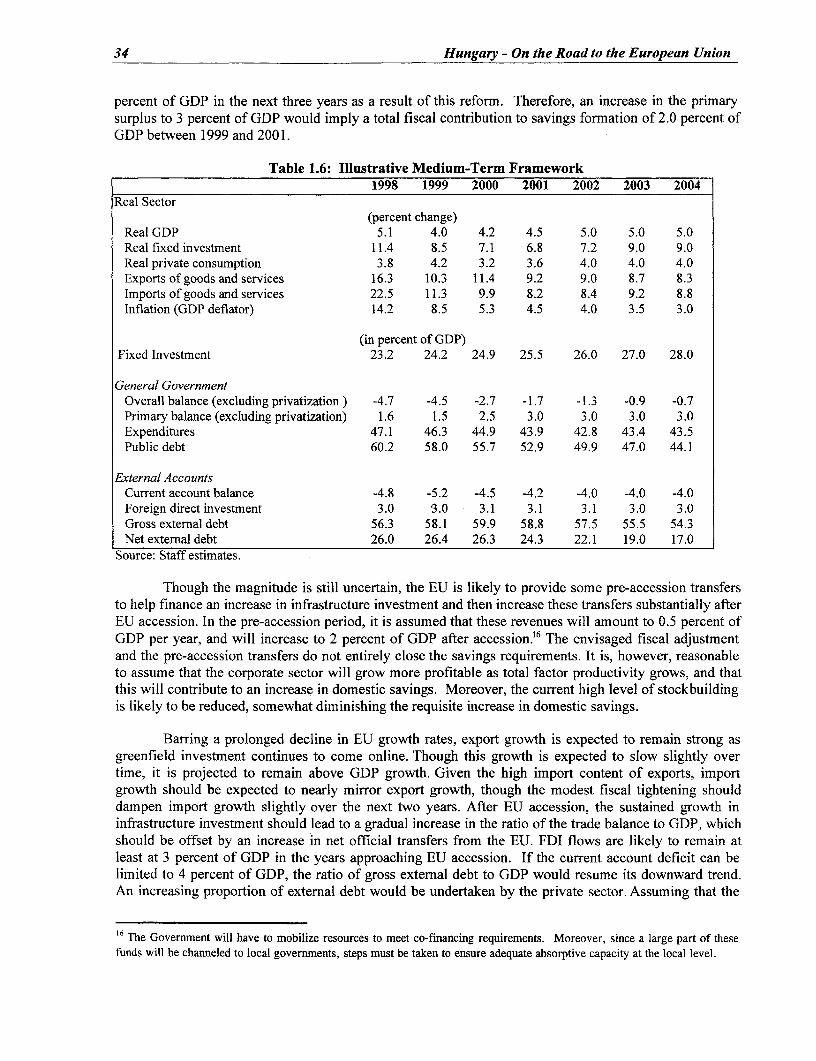
34 Hungary - On the Road to the European Union
percent of GDP in the next three years as a result of this reform. Therefore, an increase in the primarysurplus to 3 percent of GDP would imply a total fiscal contribution to savings formation of 2.0 percent ofGDP between 1999 and 2001.
Table 1.6: Illustrative Medium-Term Framework1998 1999 2000 2001 2002 2003 2004
Real Sector(percent change)
Real GDP 5.1 4.0 4.2 4.5 5.0 5.0 5.0Real fixed investment 11.4 8.5 7.1 6.8 7.2 9.0 9.0Real private consumption 3.8 4.2 3.2 3.6 4.0 4.0 4.0Exports of goods and services 16.3 10.3 11.4 9.2 9.0 8.7 8.3Imports of goods and services 22.5 11.3 9.9 8.2 8.4 9.2 8.8Inflation (GDP deflator) 14.2 8.5 5.3 4.5 4.0 3.5 3.0
(in percent of GDP)Fixed Investment 23.2 24.2 24.9 25.5 26.0 27.0 28.0
General GovernmentOverall balance (excluding privatization) -4.7 -4.5 -2.7 -1.7 -1.3 -0.9 -0.7Primary balance (excluding privatization) 1.6 1.5 2.5 3.0 3.0 3.0 3.0Expenditures 47.1 46.3 44.9 43.9 42.8 43.4 43.5Public debt 60.2 58.0 55.7 52.9 49.9 47.0 44.1
External AccountsCurrent account balance -4.8 -5.2 -4.5 -4.2 -4.0 -4.0 -4.0Foreign direct investment 3.0 3.0 3.1 3.1 3.1 3.0 3.0Gross external debt 56.3 58.1 59.9 58.8 57.5 55.5 54.3Net external debt 26.0 26.4 26.3 24.3 22.1 19.0 17.0
Source: Staff estimates.
Though the magnitude is still uncertain, the EU is likely to provide some pre-accession transfersto help finance an increase in infrastructure investment and then increase these transfers substantially afterEU accession. In the pre-accession period, it is assumed that these revenues will amount to 0.5 percent ofGDP per year, and will increase to 2 percent of GDP after accession.'6 The envisaged fiscal adjustmentand the pre-accession transfers do not entirely close the savings requirements. It is, however, reasonableto assume that the corporate sector will grow more profitable as total factor productivity grows, and thatthis will contribute to an increase in domestic savings. Moreover, the current high level of stockbuildingis likely to be reduced, somewhat diminishing the requisite increase in domestic savings.
Barring a prolonged decline in EU growth rates, export growth is expected to remain strong asgreenfield investment continues to come online. Though this growth is expected to slow slightly overtime, it is projected to remain above GDP growth. Given the high import content of exports, importgrowth should be expected to nearly mirror export growth, though the modest fiscal tightening shoulddampen import growth slightly over the next two years. After EU accession, the sustained growth ininfrastructure investment should lead to a gradual increase in the ratio of the trade balance to GDP, whichshould be offset by an increase in net official transfers from the EU. FDI flows are likely to remain atleast at 3 percent of GDP in the years approaching EU accession. If the current account deficit can belimited to 4 percent of GDP, the ratio of gross external debt to GDP would resume its downward trend.An increasing proportion of external debt would be undertaken by the private sector. Assuming that the
16 The Government will have to mobilize resources to meet co-financing requirements. Moreover, since a large part of thesefunds will be channeled to local govermnents, steps must be taken to ensure adequate absorptive capacity at the local level.

Chapter 1. Sustaining Growth and Gaining Membership in the European Union 35
stock of official reserves is maintained at 4 months of imports, and that imports grow faster than GDP, thenet external debt ratio would decline at a more rapid rate than the gross. These improving debt indicators,together with ongoing structural reforms, are likely to strengthen Hungary's credit ratings and furtherreduce Hungary's external borrowing costs.
The Objective and Structure of the Country Report
The objective of this report is to contribute to Hungary's ongoing efforts to prepare forintegration with the EU. It provides an assessment of progress in several sectors and identifies the mainreforms that needed to successfully complete the transformation initiated one decade ago. The report isstructured as follows: Chapter 2 elaborates on the fiscal framework. It provides an overview of Hungary'smedium-run fiscal program; evaluates the program's contribution to savings, capital formation, andgrowth; and it assesses the sustainability of fiscal policy beyond year 2001. It also provides an in-depthanalysis of reforms required in the pension, health, and intergovernmental finance systems.
Chapter 3 is concerned with foreign trade and trade policies. It examines the reorientation offoreign trade in the early 1 990s and the rapid integration of Hungary's trade into world markets, especiallyinto the EU. It investigates the essential role of FDI in industrial restructuring and export performance. Italso identifies the main policy issues and provides key recommendations for a pre-accession strategy thatwill maintain high the competitiveness of Hungarian exports.
Chapter 4 addresses financial sector reform. It provides an overview of banking sectordevelopment over the past decade, including harmonization of financial laws and regulations with the EU,progress in privatization, progress in coping with bad loans and troubled debtors, and resourcemobilization and allocation systems. It also contains a detailed study of the insurance sector and capitalmarkets. Finally it provides a list of reforms needed to strengthen Hungary's financial system andintegrate it with the EU.
Chapter 5 analyses the transition of the enterprise sector. It evaluates the progress achieved inprivatization and investigates the role of FDI in enterprise restructuring. It also identifies problems thatneed to be addressed in order to maintain FDI inflows as accession approaches. Chapter 6 examinesregulatory issues in the infrastructure sectors. It provides an overview of reforms undertaken to date in theelectricity, telecommunication, and gas sectors. Drawing on the experience in OECD countries, it putsforward several options for further competitive restructuring and regulatory reform to prepare Hungary'sinfrastructure sector for competition in EU markets.
Chapter 7 focuses on the labor market and social policies. After reviewing recent trends inemployment, education, and real wages, it investigates the extent to which the Hungarian labor markethas adjusted to the new economic environment. It also examines the effectiveness of social policies inensuring an efficient allocation of Hungary's human capital and compliance with EU accessionrequirements. Finally, it suggests a number of measures to increase the level of employment, flexibility,and productivity in the labor market, while ensuring smooth integration into the European Union.
Chapter 8 looks at institutional reforms in the public administration; in particular, thethree mainissues critical to building a modern, efficient, and professional civil service capable of negotiating andimplementing the acquis communautaire. First, adequate remuneration systems-pay policy and payflexibility mechanisms-to facilitate recruitment and retention of highly skilled personnel. Second,efficient human resource management and decision-making practices, to create a transparent and effectivecivil service. And finally, attracting the new mix of EU-related skills to ensure efficient management ofthe EU accession process.

36 Hungary - On the Road to the European Union
Chapter 9 addresses the agriculture and food sector. It examines the recent liberalization ofconsumer and producer prices, privatization of land and the food industry, and openness toward foreigninvestors. It also investigates the various agricultural support programs and recommends revisions andpolicy adjustments for the pre-accession period, to induce greater productivity and growth in this sectorand prepare Hungary for the implementation of the acquis.
Chapter 10 concentrates on the problem of meeting EU environment standards at minimum cost.It focuses on the investment required to comply with major EU environmental directives, and onmechanisms for financing these investments. It identifies several recommendations that will help Hungaryto comply with the EU requirements in the most efficient way.

2. A FISCAL FRAMEWORK FOR SUSTAINED GROWTH
AN OVERVIEW OF HUNGARY'S MEDIUM-RUN FISCAL FRAMEWORK
Fiscal Adjustment in the Mid-1990s
Hungary's public finances sharply deteriorated during the early years of the transition, asdemonstrated by the dramatic shift in the general Government balance from a surplus of 0.5 percent ofGDP in 1990 to a deficit of 8.4 percent of GDP in 1994. Hungary entered 1995 with even larger fiscalimbalances, one of the highest ratio of public expenditures to GDP in the world (around 60 percent), anda very large public debt (almost 90 percent of GDP). As mentioned in Chapter 1, these fiscal imbalancescaused similar imbalances in the external accounts; they threatened a balance of payments crisis andprevented a sustained recovery of output and employment after the transitional recession.
To avert a balance of payments crisis and create the conditions for a sustained recovery, theGovernment implemented a radical fiscal adjustment in 1995, centered on a sharp reduction in fiscalexpenditures. Total expenditures were reduced by nearly 13 percent of GDP between 1994 and 1998(Table 2. 1), which more than offset a large decline in revenues and enabled a significant reduction in theoverall and primary deficits-by around 4 percent of GDP, excluding privatization revenues. This fiscaladjustment, combined with large revenues from the privatization of utilities and banks, made it possiblefor the Government to achieve a sharp reduction in its debt-from nearly 90 percent of GDP in 1994 to60 percent in 1998.'
Table 2.1: An Overview of the General Government Budget (% of GDP), 1993-981993 1994 1995 1996 1997 1998*
Total Revenues (excluding privatization revenues) 51.5 51.2 47.7 45.8 43.8 42.2Total expenditures 60.8 60.4 54.3 49.0 49.2 47.1
Interest payments 4.6 6.8 9.3 8.3 9.8 7.8Net lending -3.3 -1.7 -3.4 -4.0 -3.6 -0.5
Privatization revenues 0.6 0.9 3.2 3.8 3.0 -0.3Primary Balance (excluding privatization revenues) -2.7 -2.2 2.2 3.7 2.7 1.6Overall Balance (excluding privatization revenues) -6.6 -8.4 -6.4 -3.0 -4.8 -4.7
Overall Balance (including privatization revenues) -6.0 -7.5 -3.2 0.8 -1.8 -4.4General Govemment debt 90.4 88.2 86.4 72.8 63.9 60.2
Interest-bearing debt related to cleaning of NBH 0.0 1.4 2.3 4.8 26.0 24.2Overall balance on accrual basis, excluding privatization -7.7 -9.6 -7.3 -4.6 -5.1 -4.8.revenues (NBH estimates)Consolidated operational deficit (NBH estimates) 5.1 5.5 2.1 -0.6 0.7 2.0
* 1998 figures are World Bank staff estimates.Sources: Ministry of Finance, NBH, and World Bank staff estimates.
iHungary's fiscal reform in the 1990s also included a reorganization of the public sector, with the absorption of numerous extrabudgetary funds into the central budget. A detailed analysis of Hungary's fiscal adjustment is provided in Kiss, G. (1998), and inBokros and Dethier (1998).
37
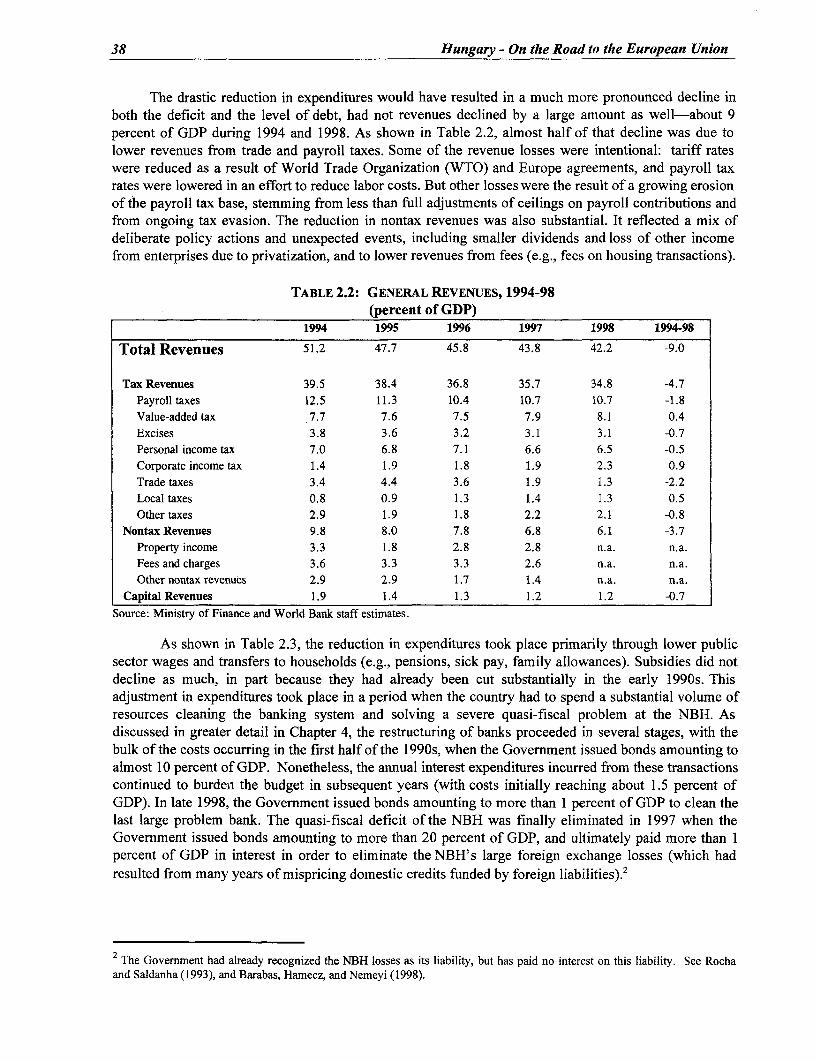
38 Hungary - On the Road to the European Union
The drastic reduction in expenditures would have resulted in a much more pronounced decline inboth the deficit and the level of debt, had not revenues declined by a large amount as well-about 9percent of GDP during 1994 and 1998. As shown in Table 2.2, almost half of that decline was due tolower revenues from trade and payroll taxes. Some of the revenue losses were intentional: tariff rateswere reduced as a result of World Trade Organization (WTO) and Europe agreements, and payroll taxrates were lowered in an effort to reduce labor costs. But other losses were the result of a growing erosionof the payroll tax base, stemming from less than full adjustments of ceilings on payroll contributions andfrom ongoing tax evasion. The reduction in nontax revenues was also substantial. It reflected a mix ofdeliberate policy actions and unexpected events, including smaller dividends and loss of other incomefrom enterprises due to privatization, and to lower revenues from fees (e.g., fees on housing transactions).
TABLE 2.2: GENERAL REVENUES, 1994-98(percent of GDP)
1994 1995 1996 1997 1998 1994-98
Total Revenues 51.2 47.7 45.8 43.8 42.2 -9.0
Tax Revenues 39.5 38.4 36.8 35.7 34.8 -4.7Payroll taxes 12.5 11.3 10.4 10.7 10.7 -1.8Value-added tax 7.7 7.6 7.5 7.9 8.1 0.4Excises 3.8 3.6 3.2 3.1 3.1 -0.7Personal income tax 7.0 6.8 7.1 6.6 6.5 -0.5Corporate income tax 1.4 1.9 1.8 1.9 2.3 0.9Trade taxes 3.4 4.4 3.6 1.9 1.3 -2.2Local taxes 0.8 0.9 1.3 1.4 1.3 0.5Other taxes 2.9 1.9 1.8 2.2 2.1 -0.8
Nontax Revenues 9.8 8.0 7.8 6.8 6.1 -3.7Property income 3.3 1.8 2.8 2.8 n.a. n.a.Fees and charges 3.6 3.3 3.3 2.6 n.a. n.a.Other nontax revenues 2.9 2.9 1.7 1.4 n.a. n.a.
Capital Revenues 1.9 1.4 1.3 1.2 1.2 -0.7
Source: Ministry of Finance and World Bank staff estimates.
As shown in Table 2.3, the reduction in expenditures took place primarily through lower publicsector wages and transfers to households (e.g., pensions, sick pay, family allowances). Subsidies did notdecline as much, in part because they had already been cut substantially in the early 1990s. Thisadjustment in expenditures took -place in a period when the country had to spend a substantial volume ofresources cleaning the banking system and solving a severe quasi-fiscal problem at the NBH. Asdiscussed in greater detail in Chapter 4, the restructuring of banks proceeded in several stages, with thebulk of the costs occurring in the first half of the 1 990s, when the Government issued bonds amounting toalmost 10 percent of GDP. Nonetheless, the annual interest expenditures incurred from these transactionscontinued to burden the budget in subsequent years (with costs initially reaching about 1.5 percent ofGDP). In late 1998, the Government issued bonds amounting to more than 1 percent of GDP to clean thelast large problem bank. The quasi-fiscal deficit of the NBH was finally eliminated in 1997 when theGovernment issued bonds amounting to more than 20 percent of GDP, and ultimately paid more than 1percent of GDP in interest in order to eliminate the NBH's large foreign exchange losses (which hadresulted from many years of mispricing domestic credits funded by foreign liabilities).2
2 The Government had already recognized the NBH losses as its liability, but has paid no interest on this liability. See Rochaand Saldanha (1993), and Barabas, Hamecz, and Nemeyi (1998).
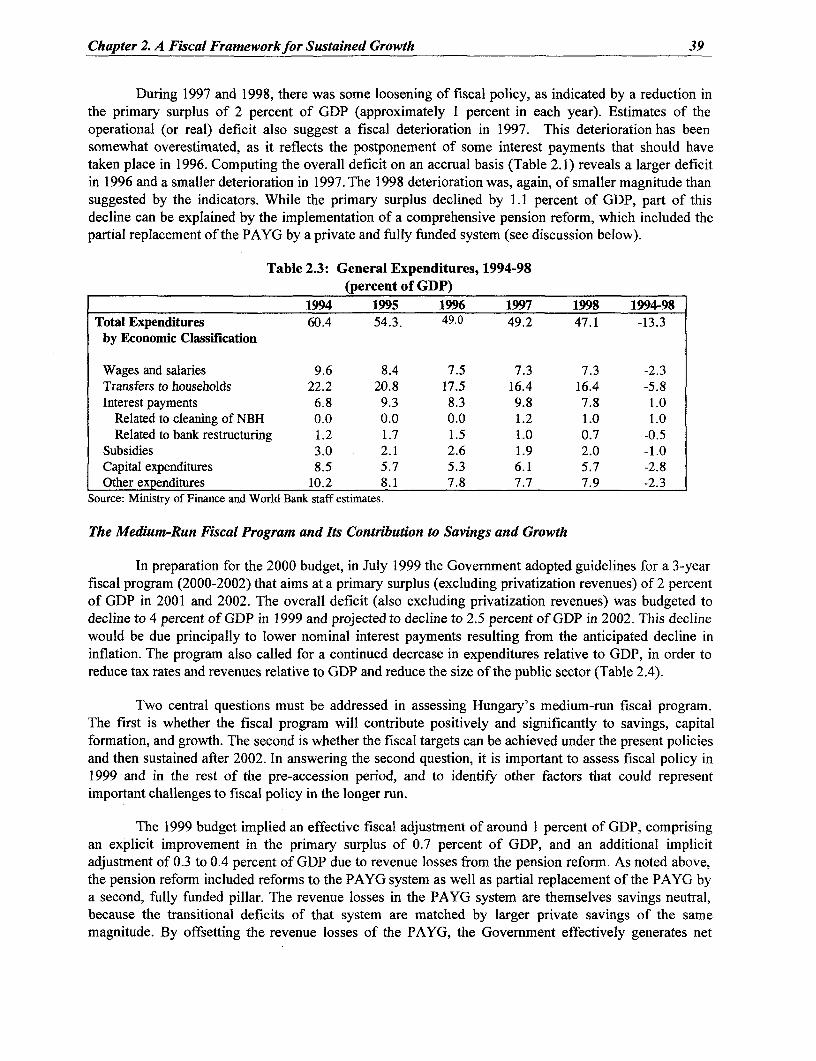
Chapter 2. A Fiscal Framework for Sustained Growth 39
During 1997 and 1998, there was some loosening of fiscal policy, as indicated by a reduction inthe primary surplus of 2 percent of GDP (approximately 1 percent in each year). Estimates of theoperational (or real) deficit also suggest a fiscal deterioration in 1997. This deterioration has beensomewhat overestimated, as it reflects the postponement of some interest payments that should havetaken place in 1996. Computing the overall deficit on an accrual basis (Table 2.1) reveals a larger deficitin 1996 and a smaller deterioration in 1997. The 1998 deterioration was, again, of smaller magnitude thansuggested by the indicators. While the primary surplus declined by 1.1 percent of GDP, part of thisdecline can be explained by the implementation of a comprehensive pension reform, which included thepartial replacement of the PAYG by a private and fully funded system (see discussion below).
Table 2.3: General Expenditures, 1994-98(percent of GDP)
1994 1995 1996 1997 1998 1994-98Total Expenditures 60.4 54.3. 49.0 49.2 47.1 -13.3
by Economic Classification
Wages and salaries 9.6 8.4 7.5 7.3 7.3 -2.3Transfers to households 22.2 20.8 17.5 16.4 16.4 -5.8Interest payments 6.8 9.3 8.3 9.8 7.8 1.0
Related to cleaning of NBH 0.0 0.0 0.0 1.2 1.0 1.0Related to bank restructuring 1.2 1.7 1.5 1.0 0.7 -0.5
Subsidies 3.0 2.1 2.6 1.9 2.0 -1.0Capital expenditures 8.5 5.7 5.3 6.1 5.7 -2.8Other expenditures 10.2 8.1 7.8 7.7 7.9 -2.3
Source: Ministry of Finance and World Bank staff estimates.
The Medium-Run Fiscal Program and Its Contribution to Savings and Growth
In preparation for the 2000 budget, in July 1999 the Government adopted guidelines for a 3-yearfiscal program (2000-2002) that aims at a primary surplus (excluding privatization revenues) of 2 percentof GDP in 2001 and 2002. The overall deficit (also excluding privatization revenues) was budgeted todecline to 4 percent of GDP in 1999 and projected to decline to 2.5 percent of GDP in 2002. This declinewould be due principally to lower nominal interest payments resulting from the anticipated decline ininflation. The program also called for a continued decrease in expenditures relative to GDP, in order toreduce tax rates and revenues relative to GDP and reduce the size of the public sector (Table 2.4).
Two central questions must be addressed in assessing Hungary's medium-run fiscal program.The first is whether the fiscal program will contribute positively and significantly to savings, capitalformation, and growth. The second is whether the fiscal targets can be achieved under the present policiesand then sustained after 2002. In answering the second question, it is important to assess fiscal policy in1999 and in the rest of the pre-accession period, and to identify other factors that could representimportant challenges to fiscal policy in the longer run.
The 1999 budget implied an effective fiscal adjustment of around 1 percent of GDP, comprisingan explicit improvement in the primary surplus of 0.7 percent of GDP, and an additional implicitadjustment of 0.3 to 0.4 percent of GDP due to revenue losses from the pension reform. As noted above,the pension reform included reforms to the PAYG system as well as partial replacement of the PAYG bya second, fully funded pillar. The revenue losses in the PAYG system are themselves savings neutral,because the transitional deficits of that system are matched by larger private savings of the samemagnitude. By offsetting the revenue losses of the PAYG, the Government effectively generates net

40 Hungary - On the Road to the European Union
savings (i.e., the increase in private savings is not offset by public dissavings, leading to an overallincrease in national savings).3
Table 2.4: Hungary's Medium-Run Fiscal Program, 1998-2001(percent of GDP)
1998 1999 2000 2001 2002
Government's Medium-Run Fiscal ProgramPrimary balance (excluding privatization revenues) 1.6 2.2 2.3 2.0 2.0Overall balance (excluding privatization revenues) 4.7 -4.0 -3.0 -2.8 -2.5
Reform ScenarioPrimary balance (excluding privatization revenues) 1.6 1.5 2.5 3.0 3.0Overall balance (excluding privatization revenues) 4.7 -4.5 -2.7 -1.7 -1.3
Revenues (excluding privatization revenue) 42.2 41.8 42.2 42.2 41.4Expenditures 47.1 46.1 44.9 43.9 42.8Net lending -0.5 -0.2 -0.1 -0.1 0.0
General Government debt 60.2 58.0 55.7 52.9 49.9Memorandum item:
Annual revenue loss from pension reform 0.3 0.4 0.3 0.1 0.1Source: Ministry of Finance and World Bank staff estimates.
As discussed in Chapter 1, the 1999 budget was prepared assuming a real GDP growth rate of 5percent and average inflation of 11 percent. It now appears more likely that both will be lower (about 4and 10 percent, respectively). Earlier in 1999, the Government announced the freezing of HUF 40 billionin special and general reserves, the equivalent of 0.4 percent of GDP. The freezing of reserves hadalready been envisaged as a contingency measure to offset the adverse impact of lower real GDP growth,and it temporarily improved the credibility of the fiscal target. While there have been doubts amongprivate analysts during the first eight months of the year as to whether the target can be achieved, it nowseems likely that the Government will be able to meet fiscal targets without additional correctivemeasures.4
If the 1999 budget deficit target is not met, a larger fiscal adjustment in 2000 will be required tomeet the fiscal targets proposed in the Govermment's guidelines. It would be advisable for this fiscaladjustment to be brought about through further reductions in expenditures rather than increases inrevenues. Within the fiscal targets, a shift in expenditures will be necessary. As a new member ofNATO, Hungary is committed to increasing its defense expenditures. Moreover, as EU accession nears,it is vital that Hungary increase and sustain infrastructure investments, especially in key sectors such asenvironment, transport, and agriculture. Accommodating these expenditures may require introducingmore targeted social programs, in order to generate savings while maintainingprotections for low-incomesegments of the population. On the revenue side, it would be prudent to ensure that tax bases arebroadened before tax rates are reduced, to avoid a loss in revenues. Many tax rates in Hungary are highby international comparison (e.g., payroll tax rates of 50 percent and upper VAT rates of 25 percent).Further increases in tax rates would generate greater distortions and induce more tax evasion. Moreover,there is an ongoing effort to improve tax collection and broaden tax bases. Success in broadening tax
3As shown in section B, even if the central budget did not offset the revenue losses of the PAYG, the pension reform would stillgenerate savings of roughly the same order of magnitude, due to the reforms to that system (increases in the retirement age andthe move from wage indexing of pensions to a mixed formula). These savings, however, would take a longer period tomaterialize, because reforms to the PAYG would reduce the transition deficit only gradually.
4These debts were due to the larger than expected deficit in the first six months of the year-HUF 391 billion, or 89 percent ofthe total deficit projected for the year.

Chapter 2. A Fiscal Framework for Sustained Growth 41
bases should be used to reduce tax rates. This is particularly true of the payroll tax, which remains one ofthe highest in the world.
The Government's guidelines call for a reduction in the overall general Government deficit in2001 and 2002. However, the fall in the overall deficit would be due primarily to the projected drop ininflation and nominal interest payments, which would not contribute to savings formation.S The overalldeficit target implies a reduction in the primary surplus to 2 percent of GDP for both these years. Thisstrategy appears to rely too heavily on increases in private savings to accommodate the envisagedincrease in investment concurrent with a decline in the current account deficit.
As discussed in Chapter 1, freeing resources for a continuing expansion of fixed investment inthe remainder of the pre-accession period (by an additional 1.8 percent of GDP), and a simultaneousimprovement in the current account (by 1.2 percent of GDP) may require some additional efforts in thefiscal area. A more prudent fiscal program is described in our reform scenario in Chapter 1. This wouldinclude increasing the primary surplus to 2.5 percent of GDP in 2000 and to 3 percent in 2001 and 2002.The overall contribution of fiscal policy to savings formation would thus amount to roughly 2 percent ofGDP (0.5 percent of GDP from the pension reform and 1.5 percent of GDP from the increased primarysurplus), or two-thirds of the total required increase in savings.6
Sustainability of Fiscal Policy in the Longer Run
It is also important to look at the longer run, and assess whether Hungary's public finances reston a solid foundation, or whether there are hidden problems that would eventually cause an increase inexpenditures and threaten fiscal equilibrium. Addressing this question involves investigating whether thesharp reduction of expenditures that occurred in the past four years is sustainable across all areas of thepublic sector, or whether there are key areas where expenditures have been unsustainably compressed.
Hungary's present fiscal situation contains some bright aspects, but also some vulnerable areasthat must be addressed as soon as possible, to avoid the reemergence of fiscal imbalances. On the positiveside, Hungary has already absorbed the large fiscal costs that are often associated with a large-scalerestructuring of the banking and enterprise sectors-a problem that continues to affect other transitioncountries. Except for Postabank, all large banks have been privatized; after the recent restructuring ofPostabank, further fiscal expenditures associated with bank restructuring are not expected (Chapter 4).As examined in section B, Hungary also implemented a comprehensive pension reform, thereby greatlyreducing the large actuarial imbalances that continue to affect the PAYG systems of many countries inWestern and Eastern Europe.
On the negative side, however, Hungary has not yet satisfactorily addressed the serious problemsaffecting the health sector. As discussed in section C, the decline in health expenditures relative to GDPsince 1995 has, to some extent, been artificial. The decline in health expenditures has been largelygenerated by sharp wage cuts, by inadequate maintenance of hospitals, and by postponing the renewal ofmedical equipment. The need to improve the poor health status of the Hungarian population will translateinto large pressures on expenditures, unless the health system is rationalized. The need for health reformbecomes even more obvious considering the aging of the population, which implies additional pressuresto increase health expenditures.
s Everything else constant, a drop in inflation would reduce the nominal deficit and private savings by the same magnitude. SeeCukierman and Mortensen (1986), Eisner (1989), and Blejer and Cheasty (1991).
6 If real interest rates declined significantly from the average 1998-99 levels (around 5 percent), the reduction in the operationaldeficit would exceed 2 percent of GDP, implying a greater contribution of fiscal policy to savings formation.

42 Hungary - On the Road to the European Union
In addition to problems in the health sector, policymakers also have to address imbalances inother areas of the public sector, such as the public administration. There is a need to reduce the excessivewage disparities between public servants and the private sector (exacerbated during the period of fiscaladjustment), in order to attract well-qualified workers into the public administration.The need to upgradeHungary's civil service appears even more pressing considering that the process of EU accession willrequire the hiring of significant numbers of well-qualified professionals who are capable of managing theintegration of the Hungarian economy into the Common Market. Hence, the upgrading of Hungary'spublic administration will probably result in some expenditure pressures in the mediumrun. This is trueeven if the new hirings are offset by laying off of less essential since the Government will have to payhigher average wages and make severance payments as well. (Challenges in the area of publicadministration are examined in more detail in chapter 8.)
Finally, preparing the public sector for the challenges of the next decade also involve examiningthe efficiency of local governments in delivering public services. As discussed in section D, localgovernments have substantial responsibilities in the provision of public services, but remain excessivelyfragmented and dependent on transfers from the Central Government. Ensuring greater efficiency in theoperation of local governments acquires even greater importance in view of the fact that localgovernments will be in charge of receiving and allocating the large EU transfers that are expected tofollow EU membership.
PENSION REFORM
The pension reform passed by the Hungarian Parliament in the summer of 1997 constitutes oneof the most critical steps in Hungary's transformation from a centrally planned to a modern marketeconomy that relies on a balanced partnership between the public and private sectors. Hungary was thefirst transition country to implement a systemic pension reform, involving the move from a pure public,pay-as-you-go (PAYG) system into a multi-pillar system-a step now being taken by other CentralEuropean countries such as Poland and Latvia. This section briefly reviews the conditions of the pensionsystem at the start of the reform, describes the main components of the reform package, assesses themedium and long-run effects of the reform, and identifies some pending policy issues.7
Initial Conditions
The Hungarian pension reform was developed in 1997 under very adverse initial conditions. Inparticular, the broadly defined PAYG system (including pensions paid by the pension and healthinsurance funds and the central budget) was already running deficits of around 1 percent of GDP by themid-1990s, despite charging very high contribution rates (30.5 percent of gross wages. This difficultfinancial situation was the result of increasing evasion and the erosion of the tax base, and a sharpincrease in the system's dependency ratio (the ratio of pensioners to active workers). The deficits werenot larger because the average pension benefit was also reduced (from more than 70 percent of theaverage wage in the late 1970s to 60 percent in the mid-1990s) through extensive manipulation of thebenefit formula. These arbitrary adjustments prevented a fiscal crisis, but also undermined thepopulation's confidence in the pension system.
The PAYG system was estimated before the reform to be running deficits that would reachalmost 6 percent of GDP by the end of the projection period (2050); this would depress national savingsby a commensurate amount and place a heavy burden on the economy (see Figure 2.1). Moreover,eliminating these deficits by increasing tax rates or by lowering replacement ratios would not be viableoptions, since tax rates would need to be doubled or the replacement ratios would need to be halved. The
7A detailed analysis of the Hungarian pension reform is provided in Palacios and Rocha (1998).
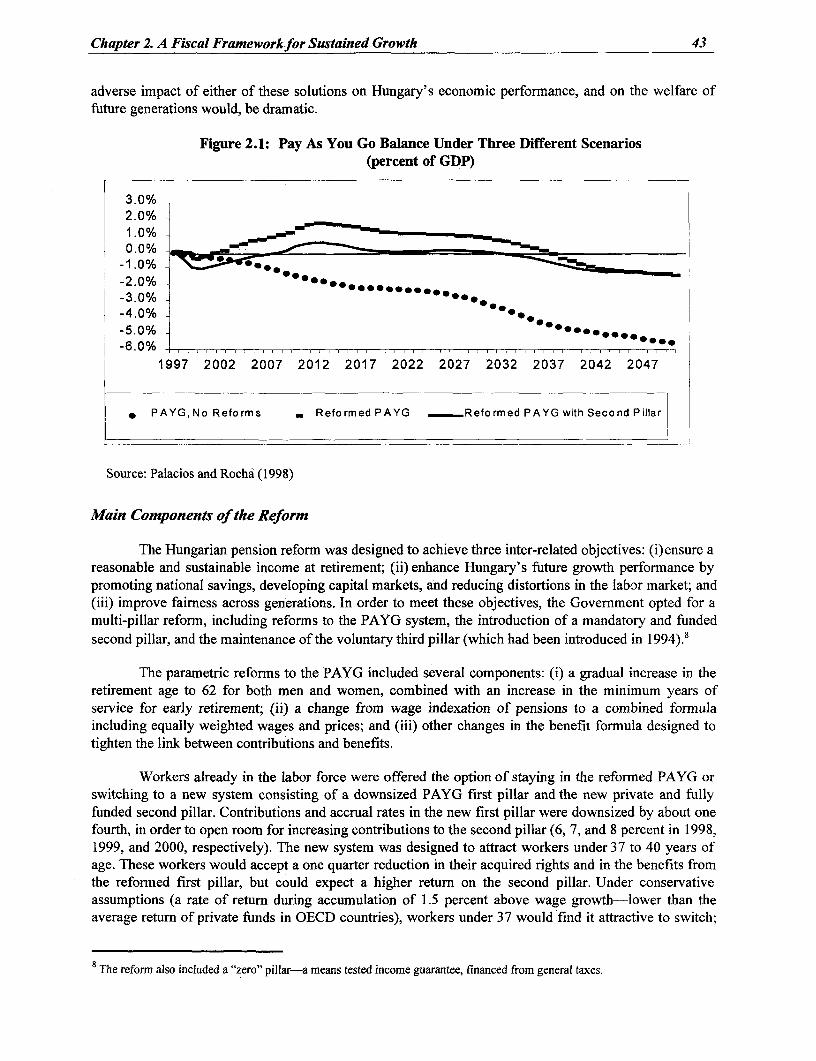
Chapter 2. A Fiscal Framework for Sustained Growth 43
adverse impact of either of these solutions on Hungary's economic performance, and on the welfare offuture generations would, be dramatic.
Figure 2.1: Pay As You Go Balance Under Three Different Scenarios(percent of GDP)
3.0%2.0%1.0%0.0% ______
-1.0% - .
-2.0%-3.0% 0-4.0%-5.0%-6.0%
1997 2002 2007 2012 2017 2022 2027 2032 2037 2042 2047
* PAYG,No Reforms _ ReformedPAYG -Reformed PAYG with Second Pillar
Source: Palacios and Rocha (1998)
Main Components of the Reform
The Hungarian pension reform was designed to achieve three inter-related objectives: (i)ensure areasonable and sustainable income at retirement; (ii) enhance Hungary's future growth performance bypromoting national savings, developing capital markets, and reducing distortions in the labor market; and(iii) improve fairness across generations. In order to meet these objectives, the Government opted for amulti-pillar reform, including reforms to the PAYG system, the introduction of a mandatory and fundedsecond pillar, and the maintenance of the voluntary third pillar (which had been introduced in 1994).8
The parametric reforms to the PAYG included several components: (i) a gradual increase in theretirement age to 62 for both men and women, combined with an increase in the minimum years ofservice for early retirement; (ii) a change from wage indexation of pensions to a combined formulaincluding equally weighted wages and prices; and (iii) other changes in the benefit formula designed totighten the link between contributions and benefits.
Workers already in the labor force were offered the option of staying in the reformed PAYG orswitching to a new system consisting of a downsized PAYG first pillar and the new private and fullyfunded second pillar. Contributions and accrual rates in the new first pillar were downsized by about onefourth, in order to open room for increasing contributions to the second pillar (6, 7, and 8 percent in 1998,1999, and 2000, respectively). The new system was designed to attract workers under 37 to 40 years ofage. These workers would accept a one quarter reduction in their acquired rights and in the benefits fromthe reformed first pillar, but could expect a higher return on the second pillar. Under conservativeassumptions (a rate of return during accumulation of 1.5 percent above wage growth-lower than theaverage return of private funds in OECD countries), workers under 37 would find it attractive to switch;
8 The reform also included a "zero" pillar-a means tested income guarantee, financed from general taxes.
44 Hungary - On the Road to the European Union
workers above that age would find it attractive to stay in the PAYG. The new system is mandatory fornew entrants into the labor force.
The actual switching outcome has been consistent with expectations-in 1998, approximately 1.3million workers chose the new system, 75 percent of which were under the age of 35. This amounts toroughly 30 percent of the labor force, or almost 60 percent of workers under 40. Most of the switchingworkers chose to place their second pillar accounts in one of the five large pension funds operated byinternational insurance companies-possibly motivated by the reputation and perceived high professionalstandards of these institutions. It is expected that at least 1.5 millionworkers will switch to the newsystem by December 1999, the deadline for exercising the switching option.
Assessing the Long-Run Impact of the Reform
The PAYG reforms are expected to substantially improve the financial standing of the pensionsystem over the medium and long run. As shown in Figure 2.1, these reforms are projected increasePAYG surpluses (even without the introduction of the second pillar) during the next decade and until2010-2012. These surpluses will decline gradually after that date, and eventually shift again into deficitsdue to further demographic shocks, thereby indicating the need for additional corrections to the PAYG inthe future (further increases in the retirement age and a shift to pure price indexation).
Policymakers had to make an early decision whether limit the pension reform to these parametricchanges in the PAYG, or take the additional step of introducing a second pillar. The decision to introducea mixed system was motivated by several considerations. First, although the surpluses produced by thePAYG reformns would, in principle, build a cushion and enhance national savings, they would also createroom for politically motivated increases in benefits and/or induce larger central budget deficits, therebydestroying some of the main objectives of the reform.9 Second, even if these savings were safeguarded,pure PAYG reformns would not produce the same long-run efficiency gains in the capital and labormarkets. They would thus contribute less to future economic performance. Third, multi-pillar systemsoffer more protection in the long run than single pillar systems because of better diversification of allrisks.
Replacing part of the PAYG by a second pillar generates an immediate revenue loss in the PAYGas well as a transitional deficit, because the system must continue paying full PAYG benefits (notdownsized) for a number of years. The transitional deficit is not a fiscal deficit in the usual sense,however, because the revenue loss in the public sector is matched by private savings of the samemagnitude, leaving national savings unchanged. In addition, the transitional deficit is projected to declineduring the next decade because of the parametric reforms to the PAYG. As shown in Figure 2.1, theintroduction of the second pillar has generated an immediate "official" deficit of around 0.3 percent ofGDP in 1998, and is projected to lead to deficits around I percent of GDP in 2000. The overall PAYGdeficit is, however, projected to decline gradually after 2001, due to the gradual but steady impact of thePAYG reforms.
The impact of the full reform on national savings can be ascertained by combining the flows ofprivate savings (the contributions and returns to the second pillar) and the PAYG balances. As shown inFigure 2.2, national savings are expected to increase progressively from 2000 on, due to the steadyincrease in private savings and the progressive decline in the PAYG deficit. The combination of the twoeffects would lead national savings to increase by 2 percent of GDP during the next decade-
9The real rate of return on public PAYG reserves in other countries has been extremely low and often negative, due to politicalinterference in asset allocation.

Chapter 2. A Fiscal Frameworkfor Sustained Growth 45
approximately 0.2 percent of GDP per year. The net savings gain would be channeled through pensionfunds in the form of long-term financing flows to the private sector, contributing to capital formation inthe private sector and enhancing Hungary's growth prospects.
These simulations assume that the central budget does not adjust to the PAYG balances duringthe transition. If the central budget fully offsets the transitional deficit, as implied by the Government'sintention to keep the primary surplus of the general Government around at least 2 percent of GDP(section 1), the impact of the reform on national savings would be more front loaded. Indeed, if theprimary surplus of the general Government is kept constant throughout the next decade, the impact of thereform on national savings would be equal to the private savings effect shown in Figure 2.2-a fast gainof around 1 percent of GDP in the first years of the reform, followed by more moderate gains thereafter.
The full impact of the pension reform on future growth depends on many other indirect effects. Itdepends on the impact of the parametric reforms on private savings, the endogenous effect of highergrowth itself on private savings, the direct impact of capital market development on growth, and thepositive labor market effects due to the tightened link between contributions and benefits. Although it isadmittedly difficult to quantify all these additional effects, their net impact on long-run growth is judgedto be positive, thereby strengthening the direct savings effect discussed above.
Figure 2.2: Pay As You Go Balances, Private Flows, and National Savings (percent of GDP)
2.5% -2.0 % A ***AA*aammi AS*^sX"s
.0.% - -----
-1.0% --1.5% A
- .0 % - iE 2b ,A zlElAAAAlll ,AA llll ll 1 ,
1997 2001 2005 2009 2013 2017 2021 2025 2029 2033 2037 2041 2045 2049
_ -|Reformed PAYG with Second Pillar * Second Pillar Savings * National Savings| _
Source: Palacios and Rocha (1998)
Pending Policy Issues
During the drafting of the 1999 budget, the Government decided to maintain the conribution tothe second pillar at 6 percent in 1999, instead of increasing it to 7 percent as planned. According to theofficial explanation, the higher than expected deficit in the social security funds, and the unforeseenexpenditures related to the restructuring of Postabank, made this amendment necessary. The Governmenthas also recently announced its intention of maintaining the second pillar contribution at 6 percent in2000, and has also announced that it may review other elements of the reform, such as the guarantee tothe second pillar and the mandatory status of new entrants to the labor force.
Although it is true that the decision to retain the contribution to the second pillar at 6 percent willresult in more resources flowing to the PAYG in 1999 and 2000, the amounts are small. In addition, thisdecision will not result in any real improvement in fiscal policy or in Hungary's overall macroeconomic
46 Hungary - On the Road to the European Union
performance; the larger flows to the PAYG will be fully offset by smaller flows to the second pillar,leaving national savings unchanged. At the same time, this decision has greatly increased uncertaintyamong both switchers and the managers of the pension funds two groups that must rely on a stable policyframework in order to make informed decisions.
The pension reform passed by Parliament in the summer of 1997 represents an important step inthe right direction. It is expected to generate a more diversified and stable retirement income, and tocontribute to Hungary's growth performance. The reform is also expected to eliminate the bias againstyoung workers which is commonly found in pure PAYG schemes. Nonetheless, the actuarial simulationsshow that the PAYG may have to undergo additional reforms due to further demographic pressures, andthese future reforms will affect primarily young workers. The introduction of a second, fullyfunded pillaropens the possibility for these workers to maintain a reasonable income at retirement, even if theseadditional corrections take place in the future.
The best policy option for the Government is, therefore, to deepen the reform and to ensure that theyoung second pillar is able to live up to its potential. This implies increasing the contribution to thesecond pillar to 8 percent as planned as soon as possible, and improving the institutional and regulatoryframework for pension funds. The latter measures involve improving the infrastructure for reporting andpayments by employers, ensuring that payments are properly credited to individual accounts, refining theregulatory framework to enhance transparency and safety, and strengthening the supervisory function, toenable supervisors to identify and correct problems at an early stage.
Guarantees on Second Pillar Returns
The new Hungarian system includes new legislation and institutions designed to improve thesafety of private pension funds. Prudential regulation includes licensing, investment guidelines, reporting,and disclosure requirements. Efforts have been made to strengthen the State Pension Fund Supervision(an agency created in 1993 to supervise voluntary funds), to help it meet its expanded responsibilities.Finally, the new system also includes the guarantee of a minimum second pillar benefit, equal to 25percent of the first pillar benefit; this is called the normative guarantee. Should the balance of the secondpillar account at retirement fall short of the level needed forto provide this minimum, the difference mustbe supplemented by a newly created Guarantee Fund. The Guarantee Fund is financed throughmembership fees (equal to 0.3 to 0.5 percent of contributions) and is ultimately backed by the centralbudget.'"
One important question related to the new Hungarian system is whether the Guarantee Fund willhave sufficient resources to honor the normative guarantee, or whether this guarantee creates a seriousrisk to the state budget. This question can be preliminarily addressed by examining the rate of return onthe second pillar that would trigger the guarantee for different age groups, and comparing it with the rateof return that could be expected under reasonable conditions. If the triggering rates are excessively high,that implies that the guarantee is excessively generous, and that the Guarantee Fund could run out ofresources and resort to the state budget as the final guarantor.
When workers were given the choice of staying in the PAYG or switching to the new system,they were presented with a baseline scenario for the second pillar. This scenario included a real rate ofreturn during the accumulation period equal to 1.5 percent above wage growth, operating costs equal to
10 All countries that have introduced a second pillar have also introduced safeguards to protect workers' accounts. Thesesafeguards include a regulatory framework to prevent fraud and reckless behavior, as well as guarantees in some form. Excessiveguarantees have generally been avoided, however, because they tend to cause distortions in capital markets and entail risks to thebudget.
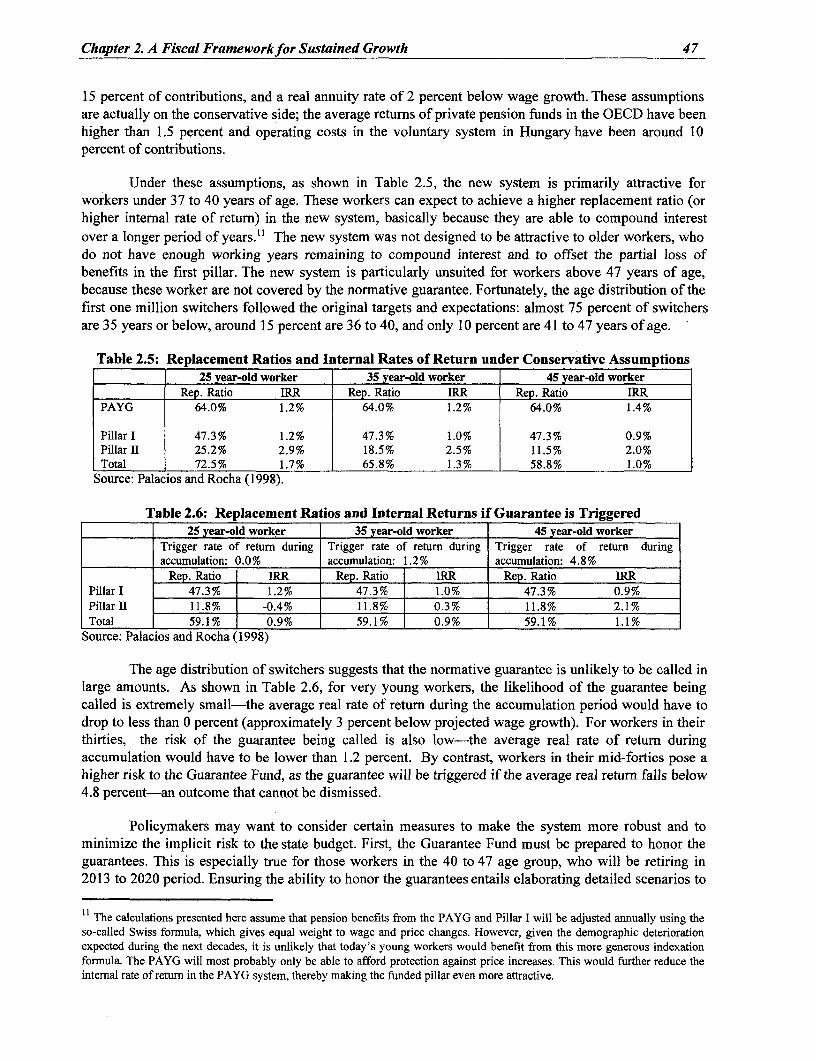
Chapter 2. A Fiscal Frameworkfor Sustained Growth 47
15 percent of contributions, and a real annuity rate of 2 percent below wage growth. These assumptionsare actually on the conservative side; the average returns of private pension funds in the OECD have beenhigher than 1.5 percent and operating costs in the voluntary system in Hungary have been around 10percent of contributions.
Under these assumptions, as shown in Table 2.5, the new system is primarily attractive forworkers under 37 to 40 years of age. These workers can expect to achieve a higher replacement ratio (orhigher internal rate of return) in the new system, basically because they are able to compound interestover a longer period of years." The new system was not designed to be attractive to older workers, whodo not have enough working years remaining to compound interest and to offset the partial loss ofbenefits in the first pillar. The new system is particularly unsuited for workers above 47 years of age,because these worker are not covered by the normative guarantee. Fortunately, the age distribution of thefirst one million switchers followed the original targets and expectations: almost 75 percent of switchersare 35 years or below, around 15 percent are 36 to 40, and only 10 percent are 41 to 47 years of age.
Table 2.5: Replacement Ratios and Internal Rates of Return under Conservative Assumptions25 year-old worker 35 year-old worker 45 year-old worker
Rep. Ratio IRR Rep. Ratio IRR Rep. Ratio IRRPAYG 64.0% 1.2% 64.0% 1.2% 64.0% 1.4%
Pillar I 47.3% 1.2% 47.3% 1.0% 47.3% 0.9%Pillar II 25.2% 2.9% 18.5% 2.5% 11.5% 2.0%Total 72.5% 1.7% 65.8% 1.3% 58.8% 1.0%
Source: Palacios and Rocha (1998).
Table 2.6: Replacement Ratios and Internal Returns if Guarantee is Triggered25 year-old worker 35 year-old worker 45 year-old worker
Trigger rate of return during Trigger rate of return during Trigger rate of return duringaccumulation: 0.0% accumulation: 1.2% accumulation: 4.8%
Rep. Ratio IRR Rep. Ratio IRR Rep. Ratio IRRPillar I 47.3% 1.2% 47.3% 1.0% 47.3% 0.9%Pillar I 11.8% -0.4% 11.8% 0.3% 11.8% 2.1%Total 59.1% 0.9% 59.1% 0.9% 59.1% 1.1%
Source: Palacios and Rocha (1998)
The age distribution of switchers suggests that the normative guarantee is unlikely to be called inlarge amounts. As shown in Table 2.6, for very young workers, the likelihood of the guarantee beingcalled is extremely small-the average real rate of return during the accumulation period would have todrop to less than 0 percent (approximately 3 percent below projected wage growth). For workers in theirthirties, the risk of the guarantee being called is also low-the average real rate of return duringaccumulation would have to be lower than 1.2 percent. By contrast, workers in their mid-forties pose ahigher risk to the Guarantee Fund, as the guarantee will be triggered if the average real return falls below4.8 percent-an outcome that cannot be dismissed.
Policymakers may want to consider certain measures to make the system more robust and tominimize the implicit risk to the state budget. First, the Guarantee Fund must be prepared to honor theguarantees. This is especially true for those workers in the 40 to 47 age group, who will be retiring in2013 to 2020 period. Ensuring the ability to honor the guarantees entails elaborating detailed scenarios to
1l The calculations presented here assume that pension benefits from the PAYG and Pillar I will be adjusted annually using theso-called Swiss formula, which gives equal weight to wage and price changes. However, given the demographic deteriorationexpected during the next decades, it is unlikely that today's young workers would benefit from this more generous indexationformula. The PAYG will most probably only be able to afford protection against price increases. This would further reduce theinternal rate of return in the PAYG system, thereby making the funded pillar even more attractive.
48 Hungary - On the Road to the European Union
determine whether the Guarantee Fund's reserves will be sufficient or whether some increase inmembership fees will be needed. Second, the regulatory framework may need to be further improved,especially regarding the frequency and rules of asset valuation, the methodology for calculating minimumreturns, and the constitution of minimum reserves. In particular, capital gains and losses should be fullyreflected in the individual accounts, minimum returns (currently defined as 85 percent of the averagereturn of long-run Government securities) should be assessed over a long period of time (e.g., a 36-monthrolling period), and the minimum reserves should be constituted by the asset manager, not the pensionfund. Finally, the supervision agency should be strengthened; and it should work closely with theinsurance and the capital market supervisions, since pension funds typically outsource their activities toservice providers, which are in the same financial group but are supervised by other agencies.
CHALLENGES IN THE HEALTH SECTOR
Needfor Reform in the Health Sector
Hungary is facing a public health crisis with long-term and far-reaching implications for thepopulation, for the stability of public finances, and for the overall performance of the economy. Thedeterioration of the health status of the Hungarian population, particularly during the transition years, hasled to an increasing health gap between Hungary and the EU; and there are signs that this gap iswidening.2 As shown in Figure 2.3., life expectancy and the burden of disease in Hungary are among theworst in Europe. Life expectancy is six years below the EU average life expectancy and is the lowest inthe OECD.'3 This health gap is largely the result of a rapid increase in premature death,disproportionately affecting men in their productive years. Today, male mortality is more than twice whatit was 30 years ago. Hungary's high mortality rate is predominantly due to chronic diseases associatedwith unhealthy lifestyles, as well as occupational and environmental risks. Compared to the EU, each dayan extra 100 people die in Hungary from avoidable causes, such as smoking, unhealthy diets, and a lackof adequate preventive health services.
The widening health gap between Hungary and the EU is worrisome, particularly taking intoaccount that Hungary has spent between 8 and 10 percent of its GDP on health-a level of spendingcomparable to the EU average. The deteriorating health status of the population not only generatesadditional pressures on health care spending, but also drives other direct and indirect costs associatedwith the decline in productivity of the work force. On average, each Hungarian worker is absent fromwork 16.5 days annually, compared to 5.2 and 5.5 days for workers in the U.S. and the Netherlands,respectively; such high levels of absenteeism are equivalent to more than 60 million lost work days peryear. In addition, this leads to large sickness payments by the Health Insurance Fund (HIF), amounting toalmost US$200 million per year. The loss in labor market productivity is estimated at US$840 million peryear (1.7 percent of GDP), and the foregone income from avoidable mortality and morbidity is estimatedat US$614 million per year (1.2 percent of GDP).
12 The gap is also rising between Hungary and other CEE countries. See World Health Organization (1997), and OECD (1999).
13 See Expert Consultative Group (1998).

Chapter 2. A Fiscal Framework for Sustained Growth 49
Figure 2.3: Comparative Disease Burden(mortality per 100,000 population)
1200 -
1000-
800
600-
400-
200- J
Hungary CEE Europe EU
EChron. Liver D. & Cirrhosis CCancer of Resp. Syst. WCaerebrovascular D.
*Ischaemic Heart D. ECirculatory System D.
Source: World Bank (1993), and staff estimates
While the health status of the population is poor, public health care spending is high. As shown inTable 2.7, health care spending almost doubled during the first half of the 1990s-from5.7 percent ofGDP in 1989 to 10.8 percent of GDP in 1994. Health expenditures have declined since 1995, both as ashare of GDP and as a share of total public expenditures. This decline was not the result of efficiencymeasures, but rather of a sharp wage compression and postponement of needed investments. The lowsalaries in the health sector have led to a rapid increase in under-the-table payments to medicalprofessionals,"4 while the lack of investment has caused a deterioration of health infrastructure (hospitalsand medical equipment). The benefits package, however, remains generous, and pharmaceuticalexpenditures are rapidly increasing.
Table 2.7: Health Expenditures, Total and Public Sector, 1991-981989 1991 1992 1993 1994 1995 1996 1997 1998
Total health expenditures (percent of GDP) 5.7 7.3 9.6 10.2 10.8 9.9 9.3 8.4 8.0Public sector health expenditures (percent of - - - 9.9 10.5 9.2 8.3 7.3 6.9
GDP)Public sector health expenditures (percent of - 12.8 16.5 18.2 18.8 17.9 18.4 17.0 13.7
total public expenditures)Source: Ministry of Finance and World Bank staff estimates.
Hungary's health care system has also experienced problems on the revenue side. Despite thereduction in public health expenditures by 2 percent of GDP between 1994 and 1998, the concomitantdrop in revenues has resulted in an HIF deficit equal to 0.7 percent of GDP. Revenue erosion can beattributed to reduction in the payroll tax, tax evasion, and underpayment-for example, annualcontributions of the self-employed are one fifth those of salaried employees in the formal sector.
Policymakers face the major challenge of improving health services and the health status of thepopulation while avoiding an explosion of expenditures and the emergence of large deficits. The current
14 Salaries of health care workers have been declining in real terms since 1991, and doctor's wages are today only one thirdhigher than average wages in the economy.
50 Hungary - On the Road to the European Union
institutional framework is not prepared to cope with this challenge. Although responsibility for healthcare provision has been transferred to local governments and to private general practitioners, localgovernments have little incentive to manage health resources, since 90 percent of local healthexpenditures are financed by transfers from the HIF and the central government. In addition, the centralgovernment guarantees the provision of health care, even in the event of insufficient RHF revenues.Performance of the HIF is hampered by an unclear mandate, by institutional overlaps, and by legalobstacles that prevent the fund from acting as a selective purchaser of services and a monitor of quality.
Because of the absence of a clear institutional and policy framework and of adequate incentives,the problems affecting the health system have persisted throughout the 1990s. Spending onpharmaceuticals has continued to increase (from 22 to 30 percent of total expenditures), despite severalattempts to curb its growth. There is still an overcapacity of hospital beds (nearly 30 percent higher thanthe OECD average), and an uneven distribution of equipment, beds, and medical personnel. Ineffectivehospital reimbursement systems (which pay hospitals on a fee-for-service basis) have led to rapidspending increases for high technology care (e.g., MRI and dialysis). They have also promoted highservice volumes and overbilling for costly procedures. There is evidence that hospitals manipulate thepayment system by misreporting diagnoses and procedures to inflate their revenues. The service networkis grossly unbalanced in favor of inpatient care and treatment by specialists.'5 At the same time, the sectorsuffers from a lack of long-term and nursing home care options, an undersupply of nurses, and adeclining budget for primary care and prevention. Furthermore, there are inequalities in service provision,with minorities suffering from a lack of access to the health system.
Health expenditures will face increasing pressure in the future, as a result of the aging of thepopulation, underinvestment in infrastructure and equipment, salary pressures from doctors and nurses,the need to address the health gap vis-a-vis the EU, and the increasing demand for higher-quality medicalcare. An emerging epidemiological profile characterized by chronic diseases, combined with ever-increasing treatment costs for an aging and chronically ill population, has the potential to lead to anexplosion in health expenditures.'6
The failure to contain the structural factors that drive inefficiency in the health sector poses aserious threat to public finances. The open-ended liability that the Government assumes in the sector, andthe importance of health in terms of overall public spending, make reforms necessary. In the absence ofreform (and keeping pharmaceutical expenditures, wages, and investments constant), annual HIF deficitswould remain at about 0.7 percent of GDP until 2010. Taking into account the likely increase inpharmaceutical expenditures, wages, and investments, annual IF deficits could increase to about 1.9percent of GDP by 2010. Deficits would increase sharply after that date, due to the projecteddemographic shock (caused by the retirement of the post-war baby boom generation and theaccompanying deterioration of old age and system dependency ratios).'7
Main Elements of Health Reform in Hungary
In early 1999, the Government proposed a number of far-reaching reforms in the health sectordesigned to improve the efficiency and quality of the system. The proposed reform would establish a
15 Hungary ranks first among 25 OECD countries in the number of specialists per 1000 population (2.7/1000). In contrast, theranking is 13 (0.7/1000) for general practitioners and 17 (6.2/1000) for nurses.
16 The elderly consume 3.5 times as many health services as the rest of the population, and the cost of the services they requireis considerably higher than average.
17 See Hollo, Long, and Papp (1998); and Jakab and Fidler (1998).
Chapter 2. A Fiscal Framework for Sustained Growth 51
health system that would include the following elements: (i) a basic but comprehensive health carepackage accessible to the entire population; (ii) a market for supplementary health insurance that wouldprovide additional services and improve quality; (iii) a single agency (the tax authority APEH)responsible for revenue collection and transfer of resources (on a risk-adjusted, capitated basis) toregional funds that may evolve as managed care organizations (MCOs); (iv) the regional funds wouldpurchase the basic care package for a defined population, using the capitated allocation from APEH andregulated copayments (MCOs may, at a later stage, assume the risk for delivering health servicesdirectly); (v) the regional funds and private insurance companies would offer supplementary insurancefor services outside the basic package; (vi) internal market mechanisms would be developed whereby theregional funds would purchase services from public and private providers that comply with minimumaccreditation criteria and standards for service delivery; and (vii) an independent supervisory andregulatory agency (superintendency) would be developed to ensure that the provided services meetquality and financial regulations.
The proposed health reform would create far-reaching changes in the regulation, financing, andorganizational arrangements of the health sector. These changes would take a number of years to be fullyimplemented, and require careful sequencing of reform steps. Each decision should weigh the fiscalimpact against the expected gains in terms of efficiency and improvements in the population's health.Inaddition, the prevailing low institutional capacity must be considered as a factor that might limit the scopeand speed of the reform. The following paragraphs discuss the key elements of the reform proposal,highlighting risks associated with the reform and focusing on those elements that are essential to thesuccess of the effort.
Develop a multi-level health insurance system that provides mandatory and universal access toa basic level of services, while creating a second pillar of supplementary health insurance. Theabolition of HIF's near-monopoly would allow for the development of regional (and eventuallycompeting) health insurance funds and should promote efficiency in the sector. Key elements of this partof the reform would include establishment of a superintendency, development of the basic package, awell-defined supplementary insurance policy, clearly defined copayment policies, and development ofreinsurance-type mechanisms that provide coverage against catastrophic risks.
Given the tight timeframe the Government has set for the reform (to be introduced by January 1,2001), it is advisable that it be carried out in two stages. In the first stage, the HIF would be split intoregional purchasers of a basic package of services, while private insurers would be encouraged to providesupplementary insurance covering other services. In the second phase, the Government may wish toconsider the pros and cons of allowing regional health care organizations to gradually compete formembers, thus allowing individuals to choose their insurer. It is important to clearly define the ownershipstructure of the newly formed managed care organizations, and the sequencing by which competitionwould be introduced.
Gradually introduce market forces to drive efficiency gains and improve quality. Increasingcompetition among providers through implementation of the purchasing function should lead to areduction in the sector's excess capacity (estimated at 30 to 40 percent); and should encourage providerorganizations to improve clinical quality and customer focus within their organizations.The purchasingagencies would pay selected providers through performance-based remuneration (capitation, DRG, pointsystem), with strict surveillance and control over the quality and quantity of services provided and overhealth outcomes. The purchaser would strive to promote competition among providers and increaseconsumer choice, while at the same time keeping the risk pool intact. The specific service improvementsto be generated by the introduction of purchasing include: (i) reduction in the average length of stay, to beachieved by replacing inpatient care with ambulatory services and reducing unnecessary care; (ii)rationalization of health care infrastructure and human resources through selective contracting; and (iii)

52 Hungary - On the Road to the European Union
reduction in the burden of disease and disability by focusing on national health priorities and strategicgoals (set by the Ministry of Health, MoH).
On the provider side, the pursuit of greater efficiency would be facilitated by the development ofa pluralistic (public/private, for-profit/nonprofit) provider network. Within a strongly regulatedframework, such providers (both physicians in private practice and health care institutions) must be freeto introduce changes in staffing and intemal budgetary allocations to meet the demands of the purchasingagencies, and to provide a defined benefits package to the population. In order for this system to functioneffectively, health workers should be employees, not public servants.
The effectiveness of these changes would depend on a number of critical aspects. Theintroduction of selective contracting among providers would create incentives for them to improveefficiency and quality, reduce hospital overcapacity of acute-care beds, increase allocations to primaryhealth care services and reduce reimbursement fraud. Nonetheless, it is critical that the reimbursementsystems, such as DRGs and the ambulatory point system, be modified to reflect the changing paradigm inthe health system. Failure to implement selective contracting or to modify the mechanisms to payproviders would severely limit efficiency gains in the proposed system. In addition, the regional fundsand MCOs should receive the budgetary transfers for investment costs in plant and equipment that arecurrently transferred from the MoH to providers.
Develop a comprehensive health policy framework, including regulation, priority sefting, andpolicymaking. The weak regulatory capacity of the MoH and its failure to establish an integral nationalhealth policy impede the current system and pose an important threat to reform. Under the proposedreform, the role of regulating managed care organizations and private providers would be an essentialelement to ensure equity and access to the basic package. The MoH must be responsible forpolicymaking, priority setting, and regulation, while focusing on establishing strategic direction for thesector, monitoring overall sector performance, and holding other actors accountable for meeting policyobjectives."8 The MoH must also promote an appropriate legislative agenda to support public healthpriorities and build consensus for political action. The key policy instruments that need to be developedinclude epidemiological surveillance, data management for decisionmaking, and human resourcesspecialized in public health and health management. The Government should also place considerableemphasis on establishing a regulatory framework, creating institutional capacity to regulate the insurancesector and health care providers, defining national health priorities, and translating health priorities intopurchasing strategies for health insurance plans. Such an agenda would require substantial changes to thecurrent role of the MoH in health financing and provision.
Increasing the accountability and transparency of local government financing and provision ofhealth care services. The failure to enforce budget caps for municipal government financing of healthcare services has a detrimental effect on budgetary discipline. Cost overruns by municipal hospitals, andirrational investments and staffing policies contributeto HIF deficits, but have little impact on the healthof the population. In the context of a reformed system, the role of municipal governments in healthfinancing and provision must be addressed in order to improve financial discipline and increase theautonomy and management capacity of provider organizations. The reform must include incentives formunicipal governments to reduce overcapacity in the sector and to strengthen local hospital management.
18 This would be achieved through a National Health Plan (NHP) produced annually by the MOH, which would lay out the keyhealth targets and monitoring indicators. Several countries are producing NHPs, including the United Kingdom and NewZealand. The financing agency needs to ensure that overall allocation is in accordance with the NHP, and articulating agenciesneed to base their their purchasing strategy on the NHP.

Chapter 2. A Fiscal Frameworkfor Sustained Growth 53
Ensuringfi nancial sustainability by improving revenue collection. While the reforms detailedabove are meant to control expenditures and to increase value for money in the health care system, theGovernment will also have to improve revenue collection. The first dimension of change focuses onimproving the revenue-generating capacity of the health insurance system. Although the recent transfer ofcollection responsibility from the HIF to APEH should produce efficiency gains, additional reforms areneeded to reduce evasion and underpayment, and to make revenue collection by the HIF more equitable.The main changes would be to collect more taxes from self-employed workers, reduce evasion by largeemployers, impose large fines on outstanding debts, and agree on debt repayment strategies with debtororganizations.
Future revenue increases must be achieved primarily through more efficient collection of payrolltaxes from existing contributors and improved collection from the self-employed. Currently, salariedemployees bear a disproportionate share of the burden, paying 87 percent of all HIF revenues andreceiving only 34 percent of the benefits. The absence of contributions from pensioners, and the relativelysmall contributions from the unemployed, students, and the self-employed (due partly to underreportingand evasion), undermine the solidarity-based social insurance concept and lead to increased deficits.Smaller SHF deficits and increased fairness across different insured groups could be achieved if the self-employed were subject to a contribution equal in proportion to that of salaried employees. CentralGovernment transfers should cover contributions for the elderly, students, and the unemployed in orderreduce the deficit and the burden on salaried employees. Furthermore, introducing Government transfersto cover health care benefits for pensioners, the unemployed, and students would make the system moreprogressive, allowing and allow for an additional reduction in payroll tax rates. However, this wouldrequire adjustments in the central budget in order to not increase the general Government deficit. Theissue of generous cash benefits and other entitlements offered by the RHF must also be addressed in thereformed system. Cash benefits should be gradually phased out or transferred to other budget lines.
The second dimension of increased revenue generation is to stimulate private financing through asupplementary insurance market, well-defined copayment policies, and increased private investment inhealth care infrastructure. While overall financing of the system would remain public through payrollcontributions and general revenues, policies to increase private financing could close the investment gap,lead to the development of more rational payment systems for medical professionals, and producesubstantial improvements in the quality of care.
Mitigating risk and limiting thefi scal cost of reforms. Although efficiency and quality gains arelikely, health reforms resulting in changes to the current health insurance scheme are not without risk. Alarge-scale health reform, as demonstrated in other countries, carries fiscal, logistical, administrative-and ultimately political-risks. It is particularly important that any changes include policy andoperational instruments that would explicitly limit the medium to long-term fiscal liabilitiesof the healthcare system. In addition, improving the capacity of the health care system to deal in a more cost-effectivemanner with an aging population that is burdened by chronic diseases would be key to mitigating theindirect fiscal liabilities. It is also critical to develop appropriate regulations to limit risk selection byprivate health plans, as well as to offset fiscal risks, in order to ensure equal access and improve thequality of care. Strategies to transfer financial risk from the Government's budget to the newly formedinsurance entities would help to ease the Government's burden of caring for the poor, the elderly, and theill. Substantial risks are associated with the potential increase in administrative expenditures. Experiencein other countries operating under competitive health insurance indicates that transaction costs andadministrative expenditures can be as high as 15 percent of contributions."9 Controlling marketing
19 The difference between the costs of public and private insurers is, however, frequently overestimated, because private coststend to be more explicit and transparent than public costs.
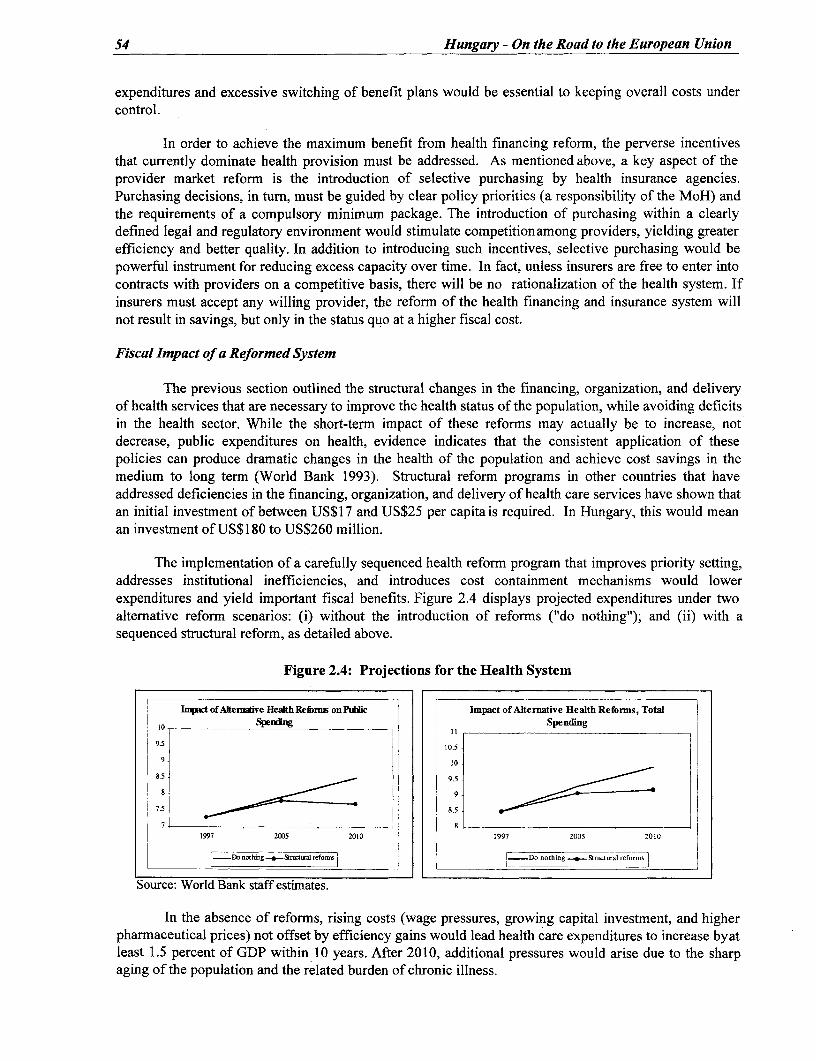
54 Hungary - On the Road to the European Union
expenditures and excessive switching of benefit plans would be essential to keeping overall costs undercontrol.
In order to achieve the maximum benefit from health financing reforn, the perverse incentivesthat currently dominate health provision must be addressed. As mentioned above, a key aspect of theprovider market reform is the introduction of selective purchasing by health insurance agencies.Purchasing decisions, in turn, must be guided by clear policy priorities (a responsibility of the MoH) andthe requirements of a compulsory minimum package. The introduction of purchasing within a clearlydefined legal and regulatory environment would stimulate competitionaamong providers, yielding greaterefficiency and better quality. In addition to introducing such incentives, selective purchasing would bepowerful instrument for reducing excess capacity over time. In fact, unless insurers are free to enter intocontracts with providers on a competitive basis, there will be no rationalization of the health system. Ifinsurers must accept any willing provider, the reform of the health financing and insurance system willnot result in savings, but only in the status quo at a higher fiscal cost.
Fiscal Impact of a Reformed System
The previous section outlined the structural changes in the financing, organization, and deliveryof health services that are necessary to improve the health status of the population, while avoiding deficitsin the health sector. While the short-term impact of these reforms may actually be to increase, notdecrease, public expenditures on health, evidence indicates that the consistent application of thesepolicies can produce dramatic changes in the health of the population and achieve cost savings in themedium to long term (World Bank 1993). Structural reform programs in other countries that haveaddressed deficiencies in the financing, organization, and delivery of health care services have shown thatan initial investment of between US$17 and US$25 per capita is required. In Hungary, this would meanan investment of US$180 to US$260 million.
The implementation of a carefully sequenced health reform program that improves priority setting,addresses institutional inefficiencies, and introduces cost containment mechanisms would lowerexpenditures and yield important fiscal benefits. Figure 2.4 displays projected expenditures under twoalternative reform scenarios: (i) without the introduction of reformns ("do nothing"); and (ii) with asequenced structural reform, as detailed above.
Figure 2.4: Projections for the Health System
Inmct ofAtternabive Heath RefLrnms on Puic Impact of Alternative Health Reforms, TotalSpeting Spending
9.5°- 1 10.5
9s 10
85. 9.5
75 8 8.5!
7 83 -1997 29D5 2010 1997 2005 2010
| _DD1) nothtng -o...&nosral n fon I (E...Do nothutg + Stmrctural reforms
Source: World Bank staff estimates.
In the absence of reformns, rising costs (wage pressures, growing capital investment, and higherpharmaceutical prices) not offset by efficiency gains would lead health care expenditures to increase byatleast 1.5 percent of GDP within 10 years. After 2010, additional pressures would arise due to the sharpaging of the population and the related burden of chronic illness.
Chapter 2. A Fiscal Framework for Sustained Growth 55
Misguided reforms can be cost ineffective. Empirical evidence suggests that the introduction ofcompeting health insurance funds without adequate regulation could lead to a sizable increase in totalhealth expenditures, with little or no improvement in the health status of the population.20 Most ofincrease would stem from increased administrative expenses (of up to 15 percent of total spending).Under conservative assumptions of risk selection by insurance companies, the impact on public spendingis even more striking. In this case, assuming that more than 60 percent of employed and self-employedworkers are enrolled in health insurance funds other than HIF by 2010, and assuming that the lower-income and chronically ill patients would be left to the public system, the deficit in the overall budgetattributable to the health sector would increase from 0.7 percent to more than 2 percent of GDP. Thelarge burden on public finances would stem from a sharp decline in IJF revenues, combined with only aminor reduction in health care spending, as those individuals that consume health care services in excessof the national average would remain in the public system due to their inability to payan actuarially fairpremium for health insurance.
The proposed gradual reforms, however, would introduce greater financial discipline and orientspending toward services that yield the greatest health gains for the population. After an initial increase inexpenditure (from 7.3 to 7.8 percent of GDP), due mainly to capital investments needed to repair andmodernize Hungary's deteriorated health facilities, public spending on health would remain nearlyconstant at 7.7 percent of GDP. Under this scenario, the efficiency gains would allow for a wageadjustment in the sector despite a likely increase in administrative costs.2 ' Due to private sector-ledsupplementary coverage, total health expenditures would increase to 9.2 percent of GDP by 2010.
Although the above estimates are preliminary, the scope for cost containment and greaterefficiency is supported by empirical evidence from reforms in other OECD countries.22 In fact, aconservative 10 percent efficiency gain achieved by realigning institutions and incentives would imply anannual stream of economic benefits of 0.7 percent of GDP. While some of the changes, such as the agingof the population and the epidemiological transition, are generally beyond the control of Hungarianpolicymakers, efforts to fine tune the financing, organization, and delivery of health services should leadto more effective utilization of limited resources while enhancing service quality and, ultimately,improving health outcomes.
LOCAL GOVERNMENT FINANCES IN THE CONTEXT OF EU ACCESSION
Local Government Finances in the First Half of the 1990s
Local government expenditures have accounted for roughly 20 percent of public sectorexpenditures and 35 percent of public sector investment. As shown in Table 2.8, locally raised taxrevenues over which localities have control have amounted to only 20 percent of total revenues, orroughly 3 percent of GDP. Local governments also receive a share of the personal income tax, based on
20 In this context, the secondary effects of the Czech health reform are illustrative. The introduction of a multiple payer systemhas resulted in higher salaries and more health care consumption, leading to a sizable increase in health expenditures (from 6 to 9percent of GDP). This increase, however, has not been accompanied by visible quality or productivity gains or by improvementsin the health of the population.
21 Administrative costs are assumed to increase from 4 to 8 percent of HIF revenues, due to improved supervision, someadvertising expenditures, and multiple layers of administration.
22 Some selected examples are: pharmaceutical reference pricing in Germany; tobacco legislation in the United States; hospitalcorporatization and purchasing reform in the United Kingdom; introduction of hard budget constraints for hospitalreimbursement in Austria; primary care reform in Spain; definition of benefit packages and risk adjusted capitation formulas inthe Netherlands.

56 Hungary - On the Road to the European Union
the amount collected within their jurisdiction, and 50 percent of the motor vehicle tax; butthese tworevenue sources yield only 11 percent of total local revenues. As a result, local governments dependheavily on transfers from other areas of the public sector to finance their expenditures. Transferscomprise a system of normative and earmarked transfers to cover current expenditures, as well as asystem of specific grants to finance investment.
Table 2.8: Local Government Accounts, 1993-98(percent of GDP)
1993 1994 1995 1996 1997 1998Total Revenues 16.1 15.9 13.6 13.0 12.8 12.0
Own current revenues 3.0 2.8 2.6 3.0 3.3 2.9Revenue sharing with Central Govt. 1.4 1.5 1.7 1.6 1.7 1.9Transfers from Central Govt. 7.7 7.3 5.7 5.0 4.3 4.2Transfers from other public sector 2.8 2.9 2.4 2.4 2.4 2.2Capital revenues 0.7 0.9 0.8 0.6 0.6 0.5Other revenues 0.5 0.5 0.4 0.4 0.5 0.3
Total Expenditures 17.2 17.4 13.9 13.0 13.1 12.7Current expenditures 13.5 13.7 11.5 10.9 10.5 10.2Capital expenditures 3.1 3.3 2.4 2.1 2.6 2.4Other expenditures 0.6 0.4 0.0 0.0 0.0 0.1
Balance -1.1 -1.5 -0.3 0.0 -0.3 -0.7Net Financing 0.5 1.0 0.2 0.3 0.3 0.4
Privatization revenues 0.2 0.3 0.5 0.7 1.0 0.5Net borrowing 0.3 0.7 -0.2 -0.4 -0.7 -0.1
Residual Balance -0.6 -0.5 -0.1 0.3 0.0 -0.3Memo item:Borrowing/borrowing cap (percent) 117.0 167.0 81.0 27.0 19.0 30.0
Source: Ministry of Finance and World Bank staff estimates.
Before 1996, transfers and own revenues, including borrowings, were insufficient to cover totalexpenditures. They resulted in residual deficits (Table 2.8) which were ultimately covered by the centralGovernment. During this period, some local governments also started to default on their debt and to callfor additional resources from the Central Government. This situation stemmed, in part, from an imbalancebetween expenditure responsibilities and revenue assignments, but also from the lack of transparency inthe use of public moneys, and from the fact that the Central Government is ultimately responsible formany local government obligations.
Recent Efforts to Introduce Transparency and Discipline
The stabilization program initiated in 1995 (chapter 1 and section 1 of this chapter) included threeelements that introduced greater discipline in the management of local government finances. First,transfers declined by around 3 percent of GDP, and efforts were made to improve and simplify thesystem of normative transfers. Second, annual borrowings by local governments were subject to a cap(equal to 70 percent of own revenues minus debt servicing costs). Finally, the Parliament enacted a localbankruptcy law that prevents bailouts by the Central Government, forbids the use of core localgovernment assets as collateral, forces local governments to negotiate with their creditors, and allows theCentral Government to appoint a commissioner to control local finances during bankruptcy proceedings.As shown in Table 2.8, these measures have resulted in a substantial reduction in current and capitalexpenditures and in the reduction of local government deficits. New borrowing has remained well underthe borrowing cap, and local governments have also made use of their privatization revenues to retire partof their debts.'
23 Their assets include the housing stock, companies established locally, and shares of state companies utilizing the land in theirterritory.
Chapter 2. A Fiscal Framework for Sustained Growth 57
Although local governments have been able to meet fiscal targets in recent years, there are alsoindications of inefficiencies in the delivery of public services and of strains in local finances. First, thereis still a systemic imbalance in the intergovernmental finance structure. Expenditure and revenueassignments are not well matched; the system of transfers creates inappropriate incentives, which leadmany local governments to claim additional deficit grants to manage financial difficulties. Although theamount of deficit grants has remained about HUF 7 billion in 1996 and 1997 (around 0.1 percent ofGDP), the number of local governments applying for such grants increased to almost 25 percent of allmunicipalities.
Second, fragmentation in the provision of services implies that economies of scale are notexploited, leading to high costs and poor quality services in many areas. There have been efforts topromote cost-effective service delivery through the creation of functional associations and regionaldevelopment units. Such associations are, however, constrained by their limited legal status, and by theirinability to either collect own revenues or to receive grants from the state as a single entity. Roles andresponsibilities of the different levels of regional development are still unclear; this creates problems ofcoordination and undermines efficiency in service delivery.
Third, although it is true that local expenditures have declined as a share of GDP in response tothe decline in transfers and the tighter borrowing constraints, it is unlikely that expenditures can bemaintained at their current level. This is because the amortization of local assets has not been properlyincorporated in local spending decisions, because the renewal of assets has been repeatedly postponed,and because there are substantial additional investment needs.24
Policy Options in the Light of EU Accession
The Government must identify the best set of policies to guide the operations of localgovernments, in view of the need to rebuild and improve local infrastructure (sewage systems, watertreatment, roads, hospitals), and the need to prepare the economy for integration with the EU. AchievingEU membership will give Hungary access to structural funds that could amount to about 2 percent ofGDP every year. Although access to these funds would substantially increase the scope for rebuildinglocal infrastructure, it is essential that local governments have the capacity to meet the cofinancingrequirements. These requirements, at about 20 percent, imply that local governments will need tocontribute an additional 0.5 percent of GDP to infrastructure projects in order to utilize the EU'sstructural funds.
If local governments are able to develop their own revenue sources, the cofinancing requirementscould be partially met from these sources. Any remaining cofinancing needs would have to be met fromadditional transfers from the Central Government or from borrowings. In any case, there is a clear need todevelop the capacity of local governments to generate and to manage a larger volume of resources. Inorder to strengthen this capacity, the Government may consider adopting the following policies:
First, the Central Government needs to further clarify the role of the intermediate tiers, such asregions, counties, and associations. Expenditure assignments need to be specified more precisely; andinconsistencies concerning local government and sectoral legislation (health, education) need to beremoved, thereby clarifying where decisionmaking lies. If the Government chooses to support thedevelopment of municipal associations, it needs to allow such associations to act as legal entities,collectrevenues, and receive grants. Multi-county and county development organizations can also perform the
24 As an illustration, in the health sector, in which a majority of hospitals are owned by local governments, the stock of buildingsneeding renovation or replacement was an estimated HUF 140 billion at the end of 1997 (the equivalent of 1.7 percent of GDP).
58 Hungary - On the Road to the European Union
important function of managing EU funds, but their programming and implementation capacity should beimproved.
Second, local governments need to further develop their capacity to generate revenues from localsources. Introducing a value-based property tax and implementing a gradual upward revision of thevehicle tax rates for large cars could significantly boost local revenues. Personal income tax (PIT)sharing currently allocated by origin might be replaced by a PIT surcharge system. There is also scope forraising more revenues from the business tax by having the tax implemented by a wider range ofsubnationals. The property tax, the PIT surcharge, and the business tax are expected to gradually becomethe major sources of local revenues; this would increase the ratio of revenues subject to local discretion,and hence enforce local accountability.
Third, the Government may wish to pursue a more systematic approach to determining currentgrants, in order to ensure predictability and improve fiscal planning at the local level. The annual level oftransfers for current expenditures might be tied to macroeconomic benchmarks such as inflation and GDPgrowth, as in France, or determined as a fixed percentage of taxes, as in Japan. Moreover, the system forallocating current grants needs to be simplified and made administratively less burdensome. Equalizationgrants currently allocated through numerous parallel channels should be consolidated into a singleequalization fund designed to compensate imbalances across municipalities and regions.
Fourth, the mechanism for investment grants needs to be reviewed to ensure that it supportsnational priorities and equalization purposes. The system of investment grants remains fragmented. It hassubstantial administrative costs, and it creates incentives for localities to focus their efforts on obtaininggrants from the center as opposed to increasing their own revenues and improving budget management.One option for the Government would be to pool all the resources currently allocated to local investmentsinto a single investment grant mechanism. The improved cross-sectoral coordination (as a result ofGovernment Resolution 263/1997) has been a step in this direction. Limitations on which local entities orprojects will be considered for capital grants might be made more stringent, to ensure that selectedprojects are economically viable, and are of the highest priority.

3. FOREIGN TRADE AND CONTESTABILITY OFMARKETS
Achieving sustainable and rapid growth before and after accession to the EU will requiremaintaining strong export performnance. This, in turn, hinges critically on the ability of Hungarianfirms to compete in a single European market. By analyzing recent trends in trade patterns andexport performance, and by examining market access issues, this chapter gauges Hungary'sability to compete in a single market, and to identify the policy measures that could furtherbolster this ability.'
REORIENTATION OF FOREIGN TRADE TOWARD MARKET-DRIVEN PATTERNS
The demise of central planning, coupled with the rapidly declining Soviet capability tosustain "soft" settlements in intra-CMEA trade, provided the catalyst for a reorientation ofHungary's commercial relations. In the second half of the 1980s, the combination of the fallingoil price in intra-CMEA trade and cuts in Soviet deliveries encouraged CMEA members torestrain exports to the FSU and increase exports to hard currency markets. This heralded a returnto trade patterns determined by economic, rather than political, considerations. The share offormer CMEA trade in Hungary's total foreign trade fell from 60 percent in 1986 to 42 percent in1989 and to 22 percent in 1991.
The challenge of readjusting trade patterns in the early 1990s proved formidable. In theprevious two decades, the competitiveness of Hungarian exports to Western markets haddeclined. Indeed, many Hungarian firms had operated in "soft" CMEA markets devoid ofcompetition and dominated by products of poor quality. Furthermore, the shift to convertiblecurrencies in CMEA trade, combined with a rapidly falling import demand in the FSU, causedsignificant deterioration in Hungary's termns of trade, mainly with the FSU.
Hungary has successfully met these challenges. After experiencing a 5 percent drop intotal exports in 1991 and another 13 drop 1993, Hungary increased its volume of exports by 17percent in 1994, to a level exceeding that of 1989. Since that time, exports have continued torapidly increase, with the share going to developed countries rising to about 70 percent. Changeson the import side were even more pronounced. As a result, the process of geographicreorientation to market-driven patterns of foreign trade was quickly achieved.
Given their proximity and high GDP, the EU countries have quickly become Hungary'slargest trading partners. In 1989, the 15 EU countries (including the countries that would join theEU in 1995) accountedfor 34 percent of Hungary's total exports; this figure rose to 50 percent in1991. Following the entry into force of trade provisions of the European Agreements (EA) in
lThis chapter focuses mainly on manufacturing; agriculture is the subject of Chapter 9.
59
60 Hungary - On the Road to the European Union
1992, this share rose to more than 70 ercent in 1997. This suggests a massive reorientation ofHungary's exports toward EU markets.
INTEGRATION INTO EU MARKETS: EXPORT PERFORMANCE
The scope and depth of a country's integration into EU markets for goods offer importantinsights about the ability of its firms to compete in a single market. With the share of EU in itstrade turnover amounting to around two thirds, Hungary is actually more integrated into the EUthan a number of EU-members themselves. Note that the average ratio of inter-EU trade toexternal trade was 61 percent in 1990-96.3 This integration took place as competition fromimports from EU suppliers became more intense: since 1995, tariffs on industrial products havebeen slashed by 15 percent annually, and will be zeroed in 2001.4 It thus appears that Hungarianfirns have so far been quite successful in a more competitive environment.
An interesting question for the future concerns the ability of Hungarian firms towithstand competitive pressures from a single market. A deeper analysis of Hungary's exportperformance in EU markets since the beginning of the transition can offer an answer.
Expansion of Exports to the EU: Two Phases
One can distinguish two different phases in Hungary's exports to the EU: 1989-92 and1994-97. During the first phase, the expansion in exports to the EU, triggered by the collapse offorner CMEA markets and the liberalization of both imports and the exchange rate regime, weredriven mainly a redirection of manufactures exports to Western markets. Most of these were EUmarkets. The value of exports to EU countries increased by 76 percent between 1989 and 1992.5This expansion, however, lost steam in 1993, at which time the value of EU-oriented exports fellby 12 percent (see Table 3.1).
In the late 1980s, the FSU accounted for approximately 40 percent of Hungary's totalexports of machinery and transport equipment, whereas the EU accounted for 10 percent.6 Theseratios were almost reversed, however, by 1991, when the EU's share reached about 35 percentand that of the FSU had fallen to 19 percent. In 1992, the share of the FSU fell further, to 16percent.
2 Total exports are as reported in Hungarian official statistics. Exports to the EU are derived from EU import statistics.In order to account for differences due to c.i.f./f.o.b. (cost of insurance and freight/free on board) conventions, the valueof imports from the EU as reported by Hungary was corrected by annual growth rates of EU imports from Hungary asreported by the EU. This approach may overstate the share of EU-oriented exports, since some exports (e.g., those dueto outward processing) were not accounted for in the Hungarian statistics, thus understating the value of total exports.
3Author's calculations from data in UN COMTRADE database.
4 The share of EU industrial products in total industrial imports for which Hungary eliminated duties in 1992 wasaround 30 percent. These were mainly products not produced domestically. In 1999 most industrial products from theEU are no longer subject to tariffs.
S This analysis is based on mirror statistics; i.e., data on Hungarian exports and imports as reported by its EU tradingpartners to the UN COMTRADE database.
6 Calculations are based on data reported by Hungary to the UN COMTRADE database.
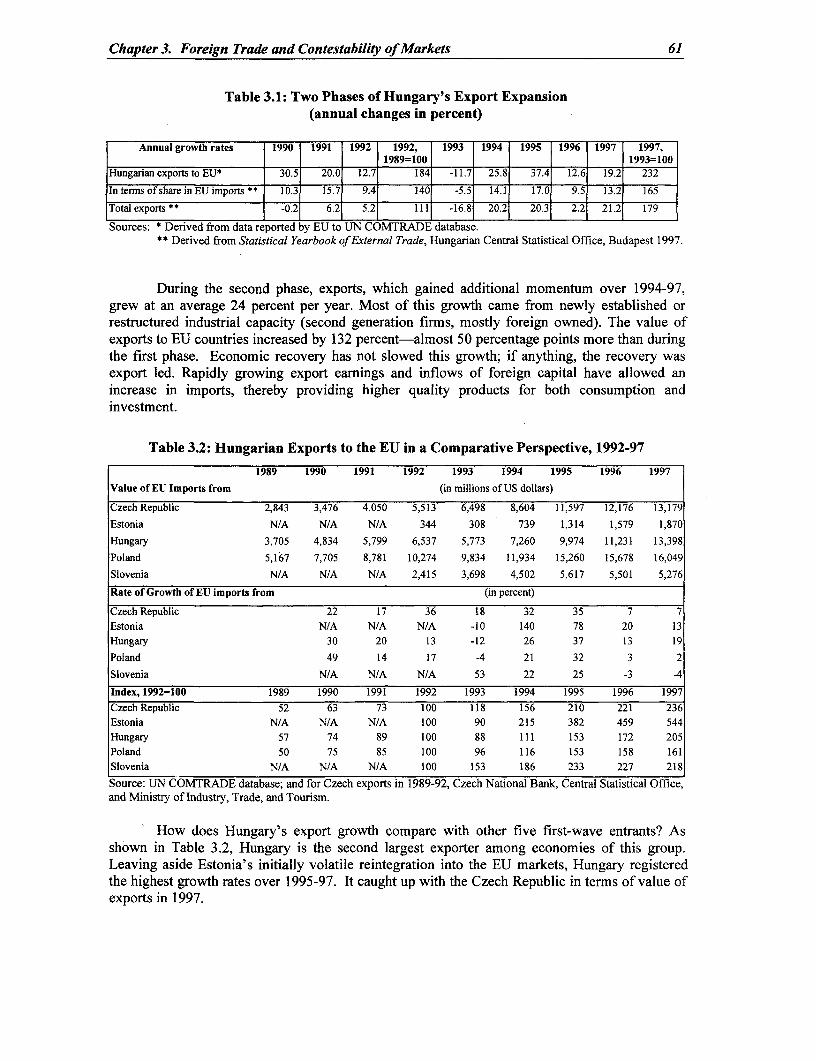
Chapter 3. Foreign Trade and Contestability of Markets 61
Table 3.1: Two Phases of Hungary's Export Expansion(annual changes in percent)
Annual growth rates 1990 1991 1992 1992, 1993 1994 1995 1996 1997 1997,1989=100 1993=100
Hungarian exports to EU* 30.5 20.0 12.7 184 -11.7 25.8 37.4 12.6 19.2 232
In terms of share in EU imports * 10.3 15.7 9.4 140 -5.5 14.1 17.0 9.5 13.2 165
Total exports ** -0.2 6.2 5.2 111 -16.8 20.2 20.3 2.2 21.2 179
Sources: * Derived from data reported by EU to UN COMTRADE database.** Derived from Statistical Yearbook of External Trade, Hungarian Central Statistical Office, Budapest 1997.
During the second phase, exports, which gained additional momentum over 1994-97,grew at an average 24 percent per year. Most of this growth came from newly established orrestructured industrial capacity (second generation firms, mostly foreign owned). The value ofexports to EU countries increased by 132 percent-almost 50 percentage points more than duringthe first phase. Economic recovery has not slowed this growth; if anything, the recovery wasexport led. Rapidly growing export earnings and inflows of foreign capital have allowed anincrease in imports, thereby providing higher quality products for both consumption andinvestment.
Table 3.2: Hungarian Exports to the EU in a Comparative Perspective, 1992-97
1989 1990 1991 1992 1993 1994 1995 1996 1997
Value of EU Imports from (in millions of US dollars)
Czech Republic 2,843 3,476 4,050 5,513 6,498 8,604 11,597 12,176 13,179
Estonia N/A N/A N/A 344 308 739 1,314 1,579 1,870
Hungary 3,705 4,834 5,799 6,537 5,773 7,260 9,974 11,231 13,398
Poland 5,167 7,705 8,781 10,274 9,834 11,934 15,260 15,678 16,049
Slovenia N/A N/A N/A 2,415 3,698 4,502 5,617 5,501 5,276
Rate of Growth of EU imports from (in percent)
Czech Republic 22 17 36 18 32 35 7 7
Estonia N/A N/A N/A -10 140 78 20 13Hungary 30 20 13 -12 26 37 13 19
Poland 49 14 17 -4 21 32 3 2
Slovenia N/A N/A N/A 53 22 25 -3 -4
Index, 1992=100 1989 1990 1991 1992 1993 1994 1995 1996 1997
Czech Republic 52 63 73 100 118 156 210 221 236Estonia N/A N/A N/A 100 90 215 382 459 544
Hungary 57 74 89 100 88 111 153 172 205Poland 50 75 85 100 96 116 153 158 161Slovenia N/A N/A N/A 100 153 186 233 227 218
Source: UN COMTRADE database; and for Czech exports in 1989-92, Czech National Bank, Central Statistical Office,and Ministry of Industry, Trade, and Tourism.
How does Hungary's export growth compare with other five first-wave entrants? Asshown in Table 3.2, Hungary is the second largest exporter among economies of this group.Leaving aside Estonia's initially volatile reintegration into the EU markets, Hungary registeredthe highest growth rates over 1995-97. It caught up with the Czech Republic in terms of value ofexports in 1997.
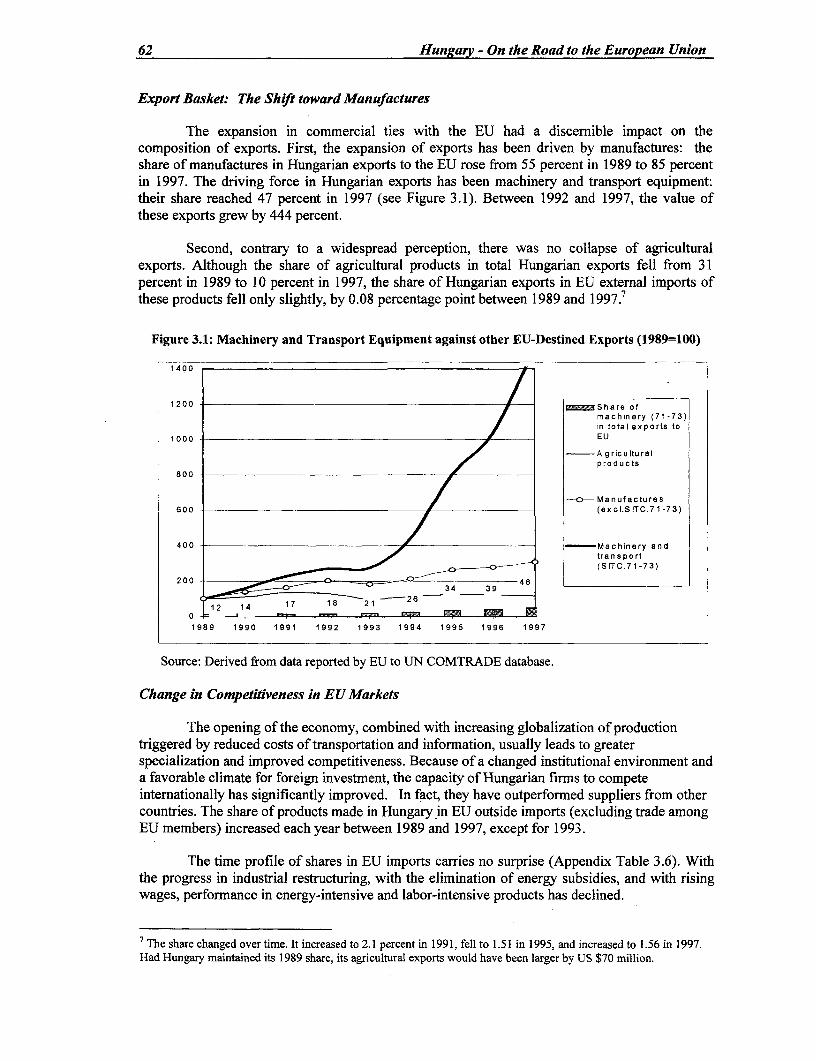
62 Hungary - On the Road to the European Union
Export Basket: The Shift toward Manufactures
The expansion in commercial ties with the EU had a discernible impact on thecomposition of exports. First, the expansion of exports has been driven by manufactures: theshare of manufactures in Hungarian exports to the EU rose from 55 percent in 1989 to 85 percentin 1997. The driving force in Hungarian exports has been machinery and transport equipment:
*their share reached 47 percent in 1997 (see Figure 3.1). Between 1992 and 1997, the value ofthese exports grew by 444 percent.
Second, contrary to a widespread perception, there was no collapse of agriculturalexports. Although the share of agricultural products in total Hungarian exports fell from 31percent in 1989 to 10 percent in 1997, the share of Hungarian exports in EU external imports ofthese products fell only slightly, by 0.08 percentage point between 1989 and 1997.7
Figure 3.1: Machinery and Transport Equipment against other EU-Destined Exports (1989=100)
01400.
1 2 0 0 Et** -Share ofi / ~~~~~~~~~~~~~~~~~~~~machinery (71-73)l / ~~~~~~~~~~~~~~~~~~~~~~~~in total exports to
Agriculturalprod ucts
800
-- o-- Manufactures600 (excl.SITC.71-73)
40 0 -Macnery rttranlsport(SITC.71-73)
200 <
1989 1990 1991 1992 1993 1994 1995 1996 1997
Source: Derived from data reported by EU to UN COMTRADE database.
Change in Competitiveness in EU Markets
The opening of the economy, combined with increasing globalization of productiontriggered by reduced costs of transportation and information, usually leads to greaterspecialization and improved competitiveness. Because of a changed institutional environment anda favorable climate for foreign investment, the capacity of Hungarian firms to competeinternationally has significantly improved. In fact, they have outperformed suppliers from othercountries. The share of products made in Hungary in EU outside imports (excluding trade amongEU members) increased each year between 1989 and 1997, except for 1993.
The time profile of shares in EU imports carries no surprise (Appendix Table 3.6). Withthe progress in industrial restructuring, with the elimination of energy subsidies, and with risingwages, performance in energy-intensive and labor-intensive products has declined.
7 The share changed over time. It increased to 2.1 percent in 1991, fell to 1.51 in 1995, and increased to 1.56 in 1997.Had Hungary maintained its 1989 share, its agricultural exports would have been larger by US $70 million.

Chapter 3. Foreign Trade and Contestability of Markets 63
Hungary no longer seems to be the marginal supplier, highly vulnerable to vicissitudes inthe business cycle, as it was in the 1980s. The weight of Hungarian products accounting for morethan 5 percent of respective EU imports increased significantly: their share rose from 35 percentin 1989 to 44 percent in 1997 (Table 3.3). Another important indicator of Hungary's reducedvulnerability is the dramatic expansion of exports of manufactures whose share in EU imports isabove 5 percent: they represented 35 percent of total EU-oriented exports by 1997.
TOlbe 3.3: Significance of Hungarian Exports into the EU in 1989, 1993, and 1997
1989 1993 1997Number of product categories with a share in EU imports exceeding 100/ 27 25 29(4 digit SITC. Rev. 1)Value of exports (US$ million) 654 845 4,418
Share in total EU-destined exports (in percent) 17.65 14.64 33.0
Menorandum: share of exports of products with a share in EU impo 65 68 56below 5% in Hungarian EU-oriented exports (in percent) I _
Sources: Derived from SITC. Four-digit data as reported by the EU to the UN COMTRADE database.
Although some engineering products that outperformed other suppliers in EU marketswere already manufactured in 1989, the expansion did not consist merely in shipping more of theproducts already produced. Numerous changes in the nature and weight of these products, withwinners and losers, can be observed. As for agricultural products, Hungarian suppliers have beensuccessful in retaining and expanding their market share in some areas. All this points, again, toprogress in economic restructuring, competitiveness, and diversification.
Factor Intensities of EU-Oriented Exports over 1989-96
According to the Heckscher-Ohlin Theorem, commodity trade patterns reflect differencesin comparative advantage, as determined by different factor endowments among countries. Acountry tends to export goods that use relatively abundant factors-an outcome of a competitivemarket mechanism efficiently allocating resources.
Considering Hungary's large pool of relatively low-cost labor and its moderate climatefavoring agriculture, one would expect dominance of labor-intensive and natural resource-intensive products. Adding to that an abundance of highly skilled labor relative to Hungary'sGDP per capita, the human capital-intensive group should account for a sizable allotment withinlabor-intensive products.
Developments during the initial stages of the transition corroborate these expectations butwith some twists. The export expansion was initially driven mainly by unskilled labor-intensivemanufactures. The share of unskilled labor-intensive products reached a peak in 1993 and thenfell gradually to 17 percent by 1997; that is, to below the pre-transition level (Table 3.4). Theshare of human capital- intensive products increased sharply in 1994-95, and then again inl997.The share of natural resource- intensive products decreased, due mainly to the relative decline inexports of agricultural products.
Another development that seems to defy predictions based on Hungary's initial factorendowments is the steady growth in the share of technology-intensive products. Such products arecapital intensive, and capital is a scarce factor relative to labor. While one might expect that, inthe early period, some of the capital-intensive pre-transition firms could redirect their sales ofengineering products to EU markets, such expansion of sales was not likely to last long. This didnot happen in Hungary: the share of technology-intensive products has been steadily expanding,from 19 percent in 1989 to 44 percent in 1997. By contrast, it is interesting to note that Poland's

64 Hungary - On the Road to the European Union
share of equivalent products contracted over 1992-95, and that Slovenia's share remained flat.Clearly, Hungary's success in attracting high-quality flows of foreign investment has contributedto this outcome.
Table 3.4: Composition of Hungarian Exports to the EU,by Factor Intensity, 1989-97
Relative Factor Intensity Groups 1989 1990 1991 1992 1993 1994 1995 1996 1997
Natural resource intensive 46.2 41.5 39.3 34.1 30.8 28.9 25.1 21.9 16.5
Unskilled labor intensive 18.8 21.1 22.6 24.8 26.5 23.0 19.2 19.3 17.1
Technology intensive 19.3 - 21.1 22.5 23.0 25.3 28.9 34.6 36.9 44.1
Human capital intensive 12.9 X 14.2 1 13.3 15.7 - 15.1 1 17.0 19.1 X 20.1 22.2
Source: Derived from the UN COMTRADE database, as reported by the EU.
As a result, low value-added natural resource-intensive products and unskilled labor-intensive products now account for only 34 percent of the Hungary export basket, while highvalue-added technology-intensive and human capital-intensive products command 66 percent.The dramatic acceleration of exports of engineering products, machinery, and capital equipmentover 1994-96 has been responsible for this change.
Indeed, calculations of Hungary's Revealed Comparative Advantage (RCA) indices inEU markets further bolster these observations.8 While both technology and human capital-intensive products were initially at a comparative trade disadvantage, that situation has reversed.The RCA index of skilled labor products first exceeded unity in 1990 and increased to 1.46 in1997 (Appendix Table 3.7). Although from a lower base, technology-intensive products haverecorded even more impressive gains. On the other hand, exports of natural resource-intensiveproducts have lost comparative advantage in these markets, while that of unskilled labor-intensiveproducts has been on the decline.
Changes in the Level of Processing
Hungary's export offer has moved toward capital and technology-intensive products, buthas it become higher value-added in terms of processing of commodities? To address thisquestion, we use a classification of 48 commodities developed by the World Bank for analyzingdifferent levels of processing.9
According to this classification, the share of primary and intermediate stage products in48 commodity chains has been declining since 1989, while the share of final stage products hassignificantly increased (Table 3.5). This shift toward final stage products has also been reflectedin shares of EU external imports. Taking the averages for 1989-92 and 1994-97, final stageproducts comprised the only group that increased its presence in EU markets. In fact, the share offinal stage products in EU imports increased spectacularly, by more than 30 percent between1989 and 1997.
8 A country's revealed comparative advantage in a product "j" is defined as the ratio of the share of "j" in the country'sexports to the share of the product "j " in world trade. A value for this index below unity indicates a comparativedisadvantage. If the index takes a value greater than unity, the country is considered to have a "revealed" comparativeadvantage in the product. In this particular case, Hungary has a revealed comparative advantage in a product if the shareof that product in Hungarian exports exceeds its share in EU imports.
9 The main processing stages are primary (unprocessed), intermediate (semi-fabricated), and processed. For instance,the primary stage of a vegetable chain consists of fresh vegetables, while the processed stage includes preservedvegetables.
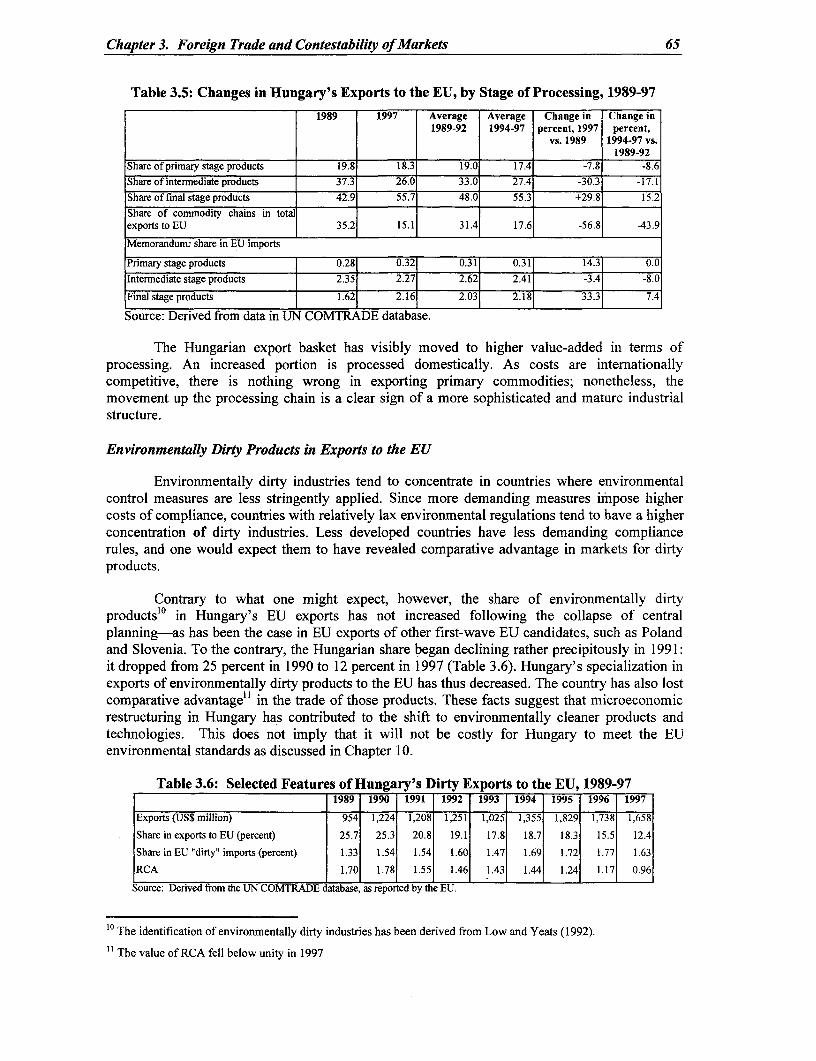
Chapter 3. Foreign Trade and Contestability of Markets 65
Table 3.5: Changes in Hungary's Exports to the EU, by Stage of Processing, 1989-97
1989 1997 Average Average Change in Change in1989-92 1994-97 percent, 1997 percent,
vs. 1989 1994-97 vs.1989-92
Share of primary stage products 19.8 18.3 19.0 17.4 -7.8 -8.6Share of intermediate products 37.3 26.0 33.0 27.4 -30.3 -17.1Share of final stage products 42.9 55.7 48.0 55.3 +29.8 15.2Share of commodity chains in totalexports to EU 35.2 15.1 31.4 17.6 -56.8 -43.9
Memorandum: share in EU imports
Primary stage products 0.28 0.32 0.31 0.31 14.3 0.0Intermediate stage products 2.35 2.27 2.62 2.41 -3.4 -8.0
Final stage products 1.62 2.16 2.03 2.18 33.3 7.4
Source: Derived from data in UN COMTRADE database.
The Hungarian export basket has visibly moved to higher value-added in terms ofprocessing. An increased portion is processed domestically. As costs are internationallycompetitive, there is nothing wrong in exporting primary commodities; nonetheless, themovement up the processing chain is a clear sign of a more sophisticated and mature industrialstructure.
Environmentally Dirty Products in Exports to the EU
Environmentally dirty industries tend to concentrate in countries where environmentalcontrol measures are less stringently applied. Since more demanding measures impose highercosts of compliance, countries with relatively lax environmental regulations tend to have a higherconcentration of dirty industries. Less developed countries have less demanding compliancerules, and one would expect them to have revealed comparative advantage in markets for dirtyproducts.
Contrary to what one might expect, however, the share of environmentally dirtyproductsl' in Hungary's EU exports has not increased following the collapse of centralplanning-as has been the case in EU exports of other first-wave EU candidates, such as Polandand Slovenia. To the contrary, the Hungarian share began declining rather precipitously in 1991:it dropped from 25 percent in 1990 to 12 percent in 1997 (Table 3.6). Hungary's specialization inexports of environmentally dirty products to the EU has thus decreased. The country has also lostcomparative advantage" in the trade of those products. These facts suggest that microeconomicrestructuring in Hungary has contributed to the shift to environmentally cleaner products andtechnologies. This does not imply that it will not be costly for Hungary to meet the EUenvironmental standards as discussed in Chapter 10.
Table 3.6: Selected Features of Hungary's Dirty Exports to the EU, 1989-971989 1990 1991 1992 1993 1994 1995 1996 1997
Exports (US$ million) 954 1,224 1,208 1,251 1,025 1,355 1,829 1,738 1,658
Share in exports to EU (percent) 25.7 25.3 20.8 19.1 17.8 18.7 18.3 15.5 12.4
Share in EU "dirty" imports (percent) 1.33 1.54 1.54 1.60 1.47 1.69 1.72 1.77 1.63
RCA 1.70 1.78 1.55 1.46 1.43 1.44 1.2 4 1.17 0.96
Source: Derived from the UN COMTRADE database, as reported by the EU.
0 The identification of environmentally dirty industries has been derived from Low and Yeats (I 992).
" The value of RCA fell below unity in 1997
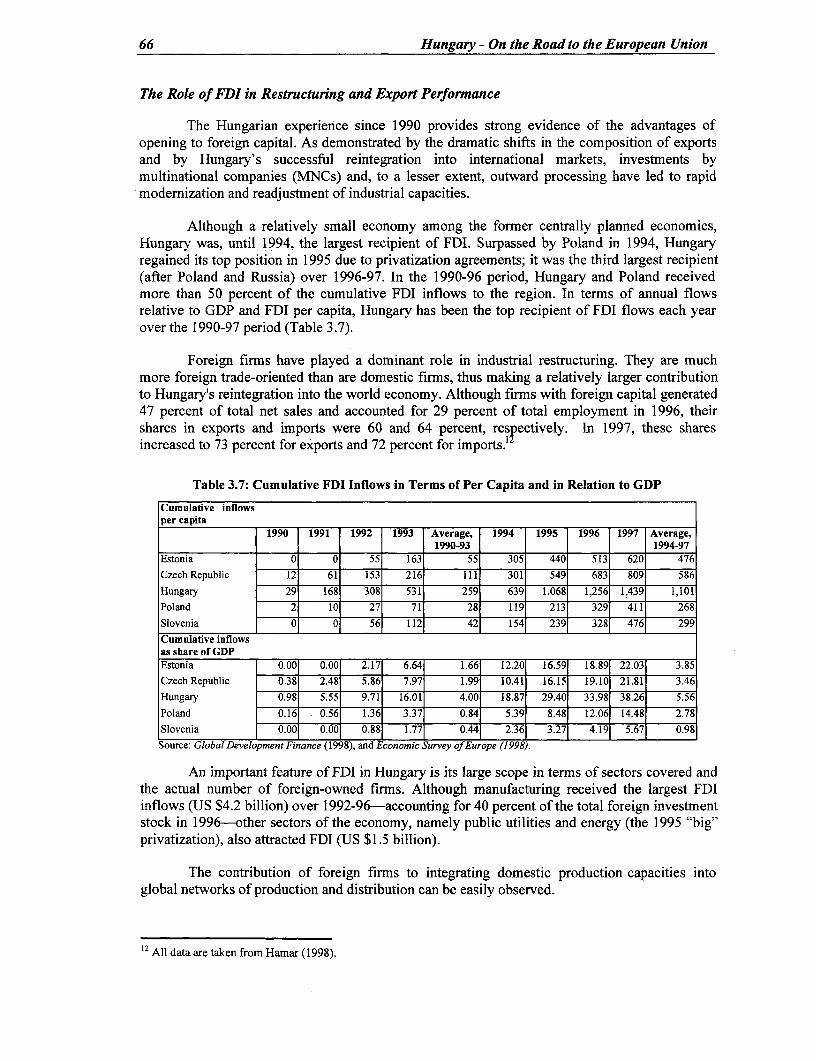
66 Hungary - On the Road to the European Union
The Role of FDI in Restructuring and Export Performance
The Hungarian experience since 1990 provides strong evidence of the advantages ofopening to foreign capital. As demonstrated by the dramatic shifts in the composition of exportsand by Hungary's successful reintegration into international markets, investments bymultinational companies (MNCs) and, to a lesser extent, outward processing have led to rapidmodernization and readjustment of industrial capacities.
Although a relatively small economy among the former centrally planned economies,Hungary was, until 1994, the largest recipient of FDI. Surpassed by Poland in 1994, Hungaryregained its top position in 1995 due to privatization agreements; it was the third largest recipient(after Poland and Russia) over 1996-97. In the 1990-96 period, Hungary and Poland receivedmore than 50 percent of the cumulative FDI inflows to the region. In terms of annual flowsrelative to GDP and FDI per capita, Hungary has been the top recipient of FDI flows each yearover the 1990-97 period (Table 3.7).
Foreign firms have played a dominant role in industrial restructuring. They are muchmore foreign trade-oriented than are domestic firms, thus making a relatively larger contributionto Hungary's reintegration into the world economy. Although firms with foreign capital generated47 percent of total net sales and accounted for 29 percent of total employment in 1996, theirshares in exports and imports were 60 and 64 percent, respectively. In 1997, these sharesincreased to 73 percent for exports and 72 percent for imports.1
Table 3.7: Cumulative FDI Inflows in Terms of Per Capita and in Relation to GDP
Cumulative inflowsper capita
1990 1991 1992 1993 Average, 1994 1995 1996 1997 Average,1990-93 1994-97
Estonia 0 0 55 163 55 305 440 513 620 476
Czech Republic 12 61 153 216 III 301 549 683 809 586
Hungary 29 168 308 531 259 639 1,068 1,256 1,439 1,101
Poland 2 10 27 71 28 119 213 329 411 268
Slovenia 0 0 56 112 42 154 239 328 476 299
Cumulative inflowsas share of GDPEstonia 0.00 0.00 2.17 6.64 1.66 12.20 16.59 18.89 22.031 3.85
Czech Republic 0.381 2.48 5.86 7.97 1.99 10.41 16.15 19.10 21.81 3.46Hungary 0.98 5.55 9.71 16.01 4.00 18.87 29.40 33.98 38.26 5.56
Poland 0.16 0.56 1.36 3.37 0.84 5.39 8.48 12.06 14.48 2.78Slovenia 0.00 0.00 0.88 1.771 0.44 2.36 3.27 4.19 5.671 0.98Source: Global Development Finance (1998), and Economic Survey ofEurope (1998).
An important feature of FDI in Hungary is its large scope in terms of sectors covered andthe actual number of foreign-owned firms. Although manufacturing received the largest FDIinflows (US $4.2 billion) over 1992-96-accounting for 40 percent of the total foreign investmentstock in 1996-other sectors of the economy, namely public utilities and energy (the 1995 "big"privatization), also attracted FDI (US $1.5 billion).
The contribution of foreign firms to integrating domestic production capacities intoglobal networks of production and distribution can be easily observed.
12 All data are taken from Hamar (1998).
Chapter 3. Foreign Trade and Contestability of Markets 67
* First, considering that they account for almost three fourths of Hungary's foreign tradeturnover, and that this share has been rapidly increasing, foreign firms are largely accountablefor the spectacular improvement in Hungary's export performance in EU markets. Indeed, thesuccessful development of a number of product groups can be easily traced to productionactivities of MNCs. These include, above all, automotive parts (Volkswagen and Audi pistonengines accounted for 9 percent of total EU-destined exports in 1996) and electronics.
* Second, there is abundant evidence suggesting a rapid progressive incorporation ofmanufacturing capacity located in Hungary into global production networks, usually of largemultinationals. Among medium and large firms in Hungary, there are no purely Hungarian-owned private companies. The top 100 Hungarian companies include a number of easilyrecognizable subsidiaries of multinational corporations' Furthermore, estimates of intra-industry trade suggest that the number of such companies is higher than in some EU members(e.g., Finland, Greece, and Portugal).
The experience with FDI in Hungary should, therefore, dispel fears that a preferentialtrading arrangement with the highly developed EU might lead to a catastrophic relocation ofdomestic industries.
Conclusion: A Demonstrated Capacity to Withstand Competition in a Single Market
The Hungarian economy has become tightly integrated into the EU; in terms of trade, asnoted above, it is even more integrated than some EU members. Contrary to some predictionsvoiced at the outset of the transition, reintegration into international markets has not confinedHungary to the status of mere supplier of low value-added raw materials. To the contrary, thetransition period has witnessed Hungary's growing specialization in increasingly sophisticatedengineering products.
Indeed, changes in the composition of Hungary's EU-oriented exports have been muchmore extensive than in other transition economies-indicating an advanced process of economicrestructuring. It appears that export growth has not been driven by marketing higher volumes ofolder products. Export offer has become more diversified. The share of high value-addedproducts has been increasing, while that of unskilled labor-intensive products has been declining.Contrary to what one might expect, the share of environmentally dirty products has also beendeclining.
The findings of this section empirically support the conclusion that Hungary's economyis well prepared to cope with the competitive pressures of a single market. The challenge facingHungary is to maintain conditions friendly to both foreign and domestic investment, and tomacroeconomic stability.
CONTESTABILITY OF DOMESTIC MARKETS
The openness of the economy to foreign investment and import competition determinesthe contestability of domestic markets. Contestability of domestic markets entails not only issues
13 See the top 100 list in The Wall Street Journal Europe's Central European Economic Review (July and August 1998)compiled by Dun & Bradstreet Hungaria Inc. Among the 20 largest firms in terms of sales, at least six companies arepart of large multinational corporations. These include IBM Storage Products (#2); Volkswagen's Audi HungariaMotor (#6); General Motor's Opel Hungary (7); Philips (#12); General Electric Lightning (#15); and Japan's MagyarSuzuki (#16). Many of the top 100are majority owned by multinationals (e.g., a white-goods producer LehelHutogepgyar, #39, which is owned by Sweden's Electrolux).

68 Hungary - On the Road to the European Union
of market access for products, as embodied in tariffs and narrowly conceived non-tariff barriers.It also encompasses the market access implications of domestic policies and(environmental andother standards, phytosanitary measures), as well as the conditions for/protection of foreigninvestment. Higher levels of contestability usually generate higher rates of economic growth andbetter export performance.
While Hungary has been a leader among transition economies in opening its industry andservices to foreign capital, it has been somewhat more hesitant in opening its foreign traderegime. As a result, there is a contrast between an unusually high degree of openness tointernational capital inflows, on one hand, and a less liberal approach toward goods inflows, onthe other. Considering Hungary's relatively small size and that it has already achieved a highdegree of openness-with foreign trade accounting for more than 40 percent of GDP-anargument can be made that Hungary would benefit enormously from unilateral liberalization.
Foreign Trade Policies: Gradual and Uneven Liberalization
The Collapse of Central Planning. State monopoly over foreign trade, together withcentral allocation of convertible currencies and the requirement to surrender hard currencyearnings, left little room for trade liberalization under central planning. With the dismantling ofcentral planning in 1987-88, the state monopoly over foreign trade was abolished. Nonetheless, incontrast to Poland's stabilization cum transformation program, liberalization of Hungary's foreigntrade and exchange rate regime was done gradually. It was to be implemented in 20 to 25 percentincrements over a 4-year period, beginning with liberalization of capital goods imports in 1989.With the erosion of central controls, the process was eventually accelerated. In 1990, rationing ofimports of intermediate goods was abandoned, as were quotas on a number of consumer goods,albeit perhaps somewhat reluctantly and not completely.
Nonetheless, the change in market access was enormous. In 1987, not a single sector wasopen to competition from imports (or for that matter, any competition at all), whereas by 1990,around 70 percent of domestic production faced external competition.
Liberalization through Regional Trade Agreements. Preferential trade agreementshave provided another powerful force for liberalizing the foreign trade regime. The two mostrelevant agreements are the European Agreements (EA) and Central European Free TradeAgreements (CEFTA),14 which envisage free trade for industrial products by the early 2000s.Imports of manufactures from the EU account for almost 74 percent of Hungary's totalmanufactures imports. Together with imports from CEFTA and EFTA, well over 80 percent ofimports will be tariff free in terms of 1996 imports.
EA. Since the EU is Hungary's largest natural trading partner, by far the most significantagreement was the EA, signed in December of 1991. The interim trade agreement, which wentinto effect on March 1992, eliminated duties on about one third of all industrial products importedfrom the EU-mainly imported inputs used by domestic industry. Beginning in 1995, however,Hungary's tariff concessions on industrial products went into effect: tariff rates on EU industrialimports are being slashed by 15 percent a year until 2001, when, with some minor exceptions,they will be zeroed on all industrial products.
14 The Central European Free Trade Agreement (CEFTA), signed in 1992, provides a framework for bilateralagreements among six states: the Czech Republic, Hungary, Poland, Slovakia, Slovenia (which acceded in 1996), andRomania (which did so in July 1997).

Chapter 3. Foreign Trade and Contestability of Markets 69
CEFTA. The tariff cuts introduced under CEFTA-sponsored bilateral agreements havegone further and faster than those under the EA.5 By 1997, already more than 90 percent ofHungarian tariff lines of industrial products had been tariff zeroed. (On industrial imports fromRomania, which did not join until July 1, 1997, this share is around 75 percent). For theremaining 10 percent of industrial products, including footwear, steel, paper, some rubberproducts, and vehicles, tariffs will be abolished on January 1, 2001. 16 Yet, CEFTA membersalready have preferential access, as rates are well below most-favored nation (MFN) tariff rates.They are now at 30 percent of MFN rates in trade with the Czech Republic, Poland, SlovakRepublic, Slovenia, and Romania. These tariff rates will decline further in 1999, and most ofthem will be zeroed by 2000.
Preferences are not limited to industrial products; they also entail agricultural tradegoverned by a set of multilateral preferences and supported by bilaterally agreed-upon tariff cuts.In all, agricultural preferences affect around 80 percent of Hungary's agricultural trade withCEFTA countries, which amounted to US$482 million in exports and US$97 million in imports.
Temporary Slippage in Trade Liberalization: The 1995 Stabilization Package. The1995 stabilization package included short-term measures designed to curb the twin fiscal andcurrent account deficits. These measures marked a temporary departure from the path of gradualliberalization in access to domestic markets, which has so far characterized Hungary's transition.The package included an extra 8 percent temporary surcharge on imports, except energy andmachinery. 7 In addition to the import surcharge, ad valorem customs and administrative fees-incompatible with WTO/GATT rules prohibiting the linkage of fees to the value of a shipmentcleared by customs-as well as a value-added tax of 25 percent, were levied on all imports; theeffective surcharge was thus significantly larger. The effective rate of surcharge reached its peakof 15 percent (on duty-free imports) in 1995 but subsequently declined until June 1997, when itwas abolished.8
Nontariff Measures. The pervasiveness of nontariff measures negatively affects foreigntrade. The non-tariff barriers (NTBs) coverage ratio-that is, the percentage of imports intoHungary subject to NTBs-amounts to 19.5 percent. By industrial country standards, this ratio isnot out of line (for the EU it amounted to 16.5 percent in 1994, before the WTO/GATT tariffregime for agricultural products was implemented). While NTBs are more prevalent in Hungarythan in the EU, the types of NTBs used are much less diversified. Hungary relies mainly onquantitative restrictions in the form of discretionary (non-automatic) licensing and quotas, bothtypes accounting for approximately 60 percent of NTB-affected imports.
The NTB-affected products include sensitive manufactures, such as textiles andgarments, some chemicals, steel, and cars. Hungary imposes two types of quantitative
15 More precisely, the CEFTA system has a multilateral and a bilateral component. The multilateral componentcomprises commonly agreed preferences, whereas the bilateral one comprises those negotiated bilaterally and notextended to all CEFTA members.
16 There are some exemptions. For instance, at the request of Poland, duties on automobiles will be zeroed a year later,on January 1, 2002.
17 The import surcharge was subsequently lowered to 7 percent (July 1996), 6 percent (October i996), 4 percent(March 1997), and 3 percent (1997). It was eliminated on July 1, 1997.18Hungary charged a 6 percent customs fee which was then reduced to 2 percent in 1996. On January 1, 1997, the feewas abolished on imports from WTO-member countries. Thus, the effective surcharge on duty-free imports was 15percent in 1995, 10.75 until October 1996, 9.5 percent until December 1996, 7.5 percent until March 1997, 5 percentuntil April 1997, and 3.75 percent through June 1997.

70 Hungary - On the Road to the European Union
restrictions: one is a uniquely Hungarian global quota on consumer goods; the other entailsimport licensing.
Global quota on consumer goods. Despite recent reductions, the list of products subjectto the global quota remains quite extensive. The quota was set at US$630 million in 1991 andsubsequently raised to US$750 million. With the removal of all agricultural products as a result ofthe Uruguay Round agreements, its value fell to US$518 million in 1995. The Governmentfurther reduced the coverage in 1998 and plans to gradually eliminate it over time, although nodeadline has been set. The global quota strikes one as a vestige of central planning. Its existencedates back to Hungary's accession to the GATT in 1973. As one Hungarian economist notes, "...
the global quota is the last remaining openly discretionary and outright protectionist element inHungary's foreign trade regime.,,19
Moreover, the quota seems to be a redundant instrument with little purpose. In somecases, one may explain quantitative restrictions in terms of political economy. This is likely inthe case of cars, where the desire to attract foreign direct investment during the early stages of thetransition overrode purely economic considerations.2 0 But maintaining quotas on jewelry orcanned fish cannot be so easily explained. A quick removal of the global quota would go a longway toward dealing with remnants of micromanagement in foreign trade.
Export and import licensing. A second tool of managed trade consists of licenses,which cover both exports and imports. For exports, the rationale for licenses is not always clear.Leaving aside arms and other products that threaten public safety, the list contains harmlessagricultural products, some metal ores, gold, and silver. Among agricultural products, goose andduck liver are subject to quotas imposed by the EU. But this does not appear to be the case forother products, such as durum wheat. Overall, around 6 percent of exports were subject to thenon-automatic license requirement in 1998.21
The list of products subject to non-automatic licensing is much more extensive on theimport side, although it directly affects a smaller percentage of imports22 The list contains fishand fish products, some chemicals, textiles and clothing, some wood products, footwear, preciousmetals, vehicles, and arms. Neither national security considerations (arms trade) nor theprotection of domestic producers appears to be the reason for maintaining licensing. On the latterpoint, for instance, caviar is not domestically produced. If import licenses are being imposed toadminister the global import quota, all the more reason to eliminate the global quota.
In all, while some products seem justifiably subject to controls (e.g., arms, hazardousproducts, national treasures), others do not. Their presence provides opportunities for rent-seekingactivities and may thereby unnecessarily complicate the political atmosphere.
Reverse Discrimination in Imports: Higher Cost to Producers and Consumers
Preferential trade arrangements always spur discrimination against suppliers from thirdcountries. Most favored nation tariff rates and other border charges levied on imports from non-preferential trading partners determine the level of discrimination. The potential for trade
19 Csaba (1996).
20 The elimination of the global quota may be problematic for certain goods because of agreements with multinationalcompanies.
21 Ministry of Foreign Trade, Industry, and Tourism (1998).22 ibid.

Chapter 3. Foreign Trade and Contestability of Markets 71
diversion from non-preferential to preferential trading partners increases with the magnitude ofthe preferential margin, that is, the difference between MFN and preferential tariff rates.
Since reductions in MFN tariff rates under the Uruguay Round proceed at a slower pacethan those under preferential agreements, the level of discrimination remains significant. Ameasure of this discrimination lies in the difference between a simple average MFN rate (8.2percent for industrial products) and a preferential rate. In 1997, for imports from the EU andEFTA countries, this difference was 6.2 percent. For founding members of CEFTA, the margin ofpreference was even higher, amounting to 7.3 percent. As a result, the average supplier from athird country is unable to market its products unless its cost is at least 6 percent lower than that ofan EU supplier, or 7 percent lower than the CEFTA suppliers.
The margins will remain substantial even when tariff concessions negotiated under theUruguay Round are phased in. Consider the following. When Hungary joined the WTO in 1995,it chose to bind its MFN tariff rates significantly higher than those of the EU. Average post-Uruguay Round weighted rates and bound rates on industrial products are both twice as high as inthe EU (Appendix Table 3.8).23 The largest absolute differences in MFN weighted rates are fortransport equipment (10.6) percent and non-electric machinery (6.1) percent. Leaving asideagricultural products, for which tariff levels are difficult to estimate, the absolute differences inbound rates between the EU and Hungary are slightly smaller.
The increase in the level of discrimination following both the implementation of tradecomponents of agreements with .the EU (March 1992) and the establishment of CEFTA (1993)has not led to a substantial increase of preferential partners in Hungarian imports. Their share intotal imports was relatively stable, averaging 70 percent over 1992-97. Thus, it would seem thatthere was none of the trade diversion that typically accompanies reverse discrimination.
Nonetheless, the tariff reverse discrimination should be reduced. Large margins usuallycontribute to higher import prices. This is especially true in markets for sophisticatedmanufactures, which are often dominated by two or three suppliers. If all of these suppliers werein preferential countries, competition among them would be sufficient to keep down the price.More often than not, however, there are also firms from third countries. If only one firm were inthe EU, the price paid by a Hungarian importer would likely be higher by up to the differencebetween the relevant MFN and preferential rates. In other words, an EU supplier (or theHungarian intermediary) obtains the rent at the expense of Hungarian users of imports. SinceHungarian MFN rates are higher than those in the EU, the reduction of the former to EU levelswould slash the rent to that implied by the level of protection in the EU. Moreover, the alignmentof MFN rate with those in the EU will bring market conditions in Hungary closer to those thatwould prevail when it becomes a full member of the EU.
TRADE POLICIES AND EXPORT PERFORMANCE
Hungary's foreign trade policy raises a question about its links to export performance.Empirical research strongly suggests that all development success stories over the past twodecades have been based on strong export orientation combined with low or falling barriers toimports.24 Hungary ,however, recorded its largest export expansion during the temporary reversal
23 Given significant changes in the composition of imports since 1989, the use of 1989 import figures to derive weightsfor tariffs raises objections. Rates weighted by more recent imports would probably be different. But since in 1996 thesimple average MFN tariff rate on industrial products was higher than that in the EU by the factor of 1.7 (8.7 versus 5.0percent), the general conclusion holds.
24 See Sachs and Warner (1995).

72 Hungary - On the Road to the European Union
in foreign trade liberalization following the 1995 adjustment program. It is also interesting toobserve that the export expansion began one year before the 9 percent devaluation of the forint.Hence, one might draw the conclusion that Hungary is an exception to the general rule.
Figure 3.2: Real Effective Exchange Rate and Developments in Foreign Trade, 1989-97(1989= 100)
170- _ _
160 l l l _
150 R _ _ _ _ / inReal Exports
140 _ _ _ _ _ _ _ _ _
130 - - i -0 -Real Imports
_ 120 - / / t + CPI real
_ 110- | re | | - effective
100 -_____ __ 1_ I__ exchange rate
90 _ = _
801989 1990 1991 1992 1993 1994 1995 1996 1997
Source: International Financial Statistics, and staff estimates.
One explanatory factor is that Hungary has, in fact, attracted foreign investors by keepingthem immune from the vagaries of its foreign trade policies. A duty drawback mechanism hasallowed exporters to disregard tariff rates on imports of inputs for exports; other provisions havemaintained duty exemptions on imports of capital equipment. If an investor wanted to avoidburdensome customs procedures, then there were de jure free trade zones located outside ofHungary's customs territory. Many investors have done so. The share of firms from free tradezones in total exports increased from 11 percent in 1995 to 19 percent in 1996 and to 26 percentin 1997.25 Together with outward processing, the share of exports generated from sourcesshielded from the vicissitudes of Hungary's foreign trade policy have amounted to 47 percent oftotal exports.26 This demonstrates that liberalism vis-a-vis foreign firms has significantlycontributed to the export expansion.
On the other hand, it seems that the foreign trade measures in the 1995 stabilizationpackage had a negative impact on the export response of small and medium enterprises. Importusers among such firms incurred losses because they pay more for imports. Although thedrawback mechanism allows them to recoup extra taxes on imports, this mechanism is costly touse and creates a considerable administrative burden in terms of processing information forcustoms. The transaction costs may be too high to warrant the extra effort involved in getting arefund on exported portion of imports. Thus, these arrangements are usually not attractive tosmall firms.
2 5 Author's calculations from data in Harnar (1998) and Ministry of Trade, Industry, and Tourism (1998).
26 The share of exports based on outward processing was 21 percent. See Ministry of Trade, Industry, and Tourism(1998).
Chapter 3. Foreign Trade and Contestability of Markets 73
CONCLUSIONS AND KEY RECOMMENDATIONS
Considering Hungary's spectacular export success in highly competitive EU markets,staying the course appears to be the best possible policy option for a pre-accession strategy.Indeed, economic reforms have established a business-friendly environment. Services providegood support for foreign trade activity. The banking sector appears to be strong. Inflation hasrecently fallen to a single-digit level and the policies in place ensure its continued decline.Finally, tariffs on imports of industrial products from preferential and MFN partners have beeneither reduced or eliminated.
The continued competitiveness of Hungarian firms, both domestic and foreign owned,ultimately depends on competition at home from imports and domestic sources alike. This, inturn, is critically dependent on a liberal trade and investment regime. Although Hungary has aliberal investment regime, conditions in market access are unnecessarily difficult for MFNsuppliers. The task of a good pre-accession strategy should be to liberalize the MFN foreign traderegime for industrial products and adopt the same tariffs as the EU for MFN industrial products.In addition, the authorities should reduce the scope of nontariff measures.
Nontariff measures. By the standards of Central European transition economies, theNTB coverage of imports in Hungary is high. The global quota on consumer products should beabolished. Its maintenance contributes to higher prices for import users by reducing competition;it also invites lobbying efforts for protection.
Furthermore, the Government should review products subject to non-automatic licensingin exports and imports. Items that do not meet the test of environmental hazard, national security,or preservation of cultural treasures should be removed from the list.
Tariff measures. Tariff rates on industrial products are substantially higher in Hungarythan in the EU. In order to ease adjustment to future membership and improve economic growthperformance during the pre-accession stage, Hungary should consider adopting the EU's(preferably post-Uruguay Round) MFN tariff schedule for industrial products. As a result, theaverage (simple) MFN tariff rate on industrial products would fall from around 8 to around 4percent.
This measure would have several advantages. It would level the playing field for MFNsuppliers to both Hungarian and EU markets. It is simple and easy to implement. There would belittle, if any domestic opposition from import competing sectors, which already face formidablecompetitors from the EU. Furthermore, the measure could counteract the threat of fading FDI asfree trade zones lose their attractiveness 27 Finally, it would require no formal notification to theWTO of change in statutory rates: Hungary could simply lower its applied rates to match those inthe EU without changing statutory and binding rates.
27 Hungary has adhered to the Pan-European system of cumulation of rules of origin, which removed all duty drawbackschemes by the end of 1998. Products from free trade zones will lose preferential access to Pan-European markets ifduties paid on imports of inputs are reimbursed. Pan-European markets include those in the EU, EFTA, NAFTA,Bulgaria, and the Baltic states.

4. FINANCIAL SECTOR DEVELOPMENT
INTRODUCTION
Among transitional countries, Hungary has been at the forefront of financial sector reform, andtoday it has one of the most developed financial systems in Central and Eastern Europe. Banks andinsurance companies have been restructured, recapitalized, and privatized, mostly through sales to strongforeign strategic investors. The share of the private sector in total bank equity exceeds 80 percent; foreignintermediaries own 60 percent of the banks, 90 percent of the insurance companies, and 70 percent of thebrokerage houses. Institutional investors such as mutual funds and pension funds have grown steadily inthe past five years. Hungary's equity market has grown dramatically in size and has become much moreliquid. Hungary has also made substantial progress in harmonizing financial laws and regulations withthose of the European Union. It is fair to say that the first order of transition issues in the financial sectorhave, for the most part, been resolved.
The transformation of Jiungary's financial system is, however, not complete. Although the bankingsystem has substantially improved in terms of services offered and the quality of its assets, it has notgrown in size over the past decade (Table 4.1), and has focused its lending almost exclusively on thepremier companies. Small and medium enterprises, agricultural firms, households, and municipalities stillhave difficulty gaining access to funding. The insurance industry has grown, but from a very small base,and still remains small by international comparison, as indicated by total assets of only 4 percent of GDP.The same holds true for mutual funds and pension funds: although they have grown rapidly in the pastfive years, they remain small by international comparison, with combined assets of only 4 percent of GDPin 1998. Finally, the effective size of the equity market (the free float) is only 12 percent of GDP, afterdeducting the holdings of large strategic investors and the residual holdings of the Government. Inaddition, except for 1996 and especially 1997, the equity market remains a minor source of finance forcorporations-the growth in market capitalization has been due mainly to privatization and price changes,rather than to new share issues.
Table 4.1: Assets of Financial Institutions and Market Capitalization, 1990-98(percent of GDP)
1990 1993 1994 1995 1996 1997 1998Banks 79.9 74.1 70.4 65.8 65.6 66.3 65.5Insurance companies 2.9 3.2 3.4 3.5 4.2 4.1 n.a.Mutual funds 0.0 0.6 1.1 1.2 1.8 2.9 3.3Pension funds 0.0 0.0 0.0 0.1 0.3 0.7 1.3
Market capitalization 0.8 12.9 20.2 21.8 34.7 59.9 53.4Equities 0.8 2.3 4.2 5.8 12.4 35.8 29.5Bonds 0.0 10.6 16.1 15.9 22.3 24.1 23.9
Public debt 90.4 88.2 86.4 72.8 63.9 60.3Sources: National Bank of Hungary, Budget Securities Exchange, Ministry of Finance.
74
Chapter 4. Financial Sector Development 75
To a large extent, the remaining institutional deficiencies of the Hungarian financial sector aredevelopmental in nature. It will take time for banks and institutional investors to grow to the levels foundin mature market economies, for new financial instruments to develop, and for corporations and otherborrowers to gain access to more diversified sources of finance. There is, however, room for furtherimprovement in the regulatory and institutional framework, to enhance the financial system's ability tosupport economic growth and withstand external shocks and volatility. Moreover, there is a need to fullyharmonize the regulatory framework with that of the EU.
DEVELOPMENT OF THE BANKING SECTOR OVER THE PAST DECADE
Background
Reform of the command economy in industry and agriculture began in the early 1970s, but thefinancial sector remained under tight Government control until the end of the 1980s. The generalmodernization of the system started in 1987, with the breakup of the insurance monopoly and theintroduction of a two-tier banking system. This system involved the creation of three state banks -
Hungarian Credit Bank (MHB), Commercial and Credit Bank (K&H), and Budapest Bank (BB) - tohandle the commercial banking business of the central bank. The system expanded rapidly both in assetsand number of institutions in the next three years, but there was no competition among banks, andsectoral concentration remained high.
Qualitative development, however, trailed market expansion and undermined the ability of thebanks to intermediate prudentially. Factors undermining the sector in the early 1990s have included: (i)the inherited bad loan portfolio; (ii) low initial capitalization of banks; (iii) profits that were exaggerated(accrued but unpaid interest, inadequate provisioning), and then paid to the Government in the form oftaxes and dividends; (iv) political influence in credit allocation; (v) lack of personnel with strong bankingskills; (vi) lack of modern banking infrastructure; and (vii) weak prudential rules and supervision.
The start of the transition in 1990 resulted in very strong shocks to the real sector of the Hungarianeconomy, with negative spillovers to the banking sector. There was an abrupt drop in exports totraditional CMEA markets, as well as increased competition from higher-quality imports floodingdomestic markets. Many enterprises experienced a sharp drop in profitability, and stopped paying banksand other creditors as a result. Legislative reform in the early 1990s began to reveal the problems in thebanking sector, as banks were unable to comply with the new laws and regulations. The new Banking Actof 1991 introduced basic prudential concepts such as loan classification and provisioning, and limits onlarge exposure; and the new Accounting Act introduced much more stringent international accountingstandards. But most of the banks were unable to comply with the stricter prudential regulation. As theweaknesses in the sector became increasingly apparent, the Government introduced a very toughBankruptcy Code in 1993 (initially including a 90-day automatic trigger for bankruptcy in cases ofoverdue payment). This forced the banks to stop the practice of rolling over unpaid loans at maturity.
As the level of enterprise arrears to banks skyrocketed, it became clear that the system could notstay afloat without Government assistance. The first two interventions--the 1991 guarantee and the 1992Loan Conciliation Program (see Box 4. 1)-were not of sufficient size or adequate designed, and failed toresolve the core problems facing the banking system. While costing around HUF 120 billion (4 percent ofGDP), the measures did not require a change in the management of the banks or reform of theiroperations. These emergency measures thus sent the wrong signals to bank and enterprise management,by indicating that bailouts would be costless to them.
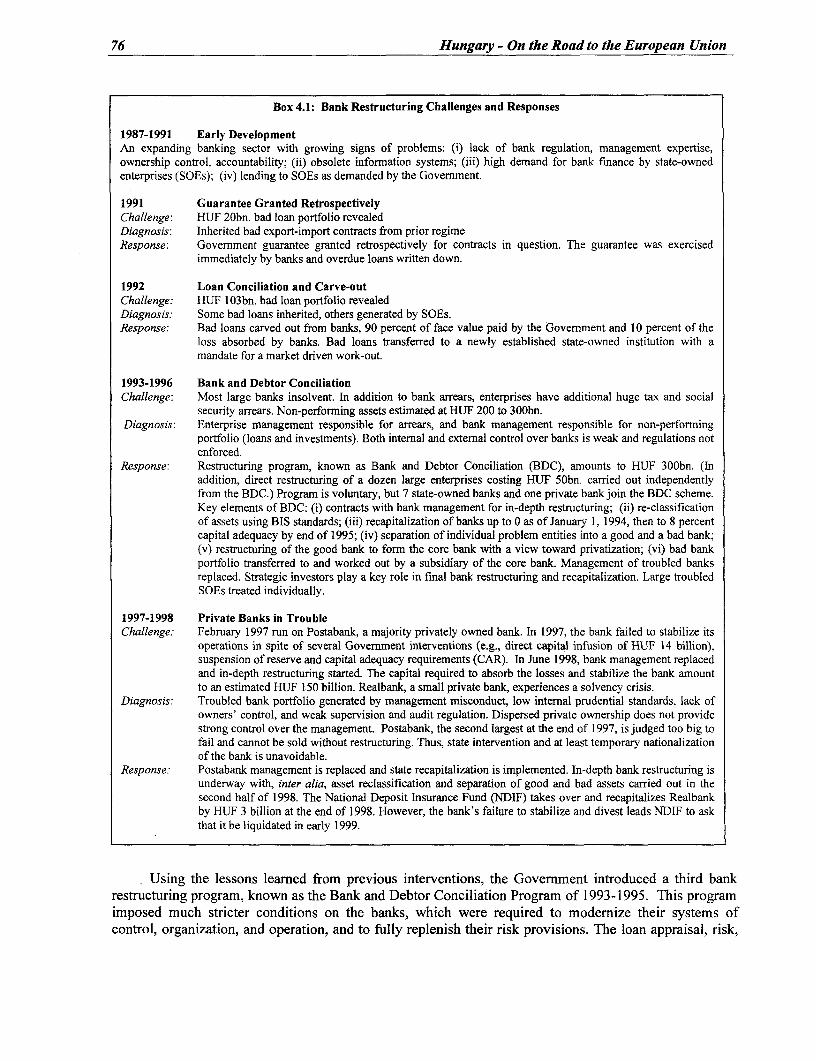
76 Hungary - On the Road to the European Union
Box 4.1: Bank Restructuring Challenges and Responses
1987-1991 Early DevelopmentAn expanding banking sector with growing signs of problems: (i) lack of bank regulation, management expertise,ownership control, accountability; (ii) obsolete information systems; (iii) high demand for bank finance by state-ownedenterprises (SOEs); (iv) lending to SOEs as demanded by the Government.
1991 Guarantee Granted RetrospectivelyChallenge: HUF 20bn. bad loan portfolio revealedDiagnosis: Inherited bad export-import contracts from prior regimeResponse: Government guarantee granted retrospectively for contracts in question. The guarantee was exercised
immediately by banks and overdue loans written down.
1992 Loan Conciliation and Carve-outChallenge: HUF 103bn. bad loan portfolio revealedDiagnosis: Some bad loans inherited, others generated by SOEs.Response: Bad loans carved out from banks, 90 percent of face value paid by the Government and 10 percent of the
loss absorbed by banks. Bad loans transferred to a newly established state-owned institution with amandate for a market driven work-out.
1993-1996 Bank and Debtor ConciliationChallenge: Most large banks insolvent. In addition to bank arrears, enterprises have additional huge tax and social
security arrears. Non-performing assets estimated at HUF 200 to 300bn.Diagnosis: Enterprise management responsible for arrears, and bank management responsible for non-performing
portfolio (loans and investments). Both internal and external control over banks is weak and regulations notenforced.
Response: Restructuring program, known as Bank and Debtor Conciliation (BDC), amounts to HUF 300bn. (Inaddition, direct restructuring of a dozen large enterprises costing HUF 50bn. carried out independentlyfrom the BDC.) Program is voluntary, but 7 state-owned banks and one private bank join the BDC scheme.Key elements of BDC: (i) contracts with bank management for in-depth restructuring; (ii) re-classificationof assets using BIS standards; (iii) recapitalization of banks up to 0 as of January 1, 1994, then to 8 percentcapital adequacy by end of 1995; (iv) separation of individual problem entities into a good and a bad bank;(v) restructuring of the good bank to form the core bank with a view toward privatization; (vi) bad bankportfolio transferred to and worked out by a subsidiary of the core bank. Management of troubled banksreplaced. Strategic investors play a key role in final bank restructuring and recapitalization. Large troubledSOEs treated individually.
1997-1998 Private Banks in TroubleChallenge: February 1997 run on Postabank, a majority privately owned bank. In 1997, the bank failed to stabilize its
operations in spite of several Government interventions (e.g., direct capital infusion of HUF 14 billion),suspension of reserve and capital adequacy requirements (CAR). In June 1998, bank management replacedand in-depth restructuring started. The capital required to absorb the losses and stabilize the bank amountto an estimated HUF 150 billion. Realbank, a small private bank, experiences a solvency crisis.
Diagnosis: Troubled bank portfolio generated by management misconduct, low internal prudential standards, lack ofowners' control, and weak supervision and audit regulation. Dispersed private ownership does not providestrong control over the management. Postabank, the second largest at the end of 1997, is judged too big tofail and cannot be sold without restructuring. Thus, state intervention and at least temporary nationalizationof the bank is unavoidable.
Response: Postabank management is replaced and state recapitalization is implemented. In-depth bank restructuring isunderway with, inter alia, asset reclassification and separation of good and bad assets carried out in thesecond half of 1998. The National Deposit Insurance Fund (NDIF) takes over and recapitalizes Realbankby HUF 3 billion at the end of 1998. However, the bank's failure to stabilize and divest leads NDIF to askthat it be liquidated in early 1999.
Using the lessons learned from previous interventions, the Govermment introduced a third bankrestructuring program, known as the Bank and Debtor Conciliation Program of 1993-1995. This programimposed much stricter conditions on the banks, which were required to modernize their systems ofcontrol, organization, and operation, and to fully replenish their risk provisions. The loan appraisal, risk,

Chapter 4. Financial Sector Development 77
and asset classification procedures were modernized. In some cases, management was replaced. Finally,the Government implemented a strategy to sell state-owned banks to strong strategic investors.
Recapitalization followed by privatization Table 4.2: Present Foreign Ownership in Largest Banks
became the major form of bank resolution in Banks Foreign Investors ForeignHungary after 1993. The overall process was not Forel.etr Fe
cheap: between 1991 and 1998, about HUF 650 Junel1998 %GR_3_
billion worth of bad loans were restructured in OTP Foreigninvestors(GDR) 31.7
several rounds, at a total cost of HUF 460 billion Bank
(around 10 percent of GDP), mostly in the form of MKB Bayerische Landesbank Girozentrale 66.9Government consolidation bonds. Although this Foreign Deutsche Investors-undcost was to some extent recovered by the Trade Bank Entwicklungs GmbH. 8.0
subsequent privatization,' there are well-grounded Bank For Arbeit und Wirtschaft AG. 10.4arguments that Hungary paid too much, Other Foreign Investors 14.7considering the moral hazard elements in the K&H Irish Life Pic. 23.12 Credit Bank Kreidietbank N.V. 23.1scheme. However, other alternatives would also EBRD 18.2
have been expensive, as moral hazard is hard to Postabank Osterreichische Postsparkasse 4.1
avoid with any approach to bank restructuring. In EA_Generali AG. 2.2any case, the program was successful, with all but a Other Foreign Investors 1.4few specialized institutions (the development CIB Comit Holding Intemational S.A.banks, export-import bank, and mortgage bank) Central- -Banca Commeciale Italia Group- 95.0
being privatized by the end of 1997. The fact that European
the newly privatized banks are, for the most part, Bank Credit Bank of Japan, Ltd. 5.0
well capitalized and managed supports the ABNAmro ABN Amnro Bank N.V., Amsterdam 99.7conclusion that rehabilitation, combined with BB EBRD 32.6privatization to strategic investors, is an effective Budapest General Electric Capital Corporation 27.6way to restructure a country's banking system. Bank Other Foreign Investors 9.7
Unicbank Raiffeisen Banking Group Austria 95.2
Bank Austria Creditanstalt AG., Austria 100.0Banks have generally been sold to strong Creditanstalt
investors, primarily large foreign financial Hungary Co.institutions (Table 4.2). The only exceptions were Source: Bank and Stock Exchange Almanac 1997-98.
OTP and Postabank, which were, respectively,partially sold through a public share offering and private placement. All Government shares incommercial banks have been sold, except for small minority stakes in BB and K&H. Postabank becamemajority state owned in the process of recapitalization in 1997-98.
Present Structure and Performance of the Banking System
At the end of 1997, the banking system consisted of 36 commercial banks, 7 specialized banks (2development banks, one mortgage bank, 3 building societies, and one export-import bank), and about 250savings and credit cooperatives. Although the three largest banks (OTP, MKB, and K&H) still holdabout 40 percent of the banking sector's assets, competition in all aspects of banking has increasedsignificantly. Both the decline in the market share of the largest banks (Figure 4.1), and the general dropin the Herfindhall of concentration (Figure 4.2) demonstrate the heightened competition, which has been
' The revenues from bank privatization in the 1994-97 period have been estimated at around 1 percent of GDP. The privatestrategic investors provided an additional 0.7 percent of GDP in equity to comply with prudential regulations (Varhegyi,1997).
2 Bank management was in charge of evaluating the magnitude of the losses, and had a built-in incentive to overestimate lossesand make the capital infusion bigger than needed.
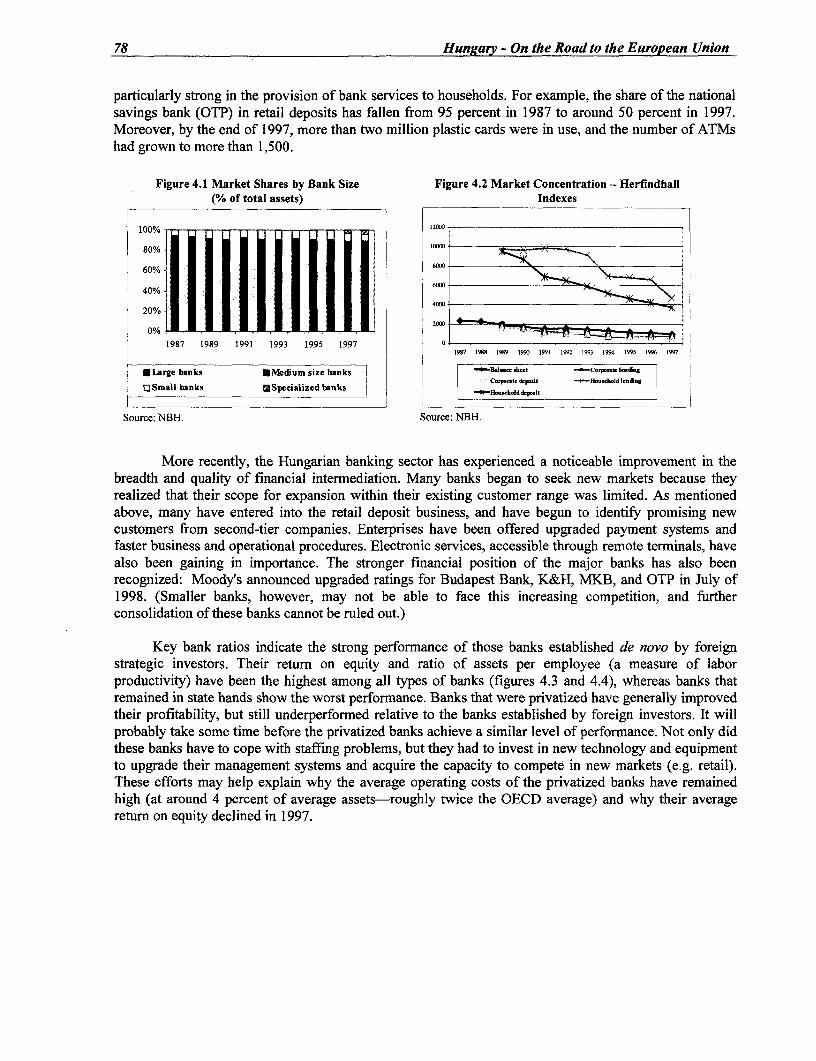
78 Hungary - On the Road to the European Union
particularly strong in the provision of bank services to households. For example, the share of the nationalsavings bank (OTP) in retail deposits has fallen from 95 percent in 1987 to around 50 percent in 1997.Moreover, by the end of 1997, more than two million plastic cards were in use, and the number of ATMshad grown to more than 1,500.
Figure 4.1 Market Shares by Bank Size Figure 4.2 Market Concentration - Herfindhall(% of total assets) Indexes
100% [1200 1
80%0 109w _________'
60% 00
400,~~~~~~~~~~~~~~~~~~~~~~40
0001 11111111111 2I~~~~~,'~~~' 1902 ~~93~~92001987 1989 1991 1993 1995 1997 o 19Er7 1998 1989 1990 1991 1992 1993 I 994 1995 1996 1997
*MLarge banks *Medium size banks AC9 Io-dAg
[]Small banks M Specialized banks
Source: NBH. Source: NBH.
More recently, the Hungarian banking sector has experienced a noticeable improvement in thebreadth and quality of financial intermediation. Many banks began to seek new markets because theyrealized that their scope for expansion within their existing customer range was limited. As mentionedabove, many have entered into the retail deposit business, and have begun to identify promising newcustomers from second-tier companies. Enterprises have been offered upgraded payment systems andfaster business and operational procedures. Electronic services, accessible through remote terminals, havealso been gaining in importance. The stronger financial position of the major banks has also beenrecognized: Moody's announced upgraded ratings for Budapest Bank, K&H, MKB, and OTP in July of1998. (Smaller banks, however, may not be able to face this increasing competition, and furtherconsolidation of these banks cannot be ruled out.)
Key bank ratios indicate the strong performance of those banks established de novo by foreignstrategic investors. Their return on equity and ratio of assets per employee (a measure of laborproductivity) have been the highest among all types of banks (figures 4.3 and 4.4), whereas banks thatremained in state hands show the worst performance. Banks that were privatized have generally improvedtheir profitability, but still underperformed relative to the banks established by foreign investors. It willprobably take some time before the privatized banks achieve a similar level of performance. Not only didthese banks have to cope with staffing problems, but they had to invest in new technology and equipmentto upgrade their management systems and acquire the capacity to compete in new markets (e.g. retail).These efforts may help explain why the average operating costs of the privatized banks have remainedhigh (at around 4 percent of average assets-roughly twice the OECD average) and why their averagereturn on equity declined in 1997.

Chapter 4. Financial Sector Development 79
Figure 4.3 Return on Equity Figure 4.4 Assets per Employees
50 20040
30 l 150
10 ~~~~~~~~~~~~~~~~~~~~1000~~~~~~~~~~~~~~~~~~~~~5
-20~~~~~~~~~~~~~~~~~~~~~~-30~~~~~~~~~~~~~~~~~~~~~
Large Media Snmall State Foreigp Foreign Large Meciurn Small Sate Foreign ForeignEAs Pri Est priv.
*1994 a1995 [31996 *1997 { 1994 a 1995 31996 *1997
Source: NBH. Source: NBH.
Although the privatization of former state banks is not yet reflected in their cost and profit ratios, itis important to note that their financial situation is robust, as indicated by the improving quality of theirassets and their increasing CARs. The share of classified assets (loans, investments, and off-balance sheetitems) in total assets declined from 29 percent in 1993 to 7 percent in 1998. The share of loss anddoubtful loans (the two worst categories) in the total loan portfolio declined steadily, from 26 percent in1993 to 3 percent in 1998, indicating that lending by the privatized banks is not affected by politicalconsiderations, and tends to follow stricter guidelines and procedures. The average risk-weighted CAR ofthe large (mostly privatized) banks increased from 7 percent in 1993 to an estimated 13 percent in 1998.Although it is still lower than the 17 percent average CAR of medium (mostly de novo) private banks), itsgrowth reflects the strong capital backing from their foreign strategic investors.
Resource Mobilization and Allocation by the Banking System
Improvements in the structure and efficiency of the banking system after 1995 coincided with amajor fiscal adjustment during the same period (chapters 1 and 2), resulting in sharp changes in theevolution of money, credit, and interest rates. As shown in Figure 4.5, high inflation and negative realinterest rates on deposits during 1992-1995 led to weak mobilization of resources by the banks, assuggested by the sharp fall in the ratio of M3 to GDP (from 60 to 50 percent). Bank credits to the privatesector declined even more during this period, as banks dramatically increased their holdings ofGovernment securities.
The banks adopted this strategy because nominal and real interest rates on Government paperincreased dramatically, frequently exceeding the average lending rate (Figure 4.5). Holdings ofGovernment paper were even more attractive, considering the high risk of lending to enterprises duringthis period of enterprise restructuring and bank consolidation. The unusual structure of interest rates wasthe result of massive Government borrowings to finance large deficits, weak competition in the bankingsystem, and a very deficient market for Government securities. In particular, the national savings bank,OTP, still had considerable monopoly power in both the retail and Government securities markets; it wasable to enjoy a very large spread between its low deposit rates and the high yield on Governmentsecurities. This was also the period, however, when the banks started losing resources, as indicated by thegrowing difference between M3 and M4 which is equal to M3 plus Government and NBH securities heldoutside the banks).
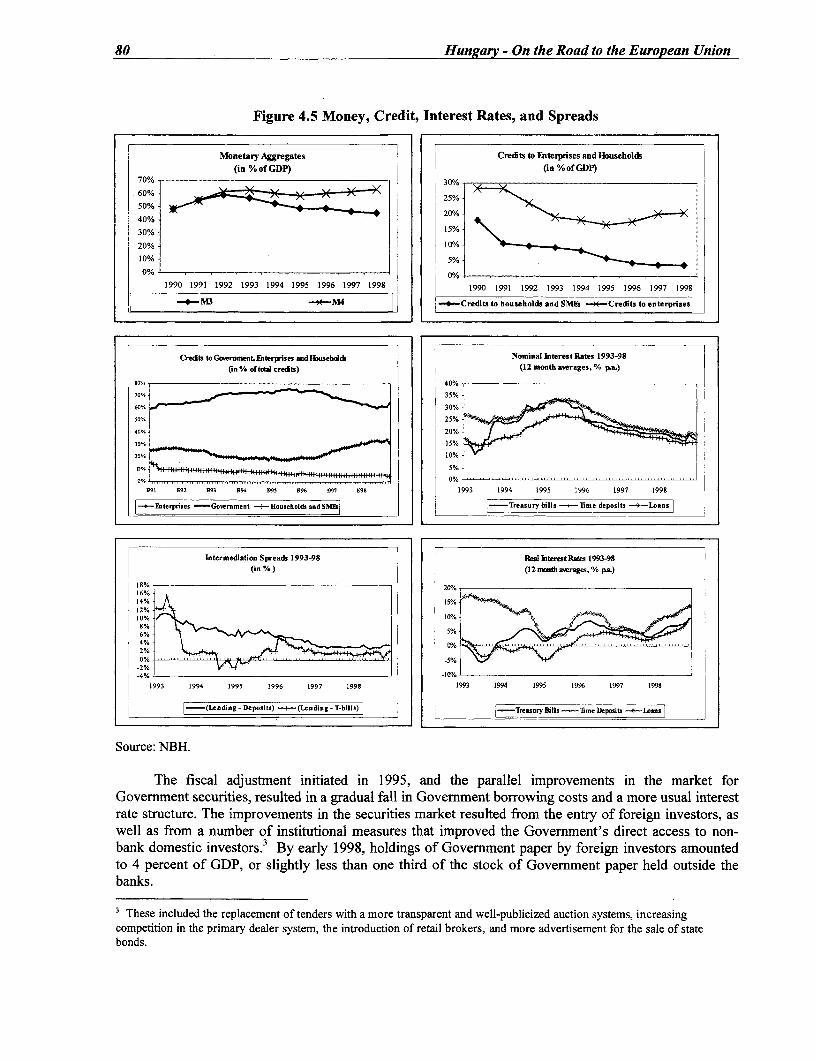
80 Hungary - On the Road to the European Union
Figure 4.5 Money, Credit, Interest Rates, and Spreads
Monetary Aggregates Credits to Etterprises and Households(in %ofGDP) (in %ofGDP)
70%l 307/.60% _ S 25%-50%
40% 0/-30%- 15%
20% 10%-
10% - 5%-
0% _ _ _ _ __/_ _-1990 1991 1992 1993 1994 1995 1996 1997 1998 1990 1991 1992 1993 1994 1995 1996 1997 1998
Nu )t AU ll _-4-Credits to households and SMEs -*-Credits to enterprises
Credts tocwernmen, Enterpises andHousebdoc Nominal Interest Rates 1993-98Qn % ofttai crecits) (12 month averages, % p.s)
so% 40%70% 35%
60% 30%
50-/v 125%
40% 20%-
30% _5%
20% 10%
Wl S92 S93 1994 S75 196 S97 99 1993 1994 1995 1996 1997 199t
F;+Fnte-psises -Government -+-Households and SMEI _ | Treasury bills-line deposits - Leans_
Intermediation Spreads 1993-98 Real IterestLutes 1993-98(in %) (12 mDnth avrages, % pLa)
18%
14%12%10 %o/.8% 56% -%
4% -1/
2% ----
-2%-4% - _ _-10% i _
1993 1994 1995 1996 1997 1998 1993 1994 1995 1996 1997 1990
-_(Leodine -Deposits) i (Lendins -T-blls) i-TressoryBills, -'me Deposits - l|
Source: NBH.
The fiscal adjustment initiated in 1995, and the parallel improvements in the market forGovernment securities, resulted in a gradual fall in Government borrowing costs and a more usual interestrate structure. The improvements in the securities market resulted from the entry of foreign investors, aswell as from a number of institutional measures that improved the Government's direct access to non-bank domestic investors. 3 By early 1998, holdings of Government paper by foreign investors amountedto 4 percent of GDP, or slightly less than one third of the stock of Government paper held outside thebanks.
3 These included the replacement of tenders with a more transparent and well-publicized auction systems, increasingcompetition in the primary dealer system, the introduction of retail brokers, and more advertisement for the sale of statebonds.
Chapter 4. Financial Sector Development 81
Resource mobilization by the banks stopped deteriorating as a result of higher real interest rates ondeposits and the perception of more stable banking institutions, but also because the banks startedchanneling their resources away from Government securities and into prime enterprises. After manyyears, credit to enterprises started increasing as a share of GDP, and the increasing competition amongbanks also led to a steady decline in the spread between lending and deposit rates (Figure 4.5).Nonetheless, it is noteworthy that resource mobilization by the banks has not yet improved, despite higherreal interest rates on deposits. Note also that credit to households and to small and medium enterprises(SMEs) has declined further, and that the access of agriculture and municipalities to the financial markethas remained difficult (section 4).
Banking Supervision
The failure of two banks (Postabank and Realbank) and six brokerage houses in 1998 has revealedunderlying weaknesses in the supervision of banks and capital market operations (which have operatedunder a common chief executive since January 1997). The failure of the brokerage houses coincided witha period of stress in the securities market, but the bank failures were simply the final outcome ofproblems well known to supervisors. Their failure to act in a timely manner has resulted in lossesamounting to more than 1 percent of GDP.
An important issue in Hungary is the legal authority of the supervisor to both issue and enforceprudential regulations. Although the Basle Core Principles suggest that supervisors should have the rightto establish prudential guidelines, in Hungary only the Government, not the supervisor, has the right toissue binding regulations. More importantly, the power of the supervisor to take appropriate timelydisciplinary action is constrained. For example, the legal framework which does not clearly authorizeintervention in a bank based on the results of inspection, but only on the basis of audited accounts-creates delays.
Hungary must strengthen the banking sector laws, regulations, and institutions, to enable thesupervisor to enforce prudential norms without political interference. The European Directives, whichguide the integration of the banking sectors of EU members, state that integration means freedom ofestablishment (branching), and freedom to provide cross-border services without further authorization, onthe principle of home country supervision of host country activities. Thus, Hungarian banks will alsoenjoy the rights of single passport-as long as Hungary's banking regulations fully comply with EUstandards, and the host country accepts the Hungarian supervisor as a reliable partner, able to shareinformation with supervisors from other countries. Clearly, a great deal depends on strengtheningsupervision.
Until 1999, Hungary prohibited universal banking and it still has not adopted the EU regulationsnecessary for supervision of financial groups on a consolidated basis. In terms of both structure andaction, the larger Hungarian institutions are behaving as financial conglomerates. For example, 15 out of100 brokers in Hungary handle 70 percent of the business, and 14 out of the 15 are controlled by anotherfinancial institution. There are several hundred pension funds, but 60 percent of the business is controlledby the subsidiaries of four insurance companies. Although the Act on Credit Institutions containsrules forconsolidated supervision of financial groups, the meaning of consolidated supervision differs from that setforth in the relevant EU directive. The basic distinction lies in the definition of a holding; the Hungarianprovisions only cover groups in which the parent company is a bank, whereas the EU directive refers tofinancial holdings.

82 Hungary - On the Road to the European Union
Although banking and capital market supervision now operate under a common chief executive,the effective integration of the two branches has yet to take place. Moreover, there is significant overlapamong insurance companies, pension funds, and asset managers in terms of business, ownership, andcontrol, but they are supervised by three different and poorly coordinated agencies-and implementingconsolidated supervision at the intermediary level is difficult when the supervisors are not wellcoordinated. The authorities might want to consider combining insurance and pension supervision, as hasbeen done for banking and securities, as an interim step toward some form of integrated supervision.Another way to ensure greater coordination would be to create a capital market council combining thechief supervisors of different areas of the capital market, and legally empowering the different supervisorsto share information. In 1999, Hungary will permni full universal banking as required by the EUDirectives. Issuing the appropriate regulations and developing the capacity to undertake consolidatedsupervision is important not only to meet the EU requirements, but also to protect the integrity of thefinancial system.
THE INSURANCE SECTOR
Prior to 1986, Hungary's insurance sector consisted only of the national insurance company,Allami Biztosito (AB). In 1986, the Hungaria Insurance Company was spun off from AB and became astate monopoly for automobile and industrial insurance, while AB retained its monopoly in housinginsurance. Garancia Insurance was formed as a subsidiary of OTP Bank in 1987. Atlasz, Generali, andProvidencia Insurance, established between 1987 and 1989, are all joint ventures with foreign insurancecompanies. Between 1990 and 1995, 15 additional insurance companies were established.
Behind the impressive institutional development in the early 1990s, however, a profound crisis wasunfolding. The two state monopolies, both undercapitalized and with close to 100 percent share in theirmarket segments, had been growing because of tax incentives and protected markets. But they did notimprove their products, portfolios, or productivity, and were unable to respond to the problems of: (i)huge inherited losses (ii) lack of reserves to cover the growing risk in motor liability insurance(Hungaria), and (iii) no inflation adjustment in property insurance in spite of growing inflation (AB).
By the end of 1992, 10 out of 15 the Figure 4.6 Insurance Sector Profit/Loss (percentage of GDP)largest insurance companies were 0.40% _insolvent, after losses that year of HUF 32 0.20% _billion-the equivalent of 1.1 percent of 0.00% GDP, or almost half of the annual premium 020% 4 1995 1996 1997(Figure 4.6). As a result, the insurance -0o40% 1991 1999_1993 941995sector was restructured and the two state .40%monopolies were sold to foreign insurance -0.60%companies, which absorbed the inherited -0.80% /losses through recapitalization. To make -1.00% /this possible, significant adjustments were -1.20%
made in insurance premiums; existing SIource: State Insurance Supervision.
unprofitable insurance contracts weregradually replaced; new products, such as life insurance, became the driving force of sector development;and European prudential standards were introduced and enforced by the Insurance Supervision. Unlikethe situation in the banking sector, the restructuring of the insurance sector took place outside of publicpurview and involved no public support.
Today, there are 49 insurance institutions, of which 20 are joint stock companies and the remainderare mutuals. Of the stock companies, 18 are primarily foreign owned and have roughly 90 percent of the

Chapter 4. Financial Sector Development 83
market. During the phase of reconstruction and privatization in the first half of the 1990s, the industry asa whole lost money, but since 1995 the companies have been increasingly profitable (Figure 4.6).Nonetheless, reserves remain low by EU standards.
The industry is dominated by five firms, leading to an oligopolistic structure. Without adequatecompetition, the insurance companies have not been pressed to be efficient. Gross spreads and operatingcosts are both high, with operating costs at roughly twice the international average. Competition willincrease both internally and externally after EU accession, when Hungary will have to allow trade infinancial services and customers gain the freedom to purchase their insurance from companies registeredoutside Hungary. If the Hungarian companies do not decrease their operating costs and improve theircustom relations, they will have a difficult time competing.
Many of the insurance firms in Hungary are too small to achieve adequate economies of scale andrisk management. Most of these are mutuals, which constitute a small segment of the insurance industrybut present a disproportionate problem for supervision. It would be wise to encourage these firms tomerge, by imposing higher capital requirements and other regulatory measures.
The insurance industry is still relatively small, as indicated by an annual premium of about 2.6percent to GDP in 1997, far below the EU average of 6.8 percent or 10 percent in the United States. Lifeinsurance is particularly small, accounting for only one third of the total premium, or less than 1 percentof GDP (Figure 4.7). The industry has Figure 4.7 Change in Composition of the Life Insurance Market Gross
significant growth potential, primarily in the Premium of Largest Companies (in percentage of GDP)
field of life insurance, which has been 1. .
growing at a rapid 16 percent annual real ratein recent years. Although this growth is inprinciple desirable, it has occurred in part dueto preferential tax treatment-one third of the 0.80%
annual premium can be deducted from taxes,as long as this and other deductions forsavings do not exceed one third of taxes due.Other countries also provide tax incentives to _ _..encourage the savings component of life N No280.ndhn *A8Aeg-n OProvid-ncI OHong80. mO:.r7
insurance, but Hungary's treatment is _Source: State Insurance Supervision.
arguably excessively generous byinternational standards. There are well- known reasons to provide tax incentives, but such incentivesshould be matched to the incentives offered in the second pillar of the pension system; namely, taxexemption of contributions and earnings but taxation on payout. This is the most commonly usedapproach in OECD countries to encourage savings for retirement.5
CAPITAL MARKETS
The development of Hungary's capital market started in 1990, with the opening of the BudapestStock Exchange (BSE), the enactment of the first Securities and Investment Act,6 and the establishment
4 On the other hand, as a share of the stock of household savings, life insurance is closer to international averages, sincehouseholds' financial wealth is also lower than in more mature economies.
' The third, voluntary pillar of the pension system also provides a very generous tax incentive in the form of tax credits. The taxincentives for third pillar contributions should also be equalized with the tax treatment of second pillar contributions.
6 Prior to this, a small commodities exchange had already opened, some municipalities had already issued bonds to financeinvestments in telephone and gas supply, and the first tradable state securities (treasury bills) had already been introduced.
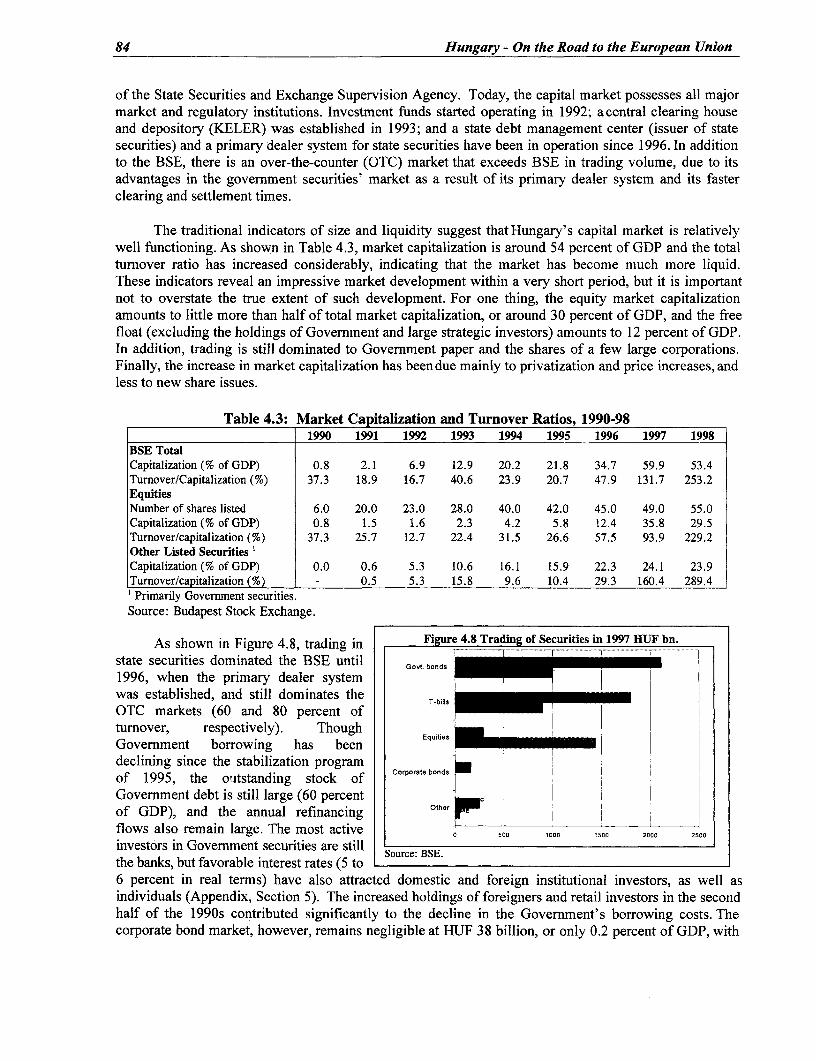
84 Hungary - On the Road to the European Union
of the State Securities and Exchange Supervision Agency. Today, the capital market possesses all majormarket and regulatory institutions. Investment funds started operating in 1992; a central clearing houseand depository (KELER) was established in 1993; and a state debt management center (issuer of statesecurities) and a primary dealer system for state securities have been in operation since 1996. In additionto the BSE, there is an over-the-counter (OTC) market that exceeds BSE in trading volume, due to itsadvantages in the government securities' market as a result of its primary dealer system and its fasterclearing and settlement times.
The traditional indicators of size and liquidity suggest that Hungary's capital market is relativelywell functioning. As shown in Table 4.3, market capitalization is around 54 percent of GDP and the totalturnover ratio has increased considerably, indicating that the market has become much more liquid.These indicators reveal an impressive market development within a very short period, but it is importantnot to overstate the true extent of such development. For one thing, the equity market capitalizationamounts to little more than half of total market capitalization, or around 30 percent of GDP, and the freefloat (excluding the holdings of Government and large strategic investors) amounts to 12 percent of GDP.In addition, trading is still dominated to Government paper and the shares of a few large corporations.Finally, the increase in market capitalization has been due mainly to privatization and price increases, andless to new share issues.
Table 4.3: Market Capitalization and Turnover Ratios, 1990-981990 1991 1992 1993 1994 1995 1996 1997 1998
BSE TotalCapitalization (% of GDP) 0.8 2.1 6.9 12.9 20.2 21.8 34.7 59.9 53.4Turnover/Capitalization (%) 37.3 18.9 16.7 40.6 23.9 20.7 47.9 131.7 253.2EquitiesNumber of shares listed 6.0 20.0 23.0 28.0 40.0 42.0 45.0 49.0 55.0Capitalization (% of GDP) 0.8 1.5 1.6 2.3 4.2 5.8 12.4 35.8 29.5Turnover/capitalization (%) 37.3 25.7 12.7 22.4 31.5 26.6 57.5 93.9 229.2Other Listed Securities' Capitalization (% of GDP) 0.0 0.6 5.3 10.6 16.1 15.9 22.3 24.1 23.9Turnover/capitalization (%) - 0.5 5.3 15.8 9.6 10.4 29.3 160.4 289.4' Primarily Government securities.Source: Budapest Stock Exchange.
As shown in Figure 4.8, trading in Figure 4.8 Trading of Securities in 1997 HUF bn.state securities dominated the BSE until Govt. bonds _ -
1996, when the primary dealer systemwas established, and still dominates theOTC markets (60 and 80 percent ofturnover, respectively). ThoughlEqugtiesGovernment borrowing has been E -declining since the stabilization programof 1995, the outstanding stock of Corporate bonds rGovernment debt is still large (60 percentof GDP), and the annual refinancing Other
flows also remain large. The most active 0 Soo 1000 1500 2000 2500
investors in Government securities are still Source: BSE.the banks, but favorable interest rates (5 to6 percent in real terms) have also attracted domestic and foreign institutional investors, as well asindividuals (Appendix, Section 5). The increased holdings of foreigners and retail investors in the secondhalf of the 1990s contributed significantly to the decline in the Government's borrowing costs. Thecorporate bond market, however, remains negligible at HUF 38 billion, or only 0.2 percent of GDP, with

Chapter 4. Financial Sector Development 85
two blue chip corporations accounting for two thirds of the bonds issued. The key impediments tocorporations issuing bonds are the high cost of issuance, the high rate of inflation (increasing the riskpremium for long maturities), the lack of a swap market, and the absence of ratings by an independentagency.
Equity trading started in June 1990, when IBUSZ company shares were listed on the Budapest andVienna stock exchanges. Equity trading has picked up since Hungary's economic turnaround in 1995, butonly 53 companies are listed on the exchange; trading in a dozen companies accounts for three quarters ofBSE activity; and two thirds of the stock market's liquidity is provided by foreign institutional investors.The number of listed companies may soon increase due to a new securities regulation, which stipulatesthat after January 1999, companies much apply for listing on the BSE before making a public shareoffering larger than HUF200 million (US$1 million). The recent introduction of a new category of shares(C class) will enable SMEs to comply with the regulation, while disclosing much less information thanthe class A and B companies. There is, however, some justified concern that the new C class shares maybe illiquid with very little trading in these shares.
Institutional Investors
Investment in securities is dominated by domestic and foreign institutional investors. Domesticinstitutional investors comprise investment funds, pension funds, and insurance companies. The firstinvestment funds were established in 1992, but did not grow substantially until after 1995. By the end of1997, there were 56 investment funds and 25 fund managers. The net asset value of these funds amounted toHUF 320 billion (3 percent of GDP) by the end of 1998. The five largest funds (including Budapest, OTP,and Creditanstalt Investment Fund) account for 75 percent of the market. The investment funds haveinvested about 70 percent of their portfolios in Government securities and 14 percent in equities.This marketsegment is still constrained by laws that limit the ability of domestic persons to invest abroad and limitforeign funds from selling their products in Hungary.
The pension fund sector comprises both voluntary (third pillar) funds, operating since 1993, andmandatory (second pillar) funds, operating since January of 1998. The assets managed by third pillarfunds had reached HUF 60 billion (0.6 percent of GDP) by the end of 1998. Although the growth of thesefunds is certainly not negligible, faster growth might have been expected, given the very generous taxadvantages given to third pillar contributions. Nonetheless, total pension fund assets are expected to growmore rapidly due to the introduction of the second pillar, reaching around 5 percent of GDP in 2002; 80percent of this will be in second pillar funds. These estimates are based on the large number of workersalready enrolled in the second pillar (1.3 million workers had joined by the end of 1998), and the fact thatit is mandatory for new entrants into the labor force. Voluntary and mandatory pension funds aremanaged mainly by banks and insurance companies, and the system is highly concentrated.
As previously mentioned, foreign portfolio investment has played a crucial role in Hungary'scapital market development. Foreign institutions entered the market in late 1995, purchasing state bonds,and by mid- 1998 they had increased their holdings of Government paper to 18 percent of the total amounttraded, or 4 percent of GDP. At the same time, due to the country's improving fiscal situation and the fallin real interest rates, foreign investors started turning to equities. By mid- 1998, foreign holdings of equityamounted to an estimated HUF 800 billion, the equivalent of 8 percent of GDP, or nearly two thirds of thefree float in equities. Contagion from the Russia crisis resulted in a sharp reduction in foreign holdings of(especially Government) securities in Hungary, but by early 1999, foreign holdings had been nearlyrestored to their pre-crisis levels (Chapter 1).
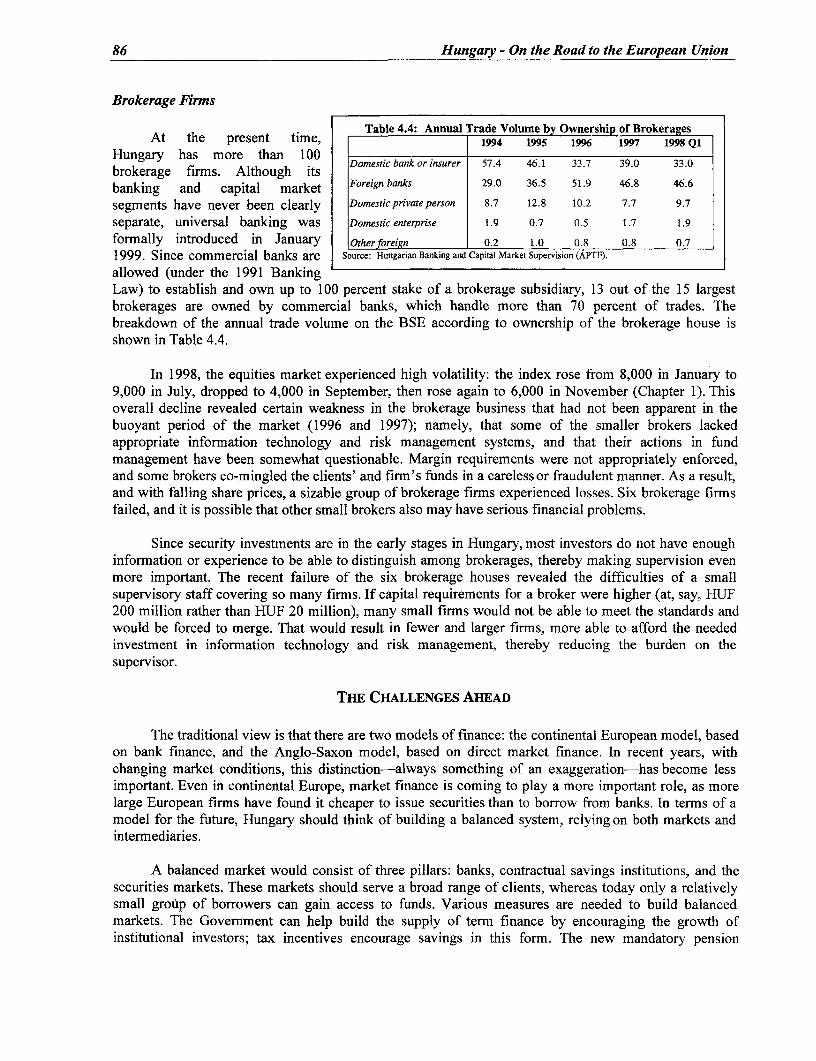
86 Hungary - On the Road to the European Union
Brokerage Firms
Table 4.4: Annual Trade Volume by Ownership of BrokeragesAt the present time, 1994 1995 1996 1997 1998 QS
Hungary has more than 100bungaroke fians . Although its Domestic bank or insurer 57.4 46.1 33.7 39.0 33.0
banking and capital market Foreign banks 29.0 36.5 51.9 46.8 46.6
segments have never been clearly Domestic private person 8.7 12.8 10.2 7.7 9.7
separate, universal banking was Domestic enterprise 1.9 0.7 0.5 1.7 1.9
formally introduced in January Otherforeign 0.2 1.0 0.8 0.8 0.7
1999. Since commercial banks are Source: Hungarian Banking and Capital Market Supervision (APTE).
allowed (under the 1991 BankingLaw) to establish and own up to 100 percent stake of a brokerage subsidiary, 13 out of the 15 largestbrokerages are owned by commercial banks, which handle more than 70 percent of trades. Thebreakdown of the annual trade volume on the BSE according to ownership of the brokerage house isshown in Table 4.4.
In 1998, the equities market experienced high volatility: the index rose from 8,000 in January to9,000 in July, dropped to 4,000 in September, then rose again to 6,000 in November (Chapter 1). Thisoverall decline revealed certain weakness in the brokerage business that had not been apparent in thebuoyant period of the market (1996 and 1997); namely, that some of the smaller brokers lackedappropriate information technology and risk management systems, and that their actions in fundmanagement have been somewhat questionable. Margin requirements were not appropriately enforced,and some brokers co-mingled the clients' and firm's funds in a careless or fraudulent manner. As a result,and with falling share prices, a sizable group of brokerage firms experienced losses. Six brokerage firmsfailed, and it is possible that other small brokers also may have serious financial problems.
Since security investments are in the early stages in Hungary, most investors do not have enoughinformation or experience to be able to distinguish among brokerages, thereby making supervision evenmore important. The recent failure of the six brokerage houses revealed the difficulties of a smallsupervisory staff covering so many firms. If capital requirements for a broker were higher (at, say, HUF200 million rather than HUF 20 million), many small firms would not be able to meet the standards andwould be forced to merge. That would result in fewer and larger firms, more able to afford the neededinvestment in information technology and risk management, thereby reducing the burden on thesupervisor.
THE CHALLENGES AHEAD
The traditional view is that there are two models of finance: the continental European model, basedon bank finance, and the Anglo-Saxon model, based on direct market finance. In recent years, withchanging market conditions, this distinction-always something of an exaggeration-has become lessimportant. Even in continental Europe, market finance is coming to play a more important role, as morelarge European firms have found it cheaper to issue securities than to borrow from banks. In terms of amodel for the future, Hungary should think of building a balanced system, relying on both markets andintermediaries.
A balanced market would consist of three pillars: banks, contractual savings institutions, and thesecurities markets. These markets should serve a broad range of clients, whereas today only a relativelysmall group of borrowers can gain access to funds. Various measures are needed to build balancedmarkets. The Government can help build the supply of term finance by encouraging the growth ofinstitutional investors; tax incentives encourage savings in this form. The new mandatory pension
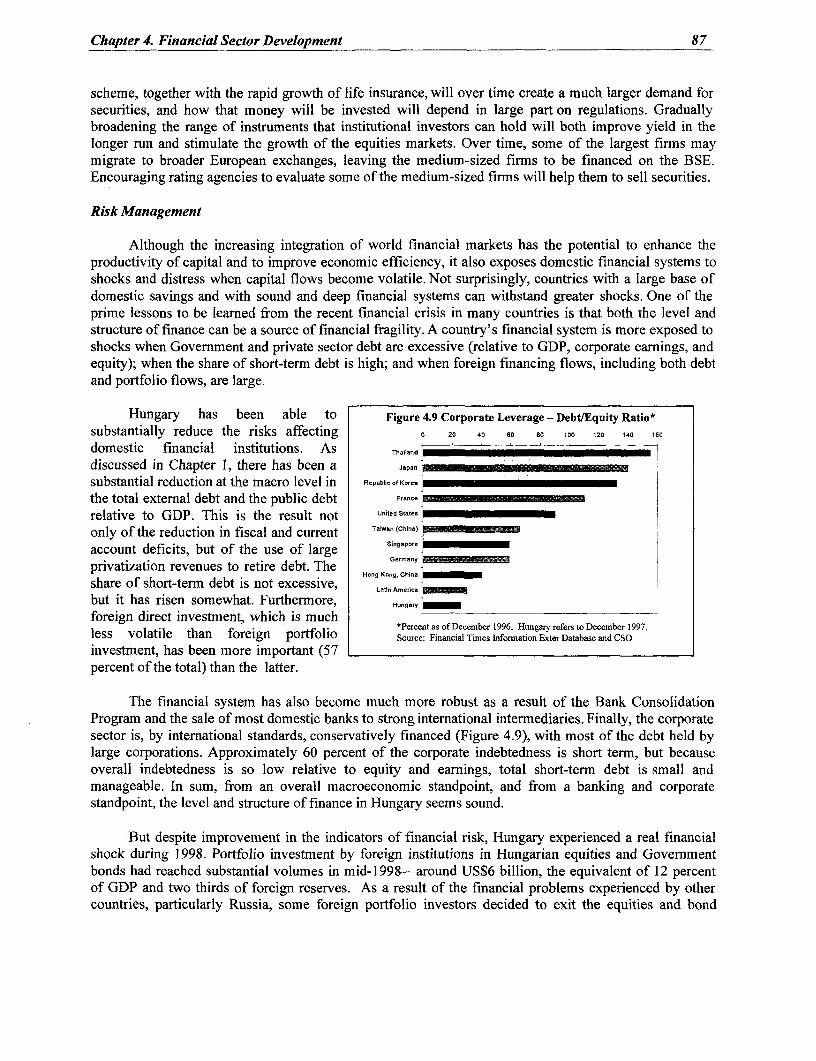
Chapter 4. Financial Sector Development 87
scheme, together with the rapid growth of life insurance, will over time create a much larger demand forsecurities, and how that money will be invested will depend in large part on regulations. Graduallybroadening the range of instruments that institutional investors can hold will both improve yield in thelonger run and stimulate the growth of the equities markets. Over time, some of the largest firms maymigrate to broader European exchanges, leaving the medium-sized firms to be financed on the BSE.Encouraging rating agencies to evaluate some of the medium-sized firms will help them to sell securities.
Risk Management
Although the increasing integration of world financial markets has the potential to enhance theproductivity of capital and to improve economic efficiency, it also exposes domestic financial systems toshocks and distress when capital flows become volatile. Not surprisingly, countries with a large base ofdomestic savings and with sound and deep financial systems can withstand greater shocks. One of theprime lessons to be learned from the recent financial crisis in many countries is that both the level andstructure of finance can be a source of financial fragility. A country's financial system is more exposed toshocks when Government and private sector debt are excessive (relative to GDP, corporate earnings, andequity); when the share of short-term debt is high; and when foreign financing flows, including both debtand portfolio flows, are large.
Hungary has been able to Figure 4.9 Corporate Leverage - Debt/Equity Ratio*substantially reduce the risks affecting 0 20 40 60 i0 100 120 140 160
domestic financial institutions. As Th.i1nod
discussed in Chapter 1, there has been a Japan
substantial reduction at the macro level in R.publi fo K.r.
the total external debt and the public debt France
relative to GDP. This is the result not UnitodStaten
only of the reduction in fiscal and current Tanvan (China)
account deficits, but of the use of large Singapore
privatization revenues to retire debt. The GermanyHong Kong, China
share of short-term debt is not excessive, tin Anerica _
but it has risen somewhat. Furthermore, Hungary
foreign direct investment, which is much*Percent as of December 1996. Hungary refers to December 1997.
less volatile than foreign portfolio Source: Financisa Times Information Exter Database and CSO
investment, has been more important (57percent of the total) than the latter.
The financial system has also become much more robust as a result of the Bank ConsolidationProgram and the sale of most domestic banks to strong international intermediaries. Finally, the corporatesector is, by international standards, conservatively financed (Figure 4.9), with most of the debt held bylarge corporations. Approximately 60 percent of the corporate indebtedness is short term, but becauseoverall indebtedness is so low relative to equity and earnings, total short-term debt is small andmanageable. In sum, from an overall macroeconomic standpoint, and from a banking and corporatestandpoint, the level and structure of finance in Hungary seems sound.
But despite improvement in the indicators of financial risk, Hungary experienced a real financialshock during 1998. Portfolio investment by foreign institutions in Hungarian equities and Governmentbonds had reached substantial volumes in mid-1998-around US$6 billion, the equivalent of 12 percentof GDP and two thirds of foreign reserves. As a result of the financial problems experienced by othercountries, particularly Russia, some foreign portfolio investors decided to exit the equities and bond
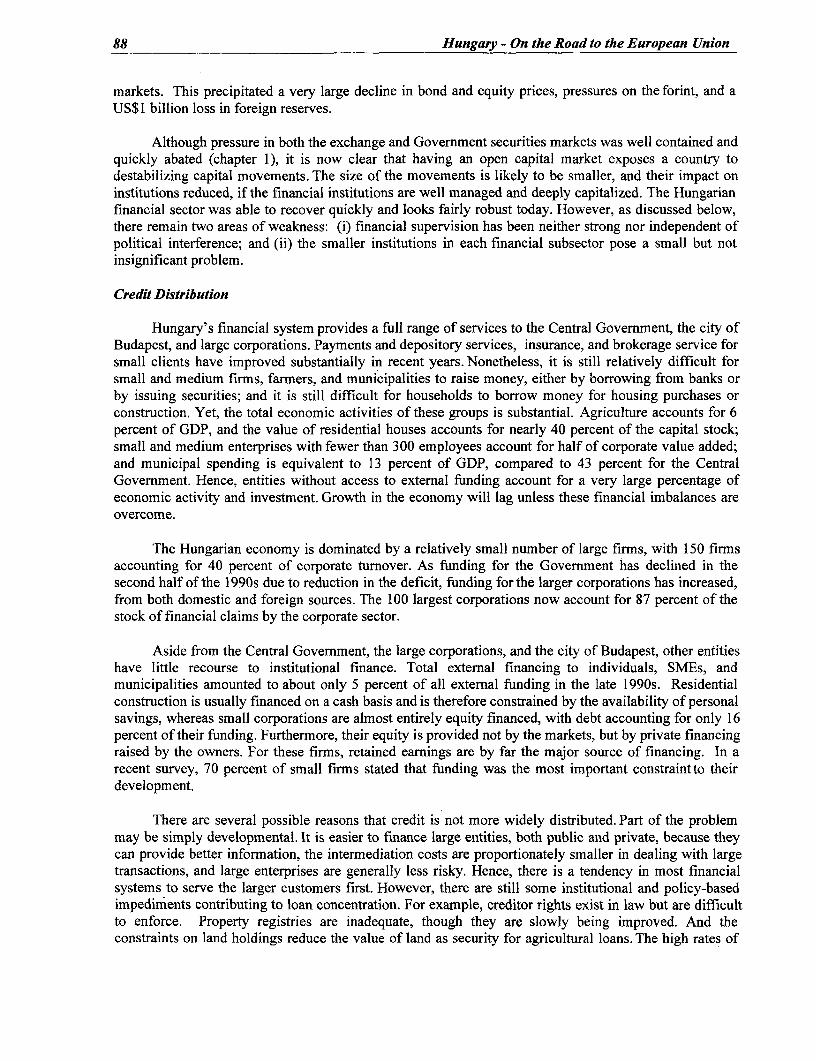
88 Hungary - On the Road to the European Union
markets. This precipitated a very large decline in bond and equity prices, pressures on the forint, and aUS$1 billion loss in foreign reserves.
Although pressure in both the exchange and Government securities markets was well contained andquickly abated (chapter 1), it is now clear that having an open capital market exposes a country todestabilizing capital movements. The size of the movements is likely to be smaller, and their impact oninstitutions reduced, if the financial institutions are well managed and deeply capitalized. The Hungarianfinancial sector was able to recover quickly and looks fairly robust today. However, as discussed below,there remain two areas of weakness: (i) financial supervision has been neither strong nor independent ofpolitical interference; and (ii) the smaller institutions in each financial subsector pose a small but notinsignificant problem.
Credit Distribution
Hungary's financial system provides a full range of services to the Central Government, the city ofBudapest, and large corporations. Payments and depository services, insurance, and brokerage service forsmall clients have improved substantially in recent years. Nonetheless, it is still relatively difficult forsmall and medium firms, farmers, and municipalities to raise money, either by borrowing from banks orby issuing securities; and it is still difficult for households to borrow money for housing purchases orconstruction. Yet, the total economic activities of these groups is substantial. Agriculture accounts for 6percent of GDP, and the value of residential houses accounts for nearly 40 percent of the capital stock;small and medium enterprises with fewer than 300 employees account for half of corporate value added;and municipal spending is equivalent to 13 percent of GDP, compared to 43 percent for the CentralGovernment. Hence, entities without access to external funding account for a very large percentage ofeconomic activity and investment. Growth in the economy will lag unless these financial imbalances areovercome.
The Hungarian economy is dominated by a relatively small number of large firms, with 150 firmsaccounting for 40 percent of corporate turnover. As funding for the Government has declined in thesecond half of the 1990s due to reduction in the deficit, funding for the larger corporations has increased,from both domestic and foreign sources. The 100 largest corporations now account for 87 percent of thestock of financial claims by the corporate sector.
Aside from the Central Government, the large corporations, and the city of Budapest, other entitieshave little recourse to institutional finance. Total external financing to individuals, SMEs, andmunicipalities amounted to about only 5 percent of all external finding in the late 1990s. Residentialconstruction is usually financed on a cash basis and is therefore constrained by the availability of personalsavings, whereas small corporations are almost entirely equity financed, with debt accounting for only 16percent of their funding. Furthermore, their equity is provided not by the markets, but by private financingraised by the owners. For these firms, retained earnings are by far the major source of financing. In arecent survey, 70 percent of small firms stated that funding was the most important constraintto theirdevelopment.
There are several possible reasons that credit is not more widely distributed. Part of the problemmay be simply developmental. It is easier to finance large entities, both public and private, because theycan provide better information, the intermediation costs are proportionately smaller in dealing with largetransactions, and large enterprises are generally less risky. Hence, there is a tendency in most financialsystems to serve the larger customers first. However, there are still some institutional and policy-basedimpediments contributing to loan concentration. For example, creditor rights exist in law but are difficultto enforce. Property registries are inadequate, though they are slowly being improved. And theconstraints on land holdings reduce the value of land as security for agricultural loans. The high rates of
Chapter 4. Financial Sector Development 89
inflation during most of the 1990s may also help to explain the concentration of credit. Inflationdiscourages financial intermediation in general, and long term lending in particular. Without long termlending, it is difficult to engage in non-subsidized mortgage finance.
Some of these constraints on external finance may be eased in the coming years. First, inflation hasdeclined steadily and is expected to continue to decline to average EU levels over the mediumterm. Lowinflation should encourage more mobilization of financial savings and long term lending, includingmortgage lending. Second, the corporate market is also becoming highly contested, interest rate spreadshave declined, and lending to the large firms has become less profitable. Thus, several banks are nowtargeting retail customers for lending as well as deposits. Third, institutional investors (e.g., pensionfunds) are becoming more prominent in Hungary; as in other countries, they will eventuallyinvest a smallfraction of their funds in venture capital financing. These funds have constituted a major financing sourcefor growing firms in the United States. But despite progress in these areas, creditor rights need to bestrengthened, restrictions on property sales need to be removed, and registries need to be improved. Suchchanges will make it possible for banks, contractual savings institutions, and the stock exchange to servemost mid-market firms.
For those very small enterprises that banks cannot serve, the Government is now considering amicrocredit scheme. Such programs have become common in other countries, and methods for theirsuccessful operation have been developed. Viable microcredit schemes initially provide very small loans,seldom more than US$500, with the loan size growing as the entrepreneur develops a successful credithistory. Very small firms often cannot provide collateral; hence, such lending is often based onprojectedrevenues. Microcredit programs are expensive to administer. While some administrative costs may besubsidized in the first years of operation, most programs aim to become financially viable within a fewyears. Thus, interest charges should be comparatively high to reflect the higher risk and administrativecosts of such lending.
Many Governments have attempted to overcome market impediments by establishing specializedfinancial institutions to serve particular markets. However, like markets, governments have found theseimpediments difficult to overcome. Furthermore, experience shows that such institutions, whenadministered on non-market principles, become political tools and end up with problem portfolios. If theGovernment of Hungary decides to implement a microcredit scheme, therefore, it should ensure that thescheme is administered according to market principles (e.g., with interest rates reflecting costs and risks,and with proper collateral), and that it is subject to periodic independent evaluations.
Housing Finance
The stock of Hungary's dwellings consists of about 4 million units, more than 93 percent of whichare owner occupied. The present challenge is the timely rehabilitation and replacement of older dwellings,rather than expansion of the housing stock. Annually, about 40 thousand new units plus the refurbishmentof many older dwellings, would be needed to maintain the housing stock. Nonetheless, only 28 thousandunits were built in 1997.
One issue of concern is that housing development depends on personal financing-more than 80percent of new units are built without any institutional finance. The share of state subsidies has fallenfrom 20 to 8 percent of total housing finance,7 and the share of bank loans to housing has dropped from10 to 1.5 percent (Figure 4.10). The stock of housing loans dropped from 10 to 5 percent of the banks'loan portfolio between 1991 and 1997; such loans represented less than 5 percent of households' annual
7 Only two thirds of the subsidies supported new development; the rest was spent on old housing loans.
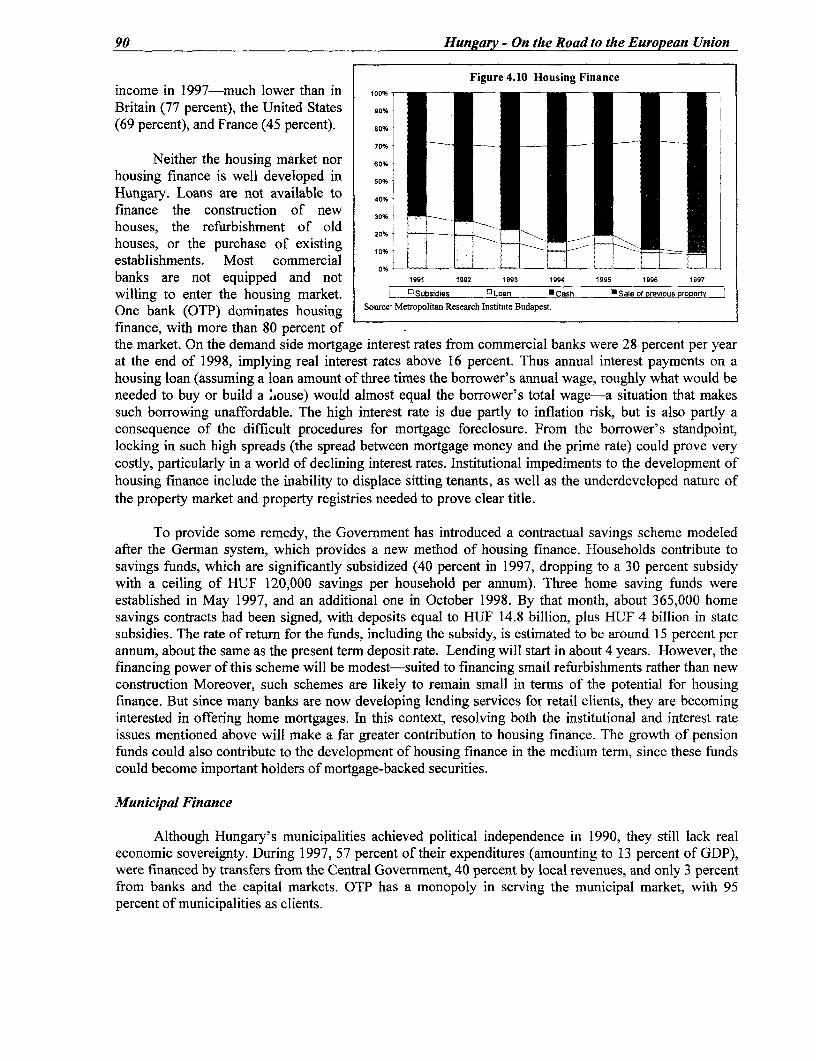
90 Hungary - On the Road to the European Union
Figure 4.10 Housing Financeincome in 1997-much lower than in 100%Britain (77 percent), the United States 90%(69 percent), and France (45 percent). 7 0%
70%
Neither the housing market nor 50%
housing finance is well developed in 50%
Hungary. Loans are not available to 40% *
finance the construction of new 30*
houses, the refurbishment of old 20%
houses, or the purchase of existing 10%.
establishments. Most commercialbanks are not equipped and not 19 1992 1993 1994 1995 1995 1997
willing to enter the housing market. i Subsidies tm
Loan * Cash Sale of weviousfrops
One bank (OTP) dominates housing Source: Metropolitan Research Institute Budapest.
finance, with more than 80 percent ofthe market. On the demand side mortgage interest rates from commercial banks were 28 percent per yearat the end of 1998, implying real interest rates above 16 percent. Thus annual interest payments on ahousing loan (assuming a loan amount of three times the borrower's annual wage, roughly what would beneeded to buy or build a lIouse) would almost equal the borrower's total wage-a situation that makessuch borrowing unaffordable. The high interest rate is due partly to inflation risk, but is also partly aconsequence of the difficult procedures for mortgage foreclosure. From the borrower's standpoint,locking in such high spreads (the spread between mortgage money and the prime rate) could prove verycostly, particularly in a world of declining interest rates. Institutional impediments to the development ofhousing finance include the inability to displace sitting tenants, as well as the underdeveloped nature ofthe property market and property registries needed to prove clear title.
To provide some remedy, the Government has introduced a contractual savings scheme modeledafter the German system, which provides a new method of housing finance. Households contribute tosavings funds, which are significantly subsidized (40 percent in 1997, dropping to a 30 percent subsidywith a ceiling of HUF 120,000 savings per household per annum). Three home saving funds wereestablished in May 1997, and an additional one in October 1998. By that month, about 365,000 homesavings contracts had been signed, with deposits equal to HUF 14.8 billion, plus H{UF 4 billion in statesubsidies. The rate of return for the funds, including the subsidy, is estimated to be around 15 percent perannum, about the same as the present term deposit rate. Lending will start in about 4 years. However, thefinancing power of this scheme will be modest-suited to financing smail refurbishments rather than newconstruction Moreover, such schemes are likely to remain small in terms of the potential for housingfinance. But since many banks are now developing lending services for retail clients, they are becominginterested in offering home mortgages. In this context, resolving both the institutional and interest rateissues mentioned above will make a far greater contribution to housing finance. The growth of pensionfunds could also contribute to the development of housing finance in the medium term, since these fundscould become important holders of mortgage-backed securities.
Municipal Finance
Although Hungary's municipalities achieved political independence in 1990, they still lack realeconomic sovereignty. During 1997, 57 percent of their expenditures (amounting to 13 percent of GDP),were financed by transfers from the Central Government, 40 percent by local revenues, and only 3 percentfrom banks and the capital markets. OTP has a monopoly in serving the municipal market, with 95percent of municipalities as clients.
Chapter 4. Financial Sector Development 91
Municipalities carry out about 40 percent of public investment, and this percentage is likely toincrease in the future. In the course of integration with the EU, huge infrastructure investments will beneeded, with wastewater treatment alone costing an estimated HUF 800 billion (US$2 billion). Transfersfrom the EU may reach up to 2 percent of GDP per annum (around US$1 billion) if the municipalities canprovide the needed cofinancing, which under the present formula is 20 percent of project cost (it isexpected to rise to 50 percent in future years). However, the municipalities will be unable to absorb thetransfers unless they develop their capacity to generate their own resources and borrowing capacity.
Municipal borrowing capacity is constrained, however, by the fact that most are not good creditrisks: they are small and lack sound financial management; they have limited resources acceptable tolenders as collateral; and have little financial capacity for debt repayment, which is tightly regulated bylaw.8 The Central Government has made it clear that it will not guarantee the debts of the municipalities.Although present regulations do allow municipalities to issue general obligation and revenue bonds, highinflation and uncertainties about utility tariffs have discouraged the issuance of such instruments.Moreover, no more than 50 communities are sufficiently large to enter, the bond market. Nor havemunicipalities developed regional associations of sufficient size to provide cost-efficient service delivery(known as special districts in the United States). Finally, many municipalities have been unwilling toborrow, since they believe they might eventually be eligible for Government subsidies to finance the sameinvestment.
To overcome these difficulties, municipalities must develop good borrowing practices. They mustborrow to fund investment, not current expenditures, ensuring that the investments are sound and cancover borrowing costs, often on a non-recourse, project financing basis. Where this is not appropriate,they must ensure that municipal revenues will be adequate to service debt payments. Given the small sizeof so many Hungarian municipalities, they should join together to form special purpose entities largeenough for the efficient provision of some services. Legal changes may be necessary to ensure that suchentities are vested with appropriate powers to enter into contracts, to borrow, to levy fees for service, andto pledge project revenues as security against loans. Government policies should encourage thesecuritization and trading of municipal loans. Establishing a national data base on municipal financewould provide creditors with transparent, reliable, and standardized information. This would, among otherthings, provide information on subnational debts, including guarantees and contingent liabilities, as wellas on the collateralized assets of local governments.
Given that few municipalities will be able to access the bond market directly, the Governmentshould consider establishing a specialized bank for municipal finance, as exists in several other Europeancountries. However, many of the problems mentioned above will not be resolved simply by creating aspecialized bank. Should such an entity be established, it should operate on market principles, lendingonly for viable projects able to generate the revenue needed to service debts, or to local entities withadequate revenue sources. The Government should not guarantee local borrowing, and all lending shouldbe on market terms. Funding, and risk and project management including service pricing, should supportmarket sustainability of the project, the municipality, and the financial intermediary.
8 The Municipal Bankruptcy Law creates a clear course of action to be followed in case of financial failure of a municipality,and makes clear that losses must be absorbed by creditors without Government bailout. This rule has been followed in 8bankruptcy cases since 1995.

92 Hungary - On the Road to the European Union
EU and OECD Compatibility
Although Hungary has made substantial progress in meeting EU and OECD standards, some minorredrafting of laws and regulations is required in several areas to ensure full compliance. These include thetreatment of foreign branches, ceilings on deposit insurance, cross-border trade in financial services,capital adequacy, and the regulation of capital movements.
Treatment of foreign branches. While branches of foreign banks do not require a separate legalpersonality, they do have to be entered into the companies' registries as separate entities. Branches offoreign banks have to comply with Hungarian banking regulations independent of the parent company,even though the latter is liable for any outstanding debts of the branch in the case of liquidation. Hence,foreign branches in Hungary are more like subsidiaries, and such status does not meet EU requirements.Under EU rules, foreign banks must be allowed to set up branches without special capital requirements,thus enjoying the non-resident status of their parents. This has a number of implications. When a foreignbank operates as a branch, the limitation of its risk depends on the capital of the parent, putting at somedisadvantage domestic banks with small capital. Second, deposits are treated as obligations of the parent.This would violate the Hungarian Act on Foreign Exchange, which presently restricts residents fromholding deposits abroad. A change in the foreign exchange rules is scheduled to be made by the time ofEU accession.
Deposit insurance. Hungary will have to gradually increase the level of deposit insurance, fromthe present compensation limit of HUF 1 million to ECU 20,000 (the equivalent of HUF 5 million).Although raising this limit would imply more protection relative to the level of average wages (incomparison with the average EU ratio) and potentially greater moral hazard problems, not raising thelimit would put Hungarian banks at a disadvantage relative to banks in otherparts of the EU. Hungaryintends to implement the higher level of protection over a five-year period.
Cross-border trade in financial services. Hungary does not yet permit cross-border trading infinancial services, as required by the EU. While Hungary does not have to conform to EU regulationsuntil the date of joining, it does need to decide whether the opening should be gradually implemented ordone all at once at the time of joining. Opening the market will certainly increase competition and reducespreads, particularly in those market segments that are not presently contested, such as the insurancesector. Continued gradual liberalization in services seems advisable, so that the finns are graduallyexposed to a more competitive environment. It would be useful for the Government to make clear to firmsthe schedule for opening trade in financial services.
Capital adequacy. Though in several ways Hungary's capital adequacy requirements are morestringent than the EU's Capital Adequacy Directive (CAD), they still need to be harmonized with thelatter. The CAD imposes new capital requirements for the market risks (e.g., position risks) contained inthe trading book that must be kept by every financial institution as of January 1999. Many definitionsused by the CAD, however, simply do not exist in Hungarian law, or have a different meaning. TheGovernment is supposed to issue decrees that would contain detailed rules on the trading book and thecapital requirements for the risks contained therein, as well as detailed rules of performance of individualportfolio managers. However, because of the date set by the EU for the implementation of universalbanking, it is feared that there will not be enough time to prepare these decrees9
The issue of capital adequacy also arises in the case of the savings cooperatives, a group of morethan 240 small institutions presently covered by the banking law. Many savings cooperatives do not meet
9 The decrees are detailed rules on trading book risks. They will likely be issued in mid-2000 and enter into force in early 2001.
Chapter 4. Financial Sector Development 93
the capital requirements for financial institutions because of their small size. Only if these institutionswere integrated, as is done in some European countries, would the group's capital be adequate. TheGovernment should considers ways to encourage the merger of many of the smaller cooperatives. Oneway to ensure this would be to raise the minimum capital from HUF 100 million to, HUF 300 million.This would bring the cooperatives in line with the capital requirement of the EU's Second BankingDirective of the EU, which requires minimal capital of Euro I million (equal to HUF 250 million).
Capital movements. While undertaking recent significant liberalization, to fully meet therequirements of the EU, as well as the agreements reached with the OECD, further liberalization ofcapital movements will be required. The Government has scheduled full liberalization of long-termcapital movements for late 1999, barring adverse changes in the international financial environment.Given the somewhat fragile nature of the world's financial markets at the end of 1998, controls. on short-term movements are to remain in force. Indeed, the Government should move cautiously on furtherliberalization of short-term capital, in particular in H1UF-denominated money market operations-themost volatile part of the market. By the time of entry into the EU, however, Hungary needs to haveestablished an economy that can operate with open capital markets. Also in keeping with EU standards,Hungary must eliminate anonymous accounts that can potentially be used for money laundering.
CONCLUSION
In the field of finance, Hungary is in the forefront of reforms among transition economies. Its legalframework for banking has been greatly improved and harmonized with that of the EU (with theexceptions noted above); and its banks have been restructured and sold, for the most part, to strongforeign strategic investors. After an initial period of heavy losses, the insurance sector is relativelyhealthy, and the capital market has developed rapidly in both size and liquidity. The recently enactedpension reform is expected to result in the rapid growth of pension fund assets, further boosting thedevelopment of the domestic capital market.
Important aspects of reform, however, still need to be addressed. The recent failure of Postabank,one of largest bank -- for years rumored to be engaged in unsound practices-indicates that supervisionstill needs to be strengthened and made more independent of political pressure. In banking, insurance, andbrokerage, there are too many small and weak firms. Higher capital requirements would lead to mergersof these small units and help reduce institutional risk in the market. While credit risk management hasimproved substantially, expertise and sophisticated regulation of market risks (e.g., foreign exchange,interest rate, and stock market risk) still requires improvement. Hungary has maintained some controlover capital movements; given the volatility of capital markets, such controls have probably provedpositive. Capital controls will be difficult to maintain, however, as Hungary becomes more integratedwith the EU. Thus Hungary will need to replace overt controls with stable macro and financial policiesthat discourage volatile capital movements. Access to funding needs to be improved for certain classes ofsmall borrowers. Here it is less clear what needs to be done, for this is in part a developmental problemthat only time and experience will rectify. However, bringing inflation under control and working toclarify property rights in agriculture and housing will certainly help. Some changes in laws andregulations are also needed to bring Hungary's financial sector into conformity with EU specifications.However, the overall assessment is that the Hungarian financial system, in terms of laws, regulations, andinstitutional strength, will be ready for the country's entry into the European Union.
5. ENTERPRISE SECTOR IN TRANSITION
Industry accounts for one quarter of the economy's GDP (down from about half during the socialistera), and manufacturing is the most important industrial subsector. Despite Hungary's aging and slightlydeclining population, aggregate savings have been sizable, and -augmented by sustained capital inflows-have financed investments in recent years amounting to 20 to 25 percent of GDP, to modernize the country'scapital stock. Utilities are also undergoing major changes: they are being privatized and refurbished and theirregulatory regimes are undergoing reform. This chapter describes developments in the unregulatedmanufacturing enterprises. Utilities and regulatory issues are discussed in chapter 6.
LOOKING BACK
The Politcal Backdrop
Even during the previous regime, entrepreneurship was not absent in Hungary's economy. Aware ofthe serious information problems of running a centrally planned economy, the authorities accorded manyenterprise managers sufficient autonomy. Enterprise managers knew their business, having risen through theranks, and were accustomed to operating with little Government oversight.
Although most firms were run without the state's heavy hand, the market was not allowed to operatefreely. Resources were misallocated, both because relative prices were distorted and because there was nomechanism to redirect one firm's surplus to another in need of resources. Investment was consequentlymisallocated across firms, and inappropriate technology (embedded in the machinery) was often selected.Non-market alternatives such as cross-ownership and holding companies were considered a possible remedy,but except for the ownership of commercial banks by industrial firms, such ownership patterns were rare.
Capitalism was not wholeheartedly embraced when Communism collapsed. Hungarian economists andpublic alike distrusted privatization because of experiences with self-dealing and asset stripping during the late1980s. Moreover, the earlier debates about how to make central planning work better had heightenedawareness of alternative ownership and governance structures. So while the Government was not averse toprivatization per se, most Hungarian economists argued that passive, dispersed private owners would notoversee enterprise managers any more effectively than the state had.2 The Government therefore soughtresponsible owners from the outset, and eschewed voucher and other mass privatization schemes. Selling acontrolling stake to insiders was also rare: although managers and employees could buy the shares at a 5 to 10percent discount, there were fewer than 100 instances when they bought a majority of a firm's shares. Selling acontrolling stake to foreigners was the logical alternative to selling to insiders or to mass privatization.
IThis chapter is based on Toth (1998), Hamar (1998), Csaba (1998), Borszeki (1998), and numerous other secondary sources.2.Janos Kornai, the prominent Hungarian economist who was influential in ensuring managerial autonomy, made a volte face in 1989when he argued for privatization, saying, "Let us not give unrestricted power to the manager of the state-owned firm."
94
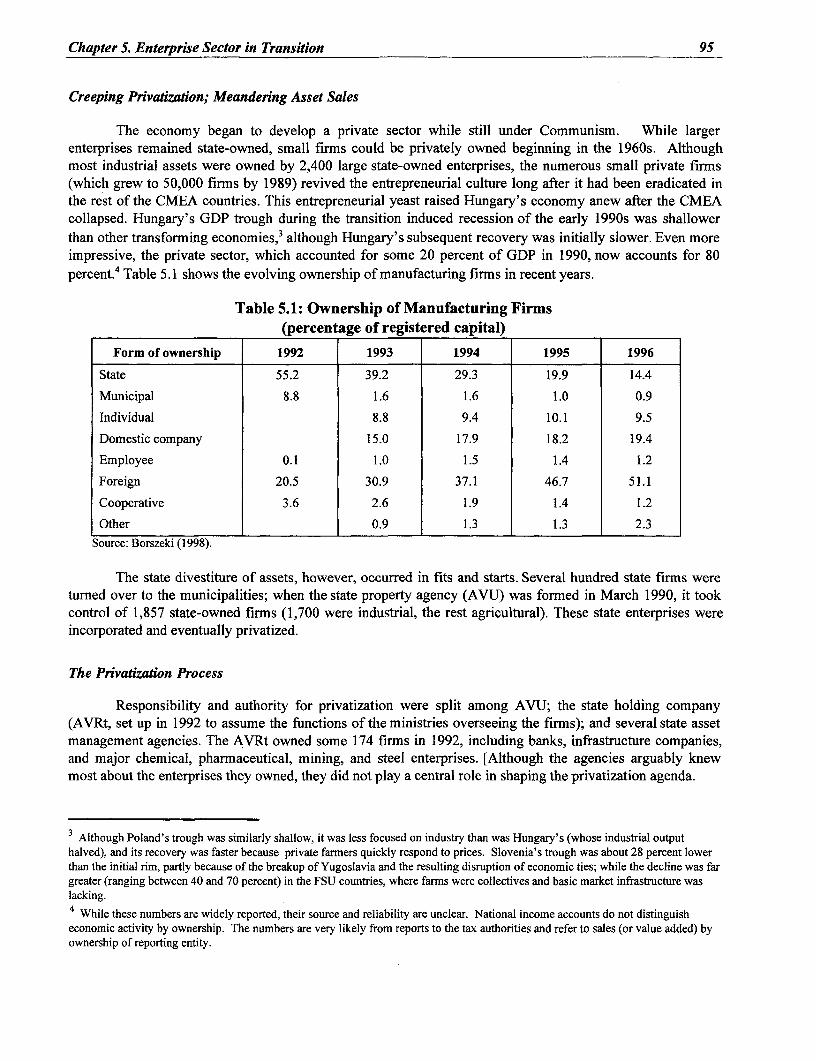
Chapter 5. Enterprise Sector in Transition 95
Creeping Privatization; Meandering Asset Sales
The economy began to develop a private sector while still under Communism. While largerenterprises remained state-owned, small firms could be privately owned beginning in the 1960s. Althoughmost industrial assets were owned by 2,400 large state-owned enterprises, the numerous small private firms(which grew to 50,000 firms by 1989) revived the entrepreneurial culture long after it had been eradicated inthe rest of the CMEA countries. This entrepreneurial yeast raised Hungary's economy anew after the CMEAcollapsed. Hungary's GDP trough during the transition induced recession of the early 1990s was shallowerthan other transforming economies,3 although Hungary's subsequent recovery was initially slower. Even moreimpressive, the private sector, which accounted for some 20 percent of GDP in 1990, now accounts for 80percent.4 Table 5.1 shows the evolving ownership of manufacturing firms in recent years.
Table 5.1: Ownership of Manufacturing Firms(percentage of registered capital)
Form of ownership 1992 1993 1994 1995 1996
State 55.2 39.2 29.3 19.9 14.4
Municipal 8.8 1.6 1.6 1.0 0.9
Individual 8.8 9.4 10.1 9.5
Domestic company 15.0 17.9 18.2 19.4
Employee 0.1 1.0 1.5 1.4 1.2
Foreign 20.5 30.9 37.1 46.7 51.1
Cooperative 3.6 2.6 1.9 1.4 1.2
Other 0.9 1.3 1.3 2.3Source: Borszeki (1998).
The state divestiture of assets, however, occurred in fits and starts. Several hundred state firms weretumed over to the municipalities; when the state property agency (AVU) was formed in March 1990, it tookcontrol of 1,857 state-owned firms (1,700 were industrial, the rest agricultural). These state enterprises wereincorporated and eventually privatized.
The Privatization Process
Responsibility and authority for privatization were split among AVU; the state holding company(AVRt, set up in 1992 to assume the functions of the ministries overseeing the firms); and several state assetmanagement agencies. The AVRt owned some 174 firms in 1992, including banks, infrastructure companies,and major chemical, pharmaceutical, mining, and steel enterprises. [Although the agencies arguably knewmost about the enterprises they owned, they did not play a central role in shaping the privatization agenda.
3Although Poland's trough was similarly shallow, it was less focused on industry than was Hungary's (whose industrial outputhalved), and its recovery was faster because private farmers quickly respond to prices. Slovenia's trough was about 28 percent lowerthan the initial rim, partly because of the breakup of Yugoslavia and the resulting disruption of economic ties; while the decline was fargreater (ranging between 40 and 70 percent) in the FSU countries, where farms were collectives and basic market infrastructure waslacking.
4 While these numbers are widely reported, their source and reliability are unclear. National income accounts do not distinguisheconomic activity by ownership. The numbers are very likely from reports to the tax authorities and refer to sales (or value added) byownership of reporting entity.

96 Hungary - On the Road to the European Union
Firms were sold mainly for cash through auctions and tenders, although about 7 percent of state assetswere sold using compensation certificates5 which were distributed among victims of the fascist and communistregimes. Municipalities accepted these certificates as payment when apartments were privatized; instead ofextinguishing them, municipalities either sold these certificates in the secondary market for cash or used themto buy shares in firms.
Because of a running dispute between the Central and the municipal governments about what eachowned, the sale of major utilities was delayed until 1995. Municipalities wanted to own firms with operatingsurpluses and were reluctant to acquire loss-making utilities that required subsidies (e.g., district heating,municipal tram and bus services). These disputes delayed privatization when the sale could have reduced theoperating losses. Privately owned utilities could have more easily raised prices in step with inflation, collectunpaid bills, and raise the funds needed for highly profitable investments such as replacing rusted water mains,or e-insulating heat distribution pipes.
In 1996, the state asset management agencies transferred about HUF 65 billion worth of shares,representing minority holdings in 40 privatized companies, to the Health and Pension Funds.
Pnivatization Scoreboard
Although the AVU had divested roughly 75 percent of its initial holdings by mid-1995, this amountedto only 35 percent of the state's stake because AVRt held the large firms: electricity, gas, airlines, railways (ahuge loss-maker), telecommunications, banking, and some chemical firms. Many of these larger firms wereHungary's largest loss makers and required subsidies to cover operating cash deficits. The losses stemmedfrom controlled prices, the repercussions of the CMEA's collapse, and operating inefficiencies.
Privatization got its final and much needed boost in 1995 when, as part of the stabilization packagesupported by the Bank, the Government drastically reduced the list of firms it would continue to own (to therailways, postal service, and national parks). As part of this effort, APVRt (which succeeded the AVRt) wasmerged with the AVU and given a clear mandate to sell some HUF 1.3 trillion worth of equity6 (out of HUF1.6 trillion it held). Also as part of this effort, the Privatization Law was amended in June 1997 to allow thesale of all but the golden shares7 in 18 firms previously considered strategic, including the savings bank (OTP)and the telecommunications company (MATAV). Majority and minority holdings in 116 firms, and goldenshares in 27 others, will remain in the hands of the state. By the end of 1997, HiUF 790 billion worth of equityhad been sold (in addition to what was transferred to the social security funds and municipalities). TheHungarian power transmission company (MVM) is now the only large firm left to be privatized (for adiscussion of utilities, see chapter 6).
5 The agency accepted certificates at face value (HUF 1,000) indexed to the price level. Certificates were issued in different years as theGovernment acknowledged the demands of various groups. The certificates traded in the secondary market at a discount; as arbitragekept the discount from the indexed value uniform, the discount from the face value depended on the certificate's vintage.6 Some HUF 1,227 billion was in majority equity holdings in 171 large firms, and HUF 40 billion in 259 small and medium-sizedfirms with fewer than 500 employees. APVRt also had HUF 356 billion in minority equity holdings in 145 large and HUF 7 billion in176 small firms. In addition, APVRt had HUF 162 billion as (book value of) equity in 77 large and 513 small firms in the process ofbeing liquidated.
7A golden share, which cannot be sold, allows the Government a disproportionately large vote in a firm's annual meeting. It wasintroduced to allow the sale of firms in which the Government wanted a say in major decisions but not in day-to-day operations.

Chapter 5. Enterprise Sector in Transition 97
Spending the Receipts
In consideration of the restructuring needs of the newly privatized firms, they were given 20 percentof the privatization receipts as a grant. The remaining proceeds, net of the privatization agency's direct salesexpenses (roughly 5 percent of revenues), went to the Government budget.8
The meager privatization revenues of the early 1990s provided little temptation for profligacy.However, the 1995 decision to privatize almost all remaining state-owned firmns triggered a heated debate overspending the receipts. The Government decided that it would have been imprudent to spend the non-recurringprivatization receipts on recurring expenditures and transfers, especially when the stabilization package soughtto keep the budget deficit sustainable. Thus, the bulk of the annual earnings from the receipts were used toreduce the outstanding debt (both domestic and foreign currency). The smaller future interest expense from thelower stock of debt allows a larger primary budget deficit (i.e., higher recurring expenditures and/or lower taxreceipts) for any level of overall budget deficit.
As a result, Government debt fell from 86 percent of GDP in 1995 to 60 percent in 1998. Growth ofthe economy since 1995 accounted for some of the decline in the Government's debt to GDP ratio, butprivatization receipts clearly played a major role.
The Role of Foreign Direct Investment
Hungarian firms had been allowed to link up with foreign (including non-CMEA) firms since 1968.Joint ventures with a Hungarian majority had been permitted since 1972, and foreign majority firms since1988. Nonetheless, FDI and the number of joint ventures remained modest until the late 1980s, when inflowsbegan to increase significantly, reflecting the westward shift of Hungarian trade after the collapse of theCMEA.
The early joint ventures enabled foreigners to assist local partners, usually state enterprises, innegotiating the legal and bureaucratic hurdles facing businesses. As the Hungarian private sector was alloweda larger role, foreigners increased their stake in their joint ventures, and began to integrate their Hungarianunits with their operations abroad. Although the overall number of joint ventures has recently decreased(because the inactive ones were liquidated), new wholly owned subsidiaries have become the norm, not theexception. In 1992, foreigners usually had only a blocking minority stake, but this slowly changed over theyears, and majority and wholly owned subsidiaries have become more common.
Origins and Recipients of FDI
Hungary attracted some US$16 billion in FDI by 1997 (Appendix Table 7.1), and the average annualinflow of more than 5 percent of GDP between 1991 and 1997 is exceptionally high. About a third of thisflows to wholly foreign owned firns, and the rest to joint ventures andpartially foreign-owned domestic firmns.Germany has been the largest source country for FDI through privatization, with roughly 35 percent of the
8In the early years, buyers were allowed to pay over time. The privatization agency, using the accrual concept, recognized thecommitted price as revenue, and considered the deferred payment as a loan (E-loan). Commercial banks formally extended the loan,with a 3-year grace and a 15-year repayment term, at concessional rates, which were rediscounted at the central bank. The Governmentbudget, however, is on a cash basis, and reconciling these differences is arduous. The amounts, however, were small until 1995, bywhich time the E-loan scheme had withered away. The cumulative total of E-loan sales was HUF 41.67 billion in April 1994.

98 Hungary - On the Road to the European Union
total; the United States (20 percent) and France (12 percent) are other major sources.9 In 1998, a new foreigninvestment law gave foreigners the same protections as domestic firms, and there is no longer a distinctionbetween affiliates and branches of foreign companies.
There are now some 30,000 firms with foreign participation; about a third of them-mostly the largerones-are wholly foreign owned. Furthermore, the proportion of the wholly foreign firms will likely risebecause they account for almost two thirds of all newly incorporated firms (1997 data). Such a changesuggests a shift toward well integrated multinational operations rather than arn's length Hungariansubsidiaries.
FDI has been most widespread in manufacturing (particularly food and mechanical engineering,Appendix Table 7.2), where, by the end of 1996, more than half the assets"0 were in firms with some FDI (upfrom one fifth in 1992). Within manufacturing, as shown in Table 5.2, wholly owned (91 to 100 percent) FDIfirms have tripled in number, reaching 1,857 in 1996 and accounting for 70 percent of assets owned by foreigninvestors.
Most firms in the export promotion zones (more than three quarters of the exports from these zonesare of electronic items) have some at least minority foreign ownership. Although firms with FDI are widelyscattered across the country, they tend to be concentrated in the western part of the country perhaps because ofthe transport and infrastructure advantages. Firms with FDI also are more trade oriented, exporting almost halftheir sales, while non-FDI firms export only a fifth of their sales. These proportions are deceptive, however,because exports are often disguised as domestic sales to exporting firms. So domestic firms indirectly exportmore than the data suggest.
Table 5.2: FDI Ownership in Manufacturing Firms, 1992 and 1996% FDI ownership Number of Companies Companies (%) FDI (HUF billion) FDI (% value)
1992 1996 1992 1996 1992 1996 1992 1996<10% 9,151 14,291 78.8% 79.1% 0.3 0.7 0.1% 0.1%11%-50% 1,111 1,009 9.6% 5.6% 42.3 77.2 21.4% 11.9%51%-90% 677 813 5.8% 5.1% 65.7 116.7 33.3% 18.0%91%-100% 681 1,857 5.9% 10.3% 89.2 453.2 45.2% 70.0%Total 11,620 18,070 100% 100% 197.5 647.7 100% 100%Source: Hamar's (1998) calculations using double accounting firms' balance sheet reports to Tax Office.
These findings should not be surprising: foreign investors rarely set up ventures in small, non-tradedactivities. So FDI firms are generally export (and import) intensive, and often fund suppliers facing funding orinvestment constraints. FDI firms also tend to be less labor intensive than domestic firms-although thedifference may be less than the data suggest. Domestic firms may show fewer workers on their payroll due tothe legacy of incorporated work units and the temptation to evade the high tax rates for pensions and socialservices.
9 Precise data are not available. The receipts are cumulated in HUF, but the shares would be somewhat different if adjusted for theexchange rate changes over the years. Also, the Netherlands would be listed as the source of a wholly owned Dutch subsidiary of anAmerican parent.
10 These data are based on book values, and the accounting system ignores inflation, which fluctuated greatly and still has not declinedbelow 17 percent annually. So one must be especially careful in drawing conclusions.
Chapter 5. Enterprise Sector in Transition 99
Benefits of FDI
Although profits accruing to the foreign owner may eventually be repatriated, FDI benefits the country(especially workers) through higher productivity and wages." Higher productivity can come in three ways: (i)improved technology, (iii) better management, and (iii) access to credit. While firms without FDI can buy thesame technically advanced machines, a foreign partner can help to choose and operate the best machine, andalso help to improve the firm's efficiency and product quality through training of staff and management.Importantly, a foreign owner can overcome domestic funding constraints by easing access to foreign banks.
In addition, even though FDI firms are geographically concentrated in the western part of Hungaryand around Budapest, the benefits are widely dispersed throughout the country. Domestic firms supplying theFDI firms are also located in other regions, and workers all over the country will benefit from the rise in wagesresulting from increased labor productivity.
Both quantitative and anecdotal evidence suggest that FDI firms gain access to credit more easily thandomestic firms. Although Hungarian firms have surprisingly little debt, Table 7.3 in the Appendix shows thatfirms with FDI have proportionately more long-term credit (and less short-term credit) than domestic firms do.The true difference may be even greater than the data show because the denominator (the book value of assets)is biased downward for domestic firms with older equipment. The difference in borrowing could reflectsignaling rather than credit access per se: if lenders cannot evaluate the borrower independently, the foreignpartner's presence may implicitly attest to the firm's viability.
FDI can also facilitate access to credit by domestic firms. An FDI firm could overcome any fundingproblems of a reliable domestically owned supplier by paying for purchases in advance. Appendix tables 7.3and 7.4 suggest that this occurred. Table 7.4 shows that firms with some foreign ownership buy or sellproportionately more to, and from, domestic firms, and Table 7.3 suggests that domestic firms have moreshort-term debt to own capital.
Have Firms Restructured?
Most privately owned (both domestic and FDI) and state-owned firms have restructured theiroperations, although firms that have remained state owned have restructured the least. Of those that wereprivatized, many began restructuring well before they were privatized-although studies 2 have shown that theperformance of privatized and state-owned firms differed less in Hungary than elsewhere in eastern Europe.What seems to really matter is FDI: firms with even some FDI restructured faster and more extensively thanprivately owned domestic firms.
While these findings point to the benefits of FDI, it would be wrong to deny the benefits ofprivatization, as FDI flows may have reflected direction, not the pace, of Hungarian reform, and the emphasison private markets. Thus privatization was an important milestone marking the continuing evolution of firms.
Loss Makers in Utilities
The top panel of Table 5.3 shows that gross losses in industry rose alarmingly during the early yearsof the transition, from 0.6 percent of GDP in 1988 to 14.2 percent in 1992, before starting to fall. In this
I See related discussion on the labor market in chapter 7.12 See Pohl et al (1997), which uses survey data of about 1,000 Hungarian firms from 1992 until 1995.
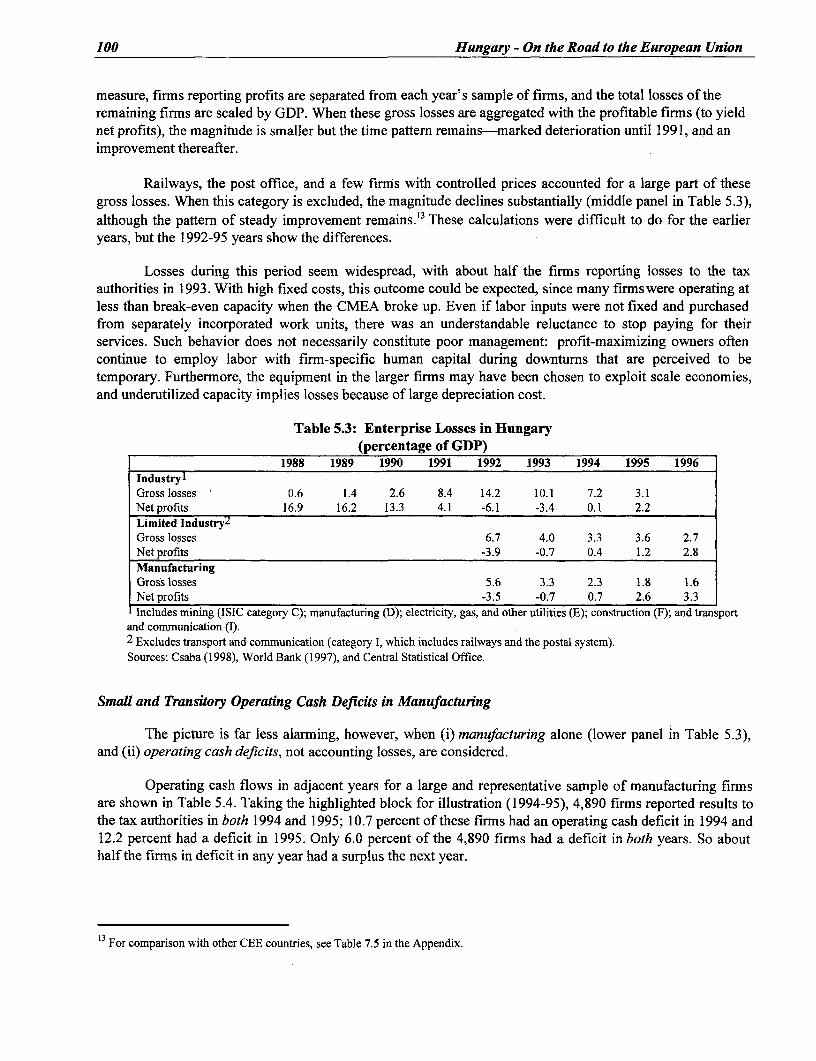
100 Hungary - On the Road to the European Union
measure, firms reporting profits are separated from each year's sample of firms, and the total losses of theremaining firms are scaled by GDP. When these gross losses are aggregated with the profitable firms (to yieldnet profits), the magnitude is smaller but the time pattern remains-marked deterioration until 1991, and animprovement thereafter.
Railways, the post office, and a few firms with controlled prices accounted for a large part of thesegross losses. When this category is excluded, the magnitude declines substantially (middle panel in Table 5.3),although the pattern of steady improvement remains.13 These calculations were difficult to do for the earlieryears, but the 1992-95 years show the differences.
Losses during this period seem widespread, with about half the firms reporting losses to the taxauthorities in 1993. With high fixed costs, this outcome could be expected, since many firmswere operating atless than break-even capacity when the CMEA broke up. Even if labor inputs were not fixed and purchasedfrom separately incorporated work units, there was an understandable reluctance to stop paying for theirservices. Such behavior does not necessarily constitute poor management: profit-maximizing owners oftencontinue to employ labor with firmn-specific human capital during downturns that are perceived to betemporary. Furthermore, the equipment in the larger firms may have been chosen to exploit scale economies,and underutilized capacity implies losses because of large depreciation cost.
Table 5.3: Enterprise Losses in Hungary(percentage of GDP)
1988 1989 1990 1991 1992 1993 1994 1995 1996IndustrylGross losses 0.6 1.4 2.6 8.4 14.2 10.1 7.2 3.1Netprofits 16.9 16.2 13.3 4.1 -6.1 -3.4 0.1 2.2Limited Industry2
Gross losses 6.7 4.0 3.3 3.6 2.7Net profits -3.9 -0.7 0.4 1.2 2.8ManufacturingGross losses 5.6 3.3 2.3 1.8 1.6Net profits -3.5 -0.7 0.7 2.6 3.3Includes mining (ISIC category C); manufacturing (D); electricity, gas, and other utilities (E); construction (F); and transport
and communication (I).2 Excludes transport and communication (category 1, which includes railways and the postal system).Sources: Csaba (1998), World Bank (1997), and Central Statistical Office.
Small and Transitory Operating Cash Deficits in Manufacturing
The picture is far less alarming, however, when (i) manufacturing alone (lower panel in Table 5.3),and (ii) operating cash deficits, not accounting losses, are considered.
Operating cash flows in adjacent years for a large and representative sample of manufacturing firmsare shown in Table 5.4. Taking the highlighted block for illustration (1994-95), 4,890 firms reported results tothe tax authorities in both 1994 and 1995; 10.7 percent of these firms had an operating cash deficit in 1994 and12.2 percent had a deficit in 1995. Only 6.0 percent of the 4,890 firmns had a deficit in both years. So abouthalf the firms in deficit in any year had a surplus the next year.
13 For comparison with other CEE countries, see Table 7.5 in the Appendix.
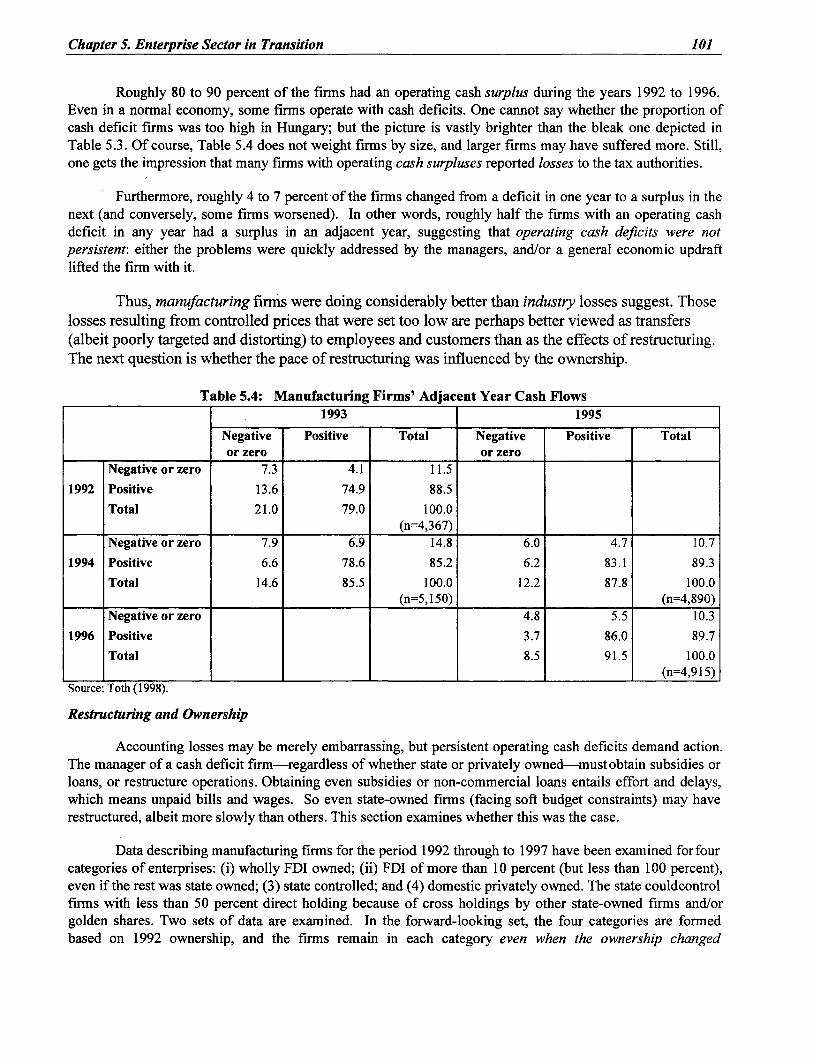
Chapter 5. Enterprise Sector in Transition 101
Roughly 80 to 90 percent of the firms had an operating cash surplus during the years 1992 to 1996.Even in a normal economy, some firms operate with cash deficits. One cannot say whether the proportion ofcash deficit firms was too high in Hungary; but the picture is vastly brighter than the bleak one depicted inTable 5.3. Of course, Table 5.4 does not weight firms by size, and larger firms may have suffered more. Still,one gets the impression that many firms with operating cash surpluses reported losses to the tax authorities.
Furthermore, roughly 4 to 7 percent of the firms changed from a deficit in one year to a surplus in thenext (and conversely, some firms worsened). In other words, roughly half the firms with an operating cashdeficit in any year had a surplus in an adjacent year, suggesting that operating cash deficits were notpersistent: either the problems were quickly addressed by the managers, and/or a general economic updraftlifted the firm with it.
Thus, manufacturing firm's were doing considerably better than industry losses suggest. Thoselosses resulting from controlled prices that were set too low are perhaps better viewed as transfers(albeit poorly targeted and distorting) to employees and customers than as the effects of restructuring.The next question is whether the pace of restructuring was influenced by the ownership.
Table 5.4: Manufacturing Firms' Adjacent Year Cash Flows1993 1995
Negative Positive Total Negative Positive Totalor zero or zero
Negative or zero 7.3 4.1 11.5
1992 Positive 13.6 74.9 88.5
Total 21.0 79.0 100.0________________ __________(n=4,367) _ _ _ _ _ __ _ _ _ _ _ _
Negative or zero 7.9 6.9 14.8 6.0 4.7 10.7
1994 Positive 6.6 78.6 85.2 6.2 83.1 89.3
Total 14.6 85.5 100.0 12.2 87.8 100.0(n=5, 150) (n=4,890)
Negative or zero 4.8 5.5 10.3
1996 Positive 3.7 86.0 89.7
Total 8.5 91.5 100.0_ _ _ _ _ _ _ _ _ _ _ _ _ _ _ _ _ _ _ _ _ _ _ _ _ _ _ _ _ _ _ _ _ _ _ _ _ _ _ _ _ _ _ _ _ _ _ _ _ _ _ _ _ _ _ _ _ _ _ _ _(n = 4 ,9 1 5)
Source: Toth (1998).
Restructuring and Ownership
Accounting losses may be merely embarrassing, but persistent operating cash deficits demand action.The manager of a cash deficit firm-regardless of whether state or privately owned-must obtain subsidies orloans, or restructure operations. Obtaining even subsidies or non-commercial loans entails effort and delays,which means unpaid bills and wages. So even state-owned firms (facing soft budget constraints) may haverestructured, albeit more slowly than others. This section examines whether this was the case.
Data describing manufacturing firms for the period 1992 through to 1997 have been examined for fourcategories of enterprises: (i) wholly FDI owned; (ii) FDI of more than 10 percent (but less than 100 percent),even if the rest was state owned; (3) state controlled; and (4) domestic privately owned. The state couldcontrolfirms with less than 50 percent direct holding because of cross holdings by other state-owned firms and/orgolden shares. Two sets of data are examined. In the forward-looking set, the four categories are formedbased on 1992 ownership, and the firms remain in each category even when the ownership changed

102 Hungary - On the Road to the European Union
subsequently. In other words, the 1995 state-controlled category includes firms that may, by then, have beenentirely FDI owned. In the backward-looking set, the four categories are based on 1997 ownership. Hence, the1995 FDI-owned category includes newly established FDI firms, as well as state-owned enterprises in whichforeigners subsequently invested. Tables 5.5 and 5.6 below show the main characteristics of the sample foreach of these sets.
The analysis revealed a dramatic improvement in wholly FDI firms. Between 1992 and 1997, totalemployment in these firms increased by 40 percent, the average number of employees per firm doubled, salesmore than tripled, and the firms invested heavily in new assets. The firms that were wholly FDI owned only atthe end of the period (they may have been state owned before or recently created) also increased sales, but farless substantially, and they invested more modestly. Employment rose, but their average size was smaller thanFDI companies in existence since 1992. This is as expected: restructuring first involves reducing operatingcosts by shedding redundant labor, then increasing sales and investing in new machinery, and only later addingnew employees.
Table 5.5: Forward-looking Set, 1992-1997 (the same firms are followed over time; ownership categorycorresponds to that in 1992)
FDI controlled Min. 10 percent FDI State owned Private domestic1992 1997 1992 1997 1992 1997 1992 1997
Total employment 23,000 32,000 96,000 69,000 380,000 105,000 40,000 16,000Number of firms 781 542 1,789 1,340 1,360 543 7,721 4,866Employment per firm 29.4 59.0 53.7 51.5 279.4 193.4 5.2 3.3Sales per firm (HUFmillion; PPI adjusted) 179.0 571.8 220.8 441.3 744.5 1,242.6 37.3 46.6Assets per firm (H-UFmillion; nominal value) 209.5 831.2 288.1 792.0 877.7 2,389.7 30.0 60.0Cashflowtoassets 14.0% 31.8% 10.0% 26.1% 11.5% 19.6% 11.8% 27.1%Cash flow to sales 16.4% 19.8% 13.0% 20.1% 13.6% 16.1% 9.5% 15.0%Source: Central Statistical Office
Table 5.6: Backward-looking Set, 1992-1997(the same firms are followed over time; ownership categorycorresponds to that in 1997)
FDI controlled Min.10 percent State owned Private domesticFDI
1992 1997 1992 1997 1992 1993 1997 1992 1997Total employment 43,000 75,000 152,000 124,000 13,000 23,000 26,000 113,000 117,000Number of firms 662 1,773 1,018 2,182 59 98 146 5,606 15,751Employmentperfirm 65.0 43.2 149.3 56.8 220.3 234.7 178.1 20.2 7.4Sales per firm (HUFmillion; PPI adjusted) 297.7 470.3 612.8 490.4 336.3 449.3 378.4 61.4 53.2Assets per firm (HUFmillion; nominal value) 378.2 736.9 835.6 957.0 493.5 695.5 661.0 52.1 74.0Cash flow to assets 10.6% 30.6% 16.6% 23.4% 2.2% 5.4% -0.4% 12.8% 17.9%Cash flow to sales 13.5% 20.5% 22.7% 19.6% 3.2% 7.5% -0.3% 10.9% 10.7%
Source: Central Statistical Office.
A partial stake is usually the first tentative step of a foreign investor, and so thepartial FDI firms showa somehow different pattern than the wholly FDI category. Older firms (i.e., the forward-looking set in Table5.5) behave much like wholly FDI firms: their sales doubled, assets increased, but the average employment hasnot (yet) risen. Data show a doubling of cash flow to assets and to sales, similar to the wholly FDI category,though at lower levels. The firms with a stake newly sold to a foreigner (backward-looking data), however,

Chapter 5. Enterprise Sector in Transition 103
show a less dramatic improvement, confirming the typical sequence of restructuring measures. An interestedforeign investor begins with a small stake in a firm, perhaps to know it better, and sets out to cut costs first.This results in lower average employment, and perhaps slightly diminished sales (when unprofitable lines arediscontinued). Investments in quality-enhancing machines and aggressive marketing later raise sales, and theforeigner increases his stake, making the company a wholly owned subsidiary, before investing massively andintegrating its operations with units abroad. The backward-looking category of partial FDI firms includes thosein the early stages of this process, and the reported measures capture this.
Any empirical examination of restructuring in the state-owned enterprises faces a selection bias, whichmakes cause and effect of improved performance difficult to separate. The most promising firms (thoseamenable to improvement because obsolete and inappropriate technology was not embedded in the machinery)may have been privatized, with the rest remaining state owned. This would mistakenly attribute improvementsexclusively to changes in ownership without also considering the adaptability of technology inherited from theCMEA era. Large SOEs may also have spun off their more adaptable assets. There is some evidence of this:firms that remained state-owned were smaller in sales and assets, but more importantly, were far less efficient(measured by cash flow to sales and to assets). The improvements in state-owned firmns with adaptabletechnologies are captured in the backward-looking data of the non-SOE categories.
The number of SOEs fell between 1992-97: 817 were liquidated or merged, while 397 wereprivatized. Labor shedding came as a consequence of liquidations and mergers, as well as restructuring of theprivatized companies. Although the average employment in firms that remained state owned throughout fell by20 percent, that decline was the result of firms splitting rather than restructuring. Total employment (after anapparent increase in 1993, perhaps because unincorporated firms were registered as SOEs) did not change.Even so, between 1993 and 1997 their total PPI-adjusted sales rose by 25 percent-more than what privatedomestic firms achieved. It is, of course, impossible to tell whether the increased sales of the SOEs was theresult of their own efforts or simply the result of a rising tide of economic growth. What is clear is that SOEs,despite their many problems, held their own.
Private domestic firms reduced their average employment, but they were comparatively smaller tobegin with. Sales rose, but less than in state-owned firms, and investment was not as substantial (the data aresuspect because of inflation). There is a far greater proportion of these small private firms entering and goingout of business (only 40 percent of private firms in the 1992 sample remained in business in 1997, and onlyone third of the firms in 1997 existed in 1992).
In the 1992-97 period, all categories of firms show an operating cash surplus (although some firmswithin each category may have had a deficit), with the exception of state-owned firms in 1997. Cash flow toassets is a crude rate of return measure; it roughly doubled for all categories (forward-looking data, Table 5.5),blurring any differences among them (this outcome may be particularly prone to measurement errors becauseof the differences in their capital vintage and the lack of inflation adjustment). The backward-looking datashow a deterioration in firms that remained state owned throughout; as mentioned before, this may reflect theirnon-adaptable, obsolete technology rather than the incentive effects of ownership per se.
The main result that stands out is the strong and powerful effect of FDI. Even those firms where theforeign stake was modest and the remainder was state owned benefited from the association. Although privatedomestic companies restructured their operations and improved performance, their results were significantlylower than firms with partial FDI. Finally, it appears that state-owned firms also improved, and did so evenbefore they were privatized. Firms that remained state owned throughout restructured the least of all categoriesand showed the least improvement.
104 Hungary - On the Road to the European Union
Tough Bankruptcy Laws Peripheral to Restructuring
Although Hungary's tough 1992 Bankruptcy Law has received considerable attention, it may notdeserve much credit for enterprise restructuring. As described in earlier sections, firms began to restructurewell before the 1992 Law took effect, and Table 5.4 on operating cash flows shows no dramatic subsequentimprovements in 1993 or 1994.
Contrary to general belief, a bankruptcy law, allows, but does not force, firms to restructure. A filingfor bankruptcy (i.e., reorganization or liquidation) is just that: no further operational changes necessarilyfollow unless the creditors demand it. New loans after filing go to the head of the creditor queue; so new loanswould be profitable if the firm had an operating cash surplus-even if it were insufficient to service its olddebt. Thus, new creditors could profit at the expense of the old unless there is sophisticated court oversight toprevent this. Thus, the combination of a good Bankruptcy Law and overwhelmed courts could provedangerous by softening the hard budget constraint. Fortunately, Hungarian banks were steeped in problems oftheir own (described in the chapter 4) and consequently had little to lend; moreover, foreign lenders were moreselective in their lending.
Although careful observers"4 accept this reasoning, the large number of bankruptcy filings is oftenconfused with restructuring. The 1992 Bankruptcy Law allowed both financial reorganization and liquidation;its most striking feature was that managers were subject to criminal penalties if they did notfile for bankruptcywithin 90 days of payment delays. While debtors could file for either reorganization or liquidation, creditorscould file for liquidation only. Courts were quickly swamped: more than 5,000 reorganization and 17,000liquidation cases were filed by the end of 1993. The law was amended in September of 1993 to remove themandatory filing requirement (and to correct flaws such as the requirement of unanimous creditor approval ofa reorganization). Although new filings for bankruptcy procedures slowed after this, the court backlog forliquidation proceedings remained large: the number of unresolved liquidation cases doubled during 1992-96,to more than 10,000. Only after 1996 did the log jam begin to decrease (see figures 5.1 and 5.2 below). Onepossible explanation is that firms continued to operate even after filing for liquidation."5
The suppliers, not the borrowers (despite the criminal penalties) or bank creditors, initiated mostof thefilings. This is not surprising: a filing forces the creditorbank to immediately recognize thatold loans are bad,and to fully provision for potential losses. So under-capitalized banks (and most Hungarian banks had negativetrue net worth) subject to closure by banking supervisors would not be likely force the debtor into filing forbankruptcy.
14 Gray et al (1996) examine a sample of 112 bankruptcy cases and concludes that while the courts and trustees improved, this "didlittle to further either deep restructuring or the exit of ailing firms."
15 Although the firm as a whole may have an operating cash deficit, some activities may generate a surplus, and continuing these is toeveryone's advantage. In the Hungarian case, the structure of the liquidator's fees may have been partially responsible for firmscontinuing to operate: liquidators obtained 2 percent of the liquidating firm's gross receipts and only 5 percent of the sales price.
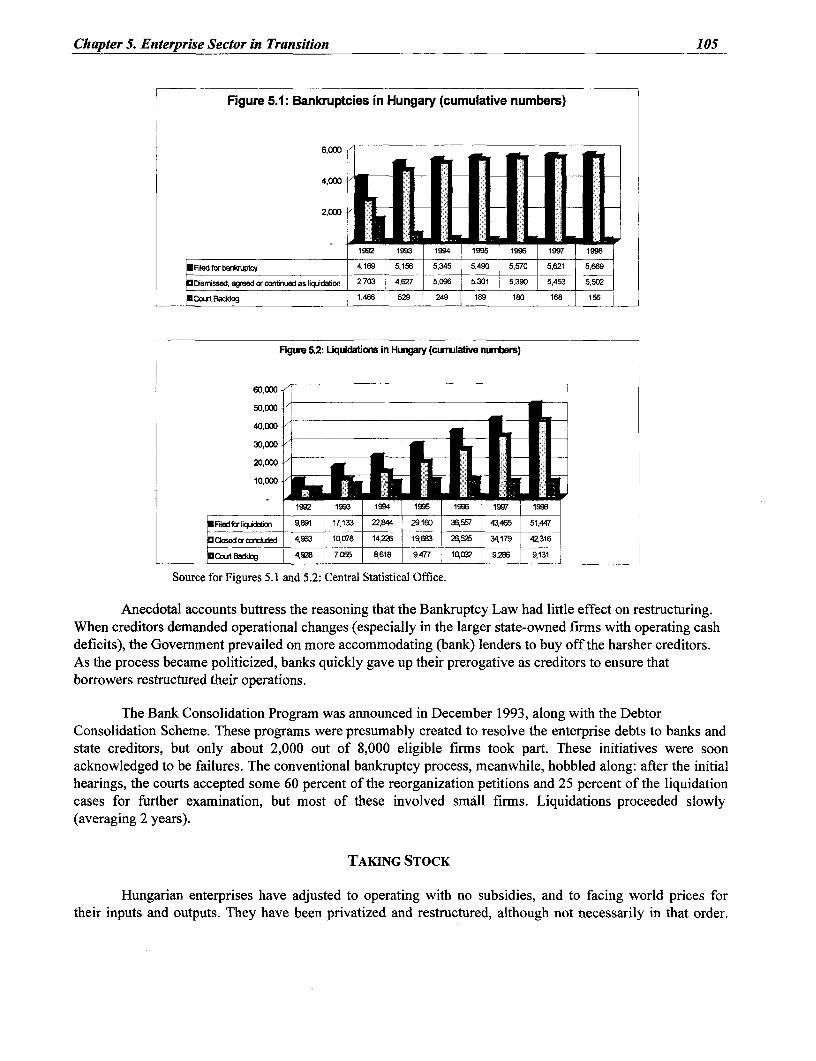
Chapter 5. Enterprise Sector in Transition 105
Figure 5.1: Bankruptcies in Hungary (cumulative numbers)
6(100
1992 j1993 1994 im 51996 1997 1993
6Filedforbarkuptcy 4,169 5,156 5,345 5,490 5,570 5,621 5,669
0 Disnssed, agreed or conninued as 1iquabhion 2,703 1 4,627 5,096 5,301 5,390 5,453 5,502
*CojtBaddog 1,466 1 529 249 189 180 168 156
Figure 52: UqLqdations In Hungary (cwumlative nuntems)
60,000
50,090
40,000
30,000
20,000
10,009 71
1992 1993 1994 1995 1996 1997 1998
FiedforIilicqkdar 9,691 17,133 2Z844 29,160 36,557 43,465 51,447
caaedorosxLK19d 4,963 10,078 14,228 19,683 26,525 34,179 4Z316
C _ wCtBadog 4,928 1 7,055 8,618 9,477 10,32 9,286 9,131
Source for Figures 5.1 and 5.2: Central Statistical Office.
Anecdotal accounts buttress the reasoning that the Bankruptcy Law had little effect on restructuring.When creditors demanded operational changes (especially in the larger state-owned firms with operating cashdeficits), the Government prevailed on more accommodating (bank) lenders to buy off the harsher creditors.As the process became politicized, banks quickly gave up their prerogative as creditors to ensure thatborrowers restructured their operations.
The Bank Consolidation Program was announced in December 1993, along with the DebtorConsolidation Scheme. These programs were presumably created to resolve the enterprise debts to banks andstate creditors, but only about 2,000 out of 8,000 eligible firms took part. These initiatives were soonacknowledged to be failures. The conventional bankruptcy process, meanwhile, hobbled along: after the initialhearings, the courts accepted some 60 percent of the reorganization petitions and 25 percent of the liquidationcases for further examination, but most of these involved small firms. Liquidations proceeded slowly(averaging 2 years).
TAKING STOCK
Hungarian enterprises have adjusted to operating with no subsidies, and to facing world prices fortheir inputs and outputs. They have been privatized and restructured, although not necessarily in that order.

106 Hungary - On the Road to the European Union
The aggregate investment has been at healthy levels; there is every reason to think that these investments havebeen well allocated and that the machines and other capital have been adequately modernized.
A Thumbnail Sketch
The following discussion, supported by Appendix tables 7.6 to 7.8, provides a snapshot of theHungarian enterprise sector: who owns the enterprises, how they are funded, and their linkages.
Population and Ownership of Enterprises
Of the one million or so registered enterprises, almost 70 percent are unincorporated limitedpartnerships (shown in line 8 of Table 5.7 below) which are commonly used to reduce taxes. The modestincrease in the total number of enterprises masks a tripling of limited liability firms (small and closely held),and a doubling of joint stock companies since 1992.
Table 5.7: Registered Firms, 1992-1997
Legal forms 1992 1993 1994 1995 1996 19971. Limited liability company 82.5% 85.1% 86.6% 87.8% 89.1% 90.2%2. Joint stock company 2.5% 2.8% 2.9% 2.7% 2.6% 2.5%3. Cooperative 11.9% 10.1% 8.1% 7.1% 6.1% 5.3%4. SOEs and organizations with obligation of transformation 2.5% 1.3% 0.8% 0.7% 0.5% 0.4%5. Other 0.6% 0. 7% 1.6% 1.7% 1. 7% 1.7%6. Number of enterprises with legal entity 69,386 85,638 101,591 116,945 136,917 158,662(1+2+3+4+5)=100%7. Corporations and other organizations without legal entity 10.4% 12.5% 13.6% 15.5% 18.3% 21.4%8. Sole proprietors 89.6% 87.5% 86.4% 84.5% 81.7% 78.6%!9. Number of enterprises without legal entity (7+8)=100% 676,804 786,879 900,382 936,312 912,673 839,602
Total number of enterprises (6+9) 746,190 884,915 1,001,973 1,053,257 1,049,590 998,264
Sources: For 1992-93-Hungarian Statistical Pocketbook (1994), Hungarian Central Statistical Office (1995), p. 144.For 1994-Hungarian Statistical Pocketbook (1995), Hungarian Central Statistical Office (1996), p. 132.For 1995-97-Hungarian Statistical Pocketbook (1997), Hungarian Central Statistical Office (1998), p. 120.
Most firms are closely held, as shown in Table 7.6 in the Appendix. While this is not surprising forsmall firms, it is for larger firms: more than three quarters of the mid-sized and large firms (defined as havingover 100 employees) have three or fewer owners. Furthermore, a fifth of them have a single majority owner,and more than two thirds have a majority of shares held by three or fewer owners.
Some of these owners may themselves be firms; Table 7.7 in the Appendix shows the ownership linksamong the larger manufacturing exporters from two survey data sets for different years. About half the firmsneither own, nor are owned by, any other domestic firm; only about 13 percent of the firms are both owned by,and own, other firms. Some of these ownership links may be legacies of the joint venture era or thesubsequent spinoffs, and may wither over time. The overall impression, however, is that ownership is fairlyconcentrated, and that larger firms and those with FDI may own other firms.
Table 7.8 in the Appendix portrays the trade links between firms with interconnected ownership.Firms owned mostly by foreigners stand out, in that half of them trade mostly with their owners. By contrast,when the owner is a domestic firm, the trade links are substantially weaker, suggesting that such ownership
Chapter 5. Enterprise Sector in Transition 107
may now be a redundant legacy from the era when firms cemented supplier ties through cross-ownership--tiesthat have lingered after the firms reoriented their businesses).
Enterprise Finance
Hungarian firms are not, and never have been, heavily indebted. The total debt (including claims bytax authorities and other firms) to assets is a scant 38 percent; if only bank borrowings were considered,debtwould account for less than 15 percent of firms' assets. The biases resulting from poor accounting (short-termdebt is implicitly indexed to the price level, while firms' assets are not) would increase the measure, so the trueleverage is even lower.
When measured from the balance sheet of creditor banks, the numbers (while different, because ofdifferences in coverage) confirm the impression of low leverage. Corporate loans were about 26 percent ofGDP in 1989; they approached 30 percent in 1991, before falling again to 20 percent in 1997, partly becauseof debt consolidation schemes.. By international standards, these are relatively low numbers.
Low leverage may partly reflect a cultural and legal tradition, or it may be a consequence of problemsin the banking system, and/or a consequence of taxation quirks described in Box 5.1.
Box 5.1: Hungarian Taxation and Its Effects
The corporate tax rate was drastically reduced in 1995, from 38 to 18 percent. Corporate tax revenues have greatly increased, leadingsome to suggest that Hungary is now a regional tax haven. This may not be the case because the lower nominal corporate tax rate maycrudely-and only partly-correct for complicated and egregious features in the tax structure.
The tax code ignores inflation. The absence of indexation and the insistence on FIFO (first-in-first-out) (which understates the materialcosts of the goods sold) overstates taxable income. On the other hand, the effect of the tax structure on indebtedness-and vice versa-;s complex, and inflation makes it more so.
Interest is a deductible expense, but nominal interest includes a substantial repayment of principal when there is inflation. The debtor'staxable income is excessively reduced, but if interest received were taxed at the same rate, inflation's effect on leverage would beneutral. This is not the case.
Personal income tax rates substantially exceed the corporate rate, providing an incentive to substitute personal for corporate borrowing(one possible explanation for low corporate leverage). Instead of the firm borrowing, owners (especially of closely held small andmid-sized firms) can borrow on their personal account and fund the company through equity. This incentive is even strongerconsidering that capital gains are untaxed even when they are realized, so owners can have firms buy back equity rather than distributecash dividends (which are taxed at 20 percent), thereby converting taxable income into untaxed capital gains.
The quirky tax treatment of banking intermediation, however, complicates this further. Interest on bank deposits (and on Governmentsecurities) are untaxed. There is thus an incentive for firms to borrow through banks. However, bank intermediation is implicitly taxedthrough high reserve requirements.
The combined effect of all these features is difficult to analyze. Although some quirks may counteract the effect of others, it may betime to simplify and improve Hungary's tax structure.
SUMMARY AND CONCLUSIONS
Even under socialism, Hungarian firms were not subject to tightly controlled central planning.Managers, with few exceptions, were allowed to operate autonomously and developed many trade contactswith market economies, though international trade was subject to licenses and controls. Nonetheless, when
108 Hungary - On the Road to the European Union
relative prices and the exchange rate became market determined after the CMEA's collapse, managers beganto restructure their operations without waiting for instructions from the Government or for privatization.
The Government embraced markets warily when socialism collapsed, and was cautious in selling thefirms it owned. Nonetheless, incentives had been surreptitiously introduced even before 1990, with largerfirms spinning off units to managers and incorporating workers into work units so pay could be linked toproductivity. This chapter has shown that, despite the slow transfer of ownership, enterprises' operationalimprovements were certainly not slow. The steady and widespread enterprise restructuring has left firmspoised to grow profitably if the country's economic policies remain prudent.
Hungary's distinguishing characteristic is the magnitude and widespread political acceptance of FDI,which may be largely responsible for restructuring and operational improvements. The US$16 billion thatflowed in between 1990 and 1997, averaging more than 5 percent of GDP, has been one of the highest in theregion, and the investments are widely dispersed. Firms with some FDI now account for more than half of thecountry's manufacturing assets, and a fifth of assets in public utilities. Such ownership has given a largenumber of Hungarian firms access to the technology, marketing, and other business expertise of multinationalfirms; and the resulting benefits are apparent in greater exports and profits. Even if FDI were to fall thebenefits of the of past FDI would be sustained through the trade links that Hungary has been established withits European partners (see below).
Despite the favorable developments of the last decade, however, several problems remain. Theownership structure does not allow all firms to be well governed and funded. Firm ownership is veryconcentrated. Firms have surprisingly little debt, especially from banks, perhaps because of a combination oftax quirks and banking problems. Large firms with FDI (overseen by their foreign investors and partners) havefew governance or funding problems and small firms may find the necessary funds through the supply chain.But mid-sized firms may face a problem. If they are closely held, raising funds through equity gives rise to thefree rider problem of no shareholder having the incentive to oversee managers. Their leverage should be, but isnot, high. One alternative pattern of ownership would be through mutual funds, but this requires reliableaccounting and a well-functioning equity market, both of which would take time to develop. While theGovernment should not try to artificially increase corporate leverage, correcting problems in the financialsystem could foster the healthy growth of mid-sized firms.
The Government's role in enterprise restructuring after privatization is minimal. If the Governmentaddresses some problems of tax structure and banking, and ensures that its macroeconomic policies areconducive, the enterprises that have been restructured should continue their healthy growth.
The crises in East Asia and Latin America underscored the volatility of international capital flows;some worry about what may happen if the FDI flood into Hungary abates.16 The exceptional and sustainedinflow of foreign investment cannot last forever: inflows can be expected to cease when the marginal return oncapital falls (as it inevitably must after the capital stock rises sufficiently). A gradual cessation of inflowswould not pose a problem, but what if the flows cease suddenly and prematurely, or worse, are reversed?
Such an event is less likely in Hungary than elsewhere. Parallels with East Asia or Russia may bemisleading: Hungary's foreign inflows have been mostly through FDI (i.e., equity), not loans, and corporate
16There was a hint of this when FDI fell in 1994, before surging in 1995. This was partly a recording artifact (a large 1994privatization deal was booked in 1995), but there were also growing doubts about the exchange rate. The surge in 1995 reflected threefactors: (i) the recording issue; (ii) the 1995 decision to privatize faster, especially the utilities; and (iii) the long-anticipateddevaluation of the forint, which removed a source of uncertainty.

Chapter 5. Enterprise Sector in Transition 109
indebtedness is low. Foreign equity investors, unlike lenders, cannot collectively withdraw their stake,especially in firms not listed on the stock exchange. But even for listed firms, attempting to sell majorpositions would send stock prices plummeting, raising the expected return of retaining their Hungarianholdings and counteracting any panicky urge to withdraw. Even when the August 1998 Russian default causedthe Hungarian stock market to drop by half, the data suggest that there was no major reversal of inflows (seechapter 1).
If inflows were to suddenly reverse, the economic effects may also be far less severe than elsewherebecause FDI firms have been well-integrated with their parents. The foreign owners have sufficient confidencein the efficiency of their Hungarian operations to lend to prevent the loss of skilled workers, which woulddisrupt their worldwide operations. Such intra-company lending would compensate for the reversal of capitalflows, and the effect on exchange and interest rates would be ameliorated. The employment effects would alsobe far less severe than if Hungarian operations were less well integrated.
Despite such compensating intra-corporate flows, aggregate inflows may fall, requiring acommensurate reduction in the trade deficit. The forint may have to depreciate in real terms; but it is difficultto predict by how much. Econometric estimates of the responsiveness of the trade deficit to real exchange ratechanges suffer from more than the well-known identification problem: the structure of Hungarianmanufacturing and trade has changed considerably, and estimates using data from earlier periods would provemisleading. Production may respond more quickly to changing relative prices within an integratedmultinational firm than when unconnected firms seek new markets for their products.
It is for these reasons that FDI is often viewed as the best form of foreign investment, and Hungary isextraordinarily fortunate in this regard. The investtnent, and the benefits to Hungary flowing from them, willcontinue long after the inflows have ceased.
6. PREPARING INFRASTRUCTURE FOR EU ACCESSION
The infrastructure sectors-telecommunications, electricity, gas, and transportation-provideservices that are critical to manufacturing, transportation, and commerce, and to increasing competitionthrough the expansion of product lines and geographic spheres of distribution. The efficient functioningof these sectors is, therefore, vital to sustained economic growth and international competitiveness.During the last decade, wide recognition of the importance of infrastructure services has led to a majorreassessment of public policy and of the proper role of the state in the provision of these services.Governments throughout the world have been actively pursuing institutional, regulatory, and structuralreforms aimed at improving operating efficiency and service quality. Countries that have implementedsuch reforms have realized substantial economic benefits.
As one of the first countries in Central and Eastern Europe to embark on economic transition,Hungary has led the region in terms of restructuring and privatization of the infrastructure sectors-electricity, gas, and telecommunications. In fact, when Hungary began negotiations over accession to theEU, its institutional and structural framework was comparable to, if not ahead of, that of most EUcountries.
In the EU and other parts of the world, however, there is now a clear movement towardderegulation and market liberalization. Accordingly, Hungary will still need to introduce a number ofpolicy changes. The objectives of this chapter are to: (i) provide a diagnostic assessment of recent andongoing structural and regulatory reforms in Hungary's infrastructure sectors; (ii) identify priorities foradditional competitive restructuring and regulatory decontrol measures, their expected impact, andpolicies that would minimize the costs of deregulation and market liberalization; (iii) assess Hungary'sprogress in complying with EU accession requirements, and identify areas in need of special attention tomeet these requirements; and (iv) identify the major regulatory issues that need to be addressed in themedium term by Hungarian regulatory agencies, along with a strategy for addressing these issues.
One of the fundamental tenets of this chapter is that undistorted and effective competition isapowerful force for achieving economic efficiency and for guiding technological change to serve thepublic interest. Nonetheless, the potential benefits of competition could be significantly undermined-orcompetition could prove harmful-if the same regulations that evolved in a franchise monopolyenvironment in other countries were applied too quickly and uncritically in Hungary. Applying suchregulations to formerly state-owned infrastructure enterprises such as network utilities, for example,could have a negative effect if combined with the pressures of competitive entry. Despite Hungary'sprogress in opening these sectors to competition, additional policy changes are needed to harmonizeregulation with open entry. This would enable the realization of more of the benefits of competition andfree entry, while avoiding many of the problems that could arise from a mismatch between open entryand traditional regulation.
110

Chapter 6. Preparing Infrastructure for EUAccession 111
Another tenet of this chapter is that any program for restructuring the relationship betweengovernment and industry, and for developing effective regulatory policy, should be explicitly derivedfrom the industry's underlying economic characteristics and the technological conditions of itsproduction. Thus the government will need to articulate a set of principles concerning the role of the statein the infrastructure sectors. It will need to establish economically sound criteriato distinguish betweenthose activities in which intervention by the public sector is warranted and those in which it is not.Inaddition, there is an urgent need to develop expertise in critical regulatory areas.
OVERVIEW OF RECENT REFORMS IN THE ELECTRICITY, TELECOMMUNICATIONS, GAS,AND TRANSPORTATION SECTORS
Electricity
Prior to 1992, the electricity industry was a vertically integrated utility.In January 1992, MagyarVillamos Muvek Trust (MVM) was restructured, corporatized, and partially unbundled into 8 powercompanies, 6 distribution companies (regional electricity companies, RECs), and one transmissioncompany-collectively known as MVM Rt, or the Hungarian Electric Company, Ltd.-in preparation forprivatization.
The six distribution companies were sold to foreign electricity companies in 1995; seven of theeight power companies (all except the nuclear power plant at Paks) were offered for sale in a tenderdocument dated July 31, 1995. Only three generating companies were sold in the first wave, but threemore were sold in 1997, leaving one small fossil plant (Vertesz) and the nuclear power company underthe ownership of MVM Rt, which remains 99.8 percent owned by the state and 0.2 percent owned bymunicipalities.
By the end of 1997, 68 percent of the privatized power companies were foreign owned, as were48.6 percent of the RECs, or 31.6 percent of the electricity supply industry as a whole. There is currentlyan active debate as to whether MWM should be further unbundled to separate generation fromtransmission, and whether part or all of the remaining state-owned companies should be privatized.
Telecommunications
In 1994, the Ministry of Transport, Communications, and Water issued a tender for localtelephone service. As part of this tender, the country was divided into 54 separate local regions of which,in the first round, 25 of the areas were offered to prospective companies wishing to provide local wirelineservice. MATAV, which had previously provided telephone service throughout the country, won thetender for five of those areas. In two other areas, MATAV was awarded the franchise because there wasno other bidder. As a result, MATAV provides service in 36 of the 54 areas. In the other 18 areas,tenders were awarded to companies other than MATAV. These [1 8?] regions represent about 12 percentof the population.
The concessions for local telephone service are for 25 years, beginning in 1995, and includeexclusivity through 2002. In addition to local franchises, the government also awarded a nationwideconcession for the provision of long distance and international voice telephony for 25 years, withexclusive rights until the end of 2002. MATAV holds these rights.
MATAV itself also underwent a significant transformation. It was transformed into a joint stockcompany at the end of 1991, and by the end of 1993, was 30.2 percent owned by MagyarCom (in turn
112 Hungary - on the Road to the European Union
owned by Deutsche Telekom) and Ameritech. MagyarCom bought another 37 percent of the company in1995. An initial public offering in November 1997 reduced MagyarCom's ownership to 59.6 percent andthe state's to 6.6 percent. Subsequently, the state's holding in MATAV was reduced to one golden share.
The state ownership share is held by the state holding company APV. According to the Ministryof Transport, Communications, and Water, there is no interaction among the regulatory bodies (discussedbelow) and APV; the regulatory bodies are independent of the operators; and there is no conflict ofinterest in their decision making process.
All other local telephone concession companies have been privately owned, since the beginningof their license period, by a variety of foreign investors, including Citizens Utilities, United Telecom andAlcatel (UTI), GE Capital, and CG Sat. Although the local telephone operators themselves are relativelysmall in comparison to MATAV and its owners, they and their owners generally do not appear to besmall, unsophisticated companies.
Natural Gas
The most important single participant in the Hungarian gas market is Magyar Olaj-es Gazipari Rt.(MOL), which was privatized in 1996. Unlike the other privatized energy companies, however, noWestern companies own a strategic interest in MOL. It is 25 percent owned by the Hungariangovernment, 38 percent by Western institutional investors, and 37 percent by Hungarian and Westernprivate investors. MOL is the sole producer of Hungarian gas, the sole importer of gas into Hungary, andthe sole owner and operator of gas storage facilities. It is also the sole owner and operator of high-pressure pipelines, and the sole wholesaler of gas in Hungary. In addition, MOL has significant retailsales to industrial and electric generating customers. Direct sales by MOL accounted for 23 percent oftotal Hungarian gas consumption in 1997.
Hungary's six gas distribution companies (.GDCs) were privatized in 1996, with the governmentselling 50 percent plus one share of the stock in each GDC, and allocating 40 percent of each GDC'sshares to the municipality it serves. The remaining shares were given or sold at discounted prices to eachGDC's employees. The govermment retained a golden share in each GDC, which gives it the right toname a member of its board of directors. Since the initial privatization, all municipalities except Budapesthave sold their shares in the GDCs to those private investors who originally purchased the 50 percent plusone share interest in each. In each case, the GDCs were bought by a consortium of Western European gascompanies.
Competition among the GDCs, and between the GDCs and MOL, is extremely limited. MOL andeach GDC were licensed to serve their pre-existing customers and municipalities at the time ofprivatization. Thus, competition for those customers and municipalities is, in effect, prohibited by law.The GDCs and MOL can compete to provide service to a new industrial or electric generating customer,or provide service to a municipality that previously had no gas service. That competition is only physicalwith one exception. MOL and the GDCs are not required to provide third party access (tpa) to theirfacilities. The one exception requires MOL to provide tpa for domestic Hungarian production. Thatexception is at present purely theoretical, however, since MOL is currently the sole producer ofHungarian gas.
In 1995, the Hungarian government awarded exploration and production concessions to fourinternational oil and gas companies: Coastal, Blue Star, Mobil, and Occidental. So far, however, none has
Chapter 6. Preparing Infrastructure for EUAccession 113
announced any promising finds, and MOL does not expect significant additional gas reserves to belocated in the foreseeable future.
Since privatization, three or four new small GDCs have been formed by existing GDCs tofacilitate cofinancing of the investment needed to provide gas service to a previously unservedmunicipality. MOL recently acquired an interest in the GDC that serves the region along the Romanianborder. MOL has also expressed an interest in acquiring a Romanian GDC that serves the region alongthe Hungarian border. Those two regions include a large number of municipalities that do not now haveaccess to gas.
Transportation
Hungary has made considerable progress during the last decade in reforming andcommercializing transport operations. Regulation of intercity trucks (but not buses) has been liberalizedin stages since the 1980s, and some 60,000 small private trucking companies are in operation.Hungarocamion, the international trucking company, was also recently privatized. However, state-ownedtrucks still account for about half of total truck transport. The national railway (MAV), intercity buses(VOLAN), inland navigation (MAHART), and Budapest urban transport (BKV) are still publicly ownedand controlled, significantly subsidized, and not yet well positioned to compete in a market economy.Moreover, the Ministry of Transport, Communications, and Water Management (MTCWM), and theMunicipality of Budapest, have still not adapted their roles to the needs of the market. The condition ofthe transport infrastructure, as well as equipment and organizational inefficiencies, are hamperingeconomic growth and preparation for EU accession.
INTERNATIONAL POLICY DEVELOPMENTS
During the last decade, public policy toward the infrastructure sectors in both industrial anddeveloping economies entered a new era of reform. Although the goals, pace, and process of reformdiffer among countries, the trend is unmistakable. These reforms have sought to minimize interferencewith economic efficiency and to expand the role of the market in areas of the economy where the strengthof competitive forces is inadequate.
The dominant institutional arrangement in the network utilities in most economies was themonolithic organization-a single entity that controlled all facilities, operations, and administrativefunctions, and determined what services to provide to relatively captive customers. Such monolithicutilities typically lacked financial incentives and did not disaggregate information on profitability; theywere (at best) production oriented and largely unresponsive to market demands, as well as hierarchical (ifnot bloated) in organizational architecture. It was therefore predictable that a state-owned network utilitysuch as Hungary's would frequently fail to respond to the needs of consumers, but would instead bepolitically directed at the expense of efficiency and stimulation of the economy.
Due to technological and other fundamental economic changes, the conditions that generated thismodel no longer exist in most countries. Indeed, in the last few years, there has been an increasingawareness that the network utilities are not, in fact, monolithic industries, but rather encompass a numberof distinct activities with entirely different economic characteristics. Electricity, gas, telecommunications,and railroads are vertical industries characterized by transportation and distribution networks linkingupstream production with downstream consumption. These networks consist of a hierarchy oftransmission links in electricity; national pipelines and regional distributional links in gas; transmissionmedia, switching centers, and the local loop (the final mile) in telecommunications; earthwork, track,
114 Hungary - on the Road to the European Union
signaling, and stations in railroads. Infrastructure networks entail substantial fixed costs that are largelysunk because the assets are of minimal value for other purposes. These characteristics of infrastructurenetworks mitigate against freedom of entry, especially when there are natural monopoly conditions aswell as massive fixed costs.
On the other hand, the cost conditions relating to upstream production and downstream supplyactivities (electricity and gas), to certain portions of the network (interexchange services intelecommunications), or to the operation of services on the physical network (railroads), are less inimicalto competition. Although there are important economies of scale and inevitably some sunk costsassociated with these activities, they are small in relation to those encountered in network infrastructure.
There is, therefore, no question that substantial competition could emerge in many activities inthese sectors if they were properly reorganized. As a result, governments throughout the world have takensteps to competitively restructure and deregulate their network utilities, to the extent consistent withtechnological opportunity and other elements of efficiency. The objectives of such restructuring andregulatory reform programs have included the injection of more innovative and efficient management, thereduction of public enterprise deficits and burdens of public subsidies, increased competition, and moreresponsiveness to the needs of enterprises.
Policymakers have taken two broad approaches to the restructuring of network industries. Theradical approach has been to vertically separate the monopoly segments (transportation and distribution)of these industries from the structurally competitive ones (upstream production and downstreammarketing). In electricity, generation is unbundled from transmission and distribution; intelecommunications, local exchange is split from long distance service; in gas, production is unbundledfrom transportation and distribution; in railroads, service is separated from track. The second approach,termed competitive access, consists of allowing integrated operations by the dominant incumbent underthe requirement that it make its facilities available to other entities on a fair and equal basis.
Another key element of reform has been the shift of supply responsibility to private enterprises.In addition to fiscal gain, this shift has been motivated by mounting empirical evidence that because oftheir financial, technical, and managerial resources, private sector entities have a comparative advantagein keeping abreast of these technically and economically complex industries.
The worldwide trend toward competitive restructuring and privatization in the infrastructuresectors has been accompanied by far-reaching regulatory reform and deregulation. The main impetus forregulatory reform was the increasing recognition that government intrusion into pricing, investment, andother such business decisions imposes substantial economic costs. It discourages investment ininnovation, shelters inefficiency, and promotes misallocation of resources by inducing departures o.fprices from marginal costs. Government intrusion into pricing also causes incentive breakdowns, andreduces the price and quality options that the public would be offered under unfettered market allocation.In addition, developments in the theory of industrial organization facilitated the formulation of policythatis more tolerant of factors that make for natural monopoly, while at the same time lessening the need forpublic intervention.
Both regulatory experience and new economic analysis also support the emerging view thatwhere market intervention is called for, the appropriate measures are often significantly different fromthose traditionally employed. Recent policy developments call for a major reorientation of regulatoryrules and procedures and offer two types of guidance to regulators. First, they provide an improved set ofcriteria to distinguish between those cases in which intervention is warranted and those in which it is not.

Chapter 6. Preparing Infrastructure for EUAccession 115
Second, where intervention is called for, they establish an improved set of guidelines for appropriategovernment intervention in the structure and conduct of firms. Such tools enable regulators to increasethe public welfare effects of intervertion.
Experience in the United States, United Kingdom, and other countries that have implementedsubstantive regulatory reforms confirms what theory predicts: decentralized, market-orienteddecisionmaking--freed from unnecessary regulatory control and energized by market incentives-is thesurest way to find and implement efficient, innovative solutions to problems in several sectors of theeconomy. As an illustration, Table 6.1 provides estimates of the welfare gains obtained fromderegulation in the United States. As a consequence of deregulation, there have been fundamentalchanges in the way firms in the United States conduct business. By and large, these changes reflectefficiency-enhancing structural reorganization, increasing diversity in price-service options, greaterresponsiveness to consumer demands, and marketplace opportunities for innovation.
Table 6.1: Welfare Gains from Deregulation in the United States in 1990(US$ billions, 1990 values)
industiy Consumews Producers Total Further PotentdalGains
Airlines 8.8-14.8 4.9 13.7-19.7 4.9Railways 7.2-9.7 3.2 10.4-12.0 0.4Road freight 15.4 (4.8) 10.6 0Telecommunications 0.7-1.6 0.7-1.6 11.8Natural gas 4.1Cable television 0.4-1.3 0.4-1.3 0.4-0.8Stockbroking 0.1 (0.1) 0 0
Total 32.6-43.0 3.2 35.8-46.2 21.6-22.0Source: Winston (1993).
While most firms in countries that have implemented regulatory reformn were quite successful inabsorbing the shock of deregulation and operating in a competitive enviromnent, others had difficultyadjusting and had to undergo major restructuring of their respective industries. Indeed, one of thenecessary consequences of regulatory reform is that relatively inefficient firms may lose profitability andgo into liquidation. Moreover, the post-deregulation period has been characterized by pressures to reducepay scales toward those in the unregulated economic sectors, while increasing productivity through amore efficient use of labor. Such changes inevitably led to some labor displacement. These dangers, ofcourse, are the natural concomitant of a freer competitive environment. Still, the available evidenceindicates that, on average, regulatory reform and deregulation have yielded positive results for bothproducers and consumers
116 Hungary - on the Road to the European Union
Box 6.1: Market Liberalization and Regulatory Reform in the European Union
In the European Union, market liberalization and reform of network utility regulations have been largely driven bythe policy initiatives undertaken to complete the process of integration, and to fully implement the Treaty of Rome.In almost all member states, the dominant institutional arrangement in these sectors was a state-owned monopolyprotected by regulatory restrictions on market entry. These market arrangements clearly reenforced thesegmentation of national markets and thus presented a significant impediment to economic integration and thecreation of a single market. Consequently, the EU urged member states to carry out a far-reaching andcomprehensive review of their domestic regulatory systems and to undertake reform measures that would makethe organization and structure of their public utilities more consistent with the aims of the Treaty of Rome.Subsequently, the EU issued a number of directives that contained explicit timetables for market liberalization andregulatory harmonization. For example, the most important requirement in the electricity sector is a Directiveconceming rules of the internal market (effective in February 1997). Most member states were given two years tocomply (although Greece has until 2001). Taken as a whole, the measures adopted by the EU can be grouped undertwo main headings: the actions taken against member states to encourage competitive access to particular markets;and the reappraisal of criteria for implementing competition rules in the regulated sectors.
CURRENT AND FORTHCOMING SUBSTANTIVE REGULATORY ISSUES
Hungary's present system for regulating network utilities is, in many ways, commendable. Theregulatory system has made possible successful privatization transactions in electricity, gas, andtelecommunications; and foreign investors appear confident in the durability and enforceability of theircontracts. Although there are disputes about price regulation, the companies seem, in general, contentwith the prices-they presumably made allowances in their bids for the possibility that prices might beheld below the statutory level for political reasons. While it should be possible to strike a satisfactorybalance between the competing interests of domestic consumers and foreign investors, this may be at theexpense of greater liberalization and competition. In this regard, investors take considerable comfortfrom Hungary's commitment to negotiate membership in the EU, and hence to implement the legal andinstitutional changes needed to strengthen the market economy and the rule of law. Now that a large partof the network utilities have been privatized, the conditions required for EU accession remain one of themost potent factors shaping regulatory reform.
But no matter how successful the process of restructuring, experience will highlight furtheropportunities for improvement. The emerging regulatory problems in the Hungarian network utilities thatare enumerated below, are also endemic to infrastructure sectors everywhere and largely reflect issuesthat arise after privatization, particularly when combined with unbundling.
Having completed a successful privatization and restructuring program in major infrastructuresectors of the economy, Hungarian policymakers must now undertake the difficult tasks of: (i)rebalancing traditional rate structures to prepare for competition within the European Union; (ii)establishing an effective interconnect policy to ensure non-discriminatory access of competitors toessential infrastructure facilities; (iii) designing competitively neutral mechanisms to promote universalservice; and (iv) adopting measures that harmonize competition with regulation, remove impediments toadequate returns to the operators, and create a level playing field.'
l It should be noted that during the last year, considerable progress was made in addressing several of these issues.For example, tariffs were substantially rebalanced and current pricing policy was made broadly consistent withrevenue adequacy.
Chapter 6. Preparing Infrastructure for EUAccession 117
Tariff Rebalancing
There are continuing inefficiencies in the present system of regulation related to the level andstructure of tariffs for electricity, gas, and hot water, which are inter-related and explained primarily bydistributional concerns. Prices for basic telephone services are also highly unbalanced.
Electricity
Price caps are on audited costs as of January 1, 1997. Thereafter, prices will be updated in linewith inflation, allowing for an efficiency factor. The inherited system of subsidies and cross-subsidieswas designed to protect domestic consumers from excessive price rises, though political interests favoredsome groups more than others (e.g., gas consumers over district heating). At the same time, Hungary'shigh inflation also induced the government to hold down these energy prices as part of their counter-inflation strategy.
A comparison of the evolution of real household prices for electricity in Hungary and the UnitedKingdom is quite revealing. While Britain and Hungary started from quite similar initial positions in1970, prices in Britain were hit by the oil shocks, while those in Hungary drifted steadily downward, sothat by 1990 they were less than one-third the level in the United Kingdom. Competition and regulationgradually reduced prices in Britain (but by not nearly as much as fuel costs have fallen), whileadjustments of prices toward costs gradually raised prices in Hungary (though prices remain below thelevel implied by the system marginal price). In 1997, household prices in Hungary were slightly over halfthe price in the United Kingdom.2
Both subsidies and cross-subsidies can most readily be preserved with the single buyer model, inwhich the network owner is the sole interface between upstream producers and downstream customers.This means that any subsidy at the production or wholesale level can be passed through intact to the finalconsumers. At the same time, the inability of final consumers to contract directly with producers meansthat almost any structure of relative prices can be sustained (though there are problems if domestic pricesare too far below commercial or industrial prices, as small businesses may succeed in obtaining supply atdomestic tariffs).
In Hungary, the wholesale price is being kept below both the price that would prevail in acompetitive pool, as well as the cost of imported power, for three reasons. First, the priceis being heavilyinfluenced by the average cost of written-down plants, rather than the marginal cost of building newplants, even though Hungary has embarked on a substantial program of replacing existing plants. Ongrounds of efficiency, the average cost of a new plant ought to be used to set the average price. This has,in fact, not happened in Hungary: the average price paid to generators on January 1, 1997 was 5.80HUF/kWh, while the average price paid to new CCGT entrants (in prices of the same date) was 8.4HUF/kWh, or some 45 percent higher. Second, the average costs exclude the return on capital of a largepart of the asset base. The average cost of power from the nuclear power station at Paks was 3.55HUF/kWh, and MVM (the transmission company) estimates that recovering 8 percent on its written-down asset value would require a further 1.52 HUF/kWh (thus bringing its cost up to 5.07 HUF/kWh), inturn raising the average cost of electricity by 6 percent.3 The full cost of transmission is above the 0.5
2 With the pricing adjustments of 1999, this ratio has clearly changed.
By January 1999, the average price for electricity from Paks increased to 5.89 HUF/kWh while the averageproducers' price (excluding Paks) was reduced to 8.00 HUF/kWh.

118 Hungary - on the Road to the European Union
HUF/kWh currently allowed, and the 8 percent return on assets would require a further 0.14 HUF/kWh,though the effect of the tight price cap has been to induce MVM to reduce costs.
Third and finally, electricity is produced jointly with hot water in most plants; the price receivedfor hot water appears to be too high, effectively subsidizing the cost of producing electricity. This effectis likely to be small, as the revenue from sales of heat appears to be less than 15 percent.Nevertheless, ifthe price of hot water were to be reduced by 25 percent, then the cost of electricity would rise by perhaps3 percent.4
Telecommunications
For historic and other reasons, rates for local calling and access are low relative to underlyinglong-run costs, while long distance and international rates substantially exceed long-run costs. As of1997, the business connection charge stood at HIUF 90,000, more than triple the price for residentialcustomers. This disparity although reduced in 1998, indicates that the business rate is above cost, theresidential rate is below cost, or both.5
Distorted telephone rates impose significant costs by providing wrong economic signals to theusers of the telephone network. Low rates for local calling overstimulate local usage, while longdistancecalling is repressed because of excessive rates. In addition, unbalanced rates create incentives for bypass.
Whatever their rationale, such unbalanced tariff structures are not sustainable in a competitiveenvironment. Entrants will be impelled by the profit motive, regardless of their efficiency, to diverttheoverpriced business. At the same time, they will be unlikely to relieve incumbent operators of thefinancial burden of serving customers whose tariffs do not compensate for the costs of service. Theoutcome of this situation will be the end of cross-subsidies, with incumbent operators losing their abilityto cross-subsidize underpriced local services, including network access, with revenues from overpricedservices such as international calling. Therefore, either new sources of subsidy must be found, or the ratesthat were below incremental costs must be raised to compensatory levels.
Incumbent operators claim that existing rate structures do not allow them to compete fairly withtheir wireless rivals, and their problems will only be aggravated after wireline competition is introduced.As Hungary moves toward a fully liberalized telecommunications market, its rate structure must berationalized. Such rebalancing will surely be necessary -both for the operators and for the publicinterest-as competition approaches the end of the protected monopoly period, as international callbackand other arbitrage mechanisms spread, and as value-added services become closer substitutes for basicservices.
Policymakers in Hungary need to plan now for a smooth transition to competitive pricing. That isthe only way to avoid serious dislocations for the industry and its customers. The primary issues concernthe standards to apply in rebalancing (e.g., revenue neutrality, adjusted revenue neutrality, or profitneutrality); the pace of rebalancing; and the continued promotion of universal service in a competitiveenvironment. It should be noted considerable progress has been made in these areas during the last year.
4 These estimates are only rough approximations at best, given the inherent difficulties of allocating fixed andcommon costs in a way that is not arbitrary and has a strong foundation in economic logic.
S By 1999, for MATAV customers the business connection was reduced to HUF 60,000 with a plan for a furtherreduction to -UF 40,000. At the same time, the residential connection was reduced to HUF 21,000.

Chapter 6. Preparing Infrastructure for EU Accession 119
Tariffs are in the process of being significantly rebalanced. Beginning in January 1, 1999, pulse-basedtariffs have been replaced with a time-based system. Moreover, the new pricing regulations likely to beimplemented by 2000 will substantially reduce cross-subsidies, mitigate the local access deficit problem,and facilitate more efficient peak load pricing.
Gas
Even though the government increased the residential price of gas by 800 percent over the lastdecade, the price remains too low. The ratio of residential price to industrial price in Hungary is 1.3 to 1.Determining the appropriate relationship would require detailed analysis of cost data, butthe typical cost-based relationship between the residential and industrial price of gas is approximately 2 to 1.
It costs much more per unit of gas to provide residential service than to provide industrial service.Part of the difference is attributable to differences in the temporal pattern of demand by the two types ofcustomers. Home heating accounts for most of Hungary's residential demand, and this demand isextremely erratic. It is very high on the coldest days of the winter-the days in which MOL and theGDCs experience their peak demand. By contrast, industrial customers have more predictable, evendemand. Moreover, some industrial customers receive gas on an interruptible basis, and industrialcustomers can be interrupted when unusually cold weather causes residential demand to reach extremelyhigh levels. As a result of these differences, residential customers account for a disproportionate amountof the capital MOL and the GDCs must invest in pipes that are large enough to accommodate peak daydemand. For the same reasons, they also account for a disproportionate amount of MOL's costs of storinggas. In addition, service to residential customers requires the GDCs to invest in a network of small, low-pressure distribution lines that are not needed for industrial customers.
An even larger part of the difference between the per unit cost of serving residential andindustrial customers has to do with the costs of metering, billing, and collecting from customers. Thesecosts are much larger, per unit of gas provided, for residential than for industrial customers. Moreover,the GDCs' costs of serving residential customers are probably considerably higher than the analogouscosts of most Western GDCs. Most North American and Western European GDCs now use remote meterreading and send their bills through the postal service. The Hungarian GDCs, in contrast, rely onmanually read meters and door-to-door collection, both of which are more costly.
Providing a service below its cost invariably distorts decisionmaking and reduces the allocativeefficiency of a market. If residential customers are offered gas service at a subsidized rate, some willchoose gas service over an alternative, even though gas is actually more costly to society. For instance,the District Heating Association claims that the subsidized residential gas price is encouraging some oftheir customers to switch to gas when the actual social cost of district heating is below the social cost ofresidential gas service. Provision of subsidized gas service also distorts the decisionmaking of existinggas consumers. The demand for gas is characterized-by some price elasticity, even for existing residentialgas consumers. Thus, for instance, a residential consumer who buys gas at a price below cost will wastegas by underinvesting in insulation and in weather-stripping of doors and windows.
The subsidized rates now paid by residential gas consumers in Hungary cannot be sustainedindefinitely. At least three factors will force up residential rates over time: (i) the depletion of price-regulated domestic reserves; (ii) the government's commitment to allow MOL and the GDCs theopportunity to earn an 8 percent return on their investments; and (iii) the ultimate availability ofcompetitive supply alternatives to industrial customers. The latter eventuality will eliminate the viability

120 Hungary - on the Road to the European Union
of any system of cross-subsidization in which the suppliers use excess revenues from above-costindustrial rates to offset inadequate revenues from below-cost residential rates.
Hungary may want to retain a special subsidized rate for extremely poor consumers. Many NorthAmerican and Western European regulators use such a mechanism to supplement their cash-basedwelfare programs. However, Hungary should eliminate its present broad subsidized rate to all residentialconsumers as quickly as possible. The extraordinarily rapid rate of increase in residential gasconsumption underlines the need for prompt elimination of the residential gas subsidy. This subsidy canbe eliminated by taking three steps: (i) increasing the GDCs' rates to the level necessary to allow themthe opportunity to earn the promised 8 percent return; (ii) deregulating the price of Hungarian gas,coupled with an offsetting increase in the production royalty MOL pays the government; and (iii)reducing the industrial price to the extent that it is now above cost and providing a cross-subsidy to theresidential price.
At present, the regulated prices of gas for all classes of consumers do not vary with the level ofdemand for gas service. Consumers pay the same price for a unit of gas on a warm summer day, whenMOL and the GDCs are operating far below capacity, and on the coldest day of the winter, when MOLand the GDCs are operating at full capacity and curtailing service to industrial customers, andwhen MOLis maximizing its withdrawals both from producing wells and from storage. There is also an urgent needfor reform with respect to that characteristic of the present rate structure. It costs much more to provide aunit of gas at a time of system peak demand than when the system is operating well below capacity.System peak demand determines the magnitude of the required investment in virtually allcapital assets ofMOL and the GDCs, including gas wells, pipelines, storage facilities, and compressor stations. Peakdemand also has a major effect on some operating costs, e.g., the cost of injections and withdrawals fromstorage, of compressor fuel, and of curtailing service to industrial customers. The Hungarian ratestructure should be changed so as to confront all consumers with the fact that providing a unit of gaswhen the system is operating at peak capacity costs much more than providing a unit of gas when thesystem is operating well below its full capacity.
There are several ways of changing a rate structure to reflect temporal differences in the cost ofproviding gas service. Ideally, prices should be set on a real-time basis; i.e., the price of gas should varycontinuously with changes in cost. There are, however, many major impediments to adopting such anidealized system; e.g., the cost of metering required for its implementation is prohibitive at present.Fortunately, there are also surrogates for real-time pricing that significantly improve the accuracy of theprice signals consumers receive and can be implemented easily and inexpensively. The governmentshould take the first step in this direction by adopting a rate structure that requires firm industrialcustomers to pay more for gas in the winter, when peak demand is likely to be high, than in the summer,when the system is always operating well below its peak capacity.
Interconnection Policy
Emerging experience from several countries indicates that the removal of legal barriers tocompetitive entry is not, in itself, sufficient to create effectively functioning competition among networkutilities. Competitors must have access to essential network facilities (the transmission grid in electricity;the switching centers and local loop in telecommunications; the pipeline system in gas; the track inrailroads) on non-discriminatory terms if they are to have a reasonable opportunity to compete. Explicitregulatory intervention may be required to ensure such access. This is particularly true in situations whereessential facilities are owned or controlled by incumbent operators. One of the primary challenges facingHungarian regulators, therefore, is to set a level and structure of access prices to promote dynamic
Chapter 6. Preparing Infrastructure for EUAccession 121
efficiency through efficient entry and investment decisions, while enabling network owners to obtain afair return on their invested capital. Access regulation should ensure that there is sufficient pressure onthe owner to operate the network in an efficient manner, but that network construction is notunnecessarily duplicated.
The definition and implementation of an access regime is not a matter that can be settled onceand for all; rather, it is an ongoing process. Nor is it a process that can be guided by simple rules-thereare inevitably difficult issues that must be resolved. The regulatory authorities will need to: (i) articulate aset of fundamental principles to govern regulation of access and interconnection; (ii) establish clearguidelines by which the behavior of bottleneck monopolists and their rivals should be judged; and (iii)develop a fallback set of standards to apply should private negotiations fail and disputes aboutpredationthrough competitive access arise.
In today's fast-changing technological and marketing environment, it is difficuitto predict whatcollection of basic network elements will prove essential to the efficient provision of some desired serviceby some supplier. Thus, the opportunities for competition to work effectively and stimulate innovationwould be enhanced by the availability-on an unbundled and non-discriminatory basis-of any basicnetwork element, or any collection of functions, that may be needed by prospective competitors.
Competitively Neutral Mechanisms for Funding Universal Service
In Hungary, as in most countries around the world, traditional public policy toward theinfrastructure sectors has led to prices with systematic elements of cross-subsidization.Nonetheless, asnoted above, both economic theory and regulatory experience suggest that it is impossible to maintainsignificant cross-subsidies in the structure of prices for long, in the context of open entry and no remedialpolicies, whether or not that would seem desirable to policymakers. With market liberalization, therefore,either new sources of subsidy must be found, or rates that were below incremental costs must be raised tocompensatory levels.
Following deregulation of key sectors in the United States, for example, substantial effort was putinto the design of competitively neutral mechanisms to foster desirable social goals and positiveeconomic externalities. The need to adopt support mechanisms that are both explicit and sufficient toadvance certain publicly articulated universal service principles, and to assist consumers who wouldotherwise be disadvantaged, is even more pronounced in Hungary, in view of the less privilegedsocioeconomic characteristics of users of infrastructure services.
Experience with universal funding mechanisms in the United States and the European Unionoffers important lessons. In the context of a specific country, however, the policy approach to pursuinguniversal service goals should be sensitive to the country's political and institutional endowment, its fiscalcondition, consumer incomes and preferences, and the industry's economic characteristics. Policymakersin Hungary will need to understand how these factors affect the optimal design of support mechanisms.They will need to consider, for example: (i)whether support for universal service should be funded out ofgeneral tax revenues, or perhaps out of a broadly based tax on revenues derived from the industry'sproducts and services; (ii) the extent and scope of subsidies; and (iii) methods for delivering the subsidywithout distorting competition.
122 Hungary - on the Road to the European Union
Competitive Pricing Flexibility
For Hungary to receive the benefits of market liberalization, infrastructure operators must bepermitted to compete with flexible prices and terms. In order to cover their fixed costs, sunk cost, thecosts of various obligations, and the revenues promised by privatization agreements, as well as to bestserve the interests of the overall economy, operators need to be permitted to vary prices among users andclasses of users in accordance with the value and marginal costs of service. Within the boundariesdetermined by the avoidance of cross-subsidization, the need to set some prices aggressively low in orderto retain business means that other prices should be permitted to compensate to secure adequate returns.
OVERVIEW OF THE TRANSPORT SECTOR
Hungary's transport infrastructure and operations are extensive, but not of sufficient quality orefficiency to meet the needs of the evolving service economy. There are 30,000 km of national roads, butabout 45 percent of them are in unsatisfactory or poor condition in terms of surface condition, and 35percent in terms of bearing capacity. MAV has about 8,000 km of track (the same density as the EU), butabout 40 percent of it has speed restrictions due to its poor condition. In addition, a significant part of thefleets belonging to MAV, VOLAN, MAHART, MALEV, and BKV are obsolete and need to be replaced.
One important structural consideration is that transport demand is changing, as it is throughoutthe Central and Eastern European countries (CEECs), due to the decline of heavy industry, growth of theservice economy, reorientation of trade toward the West, and rapid growth of motorization. Total demandfor transport has declined, but the need for high-quality transport services has increased. New, specializedsmall and medium-sized enterprises (SMEs) are replacing heavy industries. These are linked with distantpartners throughout Hungary and the EU, so that activities which formerly took place within the walls ofa large factory now occur over great distances. All these factors favor road and air transport at theexpense of rail transport, except where distance, high point-to-point density, and environmental orsafetyconsiderations justify rail.
Hungary's market reforms over the past decade are consistent with creation of an internal marketwithin the EU, based on the principles of liberalizing competition and harmonizing regulations. Thepremise of this chapter is that EU accession puts pressure on Hungary to expedite further reforms, andthus provides an opportunity to overcome obstacles. This can be accomplished not by requestingderogations that protect inefficient state-owned enterprises (SOEs) in the transport sector, but byexpediting privatization and competitive restructuring of those SOEs, and by investing only in areas thathave high priority relative to other transport needs.
Acceptance of the acquis communautaire means that Hungary must adapt its transport enterprisesand infrastructure to EU norms. The EU foresees substantial transport investment as a way for members,particularly peripheral members, to adapt to decentralized production and an urban service economy,close the income gap (as happened to Spain, Portugal, and Ireland), and overcome the physical divisionsbetween East and West. In pursuit of this objective, the EU has identified the TEN (Trans-europeannetworks), the road and rail corridors for priority investment, three of which pass through Hungary. Inparticular, the EU proposes that ECU 4.6 billion be invested in an identified backbone transport network,and ECU 4.8 billion in an additional network. One 1996 study by DG7 estimated Hungary's road and railinvestment needs at ECU 12.9 billion.

Chapter 6. Preparing Infrastructure for EUAccession 123
This approach calls for the following comments:
i) Investment in the three TEN corridors represents only a small part of Hungary's transportinvestment needs, particularly given the poor condition of existing infrastructure and fleets.
ii) It is recommended that the transport system be considered from the demand side (reductionsin travel time and improvements in service quality) rather than the supply side (km of track ormotorway built). This is the clear lesson from improving border crossings, where low-costimprovements saved as much travel time as major motorway investments. It is also thelesson from the improvement of the Budapest - Vienna rail line, where the promised two-hour travel time was not achieved because of slow travel in the vicinity of stations. Surveysof actual freight and passenger travel times should be carried out where this information isnot known.
iii) Similarly, efforts should be continued to improve the market orientation, efficiency, andoperational independence of all transport organizations, with a view to privatizing remainingSOEs as soon as possible. This could lead to significant improvements in service qualitywithout major investment. Moreover, major physical investments risk being misused orunder-maintained if the SOE is inefficient.
iv) It is recommended that Hungary prioritize all its transport investrnent needs, including thethree TEN corridors, using traditional cost/benefit techniques; and prepare an investment andfinancing plan. In general, market reorganizations, including management development andbudgetary controls, maintenance/rehabilitation, replacement of obsolete vehicles, and stagedconstruction have significantly higher economic priority than the construction of newmotorways or high-speed rail lines. Deviations from the plan should only be consideredwhere concessional financing is offered. (In this regard, it was estimated at the HelsinkiConference that only 9 percent of transport investments in the accession countries would befinanced by grants, while 8 percent would be financed by private investors, 11 percent byloans from international financial institutions (IFIs), and 72 percent by national budgets.)It isimportant to establish these investment priorities in an objective manner before pressures andeuphoria build in the months approaching accession.
v) Particular care should be taken where both road and rail investments are proposed in thesame corridor, because of the risk of an expensive duplication of transport capacity.
vi) It is important not to overlook urban transport needs, which are not included in the TENproposals but play an increasingly important role in a service economy.
TOWARD EU ACCESSION: SUMMARY AND RECOMMENDATIONS
Hungary's infrastructure sectors (with the notable exception of transportation) have beenprivatized, restructured, and placed under regulation in a manner consistent with best practice andreflecting genuine creativity in serving the public interest. In short, there is much to applaud in thesesectors, from their new market-oriented structures to the skills and vitality of those who crafted, operate,and regulate the sectors. These reforms place Hungary in a leading position transition countries, and inadvance of many countries in Western Europe.
124 Hungary - on the Road to the European Union
We have, however, identified several opportunities for further competitive restructuring andregulatory reform. If these reforms are implemented, they would result in significant new gains ineconomic performance.
Electricity
The legal framework and the regulatory institutions have won the confidence of foreign investors,both in the privatization stage and in response to invitations to tender for additional capacity.The presentsystem is still, however, in transition, as it must adapt to the requirements of the EU Directive onElectricity (and other EU standards for safety, environmental emissions, etc);and it has not yet weatheredits first regulatory review, when the price cap may be reset. Despite significant progress during the lastyear, prices remain below efficient levels, and the structure of prices remains unbalanced, with continuing(although no longer large) cross-subsidies paid to domestic consumers. Gas and district heating prices arealso distorted, further complicating rational fuel use and investment decisions. These inefficiencies arerooted in distributional concerns, which are defensible, as the inefficiencies are probably of modest size.Further market liberalization may increase the pressure to cut costs, and would most likely put pressureon any remaining subsidies. As these subsidies are politically and distributionally justified, liberalizationneeds to be carefully designed to ensure that the rents are not transferred from consumers to shareholders,at least not without adequate recompense. It should be possible to do this without great difficulty; indeeddistributional considerations are not a compelling argument against liberalization, nor against improvingthe efficiency of price signals in the industry.
The EU Electricity Directive does not seem to unduly constrain Hungary's choices, and Hungarycould choose to keep much of the present structure more or less intact. The main argument for theDirective is that it provides a unique opportunity to undertake further liberalization in an already largelyprivatized industry, and this opportunity appears worth taking.
If competition proceeds in response to a more liberal interpretation of the Electricity Directive,and with the encouragement of the government, then a number of regulatory issues will need to beaddressed. The most immediate is that competition puts pressure on Hungary to align tariffs with costs; ifthe larger commercial and industrial customers have access to competitive markets and are indeedcheaper to serve than residential customers, then some rebalancing of the rates may be necessary. Thisshould not pose regulatory problems, provided the different components of the costs of serving customersare clearly identified (generation at different times of the day, transmission, and distribution).Nonetheless, subsidies to residential customers may need to be made explicit if the financial viability ofthe distribution companies is to be sustained-especiallywhere there are major differences in the costs ofserving high and low-volume customers.
If generation is liberalized and if the transmission part of MVM is required to operate on marketprinciples, then issues of the location of power stations and the coordination of investment intransmission and generation may become acute. At present, with MVM responsible for assessing thesystem's long-term demands and for authorizing expansion, this coordination can be readily handled andthe full costs of providing different degrees of transmission reinforcement can be systematicallycompared. The decentralized market approach requires the careful design of locational signals to guidethe location of new power stations, and it raises issues of regulation and governance concerning thenational grid, which may now require incentives to provide quality transmission services in response tonew generation.
Chapter 6. Preparing Infrastructure for EUAccession 125
The simplest way to provide these incentives may be to follow the model of the British electricutility NGC, which has to provide a required quality of service and invest in transmission capacitysufficient to meet that standard, while being given incentives to minimize the costs of providingtransmission and ancillary services. These incentives take the form of profit sharing: if NGC can lowerthe cost of providing transmission services, it keeps some of the cost savings, while if it fails, it bearssome of the additional cost, up to a limit. Alternative systems, in which the construction of newtransmission lines is open to consortia of producers and consumers are willing to finance the additionaltransmission in return for lower transmission costs (as in some Latin American countries), may face hightransaction and bargaining costs, and may fail to achieve the benefits of efficient competition.
The locational problem should not be exaggerated, as it is difficult to see the present system ofapproval for new generation disappearing overnight. Nevertheless, if further liberalization iscontemplated, the Hungarian Energy Office will need to acquire or contract for the necessary expertise tojudge the prudence of transmission investments and generation location decisions.6 This may require atransparent transmission pricing model and a system of appraising investments in generation andtransmission.
Telecommunications
Hungary has made significant progress in modernizing and reforming its telecommunicationssector. The first step was to sell the state-run companies to investors willing to invest in developing theinfrastructure. One of the incentives for this investment was the promise of an exclusive regulatedfranchise until 2002. While this may have increased the amount paid for the franchise, it has clearlyimpacted competition.
Exclusivity provisions are not consistent with EU rules. Nonetheless, since the expiration datesfor those provisions nearly coincide with the expected date of accession, this should not be a bindingconstraint during negotiations. The following recommendations are directed at developing a moreeffective telecommunications sector by the time competition is mandated.
The government should take an active role in ensuring that efficient competition for non-exclusive services can survive, both currently and in the future, now that there will be viable franchisesfor efficient competition for voice services. Such actions include close scrutiny of all mergers, especiallywith an eye toward preventing the elimination of potential competition.The authorities should also adopta market-based spectrum policy that will help promote current mobile wireless services and positionwireless to be a competitive alternative to wireline voice services. It should be noted that the newtelecommunications law, now under preparation, deals with many of these issues (e.g., spectrumallocation and management), and envisages substantial further market liberalization.7
The regulatory authorities also need to examine their roles. They should eliminate anyunnecessary regulatory hurdles to competitors and requirements that will frustrate competition.Regulators also need to set forth clear, efficient rules for the interconnection of networks so thatcompetitors will have the confidence to undertake significant capital investments.
6 The Hungarian Energy Office has already issued guidelines for new capacity tendering.
7 The new law will enter into force in 2001.
126 Hungary - on the Road to the European Union
Gas
The government has made impressive progress in its efforts to create a strong, efficient gassector. It has successfully privatized all major market participants, subjected them to a carefully devisedsystem of incentive regulation, and authorized large price increases that go a long way towardestablishing prices that are consistent with costs and market forces.
The most serious remaining problem with the performance of the gas market is Hungary'sdependence on a single gas supplier. Hungary lacks the ability to address that problem on its own, butthere are potential solutions on the horizon-the most promising of which would be the promptimplementation of the EU Gas Directive. The directive aims to create a competitive gas marketthroughout the EU by providing for third party access to gas transmission lines. If the directive is fullyimplemented in the EU, Hungary will have effective access to multiple competing suppliers, with largeresulting benefits to its domestic gas market.
There are two remaining problems with the government's methods of regulating the gas market.First, the present regulatory system provides extremely limited opportunities for competition, which isunderstandable, given the lack of access to alternative suppliers. Nonetheless, the government needs to beprepared to promptly implement pro-competitive regulatory reforms, as soon as Hungary obtains accessto multiple gas suppliers. Second, the present rate structure is inefficient. Residential prices are too low,and there is no difference between the price of gas purchased during peak and off-peak periods. Thegovernment needs to promptly authorize further increases in the residential price and create an on-peak/off-peak price differential.
Roads
Two issues in the road sector have become more critical because of the preparation for EUaccession: (i) the strategy for conserving and improving the road network; and (ii) the system of roadfinance. Much of the existing road network needs rehabilitation or periodic maintenance, particularly theextensive secondary network, which is managed at the national level. In addition, Hungary needs tostrengthen part of the primary road network to accommodate the EU's higher axle load limit of 11.5 tons(MTCWM proposes 2,000 km, which would require strengthening 150 bridges).
Hungary has emphasized motorway construction as a way to comply with proposed TEN corridorimprovements and catch up with Western Europe. Hungary now has 336 km of motorway, which isbelow the EU average relative to population or GNP. However, Hungary's GNP per capita is also lowerthan the EU. It would be imprudent to build motorways too quickly, at the expense of investments inother key sectors. It is important to note that if the TEN corridors are looked at from the demand side (theonly way trucks and motorists see it), much can be accomplished with lower levels of expenditure. First,border crossing bottlenecks need to be resolved, as is happening. Second, the backlog of deferredmaintenance and rehabilitation needs to be cleared to reduce vehicle operating costs. Third, existing roadsand bridges need to be upgraded in terms of speed, traffic capacity, bearing capacity, and safety. Hungaryhas relatively few urban bypasses, which benefit both through and local traffic. It is recommended thatMTCWM plan these improvements on a corridor basis, as much of the benefit is lost ifthe improvementsare fragmented. It is important to note that this approach will benefit all Hungirian road users, many ofwhom cannot afford tolled motorways.

Chapter 6. Preparing Infrastructurefor EUAccession 127
Railways
MAV continues to be a significant drain on the Government's budget and the economy, withpassenger subsidies in 1997 amounting to HUF 37.1 billion, or 0.44 percent of GDP. In addition to thisdirect subsidy, the Government is responsible the substantial losses incurred each year by MAV.However, MAV accounts are not prepared in accordance with international accounting standards (IAS),so its accounts for 1997, showing a loss of HUF 11.9 billion, or 0.14 percent of GDP, substantiallyunderstate the true losses. The main differences with IAS are the inadequate level of both depreciationcharges and repair and maintenance expenditures. The best estimate of the real cost of MAV to theeconomy is about 1 percent of GDP over the last six years, and the trend is rising, due primarily to the fallin freight traffic. It is recommended that the government require MAV to prepare its accounts inaccordance with IAS so that the true financial position of the railways and cost to the government can beascertained.
The government at present determines the level of passenger services and sets maximumpassenger fares. MAV presently collects about 35 percent of the cost of providing passenger servicesthrough ticket sales. While the government provides substantial operating subsidies, the amount is grosslyinadequate to cover the mandated level of passenger services. The resulting cash flow problem meansthat MAV must limit its renewal investments and restrict the amount it spends on repair and maintenance.The deteriorating financial situation is further concealed by an inadequate charge for depreciation. Thelack of investment and maintenance over the last eight years affects not only passenger service, butfreight service as well. This is adversely affecting MAV's competitive position in the freight market,where it has a competitive advantage for some types oftraffic. Every year MAV must resort to short-termborrowing, which results in insolvency every few years. This form of financial management is very costlyto the government and demoralizes MAV, leading to numerous changes in managers who are not able toaddress the underlying issues. This malaise can only be remedied by establishing, in advance, realisticgovernment payments for public service obligations.
The other condition for rail success is improvement in its management and commercialorientation. There are economies of scale in this endeavor, as flourishing railways in the CEECs willgenerate traffic for the EU, and visa versa. EU accession accelerates pressures that have been building forsome time, and clinging to the nationalist status quo risks making MAV (or any other railway) all butirrelevant. A corollary is that MAV, at its present level of efficiency, cannot effectively use eitherongoing investments or those under consideration in the TEN corridors because they risk not beingproperly maintained or well utilized.
The steps required to improve MAVs managerial efficiency and service orientation (and reducesubsidies) are known and supported by the EU, but are not easy to implement. They involve theseparation of track (already done in the accounting sense); as well as the creation of a for-profit freightcompany (which could be eventually privatized), a passenger company subsidized only through publicservice obligations (PSO), and a restructuring company to dispose of excess assets and retrain orcompensate redundant personnel.
MAV has already separated its track accounts, and MTCWM and the Ministry of Finance arediscussing a system of track charges, as required under EU Directive 91/440. A management andaccounting and costing system for freight and passenger services also needs to be developed. It isrecommended that this process be completed, and that Hungary's tracks be opened up to both local andforeign trains, under terms and conditions that are cconpetitively neutral. Thus, the European Rail Freewaysshould be permitted to extend their services through Hungary on MAV's tracks, and reciprocal rights for

128 Hungary - on the Road to the European Union
Hungarian trains to operate in the present EU should be negotiated, even though present differences inlocomotive electrification make it difficult to take advantage of this opportunity in the short run. Thesearrangements will serve several purposes. First, they will enable the government to clearly identify whichtypes of traffic are profitable, the subsidies needed for individual passenger services, and areas whereservice should be discontinued. Second, they will provide competition and thus ensure a higher level of railservice to the Hungarian market. Third, they will put pressure on both the government and MAV tocommercialize all rail services.
Road Transport
Most countries rely on the private sector for intercity truck and bus services, and numerous studiesshow that the private sector does the job at lower cost and a higher level ofthan publicly owned companies.The issue in Hungary is the slow privatization of VOLAN, the large (30,000 employee) association ofdomestic passenger, freight, and freight forwarding companies. VOLAN is owned by the State Privatizationand Property Administration Company (SPPA), but the privatization process has been going on for a decadewithout being completed. It is recommended that VOLAN's freight and bus operations be separated becausethese require different management skills. It is also recommended that the trucking companies (some 400-1,000 trucks per company) be divided because they are much larger than in EU countries. In addition, it issuggested that the government offer lease or lease-purchase arrangements to provide financing. Workshopsshould be disposed of separately where possible.
MTCWM is currently preparing a new law on public transportation to harmonize with EUrequirements. It is recommended that this legislation be used to completely deregulate interity bus and truckservices, with the government's role limited to ensuring compliance with safety and environmentalregulations. Regulations that serve to limit access to the driving profession should be avoided to the extentpermitted by EU regulations. VOLAN should be expeditiously privatizedwithout investing in advance, andwithout asking for derogations from the EU. The privatization of VOLAN, which has proved difficult toimplement in the past, could be usefully supported by an IFI to provide advice and momentum. This step isthe best way to ensure the rapid adjustment of the Hungarian fleet size to match demand, improve the qualityof service, and reduce government subsidies. PSO payments should be provided only for required busservices in suburban areas and to remote towns (others are commercially viable) and paid, if possible, bythe local authority that benefits from the service.
The system of international trucking permits is being liberalized in stages, and this process isexpected to continue following accession. Presently, permits have been issued for 4,800 trucks, of which1,000 are Euro 1 & 2, and 3,800 are bilateral. Hungary should support this liberalization. It is alsorecommended that the government support reciprocal cabotage rights, including permitting foreign truckingcompanies to operate within Hungary. This will also help adjust the size of the trucking industry to demand.
Inland Navigation
The shift of economic output away from heavy goods has resulted in a permanent decline in traffic,as it has with the railways, and excess capacity in both river ports and transport. Traffic on the Danube southof Hungary is also blocked by the conflict in ex-Yugoslavia. One positive development is the startup of roll-on roll-off (ro-ro) traffic (trucks with trailers that can be loaded onto ships) between Germany and Budapest,which avoids congested roads and border crossings. River transport is deregulated, and there are a numberof private operators. MAHART is owned by SPPA, and has about 200,000 tons of river freight transportcapacity. It also provides passenger transport services and ship repair, and operates the free port of Csepel.NMAHART is cross- subsidized by its more profitable port activities. It is recommended that these

Chapter 6. Preparing Infrastructure for EUAccession 129
organizations be separated, a landlord port created, and port operations privatized. MAHART requestssubstantial public investment to replace its aging fleet (mostly pusher barges), but this is not recommendedsince the private sector will invest where there are good business opportunities.
Aviation
MALEV, the national airline, is owned by SPPA, municipalities, private banks and individuals. Todate, it has acted as a full service airline, providing scheduled service throughout the world. The EU isslowly deregulating its airlines, following a pattern established earlier in North America.This is expected toput additional commercial pressures on small airlines such as MALEV, a process that will likely to beaccelerated by EU accession. One strategy for MALEV would be to participate in creating a new regionalairline, on the model of SAS, is order to become competitive by becoming larger; howeveg this may bepolitically difficult to achieve. Another strategy would be to form an alliance with a larger carrier. It isrecommended that MALEV develop a business plan, assuming increasing competition, and assess itsoptions. The best strategy may be for MALEV to become a regional carrier, feeding into another long-distance airline with which it has a partnership.
Urban Transport
About 80 percent of GNP in EU countries is generated in urban areas. Hungary is developing aservice economy similar to that of other EU countries, where the efficient movement of people in urbanareas, including public transport for lower and middle income people, is an increasingly important factor inurban efficiency. It is also worth noting that the environmental benefits (air, noise, safety) of wellconceivedurban transport investments are higher than for interurban ones. It is also important not to repeat theautomobile congestion and suburban sprawl experience of Western Europe and North America. Budapesthas a well-developed public transport system. Nevertheless, further measures should be considered torestrain road vehicles in the city center (parking restrictions} and some form of congestion pricing should beintroduced. The EU now recognizes the importance of urban transport investments, and they should beincluded in the transport investment plan discussed above.
BKV and the Municipality of Budapest have taken a number of steps to improve BKV'scommercialization, increase tariffs to improve cost recovery, and renew the public transport fleet.However,timetables, tariffs, and operating subsidies are still determined atthe municipal level, which in practice hasresulted in poor financial performance-forcing BKV to take medium-term loans-and network and servicelevels that are not well matched to demand. It is important for the municipality to provide BKV with areliable operating subsidy, since tariffs are not expected to cover all costs.
7. THE LABOR MARKET
During the early years of the transition, labor market conditions changed substantially.Like other socialist countries, Hungary initiated its transition to a market economy with a highlyinefficient and distorted labor market. It shared with the other Central and Eastern Europe (CEE)countries the same basic characteristics: high labor force participation rates, especially forwomen; high employment, particularly in the industrial sector; low productivity, despite arelatively well- educated labor force; little mobility; and a compressed wage structure.
The most significant changes during the transition have been a reallocation of laboramong sectors (away from agriculture and industry, and toward services), a decline in bothemployment and labor force participation rates, the emergence of unemployment, and theintroduction of new policies governing the functioning of the labor market (wage-settingmechanisms, and active and passive labor market policies).
While Hungary advances toward EU integration, three main sets of questions seempertinent:
• To what extent has the labor market adjusted ? Is there sufficient adjustment to ensuresmooth integration into the EU?
. Are the policies in place adequate to ensure the flexibility needed for productivity toincrease?
* What is the likely impact of EU accession on the labor market? Should we expect substantialjob creation, increase or decrease in unemployment, increased mobility and migration?
This chapter attempts to answer these questions, after briefly reviewing recent trends.
RECENT TRENDS
Employment, Labor Force Participation, and Unemployment
Among the changes in the Hungarian labor market during the transition, three areparticularly striking: the decline in employment, the decline in labor force participation, and therise in unemployment. Between 1990 and 1996, Hungary lost about 1.4 million jobs (27 percentof the total). The employment level stabilized in 1997 and increased slightly in 1998. In parallelfashion, unemployment emerged, rose rapidly, and after reaching a peak of about 13 percent in
130

Chapter 7. The Labor Market 131
early 1993, declined to 8.7 percent, its current level'; this is somewhat below the average for theEuropean Union (10.9 percent in 1998).
While these trends are common to all CEE countries, the magnitude of the changesvaries (see figures 7.1 & 7.2). While Hungary has lost 27 percent of its jobs since 1990, Sloveniahas lost 18 percent, Slovak Republic 16 percent, and Poland and the Czech Republic only 8.6percent. Since 1993-94, employment either stabilized or grew slightly in all countries exceptHungary, where it kept declining until 1997. Differences in unemployment trends can also beobserved with Poland, which registered the highest unemployment rates, and Estonia and theCzech Republic, which had the lowest.
Figure 7.1: Employment Trends in CEE Countries
Total Employment (1990.100)
105
85 \ < _ | | ~~~~~~~~~~~~~~~~Pl and
100
Slovenia
\5 -9 Czech Re
as . -__|+-Estonia75
70¶00 100 1092 ¶D3 1904 *1S0 ¶00
Figure 7.2: Unemployment Trends in CEE Countries
Unemployment Rate t%)
14
12 -- Hungary
10 - PolandSlovenia
8 - Czecl Rep
6 /j- Estonia
01990 1991 1992 1993 1994 1995 1996
Source for Figures 7.1 and 7.2: OECD-CCET Labor Market Database.
Estimates of unemployment rates vary according to the source. Based on the number of registered unemployed, therate peaked at almost 13 percent in 1993, and declined to 9.2 percent by mid-1998; based on labor force surveys,however, the unemployment rate would be only 8.7 percent in 1997. Differences seem related to the advantages thatregistration in labor offices provide: access to job counseling, employer information and training programs, and freehealth insurance.
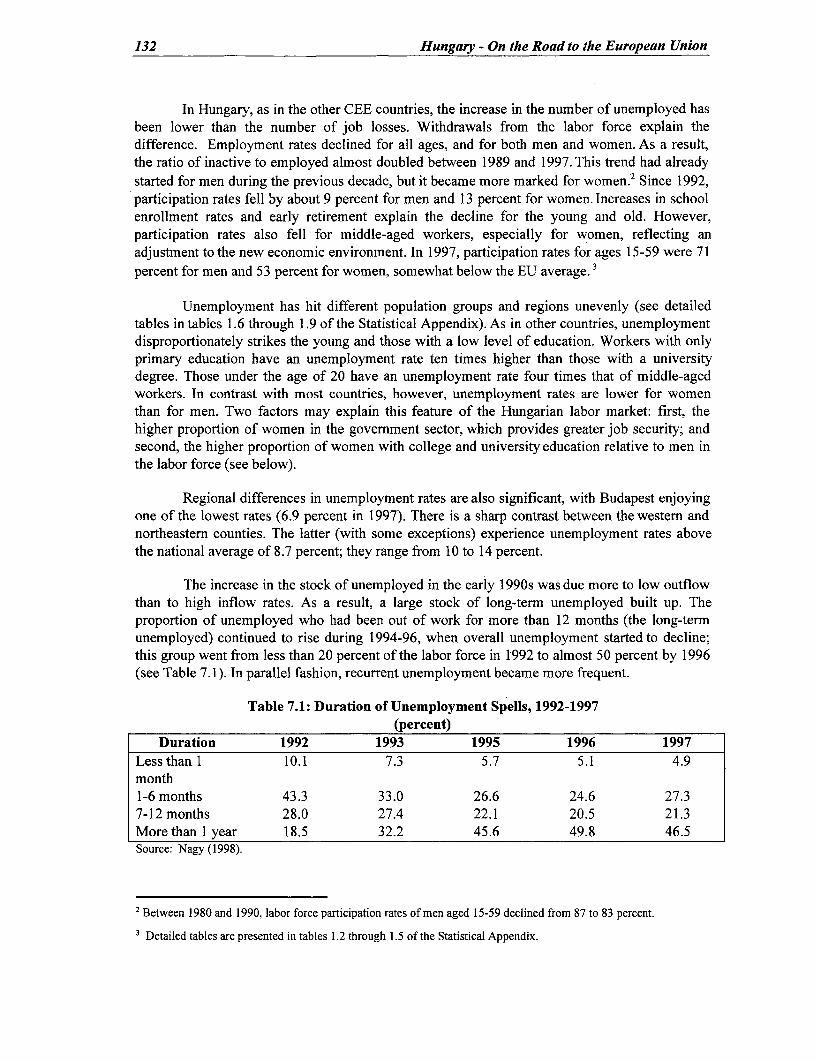
132 Hungary - On the Road to the European Union
In Hungary, as in the other CEE countries, the increase in the number of unemployed hasbeen lower than the number of job losses. Withdrawals from the labor force explain thedifference. Employment rates declined for all ages, and for both men and women. As a result,the ratio of inactive to employed almost doubled between 1989 and 1997. This trend had alreadystarted for men during the previous decade, but it became more marked for women.2 Since 1992,participation rates fell by about 9 percent for men and 13 percent for women. Increases in schoolenrollment rates and early retirement explain the decline for the young and old. However,participation rates also fell for middle-aged workers, especially for women, reflecting anadjustment to the new economic environment. In 1997, participation rates for ages 15-59 were 71
3percent for men and 53 percent for women, somewhat below the EU average.
Unemployment has hit different population groups and regions unevenly (see detailedtables in tables 1.6 through 1.9 of the Statistical Appendix). As in other countries, unemploymentdisproportionately strikes the young and those with a low level of education. Workers with onlyprimary education have an unemployment rate ten times higher than those with a universitydegree. Those under the age of 20 have an unemployment rate four times that of middle-agedworkers. In contrast with most countries, however, unemployment rates are lower for womenthan for men. Two factors may explain this feature of the Hungarian labor market: first, thehigher proportion of women in the government sector, which provides greater job security; andsecond, the higher proportion of women with college and university education relative to men inthe labor force (see below).
Regional differences in unemployment rates are also significant, with Budapest enjoyingone of the lowest rates (6.9 percent in 1997). There is a sharp contrast between the western andnortheastern counties. The latter (with some exceptions) experience unemployment rates abovethe national average of 8.7 percent; they range from 10 to 14 percent.
The increase in the stock of unemployed in the early 1990s was due more to low outflowthan to high inflow rates. As a result, a large stock of long-term unemployed built up. Theproportion of unemployed who had been out of work for more than 12 months (the long-termunemployed) continued to rise during 1994-96, when overall unemployment started to decline;this group went from less than 20 percent of the labor force in 1992 to almost 50 percent by 1996(see Table 7.1). In parallel fashion, recurrent unemployment became more frequent.
Table 7.1: Duration of Unemployment Spells, 1992-1997(percent)
Duration 1992 1993 1995 1996 1997Lessthan I 10.1 7.3 5.7 5.1 4.9month1-6 months 43.3 33.0 26.6 24.6 27.37-12 months 28.0 27.4 22.1 20.5 21.3More than 1 year 18.5 32.2 45.6 49.8 46.5Source: Nagy (1998).
2 Between 1980 and 1990, labor force participation rates of men aged 15-59 declined from 87 to 83 percent.
Detailed tables are presented in tables 1.2 through 1.5 of the Statistical Appendix.

Chapter 7. The Labor Market 133
Education
The education level of the Hungarian labor force has increased substantially over the lastdecade. The proportion of women with higher education almost doubled, rising from9 in 1986 toalmost 17 percent in 1996. The proportion of men increased from 10 to 14 percent. This sharpincrease seems due to the combined effect of two phenomena: the higher education level of newentrants; and the decline in employment and labor force participation, which disproportionatelyaffected those with least education. While the first phenomenon is common to all European andWestern countries, the latter is closely linked to the transition.
Real Wages
Real wages fell by 26 percent between 1988 and 1996, then increased by about 5 percentin 1997. A similar increase is reported for 1998. Real wage trends have closely followed realoutput trends. Nonetheless, the recovery in real wages lagged behind the output recovery by oneyear. The recent gains have not been sufficient to compensate for accumulated losses, and the1988 real wage level has not yet been recovered.
To WHAT EXTENT HAS THE LABOR MARKET ADJUSTED?
The sustainability of growth recovery and the speed at which convergence toward EUincome levels will take place depends, in large part, on how the labor markets function. To whatextent have workers in Hungary left unprofitable sectors or firms and responded to new job andskill-enhancing opportunities?
A number of factors suggest that the Hungarian labor market has, to a great extent,adjusted to the new economic environment. There have, for example, been large changes in thesectoral distribution of the labor force, from agriculture and industry toward services(Table 7.2).By 1997, the share of the labor force in the agriculture sector had fallen to 8.5 percent, while itrose to nearly 60 percent in the service sector.
Table 7.2: Distribution of Employment by Sector, 1980-1997Year Agriculture Industry Services Total1980 19.3 41.6 39.1 1001990 17.5 36.1 46.4 1001994 9.0 32.4 58.6 1001997 8.5 31.8 59.7 100
Source: Central Statistical Office.
The substantial reallocation of labor that took place within the manufacturing sectorprovides addition evidence of this adjustment. Between 1992 and 1997, total employmentdeclined by 37 percent in the manufacturing sector (Table 7.3). This was the outcome of twofactors working in opposite directions: a loss of 60 percent of jobs due to downsizing, merger, orliquidation of enterprises that existed in 1992,4 and a gain of 23 percent due to jobs created innewly established enterprises. The whole process appears linked to the gradual expansion of the
4 There were also important job losses prior to 1992, but data problems prevent measurement of the exact magnitude.
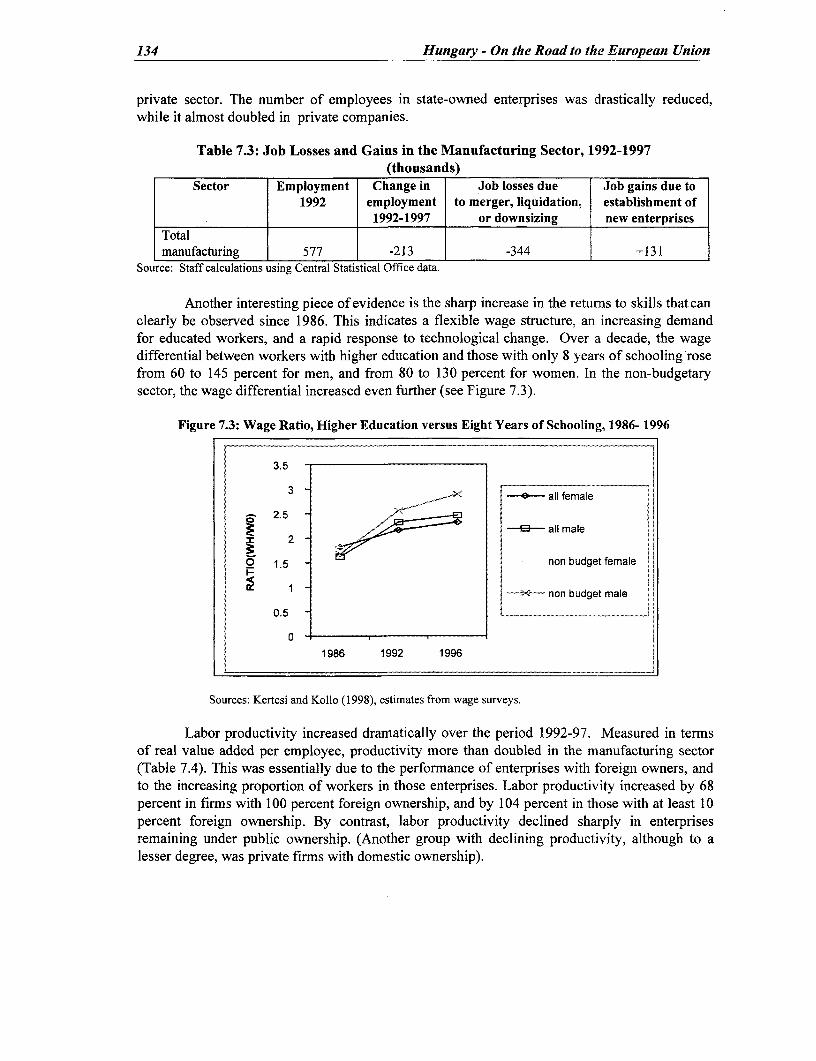
134 Hungary - On the Road to the European Union
private sector. The number of employees in state-owned enterprises was drastically reduced,while it almost doubled in private companies.
Table 7.3: Job Losses and Gains in the Manufacturing Sector, 1992-1997(thousands)
Sector Employment Change in Job losses due Job gains due to1992 employment to merger, liquidation, establishment of
Total___________ ____________ j 1992-1997 or downsizing new enterprisesTotalImanufacturing 577 -213 -344 +131
Source: Staff calculations using Central Statistical Office data.
Another interesting piece of evidence is the sharp increase in the returns to skills that canclearly be observed since 1986. This indicates a flexible wage structure, an increasing demandfor educated workers, and a rapid response to technological change. Over a decade, the wagedifferential between workers with higher education and those with only 8 years of schooling rosefrom 60 to 145 percent for men, and from 80 to 130 percent for women. In the non-budgetarysector, the wage differential increased even further (see Figure 7.3).
Figure 7.3: Wage Ratio, Higher Education versus Eight Years of Schooling, 1986- 1996
3 g 2 5 ' j0 all female
2.5 Ea -all male
0 21 5 non budget female I
0 1.5 non budget female
1 -~~~~~'f-- ~~~~non budget male
05___._ __ _
1986 1992 1996
Sources: Kertesi and Kollo (1998), estimates from wage surveys.
Labor productivity increased dramatically over the period 1992-97. Measured in termsof real value added per employee, productivity more than doubled in the manufacturing sector(Table 7.4). This was essentially due to the performance of enterprises with foreign owners, andto the increasing proportion of workers in those enterprises. Labor productivity increased by 68percent in firms with 100 percent foreign ownership, and by 104 percent in those with at least 10percent foreign ownership. By contrast, labor productivity declined sharply in enterprisesremaining under public ownership. (Another group with declining productivity, although to alesser degree, was private firms with domestic ownership).
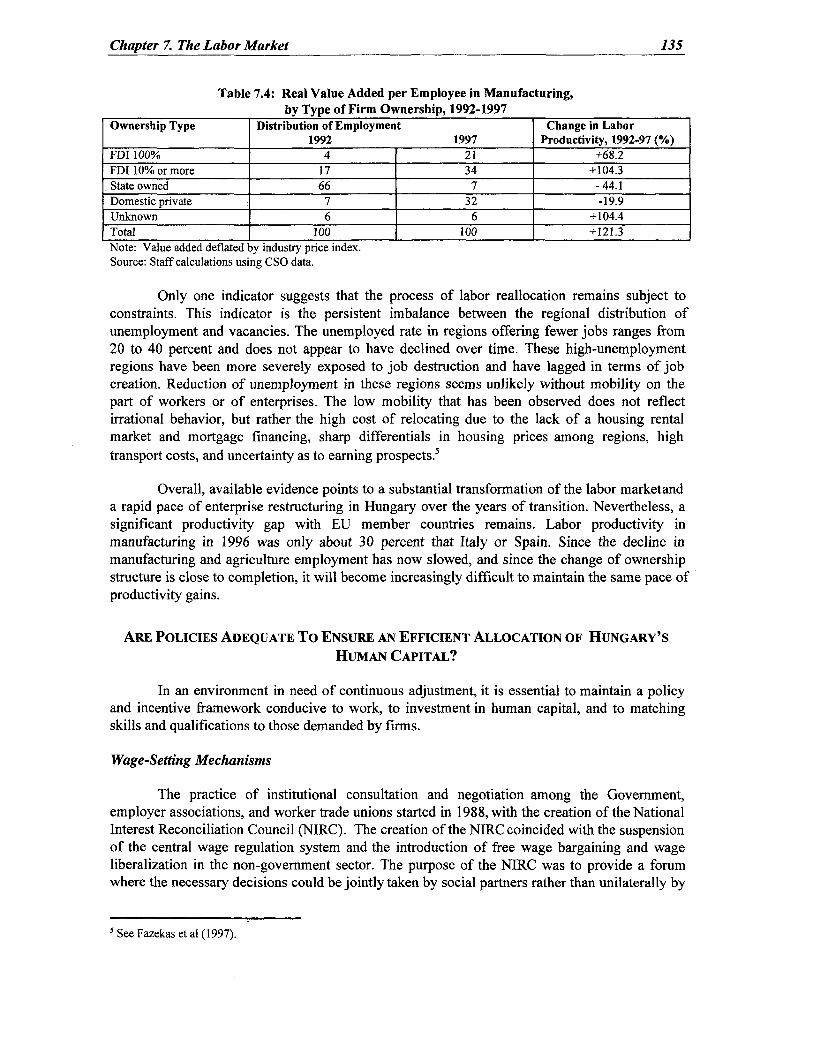
Chapter 7. The Labor Market 135
Table 7.4: Real Value Added per Employee in Manufacturing,by Type of Firm Ownership, 1992-1997
Ownership Type Distribution of Employment Change in Labor1992 1997 Productivity, 1992-97 (%)
FDI 100% 4 21 +68.2FDI 1O%ormore 17 34 +104.3State owned 66 7 - 44.1Domestic private 7 32 -19.9Unknown 6 6 +104.4Total 100 100 +121.3Note: Value added deflated by industry price index.Source: Staff calculations using CSO data.
Only one indicator suggests that the process of labor reallocation remains subject toconstraints. This indicator is the persistent imbalance between the regional distribution ofunemployment and vacancies. The unemployed rate in regions offering fewer jobs ranges from20 to 40 percent and does not appear to have declined over time. These high-unemploymentregions have been more severely exposed to job destruction and have lagged in terms of jobcreation. Reduction of unemployment in these regions seems unlikely without mobility on thepart of workers or of enterprises. The low mobility that has been observed does not reflectirrational behavior, but rather the high cost of relocating due to the lack of a housing rentalmarket and mortgage financing, sharp differentials in housing prices among regions, hightransport costs, and uncertainty as to earning prospects.5
Overall, available evidence points to a substantial transformation of the labor marketanda rapid pace of enterprise restructuring in Hungary over the years of transition. Nevertheless, asignificant productivity gap with EU member countries remains. Labor productivity inmanufacturing in 1996 was only about 30 percent that Italy or Spain. Since the decline inmanufacturing and agriculture employment has now slowed, and since the change of ownershipstructure is close to completion, it will become increasingly difficult to maintain the same pace ofproductivity gains.
ARE POLICIES ADEQUATE To ENSURE AN EFFICIENT ALLOCATION OF HUNGARY'S
HUMAN CAPITAL?
In an environment in need of continuous adjustment, it is essential to maintain a policyand incentive framework conducive to work, to investment in human capital, and to matchingskills and qualifications to those demanded by firms.
Wage-Setting Mechanisms
The practice of institutional consultation and negotiation among the Government,employer associations, and worker trade unions started in 1988, with the creation of the NationalInterest Reconciliation Council (NIRC). The creation of the NIRC coincided with the suspensionof the central wage regulation system and the introduction of free wage bargaining and wageliberalization in the non-government sector. The purpose of the NIRC was to provide a forumwhere the necessary decisions could be jointly taken by social partners rather than unilaterally by
5 See Fazekas et al (1997).
136 Hungary - On the Road to the European Union
the Government, and to provide an institutional framework for wage negotiations. The NIRC wasreplaced in mid-1990 by the Interest Reconciliation Council (IRC). The Council is comprised of,in addition to the Government, representatives from six trade union confederations and nineemployer associations. The IRC was replaced in 1999 by the National Labor Council (NLC)with the same members, but more limited competencies
The mission of the IRC was to harmonize the interests of various stakeholders andprevent conflicts. It provides a forum for exchange of information on economic and social issues;IRC partners were asked to give their opinion on Government proposals for policy and legislativechanges. Furthermore, within the framework of the IRC, the Government and other partnersnegotiated and agreed on the level of the national minimum wage, and onaverage wage increasesfor the following year. In the competitive sector, however, the agreement on the average wageincrease is a recommendation only. A similar council exists for the budgetary institutions, withthe additional competence to negotiate wages for public employees.
These councils give the Government a limited role in the wage-setting process. Beyondthe minimum wage,6 the Government does not intervene in the non-government sector, exceptthrough the average wage increase target agreed with its partners. The Government, however,cannot enforce the implementation of this agreement. In the non-budgetary sector, collectiveagreements determine the pay scale and wage increases, and most such agreements are signed atthe enterprise level. This decentralized bargaining system has most likely helped the wagestructure become more flexible and responsive to competitive forces. But it may have alsocontributed to the increased earnings inequality discussed above.
Employment Legislation
Hungary's employment legislation attempts to provide a balance between the intent tofoster permanent employment and protect workers, and the need to promote flexibility. Some ofits features, however, can be conducive to unemployment or low formal employment.
One reason is that the cost of layoffs for the employers while not out of line with that ofother European countries, is substantial, which acts as a barrier to hiring. Whenever a layofforiginates from the employer's side, the employee is entitled to a notification period andseverance payment.7 The notification period and the severance pay varies according to the lengthof employment.8 A worker with 20 years of job tenure would receive 8 months salary, in totalcompensation while one with only 4 years of employment would get only about 2 months. In thecase of mass layoffs, which occur in cases of insolvency or when at least 10 percent of a firm'slabor force is to be dismissed, procedures are more complex. The employer has an obligation tonegotiate with the trade union, inform the local employment services office, and provide anadditional 30 days of notice.
Although the cost of layoffs is substantial, it is generally in line with that of otherEuropean countries. There are, in addition, a number of cases in which layoffs can become
6 In 1996, about 5 percent of jobs in enterprises with more than 10 employees were paid at the level of the minimumwage.
' Workers who quit are not entitled to severance payments.
8 Notification period varies from 30 to 60 days. See footnote 10 for severance payments.
Chapter 7. The Labor Market 137
considerably more costly. They can be three times more costly when an employee files a claimfor unfair dismissal. Labor courts tend to rule in favor of employees, and either requirereemployment or impose fines on the employer. Dismissals are forbidden during pregnancy,maternity leave (which can be extended to three years), military service, the five years precedingretirement, sick leave, and a certain period following illness. While these restrictions are designedto protect workers, they can have adverse effects. They may, for example, explain the very lowreemployment rate of older workers. Sick leave has also reportedly been abused to maintain paywithout working and avoid dismissal.9
The legislation provides some ways to reduce these costs. First, probation periods of upto three months can be part of any labor contract. At the end of probation, contracts can beterminated at no cost. Probation provides an opportunity to improve the job matching process andthus reduce the probability of job separation. Second, the legislation authorizes fixed-termcontracts. Third, workers can be hired for specific assignments or for occasional (seasonal orshort-term) jobs. In those cases, there are no layoff costs at the expiration of the contract.Furthermore, social security contributions are reduced. The extent to which these types ofcontracts are used reflects attempts to reduce labor taxes and avoid the high cost of dismissal.
Support to the Unemployed
The aim of unemployment policies is to adequately protect those affected by thetransformation of the labor market and facilitate the transition to another job. If improperlydesigned, however, such policies can create disincentives to take a job and can lead to high fiscalcosts.
Income-support programs. Income support for the unemployed comes in two forms: (i) acontributory unemployment insurance (UI), which is dependent on an adequate employmenthistory; and (ii) an income-tested unemployment assistance (UA) for those who have exhaustedtheir entitlement to UI. In addition, there is a severance payment corresponding to one to sixmonths of wages for workers who have been dismissed for other than disciplinary reasons.'° Theunemployed can also access other social benefits which are independent of work status.
Unemployment insurance was introduced early in the transition process (in December1988) not only to mitigate the social impact of unemployment, but also to relieve employersoftheir social responsibilities so they could focus on restructuring. Benefits are earnings relatedwithin minimum and maximum limits and are unrelated to other sources of income. Thoseeligible are the unemployed, those searching for a job, and those who have worked for at leastone year in the last four years. Due to fiscal constraints, the duration of benefits has beenreduced: as of January 1993, the duration varies from 3 and 12 months, depending on theindividual's employment record for the past 4 years. Benefits are set at 60 percent of base
9 If a person is sick for 15 days, he cannot be dismissed upon his return to work during a protected period equal to 30days (twice as long as the sickness period); if a person is sick for one month, the length of the protected periodbecomes two months, and so on, up to one year. In addition, coming back to work for a few days (during the protectedperiod) allows the worker to start a new sickness period and thus a new protected period. As might be expected undersuch a system, sickness periods are reported to be long and frequent in Hungary.
'° Severance payment ranges from one month's wages for those with 3 to 4 years of employment to 6 months' wagesfor those with 25 years or more.
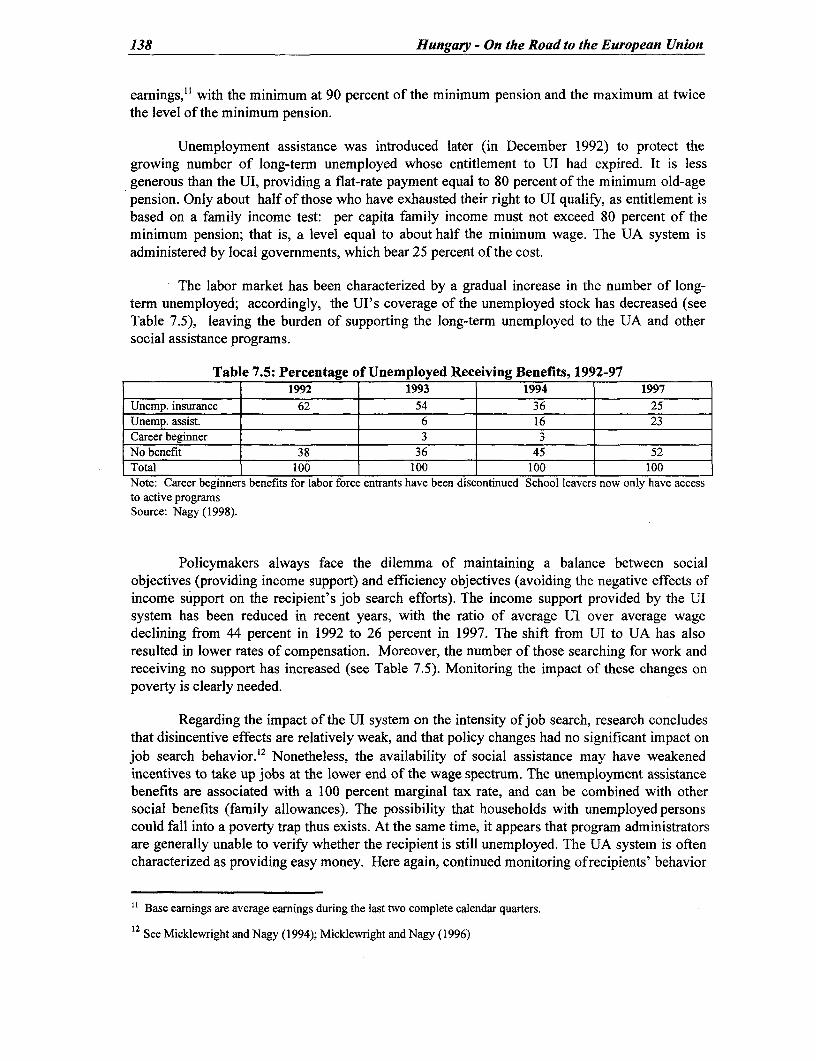
138 Hungary - On the Road to the European Union
earnings," with the minimum at 90 percent of the minimum pension and the maximum at twicethe level of the minimum pension.
Unemployment assistance was introduced later (in December 1992) to protect thegrowing number of long-term unemployed whose entitlement to UI had expired. It is lessgenerous than the UI, providing a flat-rate payment equal to 80 percent of the minimum old-agepension. Only about half of those who have exhausted their right to UI qualify, as entitlement isbased on a family income test: per capita family income must not exceed 80 percent of theminimum pension; that is, a level equal to about half the minimum wage. The UA system isadministered by local governments, which bear 25 percent of the cost.
The labor market has been characterized by a gradual increase in the number of long-term unemployed; accordingly, the Ul's coverage of the unemployed stock has decreased (seeTable 7.5), leaving the burden of supporting the long-term unemployed to the UA and othersocial assistance programs.
Table 7.5: Percentage of Unemployed Receiving Benefits, 1992-971992 1993 1994 1997
Unemp. insurance 62 54 36 25Unemp. assist. 6 16 23Career beginner |3 3 Nobenefit 38 36 45 52Total 100 100 100 100Note: Career beginners benefits for labor force entrants have been discontinued School leavers now only have accessto active programsSource: Nagy (1998).
Policymakers always face the dilemma of maintaining a balance between socialobjectives (providing income support) and efficiency objectives (avoiding the negative effects ofincome support on the recipient's job search efforts). The income support provided by the UIsystem has been reduced in recent years, with the ratio of average UI over average wagedeclining from 44 percent in 1992 to 26 percent in 1997. The shift from UI to UA has alsoresulted in lower rates of compensation. Moreover, the number of those searching for work andreceiving no support has increased (see Table 7.5). Monitoring the impact of these changes onpoverty is clearly needed.
Regarding the impact of the UI system on the intensity of job search, research concludesthat disincentive effects are relatively weak, and that policy changes had no significant impact onjob search behavior.'2 Nonetheless, the availability of social assistance may have weakenedincentives to take up jobs at the lower end of the wage spectrum. The unemployment assistancebenefits are associated with a 100 percent marginal tax rate, and can be combined with othersocial benefits (family allowances). The possibility that households with unemployedpersonscould fall into a poverty trap thus exists. At the same time, it appears that program administratorsare generally unable to verify whether the recipient is still unemployed. The UA system is oftencharacterized as providing easy money. Here again, continued monitoring of recipients' behavior
" Base earnings are average earnings during the last two complete calendar quarters.
12 See Micklewright and Nagy (1994); Micklewright and Nagy (1996)
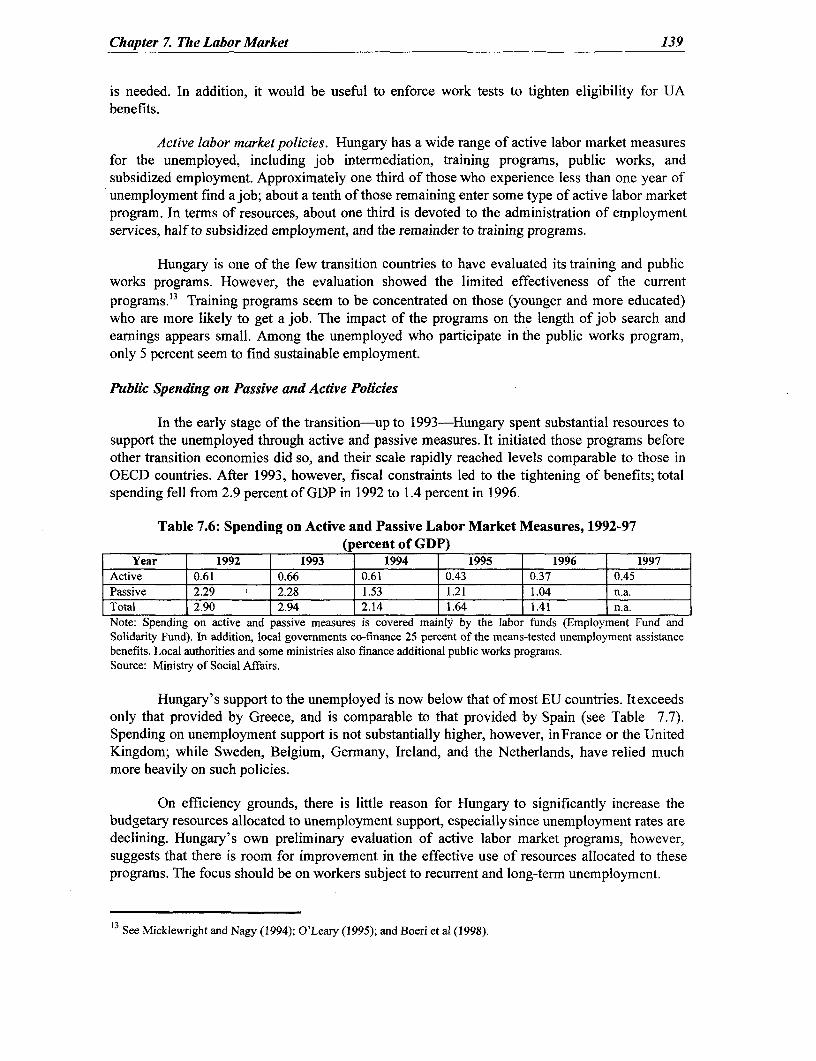
Chapter 7. The Labor Market 139
is needed. In addition, it would be useful to enforce work tests to tighten eligibility for UAbenefits.
Active labor market policies. Hungary has a wide range of active labor market measuresfor the unemployed, including job intermediation, training programs, public works, andsubsidized employment. Approximately one third of those who experience less than one year ofunemployment find a job; about a tenth of those remaining enter some type of active labor marketprogram. In terms of resources, about one third is devoted to the administration of employmentservices, half to subsidized employment, and the remainder to training programs.
Hungary is one of the few transition countries to have evaluated its training and publicworks programs. However, the evaluation showed the limited effectiveness of the currentprograms.'3 Training programs seem to be concentrated on those (younger and more educated)who are more likely to get a job. The impact of the programs on the length of job search andeamings appears small. Among the unemployed who participate in the public works program,only 5 percent seem to find sustainable employment.
Public Spending on Passive and Active Policies
In the early stage of the transition-up to 1993-Hungary spent substantial resources tosupport the unemployed through active and passive measures. It initiated those programs beforeother transition economies did so, and their scale rapidly reached levels comparable to those inOECD countries. After 1993, however, fiscal constraints led to the tightening of benefits; totalspending fell from 2.9 percent of GDP in 1992 to 1.4 percent in 1996.
Table 7.6: Spending on Active and Passive Labor Market Measures, 1992-97(percent of GDP)
Year 1992 1993 1994 1995 1996 1997Active 0.61 0.66 0.61 0.43 0.37 0.45Passive 2.29 2.28 1.53 1.21 1.04 na.Total 2.90 2.94 2.14 1.64 1.41 n.a.Note: Spending on active and passive measures is covered mainly by the labor funds (Employment Fund andSolidarity Fund). In addition, local governments co-finance 25 percent of the means-tested unemployment assistancebenefits. Local authorities and some ministries also finance additional public works programs.Source: Ministry of Social Affairs.
Hungary's support to the unemployed is now below that of most EU countries. Itexceedsonly that provided by Greece, and is comparable to that provided by Spain (see Table 7.7).Spending on unemployment support is not substantially higher, however, inFrance or the UnitedKingdom; while Sweden, Belgium, Germany, Ireland, and the Netherlands, have relied muchmore heavily on such policies.
On efficiency grounds, there is little reason for Hungary to significantly increase thebudgetary resources allocated to unemployment support, especially since unemployment rates aredeclining. Hungary's own preliminary evaluation of active labor market programs, however,suggests that there is room for improvement in the effective use of resources allocated to theseprograms. The focus should be on workers subject to recurrent and long-term unemployment.
13 See Micklewright and Nagy (1994); O'Leary (1995); and Boeri et al (1998).
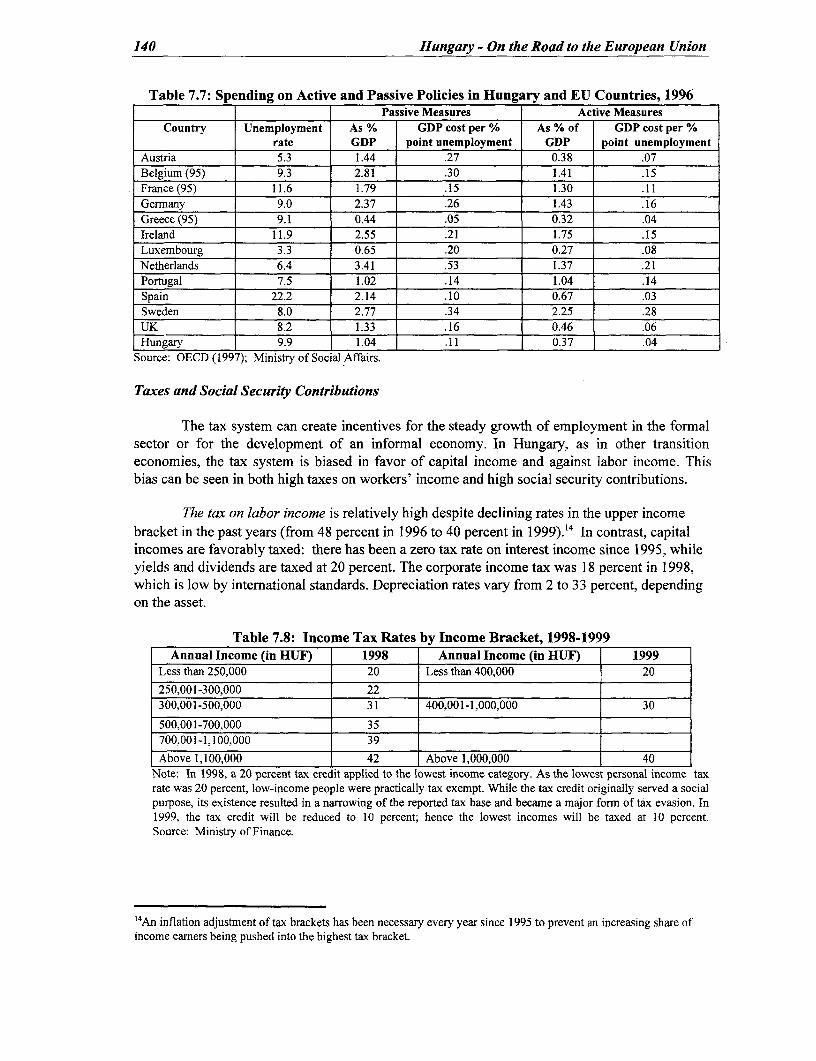
140 Hungary - On the Road to the European Union
Table 7.7: Spending on Active and Passive Policies in Hungary and EU Countries, 1996Passive Measures Active Measures
Country Unemployment As % GDP cost per % As % of GDP cost per %rate GDP point unemployment GDP point unemployment
Austria 5.3 1.44 .27 0.38 .07Belgium (95) 9.3 2.81 .30 1.41 .15France (95) 11.6 1.79 .15 1.30 .11Germany 9.0 2.37 .26 1.43 .16Greece (95) 9.1 0.44 .05 0.32 .04Ireland 11.9 2.55 .21 1.75 .15Luxembourg 3.3 0.65 .20 0.27 .08Netherlands 6.4 3.41 .53 1.37 .21Portugal 7.5 1.02 .14 1.04 .14Spain 22.2 2.14 .10 0.67 .03Sweden 8.0 2.77 .34 2.25 .28UK 8.2 1.33 .16 0.46 .06Hungary 9.9 1.04 .11 0.37 .04
Source: OECD (1997); Ministry of Social Affairs.
Taxes and Social Security Contributions
The tax system can create incentives for the steady growth of employment in the formalsector or for the development of an informal economy. In Hungary, as in other transitioneconomies, the tax system is biased in favor of capital income and against labor income. Thisbias can be seen in both high taxes on workers' income and high social security contributions.
The tax on labor income is relatively high despite declining rates in the upper incomebracket in the past years (from 48 percent in 1996 to 40 percent in 1999).14 In contrast, capitalincomes are favorably taxed: there has been a zero tax rate on interest income since 1995, whileyields and dividends are taxed at 20 percent. The corporate income tax was 18 percent in 1998,which is low by international standards. Depreciation rates vary from 2 to 33 percent, dependingon the asset.
Table 7.8: Income Tax Rates by Income Bracket, 1998-1999Annual Income (in HUFI) 1998 Annual Income (in HUF) 1999
Less than 250,000 20 Less than 400,000 20
250,001-300,000 22
300,001-500,000 31 400,001-1,000,000 30
500,001-700,000 35700,001-1,100,000 39
Above 1,100,000 42 Above 1,000,000 40Note: In 1998, a 20 percent tax credit applied to the lowest income category. As the lowest personal income taxrate was 20 percent, low-income people were practically tax exempt. While the tax credit originally served a socialpurpose, its existence resulted in a narrowing of the reported tax base and became a major form of tax evasion. In1999, the tax credit will be reduced to 10 percent; hence the lowest incomes will be taxed at 10 percent.Source: Ministry of Finance.
'4An inflation adjustment of tax brackets has been necessary every year since 1995 to prevent an increasing share ofincome earners being pushed into the highest tax bracket.
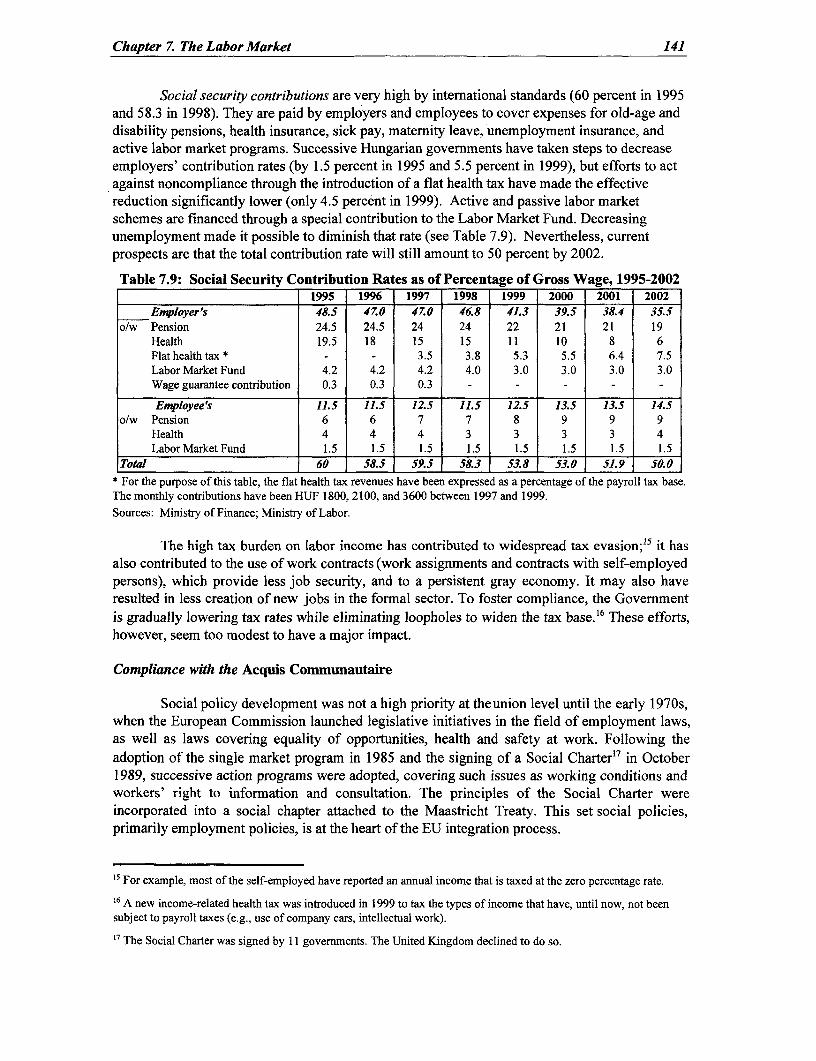
Chapter 7. The Labor Market 141
Social security contributions are very high by international standards (60 percent in 1995and 58.3 in 1998). They are paid by employers and employees to cover expenses for old-age anddisability pensions, health insurance, sick pay, maternity leave, unemployment insurance, andactive labor market programs. Successive Hungarian governments have taken steps to decreaseemployers' contribution rates (by 1.5 percent in 1995 and 5.5 percent in 1999), but efforts to actagainst noncompliance through the introduction of a flat health tax have made the effectivereduction significantly lower (only 4.5 percent in 1999). Active and passive labor marketschemes are financed through a special contribution to the Labor Market Fund. Decreasingunemployment made it possible to diminish that rate (see Table 7.9). Nevertheless, currentprospects are that the total contribution rate will still amount to 50 percent by 2002.
Table 7.9: Social Security Contribution Rates as of Percentage of Gross Wage, 1995-20021995 1996 1997 1998 1999 2000 2001 2002
Employer's 48.5 47.0 47.0 46.8 41.3 39.5 38.4 35.5o/w Pension 24.5 24.5 24 24 22 21 21 19
Health 19.5 18 15 15 11 10 8 6Flat health tax *- - 3.5 3.8 5.3 5.5 6.4 7.5Labor Market Fund 4.2 4.2 4.2 4.0 3.0 3.0 3.0 3.0Wage guarantee contribution 0.3 0.3 0.3 - - - - -
Enmployee's 11.5 11.5 12.5 11.5 12.5 13.5 13.5 14.5o/w Pension 6 6 7 7 8 9 9 9
Health 4 4 4 3 3 3 3 4Labor Market Fund 1.5 1.5 1.5 1.5 1.5 1.5 1.5 1.5
Total 60 58.5 59.5 58.3 53.8 53.0 51.9 50.0* For the purpose of this table, the flat health tax revenues have been expressed as a percentage of the payroll tax base.The monthly contributions have been HUF 1800, 2100, and 3600 between 1997 and 1999.Sources: Ministry of Finance; Ministry of Labor.
The high tax burden on labor income has contributed to widespread tax evasion;' 5 it hasalso contributed to the use of work contracts (work assignments and contracts with self-employedpersons), which provide less job security, and to a persistent gray economy. It may also haveresulted in less creation of new jobs in the formal sector. To foster compliance, the Governmentis gradually lowering tax rates while eliminating loopholes to widen the tax base."6 These efforts,however, seem too modest to have a major impact.
Compliance with the Acquis Communautaire
Social policy development was not a high priority at theunion level until the early 1970s,when the European Commission launched legislative initiatives in the field of employment laws,as well as laws covering equality of opportunities, health and safety at work. Following theadoption of the single market program in 1985 and the signing of a Social Charter"7 in October1989, successive action programs were adopted, covering such issues as working conditions andworkers' right to information and consultation. The principles of the Social Charter wereincorporated into a social chapter attached to the Maastricht Treaty. This set social policies,primarily employment policies, is at the heart of the EU integration process.
15 For example, most of the self-employed have reported an annual income that is taxed at the zero percentage rate.
16 A new income-related health tax was introduced in 1999 to tax the types of income that have, until now, not beensubject to payroll taxes (e.g., use of company cars, intellectual work).
"' The Social Charter was signed by 11 governments. The United Kingdom declined to do so.
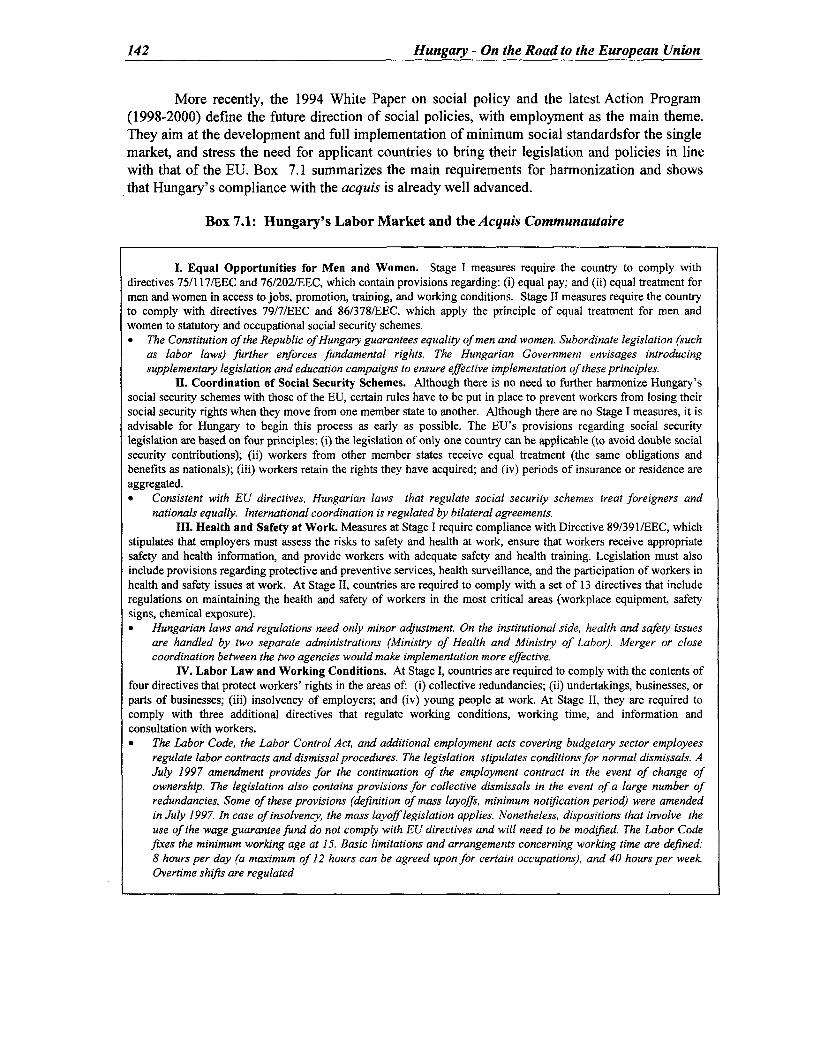
142 Hungary - On the Road to the European Union
More recently, the 1994 White Paper on social policy and the latest Action Program(1998-2000) define the future direction of social policies, with employment as the main theme.They aim at the development and full implementation of minimum social standardsfor the singlemarket, and stress the need for applicant countries to bring their legislation and policies in linewith that of the EU. Box 7.1 summarizes the main requirements for harmonization and showsthat Hungary's compliance with the acquis is already well advanced.
Box 7.1: Hungary's Labor Market and the Acquis Communautaire
I. Equal Opportunities for Men and Women. Stage I measures require the country to comply withdirectives 75/117/EEC and 76/202/EEC, which contain provisions regarding: (i) equal pay; and (ii) equal treatment formen and women in access to jobs, promotion, training, and working conditions. Stage II measures require the countryto comply with directives 79/7/EEC and 86/378/EEC, which apply the principle of equal treatment for men andwomen to statutory and occupational social security schemes.* The Constitution of the Republic of Hungary guarantees equality of men and women. Subordinate legislation (such
as labor laws) further enforces fundamental rights. The Hungarian Government envisages introducingsupplementary legislation and education campaigns to ensure effective implementation of these principles.
II. Coordination of Social Security Schemes. Although there is no need to further harmonize Hungary'ssocial security schemes with those of the EU, certain rules have to be put in place to prevent workers from losing theirsocial security rights when they move from one member state to another. Although there are no Stage I measures, it isadvisable for Hungary to begin this process as early as possible. The EU's provisions regarding social securitylegislation are based on four principles: (i) the legislation of only one country can be applicable (to avoid double socialsecurity contributions); (ii) workers from other member states receive equal treatment (the same obligations andbenefits as nationals); (iii) workers retain the rights they have acquired; and (iv) periods of insurance or residence areaggregated.a Consistent with EU directives, Hungarian laws that regulate social security schemes treat foreigners and
nationals equally. International coordination is regulated by bilateral agreements.III. Health and Safety at Work. Measures at Stage I require compliance with Directive 89/391/EEC, which
stipulates that employers must assess the risks to safety and health at work, ensure that workers receive appropriatesafety and health information, and provide workers with adequate safety and health training. Legislation must alsoinclude provisions regarding protective and preventive services, health surveillance, and the participation of workers inhealth and safety issues at work. At Stage II, countries are required to comply with a set of 13 directives that includeregulations on maintaining the health and safety of workers in the most critical areas (workplace equipment, safetysigns, chemical exposure).* Hungarian laws and regulations need only minor adjustment On the institutional side, health and safety issues
are handled by two separate administrations (Ministry of Health and Ministry of Labor). Merger or closecoordination between the two agencies would make implementation more effective.
IV. Labor Law and Working Conditions. At Stage 1, countries are required to comply with the contents offour directives that protect workers' rights in the areas of: (i) collective redundancies; (ii) undertakings, businesses, orparts of businesses; (iii) insolvency of employers; and (iv) young people at work. At Stage II, they are required tocomply with three additional directives that regulate working conditions, working time, and information andconsultation with workers.* The Labor Code, the Labor Control Act, and additional employment acts covering budgetary sector employees
regulate labor contracts and dismissal procedures. The legislation stipulates conditions for normal dismissals. AJuly 1997 amendment provides for the continuation of the employment contract in the event of change ofownership. The legislation also contains provisions for collective dismissals in the event of a large number ofredundancies. Some of these provisions (definition of mass layoffs, minimum notification period) were amendedin July 1997. In case of insolvency, the mass layoff legislation applies. Nonetheless, dispositions that involve theuse of the wage guarantee fund do not comply with EU directives and will need to be modified. The Labor Codefixes the minimum working age at 15. Basic limitations and arrangements concerning working time are defined:8 hours per day (a maximum of 12 hours can be agreed upon for certain occupations), and 40 hours per weekOvertime shifts are regulated

Chapter 7. The Labor Market 143
CONCLUSIONS AND KEY RECOMMENDATIONS
Available evidence suggests that the Hungarian labor market has been subject to rapidtransformation and has achieved substantial productivity gains during the years of transition.Hence, Hungary has entered the pre-accession stage with favorable conditions and seems wellpositioned to cope with competitive pressures in a single market. But notwithstanding the gainsthus far, other steps still need to be taken to ensure Hungary's successful integration into the EU.
Maintaining the recent pace of productivity increases is unlikely over the long term. Thelarge-scale loss ofjobs linked to the transition is now largely over and the sale of assets to foreigninvestors is now largely completed, as is the sizable reallocation of labor among sectors. Fromnow on, changes are likely to be less dramatic and further productivity gains more difficult toachieve.
It will also be difficult to achieve a substantial increase in the level of employment.Hungary's employment rate is currently somewhat below the EU average. This is due mostly tothe employment rate of workers aged 55 or above-a rate almost half that of Germany or France.Many workers were encouraged to retire early, and the older workers are not likely to return tothe labor force. But for the young, continuous job creation will be critical to keeping theunemployment rate down.
Migration flows are not likely to ease the pressure on the labor market. A number offactors induce one to think that labor flows from Hungary to the EU countries will probablyremain small."8 First, the income differences between the EU and acceding countries tend to besmaller than those that generate sizable migration. Second, there are no large Hungariancommunities in EU countries to act as social networks to reduce the costs of insertion. Third, theunemployment problem currently faced by many EU countries may discourage migration.Finally, during the last wave of accession, the potential migration flows expected from Greece,Portugal, and Spain to EU members never materialized, despite the elimination of nationalbarriers.
Pursuing a strategy conducive to job creation and continuous adjustment to innovation isthus essential for Hungary. Although it is helpful to have a labor force that is younger and moreeducated than in the past, the policy framework still matters.
Among the policies that require attention, the first priority is to reduce the taxes on labor.This is necessary both to decrease the bias against labor and to reduce the size of the informaleconomy. Recent efforts to lower social security contributions and widen the tax base are steps inthis direction. Nonetheless, the efforts remain too modest. The Government needs to considersupporting the long-term unemployed through general revenues, and also needs to reform thefinancing of the health care system.
In addition, there is still room to improve the programs that support the unemployed. Theunemployment assistance system should be reviewed to avoid threshold effects and poverty traps.Work tests should be enforced to avoid a waste of scarce public resources. Efforts to evaluate andimprove the effectiveness of active policies should also be continued, with special attention to the
18 See Borjas G., "Economic Research on the Determninants of Immigration: Lessons for the European Union," WorldBank, mimeo, 1998.

144 Hungary - On the Road to the European Union
long-term unemployed. To reduce regional differences in unemployment-and at the same timereduce long-term unemployment-consideration should be given to other types of policies thatare complementary to labor market programs, particularly those fostering the development ofpublic transportation and mortgage financing.
Hungary's wage formation system seems to have provided adequate flexibility thus far.Returns to skills are increasing and the minimum wage does not appear to be a binding constrainton employment. But there needs to be a focus on employment protection legislation. Althoughfirms seem to find ways to avoid the impact of some of the regulations on layoffs,this necessarilycomes at a cost. The possible adverse effects on the employment of some population groups,including women and older workers, need to be evaluated and considered.
If Hungary further improves its policy framework and maintains incentives that facilitatethe adjustment of the labor market to rapid changes in the economic environment, it shouldcontinue to benefit from significant productivity increases. Achieving these increases will becrucial to ensuring smooth integration into the European Union and to gradually bridging the gapbetween the country's per capita income and that of the current EU member countries.

8. PUBLIC ADMINISTRATION
The process of negotiating and preparing for accession into the European Union, as well asimplementing the acquis, will require high-caliber government. Hungary must therefore accelerate itsefforts to build a modern, capable public administration. Three questions are critical to administrativemodernization in Hungary. First, on the specific front of EU preparation, how well are the institutionalstructures and processes established to shepherd Hungary through the accession process working?Second, for more broadly defined public administration tasks, does Hungary have the necessaryinstitutional infrastructure to formulate and coordinate policy at the center of government? Third, howadvanced is the development of a professionalized human resource base in the civil service? This chapterlays the groundwork for analyzing these questions by reviewing recent trends in government pay andemployment, noting the effects of prior reform efforts and weighing the potential impact of policiesrelated to EU preparation.
GOVERNMENT EMPLOYMENT AND REMUNERATION: EFFICIENCY ISSUES
Government Employment
Three main groups dominate general government employment:' civil servants, public servants,and an "other" category encompassing several different employee classifications such as the judiciary andarmed forces. In 1997, total government employment was 814,027 (tables 8.1 and 8.2 in the Appendixprovide detailed statistics). The central administration, including Budapest-based ministries and centralagencies, as well as deconcentrated organs at the county and district level, accounted for 34.5 percent(280,496 individuals) of total employment. Local self-governments employed the remaining 65.5 percent(533,531 workers).
Civil servants accounted for approximately 13 percent of total government employment in 1997.Civil servants are nearly evenly divided between the central administration (51 percent in 1997) and localself-governments (49 percent in the same year). About one third of those in the central government workfor ministries and central budgetary institutions (CBls) in Budapest, while two thirds are indeconcentrated administrative organs in counties and municipalities.2
Non-administrative functions-e.g., education and health-are carried out by a different class ofgovernment staff: public servants. The public service is by far the largest government employer, with 72
1 General government employment includes all government workers other than state enterprise employees.
2 CBIs are dependencies of central ministries, appearing as subchapters in the budget. Examples of CBIs are the customs and taxadministrations, and the army. CBls are funded partially or wholly by the budget. They can also receive transfers from localgovernments and extra-budgetary funds, and may also generate their own tax and non-tax revenue.
145

146 Hungary: On the Road to the European Union
percent of government staff in 1997. Most public servants work in education and health; together, thesesectors accounted for 56.8 percent of all government personnel in 1997, of which 80 percent worked atthe local level.
The "other" category comprised 15.0 percent of government employment in 1997. This group islargely composed of the uniformed services (military, police, civil defense service, fire departments,border guards, customs and finance guards, and the national security services), as well as judicial branchpersonnel.
General government employment in Hungary has been declining in relative terms. It was downfrom 8.9 percent of population in 1993 to 8.0 percent in 1997.3 As a share of the labor force, it fell from21 percent in 1993 to 20.3 percent in 1997. Public servants and civil servants alone (excluding the "other"category) make up 6.8 percent of the population.
The level of Hungary's general government employment is comparable to levels found in EUmember states and other OECD countries.4 It is worth noting that, as Table 8.1 indicates, there issignificant variation in government size, even among Westem European countries. In general, however,less-developed economies tend to have a lower number of civil servants. For example, general civiliangovernment employment as a percentage of population ranges from 2.0 percent in Africa, to 3.9 percentin the Middle East, to 6.9 percent in Eastern Europe and the Former Soviet Union.
Table 8.1: Government Employment in Selected Countries(percent)
General Government Central Civilian Government*Country Population Labor Force Population Labor Force
Belgium 8.1 19.5 1.7 4.2Bulgaria 7.5 14.7 0.9 1.7Denmark 13.3 24.0 2.8 5.0Finland 13.0 25.5 2.2 4.3France 7.7 17.2 2.7 6.1Germany 4.9 9.4 0.4 0.7Greece 4.4 11.6 1.1 2.9Hungary 8.0 20.3 1.7 4.3Italy 6.0 14.6 1.3 3.3Poland 4.9 9.3 0.2 0.4Portugal 5.7 11.1 1.8 3.5Slovak Republic 8.6 19.4 1.3 2.9Sweden 18.1 34.7 4.1 8.1United Kingdom 7.5 15.6 1.3 2.7
* Data for Hungary includes armed forces.Source: Ministries of Labor and Interior (Hungary); World Bank (1997b).
3Note that the fall in share occurred despite a consistent decline in both population and labor force over the years in question.
4In a sample of 21 OECD members, general government employment was 8.2 percent on average and ranged from 4.4 to 18.1percent of the population. See World Bank (1997b) for more details.
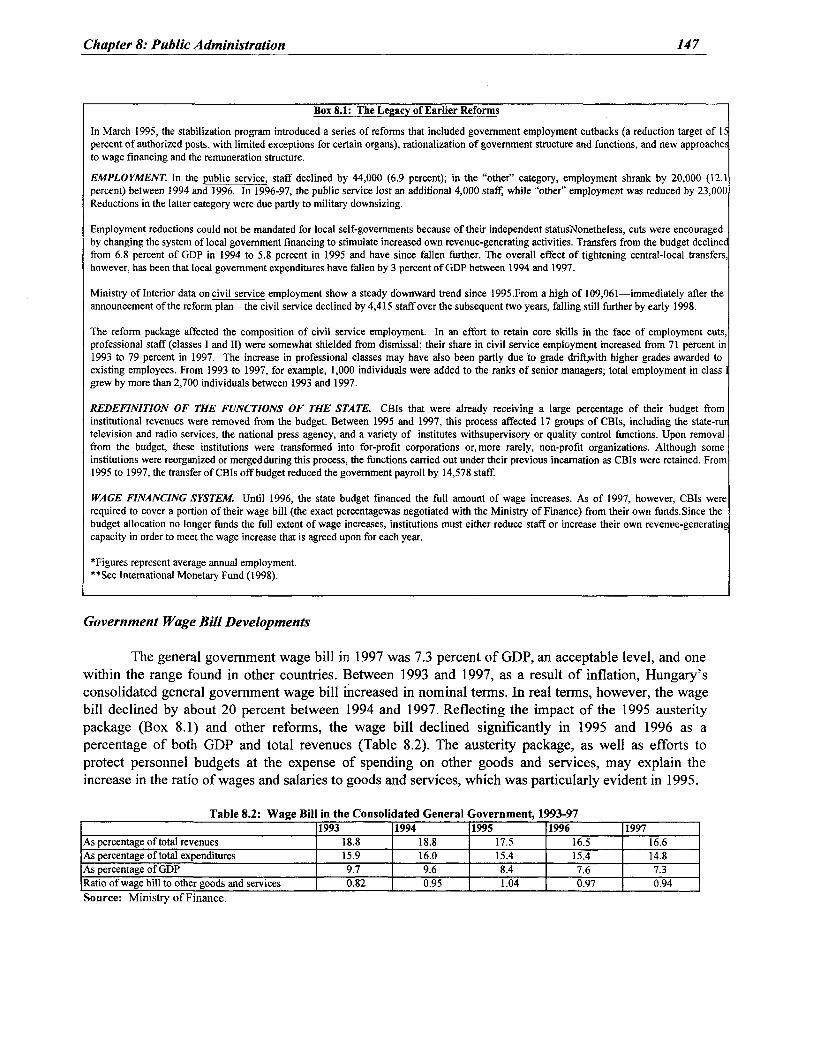
Chapter 8: Public Administration 147
Box 8.1: The Legacy of Earlier Reforms
In March 1995, the stabilization program introduced a series of reforms that included government employment cutbacks (a reduction target of 1Ipercent of authorized posts, with limited exceptions for certain organs), rationalization of govemment structure and functions, and new approacheto wage financing and the remuneration structure.
EMPLOYMENT. In the public service, staff declined by 44,000 (6.9 percent); in the "othef" category, employment shrank by 20,000 (12.1percent) between 1994 and 1996. In 1996-97, the public service lost an additional 4,000 staff, while "other" employment was reduced by 23,000Reductions in the latter category were due partly to military downsizing.
Employment reductions could not be mandated for local self-govemments because of their independent statusNonetheless, cuts were encouragedby changing the system of local government financing to stimulate increased own revenue-generating activities. Transfers from the budget declinedfrom 6.8 percent of GDP in 1994 to 5.8 percent in 1995 and have since fallen further. The overall effect of tightening central-local transfers,however, has been that local government expenditures have fallen by 3 percent of GDP between 1994 and 1997.
Ministry of Interior data on civil service employment show a steady downward trend since 1995.From a high of 109,061-immediately after theannouncement of the reform plan-the civil service declined by 4,415 staff over the subsequent two years, falling still further by early 1998.
The reform package affected the composition of civil service employment. In an effort to retain core skills in the face of employment cuts,professional staff (classes I and II) were somewhat shielded from dismissal; their share in civil service employment increased from 71 percent in1993 to 79 percent in 1997. The increase in professional classes may have also been partly due to grade drift,with higher grades awarded toexisting employees. From 1993 to 1997, for example, 1,000 individuals were added to the ranks of senior managers; total employment in classgrew by more than 2,700 individuals between 1993 and 1997.
REDEFINITION OF THE FUNCTIONS OF THE STATE. CBls that were already receiving a large percentage of their budget frominstitutional revenues were removed from the budget. Between 1995 and 1997, this process affected 17 groups of CBls, including the state-rurtelevision and radio services, the national press agency, and a variety of institutes withsupervisory or quality control functions. Upon removalfrom the budget, these institutions were transformed into for-profit corporations or,more rarely, non-profit organizations. Although someinstitutions were reorganized or merged during this process, the functions carried out under their previous incamation as CBls were retained. From1995 to 1997, the transfer of CBIs off budget reduced the government payroll by 14,578 staff.
WAGE FINANCING SYSTEM. Until 1996, the state budget financed the full amount of wage increases. As of 1997, however, CBls wererequired to cover a portion of their wage bill (the exact percentagewas negotiated with the Ministry of Finance) from their own funds.Since thebudget allocation no longer funds the full extent of wage increases, institutions must either reduce staff or increase their own revenve-generatingcapacity in order to meet the wage increase that is agreed upon for each year.
*Figures represent average annual employment.**See International Monetary Fund (1998).
Government Wage Bill Developments
The general government wage bill in 1997 was 7.3 percent of GDP, an acceptable level, and onewithin the range found in other countries. Between 1993 and 1997, as a result of inflation, Hungary'sconsolidated general government wage bill increased in nominal terms. In real terms, however, the wagebill declined by about 20 percent between 1994 and 1997. Reflecting the impact of the 1995 austeritypackage (Box 8.1) and other reforms, the wage bill declined significantly in 1995 and 1996 as apercentage of both GDP and total revenues (Table 8.2). The austerity package, as well as efforts toprotect personnel budgets at the expense of spending on other goods and services, may explain theincrease in the ratio of wages and salaries to goods and services, which was particularly evident in 1995.
Table 8.2: Wage Bill in the Consolidated General Government, 1993-971993 1994 1995 1996 1997
As percentage of total revenues 18.8 18.8 17.5 16.5 16.6As percentage of total expenditures 15.9 16.0 15.4 15.4 14.8As percentage of GDP 9.7 9.6 8.4 7.6 7.3Ratio of wage bill to other goods and services 0.82 0.95 1.04 0.97 0.94Source: Ministry of Finance.

148 Hungary: On the Road to the European Union
As part of the austerity package/efficiency efforts, wage bill management has also beenstrengthened. The Ministry of Finance determines targets for annual wage increases in the context of themacroeconomic situation, and engages in rigorous negotiations with public sector unions to determine theactual increase. Wage hikes are increasingly funded by resources mobilized by individual agencies, eitherthrough own-generated revenues or through funds released by staffing cuts. Moreover, controls on staffnumbers have been tightened. Both approaches serve as a check on the size of government employment.
Remuneration in the Civil Service and Public Service: Efficiency Issues
Remuneration systems for the public service and civil service are regulated by separate acts, bothpassed in 1992; government employees in the "other" category are regulated by additional legislation.Classification and incentive structures differ significantly for the public and civil service, as shown inTable 8.3. in the Appendix.
Significant discrepancies in remuneration systems between the private and public sectors, andbetween the public service and civil service-as well as a lack of developed incentive systems (i.e., linkbetween rewards and performance)-result in a number of problems and inefficiencies. Among the mostimportant are high turnover of staff (brain drain to the private sector), and difficulties in staff recruitmentand retention.
Differences in Public Service and Civil Service Wages
Pay levels may prove a serious threat to the recruitment and retention of government staff.According to the estimates of a local consulting firm, the average turnover rate for all classes of civilservants is around 8.9 percent per year.5 There is some evidence that the turnover rate is highest amongyoung educated staff, which implies that the turnover rate among potential future managers is high. If thisis the case, then it is a major concern, since bringing in fresh expertise could prove very expensive interms of recruitment and opportunity cost.
In addition, average civil service pay levels have been consistently higher than those for the muchlarger public service. In 1997, the average basic wage in the civil service was 65 percent higher than inthe public service; total earnings were 63 percent higher. Pay equities between the two services aresomewhat mitigated by the restricted civil service employment conditions, which do not pertain to publicservants. The former may not engage in secondary employment or political activity, or receive overtimepay. The latter may do so, as long as no conflicts of interest arise.
Previous attempts to raise pay levels have been largely reactive; there has been no long-termstrategy to develop comprehensive pay policies to raise pay to competitive levels or to bring in neededskills. Raising public service pay to civil service levels would imply substantial, perhaps unaffordable,budgetary costs. Rough calculations show that the alignment of salaries of public service employees withthe civil service would increase the public sector salary bill by approximately 50 percent. Still, manypublic servants continue to press for a single legal framework that would ensure such parity, althoughsome groups within the public service, such as education and health workers, favor separate but equalscales. The Ministry of Interior is considering options for integrating the two pay systems, perhapsmaintaining separate regulations to cover different employee groups. Nonetheless, financial constraintsand civil service opposition continue to be strong.
5Estimates based on enrollment in the Basic Examination.
Chapter 8: Public Administration 149
Differences in Public and Private Remuneration
Earnings data by profession clearly reveal a tendency toward higher earnings in occupations thatare generally in the private sphere, such as lawyer or computer specialist, and a tendency for lower wagesin predominantly public service occupations, such as physician or teacher (tables 8.5 and 8.6 in theAnnex). Starting salaries in the civil service are markedly lower than in the enterprise sector. The gapnarrows substantially, but does not close, as new recruits acquire job experience.
Private-public pay discrepancies may partly explain the continuing brain drain of professionalstaff from the government to the private sphere and the persistent difficulties of recruiting high-caliberstaff to government jobs. This rule does not apply to jobs related to European Union issues; such jobs areperceived to be important to one's career despite relatively low earnings.
New Measures for Civil Service Wage Flexibility
In 1997, new flexibility was introduced into the civil service pay system to reward performance.Central and local administration employers may now raise or lower the basic wage of individual civilservants by up to 20 percent Another new provision allows the setting of "personal salaries" outside theformal wage structure-for up to 20 percent of staff within a single organ-with approval of the head ofthe institution. Through the above mechanisms, 25 percent of all civil servants had their basic wagesincreased and 11 percent had them reduced in 1997. Increases were more likely to be applied to higher-ranking staff, and in central, rather than local, administration.6 The personal salary option was used muchless frequently, with fewer than 5 percent of civil servants receiving personal salaries in 1997.
While these new pay flexibility mechanisms have enhanced the possibility of rewardingperformance and recruiting scarce skills, their application has not been well regulated. There are fewconcrete criteria for their use, and no formal evaluation is necessary for a pay increase to be awarded.Furthermore, since no additional resources have been allocated-a salutary feature that keeps the overallwage bill management intact-managers must reduce the wages of other staff in order to fund increasesfor the star performers or to attract and retain recruits with key skills. This results in a two-tiered systemin which the losers are increasingly resentful and unmotivated.
Civil Service Pay and Employment Issues for European Integration
Adjustment in civil service recruitment will be necessary to meet the new skills mix required byEU accession. Although the Government has not carried out detailed surveys, preliminary estimatessuggest that 5 to 10 percent more staff with EU-relevant skills-up to 11,000 individuals-may beneeded in the medium term. Longer-term needs will only become evident several years hence, as theimpact of EU-induced structural changes and membership responsibilities unfold. Requirements maydiffer markedly by sector.
Many of the skills needed for EU accession activities are lacking in Hungary's civil service.While the civil service is on the whole highly educated, technical credentials, rather than administrationor management skills, predominate. The most common university degrees (36 percent) are in technicaldisciplines and agriculture, while administration and law degrees account for 22 percent. An additional 18
6 Forty-one percent of senior managers (a subgroup of Class I) received an increase, compared to 27 percent of other Class I staffand 24 percent of Class II. Every third civil servant in central administration had an increase in earnings.

150 Hungary: On the Road to the European Union
percent of qualifications are in economics and trade. Furthermore, given that the median age of civilservants is 44, it is likely that many civil servants with administrative backgrounds obtained their degreesin the socialist era, raising questions about the relevance of this training in the current context.
Another problem is the lack of language skills. Fewer than 8 percent of civil servants haveintermediate or advanced certification in a foreign language, and not all of these are major EU languagessuch as English, French, or German. Upgrading foreign language proficiency in the civil service will betimely and costly, since language pay supplements can amount to up to 40 percent of an individual'sbasic wage, depending on proficiency.
The Government will need to devise a range of approaches for enhancing the EU-relatedcapability of the civil service and funding the skills upgrading. To help meet the immediate need for EUstaff, the 1998 budget included a new "Euroatlantic Integration" allocation of 1.8 billion forints to fundEU-related expenses, including new EU-related posts and bonuses for staff carrying out EU-related work.
Cost Implications of EU Accession for the Civil Service
Recruitment of large numbers of highly skilled staff will mean that some portion of existing staff,who presumably will not meet EU criteria, will have to be redeployed or separated from the civil service.The Government needs to assessment the number of likely redundancies and the financing requirementfor such a restructuring/redeployment program.
Estimates of likely employment and wage bill changes under four scenarios are presented inAppendix Table 8.7. This exercise, however, is only a broad indication of costs and tradeoffs resultingfrom various assumptions, and is subject to a number of limitations; its results should be treated withcaution. Scenarios vary by the number of employees receiving a hypothetical 20 percent salary increase(the top 10 percent vs. 100 percent of civil servants), and by whether the constraint is to hold civil serviceemployment or the wage bill constant. Assuming an employment-neutral scenario, raising wage levels by20 percent for all civil servants, in order to approach the public-private pay relativities in the EUcountries, would increase the total wage bill by 20 percent. On the other hand, concentrating the 20percent salary increase in the top 10 percent of the skill structure would increase the total wage bill byonly 2 percent. Examining the wage bill neutral scenarios, raising wage levels by 20 percent for all civilservants would require cutting employment by 17,667 people (16.7 percent of total employment). Bycontrast, concentrating the 20 percent salary increase in the top 10 percent of skill structure would resultin redundancies of 2,078 employees (2 percent of total employment).
Another cost implication stems from the salary increment policy that has developedad hoc toattract EU accession skills. The potential impact on the wage bill of formal and informal EU skillincentives could be far reaching. It must be carefully analyzed and coordinated with a skills-basedredundancy program to adjust the talent pool of Hungary's civil service to EU requirements.
Finally, the potential training requirements of an EU-driven skills enhancement program willneed to be systematically examined and appraised. These requirements are discussed in the followingsection.

Chapter 8: Public Administration 151
HUMAN RESOURCE MANAGEMENT IN THE CIVIL SERVICE
Since 1990, Hungary has made progress not only in establishing a politically neutral civil service,but in laying the legal basis for merit-based procedures for recruitment, promotion, and performanceevaluation. Nonetheless, the institutional framework, management practices, and training infrastructure tosupport these early initiatives require serious attention if the civil service is to meet internationalstandards in the near future. Several key aspects of human resource management will need to bestrengthened.
Institutional Framework
Although Hungary has relatively stable policy and management organs for the civil service, itlacks a single organ with sufficient power to coordinate and implement its human resource policyregulations. Currently, this responsibility lies with the Civil Service Department (CSD) within theMinistry of Interior. This arrangement has some strengths but also some weaknesses (i.e., alreadyoverstretched management capacity of Mol, insufficient authority over other ministries to push throughdifficult human resource reforms, staffing inadequacies). Relocating the CSD to the Office of the PrimeMinister would increase its authority, and thereby strengthen the Government's capacity to coordinatecivil service human resources issues.'
The Prime Minister's Office already has a Commissioner for Modernization of PublicAdministration, responsible for advising the Prime Minister on all areas of public administration reform,including civil service and budgetary reform. Because of poorly defined roles and responsibilities,however, there is some overlap between the Commissioner for Modernization of Public Administrationand the CSD in the Ministry of Interior. Both have strong leadership and talented staff, which could beused more effectively if the roles of the two agencies were clarified. If the CSD were relocated to thePrime Minister's Office, the role of the Commissioner could be developed to emphasize more strategictasks.
One of the characteristics of effective human resource management in the civil service ofadvanced countries is the presence of ministry personnel departments that have skilled staff and coherentpolicies and procedures. In Hungary, this capacity is largely missing. At the ministry level, humanresource departments generally lack skills to implement the Civil Service Law effectively; many of theiractivities have been unchanged since the 1980s. The Government has recently commenced a program oftwinning,8 coordinated by the Commissioner for Modernization, whereby civil servants can work inmember state institutions, and staff from EU member states work in Hungary's civil service to help withknowledge transfer.
The Hungarian civil service does not have a set of clear procedural manuals to guide practice.This results in a wide variation in understanding and application of the civil service law. The CivilService Department, in conjunction with the human resource departments of ministries and local
7A number of models for civil service administration exist in EU member states, including a central Civil Service Department inthe Prime Minister's Office (United Kingdom), and a specific line ministry (France). In Hungary, relocation of the CSD to thePrime Minister's Office would be consistent with the existing model of small government.
8 Twinning is a region-wide Phare initiative and forms the backbone of Phare's planned technical assistance approach, inaccordance with Agenda 2000. See Phare (1998).

152 Hungary: On the Road to the European Union
governments should undertake the development of operational manuals, model human resourcedepartment structures, and staffing and skills requirements.
Hungary also lacks a specific oversight body to review civil service human resources policies;and lacks standards to ensure that such policies are fair, transparent, and effective. The establishment ofan oversight body comprising independent experts, including leading academics, lawyers, and humanresource specialists, is fundamental to ensuring merit-based practice in the Hungarian civil service.9
Internal control over the Civil Service Department's functions is exercised through Molregulations and the Civil Service Law, which requires the Civil Service Department to report toParliament on an annual basis. Reporting generally takes the form of issuing statistics on the numbers andprofiles of civil servants. Since the Department does not have a mandate to develop a national humanresources strategy, it does not report on the effectiveness of civil service human resources. Without sucha mandate, an integrated HR strategy cannot be formulated. This critical weakness is becoming moreserious as preparation for EU accession intensifies staffing requirements.
In this context, the lack of specialized skills required to forecast staff requirements anddeployment patterns, and to carry out basic personnel management practices, such as job inspection, mustbe addressed quickly. The presence of such skills would allow the Government to harness the potentialpower of those information systems that support HR management. In 1995, the Ministry of Interiordeveloped a computerized central register (KOZIGTAD) that can produce management reports usingdataprovided by Government institutions. The system, however, is not routinely used to make decisionsregarding national human resource planning; nor is it linked to the payroll, so it plays no part in nationalwage budgeting. Creating such links would prove useful in helping to forecast the national implicationsof different wage scenarios.
Merit Practices
Formal, merit-based (i.e., based on open competition and transparent rules) recruitment andpromotion systems are fundamental requirements for an effective and highly motivated civil service. InHungary, recruitment of civil servants is governed by the Civil Service Law (amended in 1998), whichrequires that all vacancies be reported to the Mol if they are not filled within 15 days. It also requires thatministries regularly post vacancy notices in official journal. The original intention of the recruitmentarticle was to mandate that all vacancies be advertised and opened to competition, butit was weakened bythe objections of some ministers. Advertisement of vacancies is now optional. Jobs that are advertisedare, in principle, subject to a set of uniform procedures, but, in reality, recruitment varies acrossministries. Clear procedures are also laid out for job descriptions, but a review of personnel files foundfew job descriptions that adhered to international standards.
Competency Exams
Although there is no mandatory open competition, all probationary civil servants without adegree in economics, law, or public administration must pass the Civil Service Basic Examination. The
9 Existing bodies to enforce merit-based practice are: The Civil Servants' Interest-Conciliation Forum (KEF), a tripartiteorganization consisting of trade unions, local government employee representatives, and chambers of commerce, whichrepresents civil servants' rights; the Parliamentary Ombudsman (Commission) on Citizens' Rights; the Commission on EthnicMinorities; and the Commission on Data Protection. For local government, employer groups such as the County AdvisoryBoards oversee policy to ensure fair practice.

Chapter 8: Public Administration 153
exam focuses on administrative law and thus is perhaps a poor predictor of civil servants' on-the-jobperformance. A more cost-effective measure would be to initiate a uniform entrance exam, which wouldscreen for abilities and potential rather than for legal and procedural knowledge.
Recruitment for civil service management positions is now linked to aSpecial Examination. Thisexarn tests relatively detailed knowledge of legal and public administration issues.Those in-service civilservants who are or wish to become managers must attend evening classes and pass the relevant modules.The Special Examination is viewed as in-service training by the Government of Hungary, although inpractice it is also used as a competitive screening device for potential managers. One of the deficienciesof the Special Examination is that it encourages managers to be sector specialists rather than decision-makers and generalists. It might be advantageous to de-emphasize specialist legal knowledge, and focusinstead on the general skills required to operate within a context of EU integration.
Performance Appraisal
The Civil Service Law fails to clearly define the principles and procedures of performanceappraisal. Performance ratings are used solely for promotion purposes rather than for career development,training, or performance improvement. Moreover, it seems that performance is not sufficiently linked topay. This is a widespread problem: even in some EU countries, performance-related pay seems to be away to make salaries more competitive rather than to improve performance.
Experience suggests that Hungary would have relatively more success in improving performanceby streamlining public sector employment while raising the salaries of targeted positions, in line withmarket conditions. To avoid wage bill increases, the salary gains would need to be financed throughefficiency savings. The performance review process also needs to be revised to allay concerns inheritedfrom the previous era about arbitrary central standards. A formal review policy should be designed, andstaff and managers trained in the relevant procedures. Performance reviews should be undertakenannually.
Promotion
Promotion within a civil service category is automatic with length of service, provided that a"capable" performance rating is obtained. Civil servants can expect to move up the hierarchy at leastevery five years. While this aids in the retention of valuable skills, the system cannot be truly merit basedbecause of the inherent limitations of the performance appraisal system.
The promotion system is dependent upon the immediate manager, with little or no oversight byeither the reviewer's senior manager or the agency's human resources department. Although promotiondecisions are transparent, since they are linked to the appraisal system, the results are not published in theemployer's bulletin or journal. The requirement to publish all staff movements should help managementand staff to track personnel movements and provide a clear trail of staff movements.
Training and Career Development
The grading and the supplementary pay systems are based on educational qualifications. Thisoveremphasis on general credentials, rather than on job-related skills and abilities, presents a problem inthe context of EU integration. The focus will have to shift toward management and planning skills.

154 Hungary: On the Road to the European Union
The institutional setup for the management of civil service training also needs strengthening.First, the role of each of the institutions involved in managing training needs to be clarified' to helpeliminate confusion and duplication. The new Government has recognized that training of civil servants isa key strategic issue, and plans to establish a central organizational structure for training based upoiltheHungarian Institute of Public Administration (HIPA). Second, the analysis of training needs and thedevelopment of training policies are being undertaken on an ad hoc basis by individualministries withoutcivil service-wide coordination of training resources. If Hungary is to make effective use of its own anddonors' resources, it is necessary that an overall training strategy for civil servants be developed. Thestrategy should define and prioritize the main training needs, the institutional arrangements for managingtraining, options for delivery, and the cost. The Civil Service Department should initiate this strategy,establish methods for coordinating national training, and specify the roles and reporting arrangements forthe various policy and provider institutions.
The cost of civil service training will be a significant factor in determining Hungary's readinessfor operating within an EU environment. The CSD draft training decree proposes that HUF 2.7 billion (2percent of the wage bill) should be made available for civil service training, but this cost has not beenanalyzed in terms of need. One option to finance cross-sectoral, core management development trainingwould be for the Civil Service Department to pool some proportion ofthe training budgets of the variousministries.
MANAGING EU ACCESSION
Hungary faces the immediate and pressing administrative task of managing the process ofaccession to the European Union. This task must be addressed in parallel with the reform of the widerpublic administration system. The challenge is to make progress in both areas without compromisingeither short or long-term objectives. The following discussion assesses the performance of the institutionsset up to manage EU accession in Hungary in light of a strategy for accession (Box 8.2 below). We focuson the suitability of institutional arrangements, the management processes that have been put in place,and the degree to which an adequate human resource base is being built to support EU accessionactivities.
Box 8.2: Strategy for Accession
Hungary's accession strategy takes the form of a detailed National Program for the Adoption of theAcquis, issued by the Ministry of ForeignAffairs, State Secretariat for Integration (SSI), in March 1998. It was subsequently agreed upon by the Cabinet Comnmittee for EU Integration,chaired by the Prime Minister. The program defines the priority tasks for the period up to 2001, and assigns broad responsibilities and timeframefor completion. The strategy c3vers ten areas, each of which is broken down into a number of subareas (e.g., employment, social affairs). For eachsubarea, the program identifies lead responsibilities, tasks, timeframes, and the economic and social impacts of EU integration.
Among the most important weaknesses of the Govemment's EU strategy are:. With regard to the institutional requirements for strategy implementation, the actions defined in the strategy tend to be basecbn general
institutional needs rather than on concrete proposals.* Lack of complete cost estimates, which would enable a more coordinated approach to requisitioning and targetingovemment and extemal
resources.. There is a lack of connection between the strategy and the wider public administration reform program.issues such as civil service
professionalizatibn, pay, and grading; and the institutional framework for civil service policy and management-all crucial to carrying ougovemment tasks within the new EU-driven environment-are not addressed.
10 These include: the Commissioner for Modernization of Public Administration in the Prime Minister's Office (training policyfor senior civil servants); Ministry of Interior (training policy of all other civil servants); Ministry of Foreign Affairs (trainingpolicy for EU-related issues); the Hungarian Institute of Public Administration (HIPA; provision of research and training);county and state administration offices (implementation of civil servant training at the local level).

Chapter 8: Public Administration 155
Institutional Arrangements
EU integration requires adequate institutional capacity to define policy and coordinateimplementation of the actions defined in the Government's accession program. Hungary appears to havemade significant progress in developing the necessary institutional infrastructure and processes to realizethese objectives. Current institutional arrangements provide for strong coordination for the accessionprogram by ensuring that politicians, ministers, senior civil servants, and non-governmental experts arefully involved in the preparation of Government policy. However, as the integration process becomesmore complex and as tasks become more numerous and sophisticated, these arrangements will requirefurther strengthening. Hungary's basic institutional framework for EU accession activities is shown inFigure 8.1 in the Appendix. The structure has evolved over time as result of discussions with the EC, aswell as examples of best practice recommended in SIGMA reports. The economic and trade-relatedfunctions of EU integration, for example, were moved from the Ministry of Trade to the Ministry ofForeign Affairs, which is now responsible for all EU integration matters. And coordination ofinternational assistance was recently moved to the Prime Minister's Office, headed by a minister withoutportfolio who can independently assess bids for technical assistance from the various ministries.
There has been some discussion of how to improve efficiency in the functioning of andcoordination among the structures involved in EU integration. There are a number of areas that needstrengthening and improvement: (i) a clear division of roles of the Commissioner for Modernization ofPublic Administration and Coordinator for Technical Assistance, particularly with regard toresponsibilities for newly developed twinning programs; (ii) technical assistance coordination; (iii)systems for tracking and monitoring technical assistance projects, and methods of ensuring compliance;(iv) more flexible usage of civil servants to improve skills transfer; (v) management procedures (i.e., asingle standing order for passing documentation among the structures involved in EU integration); and(vi) technology that could strengthen these EU-related procedures.
Human Resource Issues
The structures and procedures used to coordinate EU integration are satisfactory, and havealready proven effective in strongly positioning Hungary for EU membership. Nonetheless, because ofthe lack of centralized human resource planning, there has been no opportunity for strategic placement ofscarce staff in key civil service positions or to transfer staff as needed to priority positions. Within lineministries, human resource departments have had to compete with other ministries to increase staffinglevels and provided needed training.
Hungary's EU integration departments are relatively well staffed for their immediate tasks.Nonetheless, the State Secretariat for Integration has estimated that an additional 4,000 posts will berequired in Year 2000 to manage the civil service under EU membership. The staff now involved in EUnegotiations appear to be well trained. Following accession, however, it is likely that many of these willgo to work for the European Commission and other EU organs, and additional resources will be requiredto replace them in Hungary. Although staff turnover at senior levels has stabilized, this is not the case formore junior staff, the future mangers of the civil service, who are in high demand by the private sector,particularly international firms.
The cost of constant staff development in light of this predicted high turnover could provesignificant. Preliminary estimates provided in Table 8.8 in the Appendixindicate that the initial four-yearstream of training costs for high and mid-level personnel would reach approximately US$105 million. Inaddition, about US$7 million would have to be spent on training staff dedicated to EU integration.
156 Hungary: On the Road to the European Union
Externally, training programs and technical assistance to provide relevant integration traininghave been vigorously supported by Phare and other donors. Technical assistance coordination has beenimproved by positioning the coordinator in the Prime Minister's Office to provide a cross-sectoraloverview of needs in the various ministries. Many ministries and donors, however, claim to bypass therules, and there are concerns about the fairness with which bids are considered for funding.
POLICY RECOMMENDATIONS
Strengthening institutional capacity is not only a prerequisite for a well-functioning marketeconomy, but it is indispensable to the EU integration process. In the last few years, Hungary has madesignificant progress toward building a modern and efficient public administration and creating a fullyprofessional civil service. However, it still faces a number of constraints in terms of governmentemployment practices and remuneration systems, as well as management of human resources in the civilservice and management of the increasingly complex EU accession process. The key policyrecommendations provided below are aimed at addressing these problems.
Government Employment and Remuneration
To mitigate problems and eliminate inefficiencies stemming from significant discrepancies inprivate and public sector remuneration systems, the Government of Hungary should introduce acoherentpay policy. This means developing the capacity to undertake routine pay comparator surveys for differentbenchmark skills; and to regularly collect and publish turnover and vacancy statistics to supportdecisionmaking on pay policy. It also means considering the introduction of a revised pay and gradingsystem, based on appropriate job evaluation techniques.
Regulation of the new pay flexibility mechanisms, including performance pay increments andsubtractions, personal salaries, and Euroatlantic Integration supplements, needs to be strengthened andsystematized. A policy framework outlining clear, concrete criteria for individual pay shifts on grounds ofperformance or skills needs to be developed.
Since EU accession will require rapidly increasing the number of staff with a new mix of skills,budgetary implications should be assessed as part of an overall forward staffing plan. Potential staffingincreases associated with changing skill requirements in the context of EU accession should be evaluated,along with offsetting employment reduction projections of staff who are no longer required. A program ofredundancy and relocation measures should be designed and costed to support these staffing movements.
Human Resource Management in the Civil Service
In order to facilitate more efficient human resource management and decisionmaking practices inthe civil service, the mandates and reporting relationships of each institution involved in civil servicemanagement should be clearly defined. If necessary, the Civil Service Law should be amended.
The capacity of the Civil Service Department to manage human resources should bestrengthened, through measures such as: (i) moving the Civil Service Department to the Prime Minister'sOffice (if necessary, with its own minister and counselor); (ii) rationalization of the Civil ServiceDepartment with the Public Service Department; (iii) training in international personnel managementpractices, possibly through the use of twinning arrangements; and (iv) development of operationalmanuals, model human resource department structures, and staffing and skills requirements. Moreover,

Chapter 8: Public Administration 157
the Civil Service Department should develop a human resource strategy for the national civil service; andreport to Parliament on the success of its policies.
A number of actions should be undertaken to ensure ethical, fair, transparent, effective, andmerit-based practices in the Hungarian civil service. First, the Government of Hungary should considerestablishing a civil service oversight body to review human resources policy and standards. Second,merit-based recruitment and promotion procedures should be systematically introduced and set out inoperational manuals. Vacancies should be linked to job descriptions based on a common format; theyshould be advertised in national journals, and CSD should conduct inspections of ministries to ensurecompliance. Performnance evaluations should be undertaken on an annual basis. The Civil Service Lawshould be amended accordingly.
Finally, the following measures to improve civil service training should be considered:development of a national training strategy, contracting out of some aspects of civil service training, andclarification of the roles of relevant Government institutions in training policy and provision. In addition,the cost-effectiveness of examination arrangements for entering and sitting civil servants should bereviewed.
Managing EU Accession
Managing the process of accession to the European Union will become increasingly important inthe coming years. Improvements should be sought in technical assistance coordination by clarifying therelative roles of the Commissioner for Modernization and the Technical Assistance Coordinator tominimize duplication. The government should consider assigning all technical assistance responsibilities,including those for twinning, to the newly appointed Minister for PHARE. Systems for tracking,monitoring and ensuring compliance in technical assistance projects need to be developed.
To ensure greater commonality among Government agencies in their management and staffing ofEU-related functions, the State Secretariat for Integration should develop guidelines, based on a review ofbest practice, for the staffing and procedures in EU integration departments at the level of individualministries. Management procedures to guide existing and newly recruited EU staff should be regularlypublished and circulated.
EU integration activities need to be approached in close coordination with overall publicadministration development concerns, and the integration strategy should be updated to incorporateadministrative impact into its analysis. This analysis should detail the capital and recurrent costs,including staffing, of each proposed action. In addition, the CSD's human resource strategy shouldidentify the cross-sectoral human resource requirements of supporting both the EU accession negotiationphase and the longer-term requirements of administering programs in the EU environment.

9. THE AGRICULTURE AND FOOD SECTOR
Agriculture has traditionally played a significant role in the Hungarian economy; in fact, theamount of arable land per capita is one the highest among EU candidate countries. Despite a fall inagricultural production since the late 1980s, agriculture and food processing still account formore than10 percent of GDP (6 percent for agriculture alone). During recent years, the sector has undergonesubstantial structural changes. This chapter examines the outcome of those changes, as well as a numberof other questions: How well prepared is the sector to compete in a single EU market? What is the likelyimpact of EU accession? How much adjustment to EU standards and policy will be required? And whatare the remaining constraints to sector development?
OVERVIEW OF RECENT STRUCTURAL CHANGES
Hungary's agriculture and food sector has undergone substantial changes in recent years, fosteredby the full liberalization of consumer and producer prices, the privatization ofland and the food industry,and an open policy toward foreign investors in the food industry.
Producer and consumer prices have been fully liberalized, with the main adjustment taking placein the early 199OsLarge increases in the cost of energy and animal feed, coupled with changes in foodconsumption patterns (caused by a decline in real income and a change in relative prices), resulted in adrastic change in production. Agricultural production, mostly animal production, declined in the late1980s and early 1990s. Since 1995, animal production has stabilized, while crop production (cereals andoilseeds, in particular) has increased. Crop production now represents 60 percent of total production,compared to 50 percent in earlier periods.
The privatization of land is almost complete. About one-third of the land belonging to collectivefarms was transferred to farmers as private and the remainder was auctioned. In addition, the owners ofagricultural land confiscated during the socialist period received vouchers that could be used as paymentin auctions of collective and state farm land. A small amount of land (about 1 hectare per person) wasalso provided to members of collective farms and state farm workers, in addition to their other allotments.As a result, more than 90 percent of agricultural land was privately owned by the end of 1998. Ten to 15percent of the land, however, is still untitled.
A variety of new farming structures have emerged. By law, an individual farmer cannot ownmore than 300 hectares, and legal entities (companies of various kinds) cannot own agricultural land atall. Nevertheless, a significant concentration of holdings was made possible through associations offarmers. Thus, about 40 percent of the land is cultivated by farming organizations other than the owners.These include large family farms, cooperatives, and even some remaining state farms. Approximately500,000 part-time farmers are also generating income from sources other than agriculture. Thanks to arapidly developing leasing and rental market, the relatively fragmented land ownership pattern has not
158

Chapter 9. The Agriculture and Food Sector 159
prevented the agriculture sector from introducing new technology, a sharp contrast to most other Centraland East European (CEE) countries.
As a result of these transformations, there has been a significant transfer of the active populationfrom agriculture to other sectors of the economy. Agriculture now represents less than 8 percent of totalemployment, down from nearly 19 percent in 1992 (see Figure 9.1). This transfer was facilitated by
generally good job opportunities in other
20 sectors, and has allowed Hungary to be18 ---- . ' among the few CEE countries where16. - - . incomes from agriculture compare14. - . favorably with those of the rest of the
- 12 . eco n--- ---------------------- ---- omy. Nonetheless, while the overall
C. 8. - - - -| - unemployment rate in Hungary is slowly6 _ l 11 --- --- declining, rural areas still suffer from
2 ~~~~~~~~~~~~~relatively high unemployment, affecting0 -*. '~-~ most seasonal workers and those with a
1991 1992 1993 1994 1996 1996 1997 low level of training.
aShare of agr. in GDP *Share of agr. in employment Another consequence of thetrns ormtinhas boneqenaincrae inth
Figure 9.1: Shares of Agriculture in GDP and in Employment lransforpatron has been an ncmrease InSources: MoARD and Central Statistical Office (CSO), Hungary. labor productivity, which now compares
favorably to other sectors of theeconomy, as well as to EU countries. After adjustment to world prices, Hungary's labor productivity inagriculture (US$8,361 in terms of value added per capita) is now roughly of the same order of magnitudeas the average productivity in the EU (see Figure 9.2).
Figure 9.2: Labor Productivity in Agriculture in Selected EU Countries and Hungary, 1996(estimated at world prices)
$16,000
$14,000 $~~~~~~~~13,481S14,000 --- - - -- - - -- - - - - - - - -- - --- -- --- -- -- -- -- - --- -- --- -- -- - -------3 ~~~~~~~
$12,000 - . ._
S10,000 l$8361 $7,898
$8,000 $6,725
$6,000 -- ------ --- ----- -------- $4,09
$24,000 | | X l--
$2,000-- - - - - - - - -- - - - - - - -- -
$0
Czech Rep. Hungary Austria Germany France EU(15)
Source: OECD, 1998.
The food processing sector is now mostly in private hands (only around 6 percent remains stateowned)Privatization and openness to foreign investors have been a deliberate, although much debated,choice of the government. Agro-industry is among the sectors that has attracted the most foreign direct
160 Hungary - On the Road to the European Union
investment to Hungary: between 1991 and 1996, approximately 35 percent of FDI was invested in thefood industry, and in 1996, the share of foreign capital in the sector reached 50.6 percent. The largestcompanies, in particular, attracted foreign investors, and about 65 percent of them are majority foreignowned. This privatization policy has allowed a rapid introduction of new processing and marketingtechnologies, along with enough working capital to avoid disruptions in the financing of agriculture(through the purchase of agricultural products) and in the operation of factories. At the same time, theliquidation of failing agro-enterprises has facilitated the overall transformation of the sector.Overall, thecontribution of the food industry to GDP remained stable, at around 4.5 percent, while its share in totalemployment declined from 4.6 to3.5 percent, between 1992 and 1996.
As discussed in chapter 3, the relative contribution of agriculture and the food industry to totalexports has declined over recent years. Hungary, however, remains a net exporter of agricultural and foodproducts, mostly to European countries, with exports and imports remaining roughly stable over thewhole period (with the exception of 1993). Recently, exports to non-EU countries (mostly CEFTAcountries) and Central Asia have started to increase, making Hungary the only CEFTA country with apositive trade balance with the other CEFTA countries. This new phenomenon results from Hungary'sgeographic comparative advantage and from good commercial knowledge of the needs of neighboringcountries. Foreign investors, in particular, see Hungary as an excellent platform from which to launchtrading ventures with its Eastern and Central European neighbors.
SUPPORT TO AGRICULTURE: A LIMITED PROGRAM IN NEED OF REVISION
Direct Budgetary Support
The total budgetary cost of Hungary's agriculture support programs is modest compared withother OECD countries. In 1997, it amounted to about 1 percent of GDP (about one-fifth of thecontribution of agriculture to GDP). Estimates of producer subsidy equivalents' (PSE) show thatHungary significantly reduced its support to the sector after 1995, and now offers the same level ofsupport as the United States (about 16 percent) (see Figure 9.3). While in nominal terms, budget transfersto agriculture have more than doubled over the past six years, these transfers, measured in US dollarterms, have remained relatively stable-between US$500 million and US$600 million. Pressure,however, is growing for increasing subsidies following the recent decrease in international prices. The1998-99 support programs are thus likely to result in an increased PSE. On the consumer side, prices arenot significantly higher than international prices. This fact, expressed in terms of consumer subsidyequivalents2 (CSE), is reflected by a 8 to 9 percent implicit tax on consumers; again, a percentageequivalent to what consumers face in the United States, but 2.5 times less than the tax imposed on EUconsumers (see Figure 9.4).
Although modest, these budgetary programs need revision. Budgetary transfers to agricultureoccur in two main forms: production or investment subsidies, and market support (domestic price supportand export subsidies). Each accounts for about half of the total amount of transfers.
Producer subsidy equivalents (PSE) measure the value of transfers to producers. When expressed as a percentage of the totalvalue of production, measured at domestic prices, and adjusted to include direct payments and exclude production levies, PSEbecomes an indicator of the level of support to agriculture. This indicator is also adjusted to take into account the implicit taxesor subsidies associated with market price support.
2 Consumer subsidy equivalents (CSE) measure transfers to consumers resulting from agriculture policies. A negative CSEindicates an implicit tax on consumers.

Chapter 9. The Agriculture and Food Sector 161
Production and investment subsidies are either direct subsidies or through interest rates. Interestrate subsidies can result in negative real interest rates, although to avoid excessive costs the subsidy isbased on a central bank rate that is substantially lower than market rates. Notwithstanding thismechanism, these subsidies have created significant, non-market based incentives to borrow. At the sametime, banks seem to provide credit only under the condition that the request for subsidy has beenapproved. Consequently, the great majority of credit to agriculture is subsidized. The larger farmorganizations benefit most from these investment incentives, although the government tries to limit theregressiveness of the subsidies by imposing a cap on the amount that can be received by a single farmer.The Government believes that market failures, such as large information asymmetries and the lack ofspecialized financial institutions, justify the subsidy program.
0
0 43 - - 3 4- .7 - - 18 21--------3----- -183 -157 1 -181
31994 19 47.3 31.3~ -so ------ 5 - - 7 - 17.7
| 13 4 M 217 19 148 .7 .I .n S19 19 4a 1 3 j2138 11 4D 3 - 17 -177
_1197 16 414 159 2 1M 76 - -Z1 8 3 X -42
Figure 9.3: Producer Subsidy Equivalents for Selected Figure 9.4: Consumer Subsidy Equivalents for SelectedCountries CountriesSource: OECD, 1998. Source: OECD, 1998.
Export subsidies, the largest part of Hungary's market support program, are also its mostquestionable and debated component. Export subsidies benefit export trading firms and foreign buyers,but they do not enhance the competitiveness of the producer. In addition, the export subsidy programs arenot transparent. Instead, they reflect a piecemeal approach in which the narrow agenda of Hungarianexport trading and processing firms is supported with budget transfers. Nothing illustrates this better thanthe fact that the 1995 budget provided significant support in export subsidies to wheat traders at a timewhen world market prices were the highest in a decade. The phasing out of export subsidies is thusstrongly recommended, and this proposal has the backing of many Hungarian experts.
Direct market support through a system of guaranteed prices to farmers is limited to fiveproducts: food wheat, feed maize, pork, beef, and cow's milk. For these products, the government setsquotas and guaranteed prices (at 82 to 85 percent of domestic production costs). So far, the program hasonly been implemented in exceptional cases, as market prices have generally exceeded guaranteed prices.
The cost-plus approach used in setting guaranteed prices is neither sustainable nor compatiblewith a strong exporting position. So far, the absence of linkage with international prices has not been areal impediment, as the past few years have brought relatively strong international prices for cereals.Nonetheless, in an exporting country such as Hungary, this mode of calculation is not sustainable wheninternational prices are decreasing, since it does not create the necessary incentives for agriculture toadjust to market demand. As a large net exporter, Hungary needs to adjust its costs to international prices;any other policy would be unsustainable in the long run. Recent decreases in international prices will put
162 Hungary - On the Road to the European Union
the system in a difficult financial position. It must be noted that the Common Agricultural Policy (CAP)faced a similar dilemma in the past when it abandoned the cost-plus approach in setting interventionprices.
Tax Privileges
Compared to other sectors of the economy, agriculture enjoys significant tax privileges thatneedto be thoroughly reviewed. Small-scale farmers with an income up to HUF 1 million (about US$5,000)are tax exempt. Those with revenues between HUF 1 and 2 million pay income taxes but may choose notto do cost accounting for business taxes. The land tax was eliminated in 1995. A reintroduction of theland tax was proposed in early 1999 as a part of an overall review of taxation in agriculture. The proposalcalls for elimination of the refund of the fuel excise tax, which was introduced in 1997 (on the basis ofthe use of up to 90 liters per hectare). While the general VAT rate is 25 percent, the rate for mostagricultural products is 12 percent. Only a few products, such as spices, pepper, and tobacco have a 25percent rate. Producers with a total turnover of more than HUF 2 million must register as VAT payers,and they can be reimbursed for the VAT they paid on their inputs. Agricultural producers with a turnoverbelow HUF 2 million do not pay VAT and do not receive refunds for the VAT they have paid on theirinputs. Overall, the tax burden on agriculture is relatively low compared to other countries.
Registration of Farmers and Tax Evasion
Reporting by farmers to the tax administration is lagging. The government uses the supportprograms as an incentive for farmers to report to the tax administration. Farmers who are not registeredcannot receive any subsidy. Nevertheless, in 1997, only 48 percent of production was covered by axation.Most individual private farmers do not pay taxes, and hardly any provide information to tax and otherauthorities. The government has begun to change this situation. As of January 1, 1997, all producersmarketing any agricultural product must register with the tax authorities, even if they do not fill outdetailed income statements. At the same time, policymakers have started to ensure that farmers pay theirsocial security contribution.
The National Reserves System
The main objective of the National Reserves is, in principle, to ensure that the population issupplied with basic products in case of emergency. However, the fact that sales and purchases are done atthe discretion of a state-owned enterprise opens the possibility of using the management of stocks as aninstrument to either stabilize or support prices. Indeed, it is reported that the rotation of wheat and maizestocks is often done by sales at the end of the crop year, before harvest and purchases of products fromthe new crop. If the impact of these interventions on markets is substantial, the functioning of theprogram would prove incompatible with EU rules.
PREPARATION FOR ACCESSION TO THE EUROPEAN UNION
The agricultural and food sector is an area of potentially difficult negotiations with the EU. Thisdifficulty is increased by the uncertainty surrounding the future of the CAP. Given the large cost of theCAP3 and its potentially even larger cost after the accession of new countries, the European Commission
3The CAP represents a little less than 50 percent of the total EU budget, and the resulting PSE for EU countries is about 40percent.
Chapter 9. The Agriculture and Food Sector 163
has proposed a set of reforms aimed at providing less price support4 and more direct income support.Although the McSharry ieforns of 1992 opened the way for these types of reforms, the Agenda 2000 hasset the main direction of the reforms, including the March 1999 refinement of the original targets
Consistency with Ongoing Agreements with WTO and CEFTA
One of the expectations of some members of the Hungarian farming lobby is an adjustment of thedomestic support system to the levels of the CAP.5 The likely unbearable budgetary cost (storage costs orexport subsidies) of such a policy, however, is well understood by most farming circles and theauthorities. In addition, such a move would violate Hungary's obligations to the World TradeOrganization (WTO) and CEFTA.
Under the original WTO agreement, Hungary's commitment was to reduce its export subsidies toHUF 14 billion by year 2000. From 1994 to 1996, however, yearly subsidies reaching HUF 40-45 billion6
resulted in Argentina, Australia, New Zealand, and the United States requestingthat a WTO trade disputepanel examine the conformity of Hungary's export subsidy scheme with the Uruguay Round commitment.In October of 1997, Hungary obtained a WTO waiver of its original obligations. The waiver, however,only allows for a temporary delay, as it imposes strict limitations-for each year starting in 1997 andending in 2001-on the quantities eligible for subsidies and on the budgetary outlays per category ofagricultural products. While the yearly reduction in quantities and outlays remains small until 2000, it willbe on the order of 50 percent or more in 2001 for cereals, dairy products, and vegetables.
Proposed Adjustment of the Common Agricultural Policy (CAP)
The reforms of the CAP envisaged under Agenda 2000 aim at improving the competitiveness ofagriculture in the EU. The reforms cover: (i) prices; (ii) food safety and food quality; (iii) environment;and (iv) farm income and employment. The EC views the next set of reforms as a continuation of the1992 reform, with further shifts from price support to partly decoupled direct payment (i.e., unlinked toproduction), as well as the development of a rural policy to accompany this process. The following mainmeasures are foreseen for the period 2000-2002:
* reduction of the intervention price (EU support price) for cereals from ECU 119.19/ton to ECU 95.35(minus 20 percent), a non crop-specific area payment of ECU 66/ton (using regional reference yieldsfor cereals), and the abolition of set asides;
* reduction of market support for beef from ECU 2,780/ton to ECU 1,950 (minus 30 percent), and anincrease in direct income payments per head of cattle;
4In its declaration of mid-March 1998, the European Commission proposed a 15 to 30 percent reduction of support prices overthe next few years, to be compensated by direct income-support measures. However, the EU has already declared that farmersfrom CEECs will not be eligible for such compensatory payments; this is a potential element of disagreement during thenegotiations.
5 The Act CXIV of 1997 on the Development of the Agricultural Economy, adopted on November 11, 1997, indicates that aspart of the medium-term plan for agriculture, the gap in agricultural support between Hungary and the EU will be graduallydecreased until Hungary accedes to the EU (Section 1, item 1).
6 In addition, export subsidies in 1996 covered 149 products, instead of the 16 specified by the WTO.
164 Hungary - On the Road to the European Union
* reduction of the price of milk by 10 percent, extension of the quota regime up to 2006, and a newyearly payment per dairy cow equal to the ECU 215 payment for suckler cows.
At the same time, the level of protection at the border will remain high. Another EC proposal torenationalize certain budget transfers to agriculture (non market related) could also leave the governmentsome flexibility in negotiating the maintenance of some of its non market-based budget supports toagriculture.
Hungary's Transition toward a Hypothetical New CAP: Support Prices and Surplus
With or without the reformed CAP, Hungarian producer prices will significantly increase. Notonly does the intervention price in the CAP cover all the main cereals, but it is at the same level for allcategories of cereals. At the current exchange rate (1 ECU = 239 HUF), this intervention price of ECU119.19/ton is obviously much higher than the guaranteed price for food wheat in Hungary of ECU75.31/ton in 1998. Even with the proposed new EU intervention price of ECU 95.35/ton, Hungarianfarmers would get a 26 percent increase in the guaranteed price. This will have an impact on animalproduction, as the price of cereals (in the feed) for pigs and poultry will increase substantially. Producersof least-cost feed formulas will look for substitutions for cereals, for which the EU has not developed ahighly protective tariff at the border. In this regard, Hungary's position is not as favorable as that of otherEU countries, which have easy access to products imported by sea from third countries. Nevertheless, inHungary the trend will be to utilize less cereal and more substitutes infeed. At the same time, one canenvisage the opposite scenario in the EU(15), where, with lower prices for cereals, imported substituteswould become less attractive and more cereals would be used in animal feed. From these broad trends,the following main consequences can be envisaged:
- fewer cereals will go to intervention in the main surplus regions of the EU(15);
* pig and poultry producers of the EU(15) will become more competitive;
* pig and poultry producers in Hungary will face higher costs of production and will have to furtherimprove their competitiveness (quick improvement of the genetic material and of the feed; andreduction in energy and labor costs); and
* the remaining surplus quantities of cereals (wheat, in particular) will seek intervention purchases inHungary as well as in France, and (subsidized) exports to third countries will also tend to concentrateon these two countries.
With accession to the EU, a growing net surplus in cereals can be expected as a consequence ofsupply and consumption effects. Hungary could then become constrained by logistical problems.Transportation of wheat by rail may have a higher cost than transportation by waterway from competingcountries. In such a case, intervention stocks will appear in Hungary while being reduced in othercountries of Western Europe.
Hungary's Transition toward a Hypothetical New CAP: Policy Instruments and Institutions
Hungary's market intervention system differs from that operating in the EU. In the EU, with theexception of export subsidies that must adjust to both internal and international markets, the eligibilityand implementation rules of the guaranteed prices and market intervention are known beforehand andremain unchanged. They are not considered on an ad hoc basis by the various market committees at the

Chapter 9. The Agriculture and Food Sector 165
subsector level. In addition, intervention in the CAP is designed so that market support is organized onlyat the wholesale level (wholesale traders, marketing cooperatives, processing firms), and not at the farmlevel, as in Hungary. The actual impact of intervention measures at the farm level is felt only indirectly,since it depends largely on the actual efficiency of the marketing system between farmers and their firstcommercial clients. Though the government has now established an agency in the MoARD thatcooperates with institutions similar in the EU, the operating rules of this agency will need to be reviewedso that:
* enough private wholesale agents, merchants, marketing and processing cooperatives, and processingfirms in each subsector are registered as authorized agents that can bring agricultural products tointervention;
* the procedure to reserve storage for intervention, and to price the service of storage, is open andtransparent, and, as soon as possible, exclusively implemented through private sector facilities; and
* export subsidies are allocated in an open and transparent manner (either a fixed subsidy to whomeverrequests it and actually exports, or an open auction tc the lowest bidder).
Wholesale commodity exchanges for livestock and perishables will need to be used as marketreferences. In several subsectors (livestock, fruit and vegetables), EU market regulations are based on anumber of reference prices observed on a daily or weekly basis at "reference" wholesale commoditymarkets. Most of these markets are located in production regions.7 The government will soon need toadopt this practice and designate commodity exchanges for live animals and perishables. It will also needto collaborate with the concerned Product Councils to see how best to invest in those facilities. A systemlinking electronically major slaughterhouses with spot or term deliveries could serve as reference; theBudapest Commodities Exchange could also play a similar role.
Strengthening statistical infrastructure in agriculture and food, and providing reliabledocumentation on exports to and imports from third countries is an urgent need. The collection ofinformation, quality control of data, and data processing and dissemination in real time-in closecoordination with EUROSTAT and the European Commission-are to be put in place in preparation forEU accession. The Product Councils that represent the private sector in various agricultural and foodsubsectors already play an important role in intermediating such information
Other Consequences for Hungary of Full Accession
Trade (either formal or informal) in agricultural products with neighboring countries, whereHungarian minorities traditionally exchange products with Hungary, will be affected by implementationof the EU trade policy. Romania, the Slovak Republic, and Ukraine have developed informal traderelations with Hungary over the years, and the EU policy will have broader consequences for thesecountries than do existing border controls related to the quantity and the quality of goods. It will, forexample, affect the supply of raw agricultural products to food processing enterprises located in borderregions outside the extended EU. The higher cost of raw materials could result in the closing of theseenterprises. Similarly, Hungarian food processing firms-now selling at higher prices-will have todepend on export subsidies to sell their products to neighboring non-EU countries.
7 In consumer regions, the retail industry tends to originate its products from the production regions and bypass the localwholesale exchanges.
166 Hungary - On the Road to the European Union
Financing of Structural Changes and Investment
Some policymakers in Hungary believe that the country should wait for support from the EUbudget before addressing the long-term need for structural changes and investment in the sector. The EUincluding through the European Agricultural Guarantee and Guidance Fund (EAGGF), spends (1997figures) about 35 percent of its total budget on structural and cohesion measures.8 For countries with a percapita GDP below 75 percent of the EU average, this support is made through two funds, the EuropeanRegional Development Fund (ERDF) and the European Social Fund (ESF), and through the guidancesection of the EAGGF. A decision has already been made to create similar pre-accession funds (ISPA,SAPARD) for the current candidate countries. This type of non market-related support to agriculture isnecessary, particularly to improve rural infrastructure and strengthen the countries' ability to implementthe acquis communautaire without delay. In this regard, the existence of a convergence program, with alarge amount of funding available either through the EAGGF or through the Phare programs, wouldfacilitate the transition. Nonetheless, while the financing is crucial, it remains necessary for Hungary todevelop a strong and reliable program of adjustment and to partially finance it.
Rural or Regional Development: A Policy Still To Be Finalized and Strengthened
Rural and regional development policies are weak and need strengthening. On the institutionalside, the framework set in mid-1998 represents a significant step forward. In 1996, nineteen CountyDevelopment Councils (CDC) were established, as was a National Council for Regional Development tomake recommendations to, and coordinate with, the government. Rural development issues are now theresponsibility of the MoARD. In this regard, during the summer of 1998, the secretariat in charge ofcoordinating the regional development councils was transferred from the Ministry of Environment to theMoARD. Coordination problems also exist between the National Chambers (agriculture and industry)and the nine ministries involved in developing programs. Clearly, there is a need to better define andcoordinate central and decentralized tasks and responsibilities. To this end, the MoARD has set up a newdepartment responsible for promoting rural development and preparing a national strategy-aprerequisite for receiving grants from SAPARD. The national plan will be followed by the preparation ofregional development plans for each major region
The development of effective regional development policies-particularly those aimed at thereinsertion of the rural poor- is also made difficult by a narrow focus on agricultural policies. To beeffective, rural development policies need to be designed in collaboration with other stakeholders andinclude public investment programs in economic and social infrastructure. They need to define areas ofcollaboration with the private sector, and support the financing of micro and small enterprises incollaboration with NGOs. The availability of good regional statistics regarding unemployment andpoverty would also prove particularly useful, as the transformation of the agricultural sector-inparticular, the decrease in seasonal and part-time jobs-seems to have disproportionately hit the Gypsyminority. Most of that population lives in rural areas and 35 to 40 percent are reportedly unemployed.9
8About ECU 31.5 billion in 1997.
9 The Gypsy population is not well counted but is probably between 700,000 and 800,000, out of a total population in Hungaryof about 10.3 million.
Chapter 9. The Agriculture and Food Sector 167
REMAINING CONSTRAINTS TO LONG-TERM EFFICIENCY AND INNOVATION
Although attention is now focused on negotiations with the EU, the long-term objectives ofincreasing competitiveness and efficiency should not be forgotten. A number of constraints anddistortions in factor and product markets need to be corrected so that Hungary can benefit fully from itscomparative advantage in numerous areas of agricultural production. In addition, state agencies must gobeyond the task of harmonizing Hungarian laws and regulations with the EU framework, and prepare fortheir implementation. They will also need to collaborate with the private sector and research institutes, topromote the introduction of new technology and attractive products.
Factor Markets
Land market. Agricultural land ownership is still subject to legal constraints that limit the scope forrestructuring and investment. As discussed earlier, the 1994 Land Law does not recognize the corporate(or cooperative) ownership of land. This constrains enterprises that could consolidate land holdings andoptimize the size of farms. The 300 hectare limit on private ownership of land also constrains the range ofoperations. Furthermnore, the prohibition on corporate land ownership reduces the incentive forcorporations to invest in agriculture, and deprives them of the ability to use land as collateral for credit. Italso blocks the entry of foreign investors in the agricultural sector. The government argues that marketfailures, especially information failures, justify the restrictions on land ownership, since land prices inHungary are only a fraction of those within the EU. The restriction on foreign ownership was inspired bythe fear that foreigners could purchase Hungarian agricultural land cheaply prior to Hungary's accessionto the EU.
The legal regulations on land tenure and land lease are intended to protect the interests of both thelessor and the lessee. The recently adopted amendment to Act LV of 1994 on agricultural land, whichintroduces land tenure registration beginning in 2000, was intended primarily to provide for and tostrengthen the legal institution of land tenure. According to the amendment, all forms of agricultural landuse involving more than one hectare will have to be reported to the land registry office. Various otherlegal conditions for the lease of land-such as the duration and terms for terminating the lease-mightalso need to be revised. The Land Law limits the duration of a lease on agricultural land to a maximum often years (with longer lease terms for orchards and forest plantations). This can discourage investors fromconsolidating land through leasing if the payoff period for their projected investment exceeds ten years.Another lease-related provision requires landowners to compensate the tenant for certain naturalcalamities by reducing the rent. This diminishes the incentive of landowners to lease out. Similarly,tenants are granted the right to terminate the lease contract for health reasons. This may provide aloophole for tenants, thus penalizing owners and deterring rentals.
The agricultural land market is still not very active. Onereason may be that current owners expecta higher price for their land after EU accession. Another is that relatively good employment opportunitiesin cities-Budapest in particular-have freed former small landowners from farming the land themselves;the lease of their land to larger farms augments their non-agricultural salaries and allows them to retaintheir land as part of their wealth
The valuation of land and dissemination of market prices need to be reviewed and improved. ThePhare program has financed technical assistance for cadastre, titling, mapping, and land consolidation,but the issue of land valuation still needs to be addressed. The current system links the quality of a pieceof land to a "crown" value. This system, which has been in place for more than 100 years, needs to be

168 Hungary - On the Road to the European Union
revisited. Under this system, the registration of a transaction does not include the price of the land.Surveys are done independently to determine the price of land, but the Central Statistical Office does notrelease a relevant price index.
Another problem is that the legal framework under which cooperatives operate prevents modemstrategic management. Typically, a large part of the land and some assets used by cooperatives belong tonon-members, who do not participate in the general assembly of the cooperative. Members are paid onthe basis of the results of the enterprise, while others are paid according to a fixed price. This creates apermanent source of conflict, since the various categories of factors (land, labor, and capital) can haveopposing objectives and differing views regarding the way cooperative profits should be divided at theend of each year.
Credit to agriculture and food industry. Bank financing and public support to agriculture areintricately linked. As explained earlier, a large majority of theagriculture financing by commercial banksis done in connection with investment subsidies or interest rate subsidies under various governmentprograms. In addition, there are several types of guarantee funds that can be used for loans to farmersand food enterprises. These are mainly: (i) the agricultural guarantee fund, which benefits mostly smallfarrners; and (ii), the agro-industrial credit guarantee fund (Agro-Entrepreneur Credit Guarantee Fund).These funds create an obligation for the state and are, therefore, controlled by the Treasury. Nearly 60percent of all long-term loans for investment are guaranteed. Again, commercial banks often require suchguarantees as a condition of eligibility for their loans, but interest rates are market rates and are,therefore, not subsidized.
Despite (or because of) these constraints, the financing of agriculture is becoming diversified. Alarge number of banks now provide long-term credit to agriculture. By the end of 1997, each of fivebanks had financed agriculture for more than HUF 4 billion (more than US$21 million); and three morebanks each contributed between HUTF 1 and 4 billion. The bank that accounts for the largest share ofagricultural investment financing represents about 25 percent of the total market, and the second largestrepresents 14 percent. Banks benefit indirectly from the various subsidies and guarantees obtained bytheir clients, and from the detailed loan documentation prepared by the extension agents'° of MoARD.
In addition to the commercial banks a new specialized mortgage bank has begun to operate. Thelaw prohibiting legal entities from owning agricultural land has obliged the legislature to introduce aspecial case for banks: they can own land recovered from defaulted mortgages for a maximum of threeyears, but can sell it only to private individuals. In March 1998, the first bank to specialize in mortgagelending, the Land and Mortgage Credit Bank (FHB), was launched. It accepts agricultural land ascollateral and is planning to provide the equivalent of about US$55 million in loans (agriculture and othertypes) during its first year of operation. The development of this new bank was facilitated by thegovernment's decision to participate in its capital, both directly (with a 37 percent stake) and indirectly(through the state's interest in the bank's shareholders"). The close link of several Hungarian banks withforeign banks could also facilitate the development of other mortgage lending institutions.
Credit for working capital-a service not provided to agriculture in most CEE countries-has beenrapidly expanding in Hungary, fostered by interest rate subsidies and state guarantees. In both 1996 and
10 Those agents are located at the regional level, and preparation of loan documents is their main task.
11 The shareholders are Hungarian Investment Bank (48.33 percent), Financial Center Bank (10 percent), Mez6bank (3.33percent), and Postabank (1.67 percent).
Chapter 9. The Agriculture and Food Sector 169
1997, credit for working capital to agriculture grew by 75 percent in nominal terms over the previousyear. In the food industry, working capital financing increased during the same years by 43 and 51percent. The relatively low real interest rates for non-subsidized loans in Hungary are clearly veryattractive to the business community. For instance, the real interest rate in 1996 for credit of more thanyear was about 4.4 percent, and 3.6 percent for less than one year. Subsidization makes the effective ratesto farmers even lower. State guarantees (of up to HUF 14,000 per hectare) in connection with four crops(wheat, barley, rye, and maize) create similar incentives. Such guarantees should be reduced as othertypes of collateral develop; and subsidization of interest rates should be reviewed to avoid unwantedmacroeconomic and microeconomic effects.
By contrast, the credit system to small farmers remains underdeveloped. Thishas created demandfor other ways of financing agriculture, including those usually seen in countries much less developedthan Hungary. One such method is the pre-financing of crops by commercial companies, mainlyintegrators and processing firms. The service package they offer to small and unorganized farmersincorporates a mix of pre-financing and the supply of input products against the delivery of certainquantities of outputs. Such practice does not result in the transparent pricing of products.
All of the various subsidies to the financing of the agriculture and food industries will probablyprove incompatible with the CAP, and will have to be removed at the time of Hungary's accession to theEU, since they could constitute discrimination against foreign products. Privately funded, sector-specificguarantee finds, however, may be acceptable (they have been acceptable in the past in the EU). Thedismantling of the credit subsidy schemes will most likelycause a drastic change in the financing ofagriculture, unless some sort of post-accession transition is negotiated.
Labor market. The smooth functioning of the labor market has facilitated the transfer of jobs fromagriculture sector to other sectors of the economy. The departure of workers from agriculture hasprimarily affected the less-skilled employees of the former state farms, as well as seasonal workers. Suchrapid adjustment-and the resulting more educated agricultural labor force-largelyexplains Hungary'sprogress in the agriculture sector. The challenge for the coming years will be to achieve a collaborationbetween the public and private sectors in financing high-tech vocational, secondary, and college-leveltraining. The Product Councils in each agricultural and food subsector could be an excellent instrumentfor such collaboration.
Product Markets: Instruments and Participants
Integrators and processing companies play an important and useful role in the transfer of modemtechnology to agriculture. As intermediaries they provide a number of services to small farmers,including pre-financing of harvest, delivery of inputs in exchange for products after harvest, and supportfor marketing of products. In contrast, cooperatives operate under rules inconsistent with efficientmanagement (see above). This constrains their restructuring.
Farmers' interests are now well represented through a wide range of associations. In 1994, a newChamber of Agriculture was established, with a regional network, along the lines of the German andFrench system. Its aim is to assist farming organizations of all kinds, collect information, and support theimplementation of agricultural policies. The functioning of these Chambers is very much dependentongovernment budget transfers. To guarantee full accountability of these public funds, thorough annualreviews of their activities and audits (financial and operational) of their accounts should be carried out.

170 Hungary - On the Road to the European Union
The Budapest Commodity Exchange (BCE) also plays an important role. Like most otherexchanges in the world, BCE has diversified from agricultural commodities to financial derivatives-achange largely reflected by the total turnover of the exchange, which in terns of turnover ranked twenty-second in the world in 1996. While the financial derivatives tend to overshadow the agriculturalcommodities, the grain section of the market has expanded: in 1997, 217,844 futures contracts weretraded-equivalent to one third of the total grain production of Hungary. The most traded commoditiesare milling wheat, followed by maize and feed wheat. Deliveries have decreased from previous years,showing that users have moved toward using the market as a hedging instrument (exchange of risks)rather than for the exchange, with actual delivery, of products
The expansion of the market-at a time when the Paris and London wheat futures are struggling tosurvive-is due to a combination of factors: the liberal policy of the Hungarian government, theemergence of a thriving trade sector with a substantial participation of foreign grain trading companies;and the use of the market by "integrators" to price cereals."2 But despite this progress, interference inforeign trading activities-for instance, through the issuance of export licenses-could still bedetrimental to the future development of the market. In spring and summer of 1998, for example, thedeposits required to obtain grain export licenses caused a substantial decline in Hungarian exports-thetiming of which was especially bad, since international prices were rapidly decreasing.
The development of a warehouse receipt system is important, as it gives farmers flexibility inmarketing their goods (that is, they can store their products and sell them later, rather than having to sellat harvest time), and provides more secure collateral to the banks. This development was made possiblein Hungary by two laws,"3 enacted in 1994 and 1995. An important element, however, is still missing inthe warehouse receipt legislation: a provision for performance guarantees. As such guarantees are notcurrently possible available, the government has imposed high capital requirements, which have reducedthe private sector's interest in this type of business. As a result, the only players in this field are threestate-owned companies. Since in the EU, it is the private sector-not the state-that is supposed toimplement the decisions of the Council of Ministers, it will be important for Hungary to facilitate thedevelopment of the warehouse receipt system and the privatization of warehousing activities over thenext few years.
The development of a marketing node for Central Europe in the riparian countries of the Danubeis of great interest to private traders and to the BCE. Such a node would be of significant benefit toHungary, especially since grain exports to third countries are likely to increase substantially. Contacts arebeing developed between BCE and emerging exchanges in Romania so that the Danube/Black Sea regioncould become an internationally recognized reference similar to the Mississippi/Gulf of Mexico, theRotterdam/Rhine, or the Plata region. A bilateral agreement between Hungary and Romania removingconstraints to load and unload products for the river transport of grain would drastically reduce the cost of
12 It should also be noted that the BCE is a member of the Product Council for cereals. This demonstrates a good understandingby the Hungarian private sector of the usefulness of such councils in improving marketing techniques and fostering a dialoguewith state agencies. Such cooperation is very much in line with what the EU expects in the implementation of its policies via theprivate sector. In this regard, Hungary seems more advanced than the other CEE countries.
13 The 1994 law on commodity exchanges and the 1995 law on public warehousing.

Chapter 9. The Agriculture and Food Sector 171
transportation and result in faster development in the activities of the grain terminal facilities in the deltaand canal region of the Danube."4
Hungary is the only CEE country in which the private sector is represented by Product Councils ateach subsector level. More than 30 Product Councils have emerged since 1991. These councils haveplayed a significant role in enabling the government to convey information to the private sector, whileproviding the government with the views of farmers, wholesalers, and other members of the businesscommunity.
The role of the Product Councils, however, needs to be clarified. They should not intervene in thefixing of prices and the functioning of markets. The example of the Dairy Product Council is illustrative.This Council helps its members define an indicative price to be paid for milk by the dairies if they want tobenefit from a government subsidy. Individual dairies have no choice but to accept the so-calledindicative price. Similarly, the development by the Dairy Product Council of an intervention fund couldbring significant interference in the market and create opportunities for various types of further marketsupport, at a time when a relatively high indicative price reduces the competitiveness of Hungarian dairyproducts."5
By contrast, the Product Councils could play a useful role in helping farmers agree on rules fordelivery, quality norms, and arbitration in case of dispute (which would be particularly be useful for thesugar sector, which involves a large set of participants). Another useful role would be to assist enterprisesin a specific marketing chain in their efforts to improve quality control management and collaborate withprivate and state agencies (national or foreign) to train staff and develop new techniques. Collaborationwith the Central Food Research Institute (KEKI), for instance, could facilitate better management ofquality control along the agricultural and food marketing chain, as opposed to separate and uncoordinatedactions at the individual enterprise level.
The Role of State Agencies in Promoting Efficiency and Enforcing the EU Legal Framework
The role of state agencies should be to support cost effectiveness, marketing efficiency, andenforcement of the EU legal framework. To be ready for the January 2000 launching of the EU-financedpre-accession program, the government will have to finalize its program of harmonization with the EU.This includes adjustment of market-support institutions, agricultural statistics, and farm registers;reference wholesale markets for implementation of the CAP; quality control and consumer protection;environmental protection; customs administration; and so forth. Implementation of the acquiscommunautaire, however, should not prevent state agencies from continuing to help the private sectorimprove the production and marketing performance of the agricultural and food chain.
14 The World Bank has prepared a project with the Government of Romania that would permit the creation by the private sector,under concessionary terms, of two large grain terminals in the free zone of the port of Constanta. The European Bank forReconstruction and Development (EBRD) has already financed a new grain terminal in the same port.
15 The Product Council made a request to the government for increased export subsidies for cheese, in order to facilitate the saleof increasing inventories of milk powder, butter, and cheese A similar situation in the EU a few years ago led to the creation ofmilk production quotas
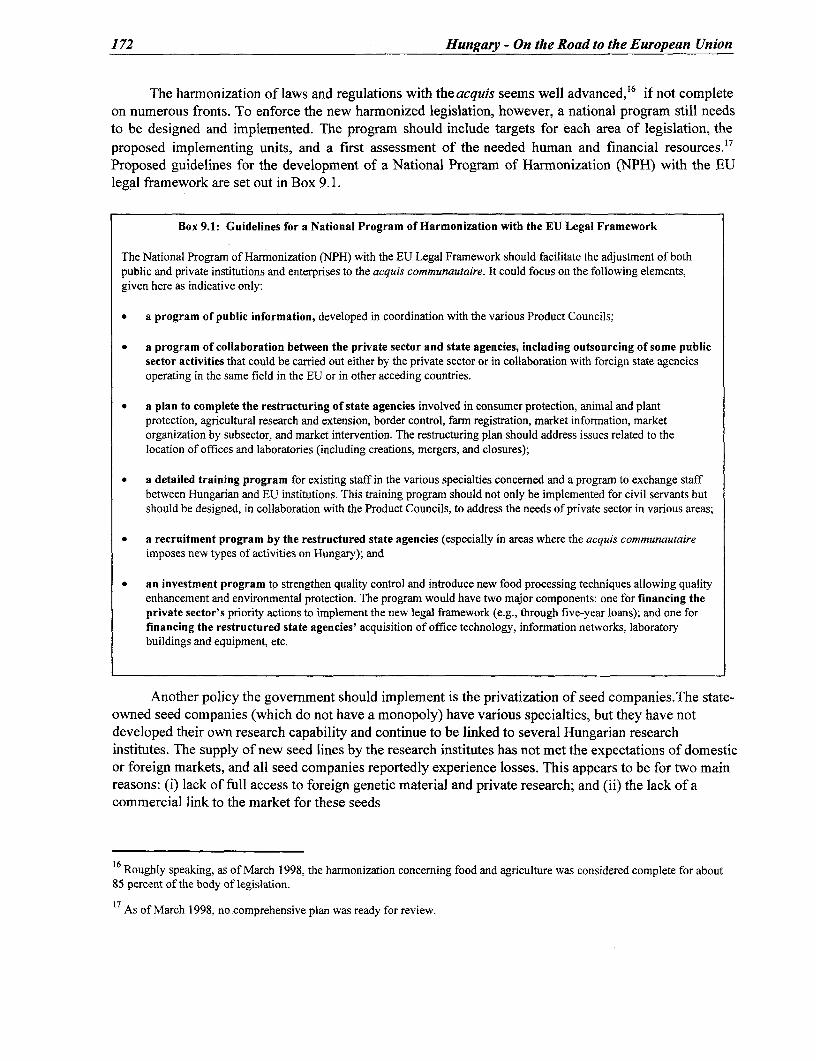
172 Hungary - On the Road to the European Union
The harmnonization of laws and regulations with the acquis seems well advanced,'6 if not completeon numerous fronts. To enforce the new harmonized legislation, however, a national program still needsto be designed and implemented. The program should include targets for each area of legislation, theproposed implementing units, and a first assessment of the needed human and financial resources.'7
Proposed guidelines for the development of a National Program of Harmonization (NPH) with the EUlegal framework are set out in Box 9.1.
Box 9.1: Guidelines for a National Program of Harmonization with the EU Legal Framework
The National Program of Harmonization (NPH) with the EU Legal Framework should facilitate the adjustment of bothpublic and private institutions and enterprises to the acquis communautaire. It could focus on the following elements,given here as indicative only:
* a program of public information, developed in coordination with the various Product Councils;
* a program of collaboration between the private sector and state agencies, including outsourcing of some publicsector activities that could be carried out either by the private sector or in collaboration with foreign state agenciesoperating in the same field in the EU or in other acceding countries.
* a plan to complete the restructuring of state agencies involved in consumer protection, animal and plantprotection, agricultural research and extension, border control, farm registration, market information, marketorganization by subsector, and market intervention. The restructuring plan should address issues related to thelocation of offices and laboratories (including creations, mergers, and closures);
* a detailed training program for existing staff in the various specialties concerned and a program to exchange staffbetween Hungarian and EU institutions. This training program should not only be implemented for civil servants butshould be designed, in collaboration with the Product Councils, to address the needs of private sector in various areas;
* a recruitment program by the restructured state agencies (especially in areas where the acquis communautaireimposes new types of activities on Hungary); and
* an investment program to strengthen quality control and introduce new food processing techniques allowing qualityenhancement and environmental protection. The program would have two major components: one for financing theprivate sector's priority actions to implement the new legal framework (e.g., through five-year loans); and one forfinancing the restructured state agencies' acquisition of office technology, information networks, laboratorybuildings and equipment, etc.
Another policy the government should implement is the privatization of seed companies.The state-owned seed companies (which do not have a monopoly) have various specialties, but they have notdeveloped their own research capability and continue to be linked to several Hungarian researchinstitutes. The supply of new seed lines by the research institutes has not met the expectations of domesticor foreign markets, and all seed companies reportedly experience losses. This appears to be for two mainreasons: (i) lack of full access to foreign genetic material and private research; and (ii) the lack of acommercial link to the market for these seeds
16 Roughly speaking, as of March 1998, the harmonization concerning food and agriculture was considered complete for about85 percent of the body of legislation.
17 As of March 1998, no comprehensive plan was ready for review.
Chapter 9. The Agriculture and Food Sector 173
Development of New Marketing Strategies
Collaboration among the private sector, state agencies, and universities will be beneficial inbringing high-tech equipment, as well as processing and marketing techniques, to Hungary. The countryhas already been exposed to modem retailing. Large chains of super and hypermarkets emerged in theearly 1 990s, and entrepreneurs in the food industry already understand the demands of the retail industry.Nonetheless, the absence of trade barriers for food products between Hungary and the EU after accessionwill call for an even more proactive strategy by Hungarian food processors. A permanent search forinnovative solutions through research and technology development, and through new marketingstrategies, will be crucial. Contractual arrangements with enterprises or research agencies to develop newproducts or new packaging or processing techniques, will need to be multiplied. The Product Councilscan contribute to the process by developing training programs for executives and line workers ontechnological, legal (EU legislation), and economic and business issues.
New products and technologies could emerge from a stronger collaboration among state agencies,universities, research centers, and the private sector. Product differentiation, as it appears in the 1998Hungarian Food Catalogue, still remains narrow. Food processing enterprises still largely produce cannedor frozen products that are only slightly differentiated; their comparative advantage resides in their costeffectiveness. When CAP prices are introduced in Hungary, however, this price advantage will largelydisappear, and the marketing mix (product, price, retail channels) will become more important. In thisendeavor, the important participation of large foreign firms in the Hungarian food industry will clearlyfacilitate the process. However, for small and medium-size enterprises with no link with foreign researchand development, the ability of food industry colleges and research centers to offer advancedtechnologies will be crucial for long-term survival. The modernization of research centers such as KEKI'slaboratories and facilities, together with the Product Councils and individual enterprises, could play amajor role in this regard in the coming years.
CONCLUSIONS AND KEY RECOMMENDATIONS
Full price liberalization, successful privatization, a sharp decline in sector employment, and aproductivity level comparable to the EU average constitute remarkable achievements in the agricultureand food sector. Nevertheless, as the process toward accession unfolds, Hungary still must adjust itspolicies to prepare for the implementation of the acquis communautaire and to pursue productivity gains.
The support programs will need substantial revision over the coming years, both to comply withongoing agreements (WTO) and to be compatible with the CAP. By 2001, export subsidies shouldalready be significantly reduced; credit subsidies, which [practically] apply to nearly all credit toagriculture, will have to be discontinued at the time of accession. The government should also, as part ofits pre-accession strategy, modify its current method of setting guaranteed prices-a cost-plusapproach-which does not promote adjustment to market demand and can lead to unbearable budgetarycosts at times of decreasing international prices. For similar reasons, the government should continue toresist pressure to raise its guaranteed prices to the current level of EU intervention prices-a level thatwill be revised downward in the near future.
Even with a substantial reduction in EU intervention prices, Hungary's producer prices for cerealswill increase. This, in turn, will create higher producer costs forpig and poultry producers and a growingexportable surplus of cereals. A continued search for competitiveness and reduction of logisticalconstraints will be critical to maintaining Hungary's export capacity.
174 Hungary - On the Road to the European Union
Hungary has already gone a long way in adjusting its laws and regulations to the EU framework.Nevertheless, an action plan still needs to be designed and implemented to apply and enforce the newframework. This plan should include, inter alia, a public information campaign, a staff training program,a restructuring plan for state agencies involved in consumer protection, animal and plant protection,agricultural research and extension, border control, farm registration, market information and marketintervention, and an investment program. While resources made available by the EU during the pre-accession period will be critical to implementation, it remains essential for the government to develop arealistic plan and contribute to its financing.
Preparation for negotiations, however, should not overshadow the long-term objectives of greaterefficiency and growth. To achieve these objectives, the government should remove the remaining legalconstraints that still affect the land market and limit the scope for restructuring and investment. It shouldalso privatize the seed companies to allow full access to foreign genetic material and enable thesecompanies to become profitable. In addition, the government should continue improving the functioningof the numerous instruments (Budapest Commodity Exchange, warehouse receipt system, ProductCouncils) that facilitate the marketing and export of agricultural products. Finally, it should collaboratewith the private sector and research institutes to promote the development of new technology andattractive products
10. ENVIRONMENT
OVERVIEW AND COST ESTIMATES
Joining the EU will require that Hungary adopt and implement the entire body of EU legislationand standards known as the acquis communautaire. Environmental protection is a guiding principle ofthe acquis-a status not accorded to other crosscutting objectives such as social protection. There aresome 70 EU environmental directives, supplemented by "daughter" directives and regulations.
The EU recognizes that the investments required to implement the environmental acquis aresignificant, and that full compliance will not be possible, for Hungary and other pre-accession countries,before the date of accession. While Hungary would make such investments in the future even without theEU directives, accession clearly accelerates the investments and reduces the scope forflexibility. The ECexpects extended transition periods for some environmental directives and for each country to address itsown national priorities and problems, taking into account their economic constraints.
The field of environmental protection presents particular challenges. First, the benefits ofinvestments will be seen only in the very long term, but the costs will affect every Hungarian householdimmediately. In the short term, therefore, environmental investment may have to be considered a price ofjoining the EU. An awareness campaign may be necessary to promote public understanding of thesecosts. Second, the EU directives, particularly as they relate to transboundary environmental impacts, donot necessarily correspond with Hungary's priorities at this stage in its development. The challenge is toidentify actions that will have both domestic and transboundary benefits and, where this is not possible, toclearly delineate the trade-offs.
Some of the costs will fall exclusively on the public sector. These include changing institutionalstructures and procedures to ensure monitoring, enforcement, and reporting systems. A second categoryof costs will be imposed predominantly on the private sector. Directives regulating industrial pollutiondominate this category. Other directives, such as efforts to reduce emissions from transport or householdheating, will fall directly on consumers. A third category of costs-in fact, the bulk of investment costs-are likely -to be borne by municipalities, corporatized municipal entities, or utilities owned by acombination of municipal governments and private organizations. Municipal wastewater and solid wasteare in this category.
After presenting a summary of costs, this chapter reviews the key implementation issuesin each of the environmental sectors, in terms of institutional arrangements, the scope formanaging investments as efficiently as possible, and implications for public service tariffs. Thechapter closes with strategic recommendations.
A recent study' has estimated that if Hungary were to continue current levels of expenditure onthe environment (1 percent of GDP plus 0.6 percent for operating expenses), and if GDP grows at 3 to 4percent a year, Hungary could reach full compliance with EU directives by 2010. Under thesecircumstances, Hungary would require an 8-year transition period if it joined the EU in 2002.
'Kerekes and Kiss (1998).
175
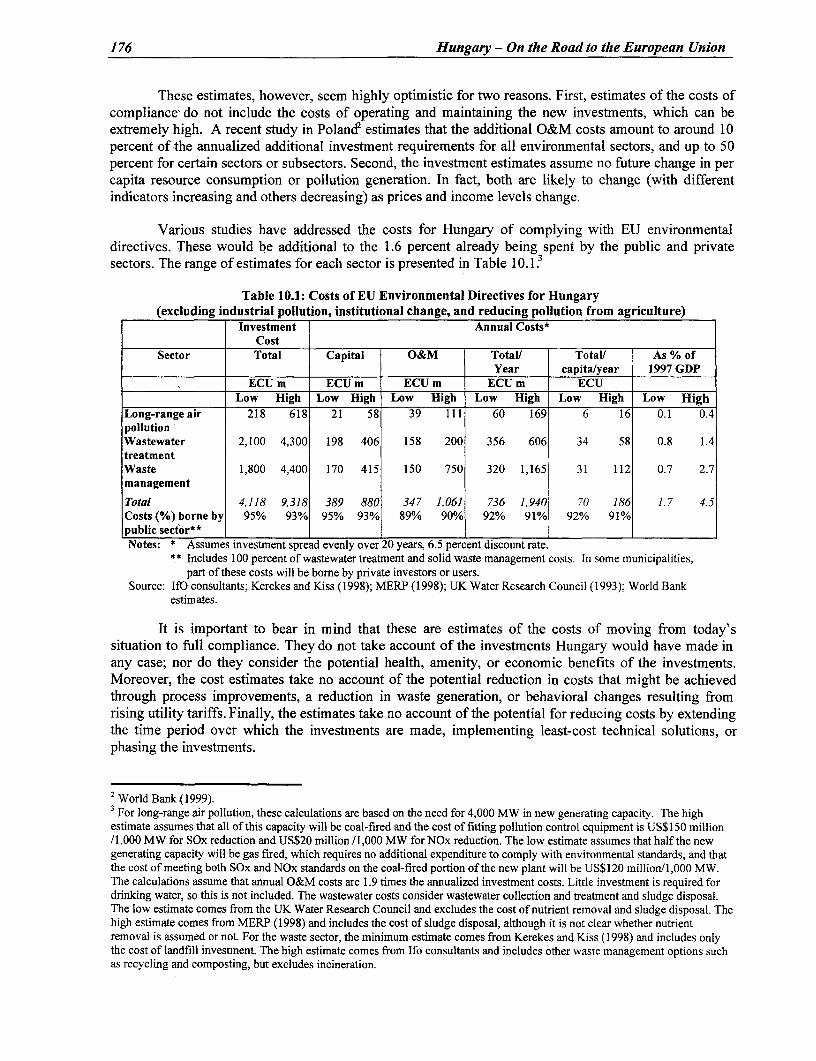
176 Hungary - On the Road to the European Union
These estimates, however, seem highly optimistic for two reasons. First, estimates of the costs ofcompliance' do not include the costs of operating and maintaining the new investments, which can beextremely high. A recent study in Poland2 estimates that the additional O&M costs amount to around 10percent of the annualized additional investment requirements for all environmental sectors, and up to 50percent for certain sectors or subsectors. Second, the investment estimates assume no future change in percapita resource consumption or pollution generation. In fact, both are likely to change (with differentindicators increasing and others decreasing) as prices and income levels change.
Various studies have addressed the costs for Hungary of complying with EU environmentaldirectives. These would be additional to the 1.6 percent already being spent by the public and privatesectors. The range of estimates for each sector is presented in Table 10.1 .3
Table 10.1: Costs of EU Environmental Directives for Hungary(excluding industrial pollution, institutional change, and reducing pollution from agriculture)
Investment Annual Costs*Cost
Sector Total Capital O&M Total/ Total/ As % ofYear capita/year 1997 GDP
ECU m ECU m ECU m ECU m ECULow High Low High Low High Low High Low High Low High
Long-range air 218 618 21 58 39 111 60 169 6 16 0.1 0.4pollutionWastewater 2,100 4,300 198 406 158 200 356 606 34 58 0.8 1.4treatmentWaste 1,800 4,400 170 415 150 750 320 1,165 31 112 0.7 2.7managementTotal 4,118 9,318 389 880 347 1,061 736 1,940 70 186 1.7 4.5Costs (%) borne by 95% 93% 95% 93% 89% 90% 92% 91% 92% 91%public sector**Notes: * Assumes investment spread evenly over 20 years, 6.5 percent discount rate.
** Includes 100 percent of wastewater treatment and solid waste management costs. In some municipalities,part of these costs will be bome by private investors or users.
Source: IfO consultants; Kerekes and Kiss (1998); MERP (1998); UK Water Research Council (1993); World Bankestimates.
It is important to bear in mind that these are estimates of the costs of moving from today'ssituation to full compliance. They do not take account of the investments Hungary would have made inany case; nor do they consider the potential health, amenity, or economic benefits of the investments.Moreover, the cost estimates take no account of the potential reduction in costs that might be achievedthrough process improvements, a reduction in waste generation, or behavioral changes resulting fromrising utility tariffs. Finally, the estimates take no account of the potential for reducing costs by extendingthe time period over which the investments are made, implementing least-cost technical solutions, orphasing the investments.
2 World Bank(1999).3For long-range air pollution, these calculations are based on the need for 4,000 MW in new generating capacity. The highestimate assumes that all of this capacity will be coal-fired and the cost of fitting pollution control equipment is US$150 million/1,000 MW for SOx reduction and US$20 million /1,000 MW for NOx reduction. The low estimate assumes that half the newgenerating capacity will be gas fired, which requires no additional expenditure to comply with environmental standards, and thatthe cost of meeting both SOx and NOx standards on the coal-fired portion of the new plant will be US$120 million/l,000 MW.The calculations assume that annual O&M costs are 1.9 times the annualized investment costs. Little investment is required fordrinking water, so this is not included. The wastewater costs consider wastewater collection and treatment and sludge disposal.The low estimate comes from the UK Water Research Council and excludes the cost of nutrient removal and sludge disposal. Thehigh estimate comes from MERP (1998) and includes the cost of sludge disposal, although it is not clear whether nutrientremoval is assumed or not. For the waste sector, the minimum estimate comes from Kerekes and Kiss (1998) and includes onlythe cost of landfill investment. The high estimate comes from Ifo consultants and includes other waste management options suchas recycling and composting, but excludes incineration.

Chapter 10. Environment 177
DIRECTIVE COSTS FALLING EXCLUSIVELY ON THE PUBLIC SECTOR
Most EU regulations require changes in the structure, procedures, and activities of nationalgovernment institutions; indeed, many directives require only changes of this nature. The government'scapacity to set reasonable policies, enforce the laws, and monitor progress are vital to the complianceeffort in all environmental sectors, and further progress is needed in these areas. The EC's 1997 Opinionon Hungary's application for EU membership found its institutional arrangements for environmentalprotection to be not yet adequate.
Better coordination is required among all the institutions involved, both national and regional.The environmental authorities are fragmented, which makes it difficult even to regulate issues that coveronly one environmental medium. Moreover, environmental policy is moving toward regulating theenvironment across media, which will require realigning the roles of various agencies, greater financialand human resources, and a strong government commitment.
The direct financial costs of institutional approximation are unlikely to be great. Nonetheless,experience in other countries suggests that institutional changes require substantial and sustained effort,and that building necessary capacity can take many years.
DIRECTIVE COSTS FALLING PREDOMINANTLY ON THE PRIVATE SECTOR
The Internal Market
The 1995 EU White Paper on accession identifies the key measures relevant to the internalmarket that accession countries must adopt before joining the EU. It covers legislation affecting the freemovement of goods and services, which in the environmental field are chemical substances, wastemanagement, and abatement of air pollution (including fuel composition) and radioactive contamination.
Hungary must adopt all of the White Paper measures by the time of accession, which leaves littlescope for strategic choice. Formal adoption of White Paper measures relating to specific products, such aschemicals, carries little financial cost for the public sector, apart from the necessary efforts to upgradeinstitutions. On the whole, producers and users of those products are likely to welcome the changes, sincethey will ease their access to the internal EU market. The major difficulty, however, will come incomplying with waste legislation, which will be addressed below.
Industrial Pollution
EU legislative requirements. The EU has a large volume of legislation on the control ofindustrial pollution. The most significant for Hungary is the 1996 Directive on Integrated PollutionPrevention and Control (IPPC), which aims for integrated management of industrial emissions to theenvironment as a whole, rather than to single medium, such as air or water. The IPPC regulates severalcategories of industry, including energy, production and processing of metals, minerals, chemicals, wastemanagement, paper and pulp production, textiles, food processing, and livestock operations. At present,with a few exceptions, the IPPC directive does not affect SMEs, and this is not likely to change in thenear future.
Compliance issues. Of Hungary's 50,000 point sources of industrial pollution, 400 to 500 areexpected to fall within the scope of the country's new legislation to implement the IPPC. The HungarianNational Environment Program identifies "processing industry"-which includes chemicals, engineering,food manufacturing and light industry-as the major problem sectors. The most important of these, in
178 Hungary - On the Road to the European Union
terms of contribution to economic value added, are (in descending order) the engineering industry, thefood manufacturing industry, and the chemical sector.
Experience in EU member states suggests that, provided the legislation allows sufficientflexibility in terms of the method of abatement and the timeframe for makinginvestments, private sectorindustry can absorb the costs of compliance within the normal investment cycle.
The main concern for the future, however, is not that companies will have difficulty complyingwith the IPPC, since most them are large, principally foreign-owned enterprises. Rather, the concern isthat other environmental legislation and improved enforcement will place a burden on small and medium-sized enterprises.
Long-Range Air Pollution
EU legislative requirements. Legislation on emissions from stationary sources-which isrelevant to the control of long-range air pollution-is found in the 1988 Large Combustion PlantDirective and the Directives on Air Pollution. This legislation addresses pollution from new and existingmunicipal waste incineration plants. The Large Combustion Plant Directive applies to power plants with athermal input of 50MW or more; its goal is to reduce emissions of SO2, Nox, and particulates through acombination of national targets and specific limits for individual plants.The EU has plans to tighten thestandards, which will require substantial additional investment and greatly increase operating costs.
Compliance issues and costs. The former state power monopoly, MVM Rt, now handles thenational grid, strategic planning, dispatching, wholesale trade, and import-export. This makes the foreignenergy companies, which now dominate the power generation market, responsible for compliance.Around one-third of existing generating capacity is slated for replacement or refurbishment under currentHungarian policies. If electricity demand rises by some 2 percent per year over the next 15 years, theexpected net new generating capacity requirement will be some 4,000MW by 2010.4
The total investment required for Hungary to meet EU standards for new power generationcapacity built after 2000 is estimated at least ECU 218 million-if half of the capacity is gas and half iscoal, and if technology costs fall as predicted. If, by contrast, all new capacity is coal fired and iftechnology costs remain as they are at present, then costs could rise to approximately ECU 618 million.These estimates use coefficients of costs that have been seen in other Central European countries.Operation and maintenance costs are high-an average of 1.9 times the annualized investment costs.
Alternative estimates by the Ministry of Energy (MoE) show the total cost of meeting EUrequirements for stationary sources of air pollution, up to year 2006, as ECU 1.2 billion. This, however,includes costs associated with establishing an energy trading system, the gradual introduction of co-generation, and the IPPC requirement for BAT in the non-power sector. Kerekes and Kiss' estimate thecompliance costs for the energy sector at ECU 1 billion.
Urban Air Quality
EU legislative requirements. The 1996 Ambient Air Quality Assessment and ManagementDirective is designed to provide a comprehensive strategy for the management of air quality inmember states by linking controls on emissions from various sources with improved air quality.
4This forecast does not take into account potential shifts to renewable energy or the impact of future demand-side managementmeasures.5Kerekes and Kiss (1998).
Chapter 10. Environment 179
It applies to cities of 250,000 or more, densely populated areas, and especially polluted areas. Itwill certainly apply to Budapest, but probably not to any other city.6
Compliance issues. Air quality is a problem in Hungary, particularly in Budapest, although notnearly on the same scale as in many other Central European countries. Several towns and cities sufferfrom poor air quality due to oxides of nitrogen and particulate concentrations, and from summer groundlevel ozone exceeding safe limits on a significant number of occasions during the year.
Emissions from motor vehicle transport appear to be a major contributing factor in air pollutioninBudapest. After declining in the late 1980s and early 1990s, such emissions have increased sharply inrecent years. Transport now contributes 56 percent of national carbon monoxide emissions and 50 percent
7of nitrous oxide emissions.
As the effects of implementing current policies become apparent, as compliance with singlemarket requirements for vehicle and fuel standards progresses, and as car and bus fleets are modernized,Hungary's vehicle emissions will fall. This should significantly reduce air pollution in Budapest in theshort term, although this will be offset by increases in the number of passenger kilometers.
DIRECTIVE COSTS FALLING ON BOTH PUBLIC AND PRIVATE SECTOR BODIES
Wastewater Colection and Treatment
EU legislative requirements. Water resource management is one of the most comprehensivelyregulated areas of EU environmental legislation. Historically, EU directives have established waterquality standards for certain classes of water, as well as emission limit values for individual substances.This so-called "combined approach" is to be consolidated in the proposed Framework Directive for WaterPolicy, first issued by the European Commission in 1997, and which member states are still negotiating.
By far the largest costs of implementing the environmental acquis are associated with the UrbanWastewater Treatment (UWWT) Directive. This specifies that all settlements above 2,000 personequivalent (p.e.) be connected to the sewerage system and that sewage should be treated to specific levels,depending on the characteristics of the receiving water.8
Hungarian baseline. Through the 1990s, Hungary has made significant progress in improvingits water infrastructure. It has also invested heavily in the collection and treatment of municipalwastewater, and plans investments of almost ECU 3 billion. Coverage is, however, still far below thatrequired for compliance with EU standards. Table 10.2 shows the coverage of 81 largest wastewatertreatment companies.
6Budapest's population was 2.016 million in 1994. The other largest cities are Debrecen (218,000), Miskolc (190,000), Szegedt180,000), Pecs (173,000), and Gy6r (131,000).
All statistics in this section are from Zegras and Hook (1995).8 This paper refers to water supply, wastewater collection, and treatment as the water sector. As used here, the water sector doesnot include issues of water resources management.
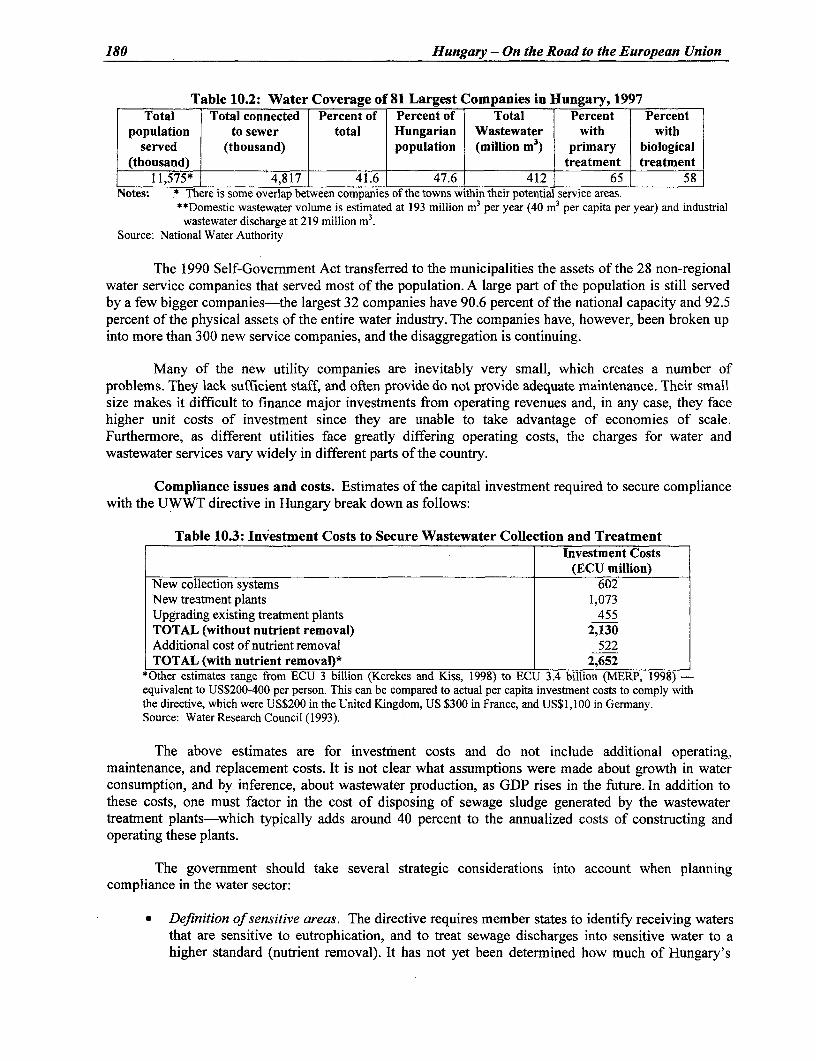
180 Hungary - On the Road to the European Union
Table 10.2: Water Coverage of 81 Largest Companies in Hungary, 1997Total Total connected Percent of Percent of Total Percent Percent
population to sewer total Hungarian Wastewater with withserved (thousand) population (million m3) primary biological
(thousand) l treatment treatment
11,575* 4,817 41.6 47.6 412 65 58Notes: * There is some overlap between companies of the towns within their potential service areas.
**Domestic wastewater volume is estimated at 193 million m3 per year (40 m3 per capita per year) and industrialwastewater discharge at 219 million m3 .
Source: National Water Authority
The 1990 Self-Government Act transferred to the municipalities the assets of the 28 non-regionalwater service companies that served most of the population. A large part of the population is still servedby a few bigger companies-the largest 32 companies have 90.6 percent of the national capacity and 92.5percent of the physical assets of the entire water industry. The companies have, however, been broken upinto more than 300 new service companies, and the disaggregation is continuing.
Many of the new utility companies are inevitably very small, which creates a number ofproblems. They lack sufficient staff, and often provide do not provide adequate maintenance. Their smallsize makes it difficult to finance major investments from operating revenues and, in any case, they facehigher unit costs of investment since they are unable to take advantage of economies of scale.Furthermore, as different utilities face greatly differing operating costs, the charges for water andwastewater services vary widely in different parts of the country.
Compliance issues and costs. Estimates of the capital investment required to secure compliancewith the UWWT directive in Hungary break down as follows:
Table 10.3: Investment Costs to Secure Wastewater Collection and TreatmentInvestment Costs
(ECU million)New collection systems 602New treatment plants 1,073Upgrading existing treatment plants 455TOTAL (without nutrient removal) 2,130Additional cost of nutrient removal 522TOTAL (with nutrient removal)* 2,652
*Other estimates range from ECU 3 billion (Kerekes and Kiss, 1998) to ECU 3.4 billion (MERP, 1998) -equivalent to US$200-400 per person. This can be compared to actual per capita investment costs to comply withthe directive, which were US$200 in the United Kingdom, US $300 in France, and US$1,100 in Germany.Source: Water Research Council (1993).
The above estimates are for investment costs and do not include additional operating,maintenance, and replacement costs. It is not clear what assumptions were made about growth in waterconsumption, and by inference, about wastewater production, as GDP rises in the future. In addition tothese costs, one must factor in the cost of disposing of sewage sludge generated by the wastewatertreatment plants-which typically adds around 40 percent to the annualized costs of constructing andoperating these plants.
The government should take several strategic considerations into account when planningcompliance in the water sector:
* Definition of sensitive areas. The directive requires member states to identify receiving watersthat are sensitive to eutrophication, and to treat sewage discharges into sensitive water to ahigher standard (nutrient removal). It has not yet been determined how much of Hungary's
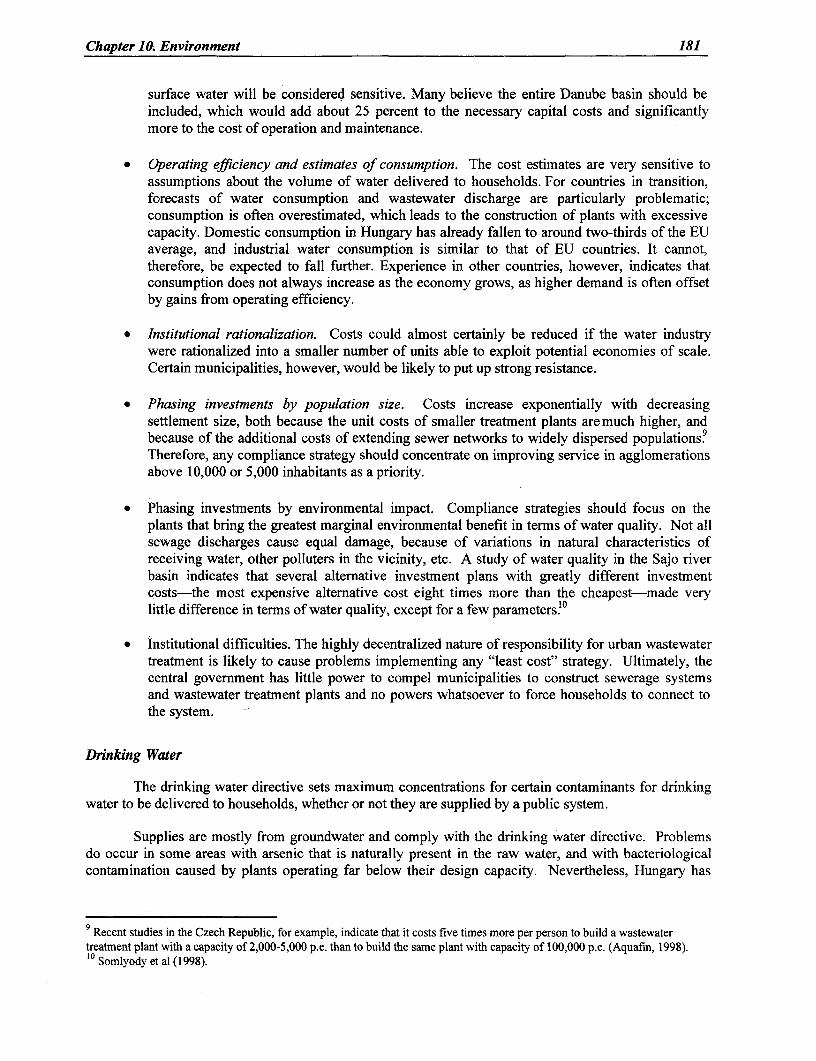
Chapter 10. Environment 181
surface water will be considered sensitive. Many believe the entire Danube basin should beincluded, which would add about 25 percent to the necessary capital costs and significantlymore to the cost of operation and maintenance.
* Operating efficiency and estimates of consumption. The cost estimates are very sensitive toassumptions about the volume of water delivered to households. For countries in transition,forecasts of water consumption and wastewater discharge are particularly problematic;consumption is often overestimated, which leads to the construction of plants with excessivecapacity. Domestic consumption in Hungary has already fallen to around two-thirds of the EUaverage, and industrial water consumption is similar to that of EU countries. It cannot,therefore, be expected to fall further. Experience in other countries, however, indicates thatconsumption does not always increase as the economy grows, as higher demand is often offsetby gains from operating efficiency.
* Institutional rationalization. Costs could almost certainly be reduced if the water industrywere rationalized into a smaller number of units able to exploit potential economies of scale.Certain municipalities, however, would be likely to put up strong resistance.
* Phasing investments by population size. Costs increase exponentially with decreasingsettlement size, both because the unit costs of smaller treatment plants aremuch higher, andbecause of the additional costs of extending sewer networks to widely dispersed populations9Therefore, any compliance strategy should concentrate on improving service in agglomerationsabove 10,000 or 5,000 inhabitants as a priority.
* Phasing investments by environmental impact. Compliance strategies should focus on theplants that bring the greatest marginal environmental benefit in terms of water quality. Not allsewage discharges cause equal damage, because of variations in natural characteristics ofreceiving water, other polluters in the vicinity, etc. A study of water quality in the Sajo riverbasin indicates that several alternative investment plans with greatly different investmnentcosts-the most expensive alternative cost eight times more than the cheapest-made verylittle difference in terms of water quality, except for a few parameters.°
* Institutional difficulties. The highly decentralized nature of responsibility for urban wastewatertreatment is likely to cause problems implementing any "least cost" strategy. Ultimately, thecentral government has little power to compel municipalities to construct sewerage systemsand wastewater treatment plants and no powers whatsoever to force households to connect tothe system.
Drinking Water
The drinking water directive sets maximum concentrations for certain contaminants for drinkingwater to be delivered to households, whether or not they are supplied by a public system.
Supplies are mostly from groundwater and comply with the drinking water directive. Problemsdo occur in some areas with arsenic that is naturally present in the raw water, and with bacteriologicalcontamination caused by plants operating far below their design capacity. Nevertheless, Hungary has
9Recent studies in the Czech Republic, for example, indicate that it costs five times more per person to build a wastewatertreatment plant with a capacity of 2,000-5,000 p.e. than to build the same plant with capacity of 100,000 p.e. (Aquafin, 1998).10 Somlyody et al (1998).
182 Hungary - On the Road to the European Union
recently invested heavily in the drinking water supply system and it is unlikely that much new investmentwill be required to achieve compliance with the drinking water directive.
Waste Management
EU legislative requirements. The 1975 Framework Directive on Waste, amended in 1991, andthe Hazardous Waste Directive of 1991, set out the EU's waste management policy. The aim is toencourage prevention of waste, and to ensure the proper administrative control of waste and the use ofclean disposal technologies. The key principles in the framework are prevention, polluter pays, andproximity (i.e., waste should be disposed of as close as possible to its source).
In addition to the framework directive, specific directives define the requirements in more detailfor particular products or waste streams-for example, hazardous waste, waste oils, sewage sludge, andpackaging-and for particular activities such as waste movement, incineration, and disposal. A LandfillDirective, proposed in 1997, involves phased reduction in the landfilling of biodegradable waste, and setsstrict standards for landfill construction. Prices for landfill disposal would have to reflect the cost ofcurrent operations as well as site restoration and 50 years of care.
The most challenging aspect of these requirements for Hungary is that waste legislation mustrepresent a coherent whole and be implemented simultaneously. Legislative and administrativeapproximation with the EU is complex enough, but substantive compliance requires that the legislativedefinitions of waste are both clear and workable. In practice, this requires training of personnel, not onlythose from the competent authority but from industry and trade as well. Experience also shows that to besuccessful, legislative action must be accompanied by efforts to raise public awareness.
Compliance issues. Waste management in Hungary is hampered by the absence of acomprehensive waste management act covering all types of waste; and by the lack of a reliableinformation system on waste occurrences and disposal methods. Industrial waste occurrences areunjustifiably high, and inexperience and confusion in waste classification have only aggravated theproblem.
Hungary is considered more advanced than other accession countries in managing its municipalsolid waste (MSW). Collection is now mostly in private sector hands and covers two-thirds of allhouseholds. However, there is rurrently no legal obligation for municipalities to manage municipal wastecollection or disposal. Disposal facilities are inadequate for a number of reasons. There are a largenumber of small, authorized, but not technically adequate municipal landfill sites (2,700), and a largenumber of illegal dumps. Twenty to 30 percent of landfills are dangerously close to inland or groundwater. The country has 66 regional scale landfills, most of them new, but more are needed. In fact, theNational Environment Program 1997 envisages that an additional 100 to 150 regional landfills will berequired over the next 10 years, at an estimated cost of HIUF 100 billion (ECU 427 million).
A lack of good natural sites, local resistance, and the absence of a nationwide authority tocoordinate development plans hamper the construction of regional landfill sites. In addition, low tariffsfor MSW collection and disposal, and the fact that waste companies must recover the tariffs directly fromhouseholds and industrial waste generators, has rendered investment unattractive to private developers.
There are a number of uncertainties surrounding any estimate of the likely costs of complyingwith EU waste management requirements. First, estimates depend on assumptions regarding the likelyfuture level of waste generation. Although MSW occurrences per capita are at the same level as the EUaverage, Hungary's MSW occurrences per uni. of GDP are five times the EU average, and industrialwaste occurrences per unit of GDP are twice the EU average. This suggests that there is considerable

Chapter 10. Environment 183
scope for improvement."' Capital expenditure on new disposal facilities is certain to be accompanied byhigher waste disposal tariffs, which will provide an incentive for waste minimization. On the other hand,as consumer incomes rise, the amount of waste generated could also rise.
Second, costs will depend on the scale of facilities provided, their technical characteristics, andthe siting of those facilities. There is likely to be potential for considerable economies of scale in landfillconstruction, and more particularly in operational costs, which are unlikely to be realized by currentarrangements. In addition, costs can vary considerably between urban and rural areas. These factorsaccount for a very broad range of estimates for landfill investment and operational costs per ton.
The only estimates on the operational costs of landfill come from a relatively dated study thatgives cost factors of ECU 20 per ton for investment costs and ECU 3 per ton for operational costs.12
Based on these figures and the range of capacity projections detailed above, the cumulative costs of theprogram, including investment and operation expenditures, could total between ECU 1.1 billion and ECU2.3 billion. Another study'3 estimates the investment cost of complying with EU waste managementlegislation at between ECU 1.8 billion and ECU 2.3 billion.
IMPLICATIONS OF THE INVESTMENT REQUIREMENTS
Implications for the Public Sector
Most public sector investment is required in sectors-water supply, wastewater treatment, andwaste disposal-that are the responsibility of municipalities. In water, operational responsibilities arefulfilled in a variety of ways, including contracting out to companies with a wide range of legal forms andstructures. All but the largest municipalities own the water companies and, by law, must own the physicalassets. In waste, both collection and disposal are frequently contracted out to private operators.
The way municipalities structure and manage these investments makes an enormous differenceinterms of costs. As mentioned above, economies of scale can be significant, particularly in the watersector. Furthermore, local environmental benefits will vary. It is therefore crucial that central governmentpolicies and financial incentives encourage municipalities to take advantage of economies of scale, and tomake the highest (national) priority investments.
Although the central government cannot, and should not, control municipal decision-making, itdoes have mechanisms for influencing the process indirectly. Currently, several funds provide grants formunicipal investment in the water and waste sectors, and pre-accession funds from the EU are alsobecoming available. These funds are the ideal mechanism for the central govemment to influence the waymunicipalities invest. For example, there is a preference in the Central Environment Fund grants systemfor proposals from groups of municipalities working together. This mechanism probably needs to bestrengthened. Grant financing from the European Union for accession-related environmental investmentscould be used to reinforce this mechanism.
Although current levels of government subsidy for capital investment are significant (up to 85percent in the water sector),14 O&M costs are high, and municipalities making new investments still need
1 OECD/MERP data.12 IFO (1994).13 Kerekes and Kiss (1998).14 The current system is not effective, since any investment is eligible for grants. More selective eligibility criteria could yieldmuch faster environmental improvements for the same level of financial support.

184 Hungary - On the Road to the European Union
to increase their tariffs considerably. In the future, an increasing proportion of the investment costs willhave to come from utilities' own cash flows from operations.
Implications for Utility Tariffs
The affordability of utility tariffs is likely to be a key constraint on the required upgrading ofwastewater, waste disposal, and energy generating capacity. Hungary's average household utility bills arealready high by international and by Central European standards. Water, wastewater, electricity, and solidwaste currently account for 5.1 percent of household consumption when the bill for drinking water isincluded.'5 A similar estimate from 1990 for the United Kingdom (before investments associated withEU environmental directives had begun to take hold, but when infrastructure coverage was significantlyhigher than currently in Hungary) was 3 percent. To further the comparison, water, electricity, and solidwaste bills accounted for 4 percent of household consumption in Poland in 1996.16
Table 10.4, which is intended for illustrative purposes only, shows possible increases in Hungary'shousehold bills for wastewater, solid waste, and electricity services as a result of alternative investmentscenarios. The figures in the table are based on the mid-range estimates for investment and O&M costspresented in Table 10.3. As percentages of household consumption, estimates do not include the bill fordrinking water. When drinking water is excluded, utility bills currently account for 3.9 percent ofhousehold consumption.
Resident;al electricity prices have historically been heavily subsidized; despite price increases of10 to 25 percent over the past few years, they have not yet reached market levels. Regular pricemodifications are expected to result in price rises of 4 percent per quarter. Average tariffs for the firstquarter of 1998 were set at HUF 12.82/kWh for residential and HUF 11.5/kWh for non-residentialcustomers.
15 For example, the combined prices of water and sewerage services in state-owned regional companies range between US$1.0/m3
(Dunamenti), which is similar to typical levels found elsewhere in Europe, including Central Europe, to US$2. I/m3 (Dunantuli), whichis high (GWR, 1998). Average annual household consumption is estimated at HUF 991,000, or ECU4,220, for 1996 (Hungary inFigures, website).16 World Bank owned estimates, and World Bank (1998a).

Chapter 10. Environment 185
Table 10.4: Household Utility Bills Under Alternative Investment ScenariosAnnualpercentage change, averaged over life of investment program
Household Bill Share of Household Consumption*Scenario A B C A B CWastewater 3.2 6.5 6.5 0.2 3.4 3.4Solid Waste 6.1 12.5 12.5 3.0 9.2 9.2Electricity 1.1 2.3 2.3 -1.8 -0.7 -0.7As a percentage of household consumption**
._______________ After 5 years After 10 yearsScenario B C A B CWastewater 1.1 1.3 0.8 1.1 1.4 1.1Solid Waste 0.7 1.0 0.5 0.8 1.3 0.8Electricity 2.1 2.2 2.0 1.9 2.2 1.9
Total 3.9 4.5 3.3 3.8 4.9 3.8Notes: Scenario A: 20-year investment program.
Scenario B: 10-year investment program.Scenario C: 10-year investment program, delayed by 5 years.
*Adjusted for 3 percent average real household income and consumption growth.Source: World Bank staff estimates.
Energy tariffs. We estimate that real (inflation adjusted) household electricity bills will have torise by 1.1 percent per annum over a 20-year program or by 2.3 percent for a 1 0-year program to meet theadditional capital and O&M requirements of EU directives. If real household income and consumptiongrow at 3 percent a year, household electricity bills will fall to 1.9 percent of household consumption after10 years in the course of a 20-year investment program. The bill will amount to 2.2 percent of householdconsumption in the course of a 10-year investment program (roughly similar to the current 2.3 percentlevel). These estimates are based on an investment cost of ECU 420 million, and assume that consumersbear all of the burden of financing the investment.
Water tariffs. We estimate that household wastewater bills (for those connected to the system)will increase in real terms by 3.2 percent per year over the course of a 20-year program, or 6.5 percent fora 10-year program. Again, if household income grows at an annual rate of 3 percent, then householdwastewater bills will rise to 1.1 percent of household consumption after 10 years in the course of a 20-year program; bills will rise to 1.4 percent at the end of the 10-year program, from the current level of 1.0percent. Furthermore, the hypothetical average domestic wastewater tariff is expected to rise froin thecurrent level of HUF 105 per m3 to HUF 207 per m3 at the end of a 20-year investment program. Thesefigures are based on an estimated investment program of ECU 3.2 billion, and assume that grant financingwill cover about 60 percent of the investment cost and that the rest of the investment is shared betweendomestic and industrial consumers (respectively, 47 and 53 percent).
As a proportion of household consumption, water and wastewater bills are already high incomparison to Western Europe and to elsewhere in Central Europe.'7 Many municipalities are alreadyseeing resistance to further price increases, even under the current highly subsidized conditions forinvestment. In some towns, households have accepted an incentive to connect to the sewer. Their reactionto the first bill, however, is often to revert to other sources, usually the well, thereby bypassing the meteron which charges are based. The utility may also be forced to operate its drinking water treatment plantbelow designed levels, which increases its costs. Newly connected households compound the problem bycontinuing to discharge their wastewater into the sewer, thus increasing costs for the utility.
17 The water and wastewater bills account for approximately twice the proportion of total household spending in Hungary as inPoland, for example (World Bank estimates; Hungary in Figures; and Government of Poland, 1996).

186 Hungary - On the Road to the European Union
Household waste tariffs. Whether the investment is financed by the private or the public sector,it is likely that households and other waste generators will face increasing tariffs for waste collection anddisposal as the waste infrastructure is extended and upgraded.
There is currently a wide range of waste fees charged to residents for municipal solid wastecollection and disposal; i.e., from HUF 460 to HUF 3,000 per capita per year. The highest charges areapplied in areas where the landfill site is constructed and operated to high technical standards. Thisprovides an approximate estimate of the likely average charges if regional scale landfill sites were to beconstructed.
Based on an estimated investment program of ECU 3.1 billion, and assuming that grant financingcovers about 60 percent of the investment cost, with the rest of the investment shared between domesticconsumers (40 percent) and industrial consumers (60 percent), the implied increase in real averagehousehold waste disposal bills would be 6.1 percent per year over the course of a 20-year program, and12.5 percent per year for a 10-year program. If household income grows at an annual rate of 3 percent,then household waste disposal charges will rise to 0.8 percent of household consumption after 10 years inthe case of a 20-year program, or to 1.3 percent at the end of a 10-year program, from the current level of0.6 percent.
The hypothetical average residential waste disposal per capita fee is expected to rise from HUF2,400 to HUF 8,100 at the end of a 20-year investment program.
RECOMMENDATIONS FOR AN IMPLEMENTATION STRATEGY
The backbone of any successful strategy will be to strengthen institutional capacity. This willbe fundamental to developing policies that bring the greatest environmental benefits for a givenexpenditure or a level of effort, while ensuring the wise use of public or external funds and reducingdistortions elsewhere in the economy. Strengthening institutional capacity will be particularly importantsince many environmental issues cut across sectoral areas of responsibility and different levels ofgovernment. Furthermore, building the capacity to enforce laws and to set incentives for improvingcompliance will be essential to complying with many of the regulations that affect the private sector.
It will be important to negotiate carefully. Hungary will have to ensure that most large sourcesof pollution comply with all standards. For many types of pollution abatement, particularly those thatinvolve highest levels of investment, the costs per unit of environmental improvementwill rise steeply.Many of the directives have clauses that allow exemptions where environmental benefits are low or wherecosts are excessive, e.g., applying the Urban Wastewater Treatment Directive in small towns. It will beimportant to negotiate either derogations where it is agreed that there is no environmental benefit, or verylong transition periods for compliance with the most costly aspects of the directives for the smaller or lessenvironmentally significant sources of pollution.
The Government should use public and EU subsidies to direct investments toward strategicgoals, particularly in the area of wastewater collection and treatment, and municipal solid waste.This hasvarious aspects. First, there is large scope for improving the efficiency of utilities, which will reduce theupward pressure on tariffs. Eligibility criteria for grants could be used to encourage utilities to improvetheir performance.
In addition, limiting the proportion of grant funding, and thus requiring municipalities tocontribute significantly from their own resources, will give municipalities an incentive to operate theirutilities more efficiently. Technical assistance from the EU and other sources could also be used to helpless efficient utilities improve their performance.
Chapter 10. Environment 187
Reducing pollution from the largest settlements will have the largest environmental impact. It willtherefore be important to focus on the largest cities first, even if smaller towns propose promisingprojects.
The costs of investments can vary dramatically, depending on some of the basic designparameters. For example, it will be important to ensure that wastewater treatment plants are large enoughto take advantage of substantial economies of scale, traded off against the increased sewerage costs, eventhough multi-municipal cooperation may increase the institutional difficulties of overseeing theinvestments.
Finally, it will be important to remember that not all investments of the same size carry thesame environmental benefit. Benefits depend on the conditions in the receiving environment.Developing detailed plans so that authorities know which investments will have the greatestenvironmental impact can help to direct investments strategically toward full compliance with EUenvironmental requirements.

188
REFERENCES
AQUAFIN Consultants (1998). "Pre-Accession Planning to the EU in the Water Sector," Backgroundinformation. Basic Introduction to Cost Analyses and Cost Relationships for Wastewater Treatment, SludgeDisposal Upgrading of Treatrnent Plants and Sewerage.
Baldwin, J. Francois and R. Portes (1997), "The Costs and Benefits of Eastern Enlargement: Impact on theEU and Central Europe," Economic Policy: A European Forum, No. 24, 127-76, April.
Baldwin, R. and E. Seghezza (1996), Growth and European Integration: Towards an EmpiricalAssessment, Working Paper No. 1393, Centre for Economic Policy Research.
BarabAs, Hamecz, and Nemenyi (1998) "Fiscal Deficit and Public Debt During the Transition," in Bokrosand Dethier, eds. (1998), Public Finance and Debt During the Transition: The Experience of Hungary,Washington D. C.: World Bank.
Barbone L. and J. Zalduendo (1997), EUAccession of Central and Eastern Europe: Bridging the IncomeGap, Po;icy Research Working Paper No.1721, World Bank.
Barro, R. (1997), Determinants of Economic Growth, A Cross-Country Empirical Study, Carnbridge,Massachusetts: MIT Press.
Barro, R. and X. Sala-i-Martin (1995), Economic Growth, New York: McGraw Hill Inc.
1BASYS-IGES (1998), Financial Analysis for the Future Restructuring of Health Funding - Stage I, June;mimeo.
Blejer and Cheasty (1991), "Analytical and Methodological Issues in the Measurement of Fiscal Deficits,"Journal of Economic Literature (December).
Boeri, T., M. Burda, and J. Kollo (1998), Mediating the Transition: Labour Markets in Central andEastern Europe, London: CEPR
Bokros and Dethier, eds. (1998), Public Finance and Debt During the Transition: The Experience ofHungary, Washington D. C.: World Bank.
Borjas, George (1998), "Economic Research on the Determinants of Immigration: Lesson for the EuropeanUnion," World Bank mimeo.
Borszeki, Zsuzsa (1998), "A Study of the Hungarian Industry and the Challenge of EU Accession,"mimeo.
Central Statistical Office (CSO) (1996). The data origin from a cross-sectional household budget survey ofthe CSO of Poland.
Csaba, Laszl6 (1996), Hungary's Trade Policy and Trade Regime: from Neoprotectionism to Liberalism orVice Versa? Discussion Paper 39, Kopint-Datorg, Budapest (July), p. 16.
Csaba, Laszl6 (1998), "Privatization and Restructuring: the Hungarian Corporate Sector Reform in aComparative Perspective" mimeo.
Cukierman and Mortensen (1986), Monetary Assets and Inflation-Induced Distortions in the NationalAccounts, Working Paper No. 15, Directorate General for Economic and Financial Affairs, EuropeanEconomic Community.

189
EDC (1997). Compliance Costingfor Approximation of EU Environmental Legislation in the CEEC. FinalReport, May.
Eisner (1989), "Divergences in Measurement and Theory and Some Implications for Public Policy,"American Economic Review (March).
.EU-PHARE (1996). Status Report on Legislative and Institutional Approximation in Hungary.Environmental Management and Law Association, Budapest.
Fazekas. K., G. Kertesi, and J. K6116 (1997), "Regional Labour Market Differentials during the Transition,"mimeo, Budapest, (May).-
Global Development Finance, The World Bank, Washington D.C., 1998.
Economic Survey of Europe 1998 No. 1. United Nations Economic Commission for Europe, New York andGeneva, 1998.
Gray, Cheryl, Sabine Schlorke, and Miklos Szanyi (1996) "Hungary's Bankruptcy Experience, 1992-93"The World Bank Economic Review, Vol.10, No.3 pp. 4 2 5 -50 .
GWR. (1998). Global Water Report. Financial Times Newsletters, Issue 39, January 24, p. 7; Issue 40,February 5, pp. 1-3.
Hamar, Judit. (1998), "FDI and Its Effects on Industrial Structure and External Competitiveness," mimeo,Budapest (June).
Holl6, Long, and Papp (1998), "Health Care Financing in Hungary," paper presented at the Health ReformConference, Visegrad (October).
Hungarian Central Statistical Office (1995-1998), Statistical Yearbook of External Trade, Budapest.
Hungarian Statistical Pocketbook (1994, 1995, 1997).
Hungary in Figures (1998). Internet Version: http://www.ksh.hu/eng/free/e7maor/ftartj.htrnl
IFO (1994). Environmental Standards and Legislation in Western and Eastern Europe: Economic Costsand Benefits of harmonisation, ifo Institut fir Wirtschaftsforschung e.V, Munich.
International Monetary Fund (1998), Hungary: Economic Policies for Sustainable Growth, IMF OccasionalPaper 159 (February).
Jakab and Fidler (1998), "Health Reform Options for Hungary," paper presented at the Health ReformConference, Visegrad (October).
Kerekes and Kiss (1998), Hungary's Green Path to the EU, Summary and Progress Report 1997,Budapest University of Economic Sciences.
Kiss, G. (1998), The Role of General Government in Hungary, NBH Working Paper No. 1998/4.
Kornai, J. (1998), "Az egeszsegugy reformjarol (On the Reform of Health Care). Kozgazdasagi es JogiKonyvkiado, Budapest.
Low, P. and A. Yeats (1992), "Do 'Dirty' Industries Migrate?" in P. Low, ed., International Trade andEnvironment. 159 World Bank Discussion Papers, Washington D.C.: World Bank.
Ministry of Environment and Regional Policy (MERP). Owned estimates.
190
Micklewright, J. and G. Nagy (1994), Flows to andfrom Insured Unemployment in Hungary, EuropeanUniversity Institute Working Papers in Economics, No. 94/41.
Micklewright, J. and G. Nagy (1996), Labor Market Policy and the Unemployed in Hungary, EuropeanEconomic Review; v. 40, pp. 3-5, April, 1998.
Ministry of Environment of the Czech Republic (1998). Pre-Accession Planning to Meet the Requirementsof EU Legislation in the Water Sector. Study fnanced by Danish EPA for the Czech Ministry ofEnvironment. Interim Report, April, 1998.
Ministry of Trade, Industry, and Tourism (1998), Newsletter, Vol. 10, No. 1.
Nagy, G. (1998), "Unemployment Benefits in Hungary," Budapest, mimeo.
NERA (1998). "Hungary Health Care Study" (Draft Report). London. (Study was sponsored byPharmaceutical Partners for Bettter Health Care (PPBH).
OECD (1997), Employment Outlook (July).
Orosz, Ellena, Jakab (1996), "Health Reform Options and Priorities." World Bank Technical Note.September, Budapest.
Palacios, Robert J. and Rocha, Roberto R. (1998), "The Hungarian Pension System in Transition," inBokros and Dethier (eds.) (1998), Public Finance and Debt During the Transition: The Experience ofHungary, Washington D. C.: World Bank.
Phare (1998). "Preliminary Analysis and Structure of Twinning-Meeting with National Contact Points,Institution Building," Brussels (March 3).
Pohl, Gerhard, Robert E. Anderson, Stijn Claessens, and Simeon Djankov (1997), Privatization andRestructuring in Central and Eastern Europe: Evidence and Policy Options, World Bank Technical PaperNo. 368.
Rocha and Saldanha (1993), Fiscal and Quasi-Fiscal Deficits, Nominal and Real, Working Paper No. 919,World Bank.
Sachs, J. and A. Warner (1996), Achieving Rapid Growth in the Transition Economies of Central Europe,Cambridge, Mass.: Harvard Institute for International Development.
Sachs, J. and A. Warner (1995), Economic Reform and the Process of Global Integration, BrookingsPapers on Economic Activity 1, Washington, D. C.: Brookings Institution.
Somly6dy, Buizas, Clement, Koncsos, Licsko, and Simonffy (1998), Strategies for Meeting theRequirements ofEULegislation in the Water Sector: The Sajo River Case, Draft Interim Report,Budapest, July.
Somly6dy, Lazl6 and Peter Shanahan. 1998. Municipal Wastewater Treatment in Central and EasternEurope. A Report for the Environmental Action Programme for Central and Eastern Europe. The WorldBank, Washington DC.
Stepan, ed. (1997), Finanzierungssyteme im Gesundheitswesen, Ein Internationaler Vergleich, ManzscheVerlags -und Universitatsbuchhandlung, Wien 1997.
Strategies for Meeting the Requirements ofEU Legislation in the Water Sector (Hungary): The Saj6 RiverCase. Draft Interim Report, Budapest, July.
191
The Wall Street Journal Europe's Central European Economic Review (July and August 1998, Vol. VI,Number 6). Compiled by Dun & Bradstreet Hungaria Inc.
Toth, Janos Istvan (1998), "Ownership Structure, Business Links and Performance in a TransformingEconomy: The Case of Hungary"; mimeo.
US Department of Energy. 1998. An Energy Overview of the Republic of Hungary. Prepared byDepartment of Energy Office of Fossil Energy. Internet Version: http://www.fe.doe.gov/int/hungary.htrnI
Winston, Clifford (1993), "Economic Deregulation: Days of Reckoning for Microeconomists," Journal ofEconomic Literature, 31, 1263-89.
World Bank (1993), World Development Report 1993.
World Bank (1995), Country Economic Memorandum: Hungary: Structural Reforms for SustainableGrowth, Washington, D. C.
World Bank (1 997a), An International Statistical Survey of Government Employment and Wages,Washington, D. C.
World Bank (1 997b), Enterprise and Financial Sector Adjustment Loan Report, Washington, D. C.
World Bank (1998a), Poland: Complying with EU Environmental Legislation, World Bank DiscussionPaper, Final Report, Washington, D.C.
World Bank (1998b), World Development Report 1998.
WHO (1997), World Health Organization, Health in Europe. and the OECD 1999 Economic Survey onHungary.
WHO (1998), World Health Organization, Health Care System in Transition (draft), Hungary, EuropeanObservatory on Health Care Systems.
WRC - Water Research Council, UK. 1993. Environmental Standards and Legislation in Western andEastern Europe: Towards Harmonisation. Water Sector Case Study. Report for the EBRD and the EU
Zegras, Christopher and Walter Hook (1995), Transportation, Energy, and Environment in Hungary: TheRole of Government Policies and the World Bank, IIEC Publication (April).
192
Statistical Appendix
Section I Social Indicators, Population, and Employment
Table 1.1 Population and Demographic Indicators, 1985-98Table 1.2 Number of Employed Persons by Industries, 1993-97Table 1.3 Participation Rates, Employment Rates and Unemployment Rates for Men by
Age Group, 1992-97Table 1.4 Participation Rates, Employment Rates and Unemployment Rates for Women
by Age Group, 1992-97Table 1.5 Participation Rates, Employment Rates and Unemployment Rates for Both
Sexes by Age Group, 1992-97Table 1.6 Unemployment Rates by Educational Level for Both Sexes, 1992-97Table 1.7 Benefit Coverage of ILO Unemployed in Hungary by Type of Benefit,
1992-97Table 1.8 Unemployment Benefits in Percentage of Average Wages and Minimum
Wages, 1991-97Table 1.9 Unemployment Rates for Budapest and 19 Counties, 1992-97Table 1. IO Monthly Inflow Rates to ILOIOECD Unemployment for Age Group 15-54 in
Quarter 1 of Year by Sex, 1992-97Table 1.11 Yearly Averages of Registered Unemployed, Vacancies and U/V Ratios on
National Level, 1990-97Table 1.12 Employment Protection Legislation
Section II National Accounts
Table 2.1 GDP by Origin in Current Value, by Value Added, 1985-96Table 2.2 GDP by Expenditure in Current Values, 1985-96Table 2.3 Income Generation of Non-Financial Cooperation, 1994-96Table 2.4 Distribution of Household Income, 1991-97
Section m Balance of Payments
Table 3.1 Balance of Payments, 1989-95Table 3.2 Balance of Payments, 1996-98Table 3.3 International Reserves and Other Foreign Assets, 1985-98Table 3.4 Commodity Pattem of Extemal Trade, 1991-97Table 3.5 Value of Extemal Trade by Trading Partners, 1991-97Table 3.6 Share of Hungarian Products in EU External Imports by Major Product
Categories, 1989-96Table 3.7 RCA and Shares in EU Imports of Major Product Groups in Terms of their
Factor Intensities, 1989-95Table 3.8 Bindings and Levels of MFN Tariff Rates After the Uruguay Round
Section IV Public Finance
Table 4.1 General Government Finance Statistics, 1991-97Table 4.2 Local Government Financial Statistics, 1991-97Table 4.3 Tax and Contribution Rates, 1993-2000Table 4.4 Budget Transfers to Agriculture, 1992-98
193
Section V Monetary Statistics
Table 5.1 Banking Survey, 1989-98Table 5.2 Banking Survey - Assets, 1989-98Table 5.3 Banking Survey - Liabilities, 1989-98
Section VI Prices and Wages
Table 6.1 Prices Indices of the Industrial Sector, 1985-98Table 6.2 Labor Income, Wage Bill and Covered Wage Bill, 1995-98
Section VII Enterprise Sector
Table 7.1 FDI Inflows into Hungary, 1991-97Table 7.2 FDI: by Sector 1992 and 1996Table 7.3 Manufacturing Firms' Indicators: 1992 and 1996Table 7.4 Business Links with Other OwnersTable 7.5 International Comparison: Enterprise Losses, 1992-97Table 7.6 Number of Owners, and Whether They Held Majorities 1995Table 7.7 Ownership Links among the Larger Exporting Manufacturing Firms
(1996 and 1997)Table 7.8 Trade Links among Firms with Ownership Links
Section VIII Public Administration
Table 8.1 General Government Employment Annual Average Employment, 1993-97Table 8.2 General Government Employment by Economic Sector, 1997Box 8.3 Remuneration Systems for the Public Service and Civil ServiceTable 8.4 Average Remuneration in the Civil Service and Public Service, 1994-97Table 8.5 Earnings of While Collar Workers by Profession, 1997Table 8.6 Civil Service - Enterprise Earnings Comparison by Rank, 1997Table 8.7 Hungary EU Accession Employment Increase Cost ImplicationsTable 8.8 Training CostsFigure 8.1 Institutional Framework for EU Accession Activities in Hungary
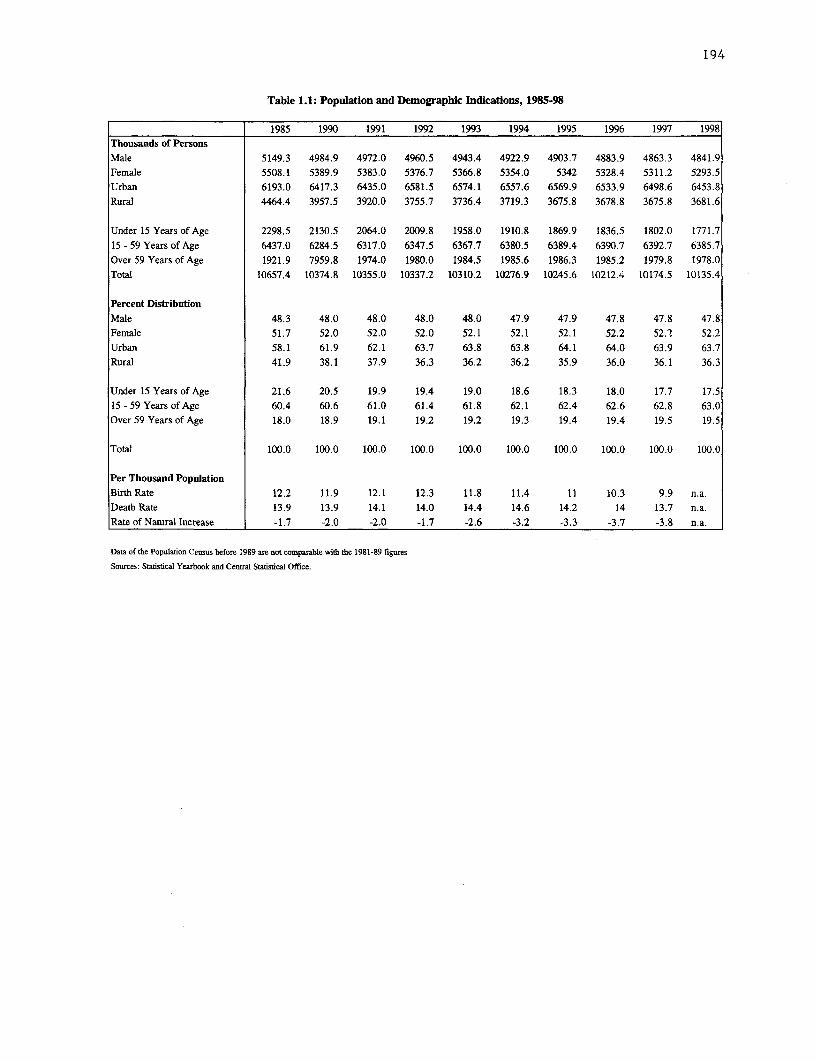
194
Table 1.1: Population and Demographic Indications, 1985-98
1985 1990 1991 1992 1993 1994 1995 1996 1997 1998Thousands of PersonsMale 5149.3 4984.9 4972.0 4960.5 4943.4 4922.9 4903.7 4883.9 4863.3 4841.9Female 5508.1 5389.9 5383.0 5376.7 5366.8 5354.0 5342 5328.4 5311.2 5293.5Urban 6193.0 6417.3 6435.0 6581.5 6574.1 6557.6 6569.9 6533.9 6498.6 6453.8Rural 4464.4 3957.5 3920.0 3755.7 3736.4 3719.3 3675.8 3678.8 3675.8 3681.6
Under 15 Years of Age 2298.5 2130.5 2064.0 2009.8 1958.0 1910.8 1869.9 1836.5 1802.0 1771.715 - 59 Years of Age 6437.0 6284.5 6317.0 6347.5 6367.7 6380.5 6389.4 6390.7 6392.7 6385.7Over 59 Years of Age 1921.9 7959.8 1974.0 1980.0 1984.5 1985.6 1986.3 1985.2 1979.8 1978.0Total 10657.4 10374.8 10355.0 10337.2 10310.2 10276.9 10245.6 10212.4 10174.5 10135.4
Percent DistributionMale 48.3 48.0 48.0 48.0 48.0 47.9 47.9 47.8 47.8 47.8Female 51.7 52.0 52.0 52.0 52.1 52.1 52.1 52.2 52.2 52.2Urban 58.1 61.9 62.1 63.7 63.8 63.8 64.1 64.0 63.9 63.7Rural 41.9 38.1 37.9 36.3 36.2 36.2 35.9 36.0 36.1 36.3
Under 15 Years of Age 21.6 20.5 19.9 19.4 19.0 18.6 18.3 18.0 17.7 17.515 - 59 Years of Age 60.4 60.6 61.0 61.4 61.8 62.1 62.4 62.6 62.8 63.0Over 59 Years of Age 18.0 18.9 19.1 19.2 19.2 19.3 19.4 19.4 19.5 19.5
Total 100.0 100.0 100.0 100.0 100.0 100.0 100.0 100.0 100.0 100.0
Per Thousand PopulationBirthRate 12.2 11.9 12.1 12.3 11.8 11.4 11 10.3 9.9 n.a.Death Rate 13.9 13.9 14.1 14.0 14.4 14.6 14.2 14 13.7 n.a.Rate of Natural Increase -1.7 -2.0 -2.0 -1.7 -2.6 -3.2 -3.3 -3.7 -3.8 n.a.
Data of the Population Census before 1989 are not comparable with the 1981-89 figures
Sources: Statistical Yearbook and Central Statistical Office.
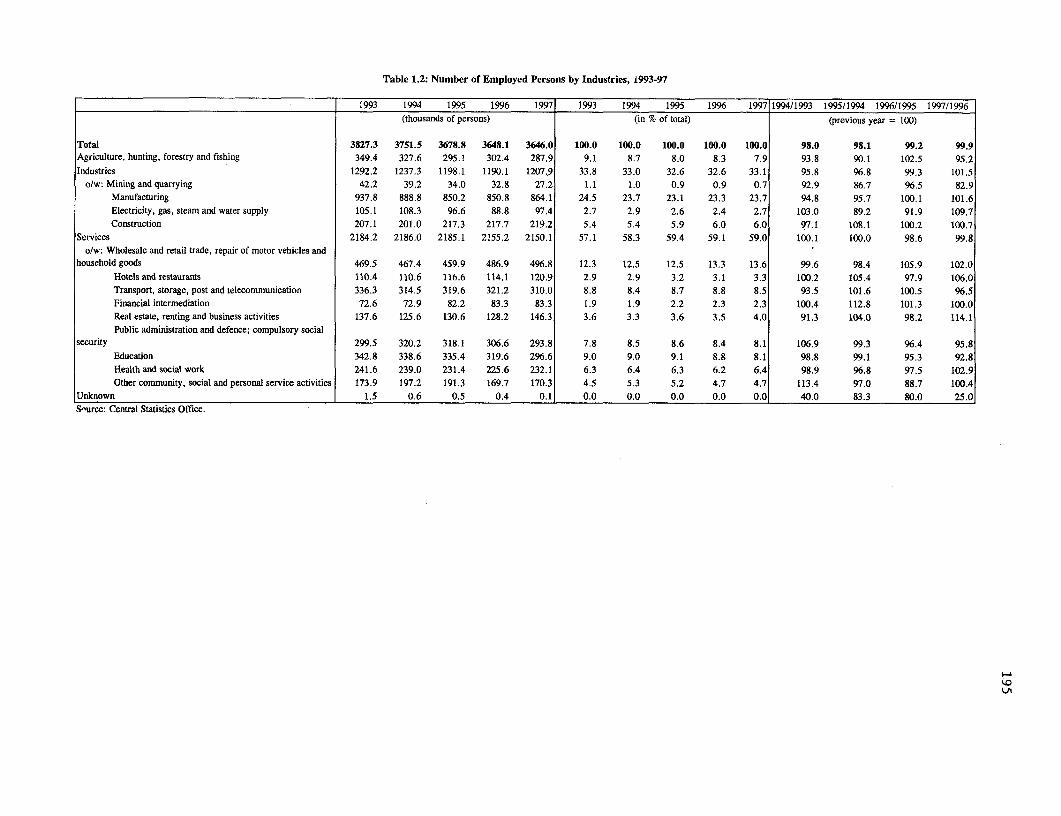
Table 1.2: Number of Employed Persons by Industries, i993-97
1993 1994 1995 1996 1997 1993 1994 199S 1996 1997 1994/1993 1995/1994 1996/1995 1997/1996(thousands of persons) (in % of total) (previous year = 100)
Total 3827.3 3751.5 3678.8 3648.1 3646.0 100.0 100.0 100.0 100.0 100.0 98.0 98.1 99.2 99.9Agriculture, hunting, forestry and fishing 349.4 327.6 295.1 302.4 287.9 9.1 8.7 8.0 8.3 7.9 93.8 90.1 102.5 95.2Industries 1292.2 1237.3 1198.1 1190.1 1207.9 33.8 33.0 32.6 32.6 33.1 95.8 96.8 99.3 101.5
o/w: Mining and quarrying 42.2 39.2 34.0 32.8 27.2 1.1 1.0 0.9 0.9 0.7 92.9 86.7 96.5 82.9Manufacturing 937.8 888.8 850.2 850.8 864.1 24.5 23.7 23.1 23.3 23.7 94.8 95.7 100.1 101.6Electricity, gas, steam and water supply 105.1 108.3 96.6 88.8 97.4 2.7 2.9 2.6 2.4 2.7 103.0 89.2 91.9 109.7Construction 207.1 201.0 217.3 217.7 219.2 5.4 5.4 5.9 6.0 6.0 97.1 108.1 100.2 100.7
Services 2184.2 2186.0 2185.1 2155.2 2150.1 57.1 58.3 59.4 59.1 59.0 100.1 100.0 98.6 99.8o/w: Wholesale and retail trade, repair of motor vehicles and
household goods 469.5 467.4 459.9 486.9 496.8 12.3 12.5 12.5 13.3 13.6 99.6 98.4 105.9 102.0Hotels and restaurants 110.4 110.6 116.6 114.1 120.9 2.9 2.9 3.2 3.1 3.3 100.2 105.4 97.9 106.0Transport, storage, post and telecommunication 336.3 314.5 319.6 321.2 310.0 8.8 8.4 8.7 8.8 8.5 93.5 101.6 100.5 96.5Financial intermediation 72.6 72.9 82.2 83.3 83.3 1.9 1.9 2.2 2.3 2.3 100.4 112.8 101.3 100.0Real estate, renting and business activities 137.6 125.6 130.6 128.2 146.3 3.6 3.3 3.6 3.5 4.0 91.3 104.0 98.2 114.1Public administration and defence; compulsory social
security 299.5 320.2 318.1 306.6 293.8 7.8 8.5 8.6 8.4 8.1 106.9 99.3 96.4 95.8Education 342.8 338.6 335.4 319.6 296.6 9.0 9.0 9.1 8.8 8.1 98.8 99.1 95.3 92.8Health and social work 241.6 239.0 231.4 225.6 232.1 6.3 6.4 6.3 6.2 6.4 98.9 96.8 97.5 102.9Other conimunity, social and personal service activities 173.9 197.2 191.3 169.7 170.3 4.5 5.3 5.2 4.7 4.7 113.4 97.0 88.7 100.4
Unknown 1.5 0.6 0.5 0.4 0.1 0.0 0.0 0.0 0.0 0.0 40.0 83.3 80.0 25.0S^urce: Central Statistics Office.
tj
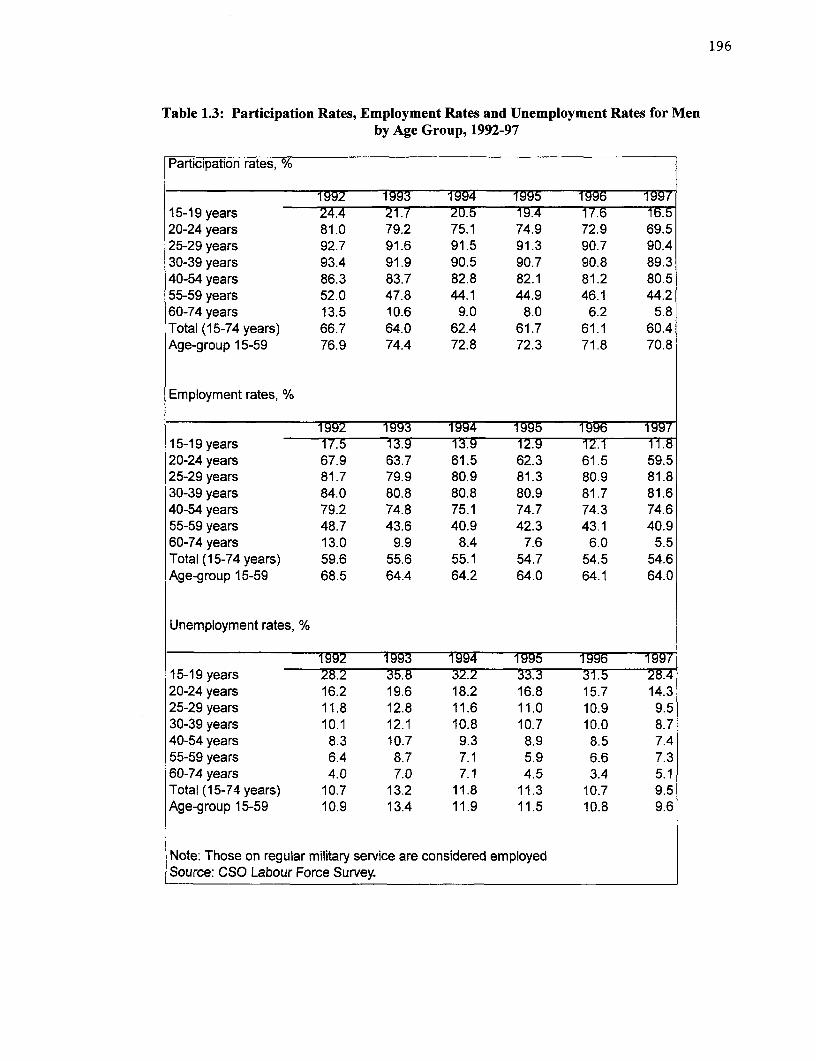
196
Table 1.3: Participation Rates, Employment Rates and Unemployment Rates for Menby Age Group, 1992-97
Participation rates, %
1992 1993 1994 1995 1996 199715-19 years 24.4 21.7 20.5 19.4 17.6 16.520-24 years 81.0 79.2 75.1 74.9 72.9 69.525-29 years 92.7 91.6 91.5 91.3 90.7 90.430-39 years 93.4 91.9 90.5 90.7 90.8 89.340-54 years 86.3 83.7 82.8 82.1 81.2 80.555-59 years 52.0 47.8 44.1 44.9 46.1 44.260-74 years 13.5 10.6 9.0 8.0 6.2 5.8Total (15-74 years) 66.7 64.0 62.4 61.7 61.1 60.4Age-group 15-59 76.9 74.4 72.8 72.3 71.8 70.8
Employment rates, %
1992 1993 1994 1995 1996 199715-19 years 17.5 13.9 13.9 12.9 12.1 11.820-24 years 67.9 63.7 61.5 62.3 61.5 59.525-29 years 81.7 79.9 80.9 81.3 80.9 81.830-39 years 84.0 80.8 80.8 80.9 81.7 81.640-54 years 79.2 74.8 75.1 74.7 74.3 74.655-59 years 48.7 43.6 40.9 42.3 43.1 40.960-74 years 13.0 9.9 8.4 7.6 6.0 5.5Total (15-74 years) 59.6 55.6 55.1 54.7 54.5 54.6Age-group 15-59 68.5 64.4 64.2 64.0 64.1 64.0
Unemployment rates, %
1992 1993 1994 1995 1996 199715-19 years 28.2 35.8 32.2 33.3 31.5 28.420-24 years 16.2 19.6 18.2 16.8 15.7 14.325-29 years 11.8 12.8 11.6 11.0 10.9 9.530-39 years 10.1 12.1 10.8 10.7 10.0 8.740-54 years 8.3 10.7 9.3 8.9 8.5 7.455-59 years 6.4 8.7 7.1 5.9 6.6 7.360-74 years 4.0 7.0 7.1 4.5 3.4 5.1Total (15-74 years) 10.7 13.2 11.8 11.3 10.7 9.5Age-group 15-59 10.9 13.4 11.9 11.5 10.8 9.6
Note: Those on regular military service are considered employedSource: CSO Labour Force Survey.
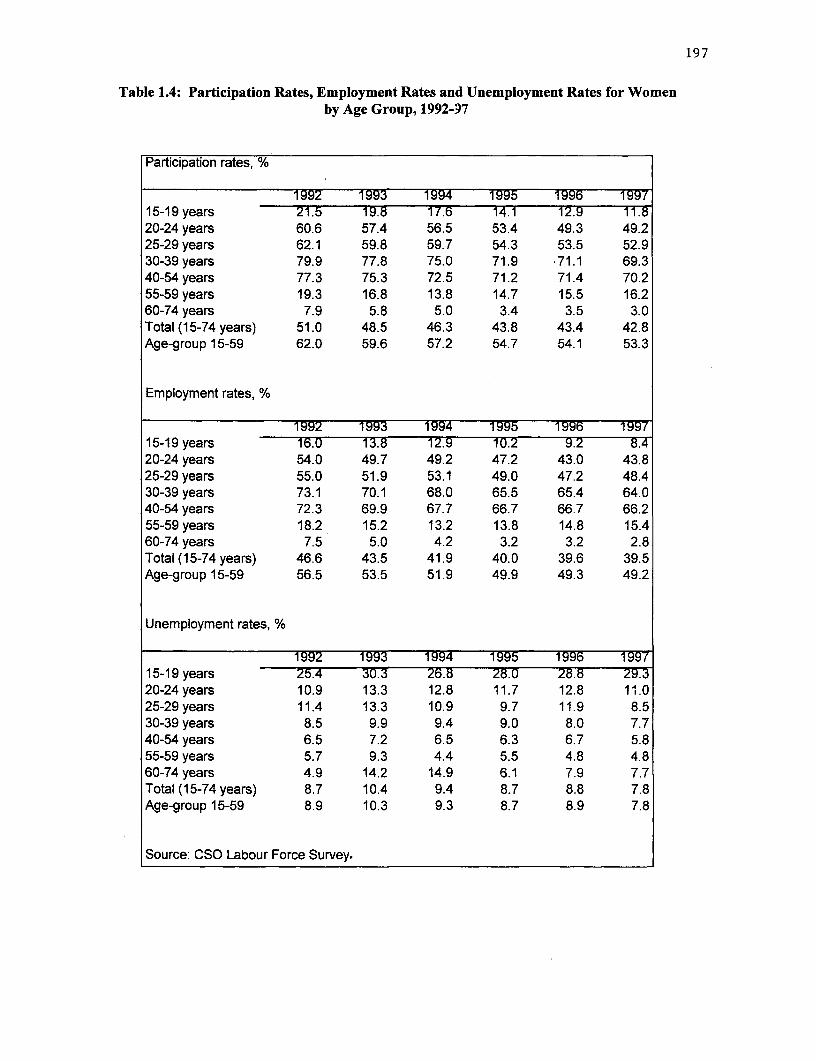
197
Table 1.4: Participation Rates, Employment Rates and Unemployment Rates for Womenby Age Group, 1992-97
Participation rates, %
1992 1993 1994 1995 1996 199715-19 years 21.5 19.8 17.6 14.1 12.9 11.820-24 years 60.6 57.4 56.5 53.4 49.3 49.225-29 years 62.1 59.8 59.7 54.3 53.5 52.930-39 years 79.9 77.8 75.0 71.9 .71.1 69.340-54 years 77.3 75.3 72.5 71.2 71.4 70.255-59 years 19.3 16.8 13.8 14.7 15.5 16.260-74 years 7.9 5.8 5.0 3.4 3.5 3.0Total (15-74 years) 51.0 48.5 46.3 43.8 43.4 42.8Age-group 15-59 62.0 59.6 57.2 54.7 54.1 53.3
Employment rates, %
1992 1993 1994 1995 1996 199715-19 years 16.0 13.8 12.9 10.2 9.2 8.420-24 years 54.0 49.7 49.2 47.2 43.0 43.825-29 years 55.0 51.9 53.1 49.0 47.2 48.430-39 years 73.1 70.1 68.0 65.5 65.4 64.040-54 years 72.3 69.9 67.7 66.7 66.7 66.255-59 years 18.2 15.2 13.2 13.8 14.8 15.460-74 years 7.5 5.0 4.2 3.2 3.2 2.8Total (15-74 years) 46.6 43.5 41.9 40.0 39.6 39.5Age-group 15-59 56.5 53.5 51.9 49.9 49.3 49.2
Unemployment rates, %
1992 1993 1994 1995 1996 199715-19 years 25.4 30.3 26.8 28.0 28.8 29.320-24 years 10.9 13.3 12.8 11.7 12.8 11.025-29years 11.4 13.3 10.9 9.7 11.9 8.530-39 years 8.5 9.9 9.4 9.0 8.0 7.740-54 years 6.5 7.2 6.5 6.3 6.7 5.855-59 years 5.7 9.3 4.4 5.5 4.8 4.860-74 years 4.9 14.2 14.9 6.1 7.9 7.7Total (15-74 years) 8.7 10.4 9.4 8.7 8.8 7.8Age-group 15-59 8.9 10.3 9.3 8.7 8.9 7.8
Source: CSO Labour Force Survey.

198
Table 1.5: Participation Rates, Employment Rates and Unemployment Rates for Both Sexesby Age Group, 1992-97
Participation rates, %
1992 1993 1994 1995 1996 199715-19 years 23.0 20.8 19.1 16.8 15.3 14220-24 years 71.1 68.5 66.1 64.4 61.3 59.725-29 years 77.6 76.0 75.7 73.0 72.4 71.930-39 years 86.6 84.9 82.8 81.3 81.0 79.440-54 years 81.7 79.4 77.5 76.5 76.2 75.255-59 years 34.3 30.9 27.4 28.2 29.2 28.760-74 years 10.3 7.9 6.7 5.3 4.6 4.2Total (15-74 years) 58.6 56.0 54.0 52.4 51.8 51.2Age-group 15-59 69.4 66.9 64.9 63.4 62.8 62.0
Employment rates, %
1992 1993 1994 1995 1996 199715-19years 16.8 13.9 13.4 11.6 10.7 10.120-24 years 61.1 56.9 55.6 54.9 52.4 52.025-29 years 68.5 66.1 67.1 65.3 64.2 65.330-39 years 78.5 75.5 74.4 73.2 73.6 72.840-54 years 75.6 72.3 71.3 70.6 70.4 70.355-59 years 32.2 28.1 25.7 26.6 27.4 26.860-74 years 9.8 7.1 6.0 5.0 4.4 3.9Total (15-74 years) 52.8 49.3 48.2 47.0 46.7 46.7Age-group 15-59 62.4 58.9 58.0 56.9 56.6 56.5
Unemployment rates, %
1992 1993 1994 1995 1996 199715-19 years 27.0 33.3 29.8 31.1 30.4 28.820-24 years 14.0 17.0 16.0 14.7 14.5 13.025-29years 11.7 13.0 11.3 10.6 11.3 9.130-39years 9.3 11.1 10.1 9.9 9.1 8.240-54 years 7.4 9.0 8.0 7.7 7.6 6.655-59 years 6.2 8.9 6.4 5.8 6.1 6.660-74 years 4.3 10.1 10.5 5.1 5.4 6.2Total (15-74 years) 9.8 11.9 10.7 10.2 9.9 8.7Age-group 15-59 10.0 12.0 10.7 10.3 10.0 8.8
Note: Those on regular military service are considered employedSource: CSO Labour Force Survey.
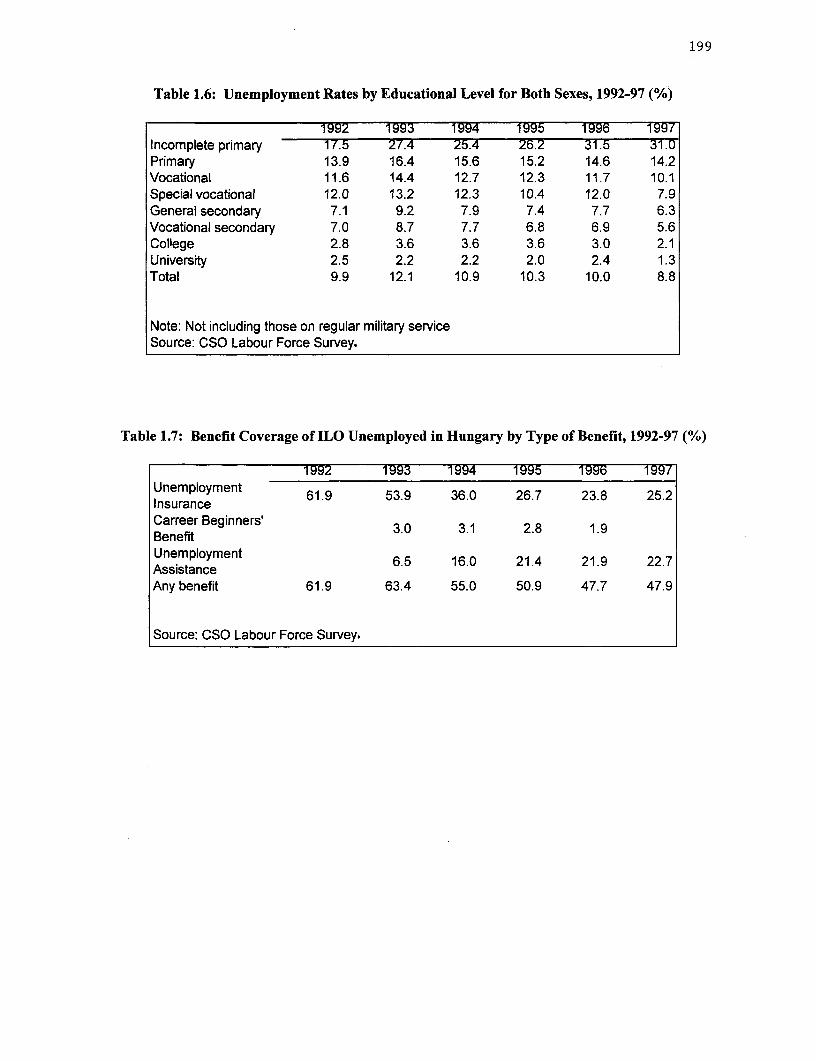
199
Table 1.6: Unemployment Rates by Educational Level for Both Sexes, 1992-97 (%)
1992 1993 1994 1995 1996 1997Incomplete primary 17.5 27.4 25.4 26.2 31.5 31.0Primary 13.9 16.4 15.6 15.2 14.6 14.2Vocational 11.6 14.4 12.7 12.3 11.7 10.1Special vocational 12.0 13.2 12.3 10.4 12.0 7.9General secondary 7.1 9.2 7.9 7.4 7.7 6.3Vocational secondary 7.0 8.7 7.7 6.8 6.9 5.6College 2.8 3.6 3.6 3.6 3.0 2.1University 2.5 2.2 2.2 2.0 2.4 1.3Total 9.9 12.1 10.9 10.3 10.0 8.8
Note: Not including those on regular military serviceSource: CSO Labour Force Survey.
Table 1.7: Benefit Coverage of ILO Unemployed in Hungary by Type of Benefit, 1992-97 (%)
1992 1993 1994 1995 1996 1997Unemployment 61.9 53.9 36.0 26.7 23.8 25.2InsuranceCarreer Beginners' 3.0 3.1 2.8 1.9BenefitUnemployment 6.5 16.0 21.4 21.9 22.7AssistanceAny benefit 61.9 63.4 55.0 50.9 47.7 47.9
Source: CSO Labour Force Survey.

200
Table 1.8: Unemployment Benefits in Percentage of Average Wages and Minimum Wages,1991-97
1991 1992 1993 1994 1995 1996 1997Average Ul 44 40 37 32 31 28 26benefiVaverage wage, %Average Ul 118 110 112 105 99 93 82benefiVminimum wage, %UA benefit/average wage, 18 18 17 17 16 17
UA benefit/minimum 50 56 57 55 54 54wage, %
Source: Frey, 1997.
Table 1.9: Unemployment Rates for Budapest and 19 Counties, 1992-97
1992 1993 1994 1995 1996 1997Budapest 6.4 9.0 8.6 6.9 8.0 6.7Bacs-Kiskun 11.5 13.2 11.6 8.3 8.5 7.1Baranya 7.6 11.3 10.8 11.0 7.2 8.3Bekes 9.4 9.5 8.7 9.3 8.7 7.3Borsod 12.5 15.4 14.6 15.0 14.7 14.0Csongrad 7.4 11.4 8.9 8.3 5.8 5.9Fejer 9.1 11.6 9.0 9.2 8.3 7.8Gyor-Sopron 7.0 8.5 7.6 6.0 6.3 5.8Hajdu-Bihar 10.6 13.6 13.2 11.9 12.3 10.7Heves 13.5 13.1 12.2 12.4 12.9 10.3Jasz-Nagykun 12.5 13.2 11.3 13.5 12.3 10.4Komarom 12.4 12.4 10.0 11.2 12.3 8.9Nograd 14.0 16.1 15.2 17.7 14.6 12.0Pest 8.3 9.9 7.8 7.0 6.9 6.1Somogy 10.1 13.8 11.7 11.3 9.1 10.0Szabolcs 11.9 14.0 13.4 12.7 11.4 11.7Tolna 10.1 10.6 11.1 11.0 10.3 9.4Vas 6.2 6.7 4.6 5.3 5.2 4.0Veszprem 11.4 11.1 10.9 10.0 8.8 5.8Zala 7.3 10.1 10.3 8.1 8.5 7.0
Source: CSO Labour Force Survey.
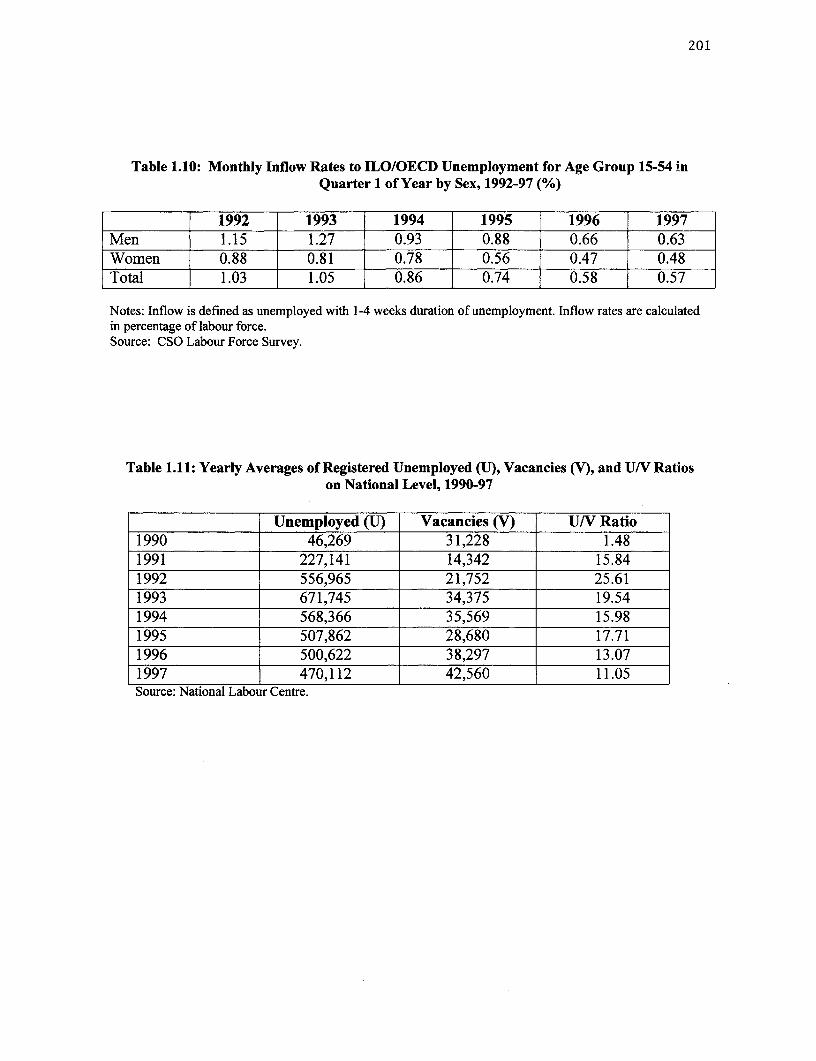
201
Table 1.10: Monthly Inflow Rates to ILO/OECD Unemployment for Age Group 15-54 inQuarter 1 of Year by Sex, 1992-97 (%)
1992 1993 1994 1995 1996 1997Men 1.15 1.27 0.93 0.88 0.66 0.63Women 0.88 0.81 0.78 0.56 0.47 0.48Total 1.03 1.05 0.86 0.74 0.58 0.57
Notes: Inflow is defined as unemployed with 1-4 weeks duration of unemployment. Inflow rates are calculatedin percentage of labour force.Source: CSO Labour Force Survey.
Table 1.11: Yearly Averages of Registered Unemployed (U), Vacancies (V), and U/V Ratioson National Level, 1990-97
| | Unemployed (U) Vacancies (V) U/V Ratio1990 46,269 31,228 1.481991 227,141 14,342 15.841992 556,965 21,752 25.611993 671,745 34,375 19.541994 568,366 35,569 15.981995 507,862 28,680 17.711996 500,622 38,297 13.071997 470,112 42,560 11.05Source: National Labour Centre.

202
Table 1.12: Employment Protection Legislation
Regular procedural inconveniences Notice and severance pay for no-fault individual Difficulty of dismissaldismissals
Procedures Delay Notice period after Severance pay after Definition of Compensationto start 9m 4y 20y 9m 4y 20y unfair dismissal at 20 yearsofnoticeI
Scale 0 to 3 Days Months Scale 0 to 3 MonthsHungaryRegular 1 0 1 1.3 3 0 1 5 1 24layoffMasslayoffs 2 30 2 2.3 4 0 1 5
Unweighted average for developed economies listed below
1.7 12.3 0.9 1.9 4.9 0.1 0.7 3.7 0.8 16.9
European Community (as of late 1980)
Belgium 1 3 2 3.6 11.4 0 0 0 0 12.5Denmark 0.5 0 1.6 2.8 5 0 0 1.5 0 9Francs 1.5 12 1 2 2 0 0.4 2.7 0 15Germany 3 10 1 1 4.5 0 0 0 2 18Greece 2 1 0.6 1.7 9 0.3 0.9 4.6 1 9Ireland 1.5 3 0.2 0.5 2 0 0.5 3.9 0 24Italy 1.5 0 0.3 1.1 2.2 0.7 3.5 18 0 32.5Netherl. 3 35 0.6 1 5.3 0 0 0 1 5.3Portugal 2 17 0.8 2 9.1 0.2 1.7 9.3 3 20Spain 2.25 40 1 3 3 0.2 1.3 6 2 35
UK 1 3 0.2 0.7 2.8 0 0.9 4.6 0 10.8
EFTA (as of the late 1980s)
Austria 2 5 0.8 1.2 2.5 0 2 9 1 9Finland 2 56 2 2 6 0 0 0 0 20Norway 1.5 3 1 2 5 0 0 0 2 15Sweden 2 7 1 4 6 0 0 0 1 32Switzerl. 0.5 1 1 2 3 0 0 0 0 3
Notes: Provisions described here relate to individual dismissals. Explanations for the columns:
Procedures: procedures to be followed when issuing a regular dismissal notice: I for a statement in writing to the employee of reasonsfor dismissal, 2 for notification to a third party, and 3 when prior permission for dismissal must be obtained from the third party (thehigher the number, the stricter the procedure).Delay to start of notice: the delay between a decision to dismiss and the time that notice can become effective after following requiredprocedures, in days.Notice period, 9 m, 4 y, 20 y: the period between issuance of a dismissal notice and the effective cessation of employment, in months.The columns refer to workers who have been with the employer 9 months, 4 years, and 20 years respectively.Severance pay, 9 m, 4 y, 20 y: a lump-sum payment to the dismissed employee at the time of cessation of employment. The columnsrefer to workers who have been with the employer 9 months, 4 years, and 20 years respectively.Definition of unfair dismissal: scored 0 when worker capability or redundancy of the job are adequate grounds for dismissal, I whensocial considerations, age or job tenure must, where possible, influence the choice of which worker to dismiss, 2 when retraining to adaptthe worker to different work must be attempted prior to dismissal, and 3 when worker capability can never be a basis for dismissal (thehigher the number, the stricter the definition).Compensation at 20 y: the compensation payable to a worker who has been unfairly dismissed after 20 years with employer.
Sources: OECD (1994); Labor Acts (1992).
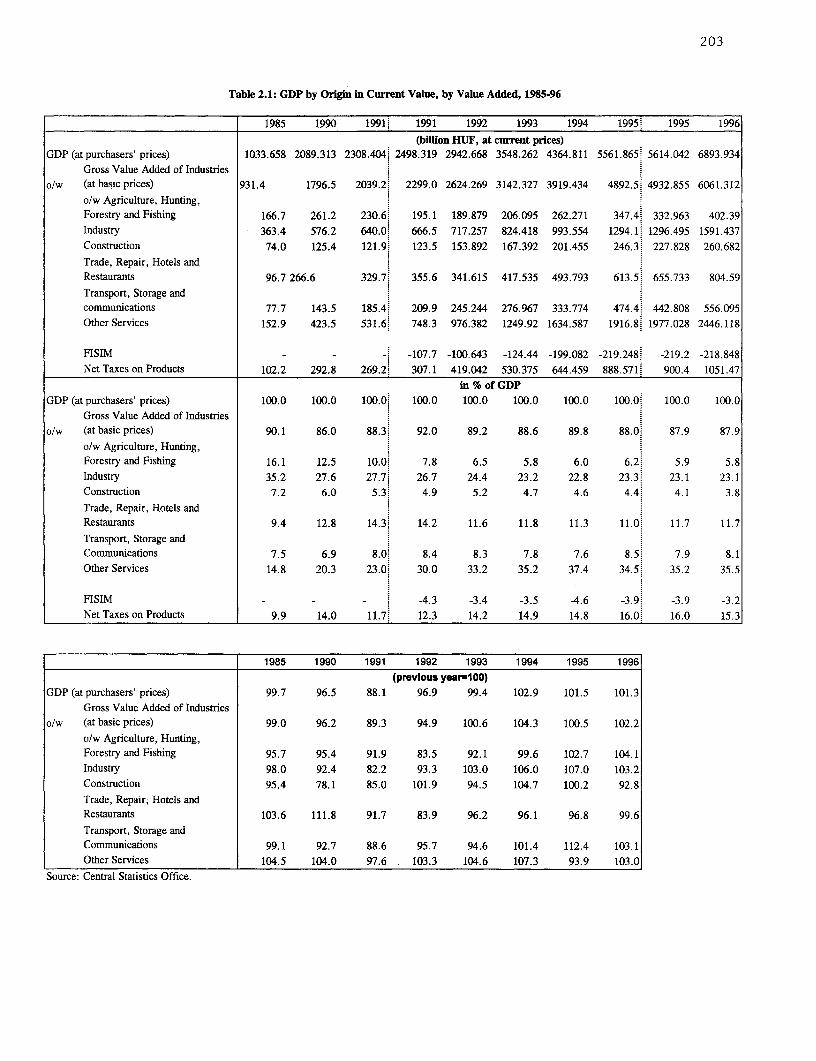
203
Table 2.1: GDP by Origin in Current Value, by Value Added, 1985-96
1985 1990 1991' 1991 1992 1993 1994 1995'. 1995 1996(billion HUF, at current prices)
GDP (at purchasers' prices) 1033.658 2089.313 2308.404. 2498.319 2942.668 3548.262 4364.811 5561.865. 5614.042 6893.934Gross Value Added of Industries
o/w (at basic prices) 931.4 1796.5 2039.2. 2299.0 2624.269 3142.327 3919.434 4892.5, 4932.855 6061.312o/w Agriculture, Hunting,Forestry and Fishing 166.7 261.2 230.6 195.1 189.879 206.095 262.271 347.4 332.963 402.39Industry 363.4 576.2 640.0. 666.5 717.257 824.418 993.554 1294.1' 1296.495 1591.437Construction 74.0 125.4 121.9. 123.5 153.892 167.392 201.455 246.3, 227.828 260.682Trade, Repair, Hotels andRestaurants 96.7 266.6 329.7,. 355.6 341.615 417.535 493.793 613.5, 655.733 804.59Transport, Storage andcommunications 77.7 143.5 185.4, 209.9 245.244 276.967 333.774 474.4, 442.808 556.095Other Services 152.9 423.5 531.6, 748.3 976.382 1249.92 1634.587 1916.8, 1977.028 2446.118
FISIM - - -. -107.7 -100.643 -124.44 -199.082 -219.248: -219.2 -218.848Net Taxes on Products 102.2 292.8 269.21 307.1 419.042 530.375 644.459 888.571 900.4 1051.47
in % of GDPGDP (at purchasers' prices) 100.0 100.0 I100. 0, 100.0 100.0 100.0 100.0 100.0, 100.0 100.0
Gross Value Added of Industrieso/w (at basic prices) 90.1 86.0 88.3. 92.0 89.2 88.6 89.8 88.0, 87.9 87.9
o/w Agriculture, Hunting,Forestry and Fishing 16.1 12.5 10.0. 7.8 6.5 5.8 6.0 6.2', 5.9 5.8Industry 35.2 27.6 27.7, 26.7 24.4 23.2 22.8 23.3, 23.1 23.1Construction 7.2 6.0 5.3, 4.9 5.2 4.7 4.6 4.4, 4.1 3.8Trade, Repair, Hotels andRestaurants 9.4 12.8 14.3, 14.2 11.6 11.8 11.3 11.0, 11.7 11.7Transport, Storage andCommunications 7.5 6.9 8.0, 8.4 8.3 7.8 7.6 8.5' 7.9 8.1Other Services 14.8 20.3 23.0, 30.0 33.2 35.2 37.4 34.5. 35.2 35.5
FISIM - - - 4.3 -3.4 -3.5 -4.6 -3.9, -3.9 -3.2
Net Taxes on Products 9.9 14.0 11.7. 12.3 14.2 14.9 14.8 16.0. 16.0 15.3
1985 1990 1991 1992 1993 1994 1995 1996
(previous year=100)GDP (at purchasers' prices) 99.7 96.5 88.1 96.9 99.4 102.9 101.5 101.3
Gross Value Added of Industries0/w (at basic prices) 99.0 96.2 89.3 94.9 100.6 104.3 100.5 102.2
o/w Agriculture, Hunting,Forestry and Fishing 95.7 95.4 91.9 83.5 92.1 99.6 102.7 104.1Industry 98.0 92.4 82.2 93.3 103.0 106.0 107.0 103.2Construction 95.4 78.1 85.0 101.9 94.5 104.7 100.2 92.8Trade, Repair; Hotels andRestaurants 103.6 111.8 91.7 83.9 96.2 96.1 96.8 99.6Transport, Storage andCommunications 99.1 92.7 88.6 95.7 94.6 101.4 112.4 103.1Other Services 104.5 104.0 97.6 . 103.3 104.6 107.3 93.9 103.0
Source: Central Statistics Office.

204
Table 2.2: GDP by Expenditure in Current Values, 1985-96
1985 1990 1991 1991 1992 1993 1994 1995 1995 1996
(Billions of Current Forint)Governnment Consumption 104.6 221.8 289.3. 264.6 336.456 491.428 527.111 629.5i 617.7 703.619Private Consumption 649.3 1282.5 1605.5, 1746.9 2141.06 2639.87 3151.719 3715.0' 3723.955 4415.857Total Consumption 753.9 1504.3 1894.7. 2011.5 2477.516 3131.298 3678.83 4344.4 4341.655 5119.476
Gross Fixed Investment 232.1 402.4 440.9. 522.9 584.739 669.988 878.473 1059.6. 1125.389 1475.538Change in Stocks 26.3 248.3 34.3. -12.0 -111.661 38.06 90.122 279.7. 218.346 373.825Total Investment 258.4 530.4 475.2 511.0 473.078 708.048 968.595 1339.2, 1343.735 1849.363
Total Domestic Use 1012.3 2034.7 2369.9. 2522.5 2950.594 3839.346 4647.425 5683.7 5685.39 6968.839
Exports, GNFS 436.2 650.7 743.4,. 818.4 925.322 937.046 1262.476 1914.8'. 2091.797 2678.706Imports, GNFS 414.8 596.1 804.9. 842.6 933.248 1228.13** 1545.09 2036.6. 2163.145 2753.611Resource Balance 21.4 54.6 -61.5. -24.2 -7.9 -291.1 -282.6 -121.8 -71.3 -74.9
(in % of GDP)GDP at market prices 1033.7 2089.3 2498.3, 2498.3 2942.668 3548.5 4364.8 5614.01 5614.0 6893.9
Government Consumption 10.1 10.6 11.6 10.6 11.4 13.8 12.1 11.2, 11.0 10.2Private Consumption 62.8 61.4 64.3, 69.9 72.8 74.4 72.2 66.2: 66.3 64.1Total Consumption 72.9 72.0 75.8' 80 5 84.2 88.2 84.3 77.4' 77.3 74.3
Gross Fixed Investment 22.5 19.3 17.6. 20.9 19.9 18.9 20.1 18.9. 20.0 21.4Change in Stocks 2.5 11.9 1.4. -0.5 -3.8 1.1 2.1 5.0, 3.9 5.4Total Investment 25.0 25.4 19.0 20.5 16.1 20.0 22.2 23.9 23.9 26.8
Total Domestic Use 97.9 97.4 94.9. 101.0 100.3 108.2 106.5 101.2. 101.3 101.1
Exports, GNFS 42.2 31.1 29.8 32.8 31.4 26.4 28.9 34.1 37.3 38.9Imports, GNFS 40.1 28.5 32.2 33.7 31.7 34.6 35.4 36.3, 38.5 39.9Resource Balance 2.1 2.6 -2.5. -1.0 -0.3 -8.2 -6.5 -2.2. -1.3 -1.1
GDP at market prices 100.0 100.0 100.0. 100.0 100.0 100.0 100.0 100.0. 100.0 100.0Source: Central Statisticsl Yearbook.
The Hungarian Central Statistical Office has recently adopted the U.N. System of National Accounts methodology for measuring Hungary's national account data. This
been applied to data for 1991 through 1993. The data presented in tables 2.1-2.4 present national account data for 1975 -199lusing the former Hungarian methodology
and 2.6 present data for 1991-1994 using SNA methodology.
1985 1990 1991 1992 1993 1994 1995 1996
(percentage change)
Goverrunent Consumption 4.1 2.6 -2.7 4.9 27.5 -12.7 -4.1 -4.2
Private Consumption* 1.3 -3.6 -5.6 0 1.9 -0.2 -6.4 -2.7Total Consumption 1.7 -2.7 -5.1 0.6 5.4 -2.3 -6.6 -2.9
Gross Fixed Investment -3.0 -7.1 -10.4 -2.6 2 12.5 -4.3 6.7Change in Stocks
Total Investment -3.5 -4.2 -21.1 -20.4 32.3 19.8 8.2 12.8
Domestic Demand 0.4 -3.1 -9.1 -3.6 9.9 2.2 -3.1 0.8
Exports, GNFS 5.2 -5.3 -13.9 2.1 -10.1 13.7 13.4 7.4Imports, GNFS 7.8 -4.3 -6.1 0.2 20.2 8.8 -0.7 5.7
GDP at market prices _
Source: Central Statistical Yearbook.
The Hungarian Central Statistics
been applied to data for 1991 through 1993. The data presented in tables 2.1-2.4 present national account data for 1975 -1991 using the former Hungarian methodology
and 2.6 present data for. 1991-1994 using SNA methodology.
starting from 1992 it includes the balance of tourism
- included the imports of military equipments from Russia (ithout custom and VAT)

205
Table 2.3: Income Generation of Non-Financial Corporations, 1994-96
1994 1995 1996 1994 1995 1996
in bilflion HUF in % of GDPGeneration of IncomeValue Added, gross 1989.0 2586.2 3180.8 45.6 46.1 46.1Compensation of Employees, total 1387.2 1695.2 2071.6 31.8 30.2 30.0
Wages and Salaries 986.1 1237.7 1543.0 22.6 22.0 22.4Employers' Social Security Contributions 401.1 457.4 528.6 9.2 8.1 7.7
Other Taxes on Production 35.0 10.8 15.4 0.8 0.2 0.2Other Subsidies on Production 60.2 28.5 26.5 1.4 0.5 0.4Operating Surplus, gross 626.9 908.8 1120.3 14.4 16.2 16.3
Allocation of Primary IncomeProperty Income, total -258.1 -389.4 -529.4 -5.9 -6.9 -7.7
Interest, net, o/w: -132.7 -170.5 -172.7 -3.0 -3.0 -2.5Interest Received 83.5 128.7 148.4 1.9 2.3 2.2
Interest Paid 216.3 299.1 321.1 5.0 5.3 4.7Income on Direct Investments, net -68.8 -91.0 -159.2 -1.6 -1.6 -2.3Reinvested Earnings on Direct Foreign Investment -39.4 -99.6 -170.0 -0.9 -1.8 -2.5Other Income -17.2 -37.4 -27.6 -0.4 -0.7 -0.4
Enterpreneurial Income, gross 509.5 717.4 944.3 11.7 12.8 13.7Balance of Primary Incomes, gross 368.8 510.4 590.9 8.4 9.1 8.6
Secondary Distribution of IncomeCurrent taxes on Income 82.1 92.3 113.9 1.9 1.6 1.7Other Current Transfers, net -39.7 -47.7 -69.6 -0.9 -0.8 -1.0Disposible Income, gross 246.9 370.2 407.2 5.7 6.6 5.9
GDP 4364.8 5614.0 6893.9 100.0 100.0 100.0Source: Central Statistics Office.
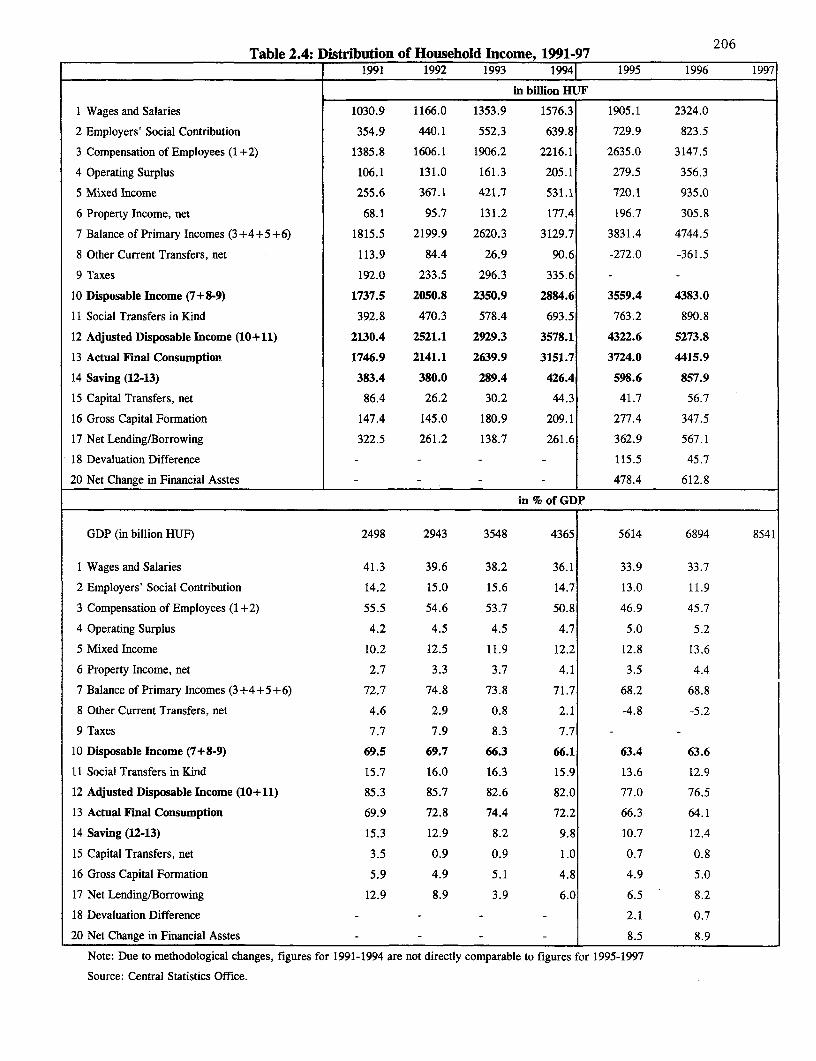
Table 2.4: Distribution of Household Income, 1991-97 2061991 1992 1993 19941 1995 1996 1997
in billion HlUJF
1 Wages and Salaries 1030.9 1166.0 1353.9 1576.3 1905.1 2324.0
2 Employers' Social Contribution 354.9 440.1 552.3 639.8 729.9 823.5
3 Compensation of Employees (1+2) 1385.8 1606.1 1906.2 2216.1 2635.0 3147.5
4 Operating Surplus 106.1 131.0 161.3 205.1 279.5 356.3
5 Mixed Income 255.6 367.1 421.7 531.1 720.1 935.0
6 Property Income, net 68.1 95.7 131.2 177.4 196.7 305.8
7 Balance of Primary Incomes (3+4+5+6) 1815.5 2199.9 2620.3 3129.7 3831.4 4744.5
8 Other Current Transfers, net 113.9 84.4 26.9 90.6 -272.0 -361.5
9 Taxes 192.0 233.5 296.3 335.6 - -
10 Disposable Income (7+8-9) 1737.5 2050.8 2350.9 2884.6 3559.4 4383.0
11 Social Transfers in Kind 392.8 470.3 578.4 693.5 763.2 890.8
12 Adjusted Disposable Income (10+11) 2130.4 2521.1 2929.3 3578.1 4322.6 5273.8
13 Actual Final Consumption 1746.9 2141.1 2639.9 3151.7 3724.0 4415.9
14 Saving (12-13) 383.4 380.0 289.4 426.4 598.6 857.9
15 Capital Transfers, net 86.4 26.2 30.2 44.3 41.7 56.7
16 Gross Capital Formation 147.4 145.0 180.9 209.1 277.4 347.5
17 Net Lending/Borrowing 322.5 261.2 138.7 261.6 362.9 567.1
18 Devaluation Difference - - 115.5 45.7
20 Net Change in Financial Asstes - 478.4 612.8
in % of GDP
GDP (in billion HUF) 2498 2943 3548 4365 5614 6894 8541
1 Wages and Salaries 41.3 39.6 38.2 36.1 33.9 33.7
2 Employers' Social Contribution 14.2 15.0 15.6 14.7 13.0 11.9
3 Compensation of Employees (1+2) 55.5 54.6 53.7 50.8 46.9 45.7
4 Operating Surplus 4.2 4.5 4.5 4.7 5.0 5.2
5 Mixed Income 10.2 12.5 11.9 12.2 12.8 13.6
6 Property Income, net 2.7 3.3 3.7 4.1 3.5 4.4
7 Balance of Primary Incomes (3+4+5+6) 72.7 74.8 73.8 71.7 68.2 68.8
8 Other Current Transfers, net 4.6 2.9 0.8 2.1 -4.8 -5.2
9 Taxes 7.7 7.9 8.3 7.7
10 Disposable Income (7+8-9) 69.5 69.7 66.3 66.1 63.4 63.6
11 Social Transfers inKind 15.7 16.0 16.3 15.9 13.6 12.9
12 Adjusted Disposable Income (10+11) 85.3 85.7 82.6 82.0 77.0 76.5
13 Actual Final Consumption 69.9 72.8 74.4 72.2 66.3 64.1
14 Saving (12-13) 15.3 12.9 8.2 9.8 10.7 12.4
15 Capital Transfers, net 3.5 0.9 0.9 1.0 0.7 0.8
16 Gross Capital Formation 5.9 4.9 5.1 4.8 4.9 5.0
17 Net Lending/Borrowing 12.9 8.9 3.9 6.0 6.5 8.2
18 Devaluation Difference - - - - 2.1 0.7
20 Net Change in Financial Asstes - - - - 8.5 8.9
Note: Due to methodological changes, figures for 1991-1994 are not directly comparable to figures for 1995-1997
Source: Central Statistics Office.
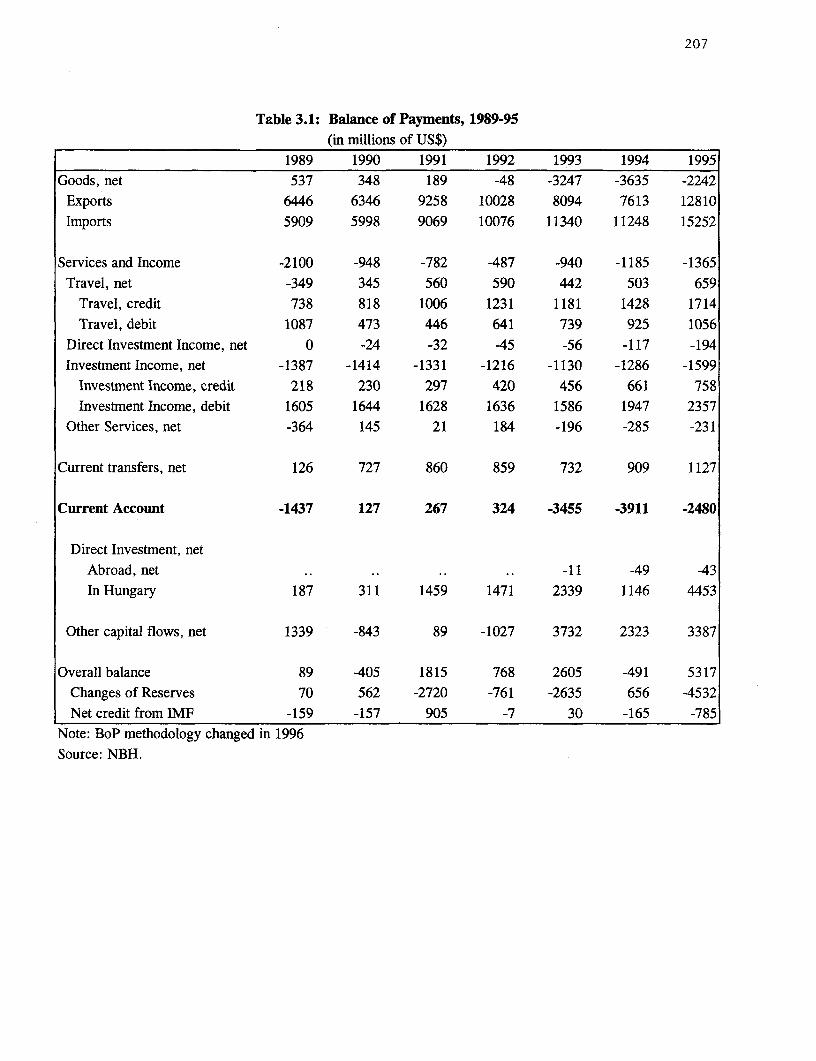
207
Table 3.1: Balance of Payments, 1989-95(in millions of US$)
1989 1990 1991 1992 1993 1994 1995Goods, net 537 348 189 -48 -3247 -3635 -2242
Exports 6446 6346 9258 10028 8094 7613 12810
Imports 5909 5998 9069 10076 11340 11248 15252
Services and Income -2100 -948 -782 487 -940 -1185 -1365
Travel, net -349 345 560 590 442 503 659Travel, credit 738 818 1006 1231 1181 1428 1714Travel, debit 1087 473 446 641 739 925 1056
Direct Investment Income, net 0 -24 -32 -45 -56 -117 -194Investment Income, net -1387 -1414 -1331 -1216 -1130 -1286 -1599
Investment Income, credit 218 230 297 420 456 661 758Investment Income, debit 1605 1644 1628 1636 1586 1947 2357
Other Services, net -364 145 21 184 -196 -285 -231
Current transfers, net 126 727 860 859 732 909 1127
Current Account -1437 127 267 324 -3455 -3911 -2480
Direct Investment, net
Abroad, net -11 -49 -43
In Hungary 187 311 1459 1471 2339 1146 4453
Other capital flows, net 1339 -843 89 -1027 3732 2323 3387
Overall balance 89 -405 1815 768 2605 -491 5317
Changes of Reserves 70 562 -2720 -761 -2635 656 -4532
Net credit from IMF -159 -157 905 -7 30 -165 -785Note: BoP methodology changed in 1996Source: NBH.
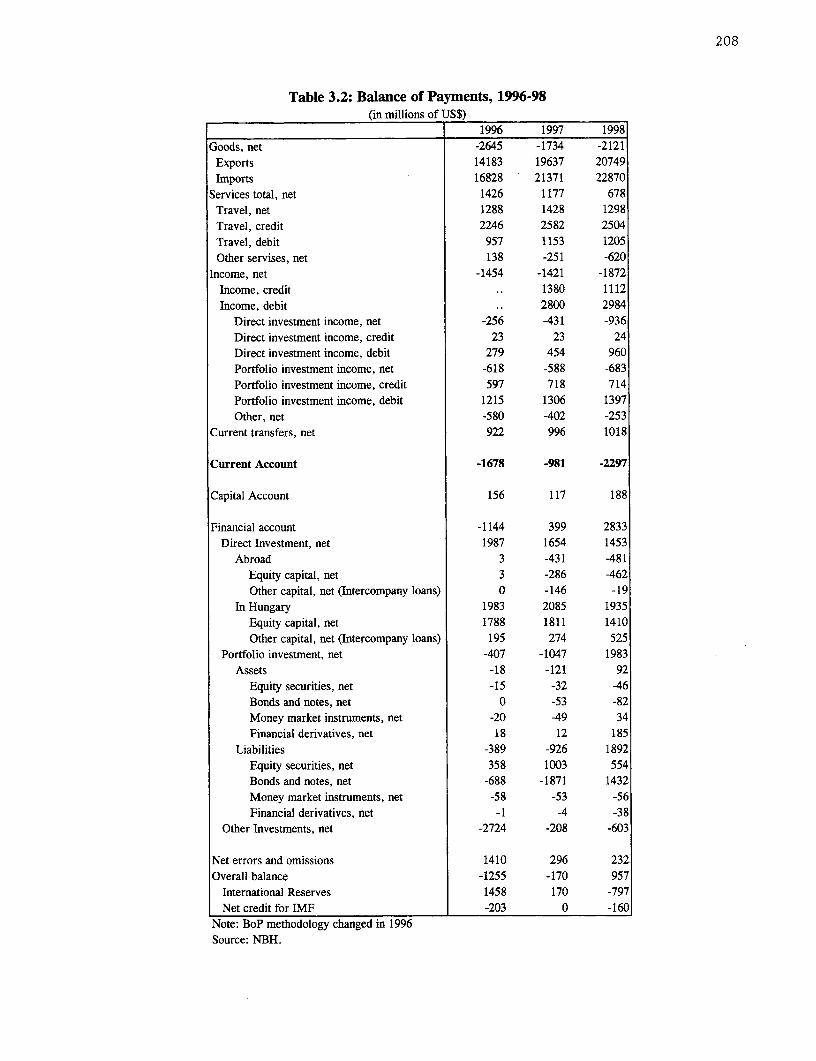
208
Table 3.2: Balance of Payments, 1996-98(in millions of US$)
1996 1997 1998Goods, net -2645 -1734 -2121
Exports 14183 19637 20749Imports 16828 21371 22870
Services total, net 1426 1177 678Travel, net 1288 1428 1298Travel, credit 2246 2582 2504Travel, debit 957 1153 1205Other servises, net 138 -251 -620
Income, net -1454 -1421 -1872Income, credit 1380 1112Income, debit 2800 2984
Direct investment income, net -256 431 -936Direct investment income, credit 23 23 24Direct investment income, debit 279 454 960Portfolio investment income, net -618 -588 -683Portfolio investment income, credit 597 718 714Portfolio investment income, debit 1215 1306 1397Other, net -580 -402 -253
Current transfers, net 922 996 1018
Current Account -1678 -981 -2297
Capital Account 156 117 188
Financial account -1144 399 2833Direct Investment, net 1987 1654 1453
Abroad 3 -431 -481Equity capital, net 3 -286 -462Other capital, net (Intercompany loans) 0 -146 -19
In Hungary 1983 2085 1935Equity capital, net 1788 1811 1410Other capital, net (Intercompany loans) 195 274 525
Portfolio investment, net -407 -1047 1983Assets -18 -121 92
Equity securities, net -15 -32 -46Bonds and notes, net 0 -53 -82Money market instruments, net -20 -49 34Financial derivatives, net 18 12 185
Liabilities -389 -926 1892Equity securities, net 358 1003 554Bonds and notes, net -688 -1871 1432Money market instruments, net -58 -53 -56Financial derivatives, net -1 -4 -38
Other Investments, net -2724 -208 -603
Net errors and omissions 1410 296 232Overall balance -1255 -170 957
International Reserves 1458 170 -797Net credit for IMF -203 0 -160
Note: BoP methodology changed in 1996Source: NBH.

Table 3.3: International Reserves and Other Foreign Assets, 1985-1998(US$ Millions at end of period)
1985 1990 1991 1992 1993 1994 1995 1996 1997 1998International Reserves 3017.1 1969.4 4723.3 4427.6 6781.3 6780.6 12010 9718 8429 9341Gold 640 97 83 33 45 42 43 37 29 30Other Foreign Assets 3538.5 4757.3 4602.2 5185.5 3549.7 3372.4 3304 3454 3841 4730Source: NBH.
Q
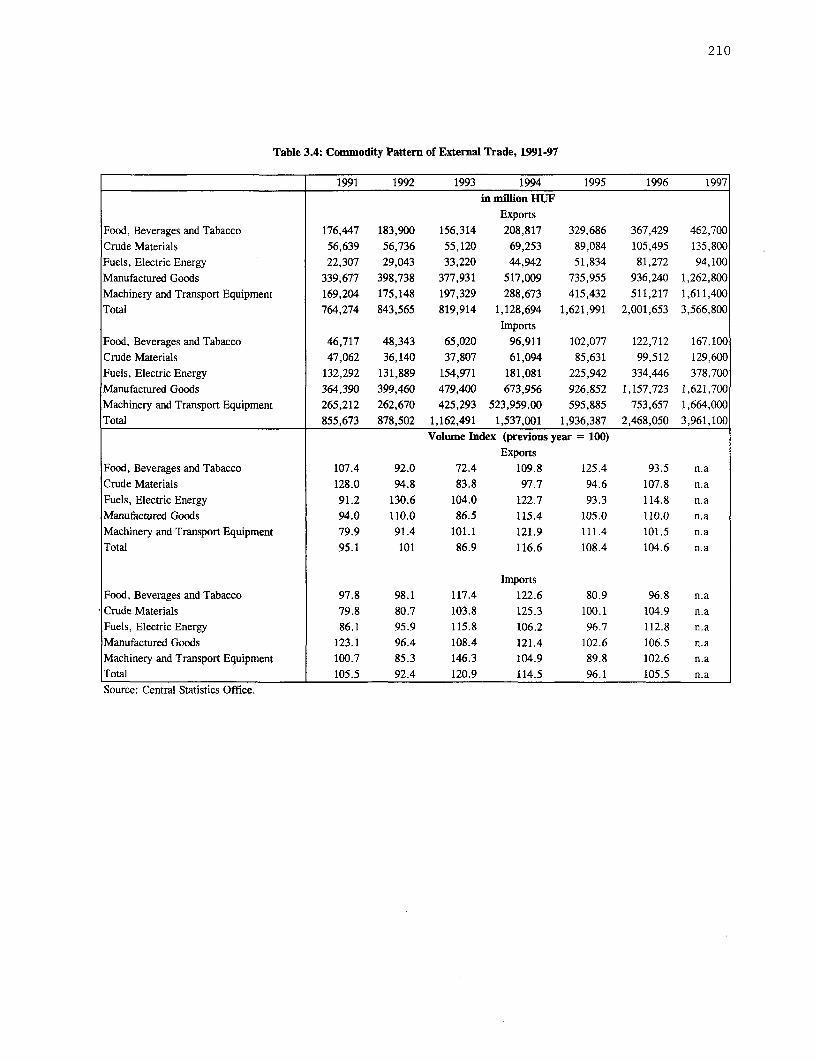
210
Table 3.4: Commodity Pattern of External Trade, 1991-97
1991 1992 1993 1994 1995 1996 1997in million HUF
ExportsFood, Beverages and Tabacco 176,447 183,900 156,314 208,817 329,686 367,429 462,700Crude Materials 56,639 56,736 55,120 69,253 89,084 105,495 135,800Fuels, Electric Energy 22,307 29,043 33,220 44,942 51,834 81,272 94,100Manufactured Goods 339,677 398,738 377,931 517,009 735,955 936,240 1,262,800Machinery and Transport Equipment 169,204 175,148 197,329 288,673 415,432 511,217 1,611,400Total 764,274 843,565 819,914 1,128,694 1,621,991 2,001,653 3,566,800
ImportsFood, Beverages and Tabacco 46,717 48,343 65,020 96,911 102,077 122,712 167,100Crude Materials 47,062 36,140 37,807 61,094 85,631 99,512 129,600Fuels, Electric Energy 132,292 131,889 154,971 181,081 225,942 334,446 378,700Manufactured Goods 364,390 399,460 479,400 673,956 926,852 1,157,723 1,621,700Machinery and Transport Equipment 265,212 262,670 425,293 523,959.00 595,885 753,657 1,664,000Total 855,673 878,502 1,162,491 1,537,001 1,936,387 2,468,050 3,961,100
Volume Index (previous year = 100)Exports
Food, Beverages and Tabacco 107.4 92.0 72.4 109.8 125.4 93.5 n.aCrude Materials 128.0 94.8 83.8 97.7 94.6 107.8 n.aFuels, Electric Energy 91.2 130.6 104.0 122.7 93.3 114.8 n.aManufactured Goods 94.0 110.0 86.5 115.4 105.0 110.0 n.aMachinery and Transport Equipment 79.9 91.4 101.1 121.9 111.4 101.5 n.aTotal 95.1 101 86.9 116.6 108.4 104.6 n.a
ImportsFood, Beverages and Tabacco 97.8 98.1 117.4 122.6 80.9 96.8 n.aCrude Materials 79.8 80.7 103.8 125.3 100.1 104.9 n.aFuels, Electric Energy 86.1 95.9 115.8 106.2 96.7 112.8 n.aManufactured Goods 123.1 96.4 108.4 121.4 102.6 106.5 n.aMachinery and Transport Equipment 100.7 85.3 146.3 104.9 89.8 102.6 n.aTotal 105.5 92.4 120.9 114.5 96.1 105.5 n.aSource: Central Statistics Office.
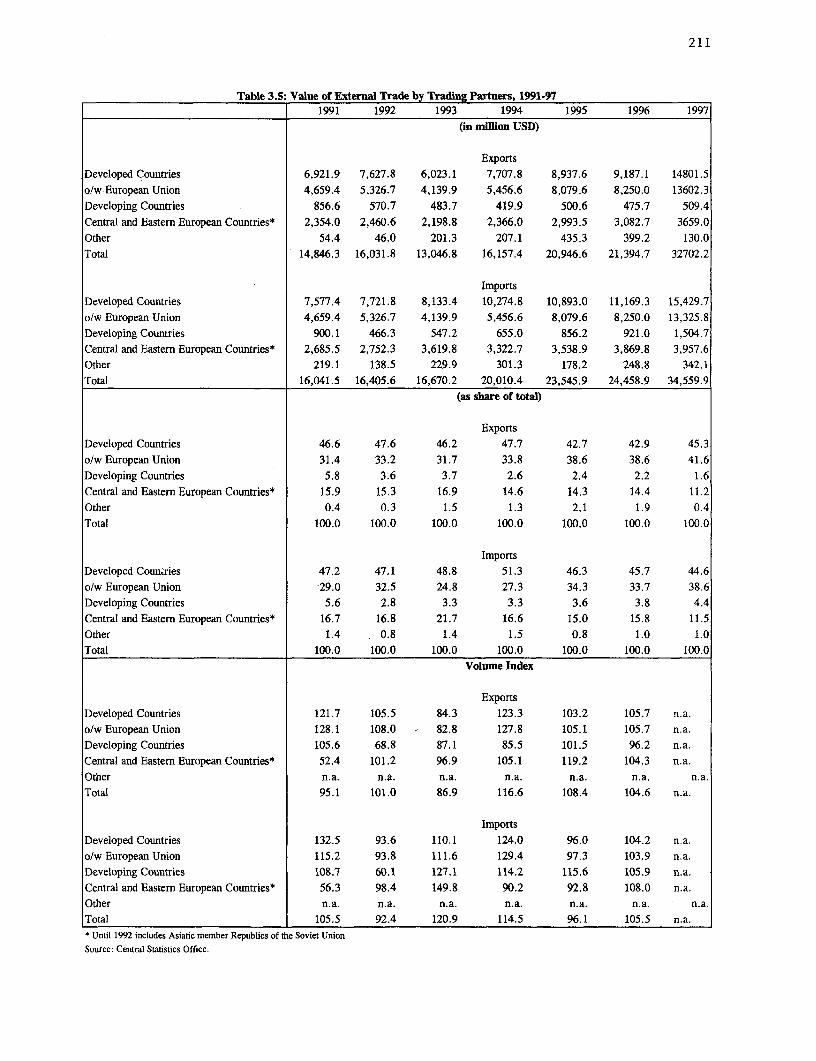
211
Table 3.5: Value of External Trade by Trading Partners, 1991-971991 1992 1993 1994 1995 1996 1997
(in miflion USD)
ExportsDeveloped Countries 6,921.9 7,627.8 6,023.1 7,707.8 8,937.6 9,187.1 14801.5o/w-European Union 4,659.4 5,326.7 4,139.9 5,456.6 8,079.6 8,250.0 13602.3Developing Countries 856.6 570.7 483.7 419.9 500.6 475.7 509.4Central and Eastern European Countries* 2,354.0 2,460.6 2,198.8 2,366.0 2,993.5 3,082.7 3659.0Other 54.4 46.0 201.3 207.1 435.3 399.2 130.0Total 14,846.3 16,031.8 13,046.8 16,157.4 20,946.6 21,394.7 32702.2
ImportsDeveloped Countries 7,577.4 7,721.8 8,133.4 10,274.8 10,893.0 11,169.3 15,429.7o/w European Union 4,659.4 5,326.7 4,139.9 5,456.6 8,079.6 8,250.0 13,325.8Developing Countries 900.1 466.3 547.2 655.0 856.2 921.0 1,504.7Central and Eastern European Countries* 2,685.5 2,752.3 3,619.8 3,322.7 3,538.9 3,869.8 3,957.6Other 219.1 138.5 229.9 301.3 178.2 248.8 342.1Total 16,041.5 16,405.6 16,670.2 20,010.4 23,545.9 24,458.9 34,559.9
(as share of total)
ExportsDeveloped Countries 46.6 47.6 46.2 47.7 42.7 42.9 45.3olw European Union 31.4 33.2 31.7 33.8 38.6 38.6 41.6Developing Countries 5.8 3.6 3.7 2.6 2.4 2.2 1.6Central and Eastern European Countries* 15.9 15.3 16.9 14.6 14.3 14.4 11.2Other 0.4 0.3 1.5 1.3 2.1 1.9 0.4Total 100.0 100.0 100.0 100.0 100.0 100.0 100.0
ImportsDeveloped Coun.ries 47.2 47.1 48.8 51.3 46.3 45.7 44.6olw European Union 29.0 32.5 24.8 27.3 34.3 33.7 38.6Developing Countries 5.6 2.8 3.3 3.3 3.6 3.8 4.4Central and Eastern European Countries* 16.7 16.8 21.7 16.6 15.0 15.8 11.5Other 1.4 0.8 1.4 1.5 0.8 1.0 1.0Total 100.0 100.0 100.0 100.0 100.0 100.0 100.0
Volume Index
ExportsDeveloped Countries 121.7 105.5 84.3 123.3 103.2 105.7 n.a.olw European Union 128.1 108.0 - 82.8 127.8 105.1 105.7 n.a.Developing Countries 105.6 68.8 87.1 85.5 101.5 96.2 n.a.Central and Eastern European Countries* 52.4 101.2 96.9 105.1 119.2 104.3 n.a.Other n.a. n.a. n.a. n.a. n.a. n.a. n.a.Total 95.1 101.0 86.9 116.6 108.4 104.6 n.a.
ImportsDeveloped Countries 132.5 93.6 110.1 124.0 96.0 104.2 n.a.olw European Union 115.2 93.8 111.6 129.4 97.3 103.9 n.a.Developing Countries 108.7 60.1 127.1 114.2 115.6 105.9 n.a.Central and Eastern European Countries* 56.3 98.4 149.8 90.2 92.8 108.0 n.a.Other n.a. n.a. n.a. n.a. n.a. n.a. n.a.Total 105.5 92.4 120.9 114.5 96.1 105.5 n.a.t Until 1992 includes Asiatic member Republics of the Soviet Union
Source: Central Statistics Office.
212
Table 3.6: Share of Hungarian Products in EU External Imports by MajorProduct Categories, 1989-1996
PRODUCT GROUP 1989 1990 1991 1992 1993 1994 1995 1996 1997
All food products (0+1+22+4) 2.00 1.99 2.35 2.16 1.82 1.78 1.74 1.77 1.63
Agricultural materials (2-22-27-28) 0.88 1.00 1.34 1.31 1.14 1.02 0.92 1.02 1.24
Textile fibres (26) 0.38 0.51 0.66 0.52 0.30 0.39 0.34 0.39 0.55
Ores, Minerals and Metals (27+28+68) 0.77 1.01 0.87 1.04 0.94 1.26 1.46 1.19 1.23
Energy (3) 0.30 0.25 0.30 0.26 0.26 0.28 0.30 0.34 0.09
All Manufactured Goods (5to 8-68) 0.70 0.85 0.98 1.13 1.09 1.27 1.54 1.76 2.13
chemical elements (51) 1.48 1.63 1.48 1.53 1.47 1.43 1.48 1.50 1.42
leather and goods (61) 2.35 2.85 4.03 4.58 4.40 3.64 3.54 3.72 3.75
wood manufactures (63) 1.74 2.30 2.38 2.02 1.63 1.83 2.33 2.47 2.59
textile yarn andfabric(65) 0.98 1.17 1.11 1.10 1.03 1.10 1.27 1.31 1.17
Iron and Steel (67) 2.54 3.11 2.49 2.54 1.93 2.93 2.49 2.65 2.16
metal manufactures (69) 1.34 1.87 2.30 2.67 2.37 2.27 2.55 2.83 2.88
nonelectric machinery (71) 0.31 0.43 0.55 0.56 0.59 0.85 1.47 1.76 2.80
electrical machinery (72) 0.48 0.65 0.84 1.01 1.03 1.38 1.61 2.12 2.60
transport equipment (73) 0.10 0.12 0.21 0.34 0.34 0.53 1.15 1.32 1.59
furniture (82) 2.64 2.89 3.54 3.70 2.94 2.99 3.43 3.89 2.61
clothing (84) 1.72 1.91 2.04 2.41 2.33 2.36 2.25 2.44 2.31
footwear (85) 1.79 2.21 2.29 2.95 2.52 2.49 2.75 2.88 2.95
scientific instruments (86) 0.09 0.09 0.13 0.18 0.19 0.23 0.34 0.38 0.47
All goods (O to 9) 0.78 0.86 1.00 1.09 1.03 1.18 1.38 1.51 1.71
Source: Derived from data in the UN COMTRADE database.
Table 3.7: RCA and Shares in EU Imports of Major Product Groups in Terms of theirFactor Intensities, 1989-95
A. Revealed Comparative Advantage Indices
Relative Factor Intensity 1989 1990 1991 1992 1993 1994 1995 1996 1996,Groups _ 1993=100Natural Resource Intensive 1.15 1.05 1.08 0.97 0.90 0.85 0.76 0.66 73
Unskilled Labor Intensive 1.61 1.71 1.67 1.73 1.77 1.61 1.41 1.40 79
Technology Intensive 0.61 0.67 0.68 0.70 0.75 0.82 0.95 1.00 133
Human Capital Intensive 0.92 1.01 0.93 1.06F 1.03 1.20 1.34 1.46 142B. Share in EU Imports, in percent
Natural Resource Intensive 0.90 0.91 1.08 1.06 0.93 1.01 1.04 1.00 108
Unskilled Labor Intensive 1.26 1.47 1.67 1.89 1.82 1.89 1.95 2.12 116
ethnology Intensive 0.48 0.58 0.68 0.76 0.77 0.97 1.31 1.51 196
Human Capital Intensive 0.72 0.87 0.93 1.16 1.07 1.42 1.85 2.21 207
Source: Derived from the UN COMTRADE database as reported by the EU imports.

213
Table 3.8: Bindings and Levels of MFN Tariff Rates After the Uruguay Round
Percentage of Percentage of imports Applied Rate Post-Uruguayimports GATT GATr bound below weighted by Bound Ratebound applied rates 1989 imports
Agricultural products, EU -100.0 EU - 41.4 EU - 3.7 EU - 3.8ex. fish (est 2) HUN -100.0 HUN- 27.0 HUN -16.5 HUN- 21.6Industrial products EU -100.0 EU - 43.3 EU - 2.9 EU - 3.2
HUN - 93.6 HUN - 55.6 HUN- 6.7 HUN - 6.1wood, pulp, paper, EU -100.0 EU - 16.7 EU - 0.3 EU - 0.5
and fumiture HUN - 100.0 HUN - 34.5 HUN- 3.3 HUN - 3.3textiles and EU -100.0 EU - 70.5 EU - 8.7 EU - 8.5
clothing HUN - 98.5 HUN - 80.6 HUN- 8.5 HUN - 8.6Leather, rubber, EU -100.0 EU - 59.7 EU - 4.9 EU - 4.9
footwear HUN - 100.0 HUN -72.7 HUN- 6.5 HUN- 6.6Metals EU -100.0 EU - 21.6 EU - 1.0 EU - 1.7
HUN -100.0 HUN- 61.7 HUN- 3.9 HUN- 4.5chemical and EU -100.0 EU - 44.5 EU - 3.8 EU - 4.4
photographic supplies HUN- 97.3 HUN - 56.1 HUN- 4.2 HUN- 4.3Transport EU -100.0 EU - 22.2 EU - 5.5 EU - 6.2
Equipment HUN - 54.0 HUN - 14.3 HUN - 16.1 HUN -11.8non-electric machinery EU -100.0 EU - 66.3 EU - 1.4 EU - 1.6
HUN- 98.3 HUN - 83.2 HUN - 7.5 HUN- 7.5Electric EU -100.0 EU - 65.9 EU - 5.4 EU - 5.2
Machinery HUN- 92.9 HUN- 60.1 HUN -8.8 HUN- 8.9Mineral products, EU -100.0 EU - 20.0 EU - 0.5 EU - 0.7
Precious stones, & metal HUN - 96.9 HUN - 18.6 HUN - 2.5 HUN- 2.3Manufactures nes EU -100.0 EU - 54.1 EU - 2.5 EU - 2.6
HUN- 98.2 HUN - 53.7 HUN - 4.6 HUN- 4.5All Merchandise Trade EU -100.0 EU - 38.6 EU - 2.9 EU - 3.2
HUN- 94.4 HUN- 49.9 HUN - 6.8 HUN- 6.6
Source: Derived from J.M. Finger, M. D lngco and U. Reincke, The Uruguay Round. Statistics on Tariff ConcessionsGiven and Received, The World Bank, Washington D.C. 1996.
214Table 4.1: General Government Finance Statistics, 1991-97
1991 1992 1993 1994 1995 1996 1997
in million HUF
Total Revenue 1,312,144 1,548,981 1,828,446 2,235,683 2,677,862 3,157,520 3,740,487
Current Revenue 1,293,290 1,506,557 1,765,485 2,153,035 2,598,811 3,069,969 3,632,261
Tax Revenue 1,053,768 1,235,072 1,469,850 1,725,247 2,153,061 2,533,655 3,052,806
Nontax Revenue 239,522 271,485 295,635 427,787 445,750 536,314 579,455
Capital Revenue 18,854 41,854 62,960 82,335 76,620 87,182 106,280
Grants 0 570 0 314 2,430 369 1,946
Total Expenditure & Lending Minus Repayments 1,384,672 1,727,129 2,040,722 2,562,720 2,856,075 3,101,419 3,897,115
Total Expenditure 1,408,526 1,777,418 2,157,443 2,635,114 3,045,845 3,377,221 4,202,617
Current Expenditure 1,253,999 1,554,415 1,818,505 2,264,488 2,723,975 3,010,756 3,682,157
Wages & Salaries 231,455 282,896 343,376 420,649 469,147 519,687 622,350
OtherPurchasesofGoods&Services 239,207 319,264 417,129 445,104 452,969 535,424 659,249
Interest Payments 92,098 160,473 161,621 296,028 519,402 570,067 839,903
Subsidies & Other Current Transacdons 689,149 791,132 896,198 1,102,551 1,282,457 1,382,379 1,558,875
Other Current Expenditure 2,091 195,885 181 156 0 3,199 1,629
Capital Expenditure 154,527 223,004 338,938 370,626 321,870 0 520,460
Acquisition of Fixed Capital Assets 89,552 143,285 241,972 250,353 167,386 240,498 390,615
Capital Transfers 50,557 66,992 90,261 113.093 121,888 106,091 103,222
Other Capital Expenditure 0 0 0 0 0 0 0
Lending Minus Repayments -23,855 -50,289 -116,720 -72,394 -189,771 -275,802 -305,502
Privatization Revenue 2,173 32,392 22,559 37,741 178,388 260,621
Overall Deficit/Surplus -72,527 -178,148 -212,277 -327,037 -178,213 56,102 -156,628252,363
Ovejas Deficit excluding Privatisation Revenues -74,700 -210,541 -234,836 -364,778 -356,601 -204,519 -408,991
in % of GDP
GDP (in million HUF) 2,498,319 2,942,668 3,548,262 4,364,811 5,614,042 6,893,934 8,541,000
Total Revenue 52.5 52.6 51.5 51.2 47.7 45.8 43.8
Total Revenue (A.lt) 52.5 52.6 51.5 51.2 47.7 45.8 43.8
Current Revenue 51.8 51.2 49.8 49.3 46.3 44.5 42.5
Tax Revenue 42.2 42.0 41.4 39.5 38.4 36.8 35.7
Nontax Revenue 9.6 9.2 8.3 9.8 7.9 7.8 6.8
Capital Revenue 0.8 1.4 1.8 1.9 1.4 1.3 1.2
Grants 0.0 0.0 0.0 0.0 0.0 0.0 0.0
Total Expenditure & Lending Minus Repayments 55.4 58.7 57.5 58.7 50.9 45.0 45.6
Total Expenditure 56.4 60.4 60.8 60.4 54.3 49.0 49.2
Current Expenditure 50.2 52.8 51.3 51.9 48.5 43.7 43.1
Wages & Salaries 9.3 9.6 9.7 9.6 8.4 7.5 7.3
Other Purchases of Goods & Services 9.6 10.8 11.8 10.2 8.1 7.8 7.7
Interest Paymettts 3.7 5.5 4.6 6.8 9.3 8.3 9.8
Subsidies & Other Current Transactions 27.6 26.9 25.3 25.3 22.8 20.1 18.3
Other Current Expenditure 0.1 6.7 0.0 0.0 0.0 0.0 0.0
Capital Expenditure 6.2 7.6 9.6 8.5 5.7 0.0 6.1
Acquisition of Fixed Capital Assets 3.6 4.9 6.8 5.7 3.0 3.5 4.6
Capital Transfers 2.0 2.3 2.5 2.6 2.2 1.5 1.2
Other Capital Expenditure 0.6 0.4 0.2 0.2 0.6 0.3 0.3
Lending Minus Repayments -1.0 -1.7 -3.3 -1.7 -3.4 -4.0 -3.6
Privatization Revenue 0.1 1.1 0.6 0.9 3.2 3.8 0.0
Overal Deficit/Surplus -2.9 -6.1 -6.0 -7.5 -3.2 0.8 -1.8
Overal Defirit excluding Privatisation Revenues -3.0 -7.2 -6.6 -8.4 -6.4 -3.0 -4.8Souce= Ministry of Finance.
Table 4.2: Local Government Financial Statistics, 1991-97 * 215
1991 1992 1993 1994 1995 1996 1997in million HUF
Total Revenue 127,562 196,975 206,187 256,022 314,142 408,901 533,355Current Revenue 115,964 175,428 171,121 204,019 257,954 342,697 452,496
Tax Revenue 65,019 91,821 89,067 105,729 153,949 204,827 273,105
Nontax Revenue 50,945 83,607 82,054 98,290 104,005 137,870 179,391
Capital Revenue 11,598 21,547 35,066 52,003 56,188 66,204 80,859
Grants 262,579 311,581 374,925 446,621 478,492 513,624 571,112
Current 242,224 280,245 337,275 394,586 435,020 477,097 524,539
Capital 20,355 31,335 37,650 52,035 43,472 36,527 46,573
Total Expenditure & Lending Minus Repayment 369,726 493,038 590,671 738,820 775,135 874,977 1,040,678Total Expenditure 370,773 496,586 597,537 750,193 800,830 913,294 1,129,740
Current Expenditure 310,029 400,968 482,467 580,219 663,226 767,679 910,334Wages & Salaries 119,454 146,506 181,829 223,098 248,700 279,469 332,959
Other Purchases of Goods & Services 122,960 157,749 183,338 192,241 219,849 264,925 312,196
Interest Payments 2,217 2,177 2,771 6,774 13,989 12,127 8,670
Subsidies & Other Current Transactions 16,515 32,365 33,816 57,634 60,454 78,677 91,442
Other Current Expenditure 48,883 62,171 80,713 100,473 120,234 132,481 165,067
Capital Expenditure 60,744 95,618 115,070 169,974 137,604 145,615 219,406Acquisition of Fixed Capital Assets 48,679 79,275 88,955 141,484 108,513 115,533 187,475
Capital Transfers 12,065 16,343 26,115 28,490 29,091 30,082 31,931
Lending Minus Repayments -1,047 -3,548 -6,866 -11,373 -25,695 -38,317 -89,062Privatization Revenue 1,047 3,548 5,419 11,038 24,400 40,741 90,509
Overal Deficit/Surplus 20,415 15,518 -9,559 -36,177 17,499 47,548 63,789
Overall Deficit/Surplus excl. Privatization Revenue 19,368 11,970 -14,978 -47,215 -6,901 6,807 -26,720in % of GDP
GDP (in million HUF) 2,498,319 2,942,668 3,548,262 4,364,811 5,614,042 6,893,934
Total Revenue 5 7 6 6 6 6
Current Revenue 5 6 5 5 5 5
Tax Revenue 3 3 3 2 3 3
Nontax Revenue 2 3 2 2 2 2
Capital Revenue 0 1 1 1 1 1
Grants 11 11 11 10 9 7
Current 10 10 10 9 8 7
Capital 1 1 1 1 1 1
Total Expenditure & Lending Minus Repayment 15 17 17 17 14 13
Total Expenditure 15 17 17 17 14 13
Current Expenditure 12 14 14 13 12 11
Wages & Salanes 5 5 5 5 4 4
Other Purchases of Goods & Services 5 5 5 4 4 4
Interest Payments 0 0 0 0 0 0
Subsidies & Other Current Transactions 1 1 1 1 1 1
Other Current Expenditure 2 2 2 2 2 2
Capital Expenditure 2 3 3 4 2 2
Acquisition of Fixed Capital Assets 2 3 3 3 2 2
Capital Transfers 0 1 1 I 1 0
Lending Minus Repayments 0 0 0 0 0 -1
Privatization Revenue 0 0 0 0 0 1
Overal Deficit/Surplus 1 1 0 -1 0 1Overal Deficit/Surplus excl. Privatization Revenue 1 0 0 -1 0 0* Consolidated for Local governments, but not for General GovernmentSource: Ministry of Finance.
216
Table 4.3: Tax and Contrbution Rates, 1993-20001998 1999
1993 1994 1995 1996 1997 expected budgeted 2000
Personal Income Taxhighest rate 40 44 44 48 42 42 40average effective ratel 19.9 18.1 20.6 22.9 20.6 20.8 20.9
Corporate income taxnonnal rate 40 36 18 18 18 18 18dividend-withholding tax2 - - 23 23 20 20 20
VAT
normal rate 25 25 25 25 25 25 25
reduced rate 6 10 12 12 12 12 12
pharmaceuticals and other3 0 0 0 0 0 0 0
Payroll 63 60.8 60 58.5 59.5 59 54.4 54.8
Covered wage bill (% of GDP) 23.6% 22.2% 21.7% 21.5%
Breakdown in payroll taxesEmployer's 51 49.3 48.5 47 47 47.5 41.9 41.3
o/w Pension 24.5 24.5 24.5 24.5 24 24 22 21
Health 19.5 19.5 19.5 18 15 15 11 11Flat Health Tax4 - - - - 3.5 3.8 5.3 5.5Income Related Health Tax (11 %)5 - - - - - 0.7 0.6 0.5
Labour Market Fund 7 5 4.2 4.2 4.2 3.7 2.7 3Wage guarantee - 0.3 0.3 0.3 0.3 0.3 0.3 0.3
Employee's 12 11.5 11.5 11.5 12.5 11.5 12.5 13.5
o/w Pension 6 6 6 6 7 7 8 9
olw in multi-pillar2nd pillar - - - 6 7 8
PAYG - - - 1 1 1Health 4 4 4 4 4 3 3 3
Labour Market Fund 2 1.5 1.5 1.5 1.5 1.5 1.5 1.5
I/ progressive taxes/progressively taxed income
2/ additional tax payed on distributed dividend
3/ electricity in 1993, school books and paper nappies in 1999
4/ for the purpose of this table, the revenues from flat health tax have been expressed as percentage of the payroll tax base
5/ for the purpose of this table, the revenues from the income related health tax (11 %) have been expressed as percentage of payroll tax base
Source: Ministry of Finance.
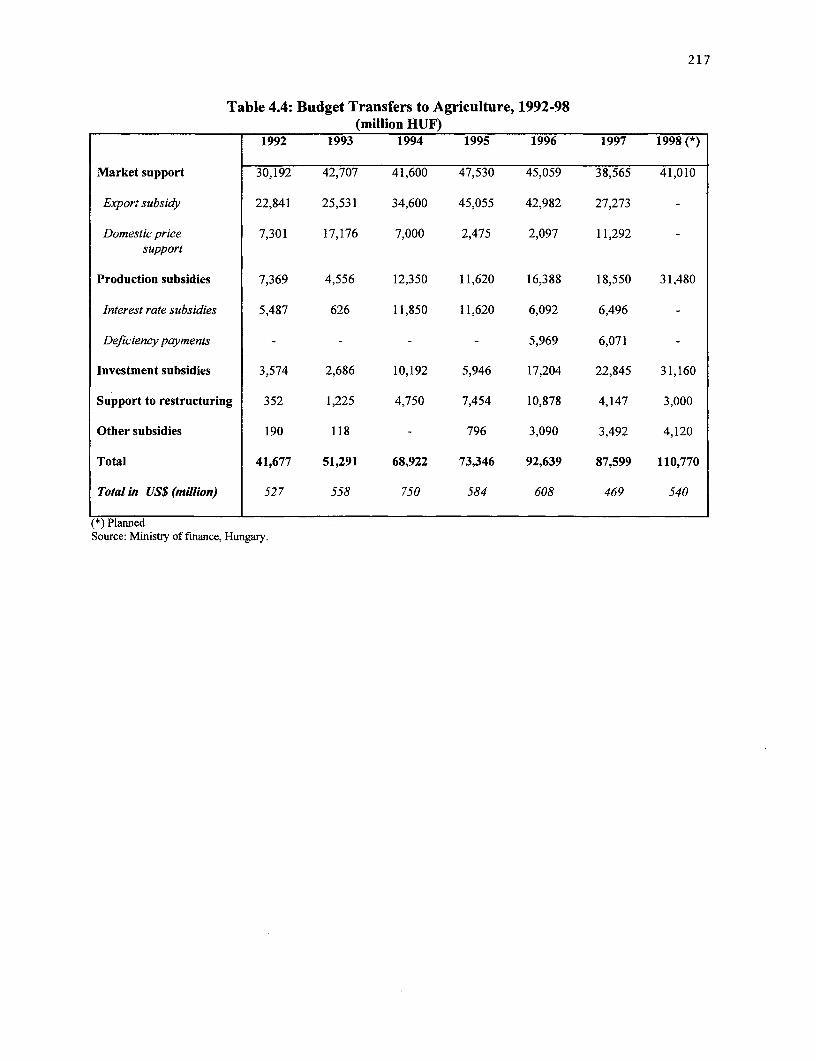
217
Table 4.4: Budget Transfers to Agriculture, 1992-98(million 1I11)
1992 1993 1994 1995 1996 1997 1998 (*)
Market support 30,192 42,707 41,600 47,530 45,059 38,565 41,010
Export subsidy 22,841 25,531 34,600 45,055 42,982 27,273 -
Domestic price 7,301 17,176 7,000 2,475 2,097 11,292 -
support
Production subsidies 7,369 4,556 12,350 11,620 16,388 18,550 31,480
Interest rate subsidies 5,487 626 11,850 11,620 6,092 6,496 -
Deficiencypayments - - - - 5,969 6,071 -
Investment subsidies 3,574 2,686 10,192 5,946 17,204 22,845 31,160
Support to restructuring 352 1,225 4,750 7,454 10,878 4,147 3,000
Other subsidies 190 118 - 796 3,090 3,492 4,120
Total 41,677 51,291 68,922 73,346 92,639 87,599 110,770
Total in USS (million) 527 558 750 584 608 469 540
(*) PlannedSource: Ministry of finance, Hungary.
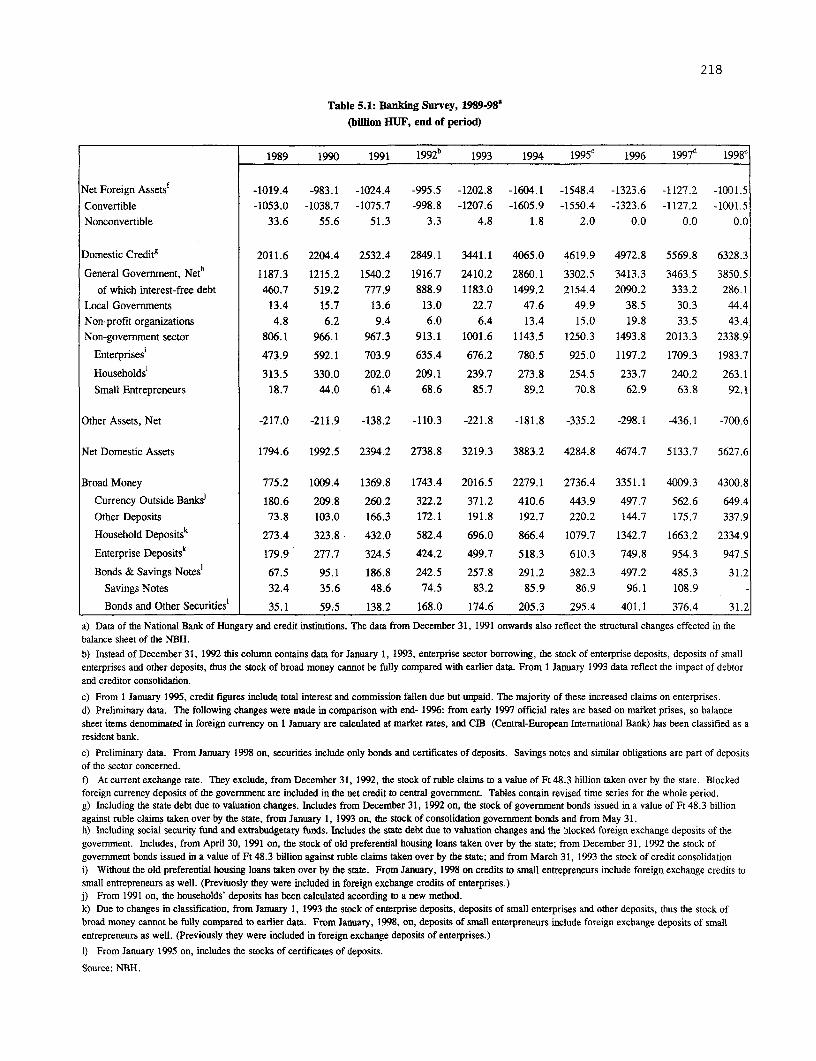
218
Table 5.1: Banking Survey, 1989-98a(billion HUF, end of period)
1989 1990 1991 1 9 92 1993 1994 1995c 1996 19 9 7d 1998e
Net Foreign Assetsf -1019.4 -983.1 -1024.4 -995.5 -1202.8 -1604.1 -1548.4 -1323.6 -1127.2 -1001.5
Convertible -1053.0 -1038.7 -1075.7 -998.8 -1207.6 -1605.9 -1550.4 -1323.6 -1127.2 -1001.5
Nonconvertible 33.6 55.6 51.3 3.3 4.8 1.8 2.0 0.0 0.0 0.0
Domestic Credit' 2011.6 2204.4 2532.4 2849.1 3441.1 4065.0 4619.9 4972.8 5569.8 6328.3
General Government, Neth 1187.3 1215.2 1540.2 1916.7 2410.2 2860.1 3302.5 3413.3 3463.5 3850.5
of which interest-free debt 460.7 519.2 777.9 888.9 1183.0 1499.2 2154.4 2090.2 333.2 286.1
Local Governments 13.4 15.7 13.6 13.0 22.7 47.6 49.9 38.5 30.3 44.4
Non-profit organizations 4.8 6.2 9.4 6.0 6.4 13.4 15.0 19.8 33.5 43.4
Non-government sector 806.1 966.1 967.3 913.1 1001.6 1143.5 1250.3 1493.8 2013.3 2338.9
Enterprises' 473.9 592.1 703.9 635.4 676.2 780.5 925.0 1197.2 1709.3 1983.7
Householdsi 313.5 330.0 202.0 209.1 239.7 273.8 254.5 233.7 240.2 263.1
Small Entrepreneurs 18.7 44.0 61.4 68.6 85.7 89.2 70.8 62.9 63.8 92.1
Other Assets, Net -217.0 -211.9 -138.2 -110.3 -221.8 -181.8 -335.2 -298.1 -436.1 -700.6
Net Domestic Assets 1794.6 1992.5 2394.2 2738.8 3219.3 3883.2 4284.8 4674.7 5133.7 5627.6
Broad Money 775.2 1009.4 1369.8 1743.4 2016.5 2279.1 2736.4 3351.1 4009.3 4300.8
Currency Outside Banks ~ 180.6 209.8 260.2 322.2 371.2 410.6 443.9 497.7 562.6 649.4
Other Deposits 73.8 103.0 166.3 172.1 191.8 192.7 220.2 144.7 175.7 337.9
Household Depositsk 273.4 323.8 432.0 582.4 696.0 866.4 1079.7 1342.7 1663.2 2334.9
Enterprise Depositsk 179.9 277.7 324.5 424.2 499.7 518.3 610.3 749.8 954.3 947.5
Bonds & Savings Notes] 67.5 95.1 186.8 242.5 257.8 291.2 382.3 497.2 485.3 31.2
Savings Notes 32.4 35.6 48.6 74.5 83.2 85.9 86.9 96.1 108.9 -
Bonds and Other Securities' 35.1 59.5 138.2 168.0 174.6 205.3 295.4 401.1 376.4 31.2
a) Data of the National Bank of Hungary and credit institutions. The data from December 31, 1991 onwards also reflect the structural changes effected in thebalance sheet of the NBH.b) Instead of December 31, 1992 this column contains data for January 1, 1993, enterprise sector borrowing, the stock of enterprise deposits, deposits of smallenterprises and other deposits, thus the stock of broad money cannot be fully compared with earlier data. From 1 January 1993 data reflect the impact of debtorand creditor consolidation.
c) From I January 1995, credit figures include total interest and commission fallen due but unpaid. The majority of these increased claims on enterprises.d) Preliminary data. The folowing changes were made in comparison with end- 1996: from early 1997 official rates are based on market prises, so balancesheet items denominated in foreign currency on I January are calculated at market rates, and CIB (Central-European International Bank) has been classified as aresident bank.
e) Preliminary data. From January 1998 on, securities include only bonds and certificates of deposits. Savings notes and similar obligations are part of depositsof the sector concerned.f) At current exchange rate. They exclude, from December 31, 1992, the stock of ruble claims to a value of Ft 48.3 billion taken over by the state. Blockedforeign currency deposits of the government are included in the net credit to central government. Tables contain revised time series for the whole period.g) Including the state debt due to valuation changes. Includes from December 31, 1992 on, the stock of government bonds issued in a value of Ft 48.3 billionagainst ruble claims taken over by the state, from January 1, 1993 on, the stock of consolidation government bonds and from May 31.h) Including social security fund and extrabudgetary funds. Includes the state debt due to valuation changes and the Blocked foreign exchange deposits of thegovernment. Includes, from April 30, 1991 on, the stock of old preferential housing loans taken over by the state; from December 31, 1992 the stock ofgovernment bonds issued in a value of Ft 48.3 billion against ruble claims taken over by the stat; and from March 31, 1993 the stock of credit consolidationi) Without the old preferential housing loans taken over by the state. From January, 1998 on credits to small entrepreneurs include foreign exchange credits tosmall entrepreneurs as weUl. (Previuosly they were included in foreign exchange credits of enterprises.)j) From 1991 on, the households' deposits has been calculated according to a new method.k) Due to changes in classification, from January 1, 1993 the stock of enterprise deposits, deposits of smaU enterprises and other deposits, thus the stock ofbroad money cannot be fully compared to earlier data. From January, 1998, on, deposits of small enterpreneurs include foreign exchange deposits of smallentrepreneurs as well. (Previously they were included in foreign exchange deposits of enterprises.)
I) From January 1995 on, includes the stocks of certificates of deposits.
Source: NBH.
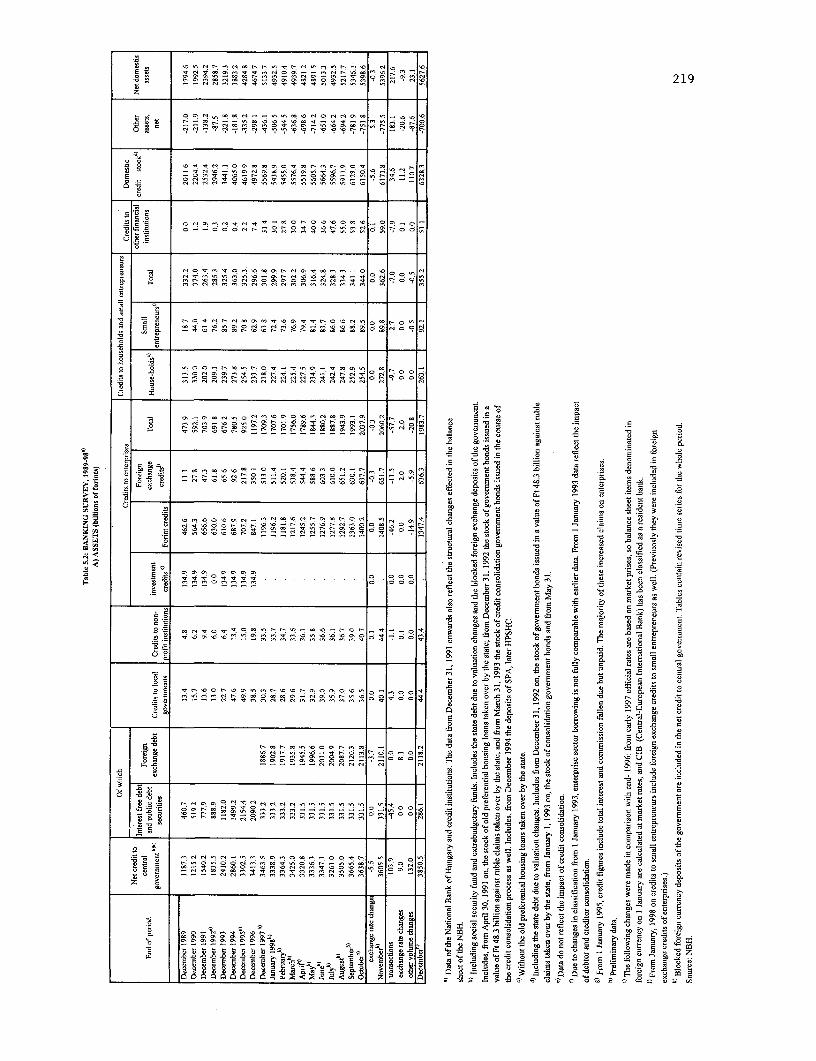
2 000N0000N000t- t0000N. 0 I
0~~~~~~~~~~~~~~~~~~~~~~~~~~~~~~~~~~~~~~~~~~~~1
0 = oo<,>,>£^ ftD& 0 Z a2
00~~~~~~0'~~~
- S~~~~~~~~~~~~~~~~~~-
S ~~~~-~ - - - - - -° - - - - - - - - -
P Z 0-
o 2~~ ~~ ~~~~~~~~~~~~~~~~~~~o4
.0 . . t~~~~~~~~~~~~~~~~00
0 0
= ~ ~ ~ ~ ~ ~ C _'00C00,.., CAN e0
o. 00 0 e0. NovX^n-
o ° > tn m n nO a > ° O 0tt $ e ,~CC0
, r O o0 m
ki 02 t 22A0
E0 z -8 <s e 00 R 00N R - > rl , Z- O O | O
0 =~2 > No 0'C0oo 9 > 2 o 9CO N b
o°2.22 800 = _, _, 2
s O ° aa > >' n> > > >> > 6 ¢n n O 0,> .0 2. 0 _
D.° Q s ~~~~~~~~- - 2 U"2 a 0 j o°C o2 12
s: E = _ ._2 o
.= Q _ _ e ° 4 ° 2 E -E3 .e:2 E O 0
g 00'r 000000 ^F 0 ._ 0 0 0 2 ggg< =E = , 00000000 >off 6o > 0 w ,.2 =°X 0 . 3= 2oe
-c 0 o> co 2 0:@ooo>^X _ N E .0, °c 0 Coo oa_t° a, , O o ~ =-$ l
u 0 _ _ = 4 e > n > t = = E , v 0 = 23
° _ o2 0 B2 > s.n0 . >vvv v f ir
_ _ _ _ 002 *d) o. .. >§l~Q
| . < 2 -GS{=E

Table 5.3: BANKING SURVEY, 1989-98"B) LIABILITIES (billions of forints)
Broad money (M3)
C-rrenicy outsidc harks Enterprise deposits llousehold and small entreprencur Household and small Other deposits
End of period r o dcposits entrepreneur deposits e Bonds and saving notes)
' Certifi- Bonds and
5 u . .e + L t1 Household deposits t Local t Ne0 0 e ~~~~~~~~~~~~~~~~~csmall entre. Total" gover- "nl." Other Towa Savigs cats of other Total Grand total laiii
Forms Poseigo preneurs'~~~~~~~~~~ meuts deposits securities~ilailten ~~~~~~~~~~F, Total
December 1989 -33.6 1019.4 146.8 33.8 180.6 166.2 13.7 179:9 252.9 20.5 273.4 23.9 297.3 35.3 5.6 9.0 49.9 32.4 13A4 21.7 67T5 775.2 1794.6
December 1990 -55.6 983.1 165.8 44.0 209.8 228.2 49.5 277.7 261.3 62.5 323.8 36.6 360.4 43.6 10.8 120 66.4 35.6 33.6 25.9 95.1 1009.4 1992.5
December 1991 -51.3 10244 189,0 71.2 260.2 258.6 65.9 324,5 3025 129.5 432.0 57.5 489.5 58.7 26.0 241 108.8 48.6 823 559 186.8 1369.8 2394.2
December 1992 -3.3 996.1 246.1 76.1 322.2 332.3 63.2 395 5 429.8 152.6 582.4 61.8 644.2 73.5 46.6 23.8 143.9 74.5 91.0 77.0 242.5 1748.3 2858.7
December 1993 -4.8 1202.8 294.7 76.5 371.2 374.7 125.0 499.7 491.3 204.7 696.0 33.2 729.2 74.7 53 3 30.6 158.6 83.2 91.7 82.9 257.8 2016.5 3219.3
December 1994 -1.8 1604.1 333.2 77.4 410.6 406.2 112.1 518.3 5727 293.7 866.4 32.0 898.4 69.4 58.3 33.0 160.7 85.9 91.8 113.4 291.1 2279.1 3883.2
December 1995 -2 0 1548.4 380.4 63.5 443.9 422.8 187.5 610.3 640.7 439.0 1079.7 34.1 1t13 8 80.7 67.9 37.5 186.1 86,9 295.4 382.3 2736.4 4284.8Decehber 1996 1323.6 425.1 72.6 497.7 545.2 204.6 749.8 857.9 484.8 1342.7 48.6 1391.3 86.2 81.0 47.9 215.1 96.1 . 401.1 497.2 3351 1 4674.7
December 1997 . 1127.2 496.9 65.7 562.6 719.6 234.6 954.3 11404 522.8 1663.2 66.8 1730.0 115.8 91.7 68.2 275.7 108.9 375.1 484.0 4006.6 5133.7
January 1998 1123.8 478.5 60.3 538.8 600.4 224.4 824.9 1581.6 530.0 2111.6 69.3 2181.0 98.3 94.0 32.2 224.6 39.5 39.5 3808.8 4932.5Februarytsi . 1054.8 485.8 61.4 547.2 628.4 216.2 844.5 1595.2 533.0 2128.3 71.2 2199.5 97.8 95.5 33.2 226.5 . 37.8 37.8 3855.5 4910.4
Msrch9b . 1006.9 489.4 62 3 551 7 654.8 227.0 881.8 1598.4 536.8 2135.2 70.4 2205.6 112.4 97.7 48 1 258.2 . 35.5 35.5 3932.8 4939.7
Aprilt9h) 882.5 521.3 63.0 584.3 623.4 237.0 860.5 1610.3 540.0 2150.3 69.9 2220.2 96.4 98.2 44.6 239.2 . . 34.5 34.5 3938.7 4821.2
May0i) 883.0 522.4 65.2 587.6 665.2 226.4 891.6 1612.6 551.3 2163.8 764 2240.2 94.7 97.4 62.9 255.1 . 34.0 34.0 4008.5 4891.5
Junet s' 932.9 521.4 66.3 587.7 709.2 233.9 943.1 1623.6 560.1 2183.7 77.4 2261.0 93.1 97.6 65.0 255.7 . 32.9 32.9 40804 5013.3
Julyi,) . 811.3 549.1 66 1 615.2 706.5 230.7 937.1 1663.5 558.2 2221.7 7 2302300.2 84.4 98.7 93.0 236.1 . . 32.6 32.6 4121.2 4932.5
AugusslEt . 964.8 5736 69.0 642.6 734.2 242.8 9771 1683.5 586.4 2270.0 86.7 2356.7 87 99.4 57.1 244.3 32.2 32.2 4252.9 5217.7
September00
) 1074.2 569.2 71.3 640.6 713.9 232.0 945.9 1704.5 600.6 2305.0 833 2388 3 113.3 99.0 53.1 265.3 . . 31.8 31.8 4271.9 5346.1
Octobers')1
, 1097.7 579.3 701 649.4 696.6 250.9 947.5 1729.8 605.1 2334.9 84.0 2418.8 99.8 104.1 50.8 253.9 . 31.2 31.2 4300.8 5398.6
Novembert
_) 1018.2 583.7 78.2 661.9 741.6 241.0 982.5 1747.6 608.1 2355.7 90.1 2445.9 93.4 103.2 60.6 257.2 . 30.5 30.5 4378.0 5396.2
transactions 0.0 -28.8 5.9 -1.1 4.7 61.3 -118 49.4 151.3 6.2 1975 -6.8 1.8 30.1 2.7 10.4 43.2 0.0 0.0 -1.6 -1.6 246.4 217.6
euchangeratechanges 0.0 -11.0 8. 00 00 0.0 0.1 0.1 80 1.3 1.3 0.0 1.3 0.0 0.1 0.1 0.2 0.0 0.0 0.0 .0 16 -9.3other volume ch 0.0 23.1 0.0 0.0 0.0 0.8 0.0 0.0 .0 0.0 0.0 8.0 0.8 0.0 0 0.0 0.0 0.0 0.0 0.0 23.1
Decembern__ 1001.5 589.5 77.1 666.6 802.8 229.3 1032.1 1898.9 615.6 2514.5 83.4 2597.9 123.5 712 300.5 289 28.9 4626.8 5627.6
a) Data of the National Bank of Hungary and credit institutions.The data from December 31, 1991 onvvards also reflect the structural changes effected in the balance sheet of the
NBH.
b) At current exchange rate. They exclude, from December 31, 1992, the stock of ruble claims to avalue ofFt 48.3 billion taken over by the state.
c) From 1991 on, the households deposits has been calculated according to a newmethod
d) Due to changes in classification, from January 1, 1993 the stock of enterprise deposits, deposits of small enterprises and other deposits, thus the stock of broad money cannot
be fully compared to earlier data.e) From January 1995 on, includes the stocks of cerificates of deposits.
f) Preliminary data.g) The following changes were made in comparison with end- 1996: from early 1997 offficial rates are based on market prises, so balance sheet items denominated in foreign
currency on I JanuaTy are calculated at market rates, and CIB (Central-European International Bank) has been classified as a resident bank.
h) From January 1998 on, securities include only bonds and certificates of deposits. Savings notes and similar obligations are part of deposits of the sector concerned.
i) From January, 1998 on, deposits of small entrepreneurs include foreign exchange deposits of small entrepreneurs as well . (Previously they
were included in foreign exchange deposits of enterprises.)j) Blocked foreign currency deposits of the government are included in the net credit to central government. Tables contain revised time series for the whole period.
Source: NBH.
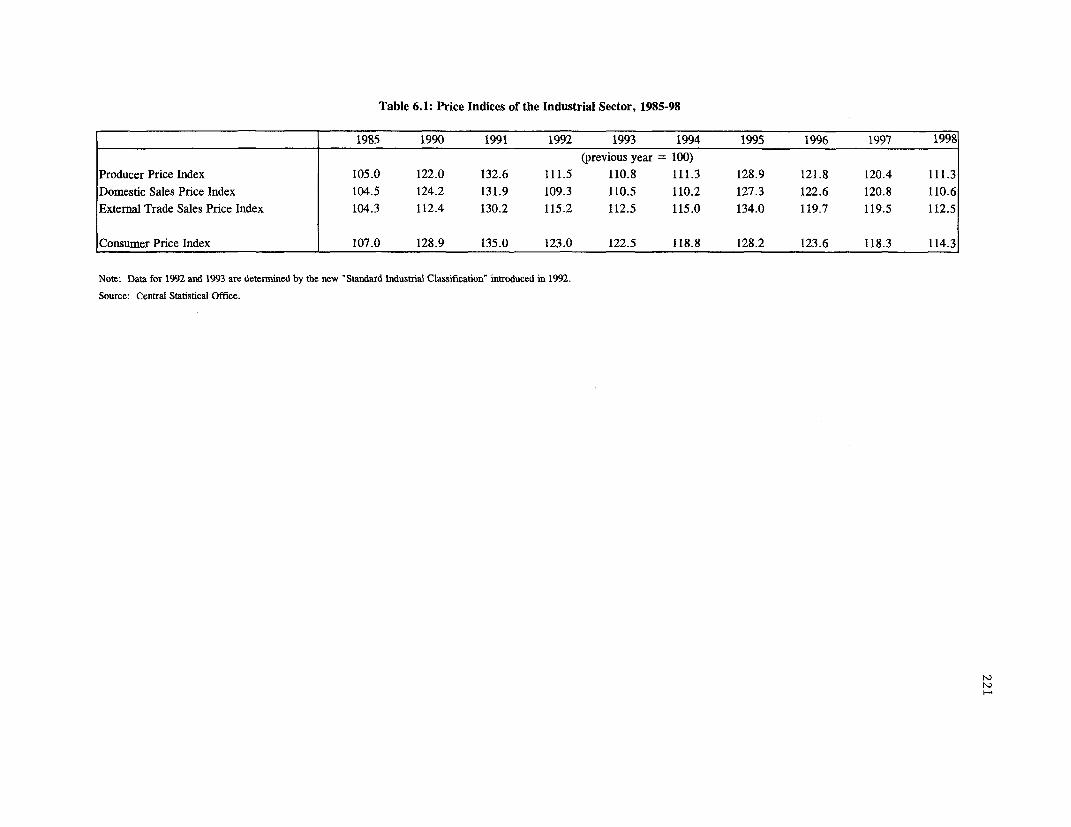
Table 6.1: Price Indices of the Industrial Sector, 1985-98
1985 1990 1991 1992 1993 1994 1995 1996 1997 1998
(previous year = 100)
Producer Price Index 105.0 122.0 132.6 111.5 110.8 111.3 128.9 121.8 120.4 111.3
Domestic Sales Price Index 104.5 124.2 131.9 109.3 110.5 110.2 127.3 122.6 120.8 110.6
Extemal Trade Sales Price Index 104.3 112.4 130.2 115.2 112.5 115.0 134.0 119.7 119.5 112.5
Consumer Price Index 107.0 128.9 135.0 123.0 122.5 118.8 128.2 123.6 118.3 114.3
Note: Data for 1992 and 1993 are determined by the new "Standard Industrial Classification" introduced in 1992.
Source: Central Statistical Office.

222
Table 6.2: Labor Income, Wage Bill and Covered Wage Bill, 1985-98in billion HUF, current prices
1995 1996 1997 1998 1995/98
GDP 5614 6893.9 8541.4 10235 -
Total Labour Income/GDP 54.3% 53.4% 51.9% 51.9% 95.5%Employer Contribution/GDP 13.0% 11.9% 12.0% 11.9% 91.4%Labor part of Mixed Income/GDP 7.4% 7.8% 6.8% 6.7% 91.3%
Wage Bill/GDP 33.9% 33.7% 33.1% 33.3% 98.0%Wage Bill/ Total Labour Income 62.5% 63.1% 63.7% 64.1% 102.6%
Covered Wage Bill/Wage Bill 69.6% 65.8% 65.6% 64.7% 92.9%Covered WageBill/GDP 23.6% 22.2% 21.7% 21.5% 91.1%Source: Central Statistics Office.
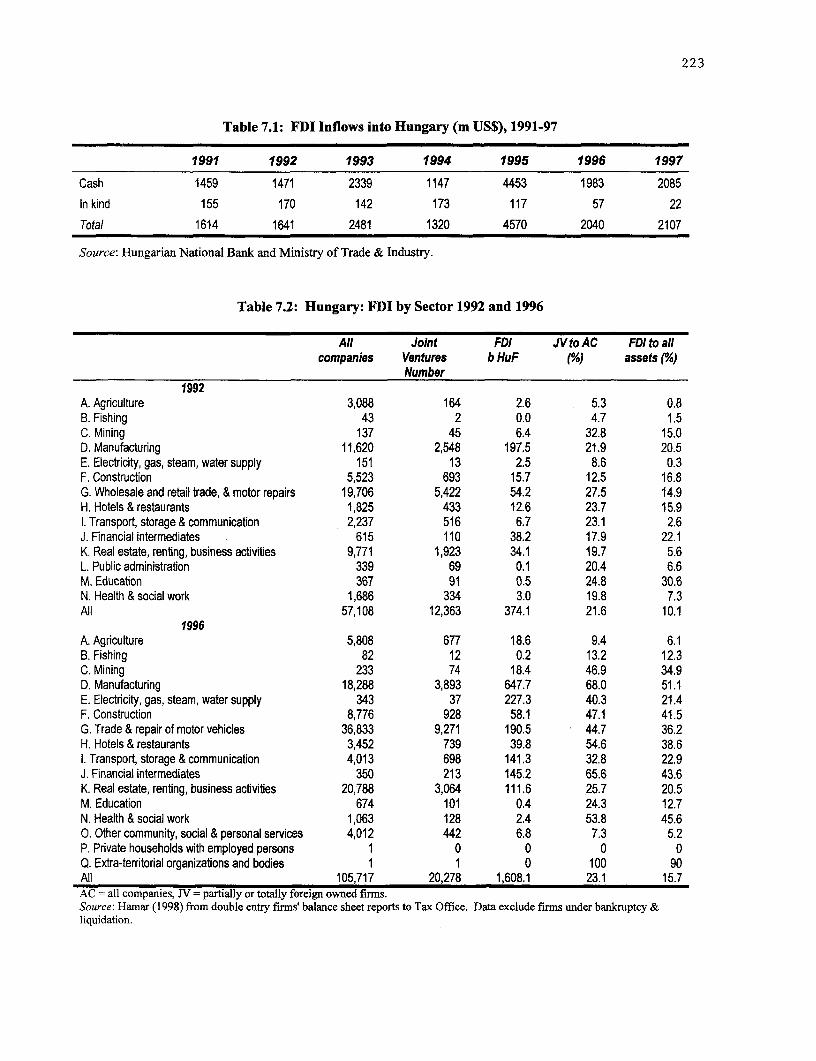
223
Table 7.1: FDI Inflows into Hungary (m US$), 1991-97
1991 1992 1993 1994 1995 1996 1997
Cash 1459 1471 2339 1147 4453 1983 2085In kind 155 170 142 173 117 57 22Total 1614 1641 2481 1320 4570 2040 2107
Source: Hungarian National Bank and Ministry of Trade & Industry.
Table 7.2: Hungary: FDI by Sector 1992 and 1996
All Joint FDI JVtoAC FDI to allcompanies Ventures b HuF (%) assets (°/0)
Number1992
A. Agriculture 3,088 164 2.6 5.3 0.8B. Fishing 43 2 0.0 4.7 1.5C. Mining 137 45 6.4 32.8 15.0D. Manufacturing 11,620 2,548 197.5 21.9 20.5E. Electricity, gas, steam, water supply 151 13 2.5 8.6 0.3F. Construction 5,523 693 15.7 12.5 16.8G. Wholesale and retail trade, & motor repairs 19,706 5,422 54.2 27.5 14.9H. Hotels & restaurants 1,825 433 12.6 23.7 15.9I. Transport, storage & communication 2,237 516 6.7 23.1 2.6J. Financial intermediates 615 110 38.2 17.9 22.1K. Real estate, renting, business activities 9,771 1,923 34.1 19.7 5.6L. Public administration 339 69 0.1 20.4 6.6M. Education 367 91 0.5 24.8 30.6N. Health & social work 1,686 334 3.0 19.8 7.3All 57,108 12,363 374.1 21.6 10.1
1996A. Agriculture 5,808 677 18.6 9.4 6.1B. Fishing 82 12 0.2 13.2 12.3C. Mining 233 74 18.4 46.9 34.9D. Manufacturing 18,288 3,893 647.7 68.0 51.1E. Electricity, gas, steam, water supply 343 37 227.3 40.3 21.4F. Construction 8,776 928 58.1 47.1 41.5G. Trade & repair of motor vehicles 36,833 9,271 190.5 44.7 36.2H. Hotels & restaurants 3,452 739 39.8 54.6 38.6I. Transport, storage & communication 4,013 698 141.3 32.8 22.9J. Financial intermediates 350 213 145.2 65.6 43.6K. Real estate, renting, business activities 20,788 3,064 111.6 25.7 20.5M. Education 674 101 0.4 24.3 12.7N. Health & social work 1,063 128 2.4 53.8 45.60. Other community, social & personal services 4,012 442 6.8 7.3 5.2P. Private households with employed persons 1 0 0 0 0Q. Extra-territorial organizations and bodies 1 1 0 100 90All 105,717 20,278 1,608.1 23.1 15.7AC = all companies, JV = partially or totally foreign owned firms.Source: Hamar (1998) from double entry firms' balance sheet reports to Tax Office. Data exclude firms under bankruptcy &liquidation.
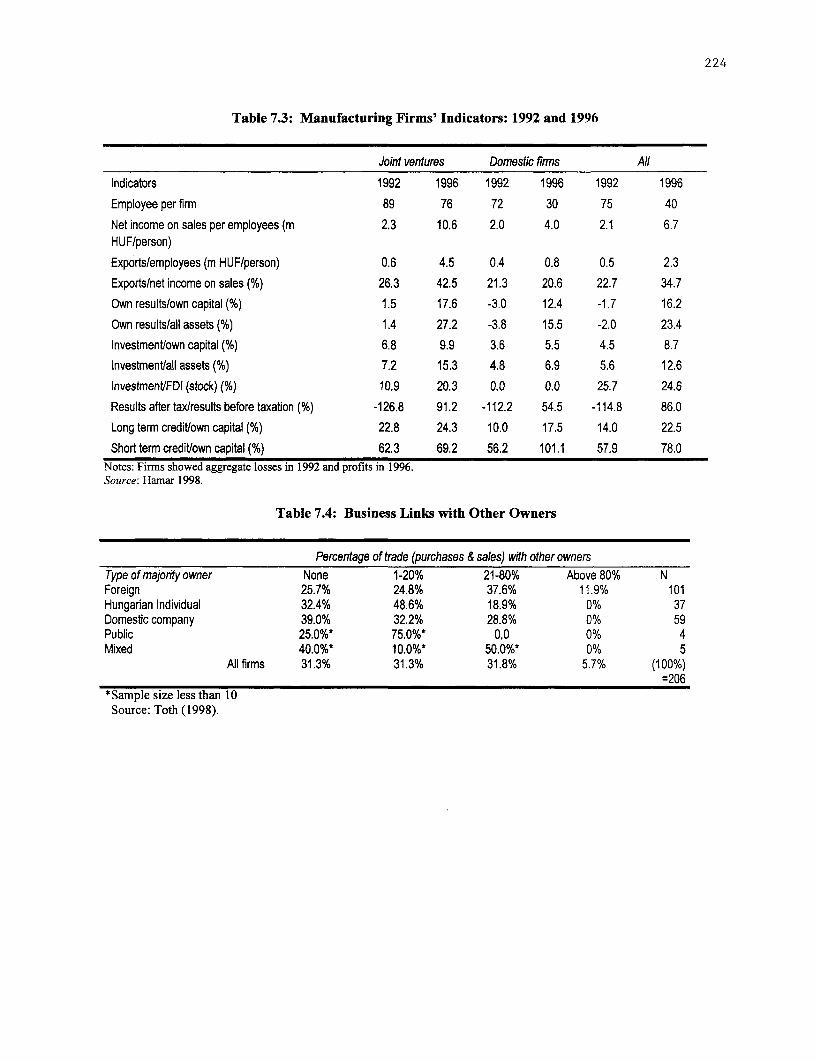
224
Table 7.3: Manufacturing Firms' Indicators: 1992 and 1996
Joint ventures Domestic fnims All
Indicators 1992 1996 1992 1996 1992 1996
Employee per firm 89 76 72 30 75 40
Net income on sales per employees (m 2.3 10.6 2.0 4.0 2.1 6.7HUF/person)
Exports/employees (m HUF/person) 0.6 4.5 0.4 0.8 0.5 2.3
Exports/net income on sales (%) 26.3 42.5 21.3 20.6 22.7 34.7
Own results/own capital (%) 1.5 17.6 -3.0 12.4 -1.7 16.2
Own results/all assets (%) 1.4 27.2 -3.8 15.5 -2.0 23.4
Investment/own capital (%) 6.8 9.9 3.6 5.5 4.5 8.7
InvestmenVall assets (%) 7.2 15.3 4.8 6.9 5.6 12.6
lnvestment/FDI (stock) (%) 10.9 20.3 0.0 0.0 25.7 24.6
Results after tax/results before taxaion (%) -126.8 91.2 -112.2 54.5 -114.8 86.0
Long term creditown capital (%) 22.8 24.3 10.0 17.5 14.0 22.5
Short term crediVown capital (%) 62.3 69.2 56.2 101.1 57.9 78.0Notes: Finns showed aggregate losses in 1992 and profits in 1996.Source: Hamar 1998.
Table 7.4: Business Links with Other Owners
Percentage of trade (purchases & sales) with other ownersType of majority owner None 1-20% 21-80% Above 80% NForeign 25.7% 24.8% 37.6% 11.9% 101Hungarian Individual 32.4% 48.6% 18.9% 0% 37Domestc company 39.0% 32.2% 28.8% 0% 59Public 25.0%* 75.0%* 0,0 0% 4Mixed 40.0%* 10.0%* 50.0%* 0% 5
All firms 31.3% 31.3% 31.8% 5.7% (100%)=206
*Sarnple size less than 10Source: Toth (1998).

225
Table 7.5: International Comparison: Enterprise Losses (in % of GDP), 1992-97
1992 1993 1994 1995 1996 1997GROSS LOSSES
INDUSTRYCzech Republic 4.1 2.6 2.0 2.5 2.2Slovenia 10.0 4.8 3.8 3.7 4.7 3.4Poland 2.0 2.1 1.7Slovak Republic 5.6 4.1 3.2 5.4 5.3MANUFACTURINGCzech Republic 3.7 2.3 1.8 2.3 1.9Slovenia 6.8 3.3 2.6 3.0 3.4 2.2Poland 2.0 1.7 1.5Slovak Republic 4.7 3.7 2.9 4.6 4.5
NET PROFITSINDUSTRYCzech Republic 4.4 5.1 5.5 2.8 2.6Slovenia -9.1 -3.6 -1.9 -1.7 -2.5 -0.4Poland 3.8 4.0 3.0Slovak Republic 7.2 5.8 6.6 3.9 2.9MANUFACTURINGCzech Republic 0.3 1.7 2.4 0.7 1.5Slovenia -6.0 -2.2 -0.9 -1.2 -1.5 0.3Poland 2.3 2.9 2.7Slovak Republic -0.2 0.3 1.5 -0.1 -0.1
Notes: Data are before tax and before distribution of dividends. In the Czech Republic, data are for non-financialenterprises with 100 or more employees. In Slovak Republic, data through 1996 are for enterprises with 25 ormore employees, and in 1997 with 20 or more employees. In Slovenia until 1994 data was complied according tothe Uniform Classification of activities, since 1995 data have been classified according to Standard Classificationof Activities
Sources: Statistical Offices of the respective countries.
Table 7.6: Number of Owners, and Whether They Held Majorities, 1995
Number of owners Percentages offirms Percentage offirms with single
majority owner
One 19 19
Two 31 29
Three 25.2 19
No more than three 75.2 66.2
More than three 24.8 14.8
Sample size (N) 210 210
'Manufacturing firms with 100 to 200 employeesSource: Abraham (unpublished manuscript, February 1996).
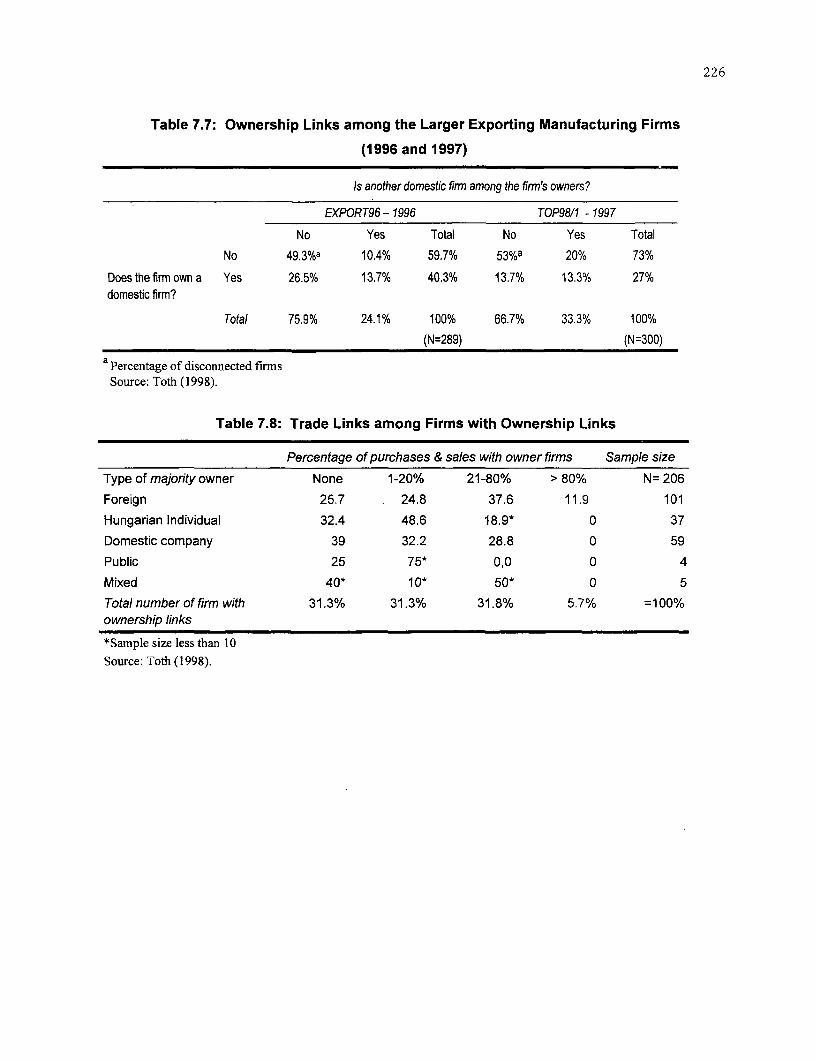
226
Table 7.7: Ownership Links among the Larger Exporting Manufacturing Firms
(1996 and 1997)
Is another domestic finn among the firn's owners?
EXPORT96 - 1996 TOP9811 - 1997
No Yes Total No Yes TotalNo 49.3%a 10.4% 59.7% 53%a 20% 73%
Does the firm own a Yes 26.5% 13.7% 40.3% 13.7% 13.3% 27%domestc firm?
Total 75.9% 24.1% 100% 66.7% 33.3% 100%(N=289) (N=300)
aPercentage of disconnected firmsSource: Toth (1998).
Table 7.8: Trade Links among Firms with Ownership Links
Percentage of purchases & sales with owner firms Sample size
Type of majority owner None 1-20% 21-80% > 80% N= 206
Foreign 25.7 24.8 37.6 11.9 101
Hungarian Individual 32.4 48.6 18.9* 0 37
Domestic company 39 32.2 28.8 0 59
Public 25 75* 0,0 0 4
Mixed 40* 10* 50* 0 5
Total number of firm with 31.3% 31.3% 31.8% 5.7% =100%ownership links
*Sample size less than 10Source: Toth (1998).
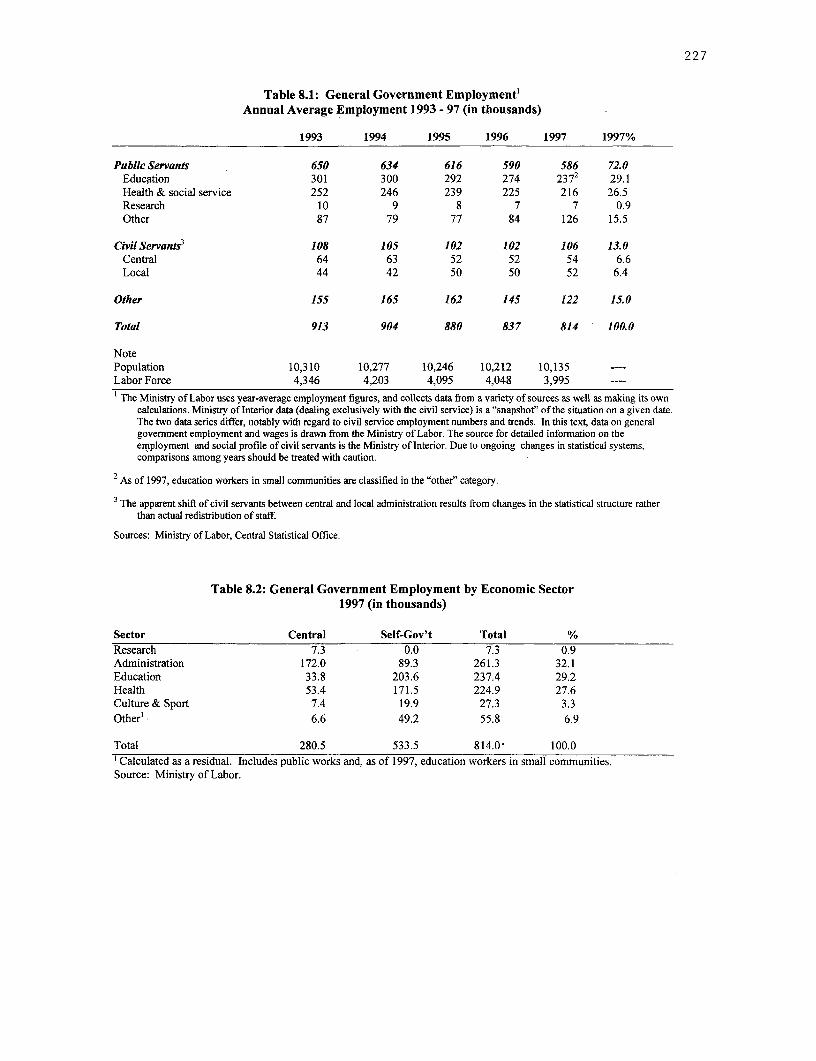
227
Table 8.1: General Government Employment'Annual Average Employment 1993 - 97 (in thousands)
1993 1994 1995 1996 1997 1997%
Public Servants 650 634 616 590 586 72.0Education 301 300 292 274 2372 29.1Health & social service 252 246 239 225 216 26.5Research 10 9 8 7 7 0.9Other 87 79 77 84 126 15.5
Civil Servants3 108 105 102 102 106 13.0Central 64 63 52 52 54 6.6Local 44 42 50 50 52 6.4
Other 155 165 162 145 122 15.0
Total 913 904 880 837 814 100.0
NotePopulation 10,310 10,277 10,246 10,212 10,135 ----Labor Force 4,346 4,203 4,095 4,048 3,995 ----
I The Ministry of Labor uses year-average employment figures, and collects data from a variety of sources as well as making its owncalculations. Ministry of Interior data (dealing exclusively with the civil service) is a "snapshot" of the situation on a given date.The two data series differ, notably with regard to civil service employment numbers and trends. In this text, data on generalgovemment employment and wages is drawn from the Ministry of Labor. The source for detailed infofrmation on theemployment and social profile of civil servants is the Ministry of Interior. Due to ongoing changes in statistical systems,comparisons among years should be treated with caution.
2 As of 1997, education workers in small communities are classified in the "other" category.
3The apparent shift of civil servants between central and local administration results from changes in the statistical structure ratherthan actual redistribution of staff.
Sources: Ministry of Labor, Central Statistical Office.
Table 8.2: General Government Employment by Economic Sector1997 (in thousands)
Sector Central Self-Gov't Total %Research 7.3 0.0 7.3 0.9Administration 172.0 89.3 261.3 32.1Education 33.8 203.6 237.4 29.2Health 53.4 171.5 224.9 27.6Culture & Sport 7.4 19.9 27.3 3.3
Other' 6.6 49.2 55.8 6.9
Total 280.5 533.5 814.0 100.0
'Calculated as a residual. Includes public works and, as of 1997, education workers in small communities.Source: Ministry of Labor.
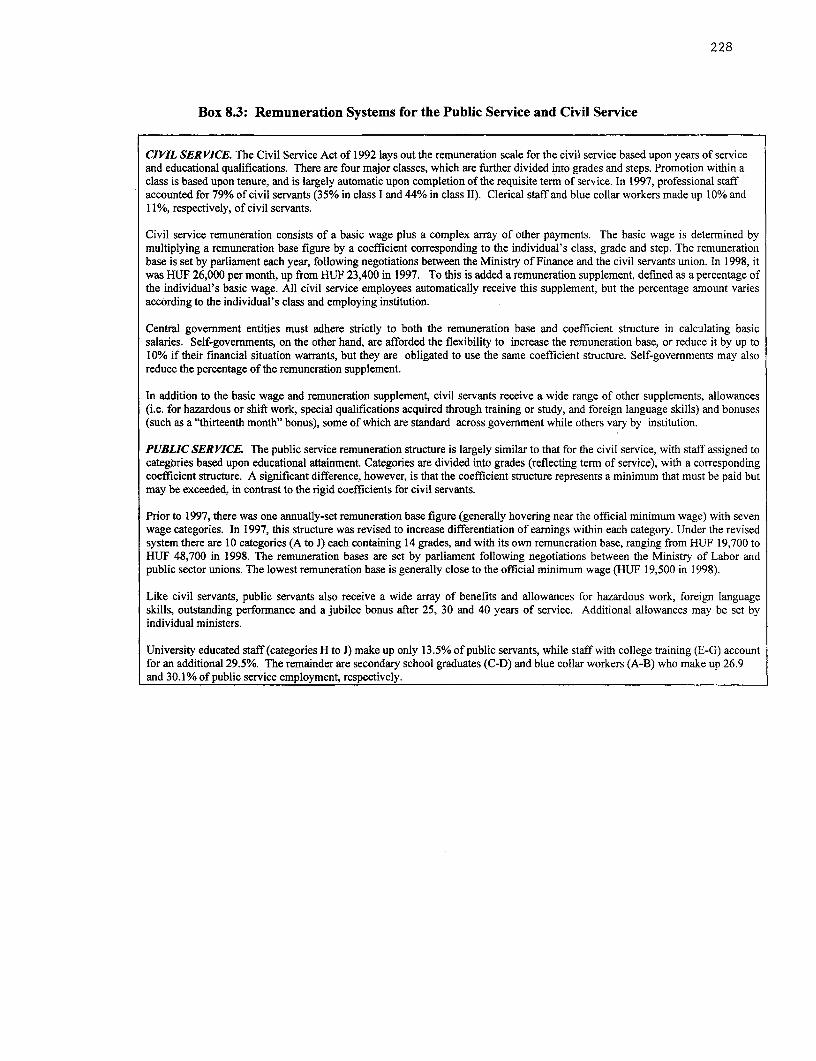
228
Box 8.3: Remuneration Systems for the Public Service and Civil Service
CIVIL SERVICE. The Civil Service Act of 1992 lays out the remuneration scale for the civil service based upon years of serviceand educational qualifications. There are four major classes, which are further divided into grades and steps. Promotion within aclass is based upon tenure, and is largely automatic upon completion of the requisite term of service. In 1997, professional staffaccounted for 79% of civil servants (35% in class I and 44% in class II). Clerical staff and blue collar workers made up 10% and11%, respectively, of civil servants.
Civil service remuneration consists of a basic wage plus a complex array of other payments. The basic wage is determined bymultiplying a remuneration base figure by a coefficient corresponding to the individual's class, grade and step. The remunerationbase is set by parliament each year, following negotiations between the Ministry of Finance and the civil servants union. In 1998, itwas HUF 26,000 per month, up from HUF 23,400 in 1997. To this is added a remuneration supplement, defined as a percentage ofthe individual's basic wage. All civil service employees automatically receive this supplement, but the percentage amount variesaccording to the individual's class and employing institution.
Central government entities must adhere strictly to both the remuneration base and coefficient structure in calculating basicsalaries. Self-governments, on the other hand, are afforded the flexibility to increase the remuneration base, or reduce it by up to10% if their financial situation warrants, but they are obligated to use the same coefficient structure. Self-governments may alsoreduce the percentage of the remuneration supplement.
In addition to the basic wage and remuneration supplement, civil servants receive a wide range of other supplements, allowances(i.e. for hazardous or shift work, special qualifications acquired through training or study, and foreign language skills) and bonuses(such as a "thirteenth month" bonus), some of which are standard across government while others vary by institution.
PUBLIC SERVICE. The public service remuneration structure is largely similar to that for the civil service, with staff assigned tocategories based upon educational attainment. Categories are divided into grades (reflecting term of service), with a correspondingcoefficient structure. A significant difference, however, is that the coefficient structure represents a minimum that must be paid butmay be exceeded, in contrast to the rigid coefficients for civil servants.
Prior to 1997, there was one annually-set remuneration base figure (generally hovering near the official minimum wage) with sevenwage categories. In 1997, this structure was revised to increase differentiation of earnings within each category. Under the revisedsystem there are 10 categories (A to J) each containing 14 grades, and with its own remuneration base, ranging from HUF 19,700 toHUF 48,700 in 1998. The remuneration bases are set by parliament following negotiations between the Ministry of Labor andpublic sector unions. The lowest remuneration base is generally close to the official minimum wage (HUF 19,500 in 1998).
Like civil servants, public servants also receive a wide array of benefits and allowances for hazardous work, foreign languageskills, outstanding performance and a jubilee bonus after 25, 30 and 40 years of service. Additional allowances may be set byindividual ministers.
University educated staff (categories H to J) make up only 13.5% of public servants, while staff with college training (E-G) accountfor an additional 29.5%. The remainder are secondary school graduates (C-D) and blue collar workers (A-B) who make up 26.9and 30.1% of public service employment, respectively.
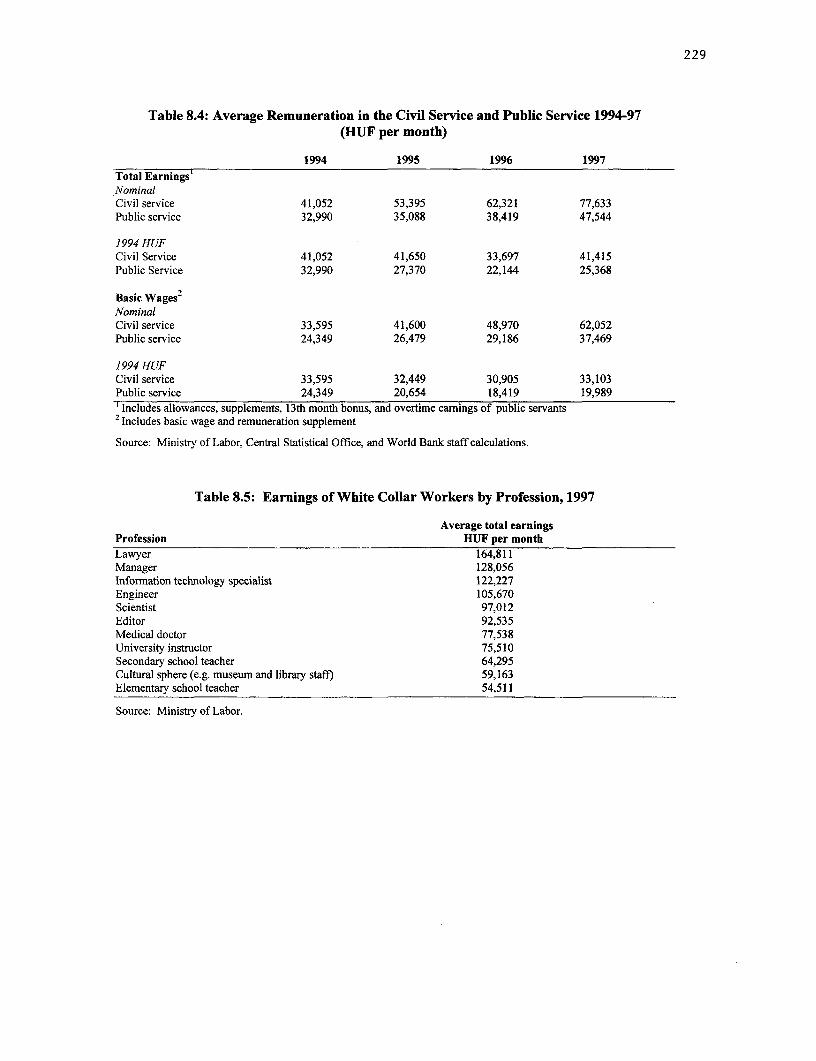
229
Table 8.4: Average Remuneration in the Civil Service and Public Service 1994-97(HUF per month)
1994 1995 1996 1997Total Earnings'NominalCivil service 41,052 53,395 62,321 77,633Public service 32,990 35,088 38,419 47,544
1994 HUFCivil Service 41,052 41,650 33,697 41,415Public Service 32,990 27,370 22,144 25,368
Basic Wages2
NominalCivil service 33,595 41,600 48,970 62,052Public service 24,349 26,479 29,186 37,469
1994 HUFCivil service 33,595 32,449 30,905 33,103Public service 24,349 20,654 18,419 19,989'Includes allowances, supplements, 13th month bonus, and overtime earnings of public servants2 Includes basic wage and remuneration supplement
Source: Ministry of Labor, Central Statistical Office, and World Bank staff calculations.
Table 8.5: Earnings of White Collar Workers by Profession, 1997
Average total earningsProfession HUF per monthLawyer 164,811Manager 128,056Information technology specialist 122,227Engineer 105,670Scientist 97,012Editor 92,535Medical doctor 77,538University instructor 75,510Secondary school teacher 64,295Cultural sphere (e.g. museum and library staff) 59,163Elementary school teacher 54,511
Source: Ministry of Labor.

230
Table 8.6: Civil Service - Enterprise Earnings Comparison by Rank1997 (HUF)
Occupational category Enterprise Civil Service' % enterprise(HUF) (HUF)
Director - State Secretary 175,523 -- --
Dep. Director - Dep. State Sec. 185,510 -- --
Head of Department 216,989 225,028 103.7Deputy Head of Department -- 184,000 --
Head & Deputy Head 159,369 146,920 92.2Univ. grad 0-1 yr. Experience 87,419 44,657 51.1Univ. grad 1+ yrs experience 123,562 101,219 81.9Secondary grad 0-1 yr. exp. 45,238 32,657 72.2Secondary grad 1+ yrs exp. 64,800 62,067 95.8Clerical, 0-0.5 yrs exp. 46,000 26,504 57.6Clerical, 0.5+ yrs. exp. 51,322 50,112 97.6Manual - unskilled 33,014 -- --
Manual - semi-skilled 42,370 40,477 95.5Manual - skilled 49,780 46,547 93.5Manual - highly skilled 83,686 -- --
' Includes civil servants in central administration and deconcentrated organs
Source: Ministry of Labor (National Labor Center).

231
Figure 8.1: Institutional Framework for EU Accession Activities in Hungary
.~~~~~~~~
| UItgaion Cabinet -
Inteap~ ~ ~ ~ ~ ~ ~ ~ ~ ~ ~~~~~~~~~~~~~~cinii atid TeSecrtiria
Strategyl Head of SSeWorking.I.
Group Inter-ministerial . iitrfoeBAffairs|Committee for -EU Integraliono.nn
.Aodministradve State Secretary for Integration... .. ~~~~~(SSI)
EU Co-rdnation Deput State Deputy StateDepartinent Scctetay Secretary
ITerritorial Departments EU EecoTnosic PolicyEU Political Riations
Integration | Working ~~NATO and WEU Department EC Hegalnisartnca
Deatents | rusEU Assistance Policy
Scientific and TechnicalCo-o,oeration
PHARE ProgmmmeManagement Unit
Source: World Bank staff.

232
Table 8.7: Hungary EU Accession Employment Increase Cost Implications
Scenario 1 Scenario 2 Scenario 3 Scenario 4
Base Year Employment- Employment-neutral Wage-bill neutral Wage-bill neutralneutral scenario scenario scenario scenario
1997 2002 2002 2002 2002
Civil Servants 106,000 106,000 106,000 103,922 88,333Employment reduction requirement:
Number l 2,0781 17,667Percentage l l l l 2.0%j 16.7%
Percentage salary increase:
Top x% of skill 20% 20% 20% 20%structureRemaining civil servants 0% 20% 0% 20%
Average total salary $ 388 $ 396 $ 466 $ 396 $ 466
Top x% of skill $ 466 $ 466 $ 466 $ 466structureRemaining civil servants $ 388 $ 466 $ 388 $ 466
Total Wage Bill $534,891,370 $545,589,197 $641,869,644 $ 534,891,370 $ 534,891,370
Change in Wage Bill $ 10,697,827 $ 106,978,274 $ (0) $ -
Percentage of employment in targeted 10% 100% 10% 100%top of skill structure (x%)
No. of monthly salaries 13 13 13 13 13paid per year |
Average Salary increase in targeted 20% 20% 20% 20%positions (1)Min. gross departures 10% 10% 10% 10%(%) IFraction of gross departures requiring 70% 70% 70% 70%severance payments
Gross departures (no.) 10,600 10,600 10,600 17,667
Severance payments
Average no. months severance 12 12 12 12compensationTotal Severance Costs $ 34,562,212 $ 34,562,212 $ 34,562,212 $ 57,603,686
Severance costs as % of base period 6.5% 6.5% 6.5% 10.8%wage bill
Scenario 1: Net employment neutral. Concentrate salary increases in top x% of skill structure
Scenario 2: Net employment neutral. Raise all civil servants' salaries to approach EU country public-private pay relativities.
Scenario 3: Wage bill neutral. Concentrate salary increases in top x% of skill structure.
Scenario 4: Wage bill neutral. Raise all civil servants' salaries to approach EU country public-private pay relativities.
Percentage salary increase assumptions reflect practices recently introduced in Hungary to attract EU-related skills.
Severance payments assume 12-month package. This reflects typical international severance practices.
(1) Average total salary increase would presumably be achieved by increasing salaries more among more highly skilled positions;i.e., by decompressing the salary structure.
Exchange rate 200
Source: World Bank staff estimates.
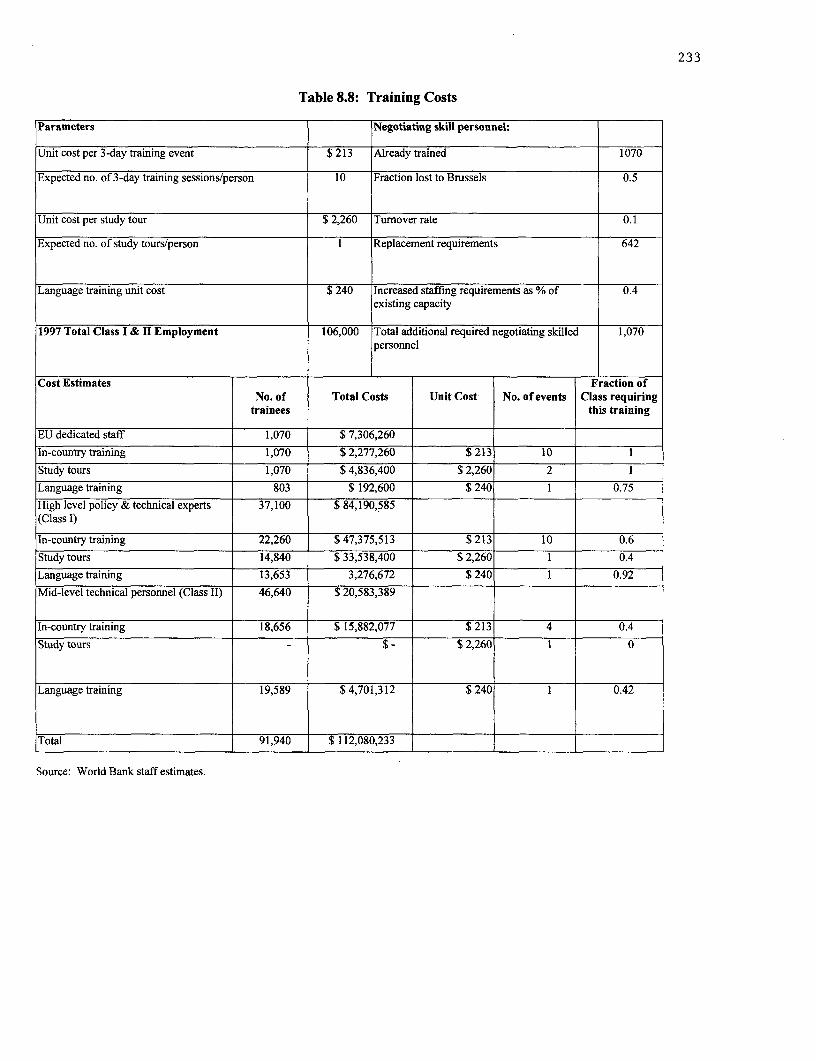
233
Table 8.8: Training Costs
Parameters Negotiating skill personnel:
Unit cost per 3-day training event $ 213 Already trained 1070
Expected no. of 3-day training sessions/person 10 Fraction lost to Brussels 0.5
Unit cost per study tour $ 2,260 Turnover rate 0.1
Expected no. of study tours/person 1 Replacement requirements 642
Language training unit cost $ 240 Increased staffing requirements as % of 0.4existing capacity
1997 Total Class I & II Employment 106,000 Total additional required negotiating skilled 1,070personnel
Cost Estimates Fraction ofNo. of Total Costs Unit Cost No. of events Class requiring
trainees this training
EU dedicated staff 1,070 $ 7,306,260
In-country training 1,070 $ 2,277,260 $ 213 10 I
Study tours 1,070 $4,836,400 $ 2,260 2
Language training 803 $ 192,600 $ 240 1 0.75
High level policy & technical experts 37,100 $ 84,190,585(Class I)
In-country training 22,260 $ 47,375,513 $ 213 10 0.6
Study tours 14,840 $ 33,538,400 $ 2,260 1 0.4
Language training 13,653 3,276,672 $ 240 1 0.92
Mid-level technical personnel (Class ll) 46,640 $ 20,583,389
In-country training 18,656 $ 15,882,077 $ 213 4 0.4
Study tours $- $ 2,260 1 0
Language training 19,589 $ 4,701,312 $ 240 1 0.42
Total 91,940 $ 112,080,233
Source: World Bank staff estimates.

Distributors of World Bank Group Publications
Prices and credit terms vary rom CZECH REPUBLIC INDIA EulyeoPublishingCe. Ltd. PERU SWEDENcountry t country. Consult your USIS, NIS Prodejna Allied Publishers Ltd. 48-1 Susong-Dong Editorial Desarrollo SA Wennergren-Williams ABlocal distributor beten placing an Havelkova 22 751 Mount Road Jongro-Gu Apartado 3824, Ica 242 OF 106 R 0. Box 1305order. 13000 Prague3 Madras- 600 002 Seoul Limae1 5-171 25 SeIna
Tel: (4202) 2423 1486 Tel: (91 44 852-3938 Tel: (82 2) 34-35t5 Tel::(St 1,4~)285300 Tel: (46 8)705-97-50ARGENTINA Fax: (4202)2423 1114 Fax: (91 44) 852-0649 Fax: (822)72-9154 Fas (Stt) 286808 Fax: (468)27-00-71World Publications SA URL: http:/v nis.cn/ INDONESIA LEBANON PHILIPPINES E-mail: [email protected]. Cordoba 1877INOEILEA NPHIPNS1120 Ciudad de BSuenos Aires DENMARK Pt. Indira Limited Librairle du Liban lntemational Booksource Center Inc. SWITZERLANDTel: (5411 4815-8156 Sam1undsLitteratur JalanS Bombudur20 P.O. BSox 11-9232 1127-A Antipolo St. Barangay, Librairie Payot SeNice lnstitutionnelPus: (5411(4815-8158 Rosenoerns AIld 11 RD. Bex 181 Beirut Venezuela C(Im(tes-cle-Morntlenon 30E-ail: Bk4 1 8585 DKI-1970 Fmederiksberg C Jakarta 10320 Tel: (981 9)217 944 Makati City 1882LausanneE-mal: wpookss in ovia.com.ar Tel: (45 351 381942 Tel: (2 213904290 Pe: 1961 9 217 434 Tel: (63 2 896 6501 6505, 6507 Tel:m(41 21) 241-3229AUSTRALIA, FUI, PAPUA NEW Fax: (45 35 357822 Fax: (62 21) 390-4289 E-mal 1: hsayegh@librairie-du- Fax: (632) 8961741 Fax: (41 21) 341-3235GUINEA, SOLOMON ISLANDS, URL: httpi/www.sl.cbs.dk IRAN Ilban.comlb ADECO Van DiermenVANUATU, AND SAMOA ECUADOR Ketah Sara Co. Publishers URL: hisip-fwwe.librairle-dai- PnenloLaND ulsigSevc dtonT nqe6D4.A Infornation Seroices Libr Mundi Khaled Eslamboli Ave., 6th Street lihan.cm.b Ul. Piekna 3137 Edihios Lacu s 41Mitcham132, Vlcteria Librerla lnternacional Delafrooz Alley No. 8 MALAYSIA 00-677 Warzawa CH1807 BlonayTel: (61(1392107777 oP.. Box 17-01-3029 RD. Box 15745-733 University ot Malaya Cooperative Tel: (48 2 628-6089 Tel: (41 21() 943 2673Pee: (61391778Jean Leon Mere 851 Tehren 15117 Eskhp, Limited Fe: 48) 621-7255 Fee: (41 21 943 3505E-marl: servicedadirect.com.au Daito Tel: (982118717819:s8716104 P UmitB 2 E-mail:hoks%ipsikptmcompl TALANDURL: hbp:/hvww.dadirect.com.au Tel t593 2) 521-606; (593 2) 544- Fax: (98 2) 8712478 Jalan Pantai Baru sRL: Central Books DIstRbuton1So E-mail: [email protected] 59700 Kuala Lameor http:/Avww.ipscg.waw.pl/ips/export Centrilm B oaksdrsrhtAUSTRIA Pee: (593 2) 504-209 Kowkab Publishers Tel: (80 3 756-50~ PORTUGAL Bangkok 10500Gerold and Co. B-marl: librimulglibrimundi.com.ec P0wBab 185Fax: 76t a) 755-4424 LisTUGA Pta Tl: ( 23 0Welhtburggasse 26 E-mail: [email protected] TehrBn 195751511 E-ma51: [email protected] Apartada281 Rua DoCum ee: (662) 237-832t
Tel (431)512-47-21-0 CODEU Tel:(9821)258-3723 MEXICO a 70-74Pee: (43 1) 512-47-31-28 Ruiz de Castilla 763, Edit. Expocolor Fax: (98 21) 25U-3723 INFOTEC 1200 Lisbon TRINIDAD & TOBAGOURx: tr4p:Avww.5r2ld47 /at1nli9 Primer pise. 01..12 Av. San Feroando Ho. 27 Tel:(134-92ADTECRBENURL: hftp:/AvwwgeroId.co/at.onIIneIRELAND Fe: (1 247-0928 Systematics Studies Ltd.BANGhttp:lADESHgerold.colat.onile DQuito Col Toriello Guerra FaxS (u) 34S-0264 StHAppIBB ENBANGtLADESH TeleFax: (5932) 507-3832 253-091 Govemment Supplies Agency 1450St. Augustin Shopping CenterMicro Industries Development E-mail: [email protected] Difig as tSolIthairr100Mxc,DF atrnMi od tuutn4-5 ecutRe Tel: (525) 824-2800 EaTerinMindRad&Tbg, Wst AugusinesAssistance Society (MIDAS) EGYTHarABREPBLItOFRobas d Fax: (52 5) 624-2822 ROMANIIA Tiia eoe etIdrHaue 5.Reed 18 Al Arrem Dstdhoin AFency Tel: (3531T881-311 E-URL: ntseISF.et.mC Cimpasi Os Llhrari Bucuresti S.A. Tel: (868) 845-848Dhasmondi RIAreaelArmDsduto gny 7l (35 6131 URL: Pee: (nB tmxt) L6scai5-.26467r DIaka 1209 Al Galaa Street Fee: (353 ()475-2670 Etp/rnntm I.Lioais.2,sc -marl: [email protected]
Tel:(8802)2284278 CaTel: (2c0/2l57ls8-603 YozmotLiteratureLtd. cRio Panuc, 141-Colonla Tel: (40 1)31389645 UGANDAFax (880 811188 Fear: (20 2(578-68823 P.anmot Liteatur Cuauhtemonc Pee: (40 1) 312 43000 Gustro Ltd.BELGIUM The Middle East Observer 3 Yohanan Hasandlar Street 06500 Meeico, D.E RUSSIAN FEDERATION P0 Boa 9997, Madhvani BuildngJean De Lauesoy 4,SeiStetTlAa658Tel:(555395 ldtIts-Ves Mis, Plot 18/4 Jinja Rd.Av. du Rol 202 41, Shehf Street Tel Aviv 61560 :(52 5~~~~~)533-5658 lsdatelstvo , KamampalAn60 dBrossls20 Caire Tel: (9723) 5285-387 Fee: (525)514-6788 se, KolpachnlyPerealok Tel: '258 411 251 4871060 Br ssels Tel: (202)393-9732 Fax: (972 3)5285-397 NEPAL Moscow 101831 Fax:(25641251468Fa: (32 533-0041 Fax: (20 393-9732 RO. Intemtil Everest Media International Services Fax: (7 095) 917 8 49 E-ma2 swiuganda.comBRAZIL FNADP0 Bos 13056 G 0 BxL544 [email protected] UNITED KINGDOM
Pahllache Tecicesloteeacinais Akateeminen Kir)akauppa Tel Aviv 61130 MOsitoLdPubliacac6es Tecnicas Internacionais Atemn Kabp Kathman 41d 02 SINGAPORE; TAiWAN, CHfINA P.O. Box 3, Omega Park, A ton,Ltds. RD. Box 128 Tel: (97231 849 9469 KTel: sSNAPR;TIAN HN icosoLdRue Pieoto Gomside, 209 FIH-00101 Helsinki Pee: (97231864888039 Te:(977 1) 416 026 MYANMAR; BRUNEI Hap0.hBee G3,4mg Par,AinOt439 T5jEl: (358 °I121 4418 E-matl: roynetvisnonnt. Fa: (977 1)N224R431 Hemisphere Publication Services Ham r42 01409 Sao Paulo, SRPe:(5.i11 48Emi:ml sese.ai 41 Kallaeg Padding Reed #04-03 Tenland4120864Tel: (55 11 359-6844 Pax: (258 a 121-4435 UIlL: httpl,iwaww.moyintLco.il NETHERLANDS Goldes Wheel Building Tel: (44 1420(08488
FaR51 h) 258-6990 E-mal ablusstockmanne.c Palestinlan Authority/MIddle East De Lindeboomntlernationale Singapore 348316 E-mail: wbank@micreints covuEi-mail p ptate t.uo.b la:lti'Avralaemnncm Iden Isformation services Puhllcaties hav.- Tel: (6574-56 URL: hl1p:/twiw.microinfo.co.okURL: hhtp://www.uol. r FRANCE RO.B. 19502 Jerusalem RD. Box 202, 7480 AE Haaksbergen Fax: (6) 742-9356CANADA Edibons Eska; DBd Tel: (972 21 6271219 Tel: (31 53) 574-0004 E-marl: ashgateCasianconnect.com The Stationery OfficeRenout Publishing Co. Ltd. 48, rue Gay Lussae Fax: (972 2) 6271634 Fax: (31 83) 572-9298 51 Nine Elms Lane5389 Canotek Reed 75085LIERI PussaskivetnkIll)shng London SWB 638Ottawa, Ontar K 93 Tel: (3-1 55-42-7-08 Ls mmssiona ri Sansoni SPA R: hlw wordonline.i-lin- Go 4 8738Tel: (813 Pee:~~~~Fa (33- 43-29-91-67 LdeboomnsaaiaSnon PA UL Fax./wwwddeleel i G4rdaoivsli uhlhnTel: (613 745-2665 Via Duca Di Calabria, 1/1 h4 1,~~~~~~~~~~~~~~~~~~~~~~~~Fee (4 817 3)872-24Fa:( )745-2885 VEMN aeia Duosta Clhela 552dh Dunaiska castes URL: http:/Ie .thre-stationery-Casella Pastele 552 ~~NEW ZEALAND 1000 Ljubljana otfice.couk/E-mail: UNO-Vedag 50125 Firenze Tel: (38661 133 8347;[email protected] HpZpelsdorterdAllee Te:(3955)645415 ESSO . (3866 )1Z Ltdu Fax~~~~Ppeldrerle 5 e: (395584-45Pdvale Mait Beg 99914 Fee: (3866) 132 8030 VENEZUELAURL: hfp://www.renoufbooks.com 53 15Bae Fax:(13965)641-257 a a E-mall: [email protected] Tecni-Ciencia Libros, SA.Tel: (4922T 94900 E-mat : licosaftcc.ftHew MarketCHINA Tel:(49l228)94920 E-mail: liunsa@tithc. wckand SOUTH AFRICA BOTSWANA Centro Cuidad Comercial TamancoChina Financial & Economic Pee: u r49 22 c) 217492 m URL htlpi/www.ftbcc.itAlcosa Tel: (64 9 524-8119 neNivl C2, CaraasPublihing ouse ftpJAwwunoverIa.cIe orJAMAICAtll21PsBlishisg House UR-mal: hunpoverwgw o.so-nerAMAIde Fee: (84 ~(524-8067 Oxferd University Pmess Southern Tel: (58 8) 59 5547: S035, 001I68, Do Fe Si Duong Jie Emi:uerlga.cm Ian Randle Puhlishers Ltd. Aficla Fax: (58 2) 959 5630Bei)ing GHANA 206 Old Hese Road, Kingston 6 Oasis Official Vasco Boulevard. Goodwood ZAMBIATel: (8610)6401-7365 EppBaks Services Tel: 876-927-2085 PO. Box 3627 RO. Box 12119, N1 City 7463 UniversityBookshop, University ofFax: (0t) 6401-7365 Po. Box 44 Fax: 876-977-0243 Wellington Cape Town ZambiaChina Book Import Centre TUC E-mail: irpl*colis.com Tel: (84 4) 499 1551 Tel: (27 21) 595 4403 Great East Road CampusPBOi Bo 2825 ATcc:ra 2 18 JAPAN Fax: 864 4) 499 1972 Fax: (27 2) 5954430 P.O ox 32379Tel: 22321 778843 e A E-ma l: [email protected] E-mail: [email protected] Lusaka
Chinese Corponatios tar Promobon GErvCce TRL: 55
p2a55
o Pn r subscription orders: Tel: (260 11 252 576ft Homanities G Tokyo E 3 NIGERIA Internetional Sabscription Service Fan: (208 1) 252 952TFel ((88611°o)) Fax25,0 Ppsotiou-nara SIr. Fee: 181 3(3818-0861 Usiversity Press Limited RDO. 8ox 41095 ZIMBAB7XuarrNeirDa6No Ji-213 Stournarapoist Afncax: okService(E.L Three Crownsi e Creighall Academic end BaFaab Bunks (Pvt.)eiealad 106 82 Athens B-na 2: ordesnH svt-ehs.ca.nPit Bagl5095 dah Johanseshurg 2024 LId.Tel: (860 968072494 Tel: (01 394-1826 URL: Pdvate-uai- Fel- 27 1 '880-1448 R4 Bl 5Fee (813Pe: (381) (384-8254 hftp-Ivwww.bakkoame.orjpl-svt- 22'da 41136ax:.7' 8064 .O o 6( 880 727494 Tel: (2 22) -35 6 COLE DIVOMBIA HONG KONG, CINA, MACAO ax: (2542AII ebs Fax: (23422) 41-2539 E-marl: i a@s mundiprensa.eAntoesaice LdE. Cellares Difflusion KENYA SPAIN Tel: 263 4 755135Carrera8 HaN. 51-21 5, Rae Cepois Africa Bank Service (EA.) Ltd. PAKIUSTAN Mundil-Pressa Libros, S.A.Fa:23713
Apa0tado4Aereo 34270 C.R 257 Duaran House, Mfaegbou Street MIae Boa k Agency Costello 37Antartads Aee 34270 Port-eu-PIece RO. Bex 45245 65, Shahrah-e-Quaid-e-Azam 28001 MadridaTeld de Bogete, D.C. Tel:K(588(23 9260 Nairabi Lahure 84000 Tel: (34 91)4 383700
Peel:(57 1(286-2798 Fee: (502 485 Tel: (284 2(2238641 Tel: (9242 735 3801 7598
C )TE D'IVOIRE HONG KONG, CHINA; MACAD Fax: (2542)2330 272 Pee: (92 4) 576 3714 E-moa: [email protected]
Centerf'IorpiieRsacRE alwwsaocommh -aLeay4m-ecm a. )45764 LkHfipseBookshodprnacm
Center dBEdition et de Diffusion Asia 2000 Ltd. Legacy Beaks Oxtord Uniersity PressANricsinas (CEDA Sales & Circulation Department Luite House783-20,alongbaownn-Dong,Preh
Africaines (CEDA) 302 Seabird House Mezzanine 1 ~~~Sharae Paisal Consell de Cent, 391AhidjPen504 22-28 knsdham Street, Central P.O. Bee 68077 PODBoxul3033 08009 BarcelonaTel:d(225 24650261 Hoeg Kong, China Hairobi Krci730Tl 3 )4839TeL: (357 22 6750 2Tel: (852) 2530-1409 Tel: (054 2-330853, 221426 Terh (92 421 6307 Tel: (34 3E 488-2592Fa:(225) 50567 Fee: (852) 2526-1107 Pus (S42-330854, 581684 Te:(92)430maxl: (34 ceo6) 407-7658 a.eCYPRUS E-mail: [email protected] E-mail: Legacy(82 anet.com Fee: (92 2 4547840
CetrEo-ppidReerhaRlhtplvw:sa2O.omhB-mail: [email protected] SRI LANKA, THE MALDIVESCenter tr Applie Researh URL: hftc/Avw.501a200.cem.hk KOREA, REPUBLIC OF Lake Heuss Bookshopg~a Cl~ HUNGARY Dayang Beoks Trading Ca. PeE Bask Corparatlan 100, Sir Chittampalam Gardiner
,igenes treet, Engomi Eure Isle Service Intemational Divlole Aziz Chambers 21, Damen's Read MawalhaRDO. Bee 2086 Margdtszgeo Eumopa Haz 783-20, Puangha Ben-Dong, Lahore Colombo2Hicosia H-1138 Budapest Socho-ku Tel: (92 42) 63632222:636 0085 Tel: (941) 22105Fee: (257 2) 59-0731 Tel: (36 13 350 80 24, 350 88 25 Seoul Pee: (92 42)826362328 Fx 9 4310
Fax: ~36 ? 350 90 32Tel: (82 2) 536-9555 E-mail: [email protected] E-mail:[email protected]~l :euroiefoOmail.mataahu Fee: (8 2(8536-0025
E-moII1: [email protected]


MAP SECTION

IBRI) 26084R
16- 20' 22�
HUNGARYUKRAINE
MOTORWAYS MM NATIONAL CAPITAL
1�) COUNTY (MEGYE) CAPITALS' BO�SOD-ABAMAIN ROADS Sl 0 VA K R E ZEM'�LEN0 OTHER MAJOR CITIESRA LROADS
---- COUNTY (MEGYEI BOUNDARtESCANALS uRIVERS INTERNATIONAL BOUNDARIES
1, k/-4
48- S-1g.-J.IbqT. V,-
SZABOL CS
NOGRAD
J�JT. N- ZJ,� H A TEVES SZ
"REG
ESZTERGOM
AUSTRIA C ... J T,.
HA T. S.. M.-R-MO BfH�ARSqP,R0N Buda PEST
JA5Z-NK�YKUN-,SZ0tN0K,_
th v I- fl k ROMANIA
T. MO,VE5ZPREM
<- BEKES
Th,, _yct b6
by 'a,U�il. J 8-k
/---z LABACS-xl S ... J---
SKUN Th�li, Z- k,lOGY�. T� iqjJ6LN� 22�SLOVENIA som
.gyk..i... CSC�GRAJ$
T. Z bJ T. ,.d
B.
Bbj 9
CROATIA
YA46- RA
FED. REP. OF YUGOSLAVIA10 20 30 40 50 60 70 BO KILOMETERS (Serbia/Montenegro)
L
r0 10 20 30 40 50 MILE$18- 20'
10,
N-I.- -7


THE WORLD BANK
1818 H Street, N.W.
Washington. D.C. 20433 USA
Telephone: 202-477-1234
Facsimile: 202-477-6391
Trelex: MCI 64145 WORLDBANK
MCI 248423 WORLDBANK
Internet: wwwworldbank.org
Ei-mail: [email protected]
ISBN 0-8213-4618-0