77023 - World Bank Documents & Reports
272
Public Disclosure Authorized Public Disclosure Authorized Public Disclosure Authorized Public Disclosure Authorized
-
Upload
khangminh22 -
Category
Documents
-
view
1 -
download
0
Transcript of 77023 - World Bank Documents & Reports
Pub
lic D
iscl
osur
e A
utho
rized
Pub
lic D
iscl
osur
e A
utho
rized
Pub
lic D
iscl
osur
e A
utho
rized
Pub
lic D
iscl
osur
e A
utho
rized
wb350881
Typewritten Text
77023

DEVELOPMENT EVALUATION IN TIMES OF TURBULENCE

DEVELOPMENT EVALUATION IN TIMES OF TURBULENCE
Dealing with Crises That Endanger Our FutureRay C. RistMarie-Helene BoilyFrederic R. MartinEditors
© 2013 International Bank for Reconstruction and Development / The World Bank1818 H Street NW, Washington DC 20433Telephone: 202-473-1000; Internet: www.worldbank.org
Some rights reserved
1 2 3 4 16 15 14 13
This work is a product of the staff of The World Bank with external contributions. Note that The World Bank does not necessarily own each component of the content included in the work. The World Bank therefore does not warrant that the use of the content contained in the work will not infringe on the rights of third parties. The risk of claims resulting from such infringement rests solely with you.
The fi ndings, interpretations, and conclusions expressed in this work do not necessarily refl ect the views of The World Bank, its Board of Executive Directors, or the governments they represent. The World Bank does not guarantee the accuracy of the data included in this work. The boundaries, colors, denominations, and other information shown on any map in this work do not imply any judgment on the part of The World Bank concerning the legal status of any territory or the endorsement or acceptance of such boundaries.
Nothing herein shall constitute or be considered to be a limitation upon or waiver of the privileges and immunities of The World Bank, all of which are specifi cally reserved.
Rights and Permissions
This work is available under the Creative Commons Attribution 3.0 Unported license (CC BY 3.0) http://creativecommons.org/licenses/by/3.0. Under the Creative Commons Attribution license, you are free to copy, distribute, transmit, and adapt this work, including for commercial purposes, under the following conditions:
Attribution—Please cite the work as follows: Rist, Ray C., Marie-Helene Boily, and Frederic R. Martin, editors. Development Evaluation in Times of Turbulence: Dealing with Crises That Endanger Our Future. Washington, DC: World Bank. doi:10.1596/978-0-8213-9879-1. License: Creative Commons Attribution CC BY 3.0.
Translations—If you create a translation of this work, please add the following disclaimer along with the attribution: This translation was not created by The World Bank and should not be considered an offi cial World Bank translation. The World Bank shall not be liable for any content or error in this translation.
All queries on rights and licenses should be addressed to the Offi ce of the Publisher, The World Bank, 1818 H Street NW, Washington, DC 20433, USA; fax: 202-522-2625; e-mail: [email protected].
ISBN (paper): 978-0-8213-9879-1ISBN (electronic): 978-0-8213-9891-3DOI: 10.1596/978-0-8213-9879-1
Cover design: Naylor Design, Washington, DC
Library of Congress Cataloging-in-Publication DataBoily, Marie-Helene. Development evaluation in times of turbulence : dealing with crises that endanger our future / Marie-Helene Boily, Frederic R. Martin, and Ray C. Rist.��pages cm ISBN 978-0-8213-9879-1 — ISBN 978-0-8213-9891-3 (eISBN) 1. Economic development projects—Evaluation. 2. Economic assistance—Evaluation. 3. Economic policy. 4. Crises—Political aspects. 5. Crises—Economic aspects. I. Martin, Frederic R. II. Rist, Ray C. III. World Bank. IV. Title. HD75.9.B65 2013 338.91—dc23
2013009228

Contents v
CONTENTS
Preface xiiiAbout the Editors xviiAbbreviations xix
Chapter 1. Linking Evaluation Work in Arab Countries to the
Crises in the “3 F’s”—Finances, Food, and Fuel 1
Saif Ibrahim
Chapter 2. When Incremental Change Isn’t Enough 5
Jan-Eric Furubo
Introduction 5What Evaluation Was All About 5Incremental and Nonincremental Change 8The Role of Evaluation in Turbulent Times 15Consequences for Evaluation 17A Final Remark 20Notes 20References 21
Part One: Implications of Turbulent Times for
Evaluation Approaches 23
Chapter 3. Evaluation and Turbulence: Refl ections
on Our Time 25
Saraswathi Menon
IDEAS’ Early Vision 25Linking Evaluation and Development 26Three Challenges 30
vi Contents
Chapter 4. Evaluation in the Context of Global
Public Goods 33
Rob D. van den Berg
Introduction: The Roots of Turbulent Times 33The Role of Public Funding: Public Goods and Costs 34Transboundary Issues: The Role of Global Public Goods 36The Rising Tide of Global Public Costs 37“Mind the Global Gap” 38Consequences for Evaluation 41Fine-Tuning “Relevance” 45Fine-Tuning “Impact” 46Following the Example of Cato the Elder 47Notes 48References 49
Chapter 5. Innovative Approach to Evaluating
Interventions in Fragile and Confl ict-Affected States:
The Case of Helmand Province 51
Samy Ahmar and Christine Kolbe
Introduction 51Challenges to Evaluation in the Helmand Context 53HMEP: A Cutting-Edge M&E Solution 57Conclusions: Future Prospects for M&E in
Fragile States 66Notes 67References 68
Chapter 6. Resource Crunch, Evaluations, and Mindset 69
Case StudiesRashmi Agrawal
The Value of Existing Data 69Turbulence and Evaluations 70Impact on Evaluation Practice 70Types of Available Data 71Quality of Available Data 72Case Studies 73Discussion and Lessons Learned 75Summing Up 76References 77
Contents vii
Part Two: Turbulent Times, Productivity, and Risks 79
Chapter 7. The Impact of the Food, Fuel, and Financial Crisis
on Children’s Education 81
Findings from a Monitoring System in NepalJeevan Raj Lohani, Purnima Gurung, and Laxman Bashyal
Background 81Overall Scenario of the Crisis 82Key Study Findings 85Overall Impact 98Findings and Suggested Responses 100Notes 101References 104
Chapter 8. Institutional Impact Assessment:
The Jordan Experience 105
Lamia Al-Zoubi
Introduction 105Status Quo Review 107Impact Assessment Mechanism 108Next Steps 109Evaluation and Impact Assessment Methodology 109Sharing Experiences through Partners 111Challenges and Issues 112Conclusion 113
Chapter 9. How Can Development Banks Boost
Firms’ Productivity? 115
Filipe Lage de Sousa
Overview 115Overview of BNDES Schemes 118Description of the Dataset 119Theoretical Background 120Descriptive Statistics 124Empirical Strategy 128Empirical Results 130Concluding Remarks 135Annex 9A List of Variables 136Annex 9B Further Results 137
viii Contents
Notes 139References 141
Part Three: Implications of Turbulent Times for Building
Monitoring and Evaluation Capacity 143
Chapter 10. A Proposed Framework to Understand Civil
Society Organizations’ Involvement in M&E 145
Marie Gildemyn
Overview 145Introduction: M&E in the Current Aid Architecture 146Unpacking the Accountability Function of M&E 148What Is Accountability? 148Unpacking the Feedback/Learning Function of M&E 153Bringing Everything Together: Toward an Understanding
of CSOs’ Involvement in M&E 160Notes 162References 163
Chapter 11. Monitoring and Evaluation in a
New Environment 167
Case Study of Jordan’s Ministry of Social DevelopmentRasha Qudisat
Objective 167Country Context 168Effects of the Economic Crisis on Jordan 171Development of Social Assistance in Jordan 173M&E in Social Development 175Lessons Learned and Conclusion 185Notes 186References 186
Chapter 12. National Performance Reporting as a Driver for
National M&E Development 187
The Experience of BotswanaRobert Lahey
Introduction 187Framework for Developing a National M&E System 188Moving from Concept to Reality—Assessing Botswana’s M&E
Aspirations and Readiness 192

Contents ix
Issues of Technical Capacity: Establishing Short-Term and Long -Term Strategies for M&E Development 194
Developing a National Performance Report as a Driver for M&E Capacity Building 195
Lessons Learned for National M&E System Development 204Annex 12A Status at a Glance 207Notes 211References 212
Chapter 13. A Pilot Experience for Evaluating M&E Systems
for Social Programs in Latin America 213
Juan Abreu, Marie-Helene Boily, Idania Fernández, and Frederic R. Martin
M&E Systems and Social Programs in Latin America 213
Analytical Framework to Diagnose M&E Systems 215Moving from the Conceptual Framework
to an Operational Approach 218Pilot Application of the Operational Approach
in Central America 220Conclusion and Way Forward 225Notes 225References 226
Chapter 14. Conclusion 229
Marie-Helene Boily and Frederic R. Martin
Implications for Evaluation 232
Index 235
Boxes
8.1 Executive Development Program 110 10.1 How Civil Society Organizations Can Engage in Social
Accountability Initiatives 152 11.1 Ministry of Social Development 173 11.2 Four Uses of M&E 176 11.3 Benefi ciaries of the Social Defense Directorate 177 12.1 Four Essential Building Blocks Elaborated 190 12.2 The Vision 2016 Pillars and Key Result Areas 197
x Contents
12.3 Type and Number of Indicators Used to Measure Performance against Key Results Expected under Each Vision 2016 Pillar 199
12.4 Performance Context: Key Measures of Long-term Progress for the “Economic Growth and Diversifi cation” Key Result Area 201
12.5 The Business Place Project: A Vision Pillar Success Story Refl ecting the “Economic Growth and Diversifi cation” Key Result Area 203
12.6 Lessons Learned for National M&E System Development 205
Figures
4.1 Evaluation Criteria 46 5.1 Example of Theory of Change Analytical Framework:
Infrastructure 63 7.1 Hunger and Out-Migration Trend 84 7.2 Trends in Fuel Prices, 2003–10 85 7.3 Pathways for Coping with the 3F Crisis Lead to Lower
School Attendance 86 7.4 Trends in Student Attendance Rate by Quarters 87 7.5 Student Attendance Rate 89 7.6 Incidences of Student Dropout 95 7.7 Reasons for Student Dropout 96 7.8 Critical Zone of Dropout 97 7.9 Trends in Education-Related Coping Mechanisms, 2009–10 99 8.1 Evaluation at Different Project Phases 110 8.2 Conceptual Communications of the IAU 111 9.1 Average Profi t versus Cut-Off Productivity 122 9.2 Government Reduces Projects’ Implementation Costs 124 9.3 Share of Disbursements, GDP, and Manufacturing Firms
between Rich and Poor Regions 125 10.1 Conceptual Framework: Accountability Dimension 153 10.2 A Comprehensive Theory of Evaluation Infl uence 155 10.3 The RAPID Framework 158 10.4 Realist Perspective of Policy Infl uence 159 10.5 Understanding CSOs’ Involvement in M&E 161 11.1 Poverty Rates, 1989–2008 169 11.2 Unemployment Rates, 2005–March 2011 170 11.3 Main Socioeconomic Reforms, 1990–2013 171 11.4 Jordan’s Medium-Term Outlook 172 11.5 Steps in Establishing an M&E System 175
Contents xi
11.6 Monitoring System, Governorate–Regional Level 179 11.7 Monitoring System, Governorate–District Level 180 11.8 Social Defense Benefi ciaries’ Dynamic Index 181 11.9 Social Defense Benefi ciaries’ Fixed Index 182 11.10 Scenario 1: Demand vs. Supply, Excluding Buildings 183 11.11 Scenario 2: Demand vs. Supply, Including Buildings 184 12.1 Four Essential Building Blocks for an Effective National
M&E System 189 12.2 Tracking Progress toward the Goals: How Measurement
and Reporting Were Carried Out 198 13.1 Main Results of the Diagnostic of the M&E System of
the PATI Program in El Salvador 222
Tables
5.1 Sampling Framework Summary 60 6.1 Three Parameters by Which to Scrutinize Data 73 7.1 Reasons for Student Absences by Quarters, 2009–10 88 7.2 Average Learning Achievements 90 9.1 Manufacturing Sectors Receiving BNDES Disbursements
and Their Share of GDP 126 9.2 Comparing Productivity of Granted and Nongranted Firms 127 9.3 Results Using PSM Plus Difference-in-Differences Approach 131 9B.1 Results for Small Projects in Method 5 137 9B.2 Results for Large Projects in Method 5 138 10.1 M&E Tools Used by CSOs According to Their Place within
the Logic Model 147 10.2 Model of Alternative Mechanisms That May Mediate
Evaluation Infl uence 156 13.1 The Five Dimensions to Assess the Degree of Compliance
of an M&E System with a Fully Developed Results-Based M&E System 217

Preface xiii
PREFACE
“The dogmas of the quiet past are inadequate to the stormy present.”
—Abraham Lincoln, 1862
More than one hundred and fi fty years later, Lincoln again has it exactly right. The stormy presence of turbulence in multiple areas of present-day societies—be it in food, fuel, or fi nances to name but three—means that long-held assumptions no longer hold, that the past is not prologue, and that the future is not clear.
Enter into this unstable present the discipline of evaluation—a discipline formed and shaped in the past 50 years of stability, little turbulence, and strong assumptions that everything will go according to plan. Conventional evaluation behavior and beliefs are ill suited for present times. The trans-formational nature of the “Arab Spring” is just one arena in which it is clear that a business-as-usual approach to evaluation is entirely inappropriate.
The chapters in this volume come from the 2011 Global Assembly of the International Development Evaluation Association—also known as IDEAS. This biannual assembly, held in Amman, Jordan, in April 2011, brought together about 350 development evaluators from 85 countries. The Arab Spring was very much on the minds of participants. Change was under way in Jordan where we were meeting, as well as in Tunisia, Libya, the Arab Republic of Egypt, Bahrain, and the Republic of Yemen—to name just six of the countries in the Middle East. The sense of turbulence was in the air. In fact, some persons who had planned to come to Amman backed out for fear for their personal safety.
The intent of this collection of papers is to systematically address changes during this time of turbulence and how these changes are impacting the craft of evaluation. This collection makes it clear that trying to hold to a set of assumptions about the status quo is no longer helpful and no longer true,

xiv Preface
that the past is truly the past (even the past of 36 months ago), and that the traditional paradigm that has defi ned and guided evaluation for these past many decades is outmoded and even passé. To reach back into history for a phrase to describe the present, consider this quote from Marx and Engels, “All that is solid melts into air.”
The intention of the IDEAS assembly was to focus on turbulence in food, fuel, and fi nances. But the realities of the Arab Spring brought a new and pressing urgency to the gathering—nation states were falling, leaders were being deposed, the streets were fi lled with persons calling for fundamental changes in the structures of their societies, and blood was being shed for the sake of change. These events could not be ignored for the sake of adhering to a defi ned intellectual framework. Consequently, the focus of this book has broadened to refl ect these new realities—we have chapters on evalua-tion refl ecting turbulence in the three “F’s,” but we also have papers on the eff ects of the turbulence of the Arab Spring on evaluation. We trust readers will appreciate this real-time approach.
This book is divided into four parts. The Introduction has two chapters. First is a single brief paper by His Excellency Dr. Saif Ibrahim, Secretary General of the Economic and Social Council of Jordan. Dr. Saif explicitly addresses many of the forces and pressures evident in the Arab Spring and how these dynamics are impacting evaluation. Second is Jan-Eric Furubo’s cogent case for augmenting the traditional paradigm focused on incremen-tal change with elements to better address societal turbulence.
Part One has four chapters, including the two keynote speeches—one by Saraswathi Menon, who at the time was the head of the evaluation offi ce for the United Nations Development Programme, and one by Robert D. van den Berg, director of evaluation for the Global Environment Fund. The other two chapters focus on the pressures and constraints of trying to establish viable monitoring and evaluation systems in the turbulence of Afghanistan and in India.
Part Two addresses the consequences of turbulence on the ground. Three chapters are in this cluster. The fi rst examines the impacts of turbu-lence on the education system in Nepal through the collection of monitoring data—imperfect as they may be in turbulent times. The second examines one of the Arab Spring nations, Jordan, and describes how it was (barely) possible to set up and operationalize an impact assessment group and the constraints on doing such work. The third chapter turns to Brazil and evalu-ates an eff ort by the Brazilian government to increase productivity by off er-ing loans to domestic fi rms to help bring the country out of the economic turbulence that had gripped it.

Preface xv
Finally, Part Three focuses on exercising the craft of evaluation in turbu-lent times. It has four chapters. The fi rst focuses on the role of civil society organizations in helping build and strengthen monitoring and evaluation systems, especially in aid-dependent, developing countries. The second chapter again focuses on Jordan and how the government was able to build a monitoring and evaluation system in its Ministry of Social Develop-ment amid clearly unsettled times. The third chapter examines eff orts in Botswana to build a national performance reporting system and describes how Botswana hopes to use this system to track and monitor performance to improve governance. The fi nal chapter proposes a diagnostic tool to assess existing M&E systems against the standard of a fully developed results-based M&E system and describes a pilot of the tool in Latin America. The book closes with a concluding chapter by two of the editors.
The editors wish to thank the contributors to this book for their care and craft. The papers refl ect the diffi culties of trying to deploy monitoring and evaluation in times of turbulence—whether as a coherent system of data collection and analysis or as an eff ort at making sense in unsettled times. The editors also wish to thank the donors who helped sponsor this book by providing scholarships to authors to attend the assembly in Amman. Spe-cifi cally, thanks are due to the United Nations Children’s Fund (UNICEF); the U.K. Department for International Development (DFID); Norwegian Development Assistance; the Islamic Development Bank; the Ministry of Planning and International Cooperation, Jordan; and the Swiss Develop-ment Council. It is not trite to say that this book would not have been pos-sible without their help and support. Thank you!
Marie-Helene Boily and Frederic R. Martin Ray C. RistQuebec City Washington, DC


About the Editors xvii
ABOUT THE EDITORS
Ray C. Rist is in his second term as president of International Development Evaluation Association (IDEAS). He is also a cofounder and codirector of the International Program for Development Evaluation Training (IPDET). Retired from the Independent Evaluation Group of the World Bank, he con-tinues to advise organizations and governments throughout the world on how to design and build results-based monitoring and evaluation systems. His career includes senior appointments in the U.S. government, academic institutions, and the World Bank. He is the author or editor of 31 books and more than 150 articles. He presently serves on the boards of nine profes-sional journals.
Marie-Helene Boily is a senior economist and the training program coordi-nator at the IDEA International Institute in Quebec, Canada. She has more than a decade of experience supporting the implementation of monitoring and evaluation systems in public policies, programs, projects, and training initiatives. She has worked extensively in Africa, Asia, and Latin Amer-ica. She is coeditor of Infl uencing Change: Building Evaluation Capacity to Strengthen Governance, copublished by IDEAS and the World Bank (2011).
Frederic R. Martin is cofounder, senior economist, and copresident of IDEA International. He is also in his second term of serving on the IDEAS board of directors. For 18 years, he taught at the University of Laval, Canada, where he served as professor and chair for international development. He has more than 30 years of experience conducting evaluations in countries of Africa, Asia, Europe, and Latin America. He is coeditor of Infl uencing Change: Building Evaluation Capacity to Strengthen Governance.

Abbreviations xix
ABBREVIATIONS
AGCHO Afghan Geodesy and Cartography Head Offi ce ANDS Afghan National Development Strategy ANP Afghan National Police AIMS-DAD Aid Information Management System Development
Assistance DatabaseRAIS Annual Social Information Report (Relação Anual de
Informações Sociais)PIA Annual Industrial Research (Pesquisa Industrial
Annual)ADB Asian Development Bank BNDES Brazilian Development Bank (Banco Nacional de
Desenvolvimento Economico e Social)IBGE Brazilian Institute of Geography and Statistics
(Instituto Brasileiro de Geografi a e Estatística)CSO Central Statistics Offi ce CSOs civil society organizations COIN counterinsurgency theory CSIS Center for Strategic and International StudiesDOFE Department for Foreign Employment, NepalDAC Development Assistance Committee DFID U.K. Department for International DevelopmentECG Evaluation Cooperation Group (ICG) [of the
development banks]FGD focus group discussionFDI foreign direct investment SECEX Foreign Trade Secretary (Secretaria de Comércio
Exterior)FEC free entry condition
xx Abbreviations
GIS geographic information systemIDEAS International Development Evaluation Association GEF Global Environment Facility GSPA Global Partnership for Social Accountability GDP gross domestic product GCC Gulf Consultative Council HOH head of household HMEP Helmand Monitoring and Evaluation Programme IDEA-AIM4R Assessing and Improving M&E for ResultsIDRC International Development Research Centre IDA International Development Association IMF International Monetary Fund IPDET International Program in Development Evaluation
TrainingISAF International Security Assistance Force KRA key result area NDP 10 Medium-Term National Development Plan,
BotswanaNORAD North American Aerospace Defense Command MCA Millennium Challenge Account MoI Ministry of Interior Aff airs, Jordan MoPIC Ministry of Planning and International Cooperation,
JordanMoSD Ministry of Social Development, JordanM&E monitoring and evaluation OECD Organisation for Economic Co-operation and
Development OECD/DAC Organisation for Economic Co-operation and Devel-
opment’s Development Assistance CommitteeODI Overseas Development Institute PRSP Poverty Reduction Strategy Paper PATI Programa de Atención Temporal al Ingreso, El
Salvador RdO Programa Red de Oportunidades, PanamaPSM propensity score matching PRT Provincial Reconstruction Team, AfghanistanRAPID Research and Policy in Development RBM results-based management RIDA Research Inputs and Development Action,
KathmanduSISCA Secretaria de la Integración Social Centroamericana
Abbreviations xxi
SMART indicators (specifi c, measurable, achievable, relevant, and time-bound)
SADC Southern African Development CommunityTWG technical working groupUNICEF United Nations Children’s Fund UNDP United Nations Development Programme UNEP United Nations Environment Programme WFP World Food ProgrammeZCP zero cut-off profi t condition


1
Linking Evaluation Work in Arab Countries to the Crises in the “3 F’s”—Finances, Food, and FuelSaif Ibrahim
In the past fi ve years, the global economic crisis has been shaped by the fi nancial, food, and fuel crises. The economic crisis resulting from the “assets bubble” in the United States and the resulting weak connection between prices and the real value of assets has created a lack of confi dence in fi nancial assets. Investors have focused on commodities markets to hedge against uncertainty in fi nancial assets. An associated increase in demand for food and fuels has aggravated the situation in many developing countries. The resulting increase in prices will likely continue, and poor countries are expected to face tough choices.
International development agencies continue to provide funding, fi nan-cial support, and humanitarian aid to governments around the world in an eff ort to curb the eff ects of the crises of the “3F’s.” Despite relief eff orts, chal-lenges remain in coordinating donor eff orts with local eff orts and in the lack of proper evaluation mechanisms for policies and crises, especially in the Arab countries.
CHAPTER 1
2 Development Evaluation in Times of Turbulence
Evaluation of economic policies is key for understanding progress, but the question is should we continue viewing economic growth and progress in terms of sectoral gross domestic product (GDP) growth? Or, should we move toward measuring progress by monitoring and evaluating various indicators including education, health, governance, democracy, equity, human rights, and freedoms?
The aftermath of the recent social and political unrest in the Arab region and the growing “youth quake,” suggest that “bread” is not the root cause of the protests. Reasons go beyond economic diffi culties, stemming from inequality, lack of freedom, and tainted dignities. Such widespread protest movements call for revisiting and reevaluating economic and social policies adopted in the Arab region over the past two decades and drawing lessons for the future.
We should remind ourselves that the Arab region comprises a diverse range of countries with diff erent assets and social and political conditions. Countries with oil revenues, such as Gulf Consultative Council (GCC) countries, have some fi nancial cushioning from shocks, but nevertheless are experiencing a sharp downturn in revenue. In countries without considerable fi nancial capacity, the drop in economic growth has been felt more intensely. Countries such as Lebanon, the Syrian Arab Republic, the Arab Republic of Egypt, Jordan, Morocco, West Bank and Gaza, and Tunisia, despite the diff erences in economic structures, are highly exposed to western European markets in terms of exports and remittances, are highly dependent on fuel consumption, and have little emphasis on agriculture. Pressure on these countries due to decreases in remittances and tourism, high unemployment and youth bulge, traditional budget defi cits, and weak governance are aff ected by slow policy response. Countries such as Iraq, the Republic of Yemen, and Sudan, which are also coping with confl ict, increased poverty, and social tension, suff er further from the economic crisis.
Despite diff erences in their social and economic structures, countries in the region do share commonalities, including a lack of proper and continuous evaluation mechanisms for economic and social policies that would allow policy makers to rethink some of their policies over time. Two reasons might explain the weak condition of evaluation in the region; one involves a lack of appreciation of the importance of monitoring. But even when appreciation exists, there may be a lack of institutional capacity and political will to undertake the task. The outcome has been a very poor record in evaluation and, as a result, adherence to policies that are not necessarily the most appropriate for the countries.
The Arab region, especially its poorest countries, faces the recent surge in food and oil prices within an increasingly fragile macroeconomic context.

Linking Evaluation Work in Arab Countries to the Crises in the “3 F’s”—Finances, Food, and Fuel 3
For example, the undermining of the agricultural sector in developing countries and imports from staple-surplus countries geared the developing world into a dependency relationship with the developed world. High food prices may heighten inequality within countries; aggravate child malnutrition; diminish opportunities for education; and destabilize the social conditions for those living amidst confl ict, instability, and drought. Poor countries are constrained in their fi scal capacity to respond to infl ationary pressures. What policy choices are left to the developing countries? Can some countries revisit their policies and investment programs? In which direction can they redirect them? These are valid questions in this turbulent time. Although theses question are simple, they are unresolved since they go beyond the conventional way of pursuing economic policies.
The challenge of crafting appropriate policy responses in the Arab countries to the fi nancial, food, and fuel crises is made harder in the context of rising oil prices. The World Bank’s food price index increased by 15 percent between October 2010 and January 2011 and is only 3 percent below its 2008 peak. The past six months have seen a sharp increase in global prices of wheat, maize, sugar, and edible oils. According to the World Bank, rising food prices have pushed 44 million people into extreme poverty and hunger since June 2010 in low- and middle-income countries. Instability in the region will also lead to an increase in prices and will pose further challenges for economic growth, imposing a heavy fi scal burden on governments apart from creating social and political unrest. The region’s recent widespread unrest is causing global economic fear and impacting global oil markets. The price of oil and grains jumped again amid fears that growing unrest in Libya and the signifi cant disruption of its oil production could spill over into other oil-producing countries in the region.
Some Arab countries are more vulnerable to the oil price increase and their room for maneuvering on the macroeconomic front is limited. Many poor countries face the risk of impeding or reversing years of progress toward achieving social development and poverty alleviation. Governments in the region are currently scrambling to produce reform policies to address the challenges posed by the economic crisis and its impact on their citizens. Although the expansion of social protection programs, such as school-feeding and conditional-cash-transfer programs focused on the most vulnerable groups, can be coordinated through international development agencies, it is challenging to implement comprehensive policies within the timeframe requested by the people, since the impact of economic policies with limited budgets cannot be realized in such a short timeframe.
This brings us to the challenges of coordination between donor and local eff orts and the lack of evaluation mechanisms for policies, especially in the
4 Development Evaluation in Times of Turbulence
Arab countries. In the past, the links between international and domestic eff orts were limited, and the mechanisms through which these eff orts were evaluated were also limited. The criteria used to evaluate, and the indicators used to understand, the fl ow of goods were vague and inconsistent. The manner used by the International Monetary Fund (IMF) and World Bank to evaluate local budgets was usually critical toward the public spending fl ow, nature, and style. The true challenge lies in the lack of a proper evaluation mechanism of economic crises, their impact, and the policies of governments in addressing economic and fi nancial crises. A clear understanding of the mechanisms of monitoring and evaluation should be established: How should these mechanisms grow? What benchmarks should be used? The Arab region should invest in building capacity toward creating economic policy evaluation systems that will aid and protect against future economic downturns. It should also realize the importance of evaluation. The need to assess, understand, and evaluate the eff ects and impacts of economic crises is crucial for the formulation of appropriate, timely, realistic, and implementable economic policies.

5
When Incremental Change Isn’t EnoughJan-Eric Furubo
Introduction
This chapter advocates the need for an adaption of evaluation to a world that is very diff erent than the world that existed in the formative years of evaluation. I will justify this assertion based on an interpretation of a central assumption about societal development, decision making, and politics that has been inherent in the form of evaluation that we see today as a feature of modern statecraft. I will also point out possible consequences for evaluation if the evaluation community will adapt to new challenges.
What Evaluation Was All About
We can safely say that evaluations have been conducted for thousands of years. After throwing a primitive spear, some of our ancestors certainly made observations in relation to criteria such as accuracy and power and used their observations to improve the spear. Even if we narrow to evaluation
CHAPTER 2
6 Development Evaluation in Times of Turbulence
of an activity based on a scientifi c set of methods, we can certainly say that evaluations have been conducted for more than 100 years in the United States and Europe. An important idea developed about public administra-tion in the United States during the end of the 19th century and the begin-ning of the next was that it was possible to scientifi cally judge the effi ciency of diff erent interventions in relation to their intended objectives.
In both Europe and the United States, we fi nd discussions from more than 75 years ago about what we later labeled central problems in evalu-ation. For a 1934 Swedish government commission, Gunnar Myrdal, later a Nobel Prize laureate, discussed the importance of counterfactual comparisons in establishing the eff ects of economic regulations (Myrdal 1934). In 1936, Merton discussed unanticipated consequences of “purpo-sive social action,” but he also defi ned outcomes in counterfactual terms and addressed the problem (well known to evaluators today) of unclear goals: “Moreover, it is not assumed that in fact social action always involves clear-cut, explicit purpose. It may well be that such awareness of purpose is unusual, that the aim of action is more often than not nebulous and hazy” (Merton 1936, 896). About 10 years later, during World War II, Kurt Lewin carried out what he described as evaluation (Mark and others 2011, 5, 8ff ). It also seems clear that the period after World War II saw an increased interest in how social sciences could be used in the construc-tion of public interventions. Many of these eff orts are associated with the development of policy analysis and names like Laswell. However, as we have already observed, the term evaluation was used many years earlier. In 1953, Henry W. Riecken wrote a memorandum to the Ford Founda-tion stating, “[E]valuation is always undertaken with reference to some intentional action designed to infl uence people or change a material situation. Evaluation is the measurement of desirable and undesirable consequences of an action intended to forward some goal that the actor values” (Riecken 1972, 86).
In 1967, Edward A. Suchman published Evaluation Research: Principles and Practice in Public Service and Social Action Programs, in which he noted, “We are currently in the midst of a ‘War on Poverty’ which has as its ulti-mate goal nothing less than the elimination of economic, educational, medi-cal, and social deprivation.’” He continues to point out that “some attempt be made to determine the eff ectiveness of such public service and social action programs has become increasingly insistent…. The result has been a sudden awakening of interest in a long-neglected aspect of social research—the evaluation study.” (Suchman 1967, 1f ).
Suchman gives an overview of earlier defi nitions and his own defi nition of evaluation:

When Incremental Change Isn’t Enough 7
as the determination (whether based on opinions, research, subjective or objective data) of the results (whether desirable; transient or permanent; immediate or delayed) attained by some activity (whether a program, or part of a program, a drug or a therapy, an ongoing or one-shot approach) designed to accomplish some valued goal or objective (whether ultimate, intermediate, or immediate eff ort of performance, long or short range (Suchman 1967, 31 f ).
Weiss, a few years later, is quite clear what evaluation “is all about”: “Basically, evaluation research is concerned with fi nding out how well action programs work” (Weiss 1972, 5). She further notes that almost all authors, like Marvin C. Alkin and Egon G. Cuba, agree that the “purpose of evaluation research is to provide information for decision making about programs” (Weiss 1972, 14).1
More contemporary defi nitions of evaluation (for example, Vedung 1997, 3; Rossi and others 1999, 4ff ) show the same consensus as Weiss noted 40 years ago. Evaluation is about making judgments about a specifi c inter-vention, a program, or, as Riecken expressed it 60 years ago, an intentional action. In the public sphere, it is about actions taken by governments, munic-ipalities, international organizations, and other entities that decide about actions aimed to infl uence the behavior of individuals or organizations.
Evaluation took off in the 1960s. In the preface of Evaluating Actions Pro-grams, published in 1972, Weiss discussed the increased emphasis on evalu-ation and a demand “not only (for) more evaluations, but more imaginative and skillful evaluation.” She also noted the quantitative expansions of evalu-ation: “A recent review of only federally funded evaluations with budgets in excess of US$25,000 turned up approximately a thousand such studies in one year (1970)” (Weiss 1972, xif ). In today’s dollars, the equivalent would be federally funded evaluations with budgets exceeding US$140,000. In a study of the development of evaluation in the United States, Rist notes, “Evaluation, by all measures, developed quite remarkably in the twenty years from 1960 to 1980” (Rist 2002, 226).
It seems safe to state that even if evaluation existed earlier, it was in the 1960s that it became an integrated part of the thinking and the theo-ries around political and administrative decision processes, budgeting, and program development. Thus, we can talk about the 1960s as the formative period of evaluation. The diff usion of evaluation around the globe in the fol-lowing decades, encouraged by strong entrepreneurs like the Organisation for Economic Co-operation and Development (OECD) and the World Bank, was diff usion of a “package” that was developed in the United States in the 1960s. Evaluation has been further integrated into ideas about budgeting and public administration that have dominated since the 1960s. When eval-uation became a mode in some European countries in the 1970s and 1980s,

8 Development Evaluation in Times of Turbulence
it did not build directly on the earlier European tradition of using social sci-ences in political decision making. Instead, Europe, and later other countries around the globe, imported an intellectual commodity from United States. However, a decisive factor for the interest in adopting this American “pack-age” was the earlier relation between the social sciences and the political and administrative sphere in diff erent countries (Furubo and Sandahl 2002).
The conclusion of this rough sketch of the historical development of evaluation is the following. When we are talking about evaluation in the context of government, governance, international development, and so on, it is not about evaluation as a generic term but about something associated with specifi c notions about politics, implementation, policy development, knowledge, psychological, and social mechanisms.2 Many of these notions are more explicit in earlier writings than in the contemporary stream of books and journal articles. Understanding these notions is crucial when evaluation is acting in a world very much diff erent from the world of 30, 50, or 70 years ago. This chapter will deal with such a notion, namely, evalua-tion as part of incremental decision making.
Incremental and Nonincremental Change
This sketchy historic overview demonstrates that evaluation was about incremental change: it was about helping to improve programs to make interventions better. Evaluation was constructed in a country, which, as Weiss noted, had become “increasingly aware of the social problems that plague special groups of the population and it has undertaken an array of programs to improve their lot” (Weiss 1972, 4). She points out that there comes a “time in the life of many programs, when it is important to ask: How are we doing? Are we accomplishing what we set out to do?” (Weiss 1972, 4). In these formative years of evaluation, it is not diffi cult to fi nd similar for-mulations by other leading evaluation theorists. This central perspective also dominates more recent texts about evaluation, for example, The Road to Results (Morra Imas and Rist 2009).
The pursuit of improving programs is, of course, a good ambition. After creating programs, we cannot be satisfi ed with their existence and their good purposes—we want to know to what extent they reach their purposes, how effi cient they are compared with other possible interventions, and which mechanisms lead or hinder intended change.
However, in many situations, we need forms of knowledge other than those produced by evaluation. We sometimes reach the point where we have to leave the incremental mode of decision making.
When Incremental Change Isn’t Enough 9
The assumption that stable periods in a society are replaced by more turbulent ones is certainly not new. Marx and Engels’ manifesto of 1848 pointed out that historical development sometimes can be seen as a pro-cess in which all that is solid melts into air (Marx and Engels 1848). From a diff erent camp, Lincoln expressed the same idea in his annual message to the Congress in 1862: “The dogmas of the quiet past are inadequate to the stormy present” (Lincoln 1862).
Both Marx and Engels and Lincoln expressed an awareness that societies can be seen as stable. During such stable periods, the fundamental institutions and policies continue and the adjustments are gradual and often based on the idea of “more (or less) of the same.” However, politicians, bureaucrats, and researchers do not always acknowledge stable times. More often they empha-size that “what our party suggests” is radically diff erent than what “the others want to do.” It is an obvious tendency to describe marginal changes as great reforms. After all, it is more fun to do something important than something unimportant. It is much more satisfying for a leading politician to change his-tory than to be one of the many who leave a soon-disappearing imprint.
Despite such rhetoric, we have adapted to a world in which changes are incremental and in which we can use our knowledge about existing actions and institutions to make decisions about future actions.
This incrementalism can be explained by an important observation made in contemporary research: Change is expensive! It often costs more to change a policy than to continue the present one. Any change creates new forms of uncertainty, brings other players into a situation, shifts the stakes and the relations among institutions, parties, individuals, and so on. Political parties and the electorate are familiar with politicians’ descriptions and prioritiza-tions. Policy shifts are expensive even if they have future potential. So, why change, especially as the probable eff ects of the change will not be seen for 10 to 15 years? The question was raised by a Swedish political scientist after a discussion about the price of change (Bergström 2006). Pierson quotes Hacker’s discussion about path dependence as developmental trajectories, which are inherently diffi cult to reverse, and adds that “the relative benefi ts of the current activity compared with once-possible options increase over time. To put it a diff erent way, the costs of switching to some previously plausible alternative rise” (Pierson 2004, 21).
Turning Points
The literature on decision making and policy learning points out that change processes sometimes reach a turning point at which it becomes evident that we cannot continue with marginal changes and small diversions from the
10 Development Evaluation in Times of Turbulence
stable course. Decision makers fi nd that the earlier road is blocked, the ear-lier course of action is closed, and they must do something very diff erent. In these situations, they must leave the stable course and the known ter-rain where they can rely on earlier experience. We can call such situations unstable or turbulent. They are the times when the chain of events takes a new direction, however unclear.
In the 1990s, in Agendas and Instability in American Politics, Baumgart-ner and Jones adopted Eldredge and Gould’s theory about punctuated equi-librium as an explanation of biological evolution. They emphasized that policy generally changes only incrementally due to a set of conditions and that the accumulation of such incremental changes can be important. How-ever, changes occur not only incrementally but also in bursts, and “when the bursts occur, old ways of doings things are swept aside, to be replaced by new organizational forms” (Baumgartner and Jones 1993, 235).
Baumgartner and Jones’ book is a study of American politics; however, the same observation is made in many other political and historical contexts. In his study on the rise of the modern market economy, Polanyi expresses much the same idea when he writes about “critical periods” and “connecting stretches of time” (Polanyi 1944, 4). Capoccia and Kelemen point out that the “dualistic conception of political and institutional development, based on an alternation between moments of fl uidity and rapid change and longer phases of relative stability and institutional reproduction, has a venerable pedigree in the social sciences and political history” (Capoccia and Kelemen 2007). Similar ideas are part of the theories of “formative moments” and “critical junctures.” A formative moment is the moment in which a policy is shaped on a fundamental level. In his discussion of formative moments in Swedish politics, Rothstein emphasizes that:
[P]olitical systems are usually so tightly structured that the prospects that actors may introduce signifi cant changes are very small. The playing fi eld, the rules of the game, the resources of the player—the institutional order, in other words—is at any point in time a given, and so the political actors’ room for maneuver is extremely limited. Under normal conditions, therefore, the pos-sibilities of fundamentally changing the structure of the political system are small to non-existent. Yet political systems nonetheless change, at times both rapidly and thoroughly. During certain special periods marked by mounting social and economic confl icts and crises, it appears that possibilities of chang-ing the rules of the political game arise.
.�.�. What diff erentiates the notion for formative moments from the notion of critical junctures is the importance of action in the former, i.e. the formative in the formative moment (Rothstein 1992, 174).
When Incremental Change Isn’t Enough 11
So, the idea that we sometimes have to leave the “incremental mode” is not new. Even though change demands more than continuing the present course of actions, sometimes the balance point changes—after all, policies do change. Sometimes the price of continuing with “more of the same” is higher than the uncertainties connected with a change in direction.
Before going further, it is important to emphasize that stability and tur-bulence can exist on diff erent scales. What is a very turbulent situation on one level can be part of an ongoing, hardly notable process, at a superior level. For example, what an agency head regards as an existential question for the agency can be merely a marginal question from the perspective of a president or prime minister. Diff erent hierarchical levels have diff erent scopes of possible actions. This point is expressed by Wildavsky when he states, “a department secretary might conceivably gain by learning that there are greater benefi ts in shifting resources from national parks to urban recreation. But the men who run the parks and forests cannot use this infor-mation; they need to know about allocation within the parks.” (Wildavsky 1979, 217). They may regard a reallocation of resources within the parks as a fundamental reorientation within their scope of action. Thus, the discus-sion about stable and turbulent times can be carried out on diff erent levels. In this book, our discussion is about turbulent times on a more aggregated societal level or within a policy fi eld. Turbulent times are when earlier poli-cies or interventions are questioned, when new ones are created, and when there is a fundamental change of goals and basic policy tools. Change in such times will be much less incremental.
Will Change Be Less Incremental in the Future?
Even if we accept the idea of “stable and turbulent” times, it is not clear that the situation today is more turbulent than the situation in the 1960s. Many will question such a description. It is obviously impossible to answer the question of whether we are living in a more turbulent world than we did in the 1960s or 1970s; while we are in the midst of now, the answer would be more about subjective perceptions than objective realities. It is probably not fruitful to argue that the world in some objective meaning has changed position on a stable–turbulent scale since 30 or 50 years ago.
Another question is more fruitful. How did the men and women who developed the fundaments of what we call evaluation perceive the world? A subjective interpretation is unavoidable, as the evaluation theorists from the formative years of evaluation assumed, and wished for, incremental societal betterment. Reading their texts several decades after they were written, it

12 Development Evaluation in Times of Turbulence
is not diffi cult to feel their deep conviction that an arsenal of diff erent pro-grams could gradually lead to social betterment and that society was on a road that could be seen as stable. Such an interpretation does not mean that the discussants of evaluation imagined that the course toward social bet-terment could not be blocked. After all, the formative period took place in the midst of the cold war and the political weight among diff erent political forces within the United States at that time could change the fundamental policy direction. But assuming that these threats were warded off , the incre-mental journey could continue.
However, it can be argued that it is possible that objective circumstances have made the world more turbulent. These factors have to do with time and distance. Countries are much more interwoven than a few decades ago. What happens in fi nancial markets in one part of the world more or less immediately infl uences the conditions for ordinary people on the other side of the globe. Turbulence is triggered not only by what happens in the local or national community or even among national neighbors. Each society is much more exposed to factors that can lead to turbulence. To this can be added the fact that the diff usion of new ideas, including questioning diff er-ent societal structures, is much more rapid today than only 10 years ago.
Confronting Crises
It is not diffi cult to argue that we perceive our societies as more turbulent than they were decades ago. Today we are confronting crises (without defi n-ing the term) that can be seen as a demonstration of more fundamental, more permanent problems. We also lack the explanatory power through inter-preting earlier eff orts to interpret current societal developments. Events, whether they concern climate, fi nancial instability, upheavals of violence, or breakdown of social order, can be transferred to a more fundamental notion of “unstable conditions,” which can give policy makers the feeling that it is impossible to continue earlier policies. Unstable conditions can lead to an awareness that the earlier paradigm from which diff erent explanations and solutions of societal problems were constructed is now insuffi cient and must be replaced.
Crises can spotlight imbalances and imperfections that may have been seen earlier. Individuals and groups (including evaluations) may have observed underlying problems in a policy. However, the picture has been uncertain or contradicted by other experts, or the eff ects of alternative strat-egies may have been disputed. In light of the cost of changing policies, it was natural—and perhaps rational—to continue the earlier policy. But a cri-sis reveals diffi culties that were earlier seen unclearly or not at all. What

When Incremental Change Isn’t Enough 13
was earlier regarded as latent or distant possibilities, or even the doomsday warnings of prophets, are now manifest in the daily news.
Turbulence Caused by Factors Other Than Crises
That crises sometimes create a break in the earlier order does not mean that a crisis is the only factor that can lead to a “punctuation” of equilibrium and a perception that times are so turbulent or unstable that searching for alter-natives seems unavoidable. In other words, we can talk about punctuations— to use Baumgartner and Jones’ term—even if we cannot point out dramatic episodes. An accumulation of “signs” of problems related to a societal devel-opment can demonstrate that it is impossible to continue “piecemeal engi-neering,” to borrow Popper’s phrase.
Before going further, a point made by Bennet and Howlett must be emphasized. They note that “[W]hy policies change, however, is not a well-understood phenomena” (Bennett and Howlett, 1992, 275). This statement is true even if empirical studies tell why old policies are replaced with new ones. In his study regarding economic policy reversals, Hood distinguishes four main explanations, or groups of explanations, for policy reversals. One group has to do with “climate changing ideas” caused by intellectual devel-opment and new economic theories. Hood notes two possibilities of how ideas can turn policy around. One “is that public policy follows the ideas of social science (particularly economics) and that theoretical breakthroughs and ‘crucial experiments’ can put it into reverse” (Hood 1994, 5). An alter-native possibility is the role of “packaging rather than content in explaining how economic policy ideas become persuasive” (Hood 1994, 6). A second group of explanations puts “ the dynamic of political interest into the cen-ter of the theoretical stage” (Hood 1994, 7). A third group has to do with changes in social structures, which form the “habitats” for corresponding types of public policies (Hood 1994, 11). Hood describes the fourth main group of explanations as policy self-destruction and refers to Wildavsky’s claim that polices tend “to create unexpected and problematic side eff ects, which, in turn, create conditions for the introduction of new polices to cor-rect or modify the eff ects of the earlier ones” (Hood 1994, 14).
Both crises and other forms of change have an impact on how existing policies are perceived in such a way that decision makers will search for new alternatives on a more fundamental level.
Examples of such changes include the following:
• Changes in what we regard as fundamental problems in society. Fifty years ago, global warming and the environment in general were not
14 Development Evaluation in Times of Turbulence
regarded as problems. Over time, we may use new information and data to fundamentally redefi ne the crucial challenges in society. Kingdon emphasizes that constructing “an indicator and getting others to agree to its worth become major preoccupations of those pressing for policy change” (Kingdon 2003).
• Changes regarding which problems we think should be handled by gov-ernmental policies, that is, which problems we regard as tasks for the political sphere to solve or to handle.
• Changes in our notions about the role of scientifi c knowledge in framing public policies. The notion that it is possible to build knowledge about the causal relations among phenomena and construct interventions to infl u-ence causal processes can underlie governmental interventions. How-ever, some question the notion that it is possible to build such value-free knowledge (for example, Fischer 2003). Geyer and Rihani demonstrate that notions regarding the degree to which scientifi c knowledge can pre-dict outcomes of public policies is embedded in our understanding of sci-ence in general (Geyer and Rihani 2010).
• Fundamental changes in previous explanations of societal mechanisms. If we apply Kuhn’s idea of paradigms to social science, it is possible to see that new knowledge can create a reconstruction of our fundamental ideas about what constitutes certain developments in society. Such shifts make earlier policies and interventions, and also—at least partly—earlier studies and evaluations, invalid.
• Changes in the relations between parties and institutions and the devel-opment of new coalitions. These changes can also change expectations more generally in society both internationally and nationally. In the 1990s, we saw important changes in relations between nations that made it necessary to create new ideas about international relations. Very stable political conditions and electoral success over an extended period lead to signifi cant changes, including shifts in the expectations of social actors. “At some point, these actors begin to recognize that there is a new status quo, and they adjust their policy preferences to accommodate the new environment. By doing so, they help to propel coordination around these new expectations, reinforcing the new regime” (Pierson 2004, 85).
Naturally, there are tradeoff s. An administration’s lack of ability to handle its undertakings can lead to a search for explanations for its lack of success. Such a search can lead to a shift in what are regarded as valid explanations of diff erent developments.
Several of these factors have an intrinsic relationship to values. As men-tioned earlier, statistics about societal problems can infl uence what we
When Incremental Change Isn’t Enough 15
regard as important and can have an impact on what knowledge we pro-duce. The selection of which phenomena are important to describe and explain also has to do with values. For example, if we try to measure changes in the number of children living on the street, it is evident that we regard this issue as important because of our values. Some developments are mea-sured in some countries and not measured in others.
All of these factors can be discussed in relation to a time perspective. A shift in what we conceive as the fundamental problems in society can take many years and even many decades. The transition from one dominant mode of explanation of certain phenomena in society to another can cer-tainly take a very long time. However, the point about formative moments, punctuated equilibrium, windows of opportunity, and so on, is that at some points in time, one factor becomes so important, or several factors converge in such a way, that we can talk about a “burst” or a historical watershed.
The Role of Evaluation in Turbulent Times
The language and the literature in fi elds like public administration, policy learning, and so on indicate that we regard the policies and tasks of gov-ernments and other enterprises as ongoing. We see them as a sequential process, often described as a circle, whose elements can be foreseen and planned in advance. We easily recognize phases such as “identifi cation of alternatives for future action,” “analysis of costs and benefi ts of the alterna-tives,” “choice of alternative,” “implementation, monitoring,” “evaluation,” and “identifi cation of possible changes.”
When we move from phase to phase in this circle we are moving in a well-known terrain and we can use earlier experiences. In this ideal type of rationalistic decision making, it is easy to grasp the role of evaluation: it is part of an ongoing incremental process of improvements and adjustments of a policy or an activity. Diff erent evaluation systems feed this ongoing process with information to gradually improve programs or governmental interventions. The procedures for monitoring and evaluating an interven-tion, therefore, often refl ect the same assumptions that were implicit or explicit in developing the intervention (Leeuw and Furubo 2008).
One way to describe what happens when we are moving around this met-aphorical circle is that we assume we know which information is relevant when we want to judge the success of diff erent elements of the intervention. Even if the environment in which the intervention takes place changes, we know—or assume that we know—what changes are important to observe. We imagine how things might have developed without the intervention.
16 Development Evaluation in Times of Turbulence
However, when we move outside our circle, we have growing, and more obvious, problems handling the counterfactual.
The incremental way of decision making has been seen as a realistic pic-ture of political decision making, not least for budget decisions, although empirical studies point out that the characterization of budget processes in terms of incrementalistic decision making can be questioned (for example, Jordan 2003; Anderson and Harbridge 2010). However, the point is that we are so used to the idea that decision making in the political sphere is incre-mentalistic that we risk not understanding the fundamentally diff erent situ-ation we face in turbulent times.
In turbulent times, when earlier courses of action are closed or fundamen-tally questioned, we need a very diff erent form of knowledge than in stable periods, when earlier courses of action are assumed to continue. In stable times, policy makers need knowledge about hundreds of questions related to the intervention itself and its interplay with other factors. Relevant ques-tions are based on earlier interventions: how they worked, how they can be changed to work better, and so on. In turbulent times, new priorities and new actions are being discussed and the knowledge produced within earlier policy frameworks is less relevant. The uncertainties are deeper.
Thus, the role of evaluation is diff erent in turbulent times, when we are moving outside the framework of existing policies and policy paradigms. The questions now asked by decisions makers are about alternatives. Tur-bulent times can shake the foundations of policy interests and structures. Institutions and structures are put under pressure.
Turbulent situations also create new arenas with new players and involve new stakeholders and interests, who ask diff erent questions. The new play-ers are more open and less oriented toward evaluation of earlier policy interventions. They want answers that can give them ideas about funda-mental alternatives for the future, or, as Boswell puts it, “Policy makers are more likely to recognize gaps in research where they become aware of the emergences of new types of problems, such as climate change, the impact of new technologies, threats to public health or security, or the emergence of new forms of criminality or social pathology” (Boswell 2009, 243).
The perception that there is an ultimate need to change a policy, or the direction of a whole society, must be matched by an interpretation of the potential of alternative policies or directions. The object in earlier evalua-tions is knowledge produced by existing interventions, which is now obso-lete. In the creation of new policies, new instruments and new institutions are constructed and new questions raised. The questions are ex-ante and evaluation is now about identifying the best possible knowledge that can be used in discussing alternative solutions.
When Incremental Change Isn’t Enough 17
Consequences for Evaluation
Even the reader who accepts the need for new forms of knowledge in tur-bulent times and agrees that we are confronting problems and issues that will make nonincremental change unavoidable will ask, What are the consequences for the practice of evaluation? I will point out two conse-quences. The fi rst is a changing relationship between evaluation and the social sciences and the second is the need to rethink who is the audience of evaluation.
A New Relation to Social Sciences
Decision makers, and any group that formulates possible courses of action to decide on actions to meet fundamental challenges that cannot be met within earlier policy frameworks, are asking, “What works?” Their ques-tions concern causalities in society. Evaluation of earlier interventions and programs can be relevant, but we must be aware that evaluation is only one source, and a limited one, of knowledge about what causes certain changes. To judge the possible impact of a certain intervention, we need knowledge about causalities that goes far beyond the purview of social sciences (for example, which factors explain variations in the halt of carbon dioxide? To what extent will smoking increase the risk for a certain type of cancer?). However, every governmental intervention will also be based on assump-tions about how individuals and collective players will act. They ask ques-tions such as: How will big companies react to a certain regulation? How will other nations react to a certain incentive or a threat? How will parents react to changes in the fi nancing of education? How will certain actions infl uence terrorism?
Whether an intervention is about saving the banking system or counter-acting terrorism, decision makers must decide which, or which combination of, policy options will create the best possibilities to reach their objective. They are searching for knowledge about causalities and need to examine intervention theories for diff erent, often competing, possible interventions. And they usually have to fi nd the best answers in a short time, sometimes a few days. The question will, therefore, be asked: “Where can we fi nd the best possible supplier of answers?”
Obviously, the answers can be based on knowledge from many sources: controlled laboratory experiments, theoretical analyses, empirical studies of social phenomena (such as Durkeheim’s study of suicide, Rosenthal and Jacobson’s study of expectations of teachers), but also from evaluations. Even if the purpose of evaluation is to improve interventions, many forms
18 Development Evaluation in Times of Turbulence
of knowledge other than evaluation can be used to answer important ques-tions in constructing future interventions. It is naïve to assume that evalua-tion can be more than one of many sources of knowledge in the construction of interventions. When policy options become broader, knowledge built on earlier interventions is less relevant.
Evaluators must accept that turbulent times will lead to a broader discus-sion about how social sciences can contribute to answering questions that are crucial for framing public policies. As expressed in a recent report by the National Research Council of the National Academies in the United States, “Scientists—when they are practicing science—do not tell policy makers what should interest them or what policy choices they should make. Scien-tists deal with accurate descriptions of conditions and explanations about the causes or consequences of those conditions.” (Prewitt and others 2012, 9).
Conversely, evaluation has to be discussed in a much broader social sci-ences context. In Mind the Gap: Perspective on Policy Evaluation and the Social Sciences (2010), editors Jos Vaessen and Frans Leeuw argue that:
From the 1970s onwards several developments took place which led to an emancipation of evaluation as a professional practice on its own, while the relationship with the social and behavioral sciences weakened. One of the rea-sons for the emerging gap between evaluative practice and the social sciences was the increasing importance and institutionalization of evaluative activi-ties inside public administration and policy-making. While evaluation studies in the fi rst half of the twentieth century were largely researcher-led studies shaped by the interests of scientists, in the second half, and especially from the 1970s and 1980s onwards, evaluation agendas were increasingly deter-mined by policymakers and administrators of public interventions (Vaessen and Leeuw 2010, 5).
In The Evaluation Society (2011), Peter Dahler-Larsen raises fundamental questions about the role of evaluation in contemporary societies and how “the mysteries behind the evaluation wave” can be explained. In discuss-ing defi nitions of evaluation as “part of the sociological story,” he makes an important remark on Scriven’s defi nition of evaluation.
Scriven is one of the founding fathers of modern evaluation as a distinct fi eld and one of the fi rst to analytically distill what it means to do evaluation. His defi nition is interesting in many respects. The object of evaluation, the so-called evaluand, is described as ‘something.’ Perhaps it is the very generaliza-tion and abstraction of the evaluand, and its liberation from any specifi c and substantial human activity, that now makes it possible to conceive of evalua-tion as a distinct cognitive activity in and of itself. If you wanted to evaluate music, you might call a good musician. Now, if you want to evaluate some-thing, there is a need for an evaluation specialist (Dahler-Larsen 2011, 5).
When Incremental Change Isn’t Enough 19
These examples can also be seen as an indication of a growing inter-est among evaluation scholars in the relationship between evaluation and social sciences. Owen’s discussion of evaluation in relation to an “expanded defi nition of evaluative inquiry” (Owen 2007, 18) seems to be based on a broader use of science and not only on earlier evaluations.
Accepting that the relationship between evaluation and the social sci-ences has to change, we can discuss the audience of evaluation.
A New Audience for Evaluation
For several decades, the fi eld of evaluation has been preoccupied with its rela-tion to decision makers and diff erent stakeholders. Even Weiss, who discusses the question in broad “knowledge-terms” rather than in “evaluation-terms,” regards the relationship as between the evaluator (or the evaluations) and the decision maker. Boswell noted, “… the assumption remains that research is val-ued fi rst and foremost as a means of infl uencing policy. Policy-relevant knowl-edge is produced and used in order to adjust policy output—even though it is acknowledged that its infl uence is somewhat less direct than the problem-solving account implies. In eff ect, then, such critiques modify the instrumen-talist account but do not essentially break with it” (Boswell 2009, 5).
Boswell’s comment is important. The idea underlying the debate about use of evaluations is based on an instrumental model, which starts with the evaluation that will be disseminated (through product or process) to deci-sion makers, who will use it in their decision making, or to other groups in the policy framework.
This relationship between evaluators and policy makers is important in stable times characterized by incremental processes. However, in tur-bulent times, diff erent questions demand a broader infl ux from the social sciences. Therefore, evaluators need to have a relationship to wider social science communities. Metaphorically speaking, evaluations are like depos-its in “knowledge banks.” Bank offi cials, to continue the metaphor, interpret the information from diff erent studies, rearrange it, and relate it to earlier knowledge in the fi eld.
The immediate users of evaluations are now not only decision makers, but also the offi cials of our metaphorical bank. The form of knowledge structures is usually compatible with social science disciplines. The extent to which the information gained from earlier governmental interventions will be chan-neled into the political and administrative system depends on how much it contributes to building more general knowledge. Some policy areas are part of strong, well-defi ned knowledge structures, such as a specifi c social sci-ence discipline or subdiscipline. When discussing the choice of fi nancial

20 Development Evaluation in Times of Turbulence
regulations, it is not diffi cult to know which academic fi elds contain the rel-evant knowledge. If we are discussing which actions will limit the spread of a certain disease, the situation is similar. For other policy areas, such as crime prevention, it is more diffi cult to defi ne the relevant knowledge structure.
A Final Remark
We have focused on the role of evaluation in helping decision makers and others judge diff erent policy options when there is a need to change the earlier course of action. Although, times may shift between stability and turbulence, the incremental form of decision making will probably remain dominant in the future, even if the punctuations happen more often.
Evaluation will continue to have an important role in helping politi-cal and administrative decision makers and stakeholders understand how existing interventions can be improved. Evaluation can also be important from an accountability perspective.
Even these traditional roles demand that evaluation asks more critical questions. The debate about diff erent systems for measuring the eff ects of programs through indicators, based on the same assumptions as the pro-grams, is a memento. Evaluation can be conservative, showing problems and possible improvements in programs, but not questioning the fundamental assumptions behind the programs.
In the research about the utilization of evaluation many diff erent forms of utilization have been discussed, and we can certainly talk about uses of evaluation in terms such as symbolic and legitimating. From a political science or anthropological perspective, such forms of utilization can be important to study. However, in discussing how evaluation can contribute to a better society, the main question is: To what extent can evaluation con-tribute knowledge that can help us to make tough choices about the future?
Notes
1. A terminological question is evaluation vs. evaluation research. This question will not be discussed here. However, the quotations can be interpreted in such a way that the meaning will be the same even if we use the word evaluation instead of evaluation research.
2. Thereby, it is also said that evaluation can be used in quite diff erent, and more generic, ways than discussed here. It can mean, as Scriven strongly advocates: The process of determining (or the act of declaring) something about the merit, worth or signifi cance of any entity” (Scriven 2013: 170).

When Incremental Change Isn’t Enough 21
References
Anderson, S. and L. Harbridge. 2010. “Incrementalism in Appropriations: Small Aggregation, Big Changes.” Public Administration Review 70 (3): 464–74.
Baumgartner, F.R., and B.D. Jones. 1993. Agendas and Instability in American Poli-tics. Chicago: University of Chicago Press.
Bennet, C.J., and M. Howlett. 1992. The Lessons of Learning: Reconciling Theories of Policy Learning and Policy Change.” Policy Sciences 25 (3): 275–94.
Bergström, H. 2006. Vem Leder Sverige Mot Framtiden? Stockholm: SNS förlag.Boswell, C. 2009. The Political Uses of Expert Knowledge. Cambridge: Cambridge
University Press. Capoccia, G., and R.D. Kelemen. 2007. “The Study of Critical Junctures: Theory,
Narrative and Counterfactuals in Historical Institutionalism.” World Politics 59: 341–69.
Dahler-Larsen, P. 2011. The Evaluation Society. Stanford, CA: Stanford University Press.
Fischer, F. 2003. Reframing Public Policy. Oxford: Oxford University Press. Furubo, J.E., and R. Sandahl. 2002. “A Diff usion Perspective on Global Develop-
ments in Evaluation.” In International Atlas of Evaluation, edited by J.E. Furubo, R.C. Rist, and R. Sandahl. New Brunswick, NJ: Transaction Publishers.
Furubo, J.E., and O. Karlsson Vestman. 2011. “Evaluation for Public Good or Profes-sional Power.” In Evaluation: Seeking Truth or Power? edited by P. Eliadis, J.E. Furubo, and S. Jacob, 1–35. New Brunswick, NJ: Transaction Publishers.
Geyer, R., and S. Rihani. 2010. Complexity and Public Policy. New York: Routledge.Hood, C. 1994. Explaining Economic Policy Reversals. Buckingham: Open University
Press.Jordan, M.M. 2003. “Punctuations and Agendas: A New Look at Local Government
Budget Expenditures.” Journal of Policy Analysis and Management 22 (3): 345–60.Kingdon, J.W. 2003. Agendas, Alternatives and Public Policies. Second Edition.
New York: Longman.Lincoln, A. 1862. Annual Message to Congress. http//quotationsbook.com/
quote/44576 (accessed November 21, 2012).Leeuw, F.L., and J.E. Furubo. 2008. “Evaluation Systems: What Are They and Why
Study Them.” Evaluation 14 (2): 157–69.Mark, M.M., S.I. Donaldson, and B. Campbell. 2011. Social Psychology and Evalua-
tion. New York: Guilford Press.Marx, K., and F. Engels. 1848. Communist Manifesto. Wikipedia (accessed
November 21, 2012). Merton, R.K. 1936.“The Unanticipated Consequences of Purposive Social Action.”
American Sociological Review 1 (6): 894–904. Morra Imas, L.G., and R.C. Rist. 2009. The Road to Results. Washington, DC: World
Bank.Myrdal, G. 1934. Finanspolitikens ekonomiska verkningar. SOU (Statens off entliga
utredningar/ Offi cial reports of the Swedish Government) 1934:1.
22 Development Evaluation in Times of Turbulence
Owen, J.M. 2007. Program Evaluation: Forms and Approaches. New York: The Guil-ford Press.
Pierson, P. 2004. Politics in Time: History, Institutions, and Social Analysis. Princeton: Princeton University Press.
Polanyi, K. 1944. The Great Transformation: The Political and Economic Origins of Our Time. Boston: Beacon Press.
Prewitt, K., T.A. Schwandt, and M.L. Straf. 2012. Using Evidence in Public Policy. Washington, DC: National Research Council of the National Academies.
Riecken, H.W. 1972. “Memorandum on Program Evaluation.” In Evaluating Actions Program: Readings in Social Science and Education, edited by C.H. Weiss. Boston: Allyn and Bacon, Inc.
Rist, R.C. 2002. “The Rise and Fall (and Rise Again?) of the Evaluation Function in the U.S. Government.” In International Atlas of Evaluation, edited by J.E. Furubo, R.C. Rist, and R. Sandahl. New Brunswick, NJ: Transaction Publishers.
Rossi, P.H., H.E. Freeman, and M.W. Lipsey. 1999. Evaluation: A Systematic Approach. Sixth Edition. Thousand Oaks, CA: Sage Publications.
Rothstein, B. 1992. “Explaining Swedish Corporatism: The Formative Moment.” Scandinavian Political Studies 15 (3): 173–91.
Scriven, M. 2013. “Conceptual Revolutions in Evaluation: Past, Present and Future.” In Evaluation Roots: A Wider Perspecitve of Theorists’ Views and Infl uences, edited by M.C. Alkin. Los Angeles: Sage Publications.
Suchman, E.A. 1967. Evaluation Research: Principles and Practice in Public Service and Social Action Programs. New York: Russel Sage Foundation.
Vaessen, J., and F.L. Leeuw. 2010. Mind the Gap: Perspective on Policy Evaluation and the Social Sciences. New Brunswick, NJ: Transaction Publishers.
Vedung, E. 1997. Public Policy and Program Evaluation. New Brunswick, NJ: Trans-action Publishers.
Weiss, C.H. 1972. Evaluating Actions Programs: Readings in Social Science and Edu-cation. Boston: Allyn and Bacon, Inc.
Wildavsky, A. 1979. Speaking Truth to Power. Boston: Little Brown & Company.

PART ONE: IMPLICATIONS OF TURBULENT TIMES FOR EVALUATION APPROACHES


25
Evaluation and Turbulence: Refl ections on Our TimeSaraswathi Menon
IDEAS’ Early Vision
It is a great privilege to be at the global assembly of the International Development Evaluation Association (IDEAS) and I would like to thank IDEAS for this opportunity to share some thoughts with you. It is good to meet in Jordan, which has been the meeting point of many cultures and peoples and, therefore, an appropriate meeting place for evaluators from across the globe.
IDEAS is, after all, an institution that has its roots in a vision that development evaluation must represent and catalyze a broad spectrum of actors, countries, interests, and ways of thinking. The United Nations Development Programme (UNDP) Evaluation Offi ce is proud to have been an early champion of IDEAS and to have played a lead role from the London Declaration in 2001 to the formal establishment of IDEAS in Beijing in 2002. The vision of that period, which combined three strands—to strengthen evaluation practice, to move beyond aid evaluation to development evaluation, and to contribute to governance for development—remains with
CHAPTER 3
26 Development Evaluation in Times of Turbulence
us today. These strands are still on our website. IDEAS was intended to be a forum that was inclusive and responsive to new trends in evaluation and in development and, thereby, to explore the interstices between development and evaluation as a two-way, dialectical process.
It is signifi cant that this global congress focuses on evaluation in a time of turbulence. I am assuming that we all see turbulence from the point of view of development. In fact, I would argue that people across the world, especially those who live in deprivation and exclusion, constantly live in a time of turbulence and of crises, including, but not just related to, food, fuel, and fi nance. What makes this economic crisis signifi cant is that it aff ects the North and not just the South, that it aff ects governments and not just people prompting democratic movements to improve governance in many countries, and that it has worsened conditions for those who were not poor or who recently escaped poverty, not just for those who have been trapped in poverty for generations. It is for these reasons that turbulence, crisis, and fragility so readily come to our lips when we talk about development today. It is important that we unpack turbulence from the standpoint of people’s lives if we are to understand it in development terms.
Linking Evaluation and Development
Let me begin by positing a broad link between evaluation and development.What is the ultimate end of evaluation and how does it intersect with
development? Simply put, I would say that it is to improve public action to contribute to people’s well-being. Public action can be seen in its broadest sense as the agency of people combined with the actions of the state and its partners. Learning and accountability, which are so often seen as the purposes of evaluation, are only channels by which the process and results of evaluation temper and galvanize public action. Learning and accountability should not necessarily be seen as the end, but only as a means to development. Only by reinforcing public action and fostering change can evaluation contribute to development.
More concretely, let me explore the interplay between the three purposes of IDEAS and this larger objective of development evaluation: to catalyze public action.
Strengthening the Practice of Evaluation
First, with regard to strengthening the practice of evaluation, evaluation as a discipline has advanced considerably in the past few years. As
Evaluation and Turbulence: Refl ections on Our Time 27
a professional discipline standing on the shoulders of several social sciences from whom it gathers methodologies and analytical approaches, evaluation may be said to have come of age. Evaluation’s visibility as a profession may be measured crudely by the number of universities off ering courses in evaluation, dedicated evaluation units in governments and organizations, regional and country-level associations of evaluation professionals, conferences on evaluation where new methodologies are discussed, consulting companies that specialize in evaluation, and, not least, the plethora of evaluation reports published annually that seek to make a constructive contribution to change. There is no doubt that technical and methodological progress in evaluation is critical to making evaluation more robust and credible.
IDEAS has played an important role as facilitator of this progress. Successive global assemblies have provided forums to discuss new developments in methodologies and approaches and to hone the skills of evaluators. The strong bond that has been built with the International Program in Development Evaluation Training (IPDET) in recent years refl ects the emphasis increasingly placed on evaluation methods and approaches and continued networking among those who have participated in common training programs. An important, although less pronounced, link with the regional evaluation associations refl ects the important global span of IDEAS envisioned by its founders. The networking platform that IDEAS provides has the potential to catalyze professional interaction that goes well beyond IPDET and the regional associations. My sense is that this potential is not yet fully tapped because we are mainly evaluators talking to evaluators. I will return to this challenge later.
Moving beyond Aid Evaluation
Let us now examine the second purpose of IDEAS, which talks of moving beyond aid evaluation. As we in UNDP understand it, development eff ectiveness can be conceptualized only within a national context. At best, international or aid partners contribute to development eff ectiveness by eff ectively partnering with national eff orts. The evaluation of this support can only be termed an assessment of aid eff ectiveness. I would argue that it is a travesty to talk about the development eff ectiveness of a bilateral or multilateral agency. It is more appropriate to talk of their contribution to development eff ectiveness. Development eff ectiveness is the result of public action, national policies, national capacity, and national engagement. Our focus in development evaluation, therefore, requires an understanding of
28 Development Evaluation in Times of Turbulence
change in a national context and demands of us methodologies and criteria that can assess the complexity of development as it is played out in a country in interaction with global trends and forces.
The criteria and approaches that have served development evaluation were born of the practice of aid that was intended to fi ll resource or capacity gaps in developing countries. The extremely useful criteria developed by UNDP’s Development Assistance Committee (DAC) with the bilateral donors in the context of evaluating projects—relevance, eff ectiveness, effi ciency, impact, and sustainability—have become core criteria for all types of evaluation and are embedded in professional evaluation capacity-development eff orts. These criteria are a natural fi t for the discrete universe of projects and programs through which development cooperation, and sometimes targeted spheres of government action, are delivered. Similarly, the pathbreaking work on impact evaluation begins, and too often ends, from the perspective of a single intervention and its results.
Evaluation criteria and questions must be expanded and fundamentally rethought if they are to yield meaningful information when looking at more complex phenomena such as outcomes, strategies, policies, and public goods. They yield only partial, and not necessarily the most crucial, information for infl uencing public action that spans the state, civil society, and the citizen. They do not capture the complexities and interactions among policies. If evaluation is to reorient public action, evaluation criteria and questions must answer what is important for the citizen and policy maker, not only what is important for the funder and manager of the initiative, whether national or international.
What issues concern citizens? Let us look at the questions being raised during this period of “turbulence.” Citizens are raising questions regarding prioritization and choice of policies. They want to know how national policies aff ect equity or reinforce social and economic gaps. They want objective assessments that will capture the persistence of inequality and discrimination and point to ways to overcome them, ways that are sustainable in a broader sense and not just based on continuing the results of isolated interventions. Citizens are concerned about the quality of governance and growing corruption. Development evaluation has to respond to such challenges. It must be underpinned by the principles of human development and use diff erent criteria and diff erent approaches if it is to respond to the type of knowledge about development eff ectiveness demanded by citizens. This is a second challenge that we face and to which I will return.
Evaluation and Turbulence: Refl ections on Our Time 29
Contributing to Governance
Let us now take a look at the closely related, very important third purpose of IDEAS—to contribute to governance for development. We evaluators pride ourselves on basing our judgments on evidence that has been rigorously collected and validated. And yet it is striking that in the recent past, judgments about the performance of governments have been shaped by evidence from a source very diff erent from evaluation—Wikileaks. And indeed public action has been catalyzed by this “evidence”: The recent mass movement against corruption in my own country, India, is a case in point. The publication and analysis of offi cial documentation unleashed a public outcry for changes in legislation. What can we evaluators learn from Wikileaks? Wikileaks stays true to its sources and does not compromise or hedge its information. Importantly, it allows others to analyze its raw information.
Development evaluation, however, perhaps because of its origins in aid evaluation, has stayed programmatic and, as a result, has had limited relevance or impact on governance. Its purpose, by and large, has been to improve programs within the framework of defi ned or intended and unintended results and not to question the basis of public action.
My colleague, Alan Fox, was to have presented at this forum our experience in the UNDP Evaluation Offi ce of conducting an evaluation in Tunisia and the Arab Republic of Egypt in recent months—a time of “turbulence.” He was unable to come, not because of security concerns, but because he is revisiting and fi nalizing our evaluation in Egypt. If we had maintained the usual practice of evaluating against intended results and using the standard DAC criteria, the UNDP program in Egypt would have done rather well. But we are using other criteria. We evaluated against United Nations (UN) norms and values as well, and it is only by doing so that the traditional assessment begins to unravel and we begin, very partially I would be the fi rst to admit, to address the kind of concerns that the youth of Egypt have been raising regarding development and gov ernance and to look at the implications for development cooperation.
Development evaluation has also, I would argue, been rather ahistorical although development is historical. A little over a year ago, the UNDP Evaluation Offi ce together with the Human Development Observatory of Morocco organized a meeting on national evaluation capacity. Please note it was not a meeting on capacity development. It was a forum to share national experiences so that South–South and trilateral cooperation in evaluation could take place. The themes discussed are familiar to all of us and are

30 Development Evaluation in Times of Turbulence
refl ected in the content of this assembly: institutional setups for evaluating public policies and programs; the relationship between monitoring and evaluation; independence of evaluation; the important distinction between capacities to manage, conduct, and use evaluations; quality and use of evaluation; and technical capacity and the political economy of evaluation.
Because countries were sharing their own experiences, the historical analysis was important. The origins of interest in evaluation varied. For some, as in Ghana, it was an initial push from donors that was later internal-ized. For others, as in India, it grew out of a national planning system crafted immediately after independence from colonialism. And yet for others, as in South Africa, it was part of the public accountability of a new democracy that had to overcome years of discrimination in order to create a new free society.
But in all countries, the national project and demands of citizens shaped evaluation systems. In all, the value of evaluation was seen as the ability to question the basis of policies themselves and not just to assess their implementation. An important conclusion of the meeting was that although a lot of work was being done on how to conduct an evaluation, far less attention was being paid to the use and users of evaluation. For this reason, the theme of the use of evaluation will be central in a follow-up conference on national evaluation capacity that is being organized by the Government of South Africa and the UNDP Evaluation Offi ce this September.
Three Challenges
Development evaluation has to emerge from a programmatic, ahistorical world view to a much more complex understanding of development reality driven by the demands of public accountability. I talked earlier of three challenges that must be met if the three central purposes of IDEAS are to be achieved.
• The fi rst challenge is the need for broader platforms and networks going beyond evaluators. These broader platforms should engage users. Already in countries in Latin America, evaluation systems interact much more closely with civil society than elsewhere. There is much we can learn from their experience and IDEAS is the ideal forum.
• Second is the need for new evaluation criteria. Chinese evaluators already use criteria such as equity and innovation, which are more rel-evant for development evaluation. In the United Nations, we prioritize human rights and gender equality in evaluation and are developing
Evaluation and Turbulence: Refl ections on Our Time 31
methodologies to do so not merely from a perspective of closing gaps but also of overcoming structural discrimination and vulnerability. In UNDP we evaluate on the basis of an understanding of the multidimensionality of poverty, not just income poverty.
• Third is the need to respond to the concerns of citizens. Evaluation systems and evaluation approaches must be responsive and nation-ally rooted. For too long we have talked of country-led evaluations and country-led evaluation systems. The term “country led” implies either that external partners had grabbed the leadership and we need a coup to restore ownership, or that nationals had abdicated their role in the past and now must be urged to take ownership. Moreover, national systems are not just government systems. They are a complex mixture of government systems, national capacity, citizens’ voices, and public accountability.
The time of turbulence that we live in—a turbulence that also aff ects the North, governments, and the nonpoor—can be seen as a time of opportunity for evaluation. By unpacking the content of turbulence, we can analyze development more concretely from the point of view of people’s lives. We will be forced to look at the interplay of policies and not just at individual programs, because turbulence is the result of this interplay. Even in the North, issues of policy coherence are coming to the fore and it is not enough to evaluate development cooperation separately. New institutional arrangements for evaluation in the United Kingdom and elsewhere refl ect this trend. And in a situation where traditional economic and political theories are turned on their head because their consequences have been disastrous, we can look for greater innovation in evaluation methodology from a variety of sources and disciplines. It is 10 years since the London Declaration that led to the founding of IDEAS. Perhaps it is time for a new commitment to fostering development evaluation that will do intellectual justice to the complex issues that have to be addressed and to fostering the use of evaluation so that public accountability and governance can be better served and evaluation can contribute to public action.

33
Evaluation in the Context of Global Public GoodsRob D. van den Berg
Introduction: The Roots of Turbulent Times
The International Development Evaluation Association (IDEAS) confer-ence in Amman in 2011 addressed challenging subjects: turbulent times and crises that endanger our future: those of food, fuel, and fi nance. This chap-ter aims to weave these subjects and crises together into a third, overarch-ing crisis, namely, the slowly encroaching crisis of rising global public costs caused by the careless way in which humanity continues to deplete natural resources and to treat our environment as an endless bounty for looting and spoiling.
In March 2011, I attended a meeting in Manila on how the international fi nancial institutions had coped with the global credit crisis.1 A common ele-ment from evaluations was that only a few experts had foreseen the crisis and those who should have listened, did not. A common recommendation was to listen better. During the second part of that meeting, I had a captive audience when, as director of the Global Environment Facility (GEF) Evalu-ation Offi ce, I presented evaluative fi ndings of the GEF. I used this golden
CHAPTER 4
34 Development Evaluation in Times of Turbulence
opportunity to tell the audience that not just a few experts, but hundreds and thousands of them, foresee three other emerging major global crises that we need to confront.
The fi rst crisis is known to all: climate change. The second is the mass extinction of species caused by human behavior. The third, and least known, is the unfolding drama of poisonous chemicals threatening environmental and human health. In Manila, I told the audience that they have been fore-warned. Experts are convinced that these three global crises—climate change, mass extinction of biodiversity, and poisonous chemicals—are endangering a prosperous and equitable future. In economic terms, these three crises are leading to dramatically increasing global public costs. They undermine achievements in development and poverty alleviation in the long run.2
Yet international institutions and governments have spent billions to solve the global credit crunch without paying much attention to the three unfolding global environmental crises. Some even say that to spend money on solving environmental problems is a luxury we cannot aff ord at the moment. Instead money has gone to bailing out banks and ensuring funding is available for “business as usual.” When the disastrous economic eff ects of the credit crisis became clear, many of us desperately hoped for “business as usual.” However, my contention is that “business as usual” is causing the three global environmental crises.
Global gross domestic product (GDP) has risen substantially over the past 50 years, from just a few trillion U.S. dollars in 1970 to US$70 trillion in 2011, with a slight downturn in 2009 due to the credit crisis.3 However, the growth of global GDP has been accompanied by a dramatic increase in global public costs. Using relatively scarce public resources to solve prob-lems in the private fi nancial sector means that hardly any resources are left to solve global public problems. The world is getting richer all the time and yet most, if not all, countries are facing a crucial shortage of funding for pub-lic issues.
The Role of Public Funding: Public Goods and Costs
The fi rst part of this chapter will address the role of public funding in tack-ling public goods and costs. The discourse about global and national econo-mies has for the past few decades focused on how to strengthen and extend the role of markets, and there has been a relative scarcity of discussions on public goods and funding. So let us go back to some fundamental principles
Evaluation in the Context of Global Public Goods 35
and reestablish these issues. Public goods are defi ned in economic terms as “nonrival” and “nonexcludable.” In other words, they are goods that are almost impossible to trade. The air you breathe is available to everybody, and the fact that you breathe does not make it impossible for anybody else to breathe. It is diffi cult to exclude anybody from breathing and put a price on it—although this situation changes if one were to go diving with an oxygen tank to breathe under water.
Public goods are strongly related to another economic concept: that of externalities, which point to costs and benefi ts that are created in markets that are additional and external to the product that was produced for and bought on the market. The benefi ts of externalities usually do not pose a problem—it is their costs that concern us. Many economists tend to speak of external costs in terms of “market failure.” The most recent and famous example concerns climate change. When Nicholas Stern, a former chief economist of the World Bank, reported to the U.K. government on the costs of climate change, both on preventing it and adapting to its consequences, he noted that climate change is a result of “the greatest market failure the world has seen.” His conclusion was that “those who damage others by emitting greenhouse gases generally do not pay.”4 There is controversy over whether Stern and his team correctly calculated the damages and the costs of preventing them, but the point he raised concerning market failure was not disputed.
In general, governments have three ways to tackle market failures and ensure public goods. First, they can criminalize the behavior that leads to the external costs. Second, they can change behavior through regulation to such an extent that the external costs no longer appear. Last, they can recover the costs through taxation that aims to bring the external costs back into the market, for example, through a tax on pollution, or emission of greenhouse gasses, or energy consumption. However, some would argue that general taxation should be suffi cient to ensure public goods and meet public costs, which are the foundation of taxation and of public spending. This argument was fi rst developed by the economist Paul Samuelson (1954) in a theory of public expenditure.
There was no general agreement on Samuelson’s theory, although after World War II, an economic discourse took place on how “the public pur-pose” could be served by strengthening the role of government and public funding. Perhaps John Kenneth Galbraith’s 1973 publication, Economics and the Public Purpose, can be highlighted as the culmination of this perspec-tive. Over time, the neoclassical school of economics gained ascendancy and questioned the role of governments. Instead, it focused on improving the functioning of markets to solve problems in society. Both market regulation

36 Development Evaluation in Times of Turbulence
and taxation were deplored as distortions that prevent markets from becom-ing fully effi cient.
To many economists, the global fi nancial crisis demonstrated the dangers of market fundamentalism, showing the need for governments to regulate markets. However, this issue continues to be contested and market-oriented economists continue to claim that it was actually government interference with the markets that caused the subprime lending crisis. The debate is far from over.
Transboundary Issues: The Role of Global Public Goods
Much of the discourse on public goods, the role of governments, and the effi ciency of markets considers what should happen in one country. How-ever, many of the externalities of markets are of a transboundary nature. If a company emits greenhouse gasses, these gasses will not respect political boundaries and will infl uence the global climate, not just a local micro-climate. The globalization of the world, and especially its economy, is, of course, a thoroughly discussed phenomenon and opinions diff er wildly on whether it is benefi cial or a challenge. However, the transboundary costs of markets are a fact and many local actions now have global consequences.
At the same time, we need to recognize that there is no global govern-ment to ensure the global public purpose. There are many elements in the direction of global governance: the United Nations is a forum for nations to discuss what needs to be done; several international treaties defi ne crimi-nal acts between nations; likewise several international conventions aim to regulate transboundary issues. There are even some minor examples of international taxation, but they do not amount to much. If there is a global public purse, it is fi lled by donations and grants from rich nations; some of it is channeled through the United Nations, but most of it either goes directly from country to country or through the international fi nancial institutions—the International Monetary Fund (IMF), the World Bank, and the many regional and subregional banks that have a role in development, recon-struction, or transformation—or, more recently, through so called “vertical funds,” of which the Global Fund to Fight AIDS, Tuberculosis and Malaria is probably the best-known example.
The fi nancial crisis has led to substantive increases in both capital and funding of many international fi nancial institutions (Moss and others 2011). The Asian Development Bank increased its capital in March 2009 from about US$55 billion to about US$165 billion. The International Bank for

Evaluation in the Context of Global Public Goods 37
Reconstruction and Development, part of the World Bank Group, received a boost in capital of US$86.2 billion in April 2010. The European Bank for Reconstruction and Development achieved a 50 percent increase in its capital, from US$30 to US$45 billion in May 2010. The International Devel-opment Association, also a member of the World Bank Group, increased its funding for the poorest countries with a record infl ow of about US$50 billion in December 2010 at its 16th replenishment.5 This money does not all come from the public purse—most of it is borrowed on the capital markets. These amounts are available for public loans that must be repaid over time. But as argued before, most of this money is available for “business as usual.”
At the same time bilateral funding for development and global issues is still lagging behind the internationally agreed upon target of 0.7 percent of GDP and although many countries pledged to reach this target over time, the Organisation for Economic Co-operation and Development (OECD) projects that this will not happen in the near future. The OECD notes that aid is expected to grow at 2 percent per year between 2011 and 2013, com-pared with the average 8 percent per year over the past three years. Aid to Africa is likely to rise by just 1 percent per year in real terms, compared with the average 13 percent over the past three years. The OECD concludes that at this rate, any additional aid to the African countries will be outpaced by population growth.6 The question is whether the current level of global public funding is suffi cient to stem the rising tide of global public costs.
The Rising Tide of Global Public Costs
The dilemma of tackling the costs of market failure was most aptly put by the Stern review. It calculates that these costs in the case of climate change would amount to 1 percent of global domestic product annually. This is an astounding amount—about US$600 billion—to prevent climate change from happening. In other words, it would cover the costs of converting our energy sources, our energy consumption, and so on to ensure that we shift to a “green economy” that does not emit greenhouse gases. I’m sure that the reader will not be surprised if I reveal that what is currently spent on these issues is woefully insuffi cient. The Stern review calculates that if cli-mate change happens, costs will rise. Adaptation to climate change will cost anywhere between US$100 and US$200 billion annually, and the world will be confronted with a reduction of up to 5 percent in our future GDP—an astounding amount of more than US$3 trillion that the world will not be able to generate due to climate change. These calculations have been heavily criticized as “deeply fl awed” and as “scare mongering.” Stern has taken all
38 Development Evaluation in Times of Turbulence
criticism on board and very carefully recalculated the costs, and admitted that his calculations could be improved—they were too low. He raised them from 1 percent of global GDP to 2 percent of global GDP.7
Many have drawn two conclusions from this debate:
1. The public costs of climate change are beyond public funding;2. The longer we wait to address them adequately, the higher the costs will
be, either to solve the problems or to rearranging our lives to adapt to the new reality.
A hypothesis in this regard could be that the increase in public costs, if unmet (that is, if no action is taken to avoid the costs, or no funding is forth-coming to meet the costs) accelerates over time either leading to a complete breakdown of the system, or a systemic change. The fi rst possibility could be illustrated with the ancient civilization of Easter Island. As Jared Diamond posed in his book Collapse: How Societies Choose to Fail or Succeed (2005), the people of Easter Island used up their natural resources and did not sur-vive. Let us hope that we have the fortune to end up with a systemic change rather than a collapse. Systematic change is in fact what many climate change skeptics assume will happen. Systemic change is central to the idea of a “green economy,” which is becoming more urgent over time, because the gap between what we need and what we can bring to solve the prob-lem is huge and growing. Increasingly, economists are adding their voices to the debate on how to “manage nature for global prosperity,” to quote Paul Collier’s subtitle for his 2010 book, The Plundered Planet.
“Mind the Global Gap”
In addition to the climate change gap, we face two other gaps that continue to grow. The world is currently moving toward a mass extinction of spe-cies greater than has been seen for 65 million years. Over time, the world has seen fi ve mass extinctions, which only 10–25 percent of living species survived. We now bring you the sixth mass extinction, this time without the aid of a meteor crashing into the Gulf of Mexico, but brought to you in Technicolor by market failure (Barnosky and others 2011)! Biodiversity continues to decline dramatically, because the existence of a species is not a marketable property and thus is not incorporated into the price of prod-ucts that through their production processes or consumption destroy natu-ral habitats. Neoclassical economists are confi dent that market forces will, over time, correct failures. However, at the moment and in the foreseeable future, we cannot recreate extinct species. Once they are gone they are gone
Evaluation in the Context of Global Public Goods 39
forever. Although no Stern review has calculated the costs of mass extinc-tion, conservative guesses of the costs of preserving biodiversity tend to dramatically surpass available funding from all sources. Even if a species does not disappear, but just faces a mass loss of population, the costs can be gigantic. For example, bats in North America are facing massive popula-tion losses due to white-nose syndrome, caused by a fungus that is an inva-sive species, as well as due to being killed in unprecedented numbers by wind turbines throughout the United States, an unforeseen consequence of greening the economy. Yet the economic value of bats to agriculture in the United States and Canada has been estimated at more than US$3.7 billion per year (Boyles and others 2011). The economic loss due to the decline in numbers of one species that is not yet threatened with extinction, already go into the billions and cannot be recovered on the market because they are public costs, in this case related to agriculture.
The third gap is that of toxic chemicals in our environment. For more than a century, industries have introduced new chemicals in their pro-duction processes after what seemed like thorough testing. Many of them are “persistent organic pollutants”: organic, carbon-based compounds that, somewhat to our surprise, turned out to be fairly indestructible and have become pervasive in the environment. Once they are introduced into the environment, often as pesticides, they travel vast distances and enter the food chain and our bodies. They may cause death and illnesses includ-ing disruption of the reproductive, immune, and respiratory systems (Resource Futures International 2001). The “dirty dozen” of these pollut-ants, with fancy names like aldrin, heptachlor, mirex, and toxaphene, have been identifi ed as dangerous for human and environmental health by the United Nations Environment Programme (UNEP) since 1995. In 2001, a new multilateral agreement, the Stockholm Convention on Persistent Organic Pollutants, was signed to eliminate or restrict the production and consumption of these chemicals. Scientists continue to explore the health risks of many other chemicals that were introduced by industry and, in 2009, another nine chemicals were added to the list (Stockholm Conven-tion on Persistent Organic Pollutants 2009).8 One can safely predict that the list will grow in the next decade.
The problem is one of side eff ects that remain invisible in ordinary test-ing because of the geographic or time scale involved, or because of unex-pected behavior. Some chemicals were introduced to help package food products. It was assumed that they would not interact with the food, but they did, and they entered into our bodies. Some chemicals arrived in places nobody expected them to turn up. The most illustrious example is that of ozone-depleting substances. When the hole in the ozone layer was
40 Development Evaluation in Times of Turbulence
discovered in the late 1970s, it took some time to establish why it had formed and what could be done about it. When ozone-depleting substances such as chlorofl uorocarbons used in refrigerators were identifi ed as the guilty par-ties, international action—leading to the Montreal Protocol—was relatively quick and successful, given the essential role the ozone layer fulfi lls in pro-tecting life on our planet from harmful cosmic radiation. Calculations show that if this action was not taken, there would be no ozone layer left in 2060, just 50 years in the future.9 The Montreal Protocol has been successful in reducing production and consumption of ozone-depleting substances, with about 95 percent of these substances now safely stored, but the problem is far from over. In 2009, the GEF Evaluation Offi ce conducted an impact evaluation on support to stop producing and consuming Ozone Deplet-ing Substances in Eastern Europe and Central Asia. The GEF Council had considered ending its support, but the evaluation alerted it that it was too early to do so. Whereas ending production and consumption can be done relatively cheaply, the challenge remains to destroy the stockpiles of these substances, as they may escape into the atmosphere if their current stor-age facilities break down or leak because of earthquakes or simple lack of care (GEF Evaluation Offi ce 2010b).
The cost of destroying persistent organic pollutants and ozone-deplet-ing substances is high. Recovering these costs through market regulations is impossible. These chemicals were put on the market decades ago at a time when the disastrous eff ects were not yet known. It is impossible to regulate the past. The cost to address this emerging global crisis is truly public, and the money to tackle it is not identifi ed. These global public costs emerge out of current business practices. For example, the food industry continues to explore possibilities to “improve” storage, taste, and durability of its products. To increase its effi ciency and increase profi ts, it introduces new substances from time to time, always carefully testing them, but perhaps not over long periods of time or with unintended con-sequences in mind. An example is Bisphenol A, better known as BPA, an organic compound used in the fabrication of certain plastics. In the 1980s this compound was used in plastics for food storage because it seemed safe and was economically attractive. It was considered safe because BPA was not supposed to travel from the plastic package into the food or into your body. In 2008, research showed that 95 percent of American adults had BPA in their bodies. Eff ects may include cancer and eff ects on the reproductive system and the thyroid and lead to several neurological conditions.10 Isn’t it nice to know that “business as usual” is presenting us with this potentially deadly cocktail of chemicals and organic pollut-ants, and let us not forget the rare metals we are now introducing into our
Evaluation in the Context of Global Public Goods 41
environment through used mobile phones, batteries, personal computer components, and so on.
Business as usual means that one generation introduces new products, ingredients, and components that are thought to be safe and enable cheaper production and higher profi ts. The next generation faces the costs of remov-ing these substances from the environment. Business as usual means that our generation continues to emit amounts of greenhouse gases that will dra-matically change climate and lead to huge costs in adaptation. Business as usual means that we continue to destroy and poison our ecosystems, so that species lose their natural habitats and die out. Going over to a “green econ-omy” will solve some of these problems, but it is by no means certain that all of these issues are on the radar screen of those who decide where the billions of dollars from the multilateral banks will go. Some will argue that these bil-lions are meant for poverty reduction, not for environmental problems. But the poor are often the fi rst to be confronted with a loss of biodiversity, with climate changes that endanger their subsistence farming, and with chemi-cals and metals that are dumped on them, sometimes from very far away.
The three widening gaps of climate change, biodiversity loss, and chemi-cal pollution highlight the global public nature of the unfolding crises of fuel, food, and fi nance. In the Global Environment Facility, we are con-fronted with these gaps all the time. The team in the GEF Evaluation Offi ce sees these gaps whenever we evaluate. They are part of the geography of our evaluation landscape. This leads me to the second part of this chapter, in which I will formulate some ideas on how evaluators can deal with these crises and with the nature of global public goods.
Consequences for Evaluation
Why should we consider these issues in evaluation practices? First of all, I would like to relate these issues to an ongoing discussion in economics, which has often been termed the micro–macro paradox: How is it possible that we see achievements at the intervention level, but these achievements do not seem to translate at the national level? How can a country have a lot of interventions that score moderately to highly satisfactory on achieve-ment of outcomes, and yet the country itself, in its national development indicators, does not refl ect the same levels of achievement? This paradox was formulated by economists, focusing on interventions that aimed to achieve economic growth, increased income, or increased economic activ-ity through investment projects or public lending. Where these investments were successful, they looked for similar changes in the macroeconomic data

42 Development Evaluation in Times of Turbulence
of the country, but often could not fi nd them. This debate over whether aid could be proven to contribute to macroeconomic development received a new impulse with the 1998 World Bank publication of Assessing Aid: What Works, What Doesn’t and Why (World Bank 1998). When the debate could not provide a defi nite answer, interest in macroeconomic solutions waned and more emphasis was placed on microeconomic work. The poverty lab approach of the Massachusetts Institute of Technology is almost completely focused on microlevel interventions and promotes methodologies that are very diffi cult to apply at the national level. It is only recently that macro-economists have off ered a response to this shift and tried to regain some of the lost ground (see for example Heckman and Urza 2009). The discussion is still lopsided, and many economists seem to have given up on the macro picture. Their approach is to concentrate on what works on the ground and to tests that would identify causal linkages.
I do not believe that this approach is suffi cient. It may help decide which innovative programs should be scaled up and which interventions show promise for aff ecting human behavior. But these approaches do not address the micro–macro gap. And we see the evidence of this in the Global Environment Facility. The GEF has a pretty complete picture of the level of success of its interventions. Each project above a certain size needs to be evaluated on completion. We have “end-of-projects” evaluations from more than 400 projects and we review newly arrived evaluations annually to assess the performance of the GEF. Most of these projects have been implemented by three agencies: UNDP, UNEP, and the World Bank. Their evaluation offi ces have also looked at these projects. We agree on the evalu-ation criteria, and we agree on the level of achievements of these projects. Our joint conclusion is that the performance of these projects has been good. More than 80 percent of GEF projects are rated moderately satisfac-tory or above, up to highly satisfactory, in achievement of outcomes. An internationally agreed upon standard in the international fi nancial institu-tions is that 75 percent of projects should perform moderately satisfactory or higher. So the GEF has a solid performance and good achievements, confi rmed not just by the GEF Evaluation Offi ce, but also by the evaluation offi ces of United Nations Development Programme (UNDP), UNEP, and the World Bank (see GEF Evaluation Offi ce 2010a, 30).
When the offi ce started to look into the impact of GEF activities, it also found evidence of short-term impact, and sometimes of longer-term impact.11 Twenty years ago the expectation was that the white rhinoceros in Africa would be extinct within two decades. Now there is a thriving com-munity of white rhinoceros in Kenya, thanks to an initial grant of the GEF. Local communities in Samoa in the Pacifi c now fi sh in a sustainable way,
Evaluation in the Context of Global Public Goods 43
rather than through destroying coral reefs. China is making the shift from incandescent to fl uorescent light bulbs through a GEF-funded introduction project. The Philippines has become one of the world leaders in geothermal power stations with technical support from the GEF. There are, of course, also failures— the GEF is not fail proof. But the main message is that there is much good news coming from GEF projects.
But is there? Let me turn to another stream of evaluations: country port-folio evaluations, where the focus is on how GEF interventions are sup-porting the country to tackle global environmental issues.12 One such global issue is deforestation. GEF support has been used by countries to reduce, stop, or even reverse deforestation. The country portfolio evaluation in the Philippines in 2007 concluded that areas in which GEF support was pro-vided had successfully stopped deforestation. The report also noted that the rate of deforestation in the Philippines overall had not changed and was still going strong in the wrong direction. There we have an environ-mental version of the economic micro–macro paradox. GEF support saves a species here or there, promotes integrated natural resource management at the community level here or there, initiates market change to reduce greenhouse gas emissions here or there while, in general, the world seems to continue to slide toward the abyss.
In the GEF’s fourth overall performance study, an eff ort was made to identify why there is not more progress at the macro level. The conclusion was that the amount of public funding available for governments and pub-lic institutions to play their proper role to meet global public costs simply was dramatically insuffi cient (GEF Evaluation Offi ce 2010a, 15–16). The gap between interventions and what is actually needed is widening. This is the crisis behind the fuel, food, and fi nance turbulence that we are currently facing: it is a crisis of rising public costs that cannot be incorporated into markets and a simultaneous reduction of availability of public funding. It is accompanied by a crisis in confi dence in public governance. Taxpayers are unwilling to give more money, because they do not trust governments to do the right thing, whereas many governments increasingly need money to do the right thing, and without money the slide continues downward.
This conclusion is not just a conclusion of the GEF Evaluation Offi ce. Since the GEF operates through both the United Nations and the mul-tilateral banks, the GEF Evaluation Offi ce is a member of both groups of evaluation offi ces, the United Nations Evaluation Group (UNEG) and the Evaluation Cooperation Group (ECG) of the development banks. The latter group took the initiative to provide a briefi ng on biodiversity-related fi nd-ings to the international biodiversity conference in Nagoya in October 2010. A briefi ng note states the case for global public goods and for the lack of
44 Development Evaluation in Times of Turbulence
priority attention and funding (Evaluation Cooperation Group 2010). Let me quote two paragraphs:
Much of the downward spiral of biodiversity loss is due to market failure: the failure of markets to price the potential loss of a species, or to price the dan-gers and opportunities of climate change, but also market forces that increase the possibility of extinction, such as over-fi shing in the world’s oceans, which in economic terms has been identifi ed as a new example of the tragedy of the commons. These market failures lead to over-exploitation of the envi-ronment, because the negative externalities are not incorporated in pricing mechanisms, and they lead to inaction to improve this situation, because posi-tive externalities that would emerge from improvements are to the benefi t of everyone and cannot easily be captured by market forces. Where markets have been regulated or prohibited, illegal trade has become a danger, as has recently been highlighted when discussing the future of tigers in Asia.
There is evaluative evidence that eff orts and interventions to sustain bio-diversity are working and do have positive impacts on ecosystems, genetic resources and species. Yet the downward spiral continues, because the inter-ventions do not reach the scale which would change the overall trend. The main lesson from many evaluations is that neither the International Financial Institutions nor the UN agencies have woken up to the urgency of the situa-tion, and they have not integrated biodiversity and environmental issues into their strategies and implementation. This situation must be turned around quickly through scaling up of positive examples of biodiversity conservation and mainstreaming conservation and sustainable use of ecosystems, genetic resources and species.
The generic idea behind statements like these is that international orga-nizations and national governments do some good with a part of their port-folio on certain issues, but that the main body of the portfolio continues “business as usual,” and if the usual practices are detrimental to the issue you want to change, the success of the portfolio will not bring about the aimed-for sustainable change. This idea is, of course, familiar in the dis-course on development eff ectiveness: what one policy gives with one hand, another policy may take away with another hand. For example, agricultural development in the South has been supported by Northern donors, while, at the same time, Northern countries refused Southern agricultural prod-ucts access to their markets, or distorted market prices through subsidies to Northern farmers. The question I am raising is whether evaluations pay attention to these issues. I raise the issue of the widening gap between global public costs and global public funding to argue that the evaluation commu-nity should report on such gaps. There are two ways we can do this. One is to fi ne tune the way we interpret the relevance criterion in evaluations. The second is the way we interpret and report on impact.

Evaluation in the Context of Global Public Goods 45
Fine-Tuning “Relevance”
Relevance is defi ned in the OECD/Development Assistance Committee (DAC) glossary of evaluation terms as: “The extent to which the objectives of a development intervention are consistent with benefi ciaries’ requirements, country needs, global priorities, and partners’ and donors’ policies.” (OECD/DAC 2002, 6) This defi nition is clearly a retrospective ex-ante assessment. I have argued in the past that this is especially important in cases where, as evaluator, you want to check whether the decisions to fund or approve interventions were in line with the intentions of the donors or funders. This is especially important if a fund delegates the authority to approve projects, to a special committee or the CEO of the organization, for example, and later wants to review whether funding decisions were made according to its instructions. This follows from a strict interpretation of the defi nition.
Actual practice in development evaluation tends to look at relevance issues throughout the lifetime of the project, checking whether objectives continue to be in line with national policies and priorities, for example. We also sometimes see questions raised as to whether a project is “still rele-vant” given changed circumstances. This ex-post assessment of relevance is mentioned in a footnote of the OECD/DAC glossary defi nition.
I prefer a third practice that is not covered well in the glossary, which is to relate relevance to the question of whether the intervention made a diff erence, whether it actually contributed toward solving the problem it was meant to address. Effi ciency and eff ectiveness are criteria that express relationships: the relationship between inputs and outputs in the case of effi ciency; the relationship between outputs and outcomes in the case of eff ectiveness. Many evaluators use relevance as the third relationship: namely, between outcomes and impact. The accompanying question is: What diff erence did it make? (See fi gure 4.1.)
I know several evaluation offi ces that use relevance in this way and report on whether the intervention actually made a diff erence to the prob-lem it was meant to solve. I would urge evaluators to adopt this practice. And when they do, they need to report on it—even if it would present a bleak picture. Evaluation reports should not spend a hundred pages on relevance, but they should have a few well-researched paragraphs, based on authorita-tive data available from other sources, on the relevance of the intervention or program to the ultimate impact to which it was meant to contribute.
Using the relevance judgment in this way ensures that we enable our-selves, as evaluators, to judge whether the intervention has contributed toward changing trends in society, the economy, and the environment. The question therefore becomes strongly related to the longer-term impact of

46 Development Evaluation in Times of Turbulence
interventions and policies—which leads me to a short discussion of the term “impact” and how it is used nowadays.
Fine-Tuning “Impact”
The OECD/DAC glossary defi nes impacts as, “positive and negative, primary and secondary long-term eff ects produced by a development intervention, directly or indirectly, intended or unintended.” (OECD/DAC 2002) Notice that it is not defi ned as a relationship, but as a fi nal state, or a snapshot, of eff ects a long time after the termination of the intervention.
However, impact is now often used to denote something else: the causal relationship between actions in the intervention and changes in behavior. This relationship is evaluated in “impact evaluations,” which seek to assess the changes brought about by an intervention (the impact) by comparing the observed result with a “counterfactual” (the result likely to have been observed without the intervention). If the counterfactual is carefully speci-fi ed and empirically grounded, then the diff erence between results observed and the counterfactual can reasonably be attributed to the intervention itself, and not to extraneous factors. Ideally, this counterfactual should be built into the design of the project and observed during its implementa-tion. We could refer to this kind of evaluation and what it studies as “direct impact.”
The evaluation community has a history of undertaking ex-post “impact evaluations,” which have a diff erent nature. Rather than focusing on one or
Figure 4.1 Evaluation Criteria
Input
Efficiency
Effectiveness
Relevance(to needs/problems)
Sustainability
Resu
lts
Output
Outcome
Impact
Evaluation in the Context of Global Public Goods 47
two of the causal mechanisms embedded in the intervention, these evalua-tions have focused on broad processes of change in which the intervention was one of many factors. These evaluations tend to focus on contribution analysis rather than counterfactual analysis and are ideally undertaken sev-eral years after the intervention has stopped to assess whether the processes of change that the intervention started have replicated, scaled up, or cata-lyzed trends in society, the economy, or the situation of the poor. If the con-tribution of the intervention can be demonstrated, these evaluations tend to provide crucial information on the relevance of the interventions (that is, did they really lead to longer-term processes of change or trends that are solving the problems). The focus of these evaluations could be referred to as “fi nal or ultimate impact.”
My proposal is to start making a clear distinction between “direct” and “fi nal” impacts. Both practices bring us benefi ts, but the relevance of inter-ventions for solving problems in society, the economy, and the environment needs to be found at the fi nal or ultimate impact level. We need to be able to refer to “impact” at the highest level in our results chain because this conforms to ordinary usage of the term, for example, in public debates about whether “aid had any impact on Africa.”
Following the Example of Cato the Elder
The role of evaluation should be to ensure accountability not only on what is achieved, but also on what these achievements mean in the long run. Long-term impact may be outside the scope of the organization we work for or the program or intervention we are evaluating, so we should be careful not to blame the organization or program. The Global Environment Facility has a solid level of achievements in its interventions. Nevertheless, in its Fourth Overall Performance Study, the GEF Evaluation Offi ce reports that global environmental trends continue to go in the wrong direction (GEF Evalua-tion Offi ce 2010a). This trend direction is not due to the GEF’s achievements or lack of achievements—it is due to a lack of attention to environmental issues in many other sectors and to a lack of policy coherence. What is gained through environmental policies is not suffi cient to compensate for the losses in other policies, like energy. But even more important, the GEF, a public institution, using public money, cannot address the level of market failure and global public costs associated with the way our economies func-tion. These issues cannot be solved by governments and international insti-tutions alone. Many infl uential thinkers, scientists, and concerned citizens speak out on these issues, but evaluators need to add their voice, based on
48 Development Evaluation in Times of Turbulence
evaluative evidence. By providing this evidence, we enable our institutions to raise these issues in the appropriate fora.
We know that the world will not change just because our evaluations point to the rise of global public costs. We may fi nd ourselves in the position of the Roman Senator Cato the Elder, who became famous for ending each public statement with the phrase, “Furthermore, I think Carthage must be destroyed.” His sentiment is not something we share; it is no longer civilized behavior between states to adopt an objective like that. But the intention of continuing to raise an issue because it has not yet been solved is something that evaluators and development practitioners should have the courage to follow.
Notes
1. Evaluation Cooperation Group, Special Session 1, “Crisis Response by MOBs: Preparedness and Response.” March 16, 2011, Manila, the Philippines.
2. Evaluation Cooperation Group, Special Session 2, “GHG Implications of MOB Energy Assistance.” March 16, 2011, Manila, the Philippines.
3. World Bank, World Development Indicators, http:ljdata.worldbank.org/ indicator/NY.GDP.MKTP.CD/countries?display=graph (accessed October 20, 2012).
4. Interview with Nicholas Stern in the Guardian, November 29, 2007. http:// guardian.co.uk.
5. International Development Association, “IDA Replenishments.” World Bank website. http://www.worldbank.org/ida/ida-replenishments.html (accessed October 20, 2012).
6. OECD News Release “Development Aid Increases, but with Worrying Trends.” April 6. 2011. http://www.oecd.org/document/29/0,3746, en_21571361_44315115_47519517_1_1_1_1,00.html.
7. For an overview of the discussion, see: http://en.wikipedia.org/wiki/Stern_Review.
8. See “Persistent Organic Pollutants.” Wikipedia. http://en.wikipedia.org/wiki/ Persistent_organic_pollutant and related articles.
9. See http:ljearthobservatory.nasa.gov/IOTD/view.php?id=38685 (accessed October 20, 2012).
10. For an overview of the many studies and confl icting claims on health eff ects, see http://en.wikipedia.org/wiki/Bisphenol (accessed October 20, 2012).
11. For an overview of impact reports and documents, see https://www.thegef.org/gef/node/1560.
12. For an overview of country portfolio evaluation reports, see http://www.thegef.org/gef/node/787.
Evaluation in the Context of Global Public Goods 49
References
Barnosky, Anthony D. and others 2011. “Has the Earth’s Sixth Mass Extinction already Arrived?” Nature 471: 51–57
Boyles, Justin G., and others. 2011. “Economic Importance of Bats in Agriculture.” Science 332.
Collier, Paul. 2010. The Plundered Planet: Why We Must—and How We Can—Manage Nature for Global Prosperity. New York: Oxford University Press.
Diamond, Jared. 2005. Collapse: How Societies Choose to Fail or Succeed. New York: Penguin.
Evaluation Cooperation Group. 2010. “Ensuring Biodiversity in a Sustainable Future: Lessons from Evaluations.” Presented to the Biodiversity Conference of the Parties in Nagoya, Japan, October 13, as briefi ng note UNEP/CBD/COP/10/INF/39. http://www.ecgnet.org/documents/biodiversity.
Galbraith, John Kenneth. 1973. Economics and the Public Purpose. Harmondsworth U.K.: Penguin edition 1975.
GEF Evaluation Offi ce. 2010a. The Fourth Overall Performance Study of the GEF. Executive Version. Washington, DC: GEF Evaluation Offi ce.
————.2010b. GEF Impact Evaluation of the Phaseout of Ozone-Depleting Substances in Countries with Economies in Transition. Volume 1: Theory of Change. Evaluation Report 56. Washington DC: GEF Evaluation Offi ce.
Heckman, James J., and Sergio Urzua. 2009. “Comparing IV with Structural Models: What Simple IV Can and Cannot Identify.” National Bureau of Economic Research Working Paper 14706, NBER, Cambridge, MA.
Moss, Todd, Sarah Jane Staats, and Julie Barmeier. 2011. “The ABCs of the General Capital Increase.” Center for Global Development Brief. http://www.cgdev.org/fi les/1425485_fi le_IFI_Briefs_GCI_FINAL.pdf.
OECD/DAC (Organisation of Economic Co-operation and Development/Development Assistance Committee). 2002. Glossary of Key Terms in Evalua-tion and Results Based Management. Evaluation and Aid Eff ectiveness Series 6. Paris: OECD
Resource Futures International. 2001. Persistent Organic Pollutants and the Stockholm Convention: A Resource Guide. Prepared for the World Bank and CIDA. http://go.worldbank.org/KOJIG6N290 (accessed October 20, 2012).
Samuelson, Paul A. 1954. “The Pure Theory of Public Expenditure.” Review of Economics and Statistics 36: 4,387–4,389
Stockholm Convention on Persistent Organic Pollutants. 2009. Report of the Conference of the Parties of the Stockholm Convention on Persistent Organic Pollutants on the Work of Its Fourth Meeting. May 8. UNEP/POPS/COP.4/38.
World Bank. 1998. Assessing Aid: What Works, What Doesn’t and Why. New York: Oxford University Press.


51
Innovative Approach to Evaluating Interventions in Fragile and Confl ict-Aff ected States: The Case of Helmand ProvinceSamy Ahmar and Christine Kolbe
Introduction
“I can well understand those who feel less generous today given the state of our economy... but we will not balance the books on the backs of the poorest people on the planet.”
It was in those terms that Andrew Mitchell, the U.K. Secretary of State for International Development, addressed the audience at last year’s Conservative Party Conference to justify the pledge made by Prime Minister David Cameron during the general election campaign to preserve the budget for overseas aid in spite of Britain’s abysmal defi cit and the bru-tal cuts undergone by most other government departments. This decision,
CHAPTER 5
52 Development Evaluation in Times of Turbulence
a politically diffi cult one in the current economic and social context, will enable the United Kingdom, by 2013, to join the handful of industrialized countries that meet their United Nations’ obligation to spend a minimum of 0.7 percent of gross domestic product (GDP) on aid for development.
What this also implied, however, was that the Department for Inter-national Development (DFID), spared by the 2010 and 2011 budget cuts, would come under an increased level of scrutiny to demonstrate results and justify each pound of taxpayers’ money spent overseas. It is for that very purpose, for instance, that a group of conservative, labor, and liberal-democrat members of Parliament set up the Independent Commission for Aid Impact, a watchdog organization dedicated to maximizing the eff ec-tiveness and impact of U.K. aid to developing countries, with a particular focus on value for money. This push toward results-based decision making had already been emphasized by DFID in a 2009 white paper, which stated that it would, “work to ensure every pound of U.K. aid is spent well” (DFID 2009). Recent developments indicate a reinforcement of this trend for the foreseeable future.
Although it has long been advocated that results-based monitoring and evaluation (M&E)—the most commonly used method for assessing the suc-cess of public policies in industrialized countries—should become the rule rather than the exception in the fi eld of international development, it has proven diffi cult for donors to carry out or commission systematic and robust M&E programs. Alongside the lack of political will, to which the current economic conditions have contributed, the intrinsic challenges associated with setting up meaningful M&E systems in poor and unstable environ-ments and the prohibitive cost of doing so have contributed to poor uptake and chronic lack of robustness in outcome and impact measurement.
This situation is rapidly changing. A combination of economic pressure and a fl ow of technical M&E expertise into the fi eld of international devel-opment have made the prospect of setting up comprehensive, robust, and innovative M&E systems attractive for many donors and groups of donors wanting to show that they are making a diff erence to a skeptical and increasingly aware audience of taxpayers and auditors. This change is par-ticularly true in confl ict-aff ected environments, where entire economies and governance mechanisms need to be built from next to nothing, and where success in achieving economic, social, and institutional develop-ment is a prerequisite for stabilization and, ultimately, the departure of foreign troops.
Arguably, nowhere is pressure for results-based M&E as strong as it is in Afghanistan. Conversely, there are few environments where the chal-lenge is greater.

Innovative Approach to Evaluating Interventions in Fragile and Confl ict-Affected States 53
Helmand province, Afghanistan, crystallizes this tension and exemplifi es the value in establishing a robust monitoring and evaluation system. As the focal point of the United Kingdom’s diplomatic, defense, and development eff orts in Afghanistan, practitioners in Helmand are under ever-growing pressure to justify British presence and activity.
Scrutiny of progress in Helmand spans the general public and the media and extends up to Members of Parliament who expect to receive quarterly updates on progress there. Increasingly, the requirement is not just to report progress, but to demonstrate outcomes and eff ects. Doing so requires the implementation of an integrated evaluation system with established base-lines and objectively verifi able indicators that can go further than counting outputs to provide an assessment of impact.
The establishment of such a system, particularly when linked to solid knowledge-management tools, enables practitioners to communicate infor-mation to multiple audiences quickly and eff ectively. For international donors engaged in Helmand, this system enables better management of reputational, political, and fi duciary risks, and supports the government’s commitment to demonstrate value for money, impact, and facilitation of transparency.
In addition to the external value of M&E in Helmand, the more funda-mental impact is arguably for practitioners. Development and stabilization eff orts in Helmand are borne out of classic counterinsurgency doctrine in terms of the rationale for and nature of the interventions pursued, for example, the notion that improved service delivery by the government of Afghanistan will confer legitimacy on the government and lead the populace to reject the insurgency. Counterinsurgency doctrine is, to a large extent, based on assumptions about the impact of development on secu-rity. By interrogating assumptions inherent within programming, M&E enables those engaged in programmatic development at the grassroots level to better understand their contribution and impact on wider goals and to eff ect midcourse corrections to programming where necessary. In an envi-ronment where successful development initiatives are bound to national and international security, impact evaluation becomes inextricably linked to the protection of our national interest.
Challenges to Evaluation in the Helmand Context
Although results-based programming is fundamental to internal and external stakeholders in Helmand, it is also fraught with challenges. In Helmand, challenges are political, relating predominantly to the complexity of the
54 Development Evaluation in Times of Turbulence
international community’s operating environment; logistical, associated with the challenges to evaluation in an insecure environment; and cul-tural, refl ecting the diffi culties in applying rigorous research methods in a traditional, Islamic society.
Institutional and Political Challenges
In Helmand, the weakness, nonexistence, or fractured nature of govern-ment systems present serious challenges to data collection and M&E. Data systems required for baselines have been weakened, destroyed, or discred-ited by association with the deposed regime leaving a dearth of baselines or time-series data and unclear responsibility for data collection spread across disparate agencies. The government of Afghanistan’s statistical capacity has begun to recover, but there remains an all-round skills shortage.
Problems presented by the government’s institutional weakness are com-pounded by the institutional complexity of the operating environment in Helmand. Because the international community is represented by a range of nations, agencies, and actors, there is a risk of operational activity being guided by multiple plans, diff ering timescales, and reporting up mutually exclusive chains of command. Without careful attention to coordinated planning, the coalition eff ort can result in a lack of synchronicity in the objectives and agendas of actors engaged in Helmand, which makes the establishment of a holistic and useful M&E program problematic.
The preeminence of political and military considerations means that contradictions can also exist within the programming of individual organizations. For example, stabilization interventions supporting coun-terinsurgency in Helmand—which have a shortened timeframe and more immediate objectives—are arguably designed around a diff erent “endgame” than programs designed to realize the Millennium Development Goals of more traditional development projects. An example is the health and educa-tion initiatives in Helmand, which are not specifi cally designed around the actualization of Millennium Development Goals 2, 4, 5, and 6, but rather aimed at ensuring that the government has the capacity independently to control, employ, and maintain state institutions to provide governance to the population of Helmand.
Similarly, stabilization eff orts in Helmand may not always be intended to have universal benefi t. Rather, they may be focused on a particular group, for example, specifi c tribal leaders, or a small area, such as the Upper Sangin Valley, with this focus seeking to achieve a political end. There is a consequent need for spatial and target-group precision in evalu-ation eff orts.

Innovative Approach to Evaluating Interventions in Fragile and Confl ict-Affected States 55
Finally, the scrutiny under which development activities take place in Helmand is one of the principal factors underscoring the need for a robust monitoring and evaluation framework. Conversely, this is also one of the factors that makes establishment of M&E more challenging. Afghanistan’s profi le as a British, U.S., and Danish foreign policy priority creates an inordinate pressure to deliver “good news stories.” A robust, impartial, and objective M&E system is essential to ensure that assess-ment is nonpartisan and that an accurate and transparent portrayal of progress is made.
Logistical Challenges
Further challenges are presented to the implementation of an integrated evaluation process through the actualities of the operating environment and the constraints imposed by the security situation. The tensions between what it would be desirable to measure and what is achievable expose the delicate balance between adhering to best practices and accepting realities on the ground.
The reality in fragile states is that data is almost always patchy and of poor quality. This situation is extreme in a context like Helmand where a regime has been removed and 30 years of warfare has stunted governmental development. In such environments, there is likely to be a dearth of baseline data from which to begin measuring progress and a requirement to start from scratch, which poses additional pressures for the system.
The diffi culty of embedding an M&E system in an environment considered to be naturally at odds to it is compounded by the wide range of staff expertise that is symptomatic of a multiagency mission. Helmund’s Provincial Reconstruction Team, for example, represents military and civil-ian organizations that bring a range of skills to the campaign eff ort but that approach M&E with varying methodological perspectives.
Once the system has been designed, challenges are presented in deliv-ery. Conventional evaluation techniques like household surveys designed to reach a representative sample of the population become fraught with chal-lenges in Helmand where freedom of movement is signifi cantly curtailed and association with the International Security Assistance Force (ISAF) puts enumerators’ lives at risk.
The scale of the challenge and the perception that the populace is largely inaccessible to the international community can lead to a negativ-ity about the feasibility of conducting research in Helmand, an associated skepticism regarding the reliability of results, and a subsequent reticence toward embracing a measurable approach. Given this backdrop, it is crucial
56 Development Evaluation in Times of Turbulence
to produce robust data that stands up to scrutiny. But again, the challenge is profound: the utility of the M&E system hinges on the credibility of the data it produces, yet the verifi cation process is complex. Security constraints make it impossible to directly oversee fi eld research while mistrust and fear among respondents mean they are often unwilling to provide contact details.
Once the system is embedded, attention must be given to its continua-tion. In fragile states, postings for international development workers are naturally shorter and the inevitable staff rotation creates diffi culties in estab-lishing institutional memory. In Helmand, civilian deployments are approxi-mately 18 months and military tours are sometimes even shorter and can be unsynchronized with civilian associates. It becomes imperative that an eval-uation system is linked to a robust knowledge management tool that can act as the institutional memory in the midst of considerable fl ux and that atten-tion is given to the transfer of knowledge and capacity to local counterparts.
Events in capitals and shifting priorities challenge the continuation of monitoring systems in fragile states. By design, evaluation frameworks in fragile states must be adaptive, fl exible, and capable of responding to the often-shifting strategic priorities that epitomize the environment.
Cultural Challenges
The third challenge to evaluation in Helmand is presented by the cul-tural diff erences between the host population and the international com-munity. Afghanistan is a conservative Islamic society. Social interactions in Helmand are pervaded by the society’s traditional mores, which have a profound impact on research. Although social desirability bias can be pres-ent in any opinion poll anywhere in the world, in societies such as Helmand, where individual rights can be constrained by culture and tradition and dominated by social hierarchies, social desirability bias is more likely to color opinions on contentious political, social, and security issues. Thus, questions on contentious issues can produce an abnormally high number of positive responses from some respondents, which raises concern about the use of statistics emanating from contentious questions.
The diffi culties in reaching women in a conservative society pose a chal-lenge to undertaking research in Helmand, as women’s views may diff er signifi cantly from those of men, particularly with regards to themes such as the role of the Taliban as justice providers, the accessibility of public health centers, or education. The risk of collecting intrinsically skewed data is high, and fi nding ways to gather women’s views becomes of critical importance for the establishment of a credible M&E system.
Innovative Approach to Evaluating Interventions in Fragile and Confl ict-Affected States 57
HMEP: A Cutting-Edge M&E Solution
The Helmand Monitoring and Evaluation Programme (HMEP), a project commissioned by DFID and the Provincial Reconstruction Team (PRT), designed in late 2009, seek to address these institutional, logistical, and cultural challenges through an innovative approach to M&E in fragile states.
Project Background and Overview
Since the British government entered Helmand in mid-2006, the tempo of activity has been such that it has been diffi cult to develop a comprehensive M&E framework. The nature of the environment prevented the establish-ment of the rigorous, best-practice approaches that the British government would employ in a more stable environment. One consequence is that while the United Kingdom could account for its spending in terms of inputs and had been able to measure outputs to some extent, there was little readily available evidence of the wider impact of its projects and programs in terms of outcomes and attitudes toward the insurgency. Hence the need for more rigorous monitoring of the eff ectiveness and impact of stabilization and development work in Helmand to improve the responsiveness of all stabili-zation and development actors to local needs, and to increase the visibility and infl uence of benefi ts.
The goal of HMEP is to improve the delivery and eff ectiveness of the contributions of Helmand’s stabilization and development programs to the Afghan National Development Strategy (ANDS) and the Helmand Plan. This goal is achieved through supporting the PRT to make more eff ective use of M&E tools. HMEP has four key outputs:
• Baselines for the PRT program strands and DFID programs in Helmand against which to monitor eff ectiveness and impact, focused on indicators chosen by the PRT and DFID
• An operational, up-to-date, user-friendly database and geographic infor-mation system (GIS) database covering DFID, the PRT, and Task Force Helmand, Task Force Leatherneck, and other donor activities in Helmand
• New knowledge and recommendations from quarterly monitoring and up to four ad hoc reactive reports per year aligned with the PRT and DFID reporting requirements
• Improved programming capacity in the PRT that standardizes approaches and aff ords consistency in reporting across the PRT.
58 Development Evaluation in Times of Turbulence
Data Collection
Political, logistical, cultural, and fi nancial challenges associated with col-lecting data in confl ict-aff ected environments have historically constituted the main challenge in setting up comprehensive, cross-cutting M&E systems where they are most needed. After an extensive phase of desk research, which examined the secondary information and data available in Helmand, it became apparent that discrete primary data collection would be required to build on existing measures and support the PRT to more comprehensively measure its eff ect.
Taking the Helmand Plan as the strategic starting point, the HMEP team worked with the PRT to design individual logical frameworks that established the conceptual journey from the intervention’s rationale to the programs’ outcomes and impacts. As part of this process, a series of indica-tors were developed to measure progress in each of the thematic strands (governance, rule of law, infrastructure, agriculture, counternarcotics, health, education, growth and livelihoods, and population engagement) at the outcome and impact levels. Recognizing that reporting was largely sub-jective and anecdotal at the output level, attention was given to developing quantitative, SMART indicators (specifi c, measurable, achievable, relevant, and time-bound) to measure impact. Given the considerable data collection constraints, particular weighting was given to attainability.
The dearth of readily available secondary data as well as the absence of existing baselines made primary data collection and analysis necessary as a means to populate indicators. A combination of statistically robust, Afghan-led, quantitative, and informative qualitative data collection was carried out, complemented by primary and secondary data collected from third-party sources. This section of the chapter focuses on the fi rst and the second research methods.
Primary data collection eff orts in Afghanistan have suff ered from numer-ous, well-documented problems.1 HMEP’s data collection methodology takes into account the lessons learned from existing primary research2 so as to address the limitations of primary research in Helmand and to avoid dupli-cation of eff ort. The HMEP approach to data collection is characterized by a carefully designed sampling strategy implemented by an Afghan research partner that involved robust sample sizes at provincial and district levels, a longitudinal approach, and a combined quantitative and qualitative method.
A Carefully Designed Sampling StrategyHMEP took the 2004 census data and the Central Statistics Organiza-tion’s (CSO) raw data on settlements (as per the 2004 administrative
Innovative Approach to Evaluating Interventions in Fragile and Confl ict-Affected States 59
district boundaries) as its sampling universe. These data presented several diffi culties for HMEP, as is common to environments where the reach of formal government is limited and data-collection systems are weak.
First, as administrative reorganization emanating from the Afghan Ministry of Interior occurred, district boundaries changed over time. These changes necessitated an update to the assignment of settlements to districts using the latest Afghan Geodesy and Cartography Head Offi ce (AGCHO) boundary dataset. Second, the location of CSO settlements contained spatial coordinate errors. HMEP was able to correct these errors by mapping coor-dinates to village locations taken from spatial imagery. Finally, the popula-tion per settlement in the CSO data did not always refl ect what could be seen on the ground through spatial imagery of Helmand Province. HMEP addressed this diffi culty with a thorough spatial analysis and according adjustment to the number of inhabitants per settlement.
For reasons that were both statistical (for example, the views of people living under a same roof risk being similar as a consequence of one person’s infl uence in the household) and cultural (for example, barriers to engage-ment with women), the decision was made to target only male heads of households (HOHs) through the household survey. To estimate the num-ber of households in each district, a multiplier of 10 people per household was assumed in the sampling framework’s design. This assumption held true as per the data gleaned during the fi rst quarterly survey, which enabled HMEP to validate this assumption for the following waves. The unavail-ability of the CSO’s household listing and the lack of other statistically robust datasets for Helmand province meant that the sample’s statistical representativeness could not be tested using demographic, cultural, social, and economic characteristics. Therefore, profi ling results from diff erent waves of the same HOH survey were compared with one another to refi ne HMEP’s understanding of the profi le of Helmand’s HOH. Once a series of quarterly surveys has been carried out, a regional profi le of the HOH will be established, and results of the following surveys weighted by a number of key profi ling variables (for example, age, tribe, income, occupation) to maximize the statistical representativeness of the HMEP survey. A multi-staged random probability sampling process3 was used with a random route for selecting households in each sampling point.
The HOH survey is being implemented by an Afghan survey partner, which enables extensive reach within Helmand. Enumerators rely on local networks and facilitators to establish access to remote areas in Helmand and to provide insights into population groups that are inaccessible to the PRT. Although security constraints do impact the sample and the feasibil-ity of implementing standard verifi cation techniques, a research method
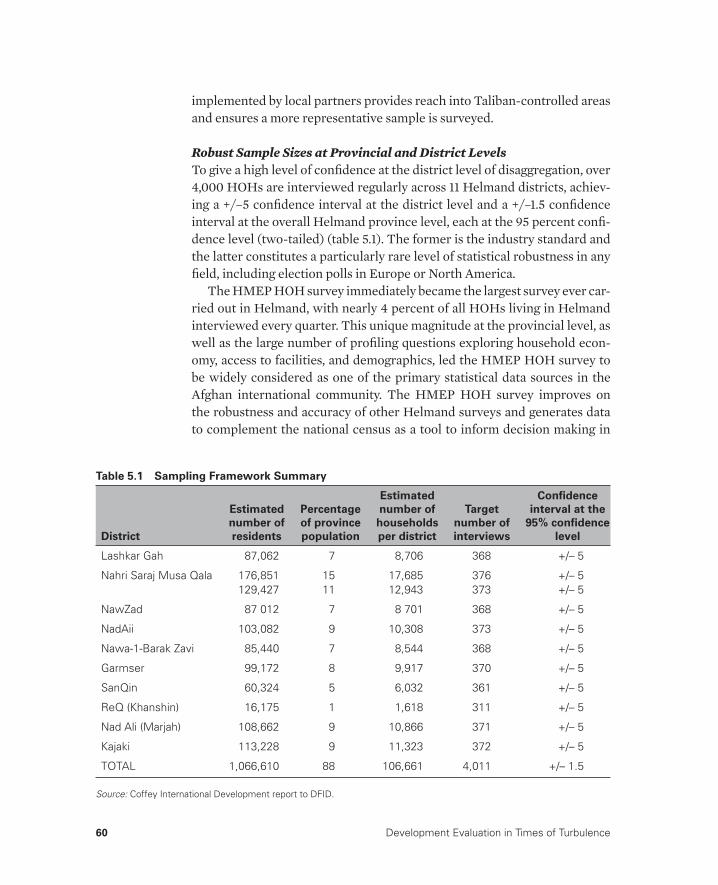
60 Development Evaluation in Times of Turbulence
implemented by local partners provides reach into Taliban-controlled areas and ensures a more representative sample is surveyed.
Robust Sample Sizes at Provincial and District LevelsTo give a high level of confi dence at the district level of disaggregation, over 4,000 HOHs are interviewed regularly across 11 Helmand districts, achiev-ing a +/–5 confi dence interval at the district level and a +/–1.5 confi dence interval at the overall Helmand province level, each at the 95 percent confi -dence level (two-tailed) (table 5.1). The former is the industry standard and the latter constitutes a particularly rare level of statistical robustness in any fi eld, including election polls in Europe or North America.
The HMEP HOH survey immediately became the largest survey ever car-ried out in Helmand, with nearly 4 percent of all HOHs living in Helmand interviewed every quarter. This unique magnitude at the provincial level, as well as the large number of profi ling questions exploring household econ-omy, access to facilities, and demographics, led the HMEP HOH survey to be widely considered as one of the primary statistical data sources in the Afghan international community. The HMEP HOH survey improves on the robustness and accuracy of other Helmand surveys and generates data to complement the national census as a tool to inform decision making in
Table 5.1 Sampling Framework Summary
District
Estimated
number of
residents
Percentage
of province
population
Estimated
number of
households
per district
Target
number of
interviews
Confi dence
interval at the
95% confi dence
level
Lashkar Gah 87,062 7 8,706 368 +/– 5
Nahri Saraj Musa Qala 176,851 15 17,685 376 +/– 5129,427 11 12,943 373 +/– 5
NawZad 87 012 7 8 701 368 +/– 5
NadAii 103,082 9 10,308 373 +/– 5
Nawa-1-Barak Zavi 85,440 7 8,544 368 +/– 5
Garmser 99,172 8 9,917 370 +/– 5
SanQin 60,324 5 6,032 361 +/– 5
ReQ (Khanshin) 16,175 1 1,618 311 +/– 5
Nad Ali (Marjah) 108,662 9 10,866 371 +/– 5
Kajaki 113,228 9 11,323 372 +/– 5
TOTAL 1,066,610 88 106,661 4,011 +/– 1.5
Source: Coffey International Development report to DFID.
Innovative Approach to Evaluating Interventions in Fragile and Confl ict-Affected States 61
Helmand. The national CSOs are also trying to identify how they can update the population estimates in lieu of a census this year.
Longitudinal Approach Provides Confi dence in Time-Series AnalysisTo enable HMEP to monitor dozens of outcome and impact indicators and hundreds of variables and combinations of variables over time, it was essential to ensure a consistent sampling-point selection method and continuity in the questionnaire rolled out each quarter. Building a panel proved impossi-ble in Helmand because of the security issues associated with keeping inter-viewees’ contact details and physical addresses, and because of the potential respondent fatigue that a quarterly survey could create. However, a range of statistical techniques, such as repeated c ross-sections, enabled the devel-opment of pseudo panels to partially address this gap. Lanjouw and others (2011) explored the potential of using repeated cross-sections to investigate movements in and out of poverty. Potentially, a similar method could be employed in Helmand to consider movements in and out of satisfaction with the Afghan government, the police, or statutory justice mechanisms. Such methods will be explored as a way to overcome the impossibility of develop-ing a genuine panel to carry out time-series modeling.
Combined Quantitative and Qualitative Research
The quantitative research revealed a number of interesting trends, some of which seemed counterintuitive or lacked geographical consistency, and warranted further analysis to investigate the causalities at play. Qualitative research was designed and carried out to complement the quantitative fi ndings and to enable the program to fully unpack the observed trends in perceptions. It proved to be a crucial tool in assessing the broader picture of progress made against the Helmand Plan.
Because the quantitative HOH survey in Helmand excluded women, qualitative research was designed to capture their perceptions. The views of Helmandi women on quality of service provision as well as on the eff ective-ness of diff erent governance structures and justice mechanisms are likely to diff er signifi cantly from those of men. In a traditional culture with strictly defi ned gender roles, females’ perceptions and needs are likely to be gen-dered and research methods must be adapted to ensure they are captured.
Qualitative research also helped to unpack interesting trends resulting from the quantitative research, for example, exploring why only a fraction of respondents would consider going to Afghan National Police (ANP) if they were the victim of a crime despite the fact that the vast majority expressed trust in the ANP as an institution capable of resolving disputes fairly and
62 Development Evaluation in Times of Turbulence
effi ciently. Qualitative research identifi ed that, for example, a preference for family-based dispute resolution and perceptions of ANP approachability helped explain why ANP might be considered eff ective and yet underused.
Qualitative research was carried out specifi cally to better understand the data, that is, to reach those who could not be reached by a quantitative sur-vey, as well as to provide a more in-depth understanding of the “story” and causal factors behind some of the less straightforward trends in perceptions observed through the quantitative survey. The survey results had to be appro-priately analyzed before planning the qualitative research process and tools.
Qualitative research was designed to concentrate on perceptions of change in attitudes about the various aspects of “government,” such as behavior and services, and to provide a means of exploring exactly what HOHs think is wrong, what should be done diff erently, and whether they have noticed changes in the recent past. The research took the form of a combination of semistructured, in-depth interviews and focus groups or kin group interviews with randomly selected HOHs and women. Twenty interviewing sessions were carried out in each district of interest, bringing the total interviewees to several hundred. Although not statistically rep-resentative, the qualitative research proved a crucial complement to the larger HOH survey in testing the theory of change and understanding some observed geographical diff erences.
Analytical Thinking and Theory of Change
The logical framework, which maps the conceptual journey of a specifi c stabilization and development intervention from its rationale through its inputs, activities, outputs, outcomes, and impacts, is the basic analytical tool through which an intervention is evaluated and against which its progress is measured over the project’s lifetime. However, as explained earlier, this approach was complicated by the multiplicity of donors. Although com-mitted to one plan, donor eff ort tends to be split by thematic area, which can reduce the visibility of cross-functional eff ects. For example, if donor A builds a school, but donor B builds the road leading to that school while donor C ensures security along the road, the success of A’s program directly depends on the eff ectiveness and timeliness of B and C in running their respective projects. In the past, each donor reporting system has tended to be inward looking with little overarching analysis or reporting across interventions. In environments where progress in security, governance, and international development are mutually dependent, reporting within silos inevitably restricts ability to assess the relative eff ectiveness of programs at the outcome and impact levels.
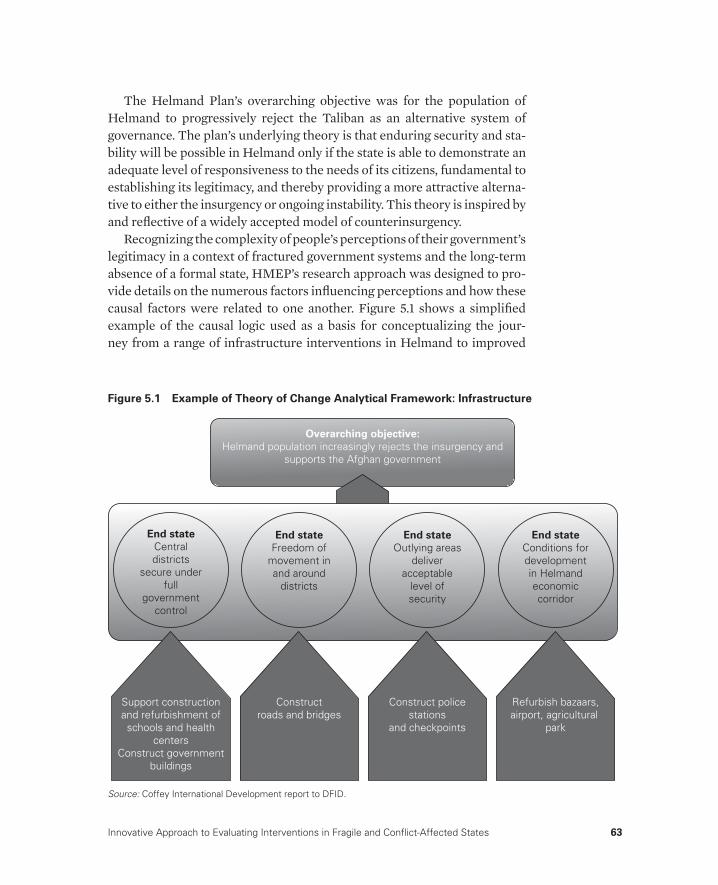
Innovative Approach to Evaluating Interventions in Fragile and Confl ict-Affected States 63
The Helmand Plan’s overarching objective was for the population of Helmand to progressively reject the Taliban as an alternative system of governance. The plan’s underlying theory is that enduring security and sta-bility will be possible in Helmand only if the state is able to demonstrate an adequate level of responsiveness to the needs of its citizens, fundamental to establishing its legitimacy, and thereby providing a more attractive alterna-tive to either the insurgency or ongoing instability. This theory is inspired by and refl ective of a widely accepted model of counterinsurgency.
Recognizing the complexity of people’s perceptions of their government’s legitimacy in a context of fractured government systems and the long-term absence of a formal state, HMEP’s research approach was designed to pro-vide details on the numerous factors infl uencing perceptions and how these causal factors were related to one another. Figure 5.1 shows a simplifi ed example of the causal logic used as a basis for conceptualizing the jour-ney from a range of infrastructure interventions in Helmand to improved
Figure 5.1 Example of Theory of Change Analytical Framework: Infrastructure
Source: Coffey International Development report to DFID.
Overarching objective:
Helmand population increasingly rejects the insurgency andsupports the Afghan government
End state
Centraldistricts
secure underfull
governmentcontrol
End state
Freedom ofmovement inand around
districts
End state
Outlying areasdeliver
acceptablelevel ofsecurity
End state
Conditions fordevelopmentin Helmandeconomiccorridor
Support constructionand refurbishment ofschools and health
centersConstruct government
buildings
Constructroads and bridges
Construct policestations
and checkpoints
Refurbish bazaars,airport, agricultural
park
64 Development Evaluation in Times of Turbulence
perceptions of the Afghan government in the province. In addition to the conventional, vertical fl ow from inputs to impact, a horizontal dimension was introduced: this dimension refl ects the basic principle according to which if X (for example, freedom of movements) and Y (for example, secu-rity along the roads) are both positively correlated with Z (for example, government legitimacy), then they should also be positively correlated to one another. A failing link between freedom of movement in and around districts and security along the roads could seriously undermine the plan’s capacity to foster improved legitimacy of the Afghan government.
Diverse statistical techniques were used to measure progress indicators and to test the HMEP theory of change. They included simple bivariate cross-tabulations, multivariate cross-tabulations, and bivariate correlation analysis, as well as multivariate probit regression modeling. The latter was used to examine further some of the key relationships among legitimacy and state capability, accountability, and responsiveness that emerged from the early-stage, cross-tabulation analysis.
All variables were transformed into dummy (binary) variables, taking either the value 1 or 0. For instance, those who agreed that the district government had improved education services were given the value 1; the others were given the value 0. From then on, the team ran a series of lin-ear, probit regressions, taking one key perception variable (for example, satisfaction with the Afghan government’s education services) as the dependent variable, one or two key explanatory variables (for example, the availability of primary and secondary schools), and a range of con-trol variables (for example, literacy, income, occupation, main source of income, assets owned). The resulting models were able to isolate relation-ships between, for example, the presence of a secondary school for boys nearby, and the likelihood of satisfaction with Afghan government educa-tion services, other things being equal.
Presentational Features
Having established a system able to test the success of the plan and the validity of counterinsurgency theory (COIN) assumptions, attention was given to the presentation and dissemination of this information. Recog-nizing that regardless of the richness of the data, M&E is only valuable if it is used, the HMEP team designed a website and database to store and display information. The website contains a range of innovative pre-sentational features, including links to a GIS database supporting the visualization of progress of information. This tool eff ectively facilitates
Innovative Approach to Evaluating Interventions in Fragile and Confl ict-Affected States 65
transparency regarding the PRT’s eff ectiveness in making progress against the Helmand Plan.
Online DatabaseThe HMEP Database schema design is based on the logical framework approach. Like the Aid Information Management System Development Assistance Database (AIMS-DAD), which was developed in cooperation with the United Nations Development Programme (UNDP) as a means to promote the transparency and accountability of overseas aid in a range of developing countries, the HMEP Database is an information repository dis-playing extractable graphics, GIS maps, reports, and documents relevant to stabilization and development in Helmand. The website is linked to an interrogable Oracle database and interactive geospatial database, which enables users to build their own GIS products.
Whereas AIMS-DAD focuses on the “input” aspect of overseas aid by col-lating fi nancial and program information exclusively, the HMEP Database schema design is based on the logical framework approach. It is a repository of existing baseline data and updated quarterly data on selected outcome and impact indicators for thematic strands combined with collated contex-tual data. The website contains a library of relevant literature, as well as the quarterly, annual, and analytical HMEP reports.
A functional web interface allows users to extract and visualize the logi-cal framework and associated indicator data. Graphs are generated in real time and display a timeline, showing whether indicators are progressing in the desired direction.
GIS MappingThe HMEP database also serves as a repository of spatial data used in GIS analysis and map production. The HMEP website displays products gener-ated by the team and links to an interactive geospatial database that enables users to develop custom-made GIS products.
The development of GIS products also attempts to resolve some of the problems created by the siloed working habits described earlier. GIS mapping enables users to visualize geographically the linkages and cor-relations among variables and illustrates in an accessible, user-friendly fashion the mutual dependence of the diff erent strands of reconstruction, stabilization, and capacity-building eff orts. For instance, by overlaying areas of intense poppy cultivation with recorded security incidents and the presence of schools and hospitals, stakeholders are able to instanta-neously visualize to what extent these variables overlap with each other,

66 Development Evaluation in Times of Turbulence
and how their work is potentially impacted by, or impacting upon, the work of others.
Intelligent Use of InformationIn a diverse and strategically complex organization like the Helmand PRT, HMEP supports more intelligent use of information in assessments, planning, and daily operations.
The HMEP evidence base is used to look back on a quarterly and annual basis on progress toward strategic goals. The HMEP team provides mate-rials and leads quarterly workshops, which provide a forum to consider results and discuss policy implications. HMEP tools are also used to look forward in terms of planning and future strategic direction. For example, HMEP is supporting the development of the current Helmand Plan by developing a GIS map that uses various datasets to build a geospatial pic-ture of the extent of the Afghan government’s infl uence in Helmand. This product aims to provide an estimate of current reach, juxtaposed with a projection of future infl uence, thus providing PRT with a visual represen-tation of its objectives. Finally, HMEP supports PRT’s daily operations through improved information management in the collation and cen-tralization of relevant data and its storage in a centralized and accessible information management system.
Conclusions: Future Prospects for M&E in Fragile States
HMEP’s specifi city lies in its holistic approach to implementing an M&E system in a part of the world where it is crucially needed but diffi cult to achieve. In demonstrating that stabilization, peace-building, and economic development eff orts made by donors in Helmand are more than a sum of individual projects, HMEP overcomes a critical barrier to meaningful M&E in fragile states. Its focus on statistical robustness and comparable time series on a wide range of indicators and variables also makes HMEP unique in a confl ict-aff ected environment.
Before assessing the replicability of the HMEP model, it is essential to understand what made it possible in the fi rst place. The breadth of skills and areas of subject-matter expertise (for example, M&E, governance, peace-building, statistical modeling, database development, GIS mapping) as well as a sound contextual and cultural understanding of Helmand province and of the diff erent forces at work in the province and the wider
Innovative Approach to Evaluating Interventions in Fragile and Confl ict-Affected States 67
region, were a prerequisite for setting up a credible and sustainable M&E system.
Arguably the most important factor of success is the very presence of a PRT, which brings together all institutional donors and creates a single mission through which funds are delivered and invested, thereby creat-ing a common sense of purpose. Such a structure facilitated the estab-lishment of a comprehensive, cross-thematic M&E system. Afghanistan’s 27 PRTs combine some of the world’s leading defense, diplomacy, and development experts. As development and reconstruction eff orts in con-fl ict-aff ected states are mutually dependent, a holistic approach to M&E is crucial. It is particularly valuable in environments with substantial donor spending where entire systems of formal governance need to be built from next to nothing, and increasingly feasible where institutions like the PRTs are capable of pooling donors’ resources to ensure progress against a joint plan.
It is important to recognize that each province, region, and country contains its own, specifi c set of contextual issues and challenges that must be refl ected in the evaluation approach. Although HMEP does not purport to off er a magic formula, it does provide a model for the devel-opment of future M&E systems in confl ict-aff ected states and, perhaps most signifi cantly, it has demonstrated that implementing robust, mean-ingful, and sustainable M&E systems is possible even in the most diffi cult environments.
As we look to the future for Helmand and the increasing focus on building Afghan capacity for successful transition, the next challenge for HMEP will be to establish local ownership of a monitoring and evalua-tion system. As HMEP supports the measurement of the PRT’s eff ective-ness in working to build capacity across thematic areas, so HMEP must work with local counterparts and in conjunction with national programs to transfer knowledge and ensure the sustainability of this fundamental approach.
Notes
1. Examples of documented problems include: Downes-Martin 2010; Cordesman 2010; Baker and others 2010.
2. See The Asia Foundation 2010; ABC News 2010; and U.S. Agency for Interna-tional Development Offi ce of Military Aff airs, “The Tactical Confl ict Assessment Framework (TCAF).” http://usacac.army.mil/cac2/call/docs/11-02/ch_2.asp, by way of example.

68 Development Evaluation in Times of Turbulence
3. Probability sampling is where a sample has been selected using random selec-tion so that each unit in the population has a known chance of being selected. It is generally assumed that a representative sample is more likely to be the outcome when this method is employed. The aim of probability sampling is to keep sampling error to a minimum. Sampling error is the diff erence between a sample and the population from which it is selected.
References
ABC News, “Afghanistan Poll: Where Things Stand 2010.” http://abcnews.go.com/Politics/Afghanistan/afghanistan-poll-things-stand-2010/story?id=12277743.
Baker, T., R. Orlina, S. Pagano, M. Salwen, and R. Williams. 2010. “Methodological Considerations and the Use of Data from Afghanistan: A Review of the Utility of SIGACTS, TCAF, KLE and Polling Data for Population-Centric Assessment.” Coff ey International Development, Washington, DC.
Cordesman, A. H. 2010. The Afghan War: Metrics, Narratives, and Winning the War. Washington, DC: Center for Strategic and International Studies.
DFID (Department for International Development). 2009. Eliminating World Poverty: Building Our Common Future. London: DFID.
Downes-Martin, S. 2010. “Assessments Process for RC (SW).” May 24, 2010, technical report draft, Center for Irregular Warfare and Armed Groups, U.S. Naval War College, Newport, RI.
Lanjouw, Peter, Jill Luoto, and David McKenzie. 2011. “Using Repeated Cross-Sections to Explore Movements in and Out of Poverty.” World Bank Policy Research Working Paper, World Bank, Washington, DC.
The Asia Foundation. 2010. Afghanistan in 2010: A Survey of the Afghan People. http://asiafoundation.org/country/afghanistan/2010-poll.php.

69
Resource Crunch, Evaluations, and Mindset Case Studies
Rashmi Agrawal
The Value of Existing Data
Two types of existing data can be used for evaluation purposes: socioeconomic and other documented data collected independently from the project under evaluation and data collected as a part of the project, including data on various parameters used for monitoring, inspection, and other periodic reports, past evaluations, and so on.
This chapter elaborates on the importance of devising an appropriate monitoring system with focus on evaluation at a later date and on the greater use of existing data to devise evaluations that are less costly but meet their goals. It off ers cases from India showing examples of how the proper use of existing data and better monitoring can lead to optimum cost-eff ective evaluation results.
CHAPTER 6
70 Development Evaluation in Times of Turbulence
Turbulence and Evaluations
The world is passing through extremely turbulent times caused by eco-nomic and fi nancial factors in the developed West and their impact around the globe, by social and political happenings unfolding in Middle Eastern and Northern African countries, and by natural calamities such as the recent tsunami in Japan. The threat of nuclear disaster, always a threat to the very existence of humanity, has again showed its ugly face in the wake of the tsumami. Above all, the impending disastrous impact of climate change, particularly on food security, looms over the world. Unfortunately, such tur-bulence is not a one-off phenomenon but rather confronts humanity with sickening regularity. What makes development evaluation in such turbulent times diff erent from the normal evaluation process is a natural concern for the community of evaluators and is the main theme of the 2011 International Development Evaluation Association (IDEAS) global assembly.
A turbulent situation impacts evaluation in various ways. Such situations force governments to initiate desperate measures to tackle the immediate crisis, diverting substantial resources from the normal development process. Whereas a resource crunch is persistent in developing countries, the devel-oped world has now witnessed the impact of an economic downturn in terms of recession and large-scale job losses. A diffi cult situation in the developed world may squeeze the fl ows of aid to developing countries. Thus, evaluation of development interventions must be more stringent so that each unit of money can be spent carefully. Short-term measures to deal with diffi cult sit-uations must be judged regarding their effi cacy. Therefore, a turbulent situ-ation makes purposeful evaluations more necessary than in normal times as the resources available for development programs become scarce and what is available will have to be used in the most optimum manner. It is also true that in such a situation, evaluation results fi nd greater acceptance because any means to improve program performance and reduce costs are welcome to program planners and implementers. As observed by Morra Imas (2009), “If there was ever a time when decision makers would gladly embrace evalu-ation, it would seem to be in the turbulent aftermath of the Global Economic Crisis of 2008. Even as we stand well in 2010, the eff ects stretch on.”
Impact on Evaluation Practice
A judicious choice of practical evaluations can optimize the resources available. The body of theoretical knowledge accumulated and practiced over the years and the methods of evaluation available are not aff ected

Resource Crunch, Evaluations, and Mindset 71
by turbulent events, but it is necessary to review the need for elaborate evaluations and choose a practical methodology that passes muster in a situation with severe resource constraints. The question arises as to how to reconcile the increased demand for evaluations of developmen-tal interventions with the resource crunch. Resources are often a con-straint in evaluations and it is not always possible for the evaluator to have unlimited access to them to design a technically perfect evaluation. This constraint seriously limits the freedom of the evaluator in designing evaluations.
A major component of evaluation costs relates to collection of quan-titative and qualitative data. Evaluators across the world and especially in developing countries tend to conduct evaluations on the basis of data collected through a primary survey. This method may be justifi ed on some occasions because baseline data is not available or is inadequate. It is also possible that the evaluators are unaware of the availability of baseline data or do not have access to it. Sometimes, they feel that avail-able data is not reliable or is outdated and it would be more appropriate to go for a special survey. In countries where a large area has to be cov-ered by fi eld surveys, the cost is very high in terms of time, money, and human resources. Because of low literacy in most developing countries, survey data must be collected in person rather than by mail, which accel-erates the cost of data collection manyfold. Various scholars have off ered practical methods to reduce data-collection costs under resource con-straints. For instance, Bamberger and others (2006) advocates simplifying evaluation designs, reducing sample sizes, adopting economical data col-lection methods, and so on.
This chapter argues that to optimize resource use in evaluations, the eval-uator should squeeze the maximum value out of information about project performance already available in various forms and from various sources before embarking on primary data collection. It discusses the strengths and weaknesses of existing data, presents case studies where use of available data was benefi cial, and recommends a strong monitoring system that could be helpful for later evaluations.
Types of Available Data
Available data, also called secondary data, is data that has not been collected by the evaluator for a particular evaluation but is available from various other sources. Available data of use to evaluators can be classifi ed into two major categories: socioeconomic data and project-monitoring data.
72 Development Evaluation in Times of Turbulence
Socioeconomic Data
National socioeconomic data are collected independently of any specifi c project under evaluation. They include data collected through regular or ad-hoc censuses, large-scale sample surveys conducted from time to time, and other data generated as a by-product of administrative operations of various wings of government. Most countries have these sources of data, which are accessible from national and international information networks. Evalua-tors would do well to scan such data and cull the relevant information for a specifi c intervention evaluation. Comparisons of the situations before and after a development intervention can provide some clue to what is happen-ing or has happened. This sort of macro-information will be particularly useful in evaluating policies, though there could be problems of separating the infl uence of factors other than the intervention being evaluated.
Project-Monitoring Data
Every program or project collects data relating to itself as a part of project formulation and implementation. These data include program management documents, such as project proposals, terms of reference, project implemen-tation guidelines, periodic progress reports, and data on parameters such as input and output indicators. Project management personnel who undertake missions to the project sites to review progress and identify problems, indi-cate fi ndings in their reports, which can be useful for evaluation purposes at a later date. Ongoing national-scale development interventions often have built-in provisions for concurrent or periodic evaluations. Sometimes sev-eral micro-evaluations are carried out by diff erent agencies independently in diff erent parts of the country or covering certain aspects of the program before an overarching national-level evaluation is commissioned. The past reports and data from these evaluations can be useful.
Quality of Available Data
Availability of bits of data is one thing, but their suitability for use in the evaluation purposes is quite another. It can be challenging for the evaluator to cull out the data that can be useful for his or her evaluation. The existing information itself needs to be evaluated for quality as well as relevancy.
In general, available data may be scrutinized on three basic parameters: its reliability, its collection methodology, and the objectives for its collection. Reliability refers to the trustworthiness of the data source, the timeliness
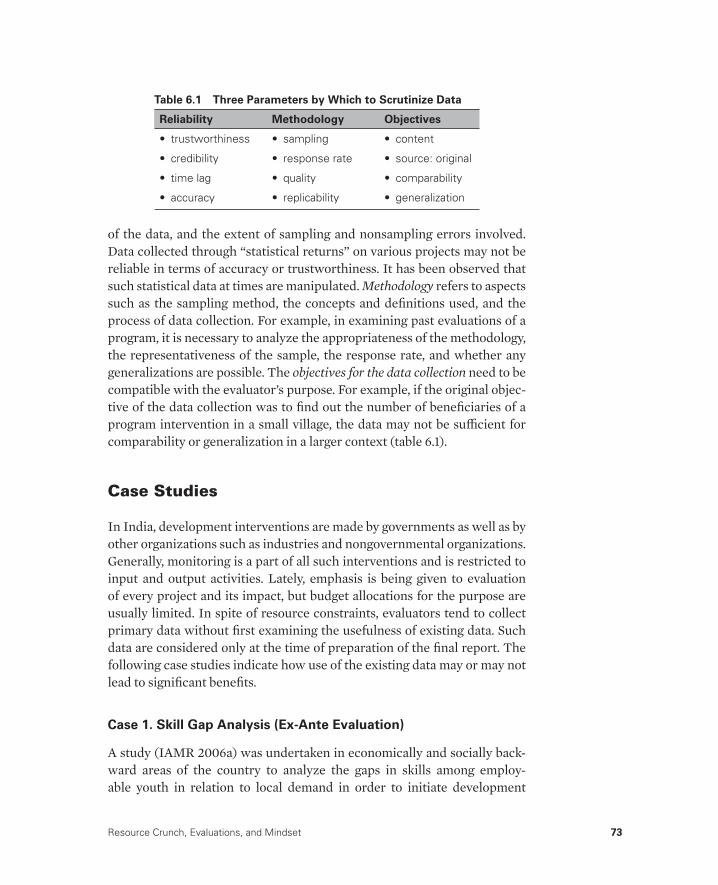
Resource Crunch, Evaluations, and Mindset 73
of the data, and the extent of sampling and nonsampling errors involved. Data collected through “statistical returns” on various projects may not be reliable in terms of accuracy or trustworthiness. It has been observed that such statistical data at times are manipulated. Methodology refers to aspects such as the sampling method, the concepts and defi nitions used, and the process of data collection. For example, in examining past evaluations of a program, it is necessary to analyze the appropriateness of the methodology, the representativeness of the sample, the response rate, and whether any generalizations are possible. The objectives for the data collection need to be compatible with the evaluator’s purpose. For example, if the original objec-tive of the data collection was to fi nd out the number of benefi ciaries of a program intervention in a small village, the data may not be suffi cient for comparability or generalization in a larger context (table 6.1).
Case Studies
In India, development interventions are made by governments as well as by other organizations such as industries and nongovernmental organizations. Generally, monitoring is a part of all such interventions and is restricted to input and output activities. Lately, emphasis is being given to evaluation of every project and its impact, but budget allocations for the purpose are usually limited. In spite of resource constraints, evaluators tend to collect primary data without fi rst examining the usefulness of existing data. Such data are considered only at the time of preparation of the fi nal report. The following case studies indicate how use of the existing data may or may not lead to signifi cant benefi ts.
Case 1. Skill Gap Analysis (Ex-Ante Evaluation)
A study (IAMR 2006a) was undertaken in economically and socially back-ward areas of the country to analyze the gaps in skills among employ-able youth in relation to local demand in order to initiate development
Table 6.1 Three Parameters by Which to Scrutinize Data
Reliability Methodology Objectives
• trustworthiness • sampling • content
• credibility • response rate • source: original
• time lag • quality • comparability
• accuracy • replicability • generalization
74 Development Evaluation in Times of Turbulence
interventions. The study also assessed the status of training institutions in terms of courses off ered, demand for those courses, facilities available, and placements. The study was sponsored by a central government minis-try. Because of a paucity of time and funds, the approach adopted for the study was to organize focus group discussions involving all stakeholders including establishments, experts, training institutions, villagers, employ-ers, students, and unemployed youth, to assess the situation. Focus groups were conducted in 50 districts of the country. Three days in each district was available for fi eld work. Besides organizing focus groups, the evalua-tors collected district-specifi c available data related to the number of train-ing institutions, employers, types of training available, details of the trained youth, and data on other demographic indicators. Reports were prepared for each district separately.
However, the offi cials who initially approved the terms of reference for the evaluation were transferred and the new incumbents did not accept the fi nal reports because they did not include information collected through structured questionnaires and fi eld surveys. They said no action was pos-sible based on the conclusions and recommendations made on the basis of focus groups and secondary data.
Case 2. Employment Generation Program (Impact Evaluation)
The Government of India has long been implementing a program to provide fi nancial and technical assistance to educated unemployed youth from low-income families to start a microenterprise. The scheme was implemented across the country. It was evaluated three times by the same organization. (IAMR 2000, 2002, 2006b). The evaluations were intended to assess the impact of the program in terms of the number of microenterprises created, their survival rates, the increase in incomes of the benefi ciaries, employ-ment generation, and the impact of the program on quality of life. In each evaluation, large-scale surveys had to be organized because existing infor-mation was either not relevant or inadequate.
Even though some information on the overall extent of self-employment among educated youth at diff erent points of time can be gleaned from socio-economic surveys by the National Sample Survey Organization, any changes in the patterns over time cannot be attributed only to the program in ques-tion. The scale of the program is too small to have any discernible impact at the national level. Although detailed implementation guidelines indicated which records were to be maintained, the requirements were so onerous that implementers were not able to follow them. Although a monitoring sys-tem was proposed in the program, it was limited to obtaining information
Resource Crunch, Evaluations, and Mindset 75
on the amount of loans disbursed by fi nancial institutions and the number of unemployed youth who received the loans. Even this data was not main-tained uniformly by each implementing unit. Thus, a proper monitoring system was not in place and even the baseline data was unavailable. A num-ber of agencies and organizations were involved in the implementation of the program without adequate networking and synergies.
In the light of the lack of monitoring data, primary data had to be col-lected from all stakeholders and even the baseline data was prepared. All the surveys were conducted in person using structured questionnaires, which took more than a year with a substantial budget and human resources.
Case 3. Teacher Recruitment (Concurrent Evaluation)
An evaluation of a program to recruit teachers was done in one state (IAMR 2009). Its objectives were to assess whether the implementers of the pro-gram clearly and consistently understood the guidelines for the procedures to be adopted for recruitment, to assess the effi cacy of the training provided to the implementers, to evaluate the eff ectiveness of the teacher recruit-ment process, and to assess the extent to which the guidelines issued were followed. The evaluation was in the nature of a concurrent evaluation. The approach was to examine the guidelines to evaluate the recruitment process for its transparency, eff ectiveness, and outcomes.
The methodology consisted of studying the data from offi cial records, discussions with focus groups, and observations by the survey teams. The teams also assessed the guidelines and the maintenance of records at vari-ous stages. Whenever the study team reported any lacunae or other prob-lems, the authorities took immediate remedial action. For example, when it was reported that training on the guidelines for recruitment was not eff ec-tive, immediate arrangements were made for retraining wherever needed. The study team took up a few cases for a sample study to verify the available information. Thus, the evaluation was conducted using secondary data and was completed in just three months, which was cost eff ective in terms of money and human resources.
Discussion and Lessons Learned
In general, every evaluation uses some secondary data at some point. It could be at the stage of project formulation and evaluation design, or at the time of data collection and analysis, or at the stage of report preparation. However, the extent of utilization of such data varies. The utility of secondary data
76 Development Evaluation in Times of Turbulence
also depends on the type of evaluation as well as on the evaluation manag-ers’ knowledge of evaluation methods, techniques, and strategies.
In the fi rst case, ex-ante evaluation, the original commissioners of the evaluation were aware of the design modifi cations and agreed on a strategy involving focus groups and secondary data because time was short. How-ever, their replacements, who had a mindset that all evaluations need pri-mary surveys through structured schedules, rejected the evaluations. This case points out the need for capacity building and knowledge dissemination among stakeholders in general and among commissioners and managers of evaluations in particular.
The second case study indicates the need for a comprehensive and eff ec-tive monitoring system so that the project data can be used for evaluation purposes. The study also shows the importance of implementable guide-lines that are properly understood by all.
The third study is an example of the adequate use of secondary data that could be possible with proper guidelines, maintenance of records, and an appropriate monitoring system.
Ex-ante and concurrent evaluations can be made more cost eff ective by using secondary data in situations where good baseline data are available and a comprehensive monitoring system is in place. In other types of evalu-ations, especially those measuring the impact of a program, there is a need for primary data collection. Even in those cases, the expenditure on such studies can be reduced if secondary data are analyzed as a fi rst step before a primary survey is conducted. Further, the monitoring system of a project, which usually includes only input and output indicators, should also have outcome and impact indicators. In such a scenario, secondary data from the monitoring system would be an extremely useful tool in the hands of evalua-tors. It is also important to change the mindsets of evaluation commissioners and managers, as well as professional evaluators themselves, to appreciate that collecting primary data is not the only means for all evaluations.
Summing Up
To reduce the amount of time and resources spent on a project evaluation, consider the following recommendations that make appropriate use of available data:
• Review the large body of data already available from various sources on various parameters relevant to the development intervention to identify relevant and usable data. Identify gaps for follow up.
• Decide how the available data can be used for evaluation purposes.
Resource Crunch, Evaluations, and Mindset 77
• Develop skills and capacity to cull out relevant, reliable, and usable information.
• Organize sample studies only to verify the quality of the existing data and to fi ll gaps.
• Disseminate knowledge to stakeholders about various procedures and techniques for evaluations.
• Help change mindsets about the usefulness of primary and secondary data for evaluations.
• Develop a comprehensive monitoring system, which includes not only input and output indicators, but also outcome and impact indicators. Information from such a system would enable quick evaluation at a future time.
References
Bamberger, M., J. Rugh, L. Mabry. 2006. Real World Evaluations: Working under Budget, Time, Data and Political Constraints. New Delhi: Sage Publications.
IAMR (Institute of Applied Manpower Research). 2000. “Report on Evaluation of Prime Minister’s Rozgar Yojana (PMRY) 1994–95.” IAMR, New Delhi.
————. 2002. “Prime Minister’s Rozgar Yojana (PMRY): An Evaluation (Second Round).” IAMR, New Delhi.
————. 2006a. “Reports on Skill Gaps in Backward Districts of India.” 50 separate reports, IAMR, New Delhi.
————. 2006b. “Report on Evaluation of Prime Minister’s Rozgar Yojana (PMRY): Third Round.” IAMR, New Delhi.
————. 2009. “Report on Recruitment of Teachers in Bihar (Second Phase, 2008) Evaluation.” IAMR, New Delhi.
Morra Imas, L. 2009. “Embracing Evaluation in Tough Economic Times.” Keynote Speech to the Ontario Chapter of the Canadian Evaluation Society, Toronto, October 1, 2009.


PART TWO: TURBULENT TIMES, PRODUCTIVITY, AND RISKS

81
The Impact of the Food, Fuel, and Financial Crisis on Children’s EducationFindings from a Monitoring System in Nepal
Jeevan Raj Lohani, Purnima Gurung, and Laxman Bashyal
Background
All countries in South Asia have been adversely aff ected by the 3F (food, fuel, and fi nancial) crisis. The recent crises in food prices, fuel prices, and the global slowdown precipitated by the international fi nancial crisis aff ects households in Nepal through a multitude of channels. Nepal is especially vulnerable to this crisis because it is emerging from a decade of confl ict and low growth; it is a low-income, food- and fuel-defi cient country, and it is highly dependent on imports.
The United Nations Children’s Fund’s (UNICEF’s) Nepal Country Offi ce, Research Inputs and Development Action (RIDA) of Kathmandu, and the Government of Nepal’s Department of Education have been monitoring the impact of the 3F crisis on children’s education since June 2009. The
CHAPTER 7
82 Development Evaluation in Times of Turbulence
monitoring system enables them to determine whether and how the crisis is aff ecting children’s education by looking at indicators such as school enroll-ment, attendance, dropout rates, learning achievement, and child labor. It also highlights groups of children who are especially vulnerable in terms of geographic and socioeconomic characteristics.
The monitoring system consists of three components: (1) household-level monitoring, (2) school-level monitoring, and (3) community-level monitor-ing. Household-level monitoring was based on a quarterly vulnerability assessment and monitoring (VAM) survey of 800–1,200 households carried out by the World Food Programme (WFP). The school-level monitoring was carried out in 22 schools in 11 districts1 that are likely to suff er from food insecurity, loss of migration opportunities, and a drop in exports—thus likely to be most aff ected by the 3F crisis. They were selected from all three ecological belts and fi ve development regions. Out of the 11 districts, six schools from three districts were monitored intensively. Community-level monitoring comprised focus group discussions (FGDs) with three groups: mothers, teachers, and children (members of child clubs). In one quarter, FGDs were conducted with six groups from two schools.
The monitoring mechanism was operated during April 2009 to December 2011. However, this chapter is based on fi ndings from seven quarters between April 2009 and December 2010, including three quarters in 2009 and four quarters in 2010.
Overall Scenario of the Crisis
The 3F crisis began with an increase in the price of crude oil, which rose to its highest level in 20 years and triggered increases in the price of staple foods by 150 percent in just four months from January to May 2008 (ESCAP 2009). Food prices often depend on the price of agricultural inputs and transportation. Food prices have dropped since their peak in mid-2008, but they are expected to remain fi rm over the medium term (ESCAP 2009). As crude oil prices dropped, triggering a decrease in food prices to an extent, the fi nancial crisis, initially limited to Western countries, developed into a global crisis. Almost all developed and developing countries are now suf-fering from the global economic crisis (World Bank 2009). This section reviews the food crisis in terms of food shortages and rises in food prices, and their impact on hunger because these characteristics are similar at the global and national levels.
Nepal has experienced food, fuel, and fi nancial crises in various forms for many years, but the current global 3F crisis could exacerbate the
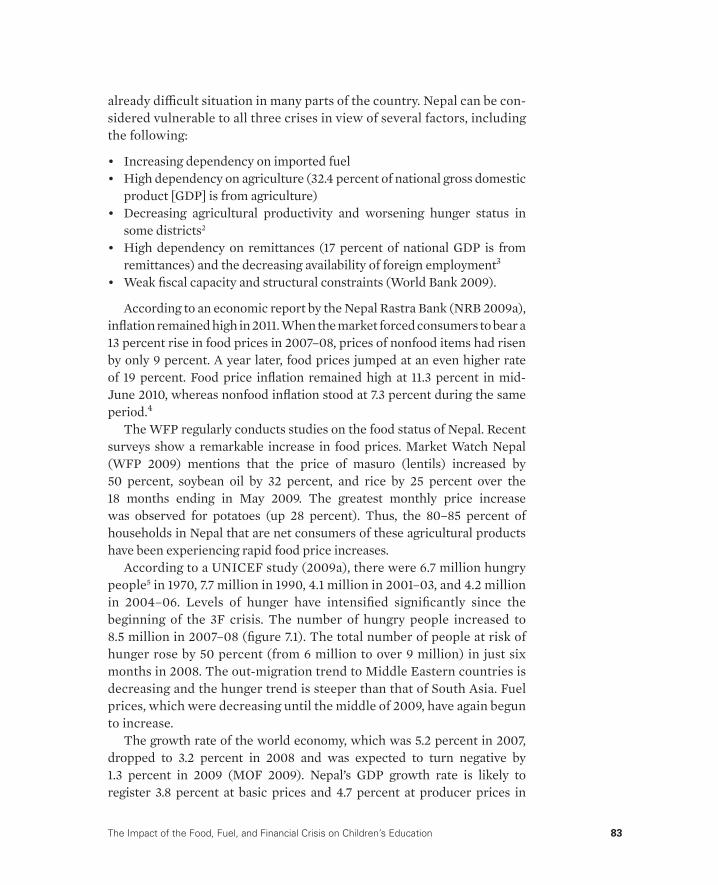
The Impact of the Food, Fuel, and Financial Crisis on Children’s Education 83
already diffi cult situation in many parts of the country. Nepal can be con-sidered vulnerable to all three crises in view of several factors, including the following:
• Increasing dependency on imported fuel• High dependency on agriculture (32.4 percent of national gross domestic
product [GDP] is from agriculture) • Decreasing agricultural productivity and worsening hunger status in
some districts2 • High dependency on remittances (17 percent of national GDP is from
remittances) and the decreasing availability of foreign employment3 • Weak fi scal capacity and structural constraints (World Bank 2009).
According to an economic report by the Nepal Rastra Bank (NRB 2009a), infl ation remained high in 2011. When the market forced consumers to bear a13 percent rise in food prices in 2007–08, prices of nonfood items had risen by only 9 percent. A year later, food prices jumped at an even higher rate of 19 percent. Food price infl ation remained high at 11.3 percent in mid-June 2010, whereas nonfood infl ation stood at 7.3 percent during the same period.4
The WFP regularly conducts studies on the food status of Nepal. Recent surveys show a remarkable increase in food prices. Market Watch Nepal (WFP 2009) mentions that the price of masuro (lentils) increased by 50 percent, soybean oil by 32 percent, and rice by 25 percent over the 18 months ending in May 2009. The greatest monthly price increase was observed for potatoes (up 28 percent). Thus, the 80–85 percent of households in Nepal that are net consumers of these agricultural products have been experiencing rapid food price increases.
According to a UNICEF study (2009a), there were 6.7 million hungry people5 in 1970, 7.7 million in 1990, 4.1 million in 2001–03, and 4.2 million in 2004–06. Levels of hunger have intensifi ed signifi cantly since the beginning of the 3F crisis. The number of hungry people increased to 8.5 million in 2007–08 (fi gure 7.1). The total number of people at risk of hunger rose by 50 percent (from 6 million to over 9 million) in just six months in 2008. The out-migration trend to Middle Eastern countries is decreasing and the hunger trend is steeper than that of South Asia. Fuel prices, which were decreasing until the middle of 2009, have again begun to increase.
The growth rate of the world economy, which was 5.2 percent in 2007, dropped to 3.2 percent in 2008 and was expected to turn negative by 1.3 percent in 2009 (MOF 2009). Nepal’s GDP growth rate is likely to register 3.8 percent at basic prices and 4.7 percent at producer prices in
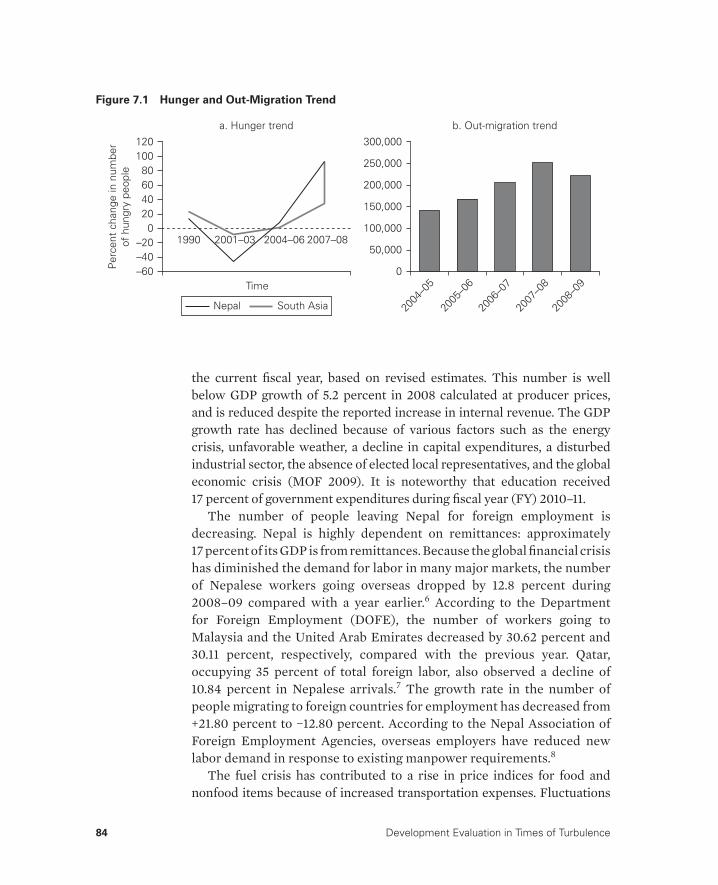
84 Development Evaluation in Times of Turbulence
the current fi scal year, based on revised estimates. This number is well below GDP growth of 5.2 percent in 2008 calculated at producer prices, and is reduced despite the reported increase in internal revenue. The GDP growth rate has declined because of various factors such as the energy crisis, unfavorable weather, a decline in capital expenditures, a disturbed industrial sector, the absence of elected local representatives, and the global economic crisis (MOF 2009). It is noteworthy that education received 17 percent of government expenditures during fi scal year (FY) 2010–11.
The number of people leaving Nepal for foreign employment is decreasing. Nepal is highly dependent on remittances: approximately 17 percent of its GDP is from remittances. Because the global fi nancial crisis has diminished the demand for labor in many major markets, the number of Nepalese workers going overseas dropped by 12.8 percent during 2008–09 compared with a year earlier.6 According to the Department for Foreign Employment (DOFE), the number of workers going to Malaysia and the United Arab Emirates decreased by 30.62 percent and 30.11 percent, respectively, compared with the previous year. Qatar, occupying 35 percent of total foreign labor, also observed a decline of 10.84 percent in Nepalese arrivals.7 The growth rate in the number of people migrating to foreign countries for employment has decreased from +21.80 percent to −12.80 percent. According to the Nepal Association of Foreign Employment Agencies, overseas employers have reduced new labor demand in response to existing manpower requirements.8
The fuel crisis has contributed to a rise in price indices for food and nonfood items because of increased transportation expenses. Fluctuations
Figure 7.1 Hunger and Out-Migration TrendP
erce
nt c
hang
e in
num
ber
of h
ungr
y pe
ople
120100806040200
–40–20
–60Time
2001–03 2004–06 2007–081990
a. Hunger trend
Nepal South Asia
300,000
250,000
200,000
150,000
100,000
50,000
0
2004
–05
2005
–06
2006
–07
2007
–08
2008
–09
b. Out-migration trend
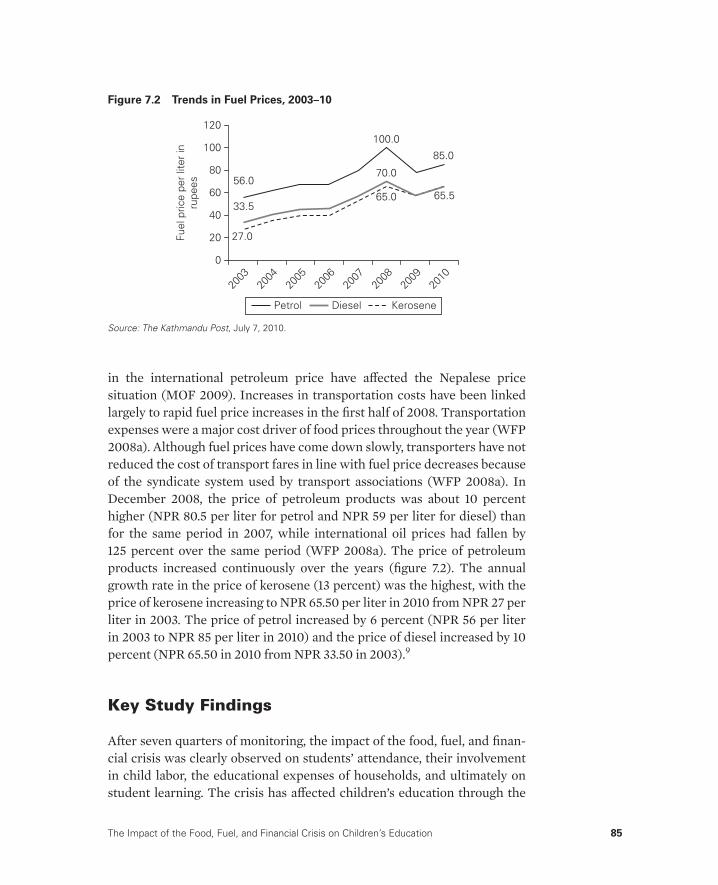
The Impact of the Food, Fuel, and Financial Crisis on Children’s Education 85
in the international petroleum price have aff ected the Nepalese price situation (MOF 2009). Increases in transportation costs have been linked largely to rapid fuel price increases in the fi rst half of 2008. Transportation expenses were a major cost driver of food prices throughout the year (WFP 2008a). Although fuel prices have come down slowly, transporters have not reduced the cost of transport fares in line with fuel price decreases because of the syndicate system used by transport associations (WFP 2008a). In December 2008, the price of petroleum products was about 10 percent higher (NPR 80.5 per liter for petrol and NPR 59 per liter for diesel) than for the same period in 2007, while international oil prices had fallen by 125 percent over the same period (WFP 2008a). The price of petroleum products increased continuously over the years (fi gure 7.2). The annual growth rate in the price of kerosene (13 percent) was the highest, with the price of kerosene increasing to NPR 65.50 per liter in 2010 from NPR 27 per liter in 2003. The price of petrol increased by 6 percent (NPR 56 per liter in 2003 to NPR 85 per liter in 2010) and the price of diesel increased by 10 percent (NPR 65.50 in 2010 from NPR 33.50 in 2003).9
Key Study Findings
After seven quarters of monitoring, the impact of the food, fuel, and fi nan-cial crisis was clearly observed on students’ attendance, their involvement in child labor, the educational expenses of households, and ultimately on student learning. The crisis has aff ected children’s education through the
Figure 7.2 Trends in Fuel Prices, 2003–10
56.0
33.5
27.0
100.0
85.0
70.0
65.0 65.5
2003
2004
2005
2006
2007
2008
2009
2010
120
100
80
60
40
20
0
Fuel
pric
e pe
r lit
er in
rupe
es
Petrol KeroseneDiesel
Source: The Kathmandu Post, July 7, 2010.

86 Development Evaluation in Times of Turbulence
coping mechanisms that households took to deal with the crisis. Parents have allowed their children to attend school irregularly, involved them in paid work, reduced the amount spent on education, shifted children to cheaper schools, and even taken them out of school to work full time.
Figure 7.3 shows some of the pathways through which increased house-hold costs caused by the 3F crisis have led to lower student attendance at school. This chapter explores these pathways, or coping mechanisms, and their impact on student performance.
Impact on Student Attendance
The monitoring of attendance and learning achievement of children over the past 17 months found that student attendance (65 percent on average) and the average examination scores (33 percent on average) are below
Figure 7.3 Pathways for Coping with the 3F Crisis Lead to Lower
School Attendance
Overall price increase
(including food price)
Increased expensesFood shortage
Low production
Reduced
food Intake
Childlabor
Lower attendance
Fewer schoolsuppliesmaterial
Lowerperformance
Debt
Higher incidenceof Illness
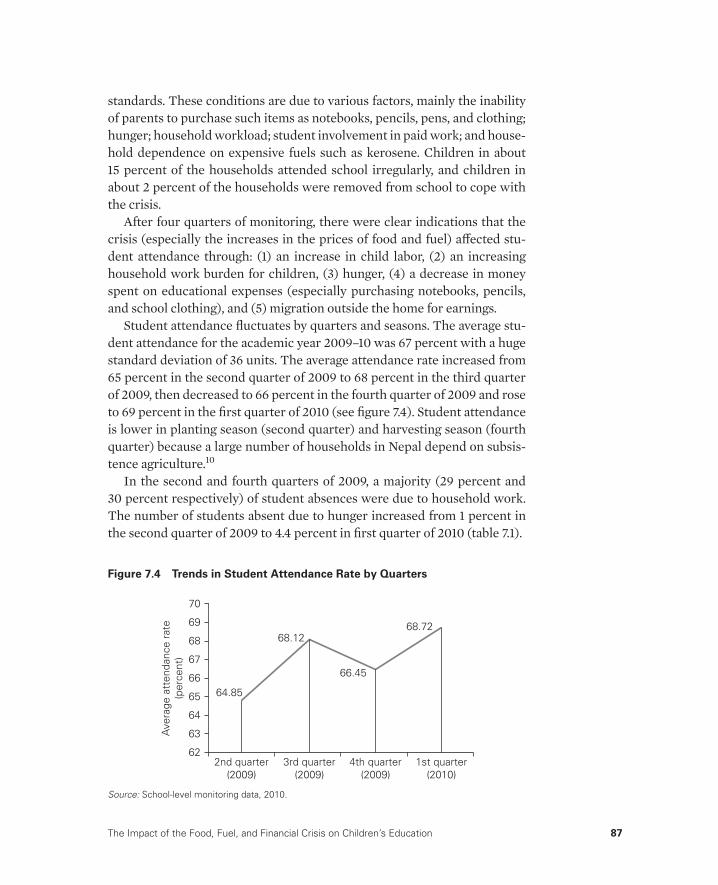
The Impact of the Food, Fuel, and Financial Crisis on Children’s Education 87
standards. These conditions are due to various factors, mainly the inability of parents to purchase such items as notebooks, pencils, pens, and clothing; hunger; household workload; student involvement in paid work; and house-hold dependence on expensive fuels such as kerosene. Children in about 15 percent of the households attended school irregularly, and children in about 2 percent of the households were removed from school to cope with the crisis.
After four quarters of monitoring, there were clear indications that the crisis (especially the increases in the prices of food and fuel) aff ected stu-dent attendance through: (1) an increase in child labor, (2) an increasing household work burden for children, (3) hunger, (4) a decrease in money spent on educational expenses (especially purchasing notebooks, pencils, and school clothing), and (5) migration outside the home for earnings.
Student attendance fl uctuates by quarters and seasons. The average stu-dent attendance for the academic year 2009–10 was 67 percent with a huge standard deviation of 36 units. The average attendance rate increased from 65 percent in the second quarter of 2009 to 68 percent in the third quarter of 2009, then decreased to 66 percent in the fourth quarter of 2009 and rose to 69 percent in the fi rst quarter of 2010 (see fi gure 7.4). Student attendance is lower in planting season (second quarter) and harvesting season (fourth quarter) because a large number of households in Nepal depend on subsis-tence agriculture.10
In the second and fourth quarters of 2009, a majority (29 percent and 30 percent respectively) of student absences were due to household work. The number of students absent due to hunger increased from 1 percent in the second quarter of 2009 to 4.4 percent in fi rst quarter of 2010 (table 7.1).
Figure 7.4 Trends in Student Attendance Rate by Quarters
Source: School-level monitoring data, 2010.
Ave
rage
att
enda
nce
rate
(per
cent
)
70
69
68
67
66
65
64
63
62
64.85
68.12
66.45
68.72
2nd quarter(2009)
3rd quarter(2009)
4th quarter(2009)
1st quarter(2010)

88 Development Evaluation in Times of Turbulence
Community-level monitoring showed similar data. The months with higher school attendance were Falgun (February–March) and Chaitra (March–April), whereas lower attendance was reported in Baishakh, Jestha, and Mangisir (June, July, and December, respectively).11 School-level moni-toring found that the attendance rate was highest (78 percent) for Chaitra (March–April) and lowest (59 percent) for Ashwin (September–October).
The levels of attendance as well as barriers to attendance diff er by dis-tricts, geographic regions, the caste of students, the gender of students, and whether schools are urban or rural. A summary of average student atten-dance by diff erent categories is shown in fi gure 7.5.
Average attendance for girls was higher than that for boys. Three major reasons for boys to be absent throughout the year were sickness (26 percent), household work; (25 percent) and not being able to bring along school supplies (10 percent), whereas for girls the reasons were household work (27 percent), sickness (25 percent), and not being able to bring along school supplies (10 percent). Girls are kept from school more often than boys for household work and sickness of family members.
Students Work at Home and for PayThe 3F crisis has aff ected school attendance through two routes. In districts like Dadeldhura, Panchthar, Saptari, Achham, and Tanahun, which have paid work opportunities, parents are increasing their work load, which has led to an increased need to keep children home from school to do household work. In the low plains adjacent to India, known as the Terai region, parents send their children to do paid work; thus, they attend school irregularly.12
In almost all districts, household work (50 percent in Kapilvastu), sick-ness (44 percent in Panchthar), inability to bring along school supplies
Table 7.1 Reasons for Student Absences by Quarters, 2009–10
Reason for absence (percent of absent students)
Quarter Sick Household work Paid work Hunger
No school
supplies
Second quarter 2009
26.2 29.2 3.9 1.0 10.7
Third quarter 2009
21.0 25.6 8.7 1.6 13.2
Fourth quarter 2009
25.8 29.7 9.7 3.6 9.6
First quarter 2010
29.4 23.3 6.0 4.4 7.2
Source: School-level monitoring data, 2009 and 2010.

The Impact of the Food, Fuel, and Financial Crisis on Children’s Education 89
(19 percent in Jumla), and paid work (20 percent in Saptari) have been the four major reasons for student absences. Community-level monitoring in Humla and Kapilvastu found that hunger was one of the key reasons for students to attend school irregularly.13
Some Cannot Aff ord School SuppliesA major reason behind the absences was that some students were not able to aff ord school supplies (up to 21 percent in the third quarter of 2009). Par-ents reported that the increase in food prices made it diffi cult for them to purchase the necessary supplies including notebooks, pencils, and school attire. Scholarships are not usually used to purchase school supplies. More-over, the scholarship amount (about US$5 per year per student) is inade-quate compared with the opportunity cost of attending school (children in the 10–14 age group get about US$2–3 per day for paid work).
Hunger Keeps Some Students AwayHunger was reported to be one of the major reasons for absences, accounting for 13 percent of the absences in the third quarter of 2009. The importance of food for children in rural Nepal can also be observed in the fact that, on average, 15 percent of parents sent their children to school to benefi t from meals off ered there. The government has been implementing school feeding programs in selected food-defi cient districts, but its implementation diff ers
Figure 7.5 Student Attendance Rate
Source: School-level monitoring data.
Note: Janajatis represents certain ethnic groups of Nepal.
Janajatis
Per
cent
Dalits
Girls
Boys
Urban
67
68
69
66
72
64
55
77
76
69
Rural
Terai
Hill
Mountain
Nepal

90 Development Evaluation in Times of Turbulence
by districts and schools. In the Humla district, schools provided children with money to buy food on their own. In the Jumla district, schools used the money to buy diff erent types of food for diff erent days, which resulted in diff erences in student attendance. In many districts, the rationale behind selection of specifi c schools was not clear—schools in great need of such programs are not getting them. In the Rolpa district, a school feeding program was implemented in primary schools but not in secondary schools, which included children from relatively poor economic backgrounds.
Impact of Irregular Attendance on Learning
The data indicate increasing incidences of irregular school attendance, child labor, and dropout rates. Reduced student attendance, increased child labor, and reduced funds available for educational expenses were found to have an impact on student learning.
Average student learning achievement (average marks) based on school reporting was 33 percent, almost equal for boys and girls; a grade of 32 percent is required to pass. However, the learning achievement diff ered according to several categories (see table 7.2). The learning achievement for Dalits (26.18 percent) was well below that of other castes such as Brahmins, Chhetris, Muslims, and Newars (36.14 percent).14
Table 7.2 Average Learning Achievements
Category Learning achievement (percent)
Gender
Boys 32.89
Girls 32.71
Caste
Dalits 26.18
Other (Brahmin, Chhtetri, Newar, Muslims, etc.)
36.14
Janajatisa 34.16
Location
Urban 35
Rural 31
Total average 33
Source: School-level monitoring data, April 2009–June 2010.
Note: a. Janajatis represents certain ethnic groups of Nepal.
The Impact of the Food, Fuel, and Financial Crisis on Children’s Education 91
The crisis is aff ecting student’s learning through reduced attendance. School-level monitoring found that student learning is directly aff ected by student attendance. When student attendance decreased by 10 percent, the learning achievement (average marks) decreased by about 11 percent.15
As expected, the main reason for student failure observed in school-level monitoring was student attendance (45 percent) followed by inability to purchase necessary learning materials (18 percent) and other reasons (27 percent), like limited time to study at home, lack of interest, lack of parental support, and dropping out before examinations. Other minor rea-sons included more involvement in household work, involvement in paid work, and sickness.
The reasons for students failing their examinations diff ered by caste and region. Fifteen percent of Dalits failed because of not having suffi cient learning materials, whereas only 2 percent of other castes failed for this reason. The average grades of Janajatis were also aff ected by their higher involvement in paid work. Of Dalit students, 7.5 percent failed examinations because of their involvement in paid work, whereas 2 percent of Janajatis and none of the other households failed for this reason. The major reasons noted during focus groups with teachers and students were similar to the school-level monitoring results.
The main barriers noted in all the community-level monitoring in 20 schools conducted in the past fi ve quarters were irregular attendance, limited time for study, and unavailability of necessary learning materials (such as notebooks, pencils, and reference books). Other reasons included limited time spent on lessons in preparation for examinations,16 household environment,17 ineff ective examination system,18 lack of nutritious food,19 heavy household workload, poor teaching methods, low parental awareness, and lack of student interest in school work.20 Learning was also reported to have been aff ected by language barriers (diff erence in students’ mother tongue and the teaching language).21 In districts with paid work oppor-tunities, parents were increasing their workloads to manage household expenses in the context of increasing prices. In the process, the household work burden for children, such as responsibilities for looking after cattle or siblings, increased and they were able to give less time to their studies.22 Because of household work, some students did not manage to complete their homework.23
Over the last quarters of monitoring, the impact on students’ learning due to reduction in education expenses was also reported. Mothers in the Humla district have started to reduce the number of notebooks they provide to their children. Teachers in the Jumla district reported that three brothers from the same family had started to share a single set of notebooks.24

92 Development Evaluation in Times of Turbulence
A systematic mechanism to monitor the learning achievement level of children and the reasons behind their weak performance was lacking in almost all schools visited for community-level monitoring. Parents are mostly unaware of their children’s learning levels.25 A few schools have real-ized the need to enhance student learning levels and have made eff orts such as monthly tests,26 and child-friendly classrooms.27
Incidences of Child Labor
A comparatively mild but detrimental coping mechanism is the increasing involvement of children in household work. Where there is the opportunity, parents are increasing their paid workload to increase household income. Thus, the household work level of children has been increased, resulting in reduced school attendance and decreased learning hours at home. Where increased prices are putting pressure on families, involvement in child labor has become one of the preferred coping strategies for poor households. Incidences of child labor (paid as well as nonpaid) were observed in all the communities visited during the monitoring period. Various pathways led to involvement of children in child labor due to the impact of the 3F crisis under the overall context of household poverty.
Mothers in all communities included in community-level monitoring reported that they involve their children in household work. Household chores performed by children include cleaning dishes, fetching water, col-lecting fodder for cattle, and so on. The incidences of children’s involve-ment in paid as well as nonpaid labor were also found in household-level monitoring. During the third quarter of 2010, of the households with stu-dents who attended school irregularly, 63 percent (69 percent in the third quarter of 2009) involved their children in nonpaid household work while 29 percent (22 percent in the third quarter of 2009) sent their children to do paid work.
Payment for Child Labor All school-aged children perform chores to support their parents in house-hold and agricultural activities. The average age at which children start being involved in paid work is 9–10 years old.28
Children get around NPR 100–NPR 250 per day. The payment diff ers by gender and age: girls get less (NPR 100 per day) than boys (NPR 150 per day).29 Children of 15–16 years of age are intensively involved in paid work, and receive payment almost equal to adults. Most children involved in paid work do part-time work such as working during school holidays, missing school for one or two days, or working in the mornings or evenings.
The Impact of the Food, Fuel, and Financial Crisis on Children’s Education 93
However, there are also incidences of children being involved in full-time labor to help their households meet basic expenses. Some children from the outskirt villages of Birgunj are employed full time in local markets and earn about NPR 2,000-2,500 per month.30
Where do students spend the money they earn? In many cases, children give their earnings to their parents to meet household expenses, which include food and other daily consumables.31 However, some children use the money to buy school supplies like notebooks, pencils, and school attire, and to meet other personal and recreational needs. There are diff erent fi nd-ings on the use of earnings from paid child labor. Mothers in Parsa men-tioned that children use their money for personal consumption.
Factors That Determine Child Labor A logit regression model based on household-level monitoring indicates that households using kerosene, households facing food shortages, poor households, households with a head who has a low education level, and larger households are likely to send their children to paid work and reduce their attendance at school.32 The incidence of household work was reported to be higher in households with many children and in households depend-ing on foreign employment.33 In households with more family members, children have no option other than involving themselves in paid work to earn money for school supplies and other consumables that their parents cannot aff ord.34
Children involve themselves in paid work if their family is in great need of fi nancial assistance or if they cannot otherwise aff ord school supplies.35
There are increasing incidences of children’s involvement in paid work due to increasing availability of work opportunities in urban areas.36 Paid work is available even in agricultural areas since there is a shortage of agricultural labor due to out-migration. During the agricultural season, a few students take part in agricultural paid work and do not attend school.37 The tendency to send children for paid work depends on the education level of the par-ents.38 In communities with increased parental awareness and higher atten-tion to school attendance, the incidences of child labor during school hours has decreased.39
Impact of Child LaborChild labor has a direct impact on student absences, and ultimately on dropout rates.40 Children who are intensively involved in paid work to feed their family have higher chances of dropping out of school if they get steady work.41 The increased involvement of children in household work has also infl uenced student’s attendance and learning to a large extent.
94 Development Evaluation in Times of Turbulence
Student Dropout Rate
Taking children out of school is the most detrimental household cop-ing measure. Initial coping practices, such as reduced student attendance, decreased learning achievement, and involvement in child labor are sus-pected to lead to students dropping out of school.
Few incidences of dropout were observed in the districts and schools monitored in 2009 and 2010. Quarterly household-level monitoring recorded that school dropout implicated only 1–3 percent of households throughout the monitored quarters: only about 52 dropout incidences were observed in six schools from three districts during this time.
Reasons for Dropping OutCauses for student dropout can be categorized as immediate, primary, and secondary, because some factors have a direct impact whereas oth-ers gradually erode children’s education. Figure 7.6 shows that immediate causes for dropout include failing examinations, out-migration for income, especially to lndia,42 not being able to pay fees and purchase school sup-plies, the psychological pressure of becoming an overage student,43 and involvement in full-time paid labor for a long period.44 These immediate causes force students to abandon school quickly: teachers claim that lower attendance and examination failures forced 6 to 10 students to drop out of school in the four schools monitored in Dolakha and Parsa.45
Key primary causes for student dropout include the student being over-age, having irregular attendance due to the reasons discussed previously, and decreased learning, possibly due to reduced study time. These primary causes can lead to the immediate causes for dropping out described above. Child labor can also act as a primary cause for dropout if working children began to attend school irregularly and fail examinations.46 These primary causes are cyclical: irregular attendance can lead to failure in examina-tions, repetition of classes, and becoming an overage student. Learning ability, which is possibly linked to nutritional factors in households47 and other personal factors, can also limit interest in studies and lead to exami-nation failure: the school-level monitoring found that about 91 percent of students who dropped out had lower or mediocre learning abilities.
Community-level monitoring data indicates that various second-ary causes lead to primary and immediate causes for dropout. Secondary causes include substantial household work, inadequate scholarship pro-vision (relative to opportunity costs), low household income, and income deprivation. Children are also dropping out because households are unable to meet educational costs.48 The socioeconomic condition of households

The Impact of the Food, Fuel, and Financial Crisis on Children’s Education 95
Figure 7.6 Incidences of Student Dropout
Failing examinations,out-migration for income,inability to pay school fees
and purchase supplies,psychological pressure ofbeing an overage student,
full-time paid labor
Overage students,child labor,
irregular attendance,decline in learning
achievement
Substantial householdwork, inadequatescholarships, low
household income, and seasonal migration
Immediate causes:
Primary causes:
Secondary causes:
was identifi ed as a secondary cause: some dropout cases resulted from the decreasing ability of households to cope with rising school costs along with escalating food prices.49 Children drop out of school to earn money to feed their family, look after siblings, or work in other homes.50 Many children have also left school to migrate to the Middle East. Teachers in Bogatigaun,

96 Development Evaluation in Times of Turbulence
Achham district, reported a dropout case triggered by aggregated economic hardship. A top eighth-grade student dropped out of school to search for work in India because his grandmother could no longer aff ord to cover liv-ing expenses and his education.
One of the key reasons for student dropout in Mugu and Bajura dis-trict schools is seasonal migration: students migrate with their parents from one place to another throughout an academic year, according to the change in seasons. This seasonal migration causes long absences, examination failures, and eventually, dropout.51 Similarly, the migra-tion of children and their families to India during the academic terms has led to student dropout.52 The school-level monitoring data confi rms community-level monitoring fi ndings. School data revealed that chil-dren’s involvement in paid work is a major reason for dropout, followed by scarce family income, household work, and out-migration (see fi gure 7.7). Teachers in Shiva Panchayan School, Damauli, reported that the incidences of dropout had increased in recent years due to children’s increasing involvement in paid work. Parents require this involvement to support their families.53
Figure 7.7 Reasons for Student Dropout
Source: School-level monitoring data.
Sick3% Household
work14%
Poor family18%
No stationery6%
Migration12%
No parentalcare12%
Lack of interest
4%
Involvementin paid work
20%
Others11%

The Impact of the Food, Fuel, and Financial Crisis on Children’s Education 97
Boys and girls drop out for diff erent reasons. Boys are more likely to leave school to cope with the increasing economic pressure of households,54 whereas girls are more likely to drop out of school to marry early.55
Factors Linked to DropoutDetailed analysis points to three clusters of factors that drive students out of school: individual, school-related, and household-related factors. The combination of these three factors forces children into a critical zone where they are most likely to forsake school (fi gure 7.8). These three factors oper-ate within a broader socioeconomic environment infl uenced by external factors such as rising food prices, loss of employment, availability of paid-work opportunities, and so on.
Individual factors include age, gender, position in the family, learn-ing ability, circle of friends, opportunity costs, and involvement in paid work. Household-related factors include family size, number of sib-lings, economic conditions, source of household income, dependence on a particular family member’s wages, food suffi ciency, family reli-ance on children to undertake household work, and education and food expenses. School-related factors include service delivery aspects (which are linked to the country’s overall education system), availability and accessibility of schools, teaching-learning processes, children’s motiva-tion to attend school, physical facilities, teacher regularity, provision of
Figure 7.8 Critical Zone of Dropout
Critical zoneof dropout
Household-related factors
Individual factors
School-related factors
98 Development Evaluation in Times of Turbulence
scholarships and school supplies, and homework and class workload. The unavailability of secondary schools and the inability of many to meet secondary education costs (living costs, school supplies, and so on) have forced dropouts in the Himalayan region. All of the eighth-grade students consulted during the community-level monitoring in Murma-gaun, Mugu district, reported that they will not be able to enroll in ninth grade next year if the class is not held in their current school.56 Girls are even less likely to migrate to the district headquarters for second-ary education because of concerns for their security, early marriage, and socioeconomic barriers.57 Small children also drop out of school due to their parents’ inability to fi nance their education.58
Government scholarships are expected to support parents, but they are very small and do not cover the opportunity cost of having a student forego paid work to stay in school. A child’s average daily income ranges from NPR 100 to NPR 200, whereas annual government scholarships normally range from NPR 350 to NPR 500.59 Scholarships are provided on an ad-hoc basis to Dalits60 and girls, regardless of family income, which results in some stu-dents who are not poor obtaining scholarships.
Characteristics of Dropout CasesChildren with poor learning abilities are dropping out of school. For instance, most of the children who dropped out this year had weak aca-demic achievement according to teachers in various schools. Dalit children were more likely to drop out than children from other castes: more than half (51 percent) of the dropout cases reported were Dalit children. Moreover, over three quarters (76 percent) of the cases involved overage children. The proportion of boys dropping out (53 percent) was slightly higher than for girls (47 percent). It is interesting to note that all the households in which children abandoned school during the last quarter of 2010 were in the poor-est category.
Overall Impact
The monitoring mechanism has produced fi ve quarterly reports. In all quarters, the impact of the food, fuel, and fi nancial crisis can be observed on student attendance, their involvement in child labor, the increased burden of educational expenses on households, and, ultimately, on stu-dent learning. The overall impact of the crisis on school attendance has remained stable compared with last year. Figure 7.9 shows changes in four coping mechanisms between the third quarters of 2009 and 2010. It shows
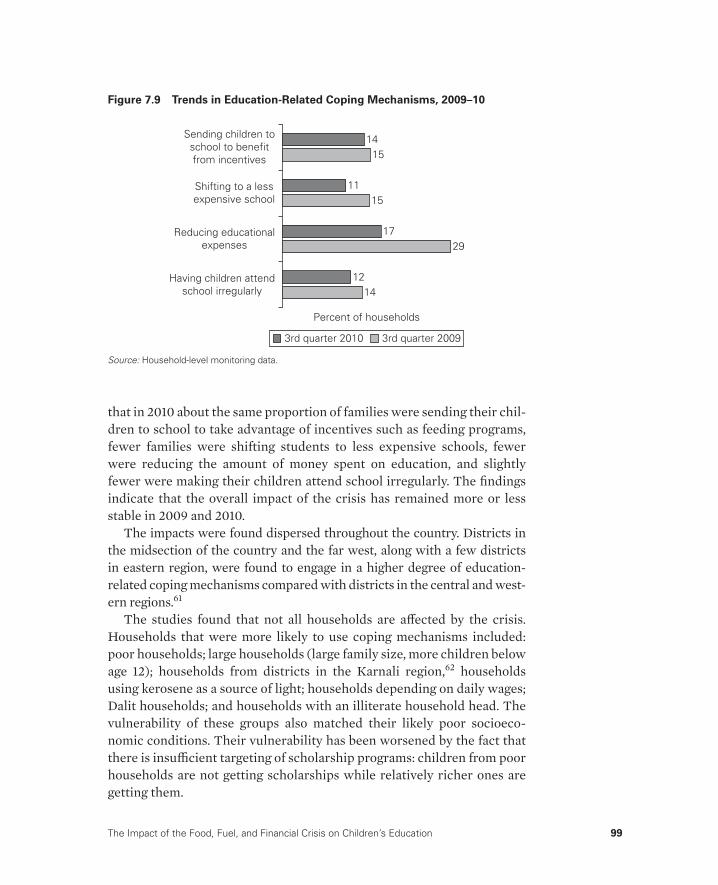
The Impact of the Food, Fuel, and Financial Crisis on Children’s Education 99
that in 2010 about the same proportion of families were sending their chil-dren to school to take advantage of incentives such as feeding programs, fewer families were shifting students to less expensive schools, fewer were reducing the amount of money spent on education, and slightly fewer were making their children attend school irregularly. The fi ndings indicate that the overall impact of the crisis has remained more or less stable in 2009 and 2010.
The impacts were found dispersed throughout the country. Districts in the midsection of the country and the far west, along with a few districts in eastern region, were found to engage in a higher degree of education-related coping mechanisms compared with districts in the central and west-ern regions.61
The studies found that not all households are aff ected by the crisis. Households that were more likely to use coping mechanisms included: poor households; large households (large family size, more children below age 12); households from districts in the Karnali region,62 households using kerosene as a source of light; households depending on daily wages; Dalit households; and households with an illiterate household head. The vulnerability of these groups also matched their likely poor socioeco-nomic conditions. Their vulnerability has been worsened by the fact that there is insuffi cient targeting of scholarship programs: children from poor households are not getting scholarships while relatively richer ones are getting them.
Figure 7.9 Trends in Education-Related Coping Mechanisms, 2009–10
Source: Household-level monitoring data.
14
11
15
15
1729
1214
Sending children toschool to benefitfrom incentives
Shifting to a lessexpensive school
Reducing educationalexpenses
Having children attendschool irregularly
Percent of households
3rd quarter 2010 3rd quarter 2009
100 Development Evaluation in Times of Turbulence
Findings and Suggested Responses
Some of the fi ndings refl ect the challenging situation for the education sec-tor and require adequate response from the government. These fi ndings have been discussed in a steering committee formed in Nepal’s Department of Education, involving senior government offi cials, researchers, and UNICEF offi cials for planning and implementation. The Department of Education can try to reduce the impact of the 3F crisis on children’s education by suitable responses. The fi ndings and proposed responses are presented below.
Finding 1. Many students lack necessary school supplies. There is a need for clear provision to distribute school supplies to children from disadvan-taged communities through the schools.
Suggested Responses: Because parents clearly mentioned that the pro-vision of textbooks has helped their children to continue their studies, there is a need for a learning materials package. The package needs to be brought under government fi nancing by making detailed cost calculations. Educa-tion stakeholders must also understand that parents’ inability to purchase learning materials is a key problem.
Finding 2. The percentage of children missing school because of hunger increased over the study period.
Suggested Responses: Advocacy and awareness is needed about school feeding programs at the district and school levels to implement the pro-grams in line with their original objectives. There is a need for uniformity maintained through clear guidelines. Government needs to consider school-based midday meal programs more seriously and try to expand or institu-tionalize them. Resource pooling at local and community levels, depending on local context, can also be an option. This requires awareness activities targeting School Management Committees, Parent-Teacher Associations, teachers, and parents. Various nutrition-related programs implemented through government and donor channels need to be linked with schools at the local level. The government can synchronize the child nutrition pro-grams through intergovernmental and donor sharing. Providing one meal a day to primary-level students could reduce the impact of the food crisis on children’s education.
Finding 3. Government school scholarships do not cover the full cost of attending school, nor the opportunity costs of missing school for paid work.
Suggested Responses: The government should improve the target-ing of scholarships and incentive programs to make sure they benefi t the neediest students. Targeting Dalit households seem fair. However, there is still a need to strengthen the targeting mechanism to benefi t needy
The Impact of the Food, Fuel, and Financial Crisis on Children’s Education 101
children. The Education Management Information System (EMIS) can be revised to collect the statistics based on disaggregation suggested by the vulnerability profi le.
Finding 4. Irregular attendance at school can lead to student perfor-mance failure and dropping out of school.
Suggested Responses: (1) Increase scholarship amounts to cover a sub-stantial proportion of the opportunity cost for students to attend school. (2) Raise awareness among parents and students about long-term benefi ts of education. Awareness activities at the school level will also be useful. In a school of Sanfebagar, Achham district, counseling students on the advan-tages of remaining in school helped reduce irregular attendance. (3) Raise child protection on the advocacy agenda and make forceful child labor a punishable off ense. (4) Establish a system to track student performance, pro-motion status, and dropout status.
Finding 5. Collection of reliable data helps identify problems and form responsible solutions.
Suggested Responses: The government should continue to play a key role in the monitoring process and analysis through the monitoring sec-tion at the Department of Education and District Education Offi ces (DEO) involved in data collection, and by providing educational data through the EMIS. The involvement of the government is expected to facilitate the insti-tutionalization of the monitoring system and increase its sustainability and governmental acceptance of recommendations drawn from the system’s fi ndings.
Notes
1. The 11 districts are Humla, Tanahun, Achham, Mugu, Bajura, Jumla, Dadeld-hura, Kapilvastu, Parsa, Saptari, and Panchthar.
2. The number of hungry people in Nepal reached 8.5 million in 2007–08 from 4.1 million in 2001–03, according to UNICEF (2009).
3. A decrease of 12.8 percent in 2008 compared with 2007, according to Republica National Daily, July 22, 2009.
4. Republica National Daily, July 29, 2010. 5. Hunger refers to those consuming less than the minimum recommended
energy intake. In South Asia, this minimum averages 2,100 calories per day per person.
6. Republica National Daily, July 22, 2009. The Kathmandu Post, June 17, 2009, compiled by the Department of Foreign Employment, reported that the num-ber of Nepalese migrant workers leaving for foreign destinations during the fi rst 11 months of the current fi scal year decreased by 10.07 percent.
102 Development Evaluation in Times of Turbulence
7. Republica National Daily, July 22, 2009. 8. Republica National Daily, July 22, 2009. 9. The Kathmandu Post, July 7, 2010.10. Also reported by mothers in Bargadawa, Kapilvastu district.11. Also reported by teachers in Taulihawa, mothers in Sante, and teachers in
Bogatigaun, Achham.12. As reported by mothers in Rupnagar, Saptari and Bargadawa, Kapilvastu.13. As reported by mothers in Rupnagar, Saptari and Bargadawa, Kapilvastu.14. Other castes like Brahmin, Chhetri, and Newar are the elite castes having
higher income levels, educational attainment, and social status.15. Derived through simple regression considering student learning as an outcome
of student attendance based on school level monitoring data, which provide attendance rates and examination scores for each student.
16. Reported by teachers of Bhasa SS, Kagate, Dhankuta district.17. Reported by teachers of SalMandir PS, Liwang, Rolpa district.18. Reported by teachers of Baijanath SS, Dadeldhura district (third quarter
of 2009).19. Acccording to teachers in Bhagwandas LSS, Kapilvastu district (fi rst quarter
of 2010).20. Teachers in Gadhi LSS, Panchthar (third quarter of 2010) reported that overage
children are losing their interest in education due to higher opportunity costs, a bad circle of friends, etc.
21. Reported by teachers and students in Balmandir PS, Liwang, Rolpa district; Panchamrit PS, Pauwabhanjyang, Panchthar district; and Buddheswor PS, Saptari district.
22. This phenomenon was observed in Tanahun district (second quarter of 2009), Panchthar and Dadeldhura district, Saptari district (fourth quarter of 2009), and Dhankuta district (second quarter of 2010).
23. Reported by teachers in Bhasa HSS, Kagate, Dhankuta district.24. According to mothers in Bhimsen PS, Simkot, Humla district (second quarter of
2009) and teachers in Kartikswami PS, Gairigaun, Jumla district (fourth quar-ter of 2009).
25. According to mothers and teachers in Bogatigaun, Achham district.26. As reported by teachers in Panchamrit PS, Panchthar district (third quarter of
2009).27. As reported by teachers in Balmandir PS, Liwang, Rolpa district.28. Mothers in Charikot and Tikhatal, Dolakha district and Visuwa, Parsa district.29. Reported by mothers in Chhapkaiya, Parsa district and mothers in Charikot,
Dolakha district.30. Reported by mothers in Chhapkaiya, Parsa district.31. Reported in three out of four focus groups with mothers conducted in this
quarter.32. A logit regression was run on household-level data produced by WFP (third
quarter of 2010) considering involvement of children in child labor as the
The Impact of the Food, Fuel, and Financial Crisis on Children’s Education 103
dependent variable, and socioeconomic and other characteristics of household as independent variables.
33. Reported by mothers in Tikhatal and Charikot, Dolakha district.34. Reported by mothers in Tikhatal, Dolakha district and Visuwa, Parsa district.35. Reported by mothers in Tikhatal, Dolakha district,36. Reported by mothers in Dadeldhura district; Phidim, Panchthar district;
Damauli, Tanahun district; and Charikot, Dolakha district.37. Reported by mothers and teachers in Tikhatal, Dolakha district.38. As reported by mothers in Tikhatal, Dolakha district and also supplemented by
analysis of VAM data.39. Reported by mothers in Tikhatal, Dolakha district, and Chhapkaiya, Parsa district.40. Reported by mothers in Tikhatal, Dolakha district.41. Reported by mothers in Tikhatal, Dolakha district.42. More relevant in far west and midwestern districts including Mugu and Bajura
districts.43. Reported by children in Bogatigaun, Achham district; Sanfebagar, Achham
district; and Bargadawa, Kapilvastu district.44. Reported by teachers in Murmagaun, Mugu district and Damauli, Tanahun
district.45. Reported by teachers in four schools from two districts.46. Reported by teachers in Balmandir PS, Liwang, Rolpa district.47. Reported by teachers in Choyakot SS, Rajali, Bajura district.48. Reported by mothers in Harirawa, Saptari district.49. Reported by mothers in Guranse, Dhankuta district and Mijhingandliwang,
Rolpa district.50. Reported by teachers and mothers in Balmandir PS, Liwang, Rolpa district.51. Reported by teachers in Bahalikot PS, Basali, Bajura district.52. Reported by teachers in Murmagaun, Mugu district.53. Reported by teachers in Shiva Panchayan PS, Tanahun district.54. Reported by children in Bogatigaun, Achham district.55. Reported by teachers in Bogatigaun, Achham district.56. The students from Murmagaun have to go to Gamgadhi district headquarters to
get secondary level education since secondary schools are not available nearby.57. Reported by children and teachers in Murma, Mugu district.58. As reported by mothers in Mijhing, Rolpa district.59. As reported by children and mothers in Mijhing, Rolpa district. Note: the
annual scholarship for a few students in the mountain region also reaches up to Rs 10,000 per year for secondary level.
60. Dalits are the low caste/untouchable groups under caste hierarchy.61. Household-level monitoring data. The coping intensity was assessed by devel-
oping a composite score of education-related coping mechanisms and comput-ing them by districts based on household-level monitoring of WFP.
62. The Karnali region is regarded as a region facing acute food shortage.

104 Development Evaluation in Times of Turbulence
References
ESCAP (Economic and Social Commission for Asia and the Pacifi c). 2009b. The Food-Fuel-Financial Crisis and Climate Change: Addressing Threats to Development. Bangkok: ESCAP.
Gujarati, D. N. 2004. Basic Econometrics. Fourth Edition. New Delhi: McGraw-Hill.MOF (Ministry of Finance). 2009. “Economic Survey for Fiscal Year 2008–09.”
MOF, Kathmandu.NRB (Nepal Rastra Bank). 2009a. Economic Report 2007–08. Kathmandu.————. 2009b. “Consumers Continue to Face Rising Prices.” Nepal Rastra Bank.
http://www.nepalnews.com.UNICEF (United Nations Children’s Fund). 2009. “A Matter of Magnitude: The
Impact of the Economic Crisis on Women and Children in South Asia.” UNICEF ROSA, Kathmandu.
WFP (World Food Programme). 2008a. “2008 Nepal Staple Food Market Review and Outlook for 2009.” WFP, Kathmandu.
————. 2009. “Market Watch Nepal.” No. 14. WFP, Kathmandu.World Bank. 2009. The Global Economic Crisis: Assessing Vulnerability with a
Poverty Lens. Washington, DC: World Bank.
105
Institutional Impact Assessment: The Jordan ExperienceLamia Al-Zoubi
Introduction
Jordan’s Ministry of Planning and International Cooperation (MoPIC) is a pioneering governmental institution that makes a signifi cant contribution toward achieving sustainable socioeconomic development. Its mission is to coordinate and direct development eff orts through planning, execution, monitoring, and evaluation of social and economic development plans in coordination with the public and private sectors and civil society organiza-tions, as well as to enhance economic, fi nancial, and technical cooperation with various countries and international organizations to achieve sustain-able socioeconomic development and a better standard of living for all Jordanians.
For most of Jordan’s development programs and organizations, impact assessment is still a one-off , donor-driven activity that is conducted half-way through a program or as part of post-program evaluation. This is also the case in government institutions, most of which hold the conventional view that impact assessment and market research studies are expensive and
CHAPTER 8
106 Development Evaluation in Times of Turbulence
should be left in the care of donors and external consultants. This view is partly due to limited access to information on these tools, but also to lack of understanding about how these tools can be integrated eff ectively into operational activities.
At MoPIC, internal demand for impact information resulted in the estab-lishment of an internal Impact Assessment Unit (IAU) in October 2010 to establish local ownership of impact assessment and cultivate trust among stakeholders. Hence, the unit sought to avoid reliance on external expertise at the expense of its internal capacities. Its fi rst activity was an orientation briefi ng on the impact assessment program for MoPIC management and staff , which consists of a director, senior evaluators, researchers, and stat-istician specialists.
MoPIC’s IAU’s main objectives are as follows:
• Maximizing the benefi ts of implemented developmental projects to improve the economic and social developmental environment
• Institutionalizing the evaluation and impact assessment process• Fostering institutional and community partnerships to achieve the devel-
opmental goals of government programs.
The IAU is a tool to help the government of Jordan assess the impacts of development programs and projects. It supports the process of policy mak-ing by contributing valuable empirical data to policy decisions, and by estab-lishing a rational decision framework to examine the implications of capital investment options. This tool is an important factor in responding to the impact on modern economies of open international markets and budgetary constraints, and the consequences of competing policy demands.
The IAU at MoPIC makes evaluation and impact assessment an integral part of the implementation process of government development projects and promotes the importance of evaluation and assessment to other gov-ernment institutions. The IAU process targets all concerned parties, and focuses on releasing and enhancing the monitoring and evaluation (M&E) culture (processes, mechanisms and methodologies). Eventually the IAU will have an active role with the donor community.
The mandate of MoPIC ’s IAU is to do the following:
• Institutionalize the evaluation process to become one of the main pro-cedures during the lifetime of a project. It will determine the required evaluation documents (such as the logic framework and evaluation plan) to facilitate evaluating and monitoring.
• Participate actively with the ministries and concerned institutions at the project document formulation stage by contributing to structuring the
Institutional Impact Assessment: The Jordan Experience 107
project’s logic framework. This participation will address the linkages of the project objectives, expected outcomes, and impact on the concerned targets and benefi ciaries.
• Evaluate selected completed programs and projects to assess their impact, and compare their objectives with their achievements.
• Actively participate with internal missions assigned by the donors for project midterm review and post-evaluation purposes. These projects are funded by the donors. IAU will participate in formulating the evalua-tion methodology and monitoring its implementation.
• Highlight the key and critical sector and component indicators addressed in the National Executive Development Program for the years 2011–13. This review will show any achievement delays through the quarterly reports of the project lifetime. These reports are issued by MoPIC ’s Pro-grams and Projects Directorate.
• Build the capacity of evaluation practitioners at MoPIC and other min-istries by preparing and supervising evaluation training packages and participating in and implementing evaluation training programs.
• Formulate an annual evaluation plan based on project status and deter-mine a project evaluation framework. IAU also supervises the evaluation implementation processes.
• Share the evaluation reports, which include results and lessons learned, with all concerned parties.
Status Quo Review
In the initial stages of the process, it was important for MoPIC to subscribe to the principles advocated by the Impact Assessment Global Network. MoPIC needed a greater appreciation of the impact assessment process and a better understanding of what it entails. A status quo review was made of MoPIC ’s international experiences with impact assessment that provided a valuable input to the project design.
The objectives of the review were to do the following:
• Make an inventory of impact assessment tools and review MOPIC’s experience with the tools;
• Compare impact assessment frameworks;• Determine inventory impact areas, indicators, and methodologies used;
and• Identify best practices that can be adopted by the IAU.
The donors in this status quo review were those who contribute to the development process in Jordan. The review demonstrated their procedures

108 Development Evaluation in Times of Turbulence
and methodologies, thus identifying gaps within the donor community on M&E processes.
IAU reviewed a representative sample of donor projects using tools such as reviewing documents, conducting meetings, interviewing, and fi eld visits. IAU documented and reported all the steps of the evaluation and impact-assessment stages.
The study found reliable monitoring and evaluation programs and proj-ect management within the donor community. The donor community has gone a long way in refl ecting on institutional and contextual components of M&E systems. The good practices identifi ed by the IAU were an eff ec-tive introduction to building an initial framework for impact assessment in Jordan, where it is not yet institutionalized.
Some donors follow a standardized methodology in all their projects worldwide. Other donors don’t have a clear evaluation methodology.
The review also found that impact studies conducted by external par-ties were in the context of project evaluations, with minimal involvement of MoPIC staff . These impact studies were undertaken on a per-project basis, and most were cross-sectional, one-off , and limited in geographic scope. They used a mix of qualitative and quantitative methods and were time- and resource-intensive. Such studies would place a very high demand on MoPIC if included as part of its regular activities.
Unfortunately, minimal eff orts were made to draw out the implications of these impact studies for improvement or to translate their fi ndings into points of action.
Impact Assessment Mechanism
Drafting impact assessments is a sophisticated and time-consuming exer-cise, and it is important to ensure that impact assessment is proportionate and does not become burdensome. In the best case, the scope and depth of impact assessments should be targeted. Even if a complete, in-depth impact assessment is recommended for all program proposals, realistically, the importance and the weight of the proposed normative act should be taken into account, and the depth of the impact assessment should be designed accordingly. Otherwise, impact assessment could face resistance from part-ners, such as government employees and donors, who might respond by simply checking off the required boxes rather than by engaging fully. By contrast, a system in which the scope of the impact assessment is targeted can generate understanding and compliance from the people working with it. The division into simple and complicated impact assessments, however,
Institutional Impact Assessment: The Jordan Experience 109
contains a trap: the desire for simplifi cation. Therefore, clear guidelines should be set regarding when in-depth impact assessment is needed, and, more important, which best practices to use, as well as the role and place for the IAU within the structure of sector and program evaluations.
Next Steps
The next steps included the following:
• Establishing an IAU at the Ministry of Planning and International Cooperation
• Positioning the IAU in the organizational structure, and highlighting its operational and institutional importance by linking it to the minister
• Coordinating the IAU’s standard of procedures (SoPs) with those of other related MoPIC departments and adopting the IAU SoPs as normal procedures for projects; the SoPs will determine the required evaluation documents (such as the logic framework and evaluation plan) through-out the evaluation process
• Conducting a process to raise the awareness of the involved parties about the importance of evaluation and impact assessment issues.
Evaluation and Impact Assessment Methodology
The IAU’s main objective is to institutionalize evaluation and impact assess-ment processes at MoPIC, as well as for all partners in the fi eld, especially the ministries and government departments. IAU adopts methodologies that can facilitate and improve the adopted and adapted evaluation and impact assessment processes and methodologies. At this stage, IAU is adopt-ing and sharing with all parties—especially the donors—several evaluation and impact assessment techniques and methodologies for diff erent project phases as listed and described here and in fi gure 8.1:
Planning phase: Conduct awareness-raising with the involved parties, assign roles, identify evaluation and impact assessment issues, build a set of documents and procedures.
Implementation phase: Conduct an evaluation at the level of monitoring in order to identify the challenges for ongoing projects.
Completion of outcomes assessment phase: Conduct an evaluation at the end of a project according to its objectives and expected outcomes, which can be included in the completion report.
Completion of impact assessment phase: Conduct a results-based post-evaluation after the completion of the project to assess the projects’ impact.

110 Development Evaluation in Times of Turbulence
The impact assessment process takes place at three levels: the level of projects and programs, the level of sectors, and the level of the annual Exec-utive Development Program (EDP) (box 8.1).
At the level of projects and programs, the goal is to build an integrated database of projects and programs listed in the 2011–13 EDP and fi nanced through grants and loans, along with a representative sample of projects fi nanced in 2011, for the purpose of evaluation and impact assessment. In selecting projects for the database, an eff ort was made to list projects that
Box 8.1 Executive Development Program
The Executive Development Program (EDP) is an investment in reform that builds on past achievements and responds to emerging socioeconomic needs and challenges. It continues the reform process through the imple-mentation of clear sectoral development strategies, which encompass a number of policy measures and time-bound action plans. Development strategies for each sector of the economy were devised by the related min-istries, in coordination with leading stakeholders from the private sector and civil society organizations
The EDP is adopted by the government of Jordan and funded by the national budget, as well as by grants and loans. It comprises seven pillars: legislation and justice; investment development; fi nancial services and gov-ernmental fi nancial reform; supporting vocational training and employment; social welfare; public education, higher education, and scientifi c research and innovation; and infrastructure upgrade.
Project document
AgreementsPlanning phase
Implementationphase
Evaluation phaseImpact
assessment
Completionreport
Monitoring
Mid-term review
Figure 8.1 Evaluation at Different Project Phases
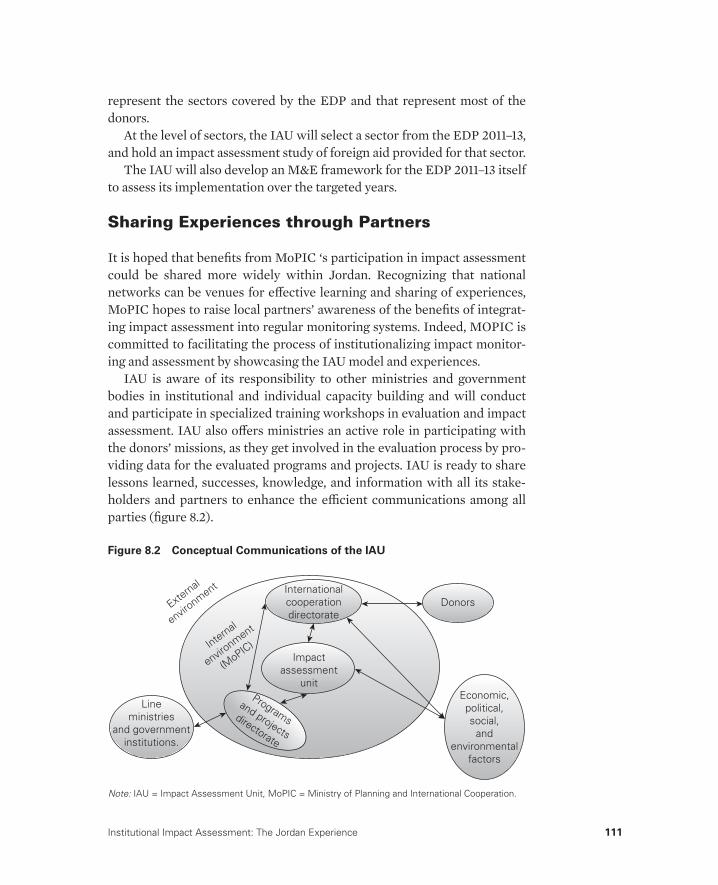
Institutional Impact Assessment: The Jordan Experience 111
represent the sectors covered by the EDP and that represent most of the donors.
At the level of sectors, the IAU will select a sector from the EDP 2011–13, and hold an impact assessment study of foreign aid provided for that sector.
The IAU will also develop an M&E framework for the EDP 2011–13 itself to assess its implementation over the targeted years.
Sharing Experiences through Partners
It is hoped that benefi ts from MoPIC ‘s participation in impact assessment could be shared more widely within Jordan. Recognizing that national networks can be venues for eff ective learning and sharing of experiences, MoPIC hopes to raise local partners’ awareness of the benefi ts of integrat-ing impact assessment into regular monitoring systems. Indeed, MOPIC is committed to facilitating the process of institutionalizing impact monitor-ing and assessment by showcasing the IAU model and experiences.
IAU is aware of its responsibility to other ministries and government bodies in institutional and individual capacity building and will conduct and participate in specialized training workshops in evaluation and impact assessment. IAU also off ers ministries an active role in participating with the donors’ missions, as they get involved in the evaluation process by pro-viding data for the evaluated programs and projects. IAU is ready to share lessons learned, successes, knowledge, and information with all its stake-holders and partners to enhance the effi cient communications among all parties (fi gure 8.2).
Figure 8.2 Conceptual Communications of the IAU
Internationalcooperationdirectorate
Impactassessment
unitPrograms
and projects
directorate
External
environment
Internal
environment
(MoPIC)
Lineministries
and governmentinstitutions.
Economic,political,social,
andenvironmental
factors
Donors
Note: IAU = Impact Assessment Unit, MoPIC = Ministry of Planning and International Cooperation.

112 Development Evaluation in Times of Turbulence
Challenges and Issues
MoPIC’s immediate challenge is to institutionalize impact assessment. Completed activities under the IAU have done much to jumpstart the insti-tutionalization process, but making the information system work will be critical. Important to institutionalizing impact assessment will be perfor-mance monitoring and making better use of current processes as informa-tion sources
Eff orts are needed to convince local stakeholders about the benefi ts of impact assessment activities relative to the costs and staff time because most of them still grapple with meeting fi nancial performance targets. By building the capabilities of the fi eld staff to collect and analyze part-ner information, MoPIC hopes to further build ownership of the process and develop a culture of learning from its partners. However, MoPIC is also learning that not all fi eld staff has the aptitude for data gathering and analysis.
Later, MoPIC will incorporate partners’ impact information, both quali-tative and quantitative, into management information systems. Similarly, MoPIC is committed to meeting the training needs of staff , particularly those who will form the core of its impact assessment activities. The mem-bers of these teams are trained researchers and evaluators who can be called upon when there are pressing operational issues that require investigation on a local or broader scale.
Improving and promoting impact monitoring and assessment through networks is a signifi cant challenge for MoPIC . Most of the local partners still narrowly view impact assessment as a costly undertaking that should be externally funded and controlled. Their immediate concern is its aff ord-ability, which explains their inclination to undertake impact assessment out of capital grants, but not to bother with it otherwise. Changing this attitude will require promotion and advocacy, that is, sharing MoPIC’s experience with impact assessment and emphasizing that its benefi ts signifi cantly exceed its costs.
Institutionalizing impact assessment will require cooperation from all partners, given that the impact assessment partner information system needs to be adapted to suit the information needs of each partner, which will require careful planning and adherence to the same process that MoPIC has been through. Building local partners’ internal capacities to handle impact assessment will also be an important challenge for the network. Also critical is raising the level of staff appreciation of impact assessment tools and meth-odologies, and improving skills in data analysis and interpretation.
Institutional Impact Assessment: The Jordan Experience 113
Conclusion
From MOPIC ’s experience with its Impact Assessment Unit, valuable les-sons have emerged in terms of institutionalizing the impact assessment pro-cess within the organization. MOPIC is also learning that, beyond internal capacities, there should be a serious commitment to institutionalize impact and partner monitoring. This commitment must be grounded in the belief that learning from partners is critical in proving eff ective improved organi-zational performance and ensuring institutional growth and sustainability.

115
How Can Development Banks Boost Firms’ Productivity?Filipe Lage de Sousa
Overview
Extensive literature examines how fi rms’ performance can be aff ected by trade policies, especially focusing on the gains from trade. However, there is a shortage of papers analyzing whether other government policies can aff ect fi rms’ productivity, as evidenced by Grilliches, Klette, Moen, and others (2000) and Criscuolo, Martin, Overman, and Reenen (2007). This shortage of papers is not due to a shortage of methods, since other areas have already developed diff erent ways to deal with policy impact analysis. For example, labor economics literature has made a relevant contribution by evaluating the extent to which government polices aff ect individuals’ achievements. A survey of this literature can be found in Heckman, LaLonde, and Smith (1999). Further work should be pursued in evaluating government policies on fi rms’ performance to provide empirical evidence for public policy design.
This chapter contributes to the literature on fi rms’ performance and public policy by trying to understand to what extent government interven-tions aff ect fi rms’ productivity. Banerjee and Dufl o (2005) provide evidence
CHAPTER 9
116 Development Evaluation in Times of Turbulence
that fi rms in many developing countries face credit constraints, by using a sample of countries including Brazil. Therefore, Brazilian fi rms might be credit constrained, especially for long-term projects. Terra (2003) provides evidence that Brazilian fi rms are defi nitely credit constrained. Financial restrictions for long-term projects are considered among the most impor-tant market failures in the Brazilian economy as they hamper the entrepre-neurial eff orts of local fi rms.
As a partial remedy, the Brazilian government provides long-term loans through the Brazilian Development Bank (Banco Nacional de Desenvolvi-mento Economico e Social; BNDES).1 The statutory goal of this institu-tion is to improve Brazilian economic competitiveness without neglecting broader social aspects. BNDES invests in several areas including research and development, infrastructure, export support, and regional and urban development. In the case of manufacturing, BNDES fi nances long-term projects aimed at the creation of new plants, the enlargement of existing ones, the restructuring and the modernization of production processes, innovation and technological development, and export promotion. Overall, the importance of BNDES in the Brazilian economy is sizeable: in 2011 its disbursements reached US$82.3 billion, representing 17.5 percent of aggre-gate investment.2
Although BNDES project analysis involves several dimensions includ-ing social and environmental aspects, it is nonetheless interesting to assess its overall impact on the competitiveness of Brazilian fi rms. The aim of this chapter is to contribute to this assessment by investigating the impact of BNDES activities on the productivity of Brazilian manufacturing fi rms. This impact is a central issue from a policy perspective: “Productivity isn’t everything, but in the long run it is almost everything.... Compared with the problem of slow productivity growth, all our other long term economic concerns—foreign competition, the industrial base, lagging technology, dete-riorating infrastructure, and so on—are minor issues” Krugman (1992, 13, 18).
Considering the relevance of productivity to fostering economic devel-opment and evaluating how it might be improved by government policies is a challenging and important investigation. A range of papers investi-gates BNDES eff ects, such as BNDES (2002), Monteiro Filha (1994), Pereira (2007), Puga and Torres Filho (2006), Reiff and others (2007), and Sousa (2003), but none has addressed productivity. Ottaviano and Sousa (2008) were the fi rst to analyze whether BNDES fi nancial support might aff ect fi rms’ productivity, but their results call for further work to evaluate how BNDES fi nancial supports improve fi rms’ productivity. The methodology used in this chapter distinguishes it from Ottaviano and Sousa (2008).
How Can Development Banks Boost Firms’ Productivity? 117
Theoretically, the aim of this chapter is to understand which cost reduc-tion is able to boost fi rms’ productivity. Specifi cally, a fi rm must evaluate two types of cost when it decides to make investments to develop a new good for the market: (1) research and development (R&D) sunk cost to develop the new product, and (2) production costs of the new good.
Depending on which cost is reduced, the eff ect on productivity diverges. In the fi rst case, R&D sunk cost, reducing costs has a positive eff ect, while in the second, production costs, the eff ect is negative. The main economic intu-ition is that when production costs are reduced, less-effi cient fi rms become profi table, which pushes down overall economic productivity. When R&D fi xed costs are reduced, there is a procompetitive eff ect in the market, in which more fi rms decide to innovate, and, thus, only the more effi cient ones are able to survive. This theoretical framework is the fi rst diff erence between this chapter and Ottaviano and Sousa (2008), which investigates the eff ects on productivity depending on which type of technology—old technology or new technology—is fi nancially supported.
Another diff erence is in how a control group was created. Whereas Otta-viano and Sousa (2008) matched a fi nanced fi rm with a similar nonfi nanced one, this chapter uses the Kernel matching method. The Kernel approach permits comparing supported fi rms with all other fi rms by weighting non-fi nanced fi rms by how similar they are to those that are fi nanced. The main advantage of this strategy is that it allows the use of all the information in the dataset.
Empirical results show that, on average, granted fi rms do perform bet-ter than nongranted fi rms after being awarded a BNDES loan. However, it is not clear whether this improvement in productivity is associated with BNDES loans. No eff ect of BNDES loans on fi rms’ performance is detected by using the diff erence-in-diff erences approach after comparing them with similar fi rms. Therefore, granted fi rms perform identically to other simi-lar fi rms. This may represent that the criterion for making the decision on which fi rms to lend money to does not focus entirely on economic issues. Other issues, such as social, regional, and environmental impacts, might be as important (or maybe more so) as economic aspects in selecting the project, due to the amenities that each project creates. Theoretically, the government might be reducing both R&D and production costs leading to a null eff ect. More emphasis should be given to R&D costs to improve average productivity because reducing R&D costs provides higher social benefi ts to the economy.
This chapter is structured as follows. The fi rst section begins by describ-ing the fi nancial support off ered by BNDES to manufacturing fi rms, and is followed by a description of the dataset used in the following section. Next,
118 Development Evaluation in Times of Turbulence
the theoretical methodology is discussed. Descriptive statistics are pre-sented and the empirical strategy is discussed, followed by the empirical results. Finally, concluding comments are off ered.
Overview of BNDES Schemes
BNDES provides a wide range of fi nancial tools to support Brazilian man-ufacturing fi rms: Financing and Endeavors (FINEM), Automatic BNDES, Machines and Equipment (FINAME), Leasing FINAME, International Competition FINAME (BNDES-Exim), and Subscription of Securities.
FINEM is a direct support scheme for projects with fi nancial needs over R$10 million (US$4.7 million). Projects with fi nancial needs below this threshold are supported indirectly through retailing banks under the Automatic BNDES scheme. Both schemes contemplate several categories of expenses covering the creation of new plants, enlargement of existing ones, restructuring and modernization of processes, innovation, and technologi-cal development.3
Through the FINAME and the Leasing FINAME schemes, BNDES supports the acquisition of new domestically produced machines and equipment either by buying them (FINAME) or leasing them (Leasing FINAME). The aim of BNDES-Exim is to provide fi nancial support for exports. Subscription of Securities facilitates changes in fi rm ownership.
Our focus is on FINEM and Automatic BNDES, which support the discovery and the implementation of promising projects. Conversely, FINAME and Leasing FINAME do not contemplate investments in inno-vation and technological development. Nonetheless, it is necessary to account for them in order to isolate the role of FINEM and Automatic BNDES. BNDES-Exim and Subscription of Securities have diff erent objectives. FINEM and Automatic BNDES are, therefore, loans that might aff ect fi rms’ productivity since their expansion may be guided by improve-ments in production and/or creation of new and/or more sophisticated goods.
To receive either of these two loans, either FINEM or Automatic BNDES, fi rms must send an application with brief information on their projects to a retail bank or BNDES itself. The bank evaluates whether the projects are in line with the purpose of the loans. After their application is approved, fi rms are asked to send a complete and detailed project plan to be evaluated by the fi nancial institution. This project plan is analyzed by investigating whether it is economically viable, what collateral can be used to guarantee the loan, and so forth.
How Can Development Banks Boost Firms’ Productivity? 119
The analysis culminates in a formal contract proposal in which the terms and conditions of the loan are established, including the amount, repay-ment period, and interest rate. After the negotiation, the loan contract is signed. It is important to note two crucial points. First, fi rms do not receive their loan in a single installment after signing the contract; they receive the funds gradually during the development of the project. During negotiations, disbursements are scheduled over the years of the project implementation. Second, there is a limit for BNDES participation in any project, which is 80 percent for the two loans mentioned here. Therefore, a project is not fully fi nanced by BNDES, only a part of it is.
Once the loan has been approved, fi rms receive their fi rst disburse-ment and remaining disbursements are made after an evaluation of the project’s progress. Before the second disbursement, the company should prove whether the money of the fi rst disbursement was invested in the items outlined in the project plan. Any violation of the loan terms leads to an investigation and disbursements can be interrupted until explana-tions are given. If no problems emerge, disbursements continue until the end of the project. Since these are long-term projects, the period between contract signing and the end of disbursements takes on average 4.5 years. It is generally only after all disbursements have been made that fi rms start to amortize their loans, including interest and principal.
Description of the Dataset
To pursue our investigation, data were drawn from a variety of sources used by Negri, Lemos, and others (2009) and Ottaviano and Sousa (2008). The dataset combines information from the Annual Industrial Research (Pesquisa Industrial Anual; PIA) of the Brazilian Institute of Geography and Statistics (Instituto Brasileiro de Geografi a e Estatística; IBGE);4 the Annual Social Information Report (Relação Anual de Informações Sociais; RAIS) of the Ministry of Labor; the Foreign Trade Secretary (Secretaria de Comércio Exterior; SECEX) of the Ministry of Industrial Develop-ment and Foreign Trade; the Foreign Capital Census and the Central Bank Register of Brazilian Capital Abroad of the Brazilian Central Bank; and BNDES itself.5
BNDES data are used to identify fi rms given loans. Information is avail-able from 1995 to 2003.6 During this period, 539 fi rms received FINEM loans and 8,505 fi rms borrowed under the Automatic BNDES scheme. In the lat-ter case, it is not possible to use all fi rms since some of them are not available from PIA; PIA covers fi rms with more than 30 employees but some smaller
120 Development Evaluation in Times of Turbulence
fi rms are granted Automatic BNDES loans. This lack of data reduced the number of fi rms granted Automatic BNDES in our sample by half.
Our sample size was further reduced by three other issues. First, the focus of this chapter is on manufacturing fi rms whereas BNDES records concern all manufacturing projects. In other words, they report manufactur-ing projects by nonmanufacturing fi rms (for example, those of large food retailers investing in the development of their own brands) and do not cover nonmanufacturing projects of manufacturing fi rms (for example, in agricul-ture). Hence, we end up evaluating only the performance of manufactur-ing fi rms granted loans to implement projects in the manufacturing sector. A second issue is related to mergers. For example, if Firm A received a loan in 1997 and then in 2000 merged with Firm B creating a new Firm C, the initial loan would be registered to Firm C. As the past records of Firm C are impossible to reconstruct, all information on loans projects granted to fi rms like A and B are dropped. Finally, there is a time lag of generally two to three years before a fi rm enters the census database of PIA.7 Hence, some granted fi rms with more than 30 employees are not recorded by PIA at the moment they receive BNDES loans.
In the end, data were available for 240 fi rms granted FINEM loans and more than 2,000 fi rms granted Automatic BNDES from 1996 to 2003. About 15,000 nongranted fi rms are available to construct the counterfactual group. A description of all variables used in this chapter is reported in Annex 9A.
Although the treated group had a reasonable size, potential drawbacks of conducting a policy analysis with this treated group should be addressed. First, any of these fi rms (granted or not) might be aff ected by other govern-ment interventions apart from BNDES loans. Second, there may be a time lag for any impact to be detected, since outcomes do not necessarily appear immediately after the loan has been granted. For the former problem, it will be assumed that BNDES loans are the main type of subsidies to aff ect the fi rms’ productivity, since BNDES is the largest fi nancial institution in Brazil off ering loans for long-term projects. For the latter shortcoming, BNDES loans encompass six months before the project may be considered eligible for analysis; then, when the loan is approved, the project is already being implemented, and considering the eff ects on the current and subsequent period is not a strong assumption.8
Theoretical Background
Melitz (2003) provides a theoretical framework in which heterogeneous fi rms with diff erent productivity levels exist in the market.9 According to
How Can Development Banks Boost Firms’ Productivity? 121
melitz’s model, there are two crucial steps for a firm: step 1, when it invests in r&D to create a new product for the market; and step 2, when it decides whether or not to produce this new product.
to create a new product, a firm incurs a sunk cost of r&D, referred to in this model as the fixed cost of entry. at this stage, the firm evaluates all mar-ket possibilities and its innovative capacity. until this moment, the firm’s profitability and productivity are unknown. the decision to create a new product is called the free-entry condition, because there is no barrier to entry for any firm in the market.
the second step occurs after a new product is invented and its produc-tivity is revealed. by knowing its productivity, the firm is able to evaluate how profitable it is to produce this new product. if it is profitable, the firm chooses to produce the new good to the market; otherwise it loses its r&D sunk cost.
in summary, any firm decides first whether it will develop a new good to the market by paying an r&D sunk cost. after knowing the firm’s productiv-ity level, and consequently the firm’s profitability, the firm chooses whether to produce the new good. those two decisions are represented by melitz (2003) by two functions that define which productivity level is required to create a new good or to produce it to the market.
the first step, called the free entry condition (FEC), is when a firm decides whether or not to create a new variety. this step derives a function of the firm‘s average profit p– on its productivity cut-off point j * where one of the parameters is the sunk cost to create a new variety Ñe. the cut-off produc-tivity defines whether a firm is profitable enough to produce the developed good. the formula for this condition is described in equation 1.
fe: p –– = h(j *; Ñe) (1)
this function allows us to evaluate how average profit responds to cut-off productivity variation. intuitively, the higher the productivity cut-off level, the lower the probability of success for a firm to enter in the mar-ket. therefore, average profit in the economy should be higher to stimulate firms to develop new goods by spending resources in r&D. in other words, the derivative of this function is positive in respect to the productivity cut-off point, as shown in equation 2.
dh fd
e( ; )**
ϕϕ
> 0 (2)
in the second step, which is called a zero cut-off profit condition (ZCP), firms decide whether or not to produce to the market. again, we can derive a function of the firm’s average profit p– on its productivity cut-off point j *,
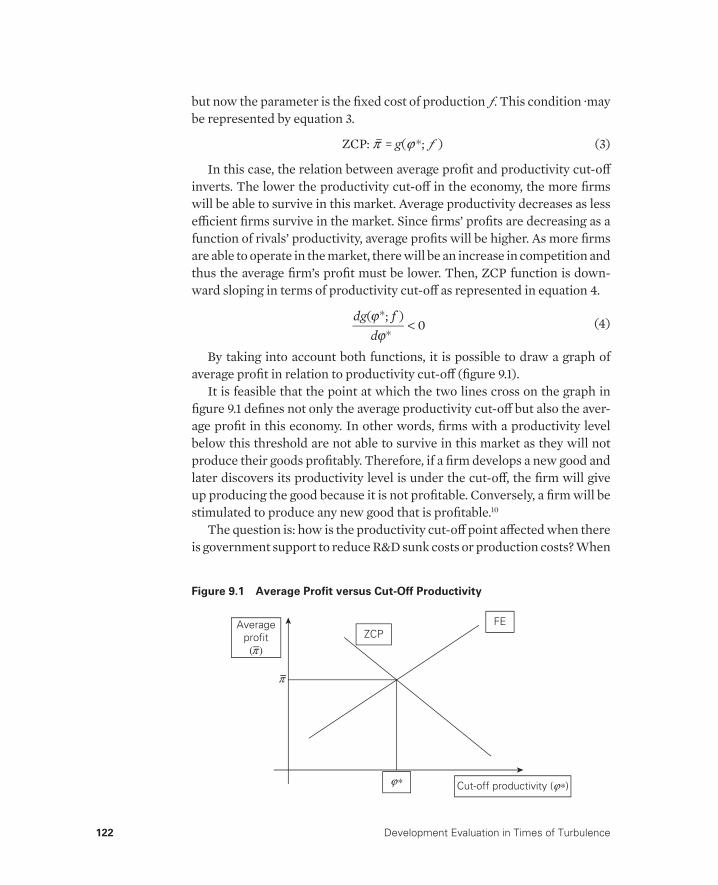
122 Development Evaluation in Times of Turbulence
but now the parameter is the fixed cost of production Ñ. this condition ·may be represented by equation 3.
Zcp: p– = g(j *; Ñ ) (3)
in this case, the relation between average profit and productivity cut-off inverts. the lower the productivity cut-off in the economy, the more firms will be able to survive in this market. average productivity decreases as less efficient firms survive in the market. since firms’ profits are decreasing as a function of rivals’ productivity, average profits will be higher. as more firms are able to operate in the market, there will be an increase in competition and thus the average firm’s profit must be lower. then, Zcp function is down-ward sloping in terms of productivity cut-off as represented in equation 4.
dg fd
( ; )**
ϕϕ
< 0 (4)
by taking into account both functions, it is possible to draw a graph of average profit in relation to productivity cut-off (figure 9.1).
it is feasible that the point at which the two lines cross on the graph in figure 9.1 defines not only the average productivity cut-off but also the aver-age profit in this economy. in other words, firms with a productivity level below this threshold are not able to survive in this market as they will not produce their goods profitably. therefore, if a firm develops a new good and later discovers its productivity level is under the cut-off, the firm will give up producing the good because it is not profitable. conversely, a firm will be stimulated to produce any new good that is profitable.10
the question is: how is the productivity cut-off point affected when there is government support to reduce r&D sunk costs or production costs? When
ZCPFE
p
j∗ Cut-off productivity (j∗)
Averageprofit
( )p
Figure 9.1 Average Profit versus Cut-Off Productivity
How Can Development Banks Boost Firms’ Productivity? 123
R&D cost is reduced, government creates an incentive for more fi rms to risk developing new goods, since economic agents are generally risk averse. Because there are more fi rms innovating, more productive fi rms will enter the market creating a procompetitive eff ect. As a result, only more competi-tive fi rms will be able to survive in a more innovative market. Thus, produc-tivity cut-off rises. This situation is represented in equation 5.
ddf
ddfe e
π ϕ> <0 0and*
(5)
Conversely, when government reduces the fi xed cost of production, the opposite occurs. If their production costs are decreased, more fi rms are able to survive in the market, since even the less-effi cient fi rms are able to com-pete with the others. As less-effi cient fi rms remain in the market, the pro-ductivity cut-off drops. Equation 6 describes these phenomena.
ddf
ddf
π ϕ> >0 0and* (6)
These results help us highlight how government policy can aff ect pro-ductivity of the economy when heterogeneous fi rms are producing in the market. If government reduces the fi xed costs of production, even less pro-ductive fi rms can survive in the market; therefore, the average productivity level of the economy will be lower (as represented by the shift of the curve from ZCP0 to ZCP1). In contrast, if government intervention diminishes the fi xed cost of entering the market, then fi rms have incentives to innovate and create new products ensuring that the more-productive fi rms remain in the market through a procompetitive eff ect; then average fi rms’ productivity increases (as can be seen, from FE0 to FE1).
When government reduces both costs in similar magnitudes, an interest-ing result occurs: both curves are shifted down (from FE0 to FE1 and ZCP0 to ZCP1) and the net eff ect might be null. In other words, by reducing R&D costs jointly with production costs, government subsidies might have no eff ect on average productivity in the economy. These shifts are visualized in fi gure 9.2.
Both loans analyzed in this study (FINEM and Automatic BNDES) have fi nanceable items that reduce both costs: innovation and technologi-cal development (R&D fi xed cost) and restructuring of processes (fi xed production cost). Therefore, all projects have a mixture of reducing fi xed costs for both innovation and production. According to the theory, the eff ects of government intervention in reducing fi xed costs presents diff er-ent outcomes depending on which cost is addressed. Therefore, if a treated group of fi rms (those granted by BNDES loans) improves its productivity
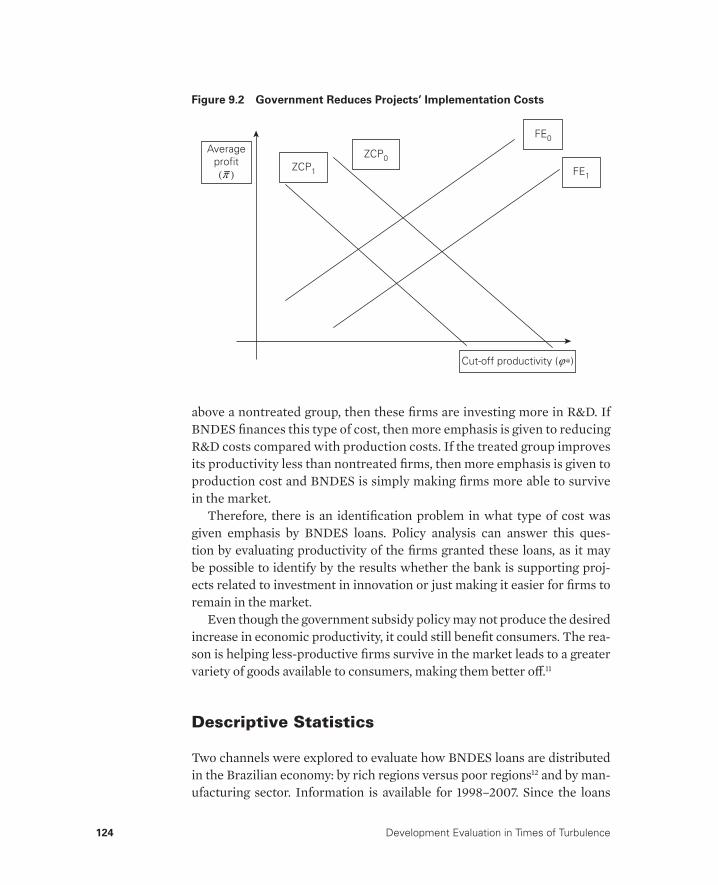
124 Development Evaluation in Times of Turbulence
above a nontreated group, then these fi rms are investing more in R&D. If BNDES fi nances this type of cost, then more emphasis is given to reducing R&D costs compared with production costs. If the treated group improves its productivity less than nontreated fi rms, then more emphasis is given to production cost and BNDES is simply making fi rms more able to survive in the market.
Therefore, there is an identifi cation problem in what type of cost was given emphasis by BNDES loans. Policy analysis can answer this ques-tion by evaluating productivity of the fi rms granted these loans, as it may be possible to identify by the results whether the bank is supporting proj-ects related to investment in innovation or just making it easier for fi rms to remain in the market.
Even though the government subsidy policy may not produce the desired increase in economic productivity, it could still benefi t consumers. The rea-son is helping less-productive fi rms survive in the market leads to a greater variety of goods available to consumers, making them better off .11
Descriptive Statistics
Two channels were explored to evaluate how BNDES loans are distributed in the Brazilian economy: by rich regions versus poor regions12 and by man-ufacturing sector. Information is available for 1998–2007. Since the loans
Figure 9.2 Government Reduces Projects’ Implementation Costs
ZCP0ZCP1
FE0
FE1
Averageprofit(p )
Cut-off productivity (j∗)
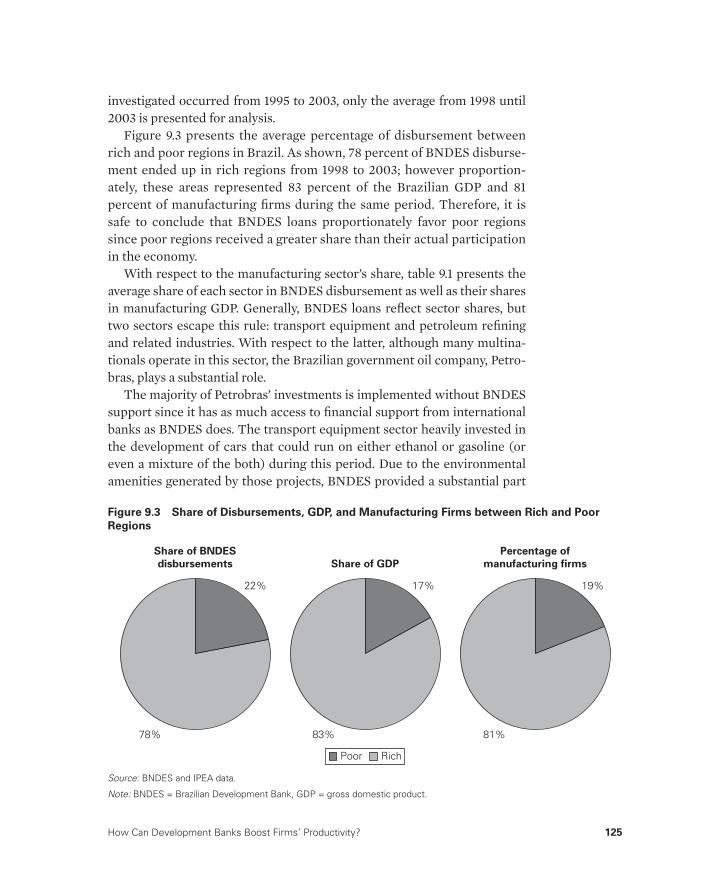
How Can Development Banks Boost Firms’ Productivity? 125
investigated occurred from 1995 to 2003, only the average from 1998 until 2003 is presented for analysis.
Figure 9.3 presents the average percentage of disbursement between rich and poor regions in Brazil. As shown, 78 percent of BNDES disburse-ment ended up in rich regions from 1998 to 2003; however proportion-ately, these areas represented 83 percent of the Brazilian GDP and 81 percent of manufacturing fi rms during the same period. Therefore, it is safe to conclude that BNDES loans proportionately favor poor regions since poor regions received a greater share than their actual participation in the economy.
With respect to the manufacturing sector’s share, table 9.1 presents the average share of each sector in BNDES disbursement as well as their shares in manufacturing GDP. Generally, BNDES loans refl ect sector shares, but two sectors escape this rule: transport equipment and petroleum refi ning and related industries. With respect to the latter, although many multina-tionals operate in this sector, the Brazilian government oil company, Petro-bras, plays a substantial role.
The majority of Petrobras’ investments is implemented without BNDES support since it has as much access to fi nancial support from international banks as BNDES does. The transport equipment sector heavily invested in the development of cars that could run on either ethanol or gasoline (or even a mixture of the both) during this period. Due to the environmental amenities generated by those projects, BNDES provided a substantial part
Figure 9.3 Share of Disbursements, GDP, and Manufacturing Firms between Rich and Poor
Regions
Share of BNDES
disbursements Share of GDP
Percentage of
manufacturing firms
22% 17% 19%
81%83%78%
Poor Rich
Source: BNDES and IPEA data.
Note: BNDES = Brazilian Development Bank, GDP = gross domestic product.
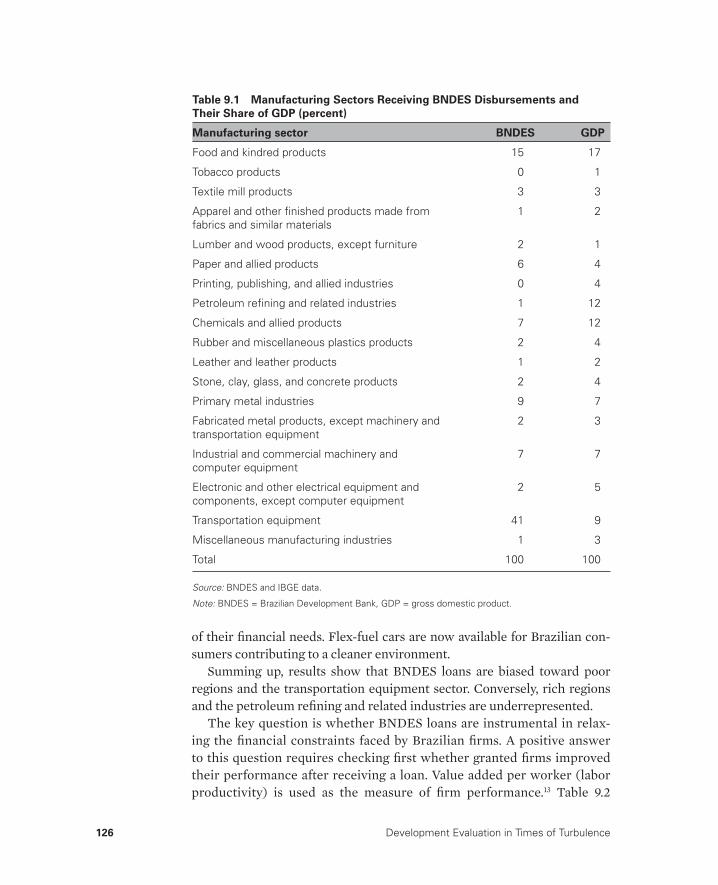
126 Development Evaluation in Times of Turbulence
of their fi nancial needs. Flex-fuel cars are now available for Brazilian con-sumers contributing to a cleaner environment.
Summing up, results show that BNDES loans are biased toward poor regions and the transportation equipment sector. Conversely, rich regions and the petroleum refi ning and related industries are underrepresented.
The key question is whether BNDES loans are instrumental in relax-ing the fi nancial constraints faced by Brazilian fi rms. A positive answer to this question requires checking fi rst whether granted fi rms improved their performance after receiving a loan. Value added per worker (labor productivity) is used as the measure of fi rm performance.13 Table 9.2
Table 9.1 Manufacturing Sectors Receiving BNDES Disbursements and
Their Share of GDP (percent)
Manufacturing sector BNDES GDP
Food and kindred products 15 17
Tobacco products 0 1
Textile mill products 3 3
Apparel and other fi nished products made from fabrics and similar materials
1 2
Lumber and wood products, except furniture 2 1
Paper and allied products 6 4
Printing, publishing, and allied industries 0 4
Petroleum refi ning and related industries 1 12
Chemicals and allied products 7 12
Rubber and miscellaneous plastics products 2 4
Leather and leather products 1 2
Stone, clay, glass, and concrete products 2 4
Primary metal industries 9 7
Fabricated metal products, except machinery and transportation equipment
2 3
Industrial and commercial machinery and computer equipment
7 7
Electronic and other electrical equipment and components, except computer equipment
2 5
Transportation equipment 41 9
Miscellaneous manufacturing industries 1 3
Total 100 100
Source: BNDES and IBGE data.
Note: BNDES = Brazilian Development Bank, GDP = gross domestic product.

How
Can D
evelopment B
anks Boost Firm
s’ Productivity?
127
Table 9.2 Comparing Productivity of Granted and Nongranted Firms
Nongranted fi rms Granted fi rms
Year
Average
productivity
(R$)
Number
of fi rms
Year
granted
Number
of fi rms
Average
productivity
before (R$)
Productivity
premium
before
Productivity
in 2003 ($R)
Productivity
premiuma in
2003
Annual percent
increase in
productivity
premium
1996 51,357 21,533 1997 1,375 73,071 1.42 63,450 2.19 6
1997 57,440 20,815 1998 1,127 92,699 1.61 82,316 2.84 10
1998 50,123 22,510 1999 706 118,823 2.37 84,719 2.93 4
1999 53,034 23,143 2000 801 108,462 2.05 84,452 2.92 9
2000 43,829 23,284 2001 808 100,307 2.29 87,469 3.02 10
2003 28,949 23,159 Average 963 98,672 1.95 80,481 2.78 8
Source: Brazilian Statistical Institute and BNDES.a. “Productivity premium” of granted fi rms was calculated as the ratio of the average value added per worker of these fi rms to that of nongranted fi rms. A higher number indicates greater productivity.
128 Development Evaluation in Times of Turbulence
reports the average values of this variable for granted and nongranted fi rms in the years in which the former received their loans and in the last year of observation, 2003. The fi rst three columns present fi gures of non-granted fi rms, while information on granted loans is shown in the last six columns. For better understanding, a “productivity premium” of granted fi rms was calculated as the ratio of the average value added per worker of these fi rms to that of nongranted fi rms. A higher number indicates greater productivity.
Table 9.2 shows that granted fi rms are generally more productive than nongranted fi rms. One year before their loans were approved, the produc-tivity premium of granted fi rms ranged from 1.42 for fi rms granted in 1997 and 2.37 for those granted in 1999. On average, fi rms selected to be fi nanced were twice as productive as those not selected. Moreover, BNDES loans selected even more productive fi rms over the years, since the productivity premium increased from 1.42 to 2.29.14 On average, the productivity pre-mium of granted fi rms increased by 8 percent annually over nongranted fi rms (see last column).
Results from descriptive statistics seem consistent with the idea that BNDES fi nancial support has helped Brazilian fi rms relax their credit con-straints: granted fi rms performed 8 percent better annually than nongranted fi rms. However, this evidence may not survive closer econometric scrutiny, which will be presented in the next section.
Empirical Strategy
To assess the impact of BNDES schemes on fi rms’ performance, ideally one would compare granted and nongranted fi rms that are identical in all respects when loans were awarded to the former. Propensity score match-ing (PSM) allows one to pursue such an ideal comparison by matching each granted fi rm with a nongranted one exhibiting similar observable charac-teristics. This method artifi cially generates a “control group” of nongranted fi rms to be compared with the “treated group” of granted fi rms to assess the impact of “treatment” by BNDES schemes. The comparison can then be made in terms of productivity levels.
There are diff erent ways to implement PSM15; this chapter uses the Kernel method, which creates a counterfactual group by pairing each granted fi rm with all nongranted fi rms weighted by how similar they are. In other words, weights are allocated to nontreated fi rms according to how alike they are compared with supported fi rms. The main advantage of this
How Can Development Banks Boost Firms’ Productivity? 129
method is that all information in the sample can be used, which will lead to a control group with more than 15,000 fi rms.16
Matching is based on the following pretreatment characteristics: produc-tivity, age, number of employees, average salary of employees, market share, total revenues, percentage of highly skilled workers (at least undergraduate degree), sector, location, educational level of employees (years of school-ing), ratio of fi nancial costs over total revenues, ratio of exports over total revenue, ratio of imports of capital goods over investment, ratio of imports of intermediaries over cost of production, and multinational status.17
Although this method establishes a control group similar to the granted group in terms of observable characteristics, nonobservable character-istics might aff ect granted and control group performance diff erently. One example is the fi rms’ management. To control for unobservable time-invariant characteristics, evaluation of the treatment eff ect is performed by diff erences-in-diff erences according to the following specifi cation used in Bronzini and Blasio (2006):
y BNDES D BNDES POST Xit i t t t i t it ittt
= + ++ +∑∑β α γδ ε( ). , (7)
where yit is value added per employee, BNDESi is a dummy variable indicating whether the fi rm received any loan in the period of observation, Dt is a year dummy, POSTt is a set of dummies for each year after receiving the loan, and Xit is the vector of control variables. The parameter of inter-est is delta which estimated value measures the impact of BNDES schemes on fi rm productivity over time. The estimation of equation 7 allows one to assess not only whether BNDES loans aff ect fi rm productivity, but also when the impact materializes.
Before presenting the results, some additional comments are worth mentioning. One shortcoming of using value-added per worker is that it also captures improvements in productivity created by investments in capital. However, some controls are able to capture these things, such as capital imports and FINAME loans. The latter represent most of the improvements by domestic capital goods, since more than 80 percent of all manufacturing fi rms have fi nanced their capital investment by borrow-ing from FINAME during the period analyzed. The former represent all capital goods imported by any Brazilian fi rm at each year in this period. In other words, it is a record of how many capital goods were imported by any fi rm in every year during the period analyzed. Therefore, investments in capital goods are able to capture any increase in productivity not related to the investigated loans.

130 Development Evaluation in Times of Turbulence
A second issue worth discussing is that some fi rms were granted FINEM or Automatic BNDES loans more than once in the period of observation. Although more than 90 percent of all granted fi rms received only one loan, repeated treatments may distort the overall picture. To tackle this problem, any fi rm granted FINEM or Automatic BNDES loans more than once was removed from the sample to eliminate double treatment.
Last, but not least, control variables include various fi rm characteristics besides acquisition of capital goods: age, wage, number of employees, their skill and education levels, market share, revenues, fi nancial status, exports, intermediate imports, and multinational status.18
Empirical Results
To see where policy interventions may have a stronger impact, two chan-nels were explored: location of the project (poor or rich regions) and project size (small or large projects).19 Therefore, results presented in this paper show not only how these loans aff ect Brazilian manufacturing fi rms, but also whether the loans had a greater impact on small projects and/or whether fi rms in poor regions benefi ted more from these fi nancial supports.
The aim of PSM is to create a counterfactual group of nongranted fi rms (“control group”) that are identical in every respect to the granted fi rms (“treated group”) when they received loans (“treatment”). This method controls for potential nonlinearities in the relation between control vari-ables and fi rm productivity.
The implementation of PSM is not possible for all years. On the one hand, some time should be allowed to check the full eff ect of the treatment. Since Automatic BNDES and FINEM last for at least fi ve years,20 a period beyond a fi ve-year horizon should be allowed for impact. This period allows the model to check BNDES’ eff ects not only during but also after the treatment. Given the time spanned by our dataset (1996 to 2003), the impact period is clearly not feasible for loans granted from 1998 onward. On the other hand, to build the control group for fi rms treated in a certain year, one needs to have at least one previous year of observation for PSM. Hence, the impact of BNDES schemes can be scrutinized through PSM only for fi rms granted Automatic BNDES and FINEM loans in 1997, which therefore defi nes our treated group. Moreover, to avoid concerns regard-ing repeated treatment, all fi rms treated more than once from 1995 to 2003 were excluded. Lastly, the construction of the control group was based on
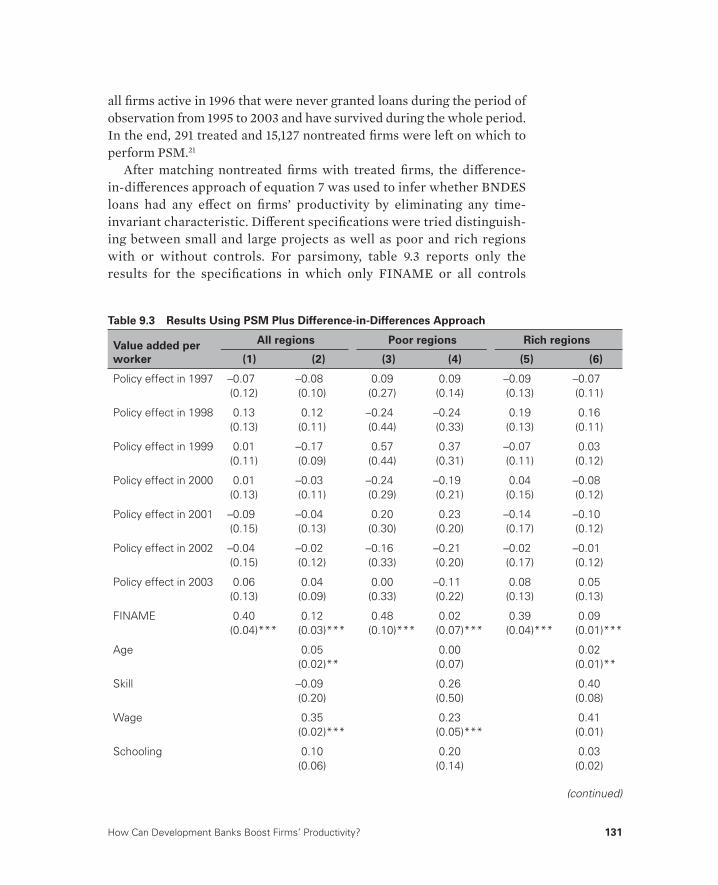
How Can Development Banks Boost Firms’ Productivity? 131
all fi rms active in 1996 that were never granted loans during the period of observation from 1995 to 2003 and have survived during the whole period. In the end, 291 treated and 15,127 nontreated fi rms were left on which to perform PSM.21
After matching nontreated fi rms with treated fi rms, the diff erence-in-diff erences approach of equation 7 was used to infer whether BNDES loans had any eff ect on fi rms’ productivity by eliminating any time-invariant characteristic. Diff erent specifi cations were tried distinguish-ing between small and large projects as well as poor and rich regions with or without controls. For parsimony, table 9.3 reports only the results for the specifi cations in which only FINAME or all controls
Table 9.3 Results Using PSM Plus Difference-in-Differences Approach
Value added per
worker
All regions Poor regions Rich regions
(1) (2) (3) (4) (5) (6)
Policy effect in 1997 –0.07 –0.08 0.09 0.09 –0.09 –0.07(0.12) (0.10) (0.27) (0.14) (0.13) (0.11)
Policy effect in 1998 0.13 0.12 –0.24 –0.24 0.19 0.16(0.13) (0.11) (0.44) (0.33) (0.13) (0.11)
Policy effect in 1999 0.01 –0.17 0.57 0.37 –0.07 0.03(0.11) (0.09) (0.44) (0.31) (0.11) (0.12)
Policy effect in 2000 0.01 –0.03 –0.24 –0.19 0.04 –0.08(0.13) (0.11) (0.29) (0.21) (0.15) (0.12)
Policy effect in 2001 –0.09 –0.04 0.20 0.23 –0.14 –0.10(0.15) (0.13) (0.30) (0.20) (0.17) (0.12)
Policy effect in 2002 –0.04 –0.02 –0.16 –0.21 –0.02 –0.01(0.15) (0.12) (0.33) (0.20) (0.17) (0.12)
Policy effect in 2003 0.06 0.04 0.00 –0.11 0.08 0.05(0.13) (0.09) (0.33) (0.22) (0.13) (0.13)
FINAME 0.40 0.12 0.48 0.02 0.39 0.09(0.04)*** (0.03)*** (0.10)*** (0.07)*** (0.04)*** (0.01)***
Age 0.05 0.00 0.02 (0.02)** (0.07) (0.01)**
Skill –0.09 0.26 0.40 (0.20) (0.50) (0.08)
Wage 0.35 0.23 0.41 (0.02)*** (0.05)*** (0.01)
Schooling 0.10 0.20 0.03 (0.06) (0.14) (0.02)
(continued)

132 Development Evaluation in Times of Turbulence
Number of employees
–0.62 –0.63 –0.59 (0.02)*** (0.03)*** (0.01)***
Market share 0.44 –11.22 1.42 (1.35) (5.34)** (1.81)
Revenues 0.72 0.78 0.66 (0.02)*** (0.03)*** (0.01)***
Financial status –0.70 –1.44 –0.53 (0.28)** (1.24) (0.05)***
Export 0.11 0.52 0.15 (0.07) (0.12)*** (0.04)***
Intermediaries import
0.19 0.79 0.01 (0.11)* (0.28)*** (0.07)
Capital import 0.19 0.48 0.11 (0.05)*** (0.14)*** (0.06)**
Number of observations 110,275 109,544 15,068 14,989 95,207 82,776R-squared 0.02 0.38 0.02 0.47 0.02 0.36
Note: Standard errors in parentheses.* signifi cant at 10%; ** signifi cant at 5%; *** signifi cant at 1%.
Table 9.3 (continued)
Value added per
worker
All regions Poor regions Rich regions
(1) (2) (3) (4) (5) (6)
are introduced. Rich and poor areas were considered jointly as well as separately.22
Most of the controls presented the expected sign. For example, the covariate variable used to capture FINAME was always positive and sig-nifi cant at the 1 percent level despite whether the fi rms were in rich or poor areas. Capital import is positive as well. These two results indicate that the control variables of investment in physical capital is reasonably captured by those measures. Therefore, the shortcoming of using only labor productiv-ity was overcome by using these measures. Moreover, results suggest that those controls appear to capture any improvement in productivity related to capital investments. Other controls, such as wages and revenues, present positive and expected signs at all regressions.
Focusing on BNDES loans, despite whether fi rms were in a poor or rich region, results show that no impact was found from those loans on fi rms’ productivity, since not a single parameter estimated appears diff erent from zero. It is important to notice that the impact was evaluated not only while
How Can Development Banks Boost Firms’ Productivity? 133
the project was implemented, but also some time after it was fi nished. It is assumed that all projects ended their implementation after fi ve years (the average loan duration), which enabled this study to see the impact two years after implementation was completed. Even considering this period, no sig-nifi cant result was found.
Similar outcomes were found when splitting the sample to diff erent project sizes, in other words, whether the project was large (FINEM) or small (Automatic BNDES). The only diff erence appeared to be regard-ing capital goods acquisition. Whereas small projects presented robust results related to domestic capital goods, large projects seemed to be more impacted by imported capital goods. This result is economically intuitive, since small projects are implemented more often by small- and medium-size fi rms; therefore, their projects can benefi t more from domestic capital. Learning how to deal with a national capital good might be easier for a Brazilian fi rm because it does not face translation costs and other costs involved in international commerce. Conversely, large projects are implemented by large fi rms, including multination-als, which have a lower cost to learn how to operate an imported capital good.
Theoretical Explanation
There are two type of explanations for the results: one theoretical and another based on the empirical results. Theoretical justifi cation is based on the Melitz model presented earlier, which shows that when govern-ment reduces proportionate R&D costs and production costs, both curves shift downward. Consequently, productivity level cut-off may remain at the same level. In other words, government might pursue an innocuous policy to boost productivity when both costs are subsidized. As the two fi nancial supports investigated in this chapter (FINEM and Automatic BNDES) reduce both costs, those loans end up not being able to impact positively fi rms’ productivity.
Another point should be emphasized related to the theoretical model. By reducing those costs, either isolated or jointly, the government increases market competition. When R&D cost is diminished, government policy induces a procompetitive eff ect in the economy so that more products are developed and only more successful projects are implemented. Conversely, if production costs are reduced, more fi rms are able to survive in the market and competition increases.

134 Development Evaluation in Times of Turbulence
In summary, reducing both R&D and production costs increases mar-ket competition, which leads to lower profi ts. There is a stylized fact in the Brazilian economy that value added in the manufacturing factor has dropped over the last years. Additionally, the number of manufacturing fi rms has increased steadily over the same period, according to PIA. Evidence from theory and stylized facts suggests that the eff ect of BNDES fi nancial support might be to increase competition in the manufacturing sector.
Explanation Based on Empirical Results
Another explanation for the results can be found in the empirical outcomes. The results suggest a positive relationship between productivity and capital goods acquisition. It might be that all labor productivity can be explained by the inclusion of new capital goods in the manufacturing process. The majority of FINEM and Automatic BNDES fi nancial supports encompass capital goods acquisition, not only domestic but also imported. Thus, pro-ductivity gains obtained by Brazilian fi rms might be related only to those capital goods.
This outcome is not an isolated case in the literature. Criscuolo and others (2007) investigated the eff ect on industrial policy in the United Kingdom and found no signifi cant impact on fi rms’ productivity, even though they found eff ects on employment and investment. Similar results were found by Ottaviano and Sousa (2008), who explain this result diff er-ently. In theoretical terms, they argue that some fi rms are implementing new technologies (higher fi xed costs to implement, but lower marginal costs) and other, old technologies (lower fi xed cost to implement, but higher marginal costs). When government reduces implementation of both technology types, a null eff ect occurs as shown in this chapter.
Additionally, Ottaviano and Sousa (2008) mentioned the existence of two time issues, one before and another after the loan itself, which might help explain the result (of no impact). Major adjustments to become more productive may have occurred before applying for fi nancial support, since BNDES policies select mainly successful enterprises, as table 9.2 reports. Therefore, fi rms might have already become more productive in order to be eligible for this fi nancial support. After getting it, their performance did not change substantially. As a result, BNDES eff ect on fi rms’ productivity might be prior to the announcement of the loan approval. Conversely, ex-post eval-uation of similar institutions, such as in the European Bank for Reconstruc-tion and Development, occurs only two years after the end of any project, as pointed out in EBRD (2006). In order words, it might be too soon to see any impact on fi rms’ productivity within two years after the project has fi nished.
How Can Development Banks Boost Firms’ Productivity? 135
Concluding Remarks
This chapter has evaluated how government support might aff ect fi rms’ productivity not only theoretically but also empirically. In the theoretical approach, government support might have diff erent eff ects in fi rms’ pro-ductivity: negative, positive, or even null. The crucial point is which type of cost is considered. If it is production cost, the eff ect of government loans on productivity is negative. However, when government loans help reduce R&D cost to launch a new good to the market, there is a positive impact. When government reduces both types of cost, the net eff ect might be null.
Based on a theoretical model, an empiric investigation was carried out for two BNDES loans: FINEM and Automatic BNDES. Overall, granted fi rms performed better after receiving BNDES loans. On average, fi rms improved their productivity by 8 percent annually after being treated compared with nontreated fi rms. However, there is no robust evidence that those improve-ments in productivity were related to government policies, as found in simi-lar papers, such as Ottaviano and Sousa (2008) and Criscuolo and others (2007). One explanation is that acquisition of capital goods (either domestic or imported) related to those loans captured all productivity gains. Theo-retically, one justifi cation might be that government is reducing both imple-mentation costs: R&D and production. For policy implications, emphasis should be given to reduce R&D sunk costs. When the government provides incentives for innovative projects, more fi rms decide to create a new product.Therefore, overall productivity rises due to a more competitive and innovative market.
Further conclusions can be reached. Initially, as fi rms perform better after receiving a loan, the economic aspects of each project appear to be relevant as one criterion decision for loans approval. As they are identical to nongranted fi rms and they are performing similarly, then perhaps the cri-terion decision on selecting projects does not focus entirely on economic issues. Other issues, such as social, regional, and environmental impacts, might be as important as economic aspects (or perhaps even more so) in project selection, due to the amenities that each project creates.
This “no treatment eff ect” results may be similar to the controver-sial issue of educational grants, in which academics question whether scholarships improve research quality or more highly skilled research-ers are selected for fi nancial support. Regardless, further work should be pursued to investigate whether these loans can eventually impact fi rms’ productivity, especially by using total factor productivity instead of labor productivity.
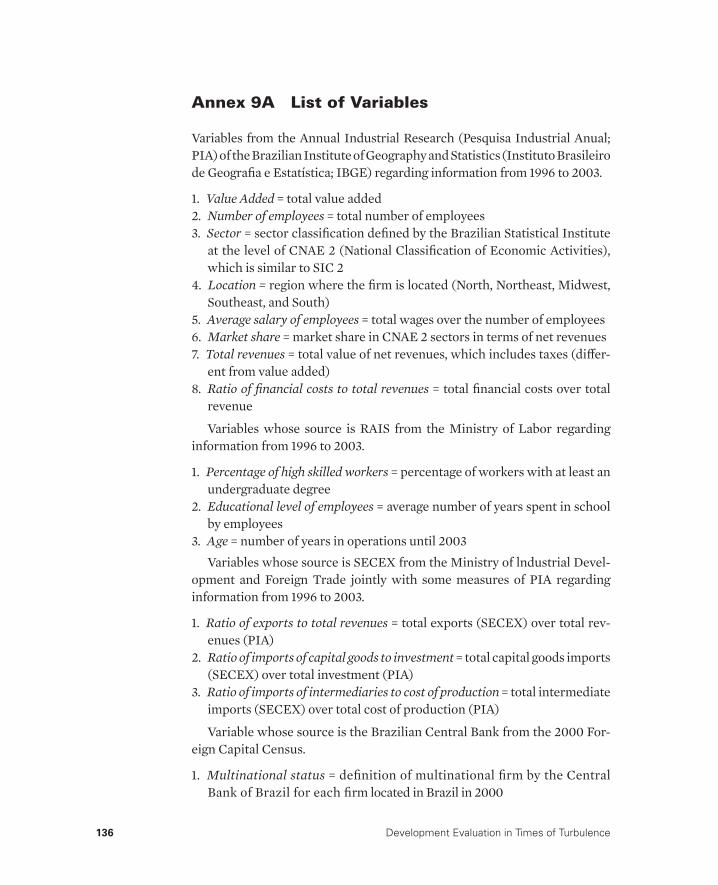
136 Development Evaluation in Times of Turbulence
Annex 9A List of Variables
Variables from the Annual Industrial Research (Pesquisa Industrial Anual; PIA) of the Brazilian Institute of Geography and Statistics (Instituto Brasileiro de Geografi a e Estatística; IBGE) regarding information from 1996 to 2003.
1. Value Added = total value added2. Number of employees = total number of employees3. Sector = sector classifi cation defi ned by the Brazilian Statistical Institute
at the level of CNAE 2 (National Classifi cation of Economic Activities), which is similar to SIC 2
4. Location = region where the fi rm is located (North, Northeast, Midwest, Southeast, and South)
5. Average salary of employees = total wages over the number of employees6. Market share = market share in CNAE 2 sectors in terms of net revenues7. Total revenues = total value of net revenues, which includes taxes (diff er-
ent from value added)8. Ratio of fi nancial costs to total revenues = total fi nancial costs over total
revenue
Variables whose source is RAIS from the Ministry of Labor regarding information from 1996 to 2003.
1. Percentage of high skilled workers = percentage of workers with at least an undergraduate degree
2. Educational level of employees = average number of years spent in school by employees
3. Age = number of years in operations until 2003Variables whose source is SECEX from the Ministry of lndustrial Devel-
opment and Foreign Trade jointly with some measures of PIA regarding information from 1996 to 2003.
1. Ratio of exports to total revenues = total exports (SECEX) over total rev-enues (PIA)
2. Ratio of imports of capital goods to investment = total capital goods imports (SECEX) over total investment (PIA)
3. Ratio of imports of intermediaries to cost of production = total intermediate imports (SECEX) over total cost of production (PIA)
Variable whose source is the Brazilian Central Bank from the 2000 For-eign Capital Census.
1. Multinational status = defi nition of multinational fi rm by the Central Bank of Brazil for each fi rm located in Brazil in 2000

How Can Development Banks Boost Firms’ Productivity? 137
Annex 9B Further Results
(continued)
Table 9B.1 Results for Small Projects in Method 5
Dependent
variable All regions Poor regions Rich regions
Value added per
worker (1) (2) (3) (4) (5) (6)
Policy effect in 1997 –0.07 –0.07 0.04 0.10 –0.08 –0.09(0.10) (0.07) (0.28) (0.13) (0.11) (0.11)
Policy effect in 1998 0.09 0.07 –0.09 –0.07 0.10 0.09(0.10) (0.08) (0.29) (0.15) (0.11) (0.11)
Policy effect in 1999 0.06 0.06 0.06 –0.01 0.06 0.06(0.09) (0.06) (0.32) (0.19) (0.10) (0.12)
Policy effect in 2000 –0.11 –0.14 0.13 0.03 –0.13 –0.14(0.11) (0.08)* (0.33) (0.22) (0.11) (0.12)
Policy effect in 2001 –0.03 0.02 –0.02 0.04 –0.03 0.00(0.12) (0.10) (0.32) (0.17) (0.13) (0.12)
Policy effect in 2002 –0.07 –0.07 –0.03 –0.10 –0.07 –0.06(0.11) (0.09) (0.33) (0.17) (0.12) (0.12)
Policy effect in 2003 0.08 0.08 0.08 –0.13 0.08 0.07(0.10) (0.07) (0.35) (0.21) (0.11) (0.13)
FINAME 0.46 0.05 0.22 –0.15 0.49 0.09(0.04)*** (0.03)* (0.09)*** (0.06)** (0.04)*** (0.02)***
Age 0.03 0.00 0.04 (0.02) (0.07) (0.02)*
Skill 0.22 0.26 0.37 (0.17) (0.50) (0.17)**
Wage 0.38 0.23 0.30 (0.03)*** (0.05)*** (0.03)
Schooling 0.01 0.20 –0.06 (0.05) (0.14) (0.06)
Number of employees
–0.63 –0.63 –0.63 (0.02)*** (0.03)*** (0.02)***
Market share 1.29 –11.22 –1.82 (1.02) (5.34)** (1.72)
Revenues 0.70 0.78 0.73 (0.02)*** (0.03)*** (0.02)***
Financial status –0.25 –1.44 –0.18 (0.25) (1.24) (0.15)
Export 0.35 0.52 0.13 (0.05)*** (0.12)*** (0.07)***

138 Development Evaluation in Times of Turbulence
Intermediaries import
–0.76 0.79 –1.59 (0.60)*** (0.28)*** (0.20)***
Capital import 0.04 0.48 0.00 (0.07) (0.14)*** (0.11)
FINEM 1.02 –0.01 1.16 0.48 1.01 0.21(0.04)*** (0.02) (0.17)*** (0.14)*** (0.04)*** (0.05)
Number of Obs. 12,172 12,132 1,355 1,352 10,817 10,780R-squared 0.06 0.50 0.07 0.69 0.06 0.50
Notes: Standard errors in parentheses.* signifi cant at I0%; ** signifi cant at 5%; *** signifi cant at I%. Columns (1), (3), and (5) show results using only FINAME and FINEM dummy as controls. Columns (2), (4), and (6) present outcomes using all controls.
Table 9B.1 (continued)
Dependent
variable All regions Poor regions Rich regions
Value added per
worker (1) (2) (3) (4) (5) (6)
Table 9B.2 Results for Large Projects in Method 5
Dependent variable All regions Poor regions Rich regions
Value added per
worker (1) (2) (3) (4) (5) (6)
Policy effect in 1997 0.07 0.00 –0.05 –0.49 0.08 0.08(0.30) (0.09) (1.15) (0.11)* (0.30) (0.38)
Policy effect in 1998 –0.03 –0.06 0.30 0.16 –0.07 –0.04(0.30) (0.11) (0.86) (0.13) (0.32) (0.38)
Policy effect in 1999 0.08 0.03 –0.47 –0.08 0.14 0.14(0.35) (0.21) (0.82) (0.19) (0.37) (0.42)
Policy effect in 2000 –0.11 –0.06 –2.14 –1.74 0.20 0.17(0.41) (0.36) (1.17)* (1.32) (0.38) (0.44)
Policy effect in 2001 0.27 0.19 1.82 1.69 0.02 0.00(0.38) (0.31) (1.13) (1.31) (0.35) (0.45)
Policy effect in 2002 –0.31 –0.16 0.29 0.08 –0.40 –0.28(0.37) (0.14) (1.05) (0.32) (0.39) (0.45)
Policy effect in 2003 0.12 0.00 –0.11 –0.13 0.15 –0.04(0.37) (0.14) (1.17) (0.32) (0.38) (0.44)
FINAME 0.01 0.02 0.42 –0.01 –0.02 0.00(0.07) (0.04) (0.16)*** (0.06) (0.06) (0.02)
(continued)
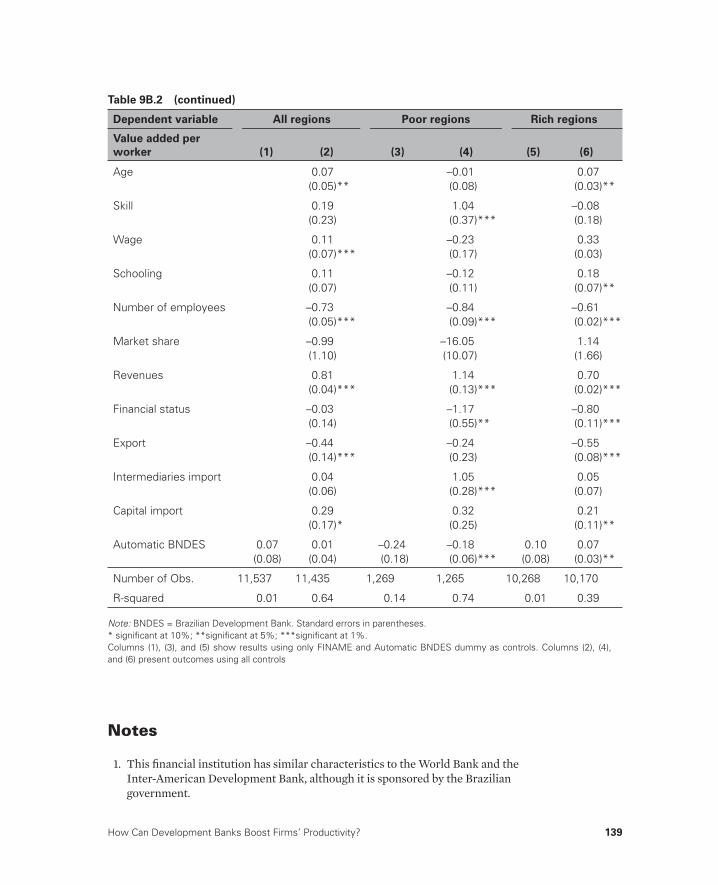
How Can Development Banks Boost Firms’ Productivity? 139
Notes
1. This fi nancial institution has similar characteristics to the World Bank and the Inter-American Development Bank, although it is sponsored by the Brazilian government.
Age 0.07 –0.01 0.07 (0.05)** (0.08) (0.03)**
Skill 0.19 1.04 –0.08 (0.23) (0.37)*** (0.18)
Wage 0.11 –0.23 0.33 (0.07)*** (0.17) (0.03)
Schooling 0.11 –0.12 0.18 (0.07) (0.11) (0.07)**
Number of employees –0.73 –0.84 –0.61 (0.05)*** (0.09)*** (0.02)***
Market share –0.99 –16.05 1.14 (1.10) (10.07) (1.66)
Revenues 0.81 1.14 0.70 (0.04)*** (0.13)*** (0.02)***
Financial status –0.03 –1.17 –0.80 (0.14) (0.55)** (0.11)***
Export –0.44 –0.24 –0.55 (0.14)*** (0.23) (0.08)***
Intermediaries import 0.04 1.05 0.05 (0.06) (0.28)*** (0.07)
Capital import 0.29 0.32 0.21 (0.17)* (0.25) (0.11)**
Automatic BNDES 0.07 0.01 –0.24 –0.18 0.10 0.07(0.08) (0.04) (0.18) (0.06)*** (0.08) (0.03)**
Number of Obs. 11,537 11,435 1,269 1,265 10,268 10,170
R-squared 0.01 0.64 0.14 0.74 0.01 0.39
Note: BNDES = Brazilian Development Bank. Standard errors in parentheses.* signifi cant at 10%; **signifi cant at 5%; ***signifi cant at 1%.Columns (1), (3), and (5) show results using only FINAME and Automatic BNDES dummy as controls. Columns (2), (4), and (6) present outcomes using all controls
Table 9B.2 (continued)
Dependent variable All regions Poor regions Rich regions
Value added per
worker (1) (2) (3) (4) (5) (6)
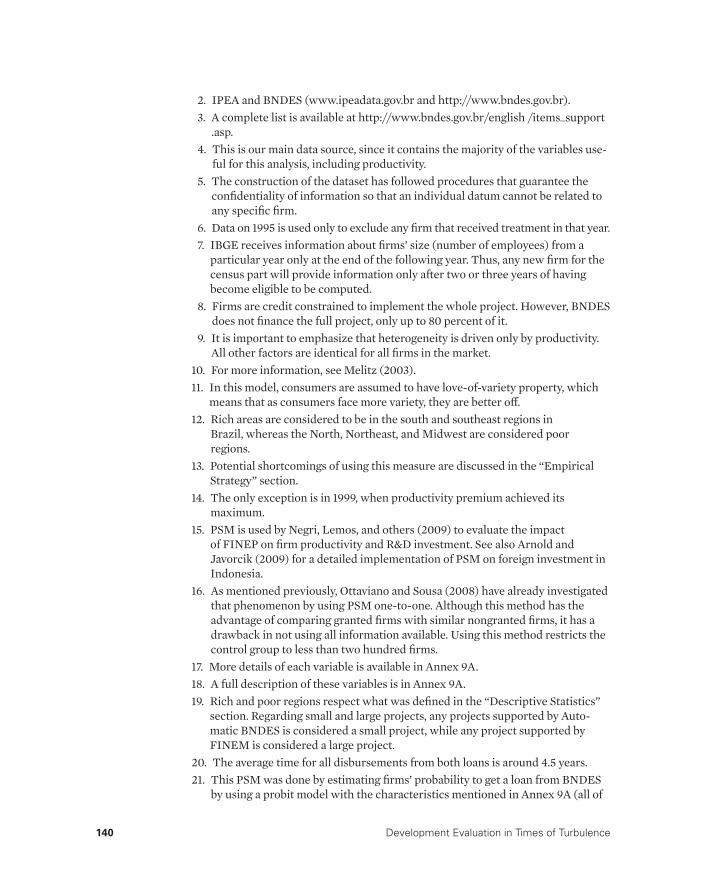
140 Development Evaluation in Times of Turbulence
2. IPEA and BNDES (www.ipeadata.gov.br and http://www.bndes.gov.br). 3. A complete list is available at http://www.bndes.gov.br/english /items_support
.asp. 4. This is our main data source, since it contains the majority of the variables use-
ful for this analysis, including productivity. 5. The construction of the dataset has followed procedures that guarantee the
confi dentiality of information so that an individual datum cannot be related to any specifi c fi rm.
6. Data on 1995 is used only to exclude any fi rm that received treatment in that year. 7. IBGE receives information about fi rms’ size (number of employees) from a
particular year only at the end of the following year. Thus, any new fi rm for the census part will provide information only after two or three years of having become eligible to be computed.
8. Firms are credit constrained to implement the whole project. However, BNDES does not fi nance the full project, only up to 80 percent of it.
9. It is important to emphasize that heterogeneity is driven only by productivity. All other factors are identical for all fi rms in the market.
10. For more information, see Melitz (2003).11. In this model, consumers are assumed to have love-of-variety property, which
means that as consumers face more variety, they are better off . 12. Rich areas are considered to be in the south and southeast regions in
Brazil, whereas the North, Northeast, and Midwest are considered poor regions.
13. Potential shortcomings of using this measure are discussed in the “Empirical Strategy” section.
14. The only exception is in 1999, when productivity premium achieved its maximum.
15. PSM is used by Negri, Lemos, and others (2009) to evaluate the impact of FINEP on fi rm productivity and R&D investment. See also Arnold and Javorcik (2009) for a detailed implementation of PSM on foreign investment in Indonesia.
16. As mentioned previously, Ottaviano and Sousa (2008) have already investigated that phenomenon by using PSM one-to-one. Although this method has the advantage of comparing granted fi rms with similar nongranted fi rms, it has a drawback in not using all information available. Using this method restricts the control group to less than two hundred fi rms.
17. More details of each variable is available in Annex 9A.18. A full description of these variables is in Annex 9A.19. Rich and poor regions respect what was defi ned in the “Descriptive Statistics”
section. Regarding small and large projects, any projects supported by Auto-matic BNDES is considered a small project, while any project supported by FINEM is considered a large project.
20. The average time for all disbursements from both loans is around 4.5 years.21. This PSM was done by estimating fi rms’ probability to get a loan from BNDES
by using a probit model with the characteristics mentioned in Annex 9A (all of
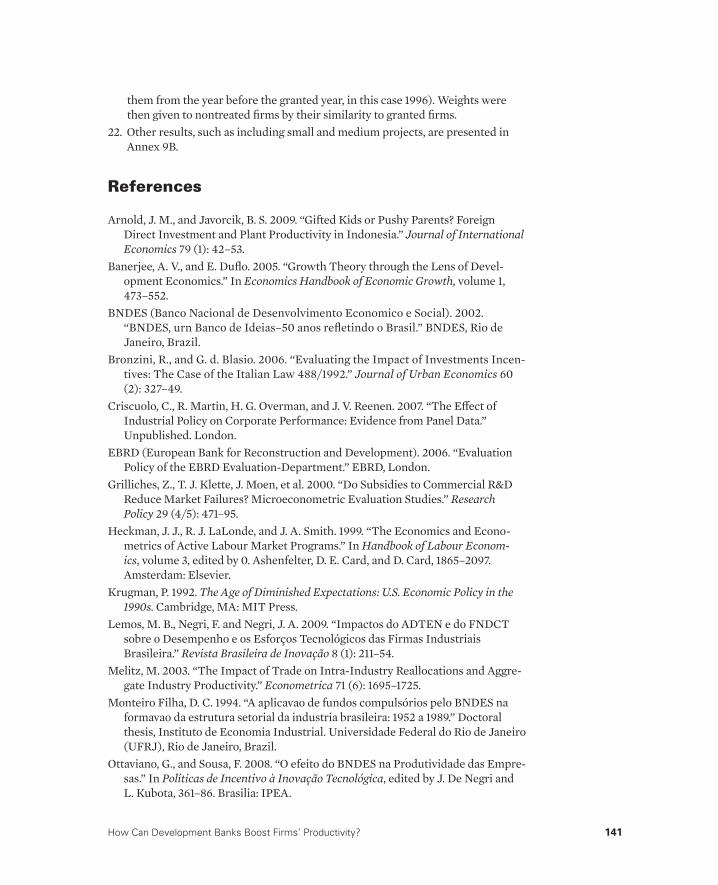
How Can Development Banks Boost Firms’ Productivity? 141
them from the year before the granted year, in this case 1996). Weights were then given to nontreated fi rms by their similarity to granted fi rms.
22. Other results, such as including small and medium projects, are presented in Annex 9B.
References
Arnold, J. M., and Javorcik, B. S. 2009. “Gifted Kids or Pushy Parents? Foreign Direct Investment and Plant Productivity in Indonesia.” Journal of International Economics 79 (1): 42–53.
Banerjee, A. V., and E. Dufl o. 2005. “Growth Theory through the Lens of Devel-opment Economics.” In Economics Handbook of Economic Growth, volume 1, 473–552.
BNDES (Banco Nacional de Desenvolvimento Economico e Social). 2002. “BNDES, urn Banco de Ideias–50 anos refl etindo o Brasil.” BNDES, Rio de Janeiro, Brazil.
Bronzini, R., and G. d. Blasio. 2006. “Evaluating the Impact of Investments Incen-tives: The Case of the Italian Law 488/1992.” Journal of Urban Economics 60 (2): 327–49.
Criscuolo, C., R. Martin, H. G. Overman, and J. V. Reenen. 2007. “The Eff ect of Industrial Policy on Corporate Performance: Evidence from Panel Data.” Unpublished. London.
EBRD (European Bank for Reconstruction and Development). 2006. “Evaluation Policy of the EBRD Evaluation-Department.” EBRD, London.
Grilliches, Z., T. J. Klette, J. Moen, et al. 2000. “Do Subsidies to Commercial R&D Reduce Market Failures? Microeconometric Evaluation Studies.” Research Policy 29 (4/5): 471–95.
Heckman, J. J., R. J. LaLonde, and J. A. Smith. 1999. “The Economics and Econo-metrics of Active Labour Market Programs.” In Handbook of Labour Econom-ics, volume 3, edited by 0. Ashenfelter, D. E. Card, and D. Card, 1865–2097. Amsterdam: Elsevier.
Krugman, P. 1992. The Age of Diminished Expectations: U.S. Economic Policy in the 1990s. Cambridge, MA: MIT Press.
Lemos, M. B., Negri, F. and Negri, J. A. 2009. “Impactos do ADTEN e do FNDCT sobre o Desempenho e os Esforços Tecnológicos das Firmas Industriais Brasileira.” Revista Brasileira de Inovação 8 (1): 211–54.
Melitz, M. 2003. “The Impact of Trade on Intra-Industry Reallocations and Aggre-gate Industry Productivity.” Econometrica 71 (6): 1695–1725.
Monteiro Filha, D. C. 1994. “A aplicavao de fundos compulsórios pelo BNDES na formavao da estrutura setorial da industria brasileira: 1952 a 1989.” Doctoral thesis, Instituto de Economia Industrial. Universidade Federal do Rio de Janeiro (UFRJ), Rio de Janeiro, Brazil.
Ottaviano, G., and Sousa, F. 2008. “O efeito do BNDES na Produtividade das Empre-sas.” In Políticas de Incentivo à Inovação Tecnológica, edited by J. De Negri and L. Kubota, 361–86. Brasilia: IPEA.

142 Development Evaluation in Times of Turbulence
Pereira, R. 0. 2007. “Avao do BNDES sobre o emprego formal: Efeito nas empresas fi nanciadas.” Revista do BNDES 14 (27): 27–42.
Puga, F. P., and E. T. Torres Filho. 2006. “Empresas apoiadas pelo BNDES geram mais empregos e pagam mais.” Visão do Desenvolvimento 17: 117.
Reiff , L. 0. d. A., L.H.R. Rocha, and G. A. G. d. Santos. 2007. “Emprego formal, quali-dade de vida eo papel do BNDES.” Revista do BNDES 14 (27): 5–26.
Sousa, F. L. d. 2003. “0 papel do BNDES na distribuivao geognifi ca da industria de Transformavao.” Revista do BNDES I 0 (19): 3–20.
Terra, M. C. T. 2003. “Credit Constraints in Brazilian Firms: Evidence from Panel Data.” Revista Brasileira de Economia 57 (2): 443–64.

PART THREE: IMPLICATIONS OF TURBULENT TIMES FOR BUILDING MONITORING AND EVALUATION CAPACITY

145
A Proposed Framework to Understand Civil Society Organizations’ Involvement in M&EMarie Gildemyn
Overview
The aim of this chapter1 is to increase our understanding of civil society organizations2 (CSOs) involvement in monitoring and evaluation (M&E), especially in aid-dependent, developing countries. As a fi rst step, the two main functions of M&E, accountability and feedback/learning, are unpacked relying on a broad and diverse range of literature across disci-plines. The most relevant elements discussed in this review are integrated within a conceptual framework proposed at the end of the chapter. This framework not only aims to improve our understanding of CSOs’ involve-ment in M&E, but could also inform future capacity-building initiatives for CSOs.
CHAPTER 10
146 Development Evaluation in Times of Turbulence
Introduction: M&E in the Current Aid Architecture
In the late 1990s, a new approach to aid emerged constructed around the principles of ownership, participation, harmonization, alignment, and results-based management (RBM). Important building blocks of this new aid architecture are the International Monetary Fund’s Poverty Reduction Strategy Papers (PRSPs), the Paris Declaration (OECD/DAC 2005), the Accra Agenda for Action (OECD/DAC 2008), and the more recent Busan Partnership Agreement (OECD/DAC 2011). The shift in thinking, combined with the adoption of new aid modalities, such as general and sector budget support, have had enormous consequences for the M&E systems of both donors and governments. Because donors have been moving away from an ex-ante type of conditionality toward an ex-post type of conditionality, in which aid is based on a proven record of progress and results, country-led M&E systems have been subjected to an ambitious reform agenda (Holvoet and Renard 2007).
To respond to the new challenges, developing countries have been asked to better defi ne and elaborate their national M&E systems, to make them more results-oriented and robust, and to allow participation of nonstate actors, including CSOs. Conversely, donors have been asked to harmo-nize and align their own M&E systems with each country’s M&E system to reduce the country’s administrative burden. National M&E systems thus have two main functions:
• To be accountable, particularly at the domestic level, to ensure the imple-mentation of (pro-poor) policies and programs
• To provide feedback to support “the realization of results-oriented, iterative and evidence-based policy-making” (Holvoet and Rombouts 2008, 579).
The initial emphasis on broad-based participation within the M&E sys-tems was motivated by three assumptions: fi rst, that the involvement of CSOs would improve domestic accountability, which refers to the accountabil-ity relations between the government and its citizens (Hickey and Mohan 2008); second, that CSOs would have a comparative advantage because, compared with external evaluators, they are closer to the local community and able to monitor over longer periods of time, especially at decentralized levels (Goetz and Jenkins 2001); and last, that CSOs would have sound expe-rience in the use of participatory and qualitative M&E tools, which would complement the quantitative approach that dominates most offi cial M&E systems (Prennushi and others 2002).
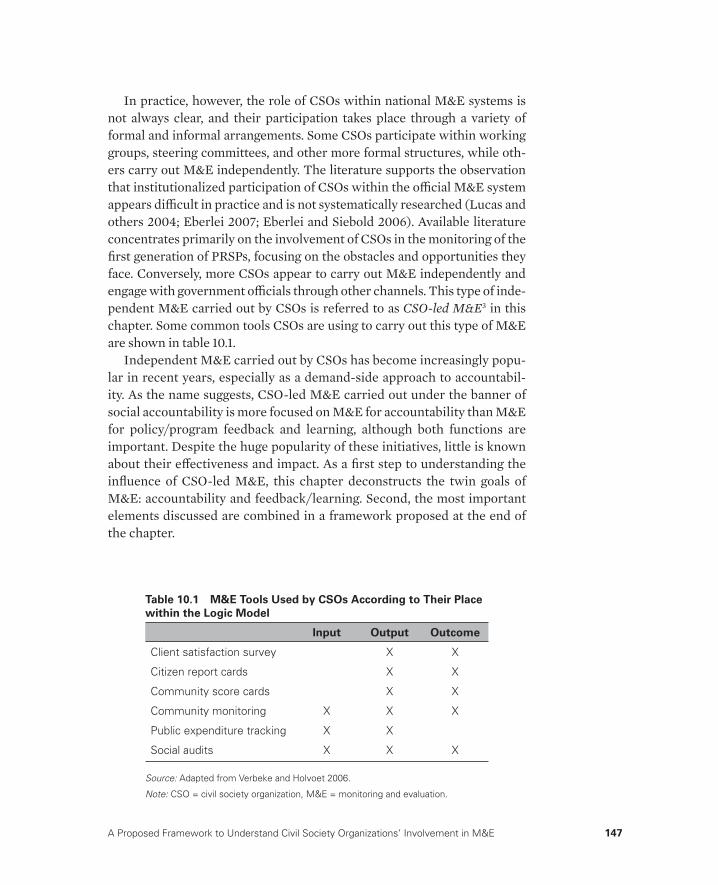
A Proposed Framework to Understand Civil Society Organizations’ Involvement in M&E 147
In practice, however, the role of CSOs within national M&E systems is not always clear, and their participation takes place through a variety of formal and informal arrangements. Some CSOs participate within working groups, steering committees, and other more formal structures, while oth-ers carry out M&E independently. The literature supports the observation that institutionalized participation of CSOs within the offi cial M&E system appears diffi cult in practice and is not systematically researched (Lucas and others 2004; Eberlei 2007; Eberlei and Siebold 2006). Available literature concentrates primarily on the involvement of CSOs in the monitoring of the fi rst generation of PRSPs, focusing on the obstacles and opportunities they face. Conversely, more CSOs appear to carry out M&E independently and engage with government offi cials through other channels. This type of inde-pendent M&E carried out by CSOs is referred to as CSO-led M&E3 in this chapter. Some common tools CSOs are using to carry out this type of M&E are shown in table 10.1.
Independent M&E carried out by CSOs has become increasingly popu-lar in recent years, especially as a demand-side approach to accountabil-ity. As the name suggests, CSO-led M&E carried out under the banner of social accountability is more focused on M&E for accountability than M&E for policy/program feedback and learning, although both functions are important. Despite the huge popularity of these initiatives, little is known about their eff ectiveness and impact. As a fi rst step to understanding the infl uence of CSO-led M&E, this chapter deconstructs the twin goals of M&E: accountability and feedback/learning. Second, the most important elements discussed are combined in a framework proposed at the end of the chapter.
Table 10.1 M&E Tools Used by CSOs According to Their Place
within the Logic Model
Input Output Outcome
Client satisfaction survey X X
Citizen report cards X X
Community score cards X X
Community monitoring X X X
Public expenditure tracking X X
Social audits X X X
Source: Adapted from Verbeke and Holvoet 2006.
Note: CSO = civil society organization, M&E = monitoring and evaluation.
148 Development Evaluation in Times of Turbulence
Unpacking the Accountability Function of M&E
This section examines how CSO-led M&E can contribute to accountability. The link between CSO-led M&E and accountability is clearest in the con-cept of social accountability, in which CSOs use M&E tools combined with other activities, such as advocacy and policy education to demand account-ability from public offi cials and/or service providers. Before examining this link, it is important to deconstruct or unpack the concept of accountability, and to briefl y discuss how accountability has been conceptualized in devel-opment discourse.
What Is Accountability?
The concept of accountability has become increasingly popular in recent years. More than 100 diff erent defi nitions and types of accountability have been reported in the literature (Lindberg 2009), which has contributed to a loss of meaning and fuzziness. Despite the conceptual cacophony, the ulti-mate goal of accountability remains the same: to keep power under control and prevent abuses.
Within the development discourse, accountability has become a buzz-word and is often portrayed as the new panacea for failures in service deliv-ery and weak development outcomes. This trend can be witnessed through key publications such as the World Development Report on improving public service delivery (World Bank 2004), the importance of accountability in the second generation of PRSPs (Hickey and Mohan 2008), and the increasing emphasis on social accountability (Malena and others 2004; McNeil and Malena 2010). Further, many donor discourses have emphasized the impor-tance of accountability to help realize good governance, public sector reform, and, ultimately, democracy (Lindberg 2009; Newell and Bellour 2002).
To create some clarity, Lindberg (2009, 8) proposed a defi nition of account-ability that captures the core characteristics of any form of accountability:
• An agent or institution who is to give an account (A for agent)• An area, responsibilities, or domain subject to accountability (D for
domain)• An agent or institution P to whom A is to give account (P for principal)• The right of P to require A to inform and explain/justify decisions with
regard to D• The right of P to sanction A if A fails to inform and/or explain/justify
decisions with regard to 0.
A Proposed Framework to Understand Civil Society Organizations’ Involvement in M&E 149
The last two characteristics in this defi nition refer to the two dimen-sions of accountability, which are answerability and enforceability, as proposed by Schedler (1999). Answerability refers to the fact that account-ing agents can ask power holders to provide information about their past or future actions and decisions (transparency) and their reasons for doing so ( justifi cation). “Accountability thus involves the right to receive infor-mation and the corresponding obligation to release all necessary details” (Schedler 1999, 15). Receiving information not only refers to obtaining data and evidence, for example, through monitoring, but also to reasoning and argumentation. Enforceability refers to the capacity to impose sanctions, or to the act of punishing the powerful if they fail to live up to their promises or if they engage in unlawful activities (Schedler 1999).4 The distinction between these dimensions is important because the concept of answer-ability is often confl ated with the concept of accountability. Without the element of enforceability or without the threat of sanction, one cannot talk about full accountability. Enforceability, thus, requires the presence of accounting actors that have enough power and/or autonomy to impose sanctions. As will be discussed, CSOs usually lack the power, legitimacy, and capacity to meet this dimension of accountability.
Although Schedler (1999) mentions that the concept of enforceabil-ity refers to both “rewarding” and “punishing,” he and other authors (O’Donnell 1999; Rubenstein 2007) emphasize the element of sanction. If the goal of enforceability and accountability in general is to ensure that public offi cials and other actors comply with established rules, then the focus should be on creating the right incentive structure rather than on punishment alone. Ackerman (2005, 13) expresses this more nuanced version when he mentions, “The best accountability system is one that includes both punishments and rewards so that public offi cials have strong incentives both not to break the rules and to perform at their maximum capacity.” In a similar way, Brett (2003) points out that for institutions to be accountable and perform well, both strong incentives and a real threat of sanction need to be present.
Moving away from the defi nition of accountability toward its typology, a common distinction is made between horizontal and vertical accountabil-ity. Vertical accountability can be described as the use of external mecha-nisms by nonstate (external) actors to hold policymakers to account (Goetz and Jenkins 2001). In vertical accountability, the relationship between the accountability holders and the power wielders is unequal. The most conven-tional mechanism used in vertical accountability is elections, where citizens (less powerful) can sanction or reward the current government for its past performance. Other examples are exposure of public offi cials’ wrongdoing

150 Development Evaluation in Times of Turbulence
in the media and government lobbying. Taking into account the direction of accountability between the more powerful and the less powerful, one can talk about upward (vertical) accountability or downward (vertical) account-ability. Within the aid context, upward accountability is used when govern-ments or nongovernmental organizations (NGOs) are accountable toward donors, while downward accountability, also called domestic accountability, refers to eff orts by government to become more accountable to its citizens.
Conversely, horizontal accountability occurs between actors with equal power. Because power is not easily measurable, Schedler (1999, 26) proposes to “translate” equal power by looking at the level of autonomy or the degree of mutual independence between the actors in question. 0’Donnell (1999, 38) defi nes horizontal accountability as: “The existence of state agencies that are legally enabled and empowered, and factually willing and able, to take actions that span from routine oversight to criminal sanctions or agen-cies of the state that may be qualifi ed as unlawful.” His defi nition implies that within horizontal accountability there is no room for nonstate, external actors to participate directly in accountability initiatives. His narrow defi ni-tion has given rise to debate among scholars and has ultimately led to the emergence of a new notion, in which CSOs are able to play a more promi-nent role.
CSO-led M&E and Accountability
Traditionally, the role of civil society in accountability has been located in the vertical axis. Through elections, lobbying, and other mechanisms, CSOs are able to hold governments accountable for their past performance. Nevertheless, several authors (Peruzzotti and Smulovitz 2006; Goetz and Jenkins 2005) have highlighted the weakness of voting as an instrument of accountability because of various imperfections such as information asymmetry and corruption. In addition, horizontal accountability mecha-nisms are defi cient in many developing countries (O’Donnell 1999). New approaches toward accountability that rely on civil society engagement have gained prominence as a way to increase domestic accountability. Called hybrid or diagonal accountability, these approaches all “challenge the vertical– horizontal dichotomy on which understandings of accountability have been based” (Goetz and Jenkins 2001, 364). Goetz and Jenkins (2001), for example, point out that some CSOs engage in performance monitoring and fi nancial auditing activities that are traditionally carried out by actors within the horizontal accountability axis (Goetz and Jenkins 2001, 365). Other authors (Newell and Bellour 2002; O’Donnell 1999) have pointed out that the presence of strong CSOs within the vertical accountability axis

A Proposed Framework to Understand Civil Society Organizations’ Involvement in M&E 151
can stimulate horizontal accountability agencies to take action. For exam-ple, in Latin America, Peruzzotti and Smulovitz (2006, 10) studied how civil society and media organizations are able to “monitor public offi cials, expose governmental wrongdoing, and [can] activate the operation of hori-zontal agencies” through the use of both institutional and noninstitutional channels. Following their monitoring activities, these CSOs can apply soft sanctions, such as exposure in the media, or trigger the response of for-mal horizontal accountability agencies that have the capacity to enforce legal sanctions. This hybrid accountability has been called societal or social accountability by these authors.
In more recent years, the concept of social accountability has gained prominence and has been adopted and actively promoted by various donors, including the World Bank (2012) through its Global Partnership for Social Accountability (GSPA). The defi nition has also broadened over the years, sparking critiques from certain authors about the increasing fuzziness surrounding the concept (for example, Joshi and Houtzager 2012). Originally, Malena and others (2004, 3) defi ned social accountabil-ity as, “an approach towards building accountability that relies on civic engagement, that is, in which it is ordinary citizens and/or civil society organizations who participate directly or indirectly in exacting account-ability.” It is important to understand that social accountability initiatives encompass a broad range of activities initiated by various actors using vari-ous strategies. Examples of social accountability initiatives include CSOs involved in policy advocacy, budget literacy, civic education, and lobbying and coalition building, among others (Malena and McNeil 2010). The U. K. Department for International Development (DFID) proposed a diff erent classifi cation with the various stages of the accountability process at which CSOs can engage (see box 10.1). This chapter particularly addresses CSOs that are involved in the “investigation” phase and that are using M&E tools to “assess” government’s performance and/or compliance with previously established standards.
Although new social accountability initiatives are mushrooming across the globe and funding for these initiatives is growing, little sound evidence of their eff ectiveness or impact is available. Several small case studies and some impact evaluations on the eff ect of social accountability initiatives have been done, but large-scale comparative studies are still lacking. An exception is the large-scale research in which McGee and Gaventa (2011) review various studies5 on the eff ectiveness and the impact of such ini-tiatives and try to identify contributing factors. Their results suggest that evidence about eff ectiveness and impact of such initiatives is uneven and inconclusive, sometimes even contradictory. Most accountability initiatives
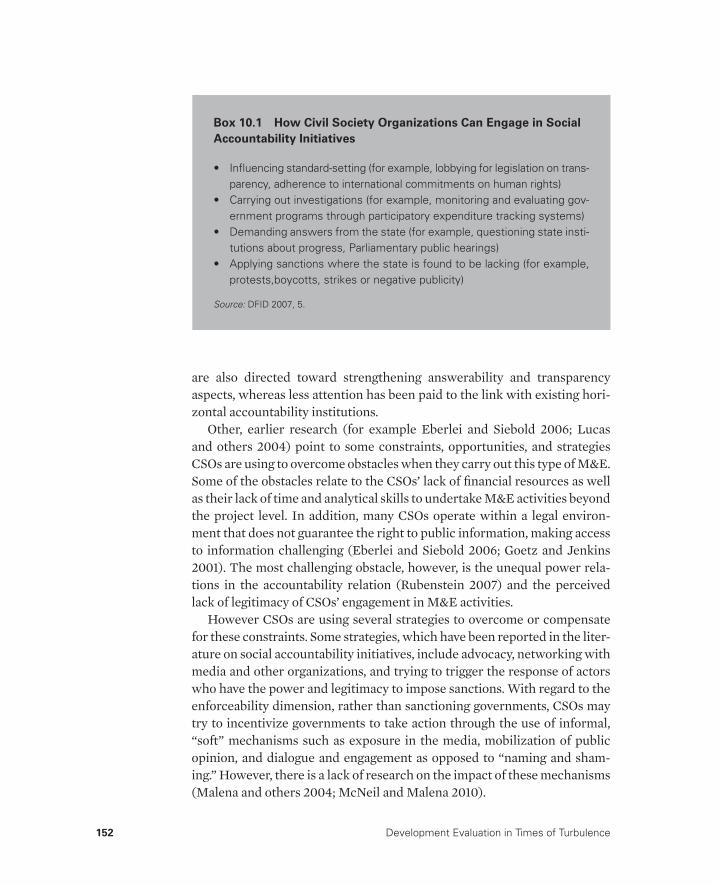
152 Development Evaluation in Times of Turbulence
are also directed toward strengthening answerability and transparency aspects, whereas less attention has been paid to the link with existing hori-zontal accountability institutions.
Other, earlier research (for example Eberlei and Siebold 2006; Lucas and others 2004) point to some constraints, opportunities, and strategies CSOs are using to overcome obstacles when they carry out this type of M&E. Some of the obstacles relate to the CSOs’ lack of fi nancial resources as well as their lack of time and analytical skills to undertake M&E activities beyond the project level. In addition, many CSOs operate within a legal environ-ment that does not guarantee the right to public information, making access to information challenging (Eberlei and Siebold 2006; Goetz and Jenkins 2001). The most challenging obstacle, however, is the unequal power rela-tions in the accountability relation (Rubenstein 2007) and the perceived lack of legitimacy of CSOs’ engagement in M&E activities.
However CSOs are using several strategies to overcome or compensate for these constraints. Some strategies, which have been reported in the liter-ature on social accountability initiatives, include advocacy, networking with media and other organizations, and trying to trigger the response of actors who have the power and legitimacy to impose sanctions. With regard to the enforceability dimension, rather than sanctioning governments, CSOs may try to incentivize governments to take action through the use of informal, “soft” mechanisms such as exposure in the media, mobilization of public opinion, and dialogue and engagement as opposed to “naming and sham-ing.” However, there is a lack of research on the impact of these mechanisms (Malena and others 2004; McNeil and Malena 2010).
Box 10.1 How Civil Society Organizations Can Engage in Social
Accountability Initiatives
• Infl uencing standard-setting (for example, lobbying for legislation on trans-parency, adherence to international commitments on human rights)
• Carrying out investigations (for example, monitoring and evaluating gov-ernment programs through participatory expenditure tracking systems)
• Demanding answers from the state (for example, questioning state insti-tutions about progress, Parliamentary public hearings)
• Applying sanctions where the state is found to be lacking (for example, protests,boycotts, strikes or negative publicity)
Source: DFID 2007, 5.
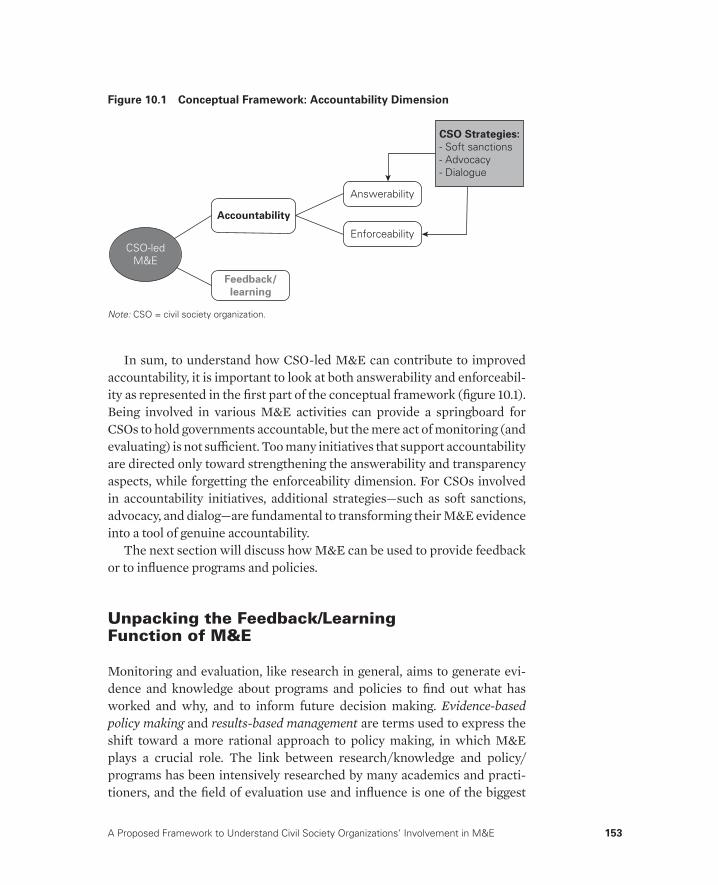
A Proposed Framework to Understand Civil Society Organizations’ Involvement in M&E 153
In sum, to understand how CSO-led M&E can contribute to improved accountability, it is important to look at both answerability and enforceabil-ity as represented in the fi rst part of the conceptual framework (fi gure 10.1). Being involved in various M&E activities can provide a springboard for CSOs to hold governments accountable, but the mere act of monitoring (and evaluating) is not suffi cient. Too many initiatives that support accountability are directed only toward strengthening the answerability and transparency aspects, while forgetting the enforceability dimension. For CSOs involved in accountability initiatives, additional strategies—such as soft sanctions, advocacy, and dialog—are fundamental to transforming their M&E evidence into a tool of genuine accountability.
The next section will discuss how M&E can be used to provide feedback or to infl uence programs and policies.
Unpacking the Feedback/Learning Function of M&E
Monitoring and evaluation, like research in general, aims to generate evi-dence and knowledge about programs and policies to fi nd out what has worked and why, and to inform future decision making. Evidence-based policy making and results-based management are terms used to express the shift toward a more rational approach to policy making, in which M&E plays a crucial role. The link between research/knowledge and policy/programs has been intensively researched by many academics and practi-tioners, and the fi eld of evaluation use and infl uence is one of the biggest
Figure 10.1 Conceptual Framework: Accountability Dimension
Note: CSO = civil society organization.
CSO-ledM&E
Accountability
Feedback/
learning
Answerability
Enforceability
CSO Strategies:
- Soft sanctions- Advocacy- Dialogue
154 Development Evaluation in Times of Turbulence
within evaluation research. The theories of evaluation use and infl uence6 can be used to understand the infl uence of M&E by CSOs. In the second part of this section, links between policy and knowledge/research undertaken by researchers and organizations in developing countries will be discussed.
Evaluation Use and lnfl uence
Research on the use of evaluation results emerged during the 1960s and 1970s when many social scientists involved in the evaluation of large-scale social welfare programs in the United States became disappointed that their research/evaluation results were not being used to improve programs and policy making. This frustration gave rise to numerous theories explaining the nonuse of evaluation results and research in general. Some earlier work concentrated on the contextual elements facilitating or inhibiting the use of evaluation results. Other research (for example Shula and Cousins 1997) proposed a classifi cation of diff erent types of use.
The basis for evaluation theory was developed with the defi nition of three main types of evaluation use: instrumental, conceptual, and political/symbolic (Leviton and Hughes 1981). Instrumental use refers to the direct use of evaluation results for decision making; conceptual use, also called enlightenment, refers to the subtle infl uence of evaluations or “the percola-tion of new information, ideas and perspectives into the arenas in which decisions are made” (Weiss 1999, 471). Political or symbolic use occurs when evaluation fi ndings are used to legitimate positions or decisions that have already been made (Kirkhart 2000). A fourth type, called process use, was described by Patton (1997). Process use refers to the fact that not only evalu-ation fi ndings, but also the process of participating in an evaluation can have eff ects or lead to outcomes, such as feelings of empowerment and organi-zational learning. Thus, there are many ways in which M&E can be used beyond instrumental use. Paradoxically, despite the fact that instrumental use is rather exceptional, the direct use of evaluation fi ndings to improve programs and decision making is still considered one of the main goals of evaluation.
More recently, following an article by Kirkhart (2000), researchers have proposed a shift in terminology from evaluation use to evaluation infl uence. The overall argument behind this shift is that the term “use” implicitly has an intentional, instrumental connotation whereas M&E can have eff ects or consequences in a plethora of ways. The term evaluation infl uence is a broader concept that captures the unintentional, longer-term consequences of M&E. Evaluation consequences can occur as a result of the fi ndings, the process, or a combination of both (Kirkhart 2000). Although there is no
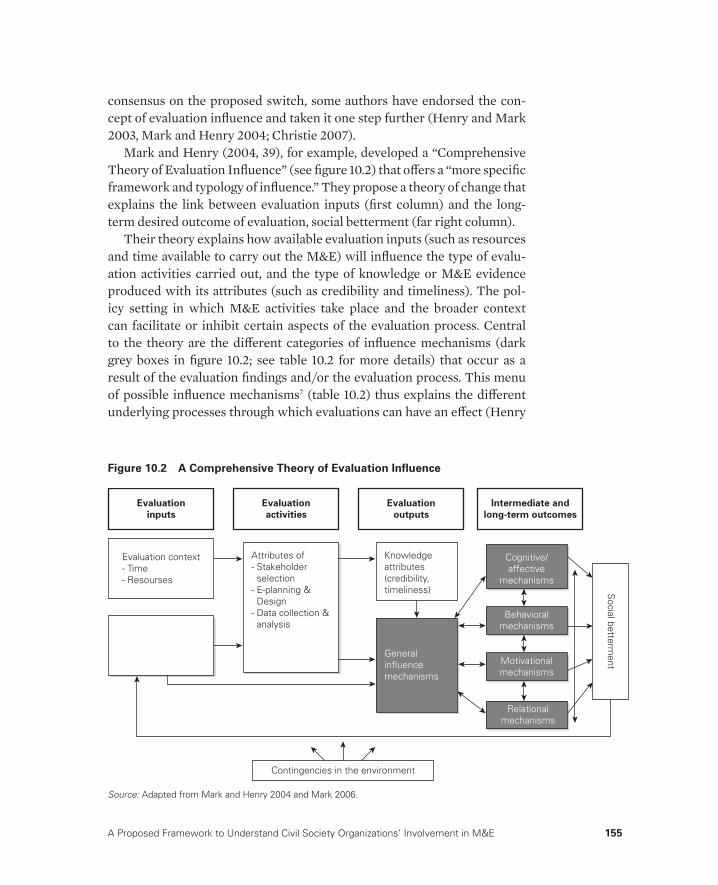
A Proposed Framework to Understand Civil Society Organizations’ Involvement in M&E 155
consensus on the proposed switch, some authors have endorsed the con-cept of evaluation infl uence and taken it one step further (Henry and Mark 2003, Mark and Henry 2004; Christie 2007).
Mark and Henry (2004, 39), for example, developed a “Comprehensive Theory of Evaluation Infl uence” (see fi gure 10.2) that off ers a “more specifi c framework and typology of infl uence.” They propose a theory of change that explains the link between evaluation inputs (fi rst column) and the long-term desired outcome of evaluation, social betterment (far right column).
Their theory explains how available evaluation inputs (such as resources and time available to carry out the M&E) will infl uence the type of evalu-ation activities carried out, and the type of knowledge or M&E evidence produced with its attributes (such as credibility and timeliness). The pol-icy setting in which M&E activities take place and the broader context can facilitate or inhibit certain aspects of the evaluation process. Central to the theory are the diff erent categories of infl uence mechanisms (dark grey boxes in fi gure 10.2; see table 10.2 for more details) that occur as a result of the evaluation fi ndings and/or the evaluation process. This menu of possible infl uence mechanisms7 (table 10.2) thus explains the diff erent underlying processes through which evaluations can have an eff ect (Henry
Figure 10.2 A Comprehensive Theory of Evaluation Infl uence
Source: Adapted from Mark and Henry 2004 and Mark 2006.
Evaluation
inputs
Evaluation
activities
Evaluation
outputs
Intermediate and
long-term outcomes
Evaluation context- Time- Resourses
Attributes of- Stakeholder selection- E-planning & Design- Data collection & analysis
Knowledgeattributes(credibility,timeliness) S
ocial betterment
Generalinfluencemechanisms
Cognitive/affective
mechanisms
Behavioralmechanisms
Motivationalmechanisms
Relationalmechanisms
Contingencies in the environment

156 Development Evaluation in Times of Turbulence
and Mark 2003). To explain these underlying mechanisms, the authors have relied on established research from social and behavioral sciences, which “can be a powerful source of methods, measures and hypotheses” (Mark and Henry 2004, 51). The framework of mechanisms distinguishes among three levels of analysis—the individual, interpersonal, and collective levels—indicating the locus of the change process, and fi ve mechanisms or types of processes: general infl uence, cognitive and aff ective, motivational, behavioral (Mark and Henry 2004, 39), and, more recently, relational (see column and row headings of table 10.2). Entries in table 10.2 can be both outcomes of the evaluation and mechanisms that stimulate other outcomes: “Because the elements [...] can play the dual roles of an outcome of evalua-tion and mechanisms that stimulates other outcomes, we often refer to them as processes” (Mark and Henry 2004, 43). A certain combination of diff er-ent infl uence mechanisms can then form a pathway toward a longer-term
Table 10.2 Model of Alternative Mechanisms That May Mediate Evaluation
Infl uence
Types of process/
outcomes
Level of analysis
Individual Interpersonal Collective
General Infl uence Elaboration Heuristics Priming
Skill acquisition
Justifi cation Persuasion Change agent
Minority-opinion infl uence
Ritualism Legislative hearings Coalition formation Drafting legislation Standard setting Policy consideration
Cognitive and affective
Salience
Opinion/attitude valence
Local descriptive norms
Agenda setting Policy-oriented learning
Motivational Personal goals and aspirations
Injunctive norms Social reward exchange
Structural incentives Market forces
Behavioral New skill performance Individual change in practice
Collaborative change in practice
Program continuation, change, or cessation
Policy change Diffusion
Relational Self-perception of empowerment
Networks shifts in power relations
Democratic forum Learning organizations Social justice
Source: Adapted from Mark and Henry 2004 and Mark 2006.
A Proposed Framework to Understand Civil Society Organizations’ Involvement in M&E 157
outcome, such as better education or health, which is captured in the term social betterment.
Like any theory, this theory has advantages and disadvantages. One of its limitations, especially for CSO-Ied M&E, is the lack of attention to external factors that infl uence the process. External factors are acknowledged, through the concept of contingencies and the decision-making context, but for use in developing countries, more details are necessary, which will be discussed in the next section. Empirical applications of this theoretical framework are also limited (Christie 2007; Weiss and others 2005), especially in a developing-country context. Conversely, because the theory is still a work in progress, it can easily be adapted to provide the foundations for context-specifi c, local theories of evaluation infl uence (Henry and Mark 2003). However, the most important contribution of the theoretical framework is the attention it draws to the broad range of ways in which M&E can have an eff ect at diff erent levels beyond direct, instrumental use. Table 10.2 entries show that program and policy change are only two among many possible infl uence mechanisms.
Understanding the Knowledge/Research–Policy Interface in
Developing Countries
Because the theories and frameworks discussed above have not yet been studied in the context of developing countries, and to better understand which factors are mediating the relationship between M&E and program/policy, the broader literature on the interface between knowledge/research and policy was consulted. M&E can be considered a type of research because it relies on techniques and methods from social sciences. More specifi cally, the experience of the Research and Policy in Development (RAPID) group at the Overseas Development Institute (ODI) and the work of the International Development Research Centre (IDRC) were exam-ined. The frameworks proposed by both research groups partially overlap but also complement each other. The RAPID framework draws attention to a broad range of factors that are relevant for understanding the relation-ship between research and policy. The work of IDRC focuses on the specifi c strategies CSOs and research institutions are adopting to increase the infl u-ence of their research on policy.
The RAPID FrameworkThe RAPID framework (fi gure 10.3) was developed by ODI to map the four broad areas that play a role in the research–policy link: external infl uence, political context, the evidence, and the links. M&E research falls at the intersection of the political and evidence “circles” (see arrow in fi gure 10.3).

158 Development Evaluation in Times of Turbulence
The four elements shed light on the link between CSO-Ied M&E and its feedback function. External infl uence (fi gure 10.3) refers to elements within the broader, international context in which CSOs operate, such as the Paris Declaration and the Millennium Development Goals, as well as more gen-eral infl uences, such as the move toward evidence-based policy making and the presence of donors in developing countries. The political context refers to national-level political processes, such as the political structure of a coun-try, and/or the way policy making occurs within a certain sector. For most of the factors in this category, data on a range of indicators exists. Examples are the Freedom of Press Index as a proxy for media freedom in a country and the governance indicators published by the World Bank.8 With respect to policy making, there are diff erences in openness across policy domains. Some sectors, such as the education sector, are more open to sources of evidence that are generated by external actors such as CSOs, whereas others, such as macroeconomic policies, are more closed (Jones and others 2009, 16).
The category evidence (fi gure 10.3) relates to both the characteristics of the evidence and the communication strategies employed (Court and Young 2003; Court and Young 2004). Evidence can be generated in many ways beyond academic research, for example, through participatory research and storytelling, but also through M&E (see arrow in fi gure 10.3). However, there is a hierarchy of diff erent types of evidence. In addition, there is variation in the attributes of evidence, such as credibility, validity, and reliability, which will facilitate or inhibit its uptake within policy making. The way e vidence is communicated also plays an important role and will be discussed in more detail when explaining the key elements of the IDRC framework.
The last element of the framework may be the most important and is closely related to the infl uence of CSO-Ied M&E. To bridge policy and
Figure 10.3 The RAPID Framework
Source: Adapted from Court and Young 2004, 2.
Note: RAPID = Research and Policy in Development.
External
influence
Political
context
EvidenceLinks
Politics &policy making
Media,advocacy,
networking
Research,learning &thinking
Policy analysis &research (including M&E)

A Proposed Framework to Understand Civil Society Organizations’ Involvement in M&E 159
evidence, links (fi gure 10.3) act as a key facilitator and can be created through the development of networks, advocacy, and others. Compared with individual evaluators, CSOs undertaking M&E have an advantage here because they are more experienced in such types of activities. This element reappears in the IDRC framework, described below.
The IDRC FrameworkThe IDRC developed a framework, referred to as a “realist perspective of policy infl uence” (fi gure 10.4), based on an in-depth evaluation of 23 best-practice cases about the infl uence of research on policy in developing countries (Carden 2004, 2009).
The framework and underlying empirical evidence are discussed extensively in Carden (2009). Although it is beyond the scope of this chapter to explain them in detail, key elements relevant to understand-ing the infl uence of CSO-Ied M&E will be highlighted. The framework shows similarities with the RAPID framework regarding research and context (fi gure 10.4). Under context, decision context is emphasized and broken down into fi ve receptivity categories to explain the openness of government/policy makers toward research fi ndings. These decision con-text categories will infl uence the strategies researchers and organizations adopt to draw attention to their research. As Carden (2009, 25) explains, “each of these classes of receptivity calls for defi nable strategies by which researchers and research advocates can maximize their prospects of infl u-encing public policy and development action.” The relationship between an adopted strategy, or combination of strategies, according to the decision
Figure 10.4 Realist Perspective of Policy Infl uence
Source: Adapted from Carden 2010.
Research
• Research quality• Research networks• Action research
• Relationship building• Institutional mechanisms• Networks Communication
Outcomes
• Enhancing policy capacity• Broader policy horizons• Policy regimes
• Overall context• Nature of governance• Stability of institutions • Economic crisis and pressure
• Decision context• Five receptivity categories
Context
Strategies
160 Development Evaluation in Times of Turbulence
context and the outcome is not linear and predictable, however, because other contextual elements can interfere.
For the purpose of this chapter, the strategies (fi gure 10.4) of relationship building, networks, and communication are especially important. Having a good communication strategy is crucial and goes beyond mere dissemination of results. The establishment of a permanent dialogue forum, for example, has been shown to be conducive for policy infl uence because it promotes the continuous exchange of information between researchers and policymakers (Carden 2009). As discussed in the previous section, establishing dialogue is also crucial to strengthening domestic accountability. Further, professional mobility, networks, and personal relations are important informal channels of communication that foster the exchange of ideas.
In sum, CSO-Ied M&E has consequences that go beyond the instrumental use of M&E fi ndings. M&E generated by CSOs can exert infl uence in many ways as suggested by Mark and Henry. In addition, CSOs use a variety of strategies to increase the infl uence of their work, as visible from the ODI and IDRC literature. Given that both main functions of M&E have been decon-structed and linked, where possible, to CSO-Ied M&E, the most important elements will be combined into a conceptual framework explained in the conclusion of this chapter.
Bringing Everything Together: Toward an Understanding of CSOs’ Involvement in M&E
Some of the most important elements discussed in this chapter are sum-marized below. These elements can be considered the building blocks for a conceptual framework, whose aim is to contribute to a better understanding of CSOs’ involvement in M&E.
Following the introduction, the concept of accountability was unpacked, highlighting its two dimensions—answerability and enforceability—and some of its main types—vertical, horizontal, and hybrid/diagonal or social. The concept of social accountability was analyzed because of its useful-ness in understanding how CSOs, especially CSOs involved in M&E activi-ties, can strengthen domestic accountability. The literature has highlighted obstacles and opportunities CSOs face when trying to demand answers from government or, more importantly, create the right incentive structure for government to take action. The two dimensions of accountability and the strategies CSOs employ to turn M&E evidence into a tool for domes-tic accountability are represented in the framework shown in fi gure 10.5. The fi gure lists factors related to the broader political context in which the

A Proposed Framework to Understand Civil Society Organizations’ Involvement in M&E 161
CSOs operate and factors related to the capacity of CSOs to undertake this type of independent M&E.
The second part of this chapter explained the feedback function of M&E by relying on the literature about evaluation use and infl uence and the knowledge/research–policy interface discussed in the context of devel-oping countries. The literature broadens the understanding of the concept “evaluation use and infl uence” beyond instrumental use. Most evaluations do not result in concrete program or policy changes but generate important changes at the conceptual or cognitive level. In addition, the Comprehen-sive Theory of Evaluation Infl uence off ers a framework to examine the dif-ferent underlying processes through which evaluation infl uences broader outcomes at the cognitive, motivational, behavioral, and relational levels,
Figure 10.5 Understanding CSOs’ Involvement in M&E
Note: CSO = civil society organization, M&E = monitoring and evaluation.
CSO Strategies:
- Soft sanctions- Advocacy- Dialogue
CSO Strategies:
- Trust & relationships- Communication & Advocacy- Networking- Institutional mechanisms
Accountability
Answerability
Enforceability
CSO-ledM&E
General
Influence
Mechanism
Cognitive/affective
Externalinfluence
Politicalcontext
CSOcapacity
Motivational
Behavioral
Relational

162 Development Evaluation in Times of Turbulence
which should ultimately result in social betterment. The underlying mecha-nisms of the Comprehensive Theory of Evaluation Infl uence are also repre-sented in the proposed conceptual framework (see fi gure 10.5).
Finally, the literature on the knowledge/research–policy interface draws attention to the factors that play a role in the knowledge/research–policy interface, as well as strategies CSOs are using to bring M&E evidence to the attention of policy makers.
In conclusion, the proposed framework takes into account the impor-tance of context to understanding the environment in which CSOs are car-rying out M&E activities, the type of M&E they are carrying out, and their capacity to transform the gathered M&E evidence as a tool to increase accountability and to infl uence (pro-poor) programs and policies. The framework draws its strength from the fact that it refl ects elements from a broad range of literature, and takes into account both the accountability and the feedback function of M&E.
The framework is still a work in progress and future research and fi eldwork on CSO-Ied M&E are necessary to fi ne-tune its elements. For example, this chapter was structured to discuss the two main functions of M&E separately. Nevertheless, as indicated by the dark grey arrow in fi gure 10.5, dynamics and trade-off s between both functions exist. CSOs that are engaged in expenditure tracking, for example, to ensure the good use of program resources, may be able to introduce improvements in that program through a combination of their M&E evidence, advocacy, and dialogue. Further, some infl uence mechanisms like “agenda-setting” or “change in practice” (see table 10.2) are indicators of a greater answerability and responsiveness of public offi cials. Additional research, especially empirical research, is needed to further explore the interaction between both func-tions. Despite this challenge, the proposed framework is a good starting point to study CSO-Ied M&E in diff erent settings, and, hopefully, a source of inspiration for further research on the topic.
Notes
1. This chapter is a revised, shorter version of Gildemyn 2011. 2. For the purpose of this chapter, the term civil society organizations refers to a
wide variety of organizations, beyond nongovernmental organizations (NGOs), such as trade unions, think tanks, community-based organizations, and others.
3. The term CSO-led M&E is adopted here to refer to the array of M&E activities in which CSOs are involved at the program and policy level. These M&E activi-ties go beyond the (internal) M&E activities CSOs are undertaking at the level of their own projects and programs.

A Proposed Framework to Understand Civil Society Organizations’ Involvement in M&E 163
4. There is debate among authors regarding the concept of enforceability. Some authors (for example Hickey and Mohan 2008 and Schedler 1999) argue that noncompliance with agreed standards can lead to sanctioning, while others (Lindberg 2009) have argued that sanctions should only be applied if power holders fail to provide answers or justifi cation.
5. Not all studies on social accountability made an explicit distinction between the diff erent types of accountability initiatives. The results discussed here apply to social accountability initiatives as a whole, not only those that have M&E at their core.
6. Evaluation use and infl uence primarily looks at “the consequences” of evaluation and, implicitly, of monitoring as well. Monitoring and evaluation are two distinct but complementary processes. Although the theory was developed to explain evaluation infl uence, it has also been applied to performance monitoring (Mark and Henry 2004) and to study the infl uence of indicators (Lehtonen 2012).
7. For a detailed explanation of the diff erent types of infl uence mechanisms see Henry and Mark 2003; Mark and Henry 2004; Mark 2006.
8. These indicators are available at : www.govindicators.org
References
Ackerman, J. M. 2005. “Social Accountability in the Public Sector: A Conceptual Discussion.” Social Development Papers 82, World Bank, Washington DC.
Brett, E. A. 2003. “Participation and Accountability in Development Management.” The Journal of Development Studies 40 (2): 1–29.
Carden, F. 2004. “Issues in Assessing Policy Infl uence on Research.” International Social Science Journal 179: 135–51.
————. 2009. Knowledge to Policy? Making the Most of Development Research. International Development Research Centre. Ottawa: Sage Publications.
Christie, C.A. 2007. “Reported Infl uence of Evaluation Data on Decision Makers’ Actions: An Empirical Examination.” American Journal of Evaluation 28 (8): 8–25.
Court, J., and J. Young. 2003. “Bridging Research and Policy: Insights from 50 Case Studies.” Working Paper 213, Overseas Development Institute, London.
————. 2004. “Bridging Research and Policy in International Development: An Analytical and Practical Framework.” Research and Policy in Development Pro-gramme Briefi ng Paper 1, Overseas Development Institute, London.
DFID (U.K. Department for International Development). 2007. “Civil Society and Good Governance: A DFID Practice Paper.” DFID, London.
Eberlei, W. 2007. “Accountability in Poverty Reduction Strategies: The Role of Empowerment and Participation.” Social Development Papers 104, World Bank, Washington, DC.
Eberlei, W., and T. Siebold. 2006. Stakeholder Involvement in PRS Monitoring. http://inef.uni-due.de/page/documents/eberlei/Eberlei-Siebold-Monitorin_Juni2006.pdf (accessed November 5, 2010).
164 Development Evaluation in Times of Turbulence
Gildemyn, M. 2011. “Towards an Understanding of CSO-Led M&E: Unpacking the Accountability and Feedback Function of M&E.” Discussion Paper 2011-03, University of Antwerp.
Goetz, A. M., and R. Jenkins. 2001. “Hybrid Forms of Accountability: Citizen Engagement in Institutions of Public-Sector Oversight in India.” Public Manage-ment Review 3 (3): 363–83.
Goetz, A.M., and R. Jenkins. 2005. Reinventing Accountability. Hampshire: Palgrave MacMillan.
Henry, G. T., and M. M. Mark. 2003. “Beyond Use: Understanding Evaluation’s Infl uence on Attitudes and Actions.” American Journal of Evaluation 24 (3): 293–314.
Hickey, S., and G. Mohan. 2008. “The Politics of Establishing Pro-Poor Accountabil-ity: What Can Poverty Reduction Strategies Achieve?” Review of International Political Economy 15 (2): 234–58.
Holvoet, N., and R. Renard. 2007. “Monitoring and Evaluation under the PRSP: Solid Rock or Quicksand?” Evaluation and Program Planning 30 (1): 66–81.
Holvoet, N., and H. Rombouts. 2008. “The Challenge of Monitoring and Evaluation under the New Aid Modalities: Experiences from Rwanda.” Journal of Modern African Studies 46 (4): 577–602.
Jones, N., A. Datta, and H. Jones. 2009. Knowledge, Policy, and Power. Six Dimen-sions of the Knowledge-Development Policy Interface. http://www.odi.org.uk/resources/download/3790.pdf (accessed November 10, 2010).
Joshi, A., and P. P. Houtzager. 2012. “Widgets or Watchdogs? Conceptual Explora-tions in Social Accountability.” Public Management Review 14 (2): 145—162.
Kirkhart, K. E. 2000. “Reconceptualizing Evaluation Use: An Integrated Theory of Infl uence.” New Directions for Evaluation 88: 5–23.
Lehtonen, M. 2012. “Indicators as an Appraisal Technology: Framework for Ana-lyzing the Policy Infl uence of the UK Energy Sector Indicators.” In Sustainable Development, Evaluation and Policy-Making: Theory, Practise and Quality Assur-ance, edited by A. Von Raggamby and F. Rubik, 175–208. Cheltenham: Edward Elgar Publishing.
Leviton, L. C., and E. F. X. Hughes. 1981. “Research on the Utilization of Evalua-tions: A Review and Synthesis.” Evaluation Review 5 (4): 525–48.
Lindberg, S.I. 2009. “Accountability: The Core Concept and Its Subtypes.” Africa Power and Politics Programme Working Paper 1, Overseas Development Insti-tute, London.
Lucas, H., D. Evans, and K. Pasteur. 2004. “Research on the Current State of PRS Monitoring Systems.” Discussion Paper 382, Institute of Development Studies, Brighton.
Malena, C., and M. McNeil. 2010. “Social Accountability in Africa: An Introduction.” In Demanding Good Governance: Lessons from Social Accountability Initiatives in Africa, edited by M. McNeil and C. Malena. Washington, DC: World Bank.
Malena, C., R. Forster, and J. Singh. 2004. “Social Accountability: An Introduction to the Concept and Emerging Practice.” Social Development Papers 76, World Bank, Washington, DC.

A Proposed Framework to Understand Civil Society Organizations’ Involvement in M&E 165
Mark, M. M. 2006. “The Consequences of Evaluation: Theory, Research and Prac-tice.” Presidential address at the Annual Meeting of the American Evaluation Association, Portland, OR.
Mark, M. M., and G. T. Henry. 2004. “The Mechanisms and Outcomes of Evalua-tion Infl uence.” Evaluation 10 (1): 35–57.
McGee, R., and J. Gaventa. 2011. “Shifting Power? Assessing the Impact of Trans-parency and Accountability Initiatives.” Working Paper 383, Institute of Devel-opment Studies, Essex.
McNeil, M., and Malena, C., eds. 2010. Demanding Good Governance: Lessons from Social Accountability Initiatives in Africa. Washington, DC: World Bank.
Newell, P., and S. Bellour. 2002. “Mapping Accountability: Origins, Contexts and Implications for Development.” Working Paper 168, Institute of Development Studies, Brighton.
O’Donnell, G. 1999. “Horizontal Accountability in New Democracies.” In The Self-Restraining State: Power and Accountability in New Democracies, edited by A. Schedler, L. Diamond, and M. F. Plattner, 29–51. London: Lynne Rienner Publishers.
OECD/DAC (Organisation for Economic Co-operation and Development/Develop-ment Assistance Committee (OECD/DAC). 2005. “The Paris Declaration on Aid Eff ectiveness.” OECD/DAC, Paris.
————. 2008. “Accra Agenda for Action.” OECD/DAC, Paris.————. 2011. “The Busan Partnership for Eff ective Development Co-operation.”
OECD/DAC, Paris. Patton, M. Q. 1997. Utilization-Focused Evaluation: The New Century Text. Thou-
sand Oaks, California: Sage.Peruzzotti, E., and C. Smulovitz. 2006. “Social Accountability: An Introduction.”
In Enforcing the Rule of Law: Social Accountability In the New Latin American Democracies, edited by E. Peruzzotti and C. Smulovitz, 3–33. Pittsburgh: Univer-sity of Pittsburgh Press.
Prennushi, G., G. Rubio, and K. Subbarao. 2002. “Monitoring and Evaluation.” In A Sourcebook for Poverty Reduction Strategies, edited by J. Klugman. Washing-ton, DC: World Bank.
Rubenstein, J. 2007. “Accountability in an Unequal World.” The Journal of Politics 69 (3): 616–32.
Schedler, A. 1999. “Conceptualizing Accountability.” In The Self-Restraining State: Power and Accountability in New Democracies, edited by A. Schedler, L. Diamond, and M. F. Plattner, 13–28. London: Lynne Rienner Publishers.
Shula, L. M., and J. B. Cousins. 1997. “Evaluation Use: Theory, Research and Prac-tice since 1986.” Evaluation Practice 18 (3): 195–208.
Verbeke K., and N. Holvoet. 2006. “Glossary of Selected M&E Instruments and Methods.” Report for the Directorate General for Development Cooperation, Antwerp.
Weiss, C. H. 1999. “The Interface Between Evaluation and Public Policy.” Evalua-tion 5 (4): 468–86.
166 Development Evaluation in Times of Turbulence
Weiss, C.H., E. Murphy-Graham, and S. Birkeland. 2005. “An Alternate Route to Policy Infl uence: How Evaluations Aff ect D.A.R.E.” American Journal of Evaluation 26 (1): 12–30.
World Ba nk. 2004. “Making Services Work for Poor People.” In World Development Report. Washington, DC: World Bank.
————. 2012. “Global Partnership for Social Accountability and Establishment of a Multidonor Trust Fund.” World Bank, Washington, DC.
167
Monitoring and Evaluation in a New Environment Case Study of Jordan’s Ministry of Social Development
Rasha Qudisat
Objective
This chapter introduces the success factors of establishing a monitoring and evaluation (M&E) system in a new environment: Jordan’s Ministry of Social Development (MoSD). It examines the support needed, the setting, the practice, and the use of the system. It illustrates the process of apply-ing monitoring outcomes to creating a managerial policy tool. By piloting and evaluating the system in one department of the ministry, the authors were able to justify the need for M&E in other areas. The chapter also explains the use of M&E tools to provide an early warning system, which can alert decision makers to the need to review plans and strategies at certain points.
CHAPTER 11
168 Development Evaluation in Times of Turbulence
This chapter does not assess MoSD’s social services, nor its plans and strategies. It is intended to highlight the importance of and need for M&E in the social sector.
Country Context
Jordan is a lower middle-income country with a population of 6 million and a per capita gross domestic product (GDP) of US$4,504 as of 2010. The population is about 80 percent urban and is one of the youngest among lower middle-income countries, with 70 percent under the age of 30. The country is not rich in natural resources (potash and phosphate are its main export commodities); its agricultural land is limited; and water is scarce—Jordan is the fourth water-poorest country in the world. The economy is well integrated with the rest of the region through trade, remittances, for-eign direct invest (FDI), and tourism and has especially strong links to the Arab Gulf economies. Jordanian policy makers hope to use the country’s demographic opportunity of a well-educated, young population to build a dynamic, knowledge-based economy.
Jordan has made signifi cant investments in social development; how-ever, households continue to be vulnerable to multiple risks. Despite its middle-income status, Jordan’s economic achievements are fragile, and it is vulnerable to external shocks, such as commodity-price fl uctuations and global economic turndowns. The global economic crisis has contributed to a slowdown in growth accompanied by a deteriorating fi scal situation. This situation makes it increasingly diffi cult for Jordan to provide adequate social protections. The global fi nancial crisis highlights the importance of reinforcing the fundamentals of the kingdom’s social protection system.
Jordan is on track to reach most of its Millennium Development Goals (MDGs), with regional disparity among its governorates. Yet, Jordan faces considerable challenges in strengthening its social protection system. Good social indicators (including low levels of maternal and infant mortality, high vaccination rates, universal primary education and high adult literacy, declining fertility, and increasing life expectancy) exist beside high levels of poverty. Approximately 781,000 Jordanians live in poverty, representing 13.3 percent of the population in 2008, a decline from 21 percent in 1989 (fi gure 11.1). However, this decline in the poverty rate is tenuous and could be easily reversed because a large share of the population lives just above the poverty line and 10 percent are vulnerable to falling into poverty. At the same time, many of the poor live just below the poverty line. Thus, low-cost but well-targeted social protection interventions could move a signifi cant
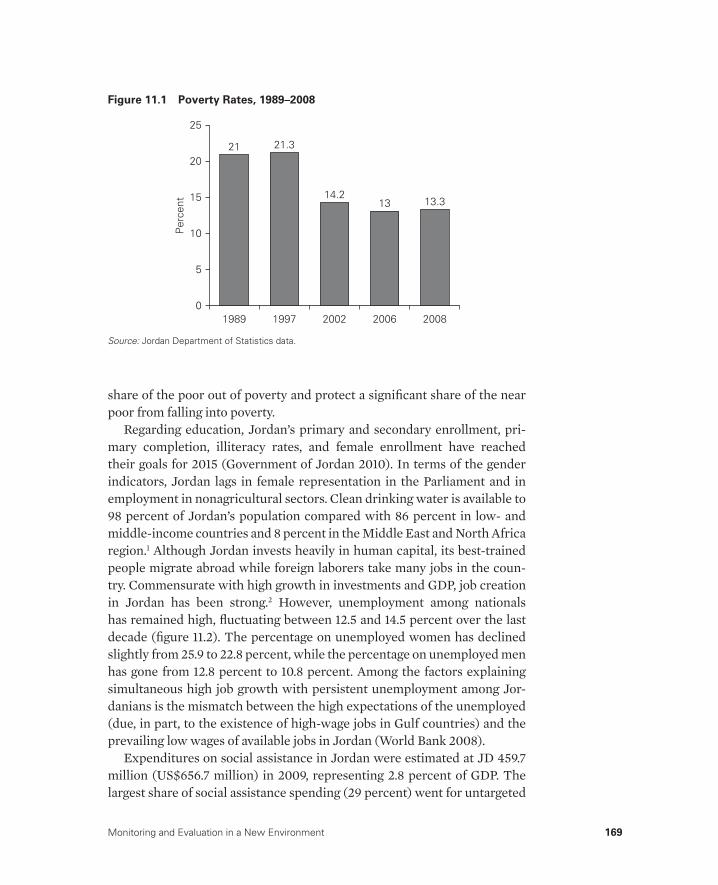
Monitoring and Evaluation in a New Environment 169
share of the poor out of poverty and protect a signifi cant share of the near poor from falling into poverty.
Regarding education, Jordan’s primary and secondary enrollment, pri-mary completion, illiteracy rates, and female enrollment have reached their goals for 2015 (Government of Jordan 2010). In terms of the gender indicators, Jordan lags in female representation in the Parliament and in employment in nonagricultural sectors. Clean drinking water is available to 98 percent of Jordan’s population compared with 86 percent in low- and middle-income countries and 8 percent in the Middle East and North Africa region.1 Although Jordan invests heavily in human capital, its best-trained people migrate abroad while foreign laborers take many jobs in the coun-try. Commensurate with high growth in investments and GDP, job creation in Jordan has been strong.2 However, unemployment among nationals has remained high, fl uctuating between 12.5 and 14.5 percent over the last decade (fi gure 11.2). The percentage on unemployed women has declined slightly from 25.9 to 22.8 percent, while the percentage on unemployed men has gone from 12.8 percent to 10.8 percent. Among the factors explaining simultaneous high job growth with persistent unemployment among Jor-danians is the mismatch between the high expectations of the unemployed (due, in part, to the existence of high-wage jobs in Gulf countries) and the prevailing low wages of available jobs in Jordan (World Bank 2008).
Expenditures on social assistance in Jordan were estimated at JD 459.7 million (US$656.7 million) in 2009, representing 2.8 percent of GDP. The largest share of social assistance spending (29 percent) went for untargeted
Figure 11.1 Poverty Rates, 1989–2008
Source: Jordan Department of Statistics data.
21
Per
cent
25
20
15
10
5
0
21.3
14.213 13.3
1989 1997 2002 2006 2008
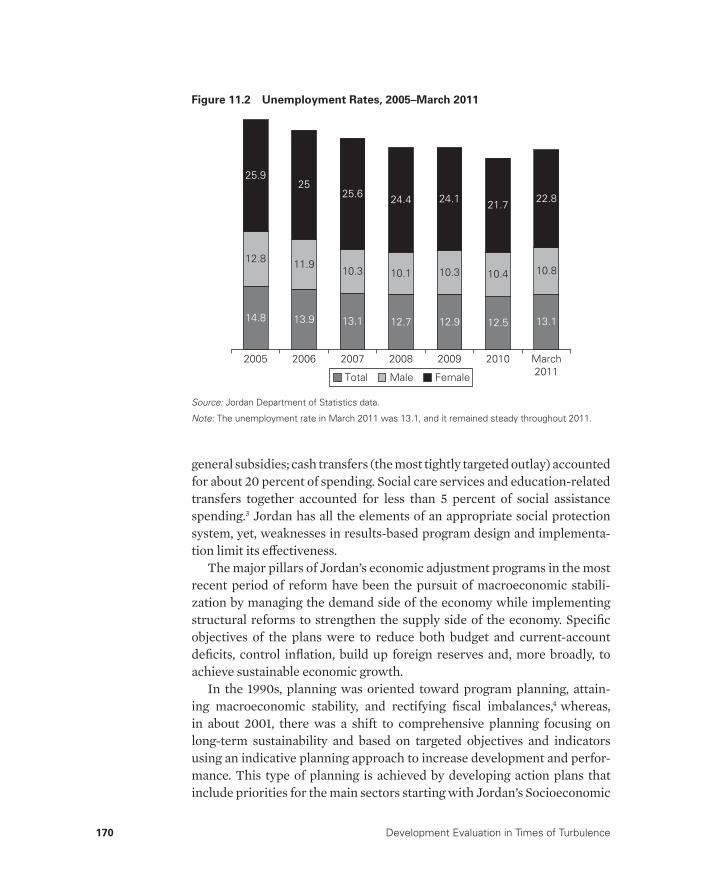
170 Development Evaluation in Times of Turbulence
general subsidies; cash transfers (the most tightly targeted outlay) accounted for about 20 percent of spending. Social care services and education-related transfers together accounted for less than 5 percent of social assistance spending.3 Jordan has all the elements of an appropriate social protection system, yet, weaknesses in results-based program design and implementa-tion limit its eff ectiveness.
The major pillars of Jordan’s economic adjustment programs in the most recent period of reform have been the pursuit of macroeconomic stabili-zation by managing the demand side of the economy while implementing structural reforms to strengthen the supply side of the economy. Specifi c objectives of the plans were to reduce both budget and current-account defi cits, control infl ation, build up foreign reserves and, more broadly, to achieve sustainable economic growth.
In the 1990s, planning was oriented toward program planning, attain-ing macroeconomic stability, and rectifying fi scal imbalances,4 whereas, in about 2001, there was a shift to comprehensive planning focusing on long-term sustainability and based on targeted objectives and indicators using an indicative planning approach to increase development and perfor-mance. This type of planning is achieved by developing action plans that include priorities for the main sectors starting with Jordan’s Socioeconomic
Figure 11.2 Unemployment Rates, 2005–March 2011
Source: Jordan Department of Statistics data.
Note: The unemployment rate in March 2011 was 13.1, and it remained steady throughout 2011.
14.8
12.8
25.9
13.9
11.9
25
13.1
10.3
25.6
12.7
10.1
24.4
12.9
2005 2006 2007 2008 2009 2010 March2011
10.3
24.1
12.5
10.4
21.7
13.1
10.8
22.8
Male Total Female
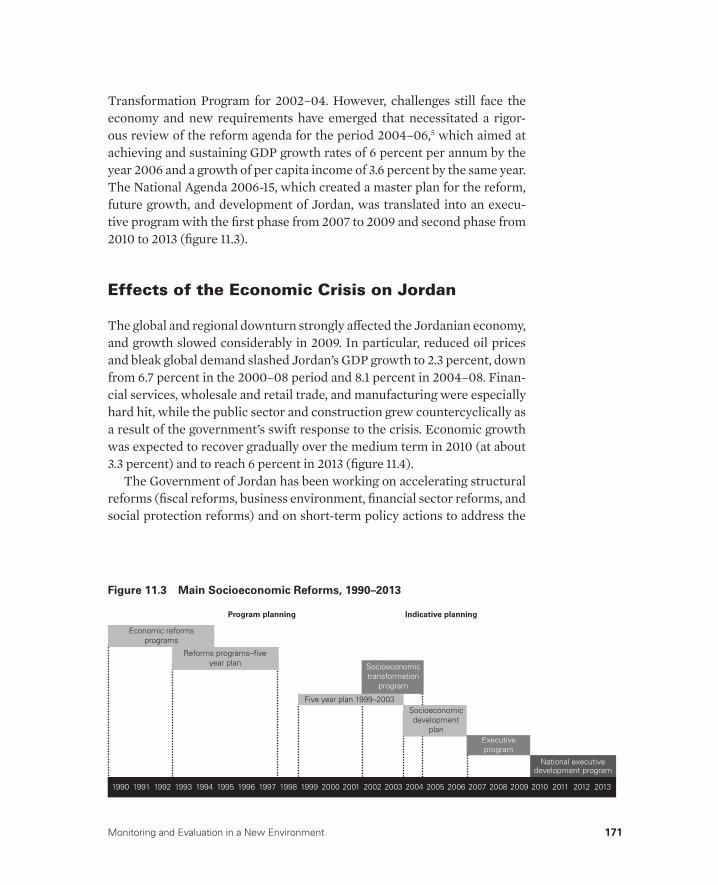
Monitoring and Evaluation in a New Environment 171
Transformation Program for 2002–04. However, challenges still face the economy and new requirements have emerged that necessitated a rigor-ous review of the reform agenda for the period 2004–06,5 which aimed at achieving and sustaining GDP growth rates of 6 percent per annum by the year 2006 and a growth of per capita income of 3.6 percent by the same year. The National Agenda 2006-15, which created a master plan for the reform, future growth, and development of Jordan, was translated into an execu-tive program with the fi rst phase from 2007 to 2009 and second phase from 2010 to 2013 (fi gure 11.3).
Effects of the Economic Crisis on Jordan
The global and regional downturn strongly aff ected the Jordanian economy, and growth slowed considerably in 2009. In particular, reduced oil prices and bleak global demand slashed Jordan’s GDP growth to 2.3 percent, down from 6.7 percent in the 2000–08 period and 8.1 percent in 2004–08. Finan-cial services, wholesale and retail trade, and manufacturing were especially hard hit, while the public sector and construction grew countercyclically as a result of the government’s swift response to the crisis. Economic growth was expected to recover gradually over the medium term in 2010 (at about 3.3 percent) and to reach 6 percent in 2013 (fi gure 11.4).
The Government of Jordan has been working on accelerating structural reforms (fi scal reforms, business environment, fi nancial sector reforms, and social protection reforms) and on short-term policy actions to address the
Program planning
Five year plan 1999–2003
Indicative planning
Economic reformsprograms
Reforms programs–fiveyear plan Socioeconomic
transformationprogram
Socioeconomicdevelopment
planExecutiveprogram
National executivedevelopment program
1990 1991 1992 1993 1994 1995 1996 1997 1998 1999 2000 2001 2002 2003 2004 2005 2006 2007 2008 2009 2010 2011 2012 2013
Figure 11.3 Main Socioeconomic Reforms, 1990–2013
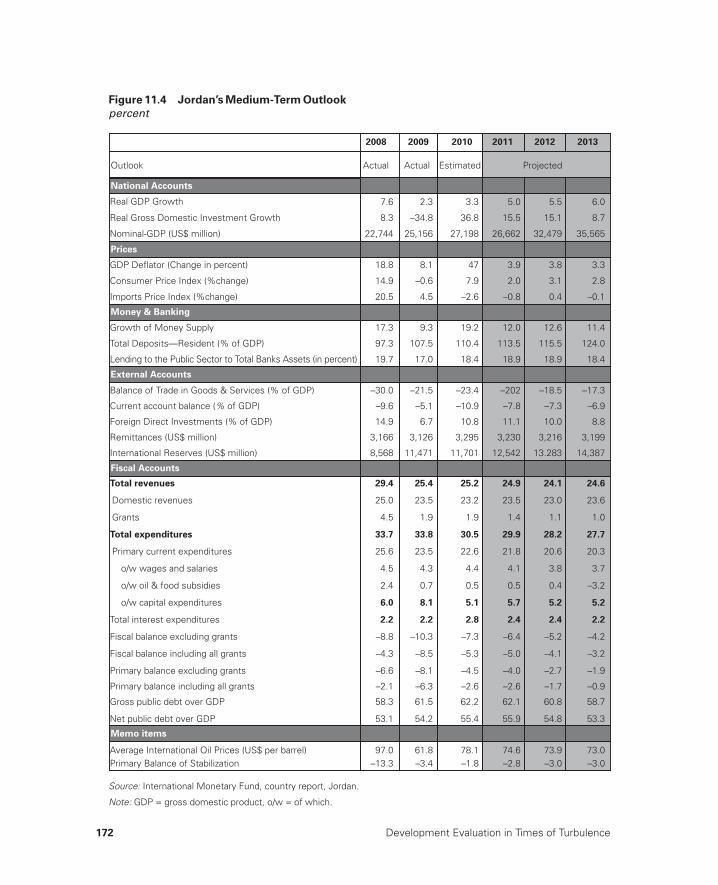
172 Development Evaluation in Times of Turbulence
Figure 11.4 Jordan’s Medium-Term Outlook
percent
Source: International Monetary Fund, country report, Jordan.
Note: GDP = gross domestic product, o/w = of which.
2008 2009 2010 2011 2012 2013
Actual Actual Estimated Projected
2.3 3.3 5.0 5.5 6.0
–34.8 36.8 15.5 15.1 8.7
25,156 27,198 26,662 32,479 35,565
Prices
8.1
–0.6
4.5
47
7.9
–2.6
3.9
2.0
–0.8
3.8
3.1
0.4
3.3
2.8
–0.1
Money & Banking
Imports Price Index (%change)
Consumer Price Index (%change)
9.3 19.2 12.0 12.6 11.4
107.5 110.4 113.5 115.5 124.0
17.0 18.4 18.9 18.9 18.4
External Accounts
Lending to the Public Sector to Total Banks Assets (in percent)
Total Deposits—Resident (% of GDP)
Growth of Money Supply
Balance of Trade in Goods & Services (% of GDP) –21.5 –23.4 –202 –18.5 –17.3
–5.1 –10.9 –7.8 –7.3 –6.9
6.7 10.8 11.1 10.0 8.8
3,126 3,295 3,230 3,216 3,199
11,471 11,701 12,542 13.283 14,387
Fiscal Accounts
International Reserves (US$ million)
Remittances (US$ million)
Foreign Direct Investments (% of GDP)
Current account balance (% of GDP)
Total revenues 25.4 25.2 24.9 24.1 24.6
Domestic revenues 23.5 23.2 23.5 23.0 23.6
Grants 1.9 1.9 1.4 1.1 1.0
Total expenditures 33.8 30.5 29.9 28.2 27.7
Primary current expenditures 23.5 22.6 21.8 20.6 20.3
o/w wages and salaries
o/w oil & food subsidies
4.3 4.4 4.1 3.8 3.7
0.7 0.5 0.5 0.4 –3.2
o/w capital expenditures 8.1 5.1 5.7 5.2 5.2
Total interest expenditures 2.2 2.8 2.4 2.4 2.2
Fiscal balance excluding grants –10.3 –7.3 –6.4 –5.2 –4.2
Fiscal balance including all grants
Net public debt over GDP
Primary balance excluding grants
Primary balance including all grants
Gross public debt over GDP 61.5
54.2
62.2
55.4
62.1
55.9
60.8
54.8
58.7
53.3
Memo items
Average International Oil Prices (US$ per barrel) 61.8 78.1 74.6 73.9 73.0Primary Balance of Stabilization
7.6
8.3
22,744
18.8
14.9
20.5
17.3
97.3
19.7
–30.0
–9.6
14.9
3,166
8,568
29.4
25.0
4.5
33.7
25.6
4.5
2.4
6.0
2.2
–8.8
–8.1 –4.5 –4.0 –2.7 –1.9–6.6
–8.5 –5.3 –5.0 –4.1 –3.2–4.3
–6.3 –2.6 –2.6 –1.7 –0.9–2.1
58.3
53.1
97.0–13.3 –3.4 –1.8 –2.8 –3.0 –3.0
National Accounts
Real GDP Growth
Outlook
Real Gross Domestic Investment Growth
Nominal-GDP (US$ million)
GDP Deflator (Change in percent)
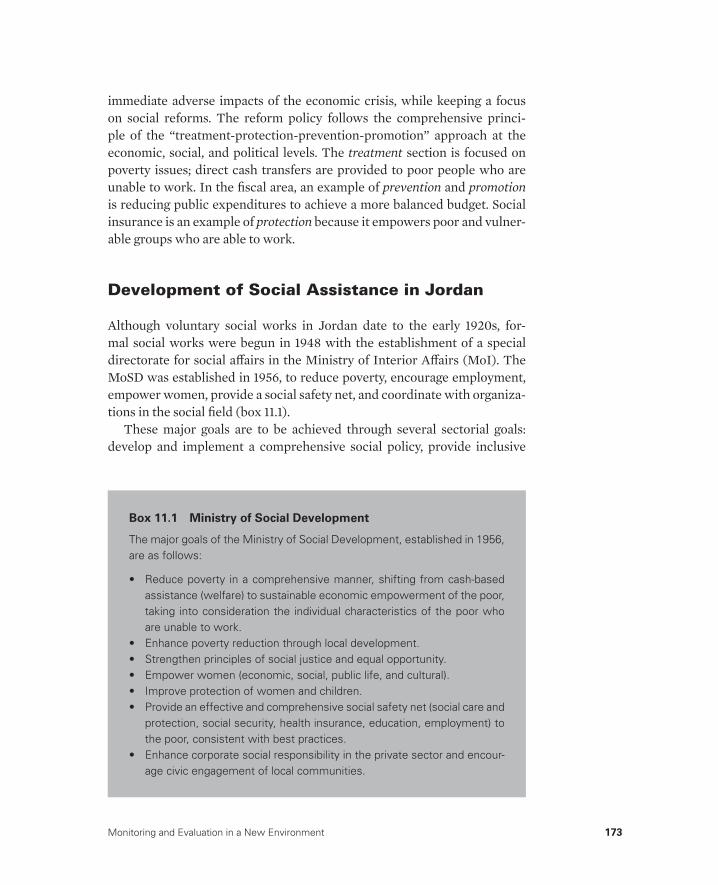
Monitoring and Evaluation in a New Environment 173
immediate adverse impacts of the economic crisis, while keeping a focus on social reforms. The reform policy follows the comprehensive princi-ple of the “treatment-protection-prevention-promotion” approach at the economic, social, and political levels. The treatment section is focused on poverty issues; direct cash transfers are provided to poor people who are unable to work. In the fi scal area, an example of prevention and promotion is reducing public expenditures to achieve a more balanced budget. Social insurance is an example of protection because it empowers poor and vulner-able groups who are able to work.
Development of Social Assistance in Jordan
Although voluntary social works in Jordan date to the early 1920s, for-mal social works were begun in 1948 with the establishment of a special directorate for social aff airs in the Ministry of Interior Aff airs (MoI). The MoSD was established in 1956, to reduce poverty, encourage employment, empower women, provide a social safety net, and coordinate with organiza-tions in the social fi eld (box 11.1).
These major goals are to be achieved through several sectorial goals: develop and implement a comprehensive social policy, provide inclusive
Box 11.1 Ministry of Social Development
The major goals of the Ministry of Social Development, established in 1956, are as follows:
• Reduce poverty in a comprehensive manner, shifting from cash-based assistance (welfare) to sustainable economic empowerment of the poor, taking into consideration the individual characteristics of the poor who are unable to work.
• Enhance poverty reduction through local development.• Strengthen principles of social justice and equal opportunity.• Empower women (economic, social, public life, and cultural).• Improve protection of women and children.• Provide an effective and comprehensive social safety net (social care and
protection, social security, health insurance, education, employment) to the poor, consistent with best practices.
• Enhance corporate social responsibility in the private sector and encour-age civic engagement of local communities.
174 Development Evaluation in Times of Turbulence
social care and protection, enhance the productivity of the capable poor, and empower women and provide them with opportunities of advancement. MoSD is considered the most decentralized ministry in the country, as it is responsible for 186 administrative units and directorates at the fi eld level, including fi eld and departmental directorates and offi ces in governorates and civil-society development centers.
Developmental planning in Jordan also dates to the middle of the 20th century, beginning with project-based planning, which evolved in the 1970s into sectorial planning. By 2000, planning in Jordan shifted into a new era, adopting the indicative planning approach (indicators-based planning) (as shown in fi gure 11.3). Accordingly, Jordan endorsed the principles of M&E as M&E began to evolve at the international level. Consequently, MoSD is adopting a more systematic approach to create a new organizational culture that institutionalizes governmental accountability for its developmental and social obligations.
MoSD focuses on two major themes: (1) protection and care that targets vulnerable groups (women, children, disabled persons) though provid-ing integrated social services; and (2) poverty reduction by providing cash assistance to the poor, enabling them to break out of the poverty circle (especially those who are able to work) through empowerment and aware-ness. This comprehensive strategy includes continuous eff orts to build the capacity of MoSD, as well as the capacity of social workers and of civil society organizations, and to build up the National Aid Fund (NAF), an inde-pendent organization that provides fi nancial assistance, health insurance, and vocational training to the poor.
Furthermore, MoSD is working to enhance its technical and institutional capacity to improve its M&E systems to ensure effi cient and eff ective opera-tions and impact on the benefi ciaries and their communities. However, despite signifi cant progress, MoSD’s resources are overburdened by the increasing demand for social services, largely due to an increase in people’s awareness of their rights for social protection and to the growing credibility of the social protection program.
Through 2008, MoSD had no offi cial M&E unit; however, it maintained a huge amount of information related to the services it has provided and to its benefi ciaries. Despite this mass of data, MoSD did not have an institutional-ized database that could track daily (or even periodically) the social services provided to various target groups. MoSD began developing its M&E meth-ods to ensure integration within policy-making and social-development planning processes, starting with the establishment of an M&E unit in the ministry in 2009.

Monitoring and Evaluation in a New Environment 175
M&E in Social Development
Institutionalization of an M&E system in a broad-outreach institution like MoSD was a substantial initiative that necessitated organizational, mana-gerial, and cultural alterations in the structure of the ministry. It required communicating the vision, purpose, and importance of an M&E system at the outset, and ensuring a participatory approach to guarantee ownership of the M&E system so that it would be used and adapted throughout the ministry. The M&E system was implemented through six steps as shown in fi gure 11.5: (1) securing political support, (2) identifying the purpose of M&E, (3) a desk review and interviews, (4) a pilot project, (5) dissemina-tion of the system, and (6) continuing to assess the M&E system in practice.
Securing Political Support and Identifying the Purpose
The fi rst, and most vital, step in establishing the system was gaining solid political support from the minister. The plan was to fi rst erect an infra-structure for the “M” (monitoring), which would pave the road for the “E” (evaluation). This fi rst step legitimated the rules for the game, focused on
Figure 11.5 Steps in Establishing an M&E System
Diagnostic tool in planning•
•
•
•
Solid political support
Desk review and interviews
Pilot the M&E system
Disseminate the system
Assessing progress andidentifying gaps
Result-based strategies, policies, andprograms to address critical issuesindicated by the system
Early social warning system
Identify the objectives ofM&E
Assess the M&E system inpractice
Note: M&E = monitoring and evaluation.
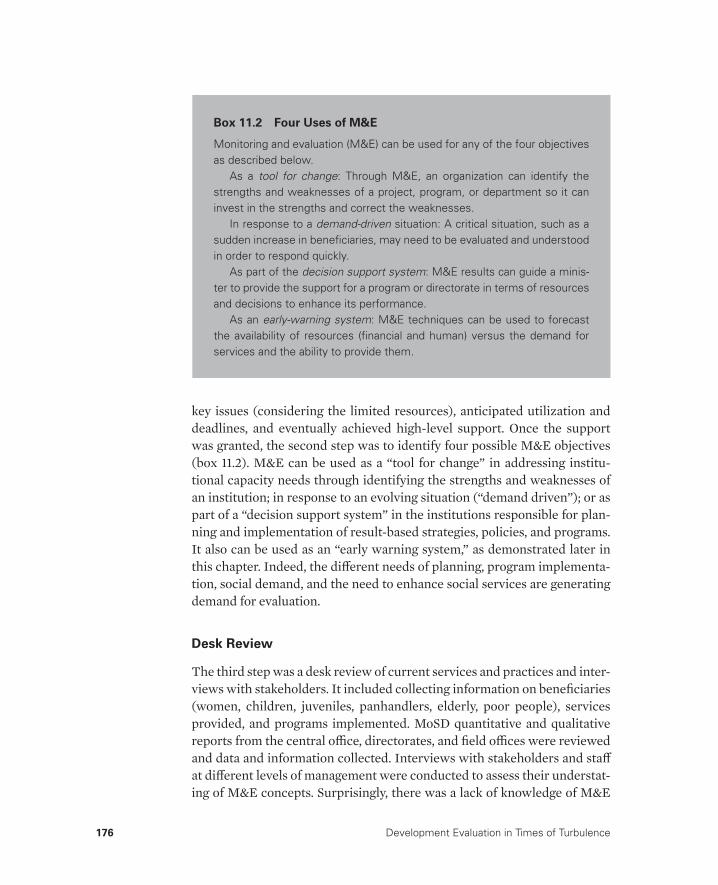
176 Development Evaluation in Times of Turbulence
key issues (considering the limited resources), anticipated utilization and deadlines, and eventually achieved high-level support. Once the support was granted, the second step was to identify four possible M&E objectives (box 11.2). M&E can be used as a “tool for change” in addressing institu-tional capacity needs through identifying the strengths and weaknesses of an institution; in response to an evolving situation (“demand driven”); or as part of a “decision support system” in the institutions responsible for plan-ning and implementation of result-based strategies, policies, and programs. It also can be used as an “early warning system,” as demonstrated later in this chapter. Indeed, the diff erent needs of planning, program implementa-tion, social demand, and the need to enhance social services are generating demand for evaluation.
Desk Review
The third step was a desk review of current services and practices and inter-views with stakeholders. It included collecting information on benefi ciaries (women, children, juveniles, panhandlers, elderly, poor people), services provided, and programs implemented. MoSD quantitative and qualitative reports from the central offi ce, directorates, and fi eld offi ces were reviewed and data and information collected. Interviews with stakeholders and staff at diff erent levels of management were conducted to assess their understat-ing of M&E concepts. Surprisingly, there was a lack of knowledge of M&E
Box 11.2 Four Uses of M&E
Monitoring and evaluation (M&E) can be used for any of the four objectives as described below.
As a tool for change: Through M&E, an organization can identify the strengths and weaknesses of a project, program, or department so it can invest in the strengths and correct the weaknesses.
In response to a demand-driven situation: A critical situation, such as a sudden increase in benefi ciaries, may need to be evaluated and understood in order to respond quickly.
As part of the decision support system: M&E results can guide a minis-ter to provide the support for a program or directorate in terms of resources and decisions to enhance its performance.
As an early-warning system: M&E techniques can be used to forecast the availability of resources (fi nancial and human) versus the demand for services and the ability to provide them.
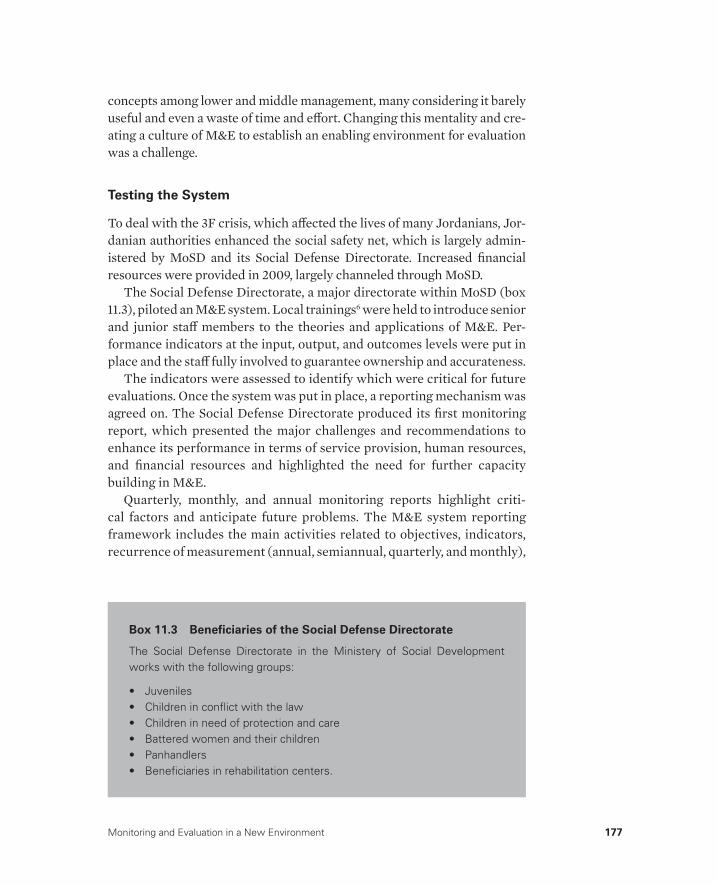
Monitoring and Evaluation in a New Environment 177
concepts among lower and middle management, many considering it barely useful and even a waste of time and eff ort. Changing this mentality and cre-ating a culture of M&E to establish an enabling environment for evaluation was a challenge.
Testing the System
To deal with the 3F crisis, which aff ected the lives of many Jordanians, Jor-danian authorities enhanced the social safety net, which is largely admin-istered by MoSD and its Social Defense Directorate. Increased fi nancial resources were provided in 2009, largely channeled through MoSD.
The Social Defense Directorate, a major directorate within MoSD (box 11.3), piloted an M&E system. Local trainings6 were held to introduce senior and junior staff members to the theories and applications of M&E. Per-formance indicators at the input, output, and outcomes levels were put in place and the staff fully involved to guarantee ownership and accurateness.
The indicators were assessed to identify which were critical for future evaluations. Once the system was put in place, a reporting mechanism was agreed on. The Social Defense Directorate produced its fi rst monitoring report, which presented the major challenges and recommendations to enhance its performance in terms of service provision, human resources, and fi nancial resources and highlighted the need for further capacity building in M&E.
Quarterly, monthly, and annual monitoring reports highlight criti-cal factors and anticipate future problems. The M&E system reporting framework includes the main activities related to objectives, indicators, recurrence of measurement (annual, semiannual, quarterly, and monthly),
Box 11.3 Benefi ciaries of the Social Defense Directorate
The Social Defense Directorate in the Ministery of Social Development works with the following groups:
• Juveniles• Children in confl ict with the law• Children in need of protection and care• Battered women and their children• Panhandlers• Benefi ciaries in rehabilitation centers.
178 Development Evaluation in Times of Turbulence
baseline value (2009), target value (2010), and actual (total computed) and achievement percentages. The latter show the percent of achieve-ment; when achievement is fully met, the cell is fully colored, otherwise, it is partially colored. The other section shows the actual achievement monthly and quarterly, where actual and targeted achievement are compared.
Dissemination
Although realizing that one size does not fi t all, organizers found that the pilot provided valuable information in moving forward to dissemi-nate the M&E system to the other directorates and fi nalize the docu-mentation of the M&E unit in terms of vision, mission, tasks, staffi ng, and standard procedures. The M&E system can serve as a useful guide or “diagnostic tool” in planning, assessing progress, and identifying gaps. It can be used as a communication vehicle and catalyst to introduce M&E as an innovative, knowledge-building idea that can be applied in the most diffi cult environments, in the toughest times, and with limited resources. It can help high-level stakeholders identify appropriate strategies, poli-cies, and programs to address critical issues, even without the need for a technical comprehension of this automated M&E reporting system.
TriangulationData triangulation in social systems is considered a challenge; Jordan’s MoSD is no special case, especially with its 186 decentralized director-ates and offi ces. Once the conception, theories, and application of the M&E system were constructed within the central MoSD, there was still a need to triangulate the data and to set up the system at various levels of application.
Decentralization is an advantage in that matter; it was easy to trian-gulate the M&E data at the fi eld, directorate, district, governorate, and regional levels through the MoSD center. M&E concepts, theories, sys-tems, and purposes have been transferred to the fi eld level. Since the offi ces all provide the same services, they report the same indicators to the MoSD center, where a computerized system develops national indicators of services provided.
The connection between the MoSD center and its many offi ces has enabled MoSD’s stakeholders to identify any sudden change in a par-ticular indicator at the national level, and then fi nd the exact local geographic area that caused this change and the reasons behind the change, such as an increase in benefi ciaries, an increase in violence in
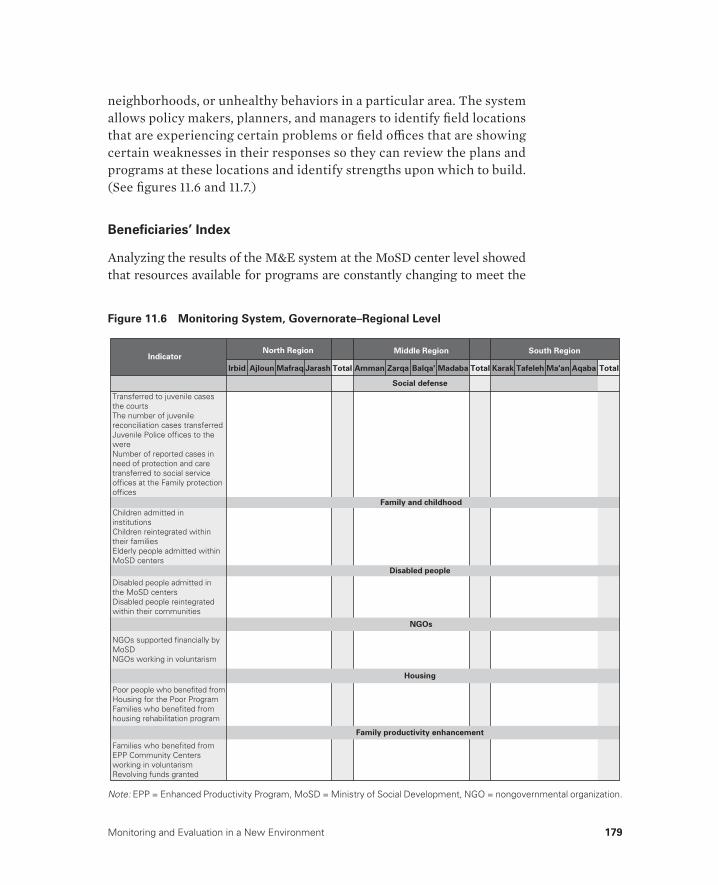
Monitoring and Evaluation in a New Environment 179
neighborhoods, or unhealthy behaviors in a particular area. The system allows policy makers, planners, and managers to identify fi eld locations that are experiencing certain problems or fi eld offi ces that are showing certain weaknesses in their responses so they can review the plans and programs at these locations and identify strengths upon which to build. (See fi gures 11.6 and 11.7.)
Benefi ciaries’ Index
Analyzing the results of the M&E system at the MoSD center level showed that resources available for programs are constantly changing to meet the
Figure 11.6 Monitoring System, Governorate–Regional Level
Note: EPP = Enhanced Productivity Program, MoSD = Ministry of Social Development, NGO = nongovernmental organization.
Indicator North Region Middle Region South Region
Transferred to juvenile casesthe courtsThe number of juvenilereconciliation cases transferredJuvenile Police offices to thewereNumber of reported cases inneed of protection and caretransferred to social serviceoffices at the Family protectionoffices
Children admitted ininstitutionsChildren reintegrated withintheir familiesElderly people admitted withinMoSD centers
Disabled people admitted inthe MoSD centersDisabled people reintegratedwithin their communities
NGOs supported financially byMoSDNGOs working in voluntarism
Poor people who benefited fromHousing for the Poor ProgramFamilies who benefited fromhousing rehabilitation program
Families who benefited fromEPP Community Centersworking in voluntarismRevolving funds granted
Irbid Ajloun Mafraq Jarash Amman Zarqa Balqa' Madaba Karak Tafeleh Ma'an Aqaba Total Total Total
Family and childhood
Disabled people
NGOs
Housing
Family productivity enhancement
Social defense
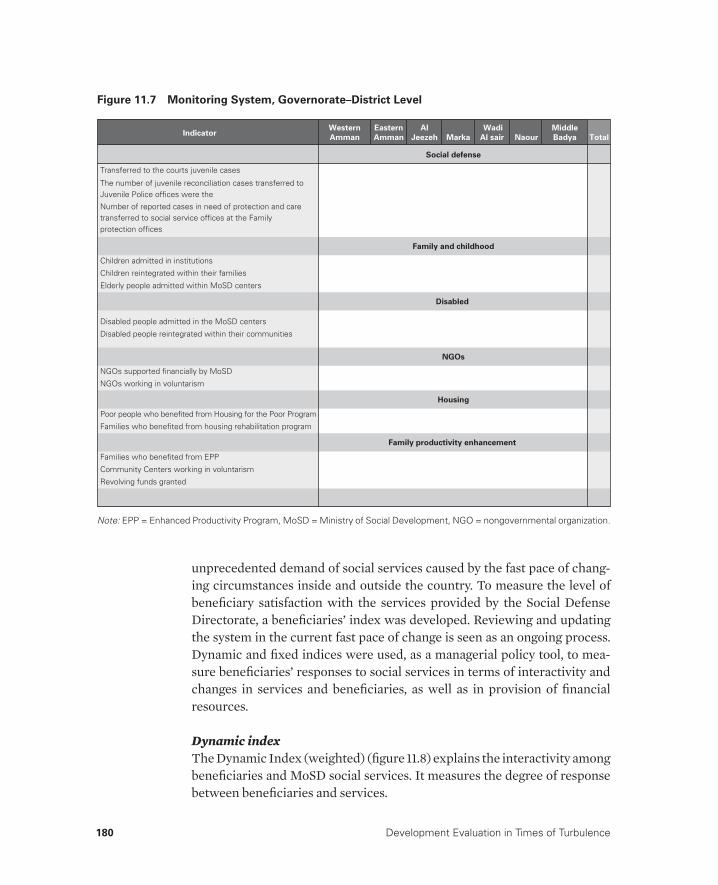
180 Development Evaluation in Times of Turbulence
unprecedented demand of social services caused by the fast pace of chang-ing circumstances inside and outside the country. To measure the level of benefi ciary satisfaction with the services provided by the Social Defense Directorate, a benefi ciaries’ index was developed. Reviewing and updating the system in the current fast pace of change is seen as an ongoing process. Dynamic and fi xed indices were used, as a managerial policy tool, to mea-sure benefi ciaries’ responses to social services in terms of interactivity and changes in services and benefi ciaries, as well as in provision of fi nancial resources.
Dynamic indexThe Dynamic Index (weighted) (fi gure 11.8) explains the interactivity among benefi ciaries and MoSD social services. It measures the degree of response between benefi ciaries and services.
Figure 11.7 Monitoring System, Governorate–District Level
Note: EPP = Enhanced Productivity Program, MoSD = Ministry of Social Development, NGO = nongovernmental organization.
IndicatorWestern
Amman
Eastern
Amman
Al
Jeezeh Marka
Wadi
Al sair Naour
Middle
Badya Total
Social defense
Transferred to the courts juvenile cases
The number of juvenile reconciliation cases transferred to Juvenile Police offices were the
Number of reported cases in need of protection and caretransferred to social service offices at the Family protection offices
Family and childhood
Children admitted in institutions
Children reintegrated within their families
Elderly people admitted within MoSD centers
Disabled
Disabled people admitted in the MoSD centers
Disabled people reintegrated within their communities
NGOs
NGOs supported financially by MoSD
NGOs working in voluntarism
Housing
Poor people who benefited from Housing for the Poor Program
Families who benefited from housing rehabilitation program
Family productivity enhancement
Families who benefited from EPP
Community Centers working in voluntarism
Revolving funds granted
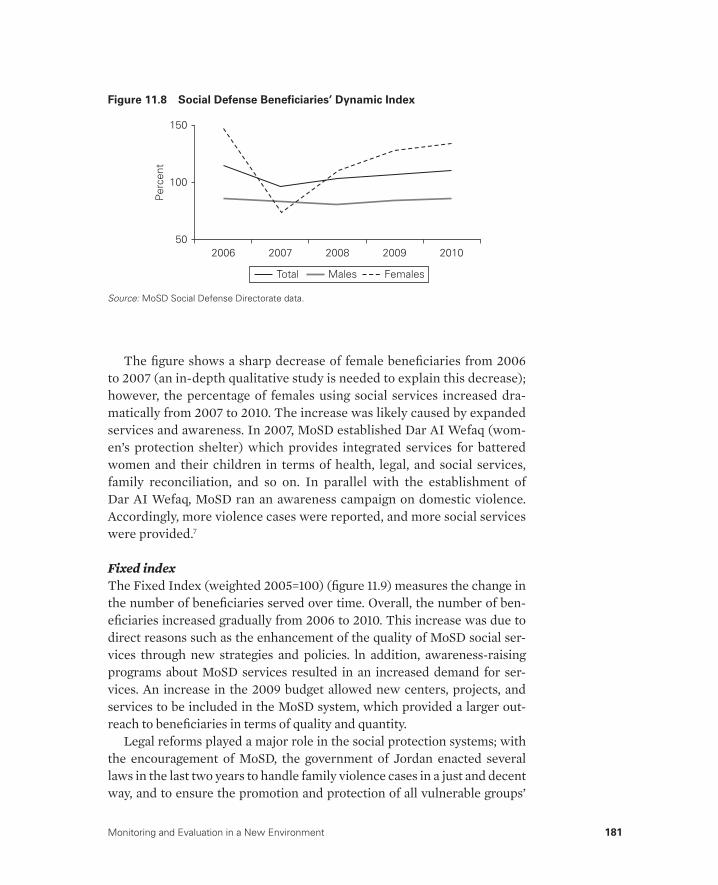
Monitoring and Evaluation in a New Environment 181
The fi gure shows a sharp decrease of female benefi ciaries from 2006 to 2007 (an in-depth qualitative study is needed to explain this decrease); however, the percentage of females using social services increased dra-matically from 2007 to 2010. The increase was likely caused by expanded services and awareness. In 2007, MoSD established Dar AI Wefaq (wom-en’s protection shelter) which provides integrated services for battered women and their children in terms of health, legal, and social services, family reconciliation, and so on. In parallel with the establishment of Dar AI Wefaq, MoSD ran an awareness campaign on domestic violence. Accordingly, more violence cases were reported, and more social services were provided.7
Fixed indexThe Fixed Index (weighted 2005=100) (fi gure 11.9) measures the change in the number of benefi ciaries served over time. Overall, the number of ben-efi ciaries increased gradually from 2006 to 2010. This increase was due to direct reasons such as the enhancement of the quality of MoSD social ser-vices through new strategies and policies. ln addition, awareness-raising programs about MoSD services resulted in an increased demand for ser-vices. An increase in the 2009 budget allowed new centers, projects, and services to be included in the MoSD system, which provided a larger out-reach to benefi ciaries in terms of quality and quantity.
Legal reforms played a major role in the social protection systems; with the encouragement of MoSD, the government of Jordan enacted several laws in the last two years to handle family violence cases in a just and decent way, and to ensure the promotion and protection of all vulnerable groups’
Figure 11.8 Social Defense Benefi ciaries’ Dynamic Index
Source: MoSD Social Defense Directorate data.
2006 2007 2008 2009 2010
Per
cent
150
100
50
Total FemalesMales

182 Development Evaluation in Times of Turbulence
rights and dignity, as well as their full participation in the society on an equal basis with others. MoSD was instrumental in passage of the family violence law, reviewed the juvenile law, and helped pass a bylaw to open protection houses for battered women and victims of violence. A helpline was estab-lished to report family violence cases. In addition, based on an increase in juvenile delinquency in Jordan, MoSD developed a new approach to protect at-risk youth using the juvenile justice system in cooperation with various partners. In addition, it created a system of prevention policies and pro-grams targeting at-risk youth in disadvantaged areas.
M&E as an Early Warning System
A comparison between the fi nancial resources and services provided was conducted to investigate the trend of increasing expenditures on social defense services. Despite Jordan’s tight macroeconomic policy stance, mainly in the area of public expenditures, the royalty initiated a dramatic increase in fi nancial resources in the social sector in the year 2009 in response to a growing need.
Considering the increased demand for social services, MoSD’s budget was increased to enhance current services, provide new services with wider outreach, purchase services from nongovernmental and community organizations, and establish new buildings and infrastructure for MoSD social centers. For example, MoSD created six additional offi ces at reha-bilitation centers.
Figure 11.9 Social Defense Benefi ciaries’ Fixed Index
Source: MoSD Social Defense Directorate data.
2006 2007 2008 2009 2010
250
200
100
150
Per
cent
50
0
Total FemalesMales

Monitoring and Evaluation in a New Environment 183
An analysis compared the increase in benefi ciaries (demand) with the available fi nancial resources. It was conducted for two scenarios: one with-out resources targeted for physical buildings and one with those resources. Scenario 1 (fi gure 11.10) excludes building expenses from the analysis. Figure 11.11 shows that in mid-2010, the increase in benefi ciaries was pro-jected to meet with the increase in fi nancial resources provided by the 2009 increases from royalty initiatives. In the years following 2010, when the budget returns to normal, the analysis shows a gap between the number of benefi ciaries and fi nancial resources, which may increase the burden on the ministry and its capacities to fulfi ll the demand and may aff ect the quality and quantity of social services provided. At this point, a question should be raised as to whether the government will be capable of creating ad hoc strat-egies to meet its commitments. This analysis provides an early warning for policy makers about a possible need to reconsider allocations and services to comply with changing demand and supply.
Scenario 2 (fi gure 11.11), which includes building-related expenses, shows a much smaller gap between benefi ciaries and resources after mid-2010 compared with scenario 1. It shows another positive intersection in 2012. However, the increase in fi nancial resources that causes this intersection is due to a high budget for new buildings. By providing increased funding for facilities, the ministry is increasing the number of centers and shelters pro-viding services to benefi ciaries in their localities rather than transporting
Figure 11.10 Scenario 1: Demand vs. Supply, Excluding Buildings
Source: Jordan Social Protection Directorate, Public Budget Report data.
Scenario 1
25
20
15
–15
10
–10
5
–5
0
2007 2008 2009 2010 2011 2012
Beneficiaries change (percent)Beneficiaries change projected Financial resources change projected
Financial resources change (percent)
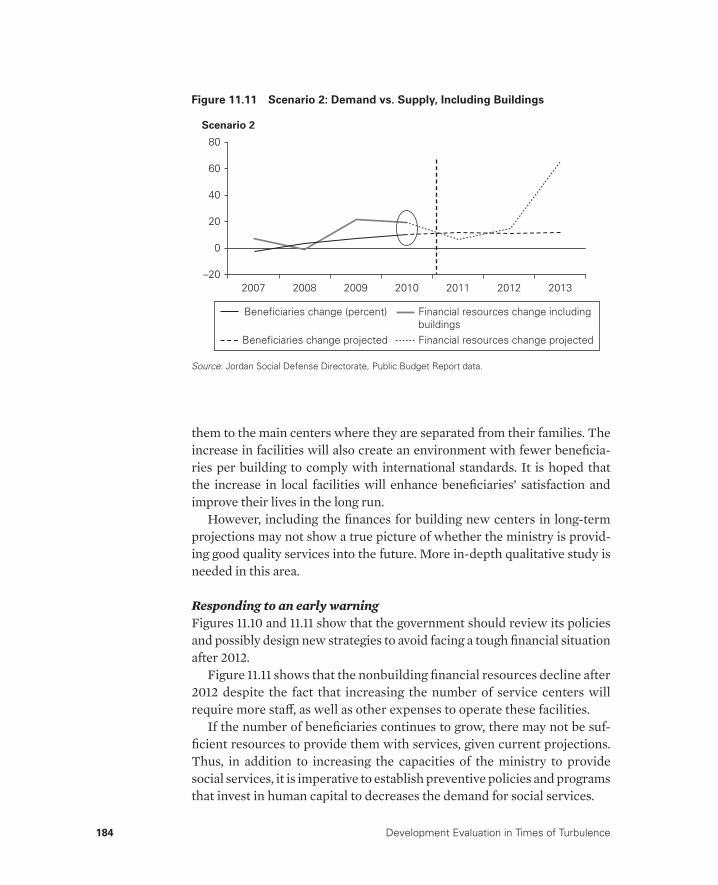
184 Development Evaluation in Times of Turbulence
them to the main centers where they are separated from their families. The increase in facilities will also create an environment with fewer benefi cia-ries per building to comply with international standards. It is hoped that the increase in local facilities will enhance benefi ciaries’ satisfaction and improve their lives in the long run.
However, including the fi nances for building new centers in long-term projections may not show a true picture of whether the ministry is provid-ing good quality services into the future. More in-depth qualitative study is needed in this area.
Responding to an early warningFigures 11.10 and 11.11 show that the government should review its policies and possibly design new strategies to avoid facing a tough fi nancial situation after 2012.
Figure 11.11 shows that the nonbuilding fi nancial resources decline after 2012 despite the fact that increasing the number of service centers will require more staff , as well as other expenses to operate these facilities.
If the number of benefi ciaries continues to grow, there may not be suf-fi cient resources to provide them with services, given current projections. Thus, in addition to increasing the capacities of the ministry to provide social services, it is imperative to establish preventive policies and programs that invest in human capital to decreases the demand for social services.
Figure 11.11 Scenario 2: Demand vs. Supply, Including Buildings
Source: Jordan Social Defense Directorate, Public Budget Report data.
2007 2008 2009 2010 2011 2012 2013
80
60
40
20
–20
0
Scenario 2
Beneficiaries change (percent)
Beneficiaries change projected Financial resources change projected
Financial resources change includingbuildings
Monitoring and Evaluation in a New Environment 185
Lessons Learned and Conclusion
Two important lessons were learned though the establishment of an M&E system. The fi rst lesson was that when the system was being established there was considerable resistance from employees due to a lack of knowl-edge and understanding of M&E, as well as to a reluctance to changing the culture of the daily work routine. Many employees considered M&E an extra work burden. Employee ownership of the system is imperative to success. Regular meetings and interaction with the employees raised the level of awareness regarding the need to forecast and plan based on trends in prog-ress and availability of resources. Ownership and participation in develop-ing the system, collecting data, and identifying weaknesses and strengths were essential in getting the staff to understand the value of M&E. They were able to see the change in practice rather than simply reading compiled reports. They were able to appreciate their own performance and encour-aged to enhance their work. According to their fi rst M&E report, the staff used the result-based management approach to develop new procedures and strategies to enhance the quality of services provided, which served as guidance for the minister to approve new approaches recommended and were successful in the following year.
As a result of educating employees on the benefi ts of M&E, the same employees who initially resisted the system now consider it an indispens-able part of their work. For example, Amer Hyasat of the Social Defense Directorate, where the system was piloted, said, “The monitoring and eval-uation system has enabled us to improve performance, better understand the problems, and off er better interventions at the right times. . . . We need to move forward on this system and to connect it electronically with all directorates and fi eld offi ces.”
The second lesson was that there is a need for regular review and updates of the current status, especially when dealing with dynamic situations such as social development. Considering MoSD’s wide mandate in serving Jor-dan’s citizens, its role should be strengthened to develop comprehensive evidence-based social protection policies, programs, and projects with a special focus on vulnerable groups, grounded in an ongoing monitoring system. Monitoring and evaluation methods can benefi t high-impact MoSD programs such as Social Defense and Family Productivity Enhancement.
In conclusion, since the purpose of an M&E system at MoSD is to cre-ate a decision support system for social policies, it is recommended that the government proceed in using M&E systems for MoSD, disseminate MoSD’s experience in developing an M&E system and analysis procedure to other social development institutions and agencies concerned with social
186 Development Evaluation in Times of Turbulence
development and services, and provide the stakeholders of these agencies with the guidance of optimum integrated social policies.
Financial resources should be allocated to avoid negative gaps between supply and demand of social services, which would create a defi cit for MoSD and limit the services it is able to provide. To cover potential negative gaps, MoSD may consider outsourcing or increasing its allocation from the public budget. Another approach is to develop strategies and programs to decrease the number of benefi ciaries through preventive programs to help vulnerable groups avoid or escape the circle of poverty. Another strategy is to enhance the roles of civil society and nongovernmental organizations to create treat-ment and preventive programs to decrease the number of vulnerable groups and empower them to be independent, which would lessen the fi nancial burden on MoSD. M&E forecasting is a good tool to provide policy makers with a guide to which approaches to implement.
Notes
1. Data from the Water Authority of Jordan. 2. Jordan’s economy created 70,000 net jobs in 2007; 65,000 in 2008; 69,000 in
2009; and 26,000 in the fi rst half of 2010. 3. Data are from the National Aid Fund Report 2010 and the Ministry of Finance
General Report, January 2010. 4. See Jordan’s Socioeconomic Transformation Plan 2002–2004. 5. See Jordan’s Social and Economic Development Plan 2004–2006. 6. Based on the technical background of the participating staff in the training ses-
sions and level of ownership. 7. The number of battered women is not cumulative; it was taken at a moment in
time.
References
Government of Jordan. 2010. “Keeping the Promise and Achieving Aspirations,” Second National Millennium Development Goals Report. Government of Jordan.
World Bank. 2008. “Resolving Jordan’s Labor Market Paradox of Concurrent Economic Growth and High Unemployment.” Policy Note 39201, World Bank, Washington, DC.

187
National Performance Reporting as a Driver for National M&E Development The Experience of Botswana
Robert Lahey
Introduction
For more than a decade, developing countries have expressed considerable interest in introducing a results-oriented monitoring and evaluation (M&E) capability. Eff orts at introducing a systematic approach to M&E have been aligned with reporting on progress against the objectives of a country’s Pov-erty Reduction Strategy Paper (PRSP) or against the Millennium Develop-ment Goals (MDGs). Both eff orts have provided some incentive to measure and report on key national-level performance indicators.
Project-specifi c M&E is older and has been spurred by donor requirements for greater performance measurement, driven in part by the donor coun-try’s own requirements for accountability and reporting on performance.
CHAPTER 12

188 Development Evaluation in Times of Turbulence
Although neither comprehensive nor systemwide, these project evalua-tions have resulted in the creation of discrete pockets of M&E knowledge in developing countries (often in the health sector, for example). What has not always happened, though, is a level of coordination and harmonization across various donor-funded project- and program-level M&E eff orts.
Building a national evaluation or M&E system1 must be thought about in more than technocratic terms or in the historical pattern of M&E in the context of development aid. A new paradigm is emerging centered around national ownership and M&E capacity that is linked to the national vision of the country, accountability, and good governance (Menon 2010).
If an M&E system is to be owned by a country, it needs to be linked to the country’s national development plan and integrated into the operations and culture of government institutions and ministries. To create a sustain-able M&E system, governments must believe in the utility of the system and understand its benefi ts. To do that, they must eventually own the system. National ownership implies a particular cultural, social, and political con-text (Segone 2010).
Moving from concept to reality in M&E development and implementa-tion typically raises a number of hurdles for any country. Both a broad vision and a practical approach that will suit the circumstances of the country and its public sector are needed (Lahey 2012).
This chapter examines the case of Botswana, a country that has recently taken steps to strengthen its M&E capacity to better manage for results. The chapter explores how Botswana has used the development of its fi rst national performance report, Vision 2016 Botswana Performance Report, not only to raise the profi le of M&E and identify gaps in M&E for future capacity-building eff orts, but also to help create a demand for M&E across all sectors of society.
Botswana’s story of how its national performance reporting eff orts served as a driver for M&E capacity building should have broad application to the international community.2 This chapter highlights some of the lessons learned.
Framework for Developing a National M&E System
M&E should be considered within a broad “system” context, that is, recog-nizing that M&E is not an end in itself. This section discusses the underpin-nings of such a system, identifying the essential building blocks that serve as the basis for a successful M&E system.
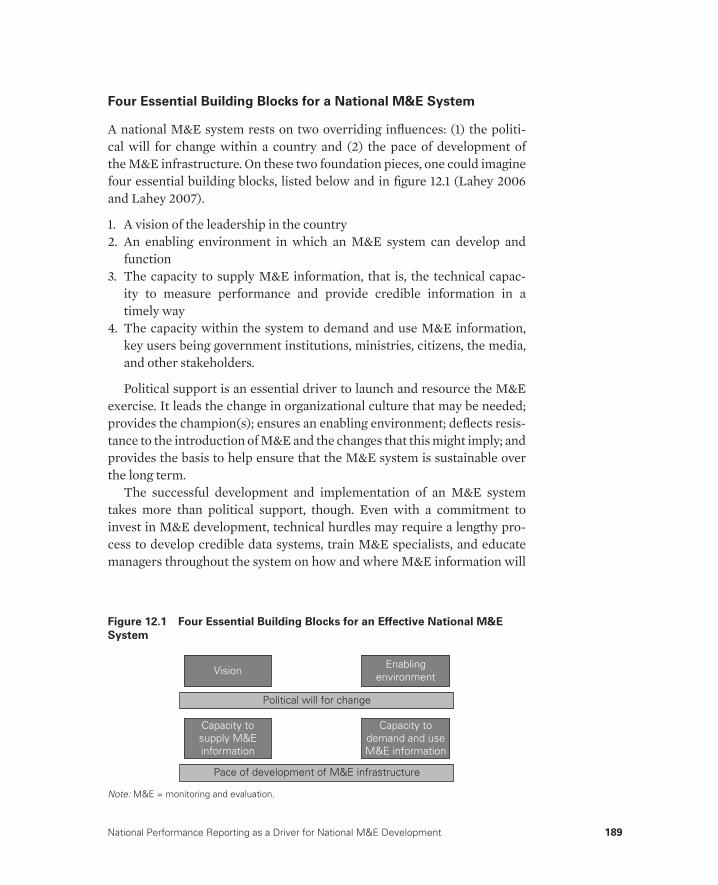
National Performance Reporting as a Driver for National M&E Development 189
Four Essential Building Blocks for a National M&E System
A national M&E system rests on two overriding infl uences: (1) the politi-cal will for change within a country and (2) the pace of development of the M&E infrastructure. On these two foundation pieces, one could imagine four essential building blocks, listed below and in fi gure 12.1 (Lahey 2006 and Lahey 2007).
1. A vision of the leadership in the country2. An enabling environment in which an M&E system can develop and
function3. The capacity to supply M&E information, that is, the technical capac-
ity to measure performance and provide credible information in a timely way
4. The capacity within the system to demand and use M&E information, key users being government institutions, ministries, citizens, the media, and other stakeholders.
Political support is an essential driver to launch and resource the M&E exercise. It leads the change in organizational culture that may be needed; provides the champion(s); ensures an enabling environment; defl ects resis-tance to the introduction of M&E and the changes that this might imply; and provides the basis to help ensure that the M&E system is sustainable over the long term.
The successful development and implementation of an M&E system takes more than political support, though. Even with a commitment to invest in M&E development, technical hurdles may require a lengthy pro-cess to develop credible data systems, train M&E specialists, and educate managers throughout the system on how and where M&E information will
Figure 12.1 Four Essential Building Blocks for an Effective National M&E
System
Vision Enablingenvironment
Political will for change
Pace of development of M&E infrastructure
Capacity tosupply M&Einformation
Capacity todemand and useM&E information
Note: M&E = monitoring and evaluation.
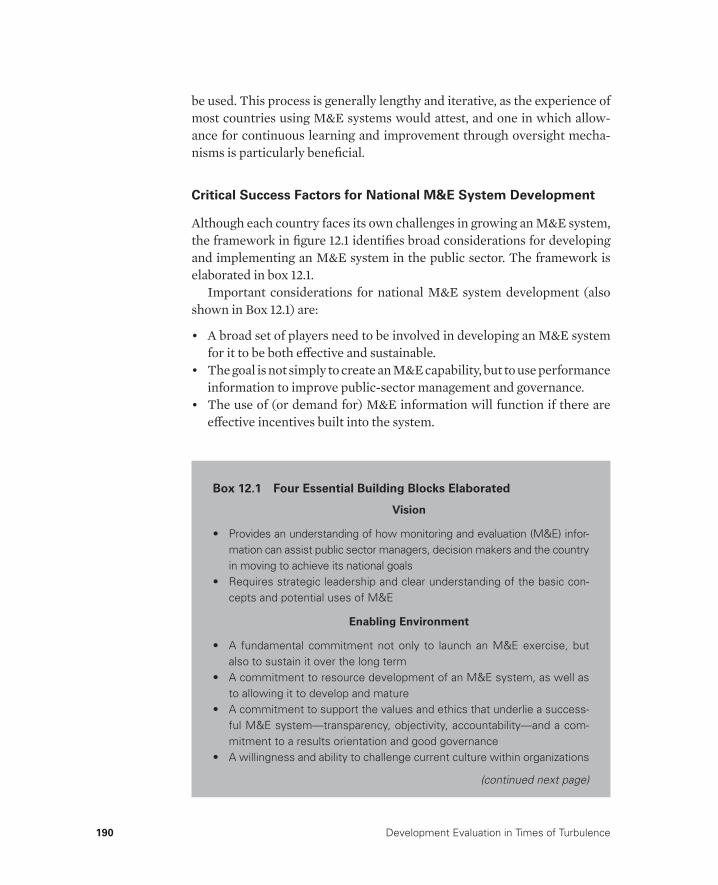
190 Development Evaluation in Times of Turbulence
be used. This process is generally lengthy and iterative, as the experience of most countries using M&E systems would attest, and one in which allow-ance for continuous learning and improvement through oversight mecha-nisms is particularly benefi cial.
Critical Success Factors for National M&E System Development
Although each country faces its own challenges in growing an M&E system, the framework in fi gure 12.1 identifi es broad considerations for developing and implementing an M&E system in the public sector. The framework is elaborated in box 12.1.
Important considerations for national M&E system development (also shown in Box 12.1) are:
• A broad set of players need to be involved in developing an M&E system for it to be both eff ective and sustainable.
• The goal is not simply to create an M&E capability, but to use performance information to improve public-sector management and governance.
• The use of (or demand for) M&E information will function if there are eff ective incentives built into the system.
Box 12.1 Four Essential Building Blocks Elaborated
Vision
• Provides an understanding of how monitoring and evaluation (M&E) infor-mation can assist public sector managers, decision makers and the country in moving to achieve its national goals
• Requires strategic leadership and clear understanding of the basic con-cepts and potential uses of M&E
Enabling Environment
• A fundamental commitment not only to launch an M&E exercise, but also to sustain it over the long term
• A commitment to resource development of an M&E system, as well as to allowing it to develop and mature
• A commitment to support the values and ethics that underlie a success-ful M&E system—transparency, objectivity, accountability—and a com-mitment to a results orientation and good governance
• A willingness and ability to challenge current culture within organizations
(continued next page)
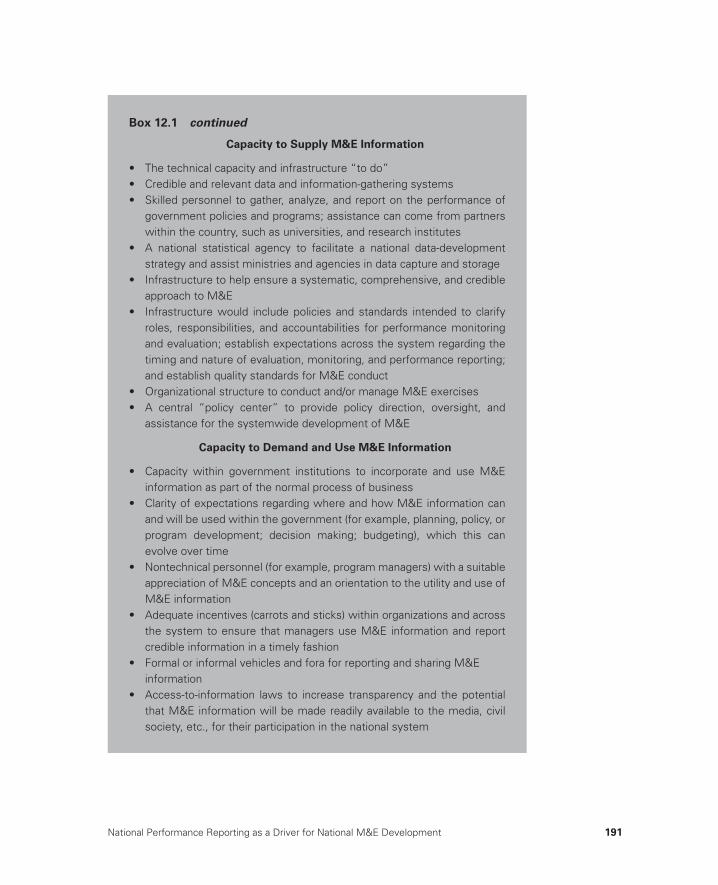
National Performance Reporting as a Driver for National M&E Development 191
Box 12.1 continued
Capacity to Supply M&E Information
• The technical capacity and infrastructure “to do”• Credible and relevant data and information-gathering systems• Skilled personnel to gather, analyze, and report on the performance of
government policies and programs; assistance can come from partners within the country, such as universities, and research institutes
• A national statistical agency to facilitate a national data-development strategy and assist ministries and agencies in data capture and storage
• Infrastructure to help ensure a systematic, comprehensive, and credible approach to M&E
• Infrastructure would include policies and standards intended to clarify roles, responsibilities, and accountabilities for performance monitoring and evaluation; establish expectations across the system regarding the timing and nature of evaluation, monitoring, and performance reporting; and establish quality standards for M&E conduct
• Organizational structure to conduct and/or manage M&E exercises• A central “policy center” to provide policy direction, oversight, and
assistance for the systemwide development of M&E
Capacity to Demand and Use M&E Information
• Capacity within government institutions to incorporate and use M&E information as part of the normal process of business
• Clarity of expectations regarding where and how M&E information can and will be used within the government (for example, planning, policy, or program development; decision making; budgeting), which this can evolve over time
• Nontechnical personnel (for example, program managers) with a suitable appreciation of M&E concepts and an orientation to the utility and use of M&E information
• Adequate incentives (carrots and sticks) within organizations and across the system to ensure that managers use M&E information and report credible information in a timely fashion
• Formal or informal vehicles and fora for reporting and sharing M&E information
• Access-to-information laws to increase transparency and the potential that M&E information will be made readily available to the media, civil society, etc., for their participation in the national system

192 Development Evaluation in Times of Turbulence
• Although the collection and analysis of performance information gen-erally requires the assistance of technically trained analysts and data specialists, the use of this performance information is generally carried out by nontechnical managers. Though they do not require a technical comprehension of M&E methods, it is important for these managers to understand and appreciate how and where M&E information can help them manage their programs and policies.
Moving from Concept to Reality—Assessing Botswana’s M&E Aspirations and Readiness
This section describes the case of Botswana, where, despite political sup-port and an enabling environment, the realities of technical capacity gaps resulted in a need to develop a strategy that incorporated short-term and longer-term components as the way forward for M&E system development.
Botswana’s National Vision (Vision 2016) Drove the Need for a
National M&E System
In 1996, Botswana developed its Vision 2016 through a national consulta-tion process with the express purpose of defi ning a long-term vision for Botswana. The work to develop this vision was led by a presidential task group that represented all sectors of Batswana society, including political parties, parastatals, private sector organizations, nongovernmental orga-nizations (NGOs), trade unions, and religious organizations. Through a broad consultation with the public, a succinct statement was developed that refl ected both the aspirations of the nation and key priority issues on which Botswana would need to focus to move forward as a people, a nation, and within the global economic environment.
The result, A Long Term Vision for Botswana, identifi ed seven pillars defi ning direction for “the way ahead” to the year 2016, the 50th anniversary of independence for the country. Box 12.2 identifi es the seven pillars—broad goals that must be met if the country is to achieve “prosperity for all” by 2016. It also shows key result areas (KRAs) that represent a succinct identi-fi cation of the nation’s expectations for each of the seven pillars.3
As part of the institutional arrangements to monitor and report on the progress of Vision 2016, two key bodies were established: a Vision Council and a Vision Secretariat. The Vision Council was set up as an independent and nonpartisan body to monitor and assess the performance, prog-ress, and achievements of Vision 2016 activities until 2016 and beyond.
National Performance Reporting as a Driver for National M&E Development 193
It has 19 members drawn from all sectors of Batswana society including government, the private sector, and civil society. The Vision Secretariat is led by the Vision Coordinator, who, with a team of about fi ve profession-als, supports the mandate of the council.
In the delivery of its mandate, the council is guided by the following terms of reference:
• To drive and monitor the implementation of Vision 2016 and to address problems and challenges that may be faced during implementation
• To generate sustained ownership of the vision by all stakeholders, and a national consensus on national directions and strategies
• To harmonize and promote cooperation among various sectoral objec-tives, and bring them within the larger national interest
• To call for information, and to conduct public hearings or special investigations
• To coordinate stakeholder feedback for eff ective policy implementation• To monitor the implementation of national development plans as vehi-
cles of the vision• To commission the translation of the materials relating to the vision into
Setswana and other languages• To regularly review the membership and functions of the council in
response to changing circumstances.
With a clear mandate for monitoring and evaluation, the Vision Coun-cil and its secretariat have worked over the past decade aiming to develop a comprehensive national M&E system. However, major challenges (both technical and institutional) have yielded mixed results. In 2008, a new attempt was launched to establish a national M&E framework; it began with the conduct of an M&E readiness assessment, an approach strongly recom-mended by the World Bank as a good-practice fi rst step toward M&E frame-work development (Kusek and Rist 2004). The framework process provided an opportunity to assess the presence and strength of the four M&E build-ing blocks described in fi gure 12.1 and box 12.1, which was important in determining an appropriate country strategy for M&E system development.
Political Will and an Enabling Environment for National M&E
System Development
The M&E readiness assessment pointed out the drivers behind the desire for developing an improved approach to national M&E in Botswana. It included not only the Vision Council’s eff orts to develop a capability to carry out an oversight role for Vision 2016, but also the public sector
194 Development Evaluation in Times of Turbulence
reform agenda being led by the Offi ce of the President. The reform agenda had resulted in several cross-government initiatives launched over the past decade that aimed to bring more accountability into the public sector; improve management and governance of individual ministries and across ministries; encourage systematic macro- and sector-specifi c planning; and raise the focus of monitoring and management decision making from “expenditures” and “activities” to “results.”
Clearly, in 2008 Botswana was experiencing a supportive environment for M&E capacity building that refl ected not only the independent, nonpar-tisan Vision Council, but also the political level. The Offi ce of the President was advocating results-based management (RBM) across the public sector and, together with the Ministry of Finance and Development Planning, was crafting an “M&E chapter” for the tenth version of its medium-term national development plan (NDP 10) that identifi ed the need for ministries to embrace results-oriented M&E. Additionally, the Offi ce of the President created a new unit intended to provide M&E oversight across the public sector.
For its part, the Vision Council felt a need to respond to the fundamental question being raised among Batswana: “Where are we?” in regard to perfor-mance and progress against the targets set in the seven Vision 2016 pillars. The fact that Botswana was headed toward the last leg of Vision 2016 added to the urgency to improve its ability to measure and report on performance.
Issues of Technical Capacity: Establishing Short-Term and Long -Term Strategies for M&E Development
Although there were senior leadership champions for M&E, as well as an apparent commitment to develop a national M&E capability in Botswana, an M&E readiness assessment revealed critical defi ciencies in both the capac-ity to supply and to use M&E information. Key constraints in the capacity to supply M&E information included: insuffi cient human resources with M&E or analytical skills; substantial data problems, primarily lack of cred-ible, quality, results-oriented data supplied in a timely fashion, and, when needed, at a subnational level; and little or no experience with the conduct of evaluation studies.
Regarding the capacity to demand and use M&E information, although there was a broad-based demand for national performance reporting (cham-pioned by the Vision Council and its secretariat), ministry-level use of M&E was less clear. As box 12.1 points out, the expectations of where and how M&E information can and will be used within government (for example,
National Performance Reporting as a Driver for National M&E Development 195
to support planning, policy, or program development, decision making, or budgeting) is a fundamental requirement of an eff ective M&E system. These expectations can, of course, evolve over time.
Faced with serious defi ciencies yet immediate needs, Botswana adopted a strategy to move ahead on national M&E development with a two-pronged approach encompassing the short and long term. In the short term, the aim was to develop a comprehensive national performance report that responded to the needs of Vision Council to answer the question “Where are we?” in terms of the Vision 2016 goals. In the long term, the aim was to build the needed M&E infrastructure to fi ll capacity gaps across the system associated with the ability to supply and to use M&E information.
Whereas the short-term exercise was being viewed as a “quick win” because it would produce very public results (a national performance report), the much-less-visible longer-term objective needed an action plan and an expectation to demonstrate results against its longer timeline. The short-term exercise was expected to take no more than six months, while the longer-term project was expected to be carried out over three to fi ve years. Moreover, the broader project would require a substantial invest-ment, particularly in data development and analytical capacity, across Botswana’s public sector.
Developing a National Performance Report as a Driver for M&E Capacity Building
Developing a national performance report on Botswana’s Vision 2016 goals, which came to be known as Botswana’s Performance Report (2009), was set up as a separate exercise from the longer-term development work.
Strategy for Performance Measurement and Reporting
The M&E readiness assessment showed that monitoring the Vision 2016 pillars was hampered by a lack of systematic data to populate and report against indicators on “results achieved.” It was hoped that the M&E capacity- building eff orts for the longer-term plan (ideally generated during Botswana’s mid-term plan) would, over time, yield a more comprehensive results-oriented information base.
Hampered by a paucity of data, the inaugural edition of Botswana’s Per-formance Report4 used a broad-based approach to draw relevant data and information from a variety of sources across the public sector, private sector, and civil society, as well as from international sources.
196 Development Evaluation in Times of Turbulence
The measurement strategy drew on areas of strength that had been iden-tifi ed during the readiness assessment, rather than focusing on weaknesses and capacity gaps in the system. “Pockets” of M&E strength and analyti-cal expertise included M&E units in a few ministries (such as Agriculture) where there was generally limited experience and often unfi lled positions, but a potential for future M&E eff orts. Additionally, a growing number of offi cials (mostly, but not exclusively public servants) had received train-ing at the International Program for Development Evaluation Training (IPDET), held annually in Ottawa, Canada, as a joint venture between the World Bank and Carleton University. These IPDET graduates were useful contacts for relevant M&E information and can in the future form the basis of an M&E network for Botswana. All of this serves to build a foundation in the understanding of results-based management and the role of M&E across the public sector.
An important institution for any national M&E system is the national statistics offi ce: the data experts. In Botswana, the Central Statistics Offi ce (CSO) was the keeper of the original Vision 2016 M&E system, a fi rst attempt developed in 2001 with the assistance of the United Nations Devel-opment Programme (UNDP). Whereas the failures of the original Vision M&E system were well documented, CSO still has an important role to play in ensuring that data development across Botswana is carried out in a cost-eff ective fashion that will support future M&E eff orts, including national performance measurement and reporting. The elements described above are needed to build a future M&E system.
For the immediate needs of developing a national performance report, there was a greater sense of urgency, created in large part by the high-level audience—the president of Botswana and his high-level consultative com-mittee. To meet the short-term objective, a new approach to performance reporting was adopted—one that told a “performance story” for Botswana by relying on both quantitative and qualitative information and incorporat-ing success stories to illustrate where, how, and to what extent progress was being made for each Vision 2016 pillar.
Telling Botswana’s “Performance Story” with Limited Data
Measuring and reporting on performance for each of the seven Vision 2016 pillars meant clarifying the intent of each Vision pillar. The original Vision 2016 document off ered a set of 43 “expectations for the nation” that could be succinctly articulated as a set of 18 KRAs. The 43 statements are shown in annex 12A and the KRAs refl ected in Vision 2016 are listed in box 12.2.
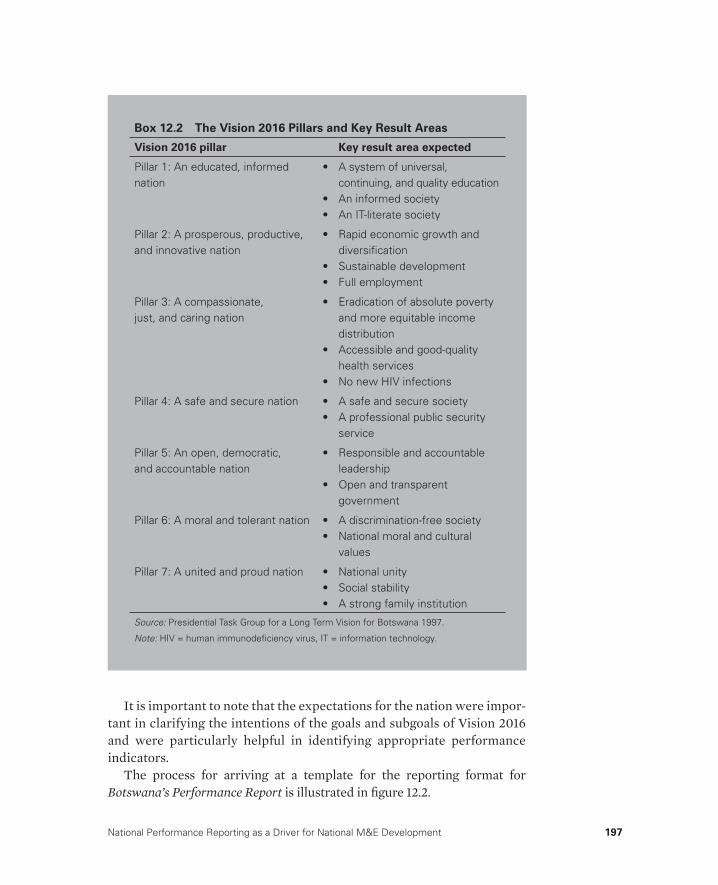
National Performance Reporting as a Driver for National M&E Development 197
Box 12.2 The Vision 2016 Pillars and Key Result Areas
Vision 2016 pillar Key result area expected
Pillar 1: An educated, informed nation
• A system of universal, continuing, and quality education
• An informed society• An IT-literate society
Pillar 2: A prosperous, productive, and innovative nation
• Rapid economic growth and diversifi cation
• Sustainable development• Full employment
Pillar 3: A compassionate, just, and caring nation
• Eradication of absolute poverty and more equitable income distribution
• Accessible and good-quality health services
• No new HIV infections
Pillar 4: A safe and secure nation • A safe and secure society• A professional public security
service
Pillar 5: An open, democratic, and accountable nation
• Responsible and accountable leadership
• Open and transparent government
Pillar 6: A moral and tolerant nation • A discrimination-free society• National moral and cultural
values
Pillar 7: A united and proud nation • National unity• Social stability• A strong family institution
Source: Presidential Task Group for a Long Term Vision for Botswana 1997.
Note: HIV = human immunodefi ciency virus, IT = information technology.
It is important to note that the expectations for the nation were impor-tant in clarifying the intentions of the goals and subgoals of Vision 2016 and were particularly helpful in identifying appropriate performance indicators.
The process for arriving at a template for the reporting format for Botswana’s Performance Report is illustrated in fi gure 12.2.
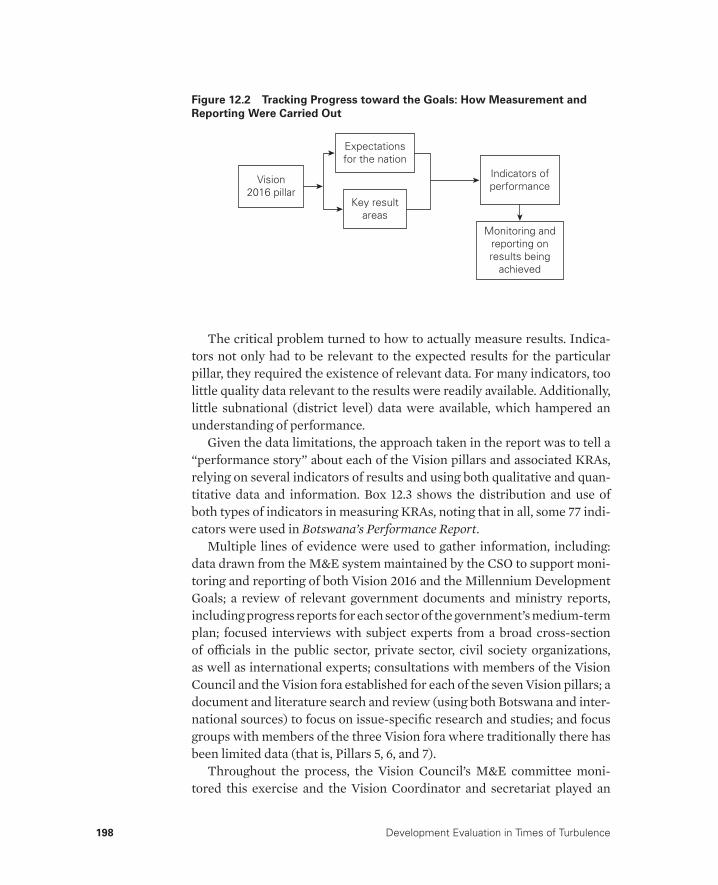
198 Development Evaluation in Times of Turbulence
The critical problem turned to how to actually measure results. Indica-tors not only had to be relevant to the expected results for the particular pillar, they required the existence of relevant data. For many indicators, too little quality data relevant to the results were readily available. Additionally, little subnational (district level) data were available, which hampered an understanding of performance.
Given the data limitations, the approach taken in the report was to tell a “performance story” about each of the Vision pillars and associated KRAs, relying on several indicators of results and using both qualitative and quan-titative data and information. Box 12.3 shows the distribution and use of both types of indicators in measuring KRAs, noting that in all, some 77 indi-cators were used in Botswana’s Performance Report.
Multiple lines of evidence were used to gather information, including: data drawn from the M&E system maintained by the CSO to support moni-toring and reporting of both Vision 2016 and the Millennium Development Goals; a review of relevant government documents and ministry reports, including progress reports for each sector of the government’s medium-term plan; focused interviews with subject experts from a broad cross- section of offi cials in the public sector, private sector, civil society organizations, as well as international experts; consultations with members of the Vision Council and the Vision fora established for each of the seven Vision pillars; a document and literature search and review (using both Botswana and inter-national sources) to focus on issue -specifi c research and studies; and focus groups with members of the three Vision fora where traditionally there has been limited data (that is, Pillars 5, 6, and 7).
Throughout the process, the Vision Council’s M&E committee moni-tored this exercise and the Vision Coordinator and secretariat played an
Figure 12.2 Tracking Progress toward the Goals: How Measurement and
Reporting Were Carried Out
Vision2016 pillar
Key resultareas
Indicators ofperformance
Monitoring andreporting onresults being
achieved
Expectationsfor the nation
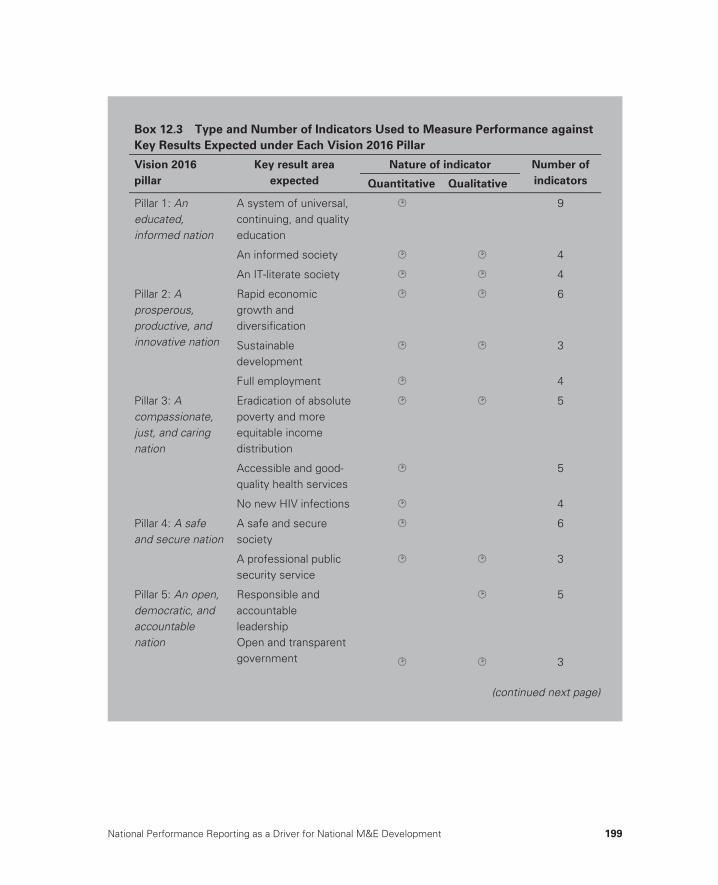
National Performance Reporting as a Driver for National M&E Development 199
Box 12.3 Type and Number of Indicators Used to Measure Performance against Key Results Expected under Each Vision 2016 Pillar
Vision 2016 pillar
Key result area expected
Nature of indicator Number of indicatorsQuantitative Qualitative
Pillar 1: An educated, informed nation
A system of universal, continuing, and quality education
9
An informed society 4
An IT-literate society 4
Pillar 2: A prosperous, productive, and innovative nation
Rapid economic growth and diversification
6
Sustainable development
3
Full employment 4
Pillar 3: A compassionate, just, and caring nation
Eradication of absolute poverty and more equitable income distribution
5
Accessible and good- quality health services
5
No new HIV infections 4
Pillar 4: A safe and secure nation
A safe and secure society
6
A professional public security service
3
Pillar 5: An open, democratic, and accountable nation
Responsible and accountable leadership Open and transparent government
5
3
(continued next page)
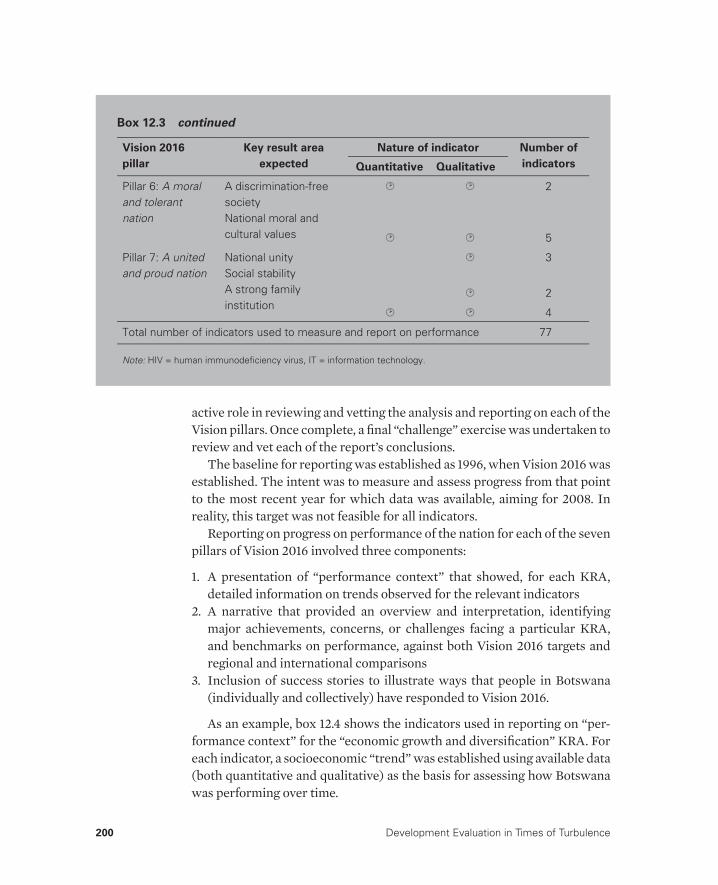
200 Development Evaluation in Times of Turbulence
active role in reviewing and vetting the analysis and reporting on each of the Vision pillars. Once complete, a fi nal “challenge” exercise was undertaken to review and vet each of the report’s conclusions.
The baseline for reporting was established as 1996, when Vision 2016 was established. The intent was to measure and assess progress from that point to the most recent year for which data was available, aiming for 2008. In reality, this target was not feasible for all indicators.
Reporting on progress on performance of the nation for each of the seven pillars of Vision 2016 involved three components:
1. A presentation of “performance context” that showed, for each KRA, detailed information on trends observed for the relevant indicators
2. A narrative that provided an overview and interpretation, identifying major achievements, concerns, or challenges facing a particular KRA, and benchmarks on performance, against both Vision 2016 targets and regional and international comparisons
3. Inclusion of success stories to illustrate ways that people in Botswana (individually and collectively) have responded to Vision 2016.
As an example, box 12.4 shows the indicators used in reporting on “per-formance context” for the “economic growth and diversifi cation” KRA. For each indicator, a socioeconomic “trend” was established using available data (both quantitative and qualitative) as the basis for assessing how Botswana was performing over time.
Box 12.3 continued
Vision 2016 pillar
Key result area expected
Nature of indicator Number of indicatorsQuantitative Qualitative
Pillar 6: A moral and tolerant nation
A discrimination-free society National moral and cultural values
2
5
Pillar 7: A united and proud nation
National unitySocial stability A strong family institution
3
2
4
Total number of indicators used to measure and report on performance 77
Note: HIV = human immunodeficiency virus, IT = information technology.
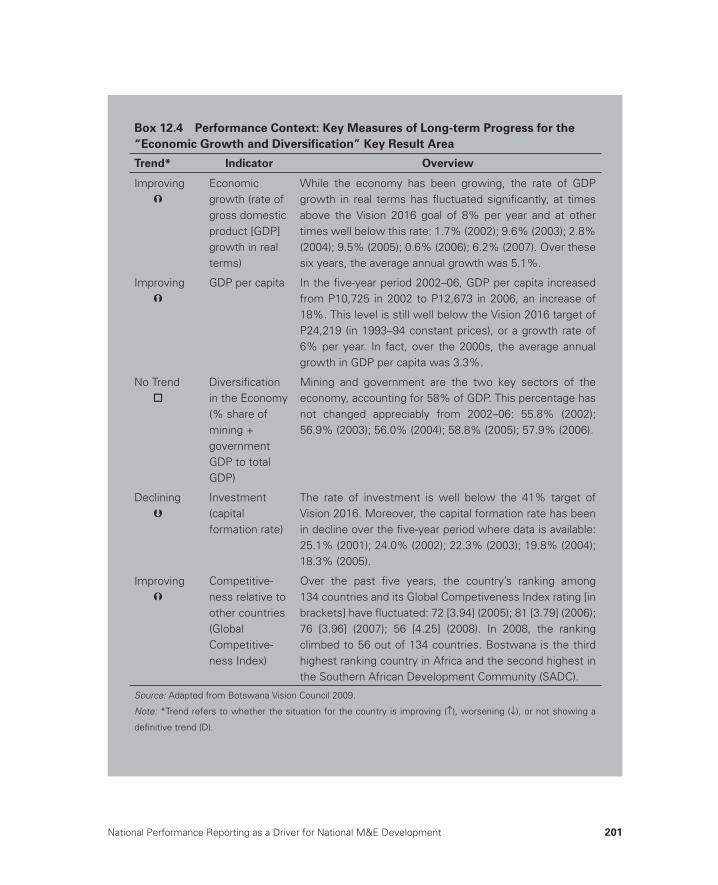
National Performance Reporting as a Driver for National M&E Development 201
Box 12.4 Performance Context: Key Measures of Long-term Progress for the
“Economic Growth and Diversifi cation” Key Result Area
Trend* Indicator Overview
Improving›
Economic growth (rate of gross domestic product [GDP] growth in real terms)
While the economy has been growing, the rate of GDP growth in real terms has fl uctuated signifi cantly, at times above the Vision 2016 goal of 8% per year and at other times well below this rate: 1.7% (2002); 9.6% (2003); 2.8% (2004); 9.5% (2005); 0.6% (2006); 6.2% (2007). Over these six years, the average annual growth was 5.1%.
Improving›
GDP per capita In the fi ve-year period 2002–06, GDP per capita increased from P10,725 in 2002 to P12,673 in 2006, an increase of 18%. This level is still well below the Vision 2016 target of P24,219 (in 1993–94 constant prices), or a growth rate of 6% per year. In fact, over the 2000s, the average annual growth in GDP per capita was 3.3%.
No Trendo
Diversifi cation in the Economy (% share of mining + government GDP to total GDP)
Mining and government are the two key sectors of the economy, accounting for 58% of GDP. This percentage has not changed appreciably from 2002–06: 55.8% (2002); 56.9% (2003); 56.0% (2004); 58.8% (2005); 57.9% (2006).
Decliningfi
Investment (capital formation rate)
The rate of investment is well below the 41% target of Vision 2016. Moreover, the capital formation rate has been in decline over the fi ve-year period where data is available: 25.1% (2001); 24.0% (2002); 22.3% (2003); 19.8% (2004); 18.3% (2005).
Improving›
Competitive-ness relative to other countries (Global Competitive-ness Index)
Over the past fi ve years, the country’s ranking among 134 countries and its Global Competiveness Index rating [in brackets] have fl uctuated: 72 [3.94] (2005); 81 [3.79] (2006); 76 [3.96] (2007); 56 [4.25] (2008). In 2008, the ranking climbed to 56 out of 134 countries. Bostwana is the third highest ranking country in Africa and the second highest in the Southern African Development Community (SADC).
Source: Adapted from Botswana Vision Council 2009.
Note: *Trend refers to whether the situation for the country is improving (↑), worsening (↓), or not showing a
defi nitive trend (D).
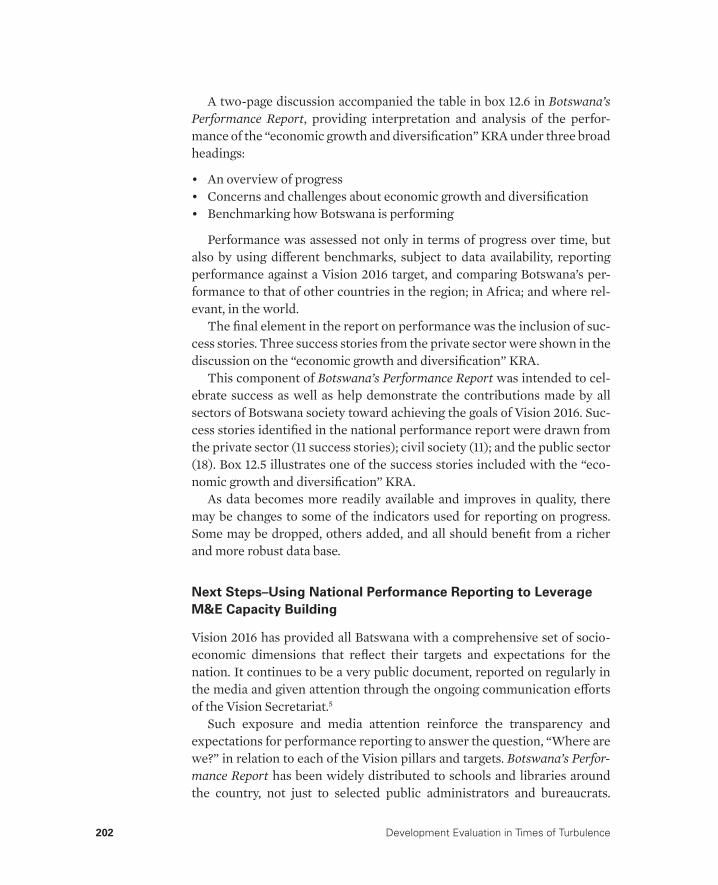
202 Development Evaluation in Times of Turbulence
A two-page discussion accompanied the table in box 12.6 in Botswana’s Performance Report, providing interpretation and analysis of the perfor-mance of the “economic growth and diversifi cation” KRA under three broad headings:
• An overview of progress• Concerns and challenges about economic growth and diversifi cation• Benchmarking how Botswana is performing
Performance was assessed not only in terms of progress over time, but also by using diff erent benchmarks, subject to data availability, reporting performance against a Vision 2016 target, and comparing Botswana’s per-formance to that of other countries in the region; in Africa; and where rel-evant, in the world.
The fi nal element in the report on performance was the inclusion of suc-cess stories. Three success stories from the private sector were shown in the discussion on the “economic growth and diversifi cation” KRA.
This component of Botswana’s Performance Report was intended to cel-ebrate success as well as help demonstrate the contributions made by all sectors of Botswana society toward achieving the goals of Vision 2016. Suc-cess stories identifi ed in the national performance report were drawn from the private sector (11 success stories); civil society (11); and the public sector (18). Box 12.5 illustrates one of the success stories included with the “eco-nomic growth and diversifi cation” KRA.
As data becomes more readily available and improves in quality, there may be changes to some of the indicators used for reporting on progress. Some may be dropped, others added, and all should benefi t from a richer and more robust data base.
Next Steps–Using National Performance Reporting to Leverage
M&E Capacity Building
Vision 2016 has provided all Batswana with a comprehensive set of socio-economic dimensions that refl ect their targets and expectations for the nation. It continues to be a very public document, reported on regularly in the media and given attention through the ongoing communication eff orts of the Vision Secretariat.5
Such exposure and media attention reinforce the transparency and expectations for performance reporting to answer the question, “Where are we?” in relation to each of the Vision pillars and targets. Botswana’s Perfor-mance Report has been widely distributed to schools and libraries around the country, not just to selected public administrators and bureaucrats.
National Performance Reporting as a Driver for National M&E Development 203
Box 12.5 The Business Place Project: A Vision Pillar Success
Story Refl ecting the “Economic Growth and Diversifi cation”
Key Result Area
Established as a nonprofi t organization, the Business Place aims to foster entrepreneurship in the country, by assisting small and microenterprises by providing affordable and accessible services such as developing business plans and fi nancial proposals. In this way, it works to help aspiring entrepre-neurs towards reaching their business goals. It is funded and directed by a public–private partnership that includes: Investec, Barloworld, Kgalagadi Beverages Trust, Community of Economic Development Association, Motor Centre Group, University of Botswana, University of Botswana Foundation, Department of Culture and Youth, and First National Bank.
To date, the project has helped over 2,045 clients to develop business plans, 173 clients start their businesses, and 16 to secure funds from repu-table sponsors. Currently, eight projects are in the process of being funded. Of those who have been assisted, 60 percent are male and 40 percent are female. The majority of those assisted (some 80 percent) are under 35 years of age.
Additionally, it has received attention and discussion at the highest levels in Botswana. The president and his high-level consultative committee were a key audience during the initial roll-out of Botswana’s Performance Report. Moreover, the Vision Coordinator is automatically included in broad con-sultations dealing with the medium-term plan for the nation and Vision 2016 goals, and results-oriented KRAs form the focus of these plans.
Some obvious elements emerge from a reading of the national perfor-mance report. Included on the short list of “key challenge areas” is the con-cern for “data and information to assist monitoring and evaluation”:
The greatest defi ciency impairing the Vision Council’s ability to monitor and report on progress of the Vision 2016 Pillars is a general lack of data. That is, the “right data,” data that relates to “results” of programmes or policies; data that has been collected in a consistent and systematic way; data that can be collected, recorded and classifi ed in more detail at a local level; and so on (Botswana Vision Council 2009, 7).
Identifi ed in the report’s executive summary as one of six major chal-lenges for the future for Botswana, this concern for data and M&E was presented along with the fi ve other key challenges: economic growth and diversifi cation; transformation of agriculture; poverty; human immunode-fi ciency/acquired immune defi ciency syndrome; and the impact that the

204 Development Evaluation in Times of Turbulence
pace of change is having on the transformation of Batswana society. The importance of this placement is to bring recognition to the fact that, through improved data and strengthened M&E, Botswana will be better able to deal with its key social and economic challenges. It highlights the capacity gaps and reinforces the need for M&E capacity building in the country.
As a public document with wide exposure, such messaging can be power-ful in leveraging future M&E capacity-building eff orts. Whether or not this report has any infl uence on events to follow, it is encouraging to note that a transformation is taking place with the national data offi ce. During 2011 and 2012, CSO was being transformed into Statistics Botswana with a new structure and mandate. It is premature to know what eff ect this change will have on data development across the country, but this is an important fi rst step in the right direction for Botswana.
In addition to drawing attention to the need for data development, an area often ignored by countries, the national performance report identifi ed areas for possible future evaluation or special issue-oriented studies. Through both a narrative and an easy-to-read “Status at a Glance,” the executive sum-mary clearly points out areas where future eff orts should be targeted.
The “Status at a Glance” showed a three-level rating of progress for each of the 43 KRA/expectation combinations that underlie Vision 2016. Although somewhat simplistic (though appealing to those who seek a sim-ple “dashboard” reading of performance), Botswana’s key challenge areas become immediately apparent. The rating reinforces the obvious conclu-sion that there is a need to examine more closely (via evaluation or special study) the policies and programs in areas that continually cause the country problems despite a high level of investment in government programs.
Given the country’s limited capacity for evaluation, this rating helps focus on where the greatest gains (best “bang for the buck”) can likely be achieved through targeted evaluation eff orts. It also identifi es stakeholders (such as government ministries and agencies) that should be targeted for evaluation capacity-building eff orts, at least in the short term. Annex A pro-vides a slightly modifi ed version of the “Status at a Glance” in Vision 2016 Botswana Performance Report.
Lessons Learned for National M&E System Development
The challenges in building a national M&E system are great, and consider-able lessons can be drawn from the experience of both developed and devel-oping countries.6

National Performance Reporting as a Driver for National M&E Development 205
Box 12.6 identifi es some key challenges and lessons for national M&E capacity development drawn from country experiences over the past two decades. The list incorporates lessons drawn from Botswana’s recent expe-rience with national performance measurement and reporting.
Box 12.6 Lessons Learned for National M&E System Development
Understand the political environment
Recognize the importance of senior leadership and political support to champion and drive change, especially when accountability has not traditionally been an important element of pub-lic sector management.
A serious effort to build a national monitoring and evaluation (M&E) system starts with a sub-stantive government demand for M&E information. It requires a political will and sustained commitment. Central leadership and a plan are very important.
Manage the expectations and impatience of senior offi cials
Educate senior offi cials on M&E. They are an important audience.
Ensure that senior offi cials recognize that M&E development is long term and iterative. It is generally not possible to achieve in one or two years what some others have been working at for many years. Bring a reality check.
Provide “quick wins” (such as Botswana’s Performance Report) to demonstrate the utility of M&E.
Know the importance of data development
Do not wait for perfection.
Rely on both qualitative and quantitative information to populate indicators.
Plan and work to use both the “E” and the “M” to measure performance.
Finding too little “quality” data likely means that a national data development strategy and plan need to be developed. Ensure that the country’s national data agency is a part of this exercise.
Data development needs to be recognized as a long-term investment.
Avoid the danger of overengineering
Overengineering an M&E system could produce a proliferation of indicators and/or a large set of uncoordinated data systems across ministries. Data development is important, but not cost-less, and needs leadership from the central ministry, the national data offi ce, and relevant ministries.
(continued next page)

206 Development Evaluation in Times of Turbulence
Box 12.6 continued
Too few human resources skilled in M&E
Recognize that training is a long-term investment.
Establish a training and development strategy aimed at target audiences, such as M&E ana-lysts, government managers, and senior offi cials, that is, both the providers and users of M&E information.
With limited resources, seek to partner and network with “pockets” of analytical expertise and opportunities for training such as International Program for Development Evaluation Training (IPDET), mentoring programs, professional associations or networks, and universities.
If there are too few skilled human resources, it is better to do a pilot implementation rather than attempt a governmentwide roll-out of M&E.
Carrying out evaluations
Ensure that the “E” in an M&E system is not overlooked, even in the planning stages.
Developing an evaluation policy center and an evaluation strategy helps position and resource the function.
Start modestly—one or two evaluations a year.
Select areas of high priority for the government.
Work to ensure that momentum is not lost once the evaluation study is completed; that is, keep a focus on follow-up to the evaluation to ensure that results get used in policy and program development.
Create greater understanding of why evaluation is important to government and how it can be used.
Implementing a national M&E system
Implementation of results-based M&E is often overlooked. Proponents need to detail and resource a plan to move from concept to reality.
Since countries’ M&E systems are generally developed incrementally, it is important to monitor progress and make adjustments along the way. This oversight role can be a part of the mandate of a central agency.
Rolling out an M&E system needs to be seen as far more than a technical issue. Policy makers need to understand the importance of positioning M&E as a mechanism to support public sec-tor management.
(continued next page)

National Performance Reporting as a Driver for National M&E Development 207
Box 12.6 continued
M&E information is not an end in itself. That is, a supply of good evaluations is not enough; a reasonable demand for evaluation is key.
Internal infrastructure is usually insuffi cient to sustain an M&E system. A number of formal re-quirements associated with its use (at the ministry level, the central level,and in the context of both management and accountability) will force managers and senior offi cials to take the time and effort to invest in M&E development.
M&E system development requires building capacity to use M&E information within and across organizations (in addition to building capacity to do M&E).
Annex 12A Status at a GlanceAn overview of progress being made against the “Expectations for the Nation” for each Vision pillar
Progress being made and a conducive environment exists for continued progress
Some concerns, even though progress being made
⌦ Major challenges
Key Result
Area Expectations for the Nation
Progress being
made?*
Vision Pillar One: An Educated and Informed Nation
Universal, continuing, and quality education
1. The system of education will be both accessible and provide for quality education.
2. Vocational or technical training will serve as an alternative to mainstream education.
3. Different languages and cultural traditions will be recognized, supported, and strengthened within the education system.
⌦
Informed society
4. Botswana will become a regional leader in the production and dissemination of information.
5. There will be a culture of transparency and accountability in government, private sector, and other organizations in Botswana.
(continued next page)
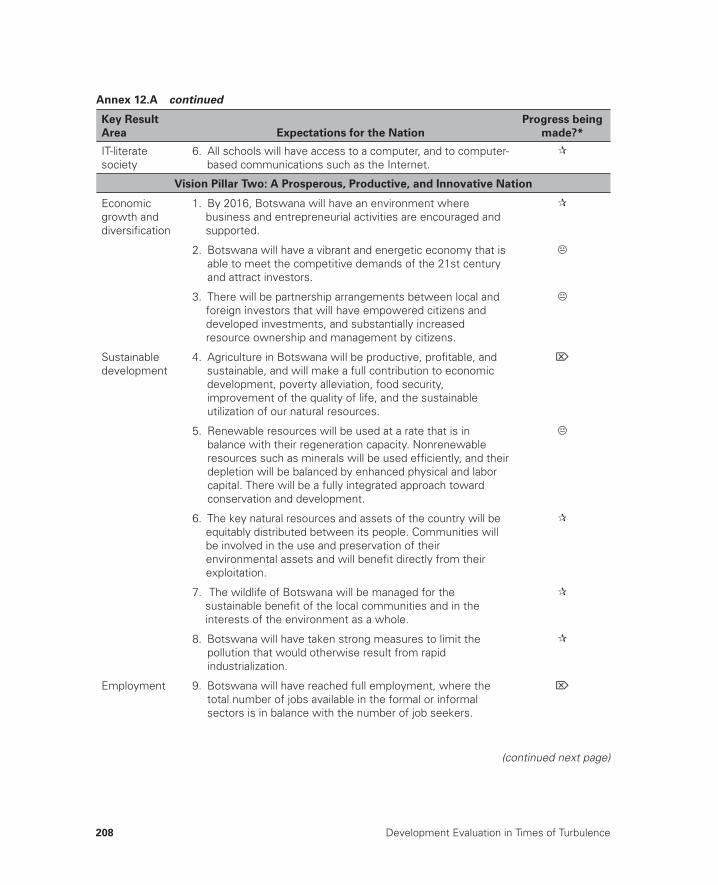
208 Development Evaluation in Times of Turbulence
IT-literate society
6. All schools will have access to a computer, and to computer-based communications such as the Internet.
Vision Pillar Two: A Prosperous, Productive, and Innovative Nation
Economic growth and diversifi cation
1. By 2016, Botswana will have an environment where business and entrepreneurial activities are encouraged and supported.
2. Botswana will have a vibrant and energetic economy that is able to meet the competitive demands of the 21st century and attract investors.
3. There will be partnership arrangements between local and foreign investors that will have empowered citizens and developed investments, and substantially increased resource ownership and management by citizens.
Sustainable development
4. Agriculture in Botswana will be productive, profi table, and sustainable, and will make a full contribution to economic development, poverty alleviation, food security, improvement of the quality of life, and the sustainable utilization of our natural resources.
⌦
5. Renewable resources will be used at a rate that is in balance with their regeneration capacity. Nonrenewable resources such as minerals will be used effi ciently, and their depletion will be balanced by enhanced physical and labor capital. There will be a fully integrated approach toward conservation and development.
6. The key natural resources and assets of the country will be equitably distributed between its people. Communities will be involved in the use and preservation of their environmental assets and will benefi t directly from their exploitation.
7. The wildlife of Botswana will be managed for the sustainable benefi t of the local communities and in the interests of the environment as a whole.
8. Botswana will have taken strong measures to limit the pollution that would otherwise result from rapid industrialization.
Employment 9. Botswana will have reached full employment, where the total number of jobs available in the formal or informal sectors is in balance with the number of job seekers.
⌦
Annex 12.A continued
Key Result
Area Expectations for the Nation
Progress being
made?*
(continued next page)
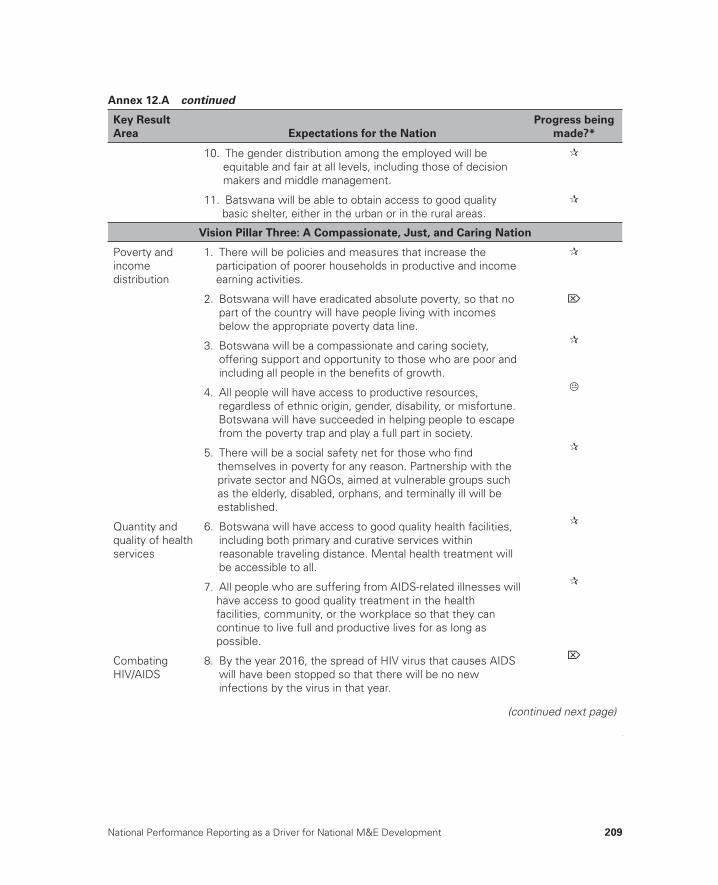
National Performance Reporting as a Driver for National M&E Development 209
10. The gender distribution among the employed will be equitable and fair at all levels, including those of decision makers and middle management.
11. Batswana will be able to obtain access to good quality basic shelter, either in the urban or in the rural areas.
Vision Pillar Three: A Compassionate, Just, and Caring Nation
Poverty and income distribution
1. There will be policies and measures that increase the participation of poorer households in productive and income earning activities.
2. Botswana will have eradicated absolute poverty, so that no part of the country will have people living with incomes below the appropriate poverty data line.
⌦
3. Botswana will be a compassionate and caring society, offering support and opportunity to those who are poor and including all people in the benefi ts of growth.
4. All people will have access to productive resources, regardless of ethnic origin, gender, disability, or misfortune. Botswana will have succeeded in helping people to escape from the poverty trap and play a full part in society.
5. There will be a social safety net for those who fi nd themselves in poverty for any reason. Partnership with the private sector and NGOs, aimed at vulnerable groups such as the elderly, disabled, orphans, and terminally ill will be established.
Quantity and quality of health services
6. Botswana will have access to good quality health facilities, including both primary and curative services within reasonable traveling distance. Mental health treatment will be accessible to all.
7. All people who are suffering from AIDS-related illnesses will have access to good quality treatment in the health facilities, community, or the workplace so that they can continue to live full and productive lives for as long as possible.
Combating HIV/AIDS
8. By the year 2016, the spread of HIV virus that causes AIDS will have been stopped so that there will be no new infections by the virus in that year.
⌦
Annex 12.A continued
Key Result
Area Expectations for the Nation
Progress being
made?*
(continued next page)
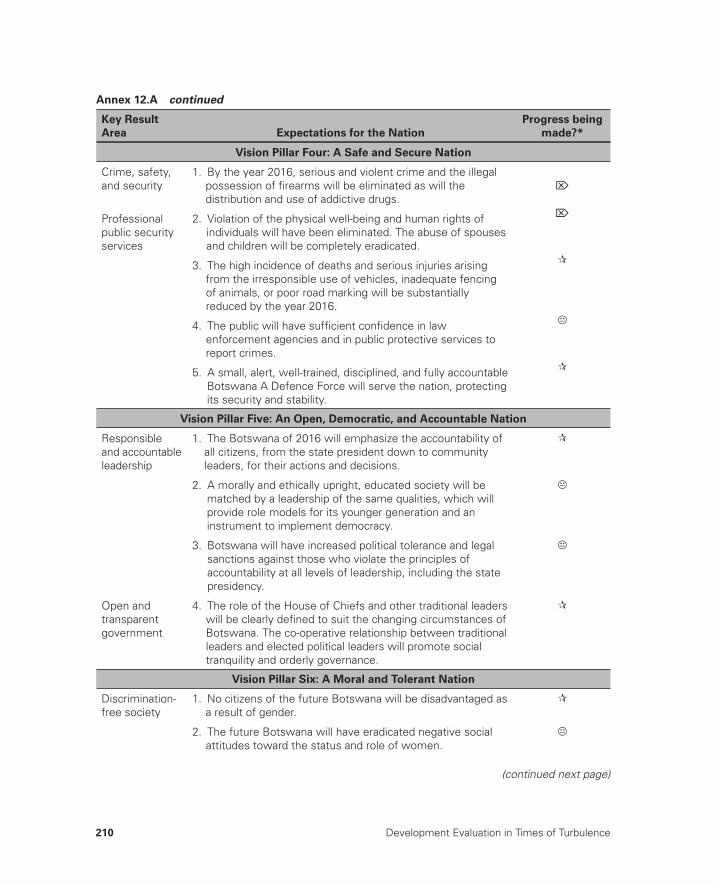
210 Development Evaluation in Times of Turbulence
Vision Pillar Four: A Safe and Secure Nation
Crime, safety, and security
1. By the year 2016, serious and violent crime and the illegal possession of fi rearms will be eliminated as will the distribution and use of addictive drugs.
⌦
Professional public security services
2. Violation of the physical well-being and human rights of individuals will have been eliminated. The abuse of spouses and children will be completely eradicated.
⌦
3. The high incidence of deaths and serious injuries arising from the irresponsible use of vehicles, inadequate fencing of animals, or poor road marking will be substantially reduced by the year 2016.
4. The public will have suffi cient confi dence in law enforcement agencies and in public protective services to report crimes.
5. A small, alert, well-trained, disciplined, and fully accountable Botswana A Defence Force will serve the nation, protecting its security and stability.
Vision Pillar Five: An Open, Democratic, and Accountable Nation
Responsible and accountable leadership
1. The Botswana of 2016 will emphasize the accountability of all citizens, from the state president down to community leaders, for their actions and decisions.
2. A morally and ethically upright, educated society will be matched by a leadership of the same qualities, which will provide role models for its younger generation and an instrument to implement democracy.
3. Botswana will have increased political tolerance and legal sanctions against those who violate the principles of accountability at all levels of leadership, including the state presidency.
Open and transparent government
4. The role of the House of Chiefs and other traditional leaders will be clearly defi ned to suit the changing circumstances of Botswana. The co-operative relationship between traditional leaders and elected political leaders will promote social tranquility and orderly governance.
Vision Pillar Six: A Moral and Tolerant Nation
Discrimination- free society
1. No citizens of the future Botswana will be disadvantaged as a result of gender.
2. The future Botswana will have eradicated negative social attitudes toward the status and role of women.
Annex 12.A continued
Key Result
Area Expectations for the Nation
Progress being
made?*
(continued next page)

National Performance Reporting as a Driver for National M&E Development 211
National moral and cultural values
3. The Botswana of the future will have citizens who are law abiding.
Vision Pillar Seven: A United and Proud Nation
National unity 1. By the year 2016, Botswana will be united and proud, sharing common goals based on a common heritage, national pride, and a desire for stability.
Social stability 2. The country will still possess a diverse mix of cultures.
3. We will have achieved ethnic integration and full partnership to create a nation in harmony with itself. From this partnership will have sprung an equitably distributed prosperity in a caring environment born of loyalty.
Strong family institution
4. The family will be the central institution for the support and development of people in Botswana.
5. The strength of the family will have been reinforced in response to the rapid social changes that are sweeping the country.
6. The emphasis on a strong family unit will encourage responsible parenting and the institution of marriage. It will provide the social foundation for the eradication of problems such as the high incidence of teenage pregnancies.
Source: Botswana Vision Council 2009. Vision 2016 Botswana Performance Report.
Note: AIDS = acquired immune defi ciency syndrome, HIV = human immunodefi ciency virus,
IT = information technology. *Progress being made? is a subjective rating of progress based on both
quantitative and qualitative information. It is a global rating and, as such, is imprecise. More detailed
information is provided in Botswana’s Performance Report on each Vision pillar.
Notes
1. “M&E” is a somewhat ambiguous term. What may be deemed to be a country’s “National Evaluation System (NES)” may have little to do with the practice of evaluation per se. The more widely used term in developing countries is “Monitoring and Evaluation (M&E) System,” where, in many instances, the prime focus is on the “M,” with little or no investment in the “E.” In this chap-ter, the use of the term M&E is intended to include the application of both monitoring and evaluation.
2. The author worked with Botswana’s Vision Council during 2008 and 2009 to develop the inaugural version of Botswana’s Performance Report, that serves as the template for future national performance reporting.
3. Annex 1 provides a detailed elaboration of the “Expectations for the Nation” drawn from Vision 2016.
Annex 12.A continued
Key Result
Area Expectations for the Nation
Progress being
made?*
212 Development Evaluation in Times of Turbulence
4. www.vision2016.co.bw/tempimg/media/mediac_.WORD. 5. A variety of communication eff orts have exposed Batswana to the goals and
expectations of Vision 2016. For example, the original Vision 2016 document has been crafted into popular versions intended for primary and secondary school children. An annual launch of the Vision 2016 campaign every September as part of “Vision month” brings all sectors together in communities across the country, reinforcing the messages of Vision 2016 and aiming to encourage the participation of civil society in Vision 2016 projects and activities.
6. See, for example, Mackay 2010, Lahey 2010 and Lahey 2011.
References
Botswana Vision Council, Vision 2016. 2009. Vision 2016 Botswana Performance Report: A Report on the Progress Being Achieved against the Vision 2016 Goals. Gaborone: Government of Botswana.
Kusek, Jody Zall, and Ray C. Rist. 2004. Ten Steps to a Results-Based Monitoring and Evaluation System: A Handbook for Development Practitioners. Washington, DC: World Bank.
Lahey, Robert. 2006. “The Broad Consequences of Evaluation Capacity Building: Experience of Developing Countries.” Presentation to the 2006 Annual Confer-ence of the American Evaluation Association, November 1–4, Portland, OR.
————. 2007. “A Framework for Developing a Monitoring and Evaluation System: Lessons from International Experience.” Presentation to the Conference on International Experiences on Institutionalizing Monitoring and Evaluation Systems and the Application and Use in Ukraine, February 21–22, Kyiv, Ukraine.
————. 2010. “The Canadian Evaluation M&E System: Lessons Learned from 30 Years of Development.” Evaluation Capacity Development Series 23, World Bank, Washington, DC.
————. 2011. “The Canadian Monitoring and Evaluation System.” PREM Note 11, spe-cial series on “The Nuts and Bolts of M&E Systems.” World Bank, Washington, DC.
————. 2012. “Guidance for National Evaluation Capacity Development: A Report for the United Nations Evaluation Group (UNEG) Task Force on National Evaluation Capacity Development.” International Labour Offi ce: Geneva.
Mackay, Keith. 2010. “Conceptual Framework for Monitoring and Evaluation.” PREM Note 1, special series on “The Nuts and Bolts of M&E Systems,” World Bank, Washington, DC.
Menon, Saraswathi. 2010. “A Perspective from the United Nations on National Ownership and Capacity in Evaluation.” In From Policies to Results: Develop-ing Capacities for Country Monitoring and Evaluation Systems, edited by Marco Segone. Geneva: UNICEF.
Presidential Task Group for a Long Term Vision for Botswana. 1997. Vision 2016: Towards Prosperity for All. Government of Botswana.
Segone, Marco, ed. 2010. From Policies to Results: Developing Capacities for Country Monitoring and Evaluation Systems. New York: UNICEF.
213
A Pilot Experience for Evaluating M&E Systems for Social Programs in Latin AmericaJuan Abreu, Marie-Helene Boily, Idania Fernández, and Frederic R. Martin
M&E Systems and Social Programs in Latin America
As a continent, Latin America has experienced times of great change and turbulence. The region overall experienced a decade of growth in the early years of this century, obviously in emerging economies like Brazil and Chile, but also in other countries such as Panama. At the same time, old issues of structural poverty and inequality pervaded and actually grew because of the unequal distribution of growth benefi ts among social categories. Latin America is now largely integrated in the world economy. It experiences the opportunities as a global food and fuel exporter as well as the shocks from international fi nancial markets, although the region went through the recent fi nancial crisis relatively well. Over the medium term, its economies have experienced the growing competition of the Asia powerhouses. Over
CHAPTER 13
214 Development Evaluation in Times of Turbulence
the long term, the growing number and amplitude of crises linked to cli-matic change and resulting higher public costs (van den Berg 2013) can be felt. Faced with these recurrent problems and the challenges of the new tur-bulent times, the opposition parties in Parliament, citizens, civil society, and the private sector are pressuring governments to address critical issues and create greater value for public money.
The response of governments in the region has been signifi cant and has involved major changes in economic and social policies, striving simulta-neously for economic growth and poverty reduction, as exemplifi ed by the success story of the Lula administration1 in Brazil. A key measure of Lula’s policies included the adoption and/or generalization of social protection programs largely accessible to poor and vulnerable groups, in particular conditional monetary transfer programs. Those programs started in Mexico (Progreso in 1982, which became Oportunidades in 2000) and were later adopted by many countries, including Brazil (Bolsa Familia within the Pro-grama Fome Zero in 2000), Chile (Chile Solidario in 2004), Honduras (Bono 10000, Programa de Asignacion), El Salvador (Programa de Apoyo Tempo-ral al Ingreso Familiar), and Panama (Red de Oportunidades in 2006).
Setting up, scaling up, and effi ciently managing social-protection pro-grams are signifi cant challenges for governments. These programs are often complex involving many actors and partnerships and multiple activities to conduct, coordinate, and monitor. They face diffi cult issues in identifi ying and following up with benefi ciaries, ensuring cost-eff ectiveness of delivery mechanisms, and demonstrating outcomes and impacts, especially in a con-text of increased external and internal shocks. Hence, governments feel the need for a solid results-based monitoring and evaluation (M&E) system as a key component of the implementation of results-based management (RBM) of those programs.
Most governments in Latin America have initiated and progressively institutionalized M&E systems (May and others 2006, Castro and others 2009, Medina Giopp 2007, Rios Hess 2007, Falcão Martins 2007, Villareal Navarro 2007). However, with signifi cant variations across countries, sec-tors, and programs, M&E has been globally identifi ed as one of the weakest pillars of RBM in Latin America (García López and García Moreno 2010). National M&E systems are often designed, but are less often fully opera-tionalized for a variety of reasons. The demand for M&E results depends on the leadership of authorities who may not champion a culture of results but rather make decisions on the basis of other considerations. The staff members in the public sector may be reluctant to implement M&E if it is perceived as an added workload with limited benefi ts for them. There are
A Pilot Experience for Evaluating M&E Systems for Social Programs in Latin America 215
problems in the design of strategies, programs, and projects with no base-line and weak logical frameworks linking outputs to outcomes to impacts. M&E human capacities are often limited, with some M&E staff positions going unfi lled as a result of rapid staff rotation or being occupied by junior staff members, who lack credibility with ministerial technical departments. Training opportunities exist but often are neither practical nor adapted to the local institutional environment, thereby limiting their usefulness and applicability. Data quality issues and multiple complex and costly informa-tion systems hamper many M&E systems. Financial resources allocated to M&E systems are often not up to ambitions set by authorities and offi cial laws and decrees. In poorer countries with weaker public institutional envi-ronments, multiple, ad hoc, and donor-driven M&E systems may under-mine the development of a national M&E system. There is now a realization that the full operationalization and institutionalization of a national M&E system is a long-term, multistep process, with a variety of technical and institutional issues to be addressed along the way. Thus, proponents see the need to regularly assess the state of implementation of a results-based M&E system and to propose an action plan to further improve the system.
Analytical Framework to Diagnose M&E Systems
Rist (2009) identifi es three main areas that need to be assessed in a results-based M&E readiness diagnostic for social protection agencies:
1. Incentives and demands for designing and building a results-based M&E system
2. Roles and responsibilities and existing structures for assessing perfor-mance of the government
3. Capacity-building requirements for a results-based M&E system.
He proposes a set of key questions to be asked in a readiness assessment:
• What potential pressures are encouraging the need for the M&E system within the ministry and why?
• Who is the advocate for such an M&E system? • What is motivating the champion to support this change eff ort?• Who will own the system? Who will benefi t from the system? How much
information do they really want?• How will the system directly support better resource allocation and the
achievement of program goals?

216 Development Evaluation in Times of Turbulence
• How will the organization, the champions, and the staff react to negative information generated by the M&E system?
• Where does capacity exist within the ministry to support a results-based M&E system?
• How will the M&E system link the project, program, sector, and national outcomes and impacts?
Rist and others (2011) identify eight domains to assess within an M&E system: the crossing of institutional, human, technical, and fi nancial capaci-ties with demand and supply sides. Lahey (2013) identifi es four building blocks for a national M&E system: the vision, an enabling environment, the capacity to supply M&E information, and the capacity to demand and use M&E information.
The challenge of conducting an operational diagnostic of an M&E system against the standard of a fully developed results-based M&E system is to incorporate all of these elements in a single assessment grid that will orga-nize the information in a systematic way; capture the essential elements; be adjustable to country and institutional situations; and be manageable in terms of time, human expertise, and budget.
To meet this challenge, fi ve dimensions were identifi ed to assess the degree of compliance of any given M&E system with the gold standard of a fully developed results-based M&E system:
• First, some preconditions in terms of planning, budgeting, performance measurement framework, accountability mechanisms, and demand for M&E will aff ect the feasibility and the performance of a results-based M&E system (Dimension 1).
• Then the M&E system must be institutionalized within a legal and insti-tutional framework (Dimension 2).
• M&E is a management function that needs to be planned and budgeted (Dimension 3).
• Finally, the implementation of the system is assessed through a review of current monitoring practices (Dimension 4) and evaluation practices (Dimension 5).
Each dimension includes several subdimensions addressing specifi c issues, including the existence of key elements of a results-based M&E sys-tem (for example, an M&E plan), the quality of those elements, and fi nally, their actual use by stakeholders.
The diagnostic should also distinguish clearly among the capacities at three levels: national (or subnational) government, sector level, and program/project level. The proposed assessment framework in table 13.1 presents the fi ve dimensions and a number of subdimensions.
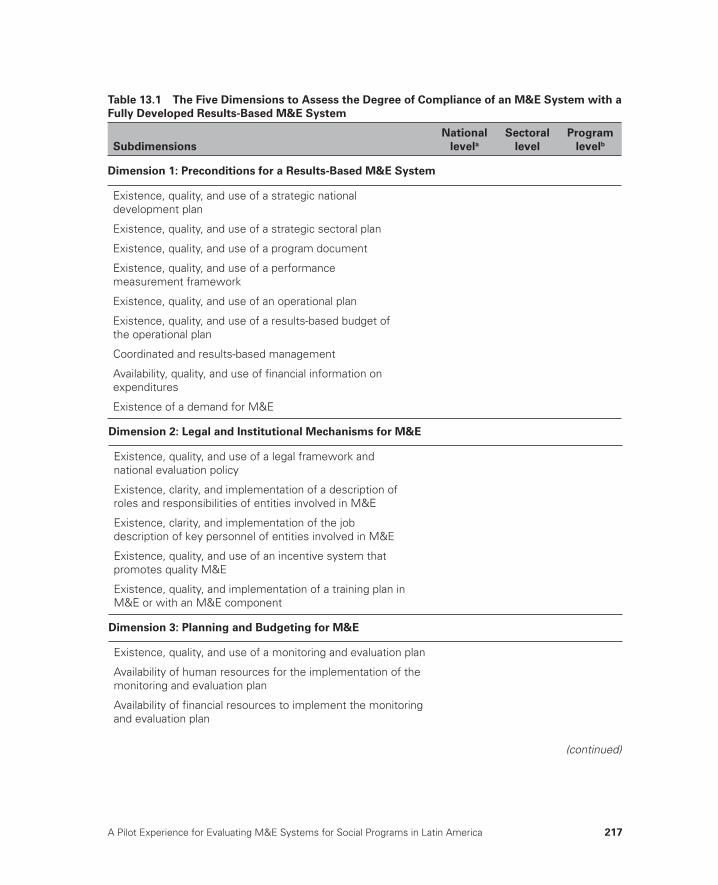
A Pilot Experience for Evaluating M&E Systems for Social Programs in Latin America 217
Table 13.1 The Five Dimensions to Assess the Degree of Compliance of an M&E System with a
Fully Developed Results-Based M&E System
Subdimensions
National
levela
Sectoral
level
Program
levelb
Dimension 1: Preconditions for a Results-Based M&E System
Existence, quality, and use of a strategic national development plan
Existence, quality, and use of a strategic sectoral plan
Existence, quality, and use of a program document
Existence, quality, and use of a performance measurement framework
Existence, quality, and use of an operational plan
Existence, quality, and use of a results-based budget of the operational plan
Coordinated and results-based management
Availability, quality, and use of fi nancial information on expenditures
Existence of a demand for M&E
Dimension 2: Legal and Institutional Mechanisms for M&E
Existence, quality, and use of a legal framework and national evaluation policy
Existence, clarity, and implementation of a description of roles and responsibilities of entities involved in M&E
Existence, clarity, and implementation of the job description of key personnel of entities involved in M&E
Existence, quality, and use of an incentive system that promotes quality M&E
Existence, quality, and implementation of a training plan in M&E or with an M&E component
Dimension 3: Planning and Budgeting for M&E
Existence, quality, and use of a monitoring and evaluation plan
Availability of human resources for the implementation of the monitoring and evaluation plan
Availability of fi nancial resources to implement the monitoring and evaluation plan
(continued)
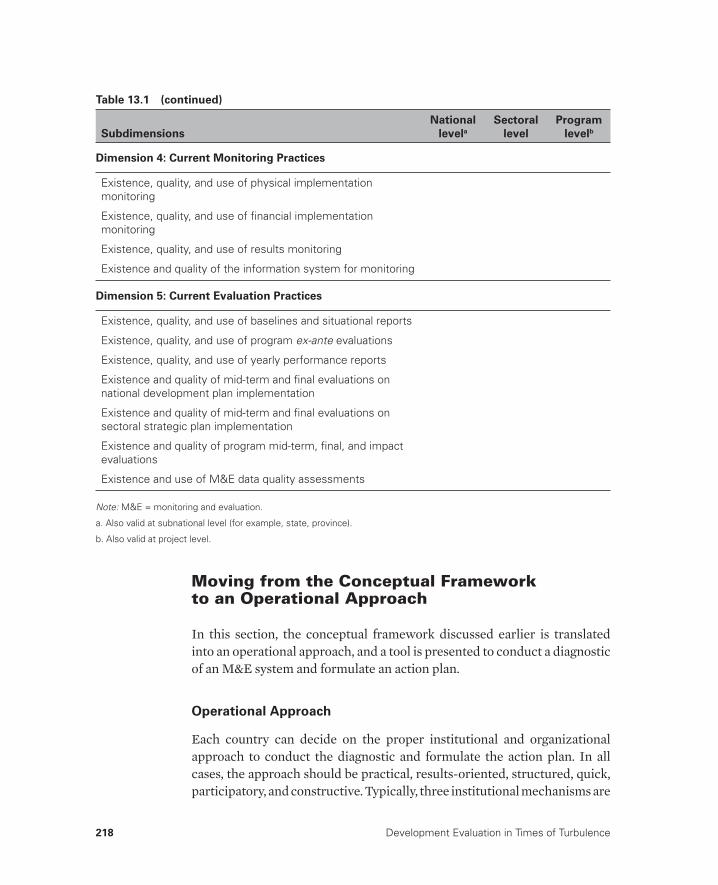
218 Development Evaluation in Times of Turbulence
Subdimensions
National
levela
Sectoral
level
Program
levelb
Dimension 4: Current Monitoring Practices
Existence, quality, and use of physical implementation monitoring
Existence, quality, and use of fi nancial implementation monitoring
Existence, quality, and use of results monitoring
Existence and quality of the information system for monitoring
Dimension 5: Current Evaluation Practices
Existence, quality, and use of baselines and situational reports
Existence, quality, and use of program ex-ante evaluations
Existence, quality, and use of yearly performance reports
Existence and quality of mid-term and fi nal evaluations on national development plan implementation
Existence and quality of mid-term and fi nal evaluations on sectoral strategic plan implementation
Existence and quality of program mid-term, fi nal, and impact evaluations
Existence and use of M&E data quality assessments
Note: M&E = monitoring and evaluation.
a. Also valid at subnational level (for example, state, province).
b. Also valid at project level.
Table 13.1 (continued)
Moving from the Conceptual Framework to an Operational Approach
In this section, the conceptual framework discussed earlier is translated into an operational approach, and a tool is presented to conduct a diagnostic of an M&E system and formulate an action plan.
Operational Approach
Each country can decide on the proper institutional and organizational approach to conduct the diagnostic and formulate the action plan. In all cases, the approach should be practical, results-oriented, structured, quick, participatory, and constructive. Typically, three institutional mechanisms are
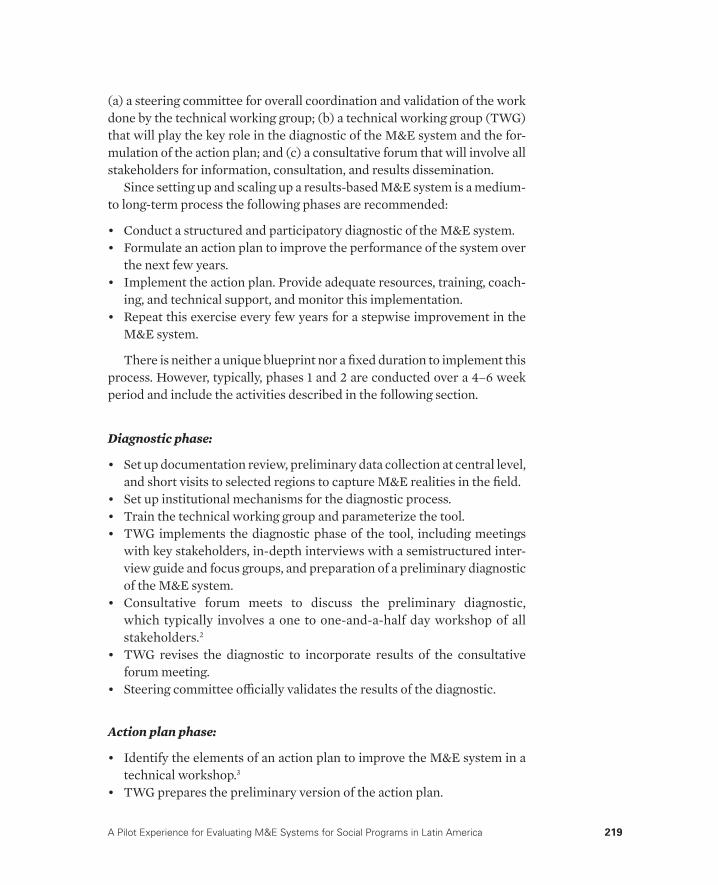
A Pilot Experience for Evaluating M&E Systems for Social Programs in Latin America 219
(a) a steering committee for overall coordination and validation of the work done by the technical working group; (b) a technical working group (TWG) that will play the key role in the diagnostic of the M&E system and the for-mulation of the action plan; and (c) a consultative forum that will involve all stakeholders for information, consultation, and results dissemination.
Since setting up and scaling up a results-based M&E system is a medium- to long-term process the following phases are recommended:
• Conduct a structured and participatory diagnostic of the M&E system.• Formulate an action plan to improve the performance of the system over
the next few years.• Implement the action plan. Provide adequate resources, training, coach-
ing, and technical support, and monitor this implementation.• Repeat this exercise every few years for a stepwise improvement in the
M&E system.
There is neither a unique blueprint nor a fi xed duration to implement this process. However, typically, phases 1 and 2 are conducted over a 4–6 week period and include the activities described in the following section.
Diagnostic phase:
• Set up documentation review, preliminary data collection at central level, and short visits to selected regions to capture M&E realities in the fi eld.
• Set up institutional mechanisms for the diagnostic process.• Train the technical working group and parameterize the tool.• TWG implements the diagnostic phase of the tool, including meetings
with key stakeholders, in-depth interviews with a semistructured inter-view guide and focus groups, and preparation of a preliminary diagnostic of the M&E system.
• Consultative forum meets to discuss the preliminary diagnostic, which typically involves a one to one-and-a-half day workshop of all stakeholders.2
• TWG revises the diagnostic to incorporate results of the consultative forum meeting.
• Steering committee offi cially validates the results of the diagnostic.
Action plan phase:
• Identify the elements of an action plan to improve the M&E system in a technical workshop.3
• TWG prepares the preliminary version of the action plan.
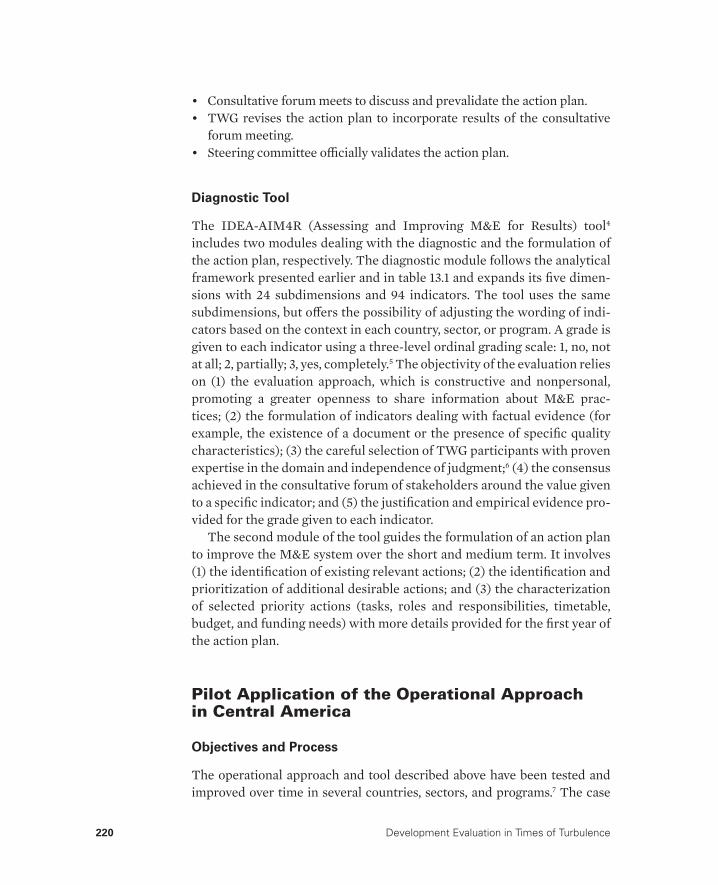
220 Development Evaluation in Times of Turbulence
• Consultative forum meets to discuss and prevalidate the action plan.• TWG revises the action plan to incorporate results of the consultative
forum meeting.• Steering committee offi cially validates the action plan.
Diagnostic Tool
The IDEA-AIM4R (Assessing and Improving M&E for Results) tool4 includes two modules dealing with the diagnostic and the formulation of the action plan, respectively. The diagnostic module follows the analytical framework presented earlier and in table 13.1 and expands its fi ve dimen-sions with 24 subdimensions and 94 indicators. The tool uses the same subdimensions, but off ers the possibility of adjusting the wording of indi-cators based on the context in each country, sector, or program. A grade is given to each indicator using a three-level ordinal grading scale: 1, no, not at all; 2, partially; 3, yes, completely.5 The objectivity of the evaluation relies on (1) the evaluation approach, which is constructive and nonpersonal, promoting a greater openness to share information about M&E prac-tices; (2) the formulation of indicators dealing with factual evidence (for example, the existence of a document or the presence of specifi c quality characteristics); (3) the careful selection of TWG participants with proven expertise in the domain and independence of judgment;6 (4) the consensus achieved in the consultative forum of stakeholders around the value given to a specifi c indicator; and (5) the justifi cation and empirical evidence pro-vided for the grade given to each indicator.
The second module of the tool guides the formulation of an action plan to improve the M&E system over the short and medium term. It involves (1) the identifi cation of existing relevant actions; (2) the identifi cation and prioritization of additional desirable actions; and (3) the characterization of selected priority actions (tasks, roles and responsibilities, timetable, budget, and funding needs) with more details provided for the fi rst year of the action plan.
Pilot Application of the Operational Approach in Central America
Objectives and Process
The operational approach and tool described above have been tested and improved over time in several countries, sectors, and programs.7 The case
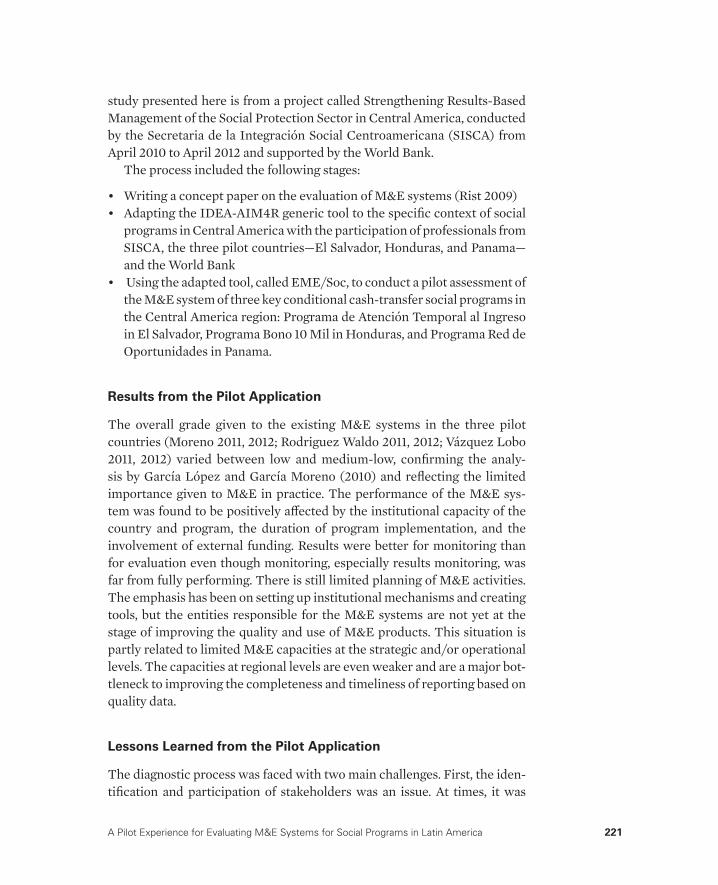
A Pilot Experience for Evaluating M&E Systems for Social Programs in Latin America 221
study presented here is from a project called Strengthening Results-Based Management of the Social Protection Sector in Central America, conducted by the Secretaria de la Integración Social Centroamericana (SISCA) from April 2010 to April 2012 and supported by the World Bank.
The process included the following stages:
• Writing a concept paper on the evaluation of M&E systems (Rist 2009)• Adapting the IDEA-AIM4R generic tool to the specifi c context of social
programs in Central America with the participation of professionals from SISCA, the three pilot countries—El Salvador, Honduras, and Panama—and the World Bank
• Using the adapted tool, called EME/Soc, to conduct a pilot assessment of the M&E system of three key conditional cash-transfer social programs in the Central America region: Programa de Atención Temporal al Ingreso in El Salvador, Programa Bono 10 Mil in Honduras, and Programa Red de Oportunidades in Panama.
Results from the Pilot Application
The overall grade given to the existing M&E systems in the three pilot countries (Moreno 2011, 2012; Rodriguez Waldo 2011, 2012; Vázquez Lobo 2011, 2012) varied between low and medium-low, confi rming the analy-sis by García López and García Moreno (2010) and refl ecting the limited importance given to M&E in practice. The performance of the M&E sys-tem was found to be positively aff ected by the institutional capacity of the country and program, the duration of program implementation, and the involvement of external funding. Results were better for monitoring than for evaluation even though monitoring, especially results monitoring, was far from fully performing. There is still limited planning of M&E activities. The emphasis has been on setting up institutional mechanisms and creating tools, but the entities responsible for the M&E systems are not yet at the stage of improving the quality and use of M&E products. This situation is partly related to limited M&E capacities at the strategic and/or operational levels. The capacities at regional levels are even weaker and are a major bot-tleneck to improving the completeness and timeliness of reporting based on quality data.
Lessons Learned from the Pilot Application
The diagnostic process was faced with two main challenges. First, the iden-tifi cation and participation of stakeholders was an issue. At times, it was
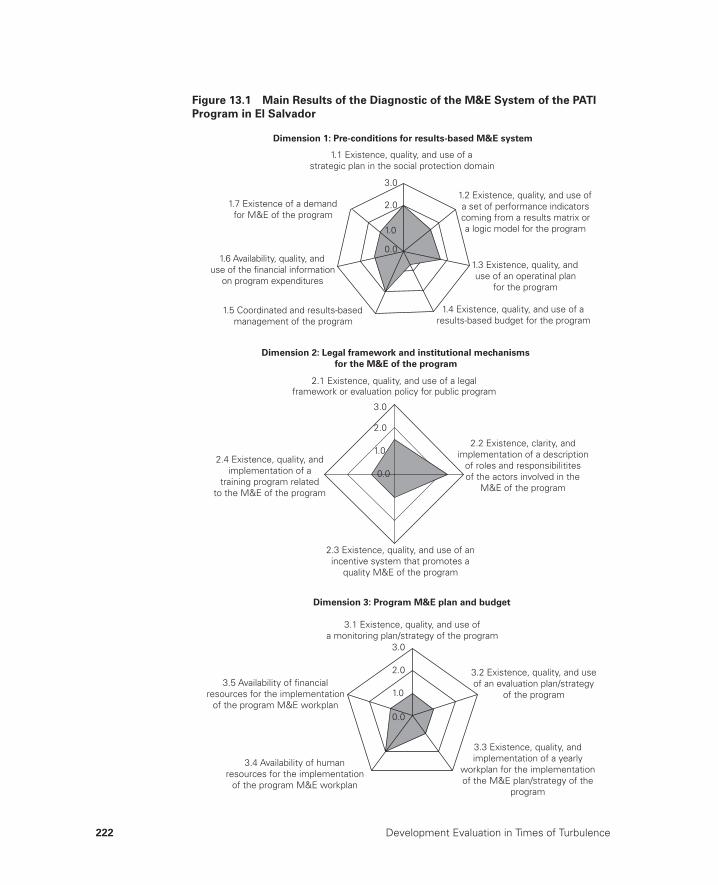
222 Development Evaluation in Times of Turbulence
Figure 13.1 Main Results of the Diagnostic of the M&E System of the PATI
Program in El Salvador
1.1 Existence, quality, and use of a strategic plan in the social protection domain
Dimension 1: Pre-conditions for results-based M&E system
1.5 Coordinated and results-basedmanagement of the program
1.7 Existence of a demandfor M&E of the program
3.0
2.0
1.0
0.01.6 Availability, quality, and
use of the financial informationon program expenditures
1.4 Existence, quality, and use of aresults-based budget for the program
1.3 Existence, quality, anduse of an operatinal plan
for the program
1.2 Existence, quality, and use ofa set of performance indicators coming from a results matrix ora logic model for the program
2.2 Existence, clarity, andimplementation of a description
of roles and responsibilititesof the actors involved in the
M&E of the program
1.0
2.0
3.0
2.4 Existence, quality, andimplementation of a
training program relatedto the M&E of the program
2.3 Existence, quality, and use of anincentive system that promotes a
quality M&E of the program
Dimension 2: Legal framework and institutional mechanisms
for the M&E of the program
0.0
2.1 Existence, quality, and use of a legalframework or evaluation policy for public program
3.1 Existence, quality, and use ofa monitoring plan/strategy of the program
Dimension 3: Program M&E plan and budget
3.5 Availability of financialresources for the implementation
of the program M&E workplan
3.4 Availability of humanresources for the implementation
of the program M&E workplan
3.2 Existence, quality, and useof an evaluation plan/strategy
of the program
3.0
2.0
1.0
0.0
3.3 Existence, quality, andimplementation of a yearly
workplan for the implementationof the M&E plan/strategy of the
program
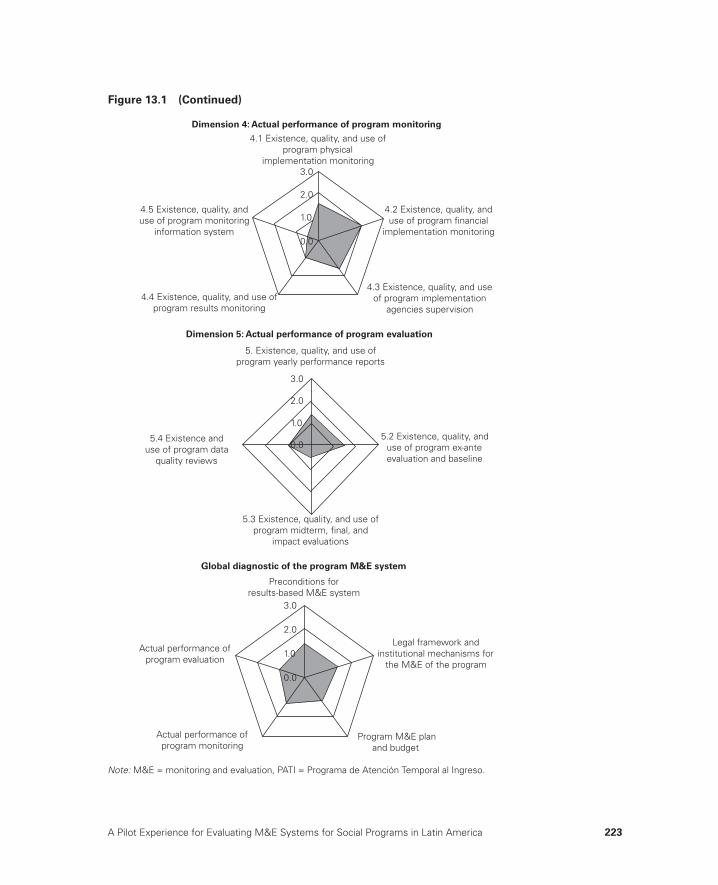
A Pilot Experience for Evaluating M&E Systems for Social Programs in Latin America 223
Note: M&E = monitoring and evaluation, PATI = Programa de Atención Temporal al Ingreso.
Figure 13.1 (Continued)
4.1 Existence, quality, and use ofprogram physical
implementation monitoring3.0
2.0
1.0
0.0
Dimension 4: Actual performance of program monitoring
4.2 Existence, quality, anduse of program financial
implementation monitoring
4.3 Existence, quality, and useof program implementation
agencies supervision4.4 Existence, quality, and use of
program results monitoring
4.5 Existence, quality, anduse of program monitoring
information system
Dimension 5: Actual performance of program evaluation
3.0
2.0
1.0
0.0
5. Existence, quality, and use ofprogram yearly performance reports
5.2 Existence, quality, anduse of program ex-anteevaluation and baseline
5.3 Existence, quality, and use ofprogram midterm, final, and
impact evaluations
5.4 Existence anduse of program data
quality reviews
Global diagnostic of the program M&E system
Preconditions forresults-based M&E system
3.0
2.0
1.0
0.0
Legal framework andinstitutional mechanisms for
the M&E of the program
Program M&E planand budget
Actual performance ofprogram monitoring
Actual performance ofprogram evaluation

224 Development Evaluation in Times of Turbulence
diffi cult to obtain the full participation of all stakeholders to avoid a closed-quarter exercise conducted by public-sector professionals and to expand the ownership of the process and the tool to more stakeholders. This chal-lenge is related to the limited culture and tradition of M&E within the pub-lic sector. Second, high staff turnover and the resulting limited institutional memory complicated the diagnostic. Those challenges were reinforced by weaknesses in knowledge management within the public sector limit-ing the impact of eff orts made to improve individual capabilities. There is room to improve the institutionalization of M&E functions in government institutions.
The tool was found to be applicable and user-friendly. It provided, with a limited amount of time and resources, a systematic assessment of the compliance of the M&E systems with the standard of a fully developed results-based M&E system. The tool also helped struc-ture the action plan within a results framework, which facilitated the monitoring of its implementation and the assessment of progress over time. Specific methodological issues addressed during the application included the following:
• The generic versus tailor-made nature of the tool. The project team expe-rienced a tension between the pressure to adjust the tool to the specifi cs of the country and program and the desire to keep a standard evaluation grid to allow for comparisons and benchmarking across countries and programs for aggregation at the regional level. This tension was resolved by keeping the same dimensions and subdimensions, but allowing some fl exibility in indicator wording.
• The optimum degree of disaggregation of the diagnostic. The TWG dis-cussed the optimum number of indicators and a compromise was struck to limit indicators to a manageable number (less than 100 for the whole tool).
• The choice of grading scale. The TWG discussed the proper range of the grading scale and agreed with a three-level scale for simplicity and objectivity.
• The control of subjectivity in initial answers. Controlling subjectivity in some indicator grades given by tool users required, at times, that tool administrators better relate each indicator grade to a specifi c situation.
• The incorporation of risk indicators in the M&E system. Risk indicators enable evaluators to account for unpredictable and exogenous factors that could adversely impact the performance of the M&E system.
A Pilot Experience for Evaluating M&E Systems for Social Programs in Latin America 225
Conclusion and Way Forward
In a context of increased accountability of governments and increased tur-bulence at national and international levels, the need for a solid results-based M&E system is at the fore. Countries in Latin America and the Caribbean have gone a long way in establishing M&E systems. The pro-posed analytical framework and operational process and tool to conduct a diagnostic of an existing M&E system’s compliance with the standards of a fully developed results-based M&E system, and ability to design a short- and medium-term action plan has proven its usefulness and adapt-ability while respecting time and resource constraints. Obviously there is room to improve both the process and the tool, in particular to ensure proper participation of all stakeholders, including private-sector and civil-society organizations,8 and to further parameterize the tool to formalize a full-fl edged application. There is a strong need for operational tools to help guide governments, ministries, and programs in the implementation of results-based M&E and its related domains of strategic planning, opera-tional planning, and budgeting to help them move up the scale of results-based management implementation.
Notes
1. Luiz Inácio Lula da Silva served two terms as Brazil’s President from 2002 to 2011.
2. If a workshop cannot be organized, an alternative is to organize meetings with the entity responsible for the M&E system and other key stakeholders.
3. Steps 7 to 9 can be combined with step 6 in a single three-day workshop or presented in a separate workshop, time and resources permitting.
4. IDEA-AIM4R is part of the IDEA-TOOLS suite, a series of applications designed to facilitate the implementation of RBM pillars.
5. There are also N/A (not applicable) and N/I (not enough information) options. For several indicators, the intermediate grade of 2 is eliminated because the choice is binary: “No,” which corresponds to a grade of 1; “Yes,” which corre-sponds to a grade of 3.
6. Professionals from the entity who are involved in M&E may be part of the TWG to provide insider’s information, but they should not lead it or control it. The lead evaluators should be external.
7. Among others, through the project “Diagnostic of M&E Systems of Programs Supporting Orphans and Vulnerable Children (OVCs)” in six African countries (Botswana, Cameroon, Côte d’Ivoire, Lesotho, Swaziland, and Uganda) through the support of UNICEF; in Zambia with the Ministry of Finance with the
226 Development Evaluation in Times of Turbulence
support of the World Bank; and in six country programs supported by the Mil-lennium Challenge Account (Benin, Lesotho, Morocco, Mozambique, Senegal, and Tanzania).
8. See Gildemyn 2013.
References
Castro, Manuel Fernando, Gladys Lopez-Acevedo, Gita Beker Busjeet, and Ximena Fernandez Ordonez. 2009. “El sistema de M&E en México: Un salto del nivel sectorial al nacional.” Independent Evaluation Group, Document de trabajo 20, World Bank, Washington, DC.
Falcão Martins, Humberto. 2007. “Sistema de Monitoramento do Plano Plurianual, Sistema de Monitoramento de Metas Presidenciais Sistema de Monitoramento e Avaliação de Políticas e Programas Sociais, Sistema de Avaliação Externa de Programas Governamentais Brasil.” In Fortalecimiento de los sistemas de monitoreo y evaluación (M&E) en América Latina, case study 3. Caracas and Washington, DC: Centro Latino de Administración para el Desarrollo and World Bank.
García López, Roberto, and Mauricio García Moreno. 2010. Managing for Devel-opment Results: Progress and Challenges in Latin America and the Caribbean. Washington, DC: Inter-American Development Bank.
Gildemyn, Marie. 2013. “Toward an Understanding of CSO’s Involvement in M&E: Unpacking the Accountability and Feedback Function of M&E.” In Develop-ment Evaluation in Times of Turbulence: Dealing with Crises That Endanger Our Future, edited by Marie-Helene Boily, Frederic R. Martin, and Ray C. Rist. Washington, DC: World Bank.
Lahey, Robert. 2013. “National Performance Reporting as a Driver for National M&E Development: The Experience of Botswana.” In Development Evaluation in Times of Turbulence: Dealing with Crises That Endanger Our Future, edited by Marie-Helene Boily, Frederic R. Martin, and Ray C. Rist. Washington, DC: World Bank.
May, Ernesto, David Shand, Keith Mackay, Fernando Rojas, and Jaime Saavedra. 2006. “Toward the Institutionalization of M&E Systems in Latin America and the Caribbean.” Proceedings of a World Bank/Inter-American Development Bank Conference, Washington, DC.
Medina Giopp, Alejandro. 2007. “El Sistema Nacional de Monitoreo y Evaluación de la Gestión Pública en México.” In Fortalecimiento de los sistemas de monitoreo y evaluación (M&E) en América Latina. Caracas and Washington, DC: Centro Latino de Administración para el Desarrollo and World Bank.
Moreno, Ilka. 2011. “Informe Diagnóstico del Sistema de Monitoreo y Evaluación del Programa Red de Oportunidades de Panamá.” Secretaria de la Integración Social Centroamericana, Ciudad de Panamá.
————. 2012. “Plan de Acción para el Mejoramiento del Sistema de Monitoreo y Evaluación del programa Red de Oportunidades de Panamá.” Secretaria de la Integración Social Centroamericana, Ciudad de Panamá.
A Pilot Experience for Evaluating M&E Systems for Social Programs in Latin America 227
Ríos Hess, Salvador. 2007. “Diagnóstico de los sistemas de monitoreo y evaluación en Chile.” In Fortalecimiento de los sistemas de monitoreo y evaluación (M&E) en América Latina. Caracas and Washington, DC: Centro Latino de Administración para el Desarrollo and World Bank.
Rist, Ray. 2009. Results-based Readiness Assessment Diagnostic Tool for Social Protection Agencies. Washington, DC: World Bank.
Rist, Ray, Marie-Helene Boily, and Frederic Martin. 2011. “Introduction.” In Infl uencing Change: Building Evaluation Capacity to Strengthen Governance. Washington, DC: World Bank.
Rodriguez Waldo, Floralba. 2011. “Programa de Atención Temporal al Ingreso—PATI: Aplicación de la Herramienta de Diagnostico del Sistema de Monitoreo y Evaluación y Diseño del Plan de Acción para su Mejoramiento: Diagnostico.” Secretaria de la Integración Social Centroamericana, San Salvador.
————. 2012. “Programa de Atención Temporal al Ingreso—PATI: Aplicación de la Herramienta de Diagnostico del Sistema de Monitoreo y Evaluación y Diseño del Plan de Acción para su Mejoramiento.” Secretaria de la Integración Social Centroamericana, San Salvador.
Villareal Navarro, Julio. 2007. “Colombia y el sistema de monitoreo y evaluación, Sistema Nacional de Evaluacion y Gestion por Resultados (SINERGIA).” In Fortalecimiento de los sistemas de monitoreo y evaluación (M&E) en América Latina. Caracas and Washington, DC: Centro Latino de Administración para el Desarrollo and World Bank.
van den Berg, Rob D. 2013. “Evaluation in the Context of Global Public Goods.” In Development Evaluation in Times of Turbulence: Dealing with Crises That Endan-ger Our Future, edited by Marie-Helene Boily, Frederic R. Martin, and Ray C. Rist. Washington, DC: World Bank.
Vázquez Lobo, Ricardo Alejandro. 2011. “Educación, Salud y Nutrición Bono 10 Mil—Honduras.” In Informe de diagnostico del Sistema de Monitoreo y Evalu-ación del Programa Presidencial. Tegucigalpa, Honduras: Secretaria de la Inte-gración Social Centroamericana.
————. 2012. “Educación, Salud y Nutrición de Honduras (Bono 10 Mil).” In Plan de Acción para el Mejoramiento del Sistema de Monitoreo y Evaluación del Pro-grama Presidencial. Tegucigalpa, Honduras: Secretaria de la Integración Social Centroamericana.

229
ConclusionMarie-Helene Boily and Frederic R. Martin
This book has focused on the implications of turbulent times, especially the food, fuel, and fi nancial (3F) crisis, for the evaluation world. Signs of turbulent times are everywhere: let us name only the fi nancial crisis aff ect-ing mainly Europe and the United States, the food crisis in the Sahel and Southern Africa, the fuel crisis with yo-yoing oil and mineral prices and the Fukoshima nuclear disaster, the growing number and magnitude of natural disasters everywhere in the world, the rapidly changing political order with revolutions in the Maghreb and the Middle East, and the growing redistri-bution of power toward Asia; and, some would add, the values crises that shake a number of rapidly changing societies through the breakdown of tra-ditional beliefs and institutions, as well as mounting racism, ethnic confl icts, and religious obscurantism as correlates.
However, turbulence is nothing new. Many previous crises have occurred in human history: during the 20th century alone, we witnessed numerous famines (mainly in Asia and Africa, but also in other regions such as the “bread” revolts in the Middle East), fi nancial and economic system crashes (North America and Europe in 1929, Asia in the 1990s), fuel crises (two oil shocks), environmental disasters (tsunamis, hurricanes, and typhoons as well as nuclear catastrophes at Chernobyl and Fukoshima), and too many wars and revolutions to count. Beyond these transitory crises, there is the
CHAPTER 14
230 Development Evaluation in Times of Turbulence
much less media-covered chronic crisis of the poor, both poor individuals and poor countries, who are living in a permanent state of crisis. United Nations and World Bank reports regularly remind us that 2.7 billion people live on less than US$2 a day and 1.1 billion live on less than US$1 a day. So why has the idea of turbulent times come to the fore today?
Many factors contribute to this complex situation, and their importance varies depending on the type of crisis, the concerned sector, and the aff ected region. However, several factors contribute more than others to the percep-tion of greater turbulent times. First, all countries and citizens, rich and poor alike, are aff ected. Second, the number and speed of interconnections among systems have increased as a result of the liberalization of world trade and fi nancial markets and the progress and generalization of information technology and media coverage. Third, fi nancial market deregulation has led to the development of new fi nancial products and decision-making models that have increased markets’ instability. Fourth, many governments have not been able to control market failures because of failures within gov-ernment itself, such as unsustainable indebtedness, corruption, ineffi cien-cies, and petty political games.
Beyond those obvious factors hides a more global factor, that is, the perception by a growing number of intellectuals and practitioners, includ-ing evaluators, that the past schemes and policies are no longer working. Ibrahim (c hapter 1) tells us that we need to revisit our economic and social policies, which are too short-sighted. Furubo (chapter 2) questions the tra-ditional approach of evaluation based on the assumption that the situation is changing incrementally and that future impacts of policies can be predicted by analyzing past realities. Honesty commands us to admit that we are good at explaining the past and why our ex-ante evaluations were wrong.
The human evaluation software needs to be upgraded. Social and man-agement sciences provide the bulk of analytical underpinnings and methods behind many program evaluations. However, the silo mentality of many dis-ciplines does not help provide a 360-degree understanding of a particular public program and its results. Among the social sciences, economics has contributed to a structured analytical framework of the eff ects of economic and social policies through economic theory and analytical methods. How-ever, the core analytical approach in neoclassical economics, that is, marginal economic analysis, looks at incremental movements around the equilibrium or moving from one equilibrium point to another equilibrium point.
This approach is insuffi cient to assess the impact of public policies and programs. Comparative statistics often involve a leap of faith about the dynamics of change, which are what evaluation of public programs is largely about. The term ceteris paribus (all other things being equal) is too often
Conclusion 231
invoked to justify our ignorance of “noneconomic” factors. Economists are not the only ones to be blamed, though they are easy culprits. For example, management sciences have also contributed to a better understanding of the decision-making process of business and public institutions. However, pro-gram management specialists still rely heavily on tools adapted to simple situations that are rarely encountered in the real world. A good example is the common requirement by many governments, international organiza-tions, and donor agencies to include in the ex-ante evaluation of a project a “logical framework,” which is a simplistic appreciation of how change is implemented through linear causality and how the environment and the project interact. Other social scientists have often rightly complained about the simplistic and incomplete analytical framework used by economists and management specialists and argued for the inclusion of other relevant key issues in the evaluation of policies and programs. However, a number of them have themselves remained prisoners of a reductionist prism of analysis—be it social class, ethnic group, gender, race, or power games—that prevents them from providing a convincing explanation of what is really happening and why.
To counter those limitations, systemic analysis has been proposed to model the evolution of complex systems over time, incorporating feedback loops and turning points. It has been used for modeling natural systems and some social systems, but the mere complexity of diff erential equations mod-els and their requirements in time, data, and skills make them of limited practical value for the time-short and resource-scarce evaluator of public programs.
A good example of our limited capacity to properly assess and then infl uence decision making is provided by the issue of climate change. First came the challenge of scientifi c measurement: fi nding statistically signifi -cant evidence of change. Scientists argued for the past 20 years about the correlation of climate change with carbon emissions due to human activity and only recently have the majority of them assessed that this hypothesis “cannot be rejected.” Second, the potential losers, vested interests like oil companies, have strongly lobbied against policy change, arguing that mov-ing away from oil would hurt economic growth and employment. Third, a majority of citizens in rich countries fi nd it easier to retain their cosy life-styles, looking away from evidence that does not fi t their beliefs, and staying in their mental comfort zone. A number of their counterparts in emerging countries are so eager to enjoy and show off their new material wealth that “long-term” concerns about climate change are the least of their priorities. Many politicians are not ready to argue for or implement policies that will result in long-term sustainable development. They prefer quick wins and
232 Development Evaluation in Times of Turbulence
populist measures that will keep them in power for the duration of their political horizon. All of them are guilty of human shortsightedness and ego-centricity: they lack the realization that what is slow change on the human clock is actually extremely rapid change on the Earth clock.
Implications for Evaluation
What are the implications for the young profession of evaluation? The chap-ters in this book off er several lines of thought and action.
Several papers make proposals about how we conceive of evaluation. First, they suggest enlarging the scope of evaluation. Menon (chapter 3) pro-poses considering other criteria such as equity, innovation, human rights, and gender equality. Van den Berg (chapter 4) alerts us about the urgency of taking into account in our evaluations the rising global public costs stem-ming from climate change, mass extinction of biodiversity, and spread of poisonous chemicals. Agrawal (chapter 6) argues that a comprehensive monitoring system should not only consider inputs and outputs, but also outcomes and even impacts to better feed into evaluation.
Several papers argue for fundamental shifts of approach in evaluation. Furubo suggests that in a turbulent environment, evaluation questions should be addressed more ex ante in the sense of “identifying the best pos-sible knowledge that can be of use in discussing alternative solutions” rather than relying on past evidence. Van den Berg suggests analyzing relevance not only in terms of consistency with government’s strategic priorities, but also in terms of whether the problem addressed was solved. He also sug-gests going beyond counterfactual analysis of short-term impact to consider long-term impact.
Not only should we modify our approach to evaluation, but also we should change the way we conduct evaluation.
• First, several chapters argue for more integrated and combined approaches. Ahmar and Kolbe (chapter 5) demonstrate the benefi t of a holistic, multidisciplinary, and coordinated approach to evaluation in a diffi cult evaluation terrain. Along the same lines, Lohani, Gurung, and Bashyal (chapter 7) show the potential of an evaluation approach com-bining household, school, and community monitoring. Lage de Sousa (chapter 9) demonstrates how a variety of models can be used to test the impact of a government loan program.
• Second, participation of key stakeholders is perceived not as a loss of time, but rather as a condition for ownership, involvement, and sustain-ability of the M&E system. Qudisat (chapter 11) outlines the importance
Conclusion 233
of information sharing and setting targets in a participatory way to reverse the mentality of public civil servants from representing obstacles to evaluation to becoming co-owners of an M&E system. Menon under-lines that national M&E systems must involve not only government, but require the participation of other stakeholders as well. Gildemyn (chapter 10) points out the contribution that a central statistics offi ce can make in leading M&E eff orts toward improving the accountability of public offi cials and service providers.
• Third, evaluation is advocated more as a learning process than as a prod-uct. Agrawal outlines the need for capacity building and knowledge dissemination among all stakeholders. Al-Zoubi (chapter 8) stresses capacity building to increase the quality and relevance of evaluations and to develop a culture of evaluation, progressively convincing stakeholders that the benefi ts of evaluation outweigh its costs.
• Fourth, in a context of constant change and high risk, building national M&E systems that can inform decision makers of developing situa-tions and provide empirical evidence to guide their decisions becomes of paramount importance. Implementing the emerging new paradigm of national M&E systems involves addressing a number of institutional and technical issues. Lahey (Chapter 12) identifi es four building blocks: a vision of the leaders; an enabling environment; a capacity to supply cred-ible, timely M&E information; and a capacity by key users to demand and use M&E information. Abreu and others (Chapter 13) propose an operational process and related information system tool to progressively improve the capacity of M&E systems, whether at the national/subna-tional, sectoral, or program/project level, through capacity-building cycles. Each cycle starts with a participatory, structured diagnostic of the M&E system and design of an action plan to improve this system, then continues with the implementation of the plan and follow up by the stakeholders—until the next diagnostic.
In conclusion, this book has demonstrated that turbulent times force us to rethink our evaluation approaches and our ways of conducting evalua-tions. Beyond the individual contributions made by each chapter, this book is both a lesson in modesty and a message of hope. It evokes the modesty we should all feel as evaluators before the challenge of providing evaluations that capture the essentials of complex and rapidly evolving situations. And it gives us hope because contributors from around the world off er glimpses of how to approach those challenges both theoretically and operationally. This book is a testimony to the contribution of the International Develop-ment Evaluation Association (IDEAS) to our profession.


235
Index
AAbreu, Juan, 213, 233academic achievement, 90–92, 90t. See also
educationaccountability
AIMS-DAD as means of, 65CSO-led M&E and, 150–53, 153fdefi ning, 148–53diagonal, 150donor requirements for, 187as evaluation goal, 26, 30horizontal, 150hybrid, 150in national M&E systems, 194vertical, 149–50
Accra Agenda for Action (2008), 146Ackerman, J. M., 149Afghan Geodesy and Cartography Head
Offi ce (AGCHO), 59Afghanistan, 51–68. See also Helmand
Monitoring and Evaluation Programme (HMEP)
challenges to evaluation in, 53–56cultural challenges in, 56institutional challenges in, 54–55
logistical challenges in, 55–56monitoring and evaluation in, 57–66political challenges in, 54–55
Afghan National Development Strategy (ANDS), 57
Afghan National Police (ANP), 61–62AGCHO (Afghan Geodesy and Cartography
Head Offi ce), 59Agendas and Instability in American Politics
(Baumgartner & Jones), 10agenda-setting, 162Agrawal, Rashmi, 69, 232, 233agricultural sector
child labor in, 93dependency on, 83developing world’s dependency on
developed world for, 3, 44economic value of bats to, 39food prices and, 82in Jordan, 168subsistence farming, 41
Ahmar, Samy, 51, 232Aid Information Management System
Development Assistance Database (AIMS-DAD), 65
Boxes, fi gures, notes, and tables are indicated by b, f, n, and t following the page number.

236 Index
Alkin, Marvin C., 7ANDS (Afghan National Development
Strategy), 57Annual Industrial Research (Brazil), 119Annual Social Information Report (Brazil),
119ANP (Afghan National Police), 61–62answerability, 149, 160Arab Spring (2011), xiii, xiv, 2, 229Asian Development Bank, 36Assessing Aid: What Works, What Doesn’t
and Why (World Bank), 42Automatic BNDES, 118–20, 123, 130, 135available data (secondary data), 71–76
case studies, 73–75lessons learned, 75–76project-monitoring data, 72quality of, 72–73, 73tsocioeconomic data, 72types of, 71–72
average productivity cut-off , 122, 122f
BBahrain, Arab Spring protests in, xiiiBamberger, M. J., 71Banco Nacional de Desenvolvimento
Economico e Social (BNDES, Brazil)fi nancing schemes of, 118–19. See also
specifi c fi nancing schemesproductivity assessment of programs,
115–42. See also productivity assessment of BNDES programs
Banerjee, A. V., 115Barloworld, 203bBashyal, Laxman, 81, 232bats, 39Baumgartner, F. R., 10, 13benefi ciaries’ index, 179–82, 179–82fBennet, C. J., 13biodiversity, 34, 38–41Bisphenol A (BPA), 40Blasio, G. d., 129BNDES. See Banco Nacional de
Desenvolvimento Economico e SocialBoily, Marie-Helene, xv, 213, 229Bolsa Familia (Brazil), 214Bono 10000, Programa de Asignacion
(Honduras), 214, 221Boswell, C., 16, 19Botswana
enabling environment in, 193–94key result areas (KRAs) in, 192, 196–97,
197b, 200, 202, 203b
national M&E development in, xv, 192–205
lessons learned, 204–5, 205–6bnational performance report. See
Botswana’s Performance Report (2009)
political will in, 193–94technical capacity in, 194–95Vision 2016 in, 192–93, 197b
Botswana’s Performance Report (2009), 195–204
data collection for, 196–202, 198f, 199–201b
distribution of, 202–4performance measurement and
reporting, 195–96“Status at a Glance,” 204, 207–11
BPA (Bisphenol A), 40Brahmins, 90, 102n14Brazil. See also Banco Nacional de
Desenvolvimento Economico e Social (BNDES); productivity assessment of BNDES programs
social protection programs in, xiv, 214Brazilian Central Bank, 119Brazilian Development Bank. See Banco
Nacional de Desenvolvimento Economico e Social (BNDES)
Brazilian Institute of Geography and Statistics, 119
Brett, E. A., 149Bronzini, R., 129budgets
evaluations of, 4, 7for national M&E systems, 216, 217t
Busan Partnership Agreement (2011), 146
CCameron, David, 51Canada, agricultural sector in, 39capacity building
for civil society organizations, 145for evaluation, 26–27, 76in Jordan, 107, 111, 174for national M&E development, 195–204,
215capital goods acquisition, 132–33Capoccia, G., 10Carleton University, 196Cato the Elder, 47–48Central Statistics Offi ce (CSO, Botswana),
196, 198, 204
Index 237
Central Statistics Organization (CSO, Afghanistan), 58–59
change. See incremental changeChhetris, 90, 102n14child labor, 87, 90, 92–93Chile, social protection programs in, 214Chile Solidario, 214China, GEF-funded programs in, 43chlorofl uorocarbons, 40civil society organizations (CSOs), xv, 145–66
accountability and, 148–53, 153fin Botswana, 95, 198, 202defi ned, 162n2evaluation use and infl uence, 154–57,
155f, 156tfeedback/learning function of M&E and,
153–60IDRC framework and, 159–60, 159fknowledge/research-policy interface in
developing countries and, 157M&E role of, 146–47, 147t, 160–62, 161fin national M&E systems development,
225RAPID framework and, 157–59, 158fsocial accountability and, 151–52, 152b
climate change, 34, 37–38, 70, 214, 231COIN. See counterinsurgency doctrineCollapse: How Societies Choose to Fail or
Succeed (Diamond), 38Collier, Paul, 38Community of Economic Development
Association, 203bComprehensive Theory of Evaluation
Infl uence (Mark & Henry), 155, 155f, 161–62
conceptual use of evaluations, 154conditional cash transfer programs, 3confl ict-aff ected states. See fragile and
confl ict-aff ected statesconsultative forums, 219, 220contribution analysis, 47corporate social responsibility, 173bcorruption, 29counterfactuals, 6, 46–47, 130counterinsurgency doctrine (COIN), 53, 54,
64country-led evaluation systems, 31credit constraints, 116Criscuolo, C., 115, 134, 135crises and incremental change, 12–13. See
also food, fuel, and fi nancial crisis (3 F’s); global fi nancial crisis (2008); turbulence
CSO (Central Statistics Offi ce, Botswana), 196, 198, 204
CSO (Central Statistics Organization, Afghanistan), 58–59
CSOs. See civil society organizationsCSO-led M&E, 147, 150–53, 162n3. See also
civil society organizationsCuba, Egon G., 7cultural challenges in fragile and confl ict-
aff ected states, 56
DDAC. See Development Assistance
CommitteeDahler-Larsen, Peter, 18Dalits, 90, 91, 98, 99, 103n60Dar Al Wefaq (women’s protection shelter),
181“dashboard” reading of performance, 204,
207–11data collection
available data, 71–76, 73tcosts of, 71dissemination of, 178–79Helmand Monitoring and Evaluation
Programme (HMEP), 58–61, 60t, 68n3for national performance report, 194,
196–202, 198f, 199–201bobjectives of, 73sampling strategy, 58–61, 60t, 68n3triangulation of data, 178–79, 179fin turbulent times, 70–71value of existing data, 69
decentralization, 178deforestation, 43DEOs (District Education Offi ces, Nepal),
101Department for International Development
(DfID, UK), 52, 57, 151Department of Education (Nepal), 81, 100,
101Department of Foreign Employment
(DOFE, Nepal), 84, 101n6desk reviews, 176–77Development Assistance Committee (DAC,
UNDP), 28, 29, 45Diagnostic of M&E Systems of Programs
Supporting Orphans and Vulnerable Children, 225n7
diagonal accountability, 150Diamond, Jared, 38diff erence-in-diff erences approach, 117, 131,
131–32t
238 Index
diff usion of ideas, 12District Education Offi ces (DEOs, Nepal),
101DOFE (Department of Foreign
Employment, Nepal), 84, 101n6domestic capital goods, 133dropout rate for students, 90, 94–98, 95–97fDufl o, E., 115Dynamic Index (MoSD, Jordan), 180–81, 181f
Eearly warning system role of M&E, 167, 176,
176b, 182–84, 183–84fEBRD (European Bank for Reconstruction
and Development), 37, 134ECG (Evaluation Cooperation Group), 43economic development
evaluation linked to, 26–30global public goods and, 34measuring, 2in Nepal, 83–84
Economics and the Public Purpose (Galbraith), 35
economic theory and methods, 230–31EDP. See Executive Development Programeducation
as economic development factor, 2food, fuel, and fi nancial crisis impact on,
3, 85–99, 86f, 99fchild labor, 92–93dropout rate, 94–98, 95–97flearning achievement, 90–92, 90trecommendations, 100–101student attendance, 86–90, 87f, 88t, 89f
in Jordan, 168, 169language barriers, 91scholarships, 98, 100, 103n59secondary education costs, 98, 169teacher recruitment case study, 75
Education Management Information System (EMIS), 101
eff ectiveness, 45effi ciency, 45Egypt
Arab Spring protests in, xiiieconomic shocks in, 2evaluation in, 29
El Salvadorpilot program for national M&E in, 221social protection programs in, 214
EME/Soc tool, 221EMIS (Education Management
Information System), 101
employmentjob creation case study, 74–75in Jordan, 169labor migration, 84, 84f
endangered species. See biodiversityenforceability, 149, 160, 163n4Engels, F., xiv, 9Europe, evaluation development in, 6, 8.
See also specifi c countriesEuropean Bank for Reconstruction
and Development (EBRD), 37, 134
Evaluating Actions Programs (Weiss), 7evaluation
of aid programs, 27–28audience for, 19–20capacity building for, 26–27challenges for, 30–31civil society organizations, role of,
145–66. See also civil society organizations (CSOs)
defi ning, 6–7, 20n1development linked to, 26–30in fragile and confl ict-aff ected states,
51–68. See also fragile and confl ict-aff ected states
global public goods and, 33–49. See also global public goods
governance contribution of, 29–30history of, 5–8impact assessments, 105–13. See also
impact assessment evaluationsincremental change and, 5–22. See also
incremental changeindependence of, 30national M&E development, 187–227. See
also national M&E developmentsocial sciences’ relation to, 17–19, 230in turbulent times, 15–16, 25–31, 70use and infl uence of, 154–57, 155f, 156t
Evaluation Cooperation Group (ECG), 43Evaluation Research: Principles and Practice
in Public Service and Social Action Programs (Suchman), 6
The Evaluation Society (Dahler-Larsen), 18evidence-based policy making, 153Executive Development Program (EDP,
Jordan), 107, 110, 110bexternalities, 35
Ffamines, 229FDI (foreign direct investment), 168
Index 239
FEC (free-entry condition), 121Fernández, Idania, 213FGDs. See focus group discussionsFINAME (Financing Machines and
Equipment, Brazil), 118fi nancial crisis. See food, fuel, and fi nancial
crisis (3 F’s); global fi nancial crisis (2008)
fi nancial market deregulation, 230Financing and Endeavors (FINEM, Brazil),
118–20, 123, 129–30, 135First National Bank (Botswana), 203bfi xed cost of entry, 121Fixed Index (MoSD, Jordan), 181–82,
182ffl ex-fuel cars, 126focus group discussions (FGDs), 74, 76,
82food, fuel, and fi nancial crisis (3 F’s)
education impact of, 81–104evaluations impact of, 70linking evaluation work to, 1–4in Nepal, 82–85, 84–85f
food prices, 2–3Foreign Capital Consensus (Brazil),
119foreign direct investment (FDI), 168Foreign Trade Secretary (Brazil), 119Fourth Overall Performance Study (GEF),
47Fox, Alan, 29fragile and confl ict-aff ected states, 51–68
analytical approach in, 62–64challenges to evaluation in, 53–56cultural challenges in, 56data collection, 58–61future prospects for M&E in, 66–67GIS mapping, 65–66information use in, 66institutional challenges in, 54–55logistical challenges in, 55–56political challenges in, 54–55quantitative and qualitative approach,
61–62sampling strategy, 58–61, 60ttheory of change and, 62–64, 63ftime-series analysis, 61
freedom of movement, 55–56, 64Freedom of Press Index, 158free-entry condition (FEC), 121fuel prices. See also food, fuel, and fi nancial
crisis (3 F’s)in Nepal, 83, 84–85, 85f
transportation costs and, 84–85turbulence and, 2–3
Furubo, Jan-Eric, xiv, 5, 230, 232
GGalbraith, John Kenneth, 35García Lopez, Roberto, 221García Moreno, Mauricio, 221Gaventa, J., 151Gaza, economic shocks in, 2GCC (Gulf Consultative Council), 2GEF. See Global Environment Facilitygender diff erences
in dropout rates, 97in enrollment rates, 169in school attendance rates, 88in secondary education enrollment, 98
gender equality, 30Geyer, R., 14Ghana, evaluation in, 30Gildemyn, Marie, 145, 233GIS mapping, 57, 65–66Global Environment Facility (GEF)
Evaluation Offi ce, 33, 40, 41, 42, 47global fi nancial crisis (2008), 36, 70, 82, 84,
229Global Fund to Fight AIDS, Tuberculosis,
and Malaria, 36globalization, 36. See also global public
goodsGlobal Partnership for Social
Accountability (GSPA), 151global public goods, 33–49
biodiversity, 38–41costs of, 37–38evaluation’s consequences for, 41–44impact evaluation for, 46–47persistent organic pollutants and, 39–41public funding’s role in, 34–36relevance evaluation for, 45–46transboundary issues for, 36–37turbulence and, 33–34
Goetz, A. M., 150governance
in evaluation of economic growth, 2evaluation’s contribution to, 29–30globalization and, 36media freedom and, 158
green economy, 38, 41greenhouse gases, 41Grilliches, Z., 115GSPA (Global Partnership for Social
Accountability), 151

240 Index
Gulf Consultative Council (GCC), 2Gurung, Purnima, 81, 232
Hhead of household (HOH) surveys, 59, 60, 61health care as economic development
factor, 2Heckman, J. J., 115Helmand Monitoring and Evaluation
Programme (HMEP), 57–66analytical approach, 62–64background and overview, 57data collection, 58–61GIS mapping, 65–66information use, 66online database, 65presentational features, 64–66quantitative and qualitative approach,
61–62sampling strategy, 58–61, 60ttheory of change and, 62–64, 63ftime-series analysis, 61
Helmand Province, Afghanistan, 51–68. See also Helmand Monitoring and Evaluation Programme (HMEP)
challenges to evaluation in, 53–56cultural challenges in, 56institutional challenges in, 54–55logistical challenges in, 55–56monitoring and evaluation in, 57–66political challenges in, 54–55
Henry, G. T., 155, 155fHMEP. See Helmand Monitoring and
Evaluation ProgrammeHOH. See head of household surveysHonduras, pilot program for national M&E
in, 221Hood, C., 13horizontal accountability, 150household workload, 87, 88, 91, 92Howlett, M., 13Human Development Observatory of
Morocco, 29human rights, 2, 30hunger, 87, 89, 100Hyasat, Amer, 185hybrid accountability, 150
IIAU (Impact Assessment Unit, Jordan),
106, 109IBGE (Instituto Brasíleiro de Geografi a e
Estatística), 119, 140n7
IBRD (International Bank for Reconstruction and Development), 36–37
IDEA-AIM4R (Assessing and Improving M&E for Results) tool, 220, 221, 225n4
IDEAS. See International Development Evaluation Association
IDRC (International Development Research Centre), 157
evaluation framework, 159–60, 159fIMF. See International Monetary Fundimpact assessment evaluations, xiv,
105–13challenges for, 112information sharing, 111, 111fmechanism for, 108–9methodology, 109–11, 110b, 110fstatus quo review, 107–8
Impact Assessment Unit (IAU, Jordan), 106, 109
implementation phase of impact assessments, 109
imported capital goods, 133incremental change, 5–22
costs of, 9crises and, 12–13evaluation’s role in, 15–16future of, 11–12nonincremental change vs., 8–15turbulence and, 13–15turning points for, 9–11
Independent Commission for Aid Impact (UK), 52
Indiaevaluation case studies, 69–77evaluation in, 30labor migration to, 96
industrial sector, 84infant mortality, 168infl ation, 3, 83information use
CSO evaluation use and infl uence, 154–57, 155f, 156t
diff usion of ideas, 12dissemination of M&E data, 76, 178–79in fragile and confl ict-aff ected states, 66impact assessment data sharing, 111, 111fknowledge/research-policy interface in
developing countries, 157institutional framework
in fragile and confl ict-aff ected states, 54–55
Index 241
for national M&E systems, 216, 217tturbulence and, 14
Instituto Brasíleiro de Geografi a e Estatística (IBGE), 119, 140n7
instrumental use of evaluations, 154International Bank for Reconstruction and
Development (IBRD), 36–37International Competition FINAME
(BNDES-Exim), 118International Development Association,
37International Development Evaluation
Association (IDEAS)contribution to evaluation profession,
233Global Assembly 2011, xiii, 33, 70moving beyond aid evaluation, 27–28strengthening practice of evaluation,
26–27vision of, 25–26
International Development Research Centre (IDRC), 157
evaluation framework, 159–60, 159fInternational Monetary Fund (IMF), 4, 36,
146International Program in Development
Evaluation Training (IPDET), 27, 196
International Security Assistance Force (ISAF), 55
Investec, 203bIraq, economic shocks in, 2Islam, 56
JJanajatis, 91Jenkins, R., 150Jones, B. D., 10, 13Jordan
Arab Spring protests in, xiiieconomic development in, 168–71,
169–71feconomic shocks in, 2, 171–73, 172fExecutive Development Program in, 110,
110bimpact assessment mechanism in,
108–9institutional impact assessment in,
105–13, 110f, 111fM&E in, xiv, xv, 167–86. See also Ministry
of Social Development (MoSD)social assistance in, 173–74status quo review in, 107–8
justice system, 181–82juvenile justice system, 182
KKathmandu Post on labor migration, 101n6Kelemen, R. D., 10Kenya, biodiversity programs in, 42Kernel approach, 117, 128key result areas (KRAs), 192, 196–97, 197b,
200, 202, 203bKgalagadi Beverages Trust, 203bKingdon, J. W., 14Kirkhart, K. E., 154Klette, T. J., 115knowledge. See also information use
evaluation development and, 19social sciences and, 17–18
Kolbe, Christine, 51, 232
Llabor migration, 84, 84f, 87, 95–96, 101n6Lage de Sousa, Filipe, 115–17, 119, 134–35,
140n16, 232Lahey, Robert, 187, 216, 233LaLonde, R. J., 115language barriers, 91Lanjouw, Peter, 61Latin America. See also specifi c countries
civil society organizations in, 151M&E systems for social programs in,
213–27pilot application of operational approach
to M&E systems evaluation in, 220–24, 222–23f
Leasing FINAME (Brazil), 118Lebanon, economic shocks in, 2Leeuw, Frans, 18legal framework for social protection
systems, 181–82legitimacy, 63, 152Lemos, M. B., 119Lewin, Kurt, 6life expectancy, 168Lincoln, Abraham, xiii, 9Lindberg, S. I., 148literacy rates, 71, 99, 169logistical challenges in fragile and
confl ict-aff ected states, 55–56Lohani, Jeevan, 81, 232A Long Term Vision for Botswana. See
Vision 2016 Botswana Performance Report
Lula da Silva, Luiz Inácio, 214, 225n1

242 Index
MMachines and Equipment (FINAME,
Brazil), 118Malaysia, labor migration to, 84Malena, C., 151malnutrition, 3M&E. See monitoring and evaluationMark, M. M., 155, 155fmarket failures, 35, 38Market Watch Nepal, 83Martin, Frederic, xv, 213, 229Martin, R., 115, 134, 135Marx, K., xiv, 9Massachusetts Institute of Technology
(MIT), 42maternal mortality, 168McGee, R., 151media freedom, 158Melitz, M., 120Menon, Saraswathi, xiv, 25, 232, 233Merton, R. K., 6Mexico, social protection programs in, 214migration for employment, 84, 84f, 87,
95–96, 101n6Millennium Challenge Account, 226n7Millennium Development Goals (MDGs),
54, 158, 168, 187, 198Mind the Gap: Perspective on Policy
Evaluation and the Social Sciences (Vaessen & Leeuw), 18
Ministry of Industrial Development and Foreign Trade (Brazil), 119
Ministry of Interior (Afghanistan), 59Ministry of Interior Aff airs (MoI, Jordan),
173Ministry of Planning and International
Cooperation (MoPIC, Jordan), 105–7
Ministry of Social Development (MoSD, Jordan)
benefi ciaries’ index, 179–82, 179–82fdesk reviews, 176–77dissemination of data, 178–79Dynamic Index, 180–81, 181fearly warning system role of M&E,
182–84, 183–84festablishment of, 173–74Fixed Index, 181–82, 182fgoals of, 173bM&E in, 175–84, 175ftesting of M&E system by, 177–78, 177b
MIT (Massachusetts Institute of Technology), 42
Mitchell, Andrew, 51Moen, J., 115MoI (Ministry of Interior Aff airs, Jordan),
173monitoring and evaluation (M&E). See also
evaluation; national M&E development
analytical framework to diagnose M&E systems, 215–16, 217–18t
CSOs role in, 146–47, 147t, 160–62, 161fas decision support system, 176, 176bas demand-driven response, 176, 176bas early warning system, 176, 176b,
182–84, 183–84ffeedback/learning function of, 153–60in Jordan, 167–86in Latin America, 213–27operational approach to evaluation of
M&E systems, 218–24results-based, 52testing of system, 177–78, 177bas tool for change, 176, 176buses of, 176b
Monteiro Filha, D. C., 116Montreal Protocol, 40MoPIC (Ministry of Planning and
International Cooperation, Jordan), 105–7
Morocco, economic shocks in, 2Morra Imas, L., 70MoSD. See Ministry of Social DevelopmentMotor Centre Group, 203bMyrdal, Gunnar, 6
Nnational M&E development, 187–212
in Botswana, 192–204building blocks for, 189–90, 189f, 190–91b,
216defi ned, 211n1enabling environment for, 190b, 193–94framework for, 188–92functions of, 146–47in Latin America, 213–27lessons learned, 204–5, 205–6bnational performance report, 195–204
data collection for, 196–202, 198f, 199–201b
performance measurement and reporting, 195–96
“Status at a Glance,” 204, 207–11performance measurement and
reporting, 195–96
Index 243
pilot application of operational approach, 220–24, 222–23f
political will for, 193–94success factors for, 190–92technical capacity for, 191b, 194–95
National Research Council (U.S.), 18National Sample Survey Organization, 74Negri, F., 119Negri, J. A., 119Nepal
child labor in, 92–93dropout rate in, 94–98, 95–97feducation impact of 3 F’s in, 85–99, 86f,
99ffood, fuel, and fi nancial crisis in, xiv,
82–85, 84–85flearning achievement in, 90–92, 90tstudent attendance rates in, 86–90, 87f,
88t, 89fNepal Association of Foreign Employment
Agencies, 84Nepal Rastra Bank, 83Newars, 90, 102n14nongovernmental organizations (NGOs),
150, 192. See also civil society organizations (CSOs)
nonincremental change, 8–15nutrition programs, 100
OO’Donnell, G., 150OECD. See Organisation for Economic
Co-operation and Developmentoil. See fuel pricesOportunidades (Mexico), 214opportunity cost, 89, 102n20organic pollutants. See persistent organic
pollutantsOrganisation for Economic Co-operation
and Development (OECD), 7, 37, 45Ottaviano, G., 116, 117, 119, 134, 135, 140n16overage students, 94, 98, 102n20Overman, H. G., 115, 134, 135Overseas Development Institute (ODI),
157Owen, J. M., 19ozone depletion, 39–40
PPanama
pilot program for national M&E in, 221social protection programs in, 214
Paris Declaration (2005), 146, 158
path dependence, 9PATI (Programa de Atención Temporal
de Ingreso, El Salvador), 221, 222–23f
Patton, M. Q., 154Pereira, R. O., 116performance measurement and reporting,
195–96persistent organic pollutants, 34, 39–41Peruzzotti, E., 151Pesquisa Industrial Anual (PIA, Brazil),
119Petrobras, 125Philippines, GEF-funded programs in,
43PIA (Pesquisa Industrial Anual, Brazil),
119“piecemeal engineering,” 13Pierson, P., 9planning phase of impact assessments, 109The Plundered Planet (Collier), 38Polanyi, K., 10policy self-destruction, 13politics
of evaluation, 30in fragile and confl ict-aff ected states,
54–55incremental change in, 16in national M&E systems development,
205bpolitical use of evaluation, 154, 158political will for evaluation, 189–90, 189f,
193–94social sciences and, 8
pollution. See persistent organic pollutants
povertyBNDES loans and, 126chronic crisis of, 230food security and, 3in Jordan, 168, 173bin Latin America, 213
poverty lab (MIT), 42Poverty Reduction Strategy Papers (PRSPs),
146, 147, 148, 187private sector
in Botswana, 95, 192, 198, 202in Jordan, 171in national M&E systems development,
225productivity, 115–42
process use of evaluations, 154production costs, 135
244 Index
productivity assessment of BNDES programs, 115–42
data collection for, 119–20descriptive statistics for, 124–28, 125f,
126–27tempirical strategy for, 128–30results, 130–34, 131–32t, 137–39ttheoretical background, 120–24, 122f,
124fproductivity premium, 128Programa de Apoyo Temporal al Ingreso
Familiar (El Salvador), 214Programa de Atención Temporal de Ingreso
(PATI, El Salvador), 221, 222–23fPrograms and Projects Directorate
(MoPIC), 107Progreso (Mexico), 214project-monitoring data, 72propensity score matching (PSM), 128, 130,
131–32t, 140n15protest movements, 2. See also Arab Spring
(2011)Provincial Reconstruction Team (PRT), 55,
57, 66, 67PRSPs. See Poverty Reduction Strategy
PapersPSM. See propensity score matchingpublic administration, 6, 7public opinion, 152public sector
accountability for, 194in Botswana, 198, 202budget evaluations, 4, 7global public goods and, 34–36
Puga, F. P., 116punctuated equilibrium, 10, 13“purposive social action,” 6
Qqualitative and quantitative data. See also
data collectionHelmand Monitoring and Evaluation
Programme (HMEP), 61–62in national M&E systems, 176–77
Qudisat, Rasha, 167, 232–33
RRAPID (Research and Policy in
Development) framework, 157–59, 158f
RBM. See results-based managementrealist perspective on policy infl uence,
159–60, 159f
recordkeeping, 75Red de Oportunidades (Panama), 214,
221Reenen, J. V., 115, 134, 135regulatory framework
fi nancial market deregulation, 230for global public goods, 35
Reiff , L. O. d. A., 116Relação Anual de Informações Sociais
(RAIS, Brazil), 119relevance, 45–46, 232reliability of data, 72–73remittances, 83, 84, 168research and development sunk costs, 117,
121, 123, 135Research and Policy in Development
(RAPID) framework, 157–59, 158fResearch Inputs and Development Action
(RIDA), 81resource constraints, 71results-based management (RBM), 146, 153,
185, 194results-based monitoring and evaluation,
52Riecken, Henry W., 6, 7Rihani, S., 14Rist, Ray C., xv, 7, 215, 216The Road to Results (Morra Imas & Rist), 8Rothstein, B., 10
SSaif, Ibrahim, xiv, 1, 230Samoa, sustainable fi shing in, 42–43sampling strategy, 58–61, 60t, 68n3Samuelson, Paul, 35sanctions, 149, 163n4Schedler, A., 149, 150scholarships, 98, 100, 103n59Scriven, M., 18, 20n2secondary data. See available datasecondary education, 98, 169Secretaria de Comércio Exterior (SECEX,
Brazil), 119Secretaria de la Integración Social
Centroamericana (SISCA), 221skill gap analysis case study, 73–74Smith, J. A., 115Smulovitz, C., 151social accountability, 148, 151–52, 152b, 160,
163n5social betterment, 157Social Defense and Family Productivity
Enhancement (Jordan), 185

Index 245
Social Defense Directorate (Jordan), 177, 177b, 180
social protection programsevaluation of, 3–4in Jordan, 167–86public expenditures on, 169–70
social sciencesevaluation’s relation to, 17–19, 230politics and, 8turbulence and, 14
socioeconomic data, 72Socioeconomic Transformation Program
(Jordan), 170–71South Africa, evaluation in, 30South–South cooperation in evaluation, 29Statistics Botswana, 204steering committees, 219, 220Stern, Nicholas, 35Stern review, 37–38Stockholm Convention on Persistent
Organic Pollutants (2001), 39Strengthening Results-Based Management
of the Social Protection Sector in Central America, 221
Subscription of Securities (Brazil), 118subsistence farming, 41Suchman, Edward A., 6Sudan, economic shocks in, 2sunk costs, 117, 121, 135symbolic use of evaluations, 154Syrian Arab Republic, economic shocks
in, 2
TTaliban, 56, 63teacher recruitment case study, 75technical working groups (TWGs), 219, 224,
225n6terms of reference, 72Terra, M. C. T., 116theory of change, 62–64, 63f3 F’s. See food, fuel, and fi nancial crisistime-series analysis, 61Torres Filho, E. T., 116tourism, 168toxic chemicals. See persistent organic
pollutantstrade policies, 115transboundary issues for global public
goods, 36–37transparency, 65, 75transportation costs, 84–85triangulation of data, 178–79, 179f
TunisiaArab Spring protests in, xiiieconomic shocks in, 2evaluation in, 29
turbulencedata collection impacted by, 70–71evaluation during, 15–16, 25–31,
70–71global public goods and, 33–34incremental change and, 10, 13–15
TWGs. See technical working groups
UUnited Arab Emirates, labor migration to,
84United Kingdom
Afghanistan as foreign policy priority for, 55
development aid from, 52in Helmand Province, Afghanistan, 53institutional arrangements for evaluation
in, 31productivity assessments in, 134
United Nations, 29, 36, 230United Nations Children’s Fund (UNICEF),
81, 83, 100, 225n7United Nations Development Programme
(UNDP), 25, 27, 42, 65, 196. See also Development Assistance Committee (DAC)
United Nations Environment Programme (UNEP), 39, 42
United Nations Evaluation Group (UNEG), 43
United StatesAfghanistan as foreign policy priority for,
55agricultural sector in, 39evaluation development in, 6, 7
University of Botswana, 203b
Vvaccination rates, 168Vaessen, Jos, 18value added per worker, 126, 128VAM (vulnerability assessment and
monitoring), 82van den Berg, Robert D., xiv, 33, 232vertical accountability, 149–50vertical funds, 36Vision 2016 Botswana Performance Report
(Botswana), 188, 192–93, 197b, 198, 212n5
246 Index
Vision Council (Botswana), 192–93, 194, 195, 198, 200, 211n2
Vision Secretariat (Botswana), 192, 193, 198, 200
vulnerability assessment and monitoring (VAM), 82
WWeiss, C. H., 7, 8, 19West Bank, economic shocks in, 2WFP (World Food Programme), 82white-nose syndrome, 39white rhinoceros, 42Wikileaks, 29Wildavsky, A., 11, 13women. See also gender diff erences
in fragile and confl ict-aff ected countries, 56
qualitative research for opinions of, 61World Bank
on aid’s contribution to development, 42capacity building and, 196
“end-of-project” evaluations, 42evaluation development role of, 7, 221on food prices, 3global governance and, 36local budgets evaluated by, 4on media freedom, 158on national M&E systems development,
193, 226n7on poverty, 230on social accountability, 151
World Development Report 2004 (World Bank), 148
World Food Programme (WFP), 82
YYemen
Arab Spring protests in, xiiieconomic shocks in, 2
Zzero cut-off profi t (ZCP), 121–22Al-Zoubi, Lamia, 105, 233
The World Bank is committed to preserving endangered forests and natural resources. The Offi ce of the Publisher has chosen to print Development Evaluation in Times of Turbulence on recycled paper with 50 percent postconsumer fi ber in accordance with the recommended standards for paper usage set by the Green Press Initiative, a nonprofi t program supporting publishers in using fi ber that is not sourced from endan-gered forests. For more information, visit www.greenpressinitiative.org.
Saved:• 16 trees• 7 million BTUs of total
energy• 1,377 lbs. of net
greenhouse gases • 7,468 gallons of waste
water• 500 lbs. of solid waste
ECO-AUDIT
Environmental Benefits Statement