31782 - World Bank Documents & Reports
252
The World Bank Group in the Philippines Supporting Islands of Good Governance Philippines Meeting Infrastructure Challenges PUBLIC-PRIVATE INFRASTRUCTURE ADVISORY FACILITY 31782 Public Disclosure Authorized Public Disclosure Authorized Public Disclosure Authorized Public Disclosure Authorized Public Disclosure Authorized Public Disclosure Authorized Public Disclosure Authorized Public Disclosure Authorized
-
Upload
khangminh22 -
Category
Documents
-
view
0 -
download
0
Transcript of 31782 - World Bank Documents & Reports
The World Bank Group in the PhilippinesSupporting Islands of Good Governance
1818 H Street, NWWashington, DC 20043 USAInternet: www.worldbank.org
World Bank Office Manila23rd Floor, The Taipan PlaceEmerald Avenue, Ortigas CenterPasig City, PhilippinesTelephone: (63-2) 637-5855Internet: www.worldbank.org.ph
Ph
ilipp
ines: M
eeting
Infrastru
cture C
hallen
ges
Insu�cient infrastructure has been a major constraint to economic growth and poverty reduction in the Philippines. To improve the situation, a gradual increase in infrastructure investments is needed, from the current �gure of less than 3% of gross domestic product to at least 5%. The e�ciency of infrastructure spending should also be signi�cantly increased.
Philippines: Meeting Infrastructure Challenges was produced by the World Bank, working closely with the government of the Philippines and a wide range of other stakeholders. The document provides an integrated assessment of the power, water supply and sanitation, roads, and telecommunications sectors, as well as a diagnosis of the key cross-sectoral issues. It proposes an overall way forward and priority actions for infrastructure development in the Philippines, along with speci�c recommendations for each of the four sectors covered.
Achieving visible infrastructure improvement in a relatively short time is a formidable but feasible task. Many elements of the required framework are already in place. Philippines: Meeting Infrastructure Challenges recommends that priority be given to: a rigorous �scal reform program; reforms in key sectors—particularly power, roads, and water—to improve cost recovery, competition, and institutional credibility, and to sharply reduce corruption; improved central oversight of the planning and coordination of investments; and a few focused investments through public-private partnership to address key bottlenecks and achieve quick gains in service delivery.
Phili
ppin
es
Mee
ting
Infr
astr
uctu
re Ch
alle
nges
PPIAF Program Management Unitc/o The World BankMail Stop Number H3-2601818 H. St. NWWashington, DC 20433 USATel: +1-202-458-5588Fax: +1-202-522-7466Email: [email protected]
PUBLIC-PRIVATE INFRASTRUCTUREADVISORY FACILITY
PUBLIC-PRIVATE INFRASTRUCTUREADVISORY FACILITY
C
M
Y
CM
MY
CY
CMY
K
Newlogos.pdf 12/6/2005 8:36:18 AM
31782
Pub
lic D
iscl
osur
e A
utho
rized
Pub
lic D
iscl
osur
e A
utho
rized
Pub
lic D
iscl
osur
e A
utho
rized
Pub
lic D
iscl
osur
e A
utho
rized
Pub
lic D
iscl
osur
e A
utho
rized
Pub
lic D
iscl
osur
e A
utho
rized
Pub
lic D
iscl
osur
e A
utho
rized
Pub
lic D
iscl
osur
e A
utho
rized

The World Bank Group in the Philippines: Supporting Islands of Good Governance
The World Bank Group seeks to help the Philippines improve the lives of its citizens through sustainable economic growth and greater social inclusion. Fiscal stability and public institutions that serve the common good are critical to these objectives. Our strategy is to support Islands of Good Governance in those government agencies, local governments, and dynamic sectors in the Philippines that demonstrate how improved accountability and service delivery will lead to better economic and social outcomes. We want to help expand these successful experiences and thus stimulate a virtuous cycle of more effective public institutions, fiscal improvements, economic growth, poverty reduction, and greater social inclusion. Our dream is that the Philippines will become the Islands of Good Governance.
CASINSIDECOVER.indd 1 12/6/2005 8:04:03 AM

Philippines
Meeting Infrastructure Challenges
WorldBankInfra.indb 1 12/6/2005 8:40:05 AM

©2005 The International Bank for Reconstruction and Development / The World Bank1818 H Street NWWashington DC 20433Telephone: 202-473-1000Internet: www.worldbank.orgE-mail: [email protected]
All rights reserved
1 2 3 4 5 09 08 07 06 This volume is a product of the staff of the International Bank for Reconstruction and Development / The World Bank. The findings, interpretations, and conclusions expressed in this volume do not necessarily reflect the views of the Executive Directors of The World Bank or the governments they represent.
Neither the World Bank nor PPIAF guarantees the accuracy of the data included in this publication or accepts responsibility for any consequence of their use. The boundaries, colors, denominations, and other information shown on any map in this report do not imply on the part of the World Bank Group or PPIAF any judgment on the legal status of any territory or the endorsement or acceptance of such boundaries.
Rights and PermissionsThe material in this publication is copyrighted. Copyright is held by the World Bank on behalf of both the World Bank and PPIAF. Copying and/or transmitting portions or all of this work without permission may be a violation of applicable law. The International Bank for Reconstruction and Development / The World Bank encourages dissemination of its work and will normally grant permission to reproduce portions of the work promptly and, when reproduction is for non-commercial purposes, without asking a fee.
For permission to photocopy or reprint any part of this work, please send a request with complete information to the Copyright Clearance Center Inc., 222 Rosewood Drive, Danvers, MA 01923, USA; telephone: 978-750-8400; fax: 978-750-4470; Internet: www.copyright.com.
For questions about this publication or information about ordering more copies, please refer to the World Bank’s Philippines website (www.worldbank.org.ph) or PPIAF website (www.ppiaf.org). Queries may also be addressed to:
Leonora Gonzales, World Bank Office Manila, 23rd Floor, The Taipan Place, Emerald Avenue, Ortigas Center, Pasig City, Philippines. Phone: (632) 637-5855. Fax: (632) 917-3050. E-mail: [email protected]; or
PPIAF c/o the World Bank, 1818 H. Street, Washington, DC 20433. Fax: 202-522-7466. Email: [email protected].
Printed in Manila, Philippines. December 2005.
WorldBankInfra.indb 2 12/6/2005 8:40:06 AM

Philippines
Meeting Infrastructure Challenges
Infrastructure Sector DepartmentEast Asia and Pacific Region TheWorld Bank
PUBLIC-PRIVATEINFRASTRUCTUREADVISORY FACILITY
WorldBankInfra.indb 3 12/6/2005 8:40:06 AM

iv Philippines: Meeting Infrastructure Challenges
Contents
Foreword xiAcknowledgments xiiAcronyms and abbreviations xiii
Executive Summary
Meeting Infrastructure Challenges: Key Findings, Conclusions, and Recommendations xviiBackground: Is there an infrastructure crisis? xviiKey issues xixThe way forward xxiiiExpected outcome xxvi
Chapter 1
Infrastructure in the Philippines 1Introduction 1Infrastructure and living standards 1The growth, poverty reduction, and infrastructure nexus 3Current and future infrastructure needs: What is driving them? 8Introducing the key cross-sectoral issues 10
Chapter 2
The Business Environment for Infrastructure 15Inadequate cost recovery 15Corruption 17Insufficient competition 18Low credibility of institutions 21Suggested actions 24
Chapter 3
Infrastructure Planning, Coordination, and Financing 33Introduction 33Infrastructure policy planning and coordination 33Infrastructure financing 43Suggested actions 46
Chapter 4
Maximizing the Benefits of Private Sector Participation 55Introduction 55Potential of private involvement and role of the public sector 57Reasons for decline in private sector interest 59Suggested actions 68
WorldBankInfra.indb 4 12/6/2005 8:40:06 AM

v
Chapter 5
The Way Forward 73Building on strength and success 73Prioritizing reforms: Key considerations 74The way forward: Key recommendations 78
Chapter 6
Power 83Overview 83Legal and institutional framework 85Sector structure and ownership 85Investment needs and financing 88Sector performance 89Main issues 94Recommendations 98
Chapter 7
Water Supply and Sanitation 107Overview 107Policy and institutional framework 109Market structure and ownership of assets 110Investment needs and financing 116Sector performance 119Main issues 123Recommendations 129
Chapter 8
Roads 139Overview 139Policy and institutional framework 140Sector structure and ownership 144Road expenditures and financing 146Sector performance 150Main issues 156Recommendations 159
Chapter 9
Telecommunications 167Overview 167Policy and institutional framework 168Sector structure and ownership 170Sector investment and financing 172Main issues 175Findings and recommendations 178
WorldBankInfra.indb 5 12/6/2005 8:40:06 AM

vi Philippines: Meeting Infrastructure Challenges
Appendixes 185Appendix 1Correlation versus Causation: Does Infrastructure Cause Growth in the Philippines? 185
Appendix 2Spatial Effects of Infrastructure 186
Appendix 3Framework for Local Government Access to Financing and its Implementation Progress 188
Appendix 4Results of Privatization Perception Survey 190
Appendix 5Costs and Benefits of Sector Reforms 194Power 194Water supply 197Road transport 199Telecommunications 202
Appendix 6 Key Legislation Relevant to Water Supply and Sanitation in the Philippines 207
Appendix 7 Principal Agencies Involved in Water Supply and Sanitation Policy Formulation and Implementation 209
Appendix 8Estimated Investment Requirements in Water Supply and Sanitation 210
Appendix 9Ownership Structure and Selected Features of Existing/Planned Expressways 212
Index 213
WorldBankInfra.indb 6 12/6/2005 8:40:06 AM
vii
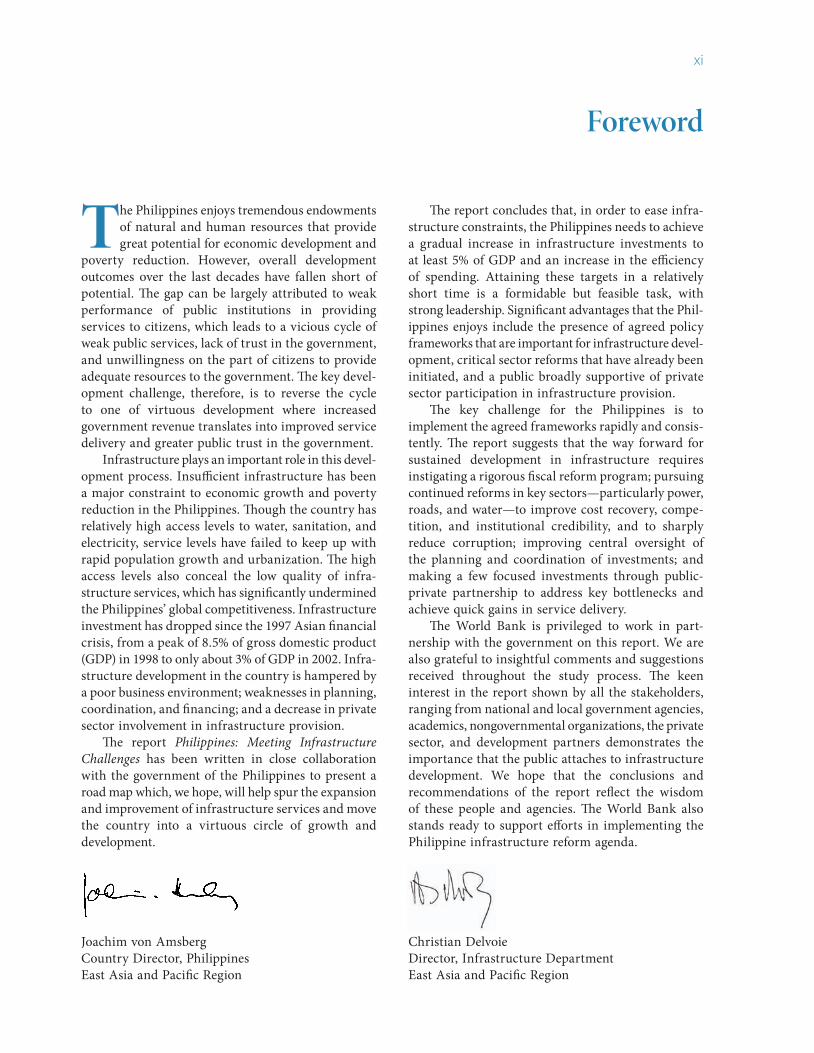
Tables
1.1 Economist Intelligence Unit competitiveness risk scores 51.2 Business environment indicators 61.3 Overall competitiveness rankings, 2003 62.1 Approved tariff increases in the Metropolitan Waterworks and Sewerage System concession areas,
average tariff (P per cubic meter) 152.2 Summary of economic regulators in infrastructure sectors 223.1 Selected key measurable targets under the Medium-Term Philippine Development Plan 2001–
2004 373.2 Funds for local infrastructure in Department of Public Works and Highways budget, 1997–2001
(P billion) 383.3 Local government infrastructure investment as a share of GDP, 1985–2002 (%) 413.4 Internal Revenue Allotment as a share of local government income 423.5 Distribution of official development assistance commitments, December 2003 465.1 International comparisons of infrastructure 745.2 Competitiveness and business environment comparisons 755.3 Estimates of consumer surplus from reforms 766.1 National Power Corporation generation by type of plant, 1998–2003 866.2 Comparison of access and other performance measures 896.3 Transco unserved energy and lost system minutes, 2002–2003 906.4 National Power Corporation financial highlights, 1996–2003 916.5 Summary matrix of potential reform measures for a three- to five-year period 1007.1 Market shares, urban and rural populations by primary source 1117.2 Water districts by category, 2003 1127.3 Sample characteristics of local government-managed water supply systems 1137.4 Local government expenditures on water supply and sanitation, 1990–2002 (P million) 1177.5 Local Water Utilities Administration capital expenditures, 1992–2003 (P million) 1187.6 Manila water concessionaire capital expenditures, 1997–2003 (P million) 1187.7 Access to drinking water and sanitation: Cross-country comparison 1197.8 Access to water supply and sanitary toilets, by income stratum, 1998, 1999, and 2002 1207.9 Access to sanitation and sewerage, 2000 1207.10 Performance indicators of the Manila water concessionaires, 1997–2003 1217.11 Efficiency indicators of selected water service providers, 2002 1227.12 Approved tariff increases in the Metropolitan Waterworks and Sewerage System concession areas,
average tariff (P per cubic meter) 1237.13 Subsidies to the Local Water Utilities Administration, 1992–2003 (P million) 1277.14 Summary of recommended actions 1358.1 Main legal and regulatory provisions 1418.2 Allocation of responsibilities/mandates 1438.3 Classification of existing non-toll road network, 2000 1448.4 Regional distribution of roads, population, and vehicles 1458.5 Motor vehicles by category, 1990–2002 1478.6 Expenditures by government on roads (P billion, nominal, unless otherwise indicated) 1488.7 Proposed Medium-Term Public Investment Program, 2004–2009 (P million, nominal) 1498.8 Indicative projections of local road expenditures (P billion, nominal) 1508.9 Projected expenditures, estimated needs, and financing gap (P billion, nominal, unless otherwise
indicated) 1518.10 Key measurable targets under the 2001–2004 MTPDP 1518.11 Road network coverage, six Asian countries 1538.12 Length and paved share of national roads, four Asian countries 1538.13 Length and paved share of national roads, Philippines, selected areas, 2000 1538.14 Change in length and paved share of roads by road class 153
WorldBankInfra.indb 7 12/6/2005 8:40:06 AM

viii Philippines: Meeting Infrastructure Challenges
8.15 Average roughness for a proportion of the national road network, 2004 1548.16 National cost of traffic accidents, 2002 1548.17 Length of expressway network, three Asian countries 1558.18 Intercity passenger transport and freight costs, three Asian countries 1558.19 Gasoline prices, selected Asian economies, November 2004 1568.20 Road sector recommendations 1619.1 Telecommunications industry structure 1709.2 Market shares in local exchange, inter-exchange carrier, and international gateway facility services
(%), 2002 1709.3 Local exchange carrier lines capacity, 2003 1709.4 Call costs, selected regional countries (US cents a minute), 2003 1719.5 Cumulative investments in telecommunications, 1992–2000 1739.6 Capital expenditures ($) 1739.7 Access to fixed and mobile line telephone services, selected indicators, 2001 1739.8 Access to information and communications technology services, selected indicators, 2001 1749.9 Teledensity distribution, 2003 1749.10 Comparison of teledensity figures in the region, 1995 and 2003 1759.11 Proposed road map for government action (in order of priority) 181
Appendix tablesA2.1 Uneven regional development and uneven infrastructure access 186A2.2 Rank correlation coefficients: Total net shift values and infrastructure development indicators,
1987–2000 187A3 Local government borrowings, 1985–2002 189A4.1 Opinion on private sector participation (investment and operation) in infrastructure
services 190A4.2 Opinion on profits and losses 191A4.3 Knowledge on whether price of service controlled by government 191A4.4 Perceived function of the Energy Regulatory Commission 192A4.5 Perception on the trade-off between quality and price 193A5.1 Tariff paths at nominal prices (P/kWh) 195A5.2 Electricity consumption, 2003 (GWh) 195A5.3 Net change in consumer surplus due to changes in tariffs, lower bound (high price elasticity,
stranded cost recovery, $ million) 196A5.4 Net change in consumer surplus due to changes in tariffs, upper bound (low price elasticity, no
stranded cost recovery, $ million) 196A5.5 Net benefits of increasing level 3 access over seven years 197A5.6 Inputs and assumptions: Level 3 providers 198A5.7 Net changes in consumer surplus 199A5.8 Maintenance expenditure, national road network (P billion) 200A5.9 Estimated generic vehicle operating costs (P/km) 200A5.10 Road conditions, by region 200A5.11 Vehicle-kms traveled, by region, 2004 201A5.12 Cost-benefit analysis, 2004–2009 201A5.13 Inputs and assumptions 203A5.14 Telecom build-out plan and users during initial construction period 204A5.15 Individual gains in consumer surplus 205A5.16 Total number of telecenters and payphones in operation, and in minutes 205A5.17 Benefits, costs, and net economic flows of the build-out plan ($ million) 206A6.1 Legislation relevant to water supply 207A6.2 Legislation relevant to sanitation 208A8.1 Estimated investment requirements for water supply, 2004–2009 210A8.2 Investment requirements for urban and rural sewerage and sanitation 211
WorldBankInfra.indb 8 12/6/2005 8:40:07 AM

ix
Figures
1 Infrastructure investment as a share of GDP, selected countries xix2 Corruption Perceptions Index for five East Asian countries, 1995–2004 xx3 Infrastructure expenditures as a share of GDP, 1985–2002 xxi4 Private and public expenditures on infrastructure as a share of GDP xxi5 National government tax revenues as a share of GDP, 1985–2003 xxii1.1 Access to and quality of basic infrastructure services, selected countries 21.2 Access to basic infrastructure, 1998 31.3 GDP growth rate, 1970–2003 41.4 GDP per capita growth, selected countries, 1985–2003 41.5 Growth and infrastructure trends 71.6 Share of firms evaluating constraints as major or very severe in the Philippines 81.7 Average annual rate of change of total, urban, and rural population, 1950–2030 81.8 Urban and rural population, 1950–2030 101.9 National government fiscal position as a share of GDP, 1985–2003 111.10 Infrastructure investment as a share of GDP, selected countries 112.1 Municipal service cost recovery 172.2 Corruption Perceptions Index for five East Asian countries, 1995–2004 173.1 Infrastructure expenditures as a share of GDP 353.2 Local government own-source revenue as a share of GDP 393.3 Local government Internal Revenue Allotment transfers as a share of GDP 403.4 Local government current operations as a share of GDP, 1985–2001 443.5 Local government revenues as a share of GDP, 1985–2002 444.1 Cumulative private sector investment in infrastructure, 1990–2003 554.2 Private sector participation in infrastructure, 1990–2002 564.3 Private investment in infrastructure, selected ASEAN countries, 1990–2003 564.4 Private investments in infrastructure (controlled for income),
selected ASEAN countries, 1990–2003 564.5 Range of private sector options in delivery of infrastructure services 574.6 Private investments in infrastructure, by type, 1990–2003, $ billion 574.7 Official exchange rate (P/$, period average) 594.8 International Country Risk Guide composite risk ratings, 1986–2004 (100 = most risky) 604.9 Economist Intelligence Unit risk scores, 1998–2004 (100 = most risky) 604.10 Economist Intelligence Unit composite country risk score, March 2004 (100 = most risky) 604.11 International Country Risk Guide risk assessment, January 2004 (100 = most risky) 614.12 Foreign direct investment net inflows as a share of GDP 614.13 Attractiveness of countries, 2004 616.1 Electricity market structure, 2004 866.2 New wholesale electricity market structure 876.3 Forecasts of maximum peak demand in Luzon 896.4 Electricity prices in Association of Southeast Asian Nations countries 927.1 Market share by type of provider 1117.2 Capital expenditure per connection, selected Asian cities, 2001/2002 1167.3 Water sector capital expenditures 1177.4 Sewerage access, selected Asian cities, 2001/2002 1197.5 Average tariffs, selected Asian cities, 2001/2002 1228.1 Investment in national roads as a share of GDP, 1993–2009 1498.2 International toll rates 1569.1 National long-distance traffic and revenue trends, 2000–2005 1719.2 Regional cellular phone market forecasts, 1998–2005 171
WorldBankInfra.indb 9 12/6/2005 8:40:07 AM

x Philippines: Meeting Infrastructure Challenges
Appendix figuresA2 Total net shift analysis of gross regional domestic product, 1987–2000 187A4.1 Ownership of utility 190A4.2 Price vis-à-vis the cost of provision 192A4.3 Present quality 192A4.4 Quality compared to 5 years ago 192A5 Demand curve for water from level 3 connections 198
Boxes
1.1 Environmental and health impacts of inadequate infrastructure 41.2 Roads, lighting, schooling, and the poor 51.3 Role of transport and logistics in trade 71.4 Infrastructure and the Mindanao conflict 91.5 To what extent do rural areas drive infrastructure needs? 101.6 The fiscal impact of infrastructure 122.1 Judicial decisions with implications for the business environment for infrastructure 242.2 Subsidies in infrastructure sectors 252.3 Citizens’ action in monitoring public works projects 272.4 The Naga City case: Making the public procurement system work 282.5 Benchmark competition in the United Kingdom water sector 292.6 Sensitizing the judiciary to infrastructure regulatory issues in South Asia 293.1 Infrastructure Planning and Coordination in East Asia 343.2 Cebu Port Authority seeks halt to project by local government unit 413.3 A successful example of interjurisdictional cooperation 483.4 Municipal Infrastructure Investment Unit, South Africa 493.5 Examples of infrastructure funds 514.1 Matching options to objectives: Metropolitan Waterworks
and Sewerage System water concessions 584.2 How do private sector participants in infrastructure projects view the existing business environment
for infrastructure? 624.3 Results of the World Bank-Social Weather Stations Privatization Perception Survey 644.4 How not to do a BOT project: The Casecnan project 654.5 Pilot output-based subsidy schemes in the Philippines 664.6 Guaranteeing input supply risk: The Casecnan and Metropolitan Waterworks and Sewerage System
cases 674.7 How do private sector participants in infrastructure projects view the BOT Law and its
implementing rules and regulations? 694.8 Measuring, budgeting, and accounting for guarantees 704.9 Improving policies for unsolicited bids in the Philippines 716.1 Energy Regulatory Commission: New responsibilities under reforms 846.2 International comparisons of lifeline tariffs 937.1 Amalgamation of water districts: The case of a water district in Laguna 1127.2 Amalgamation of BWSAs: The case of three barangays 1137.3 The Manila water concessions 1147.4 Lessons from the Manila water concessions for the design of future private sector contracts 1157.5 Reforms of the tariff-setting process in Chile 1317.6 Ecuador’s merit-based government transfers to water service providers 1348.1 Southern Tagalog Arterial Road: The two-in-one public-private partnership model 1468.2 Road Information and Management Support System 152
WorldBankInfra.indb 10 12/6/2005 8:40:07 AM
xi
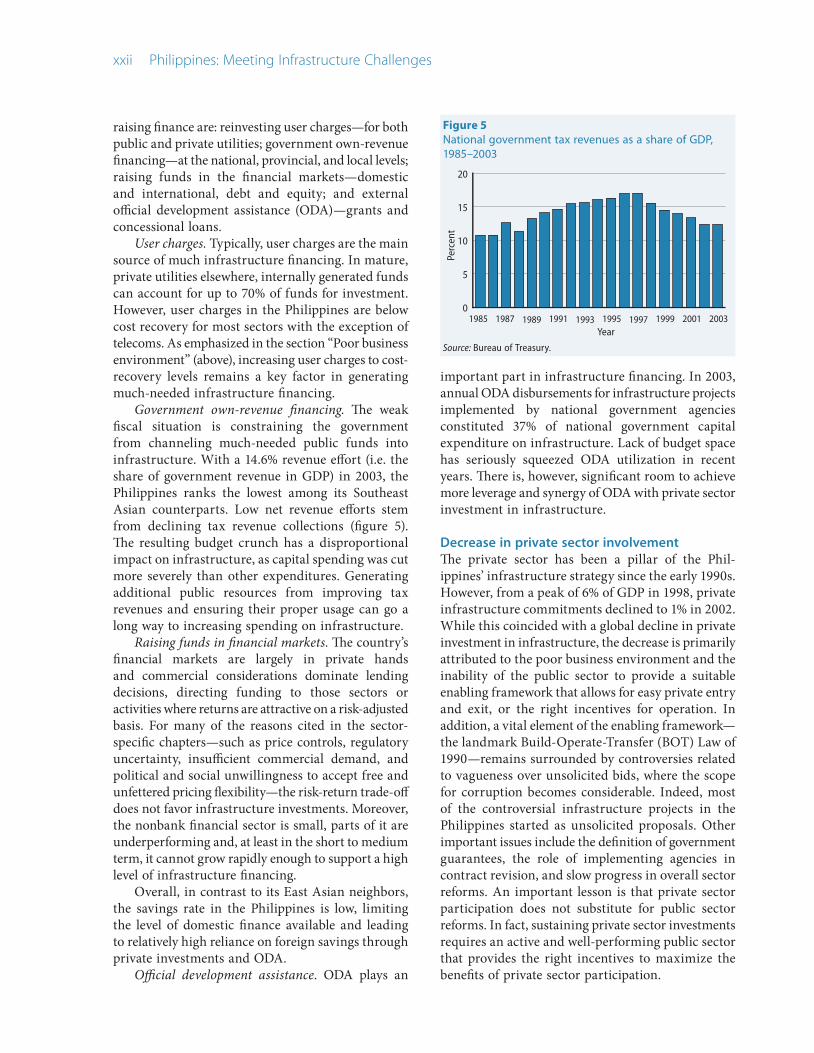
Foreword
Christian DelvoieDirector, Infrastructure DepartmentEast Asia and Pacific Region
Joachim von AmsbergCountry Director, PhilippinesEast Asia and Pacific Region
The Philippines enjoys tremendous endowments of natural and human resources that provide great potential for economic development and
poverty reduction. However, overall development outcomes over the last decades have fallen short of potential. The gap can be largely attributed to weak performance of public institutions in providing services to citizens, which leads to a vicious cycle of weak public services, lack of trust in the government, and unwillingness on the part of citizens to provide adequate resources to the government. The key devel-opment challenge, therefore, is to reverse the cycle to one of virtuous development where increased government revenue translates into improved service delivery and greater public trust in the government.
Infrastructure plays an important role in this devel-opment process. Insufficient infrastructure has been a major constraint to economic growth and poverty reduction in the Philippines. Though the country has relatively high access levels to water, sanitation, and electricity, service levels have failed to keep up with rapid population growth and urbanization. The high access levels also conceal the low quality of infra-structure services, which has significantly undermined the Philippines’ global competitiveness. Infrastructure investment has dropped since the 1997 Asian financial crisis, from a peak of 8.5% of gross domestic product (GDP) in 1998 to only about 3% of GDP in 2002. Infra-structure development in the country is hampered by a poor business environment; weaknesses in planning, coordination, and financing; and a decrease in private sector involvement in infrastructure provision.
The report Philippines: Meeting Infrastructure Challenges has been written in close collaboration with the government of the Philippines to present a road map which, we hope, will help spur the expansion and improvement of infrastructure services and move the country into a virtuous circle of growth and development.
The report concludes that, in order to ease infra-structure constraints, the Philippines needs to achieve a gradual increase in infrastructure investments to at least 5% of GDP and an increase in the efficiency of spending. Attaining these targets in a relatively short time is a formidable but feasible task, with strong leadership. Significant advantages that the Phil-ippines enjoys include the presence of agreed policy frameworks that are important for infrastructure devel-opment, critical sector reforms that have already been initiated, and a public broadly supportive of private sector participation in infrastructure provision.
The key challenge for the Philippines is to implement the agreed frameworks rapidly and consis-tently. The report suggests that the way forward for sustained development in infrastructure requires instigating a rigorous fiscal reform program; pursuing continued reforms in key sectors—particularly power, roads, and water—to improve cost recovery, compe-tition, and institutional credibility, and to sharply reduce corruption; improving central oversight of the planning and coordination of investments; and making a few focused investments through public-private partnership to address key bottlenecks and achieve quick gains in service delivery.
The World Bank is privileged to work in part-nership with the government on this report. We are also grateful to insightful comments and suggestions received throughout the study process. The keen interest in the report shown by all the stakeholders, ranging from national and local government agencies, academics, nongovernmental organizations, the private sector, and development partners demonstrates the importance that the public attaches to infrastructure development. We hope that the conclusions and recommendations of the report reflect the wisdom of these people and agencies. The World Bank also stands ready to support efforts in implementing the Philippine infrastructure reform agenda.
WorldBankInfra.indb 11 12/6/2005 8:40:08 AM

xii Philippines: Meeting Infrastructure Challenges
This report is the result of the joint efforts of a large team from various sectors led by Ming Zhang. Team members who contributed to
the writing of the report include: Apurva Sanghi, Michel Kerf, Dirk Sommer, Baher El-Hifnawi, Selina Shum, Eric Groom, Mariles Navarro, Tenzin Norbhu, Stuart McPherson, Arvind Gupta, Gilbert Llanto, Hope Gerochi, Christopher Pablo, Philip Lam, Elisa Muzzini, and Maria Rosanna Martin. The report was written under the guidance of Christian Delvoie, Director, Infrastructure Department, East Asia and Pacific Region and Joachim von Amsberg, Country Director, Philippines. Background papers for the report were contributed by Felipe Medalla, Rosario Manasan, Jhiedon Florentino, and an Almec team led by Shizuo Iwata. Hope Gerochi provided research assistance for the study, Teresita Angelica Plata served as program assistant to the team, Jonathan Aspin was editor for the entire report, and Anissa Tria advised on report production.
The report benefited from consultation and advice from numerous reviewers including: Richard Scurfield, Christine Kessides, Manuel Schiffler, Jordan Schwartz (as peer reviewers), Rey Ancheta, Yolanda Azarcon, Aldo Baietti, Mark Baird, Joven Balbosa, Jitendra Bajpai, Ma. Bella Tumaliwan-Belizario, Sally Burningham, Songsu Choi, Sanjay Dhar, Nina Masako Eejima, Elisea Gozun, Christopher Hoban, John T. Hodges, Susan Hume, John Irving, Hiroichi Kawashima, William Kingdom, Lloyd McKay, Bill Paterson, Anthony Pelligrini, Janelle Plummer, Salvador Rivera, David Satola, Sethaput Suthiwart-Naruepu, Jemima Sy, Luiz Tavares, Alan Townsend, Caroline Van Den Berg, Keshav Varma,
James Villafuerte, Jonathan Walters, Junhui Wu; as well as our colleagues from the Asian Development Bank—Yongping Zhai and Shihiru Date; the Japan Bank for International Cooperation—Mayumi Endoh and Floro Adviento; and the International Finance Corporation—Jesse Ang.
The report is being published jointly by the World Bank and the Public-Private Infrastructure Advisory Facility (PPIAF). PPIAF is a multi-donor technical assistance facility aimed at helping developing countries improve the quality of their infrastructure through private sector involvement. For more information on the facility please see the website: www.ppiaf.org.
This report was developed in close collaboration with the National Economic and Development Authority (NEDA), specifically the Infrastructure Staff and Public Investment Staff. We would especially like to thank NEDA Assistant Director-Generals Ruben Reinoso and Rolando Tungpalan for their invaluable partnership and advice. We would also like to recognize the very helpful contribution of participants in a series of consultation meetings—some on the entire report, some on the specific sectors—which helped shape the report. A draft version of the report was presented at the Philippines Infrastructure Conference on May 23, 2005, and conference participants provided valuable feedbacks. The draft report was provided to various government agencies and nongovernmental experts for comments after the conference, and also placed on the World Bank’s Philippines website to receive public feedback. We would like to thank all the people and agencies who provided comments, which we have tried to include during the final revision.
Acknowledgments
Vice President Jemal-ud-din KassumCountry Director Joachim von AmsbergSector Director Christian DelvoieTeam Leader Ming Zhang
WorldBankInfra.indb 12 12/6/2005 8:40:08 AM

xiii
BOT Build-operate-transferBWSA Barangay water services associationCICT Commission on Information and Communications TechnologyCMTS Cellular mobile telephone systemDBCC Development Budget Coordinating CommitteeDBM Department of Budget and ManagementDBP Development Bank of the PhilippinesDENR Department of Environment and Natural ResourcesDILG Department of Interior and Local GovernmentDOE Department of EnergyDOF Department of FinanceDOTC Department of Transportation and CommunicationsDPWH Department of Public Works and HighwaysEO Executive orderEPIRA Electric Power Industry Reform ActERC Energy Regulatory CommissionGDP Gross domestic productGFI Government financial institutionGOCC Government owned and controlled corporationGPRA Government Procurement Reform ActGSIS Government Service Insurance SystemGWh Gigawatt-hourICC NEDA Investment Coordination CommitteeIGF International gateway facilityIPP Independent power producerIRA Internal Revenue AllotmentIRI International Roughness IndexIRR Implementing rules and regulationsISP Internet service providerJICA Japan International Cooperation AgencykV KilovoltkWh Kilowatt-hourLGC Local Government CodeLGU Local government unit LGUGC Local Government Unit Guarantee CorporationLTFRB Land Transportation Franchising and Regulatory BoardLWUA Local Water Utilities AdministrationMCTE Manila–Cavite Toll ExpresswayMDFO Municipal Development Fund OfficeMTPDP Medium-Term Philippine Development PlanMTPIP Medium-Term Public Investment ProgramMVUC Motor Vehicle User’s ChargeMW MegawattMWCI Manila Water Company, Inc.MWSI Maynilad Water Services, Inc.MWSS Metropolitan Waterworks and Sewerage System
Acronyms and abbreviations
WorldBankInfra.indb 13 12/6/2005 8:40:08 AM

xiv Philippines: Meeting Infrastructure Challenges
NEDA National Economic and Development AuthorityNLEX North Luzon ExpresswayNPC National Power CorporationNPL Nonperforming loanNSO National Statistics OfficeNTC National Telecommunications CommissionNWRB National Water Resources BoardO&M Operation and maintenanceODA Official development assistanceP PesoPCO Public calling officePD Presidential decreePEMC Philippine Electricity Market CorporationPLDT Philippine Long Distance Telephone CompanyPNCC Philippine National Construction CorporationPNR Philippine National RailwaysPPA Philippine Ports AuthorityPSALM Power Sector Assets and Liabilities Management CorporationRA Republic ActRDC Regional development councilRIMSS Road Information Management Support SystemRWSA Rural water supply associationSAS Service Area SchemeSLEX South Luzon ExpresswaySRF Special Road FundSSIP Small-scale independent providerSTAR Southern Tagalog Arterial RoadTELOF Telecommunications OfficeTransco National Transmission CorporationTRB Toll Regulatory BoardTSC Transitional supply contractWESM Wholesale electricity spot marketWPEP Water Supply and Sanitation Performance Enhancement Project
Currency and exchange ratesCurrency Unit: Philippine PesoExchange Rate (as of October 18, 2005): P55.8 = US$1
WorldBankInfra.indb 14 12/6/2005 8:40:08 AM

xv
WorldBankInfra.indb 15 12/6/2005 8:40:08 AM

Joel Nito/Agence France-Presse
WorldBankInfra.indb 16 12/6/2005 8:40:11 AM

Executive Summary
Meeting Infrastructure Challenges: Key Findings, Conclusions, and
Recommendations
The Philippines has attained important achievements in infrastructure provision, and access to basic infrastructure services tends to
be higher than that of its neighbors. The government has also been undertaking critical reforms, such as promotion of private sector participation and power sector restructuring, which are among the most progressive in Asia. However, infrastructure deployment has not kept up with high population growth and rapid urbanization, with serious conse-quences for the country’s competitiveness and in particular for its growth and poverty reduction targets, including the Millennium Development Goals. The 2004–2010 Medium-Term Philippine Development Plan (MTPDP), as published by the government, recognizes the importance of removing infrastructure bottlenecks as a matter of priority in order to achieve a more rapid development pattern, and lays out the broad reform agenda.
Accelerating progress in infrastructure provision will require actions to address the key business environment issues—the “four Cs”: inadequate cost recovery, corruption, insufficient competition, and low credibility of institutions. Equally important will be measures to improve public sector planning and coordination for infrastructure provision, to mobilize additional resources, and to increase the benefits of private participation.
While much needs to be done, a large part of the framework for action is already in place. The government has embarked on a fiscal reform program and plans to accelerate the needed fiscal adjustment. The importance of improving the business envi-ronment for infrastructure is increasingly being recognized, as evidenced by specific steps that are being taken toward combating corruption, and by some progress toward cost recovery. Examples at
various levels of government clearly demonstrate that where political will and strong leadership exist, infrastructure provision can indeed be sustainable. The key to achieve sustained improvement lies in rapid and consistent implementation.
Over the next few years, it is important to achieve results on three interrelated fronts: (a) strong fiscal adjustment; (b) a gradual increase in infrastructure investments—they were only 2.8% of gross domestic product (GDP) in 2002—to at least 5%; and (c) increased efficiency of infrastructure spending. To achieve these results in a relatively short time is a formidable but feasible task. Priorities should be given to the implementation of (a) a rigorous fiscal reform program; (b) reforms in key sectors—particularly power, roads, and water supply—to improve cost recovery, competition, and institutional credibility, and to sharply reduce corruption; (c) improved central oversight of the planning and coordination of investments; and (d) a few focused investments through public-private partnership to address key bottlenecks and achieve quick gains in service delivery.
Success on these different fronts would help restore citizens’ trust in public institutions’ ability to use public resources efficiently. And this, in turn, would enhance the public’s willingness to provide adequate resources to the state, thus reestablishing a virtuous circle of development.
Background: Is there an infrastructure crisis?
The Philippines has attained important achievements in infrastructure development, particularly in terms of access to infrastructure services by the general population. Overall access rates to electricity (80%),
WorldBankInfra.indb 17 12/6/2005 8:40:11 AM

xviii Philippines: Meeting Infrastructure Challenges
improved water supply (86%), sanitation (83%), and telephones (31%, including cellular) are all relatively high compared with those in developing East Asian countries. The total road network length (2.6 kilometers per 1,000 people) also compares favorably. In addition, the government has undertaken some important reform measures in the sector, particularly in terms of private sector participation: the Philippines passed the first build-operate-transfer (BOT) law in the East Asian region as well as the most ambitious power sector reform legislation; it implemented the largest water concession at the time; and it established the first road fund in the region. These measures resulted in significant private sector investments in infrastructure, on average contributing more to infrastructure investments than the public sector over 1992–2002.
Deteriorating quality of infrastructure Despite these achievements, the overall state of infrastructure in the country has not kept up with rapid population growth and urbanization, and has emerged as a key impediment to the Philippines’ economic competitiveness. Competitiveness rankings underscore the importance of infrastructure to the Philippines’ investment climate. The country slid to 52 (from 49) in the 2004 World Competitiveness Yearbook, with its infrastructure ranking slipping to 59 from 56 (out of 60 countries). In 2004, the World Economic Forum ranked the country 89 out of 102 countries for overall infrastructure quality—well below both Indonesia (51) and Vietnam (76). A World Bank investment climate assessment of about 715 private firms found that infrastructure, in particular power, is a major concern.
Sector-specific data, too, attest to the deterio-rating state of infrastructure and its impact on the quality of life. The relatively high access levels mask the underlying poor quality of services. In the power sector, electrification rates, at about 80%, are above the regional average, though the sector’s financial situation is alarming. Electricity shortages in the early 1990s prompted the government to overcontract with numerous independent power producers. As a result, there has been substantial overcapacity, an issue that was exacerbated by the leveling-off of electricity demand following the 1997 Asian crisis, and elec-tricity production costs in the Philippines are among the highest in the region. Retail tariffs that have been set below cost for years contributed to a ballooning deficit at the National Power Corporation (NPC). The situation will, however, progressively improve
as demand increases. In addition, the government has taken the first steps toward containing the deficit of NPC by increasing generation tariffs by about P1.4 per kilowatt-hour over June to November 2004, and additional increases are being considered. These increases will enable NPC to cover its operating costs in 2005.
In the water sector, official access data suggest that after a decade of modest growth in coverage, access levels for water supply have been slipping. Access to safe drinking water for the entire population dete-riorated from 81.4% in 1999 to 80% in 2002. Access for the poorest segment of the population declined from 71.5% in 1999 to 70.2% in 2000. An even lower access figure to services has been reported by inde-pendent surveys, with only 63% of the population having access to any of the formal levels in 2000, with the rest relying on self-provision. In addition, official data conceal poor service quality in terms of service continuity and bacteriological content of potable water, such that even where there is access to piped water, these services often fail to meet the standards set by the government.
Matters are even worse in sanitation and solid waste where high official access data obscure the fact that effluents from ubiquitous septic tanks commonly drain into uncovered drainage systems, leaving the majority of the population, especially in urban areas, exposed daily to raw sewage. As a result of inadequate services, contaminated drinking water and waterborne diseases remain a prevalent public health concern, accounting for more than 500,000 morbidity and 4,200 mortality cases a year, and with avoidable health costs alone estimated at P3.3 billion annually.
High levels of congestion, the poor condition of large parts of the road network, and inadequate connectivity have reduced the efficiency of the road network in promoting growth. The cost of congestion in Metro Manila alone was estimated at around P100 billion a year in 1996 prices, or 4.6% of GDP. Less than 50% of national roads can be considered to be of good quality. The poor quality of roads has resulted in high vehicle operating costs, with intercity freight rates more than 50% higher than in Thailand or Vietnam.
Telecommunications is one sector where much progress has been made. Teledensity is growing (currently at 19 telephone mainlines per 100 population). However, one important target—extending distribution to 100% of municipalities (originally by 1997)—has yet to be achieved.
WorldBankInfra.indb 18 12/6/2005 8:40:11 AM

Executive Summary Meeting Infrastructure Challenges xix
Key issues
Low current spending on infrastructure The World Bank estimates that middle-income countries in East Asia will, on average, need to spend over 5% of GDP on infrastructure to meet their needs over the next 10 years. While the situation will vary by country, the Philippines’ most recent infrastructure expenditures (2.8% of GDP in 2002) were well below this 5% benchmark, and were also low compared with other countries (figure 1). In addition, this low level of resources has often been spent less than efficiently, and is insufficient to maintain the existing stock of assets and expand networks.
Inefficient use of existing resourcesIn power, overinvestment in generation, insufficient expansion of transmission, and lack of investment in distribution have caused excess generation capacity in Luzon but sporadic shortages in the Visayas and Mindanao. In water, nonrevenue water remains high for all service providers, with systems run by local government units (LGUs) faring the worst on efficiency criteria. The efficiency of the road program is also affected, by overstaffing; high procurement costs coupled with low quality; and fragmentation over a multitude of small projects.
Such underperformance in infrastructure stems from the following factors: a poor business envi-ronment; unsatisfactory performance in long-term infrastructure planning and coordination and in resource mobilization; and, largely as a consequence of these two elements, a decrease in private sector involvement. Moreover, each of these constraints is further exacerbated by the critical fiscal situation. The following paragraphs discuss the underlying causes of these factors.
Poor business environmentWhile the Philippines’ business environment for infrastructure comprises important strengths, such as an overall supportive framework for private sector participation, it is also seriously undermined by a number of major impediments, particularly the four Cs—inadequate cost recovery, corruption, insufficient competition, and low credibility of institutions.
Cost recovery provides the financial foundation for sector development but it remains an elusive goal except in telecommunications. In power, significant financial loss was incurred in 2003–2004 due in large part to tariff adjustment delays. Recent progress on tariffs, though still not achieving full cost recovery,
will enable recovery of operating costs. In water and sanitation, tariffs barely cover operation and main-tenance costs in most systems, let alone significant capital costs for service expansion. In roads, tax revenues earmarked from the fuel levy are far from meeting the requirements for road maintenance expenditures. In ports, the setting of low tariffs by the Philippine Ports Authority (PPA) discourages private entrants, and among those that enter, the quality of services is low. In the background is the country’s critical fiscal situation, which has led to the need to cut overall spending and significantly increased the cost of capital. This has made cost recovery both more important and more difficult. There is also significant room to improve the targeting of government subsidies toward cost recovery, which are present in almost all infrastructure sectors.
Corruption perceptions for the Philippines are high (figure 2). Corruption has emerged as a top bottleneck to doing business in the 2004 World Bank investment climate assessment. Infra-structure agencies (the Department of Public Works and Highways in particular) rank among the worst in the public’s perception of corruption, as reported by independent perception surveys. An own-government estimate of “potential leakage in combined public-private transactions, which included purchases for BOT projects” for 2001 was P74 billion. The government has been undertaking numerous measures, such as procurement reform, “lifestyle checks,” strengthened supervision, and
Figure 1Infrastructure investment as a share of GDP, selected countries
Perc
ent
0
2
4
6
8
10
Private
Public
China
Kazakhstan
Cambodia
Russia
Albania
Indonesia
Philippines
Note: No breakdown for China, figures are 1991–2000 average. Philippines and Indonesia are 2002 figures, Albania and Russia 2000, and Cambodia 2001.
Sources: World Bank Private Participation in Infrastructure Database; World Bank Public Expenditure Reports; China Statistical Yearbook (various years).
WorldBankInfra.indb 19 12/6/2005 8:40:12 AM

xx Philippines: Meeting Infrastructure Challenges
outside civic group monitoring. These efforts need to be sustained and scaled up quickly in order to reverse the overall negative perceptions.
The full benefits of competition are yet to be realized in most infrastructure sectors. In the power sector, the government has launched an ambitious reform program that will—if imple-mented successfully—lead to a truly competitive power market. As a result, there are already signs of renewed interest from private operators. In roads, the lack of a strong governance framework results in suboptimal procurement practices and reduces the quality of road construction, which in turn reduces efficiency and adds significantly to the cost of road provision.
In ports, PPA regulates entry of the private sector, which is likely to compete with PPA’s own ports, and sets the port dues that private ports charge for handling non-own cargo. By setting charges at low rates (among the lowest in the region), PPA can insulate itself from competition. In shipping, despite deregulation, the industry remains highly concen-trated with only five shipping lines accounting for 90% of the passenger and cargo markets and almost all of the primary and secondary shipping routes. In telecoms, the sector is dominated by regional duopolies, each with its own chosen domestic, and international, long-distance connections. An inadequate regulatory framework prevents resale by value-added service providers, further discouraging competition and innovation.
Among small-scale independent providers (SSIPs), direct competition is prevalent, particularly in the water and transport sectors; they are filling a critical and growing gap created by the failure of formal
service institutions. SSIPs, however, continue to operate in an unfavorable business climate, often having to resort to bribing officials. Lack of stability due to unpredictable political interference, limited access to credit, and insufficient information about future planning, further discourage investment.
The low credibility of regulatory and judicial institutions is another major element contributing to the poor business environment. Regulatory credibility is undermined in some sectors because of lack of insulation for the regulatory authorities from short-term political pressures, and in other sectors because of conflicts of interest arising from inadequate separation between policy, regulatory, and operational functions. Effective regulatory deci-sionmaking is further constrained, in all sectors, by limited regulatory capacity and experience, and, in transport and telecoms, by insufficient coordi-nation among regulatory agencies. The lack of clarity in the regulatory framework, particularly in the regulatory–judicial interface, has resulted in repeated interventions by the Supreme Court on tariff setting and contractual issues in the power, solid waste, and airport sectors.
As noted above, the high debt servicing burden in the Philippines raises the direct cost of capital, and makes cost recovery less attainable. In addition, the very fragile fiscal situation—in 2002, the national government deficit stood at 5.2% of GDP, compared with 1.7% in Indonesia, 1.4% in Thailand, and 3.5% in Vietnam—continues to increase investors’ assessments of country risk and to weaken the prospects of the Philippines as an investment destination.
Unsatisfactory public sector performance Lack of long-term planning and coordination for infrastructure Major efforts by the government to provide infra-structure have often been a reactive response to crises rather than a proactive input into effective long-term infrastructure planning. Figure 3 shows the infrastructure “boom-bust” cycle over 1985–2002. Total infrastructure expenditures experienced sharp declines after each peak period with the highest peaks in 1990, 1993, and 1998 following the energy and water distribution crises. This boom-bust cycle reflects, to a large extent, the failure to devise and implement a long-term infrastructure plan. Clearly, a combination of insufficient central oversight; lapses in coordination among agency plans and projects; and failure to insulate infrastructure planning, prioriti-
Figure 2Corruption Perceptions Index for five East Asian countries, 1995–2004
Perc
ent
0
1
2
3
4
5
6
Indonesia
Vietnam
Philippines Thailand
Malaysia
20042003
20022001
20001999
19981997
19961995
Year
Note: Higher score means less corrupt.
Source: Transparency International (www.transparency.org).
WorldBankInfra.indb 20 12/6/2005 8:40:12 AM

Executive Summary Meeting Infrastructure Challenges xxi
zation, and implementation from political intrusion is hampering infrastructure development.
A key issue resulting from weak central oversight has been the proliferation of small projects and appropriations, further exacerbated by political inter-vention and decentralization, leading to a vicious downward circle. Rebuilding the credibility of the public sector central agencies is at the core of rees-tablishing a social compact between the government and its citizens where the government can efficiently utilize resources provided by the public to serve the common good.
The public sector remains a major provider in most infrastructure sectors. Most government owned and controlled corporations (GOCCs) in the power, water, and transport sectors have posted sustained deficits, constraining their ability to expand services or make them more efficient. National agencies, such as the Department of Public Works and Highways and the Telecoms Office, suffer from low produc-tivity as a result of overstaffing. Governance of public service providers is weak, as reflected in arbitrary appointment of the board and executives of public utilities and weak performance accountability for utility management. Regional infrastructure has suffered both because plans for the regions have few champions at the central level and because revenues do not match devolved responsibilities at the provincial level. This has resulted in underinvestment in regional infrastructure, such as solid and toxic waste disposal, transport systems, and wastewater and watershed management, creating a “missing middle” in infrastructure service.
LGUs too have yet to rise to the challenge of local
infrastructure provision, though there have been examples of strong performance since decentralization in 1991. Overall LGU expenditures as a share of GDP have doubled since decentralization, but LGUs’ infrastructure expenditure share has remained largely unchanged, despite the LGUs’ much-expanded mandate under the 1991 Local Government Code (LGC). Key reasons for this are (a) unclear LGC, which permits an ambiguous two-track delivery system under which both central agencies and LGUs can initiate devolved activities and which undermines incentives to mobilize own-source revenues; (b) the short termism inherent in the local political economy, for instance, the three-year political tenure of elected
local officials that creates poor incentives for long-term planning and budgeting; and (c) low capacity for infrastructure investment preparation and imple-mentation at the local level.
Lack of a healthy framework for suitable financing opportunities for infrastructure As figure 4 shows, at 2.8% of GDP in 2002, overall current spending on infrastructure is low, with the private sector and GOCC share in infrastructure investment showing a decreasing trend. Consequently, the government needs to mobilize resources for infra-structure development. The four main sources for
Figure 3Infrastructure expenditures as a share of GDP, 1985–2002
Perc
ent
0
2
4
6
8
10
Total publicTotal privateTotal infrastructure
20022001
20001999
19981997
19961995
19941993
19921991
19901989
19881987
19861985
Year
Note: Infrastructure expenditures reflect capital outlays only.
Sources: Department of Budget and Management; Department of Finance; Commission on Audit; Maynilad Water Services, Inc.; Manila Water Corporation, Inc.; Optel Ltd. and World Bank.
Figure 4Private and public expenditures on infrastructure as a share of GDP
Perc
ent
0
2
4
6
8
NG
200219971992Year
LGUGOCCsPrivate
GOCC = government owned and controlled corporation; NG = national government; LGU = local government unit.
Note: Infrastructure expenditures reflect capital outlays only.
Sources: Department of Budget and Management; Department of Finance; Commission on Audit; Maynilad Water Services, Inc.; Manila Water Corporation, Inc.; Optel Ltd.; and World Bank.
WorldBankInfra.indb 21 12/6/2005 8:40:12 AM
xxii Philippines: Meeting Infrastructure Challenges
raising finance are: reinvesting user charges—for both public and private utilities; government own-revenue financing—at the national, provincial, and local levels; raising funds in the financial markets—domestic and international, debt and equity; and external official development assistance (ODA)—grants and concessional loans.
User charges. Typically, user charges are the main source of much infrastructure financing. In mature, private utilities elsewhere, internally generated funds can account for up to 70% of funds for investment. However, user charges in the Philippines are below cost recovery for most sectors with the exception of telecoms. As emphasized in the section “Poor business environment” (above), increasing user charges to cost-recovery levels remains a key factor in generating much-needed infrastructure financing.
Government own-revenue financing. The weak fiscal situation is constraining the government from channeling much-needed public funds into infrastructure. With a 14.6% revenue effort (i.e. the share of government revenue in GDP) in 2003, the Philippines ranks the lowest among its Southeast Asian counterparts. Low net revenue efforts stem from declining tax revenue collections (figure 5). The resulting budget crunch has a disproportional impact on infrastructure, as capital spending was cut more severely than other expenditures. Generating additional public resources from improving tax revenues and ensuring their proper usage can go a long way to increasing spending on infrastructure.
Raising funds in financial markets. The country’s financial markets are largely in private hands and commercial considerations dominate lending decisions, directing funding to those sectors or activities where returns are attractive on a risk-adjusted basis. For many of the reasons cited in the sector-specific chapters—such as price controls, regulatory uncertainty, insufficient commercial demand, and political and social unwillingness to accept free and unfettered pricing flexibility—the risk-return trade-off does not favor infrastructure investments. Moreover, the nonbank financial sector is small, parts of it are underperforming and, at least in the short to medium term, it cannot grow rapidly enough to support a high level of infrastructure financing.
Overall, in contrast to its East Asian neighbors, the savings rate in the Philippines is low, limiting the level of domestic finance available and leading to relatively high reliance on foreign savings through private investments and ODA.
Official development assistance. ODA plays an
important part in infrastructure financing. In 2003, annual ODA disbursements for infrastructure projects implemented by national government agencies constituted 37% of national government capital expenditure on infrastructure. Lack of budget space has seriously squeezed ODA utilization in recent years. There is, however, significant room to achieve more leverage and synergy of ODA with private sector investment in infrastructure.
Decrease in private sector involvementThe private sector has been a pillar of the Phil-ippines’ infrastructure strategy since the early 1990s. However, from a peak of 6% of GDP in 1998, private infrastructure commitments declined to 1% in 2002. While this coincided with a global decline in private investment in infrastructure, the decrease is primarily attributed to the poor business environment and the inability of the public sector to provide a suitable enabling framework that allows for easy private entry and exit, or the right incentives for operation. In addition, a vital element of the enabling framework—the landmark Build-Operate-Transfer (BOT) Law of 1990—remains surrounded by controversies related to vagueness over unsolicited bids, where the scope for corruption becomes considerable. Indeed, most of the controversial infrastructure projects in the Philippines started as unsolicited proposals. Other important issues include the definition of government guarantees, the role of implementing agencies in contract revision, and slow progress in overall sector reforms. An important lesson is that private sector participation does not substitute for public sector reforms. In fact, sustaining private sector investments requires an active and well-performing public sector that provides the right incentives to maximize the benefits of private sector participation.
Figure 5National government tax revenues as a share of GDP, 1985–2003
Perc
ent
0
5
10
15
20
2003200119991997199519931991198919871985Year
Source: Bureau of Treasury.
WorldBankInfra.indb 22 12/6/2005 8:40:13 AM

Executive Summary Meeting Infrastructure Challenges xxiii
The way forward
Tackling the above issues—the poor business envi-ronment, unsatisfactory public sector performance, and the decrease in private sector involvement—is undeniably challenging. However, much of the framework for action is already in place. The Phil-ippines has the benefit of having existing institutions that can be utilized to address these issues, as well as technical expertise at these institutions. Major reform measures in the power, water, transport, and telecoms sectors have already been initiated. Therefore, the usually arduous process of searching for solutions can be cut short—the key lies in deter-mination and consistency in implementation. Though yielding mixed results, the private sector-led infra-structure development strategy has been one of the most progressive in the region, and has been a pillar of infrastructure investment. Moreover, public perceptions of private sector participation in basic infrastructure services are generally positive: more than half of 300 respondents to a survey seemed to think that it would benefit the country. Finally, private sector investors are familiar with and interested in the sector, provided that the conditions are right. For example, measures such as recent tariff hikes in the power sector, combined with a strong commitment toward maximizing competition and attracting the private sector, are beginning to bear fruit. This was seen in the government’s successful conclusion, in December 2004, of the first major privatization of a power plant (Masinloc), with privatization proceeds of $560 million considerably exceeding expectations (though the financing for this transaction still needed to be closed as of February 2005).
The Philippines is also experimenting with innovative ways, such as output-based aid, to improve efficiency of subsidy delivery in power, as well as in water and sanitation. The passage of the anticorruption Government Procurement Reform Act of 2002, the establishment of the Office of the Ombudsman under Republic Act 6770 (otherwise known as the Ombudsman Act of 1989), and involvement of civil society organizations as observers in bidding processes, are encouraging developments that are vital for increasing transparency and accountability, and for reducing costs and delays in the public procurement process for infrastructure projects. In addition, successful experience with community-driven development in effectively and transparently providing community infrastructure can be scaled up to introduce better accountability at the local
and national levels. The positive experience of some progressive LGUs in infrastructure development and governance improvements can be replicated. And while there are factors that impede its development, progress has been made in LGU access to loan and bond financing. For example, the Local Government Unit Guarantee Corporation was created in March 1998 to guarantee debt issues of LGUs when these issues are financed from private sources. It is the first privately managed local government guarantee corporation set up in a developing country of Asia.
PrioritiesIn order to optimally plan for, and provide, infra-structure in a decentralized, market-driven, and often politicized setting, the central challenge for the Philippines is to reestablish the credibility of public sector institutions and restore the “social compact” between the government and its citizens for effective service delivery. This can be achieved through consistent implementation of: (a) a rigorous fiscal reform program; (b) key sector reforms in infrastructure; (c) proactive planning and coordi-nation of investments instead of reacting to changing circumstances in a “boom-bust” manner; and (d) a few focused investments in the short term through public-private partnership to address key bottlenecks and achieve quick gains in service delivery. In the aggregate, reducing the inherent short termism in infrastructure policymaking and improving the poor business environment can be expected to increase the performance of both the public and private sectors. Resolving ambiguities in the BOT Law, and improving the selection and preparation of projects of interest to potential investors, can further renew private sector interest. The tasks are demanding but achievable: experience in other countries shows that, through clear direction and consistent implementation, a turnaround in public perception and actual results can be achieved over the short to medium term.
Cross-sectoral prioritiesThe two key immediate cross-sectoral priorities are as follows: to improve the business environment—in particular, to take steps toward implementing cost-covering tariffs (subsidies, where justified, could be used as part of the cost-recovery equation); and to implement a rigorous and credible fiscal reform program. Moving or continuing to move toward cost recovery, particularly in the power, water, and transport sectors, will have a direct and positive effect on the fiscal situation. Likewise, improving the
WorldBankInfra.indb 23 12/6/2005 8:40:13 AM

xxiv Philippines: Meeting Infrastructure Challenges
fiscal situation will increase the resources available for public and private infrastructure projects by freeing budgetary resources, reducing the cost of capital, and improving investors’ perceptions of country risk. Improving the business environment requires continuing and accelerating reforms in the key sectors, particularly in power, roads, and water supply and sanitation. The government can also start immediately to address key bottlenecks and tap private investment by proactively helping resolve issues surrounding some of the stalled private sector investment projects, and by improving the way in which pipeline projects are prepared and competi-tively tendered.
Over the short to medium term, the two key cross-sectoral priorities will be (a) to strengthen the policy planning and coordination environment, which is directly and indirectly affecting infra-structure provision at all levels (particularly at the regional level vis-à-vis the “missing middle”); and (b) to maximize the benefits of decentralization to improve the way in which infrastructure is delivered at the local level. Both of these priorities will require the government to address difficult but significant political-economy issues so as to reduce undue political intervention in planning, prioritization, coordination, and delivery.
Sector-specific prioritiesAs far as sector-specific priorities are concerned, the chapters covering power, water supply and sanitation, roads, and telecommunications (chapters 6–9) make specific recommendations. International comparisons of performance in these various sectors, estimates of the impact of some of the proposed reforms on consumer surplus, and an analysis of the govern-ment’s own priorities as laid out in the 2004–2010 MTPDP point to three key objectives that warrant urgent attention: (a) addressing the financial deficits of the power sector; (b) reversing the recent decline in access to water services; and (c) addressing congestion on roads in the main cities.
Cross-sectoral recommendationsThe following paragraphs summarize the main cross-sectoral recommendations put forward in the present report.
Implement a vigorous and credible fiscal reform program. A credible and sustained period of fiscal reforms—in particular, increasing tax revenues—will convince participants in both domestic and
•
international financial markets to step up invest-ments. Contingent liabilities from infrastructure programs should be carefully accounted for and managed: guarantees should be used judiciously, based on a clear rationale and appropriate risk allocation.
Foster cost recovery by aligning infrastructure tariffs with costs in an economically coherent manner, and in a way that minimizes the negative impact of price increases, specifically for the poor. The key measures consist of continued power tariff adjustments according to accepted rules, including adequate and timely approval of the universal charge for the Power Sector Assets and Liabilities Management Corporation (PSALM) to recover stranded costs; clarification and enforcement of cost-recovery regulations for the water and sanitation sector to enable service expansion; an increase in the fuel levy for road maintenance expenses; and adherence to agreed toll rate adjustments for toll road rehabilitation and expansion. Consumer surplus analysis of the required cost-recovery measures shows that the priority in tariff adjustments should be given to power, followed by water tariffs, and then the fuel levy increase. Subsidies can be used as part of the cost-recovery equation but only where valid for equity or efficiency reasons. Better targeting and management of subsidies can, in effect, increase public resources that could be used for cost-recovery purposes. Good examples in the country, such as the “lifeline” power tariff and ongoing experimentation with output-based aid, can be scaled up.
Improve governance and further step up anticor-ruption efforts by vigorously implementing the 2002 Government Procurement Reform Act and complementing it with financial management reforms. Other specific actions include strength-ening the monitoring and enforcement capabil-ities of the key anticorruption oversight agencies; insisting on consistent disclosure and verification of assets by public officials; accelerating the infor-mation-transparency aspects of procurement reform, including civil society monitoring and timely posting of bid invitation and award results; and initiating an aggressive effort on simplifi-cation of government transaction procedures, so as to rapidly reduce the number of steps involved and discretionary powers. Corporate governance
•
•
WorldBankInfra.indb 24 12/6/2005 8:40:13 AM

Executive Summary Meeting Infrastructure Challenges xxv
of public utilities should also be improved by appointing qualified and experienced corporate board members and executives; providing more operational autonomy to corporate management while establishing clear performance targets based on which the management may be rewarded or penalized; regular disclosure of utility perfor-mance; and involving the public in monitoring the service levels of public utilities.
Engage private investment in a competitive manner and resolve issues surrounding stalled private sector projects. The benefits of private sector participation can be greatly improved and the problems can be greatly reduced if projects that entail private sector participation in the Philippines are carried out on a transparent and competitive basis, instead of through unsolicited bids. The target should be that the majority of transactions be competitive, rather than the opposite. In the meantime, with the government’s proactive measures, private sector transactions that have been suspended or delayed for several years may move forward and translate into visible results quickly. A number of toll roads are in such status, all of which are critical for relieving the key bottlenecks and are largely financially viable. For the water sector, quick resolution of the financial rehabilitation of the troubled concessionaire, Maynilad Water Services, Inc., is critical for investments to be made for service expansion, sanitation improvement, and new bulk water sources.
Improve planning and preparation of private sector participation in infrastructure. The government can maximize the benefit of private investors’ interest and avoid the disadvantages of unso-licited bids by adequately preparing promising projects for competitive tendering. The rela-tively small amount of funding spent on such preparation work will enable wider interest by investors and allow the government to secure better terms, as a result of both wider compe-tition and reduced uncertainty for potential investors. As privatization of the Manila water concession has demonstrated, such expense can indeed be recovered quickly, at the financial closure of the transactions. Quick preparation and tendering of the most critical infrastructure projects in this way can result in visible improve-ments in a relatively short time. To maximize the benefits of private sector participation, the
•
•
government can also explore the possibility of establishing a dedicated infrastructure fund, and means to better leverage ODA funds with private investments.
Strengthen and reorient central agencies, such as the National Economic and Development Authority, Department of Finance, Department of Budget and Management, and interdepart-mental committees, to improve planning, priori-tization, and monitoring of national government resources. The focus of oversight responsibilities can shift from a detailed project-level approval process to a broader and more forward-looking role for reform championship, strategy formu-lation, and policymaking. The oversight agencies should consider taking a more proactive role in initiating, promoting, and monitoring systemic reforms for the infrastructure sector, and should address important policy issues that can guide the decisionmaking process for projects and transactions cutting across sectors. Ensuring planning and its implementation in a decen-tralized and often politicized environment is a very challenging task. Effective instruments to implement plans, such as the use of incentive-based intergovernmental fiscal transfers and targeted subsidies, and wide reliance on perfor-mance benchmarking, should be carefully studied and consistently implemented. It is also important to ensure extensive stakeholder partic-ipation during the strategy development and planning process to secure wide public support of the outputs.
Provide incentives and technical assistance to LGUs to raise more revenues and improve perfor-mance. This will entail benchmarking LGU financial and institutional performance, and introducing performance-based criteria to the national government’s fiscal transfer programs to LGUs to incentivize revenue mobilization and performance enhancements. Technical assistance to LGUs, in revenue mobilization and infrastructure investment planning and preparation, is also important. The national government should also strengthen ongoing efforts in advancing local interjurisdictional cooperation by providing more authority to the regional development councils and giving higher priority to the province level, with regard to intergovernmental fiscal transfers.
•
•
WorldBankInfra.indb 25 12/6/2005 8:40:13 AM
xxvi Philippines: Meeting Infrastructure Challenges
Sector-specific recommendationsThe priority actions for sector-specific reform and development include the following.
Addressing the financial deficit and implementing reforms in the power sector
Achieving and sustaining the financial viability of NPC/PSALM is a major priority. This would entail increasing cost recovery in charges and ensuring that the privatization program is care-fully managed to achieve the expected sales values and the financial turnaround. It is important to ensure successful implemen-tation of market restructuring initiated under the Electric Power Industry Reform Act, including the full operationalization of the wholesale elec-tricity spot market (WESM). The prompt reso-lution of the questions related to price, conditions, and coverage of the transitional supply contracts and the bilateral contracts that follow the start of WESM operations will be crucial.The Energy Regulatory Commission needs to be strengthened to be able to undertake the task of price regulation as well as the regulation of distribution companies. It should be authorized to retain part of its revenues for its operations to be able to attract staff with the necessary skills and experience.
Expanding coverage and quality of water supply and sanitation services
It is vital to raise the overall tariff level to allow for system expansion and improved service quality. An important first step is to issue clear guidelines, in the form of an executive order, on charging cost-recovery water tariffs, and to articulate clear policies on sanitation service tariffs.To overcome current sector fragmentation, key steps include: operationalizing and strengthening the Inter-Agency Oversight Committee for water sector reform; implementing Executive Order 279 on Local Water Utilities Administration reform and water utility financing; and enhancing the capacity of the National Water Resources Board in economic regulation.A nationwide program for public utility reform and performance enhancement should be carried out. Requiring formal corporatization of all public utilities, establishing appropriate governance structure and corporate accounting systems, and benchmarking all public utilities will help instill management discipline. Private
•
•
•
•
•
•
sector participation should be encouraged, and should be conducted through well-prepared and structured competitive tendering processes.
Maintaining and expanding the road networkGovernance and accountability of spending at the Department of Public Works and Highways and the Special Road Fund should be improved by establishing accountability for results of road spending at the district and regional levels. Staffing levels should be reduced and performance-based outsourcing increased to improve efficiency.Greater reliance on user charges is needed for the upkeep and development of the road network. Key measures include expanding toll road coverage, charging appropriate toll fees, and increasing user charges through the fuel levy. Private sector interest in road improvements can be more effectively utilized if the government can proactively resolve issues of stalled toll road concessions, address right-of-way delays, and use open competition for project selection.
Expected outcome
Addressing the formidable infrastructure challenges is vital for reducing poverty and establishing a more rapid development pattern. Preliminary analysis indicates that in the Philippines there is indeed a strong relationship between infrastructure and GDP, and that growth of the infrastructure capital stock has a positive and long-term impact on level of GDP (appendix 1). Its underperformance is therefore a concern with real implications for the country’s growth and poverty reduction prospects. Moreover, preliminary estimates show that effective implemen-tation of the infrastructure reforms identified in the present study could increase consumer surplus by more than 3% of GDP per year over the next few years (appendix 5). These estimates are likely to be very conservative as they do not measure indirect or spillover benefits that could be realized, for example, by reducing the estimated 4.6% of GDP lost through congestion in Metro Manila alone or the 1.4% of GDP lost because of water pollution.
Progress in the various areas listed above would go a long way toward rebuilding citizens’ confidence in public institutions and establishing a virtuous circle of enhanced service delivery performance, greater revenue collection by the public sector, and increased investments.
•
•
•
WorldBankInfra.indb 26 12/6/2005 8:40:14 AM

Executive Summary Meeting Infrastructure Challenges xxvii
WorldBankInfra.indb 27 12/6/2005 8:40:14 AM

Joel Nito/Agence France-Presse
WorldBankInfra.indb 28 12/6/2005 8:40:16 AM

Chapter 1
Infrastructure in the Philippines
Introduction
Infrastructure is an economy’s backbone. Power supply, water and sanitation, transport networks, and telecommunications are all important
elements in a country’s quest for improving the quality of life of its citizens and increasing growth, hence contributing to poverty reduction. This is particularly relevant for the Philippines, where 40% of the population are still estimated to live on less than $2 a day and growth rates are among the lowest in the East Asia region. Even though the country has made impressive strides over the last three decades or so in improving infrastructure provision, it continues to lag behind its competitors.
The first part of the report (chapters 1–4) identifies and analyzes cross-sectoral issues and related trends that link the Philippines’ infrastructure provision to its broader development agenda. It begins by assessing the importance of infrastructure for the Philippines’ overall growth and development goals. Chapter 1 asks the question: What role does infrastructure play in improving living standards and in enhancing growth in the Philippines? It then proceeds to identify broad trends—rapid urbanization and population growth—that affect current and future infrastructure needs in the country, and asks the question: How can these needs be met? It concludes with identifying three cross-sectoral issues.
Chapters 2, 3, and 4 delve into the details of these three cross-sectoral issues—improving the overall business environment; enhancing infra-structure planning, coordination, and financing; and maximizing the benefits of private sector participation—that affect infrastructure provision in the Philippines. They also present specific recom-mendations for immediate and future government
actions. The overall road map and priority actions are presented in chapter 5, followed by chapters 6–9, which provide sector-specific assessments of and recommendations for power, water supply and sanitation, roads, and telecommunications. Due to lack of time for in-depth studies, the report does not cover some other important infrastructure sectors, such as ports, airports, railways, and solid waste.
Infrastructure and living standards
Providing safe, reliable, and cost-effective infra-structure services is an important contributor to raising living standards, thereby improving quality of life. This section benchmarks the Philippines’ performance in terms of access to basic infrastructure services against other countries, and describes the linkages between, on the one hand, infrastructure provision and, on the other, living standards; regional development; and education, health, and the environment.
Infrastructure access and service deliveryAs figure 1.1 shows, in terms of access to basic services, the Philippines performs quite well compared with other countries at similar devel-opment levels. A relatively high proportion of the population has access to basic services: about 80% to power, 83% to safe drinking water, and 86% to adequate sanitation.
However, it is possible that official access data may be overstated. For example, in the water sector, independent surveys find much lower access levels to formal services than official statistics, with only less than half the population and only about 20% of the rural population having access to piped water
WorldBankInfra.indb 1 12/6/2005 8:40:16 AM

� Philippines: Meeting Infrastructure Challenges
Figure 1.1Access to and quality of basic infrastructure services, selected countries
Sources: International Energy Agency; Philippines NationalElectrification Administration; estimates for Korea and Australia.
0
20
40
60
80
100
0 5,000 10,000 15,000 20,000 25,000 30,000
GDP per capita, PPP (US$)
Perc
ent o
f pop
ulat
ion
PHL
CHN
MNGSGP
AUSKORMYS
IND
IDNLKA
THA
VNM
Electrification rates, 2000 Quality of electric supply, 2003
1
2
3
4
5
6
7
0 5,000 10,000 15,000 20,000 25,000 30,000GDP per capita, PPP (US$)
Scal
e
AUSSGP
KORMYSTHA
CHNPHL
VNMIND
IDN
LKA
Source: World Economic Forum. Global Competitiveness Report 2003-2004.
Telephone mainlines, 2003
0
10
20
30
40
50
60
0 5,000 10,000 15,000 20,000 25,000 30,000 35,000GDP per capita, PPP (US$)
Source: International Telecommunication Union (www.itu.int).
AUS
SGP
KOR
MYS
THA
CHN
PHL
MNG
Mobile subscribers, 2003
0
20
40
60
80
100
0 5,000 10,000 15,000 20,000 25,000 30,000 35,000
GDP per capita, PPP (US$)
AUS
SGP
KOR
MYSTHA
CHNPHL
MNGIDN
LKA
Source: International Telecommunication Union (www.itu.int).
VNM
IND
Access to improved sanitation, 2002
0
20
40
60
80
100
0 5,000 10,000 15,000 20,000 25,000 30,000GDP per capita, PPP (US$)
Perc
ent o
f pop
ulat
ion
AUSSGPTHALKA
PHL
CHNIDN
INDVNM
MNG
Source: World Development Indicators 2004.
Access to improved water, 2002
0
20
40
60
80
100
0 5,000 10,000 15,000 20,000 25,000 30,000GDP per capita, PPP (US$)
Perc
ent o
f pop
ulat
ion
PHL THA
AUSSGPKOR
CHNIND
IDN
MNG VNM
LKA
Source: World Development Indicators 2004.
Total road network, 2000
0
5
10
15
20
25
0 5,000 10,000 15,000 20,000 25,000 30,000GDP per capita, PPP (US$)
km/1
,000
peo
ple
SGPMYS
MNG
IND PHLTHA
Note: As of 2002 except for Vietnam, Malaysia (1999), and Korea (2001).Source: World Development Indicators 2004.
VNM
Paved roads per land area, 2002
0
1
2
3
4
5
0 5,000 10,000 15,000 20,000 25,000 30,000GDP per capita, PPP (US$)
km/s
q km
SGP
KORMYSPHL THAIDN
Note: As of 2002 except for Malaysia (1999) and Korea (2001).Source: World Development Indicators 2004.
Per 1
00 p
eopl
e
Per 1
00 p
eopl
e
KOR
VNMLKA
INDIDN
AUS = Australia; CHN = China; GDP = gross domestic product; IDN = Indonesia; IND = India; KOR = Korea, Rep. of; LKA = Sri Lanka; MNG = Mongolia; MYS = Malaysia; PHL = Philippines; PPP = purchasing power parity; SGP = Singapore; THA = Thailand; VNM = Vietnam.
WorldBankInfra.indb 2 12/6/2005 8:40:17 AM

Chapter 1 Infrastructure in the Philippines �
supply and household connections.1 Recent household surveys conducted by the government indicate that access to sanitary toilet facilities increased by 0.3% to 86.1% in 2002 from 85.8% in 1999.2 Yet other estimates show a declining trend—to 74.2% in 2000 from 74.9% in 1991.3 For sewerage, it is estimated that only about 4% of the population nationwide had access as of 2000 and about 3% (mostly rural) have acceptable on-site treatment and disposal facilities.4 Moreover, access to sewerage networks outside Metro Manila is practically nonexistent with the sewerage systems in Baguio, Vigan, and Zamboanga cities serving less than 3% of their respective service area populations.5 In the road sector, the underreporting of road accidents varies according to the severity of the injury. A study by Sigua (2004) suggests that fatalities are 5.5 times the reported figures, and serious and minor injuries are respectively over 50 and 100 times the reported figures.6
Additionally, official access data mask the underlying poor quality of coverage, indicated by interrupted supply, significant water pressure fluctuations, and reported difficulties in abiding by drinking-water quality standards. Waterborne diseases are among the top 10 causes of mortality and morbidity in many towns with systems managed by local government units (LGUs).7 Matters are worse in sanitation and solid waste where high official access data obscure the fact that effluents from ubiquitous septic tanks commonly drain into uncovered drainage systems, leaving the majority of the population across the country exposed to raw sewage.
In the road sector, of the 11,000 kilometers of paved national roads for which reliable data on quality exist, less than 50% of the total length is considered to be in good condition.8 The poor road surface translates into higher vehicle operating costs per kilometer. On average these have doubled since 1999, while the consumer price index has increased by only 20%.9
Although the power sector has improved over the past few years, the reliability of the National Trans-mission Corporation system is well below interna-tional standards. Both the frequency and duration of interruptions are significantly greater than its counterparts in, for example, Thailand. Unserved energy increased by 50% (year on year) in 2003 in the Visayas, underlining the increasing difficulties of providing reliable supply in that region.
Not only is access to infrastructure services inadequate in the Philippines, but the poor bear the brunt of deficient infrastructure. As figure 1.2 shows,
service levels vary widely by income. Less than 10% of the poorest income quintile have access to adequate infrastructure services. This implies that the poor are receiving little or no service, and are therefore likely to be benefiting less than middle- and upper-income groups from national government programs and subsidies.
Intangible impact of infrastructureOver and above the direct effects on living standards, infrastructure can positively affect the quality of life through indirect means. This is readily apparent when one perceives that, at the household level, the demand for infrastructure is also a derived demand, i.e. a demand for inputs for other goods and outputs such as health, education, security, and convenience—all of which lead to increasing living standards. Box 1.1 demonstrates the negative impact that unsatisfactory infrastructure provision can have on the environment, and the enormous health and economic costs in the Philippines. Box 1.2 illustrates the complementarities that exist between roads, lighting, and educational opportunities in rural Philippines. Both examples in this box underscore the derived-demand aspect of infrastructure on education.
The growth, poverty reduction, and infrastructure nexus
The discussion in the preceding section highlighted the importance of infrastructure for improving living standards. This section assesses the importance of growth for poverty reduction in the Philippines,
Figure 1.2Access to basic infrastructure, 1998
Perc
ent o
f pop
ulat
ion
0
20
40
60
80
100
Own flush toiletPiped drinking water
TelephoneElectricity
RichestFourthMiddle SecondPoorest Quintile
Source: Davidson Gwatkin, Shea Rustein, Kiersten Johnson, Rohini Pande, and Adam Wagstaff. 2000. “Socio-economic Differences in Health, Nutrition, and Population in the Philippines.” World Bank, Washington, D.C.
WorldBankInfra.indb 3 12/6/2005 8:40:17 AM

� Philippines: Meeting Infrastructure Challenges
Inadequate infrastructure, especially as a result of rapid
urbanization as in the case of the Philippines, adversely affects the quality of the environment, leading to deteriorating living conditions and an overall decline in productive capacity.
Approximately 31% of illnesses monitored in 1996–2000 can be attributed to waterborne sources. Municipal and commercial fish yields are also reported to have declined by 30% and 5% due to sedimentation and silt pollution, respectively. Overall, economic
losses due to water pollution alone amount to $1.3 billion a year.
Only a handful of households are connected to a sewerage system, and sanitation-related health out-breaks and deaths are reported to be on the rise. Sewage discharged directly into the sea degrades the water quality of coastal waters, which in turn causes a decline in tourism—a strong revenue generator for the Philippines. For instance, in 1997, Boracay island experienced a 60% decline in occu-pancy from the previous year due to reported high levels of coliform.
Unpaved roads and pavements, widespread burning of garbage, and vehicular pollution from diesel-engine vehicles, such as jeepneys, trucks, and buses, have led to an alarming increase in particulate matter emissions in Metro Manila.
Annual health costs in the four major urban areas of Metro Manila, Cebu, Davao, and Baguio are now estimated to be over $400 million a year.
Sources: World Bank. 2002 and 2003. Philippines Environment Monitor 2002 and 2003. Manila.
Box 1.1 Environmental and health impacts of inadequate infrastructure
and the role that infrastructure has in the process.
As figures 1.3 and 1.4 show, the Phil-ippines is one of the slowest-growing economies in the region. From 1985 to 2003, per capita gross domestic product (GDP) increased only by about 0.7% per year, well below the 3.7% average of neigh-boring countries (Indonesia, Malaysia, Myanmar, Thailand, and Vietnam). Indeed, it was in the 1970s that the economy last experienced a sustained period of rapid growth. As tables 1.1, 1.2, and 1.3 show further, when compared with its competitors and neighbors, the country remains at the bottom of the list of overall competitiveness rankings and various business environment indicators.
The consistently poor rankings of the Philippines are a cause for concern for growth, trade, and competitiveness. But how important is growth for poverty reduction in the Philippines, and in that context, what role does infrastructure play?
To what extent does growth reduce poverty?While it is unlikely that there will ever be a definitive piece of work establishing whether economic growth is sufficient for poverty reduction, there is a qualified
Figure 1.3GDP growth rate, 1970–2003
Perc
ent
-8-6-4-202468
10
200320001997199419911988198519821979197619731970Year
Source: National Statistical Coordination Board.
Figure 1.4GDP per capita growth, selected countries, 1985–2003
Perc
ent
-20
-15
-10
-5
0
5
10
15
MyanmarVietnamThailand
PhilippinesMalaysiaIndonesia
2003200119991997199519931991198919871985Year
Source: World Development Indicators 2004.
WorldBankInfra.indb 4 12/6/2005 8:40:18 AM
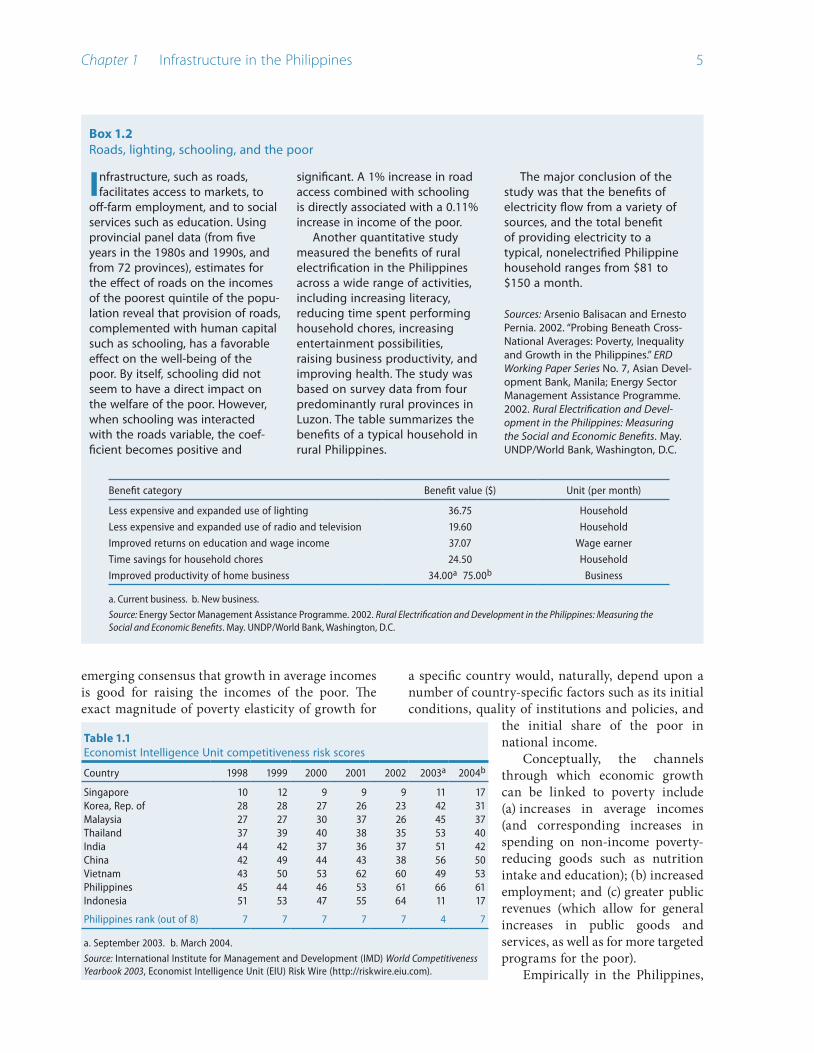
Chapter 1 Infrastructure in the Philippines �
Table 1.1Economist Intelligence Unit competitiveness risk scores
Country 1998 1999 2000 2001 2002 2003a 2004b
Singapore 10 12 9 9 9 11 17Korea, Rep. of 28 28 27 26 23 42 31Malaysia 27 27 30 37 26 45 37Thailand 37 39 40 38 35 53 40India 44 42 37 36 37 51 42China 42 49 44 43 38 56 50Vietnam 43 50 53 62 60 49 53Philippines 45 44 46 53 61 66 61Indonesia 51 53 47 55 64 11 17
Philippines rank (out of 8) 7 7 7 7 7 4 7
a. September 2003. b. March 2004.
Source: International Institute for Management and Development (IMD) World Competitiveness Yearbook 2003, Economist Intelligence Unit (EIU) Risk Wire (http://riskwire.eiu.com).
Box 1.2Roads, lighting, schooling, and the poor
Infrastructure, such as roads, facilitates access to markets, to
off-farm employment, and to social services such as education. Using provincial panel data (from five years in the 1980s and 1990s, and from 72 provinces), estimates for the effect of roads on the incomes of the poorest quintile of the popu-lation reveal that provision of roads, complemented with human capital such as schooling, has a favorable effect on the well-being of the poor. By itself, schooling did not seem to have a direct impact on the welfare of the poor. However, when schooling was interacted with the roads variable, the coef-ficient becomes positive and
significant. A 1% increase in road access combined with schooling is directly associated with a 0.11% increase in income of the poor.
Another quantitative study measured the benefits of rural electrification in the Philippines across a wide range of activities, including increasing literacy, reducing time spent performing household chores, increasing entertainment possibilities, raising business productivity, and improving health. The study was based on survey data from four predominantly rural provinces in Luzon. The table summarizes the benefits of a typical household in rural Philippines.
The major conclusion of the study was that the benefits of electricity flow from a variety of sources, and the total benefit of providing electricity to a typical, nonelectrified Philippine household ranges from $81 to $150 a month.
Sources: Arsenio Balisacan and Ernesto Pernia. 2002. “Probing Beneath Cross-National Averages: Poverty, Inequality and Growth in the Philippines.” ERD Working Paper Series No. 7, Asian Devel-opment Bank, Manila; Energy Sector Management Assistance Programme. 2002. Rural Electrification and Devel-opment in the Philippines: Measuring the Social and Economic Benefits. May. UNDP/World Bank, Washington, D.C.
Benefit category Benefit value ($) Unit (per month)
Less expensive and expanded use of lighting 36.75 Household
Less expensive and expanded use of radio and television 19.60 Household
Improved returns on education and wage income 37.07 Wage earner
Time savings for household chores 24.50 Household
Improved productivity of home business 34.00a 75.00b Business
a. Current business. b. New business.
Source: Energy Sector Management Assistance Programme. 2002. Rural Electrification and Development in the Philippines: Measuring the Social and Economic Benefits. May. UNDP/World Bank, Washington, D.C.
emerging consensus that growth in average incomes is good for raising the incomes of the poor. The exact magnitude of poverty elasticity of growth for
a specific country would, naturally, depend upon a number of country-specific factors such as its initial conditions, quality of institutions and policies, and
the initial share of the poor in national income.
Conceptually, the channels through which economic growth can be linked to poverty include (a) increases in average incomes (and corresponding increases in spending on non-income poverty-reducing goods such as nutrition intake and education); (b) increased employment; and (c) greater public revenues (which allow for general increases in public goods and services, as well as for more targeted programs for the poor).
Empirically in the Philippines,
WorldBankInfra.indb 5 12/6/2005 8:40:18 AM

� Philippines: Meeting Infrastructure Challenges
Table 1.2Business environment indicators
CountryHelpfulness of
local govt. in doing business in 2000a
Helpfulness of local govt. in
doing business in 1997a
Efficiency of local govt. in delivering
servicesb
Govt. takes into account voice of
businessc
Corruption as constraint to
operation and growth of businessd
Frequency of irregular additional
payments to get things donee
Singapore 2.0 2.2 1.8 3.2 1.3 5.8Cambodia 2.2 2.2 — 4.2 — 3.5Malaysia 2.2 2.4 2.9 4.2 1.9 4.6Thailand 2.3 2.5 3.3 3.8 3.5 2.8China 2.6 2.8 2.9 3.8 2.0 —Philippines 2.6 2.7 3.4 3.6 3.1 3.6Indonesia 3.0 3.2 3.8 4.5 2.6 2.8
Philippines rank 5 out of 7 (equal) 5 out of 7 5 out of 6 2 out of 7 5 out of 6 3 out of 6
— = not available.
a. 1 very helpful, 6 very unhelpful. b. 1 very efficient, 6 very inefficient. c. 1 always, 6 never. d. 1 no obstacle, 4 major obstacle. e. 1 always, 6 never.
Source: World Bank. “World Business Environment Survey 2000.” Washington, D.C.
Table 1.3Overall competitiveness rankings, 2003
Country
Growth Competitiveness Index
Ranking(out of 102 countries)
Business Competitiveness
Ranking(out of 102 countries)
Singapore 6 8Malaysia 29 26Thailand 32 31China 44 46India 56 37Philippines 66 64Indonesia 72 60
Source: World Economic Forum. Global Competitiveness Report 2003–2004 (http://weforum.org).
growth is indeed found to be the major proximate determinant of poverty incidence. The growth elasticity of poverty in 1985–2000 was just above 0.5, implying that while income growth does not translate into a one-for-one increase in the welfare of the poor, the poor still benefit to a degree from economic growth.10 In 1995–1997, the growth elasticity was high, as growth in services and construction facil-itated the transfer of labor to more advanced sectors. Between 1997 and 2000, poverty increased due to lower growth, especially in labor-absorbing activities such as construction.11
Despite the poverty-reduction impact of growth in the Philippines, per capita GDP growth has rarely been above 3% (with only 2% average per capita GDP growth rates over the last few years). Moreover, there are concerns about the future growth path given that the Philippines has one of the lowest investment-to-GDP ratios (at about 20%) among Southeast Asian
countries; it has the lowest capital stock per worker among market economies in Southeast Asia; and private consumption (relative to investment or government spending) constitutes a high 80% of current growth. Given the linkages between growth and poverty reduction in the Philippines, the importance of promoting growth cannot therefore be overstated. But to what extent does infrastructure contribute to growth?
How important is infrastructure for growth?Intuitively, good infrastructure improves a country’s growth prospects through strengthening its investment climate. Safe, reliable, and cost-effective infrastructure can have a significant effect on industrial productivity and costs, and thus on investment, employment, and export earnings—all growth-enhancing factors. Box 1.3 illustrates the importance of the role that logistics and transport infrastructure can play in a country’s development.
There is also a close correlation between GDP and total infrastructure spending in the Philippines. In 1985–2002, the numerical correlation stood at 85%. Figure 1.5 depicts the trends in growth rates, infra-structure spending, and the infrastructure capital stock as proxied by gross fixed capital formation in the economy.12
Correlating infrastructure expenditures with GDP, however, is only a proxy for the infrastructure-growth linkage since correlation does not neces-sarily imply causation. Appendix 1 presents the results from a series of preliminary analyses of the Philippine data that test whether infrastructure actually causes growth.
WorldBankInfra.indb 6 12/6/2005 8:40:19 AM

Chapter 1 Infrastructure in the Philippines �
Box 1.3Role of transport and logistics in trade
Empirical studies indicate that a 1% rise in the trade-to-GDP
ratio can increase income per person by at least 0.5%. Better access to coasts alone can raise incomes by 20%. The Philippines has a natural geographic advantage of port-cities, a key for export-ori-ented growth. However, inadequate roads, ports, and logistics are undermining the country’s growth prospects.
The cost of land access to ports accounts for a high proportion of the overall cost of getting products to market. Reducing these costs hinges to a large extent on improving logistics. Improved transport infrastructure and logistics can narrow the
wedge between the price paid by consumers and that received by producers, as well as reduce inventory-holding costs. A World Bank study in 2002 focusing on export of agricultural commodities from Mindanao found several major logistics bottlenecks:
Limited market information available to farmers and traders; Limited transport services in many parts of Bukidnon and other farmland areas;Inefficient interisland shipping; andCumbersome government regula-tions and public monopolies that increase the cost of interisland transport.
•
•
•
•
Mechanisms currently available for disseminating market infor-mation are constrained by the poor quality of telecommunications services in Mindanao. Transport services are often limited to carabao-drawn carts and jeepneys, and, moreover, cause damage to commodities in transit and during transfer to larger vehicles for delivery to market.
Finally, the monopoly power granted to the Philippine Ports Authority limits entry of new shipping lines to interisland services.
Source: John Arnold. 2002. “Philippines Logistics Study.” World Bank, Wash-ington, D.C.
A number of other surveys and studies for the Philippines have also consistently pointed out that infrastructure deficiency is among the top imped-iments to the business environment and investment climate. Findings from a recent investment climate assessment of 716 private firms in the Philippines, conducted by the World Bank in conjunction with the Asian Development Bank, indicate that infra-structure, in particular power, is a major element in the cost of doing business (figure 1.6)
The Philippines Development Policy Update13 recognizes the need for removing infrastructure bottlenecks in roads, interisland transport, water and sanitation, and power, in order to strengthen the overall environment for investment in the country. The report recognizes that the social impact of poor infrastructure contributes to persistent unemployment and deterio-ration in access to basic infrastructure services.
The above findings, including preliminary analysis of sector-specific data, attest to the close linkages between (a) infrastructure and growth, and (b) growth and poverty reduction. Another recent study14 provides an empirical assessment of infra-structure development on economic growth and income distribution for over 100 countries spanning the years 1960–2000. The two robust results of this study are that (a) infrastructure assets positively affect growth, and (b) income inequality declines with higher infrastructure quality and quantity. Under-performance of the Philippines’ infrastructure sectors is therefore a concern with real implications for the country’s growth and poverty reduction prospects.
Spatial effects of infrastructureLack of access to adequate infrastructure services is also correlated with uneven development between regions in the Philippines. Existing empirical evidence indicates that wide income disparities among regions can be attributed, in part, to regional differences in
Figure 1.5Growth and infrastructure trends
Perc
ent
-10-505
1015202530
GDP growth rateInfrastructure spending (% of GDP)Gross fixed capital formation (% of GDP)
20022001
20001999
19981997
19961995
19941993
19921991
19901989
19881987
19861985
Year
Note: Infrastructure spending reflects capital outlays only.
Sources of basic data: National Statistical Coordination Board; Department of Budget and Management; Department of Finance; Commission on Audit; Maynilad Water Services, Inc.; Manila Water Corporation, Inc.; Optel Ltd.; and World Bank.
WorldBankInfra.indb 7 12/6/2005 8:40:19 AM

� Philippines: Meeting Infrastructure Challenges
the level of infrastructure development.15 Appendix 2 summarizes the linkages between infrastructure and regional development. These linkages are most readily seen in the case of Mindanao. Though that region holds a comparative advantage in agricultural production, its development is severely hampered by limited access to efficient product markets and poor infrastructure. Box 1.4 describes the relationship between infrastructure and insecurity there.
Current and future infrastructure needs: What is driving them?
It is apparent from the preceding discussion that infrastructure has a critical role to play in the Phil-ippines’ development. Current infrastructure needs are already high and future requirements are growing. Two broad interrelated trends are determining these needs and requirements: a growing population and rapid urbanization. Put together, these trends imply a high current and projected future demand for infra-structure services in urban areas. Moreover, not only will infrastructure be required to meet the needs of growing numbers of people in urban areas, but its adequate provision will also be critical for posi-tioning urban areas as engines of economic growth, and hence poverty reduction. This section analyzes the population and urbanization trends, and assesses their broad impact on infrastructure provision in the Philippines.
Population and urbanizationAt 2.36% a year between 1995 and 2000, the Philippines had one of the highest population growth rates in the world, and the highest in East Asia. As in most other East Asian countries, rural population growth, at less than 1%, is expected to slow and peak in 2010, with the remaining incremental growth occurring in urban areas.16 Indeed, the total and urban population average annual rate of change is expected to remain positive. Figure 1.7 shows the historical and projected average annual rate of change for the population—total, urban, and rural—between 1950 and 2030.
It is clear that the Philippines is experiencing an emerging transformation of rural settlements into cities, with the bulk of the population expected to reside in urban areas. More than half of the total population is already residing in urban areas and, as figure 1.8 shows, this share is expected to reach 75% by 2030. For the Philippines, this implies a rank of 17 out of the 28 countries that will account for 75% of the world urban population. As early as 2015, Metro Manila, with a current population of 10 million inhabitants and already classified as a megacity (defined as an urban area with 10 million inhabitants or more) is expected to rank 15 out of 21 megacities.
At current urban growth rates of about 3%, over 1 million people are expected to be added to
Figure 1.6Share of firms evaluating constraints as major or very severe in the Philippines
TelecommunicationsWorkers' skills and education
Licensing and permitsAccess to financing
Access to landTransport
Customs and trade regulationsAnticompetitive practices
Labor regulations
Cost of financingTax administration
Crime, theft, and disorderRegulatory policy uncertainty
Tax ratesElectricity
CorruptionMacroeconomic instability
0 5 10 15 20 25 30 35 40
Percent
Source: Asian Development Bank. 2003. “Improving the Investment Climate in the Philippines.” Manila.
Figure 1.7Average annual rate of change of total, urban, and rural population, 1950–2030
Perc
ent
-1.0
0.0
1.0
2.0
3.0
4.0
5.0
6.0
RuralUrban Total population
2025–20302010–20151995–20001980–19851965–19701950–1955
Period
Source: UN Population Division. World Urbanization Prospects: 2002 Revision (http://www.un.org/esa/population/unpop.htm).
WorldBankInfra.indb 8 12/6/2005 8:40:19 AM

Chapter 1 Infrastructure in the Philippines �
Box 1.4Infrastructure and the Mindanao conflict
Centuries of conflict in Mindanao are heavily rooted in its dis-
tinct social, political, and religious structures. Starting as an ethnic struggle over land ownership in the early years of the Spanish rule, the Mindanao conflict later evolved into a struggle to be an inde-pendent entity that stemmed from the grievances and aspirations of ethnic groups unified by an Islamic ideology. The conflict escalated during the martial law years (1972–1981) when an armed solution was imposed on the “Moro problem.”
As a consequence of persistent armed struggles, instability stifled economic activity and discouraged investment.
Destruction of vital infrastructure and disruption of delivery of basic services exacted its toll on the welfare of the people of Mindanao. Since 1970, indicators of access to piped water and electricity have attested to the poor quality of life in Mindanao’s provinces. More recent data on the Autonomous Region in Muslim Mindanao (ARMM), which was created in 1990, show that
ARMM access rates to basic infra-structure are the lowest among the provinces in the table. In fact, the access ranking for ARMM has con-tinued to deteriorate over the years: whereas in 1970 ARMM’s provinces ranked somewhere in the middle, by 1990 and 2000 they ranked at the very bottom.
Sources: Amina Rasul. 2003. “Poverty and Armed Conflict in Mindanao” in Amina Rasul, ed. The Road to Peace and Reconciliation: Muslim Perspective on the Mindanao Conflict. Makati: Asian Institute of Management; and World Bank staff.
Share of households with access to piped water and electricity, selected Mindanao provinces, 1970–2000
Access to piped water Access to electricity
1970a 1990a 2000b 1970a 1990a 2000b
% of HHRank in 67 pro-vinces
% of HHRank in 76 pro-vinces
% of HHRank in 79 pro-vinces
% of HHRank in 67 pro-vinces
% of HHRank in 76 pro-vinces
% of HHRank in 79 pro-vinces
Autonomous Region in Muslim Mindanao
Lanao del Sur 19.6 28 11.0 54 22.1 77 3.7 58 34.9 44 39.5 72Sulu 15.5 37 11.0 53 30.4 76 6.7 38 9.4 74 19.9 78Maguindanao 12.0 52 40.8 74 25.8 60 46.2 68Tawi-Tawi 4.1 76 18.1 78 10.0 73 35.8 74
Neighboring provincesBasilan 10.7 55 47.5 72 19.4 68 41.0 70Lanao del Norte 19.7 27 19.3 22 82.9 35 14.4 20 48.0 26 72.1 27Zamboanga del Sur 19.0 31 17.4 28 66.7 62 10.0 28 40.2 38 54.5 56Zamboanga del Norte 7.9 49 6.1 71 55.5 67 3.9 55 22.8 65 52.6 60North Cotabato 6.0 54 8.6 59 77.5 45 6.4 41 26.4 57 58.5 50South Cotabato 3.0 60 8.3 62 85.0 30 9.3 29 45.4 29 73.9 25Sultan Kudarat 5.2 74 84.1 34 34.6 46 61.6 45Saranggani 66.9 61
HH = households.
Sources: a. Amina Rasul. 2003. “Poverty and Armed Conflict in Mindanao” in Amina Rasul, ed. The Road to Peace and Reconciliation: Muslim Perspective on the Mindanao Conflict. Makati: Asian Institute of Management. b. 2000 data from the National Statistics Office.
urban areas annually. As noted in the 2003 World Bank study carried out for the National Economic and Development Authority (NEDA) on national urban development,17 taking the average 1960–1995 urban growth rate of 5.1% (one of the highest in the world), an additional 16 million people would have to be accommodated in urban areas between 2000 and 2010. In simple terms, this is akin to more than adding, every year, the current population of Metro Cebu (1.4 million), the second largest metropolitan area of the country, into the urban system.
Given the capital-intensive nature of urban infra-structure, investment requirements, though not as sensitive to population levels, are highly sensitive to population growth rates in urban areas. In the Phil-ippines, unusually high urban growth rates are already putting a severe strain on infrastructure provision in urban areas, and pose a significant competitive threat vis-à-vis competitor urban systems in neighboring countries. Hyper-urbanization can therefore only be expected to raise the demand for infrastructure investments to unprecedented levels.
WorldBankInfra.indb 9 12/6/2005 8:40:19 AM

10 Philippines: Meeting Infrastructure Challenges
In addition to creating an absolute demand for infrastructure, because of the difference in economic activities between urban and rural areas, rapid urbanization in the Philippines is also changing the nature of the infrastructure that will be needed in order to meet the demand. The transformation of rural settlements into cities implies denser settlements and shifting economic activities that have greater infrastructure requirements. For example, sanitation needs to be better provided; power and water supplies need to be more reliable for industry and services uses; transport modes need to offer more variety and choice; and the environmental implications of infra-structure, such as solid waste disposal and storm water drainage, require greater attention.
Even though most of the future growth will be in urban areas, as box 1.5 illustrates, the Philippines cannot ignore its rural infrastructure needs.
Introducing the key cross-sectoral issues
Is the Philippines heading toward an infrastructure crisis? Various rankings underscore the importance of infrastructure to the economy’s investment climate, and sector-specific data attest to the dete-
Box 1.5To what extent do rural areas drive infrastructure needs?
While the primary driver of future infrastructure invest-
ments is clearly high urban popu-lation growth, it will still take about 50 years before the rural to urban transition is completed. The Philip-pines cannot therefore afford to ignore infrastructure needs in rural areas, especially given that just over one-third of the total popu-lation and almost one-half of the rural population live below the poverty line.
Because rural to urban migration is essentially a positive behavior—people responding rationally to information and economic signals, such as higher wages and oppor-
tunities in urban areas—explicitly attempting to slow it is not good policy. However, infrastructure investments in rural areas are still required for two reasons. First, it is important that the Philip-pines be able to create an envi-ronment in which all of its citizens can enjoy basic living standards. Second, investing in infrastructure in rural areas would have overall positive returns to both urban and rural dwellers through better rural–urban ties. For instance, the increasing use of mobile phones in rural areas, in conjunction with the development of business net-works between rural and urban
areas (enhanced through better telecommunications and migration) is likely to result in higher returns to physical infrastructure such as roads, wholesale markets, and truck terminals. Urban dwellers can benefit from better access to rurally produced commodities and labor, and rural dwellers can benefit from the technology, market knowledge, and capital in urban areas.
Source: Douglas Webster, Arthur Corpuz, and Christopher Pablo. 2003. “Towards a National Urban Development Framework for the Philippines: Strategic Considerations.” Report prepared for the National Economic and Development Authority. September.
riorating state of infrastructure and its impact on the quality of life. Demand is growing but resources are limited. Overall public finances are very weak. As figure 1.9 shows, the national government deficit—total revenues less expenditures18—has been worsening almost consistently since 1997; in 2002, it stood at a high 5.2% of GDP. This is relatively high compared with peer countries such as Indonesia (1.7%), Thailand (1.4%), and Vietnam (3.5%). Only two countries in the region have posted higher deficits: Malaysia (5.6%) and Cambodia (6.5%). If the government could possibly strengthen its financial situation by increasing revenues and reducing expen-
Figure 1.8Urban and rural population, 1950–2030
Perc
ent
010,00020,00030,00040,00050,00060,00070,00080,00090,000
100, 000
0
20
40
60
80
Share of population residing in urban areasShare of urban population residing in Metro Manila
Rural (left axis)Urban (left axis)
20302025
20202015
20102005
20001995
19901985
19801975
19701965
19601955
1950
Thou
sand
s
Year
Source: UN Population Division. World Urbanization Prospects: 2002 Revision (http://www.un.org/esa/population/unpop.htm).
WorldBankInfra.indb 10 12/6/2005 8:40:20 AM

Chapter 1 Infrastructure in the Philippines 11
ditures, there might be resources available to meet priority infrastructure needs. However, both revenue mobilization and expenditure management remain weak. And while the weak fiscal position of the Philippines implies fewer aggregate public resources available for infrastructure, the causation also runs the other way: huge losses at infrastructure-related government owned and controlled corporations (GOCCs) are contributing significantly to the fiscal crisis (box 1.6), with large unaccounted-for and mismanaged contingent liabilities further endan-gering the fiscal situation.
As figure 1.5 above shows, in recent years, infra-structure expenditures have been at near-historical lows; they are also low compared with other countries. The World Bank estimates that middle-income countries in East Asia will, on average, need to spend over 5% of GDP on infrastructure to meet their needs over the next 10 years.19 While the situation will vary by country, the Philippines’ most recent current infrastructure expenditures (2.8% of GDP in 2002) are well below the 5% benchmark and are low compared with other countries (figure 1.10).20 Recently, the government has announced that it intends increasing its annual public infrastructure spending to, at the minimum, P100 billion annually, i.e. to at least 5% of GDP.
While the purported increase in infrastructure spending is an encouraging sign, the government needs to ensure that expenditures are made judiciously. The record so far indicates that existing resources have not been utilized efficiently. For instance in power, overinvestment in generation, insufficient expansion of transmission, and lack of investment in distri-bution have caused excess generation capacity in the Luzon grid but sporadic shortages in the Visayas and Mindanao grids. In water, nonrevenue water remains high for all service providers, with LGU-run systems
faring the worst on efficiency criteria. In roads, funds have reportedly been used to finance labor-intensive employment-generation programs, which can cost as much as five times competitively procured contracts. At the local level, the use of discretionary congressional funds—also called “pork barrel” funds—allocated by congressmen and senators is a principal contributor to inefficiency. These funds—amounting to almost P18 billion in 2001 or 0.48% of GDP—are spent with little oversight, and often on small projects, resulting in fragmented and isolated projects and loss of scale economies.
What are the key common factors—i.e. cross-sectoral factors—that explain the wide-ranging underperformance of infrastructure sectors in the Philippines? Three broad cross-sectoral themes would seem to account for this underperformance: (a) an overall poor business environment for infra-structure; (b) insufficient infrastructure policy planning and coordination, and inability to mobilize adequate infrastructure financing; and (c) failure to maximize the benefits of private sector participation in infrastructure.
It should be recognized that the cross-sectoral diagnostics (as discussed in chapters 2, 3, and 4), as well as the resulting recommendations, while holding across all sectors, vary by sector. For example, it is much easier to attract the private sector to telecoms than to water. Likewise, some infrastructure sectors are more susceptible to corruption than others. Such variations are acknowledged, and are noted throughout the study. Chapters 6–9 provide sector- specific diagnosis.
Figure 1.9National government fiscal position as a share of GDP, 1985–2003
Perc
ent
-6-5-4-3-2-1012
2003200119991997199519931991198919871985Year
Source: Department of Finance.
Figure 1.10Infrastructure investment as a share of GDP, selected countries
Perc
ent
0
2
4
6
8
10
Private
Public
China
Kazakhstan
Cambodia
Russia
Albania
Indonesia
Philippines
Note: No breakdown for China, figures are 1991–2000 average. Philippines and Indonesia are 2002 figures, Albania and Russia 2000, and Cambodia 2001.
Sources: World Bank Private Participation in Infrastructure Database; World Bank Public Expenditure Reports; China Statistical Yearbook (various years).
WorldBankInfra.indb 11 12/6/2005 8:40:20 AM
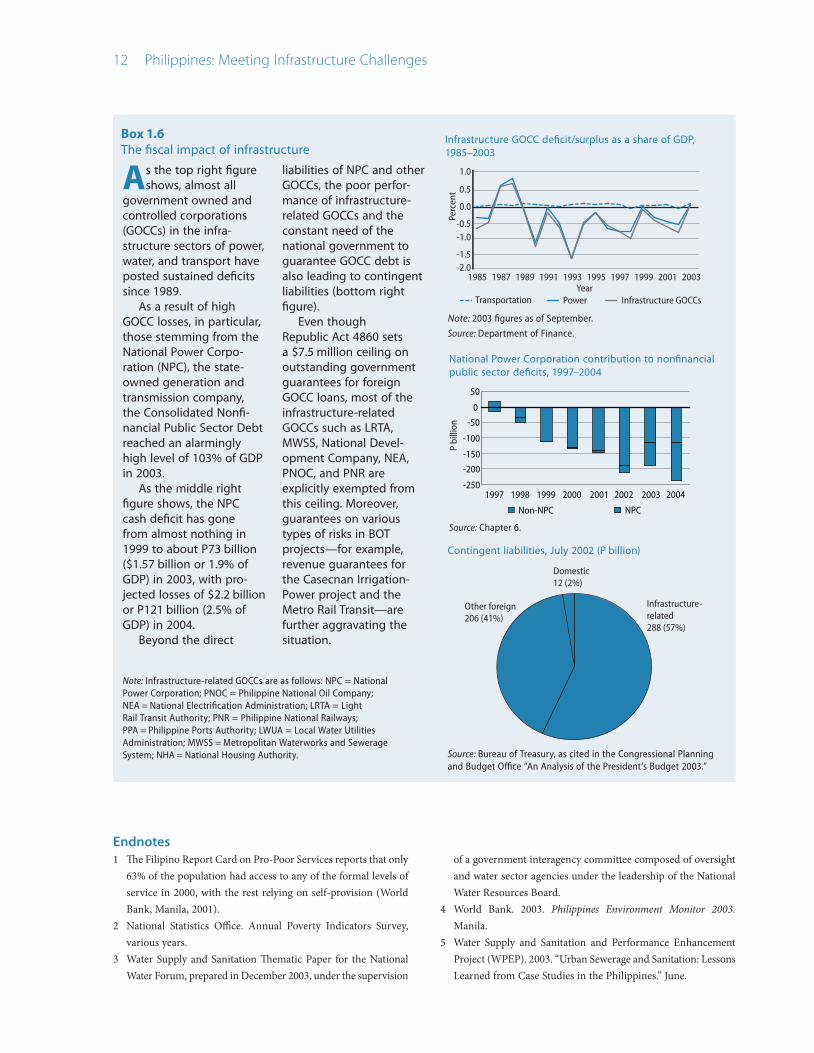
1� Philippines: Meeting Infrastructure Challenges
Box 1.6The fiscal impact of infrastructure
Endnotes1 The Filipino Report Card on Pro-Poor Services reports that only
63% of the population had access to any of the formal levels of service in 2000, with the rest relying on self-provision (World Bank, Manila, 2001).
2 National Statistics Office. Annual Poverty Indicators Survey, various years.
3 Water Supply and Sanitation Thematic Paper for the National Water Forum, prepared in December 2003, under the supervision
of a government interagency committee composed of oversight and water sector agencies under the leadership of the National Water Resources Board.
4 World Bank. 2003. Philippines Environment Monitor 2003. Manila.
5 Water Supply and Sanitation and Performance Enhancement Project (WPEP). 2003. “Urban Sewerage and Sanitation: Lessons Learned from Case Studies in the Philippines.” June.
Infrastructure GOCC deficit/surplus as a share of GDP, 1985–2003
Perc
ent
-2.0-1.5
-1.0-0.5
0.0
0.5
1.0
Infrastructure GOCCsPower
2003200119991997199519931991198919871985Year
Transportation
Note: 2003 figures as of September.
Source: Department of Finance.
National Power Corporation contribution to nonfinancial public sector deficits, 1997–2004
P bi
llion
-250
-200
-150
-100
-50
0
50
1998 1999 2000 2001 2002 2003 2004
Non-NPC NPC
1997
Source: Chapter 6.
Contingent liabilities, July 2002 (P billion)
Domestic12 (2%)
Other foreign206 (41%)
Infrastructure- related288 (57%)
Source: Bureau of Treasury, as cited in the Congressional Planning and Budget Office “An Analysis of the President’s Budget 2003.”
As the top right figure shows, almost all
government owned and controlled corporations (GOCCs) in the infra-structure sectors of power, water, and transport have posted sustained deficits since 1989.
As a result of high GOCC losses, in particular, those stemming from the National Power Corpo-ration (NPC), the state-owned generation and transmission company, the Consolidated Nonfi-nancial Public Sector Debt reached an alarmingly high level of 103% of GDP in 2003.
As the middle right figure shows, the NPC cash deficit has gone from almost nothing in 1999 to about P73 billion ($1.57 billion or 1.9% of GDP) in 2003, with pro-jected losses of $2.2 billion or P121 billion (2.5% of GDP) in 2004.
Beyond the direct
liabilities of NPC and other GOCCs, the poor perfor-mance of infrastructure-related GOCCs and the constant need of the national government to guarantee GOCC debt is also leading to contingent liabilities (bottom right figure).
Even though Republic Act 4860 sets a $7.5 million ceiling on outstanding government guarantees for foreign GOCC loans, most of the infrastructure-related GOCCs such as LRTA, MWSS, National Devel-opment Company, NEA, PNOC, and PNR are explicitly exempted from this ceiling. Moreover, guarantees on various types of risks in BOT projects—for example, revenue guarantees for the Casecnan Irrigation-Power project and the Metro Rail Transit—are further aggravating the situation.
Note: Infrastructure-related GOCCs are as follows: NPC = National Power Corporation; PNOC = Philippine National Oil Company; NEA = National Electrification Administration; LRTA = Light Rail Transit Authority; PNR = Philippine National Railways; PPA = Philippine Ports Authority; LWUA = Local Water Utilities Administration; MWSS = Metropolitan Waterworks and Sewerage System; NHA = National Housing Authority.
WorldBankInfra.indb 12 12/6/2005 8:40:20 AM

Chapter 1 Infrastructure in the Philippines 1�
6 Ricardo G. Sigua. “Scale, Characteristics and Costs of Road Accidents in the Philippines.” Presentation in the 12th Annual Transport Science Society of the Philippines Conference, July 23–24, 2004. University of the Philippines, Diliman.
7 Based on socioeconomic reports of the LGUs in more than 100 feasibility studies for towns prepared under the World Bank LGU-UWSP (Urban Water Supply Project).
8 As measured by the International Roughness Index (IRI) of 5 or less.
9 DPWH-Project Management Office Feasibility Study. 2003. DPWH, Manila.
10 Arsenio Balisacan. 2003. “Poverty and inequality.” In Arsenio Balisacan and Hal Hill. The Philippine Economy: Development, Policies and Challenges. New York: Oxford University Press.
11 World Bank. 2003. Philippine Development Policy Update. September. Manila.
12 Gross fixed capital formation includes land improvements (fences, ditches, drains, and so on); plant, machinery, and equip-ment purchases; and the construction of roads, railways, and the like, including schools, offices, hospitals, private residential dwellings, and commercial and industrial buildings (World Bank Data and Statistics technical notes, http://www.worldbank.org/data/working/def7.html).
13 World Bank. 2003. Philippine Development Policy Update. September. Manila
14 César Calderón and Luis Servén. 2004. “The Effects of Infra-structure Development on Growth and Income Distribution.” Policy Research Working Paper No. 3400. World Bank, Wash-ington, D.C.
15 See Mario B. Lamberte, Rosario G. Manasan, and Gilberto M. Llanto. 1993. Decentralization and Prospects for Regional Growth.
Makati: Philippine Institute for Development Studies; and L.Q. Basilio and D.M. Gundaya. 1997. “The Impact of Collective Public Infrastructure on Regional Income Disparities.” Under-graduate thesis, University of the Philippines. April.
16 It should be noted that a redefinition of what constitutes urban and rural is also a factor in the urban population growth rates.
17 Douglas Webster, Arthur Corpuz, and Christopher Pablo. 2003. “Towards a National Urban Development Framework for the Philippines: Strategic Considerations.” Report prepared for the National Economic and Development Authority. World Bank, Manila. September.
18 The financing deficit/surplus is calculated as internal cash genera-tion (or total receipts minus current expenditures) less capital expenditures.
19 The World Bank, in the recently launched East Asia and Pacific Regional Infrastructure Study being carried out in cooperation with the Japan Bank for International Cooperation and Asian Development Bank, estimates that infrastructure investment needs for middle-income countries in the East Asia region over 5 years are about 3.6% of GDP. However, this estimate does not incorporate (a) decisions to invest in infrastructure ahead of demand; (b) decisions to increase access for the poor in line with the Millennium Development Goals or other targets; and (c) ports, airports, bridges, secondary roads, urban transport, or gas grids. Accounting for these factors would put infrastructure investment needs closer to about 5% of GDP.
20 The Philippines’ own estimates of annual investment needs in power are about $1.9 billion over the next 10 years. Annual investment needs estimates in water and sanitation (currently averaging P3 billion–4 billion, and almost exclusively for the water sector) are about $0.7 billion.
WorldBankInfra.indb 13 12/6/2005 8:40:21 AM

Manila North Tollways Corporation
WorldBankInfra.indb 14 12/6/2005 8:40:39 AM

Chapter 2
The Business Environment for Infrastructure
While the Philippines’ business environment for infrastructure has important strengths, such as an overall supportive framework
for private sector participation, it is also seriously undermined by a number of major impediments. The “four Cs”—inadequate cost recovery, corruption, insufficient competition, and low credibility of regulatory and judicial institutions—are affecting both public and private sector performance.
Inadequate cost recovery
Most infrastructure sectors suffer from low cost recovery. The ability to recover costs and earn reasonable rates of return is critical for sustainable infrastructure investment and operation: cost recovery is important if the resources for new investments and maintenance are to be generated from within the sector. However, in the Philippines, cost recovery through efficient pricing has not been the norm. The main reason for poor cost recovery is political inter-vention, with tariffs based on social and political considerations rather than on commercial ones.
Water and sanitationThe core constraint for expanding sustainable investment in the water and sanitation sector—whether public or private—is the low level of cost recovery. This is undermining the development of the sector, and despite repeatedly stated policy objectives of cost recovery, actual progress toward
this end has been limited. Tariffs of water districts are designed based on full cost recovery and use of increasing block rates. However, politicians intervene in tariff increases, either objecting to or delaying implementation, resulting in water districts defaulting on their loans and being unable to secure sufficient funds to serve as equity in order to access loans for their expansion projects. In sanitation, cost recovery remains minimal.
For the two large Manila-based private conces-sionaires—Maynilad Water Services, Inc. (MWSI), the concessionaire for the west zone, and Manila Water Company, Inc. (MWCI), the concessionaire for the east zone—tariffs have steadily increased since privatization, to cover inflation, foreign exchange fluctuations, and investment costs. Table 2.1 shows the trend in water tariff levels. However, despite
Table 2.1Approved tariff increases in the Metropolitan Waterworks and Sewerage System concession areas, average tariff (P per cubic meter)
Charging periodMWCI
(east zone)MWSI
(west zone)
Inflation, % (average for
year)a
Pre-1997 8.56 8.561997–1998 2.32 4.96 9.71999 2.61 5.80 6.72000 2.76 6.13 4.32001 2.95 6.58 6.1Provisional implementation, April 2001 3.22Accelerated EPA, October 2001 4.22 10.792002 4.51 11.39 3.1Foreign currency depreciation
adjustment, 20026.75 15.46
EPA = extraordinary price adjustment; MWCI = Manila Water Company, Inc.; MWSI = Maynilad Water Services, Inc.
a. Base year is 1994. Source is National Statistics Office data as of March 2004.
Source: Metropolitan Waterworks and Sewerage System Regulatory Office.
WorldBankInfra.indb 15 12/6/2005 8:40:39 AM

1� Philippines: Meeting Infrastructure Challenges
marked increases, current tariff levels do not reflect investments required to assure sufficient bulk supply to the Manila distribution networks, which remain the responsibility of the Metropolitan Waterworks and Sewerage System (MWSS). This indicates that current tariff levels do not yet reflect full cost recovery. At the same time, MWSI remains in bankruptcy and rene-gotiations as to the restructuring of the concession are ongoing.
For water districts, tariffs are determined by the Local Water Utilities Administration (LWUA) to achieve recovery of cash expenditures—operation and maintenance (O&M) costs and debt service—but they fail to generate sufficient revenues to accumulate reserves (for example, through depreciation charges) to fund any expansion and to attract financing at commercial terms. As a result, service coverage is only 50–60% of water districts’ franchise populations. Moreover, smaller water districts fail to achieve even this level of cost recovery. Political interventions to avoid or delay tariff increases are not uncommon, and are—together with management failures—often at the core of water districts’ defaulting on loan obligations.
For LGU-managed systems, tariffs do not recover even O&M costs, as the need for ongoing operational subsidies indicates. As a result, these systems remain dependent on local government subsidies to augment revenues for O&M costs and capital expenditures. Tariff structures for LGU systems vary widely—increasing block rates, decreasing block rates, or flat rates—given that many LGU systems provide for no or only partial metering of household connections. LGUs typically charge connection fees, although they do not often recover full connection costs. For lower service levels managed by community-based organizations under LGU supervision, tariffs are virtually nonexistent in the majority of cases, with local governments and politicians providing for the costs of replacement and maintenance.
The inability to expand formal water supply services, largely as a result of low tariff levels, has resulted in a high cost of water for poor families not connected to the formal water systems. In Metro Manila, poor families, dependent on buying water from vendors at around $20 a month for 6 cubic meters, spend as much as 20% of their income on water.
Power With the passage of the Electric Power Industry Reform Act (EPIRA) in 2001, tariffs have been unbundled, but full implementation has yet to be
completed. Until the first half of 2004, rates failed to keep pace with costs, and have steadily fallen in US dollar terms since 1996. Owing to overcontracting by the National Power Corporation (NPC) with inde-pendent power producers in the early 1990s and the slowdown in demand growth that followed the Asian financial crisis, NPC has increasingly relied on foreign-denominated borrowings to meet its rising financial commitments, which subsequently led to a vicious circle of too much foreign debt. NPC was hard hit by the crisis and its condition continued to worsen as it has not been allowed to adjust tariffs to reflect the subsequent depreciation of the peso and, most recently, the steep increase in fuel prices to fully cover its foreign exchange exposure with regard to fuel-purchase and financial obligations. As a result, NPC has essentially absorbed insufficient pass-through as a loss each year.
Moreover, automatic rate adjustment mechanisms have been replaced with mechanisms that require Energy Regulatory Commission (ERC) review and approval of adjustments before they can be passed on to customers. But in practice, the new mechanisms and associated procedures mean that there will be considerable lags between when the increased costs are incurred and when those costs can be recovered from customers.
Retail tariffs that have been set below cost for years have contributed to NPC’s ballooning deficit. The situation will, however, progressively improve as demand increases. In addition, the government took the critical step toward containing the NPC deficit by increasing generation tariffs by about P1.4 per kWh over June to November 2004, and additional increases are being considered. These increases will enable NPC to cover its operating costs in 2005.
RoadsThe setting of toll rates is heavily influenced by noneconomic factors, and adjustment tends to be delayed. Despite the establishment of the Toll Road Board and a Special Road Fund under the Motor Vehicle User’s Charge Law, cost recovery is low to the extent that even regular road maintenance is being compromised. As a consequence, most maintenance activities have been limited to routine works and some urgent repairs of badly deteriorated sections, though at a high cost. The deficiency will therefore aggravate an already existing maintenance backlog. Maintenance effectiveness, measured in terms of expenditures against needs, is only about 33% on national roads.
WorldBankInfra.indb 16 12/6/2005 8:40:39 AM

Chapter 2 The Business Environment for Infrastructure 1�
Ports The Philippine Ports Authority (PPA) sets the port dues that private ports charge for handling non-own cargo and collects 50% of these dues in taxes. Low port charges are likely to discourage investment by the private sector in ports. Even when private ports do exist and compete, it is difficult for them to offer high-quality services due to the low tariffs and the high tax rate.
Figure 2.1 is an indication of low overall cost recovery in infrastructure sectors in the Philippines. Cost-recovery percentages for three cities in the
country—Cebu, Mandaluyong, and Naga—are compared with other cities in the region. While there is significant variation among these three cities, as the figure shows, average cost recovery in the Philippines is generally lower than in the other countries. Addressing cost recovery is especially important in the current fiscal environment where the national government has very limited resources for infrastructure spending.
Corruption
Overall business climateDespite government efforts at combating corruption, as figure 2.2 shows, overall perceptions of corruption as measured by Transparency International’s Corruption Perceptions Index have increased for the Philippines in recent years.1 The country is now losing ground to peers in the region (below Thailand and closer to Vietnam and Indonesia).2 The contrast is starker, when the Philippines, ranked 102 in 2004, is compared to Singapore (ranked 5), Hong Kong, China (16), and China (71).
The Transparency International findings are supported by other independent surveys. Research by the World Business Environment Survey in 20003 ranked the Philippines five out of six among its peers based on various business environment indicators. Corruption is also emerging as among the top bottlenecks to doing business, according to a recent investment climate survey conducted by the World Bank and Asian Development Bank (see figure 1.6 in chapter 1). It is clear from these surveys that corruption is a pressing economic development issue in the Philippines.
Infrastructure business climate By their very nature, infrastructure projects are prone to corruption in various aspects of the project cycle, from identifi-cation to implementation. And while the Philippines is not unique, corruption in its infrastructure sectors has been widely reported. Even though it is difficult to obtain detailed information because of the intrinsically covert nature of corruption, there is indeed strong informal evidence—through numerous studies, regular articles in the media, independent surveys, and interviews—that corruption within the country’s infrastructure sectors is negatively affecting the business climate.
Recently released results of the June 2004 Social Weather Stations4 Enterprise Survey revealed that the public’s perception of the efforts of the Department of Public Works and Highways (DPWH) to combat corruption is one of the worst for public agencies, and had further worsened over the previous two years.
Figure 2.1Municipal service cost recovery
Perc
ent o
f pop
ulat
ion
0
50
100
150
200
250
300
Solid wasteTelephoneElectricity
Sewerage/WastewaterWater supply
Hohhot
Mandaluyong
UlaanbaatarPhnom Penh
CebuSuva
HanoiSeoul
NagaMelbourne
Source: Asian Development Bank. 2001. Urban Indicators for Managing Cities. Manila.
Figure 2.2Corruption Perceptions Index for five East Asian countries, 1995–2004
Perc
ent
0
1
2
3
4
5
6
Indonesia
Vietnam
Philippines Thailand
Malaysia
20042003
20022001
20001999
19981997
19961995
Year
Note: Higher score means less corrupt.
Source: Transparency International (www.transparency.org).
WorldBankInfra.indb 17 12/6/2005 8:40:39 AM

1� Philippines: Meeting Infrastructure Challenges
A study on governance issues in public service delivery in the Philippines estimated that for infra-structure in particular, the misuse of resources in public works was between 20% and 40%.5 The same study noted that on certain procurement and infrastructure projects, regional directors of central agencies are said to receive a 10% commission, and Department of Budget and Management officers, 15%. An own-government estimate of “potential leakage in combined public-private transactions, which included purchases for BOT projects” for 2001 was P74 billion.6
At the local level, the use of discretionary “pork barrel” funds allocated by congressmen and senators is a principal contributor to inefficiency. These congressional funds—which amounted to almost P18 billion in 2001 or 0.49% of GDP—are spent with little oversight. They are typically channeled through national agencies, such as DPWH and LWUA, but there is little transparency and accountability in how projects are chosen for support, how funds are actually used, and what impacts and outcomes are achieved. Allegations of corruption and inefficiency with regard to the use of congressional funds remain commonplace, causing concern as to the quality of public expenditure on infrastructure.
Corruption is increasingly being recognized as a drain on the performance of the Philippines’ infrastructure sectors. To streamline the public procurement process and minimize corruption, the government has made some important progress, in terms of enacting the Government Procurement Reform Act (GPRA, Republic Act 9184), which was passed in 2002. With the intent of harmonizing procurement processes across all national line agencies and LGUs, the key provisions of the law are as follows:
Procurement by electronic means to facilitate the process. Advertisement of invitations to apply for eligibility to bid, posted on the website of the concerned offices and in the government’s electronic procurement system to ensure transparency.Standardization of the procurement process and forms. A shift in emphasis from prequalification to simple eligibility screening and strengthened post-qualification to remove discretion.A shift to the “lowest calculated responsive bid and the highest rated responsive bid” 7 as the criteria for award.
••
••
•
The use of an approved budget allocation for the contract as the ceiling on bid prices in lieu of bracketing in evaluating bid prices. Increased transparency of the procurement process. Professionalization of procurement officials.
Government efforts in addressing graft and corruption in public procurement have been laudable. The passage of the GPRA was a positive development, and is vital both for increasing transparency and accountability, and for reducing costs and delays in the public procurement process for goods and services related to infrastructure projects. Ongoing nationwide training programs on the GPRA for both LGUs and national government agencies are providing for a common interpretation of its provisions and intent. The involvement of civil society organizations in the bidding process as observers in the Bids and Awards Committee is encouraging.
Furthermore, other initiatives and reforms are being undertaken to promote transparency: widening the use of e-procurement in the bidding process; developing guidelines for value-engineering, which are to be mandatory for infrastructure projects costing at least P50 million; and encouraging alternative bids for design to ensure cost-efficient project design and to avoid overpricing of projects.
Still, the drive against corruption needs to be sustained and further stepped up, and there is scope for additional progress, as listed in the “Suggested actions” section of this chapter, below.
Insufficient competition
While certain segments of infrastructure network utilities remain naturally monopolistic (particularly in the “pipes and wires” business, i.e. bulk supply and distribution), other segments (such as production and retail supply) have become increasingly competitive in recent years with changes in technology and economic thinking.8 Essentially, competition should be pursued where feasible (and where it is not, regulation confined to the naturally monopolistic segments). Competitive pressures can be used to improve performance in infrastructure provision. Although some progress has indeed been made to promote competition in the Philippines, the economy has yet to reap its full benefits. Insufficient competition among both public and private infrastructure providers, and an uneven playing field for public and private operators,
•
••
WorldBankInfra.indb 18 12/6/2005 8:40:40 AM
Chapter 2 The Business Environment for Infrastructure 1�
is affecting sector performance and preventing much-needed efficiency gains from materializing. As discussed in the following paragraphs, competition can be of two kinds—direct and indirect.
Direct competitionTypically, competition in most product markets is head-to-head (or direct) competition, also known as competition in the market. This means that numerous suppliers compete with each other to supply consumers, who can choose among them. The scope for competition in the infrastructure market varies from sector to sector, and is highest in telecoms.
On the surface, competition in the Philippines’ telecoms sector would seem to be thriving, as there are many operators in the market—11 international gateway operators for instance, and three significant wireless players operating nationally. However, the Service Area Scheme, which requires operators to provide local exchange lines to unserved and underserved areas including parts of Metro Manila, actually created a series of regional duopolies, each with its own chosen domestic, and international, long-distance connections. As a result, users cannot exercise choice of long-distance provider as in truly competitive markets, and choice at the local service level is almost nonexistent.
There is some competition in the deregulated private line and data markets, which benefits business users in urban centers. Until the recent entry of a third national wireless operator, rates for mobile services were largely identical. In short, competition exists to a degree, but dynamic competition in the sector requires more effort. Carrier preselection for long-distance access is long overdue, and interconnection rules need to be enforced to ensure that entrants actually have a fair chance in the marketplace.
Competition is also curtailed by cumbersome market entry rules and requirements. Every service provider requires a congressional franchise and further certification by the National Telecommuni-cations Commission (NTC), both of which processes are politically influenced, slow, and costly. Until more open market-entry arrangements are in place, the market is likely to remain an oligopolistic domain for a few major economic players, and will not gain the full benefits of competitive discipline.
Likewise, in shipping, another sector where direct competition is possible, deregulation more than doubled the number of shipping companies—from 223 in 1997 to 585 in 2001. However, the industry remains highly concentrated, with only five shipping
lines accounting for about 90% of passenger and cargo markets and almost all of the primary and secondary shipping routes. Coupled with unregulated fares, this is likely to result in high shipping charges for cargo owners.
In the power business, direct competition is also possible in the generation segment (“wholesale competition”), although it should be recognized that because of the peculiarities of the power sector, designing competitive power markets is a complex task. For instance, a competitive market in generation requires well-defined market rules, the technical capacity to manage system operations and financial arrangements, and a robust transmission system. It also needs: strong and sustained political commitment to reform; financially viable market participants; a sufficient number of participants who are well prepared to participate; a competitive environment for generators and suppliers; commercially focused market participants without common ownership; development of financial markets for managing risk; and clear and sound market supervision.
The Philippines has an ambitious program for simultaneously privatizing generation and intro-ducing wholesale competition and, over time, retail competition in the power sector. A well-functioning competitive wholesale market will play an important role in improving the performance of the power sector. Indeed, the current situation in the country has several positive factors. For example, the government has shown a strong level of commitment to estab-lishing the wholesale market, and the Philippine Elec-tricity Market Corporation is now making substantial progress in its implementation. On current plans, there will be adequate generation and transmission capacity at market commencement. The proposed restructuring and privatization of the generation sector should, therefore, provide a sound basis for generation competition.
However, there are substantial risks in this strategy and key questions remain about imple-mentation. Past delays mean that the timetable for the establishment of the wholesale market is compressed, casting real doubts as to whether this timetable can be achieved. The creditworthiness of some electric cooperatives will be a major issue, as they will struggle to meet the necessary prudential requirements. There are also concerns about the preparedness of market participants, especially in view of the small size of many electric cooperatives and the concurrent process of restructuring and privatizing the generating companies.
WorldBankInfra.indb 19 12/6/2005 8:40:40 AM

�0 Philippines: Meeting Infrastructure Challenges
Direct competition is most prevalent among small-scale independent providers (SSIPs). In urban areas, SSIPs in the water sector are a diverse group of water operators serving both poor and affluent customers. They include real estate developers, homeowners’ associations, local entrepreneurs, and mobile water truckers and haulers. Most operate without recog-nition from local authorities or the water utility, and develop their business in a competitive environment. SSIPs in urban areas may serve anywhere between 100 and 3,200 water connections. In Metro Manila alone, it was estimated that 30% of the population in 1996 depended on SSIPs.
Post-MWSS privatization, SSIPs are known to buy bulk water from the private concessionaires and invest in tertiary lines to serve poor urban settlements, but they charge a higher tariff than that paid by people directly connected to the system. Some SSIPs invest in deep wells. In most cases, SSIPs serve poor urban settlements where households cannot afford connection fees.9 In rural areas, SSIPs take the form of “backyard” water vendors, who invest in pushcarts or pedicabs (bicycles with sidecars) and usually source their water from public taps or private connections. Water vendors augment water supplies of households with private wells or where the water source is at such a distance that households prefer to buy water rather than spend time fetching it or standing in line for it.
In the transport sector, various SSIPs provide informal transport services. In the crowded streets of Metro Manila, tricycles (motorcycles with sidecars) and pedicabs provide transportation services through narrow streets and routes where jeepneys and other public vehicles are not allowed to operate. Vans and microbuses carry more passengers than these, and charge less (a flat rate per head) than taxis. The Land Transportation Franchising and Regulatory Board has estimated that out of approximately 7,000 public utility vehicles operating in Metro Manila, in 2002 there were about 3,000 vehicles operating without appropriate franchises, thereby creating free entry (and exit) in the market.
With free entry and exit, and as a result, competitive prices, SSIPs are filling a critical unmet gap. However, they operate in an unfavorable business climate, often having to bribe officials. Lack of stability due to unpredictable political interference, limited access to credit, and insuf-ficient information about future planning further discourage investment. The challenge is how to validate SSIPs as legitimate service providers and
bring them under an appropriate legal and regulatory umbrella, without stifling their entrepreneurial and competitive character. Moreover, the government should consider steps to actively promote compe-tition to ensure that such competitive pressures are maximized. For example, in the power sector, EPIRA has set a general framework for SSIPs and has announced a policy of opening up unserved areas to new entrants. However, actual implementation is not running as fast as originally hoped.
Indirect competitionIndirect competition can be of two kinds: compe-tition for the market and benchmark competition.
Competition for the marketFor the naturally monopolistic segments in infra-structure, even though direct competition is not possible, benefits of competition can be used to select operators by requiring them to compete for the market. And even after a monopoly provider is in place, requiring periodic rebidding of the right to serve the market can lengthen the benefits of such competition for the market.
The Philippines has had some positive experience, for example, in the formal water sector, where the Manila water concessions were awarded competi-tively. Competitive bidding for these concessions led to a substantial reduction in the initial tariffs: the winning bid for the east zone was 26% of the prevailing tariff of MWSS at that time, and for the west zone, 57%.10 However, other opportunities for capitalizing on benefits brought by competition for the market have been forgone through numerous unsolicited and directly negotiated infrastructure contracts, most notably in power and transport. The cost of uncompetitive practices remains high.
In an aggressive campaign to attract new investment to power generation as a result of the power crisis in the 1990s, the Philippine government assured payments to private generators, in hard currencies, under numerous take-or-pay contracts with the independent power producers. Initial tariffs were high because of the unsolicited and opaque nature of most transactions. The combination of assured payments and high initial tariffs, coupled with the unanticipated fall in demand subsequently, led to significant excess capacity in the system and created substantial stranded costs.
In roads and other public works projects, there is a perception that collusion is widespread and has resulted in higher costs, but such practices are very
WorldBankInfra.indb 20 12/6/2005 8:40:40 AM
Chapter 2 The Business Environment for Infrastructure �1
difficult to prove. The majority of private sector partici-pation projects have been implemented through unso-licited bids, instead of competitive tendering. Such practices are likely to reduce the benefits accruing to the government and the public, and increase oppor-tunities for rent seeking.
The creation of an uneven public-private playing field also minimizes competition. For example, in the ports sector, PPA regulates entry of the private sector through the issuance of permits to construct and operate ports, and sets the port dues that private ports charge for handling non-own cargo. However, by setting charges at low rates (among the lowest in the region), and charging unreasonably high taxes, PPA disincentivizes new (private) entry, thereby insulating itself from competition.
Benchmark competition Another form of indirect competition used in the absence of direct competition is benchmark compe-tition. It is based on comparisons of performance and efficiency (such as tariffs and quality of service criteria) of similar service providers, and forces underperforming providers to improve their performance relative to that of other firms (or an industry average). Such competition has been exten-sively used in the United Kingdom for infrastructure utilities in water, sewerage, and power distribution (box 2.5, below), and more recently, in Latin America. Benchmark competition has also been used to resolve disputes between competing telecoms providers in Morocco and Botswana.11 In East Asia, Vietnam has embarked upon an impressive program in its water and sanitation sector that has begun benchmarking, among other things, capital costs of over 30 provincial water service companies.
To realize the full benefits of benchmark compe-tition, two requirements have to be met. First, providers must not be able to collude. Second, there has to be a minimum level of homogeneity among service providers, i.e. they must operate in similar enough environments so that their cost, pricing, and other performance criteria are comparable enough to make comparisons meaningful.
The Philippines has not fully experimented with benchmark competition. In the water sector, splitting Metro Manila’s service area into two zones during the MWSS concessioning process laid the grounds for such competition. However, benchmark competition between the two concessionaires failed to materialize in the absence of any systematic effort to actually determine an efficiency frontier.
Low credibility of institutions
Risks of investing in infrastructure projects are high for three reasons: infrastructure investments tend to be asset-specific and immobile; they are typically for the long term; and, since most infrastructure services are perceived to be public goods, infrastructure tariffs become inherently political. Therefore, governments have to credibly commit to a set of rules and a system to implement these rules, so as to minimize these risks and allow infrastructure investors to earn reasonable returns. Some of the services still need to be provided by the government or public utilities. In the Philippines, however, the credibility of rules and the associated system—particularly of regulatory and judicial institutions and public providers—is being damaged, thereby undermining infrastructure performance.
Because certain aspects of infrastructure provision remain naturally monopolistic, economic regulation—a set of rules and procedures that governs tariffs and monitoring of quality standards—is needed to protect consumers from abuse of monopoly power. Regulatory institutions are needed to implement these rules and procedures.
Regulation can be implemented through a series of tightly specified rules (for example, on detailed cost-based formulas for tariff adjustments) that attempt to foresee various contingencies. However, the cost of such rules makes it difficult for the system to adjust to unexpected changes (such as changing technologies or market conditions) that require continuous revision of the rules. The alternative is to provide discretionary powers to the regulatory entity, but the cost of this is the risk that the regulator could abuse these powers—thereby increasing regulatory risk, the cost of capital, and, ultimately, tariffs.
The Philippines has tried both approaches. The MWSS water privatization entailed an attempt to regulate the two private concessionaires through a series of tightly specified rules (“regulation by contract” with limited discretion). In most other sectors, the regulatory approach is to provide more discretion to sector-specific regulators, but then attempt to manage the discretion to minimize risk of abuse (“regulation by generally applicable law”).
Either approach can be made to work, provided that basic regulatory decisionmaking is shielded from regulatory capture by politicians, consumer lobbies, and/or regulated utilities. The issue is not really one of independence per se: the key is to have a credible regulatory decisionmaking process—one that is
WorldBankInfra.indb 21 12/6/2005 8:40:40 AM

�� Philippines: Meeting Infrastructure Challenges
Table 2.2Summary of economic regulators in infrastructure sectors
SectorDoes a well-defined
regulatory system exist?Regulator Year established
Power Yes Energy Regulatory Commission 2001
Water Proposed Local Water Utilities Administration for water districts
Metropolitan Waterworks and Sewerage System for Manila water concessions
National Water Resources Board—proposed
1973
1971; regulatory office established in 1997
TransportAirports Yes Air Transportation Office Its precursor, the Civil Aeronautics
Administration, 1947; renamed 1987Roads Yes Toll Regulatory Board 1977
Ports Yes Philippine Ports Authority 1975
Rail Yes Philippine National Railways 1984
Telecoms Yes National Telecommunications Commission 1979
Source: Compiled by World Bank staff.
guided by the need to balance public interest (i.e. the combined interest of consumers and investors) and that errs toward implementing and enforcing key rules rather than formulating them. In practice, the amount of discretion given to regulatory authorities depends upon factors such as the level of regulatory capacity, and the legitimacy and maturity of these authorities.
Table 2.2 outlines the progress that the Phil-ippines has made in establishing economic regulators. Sector-specific regulators have been established in power, transport, and telecoms.
Creating economy-wide regulators, however, is not sufficient. Most regulatory institutions suffer from a lack of credibility, which thereby increases regulatory risk. The four main factors that hurt regulatory credibility are: lack of insulation from short-term political pressures; limited regulatory capacity; lack of regulatory coordination; and judicial intervention in infrastructure decisions.
Lack of insulation from short-term political pressures Undue political interventionIn the power sector, the ERC was established as an independent regulator, and provided with a distinct legal mandate under EPIRA. However, since the ERC’s establishment, short-term political inter-ference has still been observed in the regulation process. For instance, a presidential directive was issued (May 2002, affirmed by the ERC on September 2002) to reduce the power purchase adjustment from
P1.25/kWh to P0.40/kWh. (The adjustment was an automatic mechanism that allowed NPC to pass through to customers costs associated with its US dollar independent power producer obligations.)
Lack of separation between policy, regulatory, and operational functionsPolitical intrusion can also take place if policy and regulatory functions are not well delineated. This is the case in the water sector. In 2002, the National Water Resources Board (NWRB) was reorganized through Executive Order 123 and its board was restructured to replace member agencies having direct claims in water resources with representatives from the private sector and civil society. NWRB was also moved from being an attached agency of DPWH to the Department of Environment and Natural Resources to address the conflict of interest between NWRB’s rules on water resources planning, management, and regulation, and the development function of a public works department. The nature of the relationship between NWRB and the river-basin institutions, however, is still unclear. In the same executive order, pending creation of a national water regulator, NWRB was also made responsible for economic regulation of water districts (with LWUA reviewing tariffs of water districts under its jurisdiction). This was intended to address an immediate issue of conflict of interest in that LWUA was both a financier and regulator of water districts. However, the transfer of responsibility has yet to be operationalized.
Likewise, in the transport sector, the key transport
WorldBankInfra.indb 22 12/6/2005 8:40:40 AM

Chapter 2 The Business Environment for Infrastructure ��
infrastructure agencies of the national government are DPWH and the Department of Transportation and Communications (DOTC), two of several line agencies reporting to the president. Regulatory bodies are attached to either of these two agencies or located in the Office of the President, making them vulnerable to short-term political influence.
In the ports sector, separation of policy, regulatory, and operational functions of PPA has yet to take place. Because of the conflict of interest arising from this, tariff charges as established by PPA are not aligned with the actual costs of usage of port facilities.
Weak corporate governance for public utilitiesThe ownership structure of water districts is very vague; their identity as government owned and controlled corporations was only established through a Supreme Court ruling, instead of through a clear pronouncement in their charter. Even for those utilities that have a clear corporate identity, weaknesses in corporate governance can be prevalent. For instance, board members may be selected without relevant experience, and executives of the utilities may be selected based mainly on political consider-ations rather than on qualifications and experience. There is also lack of performance monitoring and evaluation of public utilities, either by their board, the oversight agencies, or the public. Management is therefore neither rewarded nor penalized for its performance. It is clear that neither public corpo-rations nor government infrastructure agencies can withstand frequent political intrusion, as reflected in tariff decisions, project selection and prioriti-zation, and staffing. Poor civil service pay is another important element in poor performance.
Limited regulatory capacity Effective regulatory decisionmaking is also constrained by limited regulatory experience and capacity.
In power, because of its evolution from the predecessor Energy Regulatory Board, the ERC has benefited from some institutional continuity and is today an agency of close to 200 employees. However, it is charged with a large number of tasks ranging from regulation of NPC and 139 distribution companies, to oversight of the Philippine power market. As a result, the ERC has been overwhelmed, and is conse-quently unable to adhere to the deadlines for, among other things, unbundling generation from other facets of electricity provision as set down in EPIRA. For instance, as of February 2004, only about half of some 140 unbundling decisions had been issued,
whereas under EPIRA all of them should have been completed in 2002.
In water, while the responsibility for economic regulation was transferred from LWUA to NWRB, the latter still does not have the capacity to undertake such a role.
In telecommunications, the NTC does not have the capacity to conduct independent and comprehensive financial audits; neither does it have the expertise and resources to monitor performance standards.12 The NTC’s inability to provide appropriate financial incentives, and its lack of financial independence, have prevented it from hiring appropriate technical expertise.
Lack of regulatory coordination Another factor that constrains effective regulatory decisionmaking is the lack of regulatory coordi-nation among various sectoral agencies. In transport, three different agencies regulate the sector: PPA for ports, Philippine National Railways for rail, and the Toll Regulatory Board for roads. Often, these agencies have different reporting requirements and standards, thereby inhibiting efficient movement of goods across different modes. A single transport regulator that consolidates different standards and reporting requirements, and establishes some degree of uniformity, could be one solution. The government should also promote an integrated framework for developing main transport and trade corridors, with appropriate modal interfaces.
Judicial intervention in infrastructure decisionsThe lack of clarity in the regulatory–judicial interface is often fraught with misinterpretation. This is because regulatory bodies are typically neither administrative bodies nor judicial authorities, yet have elements of each. In the highly technical field of infrastructure regulation, court involvement should, in general, be limited to procedural, rather than technical, matters.
The frequency with which the apex judicial institution—the Supreme Court—involves itself in traditional regulatory affairs, such as tariff setting and other basic issues in a range of infrastructure sectors, is contributing to the perception of an activist judiciary (box 2.1). This reflects a weakness of resolving contractual disputes at lower levels, or through other means. In addition, such cases unduly add to the workload of the Supreme Court, an insti-tution already overburdened with a large backlog of civil and criminal cases.
WorldBankInfra.indb 23 12/6/2005 8:40:41 AM
�� Philippines: Meeting Infrastructure Challenges
Box 2.1Judicial decisions with implications for the business environment for infrastructure
Various decisions, some of which have explicitly reversed regu-
latory decisions, could have adverse implications for the business envi-ronment for infrastructure. They include the following:
The Court of Appeals ordered the Energy Regulatory Commission to review its approval in 2003 of a Meralco petition for a 17 centavo per kilowatt-hour rate increase (July 2004).The Supreme Court ordered Meralco, the largest private elec-
•
•
tricity distribution company, not to implement the provisional pur-chased power adjustment that was earlier granted by the Energy Regulatory Commission (January 2004).The Supreme Court upheld its earlier decision to nullify all the contracts signed by the gov-ernment with Philippine Interna-tional Air Terminals Co., Inc. for construction of Ninoy Aquino International Airport Terminal 3 (May 2003).The Supreme Court voided a
•
•
government contract won by Cyber Bay Corp. to reclaim land in Manila Bay. Cyber Bay, which has foreign investors, had already invested around $1.7 billion (May 2003).The Supreme Court ordered Meralco to refund P28.15 billion to customers for overcharges from 1994 to 1998 (April 2003).
Sources: BusinessWorld. July 30, 2004; January 15, 2004; May 6, 2003; May 8, 2003; April 11, 2003. Manila.
•
Suggested actions
The Philippine government needs to take immediate action toward addressing the four Cs of inadequate cost recovery, corruption, insufficient competition, and low credibility of regulatory and judicial institutions.
Fostering cost recovery Cost recovery should be fostered by aligning infra-structure tariffs with costs in an economically coherent manner, and in a way that minimizes the negative impact of price increases specifically for the poor, and by providing subsidies where justifiable.
Cost recovery through raising user fees With the exception of telecoms, most sectors are far from attaining full cost recovery. The situation is arguably the most dire in the water and sanitation sector, where tariffs barely cover O&M costs, let alone significant capital costs.
In power, it is not clear that recovering full costs through a tariff increase is the right policy. This is because the high costs in the sector are largely a result of past inefficient contracting. The economic rationale for raising power tariffs to cover these overcontracted costs is not compelling since these costs are not user charges but, rather, a tax. A better option would be to achieve cost recovery through a combination of a tariff increase and government direct assumption of a portion of NPC debt to be funded by a tax increase and/or refinancing. (This option is covered in more detail in chapter 6.)
In roads, cost recovery has not been achieved even for road maintenance, although the annual motor vehicle registration charges have been revised upward and the proceeds earmarked for four special-purpose funds. Since the passage of the Motor Vehicle User’s Charge Law in 2000, only about 46% of the proceeds earmarked for national road maintenance have been released by the Department of Budget and Management. More efficient utilization of the Special Road Fund and unblocking institutional issues could help achieve cost recovery.
Cost recovery through subsidies Almost all of the Philippines’ infrastructure sectors receive some level of subsidy—either direct or indirect (box 2.2). Direct subsidies could be in the form of cash subsidies given to utilities (for example, to LWUA in the water sector) or end consumers. Indirect subsidies could be in the form of uncalled government guarantees, or as in the case of MWSI, a taxpayer-assisted bailout for the utility’s past incurred debts. However, the rationale for these subsidies is not always clear, and they are often not targeted.
Generally, subsidies can be legitimately part of the cost-recovery equation for three reasons: the “natural monopoly” reason,13 the “public good” reason,14 and affordability concerns. Subsidies may be justified on equity grounds if an across-the-board increase in tariffs for all sectors is not feasible because of the adverse impact that such an increase would have on afford-ability, especially for the poor. In the Philippines, there is mixed evidence that affordability is a real concern, as discussed in the following paragraphs.
WorldBankInfra.indb 24 12/6/2005 8:40:41 AM

Chapter 2 The Business Environment for Infrastructure ��
Box 2.2Subsidies in infrastructure sectors
In power, the National Power Cor-poration (NPC), through its Small
Power Utilities Group, received about P1.34 billion subsidy in 2003 for missionary electrification. Moreover, the direct liabilities incurred by NPC as a result of guaranteeing the capacity pay-ments also constituted an indirect subsidy.
In water, the government used to appropriate subsidies for the Local Water Utilities Adminis-tration (LWUA) in the amount of P200 million–P300 million annually from 1992 to 2002 to be used as
counterpart funds for development projects of water districts. LWUA used to receive additional gov-ernment subsidies amounting to a total of P2 billion as the gov-ernment counterpart for its foreign loans. LWUA has stopped receiving government budget allocations in recent years.
In transport, the net losses in 2002 for the Philippine National Railways, Light Rail Transit line 1, and Metro Rail Transit line 3 were P857.9 million, P2,585 million, and P4,461 million, respectively. For tollways, the Philippine National
Construction Company net loss in 2000 was P418 million.
In addition, infrastructure projects are also subsidized through direct Internal Revenue Allotment cash transfers to local governments, as well as through congressional funds.
Sources: Rosario G. Manasan. 2004. “Infrastructure and Decentralization.” May. World Bank, Manila; Almec Inc. 2004. “Urban Transport.” World Bank, Manila; and Castalia Strategic Advisors. 2004. “Philippines Rural Electrification Regulatory Framework: Draft Final Report.” Manila.
Congressional funds for local infrastructure in DPWH budget, 2000–2001, P billion
2000 2001 Total 2000–2001
Total DPWHa 42.33 48.96 91.29
of which:
Congressional funds:b 8.1 17.56 25.66
Various infrastructure projects 8.1 17.29 25.39
Project Development Assistance Fund 0.0 0.27 0.27
Sources: a. Basic data from DPWH. b. Estimates by Rosario G. Manasan. 2004. “Infrastructure and Decentralization.”
In the water sector, a government survey15 showed that an average of 1% of total household expenditure is spent on water, with little variation between low-income and high-income groups or across regions. A July 2004 survey among low-income Metro Manila residents16 tested perceptions as to the fairness of prices charged by the two concessionaires. Its respondents revealed that they: spend an average of 4.3% of income on water from the network; consider that amount appropriate (12% considered the price “below the cost of service” and another 53% “only fair”); and are generally positive about the quality of water they receive from the network (very good 7%, good 43%, fair 25%). Other studies point to more significant affordability constraints. Poor households not serviced by the networks pay considerably more for water supply. For example, low-income consumers of SSIPs reportedly spend up to 16% of household income.17 For Metro Manila, expenditure on clean water may account for as much as 20% of household income for those who do not enjoy 24-hour piped water supply and who depend on buying water from vendors at around $20 per month for 6 cubic
meters.18 Improving water service affordability for poor households will, therefore, depend primarily on better access of households to network services, rather than on lower network tariffs.
In the power sector, affordability does not seem to be a major problem in the many cities served by investor-owned utilities. Evidence suggests strongly that customers of electric cooperatives are willing and able to pay, provided that they receive good service. Affordability studies carried out in the context of the Rural Power Project financed by the World Bank and Global Environment Facility suggested that levels of around P15/kWh, or $0.30/kWh, represent the lower end of alternatives available to unconnected rural populations (most of whom live in areas that are relatively remote and therefore more expensive to serve). Tariffs above P15/kWh are generally considered beyond the means of poor rural households, and current government policy is focused on ensuring that subsidies are available so that rates do not exceed this level.
In the future, electricity prices are likely to be affected by a number of changes resulting from a
WorldBankInfra.indb 25 12/6/2005 8:40:41 AM

�� Philippines: Meeting Infrastructure Challenges
probable increase in NPC generation tariffs, removal of intra-grid and inter-grid subsidies, and imple-mentation of the wholesale electricity spot market. Overall, residential users, especially outside Luzon and outside the areas in Luzon served by Meralco, are likely to see a substantial increase in rates. In percentage terms, the increase is likely to be greatest in Mindanao, since this is where electricity prices are the lowest at present.
While tariffs are politically sensitive and general economic woes have hit many segments of the urban population in recent years, balancing these factors has been the function of generous “lifeline” rates, which protect electricity users in the Philippines: users whose electricity consumption remains below a certain level benefit from reduced rates. Individual distribution companies set the maximum levels (typically between 50 kWh and 100 kWh per month). The schedules of reductions also vary between individual distribution companies. Meralco’s lifeline rates are generous by international standards: users who consume less that 50 kWh per month benefit from a discount of 50%; those who consume between 51 kWh and 70 kWh per month, 35%; and those who consume between 71 kWh and 100 kWh per month, 20%.
In the roads sector, affordability of toll rates is mixed. A 2003 study estimated the benefits of toll roads to users and determined that a toll rate for urban expressways of P4/car-km is likely to leave the user with significant savings in time and vehicle operating costs.19 Based on this benchmark, the toll rate for both the South Luzon Expressway (SLEX) and North Luzon Expressway (NLEX) (P0.33/car-km), as of June 2004, is too low, while the toll rate for the elevated Skyway is high (P8.1/car-km). Toll rates at other links (P0.72/car-km for the Southern Tagalog Arterial Road; P2.8 for Skyway at grade; P3.27 for the Manila–Cavite Toll Expressway or MCTE) are more or less reasonable for users. Generally, toll rates for intercity expressways are about one-third to one-quarter of those for urban expressways, correlating to a reasonable toll rate for intercity expressways of about P1.0–1.3/car-km.
For urban public transport, fares (as of June 2004) in Metro Manila are very low. The first 4 km on the ordinary or non-aircon bus costs P6.00, while that on a jeepney is P5.50. A bus passenger survey20 found that the majority of respondents (68%) considered the bus fare to be fair. For Light Rail Transit (LRT) 1, a fixed fare of P12 is charged for up to eight stations and P15 for more than that, covering a distance of up to 15 km. Fares on Metro Rail Transit (MRT) 3 were
actually reduced from a range of P17–34 in December 1999 to P9.5–15 in 2000, where they remain.
Overall, at the present time, affordability does not seem to be a major issue. While subsidies are prevalent in infrastructure, apart from lifeline rates in power they are often poorly targeted. Better targeting and management of subsidies can go a long way to increasing public resources that could be used for cost-recovery purposes. Subsidies should, though, be used as part of the cost-recovery equation only where justified on equity or efficiency grounds.
Minimizing corruption Corruption in infrastructure projects—both public and private—is increasingly being reported in the media. An August 2004 article highlighted how even children—based on a successful model applied in the city of Bangalore in India where school children through surveys monitor road performance and have held their local politicians accountable—can stop corruption in infrastructure.21 Another article highlighted innovation in fighting corruption in infrastructure projects at the community level: on small-scale infrastructure projects, such as the component projects in the Kalahi-CIDSS project,22 the presence of women in the administrative and auditing functions in road projects has “discouraged people from shaving off ‘any 10%’ from the actual road budget.”23 Also, a handful of citizen groups and nongovernmental organizations have taken up the crusade against graft and corruption (box 2.3). These groups approach their role in a variety of ways: some engage in watchdog activities (e.g. Volunteers Against Crime and Corruption, Negros People’s Graft Watch in Bacolod City, and the Concerned Citizens of Abra for Good Government), some undertake research work to understand the problems and the ill-societal effects of graft and corruption (e.g. Procurement Watch), while others simply draw attention to issues and help correct society’s perception that people are powerless to do anything about irregularities in procurement and in infrastructure projects (e.g. Walang Ku-Corrupt, Kilosbayan).24
In public-private infrastructure projects, the scope for corruption becomes considerable with the acceptance of unsolicited bids. Most of the contro-versial infrastructure projects in the Philippines started as unsolicited proposals, notably the Ninoy Aquino International Airport Terminal 3 in Manila and the Caliraya-Botocan-Kalayaan (CBK) hydro-electric power BOT project. Commendably, the Philippines is the only country in the region (and
WorldBankInfra.indb 26 12/6/2005 8:40:41 AM

Chapter 2 The Business Environment for Infrastructure ��
Box 2.3Citizens’ action in monitoring public works projects
After the Edsa I revolution, the Aquino administration started
to implement the Community and Employment Development Program through the National Economic and Development Authority (NEDA). Through this, small public works projects (i.e. farm-to-market roads, health clinics, school building, irrigation systems, and barangay roads) were allotted to communities and whose ben-eficiaries were to be employed by the projects to help augment their meager farm income.
One unique feature of the program is that it necessitates the involvement of nongovern-mental organizations to monitor project implementation. The Con-cerned Citizens of Abra for Good Government (CCAGG)—a group of former NAMFREL (election watchdog) volunteers during the 1986 presidential snap elections—seized the opportunity to commit themselves to monitor the projects under the program. Pursuant to the memorandum of agreement, NEDA provided CCAGG with training on project monitoring and listings of projects under the Community
and Employment Development Program including their locations and the implementing agencies. The Department of Budget and Management provided the infor-mation on total project costs and schedule of fund releases.
After visiting project sites, matching planned budgets and work program with actual dis-bursement, purchases, physical operations, and output, the CCAGG brought charges against 11 engi-neers of the Department of Public Works and Highways (DPWH) Abra district office for dishonest, and fal-sification of, public documents. The accused claimed to have completed 20 infrastructure projects financed through district funds, when in truth some had not even been started. An audit team investigated and they corroborated CCAGG’s findings. Administrative charges were filed and the 11 engineers were found guilty and punished accordingly. Shortly thereafter, the DPWH regional office issued a memorandum to its district office in Abra requiring a CCAGG moni-toring report before contractors were paid.
CCAGG continues to monitor infrastructure projects and has brought attention to quality and design defects as well as inefficient operations of contractors for public roads. In October 2002, the Com-mission on Audit (COA) enlisted CCAGG’s help in testing the first-ever participatory audit. It was pilot-tested in Abra Province on 23 road projects of DPWH and com-munity projects of the Department of Environment and Natural Resources. Later, the participatory audit was replicated in Mountain Province with the Social Action Development Center and in Cama-rines Norte with the Urban Poor Assembly. COA and CCAGG were permanent audit team members.
The COA Central Office later launched a book in January 2003 out of this experience to help insti-tutionalize participatory audits.
Sources: S. Coronel and L. Kalaw-Tirol, eds. 2002. Investigating Corruption: A Do-It-Yourself Guide. Manila: Philippine Center for Investigative Journalism; Con-cerned Citizens of Abra for Good Gov-ernment presentation in the Citizens Against Corruption Conference: Com-bating Corruption, September 21, 2004.
among a handful globally) to pass a BOT Law with a stated policy toward minimizing unsolicited bids. The essence of this policy is to make competitive an uncompetitive/unsolicited bid by allowing challengers to compete with the incumbent bid under specified rules and procedures. However, there are ambiguities surrounding the BOT Law, as well as the rules and procedures. These relate to unnecessary preconditions for a challenge; an unrealistic time frame for deci-sionmaking; and an impractical counter-proposal policy (see box 4.9 in chapter 4 for more details).
Creating positive incentives for reducing corruption, by rewarding best practice projects for example, or by systematically recognizing activities that adhere to or surpass guidelines, deserves more exploration. Box 2.4 highlights the case of Naga City, which has made its procurement process work by building an enabling environment, improving transparency of
the procurement process, and encouraging qualified entities to take part in the selection process.
Since procurement reform is often a lengthy process, more can be done by vigorous implementation of the 2002 GPRA and complementing it with financial management reforms. Other specific actions include strengthening the monitoring and enforcement capa-bilities of the key anticorruption oversight agencies such as the Government Procurement Policy Board, the Office of the Ombudsman, and the Commission on Audit; insisting on consistent disclosure and verifi-cation of assets by public officials; accelerating the infor-mation transparency aspects of procurement reform, including civil society monitoring and timely posting of bid invitation and award results; and initiating an aggressive effort on simplifying government trans-action procedures, so as to reduce both the number of steps involved and discretionary powers.
WorldBankInfra.indb 27 12/6/2005 8:40:41 AM
�� Philippines: Meeting Infrastructure Challenges
Box 2.4The Naga City case: Making the public procurement system work
Naga City government’s pro-curement practices have
resulted in significant cost reduc-tions and the timely delivery of the city’s purchases of infrastructure projects, as well as supplies and equipment. Improving transparency in the public procurement process ensures wider participation of qualified providers and increases the accountability of government. Naga has institutionalized several measures to ensure greater trans-parency in the process, as follows.
Wider dissemination of bid notices and contract awards has greatly helped increase trans-parency. They are disseminated not only through posting on electronic bulletin boards and through news-papers, but also in announcements on radio and television. Recently, the city government worked with a local publisher to print details
of activities on budget and pro-curement—under such topics as what is being procured, how much is it being procured for, to whom it has been awarded, and at what price—in a local paper’s section called “Naga City Procurement Watch” without cost to the city government.
The city government conducts an informal canvass prior to actual procurement for supplies and equipment in order to have an idea of the prevailing market price. Naga benchmarks its budget for projects on private sector estimates.
Transparency has also been bolstered by nongovernmental organization participation. In 1997, the Empowerment Ordinance of the City of Naga was passed to establish the Naga City People’s Council. This is composed of rep-resentatives from industry, gov-
ernment, and civil society groups, whose objective, among others, is to observe, vote on, and participate in the deliberation, conceptual-ization, implementation, and evalu-ation of programs and projects of the city government, including its procurement process. This process helps ensure transparency.
The Naga City case exemplifies the importance of leadership at the highest level for procurement reforms to take place. It also high-lights the phased, long-term, and continuous process of reforms. Further, it stresses the need for information dissemination, moni-toring by an independent body, and an effective feedback mech-anism for the operationalization of reforms.Source: World Bank. 2003. “Political Economy of Public Procurement in the Philippines.” World Bank, Manila.
Maximizing competition Competition can be maximized by removing barriers to entry and exit; resolving conflicts of interest by separating policy, regulatory, and operational roles; reducing the monopoly power of public providers; and more fully experimenting with benchmark competition (box 2.5). For SSIPs, the government can take steps to better adapt regulation to SSIPs, and therefore enhance the competitive pressures that they can bring.
Increasing institutional credibility The Philippine government can enhance regulatory credibility by shielding regulatory decisionmaking from short-term political pressures, building regulatory capacity, and consolidating and coordi-nating certain regulatory tasks. Specifically, some formal safeguards against undue political interference are:
Providing regulatory institutions with a reliable source of funding, preferably from fees imposed on regulated firms or consumers. Currently, neither the ERC nor the NTC seems to have fiscal autonomy.
•
Appointing regulators for fixed terms and protecting them against arbitrary removal.Exempting regulatory institutions from civil service salary rules, which make it difficult for them to retain qualified staff or hire staff at market pay scales. (Most regulators are capacity-constrained, partly for these reasons.)
Preventing political interference and building regulatory capacity are not mutually exclusive, and can be reinforcing measures: sound regulatory decisions based on application of technical expertise can prove to be an effective barrier against political interference.
The Government can improve corporate governance of public utilities by appointing qualified and expe-rienced corporate board members and executives; providing more operational autonomy to corporate management while establishing clear performance targets based on which the management may be rewarded or penalized; establishing benchmarking systems for similar utilities in the country (e.g. for water districts) and widely publicizing bench-marking results so that nonperforming utilities can be exposed; and more closely involving the public and
••
WorldBankInfra.indb 28 12/6/2005 8:40:42 AM

Chapter 2 The Business Environment for Infrastructure ��
Box 2.5Benchmark competition in the United Kingdom water sector
Benchmark competition pro-vides an option for regulators
to create indirect competition among local regional distribution monopolies. Through benchmark comparisons, regulators pressure utilities to match the efficient performance of their lowest-cost neighbors. Benchmark costs are also particularly useful for rate-setting purposes. Regulators may utilize a form of benchmark compe-tition by setting a firm’s rate cap in reference to the costs incurred by other firms in the same business. This rate-setting methodology creates incentives that limit costs. (These same incentives do not
exist under cost-plus regulation.) Furthermore, it limits the tendency for prices to far exceed costs under traditional rate-cap regimes.
However, differences in average costs among firms are explained by numerous factors other than efficiency, including differences in economies of scale, the cost envi-ronment (e.g. land topography, weather), and quality of the ser-vices provided. These differences prevent regulators from using just one cost parameter to set rates for all providers. These factors can be partially controlled for using statis-tical methods, and an industry-wide cost function can determine each
firm’s efficient cost. Often, however, differences in costs cannot be fully explained statistically.
Given this limitation, one of the most sensible methods for realizing the benefits of benchmark com-petition has been by the United Kingdom water regulator, the Office of Water Services. It has estimated capital and operating cost func-tions for various water subservices, and used the resulting predicted efficient cost as one of several factors into its rate-setting deci-sions, rather than applying a rigid formula (such as formal yardstick competition employs).Source: World Bank staff.
Box 2.6Sensitizing the judiciary to infrastructure regulatory issues in South Asia
Various South Asian countries have embarked on reform
of their infrastructure sectors. Key components of this are the introduction of competition, priva-tization of existing public sector service providers, and the creation of specialized regulatory agencies.
The region has more than 25 autonomous regulatory bodies already in place in the infra-structure sectors, and prices for infrastructure services have long been regulated. However, eco-nomic regulation by independent bodies, separated from government departments and operating on principles of transparency and cost-reflective pricing, is relatively new in South Asia.
The concept of private provi-sioning of infrastructure services is also new to the judicial authorities in the region.
Against this background, both regulators and judicial officials recognized the need to better understand each other’s roles and responsibilities, and for a different kind of sensitization of judicial issues arising from regu-lation and private provisioning of infrastructure.
As a result, a two-day workshop was organized in August 2002 with the objectives of understanding various legal aspects of regulation; examining alternative regulatory processes; and examining the rel-evance of alternative dispute reso-
lution mechanisms in infrastructure regulation.
The workshop provided a much-needed public forum for regulatory and judicial experts from the region, and went a long way to dis-pelling the apprehension that they were working at cross-purposes. Subsequently, a number of judges have referred to, and incorporated, the findings from the workshop in their court proceedings.
Source: Proceedings of the South Asia Forum for Infrastructure Regulation and the Public Private Infrastructure Advisory Facility Workshop, “Legal Aspects of Regulation in South Asia,” held in Dhaka, Bangladesh, August 3–4, 2002 (http://www.safir.teri.res.in/wkshp/legalproceed.pdf).
consumer groups in monitoring the service levels of public utilities.
Confidence in legal institutions can be restored by sensitizing the judiciary to distinctive issues related to infrastructure regulation and governance, and by exploring alternative dispute resolution mechanisms for resolving high-profile infrastructure contractual disputes. While discussing reforms of the judiciary is beyond the scope of this study, in
the short term, making the judiciary better aware of infrastructure regulatory issues (and the appro-priate government roles in proceedings) can go a long way toward minimizing the judiciary’s current negative perceptions. A similar approach has been used in South Asia where the judiciary and infra-structure regulators were brought together to better understand each other’s roles and responsibilities (box 2.6).
WorldBankInfra.indb 29 12/6/2005 8:40:42 AM

�0 Philippines: Meeting Infrastructure Challenges
Endnotes1 Transparency International (www.transparency.org) rankings are
based on surveys completed by business people, academics, and risk analysts.
2 It should be recognized that corruption works both ways: while weak accountability of public institutions leads to poor gover-nance, weak accountability of private institutions also leads to poor governance.
3 World Bank. “World Business Environment Survey 2000.” Wash-ington, D.C.
4 Conducted from November 2003 to January 2004 (www.tag.org.ph/survey/default.htm).
5 Omar Azfar et al. 2000. “Decentralization and Governance: An Empirical Investigation of Public Service Delivery in the Philip-pines.” IRIS Center, University of Maryland, College Park.
6 Philippine Daily Inquirer. 2002. March 6. Manila.7 The former applies to bids for procurement of goods and infra-
structure projects, which entails lowest calculated prices. The latter applies to bids for consulting services, which entails evalu-ation of short-listed bidders’ experience, performance, quality of personnel, price, and methodology.
8 For example in telecoms, the advent of mobile telephony has improved services substantially across the world, while in elec-tricity, the introduction of combined-cycle generation plants has reduced fixed costs in power generation, lowering the minimum efficient scale for electricity production, and spurring new entry and further competition.
9 See chapter 7.10 The MWSS tariff was P8.56 per cubic meter at the time of priva-
tization. The bid for the east zone was P2.32 per cubic meter and that for the west zone P4.97 per cubic meter.
11 The Moroccan telecoms regulator resolved an interconnection dispute between Maroc Telecom (the fixed line incumbent) and Meditelecom (a mobile service provider) through international benchmarking and analysis of cost models used by the operators. A similar technique was used to settle an interconnection dispute in Botswana. Ioannis Kessides. 2004. Reforming Infrastructure. World Bank, Washington, D.C.
12 J. Gavino Jr. 1992. “A Critical Study of the Regulation of the Telephone Utility: Some Options for Policy Development”. Ph.D. dissertation, University of the Philippines; and Ramonette Serafica. 2002. “An Assessment of Infrastructure Policies,” in
Josef Yap, ed., The Philippines Beyond 2000: An Economic Assessment. Makati City: Philippine Institute for Development Studies.
13 There is a valid economic rationale for providing subsidies to the extent that the (socially desirable) objective of setting prices at marginal cost causes a natural monopoly to become unprofit-able. Thus, the government, through taxation, picks up the losses inherent in marginal-cost pricing.
14 There might be a public-good argument for subsidizing provi-sion of certain services. For example, provision of safe water and adequate sanitation and sewerage treatment has well-known public health benefits. Similarly, there may be external benefits arising from more education and a cleaner environment as a result of improved access to electricity.
15 National Statistics Office. 2000 Family Income and Expenditure Survey.
16 World Bank and Social Weather Stations. 2004. Privatization Survey. July. (See appendix 4, this document.)
17 L. Cleofas and J. Sy. 2004. “Face-off: Utility Sub-concessions and local private providers in Metro Manila.” Paper presented at Water Week, February. World Bank.
18 Arthur C. McIntosh. 2003. Asian Water Supplies: Reaching the Urban Poor. Manila: ADB.
19 Japan International Cooperation Agency (JICA). “The Devel-opment of the PPP Technique for the Metro Manila Urban Expressway Network.” 2003.
20 D.L. Guarino Jr., P.C. Cal, and H.S. Lidasan. 2001. “A Study into the Viability of Consolidating Bus Companies Operating in Metro Manila.” Journal of the Eastern Asia Society for Transpor-tation Studies, Vol. 4, No.1.
21 “Even children can stop corruption in infrastructure.” 2004. Phil-ippine Daily Inquirer, August 2.
22 A World Bank-supported community-driven development project, which uses many of the core elements of the Compre-hensive and Integrated Delivery of Social Services (CIDSS), a community development program.
23 “Women cited for checking graft in infra projects.” 2004. Philip-pine Daily Inquirer, June 24.
24 S. Coronel and L. Kalaw-Tirol, eds. 2002. Investigating Corrup-tion: A Do-It-Yourself Guide. Manila: Philippine Center for Inves-tigative Journalism.
WorldBankInfra.indb 30 12/6/2005 8:40:42 AM

Chapter 2 The Business Environment for Infrastructure �1
WorldBankInfra.indb 31 12/6/2005 8:40:42 AM

Gabriel M Covian/Getty Images
WorldBankInfra.indb 32 12/6/2005 8:40:53 AM

Chapter 3
Infrastructure Planning, Coordination, and Financing
Introduction
The public sector plays a vital role in the provision of infrastructure in four areas: providing services directly, facilitating services
provided by the private sector, policy planning and coordination, and ensuring adequate financing opportunities.
Despite moves in recent years toward priva-tization of infrastructure services, the Philippine government remains the major player in providing services directly in the power, water, road, and ports sectors. In the power sector, state-owned National Power Corporation (NPC) is the major generator, power purchaser, transmission provider, and system operator. Privatization of NPC assets is ongoing, though progress has been slower than planned under the Electric Power Industry Reform Act (EPIRA). In the water sector, 70% and 75% of the population in urban and rural areas, respectively, are served by public utilities—water districts and LGU-managed systems. In the road sector, the central government is the dominant provider through the Department of Public Works and Highways, with LGUs playing a secondary role.
Performance issues in the power, water, and road sectors, as discussed in chapter 1, suggest that public infrastructure service has not been satisfactory. Causes of the problems are primarily related to the poor business environment for infrastructure—the four Cs discussed in chapter 2.
The public sector’s role in facilitating services provided by the private sector will be discussed in detail in chapter 4. The present chapter therefore focuses on the role of the public sector in long-term planning and coordination at all levels of government, and in ensuring adequate financing opportunities.
The section after this introduction identifies and elaborates the reasons for the lack of planning and coordination, and the implications for infrastructure provision. It discusses why the Philippines needs better long-term institutional planning and coordination, and the related role of central and local governments. It identifies a “missing middle” in the provision of secondary or regional infrastructure. And it discusses the reasons why, even though the Philippines was one of the first countries in the region to decentralize, decentralization has not fully realized its potential in terms of local infrastructure provision.
The subsequent section discusses the need for mobilizing resources for infrastructure, and the shortcomings of the prevailing financing framework. It should be emphasized that even though resources may be mobilized via nonpublic channels, the respon-sibility for establishing such a framework remains in public hands.
The final section discusses suggested actions for the government to consider.
Infrastructure policy planning and coordination
Planning and coordination are critical for infra-structure developments, as required investments are often “lumpy” and capital intensive, involve many players, span over many years, and are inevitably political as they serve public needs. Visionary infrastructure strategies anticipate growth and the demand for infrastructure, or react rapidly and stra-tegically to constraints as they begin to emerge. As the East Asia experience has demonstrated (box 3.1), the challenges for planning and coordination are multiple:
WorldBankInfra.indb 33 12/6/2005 8:40:53 AM

�� Philippines: Meeting Infrastructure Challenges
Box 3.1Infrastructure Planning and Coordination in East Asia
The East Asia experience demon-strates compellingly the impor-
tance of planning and coordination in infrastructure development. The presence of strong central agencies to oversee and coordinate infrastructure development is a common feature of the region’s now-developed economies of Hong Kong, China; Japan; Republic of Korea; Singapore; and Taiwan, China and the most advanced developing economy—Malaysia.
Central coordination also played a very important role in China and Thailand and contributed to their rapid infrastructure development. In fact, their respective planning agencies enjoyed considerable
political influence in promoting infrastructure development at the central level and are focal points for interagency coordination in policy making and implemen-tation. As these economies priori-tized improving (or maintaining) competitiveness and attracting investment, they emphasized effi-ciency in project implementation and service delivery.
The planning and coordination mechanisms in East Asia evolved over time, with the transformation of the economic and political systems in each economy. Indo-nesia, for example, saw its planning apparatus largely dismantled during the transition from auto-
cratic technocracy to greater par-ticipation and decentralization. On the other hand, in China, though authority has been extensively decentralized to local levels, the center remains strong and has become more strategic and flexible; market forces are playing an increasingly important role. In Thailand, planning and coordi-nation have remained strong, even though there has been a shifting of the key planning responsibilities from technocrats to politicians.
Source: Asian Development Bank, Japan Bank for International Cooperation, and the World Bank. 2005. Connecting East Asia: A New Framework for Infrastructure. Manila, Tokyo, and Washington, D.C.
How to balance infrastructure investments with other development priorities? How to link planning and financing in order for plans to become a reality? How to coordinate different agencies involved in infrastructure development? How to coordinate activities in a market economy, where the location and timing of growth and demand are uncertain? How to plan and coordinate activities in a decen-tralized environment where local governments are mandated to provide local (and some regional) infrastructure services? How to plan and coordinate in a political envi-ronment where the political interests of various stakeholders are often in conflict with each other?
This section provides assessments of the Phil-ippines’ infrastructure planning and coordination at the national, regional, and local levels.
National infrastructure provision and issues of policy planning and coordination While the Philippines has a well-delineated infra-structure planning framework, a closer look at the framework, and a better understanding of actual experiences and practices on the ground, point to three main factors that constrain the efficiency
••••
•
•
of infrastructure planning and implementation, namely:
Lack of policy planning and coordination at the national levelWeak central oversight by the National Economic and Development Authority (NEDA) and the Department of Budget and Management (DBM), as well as insufficient coordination among infra-structure agencies Intensive political intrusion and subsequent constant shifting of priorities.
Boom-bust infrastructure cycles Figure 3.1 shows infrastructure expenditures by different entities over 1985–2002. The most obvious feature of spending over this period is the “boom-bust” cycle. Total infrastructure expenditures reached peaks in 1990, 1993, and 1998 but experienced sharp declines after each one. Private participation, concen-trated in energy (1993–1994) and telecommunications (1998), was largely responsible for these peaks. What is noticeable is that private investments in infrastructure were preceded by crises in power and water, with the government providing overly generous incentives in some cases for private participation to resolve them. The major efforts to provide or improve infrastructure seem to have been reactive responses to crisis, and not the result of effective long-term policy planning
••
•
WorldBankInfra.indb 34 12/6/2005 8:40:54 AM

Chapter 3 Infrastructure Planning, Coordination, and Financing ��
and coordination. The Build-Operate-Transfer (BOT) Law passed in 1990 was amended in 1994 to spur more private interest in power investments, while the National Water Crisis Act was passed in 1995 to provide the government with special powers to reorganize the water sector agencies, encourage greater private sector participation, and improve the overall institutional environment in the water sector. A major accomplishment arising from the latter Act was the privatization of the operation and management of water distribution and sewerage services in Metro Manila.
Infrastructure expenditures by the public sector, though not nearly as volatile as by the private sector, declined in the 10 years to 2002, with a particularly sharp decline in spending by government owned and controlled corporations (GOCCs), reflecting worsening performance by public utilities. Spending on infrastructure by LGUs also remained stagnant, despite a significant increase of revenue transfers to them since the enactment of the 1991 Local Government Code (LGC).
The boom-bust infrastructure cycle is reflective of the government’s failure to foster an integrated and well-coordinated infrastructure plan. This failure is exacerbated by the fact that there is little assurance that a current government’s infrastructure plan will be an integral part of a future government’s infrastructure plan because of the political oppor-tunism that lies at the core of the factors working against efficient infrastructure planning. In addition, infrastructure provision remains largely driven by
projects—given that most infrastructure agencies are motivated by the avail-ability of funding and the preferences of potential donors—rather than by the implementation of a well-thought-out infrastructure strategy.
Planning and coordination Policy planning and coordination differ across sectors according to how the infrastructure is financed. On the one hand, for infrastructure services that are provided free of charge and mainly rely on government funding, the annual budgeting process plays a critical role in development and investment planning. Resource allocation and efficiency are results of decisions that involve the president, the oversight agencies, the line agencies of government, and the two chambers of Congress. On the other hand,
infrastructure services provided by either GOCCs or private corporations, at least partially financed through user fees, rely on much less government budget support. They may involve government subsidies, which can be explicit, implicit, or contingent. The role of oversight agencies in such cases is quite different. In general, oversight agencies are not consulted unless the government corporations borrow and require sovereign guarantees or enter into BOT contracts (or their variants) with the private sector. More important roles are played by the boards of these corporations, as well as their regulators, than when infrastructure services are provided free of charge.
NEDA is the main government agency responsible for the formulation of the country’s development plan and for providing executive advice on economic policy. NEDA takes overall charge of infrastructure planning, assisting the infrastructure agencies in identifying and prioritizing projects. Within NEDA, a committee of the NEDA board—the Infrastructure Committee (Infracom)—assumes oversight respon-sibilities for the infrastructure program of the government, and is responsible for preparing an integrated infrastructure program. The Investment Coordination Committee (ICC) of the NEDA board is the gatekeeper, recommending to the NEDA board projects for financing, particularly projects funded via BOT and official development assistance (ODA). The board of NEDA is chaired by the president, with a subset of the cabinet as members. The chair of the ICC is the secretary of finance.
Figure 3.1Infrastructure expenditures as a share of GDP
Perc
ent
0
2
4
6
8
10
LGUsNational governmentGOCCsTotal publicTotal privateTotal infrastructure
20022001
20001999
19981997
19961995
19941993
19921991
19901989
19881987
19861985
Year
Note: Infrastructure expenditures reflect capital outlays only.
GOCC = government owned and controlled corporation; LGU = local government unit.
Sources: Department of Budget and Management; Department of Finance; Commission on Audit; Maynilad Water Services, Inc.; Manila Water Corporation, Inc.; Optel Ltd.; World Bank.
WorldBankInfra.indb 35 12/6/2005 8:40:54 AM

�� Philippines: Meeting Infrastructure Challenges
The Medium-Term Philippine Development Plan (MTPDP) pronounces the country’s long-term devel-opment goals, and often coincides with the term of the presidency. The Medium-Term Public Investment Program (MTPIP) makes the MTPDP operational. In theory, the MTPDP and MTPIP provide the guidance and desired allocation of investment resources among sectors and regions. In reality, commitment to the MTPDP is prone to change during the course of its implementation, and the targets set by the MTPDP tend to be too ambitious.
A comparison of the results of the previous MTPDP with its targets shows that while several important targets were achieved or nearly achieved, many of the intended outcomes for infrastructure were not achieved, or at most partially achieved (table 3.1). The MTPIP process often translates into a mere wish list of projects and activities presented by sectoral agencies in the absence of well-coordinated and consistent infrastructure plans and in the face of hard budget constraints. Recently, the government has tried to rectify this by linking investment plans more closely to agency budgets and segregating the priority projects that fall within an agency’s budget ceiling from those that do not. It is also making efforts to shift from a sector-based MTPIP process to a thematic approach, forcing planners to prioritize along intra- and intersectoral lines.
In terms of project approval, in addition to the usual ICC process where proposed projects from agencies go through reviews by NEDA staff, the ICC technical board, and ICC cabinet level, oversight agencies can ask the entity submitting a project to undergo a sector effectiveness and efficiency review (SEER)1 process, and to adhere to the “scrap-and-build”2 policy applied to all government agencies. While the SEER process has helped government agencies in prioritizing their activities, in the absence of a more systematic and empirical basis for prioriti-zation, it can become a superficial exercise where an agency can easily justify the inclusion (or exclusion) of projects in its list of priorities.
Although the GOCCs and LGUs may have to coordinate with some line agencies, so as to, for example, obtain environmental clearance certificates in order to implement their respective projects, there is a lack of effective coordination in planning and guidance to ensure that regional and local infra-structure projects accord well with national priorities. Only those infrastructure projects that require a major capital outlay or funding support are evaluated for financial viability, social desirability, and budgetary
implications, by the ICC: GOCCs and LGUs are left on their own to make investment decisions on projects (other than those requiring major capital expenditure by the government).3
Linkages between budget and development plans The balancing of macroeconomic with long-term development objectives is the primary responsi-bility of NEDA’s Development Budget Coordinating Committee (DBCC), chaired by the secretary of DBM. Its other members are the secretary of finance, the governor of the central bank, and the director-general of NEDA and the executive secretary. The DBCC decides on the macroeconomic parameters that determine the size of the budget to be submitted to Congress. (Congress can change the allocations within the budget but cannot increase the total size of the budget.)
The annual budget process often results in discon-nection with the official development plans. The need to satisfy every legislator—as the budget has to be approved by Congress—spreads resources thinly, which means that low priority is given to investments that are critical to the entire infrastructure network. As a result, the budget process has become a division game that has a strong tendency to finance thousands of small projects and neglect investments that are required to increase the efficiency of the whole network. Local governments, for their part, in spite of the substantial allocation for development funds in the Internal Revenue Allotment (IRA), have also shown a tendency to have a short planning horizon, and rarely pool resources for projects that benefit several of them.
DBM is the main agency responsible for budgeting and finding the funding source for approved projects listed in the MTPDP, and, as part of public expen-diture management reforms, it began the agency performance review process. This evaluates three areas of infrastructure agencies: physical, financial, and income accomplishments. Under the physical component, DBM compares work targets vis-à-vis the works accomplished by the agency concerned. The agency is asked to explain any variance or deviation from the target. A similar process is followed for assessing financial and income accomplishments. DBM is also pursuing the implementation of the Orga-nization Performance Indicator Framework for budget allocation, with the intention of focusing on agency effectiveness and efficiency of service delivery. While some results are achieved through these methods, further improvement is needed to strengthen the way
WorldBankInfra.indb 36 12/6/2005 8:40:54 AM

Chapter 3 Infrastructure Planning, Coordination, and Financing ��
Table 3.1Selected key measurable targets under the Medium-Term Philippine Development Plan 2001–2004
SectorMTPDP 2001–2004
Actual2000 Actual 2004 Target
Roads
Paved share of national roads (%) 62 79 (as of end-2003)a 70
Lineal share of permanent bridges (%) 89 95 (as of end-2003)a 92
Expressways A total of 271 km of build-operate-transfer interurban roads: NLEX rehabilitation (widening of existing facilities), STAR 2, South Expressway (widening and extension to Lucena), and Subic-Clark-Tarlac Expressway
Only NLEX rehabilitation was implemented (83 kms)a
Power
Number of barangays served (%) 80.1 95 (as of July 2004)b 91.27
Installed generating capacity (MW) 13,196 15,479 (as of 2003)b 15,132
Energy self-sufficiency (%) 45 52 (as of 2003)b 53.9
Reduction of system losses (%) Decrease in loss to: Private utilities 9.5 Electricity 14.0
Average distribution system losses: Private utilities 10.67 Electricity cooperatives 15.08b
Effective implementation of power sector restructuring
• Retail competition and open access established no later than 2004
• Removal of cross subsidies
• Wholesale electricity spot market not implemented (as of February 2002)
• One-third of intraregional subsidy reduced (as of September 2002)b
Water
MWSS service areas (population served, million)
MWCI 2.5 6.0 (as of 2002)c 3.4
MWSI 3.4 8.4 (as of 2002)c 5.2
Legislative agenda • Clean Water Act• Water Regulatory Commission Act to establish
single agency for economic regulation of piped water supply and sewerage systems
• Amendment in Presidential Decree 198; seek increase LWUA capitalization
• Clean Water Act signed, March 22, 2004• EO 123 (2002) consolidated responsibility for
economic regulation for both water districts and LGU-managed systems in NWRB
• EO 279 (February 2004)—LWUA reform; focus on water districts that are unable to access private credit but have potential of becoming creditworthy
Telecommunications
Telephone density(installed) 9.05d
(subscribed) 3.72 12.73
As of 2002 (NTC):e
(installed) 8.7 (subscribed) 4.17
Ports
Modernization and privatization of ports
• Major port development projects to be pursued: Batangas Port Dev’t Project (Phase II), Southern Philippine Ports Development Package
• The Pan-Philippine Highway Ferry Terminals Privatization and the Western Seaboard Intermodal Transport Project
• Both projects pursued but suffered delays due to right-of-way problemsf
• Strong Republic Nautical Highway (Western Seaboard Intermodal Transport Project) launched in 2003g
EO = executive order; LGU = local government unit; LWUA = Local Water Utilities Administration; MTPDP = Medium-Term Philippine Development Plan; MW = megawatt; MWCI = Manila Water Company, Inc.; MWSI = Maynilad Water Services, Inc.; MWSS = Metropolitan Waterworks and Sewerage System; NLEX = North Luzon Expressway; NWRB = National Water Resources Board; NTC = National Telecommunications Commission.
Sources: a. Infrastructure Development, University of the Philippines 3rd Lecture Series 2004, presented by Department of Public Works and Highways. b. MTPDP 2004–2010. c. MWSS Regulatory Office Information Kit—based on official number of water service connections. d. Computed from MTPDP 2001–2004. e. NTC as cited in chapter 9. f. BusinessWorld. “Batangas port to meet capacity by 2008” (October 28, 2003) and http://www.ufs.ph/tinig/mayjun03/05060321.html. g. http://www.dotc.gov.ph/actioncenter/articles/march/articles_03312003.htm.
WorldBankInfra.indb 37 12/6/2005 8:40:54 AM

�� Philippines: Meeting Infrastructure Challenges
Table 3.2Funds for local infrastructure in Department of Public Works and Highways budget, 1997–2001 (P billion)
1997 1998 1999 2000 2001Total
1997–2001
Totala 49.05 38.25 42.65 42.33 48.96 221.24of which:
Congressional fundsb 14.17 3.04 6.83 8.10 17.56 49.70
Various infrastructure projects 13.68 2.84 0.32 8.10 17.29 42.23
Project Development Assistance Fund 0.00 0.00 0.00 0.00 0.27 0.27
Countrywide Development Fund 0.50 0.20 0.00 0.00 0.00 0.70
Rural/Urban Development Infrastructure Fund 0.00 0.00 5.36 0.00 0.00 5.36
Food Security Program Fund 0.00 0.00 1.14 0.00 0.00 1.14
Memo items Congressional funds to DPWH budget (%) 28.89 7.95 16.01 19.13 35.87 22.46
Congressional funds to LGU infrastructure investment (%)
198.47 51.83 89.23 85.36 197.01 127.24
DPWH = Department of Public Works and Highways; LGU = local government unit.
Sources: a. Basic data from DPWH. b. Estimates by Rosario G. Manasan. 2004. “Infrastructure and Decentralization.” May. World Bank, Manila.
in which performance of the line agencies is evaluated, the utilization of the performance review in budget preparation, and the monitoring and validation of agency accomplishments.
The oversight agencies have tried to make the budget process less myopic by introducing a multiyear expenditure framework. During hard times, however, when macroeconomic considerations take precedence over predictability of the size of future years’ budgets, both the line agencies and Congress have no incentive to use such a framework.
Political intervention Technocratic policymaking in the Philippines is not insulated from political influences. Because changes in political administration percolate through multiple tiers of the civil service, they reduce the likelihood of policy and program continuity and introduce instability of policies and infrastructure plans. Even priority projects are often delayed for indefinite periods or canceled altogether, according to the predilection of politicians. Political influence is also prevalent even without leadership or personnel changes. Efforts by legislators to insert pet projects into the infrastructure program of the government have resulted in fragmented utilization of scarce fiscal resources.
Another consequence of a personalistic political system is seen in discretionary congressional funds projects (also known as “pork barrel” projects) in which congressmen and senators are allocated budgets to choose pet projects. This system has little
accountability, further weakening infrastructure planning and coordination efforts of the government (table 3.2).4 Thus, some 22% of the DPWH budget in 1997–2001 was on account of local infrastructure projects, which were typically funded out of the pork barrel of legislators under various rubrics, such as the Project Development Assistance Fund, Countrywide Development Fund, Rural/Urban Development Infrastructure Fund, Food Security Program Fund, and various local infrastructure projects. (The use of discretionary congressional funds amounted to almost P18 billion, or 0.48% of GDP, in 2001.)
As discussed in chapter 2, politically motivated decisions also directly affect the financial stability and efficiency of agencies. For example, the order to limit the tariff increase that NPC could impose on its customers stymied the company’s efforts to set full-cost recovery tariffs, contributing to the already substantial NPC deficit. Thus, short-sighted political concerns sacrifice the long-term efficiency and viability of infrastructure provision.
A key result of political influence is the short time horizon. Policies and public choices are often driven either by narrow interest groups or by populism. Because of social divisions and high income inequality, reforms that require short-term pain are unlikely to be accepted unless there is already a crisis. National and local politics are both strongly influenced by narrow and well-organized constituencies, rent seeking, campaign finance, and the separation of powers among the three branches
WorldBankInfra.indb 38 12/6/2005 8:40:55 AM
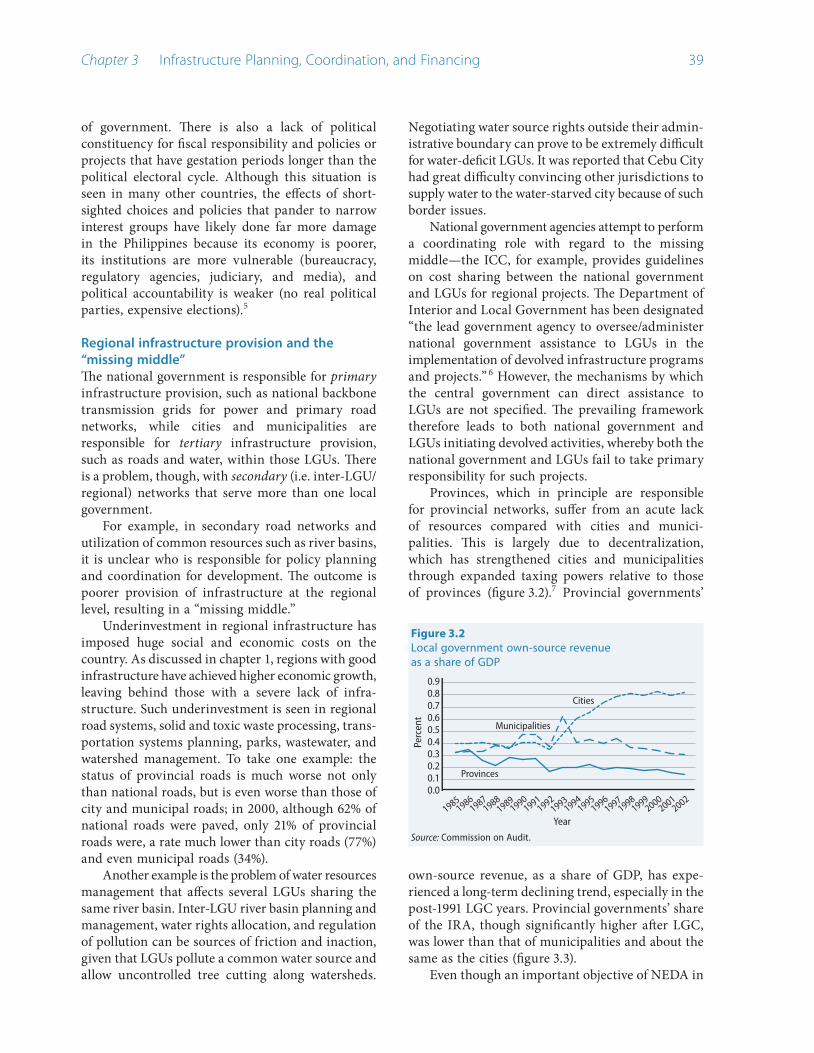
Chapter 3 Infrastructure Planning, Coordination, and Financing ��
of government. There is also a lack of political constituency for fiscal responsibility and policies or projects that have gestation periods longer than the political electoral cycle. Although this situation is seen in many other countries, the effects of short-sighted choices and policies that pander to narrow interest groups have likely done far more damage in the Philippines because its economy is poorer, its institutions are more vulnerable (bureaucracy, regulatory agencies, judiciary, and media), and political accountability is weaker (no real political parties, expensive elections).5
Regional infrastructure provision and the “missing middle”The national government is responsible for primary infrastructure provision, such as national backbone transmission grids for power and primary road networks, while cities and municipalities are responsible for tertiary infrastructure provision, such as roads and water, within those LGUs. There is a problem, though, with secondary (i.e. inter-LGU/regional) networks that serve more than one local government.
For example, in secondary road networks and utilization of common resources such as river basins, it is unclear who is responsible for policy planning and coordination for development. The outcome is poorer provision of infrastructure at the regional level, resulting in a “missing middle.”
Underinvestment in regional infrastructure has imposed huge social and economic costs on the country. As discussed in chapter 1, regions with good infrastructure have achieved higher economic growth, leaving behind those with a severe lack of infra-structure. Such underinvestment is seen in regional road systems, solid and toxic waste processing, trans-portation systems planning, parks, wastewater, and watershed management. To take one example: the status of provincial roads is much worse not only than national roads, but is even worse than those of city and municipal roads; in 2000, although 62% of national roads were paved, only 21% of provincial roads were, a rate much lower than city roads (77%) and even municipal roads (34%).
Another example is the problem of water resources management that affects several LGUs sharing the same river basin. Inter-LGU river basin planning and management, water rights allocation, and regulation of pollution can be sources of friction and inaction, given that LGUs pollute a common water source and allow uncontrolled tree cutting along watersheds.
Negotiating water source rights outside their admin-istrative boundary can prove to be extremely difficult for water-deficit LGUs. It was reported that Cebu City had great difficulty convincing other jurisdictions to supply water to the water-starved city because of such border issues.
National government agencies attempt to perform a coordinating role with regard to the missing middle—the ICC, for example, provides guidelines on cost sharing between the national government and LGUs for regional projects. The Department of Interior and Local Government has been designated “the lead government agency to oversee/administer national government assistance to LGUs in the implementation of devolved infrastructure programs and projects.” 6 However, the mechanisms by which the central government can direct assistance to LGUs are not specified. The prevailing framework therefore leads to both national government and LGUs initiating devolved activities, whereby both the national government and LGUs fail to take primary responsibility for such projects.
Provinces, which in principle are responsible for provincial networks, suffer from an acute lack of resources compared with cities and munici-palities. This is largely due to decentralization, which has strengthened cities and municipalities through expanded taxing powers relative to those of provinces (figure 3.2).7 Provincial governments’
own-source revenue, as a share of GDP, has expe-rienced a long-term declining trend, especially in the post-1991 LGC years. Provincial governments’ share of the IRA, though significantly higher after LGC, was lower than that of municipalities and about the same as the cities (figure 3.3).
Even though an important objective of NEDA in
Figure 3.2Local government own-source revenue as a share of GDP
Perc
ent
0.00.10.20.30.40.50.60.70.80.9
Cities
Municipalities
Provinces
20022001
20001999
19981997
19961995
19941993
19921991
19901989
19881987
19861985
Year
Source: Commission on Audit.
WorldBankInfra.indb 39 12/6/2005 8:40:55 AM

�0 Philippines: Meeting Infrastructure Challenges
implementing the MTPIP is to harmonize sectoral plans with “geographic strategies,” various geograph-ically focused attempts have failed. This is because the coordinating agencies that were set up to encourage integration at the local level had little control over budgets and resources, and no political influence over the agencies with direct control of resources. Regional development councils (RDCs), composed of local government officials, the directors of regional offices of the line agencies, and representatives of civil society, have the potential to coordinate and integrate local infrastructure plans and to link them with the country’s overall infrastructure plans as defined in the MTPDP.8 However, the majority of RDCs are weak and ineffective when it comes to infrastructure planning and coordination.9
Regionalization of the departments of the national government was much more successful in bringing public administration and the bureaucracy to the regions than it was for policy planning and coor-dination. Overall, fiscal resource allocation in the country has been heavily sector-based as opposed to region-based. While the sectoral departments have been regionalized, resource allocation decisions are still made in Manila and are much more responsive to the preferences of legislators (who have the power to approve or disapprove line agency budgets) than to the preferences of RDCs. Except for the Metro Manila Development Authority, RDCs have prac-tically no budget allocation and very little influence on the national budget. As a result, the planning of tax-financed infrastructure has always been plagued by the inability to take into account the fact that infrastructure investments, especially in transpor-tation, must be seen as part of a network. Cities and municipalities typically act in terms of their spatially bounded interests. Despite NEDA regional offices’
efforts (which act as a secretariat to RDCs) to commu-nicate regional and national plans to LGUs, LGUs, seldom, if ever, take into consideration the regional development plans formulated by RDCs.10
Local infrastructure provision and failure to maximize benefits of decentralizationThe decentralization and devolution under the 1991 LGC gave extensive powers to local governments in terms of service provision and delivery, revenue imposition and collection, and fund raising. In particular, LGUs were expected to develop local infra-structure given the growth-enhancing and poverty-reducing impacts of infrastructure. With the passage of the LGC, the expectation was that local autonomy would result in rapid development, particularly in nonurban and low-income areas. However, despite the LGC’s enabling policy and legal framework, growth in local infrastructure has been sluggish, if not stagnant, even though the Philippines was among the first countries in the region to decentralize.
Overall LGU expenditures as a share of GDP have doubled since decentralization but LGUs’ infrastructure expenditure share has remained largely unchanged. And even though total infra-structure investment of all LGUs combined grew by 8% annually between 1990 and 2001 (in real terms), the share of total LGU infrastructure spending to total LGU capital outlays stayed unchanged while their total capital outlays grew by 12.5%. Nonetheless, LGU infrastructure investment rose from 0.15% of GDP in 1985–1991 to 0.39% in 1992–2002 (table 3.3), though the expenditure level declined after 1995. Wide disparities are apparent across the various levels of local government, with cities spending more on infrastructure than the more cash-poor provinces and municipalities. In particular, while under the LGC the mandates of provincial and municipal governments in infrastructure provision have widened significantly, their actual investment level in infrastructure has declined when measured as a share of GDP.
This inadequate local infrastructure provision stems from the poor incentives facing local decision-makers, which have resulted from changes in the legal and institutional framework defining national-local relations in the post-LGC period. The poor incentives, in turn, are primarily due to the following factors: unclear LGC and lack of incentives for LGUs to mobilize their own resources; mismatches between revenue transfers and expenditure responsibilities; short termism inherent in the local political economy; and capacity constraints.
Figure 3.3Local government Internal Revenue Allotment transfers as a share of GDP
Perc
ent
0.0
0.2
0.4
0.6
0.8
1.0
1.2
Cities
Municipalities
Provinces
20022001
20001999
19981997
19961995
19941993
19921991
19901989
19881987
19861985
Year
Source: Commission on Audit.
WorldBankInfra.indb 40 12/6/2005 8:40:55 AM

Chapter 3 Infrastructure Planning, Coordination, and Financing �1
Unclear LGC and lack of incentives to raise own resources At first regard, Section 17(b) of the LGC clearly delineates functions across levels of government, except perhaps in the area of environment and natural resource management.11 However, Section 17(c) allows national government agencies to continue to implement devolved public works and infra-structure projects as well as other facilities, programs, and services provided that these are “funded by the national government under the annual General Appropriations Act, other special laws, pertinent executive orders, and those wholly or partially funded from foreign sources.”
In line with this, Executive Order 53 mandates national government agencies to retain management control over all foreign-assisted projects and/or nationally funded projects even if they involve devolved activities. Unfortunately, the LGC and its implementing rules and regulations do not define the mechanism through which the national government can direct assistance to LGUs under Section 17(f), which allows the central government or the next
higher level of government from the LGU to “provide or augment the basic services and facilities assigned to a lower level of local government unit when such services or facilities are not made available or, if made available, are inadequate to meet the requirements of its inhabitants.” The prevailing practice has effec-tively permitted the existence of a two-track delivery system where both national government agencies and LGUs can initiate devolved activities.12 The ill-effects of this system are illustrated by a recent incident of a frustrated attempt of two LGUs to invest in their own port (funded by own resources) because of the opposition of another government body that is supposed to be in charge of port development in the area concerned (box 3.2).
Mismatch between revenue transfers and expenditure responsibilities There is a mismatch between the revenue means and expenditure needs of various levels of local government. Under the LGC, most of the revenue-productive taxes are reserved for the national
The Daan Bantayan municipality and the Cebu provincial gov-
ernment are constructing a wharf in Barangay Maya, Daan Bantayan. The wharf will serve as a jumping-off point for Malapascua island, a small resort island off the coast of Daan Bantayan. Malapascua island is frequented by British tourists and is envisaged by local officials for development into a world-class resort in the same league as Boracay island. The wharf is also
expected to improve transport ser-vices between Malapascua island and Cebu mainland.
The Cebu Port Authority (CPA) has asked the Cebu regional trial court to stop the construction of the P15 million wharf over juris-dictional issues. According to the general manager of CPA, “under its charter only CPA has the sole authority to manage, administer, operate, maintain, improve and develop port activities within its
territorial jurisdiction.” Any port development in Cebu should have prior written approval from CPA, according to the general manager. CPA has asked for P250,000 in damages and litigation expenses.
For his part, the Cebu governor invokes the Local Government Code, which he said empowers local government units to construct municipal ports.Source: BusinessWorld. January 26, 2004. Manila.
Box 3.2 Cebu Port Authority seeks halt to project by local government unit
Table 3.3Local government infrastructure investment as a share of GDP, 1985–2002 (%)
1985–1991 1993–2002 1990 1995 2000 2002
All LGUs 0.15 0.39 0.17 0.36 0.34 0.23Provinces 0.05 0.07 0.06 0.05 0.07 0.04
Municipalities 0.04 0.08 0.06 0.08 0.06 0.04
Cities 0.05 0.24 0.05 0.23 0.21 0.15
LGU = local government unit.
Note: Mostly based on the estimates of Rosario G. Manasan. 2004. “Infrastructure and Decentralization.” May. World Bank, Manila; water sector figures adjusted to include 4% of the Local Development Fund based on eight sample LGUs.
Source of basic data: Commission on Audit.
WorldBankInfra.indb 41 12/6/2005 8:40:55 AM

�� Philippines: Meeting Infrastructure Challenges
government and are off limits to LGUs. Most of the 11 different taxes that LGUs are authorized to levy have narrow bases and limited yield prospects, with the exception of the real property tax and the local business tax. The LGC also limits LGUs’ power to set local tax rates.
Mismatches between assignment of revenues and of expenditures for all LGUs in the aggregate and across different levels of local government are compensated for by the mandated increase in the share of LGUs in national taxes (the IRA).13 The contribution of the IRA to total LGU income in the aggregate surged from 36% in 1985–1991 to 63% in 1999–2002 for all LGUs combined (table 3.4).
The IRA distribution formula is based on factors such as land area, population, and equity (rather than performance-based indicators). The formula cannot match the revenue transfers with the expenditure responsibilities devolved to the different LGUs. Therefore, while the increase in the IRA share of some LGUs is too small to finance the devolved functions (particularly provinces), other LGUs (particularly cities) have received resources beyond their requirements. Lack of concrete performance-based measures has resulted in many LGUs failing to fully utilize their revenue-raising authority, partly due to the disincentivizing effect of the IRA distri-bution formula. The adverse effects of the fiscal gap at the local level is even more pronounced in the infrastructure sector since the propensity (if not the ability) of LGUs to finance devolved activities is more constrained in this sector. This occurs because LGUs are left with no choice but to pay the salaries of devolved personnel in the other sectors.
In terms of grant support to LGUs, matching grants are an important instrument in any inter-governmental fiscal transfer system for achieving efficiency and equity. However, the government’s policy on grants to LGUs has been seriously
Table 3.4Internal Revenue Allotment as a share of local government income
Period All local government units (%)
1991 39.81995 61.92000 64.52002 66.2
Average1985–1991 36.41992–2002 62.5
Source of basic data: Commission on Audit.
hampered by inconsistency in implementation. A cost-sharing scheme was developed in 1998 and used by some ODA-financed projects, but was not enforced consistently. Most of the programs still transfer funds to LGUs on a pure grant basis, while those funds channeled through the government financial institutions (GFIs) are on a pure loan basis. Existing grant programs, channeled through various sector departments, tend to be fragmented, with a multitude of allocation criteria even within a sector. There is very little performance incentive in the grants, and almost nothing for overall LGU governance improvement.
The government has recognized the issue and has already taken important steps to address it. A new financing mix for devolved functions was estab-lished in 2002, which tightened the use of grants and covered a wider scope of LGU functions. Facing an extremely serious fiscal situation, the government is in the process of further tightening the matching grant framework.
Short termism inherent in local political economy The local political economy creates a disincentive to put in place long-term, multiyear infrastructure projects, because of the three-year political tenure of elected local government officials and the risk that the succeeding administration might not support those projects to completion.14 Budgeting and proper management of local infrastructure projects remain weak. The lack of accountability engendered by inadequate revenue and tax decentralization, together with the short period of office, create poor incentives for planning and budgeting. Thus, governors and mayors tend to have short-term planning horizons with concomitant adverse effects on LGU infra-structure investment.15
In addition, the short-term tenure of local officials often leads to their choosing questionable development priorities. While there are indeed LGUs with local executives who are more appre-ciative of the critical role of infrastructure in local development, there are others who devote their 20% IRA allocation toward, for example, building more basketball courts, launching barangay beautification projects, and engaging in other similar projects that are reported as “development projects” but that do not necessarily contribute to local development. The short period of local chief executives also creates poor incentives for raising local revenues, with many LGUs continuing to depend on IRA transfers from the national government.
WorldBankInfra.indb 42 12/6/2005 8:40:56 AM

Chapter 3 Infrastructure Planning, Coordination, and Financing ��
Short termism at the local level, in conjunction with the politicization of local development plans, severely hampers proper planning and implemen-tation of infrastructure projects. LGUs typically prepare a local development plan (LDP) with a local development investment plan (LDIP). The LDIP is a multiyear listing of programs and projects with cost estimates and sources of financing, and is the trans-lation of the policies and strategies laid out in the LDP into specific programs and projects. In this context, an annual investment plan (AIP), the current-year slice of the LDIP, is then prepared.
However, in most cases the preparation of the AIP is a “political” process, and is done indepen-dently of the LDP and LDIP. The programs and projects in the AIP, therefore, bear little resemblance to those in the LDP and LDIP.16 Closer scrutiny of the LDPs, the LDIPs, and the AIPs in five sample provinces shows that there is an imperfect match between the projects listed in the LDPs/LDIPs, on the one hand, and those listed in the AIPs, on the other.17 Of these five provinces, the share of the projects listed in the 2002 provincial AIP that can be found in its LDP ranged from a high of 61% to a low of 4% in one province, highlighting the irrelevance of the LDP in preparing the AIP. A big gap, therefore, exists between plan formulation and implementation.
Capacity constraintsWhen, under dynamic local leadership or local public pressure, LGUs do adopt a progressive development agenda, including that for infrastructure, they are often seriously constrained in their capacity to plan, prepare, and implement the programs. Many LGU infrastructure projects, for instance, suffer from slow implementation, as LGUs find it difficult to produce the needed feasibility studies, detailed designs, and bidding documents, or to secure the capacity to supervise construction and maintain assets once they are built.
Much sector expertise still lies with the central government’s line agencies, instead of being decen-tralized to LGUs. The issue is further complicated by the fragmented nature of the local government system in the Philippines, where the size of LGUs is quite small, making it difficult for them to attract and retain relevant expertise. In addition, the different capacity assistance programs to LGUs through various line agencies and international development partners suffer from a lack of coordi-nation and synergy.
Infrastructure financing
The combination of high population growth, rapid urbanization, and the continued need for development in rural areas where the majority of the poor live implies a substantial demand for both current and future infrastructure in the Philippines. The question facing the government is where the resources will come from, both for maintenance of existing infra-structure and for new investments. On the basis of 2002 expenditures on infrastructure of 2.8% of GDP, and an average 5% benchmark, a financing gap in the order of over 2% of GDP is indicated.
Four main sources of raising finance for infra-structure development are: reinvesting user charges (for both public and private utilities); government financing (at national and subnational levels); raising funds in financial markets (domestic and interna-tional, debt and equity); and external ODA.
User charges User charges are typically the main source of much infrastructure financing in the Philippines. In the mature, private utilities, internally generated funds can account for around 70% of funds for investment. However, as chapter 2 indicates, user charges are below cost recovery for most public utilities.
In addition to generating financing directly, adequate user charges also establish the “funda-mentals” of a financially viable project that private investors will be willing to finance—a predictable stream of cash flow. A stronger commitment to appropriate levels of user charges reduces uncertainty about future cash flow, therefore also lowering the return on capital that a private investor would require for a particular project.
Government financing At the national level, overall public finances are very weak. Nonfinancial public sector debt as a share of GDP, at around 100% in 2004, is already very high. Interest payments alone are close to 30% of total expenditures, and any rapid increase in debt financing would only exacerbate the problem. The government has determined to accelerate fiscal adjustment and achieve a balanced budget by 2009. Overall, however, there is extremely limited fiscal space for increasing national government financing for infrastructure over the next few years.
At the subnational level, the overall financial position of LGUs remains weak. As figure 3.4 indicates, LGUs have generally run surpluses in their
WorldBankInfra.indb 43 12/6/2005 8:40:56 AM

�� Philippines: Meeting Infrastructure Challenges
operations,18 but these have remained low and stable at best. Moreover, as figure 3.5 shows, the bulk of the receipts are transfers from the national government in the form of the IRA, which makes up nearly two-thirds of LGUs’ total income. LGUs’ own revenue (outside the IRA) has, however, remained constant at around 1.5% of GDP, despite much expanded revenue collection authority assigned to LGUs under the LGC. Not many LGUs (fewer than 40%) have revised their local tax codes since 1992, although the rate of some local taxes is not indexed to inflation. Conse-quently, revenues from these taxes are continually being eroded. Many provinces and cities (some 60%) have undertaken a general revision of the schedule of market values of real property only once since 1991, thus resulting in declining collections in real terms.19 Real property tax collection efficiency of all
LGUs declined from 58% in 1989–1991 to 55% in 1992–2000. The continued low own-resource mobili-zation effort leaves limited room for LGUs to expand infrastructure investments from their own income.
Raising funds in financial marketsThe Philippines’ financial market is largely in private hands and commercial rate-of-return considerations dominate lending decisions. The infrastructure sector has to compete with other sectors for the hearts and wallets of private lenders. Private lenders will lend to private borrowers in those sectors and activities where returns are attractive on a risk-adjusted basis. For many of the reasons cited elsewhere in this report (such as price controls, regulatory uncertainty, uncertain commercial demand, and political and social unwillingness to accept free and unfettered pricing flexibility) the risk-return trade-off does not favor infrastructure investments. Thus, the current exposure to the infrastructure sector (excluding commercial real estate) is less than 7% of the P2 trillion of outstanding gross loans (as of March 2004).20 A significant increase in the share of infrastructure loans is unlikely because it takes time to build up confidence in the sector, establish relationships, develop project appraisal skills, and acquire familiarity with the sector.
The banking sector (i.e. universal and commercial banks, thrift banks, and rural banks), which dominates the domestic financial system, offers limited possibilities for infrastructure financing.21 This is because the need to restructure balance sheets has made banks risk averse and has imposed limits on acquisition of additional risk assets. Capital-adequacy constraints—caused by high degrees of nonperforming loans (NPLs), at 16% of outstanding loans, and nonperforming assets, at 13% of gross assets, as well as inadequate provisioning, at 51% for NPLs and 31% for real and other properties owned and acquired—make it unlikely that the banks will seek new lending opportunities, especially in the relatively more risky infrastructure sector. In fact, real growth of credit in the banking system was less than 1% in 2002 and 2003.
The ability of any single bank to fund large private infrastructure projects is limited by prudential exposure limits and by the small size of its capital base. Consortium lending is an uncommon feature because of a lack of standardization among lenders in loan documentation and preference for lending mainly to entities within the conglomerate (leading to unwill-ingness to share information with lenders outside the
Figure 3.4Local government current operations as a share of GDP, 1985–2001
Perc
ent
-0.50.00.51.01.52.02.53.03.54.04.5
Excess (deficit) of income over expenditures Expenditures Income and receipts
20011997199319891985Year
Note: Excludes transfers and surplus adjustments.
Source: Commission on Audit.
Figure 3.5Local government revenues as a share of GDP, 1985–2002
Perc
ent
0.00.51.01.52.02.53.03.54.04.5
Nontax revenuesOther tax revenuesProperty taxesIRA
20022001
20001999
19981997
19961995
19941993
19921991
19901989
19881987
19861985
Year
Note: Excluding extraordinary receipts.
Source: Commission on Audit.
WorldBankInfra.indb 44 12/6/2005 8:40:56 AM

Chapter 3 Infrastructure Planning, Coordination, and Financing ��
conglomerate). Moreover, the narrow depositor base limits scope for long-term infrastructure lending since banks have to hold a significant portion of their assets in relatively liquid and short-term assets.22 Banks’ ability in term transformation is constrained by the lack of exit options for their loans via debt markets. In terms of portfolio exposure, banks are already significant financiers to the public sector—domestic currency claims on the government and nonfinancial sector account for about 30% of total assets of deposit money banks.
Capacity and enforcement issues are also restricting bank lending to the infrastructure sector. There is a capacity constraint within the economy and in the public sector to identify and develop a pipeline of commercially viable projects. Skills in project appraisal and project risk analysis in most banks are also limited. Banks are used to lending on a short-term basis against familiar forms of collateral, and are ill-prepared for undertaking cash-flow and business risk analysis, especially in complicated infra-structure operating structures. Banks would need to be supported by specialized investment banking and risk management services. A cumbersome loan-enforcement regime, in which it would take three to four years to enforce security interests or push through restructuring and reorganization, further limits bank lending for infrastructure.
The nonbank financial sector—accounting for approximately 18% of financial system resources—is small, parts of it are underperforming and, at least in the short to medium term, it cannot grow rapidly enough to support a high level of infrastructure financing.23
While pension funds and the insurance companies have increased their investable funds at a compound annual growth rate of about 10–15% during the last few years, various structural and performance features limit the extent to which they can deploy these funds into infrastructure. For example, pension funds are limited by law with regard to investments in private long-term bonds, loans, and equities. Thus, the amount of incremental funds available from the pension funds for allocation to the infrastructure sector is likely to be small. Pension funds such as the Government Service Insurance System and the Social Security System also face problems of unfunded liabilities, high levels of NPLs from members, and uncertain and poor investment returns. In the case of insurance companies, their portfolio composition is unlikely to change significantly in the medium term, and incremental resources available for private
infrastructure projects from the insurance sector are likely to be limited.
Other sources of institutional funds such as mutual funds, company pension programs, and common trust funds are still small. They are privately owned and are often parts of conglomerates. Data on these institutions are limited but indications are that they are not inclined toward infrastructure projects; they prefer investing in government bonds or equities, or extending loans to companies in the conglomerate.
The domestic bond market, though of a significant size,24 is overwhelmingly dominated by government bond issuances. Government bonds account for more than 95% of the outstanding stock of bonds; corporate and infrastructure bond issuances are rare. Moreover, 60% of outstanding government bonds have a tenor of less than four years, 34% have a tenor of between five and 10 years, and fewer than 6% are over 10 years. The main reasons for the bleak prospects for issuance of corporate bonds to finance infrastructure projects are high rates on government paper (which tends to make issuances by other entities more expensive) and high issuance costs (as much as 5% of the issue amount).
The Philippines is an active issuer in interna-tional bond markets, and investors are familiar with paper from the Philippines. But this advantage of experience and familiarity is being eroded by investor concerns over the fiscal situation. The government cost of borrowing overseas is increasing and debt service considerations will limit the extent to which it can raise external resources for infrastructure investments. Access to foreign debt finance is thus likely to be constrained and costly because of sub-investment grade rating and concerns over sovereign debt default risk.
Equity markets have not been very active in supplying risk capital to infrastructure.25 Noninfra-structure companies in the banking, real estate, and food and beverage sectors dominate the exchange. Within infrastructure, until recently only the telecoms companies and Meralco had been successful in raising capital from the equity markets, though one recent notable development was the successful listing of MWCI on the Philippine Stock Exchange on March 18, 2005. While this represents a very encouraging movement, overall it is unlikely in the medium term that equity markets will become of a sufficient size and credibility to enable infrastructure companies to mobilize resources in large amounts.
In terms of actual fund raising from the financial
WorldBankInfra.indb 45 12/6/2005 8:40:57 AM

�� Philippines: Meeting Infrastructure Challenges
market for infrastructure, the ability of the national government is seriously constrained because of the high debt level and fiscal deficits. For their part, local governments have so far done very poorly in accessing financing from the market. LGU borrowing made up less than 4% of their income during 1992–2002. LGUs’ low level of access to financing is partly due to the difficulty with such access, attributable to various factors including: low capacity in investment planning and project preparation; lack of partici-pation by private financial institutions; lack of reliable information about LGU financial situations; and cumbersome procedures of GFIs. (More details on the status of the situation of LGU access to financing are presented in appendix 3.)
External official development assistance As table 3.5 shows, the bulk of external ODA is
channeled into infrastructure, which had received 110 loans with an aggregate commitment of $6.9 billion or 69% of the total ODA loans portfolio as of December 2003.26 Within infrastructure, transportation was the largest recipient, followed by water resources, and energy, power, and electrification. Disbursement from the infrastructure portfolio was $630 million in 2003, up from $606 million a year earlier. ODA plays a very important part in infrastructure financing. In 2003, annual ODA disbursements for infrastructure projects implemented by national government agencies constituted 37% of national government capital expenditure on infrastructure, and ODA-funded projects implemented by GOCCs accounted for about 39% of GOCC capital expenditure on infrastructure.
ODA commitments, however, decreased over 2001–2003, from a peak of $13.3 billion in 2000. The key issue facing ODA project implementation in the last few years has been the lack of budget cover. This is required not just for counterpart funding, but also for loan proceeds of ODA projects of national government agencies. With fiscal tightening, budget allocation for projects is often insufficient to cover the planned expenditures. Other problems include procurement delays,27 right-of-way acquisition and resettlement, and slow processing with LGU relending facilities.
Suggested actions
The government faces a challenging policy and insti-tutional reform agenda, and to tackle the acute lack of infrastructure the following actions on planning and coordination, and on mobilizing financing for infrastructure, can be taken up.
Improving policy planning and coordination Strengthen and reorient central agencies, such as NEDA, Department of Finance, DBM, and inter-departmental committees such as Infracom, ICC, and DBCC, to improve long-term planning, prior-itization, and monitoring of national government resources. The focus of oversight responsibilities can shift from a detailed project-level approval process to a broader and more forward-looking role for reform championship, strategy formu-lation, and policymaking. The oversight agencies can play the critical role of champions of sector reforms, as the reform initiatives in specific sectors may be hampered by fragmentation,
•
Table 3.5Distribution of official development assistance commitments, December 2003
Sector/Subsector No. of loansCommitments
$ million %
Agriculture, agrarian reform, and natural resources
41 1,753 17.3
Agriculture and agrarian reform
34 1,465 14.5
Environment and natural resources
7 288 2.8
Industry and services 3 498 4.9
Infrastructure 110 6,941 68.5
Communications 2 41 0.4
Energy, power, and electrification
13 781 7.7
Social infrastructure 12 276 2.7
Solid waste management 1 17 0.16
Transportation 57 4,896 48.3
Water resources 25 930 9.2
Social reform and development
30 937 9.3
Education and manpower development
11 393 3.9
Health, population, and nutrition
6 74 0.7
Social welfare and community development
10 248 2.5
General social 3 222 2.2
Total 184 10,130 100.0
Note: Projects only, does not include program loans. Exchange rate used: $1 = Y118.
Source: National Economic and Development Authority project monitoring staff.
WorldBankInfra.indb 46 12/6/2005 8:40:57 AM
Chapter 3 Infrastructure Planning, Coordination, and Financing ��
vested interests, or inertia. It therefore falls to the oversight agencies to proactively initiate, promote, prioritize, and monitor systemic reforms. It is also their role to focus on important policy issues that cut across the various infrastructure sectors (e.g. subsidy policies, guarantee framework, inter-governmental cost-sharing policies) to guide the decisionmaking process for specific projects and transactions. Clear pronouncement of such important policy issues will help facilitate the development process of specific projects and reduce uncertainty. To ensure coordinated planning, all agencies should be subjected to a rigorous performance review process, which in fact the government has already initiated. Similarly, there may be a need to include in the annual budget call of DBM a statement that the government will fund only projects that undergo performance reviews. The oversight agencies, line agencies, and Congress need to agree on how the performance of the line agencies should be evaluated and how the review of performance will be used to prepare the budget.
Ensure extensive stakeholder participation during the strategy development and planning process. Responsibility for planning goes far beyond technocrats, and wide public participation is critical both to reflect the concerns and issues that can be easily neglected by “planners” and to ensure that the final documents represent the views and commitments by the broad population and stakeholders. This would in turn establish greater legitimacy of these plans and enable them to better withstand short-term intervention. More extensive stakeholder participation will also help insulate the decisionmakers from undue political pressures. Such a procedure should be applied at both the national and local levels. There may be a need for national and local development strat-egies and plans to be debated and approved by the corresponding legislative bodies.
Reduce excessive political intervention by insulating technocratic decisionmaking from undue political influences for short-term gains. Measures may include strengthening technical capacity at infrastructure agencies to better withstand external, politically motivated influ-ences; corporatizing certain services to reduce political interference; and establishing auton-omous regulatory agencies in other sectors.
•
•
Ultimately, resisting excessive political inter-vention will require strong political will and leadership. At the local level, issues such as extending the short three-year tenure of local elected officials are difficult political-economy issues, and are unlikely to be resolved in the short term. However, specific steps, for example reviewing and amending the way discretionary congressional funds (the pork barrel funds) are currently used, should be taken to better align funding usage with local and regional devel-opment plans and priorities. Better coordination and understanding between the executive and legislative branches of national and regional priorities, as well as vigilance by civil society and other interest groups, may also help reduce short termism in projects and activities.
Provide means and incentives for RDCs both to coordinate more effectively with LGUs and to reflect LGU priorities in their plans (and vice versa). At the minimum, RDCs can participate more actively in the agency budget development process, which DBM started to promote during the 2005 budget cycle. In addition, funding can be earmarked for interjurisdictional infrastructure development where RDCs make decisions on funding usage based on agreed principles spec-ified by the national government. Higher priority could be given to provinces in the intergovern-mental fiscal transfer system, as this is the level with the most serious imbalance between revenue and expenditure responsibilities. As box 3.3 shows, interjurisdictional cooperation can be achieved, usually under energetic local leaders. Such efforts need to be recognized and promoted more systematically.
Resolve ambiguities in the 1991 LGC, which currently allows for a two-track delivery system at the local level whereby both central agencies and LGUs can initiate devolved activities, but with neither being fully accountable. The national government can review the implemen-tation process of decentralizing government functions to the local level; and, when the func-tions are to be devolved, the national government agencies should have a clear timetable in with-drawing from actual implementation and instead reorient themselves to focusing on providing technical assistance to LGUs in fulfilling their mandates.
•
•
WorldBankInfra.indb 47 12/6/2005 8:40:57 AM

�� Philippines: Meeting Infrastructure Challenges
Develop and more effectively utilize instruments, such as matching grants and subsidies as well as performance incentives, to implement plans and achieve better coordination between national government and local infrastructure in a decentralized and market-driven envi-ronment. Matching grants can be used to provide an appropriate incentive structure to elicit consistent and well-coordinated infra-structure plans from the infrastructure agencies, including GOCCs and LGUs. In addition, a commonly accepted national performance assessment system to facilitate benchmarking for comparing performances across LGUs—as the basis for national government support, matching grants, and subsidies, especially for provinces—can be developed. The planning-budgeting-accountability linkages can also be enhanced by strengthening the performance budgeting process.
Provide targeted technical assistance to LGUs in infrastructure project development and imple-mentation. The difficulties faced in the implemen-tation of the numerous LGU lending operations by both GFIs and the Municipal Development Fund Office demonstrate the importance of enhancing the capacity of LGUs in infrastructure project planning, preparation, and implemen-tation. If the demand side of LGU financing is weak, any improvement of efficiency in funding supply will have little impact. An LGU project development facility needs to be established, which will help LGUs develop project ideas into implementation packages, including assistance on feasibility studies, procurement planning, and other implementation requirements. This facility should also help LGUs tap private sector invest-
•
•
ments whenever feasible. One such example is the Municipal Infrastructure Investment Unit in South Africa (box 3.4). In addition, LGUs need to be assisted in their strategic planning process, which should provide the basis for their infra-structure development activities.
Enhancing financial mobilization Allow increases in user charges to ensure commercial viability of infrastructure projects. As discussed in chapter 2, cost recovery is key, and establishing a tariff level that allows a reasonable, risk-adjusted rate of return for infra-structure projects is fundamental for attracting financing. If infrastructure cannot offer project yields comparable to those attainable in other sectors, voluntary lending will be limited. The more the government clarifies sector policy, supported by credible regulatory regimes that allow prices to be set at levels covering investors’ costs (including the cost of capital) through a transparent and credible process, the more likely are financial market players to accept financing risks in infrastructure projects instead of seeking credit enhancements from the government. The public, likewise, should be informed and educated on why user charges should be on a cost-recovery basis. (These issues are covered in more detail in chapter 2.) At the intersection of general tax and user charges are targeted or earmarked tax schemes where taxpayers will be able to see the impact of additional tax payments more directly. Such schemes include, for example: fuel and motor vehicle registration tax increases that are chan-neled through a special fund for road mainte-nance and expansion, which will directly benefit taxpayers through lower vehicle operating costs
•
Box 3.3A successful example of interjurisdictional cooperation
The construction of a circum-ferential road for Cabanatuan
City and adjacent municipalities is a good example of cooperation in investment planning and project implementation among LGUs. Cabanatuan City entered into a memorandum of agreement with the municipalities of San Leonardo and Santa Rosa to define their
respective contributions and obli-gations with regard to the project. The toll road, financed by contri-butions from LGUs, is expected to generate revenues once it is operational.
The interjurisdictional coop-eration benefited from the strong leadership exhibited by the local chief executives in the three LGUs
and from their understanding of the positive externality generated by a cooperative approach to solving the problem of rising urban congestion and traffic jams.
Sources: World Bank. 2004. “East Asia: Decentralization of Basic Services.” December; Consultant’s field interview, 2004.
WorldBankInfra.indb 48 12/6/2005 8:40:58 AM

Chapter 3 Infrastructure Planning, Coordination, and Financing ��
Box 3.4Municipal Infrastructure Investment Unit, South Africa
and reduced travel time; a special tax for urban areas, such as Metro Manila, for investment in improving urban transportation; a development impact fee that can be charged by LGUs to reflect the cost of providing additional infrastructure for new developments; and adjustments in real property assessment values (and therefore property tax) immediately following major infrastructure improvements in the area. These taxes have many features of a user fee. Once the government can credibly demonstrate that the additional taxes lead to infrastructure and service improvements, collecting such taxes will be less difficult to justify politically.
Implement a vigorous and credible fiscal reform program. A sustained period of credible fiscal reforms, in particular increasing tax revenues, will persuade financial market participants to step up investments. Accelerated turnaround in the fiscal situation will not only enable higher government spending on infrastructure; equally important, it will lower the cost of financing for
•
all borrowers and improve the overall business environment. Fiscal reform efforts will therefore have high payoffs.
Strengthen the financial markets for longer-term infrastructure financing. From the perspective of providing longer-term financing for infrastructure development, key reform areas include:
(a) Strengthening the banking system. For the foreseeable future, banks will continue to dominate the financial system. They have been risk averse because of a legacy of bad debts and easy earnings via government bond investments. They also need to increase their capital base. Unfortunately they have not faced sufficient regulatory or competitive pressures to address their problems. The good news is that the actions required for establishing a competitive and strong banking system and for restoring intermediation capabilities have been extensively researched and documented. The challenge is quick implementation.
•
Twenty percent of South Africa’s population have no access to
water and nearly 50% have no proper sanitation facilities. Local own-source revenues and inter-governmental grants are already insufficient to meet development goals, and private banks can rarely provide affordable loans to munici-palities. The lack of borrowing capacity among municipalities greatly constrains them from putting up capital for infrastructure such as water and sanitation systems. Private sector participation in infrastructure services is one avenue for filling the infrastructure gap. However, an established market of informed local authority clients, private sector advisors, investors, and service providers is undeveloped, if not absent.
Recognizing these shortcomings in municipal financing and local authorities’ capacity to deal with the private sector investors, the government set up the Municipal
Infrastructure Investment Unit (MIIU) in 1998 to facilitate access by municipalities to private sector investment. Initially, MIIU was envisaged as a five-year inter-vention to develop a market for technical assistance for project preparation in municipal infra-structure and services, and to encourage and optimize private sector investment at the local level, though subsequently its lifespan was extended by the government until 2006. Staffed by South African and international experts, MIIU is specifically mandated to:
Provide technical assistance and grant funds to municipalities in the preparation of service delivery solutions involving municipal service partner-ships (from conception to implementation).Assist municipalities in carrying out on-balance sheet borrowing and project finance.
•
•
Assist local authorities in the process of hiring private sector consultants, where necessary.Assist local authorities with the management of contracts with private sector service providers, where necessary.
These activities are offered to local authorities that are devel-oping projects involving the private sector, such as private sector financing of municipal debt; con-tracting out the management of ongoing services and concessions; contracts requiring the private sector to design, build, finance, and operate assets to deliver local services; and privatization of assets and services.
MIIU has worked with over 100 municipalities and has more than 70 active projects.
Source: Municipal Infrastructure Investment Unit (http://www.miiu.org.za, December 2, 2004).
•
•
WorldBankInfra.indb 49 12/6/2005 8:40:58 AM

�0 Philippines: Meeting Infrastructure Challenges
(b) Enabling securitization so that banks and others have exit options in infrastructure loans. Banks will be willing to originate long-term loans in the infrastructure sector if a method and venue for exit are available. Typically this could be by way of packaging and securitizing pools of infrastructure loans for placement in debt markets. A Securitization Bill is pending in the legislature, and its passage would estab-lish a sound legal basis for use of securitiza-tion methods by banks.
(c) Implementing recommendations to improve the conditions for domestic debt markets. The Bankers Association of Philippines has pre-pared a comprehensive proposal for setting up a fixed-income exchange. Other bodies have also made recommendations for deepening domestic debt markets. The required actions are by and large known, including a strong and independent securities and exchange commission; a strong legal system and bank-ruptcy procedures; internationally acceptable accounting and disclosure regimes; and reso-lution mechanisms incorporated into stan-dard bond indentures, including collective action clauses as well as advanced payment, settlement, and custodial systems. Prompt action in this area is required.
(d) Strengthening the supply of long-term funds through reforms of the pension system. Pension funds have a natural preference for long-dated securities. Professionally managed pension funds not only deepen bond markets but also play a critical role in screening and moni-toring issuers of bonds. By performing the latter function, they enable others to invest in bonds. The government-owned pension system in the Philippines is in need of sig-nificant policy and institutional reforms. Reforming and professionalizing it could well increase the supply of funds to the infrastruc-ture sector.
Facilitate LGU access to infrastructure financing. Key measures include:
(a) Providing incentives and technical assistance to LGUs to raise more revenues and improve performance. This will entail utilizing and publishing the results of the LGU financial
•
data collected by the Bureau of Local Govern-ment Finance, and benchmarking LGU finan-cial performance, so that the public and other stakeholders can assess and compare LGU revenue collections. The national govern-ment may consider introducing performance-based criteria to its fiscal transfer program to LGUs to provide more incentives for LGUs to increase revenue mobilization. Technical assistance to LGUs in such mobilization, e.g. improving local revenue codes, and estab-lishing and improving local real property and business tax systems, is also important for LGUs’ efforts in increasing their revenues.
(b) Removing barriers to private banks’ participa-tion in the LGU credit market. The current system in which almost all the funds lent to LGUs are from government sources is unhealthy and potentially risky. Removing the bottlenecks to participation by private financial institutions in the LGU credit market should be given high priority. Key actions include: allowing selected private financial institutions to be depository banks for LGUs and giving them some access to the IRA intercept mechanism as loan collateral; establishing an information system of LGU financial situations that is accessible to all interested parties (ideally, over the medium term, an LGU credit-rating system can be established and maintained by an indepen-dent credit-rating agency); and substantially recapitalizing the Local Government Unit Guarantee Corporation (which was created to guarantee debt issues of local governments when these issues are financed from private sources) and establishing a bond pooling system to further promote LGU bonds.
(c) Simplifying procedures of LGU access to loans. The current lending windows to LGUs for long-term financing, mostly ODA programs established through the GFIs or the Municipal Development Fund Office, have fairly com-plicated procedures. Multiple approval steps and controls, complex technical requirements, and slow responses by project implementation units to LGU requests can significantly slow loan processing. LGU leaderships have a term of three years, and politically they cannot afford delays in preparing and implementing
WorldBankInfra.indb 50 12/6/2005 8:40:58 AM
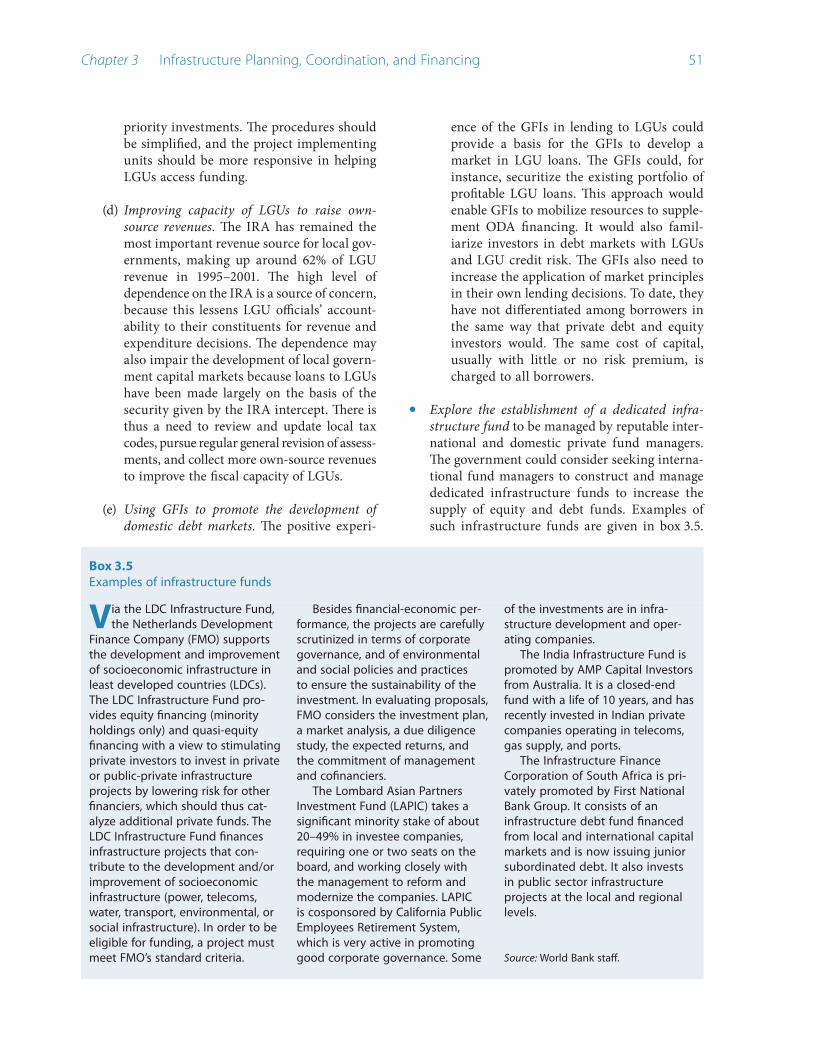
Chapter 3 Infrastructure Planning, Coordination, and Financing �1
Box 3.5Examples of infrastructure funds
Via the LDC Infrastructure Fund, the Netherlands Development
Finance Company (FMO) supports the development and improvement of socioeconomic infrastructure in least developed countries (LDCs). The LDC Infrastructure Fund pro-vides equity financing (minority holdings only) and quasi-equity financing with a view to stimulating private investors to invest in private or public-private infrastructure projects by lowering risk for other financiers, which should thus cat-alyze additional private funds. The LDC Infrastructure Fund finances infrastructure projects that con-tribute to the development and/or improvement of socioeconomic infrastructure (power, telecoms, water, transport, environmental, or social infrastructure). In order to be eligible for funding, a project must meet FMO’s standard criteria.
Besides financial-economic per-formance, the projects are carefully scrutinized in terms of corporate governance, and of environmental and social policies and practices to ensure the sustainability of the investment. In evaluating proposals, FMO considers the investment plan, a market analysis, a due diligence study, the expected returns, and the commitment of management and cofinanciers.
The Lombard Asian Partners Investment Fund (LAPIC) takes a significant minority stake of about 20–49% in investee companies, requiring one or two seats on the board, and working closely with the management to reform and modernize the companies. LAPIC is cosponsored by California Public Employees Retirement System, which is very active in promoting good corporate governance. Some
of the investments are in infra-structure development and oper-ating companies.
The India Infrastructure Fund is promoted by AMP Capital Investors from Australia. It is a closed-end fund with a life of 10 years, and has recently invested in Indian private companies operating in telecoms, gas supply, and ports.
The Infrastructure Finance Corporation of South Africa is pri-vately promoted by First National Bank Group. It consists of an infrastructure debt fund financed from local and international capital markets and is now issuing junior subordinated debt. It also invests in public sector infrastructure projects at the local and regional levels.
Source: World Bank staff.
priority investments. The procedures should be simplified, and the project implementing units should be more responsive in helping LGUs access funding.
(d) Improving capacity of LGUs to raise own-source revenues. The IRA has remained the most important revenue source for local gov-ernments, making up around 62% of LGU revenue in 1995–2001. The high level of dependence on the IRA is a source of concern, because this lessens LGU officials’ account-ability to their constituents for revenue and expenditure decisions. The dependence may also impair the development of local govern-ment capital markets because loans to LGUs have been made largely on the basis of the security given by the IRA intercept. There is thus a need to review and update local tax codes, pursue regular general revision of assess-ments, and collect more own-source revenues to improve the fiscal capacity of LGUs.
(e) Using GFIs to promote the development of domestic debt markets. The positive experi-
ence of the GFIs in lending to LGUs could provide a basis for the GFIs to develop a market in LGU loans. The GFIs could, for instance, securitize the existing portfolio of profitable LGU loans. This approach would enable GFIs to mobilize resources to supple-ment ODA financing. It would also famil-iarize investors in debt markets with LGUs and LGU credit risk. The GFIs also need to increase the application of market principles in their own lending decisions. To date, they have not differentiated among borrowers in the same way that private debt and equity investors would. The same cost of capital, usually with little or no risk premium, is charged to all borrowers.
Explore the establishment of a dedicated infra-structure fund to be managed by reputable inter-national and domestic private fund managers. The government could consider seeking interna-tional fund managers to construct and manage dedicated infrastructure funds to increase the supply of equity and debt funds. Examples of such infrastructure funds are given in box 3.5.
•
WorldBankInfra.indb 51 12/6/2005 8:40:58 AM
�� Philippines: Meeting Infrastructure Challenges
Such managers bring a range of benefits: they have extensive and diverse investment experience; they can be large equity and debt investors and thus can reduce complexity and cost of financial structuring and closure; they are acceptable to local promoters because they do not seek majority control; through board representation, they can provide valuable financial and strategic advice, as well as guidance based on experience in similar investments in other markets; they tend to take a long-term view—typically maturities of up to 10 years; and their portfolio approach reduces risks through diversification and enables them to create public bond offerings large enough to be liquid. For all these reasons, it may be useful to encourage formation of joint ventures between leading and respected local companies and inter-national institutional investors.
Improve the use of ODA funding. Over the near term, ODA will remain an important financing source for infrastructure development in the Philippines. The government should therefore continue its current efforts in improving the implementation of ODA projects, proactively addressing issues such as procurement delay and right-of-way acquisition. In addition, to better leverage ODA funding, the government can consider the following:
(a) Increasing the viability of privately financed infrastructure investments by using budget and ODA funds in complementary and sup-portive infrastructure. At present, ODA proj-ects and private sector participation projects are usually separated from each other. Better synergy can be explored to make private sector participation work better. A key risk that private financiers face in funding private
•
infrastructure investments is demand risk. Reaching break-even point in terms of capacity utilization takes time. In many instances it should be possible to reduce this lead time and spur higher utilization of the commercial infrastructure with the public sector investing in public infrastructure that enables higher user access. For example, the viability of toll roads could be increased if more users had access to the toll road via feeder roads, but such roads are not generally “bankable” propositions—only governments can fund their construction and maintenance. But if feeder roads are connected to a main highway, then the highway may have enough traffic volume to warrant private financing. Thus, it may be useful for the government to plan and coordinate public infrastructure invest-ment with a view to stimulating demand for those portions of infrastructure where user charges could be levied on volumes sufficient enough to service commercial loans.
(b) Exploring means of utilizing ODA funding to support private investors in infrastructure in accessing long-term financing. With limited capacity from the domestic financial market and a generally unfavorable global sentiment for private infrastructure investments, inves-tors are experiencing difficulties in accessing long-term, low-cost financing. While ODA funding has such benefits, it usually requires government sovereign guarantees. The gov-ernment can explore how favorable terms of ODA financing can be utilized by private sector investors, but with the benefits accruing to the end users, and without the government undertaking unnecessary risks that should be borne by private parties.
Endnotes1 The SEER exercise is a tool used by oversight agencies to elicit
better prioritization of projects and activities by the different agencies. It is part of a tool kit to improve public expenditure management.
2 Under the “scrap-and-build” policy, government agencies can request funding for a new activity (or project) on the condition that the new one is implemented at the expense of an existing one. They would have to “scrap” an old activity that presumably does not contribute to the attainment of the agency’s major final
outputs and sector outcomes and to “build” a new activity that would achieve the desired major final outputs and outcomes.
3 The ICC reviews and evaluates any public project, grant, or loan that amounts to at least P500 million or a foreign borrowing of at least $5 million; and all projects with private sector participation through BOT schemes and its variants.
4 Section 17 of the 1991 LGC provides congressmen with access to discretionary congressional funds. The General Appropria-tions Act ordains that monies from such funds can only be
WorldBankInfra.indb 52 12/6/2005 8:40:58 AM

Chapter 3 Infrastructure Planning, Coordination, and Financing ��
released for “projects identified by members of Congress.” This has resulted in pork barrel funding of projects and a coordina-tion failure between Congress and local government officials. William Loehr and Rosario G. Manasan. 1999. “Fiscal Decen-tralization and Economic Efficiency Measurement and Evalu-ation.” Consulting Assistance on Economic Reform II Discussion Paper No. 38.
5 Felipe M. Medalla. 2004. “Private Sector Participation in Infra-structure in the Philippines: Lessons from Selected Case Studies and Interviews with Private Sector Participants.” October. World Bank, Manila.
6 NEDA Board Resolution No. 6. March 6, 1996.7 For example, provinces do not collect local business tax, one of
the two LGU taxes—along with real property tax—that account for the bulk of LGU own-source revenue. Provinces can tax real property at the rate of 1%, while cities can charge 2%. In addition, the share of provinces in the proceeds of real property tax (35%) is smaller than those of cities (70%) and municipalities (40%).
8 There are nine RDCs, including those in the Cordillera Admin-istrative Region and the Autonomous Region in Muslim Mindanao.
9 Gilberto M. Llanto and Joel Lasam. 2003. “Report on the Forum on Planning, Programming and Monitoring.” Report submitted to NEDA and GTZ.
10 However, when the mayor/governor can access funding for a local project that is also of some interest to the RDC, he or she may give priority to the project even if it is not in consonance with local priorities.
11 The LGC gives to municipalities the responsibility for imple-menting community-based forestry and watershed projects, but allows DENR to retain supervision and control over such projects.
12 Eduardo T. Gonzalez et al. 1996. “Developing an Action Plan for the Financing of Local Government Projects With Social and Environmental Objectives.” School of Economics, University of the Philippines.
13 The LGC provided that the share of LGUs in national taxes should be equal to 40% of the actual collections of the Bureau of Internal Revenue (BIR) in the third year prior to the current year. Under the previous legislation, the IRA was set at a maximum of 20% of BIR collections.
14 Interviews with LGU officials held in 2004.15 Rosario G. Manasan. 2004. “Infrastructure and Decentralization.”
May. World Bank, Manila.16 Benjamin V. Cariño et al. 2004. “Preparatory Work for the
Proposed Technical Assistance on Strengthening Provincial Planning and Expenditure Management.” ADB, Manila; GTZ.
2004. “Assessment of the Information Systems and Information and Communications Technology (ICT) Resources of Regional and Local Planning Agencies/Bodies in the Visayas.” Report submitted to NEDA.
17 Cariño et al (2004) as cited in Manasan (2004).18 Figure 3.4 reflects a simple surplus/deficit of current income
over current expenditure and does not reflect transfers or other adjustments. In 2002, the Commission on Audit implemented a new government accounting system, so rendering updated 2002 figures incomparable with earlier data.
19 The LGC mandated that LGUs are to conduct a general revision of market values once every three years, with the first one in 1994.
20 A large part of the infrastructure lending of the banking system is accounted for by two GFIs—the Land Bank of the Philippines and the Development Bank of the Philippines.
21 According to Bangko Sentral ng Pilipinas (BSP) data, as of May 2004, banks (including state-owned development banks) accounted for close to 82% of the P4.8 trillion resources deployed in the financial system.
22 As of June 2004, according to data from the Philippine Deposit Insurance Corporation, deposit liability of the banking system was around P2.5 trillion. About 85% of these deposits were held by only 6% of account holders. Further, time deposits accounted for less than 10% of total deposits. Finally, about 31% of the deposits were denominated in foreign currency.
23 The nonbank financial sector as defined by BSP includes invest-ment houses, finance companies, investment companies, secu-rities dealers/brokers, pawnshops, lending investors, non-stock savings and loan associations, mutual building and loan associa-tions, leasing companies, and private and government insurance companies, including three government-owned pension funds, i.e. the Government Service Insurance System, the Social Security System, and the Armed Forces of the Philippines Retirement and Separation Benefits System. These three pension funds alone account for about 50% of the nonbank financial sector, and insur-ance companies another 25%.
24 The domestic bond market was equivalent to about 28% of GDP as of end-2003.
25 The stock exchange listed 234 companies with a market capital-ization of about $25 billion as of end-July 2004.
26 NEDA. 12th Annual ODA Portfolio Review (http://www.neda.gov.ph/../progs_prj/12th%20oda/12th_odamain.htm).
27 NEDA’s review of 138 contracts in 2003/4 reveals that on average, award of civil works took 9.5 months, consultancy services 9.3 months, and goods 7.9 months, from submission of bids to issuance of notice to proceed.
WorldBankInfra.indb 53 12/6/2005 8:40:59 AM

Jay Directo/Agence France-Presse
WorldBankInfra.indb 54 12/6/2005 8:41:02 AM

demand and take-or-pay contracts with high prices for the capacity charges have contributed to high industrial and commercial electricity prices.
Water The privatization of the Metropolitan Waterworks and Sewerage System (MWSS) in 1997, the largest water privatization in the developing world, has resulted in two drastically different outcomes. One concessionaire, Manila Water Company, Inc. (MWCI), performed satisfactorily and became profitable, whereas the other, Maynilad Water Services, Inc. (MWSI), incurred significant losses, defaulted on the concession fee, and declared the suspension of its concession contract (see boxes 7.3 and 7.4, in chapter 7).
Solid wasteThe key project for Metro Manila, the San Mateo Landfill, was stalled, resulting in the absence of any major solid waste disposal facilities in the metro-politan region.
Chapter 4
Maximizing the Benefits of Private Sector Participation
Introduction
The Philippines has a rich history of involving the private sector in financing, operating, and maintaining infrastructure. The shift
in government policy to rely on the private sector for infrastructure development began as a result of the power crisis in the late 1980s and early 1990s, which led the Aquino government (1986–1992) to adopt a private sector policy. The passage of the Build-Operate-Transfer (BOT) Law in 1990, the first of its kind in the region, signaled the govern-ment’s recognition of private sector expertise and resources in infrastructure provision. The BOT Law succeeded in opening the door to private partici-pation in infrastructure by establishing a transparent and competitive process for BOT schemes. The first privately financed BOT power project, the Navotas Gas Turbine Power Plant, was implemented during the latter stages of the Aquino administration.
As a result of the government’s sustained drive to attract the private sector, various private infra-structure projects have been undertaken in the power, water, toll road, port, airport, and telecommuni-cations sectors. These projects ranged from green-fields to concessions and a few divestitures. Figure 4.1 summarizes the cumulative private flows into various infrastructure sectors over 1990–2003.
However, results from a number of transactions have been mixed and are much less than expected.
Power While the numerous contracts with independent power producers that the government signed in the early 1990s—a period of continual power outages—enabled rapid expansion of generation capacity in a relatively short time, a combination of declining
Figure 4.1Cumulative private sector investment in infrastructure, 1990–2003
Water
Transportation
Telecoms
Power
0 2 4 6 8 10 12 14 16$ billion
Note: No data available for telecoms in 2003.
Sources: World Bank Private Participation in Infrastructure Database; International Telecommunication Union; Optel Ltd.; National Telecommunications Commission; Manila Water Company, Inc.; Maynilad Water Services, Inc.
WorldBankInfra.indb 55 12/6/2005 8:41:02 AM

�� Philippines: Meeting Infrastructure Challenges
Toll roadsWhile a few transactions were successfully concluded, there have been serious delays in actual implemen-tation. Most of the toll roads have been stalled, the only exception being the North Luzon Expressway, which was completed in early 2005 after delays.
AirportsThe BOT contract for the Ninoy Aquino Interna-tional Airport (NAIA) Terminal 3 in Manila was declared void by the government, a move subse-quently validated by the country’s Supreme Court for its allegedly onerous provisions. So, even though most of the construction is complete, the new airport terminal stands idle.
PortsTwo major ports in Manila (Manila International Container Terminal and the Manila South Harbor) are operated by the private sector under long-term concessions and have manifested efficiency gains. However, private participation continues to be inhibited by the Philippine Ports Authority’s dual operator-regulator role.
Moreover, as figure 4.31 shows, as with other countries in Southeast Asia, private flows declined substantially as a result of the Asian financial crisis, from a peak of $7 billion in 1997 to a low point of $0.03 billion in 2003, and are yet to recover from the impact of the crisis. In contrast, Vietnam’s private investment flows in more recent years have increased. Controlling for income, the Philippines’ precrisis investment flows showed a relatively good performance vis-à-vis its neighbors, and in fact, the country had higher investment levels than Malaysia
for almost all the years in question (figure 4.4). However, as discussed later, most of these investments were for greenfield projects with guaranteed offtake from public companies. Such arrangements do not maximize incentives for private sector efficiency.
Do these stalling on and voidance of contracts, and decline in private sector interest for infrastructure projects, imply that the Philippines can no longer rely on the private sector? What are the reasons behind these controversies, either in the way these trans-actions were designed and executed, or the enabling environment in which they took place? And what can the government do to reverse the waning of private sector interest?
This chapter is divided into three parts. The first briefly summarizes the potential benefits of private
Figure 4.2Private sector participation in infrastructure, 1990–2002
0.0
1.0
2.0
3.0
4.0
5.0
20032002
20012000
19991998
19971996
19951994
19931992
19911990
Year
$ bi
llion
Note: No data available for telecoms in 2003.
Sources: World Bank Private Participation in Infrastructure Database; International Telecommunication Union; Optel Ltd.; National Telecommunications Commission; Manila Water Company, Inc.; Maynilad Water Services, Inc.
Figure 4.3Private investment in infrastructure, selected ASEAN countries, 1990–2003
$ m
illio
n
0
2,000
4,000
6,000
8,000
10,000
12,000
VietnamThailandPhilippinesMalaysiaIndonesia
20032002
20012000
19991998
19971996
19951994
19931992
19911990
Year
Source: World Bank Private Participation in Infrastructure Database.
Figure 4.4Private investments in infrastructure (controlled for income), selected ASEAN countries, 1990–2003
$ m
illio
n
0.0
0.5
1.0
1.5
2.0
2.5
3.0
3.5
VietnamThailandPhilippinesMalaysiaIndonesia
20032002
20012000
19991998
19971996
19951994
19931992
19911990
Year
Sources: World Bank Private Participation in Infrastructure Database; World Development Indicators 2004.
WorldBankInfra.indb 56 12/6/2005 8:41:03 AM

Chapter 4 Maximizing the Benefits of Private Sector Participation ��
participation in infrastructure, and the appropriate role of the public sector in exploiting them. The second part identifies and analyzes the main reasons for the decline in private sector interest in infrastructure projects in the Philippines. These are both external factors (global and macro) such as the recent global downturn in private infrastructure investments and an increase in general country risk; as well as the deterio-rating business environment for infrastructure in the Philippines; weaknesses in planning, preparing, and executing private infrastructure projects; an unclear rationale and ineffective guidelines for providing fiscal support to private infrastructure projects; and certain ambiguities in the BOT policy, with sector-specific gaps in the enabling framework.
The third part concludes with concrete steps that the government can take to maximize the public benefits of private sector participation.
Potential of private involvement and role of the public sector
Involving the private sector in infrastructure provision can have many benefits, including stronger incentives for more efficient performance; more access to capital (technical, financial, and managerial); and newer technologies that could not only be cheaper, but also cleaner, than older ones. The presence of the private sector also imposes, to some extent, tariff and other disciplines on public authorities. (This is because such discipline has to be present to attract the private sector in the first place, and once the private sector is in, it lobbies the authorities to maintain such discipline.)
Private participation optionsFigure 4.5 summarizes the broad spectrum of private participation options in the delivery of infrastructure services. In general, the more risk and responsibility passed to the private sector, the more powerful its incentives to improve services.
Choosing the right option will often depend upon the specific situation—whether the objective is to tap into technical expertise or to attract investments in bulk production. In the Philippines, private involvement in infrastructure has been strong, with a range of options being chosen to match specific objectives. For example, concessions were let for the operation of MWSS (box 4.1); closure was reached for a number of greenfield projects, especially for bulk power generation; electricity distribution was privatized; and leasing arrangements of water facilities attracted the private sector in small towns. An influx of private investment took place in the transportation and telecoms sectors as well: Interna-tional Container Terminals and the Asian Terminals Inc. assumed operation of two of the country’s major ports (Manila International Container Terminal and Manila South Harbor, respectively), and various private operators entered the shipping and civil aviation industry. Opening up the telecommuni-cations sector to more private players has resulted in an impressive increase in telephone density and improved services.
Figure 4.6 shows private infrastructure investments in the Philippines, by type. In 1990–2003, more than half of the private sector investments were greenfield projects (67%), followed by concession arrangements (27%), while divestitures and management and lease contracts accounted for about 5% of investments.2 The dominance of greenfield projects
Figure 4.5Range of private sector options in delivery of infrastructure services
BOT and concession
(stricto sensu)LeasingManagement
contracts
Build-operate-
own
Divestitureby license
Source: World Bank. 1995. Public Policy for the Private Sector. Note 59. October.
Figure 4.6Private investments in infrastructure, by type, 1990–2003, $ billion
Managementand lease contracts
Greenfield projects
Divestitures
Concessions8.2
1.6
20.3
0.002
Source: World Bank Private Participation in Infrastructure Database.
WorldBankInfra.indb 57 12/6/2005 8:41:03 AM

�� Philippines: Meeting Infrastructure Challenges
In 1997, the Philippine gov-ernment granted concessions
for the operation of the Metro-politan Waterworks and Sewerage System (MWSS), the operator for Metro Manila and the neighboring province of Cavite. MWSS was one of the oldest and largest water utilities in Southeast Asia, serving a population of around 11 million. Prior to the concession agreement, MWSS relied on regular injections of funding from the government to operate and maintain its network, supplemented by a series of loans from multilateral lending institu-tions. By 1997, it had accumulated debt in the order of $800 million.
The intention of the MWSS transaction was to improve service quality, expand coverage, and eliminate the fiscal drain on the government by transferring the financial burden to the private sector. In addition, the government expected that efficiency improve-ments would result in price reduc-tions for customers. Given the objectives, a concession option was chosen as the optimal one.
At the time that it was imple-mented, the transaction was the largest private water sector project in the world. Key features of the transaction were:
The MWSS system was split into two concession zones to be operated by separate conces-sionaires. This was intended to provide a form of quasi-compe-tition, by allowing benchmarking between the two operators. The concession for the west zone, the larger of the two, was awarded to Maynilad Water Services, Inc.The concession agreement incorporated a set of aggressive service improvement and investment targets. Over the 25-year term of the agreement, the two concessionaires were expected to invest around $7 billion in the system.The concessionaires assumed responsibility for servicing the existing MWSS debt (although, as the debt was originally incurred by the state-owned MWSS, it remained subject to sovereign
•
•
•
guarantee). The debt remained on MWSS’ books, but concession payments that the two operators made to MWSS were set to include the cost of debt servicing as well as the cost of the residual functions of MWSS and the new regulatory office.
Despite the severe financial problems of one of the two con-cessionaires, water supply service levels improved in both zones from the preconcession period. Between 1997 and 2002, the total population receiving water services increased by about 1.7 million. Total combined water sales increased by 28% while almost 200,000 new water connections were added.
Other details of the Manila con-cession, including lessons learned, are summarized in boxes 7.3 and 7.4 of chapter 7.
Sources: World Bank staff; and Irwin and Erhardt. 2004. “Avoiding Cus-tomer and Taxpayer Bailouts in Private Infrastructure Projects: Policy toward Leverage, Risk Allocation, and Bank-ruptcy.” World Bank. April.
Box 4.1 Matching options to objectives: Metropolitan Waterworks and Sewerage System water concessions
shows that private participation was sought for new investments, rather than for improving the efficiency of existing assets.
Public sector role in private provisionEffective private sector participation poses many challenges for governments as they seek to transform their role from exclusive financiers, owners, and operators of services to facilitators and regulators of services provided by private firms. Private participation, however, does not mean the retreat of the public sector. On the contrary, good facili-tation and regulation are essential to maximize the benefits of private participation. For those infra-structure segments that are not competitive and contain monopolistic elements, the private sector’s high-powered profit-seeking incentives have to be complemented with strong and effective regulation, to prevent potential monopoly abuse and possible declines in quality standards.
Specifically, in the Philippines context, the public sector has two main roles. The first is to provide an appropriate enabling environment—a framework of laws, rules, and institutions—that enables private sector entry and exit, and provides the right incentives for its operation. The government has worked to provide such an environment for private participation in infrastructure. The policy framework is enshrined in the Medium-Term Philippine Devel-opment Plan. Specific measures such as the BOT Law, and subsequent amendments to the Law, indicate the government’s commitment to tapping private sector expertise and resources in infrastructure. Republic Act 8974 of 2000 provides the legal framework and basis for expropriation proceedings in infrastructure projects, the manner of compensation and relocation of squatters, and right-of-way acquisition, among others. Republic Act 8975 of 2000 prohibits lower courts from issuing temporary restraining orders to stop or delay the implementation of certain infra-
WorldBankInfra.indb 58 12/6/2005 8:41:03 AM
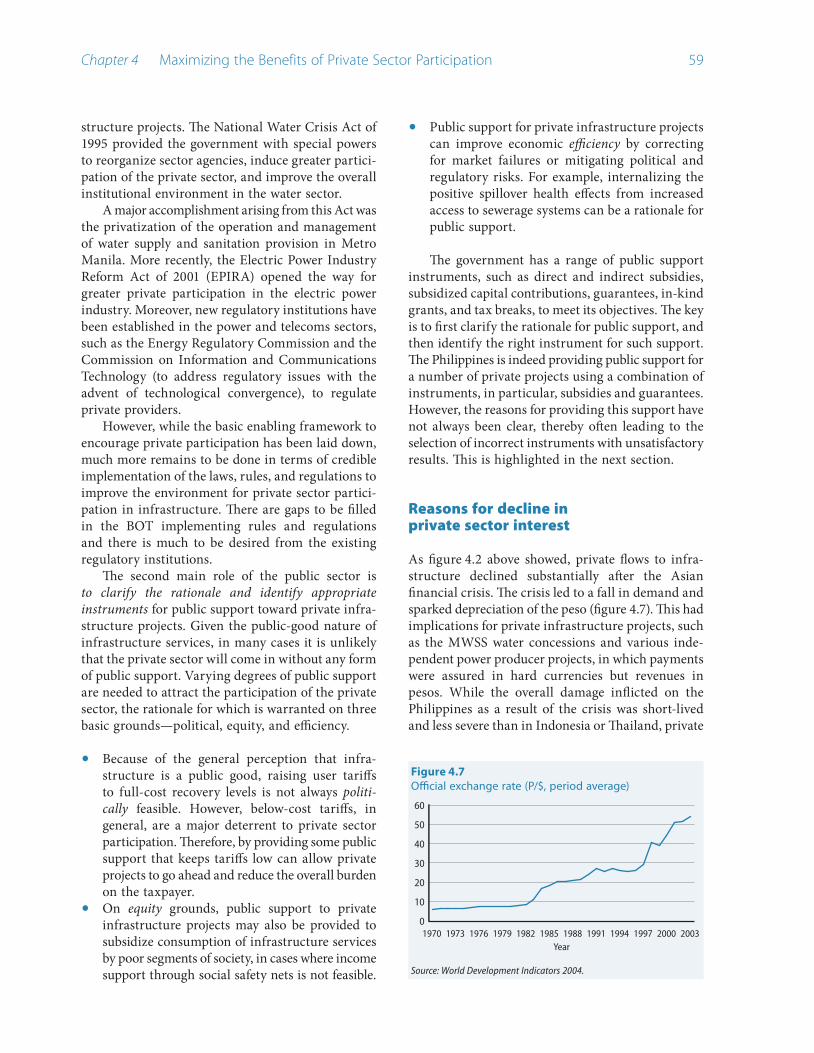
Chapter 4 Maximizing the Benefits of Private Sector Participation ��
structure projects. The National Water Crisis Act of 1995 provided the government with special powers to reorganize sector agencies, induce greater partici-pation of the private sector, and improve the overall institutional environment in the water sector.
A major accomplishment arising from this Act was the privatization of the operation and management of water supply and sanitation provision in Metro Manila. More recently, the Electric Power Industry Reform Act of 2001 (EPIRA) opened the way for greater private participation in the electric power industry. Moreover, new regulatory institutions have been established in the power and telecoms sectors, such as the Energy Regulatory Commission and the Commission on Information and Communications Technology (to address regulatory issues with the advent of technological convergence), to regulate private providers.
However, while the basic enabling framework to encourage private participation has been laid down, much more remains to be done in terms of credible implementation of the laws, rules, and regulations to improve the environment for private sector partici-pation in infrastructure. There are gaps to be filled in the BOT implementing rules and regulations and there is much to be desired from the existing regulatory institutions.
The second main role of the public sector is to clarify the rationale and identify appropriate instruments for public support toward private infra-structure projects. Given the public-good nature of infrastructure services, in many cases it is unlikely that the private sector will come in without any form of public support. Varying degrees of public support are needed to attract the participation of the private sector, the rationale for which is warranted on three basic grounds—political, equity, and efficiency.
Because of the general perception that infra-structure is a public good, raising user tariffs to full-cost recovery levels is not always politi-cally feasible. However, below-cost tariffs, in general, are a major deterrent to private sector participation. Therefore, by providing some public support that keeps tariffs low can allow private projects to go ahead and reduce the overall burden on the taxpayer. On equity grounds, public support to private infrastructure projects may also be provided to subsidize consumption of infrastructure services by poor segments of society, in cases where income support through social safety nets is not feasible.
•
•
Public support for private infrastructure projects can improve economic efficiency by correcting for market failures or mitigating political and regulatory risks. For example, internalizing the positive spillover health effects from increased access to sewerage systems can be a rationale for public support.
The government has a range of public support instruments, such as direct and indirect subsidies, subsidized capital contributions, guarantees, in-kind grants, and tax breaks, to meet its objectives. The key is to first clarify the rationale for public support, and then identify the right instrument for such support. The Philippines is indeed providing public support for a number of private projects using a combination of instruments, in particular, subsidies and guarantees. However, the reasons for providing this support have not always been clear, thereby often leading to the selection of incorrect instruments with unsatisfactory results. This is highlighted in the next section.
Reasons for decline in private sector interest
As figure 4.2 above showed, private flows to infra-structure declined substantially after the Asian financial crisis. The crisis led to a fall in demand and sparked depreciation of the peso (figure 4.7). This had implications for private infrastructure projects, such as the MWSS water concessions and various inde-pendent power producer projects, in which payments were assured in hard currencies but revenues in pesos. While the overall damage inflicted on the Philippines as a result of the crisis was short-lived and less severe than in Indonesia or Thailand, private
•
Figure 4.7Official exchange rate (P/$, period average)
0
10
20
30
40
50
60
200320001997199419911988198519821979197619731970Year
Source: World Development Indicators 2004.
WorldBankInfra.indb 59 12/6/2005 8:41:04 AM
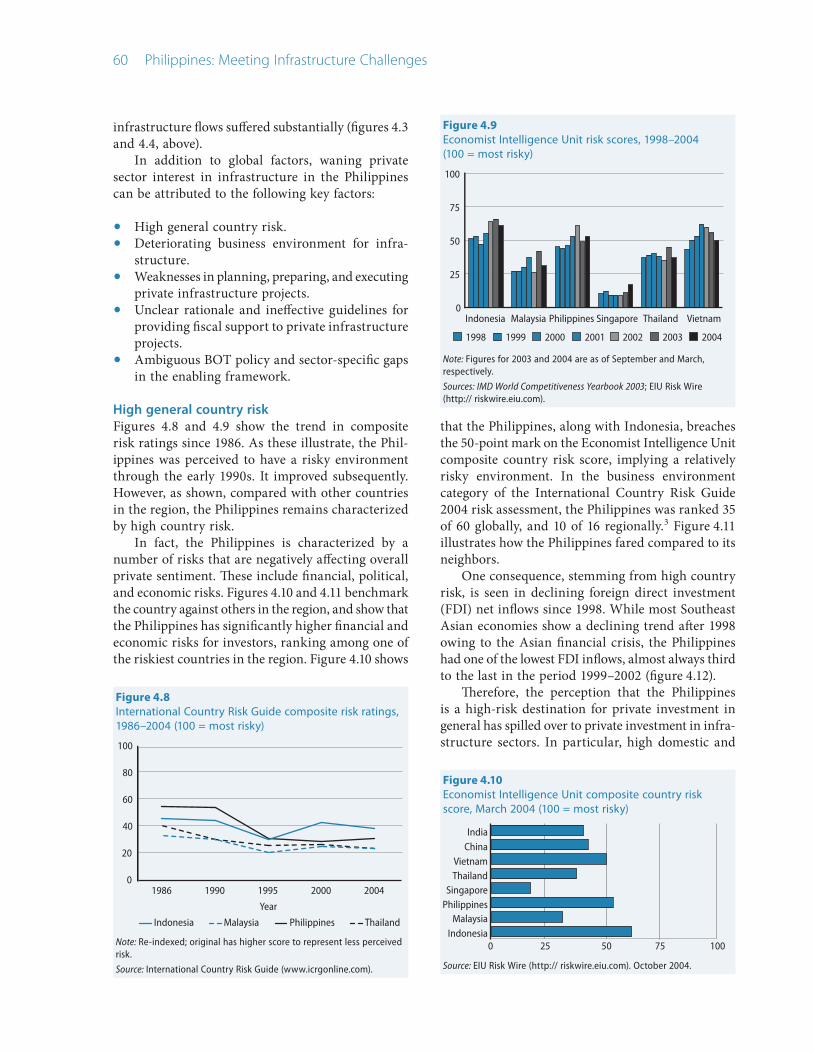
�0 Philippines: Meeting Infrastructure Challenges
infrastructure flows suffered substantially (figures 4.3 and 4.4, above).
In addition to global factors, waning private sector interest in infrastructure in the Philippines can be attributed to the following key factors:
High general country risk.Deteriorating business environment for infra-structure.Weaknesses in planning, preparing, and executing private infrastructure projects.Unclear rationale and ineffective guidelines for providing fiscal support to private infrastructure projects.Ambiguous BOT policy and sector-specific gaps in the enabling framework.
High general country riskFigures 4.8 and 4.9 show the trend in composite risk ratings since 1986. As these illustrate, the Phil-ippines was perceived to have a risky environment through the early 1990s. It improved subsequently. However, as shown, compared with other countries in the region, the Philippines remains characterized by high country risk.
In fact, the Philippines is characterized by a number of risks that are negatively affecting overall private sentiment. These include financial, political, and economic risks. Figures 4.10 and 4.11 benchmark the country against others in the region, and show that the Philippines has significantly higher financial and economic risks for investors, ranking among one of the riskiest countries in the region. Figure 4.10 shows
••••
•
that the Philippines, along with Indonesia, breaches the 50-point mark on the Economist Intelligence Unit composite country risk score, implying a relatively risky environment. In the business environment category of the International Country Risk Guide 2004 risk assessment, the Philippines was ranked 35 of 60 globally, and 10 of 16 regionally.3 Figure 4.11 illustrates how the Philippines fared compared to its neighbors.
One consequence, stemming from high country risk, is seen in declining foreign direct investment (FDI) net inflows since 1998. While most Southeast Asian economies show a declining trend after 1998 owing to the Asian financial crisis, the Philippines had one of the lowest FDI inflows, almost always third to the last in the period 1999–2002 (figure 4.12).
Therefore, the perception that the Philippines is a high-risk destination for private investment in general has spilled over to private investment in infra-structure sectors. In particular, high domestic and
Figure 4.8International Country Risk Guide composite risk ratings, 1986–2004 (100 = most risky)
0
20
40
60
80
100
ThailandPhilippinesMalaysiaIndonesia
20042000199519901986
Year
Note: Re-indexed; original has higher score to represent less perceived risk.
Source: International Country Risk Guide (www.icrgonline.com).
Figure 4.9Economist Intelligence Unit risk scores, 1998–2004 (100 = most risky)
0
25
50
75
100
VietnamThailandSingaporePhilippinesMalaysiaIndonesia
1998 200420032002200120001999
Note: Figures for 2003 and 2004 are as of September and March, respectively.
Sources: IMD World Competitiveness Yearbook 2003; EIU Risk Wire (http:// riskwire.eiu.com).
Figure 4.10Economist Intelligence Unit composite country risk score, March 2004 (100 = most risky)
0 25 50 75 100Indonesia
MalaysiaPhilippinesSingapore
ThailandVietnam
ChinaIndia
Source: EIU Risk Wire (http:// riskwire.eiu.com). October 2004.
WorldBankInfra.indb 60 12/6/2005 8:41:05 AM
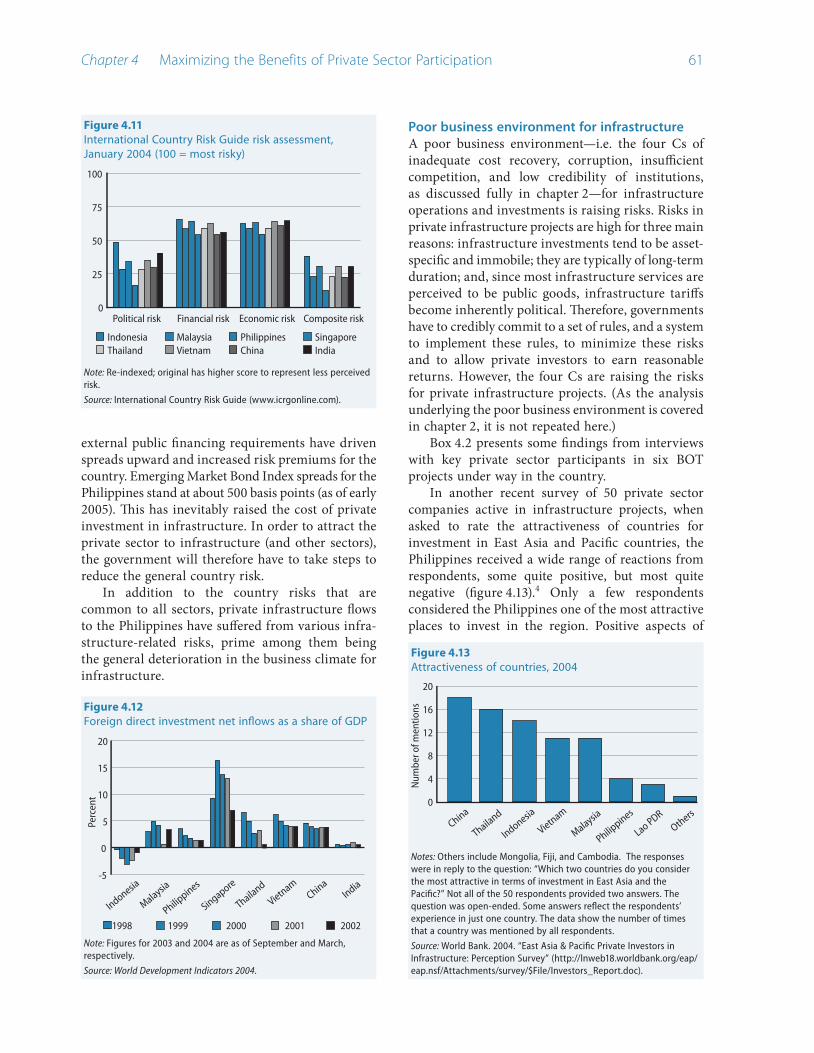
Chapter 4 Maximizing the Benefits of Private Sector Participation �1
external public financing requirements have driven spreads upward and increased risk premiums for the country. Emerging Market Bond Index spreads for the Philippines stand at about 500 basis points (as of early 2005). This has inevitably raised the cost of private investment in infrastructure. In order to attract the private sector to infrastructure (and other sectors), the government will therefore have to take steps to reduce the general country risk.
In addition to the country risks that are common to all sectors, private infrastructure flows to the Philippines have suffered from various infra-structure-related risks, prime among them being the general deterioration in the business climate for infrastructure.
Poor business environment for infrastructureA poor business environment—i.e. the four Cs of inadequate cost recovery, corruption, insufficient competition, and low credibility of institutions, as discussed fully in chapter 2—for infrastructure operations and investments is raising risks. Risks in private infrastructure projects are high for three main reasons: infrastructure investments tend to be asset-specific and immobile; they are typically of long-term duration; and, since most infrastructure services are perceived to be public goods, infrastructure tariffs become inherently political. Therefore, governments have to credibly commit to a set of rules, and a system to implement these rules, to minimize these risks and to allow private investors to earn reasonable returns. However, the four Cs are raising the risks for private infrastructure projects. (As the analysis underlying the poor business environment is covered in chapter 2, it is not repeated here.)
Box 4.2 presents some findings from interviews with key private sector participants in six BOT projects under way in the country.
In another recent survey of 50 private sector companies active in infrastructure projects, when asked to rate the attractiveness of countries for investment in East Asia and Pacific countries, the Philippines received a wide range of reactions from respondents, some quite positive, but most quite negative (figure 4.13).4 Only a few respondents considered the Philippines one of the most attractive places to invest in the region. Positive aspects of
Figure 4.11International Country Risk Guide risk assessment, January 2004 (100 = most risky)
0
25
50
75
100
ThailandSingaporePhilippinesMalaysiaIndonesia
Composite riskEconomic riskFinancial riskPolitical risk
Vietnam IndiaChina
Note: Re-indexed; original has higher score to represent less perceived risk.
Source: International Country Risk Guide (www.icrgonline.com).
Figure 4.12Foreign direct investment net inflows as a share of GDP
-5
0
5
10
15
20
IndiaChina
Vietnam
Thailand
Singapore
Philippines
Malaysia
Indonesia
1998 2002200120001999
Perc
ent
Note: Figures for 2003 and 2004 are as of September and March, respectively.
Source: World Development Indicators 2004.
Figure 4.13Attractiveness of countries, 2004
0
4
8
12
16
20
Others
Lao PDR
Philippines
Malaysia
Vietnam
Indonesia
Thailand
China
Num
ber o
f men
tions
Notes: Others include Mongolia, Fiji, and Cambodia. The responses were in reply to the question: “Which two countries do you consider the most attractive in terms of investment in East Asia and the Pacific?” Not all of the 50 respondents provided two answers. The question was open-ended. Some answers reflect the respondents’ experience in just one country. The data show the number of times that a country was mentioned by all respondents.
Source: World Bank. 2004. “East Asia & Pacific Private Investors in Infrastructure: Perception Survey” (http://lnweb18.worldbank.org/eap/eap.nsf/Attachments/survey/$File/Investors_Report.doc).
WorldBankInfra.indb 61 12/6/2005 8:41:06 AM
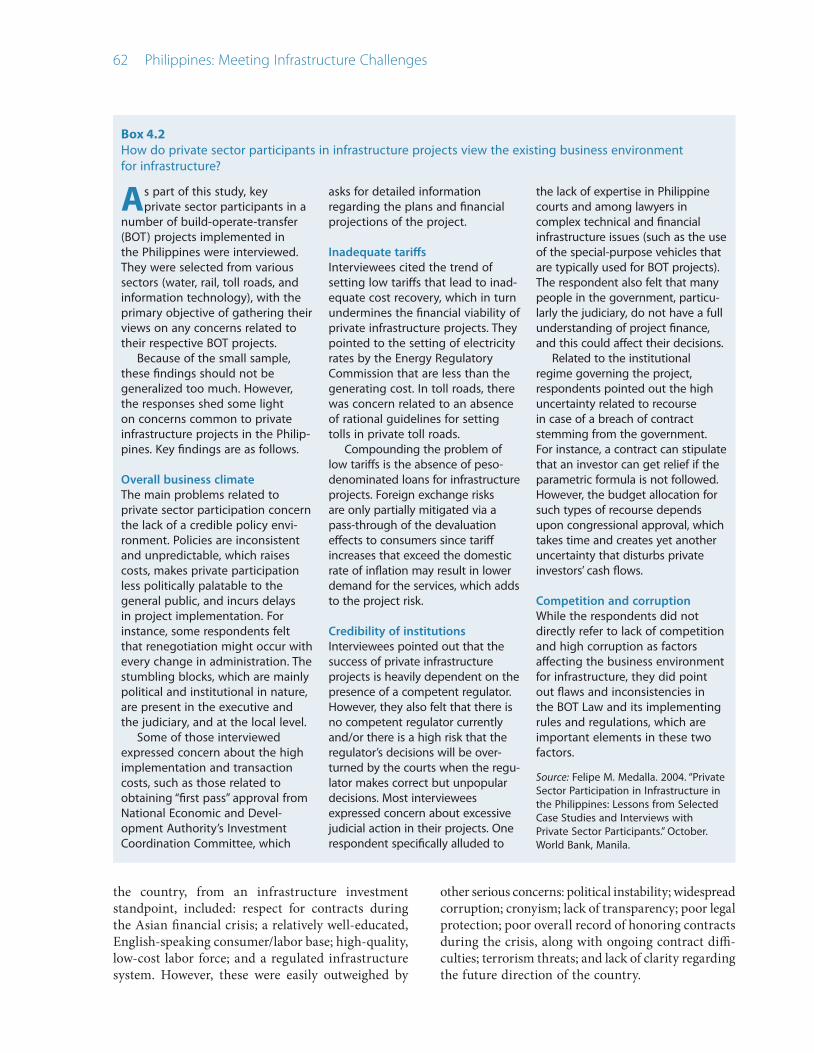
�� Philippines: Meeting Infrastructure Challenges
As part of this study, key private sector participants in a
number of build-operate-transfer (BOT) projects implemented in the Philippines were interviewed. They were selected from various sectors (water, rail, toll roads, and information technology), with the primary objective of gathering their views on any concerns related to their respective BOT projects.
Because of the small sample, these findings should not be generalized too much. However, the responses shed some light on concerns common to private infrastructure projects in the Philip-pines. Key findings are as follows.
Overall business climateThe main problems related to private sector participation concern the lack of a credible policy envi-ronment. Policies are inconsistent and unpredictable, which raises costs, makes private participation less politically palatable to the general public, and incurs delays in project implementation. For instance, some respondents felt that renegotiation might occur with every change in administration. The stumbling blocks, which are mainly political and institutional in nature, are present in the executive and the judiciary, and at the local level.
Some of those interviewed expressed concern about the high implementation and transaction costs, such as those related to obtaining “first pass” approval from National Economic and Devel-opment Authority’s Investment Coordination Committee, which
asks for detailed information regarding the plans and financial projections of the project.
Inadequate tariffsInterviewees cited the trend of setting low tariffs that lead to inad-equate cost recovery, which in turn undermines the financial viability of private infrastructure projects. They pointed to the setting of electricity rates by the Energy Regulatory Commission that are less than the generating cost. In toll roads, there was concern related to an absence of rational guidelines for setting tolls in private toll roads.
Compounding the problem of low tariffs is the absence of peso-denominated loans for infrastructure projects. Foreign exchange risks are only partially mitigated via a pass-through of the devaluation effects to consumers since tariff increases that exceed the domestic rate of inflation may result in lower demand for the services, which adds to the project risk.
Credibility of institutionsInterviewees pointed out that the success of private infrastructure projects is heavily dependent on the presence of a competent regulator. However, they also felt that there is no competent regulator currently and/or there is a high risk that the regulator’s decisions will be over-turned by the courts when the regu-lator makes correct but unpopular decisions. Most interviewees expressed concern about excessive judicial action in their projects. One respondent specifically alluded to
the lack of expertise in Philippine courts and among lawyers in complex technical and financial infrastructure issues (such as the use of the special-purpose vehicles that are typically used for BOT projects). The respondent also felt that many people in the government, particu-larly the judiciary, do not have a full understanding of project finance, and this could affect their decisions.
Related to the institutional regime governing the project, respondents pointed out the high uncertainty related to recourse in case of a breach of contract stemming from the government. For instance, a contract can stipulate that an investor can get relief if the parametric formula is not followed. However, the budget allocation for such types of recourse depends upon congressional approval, which takes time and creates yet another uncertainty that disturbs private investors’ cash flows.
Competition and corruptionWhile the respondents did not directly refer to lack of competition and high corruption as factors affecting the business environment for infrastructure, they did point out flaws and inconsistencies in the BOT Law and its implementing rules and regulations, which are important elements in these two factors.
Source: Felipe M. Medalla. 2004. “Private Sector Participation in Infrastructure in the Philippines: Lessons from Selected Case Studies and Interviews with Private Sector Participants.” October. World Bank, Manila.
Box 4.2How do private sector participants in infrastructure projects view the existing business environment for infrastructure?
the country, from an infrastructure investment standpoint, included: respect for contracts during the Asian financial crisis; a relatively well-educated, English-speaking consumer/labor base; high-quality, low-cost labor force; and a regulated infrastructure system. However, these were easily outweighed by
other serious concerns: political instability; widespread corruption; cronyism; lack of transparency; poor legal protection; poor overall record of honoring contracts during the crisis, along with ongoing contract diffi-culties; terrorism threats; and lack of clarity regarding the future direction of the country.
WorldBankInfra.indb 62 12/6/2005 8:41:06 AM
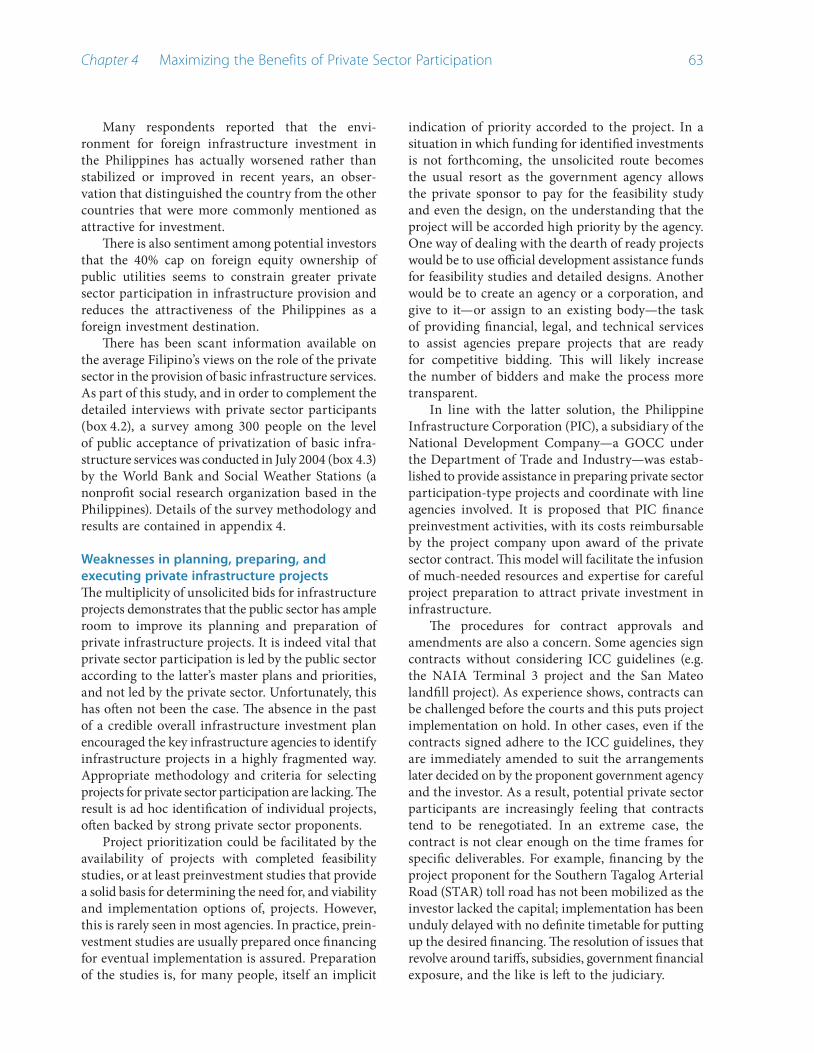
Chapter 4 Maximizing the Benefits of Private Sector Participation ��
Many respondents reported that the envi-ronment for foreign infrastructure investment in the Philippines has actually worsened rather than stabilized or improved in recent years, an obser-vation that distinguished the country from the other countries that were more commonly mentioned as attractive for investment.
There is also sentiment among potential investors that the 40% cap on foreign equity ownership of public utilities seems to constrain greater private sector participation in infrastructure provision and reduces the attractiveness of the Philippines as a foreign investment destination.
There has been scant information available on the average Filipino’s views on the role of the private sector in the provision of basic infrastructure services. As part of this study, and in order to complement the detailed interviews with private sector participants (box 4.2), a survey among 300 people on the level of public acceptance of privatization of basic infra-structure services was conducted in July 2004 (box 4.3) by the World Bank and Social Weather Stations (a nonprofit social research organization based in the Philippines). Details of the survey methodology and results are contained in appendix 4.
Weaknesses in planning, preparing, and executing private infrastructure projectsThe multiplicity of unsolicited bids for infrastructure projects demonstrates that the public sector has ample room to improve its planning and preparation of private infrastructure projects. It is indeed vital that private sector participation is led by the public sector according to the latter’s master plans and priorities, and not led by the private sector. Unfortunately, this has often not been the case. The absence in the past of a credible overall infrastructure investment plan encouraged the key infrastructure agencies to identify infrastructure projects in a highly fragmented way. Appropriate methodology and criteria for selecting projects for private sector participation are lacking. The result is ad hoc identification of individual projects, often backed by strong private sector proponents.
Project prioritization could be facilitated by the availability of projects with completed feasibility studies, or at least preinvestment studies that provide a solid basis for determining the need for, and viability and implementation options of, projects. However, this is rarely seen in most agencies. In practice, prein-vestment studies are usually prepared once financing for eventual implementation is assured. Preparation of the studies is, for many people, itself an implicit
indication of priority accorded to the project. In a situation in which funding for identified investments is not forthcoming, the unsolicited route becomes the usual resort as the government agency allows the private sponsor to pay for the feasibility study and even the design, on the understanding that the project will be accorded high priority by the agency. One way of dealing with the dearth of ready projects would be to use official development assistance funds for feasibility studies and detailed designs. Another would be to create an agency or a corporation, and give to it—or assign to an existing body—the task of providing financial, legal, and technical services to assist agencies prepare projects that are ready for competitive bidding. This will likely increase the number of bidders and make the process more transparent.
In line with the latter solution, the Philippine Infrastructure Corporation (PIC), a subsidiary of the National Development Company—a GOCC under the Department of Trade and Industry—was estab-lished to provide assistance in preparing private sector participation-type projects and coordinate with line agencies involved. It is proposed that PIC finance preinvestment activities, with its costs reimbursable by the project company upon award of the private sector contract. This model will facilitate the infusion of much-needed resources and expertise for careful project preparation to attract private investment in infrastructure.
The procedures for contract approvals and amendments are also a concern. Some agencies sign contracts without considering ICC guidelines (e.g. the NAIA Terminal 3 project and the San Mateo landfill project). As experience shows, contracts can be challenged before the courts and this puts project implementation on hold. In other cases, even if the contracts signed adhere to the ICC guidelines, they are immediately amended to suit the arrangements later decided on by the proponent government agency and the investor. As a result, potential private sector participants are increasingly feeling that contracts tend to be renegotiated. In an extreme case, the contract is not clear enough on the time frames for specific deliverables. For example, financing by the project proponent for the Southern Tagalog Arterial Road (STAR) toll road has not been mobilized as the investor lacked the capital; implementation has been unduly delayed with no definite timetable for putting up the desired financing. The resolution of issues that revolve around tariffs, subsidies, government financial exposure, and the like is left to the judiciary.
WorldBankInfra.indb 63 12/6/2005 8:41:06 AM

�� Philippines: Meeting Infrastructure Challenges
The survey asked respondents about their awareness of private
sector providers in basic infra-structure services, and gauged their perception about the quality and price of services offered by private providers. It also sought to estimate their awareness of institutions that regulate private providers. The main results are as follows:
Public perceptions of private sector participation in basic infra-structure services are generally positive: more than half of the respondents seemed to think that it would benefit the country.Public awareness of the private sector’s involvement seems to be low as the majority of the respondents regard infrastructure utilities as wholly government-owned. Meralco, MWCI, and MWSI are exceptions—more than half of those who have used their services are aware that
•
•
these service providers are pri-vately run. One possible reason for the low awareness generally is that the differing degrees of government involvement in arrangements for private sector participation are often unclear, for example, the Philippine National Construction Corpo-ration’s involvement as a GOCC in the NLEX and SLEX toll road concessions.Public perceptions of profits made by private providers do not reflect reality: an overwhelming majority believe that agencies such as NPC, MWSS, NLEX, and SLEX are posting profits, and that service providers are more than capable of shouldering the cost of any activity to improve quality. They thus have no basis for passing the cost on to consumers by increasing user charges. Public awareness of institutions that regulate private providers
•
•
is also low, with the majority of respondents responding that the government controls the prices set by the utilities.
Public awareness of price (and quality) varies by sector and private provider: the majority of the users of toll roads and urban rail systems, and of the consumers of MWCI and MWSI, believe that the price they pay is just right relative to the (perceived) cost of providing the service. For Meralco customers however, the majority believes that it is paying a price that is higher than the cost of providing elec-tricity. For the Skyway, which is an extension of the SLEX built under a BOT contract with the Citra Metro Manila Tollways Corporation, users are somewhat split on whether they are paying enough, or more than enough.
Source: World Bank staff.
Box 4.3Results of the World Bank-Social Weather Stations Privatization Perception Survey
Unclear rationale and ineffective guidelines on fiscal support to private infrastructure projectsAs embodied in the BOT Law, subsidies and guarantees can only be given to solicited BOT projects, i.e. those that emanate from the investment programs of infrastructure agencies and local governments. Preparation, development, and design of these project proposals, including determination of the nature and level of subsidies, rest with the proponent government agencies. Unfortunately, most lead agencies lack the skills and resources to make timely proposals that can lend themselves to a competitive bidding process. This spawns unsolicited proposals that tend to be accorded higher priority in the investment decisionmaking process. Processing unsolicited proposals invariably means that the government deals with only a single proponent, who, in turn, is likely to adopt a “take it or leave it” stance. This bargaining equation has an adverse bearing on how the risks (and therefore public sector support) are allocated in a contract. On the other hand, an intolerant, “no direct guarantee” policy on unsolicited proposals could also lead to the govern-ment’s missing out on important projects that cannot
be accommodated because they require some form of subsidies or guarantees to become viable. A clear policy is needed on the type and extent of subsidies and guarantees that can be provided vis-à-vis the kind of risks that are being taken. In the case of unsolicited proposals, the key is to maximize competition (rather than totally dismissing these proposals) along with clear subsidy and guarantee guidelines.
The rationale for public support to projects in which the private sector participates should be provided at the project identification and devel-opment stages. The experience with the Casecnan irrigation and hydroelectric project (box 4.4) illus-trates the importance of proper project selection and appropriate risk allocation. It further demonstrates the political vulnerability of the decisionmaking process in terms of identifying the project that should be supported and the subsidy that should be extended to a risky project.
The decision to provide public support requires careful consideration of objectives, identification of appropriate instruments, and cost-benefit analysis of using each instrument.
WorldBankInfra.indb 64 12/6/2005 8:41:07 AM

Chapter 4 Maximizing the Benefits of Private Sector Participation ��
As discussed in Irwin,5 the first and most important step is deciding whether private projects should receive any fiscal support. It is possible that through a policy change, the government could bring about private sector participation with no fiscal implications. For example, in the water sector, water districts are constrained in engaging the private sector because current policies require that the districts obtain Local Water Utilities Adminis-tration (LWUA) waivers to access financing from elsewhere. A policy change of removing the LWUA lending monopoly would greatly facilitate private sector financing and operations.
If nonfiscal policy changes cannot achieve objectives at no cost, the most promising instrument, considering its targeting and transparency, needs to be identified. The Philippines has experimented with a number of instruments for providing fiscal support to private projects such as direct subsidies, guarantees, tax breaks, subsidized capital contri-butions, and various in-kind contributions. Some of these instruments have stimulated and maximized the benefits of private sector participation, while others have not.
The most relevant instruments in the Philippines are cash subsidies, including output-based schemes, and guarantees.
Cash subsidies and output-based schemes Cash subsidies to private infrastructure projects in the Philippines are rare; however, almost all infra-structure sectors receive direct or indirect cash subsidies. These subsidies are often to public insti-tutions, but they rarely achieve their objective of helping the poor. Resources for inefficient subsidies to public institutions could perhaps be better directed and used to attract the private sector. Indeed, there are new techniques in subsidy delivery, such as output-based aid, that can both meet intended development objectives and involve the private sector.
Typically, public resources in the Philippines are provided for subsidizing inputs of production. However, results have been disappointing and subsi-dizing inputs of service providers has not translated into increased access by the poorest. Output-based subsidy mechanisms, by linking the payment of subsidies to a third-party provider to the “output” actually delivered (such as increased access to water or electricity), provide strong incentives to third-party service providers.
The design and implementation of output-based schemes are in their early stages but if done properly, such schemes have the potential to involve the private sector in areas traditionally considered not viable for private service delivery, while enhancing account-
The Casecnan multipurpose irrigation and hydroelectric
BOT project was submitted to the National Economic and Devel-opment Authority’s Investment Coordination Committee (ICC) in 1994. The ICC evaluation found that the project was not viable given the hydrologic risks and that it had dubious economic, social, and financial value.
The government had many times in the past looked at various approaches to the implementation of the project through official development assistance financing but had decided not to undertake it. When the government eventually decided to carry out the project through the BOT Law, it decided to negotiate with only one company. Since the BOT project was unso-
licited and the government was dealing with only one possible con-tractor, the framework for giving subsidies and guarantees was flawed both on legal and economic grounds.
Yet the government decided to extend the subsidies and guar-antees anyway and used a very strained interpretation of the BOT Law’s prohibition on subsidies and direct guarantees to projects that are awarded through competitive bidding. Since the project was not financially viable unless the gov-ernment absorbed most of the risks embedded in the project, including hydrologic risks, the mere fact that the proponent agreed to proceed was already an indication that the government was absorbing too much risk.
The tragedy in this under-taking is that the shortcomings were already obvious from the very beginning to the ICC both at the technical working group and technical board levels, and yet the project was approved. A senate inquiry soon ensued and one senator said that the project was indeed a bad project, and had been approved because it had backers at the highest level of government. The project showed the vulner-ability both of the BOT process and the ICC as a “gatekeeper” in granting subsidies and guarantees.
Source: Felipe M. Medalla. 2004. “Private Sector Participation in Infrastructure in the Philippines: Lessons from Selected Case Studies and Interviews with Private Sector Participants.” October. World Bank, Manila.
Box 4.4How not to do a BOT project: The Casecnan project
WorldBankInfra.indb 65 12/6/2005 8:41:07 AM

�� Philippines: Meeting Infrastructure Challenges
ability in the use of public resources. Box 4.5 describes the Philippines’ experimentation with output-based subsidy schemes in infrastructure sectors.
GuaranteesGuarantees are a popular instrument for providing public support to private infrastructure projects since they typically incur no immediate cash cost and only the possibility of liabilities in the future. Because investing in infrastructure projects is intrinsically risky, investors insist on guarantees, especially in a climate such as the Philippines, which is characterized by high country risk and lack of a credible legal and regulatory framework. As a result, infrastructure investors in the country have been guaranteed against various types of risks by the government, such as changes in the political and regulatory regime; low revenues, tariffs, and demand; and fluctuations in exchange rates.
When should guarantees be used? The answer depends on the objective and nature of the risk being guaranteed. For example, if the objective was to expand access to infrastructure services, then an output-based subsidy scheme that provided stronger
incentives to the private provider to expand access would be preferable over a guarantee scheme that guaranteed demand for services to be provided. However, an output-based subsidy scheme might not be appropriate for insuring against broader political or regulatory risks. Clarifying the rationale is therefore the first step toward evaluating whether a guarantee is required.
If a guarantee is identified as the preferred instrument, it is important not to “over-guarantee” risks. As much as possible, guarantees should be used only for those risks that cause the greatest concern to the investor. For example, if a toll road investor’s concern is that the government will build a competing free road after the private toll road is built, rather than insuring the investor against all causes of revenue loss, the government should compensate the investor for lost revenues only if a competing free road is in fact built.6 Moreover, by over-guaranteeing risks, guarantees could have the perverse effect of leaving private investors with little incentive to select commercially viable projects or to manage them efficiently, and even encourage them to take excessive risks. In the Philippine power sector,
The provincial government of La Union in Luzon is embarking on
a program that aims to connect all residents in its urban and urban-izing areas to safe and reliable piped water supply systems by involving the private sector. The province consists of 19 munici-palities and one city, four of which (including San Fernando City) are part of one provincial water dis-trict. Residents in the remaining 16 municipalities are served either by LGU-managed water utilities that are generally inefficient, or by self-provision, which is unacceptable to the poor and further exposes them to serious health risks. These 16 municipalities have relatively small economic bases that make it difficult for residents to afford the full-cost recovery tariffs required by current financing policies gov-erning water districts.
In order to provide sufficient
incentives to attract private oper-ators to invest in these commu-nities, the provincial government is considering provision of subsidies directly to private service providers on a per connection basis. In effect, an output-based subsidy will be provided for the capital costs asso-ciated with building connections to the poorer communities.
The scheme is intended to extend coverage of the existing network by around 40,000 new household connections, about double the total number of existing connections. Output payments would be made only once the con-nections are functioning (these connections would be heavily frontloaded in the first few years). The project is currently in the prequalification stage.
Another initiative in the power sector invites private parties—qual-ified third parties—into areas that
electricity cooperatives indicate they cannot serve within three years, and therefore waive their franchise rights. Most of these opportunities will be relatively small, greenfield, mini-grid devel-opments in remote areas, but they will be eligible for electrification subsidies funded by the universal charge. The Department of Energy is considering output-based subsidy approaches, under which a subsidy would be committed to fund a portion of connection costs, with all or most of the subsidy paid only after the connections are made and verified. A number of issues are yet to be resolved for the scheme to be implemented.
Sources: World Bank staff; and Chiaki Yamamoto and Catherine Hunt. 2005. “Output-based Aid in the Philippines: Harnessing Political Will to Deliver Water to the Poor.” OBA Approaches. Note 004.
Box 4.5Pilot output-based subsidy schemes in the Philippines
WorldBankInfra.indb 66 12/6/2005 8:41:07 AM

Chapter 4 Maximizing the Benefits of Private Sector Participation ��
Box 4.6Guaranteeing input supply risk: The Casecnan and Metropolitan Waterworks and Sewerage System cases
guarantees and other assurances were actively sought by private producers of power (and given to them) to compensate them for the political risk of selling power to a single, state-owned incumbent. However, the proper and quick implementation of the wholesale electricity spot market in the power sector should alleviate this specific investor concern.
The Philippines has taken steps toward controlling indiscriminate use of guarantees. For example, Republic Act 4860 sets a $7.5 million ceiling on outstanding government guarantees for foreign loans to GOCCs. However, most of the infra-structure-related GOCCs, such as Light Rail Transit Authority, MWSS, National Development Company, National Electrification Administration, National Irrigation Administration, Philippine National Oil Company (PNOC), and Philippine National Railways are explicitly exempted from this ceiling. Moreover, guarantees on various types of risks in BOT projects, for example, revenue guarantees for the Casecnan irrigation and power project and the MRT 3, are further aggravating the situation.
Identifying the right guarantee is often tricky (box 4.6) and the types of guarantees made by the government are often problematic. In the case of MRT 3, it is unclear whether the proponent absorbs any demand risk. The risk guaranteed by the government is the ridership and this is problematic since the BOT contractor can influence ridership by influencing where to locate stations, escalators, etc. Given that performance monitoring is weak and that MRT 3’s contractor receives payments on the basis of delivered capacity, it is likely that the contract monitoring will report anything but serious shortfalls in delivery.
Currently, the Department of Finance (DOF) reviews and approves requests of GOCCs for national government guarantees. However, certain GOCC
charters provide for automatic guarantees from the national government. This weakens the discipline of DOF’s vetting of guarantee applications, thereby reducing the approval process to a procedural one.
Ambiguous BOT policy and sector-specific gaps in the enabling framework7
The landmark BOT Law has been successful in paving the way for major infrastructure projects in the Phil-ippines. However, a number of controversies surround the Law, particularly in relation to vagueness over unsolicited bids, definition of government guarantees, and other possible deficiencies related to the role of implementing agencies in contract revision.
The current version of the BOT Law and its imple-menting rules and regulations (IRR), which allows for unsolicited bids for BOT projects, has led to a number of scandals. Most of the controversial projects started as unsolicited proposals, notably the NAIA 3 airport terminal and the Caliraya-Botocan-Kalayaan (CBK) hydroelectric power BOT projects. As box 4.7 illus-trates, one of the shortcomings of the BOT Law and its IRR is the lack of clarity for the process of dealing with unsolicited proposals. For instance, the Law’s IRR require that all unsolicited proposals should go through the ICC. However, proponents of unsolicited proposals such as NAIA 3 and CBK have bypassed the ICC, and instead, directly sought the approval of the Office of the President. This has been achieved because of the gray area in the IRR provision related to whether the Office of the President should approve the project concept or the entire project itself. So while safeguards for unsolicited proposals exist, this ambiguity in the law and its IRR needs to be resolved. Requiring all projects to be first cleared by the ICC before they reach the Office of the President could be one way of achieving this.
Under the original BOT Law, no guarantees,
Examples of the tricky issue of identifying what risk to be
guaranteed can be gleaned in the Casecnan BOT project and the Met-ropolitan Waterworks and Sewerage System (MWSS) concessions. In both cases, the government bears the risk of not having the main input in the project: water. This is the appropriate policy for MWSS but the wrong policy for Casecnan. Not
having water supply for distribution is not an option in the MWSS case since the alternative would be to let households dig wells or stop drinking water. In the Casecnan project, in contrast, which aims to provide irrigation services and electricity, there are other sources of electricity, and the farmers can also get water from other sources (or go into activities that are not too
dependent on water). The hydrologic risk in Casecnan is therefore purely a commercial risk, a risk that the gov-ernment should not bear.
Source: Felipe M. Medalla. 2004. “Private Sector Participation in Infrastructure in the Philippines: Lessons from Selected Case Studies and Interviews with Private Sector Participants.” October. World Bank, Manila.
WorldBankInfra.indb 67 12/6/2005 8:41:07 AM

�� Philippines: Meeting Infrastructure Challenges
either direct or indirect, could be extended to BOT projects. However, as a way out for a cash-strapped government, the BOT Law was subsequently amended to disallow only “direct” government guarantees. Nonetheless, vagueness surrounds what constitutes a direct government guarantee, which needs to be better defined. For example, there is still a controversy surrounding the CBK power project as to whether or not the project was granted a government guarantee, and if so, whether it was direct or indirect. In the absence of implementation of the IRR, the amendment to the Law remains open to many interpretations.
Several other unclear provisions exist in the current version of the BOT Law and need to be reviewed:
The roles of the implementing agency and the ICC in the awards of BOT contracts are unclear. If a contract is revised, the revised contract is merely submitted to the ICC for information only, and the ICC has little say in the process. Explicitly allowing the ICC to approve contract changes, and to ensure compliance of implementing agencies with ICC reporting requirements, should be considered. The law is silent over whether projects can be built on private land.The law is unclear about costs related to the transfer of ownership of BOT facilities to the government upon expiration of a BOT contract. A recurring issue in BOT contracts is how residual claims are handled in case the contract is termi-nated. Proper delineation between government claims and creditor claims is important in cases where the government takes over the facility (as in Philippine International Air Terminals Co., which was awarded the contract for the construction of NAIA Terminal 3 but whose contract was later nullified by the Supreme Court when construction of the terminal was almost complete).
The government has set up a BOT-IRR committee to provide recommendations on possible amendments on the IRR of the BOT Law; recommendations are expected to be completed by 2005.
Suggested actions
Given the magnitude of its infrastructure needs and requirements, the Philippine government cannot rely exclusively on the private sector. However, it can take steps to increase meaningful private involvement in
•
••
•
infrastructure. Private involvement per se is not neces-sarily the goal, and plenty of global evidence shows that private sector participation in infrastructure, without good policy and regulatory frameworks, may not improve sector performance.8
The record of private infrastructure partici-pation in the Philippines itself shows both setbacks and successes. However, given its ever-growing infrastructure requirements, the country has little choice but to attempt to minimize these setbacks and to build on the successes. In the context of fewer public resources for infrastructure, large-scale private sector investments will, indeed, have to be mobilized to ensure that infrastructure services are provided sustainably and affordably, especially for the poor.
Furthermore, the country cannot afford to dispense with the numerous small-scale independent providers who constantly meet the needs of those urban and rural poor who are not reached by formal providers. Recognizing and strengthening the role of such small-scale providers will be vital if the country is to meet the Millennium Development Goals for improving access to basic services.
Various factors are adversely affecting private sector sentiment in the Philippines. While some risk factors are exogenous and beyond its control, the government can, however, undertake the following actions to reignite private sector interest in infrastructure:
Attempt to reduce general country risk, particularly fiscal risk, as much as possible. Doing so would improve both the overall investment climate and the business environment for infrastructure. The government is already making efforts in this area. The deteriorating business environment for infra-structure is affecting the performance of both public and private infrastructure investments. Chapter 2 contains detailed recommendations for improving that environment.
Strive to attract private investments on a trans-parent and competitive basis instead of through unsolicited bids. The current situation of near dominance of unsolicited bids in private sector engagement has resulted in a project identifi-cation process largely driven by the private sector instead of determined by the public interest. The nontransparent nature of unsolicited bids gives much more room to legal challenges and to corruption. The lack of competition will most likely lead to the result that public-sector benefits
•
•
WorldBankInfra.indb 68 12/6/2005 8:41:07 AM

Chapter 4 Maximizing the Benefits of Private Sector Participation ��
In the private sector interviews introduced in box 4.2, respondents
stated that many of the problems associated with private sector par-ticipation had little to do with the BOT Law and its implementing rules and regulations (IRR), and more to do with the overall business environment. Indeed, a majority of the interviewees said that the BOT Law is a good law that the country can be proud of. However, they did point out various issues in the BOT Law and its IRR that they felt needed improvement. The over-arching problem identified was the vagueness surrounding the inter-pretation of the BOT Law and its IRR, particularly related to its policy toward unsolicited bids.
Interviewees were particularly concerned about the need to clarify
the government’s stance with regard to the provision of subsidies for unsolicited BOT proposals. Current rules create a contradiction when projects require subsidies or guarantees. These can only be given to solicited BOT projects, with the government agencies preparing the projects and determining the required subsidy. Unfortunately, many government agencies, espe-cially LGUs, do not have the skills or resources to prepare the project up to the point where it can be the subject of a bidding contest. With strict implementation of the rule on unsolicited BOT proposals (no direct subsidy provision), they felt that projects that require subsidies or guarantees might never take off.
Respondents felt that it might not be possible to do away com-
pletely with unsolicited BOT projects because, in addition to the constraint that many government agencies face in preparing com-petitive BOT projects, unsolicited projects offer greater room for cre-ativity and innovativeness of private sector involvement.
The key is not to do away with unsolicited projects, but maximize competition even in unsolicited projects. The important point in unsolicited BOT projects is to distin-guish between what is proprietary (and therefore cannot be revealed to the challenger) and what is not.
Source: Felipe M. Medalla. 2004. “Private Sector Participation in Infrastructure in the Philippines: Lessons from Selected Case Studies and Interviews with Private Sector Participants.” October. World Bank, Manila.
Box 4.7How do private sector participants in infrastructure projects view the BOT Law and its implementing rules and regulations?
are not maximized. To establish the credibility of private sector participation in infrastructure, it is vital that this situation be reversed. The benefits of such participation can be greatly improved and the problems can be greatly reduced if projects in the Philippines that entail the participation of the private sector are carried out on a trans-parent and competitive basis, instead of through unsolicited bids. The target should be that the majority of transactions be competitive, rather than the opposite.
Budget sufficient resources for preparing quality preinvestment studies for projects that are likely to attract private investors. Good project preparation work—including feasibility studies, engineering design, and financial packaging—will enable the government to more effectively tender projects for competition. Current funding constraints limit the government’s ability to do this, and have been one of the main reasons for unsolicited proposals for private sector participation, as the proponents finance such studies. This should not be the case, since the limited resources spent on such studies will enable wider interest by investors and allow the government to secure better terms, as a result of both wider competition and reduced uncer-
•
tainty to be faced by potential investors. As the Manila water concession has demonstrated, such expense can indeed be recovered from private sector participation proceeds.
Clarify the rationale for public support for private infrastructure projects, and identify and use appropriate instruments to meet development objectives. Where cash subsidies are warranted, output-based mechanisms should be explored to achieve better targeting and subsidy efficiency (box 4.5 above). For subsidies in the form of guar-antees, the exemption of infrastructure-related GOCCs of the $7.5 million ceiling on outstanding government guarantees for foreign loans to GOCCs needs to be reviewed. Guarantees should be used judiciously, based on careful analysis as to which parties are best equipped to deal with specific risks. There will almost always be risks that the government is better able to control or manage than private operators. By providing private operators with a guarantee against such risks, the government can reduce overall project costs. The challenge, however, is to identify and precisely define those risks and to evaluate and account for the cost to the government of providing such guarantees.
•
WorldBankInfra.indb 69 12/6/2005 8:41:07 AM

�0 Philippines: Meeting Infrastructure Challenges
To make informed decisions about which risks it should
assume, a government needs to consider how to measure risks and incorporate them in its accounts and budgets. Otherwise, it may be courting financial disaster.
Identifying and listing guaranteesThe first and simplest step that governments can take to improve the monitoring and management of risks is to compile and publish a list of their contingent liabilities and the maximum amounts they stand to lose. The New Zealand government presents this infor-mation in its statement of con-tingent liabilities published on the Internet (http://www.treasury.govt.nz).
Calculating expected lossesWhile helpful, the listing of guar-antees and possible maximum losses does not indicate what losses a government should expect. The calculation of expected losses is sometimes feasible using rela-
tively straightforward techniques: in cases where a government has issued a large number of similar guarantees for many years and has recorded information on defaults, the expected cost of the guar-antees can be estimated actuarially in the same way as, for example, car insurance premiums are calcu-lated. In other cases, techniques developed to value financial deriva-tives (such as options, futures, and swaps) can also be used to value guarantees. Extending a credit guarantee, for example, is equiv-alent to the government’s selling—at zero prices—a put option to the lender, which can be valued using option-pricing techniques. Such techniques are being used to value guarantees in Colombia and the United States.
Incorporating expected losses in accounts and budgetsExpected losses, once they are reliably calculated, should be incor-porated in government accounts and budgets. For most govern-
ments, however, these systems are cash-based. Although it is both possible and desirable to note guarantees and other noncash items in what are essentially cash-based accounts and budgets, fully incorporating them requires a shift away from cash-based systems. Cost-based budgeting, though, is not easy to implement, and in addition to estimating default risks, requires a shift to accrual accounting. Despite the fact that the Philippine accounts and budget systems are not well equipped, this should be a long-term goal for the government for better management of guarantees.
Sources: Mateen Thobani. 1999. “Private Infrastructure and Public Risk.” Devel-opment and Finance. 1999. Volume 36, No. 1. March. International Mon-etary Fund, Washington, D.C.; Timothy Irwin. 2003. Public Money for Private Infrastructure: Deciding When to Offer Guarantees, Output-Based Subsidies, and Other Forms of Fiscal Support. Washington, D.C.: World Bank. July; and World Bank staff.
Box 4.8Measuring, budgeting, and accounting for guarantees
Require a central unit such as DOF to evaluate all guarantee applications, in the event that guar-antees have to be provided. DOF should establish an appropriate guarantee framework for infra-structure projects, including clear and transparent criteria for project selection, public support, and proper accounting of the fiscal costs and risks of these investments. Box 4.8 highlights some steps that other countries have taken with regard to guar-antees and the resulting contingent liabilities. Strengthen the enabling policy framework by improving the BOT Law and its IRR, particularly in the way unsolicited bids are dealt with. Box 4.9 highlights ways in which the policies for dealing with unsolicited bids could be strengthened.
•
•
Improve the public’s perceptions of private sector infrastructure providers. The public does not seem to be averse to private involvement in infrastructure, but holds several misconceptions about private provision, as well as the institu-tions that regulate private provision, such as the Energy Regulatory Commission and the Toll Regulatory Board. A targeted public information campaign using various media outlets is likely to go a long way in reducing these misconcep-tions. The objective would be to engender better public appreciation of the project process and the role of private sector finance in infrastructure provision, which can facilitate more rational tariff setting.
•
WorldBankInfra.indb 70 12/6/2005 8:41:07 AM

Chapter 4 Maximizing the Benefits of Private Sector Participation �1
Although the Philippines is one of the few countries that has a
policy for dealing with unsolicited bids, the only successful challenge to an unsolicited proposal has been the NAIA terminal 3 bid by Asia’s Emerging Dragon Corporation (AEDC). Other countries have had a greater number of successful chal-lenges—in Chile approximately half of all unsolicited projects are chal-lenged successfully; in Korea one-third are challenged, and about half of these successfully. Possible reasons for the lack of successful challenges in the Philippines are:
Unnecessary preconditions for a challenge. Among the three conditions allowing unsolicited projects, the first states that an unsolicited bid is allowed if “…the project involves a new concept or technology and/or is not part of the list of priority projects.” This lays the ground for ambi-
•
guity in the event of a challenge since the original proponent can always claim a new concept. This precondition could deter possible challengers, and therefore may not be required.
Unrealistic time frames for deci-sionmaking. As the table shows, it would appear that the Philip-pines is relatively quick in making decisions (about 8 months). However, there are only 30 days from when a project is published in which a counter-proposal can be submitted—a deadline that is enforced. But, because of the complexity involved in infra-structure bids, this is likely an additional deterrent to potential challengers.
An impractical counter-proposal policy. Under the current policy, if a challenger submits a bid, the original proponent is given
•
•
the option of matching the price offered by the challenger. This can be a disincentive to challengers if the original pro-ponent can readily match the challenger’s price.
With experience, most other countries have changed their policies on unsolicited proposals for infrastructure projects. Pos-sible ways for the Philippine gov-ernment to improve its current approach include changing the existing policy so that there are more challenges; putting out to bid all unsolicited proposals, with no advantage to the original pro-ponent; and adequately compen-sating the original proponent for legitimate project development costs if the challenge is successful.
Sources: John T. Hodges. 2003. “Unso-licited Proposal.” Public Policy for the Private Sector. Note 258. World Bank, Washington, D.C.; and World Bank staff.
Box 4.9Improving policies for unsolicited bids in the Philippines
Time frames in decisionmaking, selected countries (months)
Preliminary approval
Final approvalCall for open
tendersChallenge/
Counter-proposalAdditional time Total
Chile 7.0 12 12 Approx. 2–4 — 33–35
Philippines 2.0 3 Undetermined 2 1a 8 +
South Africa 1.0 9 3 2 2b 17
Korea, Rep. of 0.5 4 Undetermined Approx. 2–4 — 6.5–8.5+
— = not available.a. To counter match. b. To evaluate.Source: John T. Hodges. 2003. “Unsolicited Proposal.” Public Policy for the Private Sector. Note 258. World Bank, Washington, D.C.
Endnotes1 For comparability across countries, only estimates from the
World Bank’s Private Participation in Infrastructure Database for the Philippines were used for this figure.
2 By number, there are 48 projects under the greenfield type, 17 for concessions, and one each for management and lease contracts and for divestitures.
3 For the International Country Risk Guide risk index, out of 22 countries, the Philippines ranked 13 in the political risk category; 16 in the financial risk category; 14 in the economic risk category; and 13 in the composite risk category. For the Economist Intel-ligence Unit composite country risk score, on a scale of 1 to 100 (with 100 being most risky), the Philippines scored 53.
4 World Bank. 2004. “East Asia & Pacific Private Investors in Infra-structure: Perception Survey,” (http://lnweb18.worldbank.org/eap/eap.nsf/Attachments/survey/$File/Investors_Report.doc).
5 Timothy Irwin. 2003. Public Money for Private Infrastructure: Deciding When to Offer Guarantees, Output-Based Subsidies, and Other Forms of Fiscal Support. Washington, D.C.: World Bank.
6 Ibid. 7 This section is based on interviews with various government
officials and planning agencies.8 For a recent global review of privatization, regulation, and compe-
tition in infrastructure, see Ioannis Kessides. 2004. Reforming Infrastructure. Washington, D.C.: World Bank.
WorldBankInfra.indb 71 12/6/2005 8:41:08 AM

Edwin Huffman/World Bank
WorldBankInfra.indb 72 12/6/2005 8:41:16 AM

Chapter 5
The Way Forward
Building on strength and success
Tackling the issues discussed in the previous chapters—improving the business envi-ronment; enhancing planning, coordination,
and financing; and maximizing the benefits of private sector participation—is undeniably challenging. The strategy for going forward should be firmly anchored in the Philippines’ strengths and the reforms that have already been initiated by the government in the various infrastructure sectors. The Philippines has the benefit of existing institutions that can be utilized to address these issues, as well as technical expertise at these institutions.
Major reform measures in the power, water, transport, and telecoms sectors have already been initiated, and the key to achieve sustained improvement lies in rapid and consistent implemen-tation. Though yielding mixed results, the private sector-led infrastructure development strategy has been one of the most progressive in the region, and has been a pillar of infrastructure investment.
Moreover, public perceptions of private sector participation in basic infrastructure services are generally positive: more than half of 300 survey respondents seem to think that it would benefit the country, as detailed in chapter 4 and appendix 4. Finally, private sector investors are familiar with and interested in the sector, provided that conditions are right. For example, measures such as recent tariff hikes in the power sector, combined with a strong commitment toward maximizing competition and attracting the private sector, are beginning to bear fruit. This was seen in the government’s successful conclusion, in December 2004, of the first major privatization of a power plant (Masinloc), with privatization proceeds of $560 million considerably exceeding expectations.1
The Philippines is also experimenting with innovative ways, such as output-based aid, to improve efficiency of subsidy delivery in power, and in water and sanitation. The passage of the anticorruption Government Procurement Reform Act of 2002, the establishment of the Office of the Ombudsman under Republic Act 6770, otherwise known as the Ombudsman Act of 1989, and involvement of civil society organizations as observers in bidding processes, are encouraging developments that are vital for increasing transparency and accountability, and for reducing costs and delays in the public procurement process for infrastructure projects. Successful experiences with community-driven devel-opment in effectively and transparently providing community infrastructure, such as the Kapit-Bisig Laban sa Kahirapan—Comprehensive and Integrated Delivery of Social Services (Kalahi-CIDSS), can be scaled up to introduce better accountability at the local and national levels. The positive experience of progressive LGUs in infrastructure development and governance improvements can be replicated. And while there are factors that impede its devel-opment, progress has indeed been made toward enhancing LGU access to loan and bond financing. For example, the Local Government Unit Guarantee Corporation was created in March 1998 to guarantee debt issues of LGUs when these issues are financed from private sources. It is the first privately managed local government guarantee corporation set up in a developing country of Asia.
These strengths, success stories, and ongoing reform initiatives provide a broad base for a strategy to tackle the remaining and increasingly serious challenges that, in aggregate, have resulted in further infrastructure deterioration. Moving forward to achieve results, however, would inevitably require more difficult measures on various fronts. Strategic
WorldBankInfra.indb 73 12/6/2005 8:41:16 AM

�� Philippines: Meeting Infrastructure Challenges
considerations should be given to the evaluation of various trade-offs among the different approaches and how to prioritize and sequence reforms.
Prioritizing reforms: Key considerations
The preceding cross-sectoral chapters, as well as the following sector-specific chapters, propose a detailed menu of reforms. It is clear, however, that not all of the proposed reforms can be carried out simultaneously. This is primarily due to financial, political, and capacity constraints. Some of the proposed reforms require increases in public expenditures, but public funding is limited, especially given the current fiscal situation. Other reforms are politically challenging to implement, such as increases in tariffs to achieve cost recovery, and measures that would require legis-lative actions. Prioritization is needed also because government capacity to carry out multiple reforms at the same time is greatly constrained. Lastly, trade-offs between different policy measures need to be recognized and carefully evaluated.
Given this reality, it is important to provide a framework that attempts to prioritize the proposed reforms to make the trade-offs more explicit. This
may be done in many ways, with key considerations including: international comparisons that illustrate the areas in which the Philippines lags behind its competitors; comparing the estimates of the overall economic impact of the proposed reforms; and the government’s current priorities in medium-term development. While none of these criteria would give the “right” answer, taken in conjunction, they provide indicative inputs to help policymakers prioritize reforms. This chapter tries to suggest some priorities based on evaluation of multiple criteria. Even then, the objective of this chapter is not to provide definitive “answers” but to provide inputs to the decisionmaking processes of the authorities in the Philippines.
International comparisonsPhilippine infrastructure should be on a par with that of its regional competitors to ensure business competitiveness and sufficient living standards. Inter-national comparisons are useful in this regard, but should not be made without consideration of the local context. Each country has location-specific charac-teristics that limit data comparability and hence the basis for resulting policy decisions.
Table 5.1 helps identify the areas in which the
Table 5.1International comparisons of infrastructure
Power Telecoms Water and sanitation Roads
Electrification rates (%)a
2000
Quality of electric
supply (Scale 1–7)b
2003/04
Trans-mission and distribution losses (%)c
2002
Mainlines per 100 peoplec
2003
Mobile sub-scribers per 100 peoplec
2003
Pop w/access to improved
sanitation (%)c 2002
Pop w/access to improved water (%)c
2002
Total road network
(km/1,000 people)c
Paved roads per land area (km/sq. km)c
Australia 100 6.7 6.64 54.23 71.95 100 100 — —Korea 100 6.1 5.99 53.83 70.09 — 92 1.8 0.55Singapore 100 6.7 8.52 45.03 85.25 100 100 0.8 4.67China 98 4.2 7.12 20.90 21.48 44 77 1.4 —Malaysia 96 5.9 5.55 18.16 44.20 — — 2.9 0.15Mongolia 90 — — 5.62 12.98 59 62 20.1 ..Thailand 82 5.3 7.26 10.49 39.42 99 85 3.1 0.11Philippines 80 3.7 16.33 4.12 26.95 73 85 2.5 0.06Vietnam 75 3.4 14.00 5.41 3.37 41 73 1.2 —Sri Lanka 62 3.2 18.11 4.90 7.27 91 78 — —Indonesia 53 3.6 16.16 3.94 8.74 52 78 1.7 0.12India 43 3.0 26.21 4.63 2.47 30 86 3.2 —
Philippines rank
8 of 12 8 of 11 9 of 11 11 of 12 6 of 12 5 of 105 of 11 (equal)
6 of 12 6 of 12
— = not available; .. = less than .01; km = kilometer; sq. km = square kilometer; pop. = population; w/ = with.
Note: For road indicators, figures are as of 2002 except for Vietnam and Malaysia (1999) and Korea (2001).
Sources: a. International Energy Agency. World Energy Outlook 2002; Philippines National Electrification Administration; estimates for Korea and Australia; b. World Economic Forum. Global Competitiveness Report 2003–2004; c. World Bank. World Development Indicators 2004.
WorldBankInfra.indb 74 12/6/2005 8:41:16 AM

Chapter 5 The Way Forward ��
Philippines lags behind its competitors. It is clear that the country does not perform particularly well in most areas. Broadly speaking, the area of most concern is power, as it consistently ranks in the lower half of the comparison countries based on measures of access, quality of service, and technical efficiency. Fixed telephone line access is also a serious concern from the figures, though the Philippines ranks better on cellular phone access. In terms of water supply and sanitation access, the country performs reasonably well, but as elaborated in chapters 7 and 8, the relatively high access data for water and sanitation, as well as the relatively high road density, conceal the poor quality of services.
Cross-country comparisons, as shown in table 5.2 and discussed extensively in chapter 1, demonstrate that the competitiveness of the Philippine economy in Asia has been undermined by the deterio-rating business environment and low public sector performance, particularly with regard to governance. These factors are also particularly relevant for infra-structure in terms of prioritizing the key actions.
Estimated impact of certain reformsComparing estimates of the overall economic impact of proposed reforms can also be a useful input in prioritization. Simple analyses to estimate consumer surplus, i.e. the net gains to consumers if proposed reforms are undertaken, were carried out for each of the four infrastructure sectors included in this report. It is important to note that the analyses consider only a limited number of sector reform
Table 5.2Competitiveness and business environment comparisons
Growth Competitiveness
Index Ranking(out of 102 countries)
Business Competitiveness
Ranking(out of 102 countries)
Helpfulness of local gov’t. in doing
business in 2000a
Efficiency of local gov’t. in delivering
servicesb
Corruption as constraint to operation
and growth of businessc
Frequency of irregular additional
payments to get things doned
Singapore 6 8 2.0 1.8 1.3 5.8Malaysia 29 26 2.2 2.9 1.9 4.6Thailand 32 31 2.3 3.3 3.5 2.8China 44 46 2.6 2.9 2.0 —Philippines 66 64 2.6 3.4 3.1 3.6Indonesia 72 60 3.0 3.8 2.6 2.8Cambodia — — 2.2 — — 3.5
Philippines rank
5 of 6 6 of 6 5 of 7 (equal) 5 of 6 5 of 6 5 of 6
— = not available.
Sources: World Economic Forum. Global Competitiveness Report 2003–2004 (http://weforum.org); World Bank. “World Business Environment Survey 2000.” Washington, D.C.
a. 1 very helpful, 6 very unhelpful. b. 1 very efficient, 6 very inefficient. c. 1 no obstacle, 4 major obstacle. d. 1 always, 6 never.
scenarios and rely on less than perfect data. They also exclude the benefits of reforms that are particularly difficult to measure, including reducing corruption and improving regulation. Results should therefore be considered as broad estimates. More compre-hensive, detailed analyses would be needed to refine the numbers and consider additional, more complex reform measures. Used with caution, however, such analyses can provide broad indications as to which reforms are likely to have the largest overall economic impact.
Consumer surplus analyses were carried out to provide rough estimates of the overall economic impact of certain proposed reforms. Appendix 5 discusses these analyses in greater detail. The reform scenarios and results of the analyses are summarized in table 5.3.
PowerThe reforms in the power sector have resulted, and will continue to result, in significant changes in end user tariffs, particularly due to increases in National Power Corporation (NPC) tariffs, and the implementation of the wholesale electricity spot market (WESM). Using standard consumer surplus analysis, the model calculates the change in consumer surplus resulting from these tariff changes to be in the range of $2.4 billion–3.2 billion over five years. These economic gains are also accompanied by significant financial gains. In the short term (until 2006), given continued implementation of the energy reform program—including tariff increase, reduction of
WorldBankInfra.indb 75 12/6/2005 8:41:16 AM
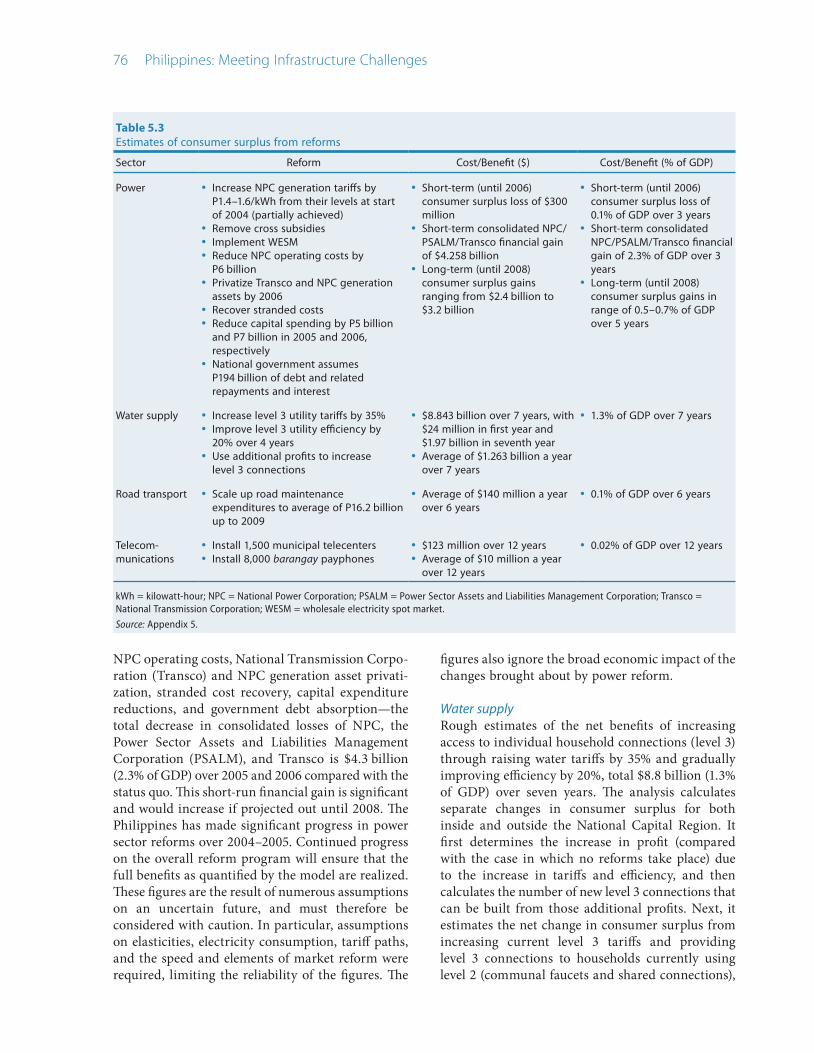
�� Philippines: Meeting Infrastructure Challenges
Table 5.3Estimates of consumer surplus from reforms
Sector Reform Cost/Benefit ($) Cost/Benefit (% of GDP)
Power Increase NPC generation tariffs by P1.4–1.6/kWh from their levels at start of 2004 (partially achieved)Remove cross subsidiesImplement WESMReduce NPC operating costs by P6 billionPrivatize Transco and NPC generation assets by 2006Recover stranded costs Reduce capital spending by P5 billion and P7 billion in 2005 and 2006, respectivelyNational government assumes P194 billion of debt and related repayments and interest
•
•••
•
••
•
Short-term (until 2006) consumer surplus loss of $300 millionShort-term consolidated NPC/PSALM/Transco financial gain of $4.258 billionLong-term (until 2008) consumer surplus gains ranging from $2.4 billion to $3.2 billion
•
•
•
Short-term (until 2006) consumer surplus loss of 0.1% of GDP over 3 yearsShort-term consolidated NPC/PSALM/Transco financial gain of 2.3% of GDP over 3 yearsLong-term (until 2008) consumer surplus gains in range of 0.5–0.7% of GDP over 5 years
•
•
•
Water supply Increase level 3 utility tariffs by 35%Improve level 3 utility efficiency by 20% over 4 yearsUse additional profits to increase level 3 connections
••
•
$8.843 billion over 7 years, with $24 million in first year and $1.97 billion in seventh year Average of $1.263 billion a year over 7 years
•
•
1.3% of GDP over 7 years•
Road transport Scale up road maintenance expenditures to average of P16.2 billion up to 2009
• Average of $140 million a year over 6 years
• 0.1% of GDP over 6 years•
Telecom-munications
Install 1,500 municipal telecentersInstall 8,000 barangay payphones
••
$123 million over 12 yearsAverage of $10 million a year over 12 years
••
0.02% of GDP over 12 years•
kWh = kilowatt-hour; NPC = National Power Corporation; PSALM = Power Sector Assets and Liabilities Management Corporation; Transco = National Transmission Corporation; WESM = wholesale electricity spot market.
Source: Appendix 5.
NPC operating costs, National Transmission Corpo-ration (Transco) and NPC generation asset privati-zation, stranded cost recovery, capital expenditure reductions, and government debt absorption—the total decrease in consolidated losses of NPC, the Power Sector Assets and Liabilities Management Corporation (PSALM), and Transco is $4.3 billion (2.3% of GDP) over 2005 and 2006 compared with the status quo. This short-run financial gain is significant and would increase if projected out until 2008. The Philippines has made significant progress in power sector reforms over 2004–2005. Continued progress on the overall reform program will ensure that the full benefits as quantified by the model are realized. These figures are the result of numerous assumptions on an uncertain future, and must therefore be considered with caution. In particular, assumptions on elasticities, electricity consumption, tariff paths, and the speed and elements of market reform were required, limiting the reliability of the figures. The
figures also ignore the broad economic impact of the changes brought about by power reform.
Water supply Rough estimates of the net benefits of increasing access to individual household connections (level 3) through raising water tariffs by 35% and gradually improving efficiency by 20%, total $8.8 billion (1.3% of GDP) over seven years. The analysis calculates separate changes in consumer surplus for both inside and outside the National Capital Region. It first determines the increase in profit (compared with the case in which no reforms take place) due to the increase in tariffs and efficiency, and then calculates the number of new level 3 connections that can be built from those additional profits. Next, it estimates the net change in consumer surplus from increasing current level 3 tariffs and providing level 3 connections to households currently using level 2 (communal faucets and shared connections),
WorldBankInfra.indb 76 12/6/2005 8:41:17 AM

Chapter 5 The Way Forward ��
level 1 (point sources), and self-provisioning as their main water source. In total, 8.96 million people gain access to level 3 connections, with approximately 90% of the net gain in consumer surplus coming from outside the National Capital Region. The model does not take into account improvements in water quality or, as an individual gains a level 3 connection, the reductions in time taken to collect water. In addition, the model requires numerous nationwide averages on tariffs, expenditures, and consumption, which limit the significance of the results, particularly at the local level.
Road transport The exercise determines the net benefits of scaling up maintenance expenditures for the national road network to an average of P16.2 billion until 2009. Doing so would make up for a backlog of preser-vation works and reverse declining road conditions. The net benefits are approximately $140 million on average until 2009, or 0.1% of GDP. These benefits are extremely conservative, given the limits of the model: the reform scenario analyzed here focuses on increased maintenance exclusively (i.e. it does not include targeted expansions of the network); it does not include estimates of reductions of nonmarket benefits costs, stemming from reduced travel time (and costs of congestion in Metro Manila alone were estimated at 4.6% of GDP in 1996) or increased road safety; and it does not include estimates of benefits from increased vehicle travel due to economic growth. Additionally, the model also employs numerous assumptions regarding the status quo scenario and price elasticity that further underestimate the benefits of increased maintenance expenditures.
Telecommunications To increase telephone access, the report “Extending Access to Communication and Information: Recom-mended Approach and Implementation Plan”2 calls for an expansion of service to underserved munici-palities and barangays over five years through the installation of 1,500 municipal telecenters and 8,000 barangay payphones. The model estimates that the approximate net economic benefit resulting from this expansion plan totals $123 million (0.02% of GDP) over 12 years. The benefits include the additional operating revenues and added consumer surplus resulting from the new services. The plan for rural access would result in over 1 million more telephone users who had no previous access. Due to lack of data, these estimates are based on numerous assumptions.
They do not take into account increased access to computers and the Internet, which the telecenters will also include. Neither do they consider the oppor-tunity cost of the build-out plan. In addition, broad assumptions on average prices, quantities, costs, municipalities, and barangays limit the reliability of the figures. The figures used in the analysis are best estimates of “representative” figures.
Stated government prioritiesThe government’s latest plans for dealing with devel-opment challenges are laid out in the Medium-Term Philippine Development Plan (MTPDP) 2004–2010, released in November 2004. Developed with close involvement of the president and wide participation of government agencies, the MTPDP is based on a number of pillars that cover sector reforms and cross-cutting issues. The key challenges that the MTPDP tries to address include, in President Macapagal-Arroyo’s own words, “a still untamed fiscal deficit, insufficient infrastructure, rapid urbanization that has congested our cities, especially Metro Manila, the growing number of jobless Filipinos, and the inef-ficient delivery of basic services.” 3 A major focus of the MTPDP is infrastructure development. Of the president’s “10-point agenda” that forms the core of the MTPDP, four points are directly associated with infrastructure: decentralization of development across the country through transport network and digital infrastructure; provision of water and energy to all barangays; decongesting Metro Manila; and development of the Subic and Clark areas. Some of the measures highlighted in the MTPDP for infra-structure development are:
Improve public-private partnerships in infra-structure provision (e.g. review the Build-Operate-Transfer Law and its implementing rules and regulations, particularly in energy, ports, and aviation).Create the Philippine Infrastructure Corporation, through which the government can provide seed money to attract or revitalize private sector participation in infrastructure.Generate more infrastructure with minimal budget cover or contingent liabilities.Develop a “user pays” culture where road users will pay at least for the maintenance of the roads; allow strategic allocation of public resources, with the hierarchy of priority activities as maintenance of existing assets, rehabilitation, improvement and widening of roads, and expansion of new roads.
•
•
••
WorldBankInfra.indb 77 12/6/2005 8:41:17 AM

�� Philippines: Meeting Infrastructure Challenges
Pursue power sector reform with successful priva-tization of NPC assets, government absorption of NPC debt, adopting the right pricing policy, estab-lishment of WESM, and strengthening of electric cooperatives; Energy Regulatory Commission processes will be streamlined and performance will be assessed.Fully implement Executive Order 279 (institution-alizing reforms in water financing and rational-izing the Local Water Utilities Administration) and Executive Order 123 (reconstituting the National Water Resources Board, to carry out economic and resource regulation mandates); provide potable water to the entire country with continued capacity-building programs for water service providers; and promote private or public sector investment to provide water in waterless barangays and municipalities.
Other important policies pronounced by the MTPDP that are closely related to infrastructure include:
Balance the national government budget in six years with a combination of revenue measures and disciplined, efficient public spending.Strengthen the Investment Coordination Committee process of the National Economic and Development Authority board.Implement the government agency rationalization and reorganization plan.Improve the performance of government owned and controlled corporations. Make anticorruption one of the key reform packages through measures such as improving and simplifying agency processes, strength-ening procurement reforms, assuring wide public scrutiny of projects, strengthening life-style checks, strengthening of the Office of the Ombudsman, and implementing effective pros-ecution and conviction.
The way forward: Key recommendations
The above analyses, while not pointing directly to definitive answers, provide useful guidance in answering the question of prioritization. In fact, there is overall consistency between the government’s latest priorities and the results of the analyses. The recommendations, as summarized in this section, are generally in line with the government’s stated
•
•
•
•
•••
priorities, in terms of both cross-sectoral issues and sector-specific strategies, and in most cases further develop the broad policy statements of the MTPDP.
In order to optimally plan for, and provide, infrastructure in a decentralized, market-driven, and often politicized setting, the central challenge for the Philippines is to reestablish the credibility of public sector institutions and restore the “social compact” between the government and its citizens for effective service delivery. This can be achieved through consistent implementation of: a rigorous fiscal reform program; key sector reforms in infra-structure; proactive planning and coordination of investments instead of reacting to changing circumstances in a “boom-bust” manner; and a few focused investments in the short term through public-private partnership to address key bottlenecks and achieve quick gains in service delivery. In the aggregate, reducing the inherent short termism in infrastructure policymaking and improving the business environment can be expected to increase the performance of both the public and private sectors. Resolving ambiguities in the Build-Operate-Transfer Law, and improving the selection and preparation of projects of interest to potential investors, can further renew private sector interest.
The tasks are demanding but achievable. Experience in other countries shows that, through clear direction and consistent implementation, a turnaround in public perception and actual results can be achieved over the short to medium term.
Cross-sectoral prioritiesThe two key immediate cross-sectoral priorities are as follows: (a) to improve the business environment—in particular, to take steps toward implementing cost-covering tariffs (subsidies, where justified, could be used as part of the cost-recovery equation); and (b) to implement a rigorous and credible fiscal reform program. Moving or continuing to move toward cost recovery, particularly in the power, water, and transport sectors, will have a direct and positive effect on the fiscal situation. Likewise, improving the fiscal situation will increase the resources available for public and private infrastructure projects by freeing budgetary resources, reducing the cost of capital, and improving investors’ perceptions of country risk. Improving the business environment requires continuing and accelerating reforms in the key sectors, particularly in power, water supply and sanitation, and roads. The government can also start immediately to address key bottlenecks and tap private investment by
WorldBankInfra.indb 78 12/6/2005 8:41:17 AM

Chapter 5 The Way Forward ��
proactively helping resolve issues surrounding some of the stalled private sector investment projects, and improving the way in which pipeline projects are prepared and competitively tendered.
Over the short to medium term, the two key cross-sectoral priorities will be: (a) to strengthen the policy planning and coordination environment, which is directly and indirectly affecting infrastructure provision at all levels—particularly at the regional level vis-à-vis the “missing middle” (see the section “Regional infrastructure provision and the ‘missing middle’ ” in chapter 3); and (b) to maximize the benefits of decentralization, so as to improve the way in which infrastructure is delivered at the local level. Both of these priorities will require the government to address difficult but significant political-economy issues so as to reduce undue political intervention in planning, prioritization, coordination, and delivery.
Sector-specific prioritiesAs far as sector-specific priorities are concerned, the following sector-specific chapters covering power, water supply and sanitation, roads, and telecom-munications make recommendations. International comparisons of performance in these various sectors, estimates of the impact of some of the proposed reforms on consumer surplus, and an analysis of the government’s own priorities as laid out in the MTPDP point to three key objectives that warrant urgent attention: addressing the financial deficits of the power sector, reversing the recent decline in access to water services, and addressing congestion issues in the main cities.
Cross-sectoral recommendationsThe following paragraphs summarize the main cross-sectoral recommendations put forward in the present report.
Implement a vigorous and credible fiscal reform program. A credible and sustained period of fiscal reforms—in particular, increasing tax revenues—will convince participants in both domestic and international financial markets to step up invest-ments. Contingent liabilities from infrastructure programs should be carefully accounted for and managed: guarantees should be used judiciously, based on a clear rationale and appropriate risk allocation.
Foster cost recovery by aligning infrastructure tariffs with costs in an economically coherent
•
•
manner, and in a way that minimizes the negative impact of price increases, specifically for the poor. The key measures consist of continued power tariff adjustments according to accepted rules, including adequate and timely approval of the universal charge for PSALM to recover stranded costs; clarification and enforcement of cost-recovery regulations for the water and sanitation sector to enable service expansion; an increase in the fuel levy for road mainte-nance expenses; and adherence to agreed toll rate adjustments for toll road rehabilitation and expansion. Consumer surplus analysis of the required cost-recovery measures shows that the priority in tariff adjustments should be given to power, followed by water tariffs, and then the fuel levy increase. Subsidies can be used as part of the cost-recovery equation but only where valid for equity or efficiency reasons. Better targeting and management of subsidies can, in effect, increase public resources that could be used for cost-recovery purposes. Good examples in the country, such as the lifeline power tariff and ongoing experimentation with output-based aid, can be scaled up.
Improve governance and further step up anticor-ruption efforts by vigorously implementing the 2002 Government Procurement Reform Act and complementing it with financial management reforms. Other specific actions include strength-ening the monitoring and enforcement capa-bilities of the key anticorruption oversight agencies; insisting on consistent disclosure and verification of assets by public officials; accel-erating the information-transparency aspects of procurement reform, including civil society monitoring and timely posting of bid invitation and award results; and initiating an aggressive effort on simplification of government trans-action procedures, so as to rapidly reduce the number of steps involved and discretionary powers. Corporate governance of public utilities should also be improved by appointing qualified and experienced corporate board members and executives; providing more operational autonomy to corporate management while establishing clear performance targets based on which the management may be rewarded or penalized; regular disclosure of utility performance; and involving the public in monitoring the service levels of public utilities.
•
WorldBankInfra.indb 79 12/6/2005 8:41:17 AM

�0 Philippines: Meeting Infrastructure Challenges
Engage private investment in a competitive manner and resolve issues surrounding stalled private sector projects. The benefits of private sector partici-pation can be greatly improved and the problems can be greatly reduced if projects that entail such participation in the Philippines are carried out on a transparent and competitive basis, instead of through unsolicited bids. The target should be that the majority of transactions be competitive, rather than the opposite. In the meantime, with the government’s proactive measures, private sector transactions that have been suspended or delayed for several years may move forward and translate into visible results quickly. A number of toll roads are in such status, all of which are critical for relieving the key bottlenecks and are largely financially viable. For the water sector, quick resolution of the financial rehabilitation of the troubled concessionaire, Maynilad Water Services, Inc., is critical for investments to be made for service expansion, sanitation improvement, and new bulk water sources.
Improve planning and preparation of private sector participation in infrastructure. The government can maximize the benefit of private investors’ interest and avoid the disadvantages from unso-licited bids by adequately preparing promising projects for competitive tendering. The rela-tively small amount of funding spent on such preparation work will enable wider interest by investors and allow the government to secure better terms, as a result of both wider competition and reduced uncertainty for potential investors. As privatization of the Manila water concession has demonstrated, such expense can indeed be recovered quickly, at the financial closure of the transactions. Quick preparation and tendering of the most critical infrastructure projects in this way can result in visible improvements in a relatively short time. To maximize the benefits of private sector participation, the government can also explore the possibility of establishing a dedi-cated infrastructure fund, and means to better leverage ODA funds with private investments.
Strengthen and reorient central agencies, such as the National Economic and Development Authority, Department of Finance, Department of Budget and Management, and interdepart-mental committees, to improve planning, priori-tization, and monitoring of national government
•
•
•
resources. The focus of oversight responsibilities can shift from a detailed project-level approval process to a broader and more forward-looking role for reform championship, strategy formu-lation, and policymaking. The oversight agencies should consider taking a more proactive role in initiating, promoting, and monitoring systemic reforms for the infrastructure sector, and should address important policy issues that can guide the decisionmaking process for projects and transac-tions cutting across sectors. Ensuring planning and its implementation in a decentralized and often politicized environment is a very chal-lenging task. Effective instruments to implement plans, such as the use of incentive-based intergov-ernmental fiscal transfers and targeted subsidies, and wide reliance on performance benchmarking, should be carefully studied and consistently implemented. It is also important to ensure extensive stakeholder participation during the strategy development and planning process to secure wide public support of the outputs.
Provide incentives and technical assistance to LGUs to raise more revenues and improve performance. This will entail benchmarking LGU financial and institutional performance, and introducing perfor-mance-based criteria to the national government’s fiscal transfer programs to LGUs to incentivize revenue mobilization and performance enhance-ments. Technical assistance to LGUs, in revenue mobilization and infrastructure investment planning and preparation, is also important. The national government should also strengthen ongoing efforts in advancing local interjurisdic-tional cooperation by providing more authority to the regional development councils and giving higher priority to the province level, with regard to intergovernmental fiscal transfers.
Sector-specific recommendationsThe priority actions for sector-specific reform and development include the following.
Addressing the power sector financial deficit and implementing reforms
Achieving and sustaining the financial viability of NPC/PSALM is a major priority. This would entail increasing cost recovery in charges and ensuring that the privatization program is care-fully managed to achieve the expected sales values and the financial turnaround.
•
•
WorldBankInfra.indb 80 12/6/2005 8:41:17 AM

Chapter 5 The Way Forward �1
It is important to ensure successful imple-mentation of market restructuring initiated under the Electric Power Industry Reform Act, including the full operationalization of WESM. The prompt resolution of the questions related to price, conditions, and coverage of the transi-tional supply contracts and the bilateral contracts that follow the start of WESM operations will be crucial.The Energy Regulatory Commission needs to be strengthened to be able to undertake the task of price regulation as well as regulate distribution companies. It should be authorized to retain part of its revenues for its operations to be able to attract staff with the necessary skills and experience.
Expanding coverage and quality of water supply and sanitation services
It is vital to raise the overall tariff level to allow for system expansion and improved service quality. An important first step is to issue clear guidelines, in the form of an executive order, on charging cost-recovery water tariffs, and to articulate clear policies on sanitation service tariffs.To overcome current sector fragmentation, key steps include: operationalizing and strengthening the Inter-Agency Oversight Committee for water sector reform; implementing Executive Order 279 on Local Water Utilities Administration reform and water utility financing; and enhancing the
•
•
•
•
capacity of the National Water Resources Board in economic regulation.A nationwide program for public utility reform and performance enhancement should be carried out. Requiring formal corporatization of all public utilities, establishing appropriate governance structure and corporate accounting systems, and benchmarking all public utilities will help instill management discipline. Private sector participation should be encouraged, and should be conducted through well-prepared and structured competitive tendering processes.
Maintaining and expanding the road networkGovernance and accountability of spending at the Department of Public Works and Highways and the Special Road Fund should be improved by establishing accountability for results of road spending at the district and regional levels. Staffing levels should be reduced and performance-based outsourcing increased to improve efficiency.Greater reliance on user charges is needed for the upkeep and development of the road network. The key measures include expanding toll road coverage, charging appropriate toll fees, and increasing user charges through the fuel levy. Private sector interest in road improvements can be more effectively utilized if the government can proactively resolve issues of stalled toll road concessions, address right-of-way delays, and use open competition for project selection.
•
•
•
•
Endnotes1 As of February 2005, the financing for this transaction still
needed to be closed, however.2 Björn Wellenius. 2002. “Extending Access to Communication
and Information: Recommended Approach and Implementa-tion Plan.” Report submitted to the Republic of the Philippines
Department of Transportation and Communications, February 21. PPIAF and World Bank, Manila.
3 National Economic and Development Authority. 2004. “Medium-Term Philippine Development Plan 2004–2010.” Foreword. Manila, Philippines.
WorldBankInfra.indb 81 12/6/2005 8:41:17 AM

Northwind Power Development Corporation
WorldBankInfra.indb 82 12/6/2005 8:41:27 AM

Chapter 6
Power
Overview
The long-standing liquidity problem of the National Power Corporation (NPC), the state-owned generation company,1 is mainly attributable to its undercapital-ization and inadequate tariff adjustments. Since 2002, NPC’s large and growing deficits have been a major element in the country’s worsening fiscal position and debt levels. The financing gap2 of NPC increased sharply from P16.1 billion in 1999 to P84.2 billion in 2003. This, in turn, contributed to the ballooning public sector deficits of the country.
The government is aware that NPC’s heavy reliance on foreign debt finance is unsustainable in the long run. Since June 2004, substantial progress has been made toward the financial recovery of NPC, including increases in the generation tariff that are expected to allow NPC to cover fully its operating costs in 2005; and government absorption of about P200 billion of NPC debt. However, given the high level of its debt, the Consolidated Power Sector Assets and Liabilities Management Corporation (PSALM), including NPC and the National Transmission Corpo-ration (Transco), will remain technically bankrupt in the absence of adequate additional measures. Given that PSALM does not have the resiliency to cope with downside risks, its evolving financial recovery action plan should include a contingency plan and other risk mitigation measures based on rigorous risk analysis. As a last resort, further debt relief by the government would be required to enable Consolidated PSALM to self-finance all of its financial obligations and to sustain financial viability.
In order to bring about a sustainable financial recovery in the power sector, however, additional structural reforms are needed, and the government has launched an ambitious reform agenda. The
Electric Power Industry Reform Act (EPIRA), approved in June 2001, provided the framework for sector reform and the restructuring, recapital-ization, and privatization of NPC assets. While the target dates set for implementation were challenging and have not in fact been met, substantial progress is now being achieved in the establishment of the wholesale electricity spot market (WESM) and in the separation of network operations into generation and retail supply of electricity to end users. After a very slow start, the privatization program is now showing positive results. The winning bid of $562 million for the first sale of a major generating plant (the 600 MW coal-fired Masinloc plant) exceeded expectations.3
Successful implementation of WESM—its design is based on functioning markets in Australia and New Zealand—will be critical to the overall success of the reforms, but much remains to be done to ensure this. Many prospective market participants appear poorly prepared for the market and some (the electric coop-eratives) may not have the financial resources or skills to meet the requirements of the market and properly manage their risk exposure. The poor credit standing of some private investor-owned distribution utilities and of many electric cooperatives will be a barrier to full participation of existing suppliers in WESM. Resolution of the creditworthiness issue will be an important step for a successful market launch.
Sustainable market reform also requires adequate management of the key risks common to other similar competitive energy market reforms:
Ensuring that there is adequate investment and security of supplyManaging price volatility risks by avoiding excessive market power
••
WorldBankInfra.indb 83 12/6/2005 8:41:27 AM

�� Philippines: Meeting Infrastructure Challenges
Ensuring that there are adequate means of managing the exposures to price risks.
In principle, WESM can provide price signals for investment in new generation capacity, but there are concerns that adequate investment may not be seen without some form of government guarantee due to the perceived political and market risks. Improvement in the investment climate should be a top priority for policy. In the short term, additional mechanisms are likely to be needed to ensure security of supply or manage the risks associated with new investment in generation. Adequate transmission investment will be important during the early stages of a competitive wholesale market to limit market power and to avoid excessive localized price volatility without dampening desirable signals for investment in generation.
In a mature market, medium- to long-term contracts for power supply are likely to provide the basis for most new generation. However, the markets for these contracts may take time to develop. In the interim, the successful implementation of transi-tional supply contracts (TSCs), initially with a high level of coverage of energy bought and sold, will be essential both to manage market and price risks, and to provide a more predictable revenue stream for the assets to be privatized. EPIRA requires suppliers to purchase at least 10% of the energy through WESM at spot market prices. This is a higher level of exposure than suppliers are usually willing to bear in other electricity markets, such as, for example, Australia. In the absence of adequate protection mechanisms, it would result in suppliers (and/or end users) bearing substantial financial risks.
Competition and the restructuring of the sector create demanding new tasks for the Energy Regulatory Commission (ERC; see box 6.1). Yet the ERC is struggling with its current tasks, which include regulating 141 distinct distribution companies (including 119 consumer-owned electric cooperatives) on a case-by-case basis. Better ERC performance is essential for the success of the reform program. To achieve this, the ERC needs to be able to attract and retain highly qualified staff, rationalize its processes, and, in particular, develop a streamlined approach to regulating the electric cooperatives. It will take time to overcome the perception, felt by investors and others, that there is a high risk of political or judicial inter-vention and a bias toward consumers’ interests.
Given the ambitious nature of the reform program and the risks involved in any transition toward competitive electricity markets, an effective strategy
•
for managing risk is critical. Specific measures aimed at ensuring security of supply, adequate market monitoring, and implementation of TSCs are some of the components of such a strategy.
Beyond this, the government might want to consider, on a transitional basis, requiring that the weakest suppliers enter into a price stabilization scheme that would protect these suppliers against spot price fluctuations for the power purchases that such suppliers will need to make through WESM in order to serve their captive customers. In addition, the pace of some reforms may well need to be slowed, especially with regard to the introduction of retail competition for residential and small business users. Finally, there need to be clear provisions as to what happens if a distributor or supplier fails: How is continuity of supply to end users assured? Who assumes the previous supplier’s responsibilities and at what price? Each of these elements will increase the complexity of the ERC’s tasks, highlighting the need both for its independence and for proper resourcing and support.
It has to be recognized that implementation of substantial reforms in the power sector is an eminently political process and that, in particular, the increase in electricity prices necessary to restore the financial viability of NPC will be politically chal-lenging. For industrial users, the removal of cross subsidies mandated under EPIRA may partially offset these increases in average prices. For residential users though, the price increases to remove these cross subsidies will come on top of the increases in average prices. “Lifeline” rates are, however, generous by regional standards and relatively well targeted (see
Box 6.1Energy Regulatory Commission: New responsibilities under reforms
Enforce the implementing rules and regulations of the Electric Power Industry Reform ActPromulgate and enforce a national grid code and a distribution codeEnforce the rules and regulations governing the operation of the wholesale electricity spot marketEstablish and enforce methodologies for trans-mission tariffs and unbundle distribution and retail tariffs Eliminate cross subsidies within three years of the passage of the Electric Power Industry Reform ActMonitor and take measures against anticompetitive behavior
•
•
•
•
•
•
WorldBankInfra.indb 84 12/6/2005 8:41:27 AM

Chapter 6 Power ��
the section “Affordability,” below). An effective public information campaign will be essential to highlight this and to explain convincingly the benefits that can be expected from successful implementation of the reform process.
Legal and institutional framework
Main laws, regulations, and institutionsEPIRA and the accompanying implementing rules and regulations are the key legal documents governing the power sector. EPIRA provided for:4
Unbundling the sector into generation, trans-mission, distribution, and supply; the generation and supply businesses are intended to be open and competitiveCreation of Transco to assume the transmission assets and functions of NPCCreation of PSALM to own Transco and other NPC assets and assume all the liabilities of NPC, with a mandate to privatize the Transco concession and to dispose of other assets (mostly generation assets)Creation of WESM (expected to be launched in Luzon by end-2005)A universal charge for recovery of stranded costs for power purchase5 and NPC stranded debt beyond government absorption of NPC debt6 (to be set after WESM is launched)Promotion of rural electrification and provision of a subsidy mechanism for missionary electrification7
Replacement of the Energy Regulatory Board (ERB) with the ERC.
The Department of Energy (DOE) is the lead policy agency and its Electric Power Industry Management Bureau is the policy development and implementation arm.
The ERC evolved from its predecessor, the ERB, which had been the sector regulator since 1987. With around 200 employees, the ERC faces daunting challenges. The task of regulating NPC, Transco, and distribution utilities is becoming more complex due to market reforms, and it has taken on a role in the oversight of behavior in the competitive wholesale market.
The National Electrification Administration is responsible for implementing the government’s rural electrification policy, including provision of technical
•
••
••
•
•
advice and operating guidelines to electric cooper-atives, which serve about 55% of all customers in the country, or over 6 million customers in a total of 31,459 barangays (out of 41,999 nationwide). The Philippine Electricity Market Corporation (PEMC) was established in November 2003 as the governing body of WESM, including the retention by contract of an independent market operator. PEMC is jointly owned by the prospective participants in WESM.
Sector structure and ownership
Current market structureThe Philippines’ electricity market is dominated by two large companies: NPC, which is the major generator and power purchaser, transmission provider, and system operator; and Manila Electric Company (Meralco), the distributor in Metro Manila. Meralco is a listed company traded on the Philippine stock exchange; the government holds a 26% share.
The country has three high-voltage grids in Luzon, Visayas, and Mindanao. Transco is the transmission service provider and system operator and its regional grids in Luzon and in the Visayas are interconnected. NPC, through its Small Power Utilities Group, also supplies 41 electric cooperatives that are off the main grid in islands and remote areas (figure 6.1).
In 2003, NPC’s own plants and contracts with inde-pendent power producers (IPPs) accounted for around 70% of total electricity generation in the country. Most of the balance was produced by IPPs selling to Meralco. Table 6.1 shows the main trends in NPC generation in 1998–2003: flatter demand following the Asian crisis in 1997–98; the growing importance of natural gas since the Ilijan IPP started in 2002; and the fall in NPC power sales as Meralco reduced purchases of NPC power in favor of its own IPP supplies.
NPC supplies 286 customers in total; 91% of power sales are for distribution utilities, while 9% are for direct sales to a range of industrial and commercial users, and miscellaneous customers (universities, army camps, etc.). Meralco accounted for 49% of sales in 2002 and the amount of generation that Meralco has under contract with its own IPPs limits NPC’s opportunity to increase sales in Luzon in the short term.
In addition to Meralco, there are 17 private investor-owned distributors connected to Transco’s transmission (138–500 kV) or subtransmission (mostly 69 kV) systems. There are 119 electric
WorldBankInfra.indb 85 12/6/2005 8:41:27 AM

�� Philippines: Meeting Infrastructure Challenges
Figure 6.1Electricity market structure, 2004
Meralco
National Transmission Corporation (Transco)
//140 direct-connect
customers
Non-NPC IPPs(incl. Meralco’s
2,260 MW)
Visayas (1,006 MW)distribution utilities (4),
electric cooperatives
Mindanao (1,049 MW) distribution utilities (4),
electric cooperatives
Luzon (6,454 MW)(including Meralco)
distribution utilities (9),electric cooperatives,
LGU-owned distributors (2)
Luzon-Visayas interconnection
41 non-grid- connected
electric cooperatives
NPCgeneration
Gas supply to Ilijan IPP
NPC-IPPs NPC-SPUG200 MW
IPP = independent power producer; LGU = local government unit; NPC = National Power Corporation; SPUG = Small Power Utilities Group.
Note: NPC-SPUG plants are not connected to the transmission network.
Source: World Bank staff.
Table 6.1National Power Corporation generation by type of plant, 1998–2003
1998 1999 2000 2001 2002 2003
GWh % GWh % GWh % GWh % GWh % GWh %
Hydro 4,997 13 7,617 19 7,349 18 7,035 16 6,530 17 7,812 20Oil thermal 7,207 18 5,392 14 2,550 6 3,527 8 941 2 4,718 12Coal thermal 9,384 24 11,276 29 15,607 39 16,881 39 14,018 37 12,067 31Diesel 5,333 13 2,270 6 1,976 5 3,397 8 2,497 7 0 0Geothermal 8,915 22 10,638 27 11,331 28 10,458 24 9,974 26 9,822 25Gas turbine 622 2 52 .. 36 .. 64 .. 37 .. n.a. n.a.Gas–CCGT 3,192 8 2,083 5 1,521 4 1,801 4 3,709 10 4,505 12
Total NPC and IPP 39,650 100 39,328 100 40,370 100 43,163 99 37,706 99 38,924 100
IPP 18,262 46 18,532 47 20,141 50 22,885 53 21,345 57 n.a. n.a.
.. = less than 1%; n.a. = not applicable; CCGT = combined-cycle gas turbine; GWh = gigawatt-hour; IPP = independent power producer; NPC = National Power Corporation.
Source: www.transco.ph/so/gen_mix.asp.
cooperatives and two municipal systems (owned by two small LGUs in Luzon). Most of the electric cooperatives are supplied from the grid through Transco’s radial subtransmission circuits grouped in about 15 contiguous supply areas. Collectively, these distributors account for less than 45% of total sales, with electric cooperatives accounting for about 15%.
Proposed market reformsThe introduction of the competitive wholesale market is at the core of the Philippine reform program in the power sector. Its structure is outlined in figure 6.2.
The market is an energy-only one modeled on the markets in Australia and New Zealand. Dispatch is determined by bids from generators where generator bids cover all the energy they wish to supply (i.e.
WorldBankInfra.indb 86 12/6/2005 8:41:28 AM
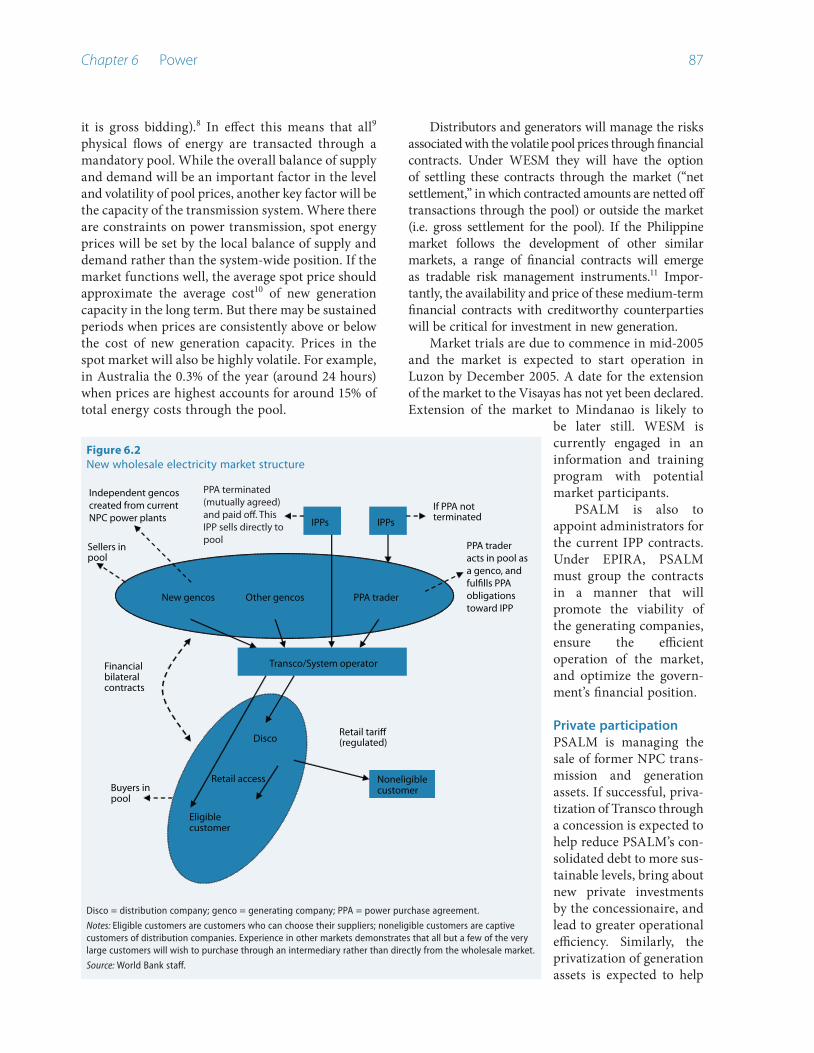
Chapter 6 Power ��
Figure 6.2New wholesale electricity market structure
New gencos Other gencos PPA trader
Transco/System operator
IPPs IPPs
Disco
Noneligible customer
Eligible customer
Retail tari� (regulated)
Retail accessBuyers in pool
Financial bilateral contracts
Sellers in pool
If PPA not terminated
PPA trader acts in pool as a genco, and ful�lls PPA obligations toward IPP
PPA terminated (mutually agreed) and paid o�. This IPP sells directly to pool
Independent gencos created from current NPC power plants
Disco = distribution company; genco = generating company; PPA = power purchase agreement.
Notes: Eligible customers are customers who can choose their suppliers; noneligible customers are captive customers of distribution companies. Experience in other markets demonstrates that all but a few of the very large customers will wish to purchase through an intermediary rather than directly from the wholesale market.
Source: World Bank staff.
it is gross bidding).8 In effect this means that all9 physical flows of energy are transacted through a mandatory pool. While the overall balance of supply and demand will be an important factor in the level and volatility of pool prices, another key factor will be the capacity of the transmission system. Where there are constraints on power transmission, spot energy prices will be set by the local balance of supply and demand rather than the system-wide position. If the market functions well, the average spot price should approximate the average cost10 of new generation capacity in the long term. But there may be sustained periods when prices are consistently above or below the cost of new generation capacity. Prices in the spot market will also be highly volatile. For example, in Australia the 0.3% of the year (around 24 hours) when prices are highest accounts for around 15% of total energy costs through the pool.
Distributors and generators will manage the risks associated with the volatile pool prices through financial contracts. Under WESM they will have the option of settling these contracts through the market (“net settlement,” in which contracted amounts are netted off transactions through the pool) or outside the market (i.e. gross settlement for the pool). If the Philippine market follows the development of other similar markets, a range of financial contracts will emerge as tradable risk management instruments.11 Impor-tantly, the availability and price of these medium-term financial contracts with creditworthy counterparties will be critical for investment in new generation.
Market trials are due to commence in mid-2005 and the market is expected to start operation in Luzon by December 2005. A date for the extension of the market to the Visayas has not yet been declared. Extension of the market to Mindanao is likely to
be later still. WESM is currently engaged in an information and training program with potential market participants.
PSALM is also to appoint administrators for the current IPP contracts. Under EPIRA, PSALM must group the contracts in a manner that will promote the viability of the generating companies, ensure the efficient operation of the market, and optimize the govern-ment’s financial position.
Private participationPSALM is managing the sale of former NPC trans-mission and generation assets. If successful, priva-tization of Transco through a concession is expected to help reduce PSALM’s con-solidated debt to more sus-tainable levels, bring about new private investments by the concessionaire, and lead to greater operational efficiency. Similarly, the privatization of generation assets is expected to help
WorldBankInfra.indb 87 12/6/2005 8:41:28 AM

�� Philippines: Meeting Infrastructure Challenges
sustain the financial recovery and yield operational efficiencies. It will also provide a better climate for new investments by reducing the perceived risk of noncommercial pricing when there are government-owned generators. Overall, successful implementation of the planned privatization program in the power sector should substantially reduce the country’s public sector deficits.
A potential impediment to successful implemen-tation is poor investor sentiment. In recent years, inter-national investor interest in developing-country power assets in general has fallen,12 and there is investor concern about the regulatory environment in the Phil-ippines (discussed in more detail in chapter 2).
The proposed Transco concession privatization would be in the form of a 25-year lease, renewable for 25 years, under which the concessionaire would finance, operate, maintain, rehabilitate, and expand the nationwide transmission system (high-voltage grids in Luzon, Visayas, and Mindanao). Transco would retain title to transmission assets. PSALM expects to select a concessionaire by 2006, and it previously estimated that the total value of the concession fee would reach $2 billion (at present value), with $500 million to be paid upfront and the balance of $1.5 billion to be paid within the contract period.
A delayed start to the process of privatizing the Transco concession may have increased perceptions of political and regulatory risk. Two biddings were held in 2003 to select a concessionaire. Both times, only one party submitted a proposal and the biddings were declared failures. Subsequently, PSALM began direct negotiations with four bidding groups. While the level of interest and reported bids were in line with, or above, expectations, the process was terminated because of the complex and unique nature of the conditions attached to each offer. PSALM has announced that the concession contract will now be awarded through a process of public bidding based on a revised, and standardized, package.
Privatization of generation assets involves the sale of NPC power plants with a combined capacity of some 5,800 MW by 2006, through bidding, free of debt (i.e. PSALM will absorb all NPC debt). Generic transaction documents for thermal plants and specific documents for hydropower plants and geothermal plants13 have been prepared. Thirty-two interested parties, largely local investors14 with existing power assets in the Philippines, received a preliminary information memorandum issued in October 2003. PSALM has hired an independent third party to update the valuation of generating company priva-
tization. PSALM sold five small hydropower plants for $5.16 million, and in November 2004 announced the successful bid for its first major power plant (Masinloc) for $562 million, 40% of which must be paid upfront, with the rest due within seven years. (The financing for the transaction still has to be closed, however.) This exceeded expectations and PSALM is scheduled to sell a total of 5,815 MW during 2004–2006, including 1,460 MW of decom-missioned plants. PSALM currently plans to sell some 830 MW without TSCs15 as merchant plants, which has already raised concerns among some of the interested investors. PSALM hopes to raise $2 billion (at present value), with 50% paid upfront.
Uncertainties will be reduced through the conclusion of TSCs with offtakers and the launch of WESM. The TSCs will determine the amount of energy to be purchased by offtakers from each power plant. Once WESM is established, offtakers will have to purchase at least 10% of their energy needs at the spot market price through WESM. At that time, TSCs will, by prior agreement, convert into bilateral contracts covering up to 90% of offtakers’ energy needs. Depending on their design, term, and price, the TSCs may add value to the sale of the assets. In any case, the reduced uncertainties and risks are likely to help PSALM attract more, higher-quality bidders. TSCs and bilateral contracts will therefore secure the bulk of the generators’ revenues for the medium term and will be the primary determinant of the value of the generators.
According to the provisions of EPIRA, up to 90% of energy sold and bought can be covered by TSCs or bilateral contracts. However, the current level of coverage of these contracts is still extremely limited as PSALM has encountered protracted delays in negotiating a TSC with Meralco and TSCs or supple-mentary agreements with other distribution utilities. So far, only three utilities (out of 78) have signed a supplementary agreement and only two (out of 48) have signed a TSC. These documents have been filed with the ERC for its consideration of approval.
Investment needs and financing
DOE’s latest Philippine Energy Plan (2005–2014) includes the following indicative investments:
Additional peaking capacity of 50 MW and 100 MW in 2005 and 2006, respectively, in Mindanao, and additional base-load capacity of 100 MW in 2007
•
WorldBankInfra.indb 88 12/6/2005 8:41:28 AM

Chapter 6 Power ��
Additional peaking capacity of 100 MW in the Visayas in 2008Additional peaking capacity of 150 MW and 450 MW in Luzon in 2008 and 2009, respectively, and mid-range capacity of 600 MW in 2009.
Forecasts for capacity requirements, such as these, have an important role to play in signaling investment needs even after a competitive wholesale market has been established. However, such forecasts must be treated cautiously because they depend upon assumptions of highly uncertain variables, such as future economic growth and the prospects for energy-intensive industries. The tendency toward overesti-mation of demand shown in figure 6.3 is common to many countries.
New investment in Mindanao will need to be committed to, and constructed, prior to the launching of a competitive wholesale market. In the case of Luzon, potential projects that can provide much of the mid-range capacity have been identified, but the projects are not yet committed. Decisions to commit to new capacity in Luzon may need to be taken shortly after the scheduled start of market operation. This adds to uncertainty for investors, as the outcomes with a competitive market may be different from those with a traditional “planning” approach. A competitive wholesale market will value the avail-ability of generation in peak periods highly and may encourage more efficient or intensive operation of existing plant, including standby generation. It may
••
also value more highly projects with shorter lead times (such as refurbishment of existing plants), and smaller increments to capacity (such as standby capacity, cogeneration, and other forms of distributed generation).
Though these uncertainties are real, the latest forecasts provide a valuable guide to possible investment needs. These forecasts suggest that total indicative investment needs for power generation over the next 10 years may be around P360 trillion (about $7 billion). Together with indicative investments for transmission and distribution, estimated at about P150 trillion (about $2.8 billion) and P90 trillion (about $1.7 billion), the total investment requirements for the power sector are currently estimated at about P600 trillion (about $11 billion) over the next 10 years.
Sector performance
AccessBy end-2003, about 90% of barangays and 80% of households were electrified in the country. This is less than in some other comparable countries such as Malaysia and Thailand, but better than Vietnam or Indonesia (table 6.2). Of the remaining communities to be electrified—3,970 barangays—DOE projects that
Figure 6.3Forecasts of maximum peak demand in Luzon
0
2,000
4,000
6,000
8,000
10,000
12,000
14,000
16,000
19901992
19941996
19982000
20022004
20062008
20102012
2014
Year
Giga
wat
ts
Actual demandPDP 1993 PDP 1996 (high) PDP 1997 (low)PDP 1999 (low) PDP 2000 PDP 2001 (low)PDP 2002 (low) PDP 2003 (low) PDP 2004 (low)
PDP = peak demand projection. High and low refer to the scenarios in previous development plans.
Source: Department of Energy.
Table 6.2Comparison of access and other performance measures
CountryElectrification
rates (%)a 2000
Quality of electricity supply
(scale of 1–7)b 2003–2004
Transmission and distribution
losses (%)c
2002
Australia 100 6.7 6.64Singapore 100 6.7 8.52Korea, Rep. of 100 6.1 —China 99 4.2 7.12Malaysia 97 5.9 5.55Mongolia 90 — —Thailand 82 5.3 7.26Philippines 80 3.7 16.33Vietnam 76 3.4 14.00Sri Lanka 62 3.2 18.11Indonesia 53 3.6 16.16India 43 3.0 26.21
Philippines rank
8 out of 12 8 out of 11 8 out of 10
— = not available.
Sources: a. International Energy Agency. World Energy Outlook 2002; Philippines National Electrification Administration; estimates for Australia and Republic of Korea. b. World Economic Forum. Global Competitiveness Report 2003–2004. c. World Bank. World Development Indicators 2004.
WorldBankInfra.indb 89 12/6/2005 8:41:29 AM

�0 Philippines: Meeting Infrastructure Challenges
Table 6.3Transco unserved energy and lost system minutes, 2002–2003
Region 2002 2003
Unserved energy SISI Unsupplied energy SISI(GWh) (minutes) (GWh) % Change (minutes) % Change
Luzon 120.4 670 75.9 -37.0 598 -10.7 of which Meralco 82.4 39.9 -51.6Visayas 21.3 1,100 32.2 51.2 1,770 60.9Mindanao 29.9 1,663 29.4 -1.7 942 -43.4
Total 171.6 3,433 137.5 -19.9 3,310 -3.6Loss of salesa 7,586,257 5,781,580 -23.8
GWh = gigawatt-hour; SISI = system interruption severity index.
a. Estimated using National Power Corporation per kilowatt-hour rates of P2.4897 (Luzon), P2.6737 (Visayas), and P1.2634 (Mindanao).
Source: Transco.
about two-thirds (2,762) will be connected via grid extension and the balance of 1,208 using isolated systems. Under current plans, full barangay electri-fication is targeted for completion by end-2008 and 90% household electrification by 2017.
Quality of serviceIn 2003, there were about 3,310 minutes of system interruptions16 with unsupplied energy of 137.5 GWh, spread over the three grids (table 6.3). While Transco measures the cost in terms of lost generation sales it
does not take into account the value of the lost distri-bution margins, nor the even greater economic losses incurred by customers. Although it has improved over the past few years, the reliability of Transco’s system is well below international standards. Many of the problems within Transco’s control relate to poor maintenance scheduling, or other minor main-tenance issues (tree clearing, faults in operation of protection systems, etc.) which could be improved at relatively low cost.
Reliability at the distribution level is reportedly mixed. Both private distributors and electric coop-eratives suffer from weaknesses in the transmission and subtransmission networks, which results in power delivered below acceptable voltage ranges17 and subject to frequent interruptions. Most distribution networks suffer from serious underinvestment, which results in high losses, poor voltage regulation, and low reliability. And many distributors, especially many electric cooperatives, are simply not that well run, with the result that customers must endure frequent power outages. On the upside, improvements are being made by some of the larger distributors. Meralco, for example, reduced its non-Transco-related inter-
ruption time by nearly three-quarters from 2000 to 2002. Visual evidence of the status of the distribution networks in Manila, and its high loss levels, testify to the fact that Meralco, along with all of the larger distributors, could do a lot more.
Efficiency Power system losses are a significant problem, especially at the distribution level. Transco’s reported losses averaged 2.89% in 1998–2002 in the Luzon grid, although losses may be understated because of
the inadequate metering in place at NPC generating stations. Losses of 4.53% in the Visayas and 4.26% in Mindanao were due, in part at least, to the lower volume transmitted over greater distances. Private investor-owned distributors operate under a regulatory cap of 9.5% system losses but many lose more than 12%, although better performance has been demonstrated (e.g. Davao Light & Power’s 8% losses). Meralco lost 9.3% in Metro Manila in 2002, and 14% in its service territory outside Metro Manila. System losses of consumer-owned electric cooper-atives averaged 14.8% in 2003, despite a declining trend from 16.9% in 1999. The national average masks a high degree of diversity among these cooperatives. In 2003, they were allowed a regulatory loss cap of 14% but 56% of them exceeded this cap, and 13% lost more than 20%, which in turn contributed to their precarious finances. DOE is aware of the need to reduce losses and has set a target for electric coop-eratives’ losses of below 10% by 2010.
Financial performanceNPC has been faced with very serious financial problems, mainly attributable to its undercapitalization
WorldBankInfra.indb 90 12/6/2005 8:41:29 AM
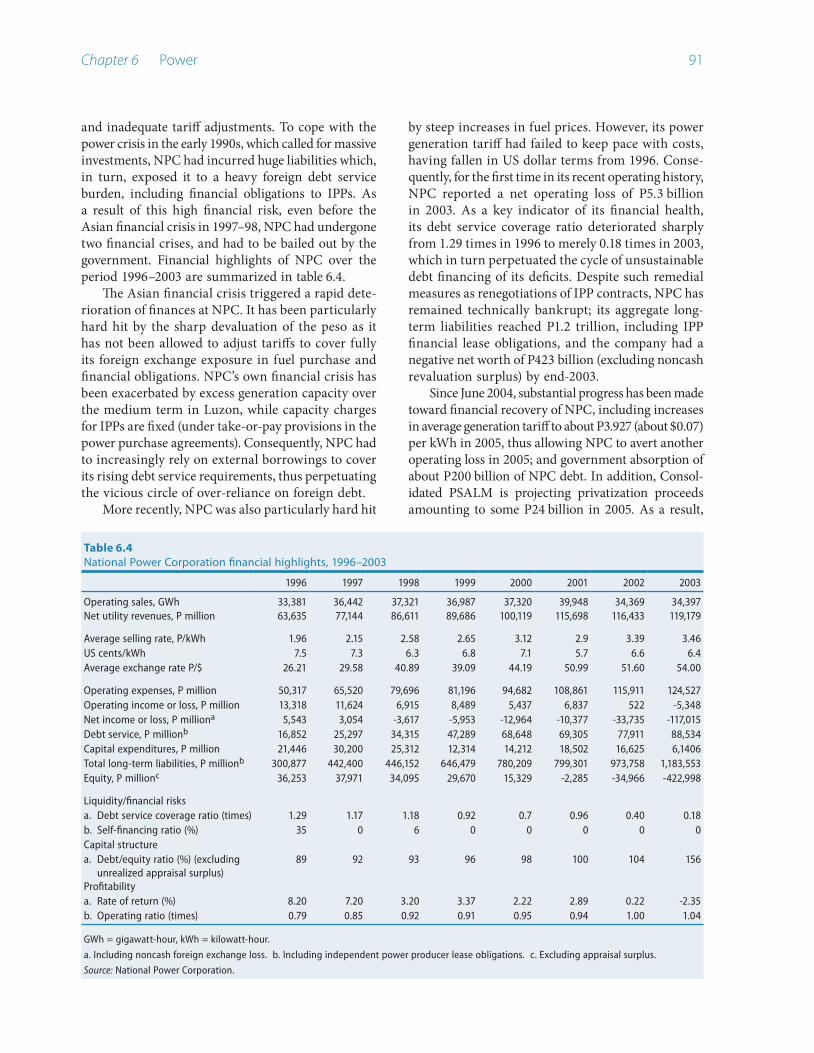
Chapter 6 Power �1
and inadequate tariff adjustments. To cope with the power crisis in the early 1990s, which called for massive investments, NPC had incurred huge liabilities which, in turn, exposed it to a heavy foreign debt service burden, including financial obligations to IPPs. As a result of this high financial risk, even before the Asian financial crisis in 1997–98, NPC had undergone two financial crises, and had to be bailed out by the government. Financial highlights of NPC over the period 1996–2003 are summarized in table 6.4.
The Asian financial crisis triggered a rapid dete-rioration of finances at NPC. It has been particularly hard hit by the sharp devaluation of the peso as it has not been allowed to adjust tariffs to cover fully its foreign exchange exposure in fuel purchase and financial obligations. NPC’s own financial crisis has been exacerbated by excess generation capacity over the medium term in Luzon, while capacity charges for IPPs are fixed (under take-or-pay provisions in the power purchase agreements). Consequently, NPC had to increasingly rely on external borrowings to cover its rising debt service requirements, thus perpetuating the vicious circle of over-reliance on foreign debt.
More recently, NPC was also particularly hard hit
Table 6.4National Power Corporation financial highlights, 1996–2003
1996 1997 1998 1999 2000 2001 2002 2003
Operating sales, GWh 33,381 36,442 37,321 36,987 37,320 39,948 34,369 34,397Net utility revenues, P million 63,635 77,144 86,611 89,686 100,119 115,698 116,433 119,179
Average selling rate, P/kWh 1.96 2.15 2.58 2.65 3.12 2.9 3.39 3.46US cents/kWh 7.5 7.3 6.3 6.8 7.1 5.7 6.6 6.4Average exchange rate P/$ 26.21 29.58 40.89 39.09 44.19 50.99 51.60 54.00
Operating expenses, P million 50,317 65,520 79,696 81,196 94,682 108,861 115,911 124,527Operating income or loss, P million 13,318 11,624 6,915 8,489 5,437 6,837 522 -5,348Net income or loss, P milliona 5,543 3,054 -3,617 -5,953 -12,964 -10,377 -33,735 -117,015Debt service, P millionb 16,852 25,297 34,315 47,289 68,648 69,305 77,911 88,534Capital expenditures, P million 21,446 30,200 25,312 12,314 14,212 18,502 16,625 6,1406Total long-term liabilities, P millionb 300,877 442,400 446,152 646,479 780,209 799,301 973,758 1,183,553Equity, P millionc 36,253 37,971 34,095 29,670 15,329 -2,285 -34,966 -422,998
Liquidity/financial risksa. Debt service coverage ratio (times) 1.29 1.17 1.18 0.92 0.7 0.96 0.40 0.18b. Self-financing ratio (%) 35 0 6 0 0 0 0 0Capital structurea. Debt/equity ratio (%) (excluding
unrealized appraisal surplus)89 92 93 96 98 100 104 156
Profitabilitya. Rate of return (%) 8.20 7.20 3.20 3.37 2.22 2.89 0.22 -2.35b. Operating ratio (times) 0.79 0.85 0.92 0.91 0.95 0.94 1.00 1.04
GWh = gigawatt-hour, kWh = kilowatt-hour.
a. Including noncash foreign exchange loss. b. Including independent power producer lease obligations. c. Excluding appraisal surplus.
Source: National Power Corporation.
by steep increases in fuel prices. However, its power generation tariff had failed to keep pace with costs, having fallen in US dollar terms from 1996. Conse-quently, for the first time in its recent operating history, NPC reported a net operating loss of P5.3 billion in 2003. As a key indicator of its financial health, its debt service coverage ratio deteriorated sharply from 1.29 times in 1996 to merely 0.18 times in 2003, which in turn perpetuated the cycle of unsustainable debt financing of its deficits. Despite such remedial measures as renegotiations of IPP contracts, NPC has remained technically bankrupt; its aggregate long-term liabilities reached P1.2 trillion, including IPP financial lease obligations, and the company had a negative net worth of P423 billion (excluding noncash revaluation surplus) by end-2003.
Since June 2004, substantial progress has been made toward financial recovery of NPC, including increases in average generation tariff to about P3.927 (about $0.07) per kWh in 2005, thus allowing NPC to avert another operating loss in 2005; and government absorption of about P200 billion of NPC debt. In addition, Consol-idated PSALM is projecting privatization proceeds amounting to some P24 billion in 2005. As a result,
WorldBankInfra.indb 91 12/6/2005 8:41:29 AM

�� Philippines: Meeting Infrastructure Challenges
Consolidated PSALM is expected to avert a serious liquidity crisis in the same year, as indicated by the improvement of its projected debt service coverage ratio from 0.24 times in 2004 to about 0.7 times in 2005. However, as elaborated below, given the high level of PSALM debt, its financial recovery is not sustainable in the absence of additional remedial measures.
Prices and affordability The Philippine electricity sector performs compara-tively well on affordability criteria—at the expense of price distortions, cross subsidies, and rising debts of NPC and government.
Composition of pricesThe regulated retail tariffs comprise the following components:
Generation charges. The total charges include a basic rate plus adjustments for delayed recovery of fuel and power purchases as well as exchange rate fluctuations.Transmission wheeling rates. This component is governed by the ERC’s transmission wheeling rate guidelines, which establish a revenue cap mechanism governing Transco’s rates. Distribution and retail margins. The ERC has set separate distribution wheeling and retail margins based on a review of costs for each of the 141 distribution utilities that has filed its rate unbun-dling application. Universal charge. In accordance with EPIRA, this charge presently covers missionary electrification,
•
•
•
•
removal of cross subsidies, the equalization of taxes and royalties applied to indigenous or renewable sources of energy vis-à-vis imported fuels, and an environmental charge for management and/or rehabilitation of watershed areas. As noted above, this will be extended to cover NPC’s stranded costs and debt after the launch of WESM.
Comparisons of chargesComparisons of price structures raise two broad areas of concern. First, commercial and industrial tariffs are high relative to residential tariffs in the Philippines and to commercial and industrial tariffs in other countries, reducing the competitiveness of Philippines businesses. Second, the variations in charges between regions do not reflect costs.
Industrial users normally expect to pay much less than residential users because they have better load factors and use little of the distribution system. Cost-reflective prices for commercial users will generally fall between these two groups. In the Philippines there is very little difference among the three groups. The average residential price in Luzon is P5.75/kWh (about $0.10/kWh) compared with P5.23 for industrial users and P6.09 for commercial users. This is not unique to the Philippines, as figure 6.4 shows, but it does raise concerns. Although the special pricing arrangements in the economic zones soften the impact, industrial tariffs in the Philippines are the fourth highest in Association of Southeast Asian Nations countries.
Current residential tariffs and household incomes are highest in Luzon, followed by the Visayas and Mindanao. On average, households in Luzon and
Figure 6.4Electricity prices in Association of Southeast Asian Nations countries
Residential
0
2
4
6
8
10
12
14
16
18
Lao PDR
IndonesiaThaila
ndVietn
amPhilip
pinesMalays
iaMya
nmarBru
neiSingaporeCambodia
US ce
nts/
kilo
wat
t-hou
r
= price range = midpoint
Industrial
0
2
4
6
8
10
12
14
16
Lao PDR
IndonesiaThaila
ndSingapore
Malaysia
Philippines
Brunei
Vietnam
Myanmar
Cambodia
US ce
nts/
kilo
wat
t-hou
r
= price range = midpoint
Notes: Retail prices as of June 2004. Excludes price increases in the Philippines since June 2004.
Source: www.aseanenergy.org.
WorldBankInfra.indb 92 12/6/2005 8:41:30 AM

Chapter 6 Power ��
the Visayas spend 3.2% of their household income on electricity, while the corresponding figure in Mindanao is 2.9%. Electricity expenditure as a share of income is highest at 3.5% in the National Capital Region, where Meralco’s residential rate of P5.79/kWh is the highest in Luzon.
Future electricity prices are likely to be affected by several changes:
The pass-through of higher NPC generation tariffs.Under EPIRA, cross subsidies in generation and retail prices must be removed. The interregional cross subsidies18 were removed by September 2002 and intraregional cross subsidies19 in generation prices are being phased out by October 2005. Interclass cross subsidies20 also have to be phased out and the ERC has mandated that Meralco must phase out these cross subsidies between customer classes by October 2005. Interclass cross subsidies will be phased out by 2009. After WESM becomes fully operational, wholesale rates should, on average and over time, approach the new entrant costs. With competition and WESM there will be a greater shift to time-of-use pricing in the compet-itive segments.
Overall, residential users, especially outside Luzon and outside the areas in Luzon served by Meralco, are likely to see an increase in rates. In the absence of explicit subsidy mechanisms, the increase is likely to be greatest in Mindanao, since this is where electricity prices are the lowest at present.
••
•
•
AffordabilityEvidence suggests that most power customers are willing and able to pay, provided that service quality is maintained. However, tariffs are politically sensitive and general economic woes have hit many segments of the urban population in recent years. In addition, the tariff reforms mentioned above will affect afford-ability and make well-targeted assistance measures more important.
Such measures appear to be in place at present. Low-income electricity users are protected by a system of “lifeline” rates: users whose electricity consumption remains below certain levels benefit from these lower rates, which are cross-subsidized by other consumers within an individual franchise area of the distribution utility. The maximum levels are set by individual distribution companies. The levels tend to be set at 100 kWh a month in the large franchise areas and at between 15 kWh and 40 kWh a month in the electric cooperatives and some of the small distribution utilities. The schedule of rate reductions also varies between individual distribution companies. Meralco’s lifeline rates are rather generous and well targeted by international standards (box 6.2): users who consume less that 50 kWh a month benefit from a discount of 50%; those who consume between 51 kWh and 70 kWh a month benefit from a discount of 35%; and those who consume between 71 kWh and 100 kWh a month benefit from a discount of 20%. A more detailed analysis would be needed to ascertain the extent to which existing social protection mechanisms meet their objectives in the power sector,21 especially given the substantial differences in the lifeline rates offered in each service area.
Box 6.2International comparisons of lifeline tariffs
An examination of international lifeline mechanisms shows
that the current lifeline scheme in the Philippines is unique. The overwhelming majority of electric utilities in the world currently have standard increasing block tariffs in place, in which all consumers enjoy the lifeline benefits no matter how much they consume. The Philippines, on the other hand, spe-cifically targets the lifeline benefit by limiting it to customers who consume under a lifeline threshold. Those who consume more than the
threshold are not eligible for the benefits.
Even among those countries that target lifeline benefits, the Philippines is unique in that its lifeline is based on percentage dis-counts rather than fixed amounts. Also, the lifeline threshold among distribution companies in the country is above subsistence levels of consumption. For these reasons, it appears that the Philippines’ social protection mechanisms are better targeted than those in other countries and are fairly generous.
However, while international com-parisons are useful, each country has individual factors that may make comparisons misleading, including demographics, climate, stage of development, and elec-tricity consumption patterns.
A more thorough analysis of the Philippines’ social protection mech-anisms is needed to properly assess the lifeline scheme’s targeting, errors of exclusion and inclusion, impact, and generosity.
Source: World Bank staff.
WorldBankInfra.indb 93 12/6/2005 8:41:30 AM

�� Philippines: Meeting Infrastructure Challenges
Main issues
Many of the challenges facing the Philippine power sector are not unusual. There is a need to ensure that the sector better meets the community’s needs by providing a better environment for investment, improving sector efficiency, and ensuring access to affordable energy. However, the precarious finances of NPC, and therefore PSALM, are the key drivers in determining the priority and urgency of the responses required. In addition, while the introduction of a competitive electricity market can substantially improve resource allocation and efficiency, it might also subject stakeholders to the risks associated with a high degree of price volatility.
In this context, the outstanding challenges for the government are to:
Achieve and sustain financial viability for NPC and PSALM.Ensure new investment.Introduce a competitive wholesale market while managing suppliers’ and end users’ exposure to price risks.Increase private participation.Improve regulation.Reform prices and ensure competitiveness and affordability.
Achieving and sustaining financial viability for NPC and PSALMAs noted above, there has been a substantial turnaround in the financial prospects of PSALM due to the better outlook for NPC in 2005 following the increases in regulated generation charges. However, Consolidated PSALM (including NPC and Transco) will remain technically bankrupt in the absence of additional remedial measures. Even in the best-case scenario, Consolidated PSALM remains highly vulnerable to shocks, notably high and rising oil prices and interest rate risks. In addition, critical factors include: the timing and amount of privatization proceeds; the market share of NPC relative to Meralco’s IPPs; the volatility of spot power prices once WESM is launched; and related timeliness and adequacy of the universal charge for recovery of stranded NPC contract costs and debt (as yet to be approved by the ERC). The ERC believes that the stranded contract cost component can only be filed one year after the wholesale electricity spot market becomes operational. NPC or PSALM can, however, file for the stranded debt component of the universal charge.
•••
•••
In theory, the universal charge could allow Consol-idated PSALM to reach a debt service coverage ratio of 1. However, in practice, ERC approval for timely and adequate cost recovery under the universal charge is subject to considerable uncertainty. Thus, PSALM’s future cash inflows are subject to major uncertainties and high volatility. Similarly, PSALM’s annual cash outflows are expected to be volatile. Through 2010, its debt service payments (before government absorption and IPP lease obligations) in a typical year are around $1 billion, but in 2006, 2009, and 2010, certain bonds mature and the related bullet payments cause debt service in those years to nearly double. Given that PSALM does not have the resiliency to cope with downside risks, its evolving financial recovery action plan should include a contingency plan and other risk mitigation measures based on rigorous risk analysis. As a last resort, further debt relief by the government would be required to allow Consolidated PSALM to self-finance its financial obligations. Similar government actions for debt relief have successfully enabled the recent financial recovery of the state-owned power utility, PLN, in Indonesia. Indeed, NPC has not been considered creditworthy on its own and, in recent years, the government has been borrowing directly, in its own name, over $1 billion annually to help service NPC debt.
In the future, one option is for the government to onlend these funds to PSALM with annual repayment obligations limited to its ability to self-finance such obligations, thus effectively allowing PSALM to achieve annual debt service coverage ratio of at least 1. This is a good indicator of PSALM’s financial health and lays the ground for PSALM borrowing in its own name without a high premium over government borrowing. The onlending arrangements between the government and PSALM have no impact on the consolidated public sector deficits, which eliminate such internal transfers. In the next few years, compre-hensive liability management at PSALM will be an important part of the government’s public debt and risk management.
Ensuring new investmentThere is no immediate risk of countrywide elec-tricity supply shortages of the kind experienced in the early 1990s, but the government’s responsi-bilities for funding capital expenditures and taking on industry risk must be reduced. There is also an urgent need to improve the business environment in the power sector to ensure that adequate private investment will meet future capacity needs in a timely
WorldBankInfra.indb 94 12/6/2005 8:41:30 AM

Chapter 6 Power ��
manner. Specifically, financial commitment may be required by 2006–2007 if new capacity is to come on-line by 2009–2010. The competitive wholesale market may well encourage a variety of responses, such as demand responses, extension of generation asset lives, greater utilization of existing capacity, and growth in smaller-scale capacity that may, for a while, provide alternatives to new base-load investment. Even so, new investment in base-load capacity will be needed, and the necessary preparation and commitments are required soon.
Avoiding unnecessary additions to the already substantial burden on the government’s fiscal position is a priority. Privatization of the government’s elec-tricity businesses will significantly reduce these financial obligations, but the remaining government-funded capital expenditures must also be carefully scrutinized.
Under EPIRA, responsibility for new investments rests with private parties. Clearly, a substantial improvement of the business environment, better price signals, greater regulatory certainty, and improvement in credit standing of sector offtakers are needed. In addition, suppliers, independent retailers, or users of large loads must have the capacity and willingness to enter into long-term financial contracts for energy. Given the current financial situation of the sector and the path-breaking nature of the reform program, the question arises as to whether the government needs to offer some form of guarantee or to take other specific steps to encourage new private investment in generation.
Introducing a competitive wholesale marketA well-functioning competitive wholesale market will play an important role in improving the performance of the power sector. However, there are substantial risks in this strategy and key questions remain about implementation and investment in new generation in the market.
The government is implementing an ambitious program that involves simultaneously privatizing generation and introducing wholesale competition and, over time, retail competition. While other countries have achieved similar reforms, this is a daunting task with strong interlinkage between the different reform components.
The successful establishment of competitive energy markets requires:
Careful design and implementation of trading systems, market rules, and operation systems
•
Strong and sustained political commitment to reform A competitive environment for generators and suppliersCommercially focused, financially viable, and well-prepared market participantsDevelopment of financial markets for managing riskClear and sound market supervision.
The challenge of maintaining the commitment to reform is integral to the reform process and is not unique to the Philippines. There are a number of positive factors in the current situation in the country. The government is strongly committed to establishing a competitive wholesale market and PEMC is now making substantial progress in its implementation. The proposed restructuring and privatization of the generation sector should provide a sound basis for competition in that sector.22
However, maintaining the commitment to reform is more difficult when the reform process entails greater risk. In this context, several important physical and technical obstacles and risks must be overcome or managed better. For example, the credit-worthiness of distributors will be a major issue as many of them will struggle to meet the necessary prudential requirements to be allowed to participate in the market. The preparedness of market participants also raises concerns: many of the electric cooperatives are very small and the NPC generation units may be focused at present on the ongoing process of restruc-turing and privatization. It is also important that “safety nets,” such as obligations for retail suppliers of last resort and a price ceiling for the wholesale market,23 are put in place.
Two key concerns that are common across the experience of different countries in the introduction of competitive markets are:
Price volatility in the wholesale market, and the financial risks and retail price implications of this volatilitySecurity of supply and investment in new gener-ation and network capacity.
Price volatility is an important part of a competitive wholesale market because it is through such volatility that better signals can be provided for energy use and production. However, the volatility entails financial risks for market participants and retail price risks for consumers, and these need to be managed.
•••••
•
•
WorldBankInfra.indb 95 12/6/2005 8:41:30 AM
�� Philippines: Meeting Infrastructure Challenges
The Australian and New Zealand markets, upon which the Philippine market design is based, show a higher level of volatility than other market designs, such as the PJM market24 in the US. This does not automatically mean that the Philippine wholesale market will be relatively volatile, because other factors—such as the diversity of generation sources, generator market power, and detailed market rules—also affect market volatility. However, it does suggest caution and a need to carefully examine the means of managing this potential volatility.
Another key priority is to ensure that the market environment supports the necessary investment in new generation capacity. In principle, WESM can provide good price signaling for new capacity to come into the market. There are concerns, however, that it may be difficult for new plants to write the long-term financial contracts needed to underpin new investment in a new market, especially given the concerns about the creditworthiness of coun-terparties and the perceived risks of political inter-vention. Addressing these concerns may require a reconsideration of some elements of the current market design (e.g. the absence of capacity obli-gations) and careful attention to the details of the market and regulatory rules to ensure that there are no obstacles to enhanced demand responses and smaller-scale generation. These options will also affect the level of price volatility in the market and need to be considered from that perspective as well.
If these issues are not addressed, the government will face considerable pressure to underwrite new investments in generation. The financial crises of NPC clearly demonstrate the risks to the government of providing loans and guarantees when capacity costs are not adequately passed on to users. Security of supply is, however, a critical issue and, while improving the investment climate should be given priority, there may be a need for a “backstop” mechanism, in the short term at least.
Retail competition can strengthen competition in the wholesale market25 and focus suppliers more clearly on customers’ needs. However, experience with the costs and benefits of retail competition suggests that a clear, but cautious, approach should be taken. The EPIRA timetable for retail competition depends on a number of conditions, most impor-tantly the progress in the privatization of generation assets. This creates uncertainty about the timetable, which the ERC has recently sought to address in part. (Given expected progress on implementation of the market and sale of generation assets, the ERC has
indicated that competition for customers above 1 MW in Luzon will start on July 1, 2006 and be extended to customers above 750 kW from July 1, 2008.) The timetable for the phasing in of competition beyond 750 kW is even more uncertain. The extension of individual choice to small business and residential customers is foreshadowed but no timetable has been set. There are very great doubts as to whether the benefits would exceed the costs (such as metering or load profiling costs) and whether there would be strong interest from potential retailers.
In practice there is likely to be an extended period when wholesale energy prices will be determined in the market but when retail prices for many customers will need to be regulated. This is likely to be a difficult challenge for the regulator and one that will require a careful balancing between incentives and financial risks for the distributor, on the one hand, and price stability for the end user, on the other.26 Even under automatic cost pass-through arrangements, the residual exposure to spot prices can create significant cash-flow risks for distributors. It also can create significant price volatility in end-user prices.
Increasing private participationSuccessful completion of the government’s plans to increase private participation is critical for the reduction of public debt levels and the introduction of competitive markets. However, previous timetables for the Transco concession and sale of NPC power plants have not been followed. The government’s decision to award the Transco concession through competitive bidding is a step in the right direction, though political and regulatory risks could affect the attractiveness and therefore the value of this concession.
Successful privatization of the Transco concession would, in turn, provide an important positive signal for the privatization of major generation assets. The current plan, under which PSALM will sell most of the generation plants in Luzon by end-2006, appears optimistic. TSCs27 and subsequent bilateral contracts are still to be arranged. The design, price, length, and coverage of these contracts will have an important effect on the value of the assets, but each of these elements remains uncertain. Indeed, setting the volume covered by the contracts is made more difficult by the uncertainty in the timing of the introduction of retail contestability. In the absence of the TSCs, the future revenue stream for the generators will be more uncertain. This is likely to significantly affect the quality of the bidders, the prices and conditions offered, and the risk of future operators’ failure. The
WorldBankInfra.indb 96 12/6/2005 8:41:30 AM
Chapter 6 Power ��
design and level of coverage of the TSCs will also have a significant effect on the bidding behavior of generators and prices in WESM.
A higher level of coverage under financial contracts will help reduce the extent of market power and lower average pool prices28 but the impact also depends on the design of the contracts. Both theory and experience suggest that the use of two-way hedges (or contracts for differences), which remove entirely the price risk for the volumes covered, will lead to lower wholesale market prices than alter-native contracts such as price cap contracts. The drop in market prices in Singapore following the introduction of two-way hedge contracts to cover the bulk of purchases illustrates this. A comparison of the early price outcomes in the interconnected Queensland, New South Wales, and Victoria markets in Australia also illustrates the impact of contract design. Queensland used a range of contract forms, including price cap contracts, whereas the other states used two-way hedges for the vesting contracts. Each state started with a high level of contract cover but there was not the same initial move to very low wholesale prices in the Queensland market.
This highlights that while a high level of contract coverage is essential for risk management, the details of the design of these contracts are very important. The choices in the design and level of coverage are likely to have a significant impact on the viability of existing and new generators. While initial high prices driven by market power should be avoided, a short-term collapse of wholesale prices should also be avoided, if possible. The design of these contracts requires a very sound understanding of their potential impacts and, ideally, the capacity to model these impacts
The privatization program does not include the sale of the Government’s 26% interest in Meralco. The policy purpose of this interest is not clear, especially once the energy market becomes competitive and the decision on whether to sell or retain this interest is essentially a financial matter. However, the sale could be achieved relatively quickly to provide an early contribution to improving the financial position of the government.
Improving regulationThe ERC’s performance must improve if the sector is to be put on a sustainable footing and, critically, if it is to attract new private sector investment.
Investors, government officials, and other stake-holders have highlighted the need to reduce the
perceived regulatory risk and strengthen the ERC’s capacity. Stakeholders have pointed to the fact that the ERC has not met the deadlines set in EPIRA. Addi-tionally, there is a perception that the ERC has used the unbundling of rates or pass-through of foreign exchange or fuel cost changes to reduce rates or defer necessary increases. While more prompt handling of the cases is desirable, the deadlines, particularly in regard to the unbundling of all the distribution utilities and electric cooperatives, may have been unrealistic. Furthermore, regulatory processes depend upon the submission of timely, accurate, and complete claims which the ERC then has a duty to carefully review—a duty that has been reinforced through the decisions of the Supreme Court on appeals to ERC decisions. Although the ERC has been developing more professional capabilities and is now focusing on the importance of balancing the interests of consumers and service providers alike, changing this perception will be difficult.
The regulation of retail tariffs for those customers who are not contestable may become more challenging with the introduction of a competitive wholesale market. In addition, clear procedures will be needed for handling the transition and managing customer risks in the event that a distributor failed.
The market supervision role will be particularly challenging for the ERC (and PEMC). The skills and knowledge required—and the frame of reference to be used—are very different from those necessary for price regulation. Excessive intervention to eliminate rents could be highly detrimental to the operation of the market and the incentives to invest. There is also potential for overlap and confusion between the roles of the ERC and PEMC.
Reforming prices and ensuring affordability and competitivenessEnsuring that access to a basic electricity service remains affordable to poor households while addressing the relatively high prices paid by the commercial and industrial sectors will be a major challenge.
It is difficult to judge whether the current average price of electricity is too high or low relative to long-run benchmark costs. Clearly, it is insufficient to cover current costs, but these costs are inflated by the present excess capacity and inefficiencies within the sector. Residential prices are comparable to those in several similar countries in the region, but commercial and industrial prices are high, both relative to other countries and to residential prices. Rebalancing prices between customer classes may
WorldBankInfra.indb 97 12/6/2005 8:41:30 AM

�� Philippines: Meeting Infrastructure Challenges
require significant increases in residential prices. The elimination of regional cross subsidies will further impact users outside Luzon (e.g. Mindanao residential charges are 40% below those in Luzon).
In this context, subsidies to ensure affordability of basic services will need to be designed and targeted carefully. Currently the lifeline, regional, and electri-fication subsidies appear relatively generous, and are better targeted than in many other countries.
Recommendations
The government has committed itself to measures to meet the challenges discussed in the previous section. For example, steps have been taken to privatize generation and transmission and to introduce wholesale and retail competition. While substantial benefits can be reaped from these reforms, the risks are also substantial and a carefully thought-through risk management strategy is required.
The key risks arise from:
Flawed design or implementation of the main reform measures resulting in insufficient investment to guarantee security of supply; high and/or volatile prices; or supplier failure due to a lack of creditworthiness.Strong public opposition to the reform program due to negative social impacts or concern at price outcomes.
The government can take certain steps to manage these risks. First, the timetable for reform needs to be clear, realistic, and properly sequenced. Second, it cannot be assumed that the reforms and structures working in one country will also necessarily work in the Philippines. The risks need to be identified and the experience of a range of other countries drawn upon in fine-tuning the current design, ensuring both that appropriate regulatory safeguards are in place, and that alternative strategies are available to address problems that may arise in implementation of the reforms. These steps, plus well-designed social safety nets, will help reduce the risk that the reforms might be derailed. The management of these risks is central to the recommen-dations listed below (summarized in table 6.5).
The proposed recommendations have regard to the broad powers under EPIRA and the IRR, and the capacity of PEMC to modify the WESM market rules. The recommendations also have regard to the work that has already begun in a number of
•
•
these areas (e.g. supplier of last resort obligations and WESM market caps). However, there has been no detailed analysis either of the existing powers for implementing these recommendations or of the extent to which changes in legislation, regulations, or market rules would be required. Clearly such a review would be the first step in the implementation of these recommendations.
Improving financial performanceSignificant progress is now being made toward restoring the financial prospects of the sector. However, success is not assured. The privatization program will be critical but, beyond this, the requirements to ensure that this progress is sustained are as follows:
Adequate and timely approval of the universal charge for PSALM to recover stranded contract costs and stranded debt. Calculation of the stranded costs of the eligible existing power purchase agreements may not be an easy task because it may require a forecast of future market prices. However, given the current costs under these contracts, the calculated stranded costs may be significant and the allocation of the burden of these contracts may need careful consideration. Careful control of capital and other expenditures in those areas that remain, for the time being, under government ownership or regulation. Successful introduction of the competitive wholesale market supported by a high level of contracting that secures the revenue stream for generators and protection against excessive price risks for the distributors/end users.Further reduction of uncertainty, in particular through conclusion of well-designed TSCs, to maximize the benefits of privatization. A regulatory regime that provides an opportunity for the regulated sectors to recover reasonable costs.
Focusing investments on key prioritiesCurrent plans for committed and funded trans-mission investment should substantially eliminate existing network bottlenecks. The government should carefully review, prioritize, and minimize investment commitments beyond this. In addition, the expansion investment in the proposed Small Power Utilities Group program should be scrutinized very closely and alternative means of meeting electrification goals considered by striking a balance between
•
•
•
•
•
WorldBankInfra.indb 98 12/6/2005 8:41:31 AM
Chapter 6 Power ��
economic efficiency and social equity. The cost to the government of this program needs to be contained within the budget provided by the universal charge for missionary electrification in order to avoid further unsustainable drain on the budget.
The investment climate under WESM needs careful consideration (see next section). Additional progress can be achieved, prior to market commencement, through the introduction of mandatory time-of-use generation prices and, possibly, a limited additional increase in average generation prices.
Implementing successful market restructuring The ambitious government reform program entails significant risks. Hence the government’s strategy must focus on efforts to manage the policy and operational risks associated with the introduction of WESM. This involves the following main elements.
First, a mechanism must be found to reduce the high credit risk of many of the offtakers. WESM’s proposal for twice-monthly billing with shorter payment periods will help. However, other mechanisms, such as a backstop credit insurance arrangement, are likely to be required. Other options could include aggregation—and perhaps contracting out—of trading for those distributors that cannot meet these requirements. In effect, these options transfer the trading responsibilities and hence prudential requirements for the market to another, more cred-itworthy party. While solutions must be found, care must be taken not to dilute too much the pressures on the electric cooperatives and other offtakers to reform and consolidate.
Second, additional technical and policy support should be provided to WESM and the ERC. M-Co and ABB are currently providing technical support to WESM. Substantial progress has been made in the implementation, and the need for technical support will shift to monitoring the performance of the market and the ongoing fine-tuning and modification of the market rules and processes, especially as the scope of retail competition expands. WESM and the ERC are likely to need support in developing the skills and processes required for the new market supervision role. The recommendations below on the modification and development of the market will require further technical support if they are to be implemented.
Third, the government and WESM must ensure that participants are adequately prepared for partici-pation in the market when it commences. WESM or the government must embark on a substantial training and education program for participants,
supported by experts with operational experience in competitive energy markets.
Fourth, elements of the wholesale market design may need to be reviewed to reduce the risk of the failure of the market due to price volatility and/or insufficient investment. The government should:
(a) Seek a further increase in generation and retail prices as a benchmark for future wholesale contracts.
(b) Ensure that a large fraction of electricity sales and purchases (as close as possible to the maximum 90% allowed) is covered under the TSCs and bilateral contracts for the medium to long term. Ninety percent contract cover is still low compared to the level of contract cover commonly sought by retail suppliers in other competitive markets—especially in those markets that exhibit higher levels of price volatility (such as the market in Australia with which the Philippine market shares a number of common design principles). The vesting contracts can comprise a portfolio of contracts of different types and duration. The period of the contracts can also be linked to the phase-in of retail contestability, as was done in Australia, to avoid the risk of overcontracting the existing retail suppliers. The uncertainty of the timetable for retail competition (see below) makes this more difficult in the current circumstances in the Philippines. As noted above, the details of the design of the TSC/bilateral contracts are impor-tant and need to be supported by a sound under-standing of the expected market outcomes and an evaluation of the impact of the design of the contracts on market outcomes. It is not possible, a priori, to advise on such details without having undertaken this sort of analysis.
(c) Establish default mechanisms to help the weakest retail suppliers manage trading risks. Even with substantial TSC coverage, the residual price risk for the weakest suppliers (and/or the degree of price volatility for end users) might be substan-tial and electric cooperatives, for example, are unlikely to have the resources or skills to manage their power purchases with an acceptable degree of risk. Competitive electricity markets are among the most volatile markets in the world because of the need to constantly match demand and supply in circumstances where there is limited storage capacity and traditionally little real-time flexibility in demand. At times, prices in the market can be 30 to 300 times the “normal” price.29 Partial
WorldBankInfra.indb 99 12/6/2005 8:41:31 AM

100 Philippines: Meeting Infrastructure Challenges
exposure to these prices for even a few hours when the system is at critical capacity can be a substantial burden on the retail supplier. Manage-ment of these risks typically requires consider-able skills and resources. For example, trading and risk management systems have to be estab-lished and the matching of contract positions to expected demand constantly monitored and the positions adjusted. Price stabilization schemes that shield offtakers against the risks of spot price fluctuations—such as the power-purchase funds established in Australia (New South Wales) and Argentina—might therefore deserve consid-eration as transitional protection mechanisms. Often these schemes are focused on the supply
of electricity to customers who are captive to the existing supplier, either because they do not have the option of choosing an alternative retail supplier or because there is limited retail competi-tion in that part of the market. Such schemes can also be adjusted to incorporate contracting with new generators as well as purchases at spot prices or contracting with existing generators. This can provide a basis for investment by private genera-tors in new capacity.
(d) Ensure that there is well-designed system of retail supplier of last resort. In a competitive retail market there is a risk that a retail supplier may fail or pull out of the market at short notice. In these circumstances it is important that there are
Table 6.5Summary matrix of potential reform measures for a three- to five-year period
Critical issuesPotential milestones
OutcomesBy year 1 By years 2–3 By years 3–5
NPC/PSALM financial performance
Inadequate tariffsDebt overhangNPC financial deficits
•••
NPC average generation selling rate increased sufficiently to at least eliminate NPC’s operating loss (achieved for 2005)P200 billion in NPC debt transferred to gov-ernment (achieved) Credible action plan ensuring consolidated PSALM’s annual DSCR is at least 1, by 2009
•
•
•
Additional tariff increase and NPC debt transferred to national government, if needed to enable PSALM to achieve DSCR of 1 by 2009
• NPC/PSALM stranded costs recovered through universal charge and additional actions, if needed, to enable PSALM to achieve DSCR of at least 1 by 2009
• No additional drain on national gov-ernment budget other than rural electrification
•
Investment program
Insufficient focus on prioritiesInsufficient demand management
•
•
Capital expenditures of NPC and Transco limited to key priority invest-ments onlyIntroduction of TOU tariffs for generation
•
•
Assess investment commitments and security of supply risks prior to final-izing 2006–2007 investment plans
• Investments appro-priately timed and designed to ensure security of supply at lowest cost
•
Market restructuring
WESM/TSC implementation
•
Strengthen program to enhance market pre-paredness of generators and distributors Transition supply con-tracts and supplementary agreements approved and minimum coverage achievedCompletion of paper trials for WESMWESM price cap set
•
•
•
•
WESM fully opera-tional in LuzonAnnouncement of firm timetable for retail competition beyond first two tranchesBackstop mechanism in place to enable participation of small electricity coopera-tives in WESM Protocols for market monitoring established
•
•
•
•
Review of first year of operation of WESM and report on contract coverage, price outcomes and security of supplyConfirmed timetable for extension of WESM beyond Luzon
•
•
Efficient, competitive bulk power market in place
•
continued on next page
WorldBankInfra.indb 100 12/6/2005 8:41:31 AM
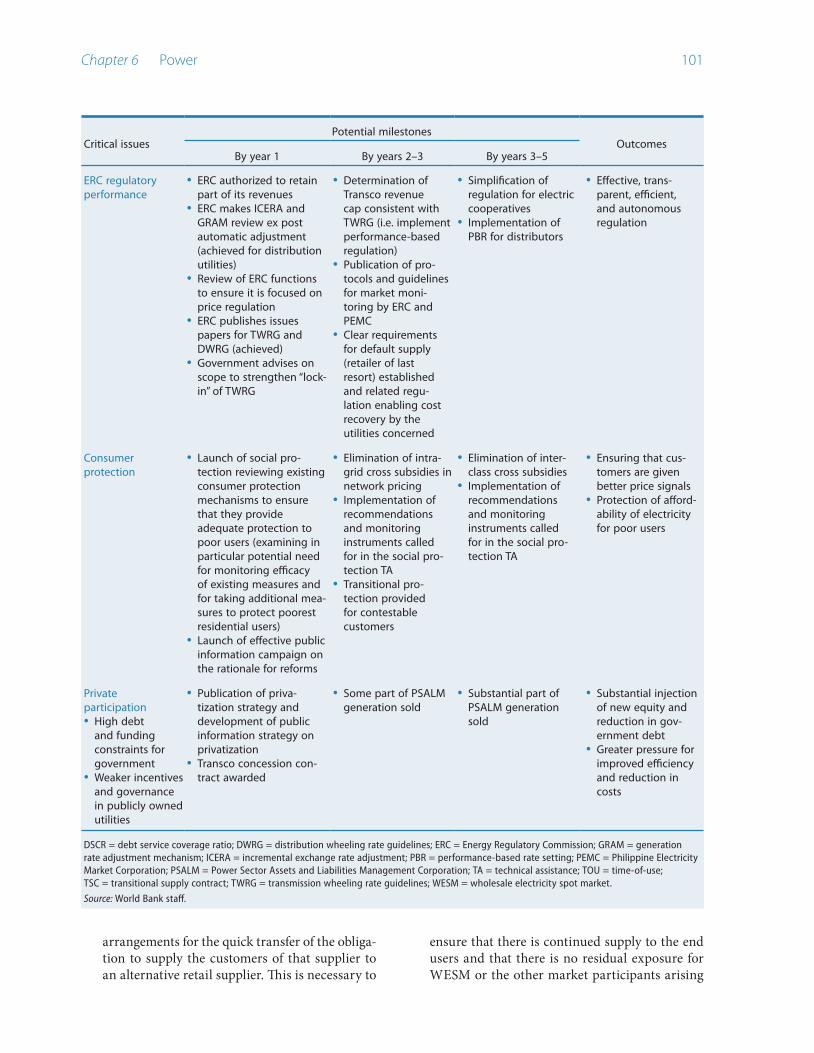
Chapter 6 Power 101
arrangements for the quick transfer of the obliga-tion to supply the customers of that supplier to an alternative retail supplier. This is necessary to
ensure that there is continued supply to the end users and that there is no residual exposure for WESM or the other market participants arising
ERC regulatory performance
ERC authorized to retain part of its revenuesERC makes ICERA and GRAM review ex post automatic adjustment (achieved for distribution utilities)Review of ERC functions to ensure it is focused on price regulation ERC publishes issues papers for TWRG and DWRG (achieved)Government advises on scope to strengthen “lock-in” of TWRG
•
•
•
•
•
Determination of Transco revenue cap consistent with TWRG (i.e. implement performance-based regulation)Publication of pro-tocols and guidelines for market moni-toring by ERC and PEMCClear requirements for default supply (retailer of last resort) established and related regu-lation enabling cost recovery by the utilities concerned
•
•
•
Simplification of regulation for electric cooperativesImplementation of PBR for distributors
•
•
Effective, trans-parent, efficient, and autonomous regulation
•
Consumer protection
Launch of social pro-tection reviewing existing consumer protection mechanisms to ensure that they provide adequate protection to poor users (examining in particular potential need for monitoring efficacy of existing measures and for taking additional mea-sures to protect poorest residential users) Launch of effective public information campaign on the rationale for reforms
•
•
Elimination of intra-grid cross subsidies in network pricingImplementation of recommendations and monitoring instruments called for in the social pro-tection TATransitional pro-tection provided for contestable customers
•
•
•
Elimination of inter-class cross subsidiesImplementation of recommendations and monitoring instruments called for in the social pro-tection TA
•
•
Ensuring that cus-tomers are given better price signalsProtection of afford-ability of electricity for poor users
•
•
Private participation
High debt and funding constraints for governmentWeaker incentives and governance in publicly owned utilities
•
•
Publication of priva-tization strategy and development of public information strategy on privatization Transco concession con-tract awarded
•
•
Some part of PSALM generation sold
• Substantial part of PSALM generation sold
• Substantial injection of new equity and reduction in gov-ernment debtGreater pressure for improved efficiency and reduction in costs
•
•
DSCR = debt service coverage ratio; DWRG = distribution wheeling rate guidelines; ERC = Energy Regulatory Commission; GRAM = generation rate adjustment mechanism; ICERA = incremental exchange rate adjustment; PBR = performance-based rate setting; PEMC = Philippine Electricity Market Corporation; PSALM = Power Sector Assets and Liabilities Management Corporation; TA = technical assistance; TOU = time-of-use; TSC = transitional supply contract; TWRG = transmission wheeling rate guidelines; WESM = wholesale electricity spot market.
Source: World Bank staff.
Critical issuesPotential milestones
OutcomesBy year 1 By years 2–3 By years 3–5
WorldBankInfra.indb 101 12/6/2005 8:41:31 AM

10� Philippines: Meeting Infrastructure Challenges
from the continued supply of electricity to end users. These arrangements are often called retailer (or supplier) of last resort and are a common feature of most competitive electricity markets. The ERC has begun to consider this issue. The key concerns are: Who is to be the retailer of last resort? How is the obligation to be assigned? and What price will the retailer of last resort charge the end user?
(e) Establish a cap on the WESM price. Other elec-tricity pools have established caps to provide greater certainty and to limit extreme use of market power. Such caps must be set at very high levels to allow the market to work. As noted above, the ERC is currently considering whether to set a cap on wholesale prices.30 At times some genera-tors in some locations on the network may simply have to run in order to ensure that supply is main-tained. If so, there may be very few constraints on the price at which the generator could bid into the market. The challenge is that while the need to limit prices in these circumstances is generally well accepted, the temptation to set too close a cap should be resisted. In an energy-only market, such as the Philippines market, the peak prices play a very important role in sending the signals for new generation. If the cap is set too low it may deter new investment in generation. PJM, which is an energy and capacity market, has a cap of US$1,000 on wholesale market prices but it also requires cost-based bidding in some circumstances to limit market power. In the Irish and Australian markets, which are both energy-only markets, the caps were set at €7,200 and A$10,000, respectively, based on an assessment of the value of lost load to consumers. This is a proxy for the point at which a consumer would choose not to consume. In practice the value at which a consumer would choose not to consume is likely to vary substantially between customers. Hence another important related program of work is to incorporate demand responses more fully into the market. These responses can, in principle, greatly increase the efficiency of the market and reduce the market power of generators. But this is also an area that other competitive electricity markets have found challenging.
(f) Identify all potential sources of new capacity, including demand responses, distributed genera-tion, and plant rehabilitation, and remove any obstacles to these options. The disclosure of information on alternative sources of supply
and projected supply-demand balances can help provide a better basis for future investment and is a common feature of other competitive markets. The current DOE projections can form the basis of the forecasts.
(g) Incorporate medium-term capacity-contracting obligations,31 or other similar options, within the market. Capacity-contracting obligations require retail suppliers to contract for enough generation capacity (in megawatts) to meet the peak demand requirements of their end users. These requirements are a feature of a number of Latin American markets and the New York, New England, and PJM markets in the US. The capacity market operates in parallel with the energy market and reduces some of the pressure on the latter.32 While the capacity obligations may only be short term, they provide an additional stream of income for generation that is directly based on available capacity rather than the sched-uling of plants.
(h) Review current security of supply arrangements to ensure that there is a backstop mechanism that has minimal impact on the operation of the market and that limits the fiscal risks to be assumed by the government. A key objective of establishing new electricity markets is to have market participants make investment decisions based on competi-tive market price signals of the value of new capacity, rather than planning processes. Hence policymakers should be wary of assuming market failure and establishing nonmarket mechanisms for new generation investment. However, in prac-tice most governments have not been prepared to rely solely on market price signals, even where these are supported by the information disclosure programs, such as forecasts of energy demand and capacity under (f). This may require a review of the range of mechanisms used in other coun-tries, such as contractor of last resort, fast-track approvals, government-sponsored bidding, or information programs. If additional mechanisms are put in place, the entity (e.g. DOE, PEMC, or the distributors) on which the obligations fall needs to be clearly identified, together with the mechanisms for ensuring security of supply.
(i) Examine the option of using cost-based bids as a transition mechanism, as was done in several South American countries, such as Argentina and Chile. Cost-based bidding has long-term efficiency costs but it can mitigate market power and reduce price volatility. Given that the invest-
WorldBankInfra.indb 102 12/6/2005 8:41:31 AM
Chapter 6 Power 10�
ment program is likely to reduce substantially the transmission constraints and that the infrastruc-ture for a bid-based system is largely in place, it is not recommended that WESM move to cost-based bids as the standard “bidding” mechanism. However, the performance of the market should be monitored and the option of moving to cost-based bids in some circumstances may need to be considered if there is excessive market power. Some markets, such as PJM, use price-based bidding in most circumstances for most genera-tors but define circumstances—such as when a generator is a “must-run” generator—in which a generator may be required to bid on the basis of cost. The ERC has published for discussion a proposal for cost-based bidding.
(j) Review the timetable and strategy for introducing retail competition. This is discussed further below, but uncertainty about the rate at which the market will be opened up beyond the first two tranches affects incentives of retail suppliers to contract with new generation capacity. The absence of a known timetable makes it difficult for retail suppliers to forecast their future supply commit-ments that will need to be backed by medium- and long-term wholesale contracts. In particular, a clear statement that retail competition—in the form of individual customer choice—will not be extended to the residential and small business sectors for a clearly specified period would help the reform process.
The recommendations (b)—(e) are aimed primarily at better managing the pool price risk while not eliminating the important price signals provided through the market for wholesale electricity supply. Recommendations (a) and (f)—(j) seek to create a better climate for new investments in generation. Taken together, the implementation of these measures is likely to reduce the risk that the reform process could be derailed by market shocks and unexpected outcomes during the transition period. A detailed review of the existing legal instruments and powers has not been undertaken to determine the extent to which these recommendations can be pursued within the existing powers. However, it is noted that action has already begun on a number of these issues. For example, the ERC and WESM are aware of the need to set a wholesale market price cap and the ERC has started examining the retailer of last resort obligation. PSALM is also working on the development of the TSCs and the bilateral contracts that should follow
on from these contracts. An assessment of the legal basis for each of the other recommendations is clearly an important first step. There is also a strong need to ensure that the interconnections between these various strategies are recognized and that adequate resources and expert technical assistance are available.
Maximizing benefits from private participationThe benefits of greater private participation will be maximized, and the problems created by unrealized expectations minimized, if greater certainty on key market features, such as the phase-in of retail competition beyond 750 kW, the level of contracting, wholesale market price caps, and the regulatory regime, is provided. With regard to the Transco concession, this requires:
Finalization of the proposed regulatory regime. Review of the transmission investment framework to ensure both that it is flexible enough to cope with changing circumstances and that it provides certainty to market participants that essential infrastructure will be put in place in time. This may require a review of responsibilities for trans-mission planning and/or a narrowing of regu-latory discretion through transparent and legally binding instruments.
The current high level of market and political risk must be reduced urgently if the benefits of privati-zation of the generation assets are to be maximized. The steps required with regard to the wholesale market have been set out in the previous section. In addition, the prompt resolution of the questions related to price, conditions, and coverage of the TSCs and the bilateral contracts that follow the start of WESM operations will be crucial. PSALM should seek technical support on the design of the TSCs and bilateral contracts in view of the complexity of the task and importance of their design.33
Improving regulatory performanceThe ERC, assisted by independent experts, should undertake a strategic review of its functions, structure, capacity, and resources. This review will provide a basis for the government to proceed with legislation to give the ERC greater fiscal independence by allowing it to retain part of the revenues that it generates. While the ERC should not be allowed to determine its own budget, the government should give it greater medium-term budget certainty by ensuring that legislative instruments contain rules
••
WorldBankInfra.indb 103 12/6/2005 8:41:31 AM

10� Philippines: Meeting Infrastructure Challenges
or guidelines to establish minimum requirements. In other regimes, regulators are often funded through transparent levies on the regulated businesses. The overall budget may still be subject to approval by, e.g. Parliament, but this can provide greater budgetary certainty for the agency. The ERC should review its remuneration structure to ensure that it can attract staff with the necessary skills and experience. The ERC does not need to recruit many new staff—indeed following the review it may need fewer people—but it does need a few very highly skilled staff.
In assessing its current regulatory practices, the ERC should give substantial weight to the objective of increasing regulatory certainty and the timeliness of its processes. An important step will be to streamline its regulatory activities, where possible, such as by adopting a standardized approach to the regulation of distribution companies rather than by carrying out individualized price reviews for each company. A practical constraint may be that the current legislative framework and its interpretation by the Supreme Court place an obligation on the ERC to examine individually the circumstances of each distribution utility and electric cooperative. The ERC has recently published guidelines and issues papers that specify in detail how it intends to regulate network charges. It should look to extend this approach to reduce uncertainty.
The ERC will need to designate—and specify the regulatory regime applicable to—a supplier of last resort, responsible for ensuring continued supply in case a distributor or supplier defaults on its obli-gations to its captive customers (and to its contestable customers who did not choose another supplier).
Finally, responsibility for monitoring behavior in the competitive wholesale market is to be shared between WESM and the ERC, with the ERC responsible for taking action on anticompetitive behavior. WESM and the ERC should seek expert assistance to establish monitoring protocols, data
requirements, and processes for carrying out this task. They also need to agree on a memorandum of understanding to clarify their respective roles.
Ensuring adequate consumer and industry protectionThe reforms being implemented by the government and the requirements set out above will result in substantial changes in price levels and structures and, at least in the short term, an increase in the average level of charges. Residential customers are likely to see more substantial price increases than other customers. Even where consumer research may indicate customers should be “willing to pay” the higher electricity prices (i.e. the value to the customers of electricity is still greater than the proposed price), rapid increases in prices can cause concern and customer resistance that can be a barrier to reform. This concern arises because expectations as to what is a fair price may be set by past prices, and a rapid increase in the price does have a real income effect for the household. Hence for the process of price reform to be sustainable the government should:
Carry out a forceful, and professionally managed, public information campaign in order to explain why price increases and market reforms are essential, to highlight the relatively generous social protection mechanisms that are in place (such as lifeline rates), and to point out that over the past few years prices have in fact decreased in dollar terms.Finalize the elimination of cross subsidies in order to provide better price signals and improve the competitiveness of industrial users.Review existing social protection mechanisms in the power sector and determine whether such mecha-nisms can be improved, for example by ensuring better targeting on the poorest or by enhancing incentives for efficient service delivery.
•
•
•
Endnotes1 NPC supplies bulk power from its own plant and independent
power producers with which it has long-term power purchase agreements.
2 Including loan repayment and capital expenditures, before external financing.
3 The winning bid was announced in November 2004. The financing for the transaction still remains to be closed, however.
4 Unless otherwise indicated, the changes came into effect in June 2001.
5 I.e. the excess of the contracted cost of electricity under eligible contracts over the actual selling price of the contracted energy output of such contracts in the market.
6 I.e. any NPC unpaid financial obligations, not liquidated by the proceeds of the sales and privatization of NPC assets.
7 Missionary electrification is the provision of basic electricity services in unviable areas.
8 There are also provisions for offtakers to bid in demand reductions.
WorldBankInfra.indb 104 12/6/2005 8:41:32 AM

Chapter 6 Power 10�
9 There are some exceptions; for example, renewable generators do not have to bid into the pool to be dispatched.
10 This is the average cost across a mix of generators—base load, mid-merit order, and peaking capacity.
11 Typically, these will be contracts for differences where the generator and distributor will compensate each other for differ-ences between the pool price and the strike price in the contract. However, there are many variations likely to develop such as one-way hedges, cap and collar contracts, or pure price caps.
12 US and European investors are currently selling their power assets in Asia, some of which have been purchased by regional investors but others have not identified willing purchasers. In addition, Asian developing country power projects would need to compete with projects in countries with high credit ratings such as Australia and Singapore, and many regional investors wonder why they have to invest in non-investment grade coun-tries with underdeveloped legal and regulatory frameworks for similar returns.
13 Exploration of natural resources (e.g. geothermal steam and water resources) is subject to minimum Filipino ownership of 60%.
14 EPIRA encourages Philippine participation in generation.15 Including Masinloc, which was initially planned to be sold with
TSCs but was sold as a merchant plant. 16 System interruption severity index minutes—the system inter-
ruption severity index is computed on the basis of the sum of outage times weighted according to the estimated loss of sales. Care is needed in interpreting annual changes due to the vari-ability from year to year in system interruptions.
17 Transco’s average voltage limit compliance from 2000 to 2002 was only 74.7%.
18 The amount included in NPC rates charged to customers located in viable regional grids to reduce the charges of those located in less viable regional grids.
19 The amount included in NPC rates charged to distributors and non-utilities with higher load factors or delivery voltages to reduce the rates of those with poorer load factors or lower delivery voltages.
20 The amount charged by distributors to industrial and commer-cial end users to reduce the rates of other customers, such as residential end users and hospitals.
21 One would, for example, need to determine what constitutes an adequate level of subsistence power consumption for the Philip-pines, analyze the poor’s consumption patterns, and evaluate the impact on power affordability of protection measures that may be in place outside the power sector.
22 Too few generators or common ownership of strategically located generators (either physically or on the load curve) can create market power, while retention of significant public ownership can increase perceived political risks and deter private investment. PSALM’s current plans address these concerns.
23 The level at which the price ceiling is set is critical. Often the temptation is to place relatively low price cap on the wholesale market to prevent the exercise of market power. However, this can be counterproductive because it can discourage new invest-ment. A price cap is necessary to prevent potentially destabilizing price volatility, especially in the early period of the market devel-opment but it should be a very ‘loose’ price cap. The price cap in the PJM market in the US is US$1,000/MWh and the cap in Australia is around US$7,500/MWh.
24 The PJM market was originally for wholesale supply in Pennsyl-vania-New Jersey-Maryland but has expanded to include other areas in northeast US.
25 This is because it strengthens the incentives on suppliers to manage their bulk electricity purchases more efficiently. It can also reduce the market power of an incumbent with a dominant share of the retail market—as is the case with Meralco.
26 See B. Arizu et al. 2004. “Pass Through of Power Purchase Costs: Regulatory Challenges and International Practices.” Energy and Mining Sector Board Discussion Paper No. 10. World Bank. February.
27 These contracts are expected to be contracts for difference, which serve as commodity swaps to help both generators and distribu-tors hedge against the volatility of electricity market prices.
28 See for example, Frank Wolak. 2003. “Designing Competitive Wholesale Electricity Markets for Latin American Countries.” IADB/OECD. April.
29 PJM and the Australian market provide examples of this vola-tility but even in these cases the level of volatility is constrained through caps on wholesale market prices, as mentioned.
30 The market rules provide for ERC to set a price cap if the market is suspended however the circumstances in which the market may be suspended and the level of the price cap are not clear at this stage.
31 Capacity-contracting obligations require the distributors/retailers to contract for enough generation capacity (in megawatts) to meet the peak demand requirements of their end users. These requirements are a feature of a number of Latin American markets and the PJM market in the US. The capacity market operates in parallel with the energy market and reduces some of the pressures in the latter.
32 See, for example, W. R. Hughes and A. Parece. 2002. “The Economics of Price Spikes in Deregulated Power Markets.” Charles River and Associates.
33 There are a range of options for the design of these contracts (e.g. contracts that provide protection against both high and low spot prices, contracts that provide protection against high spot prices only, and contracts that provide exposure to spot prices within a band). The design and coverage of these contracts will affect the price certainty for both generators and suppliers, but will also affect outcomes in the spot market.
WorldBankInfra.indb 105 12/6/2005 8:41:32 AM

Joel Nito/Agence France-Presse
WorldBankInfra.indb 106 12/6/2005 8:41:33 AM

Chapter 7
Water Supply and Sanitation
Overview
Major efforts will be needed in the Philippines to achieve the Millennium Development Goal of increasing formal access to water
supply to 90% by 2010. Official data on coverage show that only very modest growth has occurred over the past decade and that access levels for water supply have slipped. Access to safe drinking water for the entire population deteriorated from 81.4% in 1999 to 80% in 2002. Access for the poorest segment of the population declined from 71.5% in 1999 to 70.2% in 2000. An even lower access figure to formal services has been reported by independent surveys, with only 63% of the population having access to any of the formal levels in 2000, with the rest relying on self-provision. Even more worrisome, official data mask the underlying poor quality of coverage. Though public data show fairly high formal water supply access rates, less than half of the population and only about 20% of the rural population have access to piped water supply and household connections. But where there is access to piped services, the quality of such services in terms of continuity and bacterio-logical quality of drinking water often does not meet the standards set by the government.
For sanitation and solid waste, matters are even worse. It is in fact estimated that only about 4% of the population nationwide had access to sewerage as of 2000 and that, of the vast majority of households with septic tanks, only about 3% (mostly rural) had acceptable on-site treatment and disposal. Effluent from ubiquitous septic tanks usually drains into uncovered drainage systems, which leaves the majority of the population across the country exposed to raw sewage. Solid waste collection is ineffective, and large quantities of such waste often accumulate and block
drainage canals, exacerbating public health problems. Even when collected, improper disposal practices for both septic tank sludge and solid waste contribute to severe environmental degradation of water bodies throughout the country, and undermine economic activity and growth in various sectors, including tourism.
As a result of inadequate services, contaminated drinking water and waterborne diseases remain a prevalent public health concern, accounting for more than 500,000 morbidity and 4,200 mortality cases a year with avoidable health costs alone estimated at P3.3 billion annually. Avoidable economic losses due to water pollution alone are estimated at an annual average of P17 billion in fishing industries and up to P47 billion in tourism.1
Modest sector investment and weak fundamentals Over the last two decades, capital expenditures in the water and sanitation sector have fluctuated at around P3 billion–4 billion a year, almost entirely allocated to water. This is far from the estimated investment requirements for water supply of around P6 billion–7 billion a year to achieve a 90% access rate to formal services by 2010 (one of the Millennium Development Goals). Furthermore, implementing the provisions of the Clean Water Act, which was passed in February 2004, will require additional annual expenditures of an estimated P35 billion.2
Clearly, the current investment levels are inadequate to keep up with growing demand and service targets. While investment figures indicate an uptrend in 2002 and 2003, the vast majority of this investment was undertaken by two government owned and controlled corporation (GOCCs)—the Metropolitan Waterworks and Sewerage System
WorldBankInfra.indb 107 12/6/2005 8:41:33 AM

10� Philippines: Meeting Infrastructure Challenges
(MWSS) and the Local Water Utilities Adminis-tration (LWUA)—both of which are in severe financial distress. Without major reforms in the sector, it is likely that capital expenditures will fall below even the low average levels of the last decade.
Generally, low tariffs constitute a core constraint undermining the development of the entire sector. They are not even sufficient for the majority of service providers to recover recurrent costs, let alone to accumulate sufficient reserves to fund new capital investments. Despite repeatedly stated policy objectives of cost recovery, actual progress toward this end has been minimal. In addition, the small scale of many individual service providers contributes to low efficiency and low skill levels of management.
For sanitation, users’ low willingness to pay operating costs, much less capital costs, has made it difficult for the government to expand investments. Currently, local governments attach a higher priority to water supply investments to bridge the significant gap in unserved demand for safe and reliable water than to sanitation investments.
Severe fragmentation of policy and institutional frameworkThe water supply and sanitation sector is highly fragmented, with numerous small providers that have neither sufficient operational scale nor the necessary autonomy from political interference to be efficient providers. Various local providers coexist, but operate under different regulatory and financing regimes, thus blurring accountability of individual providers for expanding both water supply and sanitation services. More than a decade since the provision of certain services was decen-tralized, LGUs remain ill-equipped to provide them. Similarly, the majority of water districts remain too small to attract skilled staff to effectively institu-tionalize technical advice provided by LWUA. The relationship between LGUs and water districts remains ambiguous, hampering the incentives for LGUs to provide loan collateral on behalf of water districts to attract more funding.
Among the LGU levels, the vast majority of water providers have been established at the barangay level (the lowest administrative level in the Philippines). As a result, coordination and cooperation among barangay water suppliers, for example to develop bulk sources, have often been difficult and tainted by local politics and political rivalries. In some cases, higher-level LGUs, e.g. provincial administrations, have tried to facilitate in this area but not always
successfully. An effective mid-level coordination body for inter-LGU conflicts is missing.
Coordination between the various national government agencies involved in the sector also remains weak. Recent initiatives, such as the reform of LWUA, strengthening of the National Water Resources Board (NWRB), and the Clean Water Act provide an opportunity to better align sector responsibilities and agencies, but at the same time they present significant challenges to the sector to implement such reforms seamlessly.
Lack of robust and coherent regulatory framework Critical for sector development is a robust regulatory framework that could provide for a credible and effective tariff adjustment mechanism insulated from short-term political intrusion. A regulatory framework is also crucial to make service providers accountable to consumers. However, such a framework is still not in place. Perhaps the strongest indication that it is missing is the lack of reliable and publicly available benchmarking information on the sector. The absence of consistent sector data and baseline figures on the extent and quality of coverage not only undermines the credibility of the regulatory process but also hampers any efforts to improve sector planning or to strengthen accountability of national government agencies in the sector.
In addition, the sector’s regulatory oversight is highly fragmented, with regulatory functions controlled by different entities. This makes it difficult to build the necessary technical capacity and has led to variance in regulatory rules and their enforcement across different groups of service providers. For publicly owned or community-based water districts, regulatory oversight has now shifted to NWRB to address LWUA’s conflicting role as both financier and regulator for water districts. However, NWRB has so far been unable to build capacity to effectively face the challenges brought by its new mandate. One particular challenge for NWRB will be to change the regulatory process from one narrowly focused on ensuring the financial viability of the sector to one also ensuring the achievement of expansion and service goals.
Nor is a tangible regulatory framework in place for tariff setting at the LGU level—despite guidance from the National Economic and Development Authority (NEDA)—and the role of NWRB vis-à-vis LGUs remains unclear. In the absence of NWRB’s effectiveness in enforcing tariff adjustments, efforts to
WorldBankInfra.indb 108 12/6/2005 8:41:33 AM

Chapter 7 Water Supply and Sanitation 10�
strengthen LGU tariff policies need to be embedded in a comprehensive program to reinforce public finances and accountability for public services at the local level.
Prioritizing a sector reform program The government undertook pioneering sector reforms in 1997 with the privatization of the Metro Manila water system. Since then reform has slowed, partly as a result of the Asian financial crisis in 1997–98 and general deterioration in private sector interest in infrastructure investment. In 2002–2004, the government issued important policy directives to further sector reform and consolidation. It is critical that these initiatives be implemented with a sense of urgency. The sector reform program should include (as outlined in the Recommendations section, below) the following elements: implementing adequate cost-recovery tariffs, establishing an integrated sector framework, carrying out a public utility reform and performance enhancement program, enhancing sector financing and rationalizing subsidies, and expanding sanitation and sewerage coverage.
Policy and institutional framework
Policy goals for the water supply and sanitation sector are formulated in the Medium-Term Philippine Development Plan (MTPDP) 2001–2004. The broad pillars of the sector policy have not changed over recent years3 and include, on the government’s part, a strong commitment to cost recovery in the sector; endorsement of the adoption of commercial principles, including private sector involvement in the management and financing of services; and a strong commitment to decentralization of responsibilities to local governments. However, the government has struggled to make these policies work, and the insti-tutional framework for implementing its policies has remained weak and fragmented.
Main laws and regulations The main pieces of legislation (appendix 6) defining the institutional setup of the sector were enacted in the 1970s. First was the legislation creating MWSS in 1971. Then came the Provincial Water Utilities Act of 1973. This authorized the formation of local water districts in provincial centers outside Metro Manila and the creation of LWUA as a specialized lending institution to assist in the promotion and devel-opment of water districts by providing financing for
water supply and sewerage investments and technical advisory services. Third was the Water Code of the Philippines, enacted in 1976, which established the framework for management of water resources as well as NWRB as the responsible lead agency. The Public Service Law, Presidential Decree 1206 (1977), gave to NWRB the mandate for supervision of water utilities, including the regulation of water tariffs (except those falling under the jurisdiction of MWSS and LWUA), and to act as an appeals body on tariff disputes arising between water districts and LWUA.
The Local Government Code (LGC) of 1991 shifted responsibility for public services to local governments in their areas. Local governments at all levels—provinces, cities, municipalities, and barangays—were made responsible for basic service delivery, including water supply and sanitation services. The BOT Law of 1990 sought to provide the enabling framework for private sector participation in infrastructure devel-opment, including water supply. Finally, the National Water Crisis Act of 1995 provided the government with special powers to reorganize sector agencies and pursue private sector participation. In particular, this Act facilitated the privatization of water supply and sanitation in Metro Manila.
Since 1995, successive governments have pursued their policy objectives through executive orders issued by the president rather than laws passed by Congress. This may partly be a matter of expediency in imple-menting sector reforms, but also signals the lack of broad political consensus over whether, and how, to promote ambitious reforms in the water sector.
In September 2002, NWRB was restructured through Executive Order 123, and was entrusted with responsibility for economic regulation of water districts. Implementation has not yet made much progress and the implementing rules and regulations have yet to be finalized. Executive Order 279 issued in February 2004 outlined substantial reforms in the financing of the sector, particularly with regard to the role of LWUA in providing finance to water districts, by pursuing more actively the “graduation” of water districts and other water service providers to the private capital market.
With regard to sanitation, the standards for air and water quality, and guidelines for land use management, natural resources, groundwater, and waste management were established by the Philippine Environmental Code, 1977, through Presidential Decree 1152. The Clean Water Act of 2004 defines the policies for pursuing economic growth within the framework of sustainable development in the aspect of
WorldBankInfra.indb 109 12/6/2005 8:41:34 AM

110 Philippines: Meeting Infrastructure Challenges
water quality management of all water bodies, as this impacts on water supply, public health, and ecological protection. The Department of Environment and Natural Resources (DENR) has the main responsi-bility for implementing the provisions of the Act.
Allocation of responsibilities for policymaking and regulation Responsibilities for sector policymaking, planning, and regulation are severely fragmented, spread across different government tiers and various national government agencies.
MWSS is responsible for the provision of water supply and sanitation services to the cities and munic-ipalities of Metro Manila. The services are currently provided, on the basis of concession contracts, by two private concessionaires, Manila Water Company, Inc. (MWCI) and Maynilad Water Services, Inc. (MWSI). LWUA and the Water Supply and Sanitation Project Management Office of Department of Interior and Local Government (DILG), through their respective funding activities, define and enforce specific quality and performance standards of service for water districts and LGU-managed systems, respectively. They also assist service providers through capacity building and technical assistance. LWUA’s support, in particular, extends beyond technical assistance to actual involvement of LWUA staff in execution of individual water district projects and the governance of water districts. Local governments at all adminis-trative levels retain de facto responsibility for policy, planning, and regulatory functions specific to their jurisdictions. This includes choosing financing and management options, deciding on tariffs, providing investment and funding support, and setting performance standards.
NEDA defines the institutional roles and respon-sibilities of sector agencies; sets broad coverage targets for the country; and defines broad policies, particularly regarding access of low-income groups to services, cost recovery to support sustainability, incentives to improve operational efficiency, and mechanisms for private sector involvement. The Department of Finance (DOF), for its part, sets and implements policies on the use of grants and guarantees from the national government and official development assistance (ODA).
Appendix 7 discusses the main agencies involved in water supply and sanitation policy formulation and implementation.
The sector’s regulatory oversight also remains highly fragmented, with regulatory functions, if at all,
controlled by different entities. The Regulatory Office of MWSS is entrusted with regulation of the two private concessionaires for Metro Manila. Regulatory provisions affecting other private firms are largely contained in individual contract agreements, in some cases administered by a dedicated contract adminis-tration unit or regulatory panel. This was a pragmatic solution chosen at the time of the transactions in the absence of a more institutionalized framework to review service quality and tariffs that would have been acceptable to investors.
Until 2002, LWUA was, in effect, regulating water districts, and NWRB private providers serving residential developments. After attempts to establish a dedicated regulatory authority for the sector stalled, in 2002 the government consolidated economic regulation for both LGUs and water districts, assigning this mandate to NWRB through an executive order. NWRB also has the mandate to regulate LGU systems; this mandate appears to be somewhat in conflict with the LGC and may well be subject to challenge by LGUs in the future.
Market structure and ownership of assets
Despite the government’s efforts to foster amalga-mation of providers, the market for water supply and sanitation remains highly fragmented. While concise figures are difficult to obtain, public water supply services are provided by about 5,000 service providers, broken down into about 3,100 barangay water services associations (BWSAs), up to 1,000 systems managed directly by LGUs, about 580 water districts, about 500 rural water supply associations (RWSAs), about 200 cooperatives, and nine private firms, including the two Metro Manila concessionaires.
These are the results of policies over recent decades that have promoted, in successive waves, specific provider models. Adoption of these models was commonly a precondition for local governments and communities to obtain government and donor funding. A dedicated national agency was typically established to channel funds and technical assistance to beneficiaries: advocacy for water districts started in the early 1970s, with technical and financial support from LWUA; this was followed by the formation of RWSAs with support from the Rural Waterworks Development Corporation; the promotion of cooperatives under the auspices of the Cooperative Development Authority; and, since the early 1980s, the formation of BWSAs
WorldBankInfra.indb 110 12/6/2005 8:41:34 AM
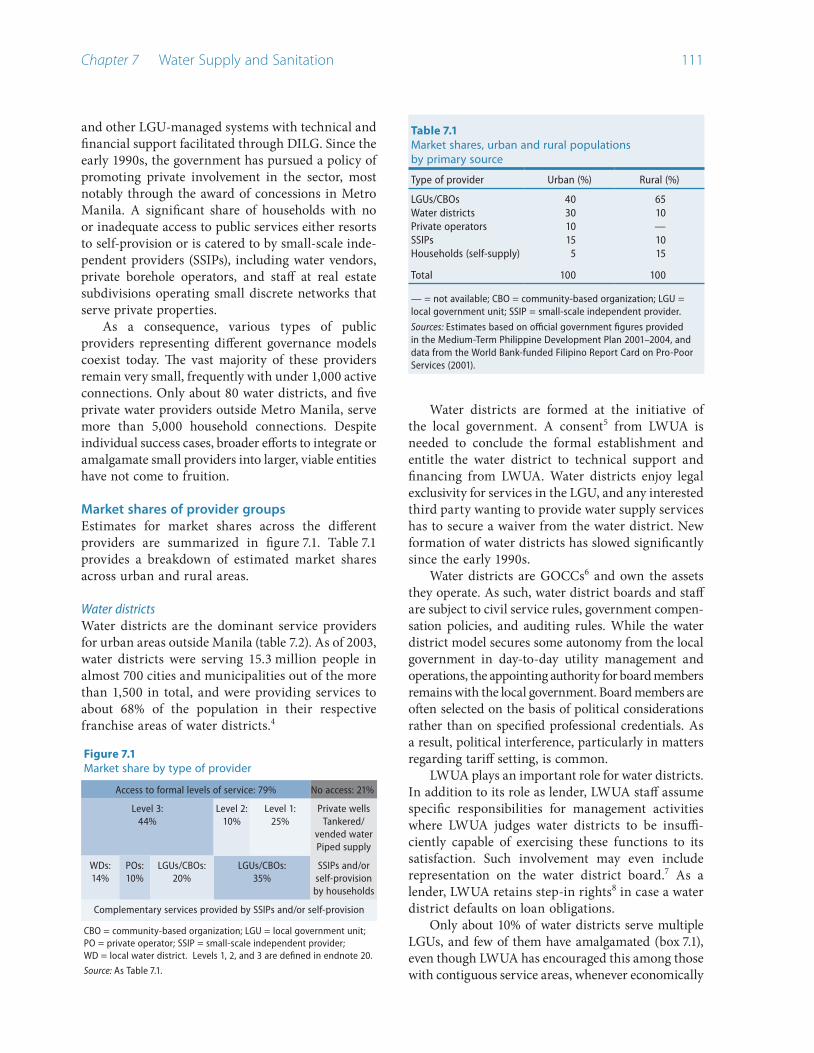
Chapter 7 Water Supply and Sanitation 111
and other LGU-managed systems with technical and financial support facilitated through DILG. Since the early 1990s, the government has pursued a policy of promoting private involvement in the sector, most notably through the award of concessions in Metro Manila. A significant share of households with no or inadequate access to public services either resorts to self-provision or is catered to by small-scale inde-pendent providers (SSIPs), including water vendors, private borehole operators, and staff at real estate subdivisions operating small discrete networks that serve private properties.
As a consequence, various types of public providers representing different governance models coexist today. The vast majority of these providers remain very small, frequently with under 1,000 active connections. Only about 80 water districts, and five private water providers outside Metro Manila, serve more than 5,000 household connections. Despite individual success cases, broader efforts to integrate or amalgamate small providers into larger, viable entities have not come to fruition.
Market shares of provider groupsEstimates for market shares across the different providers are summarized in figure 7.1. Table 7.1 provides a breakdown of estimated market shares across urban and rural areas.
Water districts Water districts are the dominant service providers for urban areas outside Manila (table 7.2). As of 2003, water districts were serving 15.3 million people in almost 700 cities and municipalities out of the more than 1,500 in total, and were providing services to about 68% of the population in their respective franchise areas of water districts.4
Table 7.1Market shares, urban and rural populations by primary source
Type of provider Urban (%) Rural (%)
LGUs/CBOs 40 65Water districts 30 10Private operators 10 —SSIPs 15 10Households (self-supply) 5 15
Total 100 100
— = not available; CBO = community-based organization; LGU = local government unit; SSIP = small-scale independent provider.
Sources: Estimates based on official government figures provided in the Medium-Term Philippine Development Plan 2001–2004, and data from the World Bank-funded Filipino Report Card on Pro-Poor Services (2001).
Water districts are formed at the initiative of the local government. A consent5 from LWUA is needed to conclude the formal establishment and entitle the water district to technical support and financing from LWUA. Water districts enjoy legal exclusivity for services in the LGU, and any interested third party wanting to provide water supply services has to secure a waiver from the water district. New formation of water districts has slowed significantly since the early 1990s.
Water districts are GOCCs6 and own the assets they operate. As such, water district boards and staff are subject to civil service rules, government compen-sation policies, and auditing rules. While the water district model secures some autonomy from the local government in day-to-day utility management and operations, the appointing authority for board members remains with the local government. Board members are often selected on the basis of political considerations rather than on specified professional credentials. As a result, political interference, particularly in matters regarding tariff setting, is common.
LWUA plays an important role for water districts. In addition to its role as lender, LWUA staff assume specific responsibilities for management activities where LWUA judges water districts to be insuffi-ciently capable of exercising these functions to its satisfaction. Such involvement may even include representation on the water district board.7 As a lender, LWUA retains step-in rights8 in case a water district defaults on loan obligations.
Only about 10% of water districts serve multiple LGUs, and few of them have amalgamated (box 7.1), even though LWUA has encouraged this among those with contiguous service areas, whenever economically
Figure 7.1Market share by type of provider
Access to formal levels of service: 79% No access: 21%
Level 3: 44%
Level 2: 10%
Level 1: 25%
Private wellsTankered/
vended waterPiped supply
WDs: 14%
POs: 10%
LGUs/CBOs: 20%
LGUs/CBOs:35%
SSIPs and/or self-provision
by households
Complementary services provided by SSIPs and/or self-provision
CBO = community-based organization; LGU = local government unit; PO = private operator; SSIP = small-scale independent provider; WD = local water district. Levels 1, 2, and 3 are defined in endnote 20.
Source: As Table 7.1.
WorldBankInfra.indb 111 12/6/2005 8:41:34 AM
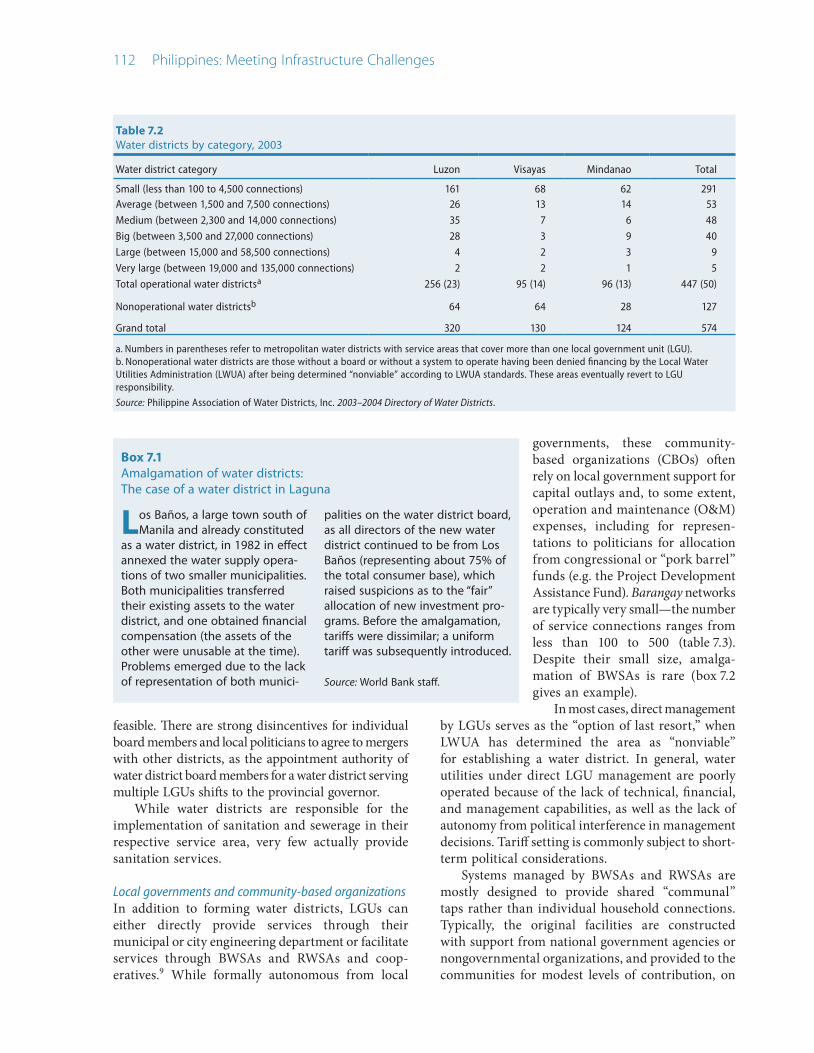
11� Philippines: Meeting Infrastructure Challenges
Table 7.2Water districts by category, 2003
Water district category Luzon Visayas Mindanao Total
Small (less than 100 to 4,500 connections) 161 68 62 291Average (between 1,500 and 7,500 connections) 26 13 14 53
Medium (between 2,300 and 14,000 connections) 35 7 6 48
Big (between 3,500 and 27,000 connections) 28 3 9 40
Large (between 15,000 and 58,500 connections) 4 2 3 9
Very large (between 19,000 and 135,000 connections) 2 2 1 5
Total operational water districtsa 256 (23) 95 (14) 96 (13) 447 (50)
Nonoperational water districtsb 64 64 28 127
Grand total 320 130 124 574
a. Numbers in parentheses refer to metropolitan water districts with service areas that cover more than one local government unit (LGU). b. Nonoperational water districts are those without a board or without a system to operate having been denied financing by the Local Water Utilities Administration (LWUA) after being determined “nonviable” according to LWUA standards. These areas eventually revert to LGU responsibility.
Source: Philippine Association of Water Districts, Inc. 2003–2004 Directory of Water Districts.
feasible. There are strong disincentives for individual board members and local politicians to agree to mergers with other districts, as the appointment authority of water district board members for a water district serving multiple LGUs shifts to the provincial governor.
While water districts are responsible for the implementation of sanitation and sewerage in their respective service area, very few actually provide sanitation services.
Local governments and community-based organizations In addition to forming water districts, LGUs can either directly provide services through their municipal or city engineering department or facilitate services through BWSAs and RWSAs and coop-eratives.9 While formally autonomous from local
governments, these community-based organizations (CBOs) often rely on local government support for capital outlays and, to some extent, operation and maintenance (O&M) expenses, including for represen-tations to politicians for allocation from congressional or “pork barrel” funds (e.g. the Project Development Assistance Fund). Barangay networks are typically very small—the number of service connections ranges from less than 100 to 500 (table 7.3). Despite their small size, amalga-mation of BWSAs is rare (box 7.2 gives an example).
In most cases, direct management by LGUs serves as the “option of last resort,” when LWUA has determined the area as “nonviable” for establishing a water district. In general, water utilities under direct LGU management are poorly operated because of the lack of technical, financial, and management capabilities, as well as the lack of autonomy from political interference in management decisions. Tariff setting is commonly subject to short-term political considerations.
Systems managed by BWSAs and RWSAs are mostly designed to provide shared “communal” taps rather than individual household connections. Typically, the original facilities are constructed with support from national government agencies or nongovernmental organizations, and provided to the communities for modest levels of contribution, on
Box 7.1Amalgamation of water districts: The case of a water district in Laguna
Los Baños, a large town south of Manila and already constituted
as a water district, in 1982 in effect annexed the water supply opera-tions of two smaller municipalities. Both municipalities transferred their existing assets to the water district, and one obtained financial compensation (the assets of the other were unusable at the time). Problems emerged due to the lack of representation of both munici-
palities on the water district board, as all directors of the new water district continued to be from Los Baños (representing about 75% of the total consumer base), which raised suspicions as to the “fair” allocation of new investment pro-grams. Before the amalgamation, tariffs were dissimilar; a uniform tariff was subsequently introduced.
Source: World Bank staff.
WorldBankInfra.indb 112 12/6/2005 8:41:34 AM

Chapter 7 Water Supply and Sanitation 11�
the condition that they form BWSAs or RWSAs and register them as legal entities. Such systems are often later “converted” to level 3 systems, i.e. modified by users by attaching rubber hoses to deliver water to individual household yards, emulating level 3 service standards. Both BWSAs and RWSAs provide for a governing board with between five and nine members, who also retain responsibilities for management and operations functions.
In sanitation, there are only three sewerage systems operating outside Metro Manila; all are managed by local government departments. Some local governments have financed neighborhood sanitation systems that are managed by users’ asso-ciations. The only exception is Metro Manila, where private operators have assumed the responsibility for managing and operating sewerage assets, yet without assuming investment obligations in sanitation.
Private operators Prompted by a water supply crisis in the capital region,10 water supply and sewerage services were
Box 7.2Amalgamation of BWSAs: The case of three barangays
Three barangays—Nena, Cam-pidham, and Libas—in San
Julian Municipality, Eastern Samar, share one spring source (about 4 kilometers from barangay Nena), transmission lines, and a storage tank, and developed a water dis-tribution system in each barangay. Each of the three formed a BWSA, and the BWSAs in turn formed a
“federated” BWSA to discuss and solve common issues. The fed-erated BWSA services nearly 6,000 people in the three barangays.
Source: ADB Project Innovations and Good Practices Rural Water Supply and Sanitation Sector Project (http://www.adb.org/water/actions/PHI/RWSS-samar-case-study.asp).
Table 7.3Sample characteristics of local government-managed water supply systems
Local government level
Operating bodyNo. of water supply
systemsNo. of households
servedNo. of people served
No. of connections (metered and unmetered)
Province Provincial LGU department 3 500–900 2,500–5,000 <1,000
City RWSA 1a 2,700 15,000 2,700
Municipality Municipal LGU department 99 7–6,500 35–56,000 <5,000
RWSA 59b 125–4,000 600–23,000 125–2,200
Barangay BWSA 18c 65–700 300–3,600 50–700
BWSA = barangay water services association; LGU = local government unit; RWSA = rural water supply association.
a. Operating in an area with a water district. b. One of the systems is operating in an area with a water district. c. Five of these systems are operating in areas with water districts.
Source: Japan International Cooperation Agency and GTZ-assisted provincial master plans for water supply and sanitation prepared for 32 provinces between 1998 and 2003.
competitively awarded through concession agreements to two private companies in 1997—MWCI and MWSI. Compared with the performance of MWSS prior to the agreements, both concessionaires have improved and expanded services. Both have made significant investments over the years, improved the quality of water supply, and provided access to network water to over 200,000 new households, including many among the poor. Yet one of the concessionaires is currently in bankruptcy and, overall, several of the ambitious targets of the original contracts have not been achieved (box 7.3). Various factors have contributed to this and may provide valuable lessons with regard to future policy approaches involving the private sector, the design of future similar agreements, and the government’s need to strengthen the sector’s regulatory framework (box 7.4).
Efforts and policies to broaden private sector involvement beyond Manila have had little success. Given the uncertainties and controversy surrounding the flagship concessions in the capital, local governments and operators have been cautious in pursuing deals,
which is hardly surprising with the lack of cost recovery that is symptomatic for most providers, coupled with the small scale of most operations. Examples of private sector participation in the water sector outside Manila include a partial privatization in Subic Bay in the form of a joint venture, and a joint venture arrangement in Tagbilaran City in Bohol province. Several LGUs have tendered design-build-lease contracts, which have attracted bidders, but have been beset by contractual problems.
WorldBankInfra.indb 113 12/6/2005 8:41:35 AM

11� Philippines: Meeting Infrastructure Challenges
Small-scale independent providersIn urban areas, SSIPs have stepped in to fill the gap left by the slow expansion of public providers. SSIPs comprise a diverse group of water operators that serve different groups of customers, some affluent and others poor. They include real estate
developers, homeowners’ associations, local entre-preneurs, and mobile water truckers and haulers. Most operate without recognition from local authorities or the water utility and develop their business in a competitive environment. Individual SSIPs in urban areas may serve between 100 and
Box 7.3The Manila water concessions
The largest and best-known example of private sector
involvement in the sector is the privatization of the Metropolitan Waterworks and Sewerage System (MWSS) in 1997 that involved $7 billion-worth of investment com-mitments over a 25-year concession period, and a service population of 12 million. The privatization was competitively conducted with the following key features:
Require Filipino investors to form consortia with international water operatorsAward the concession to the qualified bidder that offers the lowest tariffsSplit the concession area into two, not allowing a single firm to win both concession areas, and accept tariff differentials that may result from the biddingSplit the debt service require-ments of MWSS using a 9:1 ratio between west and east, based on the utilization of loans between the two zonesExclude Laiban dam (an addi-tional bulk water source) in the contract but include the raw water supply contract for 300 million liters a day in the con-tract for the westEstablish a tariff adjustment framework and a regulation system within the concession agreement.
The Manila Water Company, Inc. (MWCI) was awarded the con-cession for the east zone while Maynilad Water Services, Inc. (MWSI) was awarded the west
•
•
•
•
•
•
zone concession. Since the start of the concessions, there has been an increasing divergence in the financial performance of the two concessionaires. While both ini-tially struggled, MWCI has been profitable since 1999, though only modestly, while MWSI has never made a profit (and is now in bankruptcy).
Water supply service levels have improved in both zones compared with the preconcession period. Between 1997 and 2002, the total population receiving water services increased by about 1.7 million. Total combined water sales increased by 28% while almost 200,000 new water connections were added. Improvements in MWSI’s zone have been more limited than those in MWCI’s zone, and non-revenue water levels have actually increased. Sewerage and sanitation improvements have been very limited and the agreed targets set out in the concession agreement have not been met. In the initial rebasing of tariffs, which the con-cession agreement provides for every five years, these targets were revised substantially downward.
In March 2001, MWSI suspended payment of its concession fee. This has threatened the financial via-bility of MWSS, which, in order to meet its financial obligations, has taken out short-term debt. MWSS agreed to amend the concession agreements in October 2001. This amendment incorporated adjustment mechanisms to recover foreign exchange losses. As a result, between October 2001 and January 2002, the average MWSI water tariff
increased by 135% while that for MWCI increased by 110%. MWSS also confirmed its option under the concession agreement to implement a general rate rebasing as of January 1, 2003.
Despite tariff increases, the financial position of MWSI con-tinued to deteriorate and the company maintained its suspension of payment of the concession fee (which by early 2004 totaled about P8 billion). In February 2003, MWSI issued notification that it had ter-minated the concession. The ter-mination was contested by MWSS before an international arbitration panel, which ruled in November 2003 that no ground for early termination existed, and allowed MWSS to draw on a performance bond. In response to the ruling, MWSI sought protection from a rehabilitation (i.e. bankruptcy) court on November 13, 2003. Agreement was still to be reached between MWSI, MWSS, and the various creditors on the rehabilitation as of February 2005.
In contrast, MWCI has expanded access to services by increasing connections and is performing well financially. Between 1997 and 2004, the serviced population increased from 3.0 million to 5.1 million, staff per connection fell from 8.5 to 2.8, and nonrevenue water was reduced from 63% to 43%. On March 18, 2005, MWCI was listed on the Phil-ippine Stock Exchange, in the first initial public offering in the country since 1997.
Source: Compiled by World Bank staff.
WorldBankInfra.indb 114 12/6/2005 8:41:35 AM

Chapter 7 Water Supply and Sanitation 11�
Treatment of foreign exchange risksExchange rate risks in the original contract were shifted quite aggressively to the private firms. Mitigation was provided only by extraordinary price adjustments, and recovery of exchange rate losses was allowed only over the remaining life of the contract rather than through more fre-quent, automatic, and steeper rate adjustments. This mechanism proved insufficient for investors to cope with the unexpected volatility of the peso since 1997. Lessons from private infrastructure projects in emerging markets have brought about a new appre-ciation of foreign exchange risks. Future attempts to attract private financing—even for public water providers—will therefore likely require more immediate and credible mechanisms to mitigate currency risks.
Regulatory frameworkAt the time of the concession agreement, the government set up a regulatory office within the Metropolitan Waterworks and Sew-erage System (MWSS), accountable to the MWSS board of trustees, and to establish regulatory rules largely within the contract. In the absence of a dedicated regulatory authority, this was a pragmatic choice, though the last few years have revealed the shortcomings of this approach.
Regulatory processThe new and relatively inexperi-enced regulatory office arguably could have responded more quickly to the need to renegotiate the relevant contract, even though it might not have been legally obliged to do so. Although swifter action might have been able to limit the repercussions of the peso’s depreciation once it became
clear that a contract amendment was unavoidable, the absence of explicit legislative backing for the regulatory process and regulatory decisions opened the regulatory process to legal challenges.
Unsuitable dispute resolution and appeal mechanismsConcession contracts provided for international arbitration in the case where conflicts between the regu-latory office and either of the con-cessionaires could not be resolved amicably, but did not specify ami-cable dispute resolution or trans-parent appeal mechanisms short of international arbitration. As a result, there have been several cases of costly and lengthy arbitration.
Managing conflicts of interestUnder the concession contracts, MWSS retained responsibilities directly affecting the performance of the concessionaires, including the supply of bulk water. Several of these projects were delayed in execution or canceled due to insufficient MWSS funds, creating conflicts of interest for the board of trustees, and tainting the credibility of the regulatory process.
Transparency and public disseminationAbsent a mandate, the necessary resources, and accountability, the regulatory office has been unsuc-cessful in developing a transparent regulatory process, including wide public participation and regular dissemination of mean-ingful performance measure-ments and benchmarks for the concessionaires.
Incentives for reducing unaccounted-for waterThe concession contracts did not specify explicit targets to reduce water losses. The design assumed that bidders would have natural
incentives to do this so as to increase sales and revenues, as well as unit operating costs. The con-tract also committed MWSS to pro-viding substantial additional bulk supply at no cost to the conces-sionaires and offered to bidders a chance to pass through high oper-ating costs to consumers at price reviews. With hindsight, the incen-tives provided to reduce water losses were not strong enough to induce the concessionaires to direct significant investments toward that objective, and might have been enhanced significantly by a bulk water surcharge levied on the con-cessionaires with a pass-through to consumers only for water sold. The 2003 rate rebasing targets introduced key performance indi-cators, which include targets for nonrevenue water. This has pro-vided stronger incentives for the concessionaires.
Market structureSplitting the MWSS service area into two zones allowed for benchmarking between the two providers during regulatory reviews. The ability to compare performance and the presence of a possible “replacement operator” have strengthened the government in the ongoing dispute with Maynilad Water Services. Another benefit can be seen in the fact that, although water providers often insist on and are granted exclusivity for providing services in concession areas, in this case the government allowed small-scale independent providers (SSIPs) to continue serving consumers while providing incentives to the concessionaires to cooperate with incumbent SSIPs. This has triggered innovative partnership initiatives that have had a big impact on providing new connections to low-income households.
Source: World Bank staff.
Box 7.4Lessons from the Manila water concessions for the design of future private sector contracts
WorldBankInfra.indb 115 12/6/2005 8:41:35 AM

11� Philippines: Meeting Infrastructure Challenges
Figure 7.2Capital expenditure per connection, selected Asian cities, 2001/2002
UlaanbaatarOsaka
Phnom PenhChengdu
Kuala LumpurDhaka
Hong KongSeoulDelhi
Ho Chi MinhJakarta
VientianeShanghai
ManilaKathmandu
ColomboKarachi
Tashkent
0 50 100 150 200 250US$
1,980
Source: Asian Development Bank. 2004. Water in Asian Cities: Utilities Performance and Civil Society Views. Manila.
3,200 connections.11 In rural areas, SSIPs take the form of water vendors, who invest in pushcarts or pedicabs (bicycles with sidecars) and usually source their water from public taps or private connections. Water vendors augment water supplies of households from private wells or where the water source is at a distance.
The overall market size of SSIPs is unknown and very difficult to estimate, but likely to be sizable as a substantial portion of the population does not have access to sufficient formal levels of service. In Metro Manila alone, it is estimated that 30% of the population depended on SSIPs in 1996;12 similarly in Cebu, about 30% of the 1.5 million population are served by SSIPs.13 It is difficult to estimate to what extent Manila water privatization has impacted SSIPs. One feature of the concession contracts is that neither concessionaire was awarded an exclusive right to provide services. Both were given incentives to cooperate with SSIPs, as services provided by SSIPs were accounted for when assessing conformance with coverage targets as stipulated by the concession contracts. As a result, a number of innovative part-nerships between concessionaires and incumbent SSIPs have developed, in some cases with SSIPs as offtakers buying for resale to customers.
While not specifically geared toward low-income households, some SSIPs target and serve low-income urban settlements where households cannot afford connection fees or where tenure disputes prevent the concessionaires from offering individual household connections.14 Local entrepreneurs also play a large role in providing sanitation services, particularly for desludging of septic tanks in many urbanized LGUs. For Metro Manila alone, about 75 firms offer such tank-cleaning services.
Self-provision by householdsHouseholds without access to any formal level of service resort to self-provision, using either shallow wells if they are poor or deep wells if they have higher incomes. An estimated 20–30% of the population rely on self-provision, both as their main source of water supply and in combination with other sources. Many households use several sources of water even when connected to a public distribution system. In lower-income households, people tend to
limit consumption from the water supply system for drinking and cooking purposes, and rely on wells and surface water for bathing and laundry. Many high-income households invest in private wells to mitigate the water utilities’ poor service. Sanitation (i.e. toilets and septic tanks) is treated by government policies as primarily a private responsibility. The presence of a septic tank is commonly a requirement of local building codes, and both construction and main-tenance of these facilities are carried out by private households.
Investment needs and financing
To achieve the Millennium Development Goal of 90% access to formal services by 2010, the investment need for water supply is estimated to be around P6 billion–7 billion a year. The cost of implementing the Clean Water Act, passed in February 2004, is estimated at up to P35 billion a year (appendix 8).
Actual investment in water supply and sanitation over the last two decades has been far below these required levels. Total investment has fluctuated at around P3 billion–4 billion a year. Out of this, capital expenditures on sanitation—largely public investments in the Metro Manila area—amounted to about P500 million a year. Investments have been heavily skewed toward Manila, yet compared with capital expenditure per connection for other water supply systems in Asian cities,15 even these are at the very low end (figure 7.2).
Investment figures (figure 7.3) indicate an uptrend
WorldBankInfra.indb 116 12/6/2005 8:41:35 AM

Chapter 7 Water Supply and Sanitation 11�
over 2002–2003, but this is unlikely to be sustainable. The majority of public investment is channeled through MWSS and LWUA, which show significant increases in expenditures and disbursements in 2002 and, in the case of LWUA, in 2003. They accounted for 76% of total investment in 2003, and 53% of total sector investment in the last 10 years. However, both are facing acute financial distress. Private investments have become very significant over the last years, predominantly in Metro Manila, and investments by MWCI and MWSI have been equivalent to about 50% of total sector investments over the last five years (1999–2003). Yet the uncertainties surrounding the financial collapse of MWSI and the ongoing rene-gotiations will almost certainly depress investment
flows in the coming years. Therefore, in the absence of major reforms in the sector, it is likely that capital expenditures will fall below even the low average levels of the last decade.
National government. Since 1991, the government has facilitated public investments through three main avenues: onlending of funds to national sector agencies, in particular LWUA and MWSS; onlending to LGUs, through the government financial insti-tutions (GFIs) and the Municipal Development Fund Office; and grants for community-driven initiatives. In addition, congressional funds remain an important source of funding for water projects. In 2000 and 2001, it is estimated that P247 million and P747 million, respectively, of such funds were obligated for water supply investments.16 Congres-sional funds for water projects are charged against the budgets of national agencies, predominantly DPWH and to a lesser extent LWUA, and imple-mented by these agencies.
Local governments. LGU financial records indicate expenditure levels of about P400 million a year (table 7.4), but spending has been largely in support of recurrent expenditures.
MWSS. In Metro Manila, MWSS has continued to make significant financing available to the sector since awarding the concessions. However, its ability to channel financing into the sector even at the same low levels as the last few years is in jeopardy. MWSS capital outlays dropped significantly from about P2.9 billion in 2001 and P1.9 billion in 2002 to about P0.7 billion in 2003, and sanitation investments dropped to about P100 million–250 million a year, indicating the severe financial distress brought about by the default of MWSI. Without major financial
Figure 7.3Water sector capital expenditures
P bi
llion
(199
4 pr
ices
)
0
1
2
3
4
5
6
7
Total expenditures
Private
GOCCs
LGUs
NG
2003200119991997199519931991198919871985Year
GOCC = government owned and controlled corporation; LGU = local government unit; NG = national government.
Note: For 2003, GOCC data are as of September; private sector data are unaudited and LGU data are unavailable.
Sources: Department of Budget and Management; Department of Finance; Commission on Audit; Maynilad Water Services, Inc.; Manila Water Corporation, Inc.; and National Statistical Coordination Board.
Table 7.4Local government expenditures on water supply and sanitation, 1990–2002 (P million)
1990 1994 1998 2002
Operation of waterworks system: Total expenditures 86.0 157.0 277.0 246.0
Personnel services 29.0 58.0 123.0 108.0
Maintenance and other operating expenses 29.0 43.0 102.0 81.0
Capital outlay 27.0 56.0 52.0 57.0
Local Development Fund 30.0 1,036.0 1,684.0 1,433.0
Share of WSS in Local Development Funda 1.2 41.4 59.8 57.3
Estimated total of LGU resources spent on WSS 87.0 198.0 337.0 303.0
Estimated total capital outlay of LGUs for WSS 28.0 97.0 112.0 114.0
LGU = local government unit; WSS = water supply and sanitation.
a. Own estimate based on own LGU record samples, assuming that LGUs allocate about 4% of their Local Development Fund to WSS projects.
Source: Commission on Audit.
WorldBankInfra.indb 117 12/6/2005 8:41:36 AM

11� Philippines: Meeting Infrastructure Challenges
Table 7.5 Local Water Utilities Administration capital expenditures, 1992–2003 (P million)
Item 1992 1993 1994 1995 1996 1997 1998 1999 2000 2001 2002 2003
Capital expenditures 478 341 471 687 740 761 852 748 747 732 1,215 1,645Sources of financing
Foreign financing 111 36 145 324 348 414 418 438 301 485 825 1,093
Domestic borrowings n.a. n.a. n.a. n.a. n.a. 61 78 40 19 1 67 403
Internal cash generation 4 17 14 10 10 6 20 45 32 29 52 35
National government subsidy 290 235 268 247 298 216 280 194 126 138 257 99
Congressional funds — 10 35 86 81 60 46 24 29 24 9 6
Special funds 74 43 9 20 3 4 10 5 1 4 n.a. n.a.
Lingap para sa Mahirap n.a. n.a. n.a. n.a. n.a. n.a. n.a. n.a. 233 43 n.a. n.a.
Water district equity n.a. n.a. n.a. n.a. n.a. n.a. n.a. 3 6 9 5 9
— = not available; n.a. = not applicable.
Note: Lingap para sa Mahirap (Care for the Poor) was the poverty alleviation program of the Estrada administration (1999–2001).
Source: Local Water Utilities Administration.
restructuring, it is highly unlikely that MWSS will be able to sustain investment levels.
LWUA. LWUA has been the main conduit of loans provided by the national government and interna-tional finance institutions to the water sector. Since the late 1990s, LWUA has had difficulties disbursing ODA loans due to lack of counterpart funding on its behalf as well as the inability of the water districts to raise equity contributions. However, disbursements over the past few years have improved markedly, from an average of about P700 million a year during the late 1990s to about P1.6 billion in 2003 (table 7.5). It is unlikely, though, that LWUA will be able to sustain this performance. Indeed, there has been almost no new loan commitment to LWUA for the past few years.
Private investment. Private financing of investment in the sector has taken on significant dimensions since 1997, but has been largely concen-trated in Metro Manila. The two concessionaires in the capital have incurred a total of about P16 billion ($286 million) of capital expenditures since 1997 (about P2 billion a year), over half of which has been privately financed (table 7.6). Outside Metro Manila, private financing and investment in water utilities have been limited. Investment through SSIPs is believed to be significant, but information on exact figures is very limited.17 Investments by private households, either to upgrade communal facilities or to drill private wells, are significant, conserva-tively estimated at about $4.3 million (P235 million) annually.18
In the absence of sewerage services, the majority of urban households have built their own sanitation facilities, most commonly flush toilets connected to private septic tanks. In Metro Manila alone, more than a million such systems are in use. Many private housing developments now have small independent sewer networks and connect to a communal septic tank. The total investment by private households in these systems is difficult to estimate, but significant.
Table 7.6Manila water concessionaire capital expenditures, 1997–2003 (P million)
Item 1997 1998 1999 2000 2001 2002 2003a Total
Manila Water Company, Inc. 350 842 588 654 865 1,406 1,804 6,509Concessionaire financing 253 579 357 308 586 734 1,316 4,133
Concession fee projectsb 97 263 231 346 279 672 488 2,376
Maynilad Water Services, Inc. — 808 1,234 3,003 1,702 1,727 983 9,457Concessionaire financing — 90 294 1,568 492 1,094 738 4,276
Concession fee projectsb,c — 718 940 1,435 1,210 633 245 5,181
Total 350 1,650 1,822 3,657 2,567 3,133 2,787 15,966
— = not available.
a. Unaudited. b. Covers payments made from Metropolitan Waterworks and Sewerage System loans and local counterpart support provided by the concessionaires. c. Figures are inclusive of 10% value-added tax and do not include the concessionaire’s overhead, engineering, supervision, and consultancy costs, nor materials supplied from the concessionaire’s in-house inventory of supplies.
Sources: Manila Water Company, Inc.; Maynilad Water Services, Inc.
WorldBankInfra.indb 118 12/6/2005 8:41:36 AM

Chapter 7 Water Supply and Sanitation 11�
Sector performance
Information on the performance of the sector is difficult to obtain and can be gleaned in most cases only from sector studies that cover a limited sample of service providers at a given time. It is therefore difficult for the government and for users of services to assess critical aspects such as the efficiency of services provided and the quality of services. The lack of such vital information makes it difficult for the government to formulate policies, track progress over time, or hold agencies and service providers more accountable.
Access There are various estimates—not fully consistent—as to access of the population to water supply services and sanitation facilities. Data from the World Health Organization (WHO) and the United Nations Children’s Fund (UNICEF) indicate that overall access to improved water sources in the Philippines as of 2002 was 85%, with 90% and 77% access in urban and rural areas, respectively (table 7.7). These figures compare favorably with other economies in the region, but also reveal a downward trend in coverage over the last decade, while all other neigh-boring economies have improved their access levels significantly.
Recent government data, based on household surveys, show slightly different estimates but confirm that only very modest growth has occurred over the past decade and that access levels for water supply are
now indeed slipping. Access to safe drinking water deteriorated from 81.4% in 1999 to 80% in 2002 for the entire population, while for the lowest 40% of the population in income terms, access declined from 71.5% to 70.2% over this period (table 7.8). Across regions, there are wide disparities in access: the Autonomous Region in Muslim Mindanao has only 29% of its households with access compared with 97% in Central Luzon.19
Independent surveys show overall lower access levels: survey data from the Filipino Report Card on Pro-Poor Services published in 2001 reports that only 64% of the population had access to any of the formal
Table 7.7Access to drinking water and sanitation: Cross-country comparison
Country Year
Improved drinking water coverage (%)Improved sanitation coverage (%)
Total Urban Rural
Total HH conn. Total HH conn. Total HH conn. Total Urban Rural
China 1990 70 49 100 80 59 37 23 64 72002 77 59 92 91 68 40 44 69 29
Indonesia 1990 71 10 92 26 62 3 46 66 382002 78 17 89 31 69 5 52 71 38
Philippines 1990 87 21 93 37 82 6 54 63 462002 85 44 90 60 77 22 73 81 61
Malaysia 1990 — — 96 — — — 96 94 982002 95 — 96 — 94 64 — — 98
Vietnam 1990 72 11 93 51 67 1 22 46 162002 73 14 93 51 67 1 41 84 26
— = not available; HH conn. = household connections.
Source: World Health Organization/United Nations Children’s Fund. 2004. Meeting the MDG Drinking Water and Sanitation Target: A Mid-Term Assessment of Progress.
Figure 7.4Sewerage access, selected Asian cities, 2001/2002
Hong KongOsakaSeoul
ChengduTashkent
Kuala LumpurShanghai
DelhiKarachi
UlaanbaatarPhnom Penh
ColomboDhaka
KathmanduHo Chi Minh City
ManilaJakarta
Vientiane
0 20 40 60 80 100Percent
Source: Asian Development Bank. 2004. Water in Asian Cities: Utilities Performance and Civil Society Views. Manila.
WorldBankInfra.indb 119 12/6/2005 8:41:36 AM

1�0 Philippines: Meeting Infrastructure Challenges
Table 7.8Access to water supply and sanitary toilets, by income stratum, 1998, 1999, and 2002
1998 1999 2002
All families
Lowest 40%
Highest 60%
All families
Lowest 40%
Highest 60%
All families
Lowest 40%
Highest 60%
Total no. of families (‘000) 14,371 5,748 8,623 14,746 5,898 8,847 15,925 6,370 9,555With access to water supply (%) 78.1 66.2 85.9 81.4 71.5 88.0 80.0 70.2 86.6
With access to sanitary toilets (%) 80.4 65.7 90.2 85.8 73.9 93.9 86.1 73.1 94.8
Source: Annual Poverty Indicators Survey, National Statistics Office, various years.
levels of service in 2000, with the rest relying on self-provision. Of the 64% with access, only about 39% reportedly were connected to level 3 systems, with 25% being served by level 1 and 2 facilities.20
Household surveys conducted by the government indicate that access to sanitary toilet facilities increased slightly—by 0.3 percentage points to 86.1% in 2002 from the 1999 rate,21 while other government estimates show a slightly declining trend—to 74.2% in 2000 from 74.9% in 1991.22 While these figures compare favorably with other countries in the region, they represent access to sanitary toilets, and not neces-sarily to satisfactory sanitation. It is in fact estimated that only about 4% of the population nationwide had access to sewerage as of 2000 (table 7.9) and that, of the vast majority of households with septic tanks, only about 3% (mostly rural) had acceptable on-site treatment and disposal.23 Outside Metro Manila, access to sewerage networks is practically nonex-istent with only three sewerage systems—in Baguio, Vigan, and Zamboanga—which serve less than 3% of their respective service area populations.24
Quality of serviceQuality of service information is neither published nor monitored systematically across the sector. Indications are that most small systems have interrupted supply and significant pressure fluctuations, and so face difficulty in abiding by drinking-water quality standards. For water districts, LWUA standards require that level 3 facilities should be able to provide 120 liters per capita per day (lpcd); 24 hours of water availability a day; drinking water quality according to Philippine
Table 7.9Access to sanitation and sewerage, 2000
Population(million)
Population served(million)
Share of population served (%)
Sanitation facilities MWSS service areas
Maynilad Water Services, Inc. 8.0 0.0 0.0
Manila Water Company, Inc. 5.3 1.2 22.00
Rural and other urban areas 62.9 55.4 88.00
Total 76.2 56.6 74.00
Sewerage systemsMWSS service areas
Maynilad Water Services, Inc. 8.0 0.5 0.06
Manila Water Company, Inc. 5.3 1.2 0.22
Outside MWSS areaa 0.4 0.0 0.00
Total 13.7 0.6 4.10
MWSS = Metropolitan Waterworks and Sewerage System.
a. Baguio City and Zamboanga City only.
Note: Population calculated from number of household connections. A household comprises six persons.
Sources: National Economic and Development Authority; 2000 Census of Population, National Statistics Office.
National Standards for Drinking Water (PNSDW); and hydraulic pressure of at least 7 meters and 11 meters, for residential and commercial establishments, respectively. LWUA reports that the majority of water districts have attained these performance levels. Yet, on the basis of data gathered for 64 water districts of various sizes, as well as anecdotal evidence, many water districts do not in fact meet these standards. For example, water availability in a sample of 38 small water districts ranged from 10 to 24 hours a day.
For LGU-managed systems, based on a limited sample of 30 LGUs, over 50% reported interrupted supply or did not have data. Only 14 LGUs reportedly comply with water quality standards. Other studies reveal even worse service levels. Water availability is often less than an hour a day, pressure low and uneven with households in the extremities of the
WorldBankInfra.indb 120 12/6/2005 8:41:37 AM
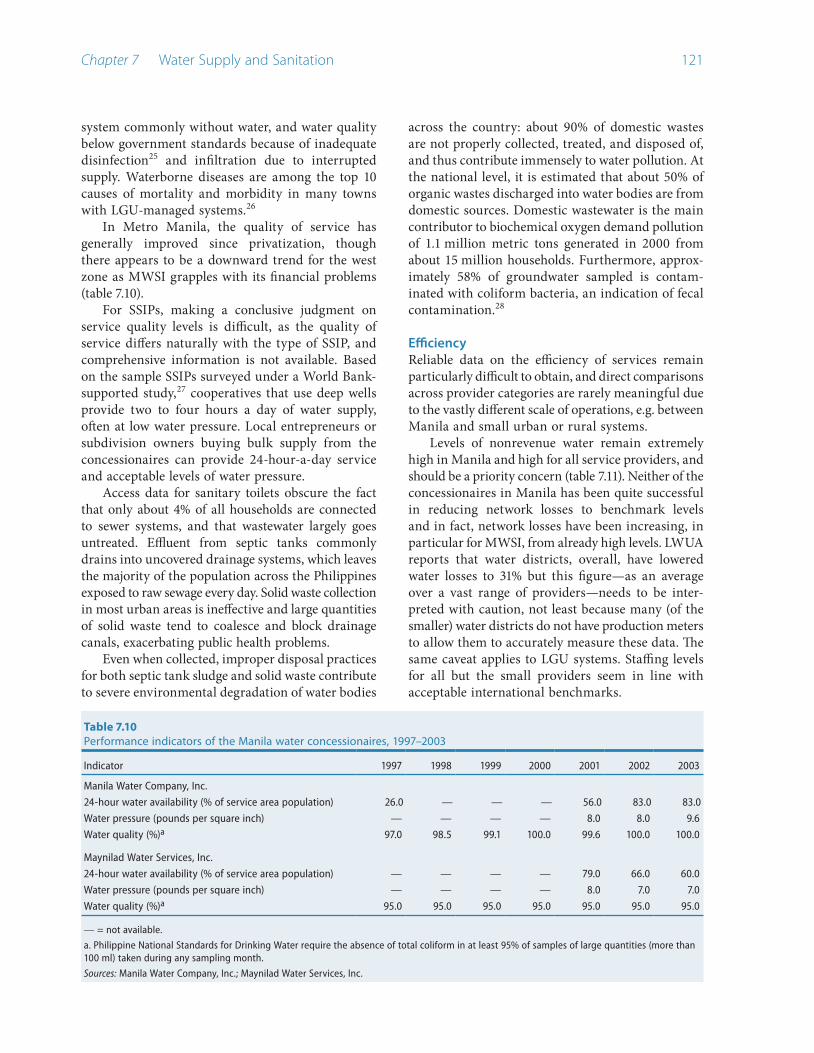
Chapter 7 Water Supply and Sanitation 1�1
system commonly without water, and water quality below government standards because of inadequate disinfection25 and infiltration due to interrupted supply. Waterborne diseases are among the top 10 causes of mortality and morbidity in many towns with LGU-managed systems.26
In Metro Manila, the quality of service has generally improved since privatization, though there appears to be a downward trend for the west zone as MWSI grapples with its financial problems (table 7.10).
For SSIPs, making a conclusive judgment on service quality levels is difficult, as the quality of service differs naturally with the type of SSIP, and comprehensive information is not available. Based on the sample SSIPs surveyed under a World Bank-supported study,27 cooperatives that use deep wells provide two to four hours a day of water supply, often at low water pressure. Local entrepreneurs or subdivision owners buying bulk supply from the concessionaires can provide 24-hour-a-day service and acceptable levels of water pressure.
Access data for sanitary toilets obscure the fact that only about 4% of all households are connected to sewer systems, and that wastewater largely goes untreated. Effluent from septic tanks commonly drains into uncovered drainage systems, which leaves the majority of the population across the Philippines exposed to raw sewage every day. Solid waste collection in most urban areas is ineffective and large quantities of solid waste tend to coalesce and block drainage canals, exacerbating public health problems.
Even when collected, improper disposal practices for both septic tank sludge and solid waste contribute to severe environmental degradation of water bodies
across the country: about 90% of domestic wastes are not properly collected, treated, and disposed of, and thus contribute immensely to water pollution. At the national level, it is estimated that about 50% of organic wastes discharged into water bodies are from domestic sources. Domestic wastewater is the main contributor to biochemical oxygen demand pollution of 1.1 million metric tons generated in 2000 from about 15 million households. Furthermore, approx-imately 58% of groundwater sampled is contam-inated with coliform bacteria, an indication of fecal contamination.28
EfficiencyReliable data on the efficiency of services remain particularly difficult to obtain, and direct comparisons across provider categories are rarely meaningful due to the vastly different scale of operations, e.g. between Manila and small urban or rural systems.
Levels of nonrevenue water remain extremely high in Manila and high for all service providers, and should be a priority concern (table 7.11). Neither of the concessionaires in Manila has been quite successful in reducing network losses to benchmark levels and in fact, network losses have been increasing, in particular for MWSI, from already high levels. LWUA reports that water districts, overall, have lowered water losses to 31% but this figure—as an average over a vast range of providers—needs to be inter-preted with caution, not least because many (of the smaller) water districts do not have production meters to allow them to accurately measure these data. The same caveat applies to LGU systems. Staffing levels for all but the small providers seem in line with acceptable international benchmarks.
Table 7.10Performance indicators of the Manila water concessionaires, 1997–2003
Indicator 1997 1998 1999 2000 2001 2002 2003
Manila Water Company, Inc.
24-hour water availability (% of service area population) 26.0 — — — 56.0 83.0 83.0
Water pressure (pounds per square inch) — — — — 8.0 8.0 9.6
Water quality (%)a 97.0 98.5 99.1 100.0 99.6 100.0 100.0
Maynilad Water Services, Inc.
24-hour water availability (% of service area population) — — — — 79.0 66.0 60.0
Water pressure (pounds per square inch) — — — — 8.0 7.0 7.0
Water quality (%)a 95.0 95.0 95.0 95.0 95.0 95.0 95.0
— = not available.
a. Philippine National Standards for Drinking Water require the absence of total coliform in at least 95% of samples of large quantities (more than 100 ml) taken during any sampling month.
Sources: Manila Water Company, Inc.; Maynilad Water Services, Inc.
WorldBankInfra.indb 121 12/6/2005 8:41:37 AM

1�� Philippines: Meeting Infrastructure Challenges
Information is least available on LGU-run or community-based systems and is generally based on very small samples. LGU systems are often quite small, and as a result they frequently have low managerial and technical capability, and staff face probably weak incentives and constraints to operate more efficiently. Among the service providers, the private utilities and water districts are performing reasonably well financially, compared with community-based systems facilitated by LGUs, such as BWSAs or RWSAs.
Tariffs for water and sanitation Tariff levels, tariff structures, and tariff-setting meth-odologies differ across individual service providers, and comprehensive information on tariff levels or structures is not publicly available.
Domestic tariffs in Manila are structured in increasing blocks with an initial lifeline block of 10 cubic meters, and connection fees of $40–60 are charged to new consumers. The privatization brought about a substantial reduction in the initial tariffs; the bid for the east zone was 26% of the prevailing tariff of MWSS at that time, and for the west zone, 57%. Tariffs have since steadily increased, mainly to cover inflation and foreign exchange fluctuations. However, despite the nominal increases since 1997, tariffs in Manila remain fairly low compared with other Asian cities (figure 7.5). Both concessionaires levy sewerage charges in the order
Table 7.11Efficiency indicators of selected water service providers, 2002
Service provider Nonrevenue water (%)
Operating ratio (%)a
Staff per 1,000 connections
Privateb
Manila Water Company, Inc. 53 79 4.1 Maynilad Water Services, Inc. 69 119 4.2Water districts 31c 74d 7.14d
Local government units 70c 56e 21.30f
a. Defined as operating expenses before debt service over operating revenues. b. Sources: Manila Water Company, Inc., Maynilad Water Services, Inc. c. As of end-2000; source: ADB. 2001. Water Supply and Sanitation Profile. d. 2002 water district industry average; source: Local Water Utilities Administration. e. Only for LGU-operated systems; based on audited financial reports of all provinces, cities, and municipalities, but excluding barangays; source: Commission on Audit 2002; operating ratio is 0.65 for municipalities and 1.2 for provinces. f. Based on a sample of four LGUs; source: Water Supply and Sanitation Performance Enhancement Project. 2003. “Management Models for Small Towns Water Supply.”
of 50% of the household water bill and a service connection fee; in addition, all water customers, even without a sewerage connection, must pay a 10% environmental surcharge.
For water districts, tariffs range from P215 to P240 for 10 cubic meters monthly household consumption, the minimum monthly charge. In addition to tariffs, water districts typically charge connection fees—currently about $100—and usually require them to be paid upfront, which is certainly a barrier for lower-income groups to access piped water services. Few water districts levy sanitation surcharges or sewerage tariffs on their consumers.
Metro Zamboanga water district, which manages a public sewerage system, assesses a sewerage charge of 50% of the water bill and has a 99% collection rate.
Tariff structures for LGU systems as well as community-based systems vary widely, including increasing block rates, decreasing block rates, or flat rates, as many LGU systems provide no or only partial metering of household connections. LGUs typically charge connection fees although they do not usually recover full connection costs. Most community-based systems providing service levels 1 or 2 charge nothing or only nominal tariffs (i.e. flat monthly rates of P5–10), with local governments and politicians meeting the costs of maintenance and replacement. LGUs managing sewerage facilities charge flat (or even zero) sewerage charges, and do not recover their costs.
Figure 7.5Average tariffs, selected Asian cities, 2001/2002
OsakaSeoul
Hong KongKuala Lumpur
JakartaPhnom Penh
ColomboUlaanbaatar
Ho Chi Minh CityChengdu
ManilaShanghai
KathmanduDelhi
KarachiDhaka
VientianeTashkent
0.0 0.1 0.2 0.3 0.4 0.5US$ per cubic meter
1.37
Source: Asian Development Bank. 2004. Water in Asian Cities: Utilities Performance and Civil Society Views. Manila.
WorldBankInfra.indb 122 12/6/2005 8:41:37 AM

Chapter 7 Water Supply and Sanitation 1��
Table 7.12Approved tariff increases in the Metropolitan Waterworks and Sewerage System concession areas, average tariff (P per cubic meter)
Charging periodMWCI
(east zone)MWSI
(west zone)
Inflation, % (average for
year)a
Pre-1997 8.56 8.561997–1998 2.32 4.96 9.71999 2.61 5.80 6.72000 2.76 6.13 4.32001 2.95 6.58 6.1Provisional implementation, April 2001 3.22Accelerated EPA, October 2001 4.22 10.792002 4.51 11.39 3.1Foreign currency depreciation
adjustment, 20026.75 15.46
EPA = extraordinary price adjustment; MWCI = Manila Water Company, Inc.; MWSI = Maynilad Water Services, Inc.
a. Base year is 1994. Source is National Statistics Office data as of March 2004.
Source: Metropolitan Waterworks and Sewerage System Regulatory Office.
Among SSIPs, water rates differ. Tariffs range from P15 per cubic meter for a community-owned water facility, P45.31 per cubic meter for a piped customer of a local entrepreneur using an intermediary (water tender), P80 per cubic meter for a water customer using a water hose, to as high as P187.35 per cubic meter for water bought from a water tanker. Tariff structures include increasing block rates, decreasing block rates, or uniform rates. Most SSIPs also charge connection fees but are often cheaper and have more flexible payment arrangements than the incumbent formal water utilities.29
While tariffs charged by SSIPs in Manila are higher than the regulated tariffs of the concessionaires, this is largely reflective of their cost structure. For example, one of the larger SSIPs in Manila, Inpart Engineering, which serves predominantly low-income urban households, receives bulk supply from MWCI at the commercial rate of about $0.39 per cubic meter rather than lifeline rates of $0.15–0.25 charged to residential customers. Tariffs charged to Inpart customers with a piped connection (but no connection fee) corre-spondingly range from $0.90 to $1.60, but still compare well with rates charged by water haulers ($3.70).
AffordabilityAffordability concerns are typically presented as the key justification and the main political argument for not raising water tariffs or for not levying charges for sanitation. Yet there is little comprehensive evidence that tariffs charged by water utilities pose an afford-ability problem to large parts of the population in the Philippines. Based on a government survey,30 an average of 1% of total household expenditure is spent on water, with little variation between lower-income and higher-income groups and across regions.
A July 2004 survey among low-income Metro Manila residents31 tested respondents’ perceptions as to the fairness of prices charged by the two conces-sionaires. Respondents revealed that they spend an average of 4.3% of income on water from the network, consider that amount appropriate (12% considered the price “below the cost of service” and another 53% “only fair”), and are generally positive about the quality of water they receive from the network (very
good 7%; good 43%; fair 25%) and still spend an additional 3.7% of household income on water from other sources, including bottled water.
Other studies point to more significant afford-ability constraints. The survey for the Filipino Report Card on Pro-Poor Services carried out in 2000 showed that water accounts for up to 9% of monthly household expenditures (including the boiling of water for drinking purposes, etc.) of low-income households. For example, low-income consumers of SSIPs such as Inpart Engineering reportedly spend up to 16% of household income on water, but are still better off than purchasing water from tankers.32 For Metro Manila, expenditure on clean water may account for as much as 20% of household income for those not enjoying 24-hour piped water supply and dependent on buying water from vendors at around $20 a month for 6 cubic meters.33 These figures demonstrate that improving affordability will depend primarily on better access of households to network services rather than on lower network tariffs.
Main issues
Institutional fragmentation Development of the water supply and sanitation sector in the Philippines has been seriously undermined by the high level of fragmentation, both at the local service provider level and at the national government level. The key symptoms of fragmentation include:
WorldBankInfra.indb 123 12/6/2005 8:41:37 AM

1�� Philippines: Meeting Infrastructure Challenges
Proliferation of different service provider models, operating under different managerial regimes, regulatory frameworks, and financing constraints. The models include water districts, direct LGU management, BWSAs, RWSAs, cooperatives, private firms, and SSIPs. The results of such proliferation are blurred accountability of indi-vidual providers for expanding both water supply and sanitation services, and extreme difficulty for regulation and oversight.
The very small sizes of individual service providers. About 5,000 entities provide water supply services in the country. Among them, up to 2,000 provide level 3 services, and only about 80 water districts and five private water providers outside Metro Manila serve more than 5,000 household connec-tions. The majority of these entities are too small, with neither sufficient operational scale nor the necessary autonomy from political interference to be efficient providers, making it extremely difficult to improve service efficiency. Among the LGU levels, the vast majority of water providers have been established at the barangay level; as a result, coordination and cooperation among barangay water suppliers, for example to develop bulk sources, is often difficult and tainted by local politics and political rivalries.
Fragmentation of oversight responsibilities at national level. Oversight responsibilities for the sectors are divided among several agencies: MWSS for Manila, LWUA for water districts, and DILG for LGU systems. NWRB and DENR both play important roles with regard to planning, regulation, water resource allocation, and sani-tation improvement. In addition, DOF and the Municipal Development Fund Office, as well as GFIs (e.g. Development Bank of the Philippines, Land Bank of the Philippines) are involved in formulating grant policies and credit lending to the sector. Without a national government agency responsible for overall sector policy, planning, and reform, coordination between the various national government agencies also remains weak and lacking in consistency. Recent initia-tives, such as the reform of LWUA, strengthening of NWRB, and the Clean Water Act provide an opportunity to better align sector responsibilities and agencies, but at the same time they present significant challenges to the sector in terms of implementing such reforms seamlessly.
•
•
•
Sector-wider consolidation is needed for the long-term growth of the sector. There is an urgent need to promote and speed up amalgamation at the local level, and to establish strong leadership at the national level.
Low cost-recovery level The core constraint that undermines the development of the entire sector is the low tariff level, which is not even sufficient for service providers to recover recurrent costs, let alone to accumulate sufficient reserves to fund new capital investments. Despite repeatedly stated policy objectives of cost recovery, actual progress toward this end is minimal.
For LGU-managed systems, tariffs are too low to recover even O&M costs. As a result, they continue to be dependent on the local government to augment their revenues. The quality and coverage of their service suffer significantly as a result. While water districts as a whole achieve higher cost-recovery levels, and recover their cash expenses (O&M costs and debt service), they still fail to generate sufficient revenues to accumulate reserves (for example, through depre-ciation charges) to fund any expansion or to attract financing on commercial terms.
Water tariffs are short of the cost-recovery level, even in Metro Manila. The fact that one of the concessionaires incurred losses while the other made a modest income indicates that tariff revenues are currently inadequate to cover costs, including the concession fees owed to MWSS. And while MWSS retained investment obligations under the concession contract for bulk supply to the system, current tariffs do not allow for this.
Finally, most systems have no sewerage tariff. Even in Manila, where the concessionaires charge 50% of the water tariff for sewerage and a connection fee, there is a disincentive to connect, as households are only charged if they are connected to the sewerage system.
Ironically, low tariff levels charged by utilities have become the most important factor in the issue of affordability for low-income households, as the poor have to resort to much more expensive alter-natives for water supply. From a service expansion perspective, the current level and structure of water tariffs also have the following shortcomings:
Discouraging service expansion. Current tariffs constrain the ability of providers, including many of the water districts, to grow more rapidly and expand water supply systems more aggressively.
•
WorldBankInfra.indb 124 12/6/2005 8:41:38 AM

Chapter 7 Water Supply and Sanitation 1��
For providers to be able to not only add connec-tions but also trunk infrastructure and new bulk supply, tariff increases are necessary. Households not at present connected to the network therefore have a stake in the regulatory process, including reviewing tariffs, but they are rarely involved.
Discouraging connecting residential users. Under the present tariff structure in Manila and in many water districts, tariffs for the initial consumption block (or flat rates) are below the average price of water; given the constraints imposed on water supply both by the lack of new bulk water and high network losses, specifically in Manila, this limits the incentives for concessionaires to connect residential users. Reforms of the tariff structure, including the “flattening” of block tariffs or the adoption of uniform volumetric tariffs, might correct the situation.
High cost for SSIP users. In Metro Manila, allowing the concessionaires to sell water to SSIPs, which in turn sell water to the users outside the current coverage area, has a significant impact on improving affordability for those not connected to the system. However, affordability for house-holds served by SSIPs can be further improved if residential rates, instead of commercial rates, are charged to such SSIPs.
On a positive note, the Manila concessionaires and SSIPs have developed innovative approaches to increase access to low-income and low-consumption households, without subsidies, by allowing customers to pay connection fees in installments or through a higher water tariff, by reducing connection costs through sharing meters, and by using low-cost approaches such as hoses for establishing individual connections in informal settlements. Many of these approaches could be adopted by water districts, but they lack both the capacity and flexibility from the regulatory authorities, primarily LWUA, to allow for such innovation, partic-ularly in terms of technical standards.
Unsatisfactory performance by utilitiesOverall, water service providers do not perform satis-factorily. Among the approximately 5,000 providers in the country, viable operators are the exception rather than the rule. The common issues are slow service expansion and low coverage, low service quality, high nonrevenue water levels, and requirements for subsidies by the majority of service providers.
•
•
Among the public water service providers, the category with the worst performance is also the most numerous: the BWSAs, RWSAs, and cooperatives. For example, a 1998 review by LWUA of RWSAs indicated that out of 354 RWSA systems actually established, 160 were nonoperational. Only 194 were operational, out of which 173 were still RWSAs. Only 29 of these remaining RWSAs were servicing outstanding debt. Similarly, water services provided by cooperatives under the supervision of the Coop-erative Development Authority suffer from lack of technical or managerial capacity. Sponsoring agencies often compete among themselves in facilitating the formation of RWSAs and cooperatives, to allow for disbursements of government programs to go ahead, but often with little regard to demand responsiveness and sustainability. Given their small size, these utilities are commonly unable to retain skilled staff or absorb the technical assistance given.
Water utilities under direct LGU management are in general also poorly operated because of the lack of technical, financial, and management capabilities, and the lack of autonomy with regard to political inter-ference in management decisions. More than a decade after decentralization, LGUs remain ill-equipped to provide water supply and sanitation services. Water districts overall perform better than LGU-managed systems, with more competent management and high cost-recovery levels. But there are wide variations. The majority of water districts remain too small to attract skilled staff to effectively institutionalize technical advice provided by LWUA. Indeed the majority of the water districts, particularly the small ones, cannot be classified as creditworthy. A key problem with water districts is service coverage, with piped water supply reaching less than half of the population of their service areas. Finally, private service providers do not necessarily perform satisfactorily either, as demonstrated in the case of MWSI.
While operating water services along commercial lines is official government policy (NEDA Board Resolution No. 4 of 1994), in reality it is not practiced. Most of the LGU-run systems are part of local government, with no separate corporate identity, and are not registered with the Securities and Exchange Commission, a basic step for establishing any corporate or nonprofit organization in the Phil-ippines. The legal standing (as commercial entities) of water districts is unclear, and their status as GOCCs was only established through a Supreme Court ruling in 1991.34 However, it remains unclear if that actually implies an ownership role for LGUs. LGUs
WorldBankInfra.indb 125 12/6/2005 8:41:38 AM

1�� Philippines: Meeting Infrastructure Challenges
retain a significant role in the corporate governance of water districts, through the appointment of the water district supervisory board, which the water districts and LWUA regard as a channel for political interference.
LWUA retains a dominant influence over water districts. This includes determining service levels; playing a major role in planning, design, and implementation of individual investments; and, for practical purposes, setting tariffs. LWUA also has strong step-in rights. Many LGUs view this influence as counter to the spirit of the LGC, and it continues to generate tensions among LGUs, water districts, and LWUA. The ambiguous relationship between LGUs and water districts also hampers the incentives for LGUs to provide collateral on behalf of water districts to attract more funding.
Attempts by local governments to pursue private sector participation to replace existing water districts have encountered significant legal hurdles, as this requires the dissolution of the water district or the de-annexation of a municipality or city from a metro-politan water district. Such a process can be slow. In addition, LWUA has required that any outstanding obligations of the water districts be fully paid in the event of a restructuring involving a private operator. However, Executive Order 279 calls for stronger incentives for water districts to achieve financial self-sufficiency, for mergers among service providers, for greater accountability of service providers vis-à-vis their consumers, and for increased pooling of resources among LGUs and water districts to facilitate access to financial markets. Implementing Executive Order 279 is a high priority, and an important challenge.
Weak and fragmented regulatory framework Critical for achieving the policy objective of higher levels of cost recovery is a regulatory framework that would provide for a credible and effective tariff adjustment mechanism insulated from short-term political intrusion. A robust framework is crucial to hold service providers accountable to consumers for the efficient use of revenues.
For practical purposes, the sector’s regulatory oversight remains highly fragmented, with regulatory functions controlled, if at all, by different entities. A symptom of the serious lack of a much-needed regulatory framework is the lack of sector infor-mation at the service provider level. The lack of transparency as to sector performance and bench-marking information for individual providers makes
it difficult for public participation and for holding service providers and local politicians accountable for service improvements. The lack of credible benchmark information also makes it difficult for utility management and local politicians alike to build credible arguments for tariff increases where services have improved.
While gathering and disclosing information for the sector and establishing meaningful benchmarking systems are slow processes, there is at present no sector agency entrusted with these tasks, nor is there a legal obligation for most providers to disclose such information. The mandate of collating sector data may well be best assigned to NWRB as part of its new regulatory role. Starting to fill this immediate and important gap should receive high priority.
In 2002, after earlier attempts to establish a dedicated regulatory authority for the sector by legislation had stalled, the government opted to consolidate economic regulation of water districts with that of the other service providers, and assigned this mandate to NWRB by issuing Executive Order 123. This institutional arrangement, while providing for cautious progress toward much-needed consoli-dation of regulatory functions, is not without its concerns:
Given the ambiguous legal framework, it remains to be seen what role NWRB can play in practical terms in setting tariffs for LGUs, in view of the lack of any strong incentives for LGUs to submit tariff proposals to NWRB.35 Without effective leverage, NWRB is unlikely in the medium term to ensure tariff adjustments for LGU operations or RWSAs. To increase the impact that NWRB may have, the government may want to pursue efforts to strengthen LGU tariff policies as part of a broader and comprehensive program to reinforce public finances and accountability for public services at the local level, drawing on NWRB technical guidance in this matter. One possibility would be to ensure that recipients of national government funding in the sector, across all provider types, adhere to NWRB guidelines in setting tariffs and disclosing regulatory information.
Private sector providers are to remain under regulatory arrangements specified in individual contracts, hampering opportunities both to build and use regulatory skills more effectively and to ensure consistency of regulatory principles across different provider models. It remains unclear to
•
•
WorldBankInfra.indb 126 12/6/2005 8:41:38 AM

Chapter 7 Water Supply and Sanitation 1��
what extent LGUs entering into private sector arrangements will move to NWRB regulation (or regulatory assistance through the MWSS Regu-latory Office), if such an option is more credible to private operators than contractual regulation by individual LGUs directly.
Nevertheless, these latest reforms could still contribute enormously to reducing the fragmentation of economic regulation and to mitigating conflicts of interest that marked LWUA’s role in setting tariffs. Yet, two years into the issuance of the executive order, little progress has been made in making the new arrangements effective, and NWRB has not, given its budget constraints, been able to establish capacity and broaden its geographic presence to effec-tively assume its role in regulating tariff setting for water districts. In this vacuum, LWUA in practice maintains regulatory authority over water district tariffs.36
One particular challenge for NWRB will be to change the regulatory process from one that is narrowly focused on ensuring the financial viability of water districts toward one that ensures that expansion and service goals are well defined, funded, and met. In tariff hearings, for example, it is not only current consumers who need to be involved but also consumers who are not currently benefiting from network services. In the future, to ensure sufficient funding of NWRB’s regulatory functions, the government may want to explore securing funds not only through budget allocations but also through direct access to revenues from “regulatory surcharges” on water tariffs, a solution that is common practice internationally and one that has also been applied to fund the MWSS Regulatory Office.
Regulatory provisions affecting private firms are largely contained in concession agreements, a pragmatic solution chosen at the time the agreement was made in the absence of a more institutionalized framework to review service quality and tariffs that would have been acceptable to investors. Yet even for the Manila concessions, where capacity has been less of a concern, a transparent regulatory process, including regular monitoring and public disclosure of actual service levels, has not evolved
out of the contractual arrangements. Outside Manila and Subic Bay, smaller private sector participation arrangements have struggled, and ultimately failed, to make regulatory commitments work, based on the contractual provisions alone.
Reform of the Local Water Utilities Administration LWUA plays a critical role in the establishment, operation, and expansion of water districts. Until recently, its mandates included financing, regulating, and providing technical assistance to water districts, presenting clear conflicts of interest. Given the small number of creditworthy water districts, LWUA has struggled to balance the need for sound banking practices and the goal of providing credit to service providers who would not otherwise be able to obtain it. LWUA’s track record highlights the difficulties in striking the right balance: in the early 1990s, LWUA suffered from low collection rates and a high ratio of nonperforming loans as a consequence of indiscriminate lending to a large number of credit-constrained water districts.
Since NEDA directed LWUA to lend only to viable water districts in the mid-1990s in order to improve its financial performance, LWUA’s loan portfolio has been concentrated on the larger water districts. As of December 2001, out of 431 water districts that had taken loans from LWUA, 20 water districts (i.e. medium to very large) accounted for 60% of the value of these loans, with loans of at least P100 million each.37 Between 1996 and 2002, only 45
Table 7.13Subsidies to the Local Water Utilities Administration, 1992–2003 (P million)
YearNational
government subsidies
Congressional funds
Special fundsLingap para sa
MahirapTotal
1992 290 n.a. 74 n.a. 3641993 235 10 43 n.a. 2881994 268 35 9 n.a. 3121995 246 86 20 n.a. 3521996 298 81 3 n.a. 3821997 216 60 4 n.a. 2801998 280 46 10 n.a. 3361999 194 24 5 n.a. 2232000 126 29 1 233 3892001 138 24 4 43 2092002 257 9 n.a. n.a. 2662003 99 6 n.a. n.a. 105
n.a. = not applicable.
Source: Local Water Utilities Administration.
WorldBankInfra.indb 127 12/6/2005 8:41:38 AM

1�� Philippines: Meeting Infrastructure Challenges
water districts, i.e. less than 10% of all water districts, were provided with new loans. This concentration in lending, however, substantially improved LWUA’s collection efficiency, from 35–40% in the early 1990s to 88% in 2002.38
Despite these improvements in its loan portfolio and collection, LWUA’s financial situation remains fragile. The practice of passing on funds on more favorable terms than those LWUA obtained from its creditors39 has undermined its financial viability. As a result, LWUA is facing difficulties in renewing its financing facilities by international finance insti-tutions, and new loan commitments to water districts have dropped to about P0.5 billion, or roughly the same size as its own operating expenditures. While the government continues to appropriate subsidies for LWUA of P200 million–300 million annually to be used as counterpart funds for development projects of water districts, appropriations made in 1998 and 1999 were disbursed only in 2000 and 200140 and the government, in light of the worsening budget deficit, has not disbursed any appropriations since 2001.
In addition, the continuing rise in the cost of servicing its foreign debt has made it difficult for LWUA to generate counterpart funding. In 2002, it borrowed P500 million from the Land Bank of the Philippines to fund its counterpart obligations,41 which helps explain the improved disbursement figures, but also implies increasing off-balance-sheet liabilities for DOF. Without any improvement in revenue mobilization by LWUA, this practice is clearly unsustainable.
Executive Order 279 issued in February 2004 outlines substantial reforms in the financing of the sector, in particular with regard to the role of LWUA in providing finance to water districts, by pursuing more actively the “graduation” of water districts and other water service providers to the private capital market. LWUA is to focus on water districts that are unable to access private credit but have the potential to become creditworthy. Creditworthy water districts would be forced to seek financing from GFIs and private banks, while water districts classified by LWUA as non-creditworthy would revert to the control of LGUs. According to this executive order, LWUA, which in the long run would be overseen by DOF more closely, would reorganize into separate units, to differentiate better between the three main services it currently provides: insti-tutional development and the classification of water districts according to their creditworthiness, lending
functions and financial assistance, and technical assistance to water districts. It remains to be seen how this new policy will be implemented. It carries significant challenges:
The potential failure of LWUA to graduate water districts, to mitigate credit risks, and to maintain a portfolio of sufficient quality to attract donor funding.“New” regulatory risks in terms of the future performance of NWRB, as LWUA will lose its current leverage and discretion to enforce tariff adjustments where water districts default on their obligations.The need to carefully manage the incentives for water districts to actually strive toward credit-worthiness, even though this implies the loss of concessional finance.The ability of GFIs and private banks to develop finance products geared toward water districts and the ability of water districts deemed to be creditworthy by LWUA to actually access credit markets.
Financial distress of the Metropolitan Waterworks and Sewerage System Since MWSI, the concessionaire for the west zone, defaulted on its concession fees in 2001, MWSS has borrowed heavily to cover the resulting losses and to service its own outstanding debt. But with MWSS unable to service this commercial short-term debt, the national government has taken over its servicing. Given the ongoing renegotiation of the MWSI concession, it remains unclear to what extent MWSS will be able to generate sufficient revenues to cover its exposure on existing loans or even to recover arrears for past concession fees. It seems that a funda-mental restructuring of financial obligations assumed by MWSS will have to become one of the immediate priorities for the government, pending a final renego-tiation settlement. Such restructuring will likely have to feature a partial transfer of current MWSS debt obligations to the government as well as additional water tariff surcharges assigned to MWSS to finance its contractual obligations. It is highly unlikely that MWSS will be able to sustain financing levels without such restructuring.
A fast resolution of MWSS’ financial distress is not only important to immediately improve water supply and sewerage services in the west zone; it also has an impact on the east zone, as the current situation prevents MWSS from channeling low-cost
•
•
•
•
WorldBankInfra.indb 128 12/6/2005 8:41:38 AM

Chapter 7 Water Supply and Sanitation 1��
financing to MWCI. Even more important, there is an urgent need to develop new bulk water sources for Metro Manila, which remain the responsibility of MWSS. The current MWSS financial situation does not allow it to enter into any financial trans-actions (either as a borrower or as a sponsor for BOT projects) for the needed investments, rendering the government ill-prepared to deal with a looming water shortage in Metro Manila.
Underinvestment in sanitation and sewerage Effluent from septic tanks across the country often drains into uncovered drainage systems, which leaves the majority of the population exposed to raw sewage. Solid waste collection is ineffective and large quantities of solid waste can mass and block drainage canals, exacerbating public health problems. Even when collected, improper disposal practices for both septic tank sludge and solid waste contribute to severe environmental degradation of water bodies across the country and undermine economic activity and growth in various sectors, including tourism.
As a result of inadequate services, contaminated drinking water and waterborne diseases remain a prevalent public health concern, accounting for more than 500,000 morbidity and 4,200 mortality cases a year with avoidable health costs alone estimated at P3.3 billion annually. Avoidable economic losses due solely to water pollution are estimated at an annual average of P17 billion in fishing industries and up to P47 billion in tourism.42
Investment in off-site sanitation and sewerage is grossly inadequate; untreated human and solid wastes clog canals and water bodies in all urban centers, further degrading water resources. Although the new Clean Water Act set ambitious targets for water quality improvements, the investments needed to achieve the targets are hard to make. Very few LGUs or utilities charge sewerage tariffs, and neither national nor local governments have large fiscal resources for subsidies. Between water supply and sanitation, local governments have favored the former with virtually no investment in off-site sanitation. There is generally low motivation and political support for sanitation investment, with low public awareness of the health and environmental impact of water pollution. There is a need to revisit the policy of national government grants for “brown” investments to extend application of grants to cities as well, and to consider the “decen-tralized” approach in developing a sanitation strategy in the medium term to prevent further environmental degradation.
Recommendations
Reform of the Philippine water supply and sanitation sector made groundbreaking progress with the priva-tization of the Metro Manila water system. Since then progress has slowed, with the sector witnessing dete-riorating access levels and only modest investments. The stakes are high. The country continues to experience rapid population growth, at a rate of 2.2% a year. All of the net increase in the population will be in the urban areas because of rural-urban migration, resulting in a much higher urban growth rate. The current status of the sector will not allow it to provide expanded quality services for the growing urban population. In Metro Manila for example, shortages of water sources are projected to occur in only a few years if new bulk water supply is not implemented. Similar situations are seen arising in other urban areas such as Cebu. In the meantime, increasing water and solid waste pollution is not only undermining the country’s economic competitiveness and long-term sustainability, but is also having a direct health impact on the population, especially the poor, and has potentially very serious consequences.
The government has given a very high priority to improving water supply and sanitation, listing it on the “10-Point Agenda” or action plan of the president for the period of her administration. In the last three years, the government has undertaken important steps in sector consolidation and restruc-turing, with the issuance of two executive orders (123 and 279) that consolidate regulatory functions and initiate reforms of LWUA and sector financing. It is important now to focus on implementing these initiatives and on putting the sector onto a footing for long-term sustainable development.
Key actions for the government fall into the areas of: implementing adequate cost-recovery tariffs; estab-lishing an integrated sector framework; carrying out a public utility reform and performance enhancement program; enhancing sector financing and ratio-nalizing subsidies; and expanding sanitation and sewerage coverage. These actions are now discussed in greater detail.
Implementing adequate cost-recovery tariffs Raising the overall tariff level is a priority for the sector to allow for system expansion and improved service quality. This is extremely important given the tight fiscal conditions of the national and local governments. Key actions to be taken in this area include:
WorldBankInfra.indb 129 12/6/2005 8:41:39 AM

1�0 Philippines: Meeting Infrastructure Challenges
Issue clear guidelines on charging cost-recovery water tariffs to achieve an appropriate return on assets. While NEDA Resolution No. 4 of 1994/IRR specifies the principle of cost recovery for water tariffs, the current policy guidelines remain ambiguous as to what constitutes an adequate level of cost recovery, in particular an adequate return on assets for public providers and to what extent the policy actually applies to LGUs. It also remains silent as to how the transition from highly subsidized tariffs to full cost recovery may be achieved in practice and how such a tran-sition can best be monitored. Lastly, it omits many practical details on the tariff-setting process and vests NWRB with considerable discretion as to how to implement its regulatory functions in a practical way. Given its nascent regulatory role, limited capacity and skills, and susceptibility to political influence, NWRB may not yet be able yet to manage such an ambiguous mandate effectively. International experience shows that newly estab-lished regulatory agencies are more successful when their mandate is more clearly defined (box 7.5) and more firmly prescribed by primary legislation than is currently the case in the Phil-ippines. NWRB’s regulatory mandate could be significantly strengthened (see below), if the government were to spell out its policies on these questions in much more detail and provide a stronger legal basis for NWRB to implement this more detailed mandate. NWRB, given the broad representation of government agencies and its responsibility to implement such policy, is well placed to develop recommendations both to the Office of the President and to Congress. One option, short of legislative measures that may be difficult to pass in the short term, would be to frame these more detailed policies in an executive order as a key measure for the 10-Point Agenda. The new executive order should further clarify the notion of cost-recovery tariffs, explicitly requiring them to account for the need to expand coverage. Implementation and monitoring strategies should also be well designed and highlighted in this executive order, along with measures for generating wider public awareness of the importance of cost recovery.
Articulate clear policies on sanitation service tariffs, and on the responsibilities of water districts and LGUs for collecting sanitation surcharges jointly
•
•
with the water tariff. A sanitation tariff should be charged on water bills, and the revenue should go to a special fund for sanitation service expansion. Even households that are not connected to a formal sewer system can be required to pay a sanitation tariff, provided that credible investment plans are in place to utilize the special fund. Where water districts collect water tariffs, they should also be responsible for putting the sanitation tariff on the water bill, with the water districts receiving an appropriate collection charge.
Review and quickly act on requirements at MWSS for tariff surcharges to fund bulk water investments in the Manila area. These surcharges should be enacted quickly to address the looming water shortage in the capital region. An early tariff decision will also help potential investors gain confidence, and ultimately lower the financing cost of investments.
Strengthen incentives for LGUs to adopt cost-recovery tariffs. The lack of incentives among LGUs to charge user fees commensurate with the cost of services needs to be addressed more forcefully than can be reasonably expected from NWRB alone. Strengthening such incentives could include making subsidies to LGUs condi-tional on tangible achievements regarding public utility reform and performance enhancement, including progress in achieving cost recovery for water services.
Establishing an integrated sector frameworkExecutive orders 123 of September 2002 and 279 of February 2004 outlined the key steps for moving toward an integrated sector framework, consolidating the functions vested in various agencies to the extent possible as allowed by the actions of the executive. The immediate priority is to quickly implement these two orders. Over the medium term, there is a need for legislative action to further consolidate the responsi-bilities of the agencies in the sector and establish an independent regulator. Discussions on the legislative agenda should start soon.
Operationalize and strengthen the Inter-Agency Oversight Committee for water sector reform. The committee was established under Executive Order 279, and is made up of DOF (chair), NEDA (vice chair), DBM, DILG, Office of the President, and LWUA. In the absence of a sector oversight
•
•
•
WorldBankInfra.indb 130 12/6/2005 8:41:39 AM

Chapter 7 Water Supply and Sanitation 1�1
In the late 1980s Chile began an overhaul of its water and sani-
tation sector. Before the reforms, water tariffs covered less than 50% of costs, and only 20% in regions where production costs were high. Tariffs were not indexed to inflation and increases were ad hoc, by the Ministry of Economy, issued as presidential decrees. Hence, an important focus of the reforms was a new institutional framework for tariff setting aimed at raising water prices to the true cost of the services while accommodating legitimate affordability concerns through more targeted subsidies. Broader reforms went beyond this, however, and included the reorga-nization of service providers, par-ticularly a shift from autonomous entities constituted under public law toward state-owned corpora-tions established under private commercial law, partially privatized providers, or service concessions awarded to private operators.
Overall, the reforms contributed to the emergence of a regulatory regime that is widely viewed as the most robust in Latin America. This has provided comfort to foreign investors who have invested heavily in the sector over the last decade, and triggered a remarkable turn-around in the performance even of public utilities operating in the sector.
One particular feature of the regulatory regime and of the tariff-setting process in particular is the high level of detail that is prescribed by law. The Law of Tariffs was passed in 1988 and associated operative regulations
were promulgated in 1990 under Supreme Decree 453. It spells out in great detail the process of tariff adjustment, and steps for resolving eventual discrepancies and dis-putes between regulated firms and the regulatory agency, the Super-intendencia de Servicios Sanitarios. This regulatory framework applies equally to all firms operating in the sector, ensuring a consistent approach to tariff setting across the sector and different providers. The specificity of the law limits regu-latory discretion and shields the regulatory agency from political interference and thus reduces markedly the perception of regu-latory risks in the sector. It has also substantially increased the level of transparency associated with tariff setting, both with regard to the public at large and private investors in the sector.
Tariffs are set for a period of five years with automatic indexation to inflation within that period. Twelve months prior to expiration of valid tariffs, the regulatory agency for-mally launches the tariff review process by publishing the detailed terms of reference under which outside advisors will make recom-mendations to the agency as to appropriate investment and tariff levels for the forthcoming five-year period.
Regulated firms and the general public are given an opportunity to comment—for 60 days—on the terms of reference and the specific methods suggested for estab-lishing service quality levels, for calculating the applicable cost of capital, and for assessing efficient
and prudent levels of operating and capital expenditure on the firms to meet service levels. The regulatory agency is required by law to respond specifically to com-ments received within a set period and prior to hiring advisors. This allows both parties subsequently to pursue tariff studies independently, yet based on a common framework and parameters, reducing dis-crepancies and facilitating better comparison of tariff submissions by firms and studies conducted for the regulator.
Not later than five months prior to the expiry of valid tariffs, the regulatory agency and the regulated firms exchange their respective studies, which takes place formally in the presence of a public notary. Both have 30 days to identify disagreements and for-mally present diverging findings as supported by relevant studies. If within 15 days after the presen-tation of the discrepancies, there is no agreement between the regu-latory agency and the company, the disputes are resolved by referral to a three-member domestic arbi-tration panel appointed by both parties. The opinion of the panel is definitive and mandatory for both parties. Not later than 30 days before expiration of the appli-cation of the current tariff formulas, the Ministry of Economy finally approves and publishes the new tariff.
Source: World Bank staff; and Gabriel Bitran and Pamela Arellao. 2005. “Regu-lating Water Services.” Public Policy for the Private Sector. Note 286. March. World Bank, Washington, D.C.
Box 7.5Reforms of the tariff-setting process in Chile
agency, this committee should be strengthened and made operational to supervise sector reform and coordinate government policies.
Implement Executive Order 279, to achieve a better alignment of GFIs and LWUA in providing
•
financing and to strengthen LWUA in its new role of transforming potential creditworthy water supply providers to be able, eventually, to access the capital market. The implementing rules and regulations for Executive Order 279 should be developed to address the remaining issues with
WorldBankInfra.indb 131 12/6/2005 8:41:39 AM

1�� Philippines: Meeting Infrastructure Challenges
regard to the implementation of the policies in the order, and the business plans for the three LWUA business units—the Water Development Group, the Water Development Financier, and the Technical Assistance Group, as spelled out in Executive Order 279—should be developed and executed. In view of DILG’s role in promoting the development of viable LGU systems, the business plans for the three LWUA business units, in particular the Technical Assistance Group, should pinpoint and explore possible synergies between DILG and LWUA.
Enhance NWRB capacity in economic regulation, as it takes on an expanded mandate for economic regulation of water districts, LGU-managed systems, and, potentially, private providers currently regulated through their contracts. For NWRB to be able to build the necessary capacity and credibility in this area, it should have suffi-cient resources. Given the current tight fiscal situation this may be difficult, but the current budget may be realigned between the agencies to strengthen NWRB staffing, including trans-ferring staff from LWUA, DENR, and DILG. Overall, strengthening the economic regulatory framework at NWRB should be seen as building institutional capacity toward an independent regulatory body with a legislative mandate in the medium term (see below). As such, NWRB, with increasing capacity, can be afforded greater autonomy in its exercise of regulatory powers or leveraging regulatory and renegotiation expertise residing within MWSS for private sector partic-ipation arrangements and those of smaller LGUs.
Update the national and provincial water supply, sanitation, and sewerage plans. The current national plan, drafted in 1988 with a target year of 2000, is outdated. An updated plan can serve as a valuable platform to determine tangible objectives and performance indicators for national and local government agencies, to undertake implementation and to strengthen accountability of each agency for results. The updated plan should include both physical and institutional reform targets. In addition, planning at the provincial level should be strengthened and include monitoring indicators and targets specified at the utility and LGU level. Provincial governments should play
•
•
an important role in the oversight of the imple-mentation of the sector master plans in their jurisdiction.
Enact legislative action to consolidate sector over-sight responsibilities and set up a dedicated regu-latory agency. While early implementation of the legislative action cannot reasonably be expected soon, the roles of DPWH, DILG, LWUA, MWSS, NWRB, DENR, DOF, and NEDA in the over-sight of the water supply and sanitation sector should be reviewed, and proposals for consoli-dation and realignment should be developed and debated. In the medium term, establishment of a dedicated regulatory agency is critical for sector development, and this will also require legislative action. Draft legislation on establishing an inde-pendent water regulatory commission should be tabled for public consultations and debate in Congress.
Carrying out a public utility reform and performance enhancement programReform of public utilities, in particular the water districts and LGU-managed systems, is needed to improve accountability, professional management, and efficiency. A nationwide program for public utility reform and performance enhancement should be carried out under the supervision of the Oversight Committee. Key elements of the program should include:
Require formal corporatization and registration with the Securities and Exchange Commission of all public utilities having the appropriate gover-nance structure. As a first step, the water districts and systems directly managed by LGUs should be corporatized and registered with the Securities and Exchange Commission. Accounting standards appropriate for a corporation should be adopted for these utilities. The governance structure for these utilities should be carefully studied and specified, with a competent board structure and sufficient accountability and autonomy for the management.
Strengthen incentives for mergers of various public service providers to attain scale economies and financial viability, and to plan and develop water supply and sanitation systems cutting across municipalities. This does not mean that munici-palities and even barangays should stay out of any
•
•
•
WorldBankInfra.indb 132 12/6/2005 8:41:39 AM

Chapter 7 Water Supply and Sanitation 1��
involvement in the delivery of water supply and sanitation services. But in order to overcome the fragmentation of the sector, higher-level LGUs should facilitate regionalized solutions to water supply and sanitation problems and need to be equipped with strong incentives to achieve buy-in from lower-level LGUs. Province-level water and sanitation plans should propose amalga-mation scenarios for both water districts and LGU systems, and incentives (e.g. subsidies, debt restructuring, investment financing) should be provided if the local service providers agree to mergers.
Promote private sector participation for public util-ities that have in place sound fundamentals. For the majority of public utilities, corporatization, amalgamation, and establishment of sufficient tariffs need to be implemented before they can attract any private sector investment or borrow funds from commercial lenders. Nevertheless, selected water districts and LGU-run systems have in place sound financial fundamentals, and involving the private sector can help improve service expansion and efficiency. Lessons learned from the MWSS privatization and other private sector participation should be carefully incor-porated into the design and execution of future involvement of the private sector.
Benchmark all public utilities, require submission of audited financial data, and establish perfor-mance targets. A well-disseminated bench-marking system is an important first step in instilling accountability among the utilities and can also help mobilize public support for reform. NWRB, in collaboration with LWUA and DILG, should undertake the task as a priority. Transmission to NWRB of the Commission on Audit-verified financial data for public utilities should be a requirement to enable NWRB to fulfill its mandate. Beyond benchmarking, performance targets for each utility should be set and monitored. Such targets should include a small set of indicators (e.g. service coverage, operational efficiency, financial viability) where the utilities can be held accountable. The targets can arise from province-level master plans, and the provincial governments should play an active role in collaboration with NWRB in monitoring the performance targets.
•
•
Enhancing sector financing and rationalizing subsidies
Develop and implement a strategy for the financial restructuring of both LWUA and MWSS. Both institutions, in particular MWSS, are in dire need of reestablishing their financial viability. MWSS is contractually obliged to invest in bulk supply for the Metro Manila area and a failure to address the financial needs of doing this would only delay further necessary investments and undermine the viability of the two private concessions. MWSS’ financial restructuring will depend to a large extent on the renegotiations with MWSI, which should be concluded as soon as possible. For LWUA, it has become very difficult to attract donor financing and without financial restruc-turing, it might not be able to fulfill its mandate as a financier for water districts that have not achieved creditworthiness. The internal reorgani-zation of LWUA has been well articulated under Executive Order 279 and needs to be elaborated through its implementing rules and regulations and put into effect. National government financial injection is likely to be needed for both cases after steps are taken by the two bodies.
Remove structural barriers for GFIs and private finance institutions (PFIs) to extend financing to water districts, including subordination of GFI and PFI debt to LWUA exposure, and the need for approval by the board of trustees of LWUA (i.e. a waiver). To implement Executive Order 279, the process of allowing creditworthy water districts to access financing from other sources than LWUA should be streamlined. There is also a need to explore refinancing of the current LWUA loan portfolio by GFIs, PFIs, and the capital market in order to broaden exposure of the domestic capital market to the sector.
Clarify the policy on enforcing graduation of water districts. While differentiated terms for public financing according to viability of providers are needed in accordance with the capabilities of the different types of utilities, policies should be clarified in their early stage to remove the perverse incentives for utilities not to graduate (so as to continue to enjoy subsidies). This can be done, for example, through strict criteria on the usage of the more concessional funding sources, including setting up performance criteria for accessing funding.
•
•
•
WorldBankInfra.indb 133 12/6/2005 8:41:39 AM

1�� Philippines: Meeting Infrastructure Challenges
Rationalize and leverage subsidies. One of the short- to medium-term priorities of the government should be to clarify the rationale and targeting of subsidies in the water supply and sanitation sector and to broaden the application of policies formu-lated for government grants to other transfers, including concessional financing and, to the extent possible, congressional funds. Particularly in light of significant expenditures required for the imple-mentation of the Clean Water Act and to improve sanitation more generally, ensuring the following should remain top priorities for the government: that subsidies are increasingly tied to results, that investments reflect the priorities and actual demand of beneficiaries, and that disbursement of subsidies provides for the strongest possible incen-tives for efficient use of funds. A good example of subsidies implemented by Ecuador is shown in box 7.6. Exploring output-based aid approaches more extensively may provide an opportunity to strengthen the quality of public expenditure in the sector. (See box 4.5 in chapter 4.)
Improve the usage of ODA financing. ODA has historically played an important role for sector financing, and will continue to play such a role in the medium term in view of the relative low capacity within the country to provide financing. Policies should, though, be developed to guide the overall use of ODA in leveraging domestic currency financing, and to clarify the type of credit enhancements available to GFIs/LWUA
•
•
and PFIs in lending to the sector. Implemen-tation performance of ODA projects should also be improved to allow financing to reach the beneficiaries efficiently.
Expanding sanitation and sewerage coverageReinforce public awareness-building measures regarding the impacts of inadequate sanitation and the insufficiency of individual septic tanks, and instigate stronger demand for improvement. An advocacy campaign for the public and among political representatives is required to secure awareness and commitment to sanitation at the highest political level.
Review and clarify accountability for planning, construction, operation, and regulation of sani-tation infrastructure, including drainage at the national and local levels. This includes the identification of departmental responsibility for sanitation policymaking and planning. Currently the responsibilities are dispersed among DPWH, LWUA, water districts, DENR, MWSS, and LGUs. Such a review should form an integral part of the implementation of the Clean Water Act. In the short run, the government may want to appoint a lead agency to coordinate such a review and submit specific proposals to policymakers as to how responsibilities for sanitation may be stream-lined. The same agency should also take the lead in broader efforts to raise the general awareness of sanitation.
•
•
Box 7.6Ecuador’s merit-based government transfers to water service providers
In December 2004, Ecuador’s Ministry of Economy and Finance
issued a decree to link national government transfers to the country’s 220 urban water and sani-tation service providers (a private concessionaire, some municipal companies, and many municipal-ities that operate their water supply and sanitation services directly) to a series of performance parameters, including operational efficiency, and institutional separation and autonomy from the municipal administration.
Most of the national govern-ment’s transfers to the water sector
are funded from a 10% tax on tele-phone calls (the ICE) which gen-erated some $75 million in 2003, representing about one-third of revenues raised by Ecuador’s water service providers in 2003. Until the decree was passed, ICE tax rev-enues had generally been returned directly to the municipalities generating the tax revenues, for water and sanitation investments, without regard for the efficiency of the water and sanitation service provider or the adequacy of cost-recovery tariffs.
The new decree is expected to provide a powerful incentive
for municipalities to adopt tariffs that cover at least O&M costs, reduce operating costs in line with benchmarks, and adopt autonomous (public or private) management models instead of direct service provision by the local government. While the majority of funds in the past went to the two largest cities in the country, Quito and Guayaquil, the new allocation mechanism is biased toward smaller (and poorer) municipalities, which generally have higher costs of service.
Source: World Bank staff.
WorldBankInfra.indb 134 12/6/2005 8:41:39 AM

Chapter 7 Water Supply and Sanitation 1��
Table 7.14Summary of recommended actions
Objective Short-term actions Medium-term actions
Implement adequate cost-recovery tariffs
Issue clear guidelines, in the form of an executive order, on charging cost-recovery water tariffs to achieve an appropriate return on assets, including implementation and monitoring strategies Articulate clear policies on sanitation service tariffs, and the responsibilities of water districts and local government units (LGUs) in collecting sanitation surcharges jointly with the water tariffReview and quickly act on requirements in the Metropolitan Waterworks and Sewerage System (MWSS) for tariff surcharges to fund bulk water investments in the Manila area
•
•
•
Strengthen incentives for LGUs to adopt cost-recovery tariffs, including making any subsidies conditional on full cost recovery for water services
•
Establish an integrated sector framework
Operationalize and strengthen the Inter-Agency Oversight Committee for water sector reform (established by Executive Order 279 on LWUA reform and on the policy for water districts to graduate to capital markets). Implement Executive Order 279Enhance capacity of the National Water Resources Board (NWRB) in economic regulation. Realign the budget to enable NWRB to fully function, including transferring staff from the Local Water Utilities Administration (LWUA) and the Department of Environment and Natural Resources
•
••
Update the national water supply and sewerage planPrepare, update, and consolidate province-level water supply, sanitation, and sewerage master plans Enact legislative action to consolidate sector oversight responsibilities and set up a dedicated regulatory agency for the sector
•
•
•
Carry out a public utility reform and performance enhancement program
Require formal corporatization of all public utilities, registered with the Securities and Exchange Commission, having appropriate governance structure and corporate accounting systemsBenchmark all public utilities Require the Commission on Audit to provide audited data and indicators to NWRB to fulfill its mandate Promote private sector participation for selected public utilities through well prepared and structured competitive tender process
•
••
•
Strengthen incentives for mergers of various public service providers to attain scale economies and financial viabilityEstablish performance targets for public utilities based on province-level master plans Monitor progress toward provincial targets
•
•
•
Enhance sector financing and rationalize subsidies
Develop and implement a strategy for the financial restructuring of both LWUA and MWSS, to reestablish the financial viability of both entitiesRemove structural barriers for government and private finance institutions to extend financing to water districtsImprove usage of official development assistance financing
•
•
•
Rationalize and leverage subsidiesClarify policy on enforcing graduation of water districts
••
Expand sanitation and sewerage coverage
Reinforce public awareness-building measures on the impacts of inadequate sanitation, and instigate stronger demand for improvementReview and clarify accountability for planning, construction, operation, and regulation of sanitation infrastructure, including drainage
•
•
Develop and implement plans to scale up sanitation facilities in LGUs (including targets and programs) as an integral part of the water supply, sanitation, and sewerage master planEstablish practical standards for local wastewater systemsProvide technical assistance to LGUs and local utilities in planning and implementing sanitation improvementsAllocate funding from national government to provide incentives for LGUs and utilities in sewerage investments
•
•
•
•
WorldBankInfra.indb 135 12/6/2005 8:41:40 AM
1�� Philippines: Meeting Infrastructure Challenges
Assist LGUs and local utilities develop strategies and plans for sanitation improvement. Technical guidelines for improved sanitation should be provided by national government agencies for local utilities, and technical assistance should be provided where local entities become committed to certain steps.
Allocate funding from the government to provide incentives for LGUs and utilities in sewerage invest-ments. Budget support is needed for the implemen-tation of the Clean Water Act, and any national funding should be leveraged to bring more local government financing and private funding, and targeted particularly at areas where benefits will go beyond individual LGU boundaries.
Table 7.14 above summarizes the steps to be taken in the immediate term (up to two years) and medium
•
•
term (up to five years). It is important to highlight the close linkages among the five action areas: raising tariffs to cost-recovery levels has to be accom-panied by performance improvement of the service providers, otherwise there will be strong resistance by consumers; utility performance improvement on the other hand cannot be realized unless appropriate tariffs are charged to ensure financial viability. Both measures will rely on a good regulatory system that can effectively mediate between the interests of the service providers and consumers and instill discipline in both sides. This integrated reform and performance enhancement can only occur in an integrated framework with strong leadership and oversight by the national government. This same “package” is needed not only for water supply but also for sanitation and sewerage. It is therefore critical that progress in all these areas occur in parallel, and be synchronized.
Endnotes1 World Bank. 2003. Philippines Environment Monitor 2003.
Manila.2 Ibid.3 Many of the policies and reforms were already detailed by the
government in 1998 in a Letter of Sector Development addressed to the Department of Finance and, prior to that, two NEDA board resolutions in 1994, Nos. 4 and 5.
4 2003–2004 Directory of Water Districts. Philippine Associa-tion of Water Districts, Inc. The coverage figures, however, are misleading. Franchise areas are very narrowly defined by water districts and often exclude peri-urban areas that water districts do not view as viable for expansion.
5 In the form of a certificate of conformance.6 Through a Supreme Court ruling issued in the 1980s (201 SCRA
593).7 During the late 1980s, LWUA started to appoint a sixth member
on water district boards. By 2003, LWUA had appointed board members to 40 out of a total of 433 operational districts to ensure that recommendations of the LWUA’s institutional development advisors received sufficient attention from boards.
8 Step-in rights assigned to LWUA differentiate between partial and full takeover. In a partial takeover LWUA assumes the func-tions either of the management or of the board, while in a full takeover it assumes the functions of both.
9 The governance models of cooperatives and water user associa-tions are similar. A cooperative differs from an RWSA in that members of cooperatives contribute equity toward investments
in infrastructure and are entitled to patronage refunds or shares in dividends from cooperative operations. They therefore have a financial stake in the success or failure of the cooperative.
10 In 1995, there were 480 cases of cholera in Manila, compared with 54 cases in 1991, according to the Department of Health. Reports of severe diarrhea-causing infections peaked in 1997 at 109,483—more than triple the 1990 number.
11 WPEP. 2002. Small Scale Independent Providers: Are They Here to Stay? http://www.wpep.org/downloads/SSIP%20study%20(final%20draft%20-%2011%20March%2004).pdf
12 Cristina David and Arlene Inocencio. 2001. “Public-Private-Community Partnerships in Management and Delivery of Water to Urban Poor: The Case of Metro Manila.” Philippine Institute for Development Studies Discussion Paper 2001–18. Makati.
13 Arthur C. McIntosh. 2003. Asian Water Supplies: Reaching the Poor. Manila: ADB.
14 Ibid.15 ADB. 2004. Water in Asian Cities: Utilities’ Performance and Civil
Society Views. Manila.16 Ruben G. Mercado. 2003. “A Review of the DPWH Regional
and District Office Management and Spending: What’s Pork Got to Do With It?” Philippine Institute for Development Studies. Unpublished discussion paper.
17 From the case studies done by WPEP. 2002. Small-Scale Indepen-dent Providers: Are They Here to Stay? WPEP, Manila. Investments of SSIPs in Metro Manila ranged from P500,000 to P15 million serving between 100 and 3,000 households. The size of the invest-
WorldBankInfra.indb 136 12/6/2005 8:41:40 AM

Chapter 7 Water Supply and Sanitation 1��
ments also depends on whether the SSIP has access to bulk water supply from the concessionaires or needs to develop its own water source, usually deep wells.
18 Costs for a shallow well (12 meters deep) may range from about P25,000 to P50,000, and for a deep well (20 meters deep) from about P60,000 to P250,000, if constructed by a household (lower estimate) or a foreign-funded project (upper estimate).
19 Water Supply and Sanitation Thematic Paper for the National Water Forum, prepared in December 2003, under the supervision of a government interagency committee composed of oversight and water sector agencies under the leadership of NWRB.
20 Services provided by public providers are grouped by the govern-ment into three categories: level 1—a point source (either a protected well or a developed spring with an outlet but without a distribution system) serving an average of 15 households. These facilities are typically funded from government grants and managed by CBOs (BWSAs and cooperatives); level 2—a piped system with communal faucets serving four to six households. These facilities are predominantly managed by CBOs; and level 3—a piped system with individual household taps. These facili-ties are operated and managed by local water districts, private utilities, or LGUs either directly or indirectly through CBOs.
21 National Statistics Office.22 Water Supply and Sanitation Thematic Paper for the National
Water Forum, prepared in December 2003. 23 World Bank. 2003. Philippines Environment Monitor 2003.
Manila.24 WPEP. 2003. Urban Sewerage and Sanitation: Lessons Learned
from Case Studies in the Philippines. June.25 Project Feasibility Studies prepared under LGU-UWSP Adaptable
Program Loans 1 and 2 between 1997 and 2000. World Bank. 26 Based on socioeconomic reports of the LGUs in more than 100
feasibility studies for towns, prepared under the World Bank project LGU-UWSP.
27 WPEP. 2002. Small Scale Independent Providers: Are They Here to Stay? Manila.
28 World Bank. 2003. Philippines Environment Monitor 2003.Manila.
29 Arthur C. McIntosh. 2003. Asian Water Supplies: Reaching the Poor. Manila: ADB.
30 National Statistics Office. 2000 Family Income and Expenditure Survey.
31 World Bank and Social Weather Stations. 2004. Privatization Survey. July.
32 L. Cleofas and J. Sy. 2004. “Face-off: Utility Sub-concessions and Local Private Providers in Metro Manila.” Paper presented at Water Week, February. World Bank.
33 Arthur C. McIntosh. 2003. Asian Water Supplies: Reaching the Poor. Manila: ADB.
34 The Supreme Court established, by its ruling of September 13, 1991 in the case of Davao City Water District et al. vs the Civil Service Commission and the Commission on Audit, that water districts are GOCCs.
35 This is largely because, under the LGC, LGU responsibility for water and sanitation services includes local tariff setting. As a matter of practice, LGUs decide on tariffs in LGU-managed water supply systems.
36 The memorandum of agreement between LWUA and DBP, dated September 17, 2003 states in Section 5: “LWUA shall maintain its regulatory authority over the WDs, as provided in PD 198, as amended, to conduct an annual review and among others, recommend to the WDs the adoption of water rates…”
37 Stone & Webster Management Consultants, Inc. 2003. “Study on reforms in the Financing Policies in the Water Sector, Gradua-tion Policies in the Water Districts, and Approaches to Various Regulatory Issues.” Department of Finance.
38 Ibid.39 Water district projects are financed at highly concessional terms
and compare favorably to loans provided to LGUs from GFIs. Projects are typically funded 70% from loans from international financial institutions, 20% from LWUA counterpart funds, and 10% from water district equity. Funds are provided to water districts at fixed interest rates of 8.5–12.5% depending on the loan amount, with a repayment period of 25–30 years with four years grace period on the principal repayment. In addition to capital works, LWUA lends for technical assistance for feasibility studies and design (9% of project costs), i.e. as well as supervision costs (4% of project costs).
40 In fact, about 75% of LWUA’s cash position in 2002 was accounted for by undisbursed government appropriations.
41 Local Water Utilities Administration. 2003. 2002 Annual Report. Manila.
42 World Bank. 2003. Philippines Environment Monitor 2003. Manila.
WorldBankInfra.indb 137 12/6/2005 8:41:40 AM

Paul Chesley/Getty Images
WorldBankInfra.indb 138 12/6/2005 8:41:51 AM

Chapter 8
Roads
Overview
The main objective of road sector development in the Philippines is to develop a network that will help promote sustainable economic growth
and competitiveness, and provide adequate all-year reliable and safe access throughout the country.
The road sector has made some progress in meeting this objective. But high levels of congestion, the poor condition of large parts of the road network, inadequate connectivity, and the lack of a sustainable road safety strategy reduce the efficiency of the road network in promoting growth and providing safe access. The cost of congestion in Metro Manila alone was estimated at around P100 billion a year in 1996 prices, or 4.6% of GDP, while the poor quality of roads resulted in high vehicle operating costs, with intercity freight rates in the Philippines more than 50% higher than in Thailand or Vietnam. The cost of road accidents in the country was estimated at $894 million in 2002, or more than 1% of GDP.
Two major issues pose considerable constraints to road sector development in the country: under-investment in the road network and inefficiency in resource utilization.
Underinvestment in the road network Expenditures on the road network in the Philippines in 2002 were estimated at P34 billion (0.9% of GDP), their lowest level in a decade. This represents half, at best, of what would be necessary to maintain the existing network in adequate condition and to sustain economic growth rates of around 4%. The situation is expected to get worse over the next six years, as the figures in the 2004–2009 Medium-Term Public Investment Program (MTPIP) indicate that expen-ditures on national roads (currently 0.55% of GDP)
would drop to 0.3% of GDP by 2009, which would be their lowest level in at least 17 years. Local roads also suffer from underinvestment and inadequate maintenance, although the actual conditions are not clearly known due to lack of reliable data.
The low level of expenditures on the road sector is due to low contributions by the government, road users, and the private sector in general. While the decrease in investment funding of national roads by the government is due in large part to the increase in the government deficit, expenditures on national roads as a share of total national government spending declined by 50% between 1999 and 2002, indicating the decreasing priority of investment in national roads for the government during that period.
Road users are paying a proportion of the road maintenance cost through their contributions to the Motor Vehicle User’s Charge (MVUC). Nevertheless, these contributions fall well short of the required funds for maintenance. Given the potential benefits to road users from improved road conditions and reduced congestion, road users can be expected to pay more. The experience of other countries is that road users are willing to pay for improved roads provided that there is a clear perceived link between the payment and delivery of better services. Receipts from a fuel levy were supposed to augment the MVUC but there has been little action on that front.
Private sector participation in the Philippines started in the road sector in the 1970s but interest has waned since, despite the enactment of the Build-Operate-Transfer (BOT) Law and its amendment in the 1990s. In the last decade, only four agreements were concluded: one was completed after lengthy delays, two are stalled after completion of a phase, and the fourth never got started. The contribution of the private sector (in the form of toll roads) over the
WorldBankInfra.indb 139 12/6/2005 8:41:52 AM

1�0 Philippines: Meeting Infrastructure Challenges
last decade represents only about 10% of the govern-ment’s expenditures on roads. The sector’s interest in and contribution to investment in the road network have been low for a number of reasons. Its inability to come up with the necessary financing and the problems and costs associated with acquiring rights-of-way are two main reasons (in toll roads), while the uncertainty surrounding the investment climate and legal environment generally also contributes to low private sector investment.
Inefficiency in resource utilization The inefficiency in resource utilization is attributable to inadequate policy, institutional, and governance frameworks, and to poor capacity. Indeed, some progress has been made in implementing the road sector reforms at the Department of Public Works and Highways (DPWH), but implementation has been slow. Much of the progress has been in developing technical and information systems for reforming internal business processes of DPWH under the Road Information Management Support System (RIMSS) Project (discussed in more detail in box 8.2, below). Agency performance indicators have been developed and some are already in use by DPWH. Land acqui-sition procedures have also been developed, with implementation and staff training ongoing. As a result of the development of new contractor billing systems, the average time to pay contractors was reduced from 69 days in 2001 to 30 days in 2003.
Nevertheless, institutional reforms have lagged behind their technical counterparts, jeopardizing the overall success of the road sector reforms. The Special Road Fund (SRF) was established in 2000 but its secretariat was only appointed in mid-2004 and has been subjected to external pressures in delaying and diverting the release of funds, thereby reducing its effectiveness in improving the road maintenance program. Also, little progress has been made in separating the roles of client and service provider in DPWH and transforming the agency into a commer-cially oriented, performance-based National Roads Authority.
As a rough indication of inefficiency, the public’s perception of DPWH’s efforts to combat corruption is one of the worst with regard to public agencies, and has further worsened over the past couple of years. Spending of the congressional (“pork barrel”) funds, accounting for 19–30% of DPWH’s budget and for more than maintenance expenditures on all local roads, is widely regarded as inefficient. Further mani-festations of poor resource utilization are inefficient
maintenance practices, and low labor productivity at DPWH. There is one employee for every 1.3 km of national roads in the Philippines compared with about one employee for every 10 km in Indonesia.
Proposed reform strategy: Commercialization and efficient resource utilizationThe underpinnings of the proposed reform strategy are the commercialization of the road sector and increasing the efficiency of utilization of scarce government resources. The establishment of a commercially oriented road sector, with increased participation from the private sector in terms of both management and financing, requires a strong partnership between the private and public sectors. In this partnership, the public sector is to play the lead role in developing good plans (through collabo-ration with the private sector), in ensuring efficient utilization of its scarce resources, and in providing an enabling environment for the participation of the private sector.
Policy and institutional framework
Main laws and regulationsTwo main laws govern the road sector in the Phil-ippines (table 8.1): the Philippine Highway Act of 1953, Republic Act (RA) 917; and the Land Transpor-tation and Traffic Code of 1964 (RA 4136). RA 917 defines four classes of roads (national, provincial, city/municipal, and national aid1) with their respective administration and funding. Executive Order 113 (1955), as modified by Presidential Decree 702 in 1975, added a category called barangay road and in 1992 deleted the national aid road category. RA 4136 sets the rules for road use.
The Local Government Code of 1991 (RA 7160) impacted the road sector in two ways: the regulation of tricycles for hire was devolved to province, city, and municipal governments; and the provision of barangay roads was transferred from DPWH to barangays and local governments.2 Local road provision in provinces, cities, and municipalities was the responsibility of the respective local governments prior to the Code, and remained so after its introduction.
RA 2000 (1957) defines the standards for limited access highways and their development by DPWH. The legal basis for toll roads emanated from Presi-dential Decree 1112 (1977) and RA 7718 (1993) for privately financed infrastructure. The franchise for the operation and maintenance of the first two
WorldBankInfra.indb 140 12/6/2005 8:41:52 AM

Chapter 8 Roads 1�1
Table 8.1Main legal and regulatory provisions
Legal provision Purpose
Commonwealth Act (146, 1936), and amendments, the latest being Executive Order 125-A, series of 1987
Provides framework for grant of franchises for public land transport for hire, including rate setting based on application and public hearings. Makes the Land Transportation Franchising and Regulatory Board the quasi-judicial grantor
Philippine Highway Act (RA 917, 1953)
Provides for an effective highway administration; classifies roads according to administration and funding; establishes a highway fund; and provides for technical and financial assistance to provinces, cities, and municipalities
Limited Access Highway Act (RA 2000, 1957)
Sets framework for the development of limited access roads under the responsibility of the Department of Public Works and Highways
Land Transportation and Traffic Code (RA 4136, 1964)
Governs the registration and operation of motor vehicles and licensing of owners and drivers, and establishes traffic rules
Equivalent Maintenance Kilometer Method (Presidential Decree 17, 1972)
Allocates funds for maintenance of each road, based on a certain formula
Charter of Toll Regulatory Board (Presidential Decree 1112, 1977)
Regulates entry and pricing of limited-access roads
Charter of the Department of Public Works and Highways (Executive Order 124, series of 1987)
Reorganizes the Department of Public Works and Highways into its current form and functions
Local Government Code (RA 7160, 1991)
Delineates powers and responsibilities of provinces, cities, municipalities, and barangays in a number of economic sectors; devolved the maintenance of barangay roads to barangays
Build-Operate-Transfer Law (RA 6957 as amended by RA 7718, 1994)
Lays down the rules for private sector financing and development of infrastructure
Right-of-Way Law(RA 8974, 2000)
Sets rules for expediting right-of-way acquisition and stipulates role of LGUs in relocation/resettlement
Motor Vehicle User’s Charge (RA 8794, 2000)
Provides for additional resources for maintenance, safety, and air pollution control, and for establishing a Road Board for the prudent and efficient management and utilization of these resources
Government Procurement Reform Act (RA 9184, 2002)
Attempts to: harmonize procurement processes across all national line agencies and LGUs, simplify prequalification and award, enhance trans-parency, and encourage electronic bidding
Source: Compiled by World Bank staff.
expressways was given in 1977 (under Presidential Decree 1113) to the Construction and Development Corporation of the Philippines, a private corporation that was later taken over by the government in 1983 for unpaid debts and renamed the Philippine National Construction Corporation (PNCC). To expedite right-of-way acquisition, RA 8974 allows for immediate possession of land being expropriated, upon payment of the zonal value of the property and pending a court decision on the final purchase price.
The Public Service Act (which originated from Commonwealth Act 146 of 1936, and has been amended several times since) provides the framework
for the regulation of public transport or common carriers. Under this law, market entry requires an administrative franchise (called Certificate of Public Convenience) and fares are decided by the government after petition and public hearings.
Funds for maintenance of national roads are allocated based on the equivalent maintenance kilometer method, introduced in 1972 under Presi-dential Decree 17. The amount for each road is determined taking into account traffic volumes, road dimensions, surface type, and bridge type.
RA 8794 of 2000, the Law on Motor Vehicle User’s Charge, imposes this charge, which is designated for
WorldBankInfra.indb 141 12/6/2005 8:41:52 AM

1�� Philippines: Meeting Infrastructure Challenges
road maintenance, safety, and air pollution control. Collected funds are put into the SRF administered by the Department of Finance for program allocations managed by the newly established Road Board under the same law.
The Government Procurement Reform Act (RA 9184 of 2002) was enacted to govern the procurement processes across all national line agencies and LGUs. It attempts to simplify prequalification and award, enhance transparency, and encourage electronic bidding.
Allocation of responsibilitiesHistorically, the central government has been the dominant provider of roads through DPWH, with LGUs playing a secondary role. DPWH is responsible for planning, design, construction, and maintenance of the national road network (table 8.2). Maintenance of national roads in provinces is carried out by the district offices of DPWH in these provinces. DPWH sets technical standards for the construction of all road and bridge classes, and establishes regulations regarding vehicle weights and axle loading. It also upgrades and constructs local roads financed by other agencies, such as the Department of Agriculture and the Department of Agrarian Reform, and through congressional funds. Roads constructed for these two departments are typically project components for these agencies. In addition, DPWH assists LGUs in road provision when they lack the capacity for performing such services.
The Road Board, attached to DPWH, is responsible for managing the SRF where funds are earmarked for road maintenance, safety, and air pollution control.
The planning, construction, and maintenance of local roads are the responsibility of LGUs. Funding is approved by their respective local councils or provincial boards, after they consider their own revenue sources and Internal Revenue Allotment. The 1991 Local Government Code stipulates that local governments should dedicate 20% of their respective Internal Revenue Allotment shares to development expenditures. LGUs regulate market entry and pricing for tricycles and pedicabs for hire. The Department of Interior and Local Government coordinates LGUs’ participation in subnational programs and assists LGUs in capacity building for development planning and investment programming.
The Land Transportation Franchising and Regulatory Board (LTFRB), an office attached to the Department of Transportation and Communications (DOTC), is responsible for the regulation of market
entry, service standards, and fare setting for all road-based public transport in the country, except tricycles and nonmotorized vehicles. The Land Transportation Office (LTO), an agency under DOTC, enforces the provisions of RA 4136. It registers motor vehicles, licenses drivers, and enforces LTFRB’s regulations to ensure that public transport vehicles operate within their franchises.
The main government agencies that play oversight roles in the infrastructure sector are the National Economic and Development Authority (NEDA) and Department of Budget and Management (DBM). NEDA provides advisory and coordinative services in the formulation of sector policies and programs through its Infrastructure Committee (Infracom) and screens and formulates DPWH’s medium-term investment program. NEDA also monitors and coordinates public sector investments (both foreign and domestic exceeding P300 million) through its Investment Coordination Committee. This committee requires the endorsement of the appropriate regional development council before clearing local projects for implementation.
DBM drafts the annual national budget for approval of Congress and sets the budgetary ceilings through its Development Budget Coordinating Committee. All foreign funding and official devel-opment assistance (ODA) is approved by NEDA and the Department of Finance.
Incidental players in road infrastructure are the Department of Agriculture and the Department of Agrarian Reform. They allocate funds for farm-to-market roads that are part of their respective programs. In addition to these two departments, specialized national agencies occasionally get involved in the supply of roads. These are the Public Estates Authority and the Bases Conversion and Devel-opment Authority and its subsidiaries, such as Subic Bay Metropolitan Authority and Clark Development Corporation. Unlike farm-to-market roads, these are generally intra-urban local roads (with the exception of the Subic Expressway).
Policy framework under the Medium-Term Philippine Development PlanThe Medium-Term Philippine Development Plan (MTPDP), which is typically revised every six years to synchronize with the term of the president of the Philippines, contains the broad strategies as well as policies on infrastructure development. Its key objectives for 2001–2004 in the road subsector included the following:
WorldBankInfra.indb 142 12/6/2005 8:41:52 AM

Chapter 8 Roads 1��
Table 8.2Allocation of responsibilities/mandates
Agency Functions
Department of Public Works and Highways (DPWH)
Planning and construction of the national road networkMaintenance of the national road networkSetting technical standards for the construction of all road and bridge classesEstablishing regulations for vehicle weights and axle loads for all road classesSelective upgrading and construction of local roads for other agencies such as the Department of Agriculture and the Department of Agrarian Reform, and through congressional fundsAssisting LGUs in the provision of roads when such services are unavailable or inadequate
•••••
•
Road Board—Attached to DPWH Managing the Special Road Fund where collected monies from the Motor Vehicle User’s Charge are deposited and designated for road maintenance, safety, and air pollution control
•
LGUs: provinces, cities, and municipalities
Planning and construction of local roads (including barangay roads) within their respective jurisdictionsMaintenance of local roadsEconomic regulation of tricycles and pedicabs for hire, in terms of market entry and pricing
•
••
LGUs: barangays Maintenance of barangay roads•Department of Interior and Local Government
Coordinating LGU participation in subnational programsAssisting LGUs in building their capability for development planning and investment programming
••
Land Transportation Franchising and Regulatory Board (LTFRB)—Attached to the Department of Transportation and Communications (DOTC)
Regulation of market entry, service standards, and fare setting for all road-based public transport in the country, except tricycles and nonmotorized vehicles
•
Land Transportation Office—Attached to DOTC
Enforcement of the provisions of RA 4136 Registration of motor vehicles, licensing of drivers, and enforcement of LTFRB’s regulations to ensure that public transport vehicles operate within their franchises
••
Philippine National Construction Cor-poration—Attached to the Department of Trade and Industry
Developer and operator of some toll roads; franchise holder for the North Luzon and South Luzon expressways
•
Toll Regulatory Board—Attached to DOTC
Economic regulation of toll roads•
Specialized bodies such as the Public Estates Authority, Bases Conversion and Development Authority, and Subic Bay Metropolitan Authority
Provision of roads within certain areas, usually economic export zones, following technical standards and guidelines of DPWHMaintenance of roads and other infrastructure within their defined geographic areas
•
•
National Economic and Development Authority
Formulation and coordination of policies in transport (roads, maritime, air, etc.) in the Medium-Term Philippine Development PlanFormulation of medium-term public investment programs that include roadsApproval and oversight of infrastructure programs/projects exceeding P300 million
•
••
Department of Budget and Management
Synthesis and review of budget requests of agencies, submission of consolidated budget to Congress, and execution of approved appropriationRelease of the annual Internal Revenue Allotment of LGUs
•
•Department of Agriculture and Department of Agrarian Reform
Incidental financing of rural roads that are necessary components of the departments’ agricultural and agrarian-related programs
•
Source: Compiled by World Bank staff.
WorldBankInfra.indb 143 12/6/2005 8:41:52 AM

1�� Philippines: Meeting Infrastructure Challenges
13%, and city and municipal roads 11% (table 8.3). The balance of 60% is classified as barangay roads, which are mostly unpaved village-access roads built in the past by DPWH but devolved to LGUs. Farm-to-market roads fall into this last category.
With the exception of barangay roads, the above road classification system is based primarily on administrative responsibilities, i.e. which level of government built and funded the roads. Barangay roads were mostly built and funded by DPWH, with the Department of Agrarian Reform and the Department of Agriculture financing a few farm-to-market roads. There are ongoing efforts to reclassify roads by function.
Table 8.4 shows that there are large differences in the regional distribution of national and local roads, irrespective of the measure used. Region IV, for example, accounts for the highest absolute share of the road network at 11% of the total, but has one of the lowest densities of roads per square kilometer (0.5 km per sq. km). Metro Manila has the highest road density per square kilometer, more than six times as high as any other region, but ranks last when density is measured in terms of kilometer per vehicle or population. The road density in terms of kilometer per square kilometer of land area is highest in Metro Manila (7.5 km per sq. km) and lowest in Caraga (0.4 km per sq. km). If the 1,820 km of privately developed roads in Metro Manila are taken into account, road density further increases to 10.3 km per sq. km.
Private sector participation in the road sectorToll roadsThe Philippines has a total of 165 km of toll roads. The first two of these toll roads, the North Luzon Expressway (NLEX) and South Luzon Expressway
Table 8.3Classification of existing non-toll road network, 2000
Classification Length (’000 km) Share (%)
Nationala 30.0 15
Provincial 27.1 13
City 7.1 3
Municipal 15.8 8
Barangay 122.0 60
Total 202.0 100
a. The Department of Public Works and Highways (DPWH) reported a total of 28,266 km (excluding the Autonomous Region in Muslim Mindanao), as of June 2004 due to reclassification, more accurate inventory, and devolution.
Source: JICA-DPWH. 2003. “Roads in the Philippines.” Manila.
Provide the transport infrastructure needed to support the priority programs of the government, namely: modernization of agriculture, devel-opment of tourism, improvement of peace and order, decongestion of traffic, and development of information and communications technology.Improve the quality of existing infrastructure through proper maintenance, rehabilitation, and upgrading. Achieve well-defined complementary roles of the government and private sectors.Streamline the contract procurement process to make it more transparent, efficient, fair, nondiscretionary, and conducive to the widest possible competition of qualified contractors and consultants.Restructure institutions to ensure that the public and private sectors operate on the same levels and that government is not both regulator and operator within a given subsector.Formulate a timely and realistic list of transport projects for implementation.
The key road subsector strategies to accomplish the above objectives included the following:
Priority to road investments leading to regional growth centers, key tourism development areas, and in the economically lagging regions with low road densities and paved road ratios, with special attention to Mindanao.Road users to increasingly pay for the use of national roads.Highest priority to the maintenance of existing assets, including preventive maintenance, in order to prolong the useful life of the road network.LGUs to assume full responsibility for the financing and management of local roads with the national government providing appropriate assistance programs.Allowable vehicle axle loads and configuration to be strictly enforced to minimize road damage.DPWH to implement priority business processes under the ongoing RIMSS Project.
Sector structure and ownership
Public road networkIn 2000, the total length of the non-toll road network was reported to be 202,000 km, with national roads accounting for 15% of the total, provincial roads
•
•
••
•
•
•
••
•
••
WorldBankInfra.indb 144 12/6/2005 8:41:52 AM

Chapter 8 Roads 1��
Table 8.4Regional distribution of roads, population, and vehicles
RegionRoad length (km)
Area(sq. km)
Population (’000), 2000
Motor vehicles
2001
Road density in km per
National2004
Local2000
sq. km ’000 vehicles ’000 population
Metro Manilaa 1,019 3,723 636.0 9,933 1,255,140 7.5 4 0.5CAR 1,587 7,183 18,294 1,365 50,605 0.5 173 6.4
I 1,609 13,166 12,840 4,201 210,135 1.2 70 3.5
II 1,711 13,035 26,838 2,813 130,762 0.6 113 5.2
III 1,980 13,481 18,231 8,031 477,106 0.9 32 1.9
IV 4,440 17,763 46,924 11,794 525,394 0.5 42 1.9
V 2,177 7,000 17,633 4,675 102,492 0.5 90 2.0
VI 2,878 14,816 20,223 6,209 225,056 0.9 79 2.9
VII 2,017 13,694 14,952 5,701 329,414 1.1 48 2.8
VIII 2,264 7,342 21,432 3,610 72,636 0.5 132 2.7
IX 1,068 9,603 15,997 3,091 98,392 0.7 185 3.5
X 1,603 13,671 14,033 2,748 89,217 1.1 171 5.6
XI 1,390 15,805 27,141 5,189 195,244 0.6 88 3.3
XII 1,196 8,527 14,571 2,598 64,511 0.7 151 3.7
ARMM 914.2 6,588 11,410 2,412 — 0.7 — 3.1
Caraga 1,327 6,276 18,847 2,095 39,758 0.4 191 3.6
Totalb 29,180 171,680 300,000 76,499 3,865,862 0.7 52 2.6
— = not available; motor vehicles for the Autonomous Region in Muslim Mindanao (ARMM) are included in Region IX. CAR = Cordillera Autonomous Region.
a. There are about 1,820 km of private roads in Metro Manila. Were these to be included in the estimation, the resulting density for Metro Manila would rise from 7.5 to 10.3 km per sq. km. b. Total length of national road network reported in 2004 is 29,180 km when including ARMM and 28,266 km when excluding it.
Sources: 1. National road lengths as of 2004 from the Department of Public Works and Highways website. 2. Local road lengths as of December 2000, from National Statistical Coordination Board. “Countryside in Figures.” 2004. Manila. 3. Motor vehicle data as of 2001, from the Land Transportation Office. 4. Land area and population data from Philippine Statistical Yearbook 2002.
(SLEX), were constructed by DPWH in 1975–1977 and subsequently franchised to a private company, Construction and Development Corporation of the Philippines, in 1977 (later taken over by the government and renamed PNCC). PNCC is a government owned and controlled corporation currently attached to the Department of Trade and Industry. With the passage of the BOT Law, and its amendment in 1994, PNCC entered into several joint-venture agreements to redevelop the NLEX and SLEX, as well as expand the expressway system. The deals led to the incorporation of Citra Metro Manila Tollways Corporation (CMMTC) and Crown Hopewell for the rehabilitation and extension of the SLEX and Manila North Tollways Corporation (MNTC) for the reha-bilitation, upgrading, and extension of the NLEX. Two other private sector players are the Coastal Road Corporation for the Manila–Cavite Toll Expressway (MCTE) and the STAR Infrastructure Development Corporation (STAR IDC) for the Southern Tagalog Arterial Road (STAR).
Since the initial franchising of the SLEX and the NLEX, construction of toll roads has followed the BOT model where the project sponsor is responsible for construction/upgrading as well as operation and maintenance of a road (or a section). The STAR provides a different model of private sector participation in that the government built the first phase of the road, the concessionaire was contracted through public bidding to build the second phase only, and then to operate and maintain both phases (box 8.1). Certain key features of the existing toll roads and their proposed extensions are shown in appendix 9.
Private roadsAn indeterminate length of roads is classified as private. These were built and financed by large private property developers. These roads are not tolled and are mostly found in urban areas. In Metro Manila, 1,820 km of roads, or about one-third of the total road network in the metropolis, are private.
WorldBankInfra.indb 145 12/6/2005 8:41:53 AM
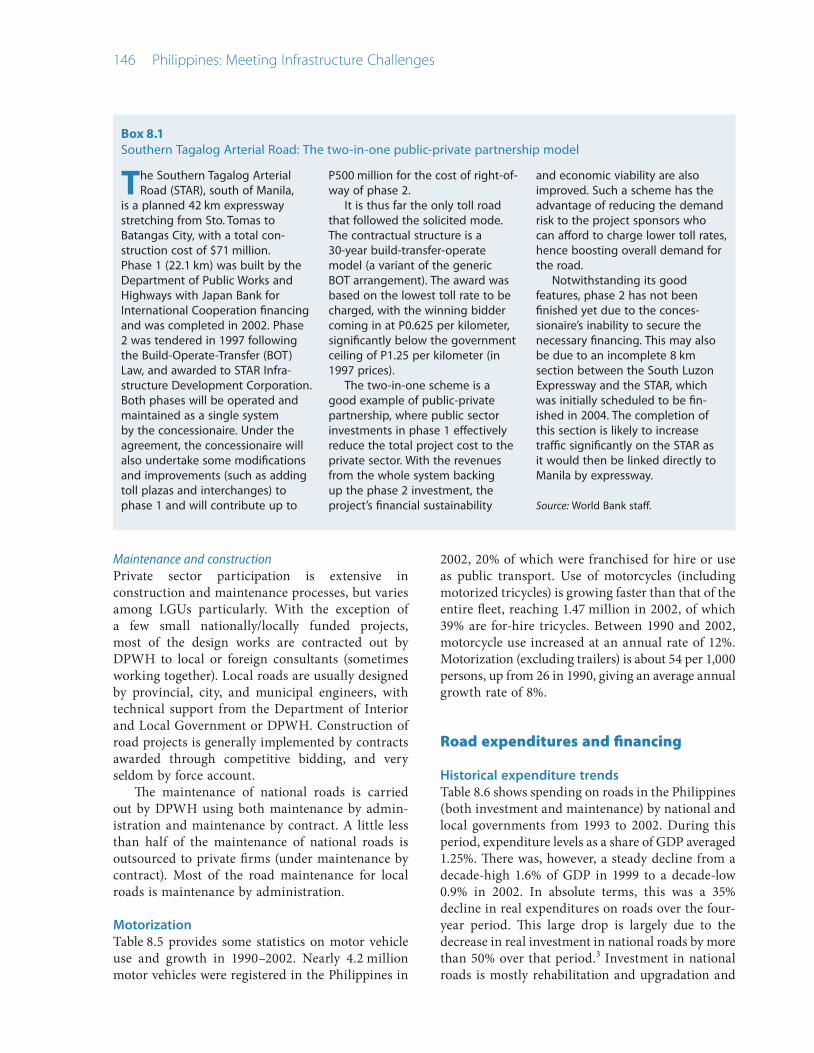
1�� Philippines: Meeting Infrastructure Challenges
The Southern Tagalog Arterial Road (STAR), south of Manila,
is a planned 42 km expressway stretching from Sto. Tomas to Batangas City, with a total con-struction cost of $71 million. Phase 1 (22.1 km) was built by the Department of Public Works and Highways with Japan Bank for International Cooperation financing and was completed in 2002. Phase 2 was tendered in 1997 following the Build-Operate-Transfer (BOT) Law, and awarded to STAR Infra-structure Development Corporation. Both phases will be operated and maintained as a single system by the concessionaire. Under the agreement, the concessionaire will also undertake some modifications and improvements (such as adding toll plazas and interchanges) to phase 1 and will contribute up to
P500 million for the cost of right-of-way of phase 2.
It is thus far the only toll road that followed the solicited mode. The contractual structure is a 30-year build-transfer-operate model (a variant of the generic BOT arrangement). The award was based on the lowest toll rate to be charged, with the winning bidder coming in at P0.625 per kilometer, significantly below the government ceiling of P1.25 per kilometer (in 1997 prices).
The two-in-one scheme is a good example of public-private partnership, where public sector investments in phase 1 effectively reduce the total project cost to the private sector. With the revenues from the whole system backing up the phase 2 investment, the project’s financial sustainability
and economic viability are also improved. Such a scheme has the advantage of reducing the demand risk to the project sponsors who can afford to charge lower toll rates, hence boosting overall demand for the road.
Notwithstanding its good features, phase 2 has not been finished yet due to the conces-sionaire’s inability to secure the necessary financing. This may also be due to an incomplete 8 km section between the South Luzon Expressway and the STAR, which was initially scheduled to be fin-ished in 2004. The completion of this section is likely to increase traffic significantly on the STAR as it would then be linked directly to Manila by expressway.
Source: World Bank staff.
Box 8.1Southern Tagalog Arterial Road: The two-in-one public-private partnership model
Maintenance and construction Private sector participation is extensive in construction and maintenance processes, but varies among LGUs particularly. With the exception of a few small nationally/locally funded projects, most of the design works are contracted out by DPWH to local or foreign consultants (sometimes working together). Local roads are usually designed by provincial, city, and municipal engineers, with technical support from the Department of Interior and Local Government or DPWH. Construction of road projects is generally implemented by contracts awarded through competitive bidding, and very seldom by force account.
The maintenance of national roads is carried out by DPWH using both maintenance by admin-istration and maintenance by contract. A little less than half of the maintenance of national roads is outsourced to private firms (under maintenance by contract). Most of the road maintenance for local roads is maintenance by administration.
MotorizationTable 8.5 provides some statistics on motor vehicle use and growth in 1990–2002. Nearly 4.2 million motor vehicles were registered in the Philippines in
2002, 20% of which were franchised for hire or use as public transport. Use of motorcycles (including motorized tricycles) is growing faster than that of the entire fleet, reaching 1.47 million in 2002, of which 39% are for-hire tricycles. Between 1990 and 2002, motorcycle use increased at an annual rate of 12%. Motorization (excluding trailers) is about 54 per 1,000 persons, up from 26 in 1990, giving an average annual growth rate of 8%.
Road expenditures and financing
Historical expenditure trends Table 8.6 shows spending on roads in the Philippines (both investment and maintenance) by national and local governments from 1993 to 2002. During this period, expenditure levels as a share of GDP averaged 1.25%. There was, however, a steady decline from a decade-high 1.6% of GDP in 1999 to a decade-low 0.9% in 2002. In absolute terms, this was a 35% decline in real expenditures on roads over the four-year period. This large drop is largely due to the decrease in real investment in national roads by more than 50% over that period.3 Investment in national roads is mostly rehabilitation and upgradation and
WorldBankInfra.indb 146 12/6/2005 8:41:53 AM

Chapter 8 Roads 1��
Table 8.5Motor vehicles by category, 1990–2002
1990 1995 2000 2001 2002
Private 1,305,142 2,030,705 2,835,801 3,010,974 3,274,316Cars 419,410 581,910 688,402 681,050 694,557Utility vehicles 517,679 837,271 1,171,953 1,271,420 1,406,202Buses 3,279 3,735 3,686 3,711 3,525Trucks 116,956 177,004 222,893 229,664 232,965Motorcycles/tricycles 232,848 407,050 725,330 804,081 916,332Trailers 14,970 23,735 23,537 21,048 20,735
For hire 246,082 493,103 794,499 794,306 851,145Cars 13,676 35,977 69,464 40,908 45,161Utility vehicles 71,365 135,229 183,255 189,180 217,000Buses 14,667 23,983 29,833 27,632 30,069Trucks 6,515 10,832 17,991 17,032 18,306Motorcycles/tricycles 138,948 285,366 491,113 517,087 537,811Trailers 911 1,716 2,843 2,467 2,798
Government 45,482 51,160 66,468 56,698 58,142Cars 6,052 4,613 5,968 4,089 6,077Utility vehicles 23,074 25,428 32,670 28,398 28,834Buses 386 458 367 343 321Trucks 5,607 4,878 7,461 6,872 6,476Motorcycles/tricycles 9,617 15,571 19,793 16,812 16,233Trailers 116 212 209 184 201
Diplomatic 5,895 3,070 3,391 2,698 2,904Exempt 17,641 3,316 1,014 1,189 1,166
Total vehicles 1,620,242 2,581,354 3,701,173 3,865,862 4,187,673
Sources: Land Transportation Office (www.lto.go.ph); and National Statistical Coordination Board. Philippine Statistical Yearbook 2003. Manila.
involves very little expansion or extension. The large decrease in investment funding of national roads was due in part to the government deficit, which adversely affected investment in all sectors. Never-theless, expenditures on national roads as a share of total national government expenditures declined by 50% between 1999 and 2002, indicating the govern-ment’s decreasing priority of investment in national roads. While investment expenditures have shown significant fluctuations over the past decade, expen-ditures on road maintenance remained stable at 0.2% of GDP.
Consistent and reliable data on expenditures on local roads are unavailable. The estimates in table 8.6 make use of some available figures and involve certain assumptions regarding the spending patterns of the different agencies funding local roads. Similar to expenditures on national roads, it appears that there has been a decline in investment in local roads over the past few years, but at a less pronounced rate.
Who finances road expenditures?National roadsThe outlay for national roads is funded from the general fund of the national government. There is an appropriation for investment and a separate one for maintenance. According to DPWH, ODA accounted for about half of the investment in national roads in 1997–2001, most of which was for rehabili-tation and upgradation. In addition to the appropriation for road main-tenance, the annual motor vehicle registration charges were revised upward with 80% of the proceeds earmarked to be deposited in the SRF for the maintenance of national roads (RA 8794). In the three years following the passage of this law in 2000, P10.3 billion was deposited into the SRF. However, less than half was released by DBM to DPWH. Currently, the annual proceeds into the SRF are about P5 billion. This rate is expected to grow with the increase in vehicle registrations. There is no provision in the law or its implementing rules and regulations for indexing charges to the general price level.
Over the past 10 years, the private sector has financed three toll road projects costing $925 million: the redevelopment of the NLEX ($377 million); phase 1 of the MCTE ($47 million); and phase 1 of the Skyway ($500 million). With the exception of the right-of-way, which was probably in the order of $100 million–150 million, the balance was financed by the private sector.4 In addition, work is under way on the construction of phase 2 of the MCTE at an estimated cost of $117 million.
Local roadsThe largest investor in local roads is the LGUs, although their investments have varied from 4% to 6% of total LGU revenues.5 Another large source is congressional funds, which earmark funds in DPWH’s budget for investment. These funds appear under the rubric “various infrastructure” in DPWH’s budget and are dedicated to projects selected by legislators, many of which are not part of well-conceived or sustainable development plans for local governments. For 2001–2004, P30.4 billion was appropriated to
WorldBankInfra.indb 147 12/6/2005 8:41:53 AM

1�� Philippines: Meeting Infrastructure Challenges
Table 8.6Expenditures by government on roads (P billion, nominal, unless otherwise indicated)
Sources 1993 1994 1995 1996 1997 1998 1999 2000 2001 2002
A. National roads
A.1. Investment (mostly rehabilitation)
DPWH1,2 10.5 14.3 13.6 21.9 21.8 18.2 30.8 21.5 20.3 16.0
A.2. Maintenance3 1.7 1.8 3.2 3.4 3.6 3.7 3.8 4.1 4.1 4.1
Total expenditures on national roads 12.2 16.1 16.9 25.3 24.4 21.9 34.6 25.6 24.4 22.1
Expenditures on national roads (% of national government expenditures)
5.1 6.8 5.6 4.6 6.9 4.3 4.0 3.5
B. Local roads
B.1. Investment (mostly rehabilitation)
B.1.1. Investment by national government
Department of Agriculture1 0.0 0.0 0.0 0.0 0.0 0.9 1.0 2.3 0.7 0.7
Department of Agrarian Reform1 0.2 0.5 0.5 1.0
ARMM1,4 0.4 0.2 0.6 0.0 0.1
Allocations from Special Funds1,5 0.0 0.0 0.0 0.0 0.0 0.0 0.0 2.1 0.7 0.7
Estimated congressional funds6 5.5 1.2 2.7 3.2 6.9 3.9a
Subtotal (national government) 5.5 2.4 4.1 8.6 8.7 6.4
B.1.2. Investment by LGUs
Estimated LGU investment in roads7 1.7 3.0 4.1 3.4 4.9 4.0 5.3 6.6 6.1 4.7
Total investment in local roads 1.7 3.0 4.1 3.4 10.4 6.4 9.4 15.2 14.8 11.1
B.2. Maintenance8 0.9 1.2 1.3 1.5 1.8 1.9 2.3 2.7 2.7 3.1
Total expenditures on local roads 2.6 4.1 5.4 4.9 12.3 8.4 11.7 17.8 17.5 14.2
Total investment in all roads 12.3 17.3 17.7 25.4 32.3 24.6 40.2 36.6 35.1 27.1
Total expenditures on all road maintenance
2.5 2.9 4.6 4.9 5.4 5.6 6.1 6.8 6.8 7.2
Total expenditures on all roads 14.8 20.2 22.2 30.2 37.7 30.3 46.3 43.4 41.9 34.3
Total road expenditures (% of GDP) 1.0 1.2 1.2 1.4 1.6 1.1 1.6 1.3 1.1 0.9
DPWH = Department of Public Works and Highways.
a = assumed equal to the average of the previous five years.
Sources: 1. Annual figures on obligation basis sourced from Department of Budget and Management. 2. The funds for road investment in national roads are historically heavily dependent on official development assistance (ODA). According to DPWH, ODA accounted for about half of the investment in national roads in 1997–2001. 3. DPWH-Bureau of Maintenance as cited in Japan Bank for International Cooperation. 2003. “Sector Study for the Road Sector in the Philippines.” June. 4. ARMM receives a separate budget. 5. Includes funding from the Municipal Development and Local Government Empowerment Funds. 6. Figures for congressional funds from Rosario G. Manasan. “Infrastructure and Decentralization.” May. World Bank, Manila. 7. LGUs’ investment in roads was assumed at 70% of their total investment in transport. Resulting investment figures vary between 4% and 6% of total LGU revenues and are consistent with the results of the 2002 Annual Survey of Construction Projects of Local Government, National Statistics Office. 8. Maintenance expenditures for 2002 from Asian Development Bank. 2003. “Rural Roads Development Policy Framework.” Manila. Figure represents 1.9% of LGU revenues for 2002. Maintenance expenditures for earlier years were assumed to be 1.9% of total LGU revenues.
congressional funds, of which some P14.2 billion (or 39%) went to local roads.6 As table 8.6 indicates, the level of financing from congressional funds varied significantly from year to year, from a low of P1.2 billion in 1998 to P6.9 billion in 2001.
As for other financiers of roads, the Department of Agriculture has, in its Agriculture and Fisheries Modernization Act (AFMA) program budget, an
allocation of P700 million annually for farm-to-market roads, and the Department of Agrarian Reform allocated an average of P777 million a year from 2001 to 2003. The total annual allocations for farm-to-market roads from both agencies were P1.47 billion between 2001 and 2003. This amount is over and above any funds committed by DPWH, the LGUs, and congressional funds.
WorldBankInfra.indb 148 12/6/2005 8:41:53 AM

Chapter 8 Roads 1��
Investment outlook: Next six yearsNational roads The MTPIP proposed by DPWH for roads for 2004–2009 has an annual budget of around P26 billion (table 8.7). The MTPIP ref lects the government’s planned tight fiscal policy however, rather than the sector’s needs. Under the proposed plan, investment in national roads (once congressional funds are excluded from the total) is projected to increase to P22.0 billion in 2006 before dropping to P20.6 billion in 2009. According to these figures, and assuming average annual GDP growth of 4% a year,7 expenditure on national roads would drop to slightly less than 0.3% of GDP by 2009. This would be the lowest rate of expenditure in at least 17 years. Figure 8.1 shows historical and projected expenditure levels as a share of GDP. Projections are based on the GDP growth assumptions cited above.
Toll roadsA 2003 study8 compiled 15 proposals for toll roads likely to be implemented by 2015. The estimated cost of these toll roads is more than P300 billion. Given that several of these proposals appear to have already been abandoned by their proponents, and the fact that only about 10% of that amount was invested by the private sector in toll roads over the past decade, it is unlikely that this investment level will be achieved. Over the next few years, the toll road projects with the best chance of completion are those with preexisting signed concession agreements: STAR phase 2 in Batangas province and the MCTE phase 2. These two projects have completed segments. In both cases, the main hurdle
Table 8.7Proposed Medium-Term Public Investment Program, 2004–2009 (P million, nominal)
Category 2004 2005 2006 2007 2008 2009 Total
Total national roads 19,960 21,833 22,022 22,239 21,012 20,557 127,624Foreign assisted 17,251 20,498 20,622 20,739 17,411 17,130 113,652
Ongoing 14,205 16,366 13,815 11,784 4,972 1,706 62,849
Additional requirementa 1,851 3,420 4,530 5,620 2,328 1,159 18,907
New/Proposed 1,195 712 2,277 3,335 10,111 14,265 31,896
Locally funded 2,709 1,335 1,400 1,500 3,601 3,427 13,972
Other infrastructure/CF 13,175 10,350 10,350 10,350 10,350 10,350 64,925
CF expenditure on roads (39% of total) 5,138 4,037 4,037 4,037 4,037 4,037 25,321
Total roads 26,153 26,698 26,887 27,104 25,877 25,421 158,139
CF = congressional funds. a. Covers cost overruns and change orders.
Source: Department of Public Works and Highways. 2004. Medium-Term Public Investment Program (2004–2009). April.
appears to be the inability of the proponents to raise the funding required by the project.9 The total costs are $46 million for phase 2 of STAR and $177 million for phase 2 of the MCTE.
Local roadsThe absence of long-term transport planning among LGUs, with few exceptions, makes estimation of future road expenditures difficult. The trends arrived at earlier are used to project spending by LGUs on investment and maintenance, estimated at 4.5% and 1.9%, respectively, of LGU income. These rates, based on previous trends, are well below desired levels. A study by the Asian Development Bank (ADB), for example, places the requirements for maintaining local roads at P13.9 billion10 a year, inclusive of P4.0 billion a year for road restoration works spread over 10 years. Table 8.8 is an indicative expenditure program for local roads, assuming that the previous expenditure trends continue.
Figure 8.1Investment in national roads as a share of GDP, 1993–2009
Perc
ent
0.0
0.2
0.4
0.6
0.8
1.0
1.2
200920072005200320011999199719951993Year
Note: Projections from 2004.
Source: Tables 8.6 and 8.7.
WorldBankInfra.indb 149 12/6/2005 8:41:54 AM

1�0 Philippines: Meeting Infrastructure Challenges
Table 8.8Indicative projections of local road expenditures (P billion, nominal)
Item 2004 2005 2006 2007 2008 2009
Total LGU incomea 196 217 241 268 298 332
1. Road maintenance by LGUsb 3.7 4.1 4.6 5.1 5.7 6.3
2. Road investment by LGUsc 8.8 9.8 10.9 12.1 13.4 14.9
3. Road investment from CF (39% of total CF allocation to DPWH–Table 8.7)
5.1 4.0 4.0 4.0 4.0 4.0
Total investment in local roads (2 + 3) 14.0 13.8 14.9 16.1 17.5 19.0
Total expenditures by LGUs on roads (1 + 2) 12.5 13.9 15.5 17.2 19.1 21.2
Total expenditures on local roads (1 + 2 + 3) 17.7 17.9 19.5 21.2 23.1 25.3
CF = congressional funds.
a. LGU income has been projected to grow at a real rate of 6.7% a year (following historical trends) and an average inflation rate of 4.5%. b. Road maintenance assumed at 1.9% of LGU revenue. c. Road investment assumed at 4.5% of LGU revenue.
Source: Consultants’ estimates.
The financing gap: How big is it?Maintenance With regard to national roads, the annual requirement for maintenance of the road network is estimated at about P16 billion (at 2003 prices)11 but projected annual expenditures through 2009 are P5.1 billion a year, or only 32% of estimated requirements. With regard to local roads, the 2003 ADB study indicates that spending on the preservation of the 172,000 km local road network is one-quarter of estimated requirements. The expenditure on maintenance of local roads was about P3.1 billion in 2002 or P18,000 per kilometer, significantly lower than the required P13.9 billion or P80,000 per kilometer.
InvestmentBased on an average projected growth in GDP of 4% a year, the investment needs in the road network are around 1% of GDP a year over 2004–2009.12 Moreover, based on the MTPDP targets, the period 2001–2004 incurred an estimated investment backlog of P63 billion for national roads. If the backlog were to be made up over a 10-year period, this would require an additional 0.12% of GDP to be invested in roads. Table 8.9 shows the required investment in roads, the projected/planned spending, and the financing gap.
Total The total financing gap for both investment and maintenance for 2004–2009 is estimated to be about 1% of projected GDP a year. The underinvestment in maintenance—such investment has been established as a priority in the MTPDP—is about 0.55% of GDP, or slightly more than half of the total gap.
Sector performance
Overall progress vis-à-vis the Medium-Term Philippine Development PlanThe 2001–2004 MTPDP identified a number of reform measures and priority projects to be undertaken by 2004. A few of the targets were met. Among the key targeted reforms that were not achieved were: expansion of the revenue sources for the SRF to include a portion of the fuel tax; transformation of DPWH into an autonomous National Roads Authority; assumption of full responsibility by LGUs for the financing and maintenance of local roads; and strict enforcement of vehicle axle loads.
A review of priority projects revealed that only three projects had been completed by 2002 against the planned 10. Of the 111 projects in the MTPDP, all of which should have been started and most completed by 2004, more than one-half showed no activity. A progress report by DPWH in 2004 revealed some progress in meeting targets but results fell short in many areas, particularly in expressway development (table 8.10).
Some progress has been made in implementing the road sector reforms, but in general implemen-tation has been slow. Much of the progress has been in developing technical and information systems for reforming internal business processes of DPWH under the RIMSS Project (box 8.2). While there have been extensions and delays of up to two years on certain reform components, there have also been important achievements.
Agency performance indicators have been developed and some are already in use by DPWH. Road infrastructure surveys have been
WorldBankInfra.indb 150 12/6/2005 8:41:54 AM

Chapter 8 Roads 1�1
Table 8.9Projected expenditures, estimated needs, and financing gap (P billion, nominal, unless otherwise indicated)
Category 2004 2005 2006 2007 2008 2009
GDPa 4,768 5,172 5,627 6,112 6,621 7,157Projected real GDP growth (%) 4.5 4.2 4.1 3.9 3.6 3.4
Estimated investment needsb (% of GDP) 1.24 1.18 1.15 1.11 1.03 0.98
Estimated investment needs 58.8 60.5 64.3 67.6 69.0 71.8
Projected investment expenditures
National roadsc 20.0 21.8 22.0 22.2 21.0 20.6
Local roadsd 17.7 17.9 19.5 21.2 23.1 25.3
Total 37.7 39.7 41.5 43.4 44.1 45.9
Financing gap for investment 21.2 20.8 22.8 24.1 24.9 25.9
Estimated maintenance needs
Nationale 17.1 18.5 20.2 22.0 24.1 26.3
Localf 16.6 18.0 19.6 21.4 23.4 25.6
Total 33.6 36.5 39.8 43.4 47.5 52.0
Projected maintenance expenditures
Nationalg 4.7 4.8 5.0 5.2 5.4 5.6
Local 3.7 4.1 4.6 5.1 5.7 6.3
Total 8.4 8.9 9.6 10.3 11.1 11.9
Financing gap for maintenance 25.2 27.6 30.2 33.1 36.4 40.1
Total financing gap 46.4 48.4 52.3 57.3 61.3 66.0
Total financing gap (% of GDP) 1.0 0.9 0.9 0.9 0.9 0.9
a. Base case projections by the International Monetary Fund. Assumptions: annual inflation of 4.5%, and real GDP growth of 4.5% in 2004 to drop gradually to 3.4% by 2009. b. The share is estimated at 25% of projected GDP growth plus 0.12% of GDP to adjust for the investment backlog. c. Projected expenditures for national roads are from the MTPIP. d. Projections for local roads are based on average spending levels as a share of LGU revenues over the past 10 years plus the projected expenditures on roads from congressional funds as per the MTPIP. e. Maintenance needs for 2003 were estimated at P16 billion, equivalent to 0.36% of GDP. This percentage was held constant in projecting future maintenance requirements. f. Maintenance needs for 2002 were estimated at P13.9 billion, equivalent to 0.35% of GDP. This percentage was held constant in projecting future maintenance requirements. g. Projected real expenditures on maintenance for national roads were held constant at the 2003 level and only increased by the rate of inflation.
Source: Consultants’ estimates.
completed and road and bridge information applications have been developed, including infra-structure performance indicators, which generate reliable data for decisionmaking. Land acquisition procedures have been developed with implementation and staff training ongoing. New contractor billing systems reduced the average time to pay contractors from 69 days in 2001 to 30 days in 2003. Human resource capacity is being strengthened in parallel to be able to handle the new systems. While the development of a multiyear network planning and programming system was to be in operation by July 2004, the system can be fully operational only after the collection of traffic data, a process that is currently delayed. Another setback has been the delay in the prepa-ration of streamlined contract and procurement documents.
On the institutional side, the SRF was established in 2000, and revenues of P10.3 billion from the MVUC were deposited in the SRF over three years. However, there has been little progress in establishing a commercially oriented National Roads Authority, a reform plan developed and approved by DPWH, DBM, Department of Finance, and NEDA.
In addition, little action has been seen in introducing a fuel levy as an
Table 8.10Key measurable targets under the 2001–2004 MTPDP
2000a 2004 targeta Actual (end-2003)b
Paved share of national roads (%) 62 79 70
Lineal share of permanent bridges (%) 89 95 92
Expressways A total of 271 km of build-operate-transfer interurban roads: North Luzon Expressway rehabilitation (widening of existing facilities), STAR 2, South Luzon Expressway (widening and extension to Lucena), and Subic-Clark-Tarlac Expressway
Only North Luzon Expressway rehabilitation was implemented (83 km)
Sources: a. NEDA. 2000. 2001–2004 Medium-Term Philippine Development Plan. b. DPWH “Infrastructure Development.” Presentation in the University of the Philippines 3rd Lecture Series 2004.
WorldBankInfra.indb 151 12/6/2005 8:41:54 AM

1�� Philippines: Meeting Infrastructure Challenges
The Road Information and Management Support System
(RIMSS) aims to improve the quality and delivery of Department of Public Works and Highways (DPWH) services in the provision and management of the road system by: providing a source of readily accessible, relevant, and valid information on the road system; using various modern analytical tools; and adopting efficient, modern, information technology. It was a comprehensive attempt at improving three areas: strategic management (quality assurance, strategic planning, performance indicators, policies and procedures, and public relations); core processes; and support processes. The core processes that were to be enhanced are in planning (network planning and multiyear programming, bridge management, traffic infor-mation and analysis, assessment and feasibility, postevaluation, pavement management, and safety),
construction (project/contract man-agement, land acquisition, design review, cost estimation, design surveys and design tools), and oper-ation and maintenance (equivalent maintenance kilometer and mainte-nance management). The support processes to be assisted include financial management, as well as management of physical resources, human resources, information, and procurement.
Implementation of RIMSS started in 1997. It has been integrated with the major business process reengi-neering program of DPWH, which aims for reforms and modernized systems in processes that were not only notoriously cumbersome but also prone to suspect practices, namely procurement, project pri-oritization, financial management, and right-of-way acquisition. In pro-curement, for instance, the devel-opment of the Civil Works Registry and advertisement and rules posted on the DPWH website reportedly
reduced procurement time from one year to between two and four months. In project identification and prioritization, decisionmaking can now be aided by empirical methods from the multiyear planning system that was developed and by the executive information and project monitoring system. The automation of financial management brought improvements in contractor and consultancy billing guidelines, reduction of processing time for payments, proper control mecha-nisms, and improved policies and procedures. Greater transparency in operations (e.g. clear rules and procedures on infrastructure right-of-way, contractor billing guidelines, civil works procurement) is likely to be achieved.
Sources: www.dpwh.gov.ph; DPWH presentation to the World Bank at DPWH, October 1, 2004; and World Bank Project Appraisal Document of the National Road Improvement and Management Project, January 21, 2001.
Box 8.2Road Information and Management Support System
additional source of revenue for the SRF. Experience in other countries indicates that road users are more likely to be willing to pay for improved roads, provided that there is a clear perceived link between the payment and the delivery of better services. Furthermore, the administration of the SRF has been subjected to external pressures that have resulted in delays and diversion in the release of funds, so that it has not been as effective as expected in improving the road maintenance program.
GovernanceResults of the June 2004 Social Weather Stations Enterprise Survey13 revealed that the public’s perception of DPWH’s efforts to combat corruption is one of the worst with regard to public agencies, and that it had further worsened over the previous two years. Speculations vary widely as to the level of leakage from DPWH-implemented projects, and are all difficult to verify. Governance issues also include the selection of project locations or allocation of funds. The lack of a strong governance framework in DPWH most likely results in uncompetitive
procurement practices and reduces the quality of road construction, which in turn reduces efficiency and adds significantly to the cost of road provision.
AccessAn important measure of access for a road network is the percentage of people within a certain distance (for example, 2 km) from an all-season road. This infor-mation is unavailable in the Philippines but is worthy of collection to help focus on the regions that require better integration into the country’s growth centers and markets. A proxy for access is the density of the road network measured in terms of road length per vehicle, per person, and per square kilometer of land area. The Philippines compares favorably with other countries in the region in this category (table 8.11), although there are large regional variations as explained below—a clear limitation of such broad measures. The significantly higher road density per 4-wheel vehicle in Vietnam and Cambodia is due in large part to the dominance of the motorcycle as a means of transport and the small number of 4-wheel vehicles in the two countries.
WorldBankInfra.indb 152 12/6/2005 8:41:55 AM

Chapter 8 Roads 1��
Table 8.11Road network coverage, six Asian countries
CountryTotal road
length (km)
Road density: length in km per
1,000 vehicles (4-wheel)
1,000 population
sq. km of land area
Indonesia 310,000 65.8 1.4 0.16Thailand 209,800 42.0 3.3 0.41
Vietnam 204,318 302.0 2.5 0.62
Philippines 202,083 91.3 2.4 0.67
Cambodia 38,257 372.0 2.7 0.21
Malaysia 72,000 19.4 2.8 0.22
Sources: Philippine data from JICA-DPWH. 2003. “Roads in the Philippines.” Manila; other countries from the ASEAN Statistical Yearbook 2004 and the ASEAN Transport and Communication Sectoral Report 1999. ASEAN, Jakarta.
Quality of infrastructure/service Paved national roadsA key indicator of road quality is the share of national roads that is paved.14 The estimated paved rate in June 2004 was 70%. Table 8.12 shows the length of national roads and the paved share in four Asian countries. Road classification in the Philippines is still administrative, rather than functional, and recent studies have indicated that the length of roads categorized as “national roads” needs to be reduced to around 18,000 km.15 The resulting smaller network comprising the arterial national roads is likely to have a higher paved rate than the 70% average for all national roads.
The paved rate differs considerably within the country, from province to province, as well as by class of roads. Table 8.13 shows the length of national roads and the paved share for various geographic areas, while table 8.14 presents changes in the length and the paved share of roads between 1981 and 2000 for all road types.
Table 8.12Length and paved share of national roads, four Asian countries
CountryNational road length
(km)Paved (%)
Philippines (2003)a 28,266 70Philippines (1981)b 23,835 44
Vietnam (2002)c 15,831 71
Thailandc 51,544 98
Myanmarc 28,790 80
Sources: a. Philippines 2004, DPWH website: http://www.dpwh.gov.ph/infrastructure/stat_JUNE182000.htm. b. Government of the Philippines. 1981. “National Transport Planning Project.” Manila. c. ASEAN Statistical Yearbook 2004. ASEAN, Jakarta.
Table 8.13Length and paved share of national roads, Philippines, selected areas, 2000
AreaNational road length
(km)Paved (%)
NCR 891 100Luzona 14,061 60
Visayas 7,119 68Mindanao 7,807 51Philippines 29,878 62
a. Excluding National Capital Region.
Source: JICA-DPWH. 2003. “Roads in the Philippines.” Manila.
Table 8.14Change in length and paved share of roads by road class
Road class1981 2000
Length (‘000 km)
Paved (%)Length
(‘000 km)Paved (%)
National 23.8 44 29.9 62Provincial 33.6 17 27.1 21
City 7.1 77
Municipal 11.9 26 15.8 34
Barangay 84.2 2 122.0 7
Total 153.6 13 200.8 21
Sources: JICA-DPWH.2003. “Roads in the Philippines.” Manila; Government of the Philippines. 1981. “National Transportation Planning Project.” Manila.
Quality of paved roadsReliable data on the quality of paved roads exist for about 11,000 km of national roads only.16 For this group of roads, less than 50% is considered to be in good condition as measured by the International Roughness Index (IRI) of 5 or less. Table 8.15 shows the average IRI for the four main groups of national roads based on the data available. Maintenance expenditures, another indicator of the quality of the roads, have averaged about one-third of the desired levels for both national and local roads.
The poor road surface translates into higher vehicle operating costs per kilometer. In 1999, one study estimated that a 1% improvement in the IRI for national roads would yield a 4% reduction in vehicle operating costs, equal to P13 billion a year.17 The same study estimated the required annual maintenance cost to improve the IRI by, most likely, significantly more than 1% to be P10 billion. Given the underin-vestment in maintenance between 1999 and 2003, the situation could only have worsened since 1999. This is consistent with DPWH’s finding that average vehicle
WorldBankInfra.indb 153 12/6/2005 8:41:55 AM
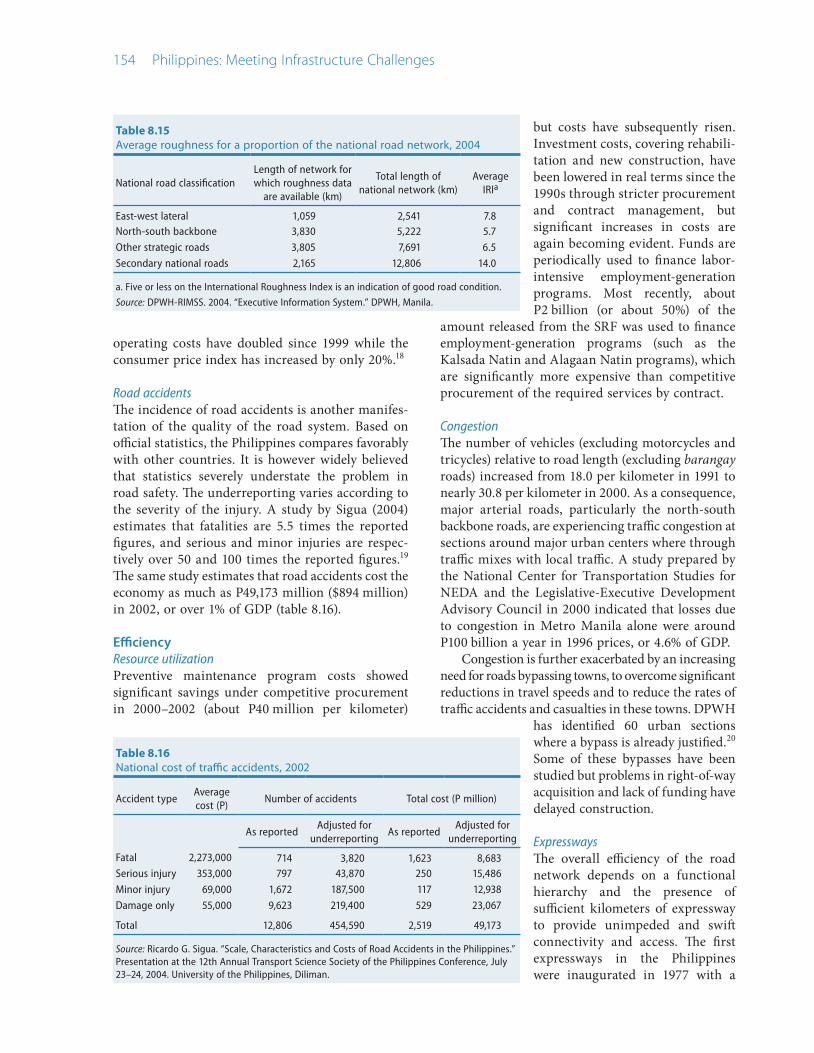
1�� Philippines: Meeting Infrastructure Challenges
operating costs have doubled since 1999 while the consumer price index has increased by only 20%.18
Road accidents The incidence of road accidents is another manifes-tation of the quality of the road system. Based on official statistics, the Philippines compares favorably with other countries. It is however widely believed that statistics severely understate the problem in road safety. The underreporting varies according to the severity of the injury. A study by Sigua (2004) estimates that fatalities are 5.5 times the reported figures, and serious and minor injuries are respec-tively over 50 and 100 times the reported figures.19 The same study estimates that road accidents cost the economy as much as P49,173 million ($894 million) in 2002, or over 1% of GDP (table 8.16).
EfficiencyResource utilization Preventive maintenance program costs showed significant savings under competitive procurement in 2000–2002 (about P40 million per kilometer)
Table 8.15Average roughness for a proportion of the national road network, 2004
National road classificationLength of network for which roughness data
are available (km)
Total length of national network (km)
Average IRIa
East-west lateral 1,059 2,541 7.8North-south backbone 3,830 5,222 5.7
Other strategic roads 3,805 7,691 6.5
Secondary national roads 2,165 12,806 14.0
a. Five or less on the International Roughness Index is an indication of good road condition.
Source: DPWH-RIMSS. 2004. “Executive Information System.” DPWH, Manila.
Table 8.16National cost of traffic accidents, 2002
Accident typeAverage cost (P)
Number of accidents Total cost (P million)
As reportedAdjusted for
underreportingAs reported
Adjusted for underreporting
Fatal 2,273,000 714 3,820 1,623 8,683Serious injury 353,000 797 43,870 250 15,486
Minor injury 69,000 1,672 187,500 117 12,938
Damage only 55,000 9,623 219,400 529 23,067
Total 12,806 454,590 2,519 49,173
Source: Ricardo G. Sigua. “Scale, Characteristics and Costs of Road Accidents in the Philippines.” Presentation at the 12th Annual Transport Science Society of the Philippines Conference, July 23–24, 2004. University of the Philippines, Diliman.
but costs have subsequently risen. Investment costs, covering rehabili-tation and new construction, have been lowered in real terms since the 1990s through stricter procurement and contract management, but significant increases in costs are again becoming evident. Funds are periodically used to finance labor-intensive employment-generation programs. Most recently, about P2 billion (or about 50%) of the
amount released from the SRF was used to finance employment-generation programs (such as the Kalsada Natin and Alagaan Natin programs), which are significantly more expensive than competitive procurement of the required services by contract.
Congestion The number of vehicles (excluding motorcycles and tricycles) relative to road length (excluding barangay roads) increased from 18.0 per kilometer in 1991 to nearly 30.8 per kilometer in 2000. As a consequence, major arterial roads, particularly the north-south backbone roads, are experiencing traffic congestion at sections around major urban centers where through traffic mixes with local traffic. A study prepared by the National Center for Transportation Studies for NEDA and the Legislative-Executive Development Advisory Council in 2000 indicated that losses due to congestion in Metro Manila alone were around P100 billion a year in 1996 prices, or 4.6% of GDP.
Congestion is further exacerbated by an increasing need for roads bypassing towns, to overcome significant reductions in travel speeds and to reduce the rates of traffic accidents and casualties in these towns. DPWH
has identified 60 urban sections where a bypass is already justified.20 Some of these bypasses have been studied but problems in right-of-way acquisition and lack of funding have delayed construction.
Expressways The overall efficiency of the road network depends on a functional hierarchy and the presence of sufficient kilometers of expressway to provide unimpeded and swift connectivity and access. The first expressways in the Philippines were inaugurated in 1977 with a
WorldBankInfra.indb 154 12/6/2005 8:41:55 AM

Chapter 8 Roads 1��
total length of 126 km. This figure remained unchanged until the late 1990s when expressway length increased to 165 km. Table 8.17 shows that Thailand and Indonesia have more extensive expressway systems, both in absolute terms and as a percentage of national roads. In addition, the benefits of the Philippine system are not fully realized due to missing links and lack of interconnections of some sections (in particular the section between the STAR and the SLEX).
Productivity of road administrationDPWH employs about 35,000 workers, of whom about 60% are deployed to manage the national road network of 28,600 km. It is a level that has not changed much despite the reduction in the road program in recent years and in particular after the devolution of barangay roads. This translates to a ratio of one employee for every 1.3 km of national roads. In comparison, Indonesia employs 2,726 workers under the Directorate General of Regional Infrastructure to manage about 26,300 km of national roads—or a ratio of one employee for every 10 km of roads.21
AffordabilityPublic transport fares within Metro Manila are the highest in the Philippines, with lower and different rates applied in the rest of Luzon, Visayas, and Mindanao. In 2003, the applicable tariff in Metro Manila for ordinary buses was P4.00 for the first 4 km plus P0.65 per kilometer beyond that. In June 2004, the tariff was adjusted upward to P6.00 and P1.10 per kilometer respectively. The rate from late 2004 for jeepneys is different, with a rate of P5.50 for the first 4 km and P1.00 per kilometer thereafter. Fares on air-conditioned buses are deregulated, and are typically no higher than 20% over ordinary bus services. While the official rates in urban centers are generally followed, the provincial and interurban fares are discounted, particularly in the Visayas and Mindanao. On the island of Cebu, operators charge P0.72 per kilometer (instead of P1.10 per kilometer) due to competition and sensitivity of passenger demand to fares.22
Rates for cargo are not regulated. The going rate is about P40 per kilometer for containers in Metro Manila. The intercity freight rate ranges from P86 to P104 per 20-foot equivalent unit-km for distances exceeding 200 km. Table 8.18 shows that the costs of
Table 8.17Length of expressway network, three Asian countries
Total length (km)
Expressways as percent of national
road network
In urban capital (urban expressway)a
Length (km) Length (km) per 1,000 vehicles
Philippines 165 0.6 41 38Thailand 270 1.8 136 57
Indonesia 490 3.4 160 61
a. An urban expressway is located within the administrative boundary of the urban centers (Manila, Bangkok, Jakarta).
Sources: Hitoshi Ieda. 2000. “Motorway Development in Eastern Asia 2000.” Short Report for PIARC-C4 Meeting in Cuba 2000; Japan International Cooperation Agency. 2003. “Public-Private Partnership Study of Metro Manila Urban Expressway Network 2003.” Manila.
intercity passenger travel and freight in the Philippines are higher than in Thailand and Vietnam, attributable in large part to high vehicle operating costs.
Figure 8.2 shows the toll rates of various expressways in the Philippines and how they compare to other countries. The 2004 toll rate for the NLEX and SLEX were very low compared regionally. Even with the increase of NLEX toll rates in early 2005 after the completion of its redevelopment, its toll level is still within the middle ranges relative to other countries. A 2003 study23 estimated the benefits to users of toll roads and determined that P4 per kilometer is likely to leave the user with significant savings in time and vehicle operating costs.
Gasoline and diesel prices in the Philippines are deregulated and are minimally taxed. As a result, the Philippine gasoline price (52 US cents per liter) is just above the “normal” sales price of gasoline of about 48 US cents per liter.24 In contrast, diesel prices (34 US cents per liter) are held below the “normal” sale price of 47 US cents per liter. It is worth noting that the prices of gasoline and diesel have increased 48% and
Table 8.18 Intercity passenger transport and freight costs, three Asian countries
Intercity passenger fare (P per pax-km)
Intercity freight rate (P per ton-km)
Philippines 0.69–0.79 8.80Thailand 0.44 5.40
Vietnam 0.58 5.10
Sources: Philippines: consultants’ estimates; Thailand: World Bank. Trade and Logistics in East Asia. 2003. World Bank, Washington, D.C.; Vietnam: Japan International Cooperation Agency, Ministry of Transport, and Transport Development and Strategy Institute. 2000. “The Study on the National Transport Development Strategy in the Socialist Republic of Vietnam. Hanoi.
WorldBankInfra.indb 155 12/6/2005 8:41:55 AM

1�� Philippines: Meeting Infrastructure Challenges
26% respectively since 2002 in response to the sharp rise in world crude oil prices. Table 8.19 shows that gasoline prices in the Philippines are similar to those in Thailand and Vietnam but higher than those in Indonesia, where they remain heavily subsidized.
Main issues
One way to understand the main issues in the road sector is to examine the supply and demand dimensions of road transport, namely road provision—analyzed further under the two key problems of unsatisfactory preservation of road assets and inadequacies in the road network (as well as their causes); and road use management—discussed under road safety and vehicle overloading, the latter of which has a direct negative impact on road quality.
Unsatisfactory preservation of road assets Increasing vehicle operating costs are a manifestation of the unsatisfactory preservation of road assets, both national and local. With regard to national roads, the annual requirement for the maintenance of the national road network was estimated at about P16 billion in 2003 (as explained in the section above, “Road expenditures and financing”) but actual spending for 2001 was about P4.0 billion, or only 25% of estimated requirements. Even though the government attached the highest priority to the maintenance of existing road assets in the 1999–2004 MTPDP, maintenance spending for 1998–2002 has varied at between 25% and 30% of requirements, indicating that the condition of national roads has been consistently deteriorating throughout this period. Moreover, most of the P4.0 billion is devoted to routine maintenance, which is ineffective in reducing deterioration and restoring the condition of the roads.
While the lack of reliable historical data precludes establishing how much the national road assets have deteriorated in the past, recent investigations of road conditions carried out under the RIMSS Project for 11,000 km of paved national roads indicated that half of these roads were in poor condition (i.e. with an IRI higher than 5). As the roads that were surveyed were the national arterial and other strategic roads that would have received priority maintenance, a reasonable inference is that significantly more than half of the national road network is in poor condition.
Further evidence of such deterioration can be seen by reexamining the 1999 study by Scott Wilson Kirk-patrick & Co.17 The study estimated the normalized annual requirement for maintenance at P10 billion with an additional P2.6 billion a year over a 10-year period to address the maintenance backlog. Given that annual maintenance expenditures from 1999 to 2003 did not exceed P4.1 billion, the extent of the
Table 8.19Gasoline prices, selected Asian economies, November 2004
Gasoline price(US cents per liter)
Indonesia 27Malaysia 37
Vietnam 48
Philippines 52
Thailand 54
Cambodia 79
India 87
Korea 135
Hong Kong, China 154
Note: November 17–20, 2004 survey; prices at filling stations.
Source: Gerhard P. Metschies. International Fuel Prices 2005, 4th Edition Data Preview. Deutsche Gesellschaft für Technische Zusammenarbeit (www.internationalfuelprices.com).
Figure 8.2International toll rates
AustraliaCanada
France
China
BrazilMalaysia
South Africa
IndonesiaPHI–SLEX
PHI–Skyway at grade
PHI–Skyway elevated
PHI–NLEX open
PHI–NLEX closedPHI–MCTE
0.00 0.02 0.04 0.06 0.08 0.10 0.12 0.14 0.16 0.18
US$ per km
Note: Australia, Canada, France, Malaysia, and Indonesia (2003); China and Brazil (2000); South Africa (1999); Philippines (2005).
MCTE = Manila–Cavite Toll Expressway; NLEX closed = Marilao to Sta. Ines; NLEX open = Balintawak to Marilao; PHI = Philippines; Skyway at grade = Magallanes to Alabang; Skyway elevated = Pasay Road to Bicutan; SLEX = South Luzon Expressway, Alabang to Calamba. An “open” system means a road user pays upon entry and exits anywhere; in a “closed” system, a road user gets a ticket upon entry and pays upon exit. Exchange rate used for conversion = P55/US$.
Source: Tasman Economics. 2003. “Institutional Arrangements in the Toll Road Sector, Final Report.” PPIAF and World Bank, Manila; basic data for Philippines from Toll Regulatory Board.
WorldBankInfra.indb 156 12/6/2005 8:41:56 AM

Chapter 8 Roads 1��
deterioration of the national road network becomes apparent.
In addition to the low level of maintenance spending, the efficiency of maintenance practices is in question. Most of the maintenance is by admin-istration and, even when carried out by contract, the administration limits scope for private sector efficiency by defining specific activities for the private contractors to carry out. Exacerbating the situation is the fact that funds allocated for maintenance are not always used for that purpose—as mentioned, maintenance funds are periodically used to finance labor-intensive employment-generation programs.
In terms of local roads, with a few exceptions, there are no expenditure recording and information systems in LGUs to provide reliable estimates on maintenance spending or road conditions. The 2003 study by ADB10 indicates that spending on the pres-ervation of the 172,000 km local road network is only one-quarter of estimated requirements. Expenditures on maintenance of local roads were about P18,000 per kilometer in 2002, significantly lower than the required P80,000 per kilometer.
Inadequacies in the road network The increasing levels of congestion reflect both demand management and infrastructure limi-tations. Investment in the upgrading and expansion (including extension) of the network has been low. The required investment in new capacity to sustain a 4% economic growth rate would be around 1.25% of GDP, or significantly higher than the current investment rate of 0.7% (see section above, “Road expenditures and financing”). The current government inclination to freeze the national road investment budget at its 2003 level through 2009 would result in significantly lower levels of investment as a share of GDP. This may be withstood by a country for a year or two but cannot be sustained for a long period without adversely affecting growth. The fast-growing countries in the region are investing over 2.5% of GDP in road capacity expansion alone.
Only about 80% of arterial national roads are paved, even though paving all arterial roads is generally well justified on economic and social grounds as they carry sufficient traffic volumes and are essential for linking the provinces to the country’s various economic growth centers and facilities. However, the implementation of several foreign-assisted road projects has been delayed due to the lack of counterpart financing. In addition, the construction of some key toll roads has been delayed
by financial problems facing the sponsors, difficulties with right-of-way acquisition, and in some instances, the unwillingness of the concessionaire to invest in extensions after receiving a concession to operate an existing section and build a new one.
There is also an increasing need for roads bypassing towns to overcome significant reductions in travel speeds and to reduce the rates of traffic accidents and casualties in these towns. In some cases, the benefits of a road network are not fully realized due to missing links and lack of intercon-nection of some expressways.
Causes of poor asset preservation and inadequate road network Two main factors account for the unsatisfactory preservation of road assets and inadequacies in road network development. First is the weak institutional, policy, and governance frameworks as well as poor capacity of the sector, including poor governance and corruption, which lead to inefficient resource utili-zation. Second is the relatively low level of contri-butions by the government and the private sector to road investment and maintenance.
Weak institutional, policy, and governance frameworksAt the national level, this can be discussed under four areas: weak commercial orientation of DPWH; corruption; lack of clear direction by the Road Board; and overstaffing at DPWH. First, DPWH has been slow in implementing the institutional reforms to give it a greater commercial orientation. Although the development of the technical systems necessary to reengineer the internal business processes of DPWH is progressing, and will result in more transparency and better resource utilization, there has been no progress in converting DPWH into a commercially oriented National Roads Authority. Without further progress on commercialization, there is a high risk that the potential benefits of the technical reforms will not be realized. The high-level multiagency oversight group that was to be established to monitor and drive the reform process has still not convened or taken control of the reform.
Second, the public regards DPWH as one of the worst agencies in combating corruption and, as the results of the 2004 Social Weather Stations Enterprise Survey25 indicate, the perception had further worsened over the previous two years. In addition, a manifes-tation of the weak governance framework of DPWH is the discrepancy between the surveyed length of national roads and the length used in planning the
WorldBankInfra.indb 157 12/6/2005 8:41:56 AM

1�� Philippines: Meeting Infrastructure Challenges
allocation of maintenance funds. Surveys carried out under the RIMSS Project indicated that the road lengths used for planning in the various regions were generally higher than actual surveyed lengths, and in one region the difference exceeded 20%. The lack of a strong governance framework in DPWH and in the government generally will result in inefficiencies that will add significantly to the cost of road provision.
Third, although the administrative order was made in early 2003, the Road Board secretariat was only established in mid-2004 after long delays in autho-rizing the staffing and budget status. Without the focused guidance of the secretariat, the Road Board runs a risk of developing objectives and processes that are heavily influenced by the political process and that conflict with many reform objectives.
Fourth, out of 35,000 employees at DPWH, about 60% are allocated to roads. This translates into 1.3 km of national roads per employee compared with about 10 km in Indonesia, for example.
At the local level, the weak institutional, policy, and governance frameworks are exemplified in the fact that only a few LGUs have prioritized investment programs and that spending is not according to a plan. In many cases there appears to be very little systematic planning as to how funds are allocated and no formal analysis of investments or prioriti-zation based on efficiency criteria. The devolution of responsibilities to LGUs was not accompanied by building their planning, technical, and imple-mentation knowledge and skill base. Planning and programming, in particular, are the weakest points in the project management cycle.
Resources for investment in local roads come from different sources with little coordination and performance incentives among them. These include the Department of Agriculture, the Department of Agrarian Reform, LGUs, and the congressional funds. The departments finance farm-to-market roads. These road investments are typically conceived in the context of an agricultural or irrigation project and not as part of an overall road development plan. Moreover, little attention is typically paid to the maintenance requirements or sustainability of these roads.
DPWH receives a budgetary allocation from congressional funds for local roads. This amount varied between 19% and 30% of DPWH’s budget and averaged about P3.9 billion over 1997–2001. It exceeds total maintenance expenditures of all local roads and is slightly less than maintenance spending on national roads.
Low level of contributions by the government and private sectorAt the national government level, the increasing government deficit resulted in a reduction in the budgetary resources committed to the road sector over 1998–2002, both in real terms and as a share of GDP. More important, the share of the road sector in the national government budget declined over these years, indicating that the sector has borne a larger share of the government deficit. Nevertheless, budgetary resources to the sector are likely to increase once the fiscal deficit is reduced and efficiency of the sector in resource utilization is enhanced.
Private sector participation in the Philippines started in the road sector in the 1970s but interest has waned since, despite the enactment of the BOT Law and its amendment in the 1990s. In the last decade, only four BOT agreements were concluded, one of which never started, two are stalled after completion of a phase, and the fourth was completed in 2004.
The interest and contribution of the private sector to investment in the road network have been low for several reasons. The inability of the private sector to come up with the necessary financing and the problems and costs associated with acquiring rights-of-way help explain its low investment in toll roads. Another reason is the weak institutional setup associated with the two-in-one public-private part-nership model (discussed in box 8.1 above). Under this model, a concessionaire receives a completed phase 1 of a road project to build an additional phase and to operate and maintain both phases. While the model itself is feasible, without the necessary safeguards in place it has been possible for conces-sionaires to operate phase 1 without carrying out the necessary investment in the ensuing phases.
Of 16 road projects being monitored by the Metropolitan Manila Development Authority, a special administrative body under the Office of the President created to coordinate services common to 17 LGUs of Metro Manila, 11 are encountering right-of-way problems. A law enacted in 2000 to facilitate the acquisition of right-of-way for infra-structure projects has had little impact so far. The delays are due to problems with the identification of the beneficiaries and valuation, which often result in lengthy court proceedings; reluctance of the government to use its power of eminent domain (compulsory purchase) and reliance on negotiation; and complexity arising from the need to deal with more than one LGU.
WorldBankInfra.indb 158 12/6/2005 8:41:56 AM

Chapter 8 Roads 1��
The uncertainty surrounding the investment climate and the legal environment also contributes to the low level of private sector investment. In the past, collection of tolls has been stopped by court injunction; toll rates have also been rolled back by presidential order. The Toll Regulatory Board (TRB)—the economic regulator for toll roads—is made up of the secretaries (or their representatives) of DPWH, DOTC, and the Department of Finance, as well as a private sector representative. The compo-sition of the group calls the autonomy of the TRB into question. Moreover, the TRB is a party to road concession agreements in which it can adjudicate. A positive sign recently, though, is that the Department of Justice denied to the TRB control of awarding service facility contracts inside expressways.26
The MVUC has been instituted and road users are paying a proportion of the cost of using the roads. Nevertheless, a large share of the cost of road maintenance and provision is not paid by users. The discussions in earlier sections demon-strated the benefits of higher-quality roads and less congestion. Comparisons with other countries in the region have indicated a significantly higher cost of passenger travel and freight movements in the Philippines than, for example, Vietnam or Thailand. Road users, in general, are likely to be willing to pay more for the use of roads once they are aware of the benefits and, more important, if they are assured that the funds they contribute will be invested in the road network.
Road safety and vehicle overloading Road safety The section “Sector performance,” above, provided some statistics as to how the Philippines compares to other countries in terms of road safety. The local study carried out by Ricardo Sigua estimated that road accidents and fatalities cost the economy as much as $894 million in 2002, or over 1% of GDP. While some general good road safety measures and policies exist, there is no comprehensive strategy for road safety, and enforcement is weak. The main obstacles to solving this problem do not have much to do with efficiency or shortage of funding as much as the lack of perception of its gravity. While the Phil-ippines may compare somewhat favorably to other countries in the region in terms of road accidents and fatalities (although statistics in this area tend not to be very reliable in many countries), investment in road safety measures can be easily justified on the basis of their high economic and social returns.
Vehicle overloading Vehicle overloading remains a problem. A study27 by the RIMSS Project carried out in Batangas and Cebu showed high costs to the Philippine economy (both user and agency costs) as a result of overloading. Overloading results in faster deterioration of the road network, contributing to the country’s high vehicle operating costs. This in turn adversely impacts all road users and, moreover, would require maintenance sooner and more frequently than originally planned. Based on the study by the RIMSS, the cost of over-loading estimated over a 15-year period is about P104 million a kilometer of roads in Batangas and P43 million a kilometer of roads in Cebu. The cost of overloading in the case of Batangas would have been higher had the road not been designed for larger loads. DPWH has raised the ceiling of the maximum single axle load to 13.5 tons. This, however, has not stopped overloading. In addition, the permissible load is likely to be too high for many of the roads that have weak pavements.
The problem of vehicle overloading is not unique to the Philippines, and is quite common in many developing countries. Two main reasons for over-loading are ineffective and weak enforcement of the relevant regulations, and lack of sufficient (and functioning) weighbridges in vehicle inspection stations. Attempts over the years to deal with over-loading by strengthening enforcement and by adding new weighbridges have not borne much fruit. Given the prevalence of overloading and the poor track record in controlling it, it may be practical to start considering second-best solutions that acknowledge the existence of overloading. Comparing the costs imposed on DPWH and road users as a result of truck overloading to the costs of designing and building the roads to higher standards that can withstand the higher axle loads (while observing road safety codes) would help determine whether it may be advisable to design the roads for higher axle loads or not.
Recommendations
Underpinnings of the reform strategies The main objectives of the reform strategies are to enhance the efficiency of the road sector in the Phil-ippines and to increase the sector’s effectiveness in promoting sustainable economic growth and compet-itiveness, while also providing adequate, all-year, reliable, and safe access throughout the country. The underpinnings of the government’s strategies should
WorldBankInfra.indb 159 12/6/2005 8:41:56 AM

1�0 Philippines: Meeting Infrastructure Challenges
be to increase efficiency in the utilization of scarce government resources, and commercialize the road sector. Better resource utilization primarily requires improvements in planning, prioritization, and governance. Commercializing the sector addresses issues of: raising more funds from the users following the “user pays” principle; involving the private sector in the financing of toll roads; managing resources through the Road Board; and establishing an autonomous National Roads Authority.
The creation of a commercially oriented road sector with increased participation from the private sector in terms of both management and financing requires a strong partnership between the private and public sectors. In this partnership, the public sector is to play the lead role in developing good plans, in ensuring efficient utilization of its scarce resources, and in providing an enabling environment for the participation of the private sector. These objectives can be met by realigning policies according to principles of sound economic management, strengthening institutions, building capacity, developing a strong governance framework and culture, and weeding out corruption.
Practical approach to the reformsThe proposed way forward for the road sector involves short-term (up to three-year) actions as well as medium-term initiatives. Over the next three years, two critical factors will restrict the scope of proposed government actions. The first is that very limited, if any, additional funding from the national government beyond current spending levels can be expected due to the government’s tight fiscal position. The second factor is that any short-term action should not require the initiation of any new legislation. The longer-term plan should reflect the relaxation of both of these constraints. Finally, a distinction needs to be made between the time necessary for the successful completion of a reform and the time required to start it. While the successful accomplishment of many institutional reforms requires years, there is no need to delay their initiation.
Broad directions to move forwardIncreasing efficiency and commercialization entails completing a series of critical actions. These actions can be sequenced according to the degree of imple-mentability, starting with governance measures that are largely within the control of DPWH. Once results are seen, the government may intensify the reform package by focusing on actions that require a great
deal of political buy-in across many stakeholders, including the legislature.
The key recommended actions are therefore grouped and can be implemented in the following order (table 8.20).
Improving governance and accountability of DPWH spending
Establish accountability for results of road spending at the district and regional levels. Spending for both capital and maintenance items should be guided by network requirements, defined by district offices that are to be held accountable for measurable outputs. Performance-based maintenance is one area where the concept of accountable spending can be applied in a practical manner. Information on the investment require-ments for new roads in the network and mainte-nance needs are now systematically generated by the methodologies and systems developed by the RIMSS and should be the basis for allocations to capital and maintenance projects carried out by district and regional offices of DPWH.
Prioritize spending based on major final output criteria. Political intrusion in public works deci-sionmaking should be minimized, if not elimi-nated. This could be achieved by fully utilizing the system-wide technical analysis of investment and maintenance needs now put in place by the RIMSS. By strengthening the technical base for decision-making within DPWH, the annual budgets for road building and maintenance spending can be fully justified and work plans of various units adequately supported. DPWH should start a serious application of the multiyear programming and scheduling system, the bridge management system, and the pavement management system developed under the RIMSS, in defining its capital and expenditure programs.
Ensure better coordination among DPWH and other national agencies (such as the Department of Agriculture and the Department of Agrarian Reform) and local government agencies in the identification and prioritization of local roads. This will contribute to greater efficiency in road spending.
Reduce costs and increase transparency in procurement. The procurement reforms initiated within DPWH should be accelerated. Many of
•
•
•
•
WorldBankInfra.indb 160 12/6/2005 8:41:57 AM

Chapter 8 Roads 1�1
Table 8.20Road sector recommendations
Issue Actions for the short term (less than 3 years)
Actions for the medium term(3–5 years)
Improving governance and accountability of spending at Department of Public Works and Highways (DPWH)
Establish accountability for results of road spending at district and regional levelsPrioritize spending based on major final output criteriaReduce costs and increase transparency in procurementApply the same efficiency and transparency principles to congressional funds projects
•
•
•
•
Implementing structural changes in the road sector
Rightsize DPWH staff levelsOperationalize Road Board to ensure stakeholder oversightEnlist support from oversight agencies to monitor and drive the road sector reform process
••
•
Establish a commercially oriented National Roads AuthorityOptimize road network: redefine primary and secondary roads
•
•
Placing greater reliance on user charges to support sector needs
Expand toll road coverage and charge appropriate level of tolls
• Increase user charges through the fuel levy
•
Improving private sector participation
Resolve impediments to toll road concessionsIncrease use of performance-based maintenance contractsAnalyze obstacles in implementing the law on right-of-way acquisition (RA 8974) Use open competition as preferred method for project selectionLimit role of Toll Regulatory Board to economic regulationDevelop a strong pipeline of road projects that could readily lend themselves to private sector participation
••
•
•
•
•
Improving management of road use to protect lives and road assets
Ensure effective control of axle loadsDevelop a road safety strategy
•
•
the required actions are fully within the control of DPWH: full disclosure of relevant information (e.g. bid documents, bid results); simplification of evaluation criteria; speeding up the review process (in the bid committees); institutionalization of outside oversight of the bid process (for example, by involving civil society representatives in bid committee proceedings); and speedy prosecution of erring DPWH officials and contractors. Lifestyle checks28 on public sector personnel can be inten-sified, not only to expose corrupt staff and officials but to deter rent-seeking behavior in DPWH.
Apply the same principles of efficiency and transparency, as applied to DPWH, to projects financed by congressional funds. The efficiency
•
of use of congressional funds could be signifi-cantly improved if they were linked more closely to local development priority plans and normal standards of design and economic analysis, as would be done for programmed projects in DPWH. Congressional funds projects should be subject to the same system of prioritization, rationalization, and transparency that is to be carried out in DPWH.
Implementing structural changes in the road sectorThere has been considerable progress, despite some delays, in developing technical systems as part of the reforms of the internal business processes of DPWH, but the associated institutional reforms have lagged far
WorldBankInfra.indb 161 12/6/2005 8:41:57 AM

1�� Philippines: Meeting Infrastructure Challenges
behind. The success of the technical reforms (known as the reengineering of DPWH’s business processes) will not have the desired impacts without the supporting institutional framework and administration. Conse-quently, there is an urgent need to focus reform efforts on implementing institutional changes so as to bring these reforms much closer to fruition. More specif-ically, this would involve the following:
Rightsize DPWH staff. With a very high staff-to-kilometer ratio, overstaffing at DPWH is seriously undermining the reform effort. Various proposals have been put forward and decisions now need to be made to bring the department to a size adequate to perform its core functions, while other responsibilities are slowly shed from DPWH through contract arrangements or transferred to other agencies. Options discussed during some earlier attempts of civil service reorganization include deactivating the Bureau of Maintenance, reducing the workforce in the regional offices and district engineering offices, and transferring the management of the equipment pool from the Bureau of Equipment to the 16 DPWH regional offices.DPWH management can take advantage of the bureaucracy-wide streamlining effort governed by Executive Order 366 of 2004 to initiate the rightsizing program for DPWH. This executive order directs all government agencies to shed redundant functions, restricts recruitment of new staff, and offers opportunities for early retirement to affected staff.
Operationalize the Road Board to ensure stake-holder oversight. Setting up and empowering the Road Board secretariat and strengthening the Road Board’s control over use of funds through well-defined ownership and oversight of the SRF should be carried out as a matter of urgency. The main purpose of the Road Board is to act as a “client” requesting services from DPWH (the service provider), for planning and undertaking the maintenance of national roads according to set standards. Recent experience has shown that there is a risk that the Road Board might not perform its responsibilities and that the SRF might be diverted to other uses. It is important to strengthen the safeguards against the diversion of resources from the SRF and to ensure their disbursement as scheduled. Auto-matic releases from the SRF could help ensure
•
•
both the continuous flow of funds and their use for their earmarked purposes. Strengthening transparency in decisionmaking, monitoring, and reporting, and enhancing the role of road users in the oversight of the SRF are ways to reduce the probability of diversion of funds.
Optimize the road network: redefine primary and secondary roads. The ongoing reclassification of secondary national roads into lower-level local roads should be accelerated, to enable DPWH to better focus on the management of the core arterial roads. Most of the secondary national roads do not perform the strategic function that warrants their classification as national roads. Reclassifying them and reducing national roads to a core network of about 18,000 km would make the resources available for maintenance of the national roads adequate. With LGUs being given additional roads in the reclassification, this will likely require extra transfers from the national government to LGUs. It would also be necessary to strengthen LGUs’ capacity to manage existing road assets and to develop a simple information database for existing roads and their condition, as a step toward effi-cient management. In this case, DPWH is an ideal candidate to play a central role in building the capacity of LGUs in road management.
Establish a commercially oriented National Roads Authority. One of the government’s objectives in its 2001–2004 MTPDP was the development of an autonomous and commercially oriented National Roads Authority. The rationale for this is to increase the efficiency of the sector and its responsiveness to the demands of road users. Actually establishing an authority entails vertical separation of DPWH’s activities between road-related activities and non-road-related ones, as well as horizontal separation between the client and service provider functions. The vertical separation would allow the authority to focus exclusively on the management of the national road network and would also allow for easier monitoring of resource use. The horizontal separation is intended to create accountability of the authority to road users. One mechanism to ensure the creation of this accountability is rigorous oversight by road users. The ideal body to which a transformed DPWH would report is the existing Road Board. The argument for one oversight body for both road investment and
•
•
WorldBankInfra.indb 162 12/6/2005 8:41:57 AM

Chapter 8 Roads 1��
maintenance activities is clear if one considers the need for close coordination between the two in planning and the trade-offs between the two in investment decisions. The realization of the National Roads Authority envisaged by the government would entail the proposed high-level multiagency oversight group and DPWH agreeing on a transformation plan for DPWH’s transition to such an authority and to expand the purview of the Road Board to cover investment in new capacity. While the actual transformation is likely to require legis-lative action and cannot be accomplished in the short term, work on developing the plan and on implementing certain aspects of it can start straight away.
Enlist external support to monitor and drive the road sector reform process. Due to the mixed incentives facing agencies undergoing reform, these bodies almost always offer some resistance. Support from oversight agencies, such as NEDA, the Department of Finance, and the Department of Budget and Management, to DPWH will be critical to hasten the reform process. The assis-tance can be in the form of formal confirmation of the DPWH plans and programs (through the MTPIP process), in turn indicating commitment to the financing of its priority programs. Helping DPWH insulate its investment decisionmaking processes from political intrusion is another form of support that the oversight agencies can provide. Finally, the key oversight agencies should help the Road Board perform its mandated role by making sure it receives the funding it needs (as defined by law).
Placing greater reliance on user charges to support sector needs
Increase user charges through the fuel levy. The link between user payments and provision of roads through augmenting the receipts of the SRF with revenues from the fuel levy requires further strengthening. Expanding the SRF’s revenues by an increase in the fuel levy would be easier if road users could clearly see that the revenues from the MVUC were being invested in the maintenance of national roads. Given that the annual inflow from the MVUC and the potential receipts from the fuel levy are unlikely to be suffi-cient to cover maintenance costs, and given the uncertainty of receiving funds for maintenance
•
•
from the national government in view of the fiscal situation, it would be advisable to pursue (as a second stage to the fuel levy) an amendment to the MVUC Law to raise rates on loaded trucks (which are currently set too low) and to allow for annual indexation of the MVUC to the consumer price index. The government could also consider increasing the fuel levy and earmarking the additional revenues to the SRF. While fuel prices in the Philippines are comparable to those in most other countries in the region, vehicle operating costs are signifi-cantly higher, hence impeding the efficiency and competitiveness of the economy. Consequently, while a carefully designed increase in fuel price is likely to make fuel more expensive than in most regional neighbors, such an increase could be offset by a reduction in vehicle operating costs due to improved road conditions, provided that the additional revenues from the levy are invested in the road sector.
Expand toll road coverage and charge an appro-priate level of tolls. User charging is specifically applied to toll roads for a discrete section of a road network. Revenues from toll roads are mostly used to pay for the cost of building, maintaining, and operating that specific section. Widening toll road coverage is thus one way of expanding the area of responsibility of road users in the upkeep of road networks.Appropriate toll levels should be levied to reflect the cost of improvements (in road conditions and reduced travel times), as in the case of the redevelopment of the NLEX, which resulted in a 400% increase in toll rates. Some resistance to contractually agreed toll rates is inevitable, sometimes leading to political intervention and eventual rollback in toll fees. Such actions can send a negative signal to potential investors. The government has so far resisted attempts, as in the case recently of the NLEX, to intervene in tariff setting. If it continues to do so, this will encourage greater private sector interest in toll road projects. The government should launch a public awareness campaign to better articulate the benefits of appropriate levels of toll rates.
Improving private sector participationResolve impediments to toll road concessions. The commitment of the government to resolving outstanding issues in toll road agreements would
•
•
WorldBankInfra.indb 163 12/6/2005 8:41:57 AM

1�� Philippines: Meeting Infrastructure Challenges
provide a positive signal to local and foreign investors and help attract private sector partici-pation in the construction and operation of toll roads. Focusing on a few toll roads (SLEX, and phase 2 of STAR and the MCTE, for example) may provide the necessary signals. Greater attention to due diligence aspects in the choice of project sponsors and in the quality of contracts will greatly reduce risks of stalled toll projects such as STAR (whose contract does not give a time frame for securing financing). Giving priority to the 8 km section connecting the SLEX to the STAR (box 8.1 above) would ease the flow of traffic in this area and would in turn enhance the financial and economic viability of expressways, including STAR.
Increase use of performance-based maintenance contracts. In line with DPWH’s reengineered business processes, road maintenance should increasingly be allocated to service contractors. Output-driven contracts are likely to be more efficient than the traditional DPWH-run main-tenance programs in that payment to the private sector maintenance contractor is based on performance rather than on quantity of inputs. Furthermore, private firms under performance-based contracts tend to be more conscious in keeping maintenance costs low than a typical DPWH district engineering office.
Analyze obstacles in implementing the Right-of-Way Law. As right-of-way acquisition remains a deterrent to private sector participation in toll roads, it would be beneficial to analyze the obstacles in implementing the law relating to right-of-way acquisition (RA 8974) enacted in 2000 and to propose practical solutions. According to this law, a deposit toward the cost of the land is sufficient ground for the courts to grant possession of it while the case is pending. However, a deposit presupposes a budget, which is not available well in advance of project construction. This problem could be overcome if DBM were able to release the funds when such a deposit is required.
Use open competition as the preferred method for project selection. Unsolicited bids frequently subject the government to bear guarantees that
•
•
•
it would otherwise not make under a competitive bid. Doing so can create an added fiscal burden to an already worrisome fiscal position. Unso-licited proposals, if considered, should be subject to especially rigorous analysis and monitoring. Conversely, the government should develop a strong pipeline of road projects that could readily lend themselves to private sector participation to reduce any resort to unsolicited proposals. Ideally, feasibility studies and detailed designs should be carried out with public sector resources to ensure a more level playing field during the tendering process. An explicit indication of priority by the government to the projects lined up for possible private sector implementation will lend credibility to the process and demonstrate the government’s commitment to these projects.
Limit the role of the TRB to economic regu-lation. As regulator, it should not be involved in the development of toll roads or the award of franchises.
Improving management of road use to protect lives and road assets
Develop and implement a road safety strategy. Some of the immediate interventions ought to be for high-risk roads and blind spots where the reduction in fatalities and injuries would be large. There is also a need to develop a strategy for sustainable road safety, and to identify a lead agency to coordinate the efforts.
Manage vehicle overloading through effective control of axle loads. Irrespective of the permissible axle loads, some level of enforcement is necessary. More effective control could be achieved by involving road users in the management of vehicle inspection stations and by focusing inspection on key roads for freight movement where over-loading is common. In Sumatra, Indonesia, a pilot project for controlling truck overloading using performance pay schemes and involving the private sector in managing weigh stations with the government is producing positive results, but has not been in operation long enough to prove sustainable. It would be worthwhile in the Phil-ippines to test different programs for enforcing load limits, given the heavy cost that overloading imposes on society.
•
•
•
WorldBankInfra.indb 164 12/6/2005 8:41:57 AM

Chapter 8 Roads 1��
Endnotes1 National aid roads were local roads with full or partial funding
from the national government.2 The Local Government Code stipulated that maintenance of
barangay roads be transferred to barangays, but was not clear on their construction. The current practice is that cities and municipalities finance the construction of barangay roads contingent on the approval of proposals submitted by the barangays.
3 While investment in national roads was exceptionally high in 1999, there was still a 30% drop in the real investment expendi-tures between 2000 and 2002.
4 Since the work on the NLEX and a large section of the first phase of the Skyway were redevelopment of existing expressways, there was a limited need for right-of-way acquisition.
5 Investment by LGUs in local roads was taken as 70% of their total investment in transport.
6 Interview with DPWH officials. 7 GDP growth assumptions based on the “baseline” projections by
the International Monetary Fund. GDP growth rates have been projected to drop from 4.5% in 2004 to 3.4% in 2009, averaging 4% per annum for the six-year period.
8 JICA. “The Development of the PPP Technique of Metro Manila Urban Expressway Network.” 2003.
9 Based on interviews with project proponents and DPWH officials.
10 ADB. 2003. “Rural Roads Development Policy Framework.” Manila. November.
11 World Bank estimates based on data from Scott Wilson Kirk-patrick & Co. Ltd in Association with Cesar Virata & Associates Inc. 1999. “Better Roads Philippines.” DPWH. April.
12 The estimate is based on a formula developed by the World Bank to give orders of magnitude. According to this formula, investment needs for the road sector would be around 0.25% of projected GDP growth.
13 Conducted from November 2003 to January 2004. Downloadable from www.tag.org.ph/survey/default.htm.
14 The percentage of all (rather than national) paved roads is some-times used as a measure of quality but this can be misleading and has to be interpreted with caution. For low-traffic volumes,
well-maintained gravel rural roads can be of the desired standard and quality.
15 DPWH-RIMSS. 2004. “Implementing a New Road Classification System in the Philippines.” DPWH, Manila.
16 DPWH-RIMSS. 2004. “Executive Information System.” DPWH, Manila.
17 Scott Wilson Kirkpatrick & Co. Ltd. 1999. “Better Roads Philip-pines.” DPWH. April.
18 DPWH-Project Management Office Feasibility Study. 2003. DPWH, Manila.
19 Ricardo G. Sigua. “Scale, Characteristics and Costs of Road Accidents in the Philippines.” Presentation at the 12th Annual Transport Science Society of the Philippines Conference, July 23–24, 2004. University of the Philippines, Diliman.
20 DPWH-JICA. 2003. “Mini Master Plan Study on Bypass Roads Along the Arterial Road Network.” Manila.
21 Information from Directorate General of Regional Infrastructure of Indonesia, 2004.
22 The Freeman News. Cebu. June 12, 2004.23 JICA. 2003. “Public-Private Partnership Study of Metro Manila
Urban Expressway Network.” Manila.24 Gerhard P. Metschies. 2005. International Fuel Prices, 4th Edition.
Deutsche Gesellschaft für Technische Zusammenarbeit (www.internationalfuelprices.com). The “normal” price includes the cost of crude oil, refining, distribution, and a 10–20% sales tax.
25 Conducted from November 2003 to January 2004 (www.tag.org.ph/survey/default.htm).
26 Secretary of Justice Opinion 30 of 2004, “On the request of the DOTC regarding the authority of the TRB to enter into service facility and utility agreements involving gas stations, pipelines and cables along and inside the expressway” (www.doj.gov.ph/words_2004.html).
27 Report from RIMSS. 2004. “Impact on Pavements and Road User Costs of Truck Overloading.” June. DPWH, Manila.
28 Investigating whether public bureaucrats and officials’ lifestyle or manner of living can be explained by their salaries. Leading an extravagant lifestyle that can hardly be provided by a public servant’s salary is one indicator that wealth might have been accumulated illegally.
WorldBankInfra.indb 165 12/6/2005 8:41:57 AM

Romeo Gacad/Agence France-Presse
WorldBankInfra.indb 166 12/6/2005 8:42:00 AM

Chapter 9
Telecommunications
Overview
The telecommunications industry in the Philippines has a unique history. Unlike those in most of its neighbors, the country’s telecoms
sector has been dominated by a single private sector operator, the Philippine Long Distance Telephone Company (PLDT), for decades. Another difference is the long-term existence of a telecoms regulatory body, the National Telecommunications Commission (NTC), which has been responsible for sector regulation in various forms for more than 30 years.1 However, like most of its neighbors, the Philippines for many years suffered from poor telecoms availability throughout most of the country.
In 1988, the government recognized that the sector was essentially moribund, with very limited rural services, and long waiting lists for services throughout the country. There were only 591,000 telephone lines nationally, and hundreds of municipalities were without any telephone services whatsoever. The monopoly incumbent had failed to provide services in much of the countryside, concen-trating its investment in the major urban centers. Moreover, the scores of smaller telephone companies operating primarily in rural areas lacked the capital to expand their networks and services.
To address these problems, the government initiated a series of legislative and executive actions aimed at introducing competition to the sector, and at removing the government from the sector as an operator. These initiatives have led to significant progress, now marked by a multi-operator envi-ronment in all market segments, an increase in telephone penetration rates, and particularly dramatic growth in the availability of cellular services throughout the country.
The prime thrust of Philippine government tele-communications policy has been, since 1987, to create a regulatory and policy environment in which the private sector plays the lead role in telecoms devel-opment and expansion. The National Telecommuni-cations Development Plan for 1991 to 2010, published by the Department of Transportation and Commu-nications (DOTC) in 1990 stated:
The efficient and rapid growth of the telecommu-nications sector requires the maximization of the role of the private sector, with the Government acting as the facilitator. Accordingly, the Government shall initiate further improvements to the policy and regulatory environment and privatize government telecoms assets and/or operations as soon as practicable.
This policy theme has been repeated often in legislation and policies relating to both telecommu-nications and information and technology (together, ICT) development. The National Telecommunications Development Plan set out growth targets for the sector, including teledensity (3.5 per 100 population by 2010), public calling office (PCO) distribution (100% of municipalities by 1997), and a series of related investment and operational targets.
The teledensity target has been exceeded by a huge margin, as have the various forecasts of sector investments. Conversely, the PCO distribution target has been missed by a large margin, primarily because of the focus on urban areas by all of the carriers in the sector, and approximately 35,000 barangays out of a total of 42,000 have no telephone services.2 Further, there are still many municipalities in rural parts of the country that lack access to basic telephone services, and even more that require upgrades to bridge the
WorldBankInfra.indb 167 12/6/2005 8:42:00 AM

1�� Philippines: Meeting Infrastructure Challenges
“digital divide,” through the provision of access to Internet services. Cellular wireless services are not yet easily used for Internet access for such applications as education and health care, and while wireless technology is expanding rapidly in the country as elsewhere, wireless service is only available to some 41% of the nation’s barangays.
There is still a serious shortage of basic services in many parts of the Philippines. NTC has succeeded in motivating some expansion to rural and remote areas, but such expansion has now slowed to a trickle, and new thinking is required to finish the task.
Despite significant progress in the sector, several challenges remain. Four main priorities for the government have emerged:
Systematically review initiatives that were imple-mented to achieve adequate distribution of basic telecoms and information services throughout the country, and adopt and implement a new approach to providing universal access. Bring about more dynamic competition in the sector by putting in place more open market-entry arrangements and mechanisms for increasing customer choice at the local service level.Review the institutional structure of the sector, with a view to increasing regulatory credibility and to better defining the operational role of government in the sector. Review and revise radio spectrum management policies and processes to promote efficiency in spectrum use and utilization of new wireless technologies.
Policy and institutional framework
Until recently, telecoms policy was the responsibility of DOTC, with the prime assignment falling to the undersecretary for communications. Executive Order 269, issued by President Arroyo in January 2004, estab-lished the Commission on Information and Commu-nications Technology (CICT) to be the “primary ICT policy, planning, coordinating and implementing, regulating, and administrative entity” of the executive. The CICT is therefore the policymaking body, and NTC reports to the CICT chair, as does the Telecom-munications Office (TELOF). TELOF has historically been tasked with providing telecoms services in areas not served by private sector operators.
Although many new private sector entrants are now in the sector, TELOF continues to play a
•
•
•
•
role, operating a marginal service in many parts of the country, despite the government’s efforts to privatize all telecoms operations and reduce or eliminate the costly, inefficient operation that is TELOF.3 Government figures indicate that TELOF incurs significant annual operating losses, amounting to some $17 million in 2001. Reports indicate that these losses are primarily due to overstaffing and that the current level of 5,000 personnel could likely be reduced to 1,000 without seriously impacting service levels. The problem of how to mitigate the effect on current employees is clearly difficult, and there is also the problem of finding a suitable replacement for TELOF, which provides services in areas where no private operator has expressed any interest in operating. The privatization of government facilities has been on the government’s agenda for years, and clearly requires attention and the cooperation of the telecommunications industry, although the fact that Executive Order 269 reaffirms the existence of TELOF in the government’s plans appears to run contrary to this policy.
The National Economic and Development Authority (NEDA) is responsible for overall government development planning. To the extent that NEDA is concerned about the development of infrastructure as an important element of economic growth, this agency has, from time to time, influenced the direction of telecoms policy. In particular, NEDA has regularly published macroeconomic outlooks for the country. The Medium-Term Philippine Development Plan 2004–2010 (MTPDP) provides an assessment and broad policy guidance on infra-structure development in the ICT sector.4
RegulationRegulation of the sector falls to NTC, which is also responsible for radio spectrum management and regulation of the activities of the broadcasting sector. NTC commissioners are appointed by the adminis-tration “at pleasure” and are not tenured. There have been numerous dismissals of commissioners in recent years, and with each change of administration all commissioners are usually replaced. The credibility of NTC can be greatly improved and made more stable if appointment of the commissioners is based on certain professional criteria and the process is more transparent. A regulator that is protected from political interference is fundamental to stability in a sector that is a vital part of the economic progress of the country.
NTC is a source of revenue for the government,
WorldBankInfra.indb 168 12/6/2005 8:42:01 AM

Chapter 9 Telecommunications 1��
through the generation of significant fees from its supervisory and licensing activities—that is, regulatory fees are not set on a pure cost-recovery basis. For example, during fiscal year 2002, NTC had total revenues of over $25 million, with a budget allocation of approximately 10% of these revenues. However, even though NTC generates revenues far in excess of its costs, it has no financial independence, as all revenues accrue to general government funds, and it must rely on annual appropriations. Moreover, as a government agency, NTC’s entire staff is paid at the same (low) level as other government entities, such that it finds it very difficult to recruit or keep staff with the necessary qualifications. Compensation levels so far below those of industry counterparts are a source of ongoing difficulty.
Supervision fees are far in excess of the cost of such supervision, and government doubtless sees this revenue as important to overall fiscal needs. However, these fees could be put to use in more creative ways, as the surplus could, for example, be used to fund either expansion of services to rural parts of the country or other telecoms objectives prioritized by the government. These fees could also be used to fund a more effective regulatory function, including providing adequate equipment and keeping qualified staff.
Market entryAll telecoms operators must obtain a legislative franchise from Congress. This is unlike regulatory and policy frameworks in most countries, in which the regulatory body issues licenses, pursuant to a national policy favoring new entry into a competitive market.
The process of obtaining a congressional franchise is often tortuous and unpredictable. There is no national policy regarding the number or nature of franchises to be granted, and since, in essence, a franchise is a “law” like any other instrument of government, it is subject to the energy of the poli-ticians (including the president, who must ultimately sign the law) supporting the aspiring entrant. It is clearly a highly political process, and in recent years various dominant financial players in the Philippine business sector have attempted to find a niche in the telecoms market, exploiting their political strengths. To the extent that the telecoms market today has many players in all segments of the marketplace, it is unlikely that further congressional activity will be undertaken by putative entrants. The powerful interests now in the market would likely have sufficient political influence to keep them out. The
likelihood of increased competition developing in the sector is closely related to the likelihood of Congress relinquishing its franchising powers.
In addition, a congressional franchise is insuf-ficient to allow a company to start offering services. The company must also obtain a license or certificate of public convenience from NTC before it can begin operations. This, too, has often proven difficult and time-consuming, since the processes adopted by NTC can result in litigious and lengthy deliberations. Finally, there are various local government (city, municipality, or barangay) permits relating to taxes and public construction that must be secured, often leading to further delays.
Legislative and regulatory initiativesThe government has taken various steps over the years to improve sector performance through the selective introduction of competition, coupled with service obligations for all players. The following are the highlights of the formal initiatives that have formed part of this process:
DOTC Department Circular 87-188 was issued in May 1987, and set out a series of policy state-ments from a government/industry committee, stating that the structure of the telecoms sector should be competitive, and dominated by the private sector.Executive Order 59 (Interconnection Policy) was issued in 1993, mandating interconnection of all authorized public telecoms carriers. The objective was a fully integrated nationwide telecoms network, and an environment that would encourage greater investment in the sector.Executive Order 109 (Policy to Improve the Provision of Local Exchange Carriers Services), issued in July 1993, required international gateway facility (IGF) operators and cellular mobile tele-phone system (CMTS) operators to provide (within five years) 300,000 and 400,000 local exchange lines, respectively, in unserved and underserved areas, including parts of Metro Manila. Known as the Service Area Scheme (SAS), it sought to establish at least one line in rural areas for every 10 lines installed in urban centers.Republic Act 7925 (Public Telecommunications Policy Act) was enacted in March 1995, and set out a policy framework for the sector. It also mandated the privatization of all government-operated rural telecoms facilities (operated by TELOF) within three years.
•
•
•
•
WorldBankInfra.indb 169 12/6/2005 8:42:01 AM
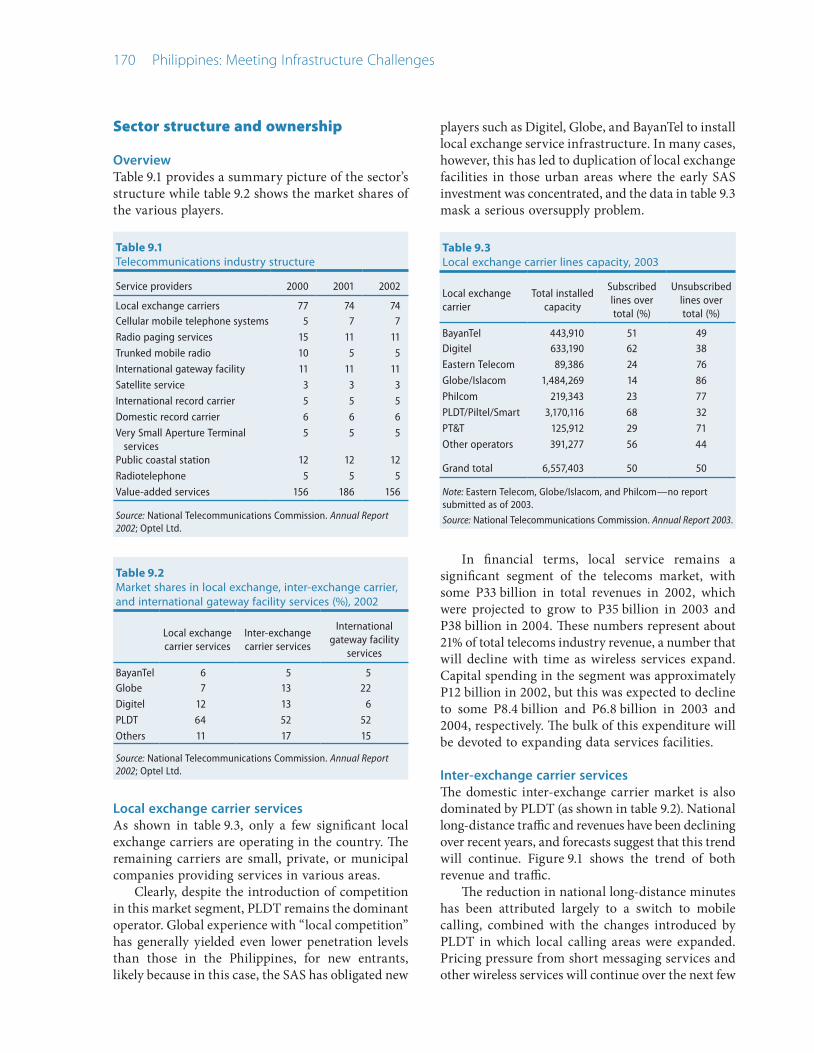
1�0 Philippines: Meeting Infrastructure Challenges
Sector structure and ownership
OverviewTable 9.1 provides a summary picture of the sector’s structure while table 9.2 shows the market shares of the various players.
Local exchange carrier services As shown in table 9.3, only a few significant local exchange carriers are operating in the country. The remaining carriers are small, private, or municipal companies providing services in various areas.
Clearly, despite the introduction of competition in this market segment, PLDT remains the dominant operator. Global experience with “local competition” has generally yielded even lower penetration levels than those in the Philippines, for new entrants, likely because in this case, the SAS has obligated new
Table 9.1Telecommunications industry structure
Service providers 2000 2001 2002
Local exchange carriers 77 74 74Cellular mobile telephone systems 5 7 7
Radio paging services 15 11 11
Trunked mobile radio 10 5 5
International gateway facility 11 11 11
Satellite service 3 3 3
International record carrier 5 5 5
Domestic record carrier 6 6 6
Very Small Aperture Terminal services
5 5 5
Public coastal station 12 12 12
Radiotelephone 5 5 5
Value-added services 156 186 156
Source: National Telecommunications Commission. Annual Report 2002; Optel Ltd.
players such as Digitel, Globe, and BayanTel to install local exchange service infrastructure. In many cases, however, this has led to duplication of local exchange facilities in those urban areas where the early SAS investment was concentrated, and the data in table 9.3 mask a serious oversupply problem.
In financial terms, local service remains a significant segment of the telecoms market, with some P33 billion in total revenues in 2002, which were projected to grow to P35 billion in 2003 and P38 billion in 2004. These numbers represent about 21% of total telecoms industry revenue, a number that will decline with time as wireless services expand. Capital spending in the segment was approximately P12 billion in 2002, but this was expected to decline to some P8.4 billion and P6.8 billion in 2003 and 2004, respectively. The bulk of this expenditure will be devoted to expanding data services facilities.
Inter-exchange carrier servicesThe domestic inter-exchange carrier market is also dominated by PLDT (as shown in table 9.2). National long-distance traffic and revenues have been declining over recent years, and forecasts suggest that this trend will continue. Figure 9.1 shows the trend of both revenue and traffic.
The reduction in national long-distance minutes has been attributed largely to a switch to mobile calling, combined with the changes introduced by PLDT in which local calling areas were expanded. Pricing pressure from short messaging services and other wireless services will continue over the next few
Table 9.3Local exchange carrier lines capacity, 2003
Local exchange carrier
Total installed capacity
Subscribed lines over total (%)
Unsubscribed lines over total (%)
BayanTel 443,910 51 49 Digitel 633,190 62 38
Eastern Telecom 89,386 24 76
Globe/Islacom 1,484,269 14 86
Philcom 219,343 23 77
PLDT/Piltel/Smart 3,170,116 68 32
PT&T 125,912 29 71
Other operators 391,277 56 44
Grand total 6,557,403 50 50
Note: Eastern Telecom, Globe/Islacom, and Philcom—no report submitted as of 2003.
Source: National Telecommunications Commission. Annual Report 2003.
Table 9.2Market shares in local exchange, inter-exchange carrier, and international gateway facility services (%), 2002
Local exchange carrier services
Inter-exchange carrier services
International gateway facility
services
BayanTel 6 5 5Globe 7 13 22
Digitel 12 13 6
PLDT 64 52 52
Others 11 17 15
Source: National Telecommunications Commission. Annual Report 2002; Optel Ltd.
WorldBankInfra.indb 170 12/6/2005 8:42:01 AM

Chapter 9 Telecommunications 1�1
years, and prices will move closer to costs, as in other jurisdictions. Innovative new service arrangements will doubtless be introduced, and if resale in telecoms services is allowed, it may become as prevalent as in other countries, where niche players can service some long-distance market subsegments effectively.
International gateway facility servicesAs table 9.2 above shows, PLDT dominates the inter-national gateway facility market as well. The average revenue per minute for international calling has declined over the past few years, due to competition and the impact of the so-called FCC benchmarking decision, which has forced settlement rates with US-based carriers to be sharply reduced. Current average revenue per minute for US traffic is in the range of $0.22 and is expected to move to about $0.18 over subsequent years.
The drop in rates has led to huge rises in call minutes, with volume growing from 900 million minutes in 1995 to some 6 billion in 2002. These increases in volume have not, however, offset the reductions in rates, and total revenue has been decreasing. For example, total international long-distance revenues dropped marginally from P17.7 billion ($316 million) in 2001 to P17.3 billion in 2002, but over the years, the importance of such revenues has decreased dramatically. In 1997, international long-distance revenues were some 45% of PLDT totals, and today (2004), the share is only 25%. This trend will continue. There are several inter-national disputes currently active in this market, following decisions by Philippine carriers to increase their settlement rates—and various proceedings are under way relating to disputes from US-based carriers and other players, including the FCC.
Long-distance service ratesTable 9.4 contains some sample long-distance rates in the region. In general, rates in the Philippines for domestic traffic are in line regionally, although inter-national rates seem high relative to countries where competition may be more spirited. This may be a result of the failure of NTC to mandate some form of long-distance carrier selection for users.
Cellular mobile telephone services (CMTS or mobile services)The CMTS market segment is by far the most significant in the Philippines, and is likely to be the dominant segment over the next several years. Figure 9.2 shows how dramatic the trend has been, even compared with regional neighbors. Much of this growth has been fueled by unprecedented growth in the use of short messaging services.
The CMTS market in the Philippines is essentially a duopoly, despite the presence of several players.
Table 9.4Call costs, selected regional countries (US cents a minute), 2003
CountryInternational long
distance to USDomestic
long distanceLocal mobile
Brunei 10 n.a. 12.0Indonesia 57 — 8.2
Malaysia 24 12–86 14.0
Philippines 40 9.0 12.0
Thailand 22 7–44 7.4
— not available; n.a. = not applicable.
Note: Depending on distance.
Source: International Telecommunication Union.
Figure 9.1National long-distance traffic and revenue trends, 2000–2005
0
5
10
15
20
0
1
2
3
4
5
6
7
Traffic Revenues
200520042003200220012000
Bilio
n pe
sos
Year
Bilio
n m
inut
esNote: Figures for 2003 to 2005 are forecasts.
Source: Optel Ltd.
Figure 9.2Regional cellular phone market forecasts, 1998–2005
Mill
ion
subs
crib
ers
0
5
10
15
20
25
30
Hong KongMalaysia
ThailandSingaporePhilippines
20052004200320022001200019991998Year
Note: Figures for 2003 to 2005 are forecasts.
Source: Optel Ltd.
WorldBankInfra.indb 171 12/6/2005 8:42:02 AM

1�� Philippines: Meeting Infrastructure Challenges
The PLDT Group owns Smart Communications and Pilipino Telephone Corporation, and the Ayala Group has Globe Telecom and Isla Communications (now renamed Innove Communications). A recent entrant in this market is Sun Cellular, owned by Digitel, which is in turn owned by one of the country’s largest family conglomerates. Sun has shown that it intends to be a price leader in some segments of the market, and is putting pressure on the other players—possibly putting an end to the duopoly.
Innovation in services and pricing of services will be a trend for the next several years, benefiting consumers throughout the country. There are many who say that mobile or cellular technology should be seen as the “universal service” platform of the future in the Philippines, and there is merit to this argument. One question that needs addressing is the role of this technology in terms of Internet access for business and other broadband applications. The introduction of 2.5G and, subsequently, 3G wireless technology may address this matter, but it is unclear today as to whether such technology will obviate the need to extend fixed-line technology to communities that currently have no access to wireline services.
Internet servicesInternet service providers (ISPs) in the Philippines have suffered from a flattening of the growth rate in demand in recent years, leading to some consoli-dation of operators (from 180 to the current 70). Still, usage is growing, with approximately 4 million users, projected to double over the next three years. Despite the fact that ISPs do not require a franchise from Congress (they need only register with NTC), the industry is dominated by the carriers—PLDT, Globe, and BayanTel. Major non-carrier ISPs include Moscom and Pacific Internet.
Broadband Internet access is in its infancy in the Philippines (there were only 15,000 broadband users in 2002 and 22,000 in 2003), but cable modems and DSL technology will drive the rollout of high-speed Internet access, and broadband is expected to be a growth area over the next few years. Another factor for optimism is the fact that the broadband facilities market is deregulated. This is a plus in the long run, but contributes to the advantage of the facilities-based companies with their infrastructures in place, to provide their ISP operations with needed broadband facilities at essentially no cost. If services to competitors were regulated, then the carriers could be required to tariff needed facilities and provide them to themselves at the same price as to competitors.
Cable television servicesCable TV was first established in the Philippines in Baguio City in 1969. In 1977, Sining Makulay Inc., a private company, was given a nationwide monopoly by presidential decree. In 1987, Executive Order 205 ended this monopoly, and established a competitive, open market. Finally, in 1998, NTC liberalized the international satellite industry, permitting the reception of direct-to-home TV from content providers using international satellite systems.
There are two cable companies that dominate the industry, in which the largest market, Metro Manila, represents 50% of the total national market. It is estimated that there are approximately 1 million subscribers paying about $10 a month. Some 30 companies serve this market, with the company Beyond Cable, controlled by the Lopez Family and PLDT, having some 70% of the market. The second largest, Destiny Cable, owned by the Solid Group, has a 7% market share, and the remaining 23% is held by many smaller operators.
Convergence, which will permit both voice and cable services to be carried on the cable TV infra-structure, is slowly evolving, although it is not a major factor at the moment—perhaps because PLDT has a significant influence over new developments and is unlikely to introduce services that compete with its telecoms packages. Destiny Cable is planning to introduce a bundle of services, offering cable TV, Internet, and voice over Internet protocol telephony—this will begin to change the market dynamics in the future, but since Destiny Cable is very small, it will take some time.
The 2004–2010 MTPDP mentions a Convergence Act, which is intended to address the role of cable in information infrastructure.
Sector investment and financing
Overall sector investment has continued to grow, as depicted in table 9.5. Table 9.6 provides more recent figures by company, confirming a slight downward trend in capital expenditures, although reports also indicate continuing growth in wireless infrastructure, which has slowed the reductions somewhat.
This trend will likely continue at the slowing pace indicated above. The future growth in cellular systems, for instance, will probably be limited to refinements and new services rather than significant infra-structure investment. As for wireline systems, current oversupply will seriously limit new investments.
WorldBankInfra.indb 172 12/6/2005 8:42:02 AM

Chapter 9 Telecommunications 1��
Given that the telecoms sector has been in the private domain, it is largely self-supporting. Subsidies are not involved in the sector, generally, although there are some inherent inter-segment subsidies, for
Table 9.5Cumulative investments in telecommunications, 1992–2000
Year Pesos (billion) Equivalent $ (billion)
1992 90.2 1.611993 106.3 1.90
1994 142.7 2.55
1995 182.1 3.25
1996 209.4 3.74
1997 304.7 5.44
1998 454.7 8.12
1999 524.7 9.37
2000 618.4 11.04
Sources: National Telecommunications Commission; Optel Ltd.; other industry sources.
Table 9.6Capital expenditures ($)
Company 2001 20022003
(estimate)
BayanTel 15,406,127 18,758,381 10,349,923Digitel 200,000,000 213,163,423 260,000,000
Eastern Telecom 13,727,455 9,689,246 —
Globe 75,000,000 367,000,000 284,000,000
Islacom 10,707,415 n.a. n.a.
PLDT Group 599,191,649 284,863,847 328,098,105
Total 1,590,032,645 893,474,897 882,448,028
— = not available; n.a. = not applicable.
Sources: Company annual reports of carriers; Optel Ltd.
instance rural local services being subsidized by other services. Competition is driving prices closer to costs in an ever-increasing number of services, across a wider geographic area, with the trend being toward cost-based pricing. While direct public subsidies should not be required in the sector, TELOF receives subsidies annually to fund its operational deficits of some $17 million.
Sector performanceOverall, the sector has performed well in the face of the serious economic downturn that has hit the Asian region and the telecoms sector globally. With total sector revenues for 2002 at P145 billion, and year-on-year growth of 7.2% estimated for the following three years, the sector is a major factor in the country’s economy. The phenomenal growth in mobile usage is the most significant development, with subscriber numbers growing from 12.1 million in 2001 to some 15.4 million in 2002, a growth of 27%. Mobile penetration grew from 15.6% in 2001 to 19.4% in 2002, which is greater than that for fixed lines. This trend is expected to continue over the next few years, with projections of 26 million subscribers by 2005 generally considered achievable.
Broad measures of service development around the turn of the century in selected regional countries are shown in tables 9.7 and 9.8, indicating that the development of fixed-line phone services and television in the Philippines is well below regional averages, while mobile, computing, and Internet development is about average.
The market expansion mandated by the government led to the award of licenses resulting in 11 IGF operators and five CMTS operations. In order to increase access to basic services, each
Table 9.7 Access to fixed and mobile line telephone services, selected indicators, 2001
Country Fixed telephone serviceMobile telephones per 100 inhabitantsMainlines per 100
inhabitantsMainlines per 100
inhabitants in largest cityaMainlines per
employeeaResidential lines per
100 households
Philippines 4.0 14 14 230 14.0Indonesia 3.7 25 11 177 2.5Malaysia 20.0 28 65 187 30.0Thailand 9.4 38 24 169 12.0Vietnam 3.8 13 4b 17 1.5ASEAN countries 5.1 21 18c 167 6.6Lower-middle-
income countries13.6 25 36 126 9.8
a. 2000. b. 1999. c. Philippines, Thailand, Indonesia, Malaysia, and Singapore.
Source: International Telecommunication Union. 2002. World Telecommunication Development Report. Geneva.
WorldBankInfra.indb 173 12/6/2005 8:42:02 AM

1�� Philippines: Meeting Infrastructure Challenges
Table 9.8 Access to information and communications technology services, selected indicators, 2001
CountryComputers per 100
inhabitantsHosts per 10,000
inhabitantsUsers per 10,000
inhabitantsUsers per computer
Television sets per 100 inhabitants
Philippines 2.2 4.0 259 1.2 14Indonesia 1.1 2.1 186 1.8 15
Malaysia 13.0 31.0 2,395 1.9 17
Thailand 2.7 11.0 556 2.1 28
Vietnam 1.0 0.1 49 0.5 19
ASEAN countries 2.3 8.8 324 1.5 14
Lower-middle-income countries 2.5 4.3 265 1.1 28
Source: International Telecommunication Union. 2002. World Telecommunication Development Report. Geneva.
of these operators was required to deliver within five years (reduced to three years in MC 8-9-95), 300,000 or 400,000 lines (for IGF and CMTS licenses, respectively) in various regions of the country. This arrangement was called the SAS. Fixed-line devel-opment, still considered a vital part of the basic service deployment picture, has not met regulatory or policy requirements, resulting in serious shortfalls in commitments made under the SAS.
Table 9.9 shows the distribution of telephones by region, highlighting the fact that the teledensity across the country is uneven, and in some areas extremely low, especially when actual subscribed teledensity is
Table 9.9 Teledensity distribution, 2003
Region Population Installed capacity Subscribed lines Installed teledensity Subscribed teledensity
CAR 1,492,050 93,567 33,527 6.27 2.25NCR 10,935,524 2,818,358 1,647,671 25.77 15.07
I 4,345,194 195,088 108,888 4.49 2.51
II 2,977,032 30,236 29,000 1.02 0.97
III 8,130,440 431,626 260,328 5.31 3.20
IV 12,206,054 1,064,590 564,370 8.72 4.62
V 5,001,342 124,957 72,656 2.50 1.45
VI 6,660,110 412,984 117,154 6.20 1.76
VII 5,856,441 458,637 185,620 7.83 3.17
VIII 3,977,372 127,264 16,339 3.20 0.41
IX 3,374,312 33,849 31,949 1.00 0.95
X 3,054,139 147,518 50,412 4.83 1.65
XI 5,646,477 381,295 104,730 6.75 1.85
XII 2,847,063 82,349 31,291 2.89 1.10
XIII 2,222,812 125,116 37,264 5.63 1.68
ARMM 2,327,967 29,969 8,162 1.29 0.35
Total 81,054,329 6,557,403 3,299,361 8.09 4.07
ARMM = Autonomous Region in Muslim Mindanao; CAR = Cordillera Autonomous Region; NCR = National Capital Region.
Source: National Telecommunications Commission.
considered. There is a large oversupply issue, resulting in much stranded investment and little prospect of any uptake in the foreseeable future. Moreover, margins on international revenues have dropped dramatically, reducing sharply the availability of the cross subsidies that have historically assisted in the deployment and maintenance of local exchange services.
As part of its report on the SAS, NTC provided a full list of the service situation in terms of coverage by fixed lines, payphones (PCOs), and cellular systems. Some 105 municipalities have no service coverage whatsoever and within the 1,504 other municipalities listed, many barangays are without wireline services.
WorldBankInfra.indb 174 12/6/2005 8:42:02 AM

Chapter 9 Telecommunications 1��
Only 52% of the 1,609 municipalities had fixed-line service, and 41% had cellular coverage. Some 88% had PCO service.
These statistics, if still approximately correct, are cause for serious concern, especially in view of the suggestion that cellular is going to “solve” the access problem. It is likely that cellular coverage in some remote areas is better today than in 2000/2001 when these numbers were gathered, but unless they have improved substantially, the coverage data are not encouraging.
It is clear that NTC and DOTC need more up-to-date coverage data, and a plan to address the issue. The programs aimed at universal access have not produced the desired results, and it is not clear that the government has attached an urgent priority to addressing the problem.
There is a need for a concerted effort to address the shortfall in distribution of services under the SAS, and a plan involving all of the carriers to consider the probability of services being made available in unserved areas. It is not sufficient to rely simply on the likelihood that wireless expansion will take place over time. Quantifiable, time-bound targets and implementation mechanisms are needed to measure progress against objectives.
Teledensity in selected countriesThe figures in table 9.10 show the influence of the dramatic growth of cellular services throughout the Asian region, but also indicate that the Philippines has lagged behind in some respects (China, India, and Vietnam have had higher growth rates in fixed-line teledensity), but is ahead in others, in that its growth in mobile teledensity is second only to that of China, and only by a small amount. However, these national figures do not address the regional disparity
in the Philippines, where parts of the country are severely lacking in telecoms facilities. This under-scores the fact that broad teledensity figures are really meaningless in terms of the development targets that most nations wish to address. The International Tele-communication Union (ITU) has begun to utilize a different teledensity figure, reflecting the influence of mobile technology on the sector. A measure called “effective teledensity,” as shown in table 9.10, has been defined as the higher value of either main telephone lines per 100 population or cellular subscribers per 100 inhabitants. Clearly, the intent of the ITU is to recognize that adding the two figures, as has been done in some comparisons, ignores the overlap in coverage that the two numbers denote. However, using teledensity figures as a measure of progress can be misleading, as it does not reveal anything about the breadth of availability of service throughout large countries—and the Philippines is particularly difficult to apply such measures to, for obvious geographic reasons.
Main issues
Institutional structureThe lack of true independence of the regulator, NTC, is an important issue, as it lacks both the authority to adequately enforce its decisions, and the political independence to make the decisions needed for sector progress. This stems from the “at pleasure” nature of the appointment of commissioners, the lack of budgetary independence, and the fact that telecoms operators require legislative franchises, which polit-icizes the market entry process unduly.
The role of DOTC as both policymaker and operator is an arrangement that is generally seen
Table 9.10Comparison of teledensity figures in the region, 1995 and 2003
Country1995 2003
Fixed Mobile Total Fixed Mobile Total Effective teledensity
China 3.30 0.29 3.59 20.9 21.48 42.38 21.48India 1.29 0.01 1.30 4.63 2.47 7.10 4.63
Indonesia 1.69 0.11 1.80 3.94 8.74 12.68 8.74
Malaysia 16.57 5.00 21.57 18.16 44.20 62.36 44.20
Philippines 2.05 0.72 2.77 4.12 26.95 31.07 26.95
Thailand 6.06 2.26 8.32 10.49 39.42 49.91 39.42
Vietnam 1.05 0.03 1.08 5.41 3.37 8.78 5.41
Note: Effective teledensity is the higher of either telephone mainlines per 100 population or cellular subscribers per 100 inhabitants.
Source: International Telecommunication Union. 2004. Asia-Pacific Telecommunication Indicators 2004. Geneva.
WorldBankInfra.indb 175 12/6/2005 8:42:03 AM

1�� Philippines: Meeting Infrastructure Challenges
as inappropriate, especially where the private sector is supposed to play a leading role. Given that it is 15 years since the publication of its National Tele-communications Development Plan, DOTC should provide an updated policy vision for the telecoms industry. Such a policy would give the industry and other stakeholders the opportunity to examine alter-native approaches to regulating the sector, ensuring real competition and the development of an approach to providing much-needed telecoms services in parts of the country where market forces are not motivating expansion.
Service expansion of both basic and broadband services throughout the country has been supported by government planning documents, notably the 2004–2010 MTPDP, which includes a major section on telecoms infrastructure, and a Philippine Information Infrastructure Policy Study, published by DOTC in October 1998. However, unlike the more compre-hensive National Telecommunications Development Plan of 1990, neither of these documents provides quantified, time-bound targets for the telecoms sector toward achieving important policy objectives. This is essential, though, to measure progress in meeting overall distribution levels, for instance.
The recent issuance of Executive Order 269 is worthy of note, in that it signals that the current administration considers the development of ICT to be a national priority. The appointment of the under-secretary for ICT from DOTC as chairperson of the CICT is also a positive step, and underlines the rela-tionship between telecoms infrastructure development and the evolution of innovative broadband ICT technology. However, the institutional arrangements set out as part of Executive Order 269 confirm that the current problems relating to NTC independence, and the role of government as an operator, are likely to continue. The MTPDP, indicating that commis-sioners of NTC should have fixed-term appointments, is a positive sign, but there is no sign of any progress toward achieving this.
Finally, the proposed bill creating a department for ICT would be a welcome change to the insti-tutional structure, as it would recognize both the convergence of information technology and tele-communications technologies, and the importance of infrastructure development and information technology for education, health care, and commerce. However, such legislation will not bring about the kind of reforms needed for the policy/regulatory framework governing telecoms unless the institutions that make up the structure are also changed, and this
does not appear to be contemplated by the bill or by those promoting the restructuring. The bill seems to merely effect some consolidation of departments, which is likely positive, but it does not change the fundamentals, such as the role of TELOF or the powers and independence of NTC.
CompetitionCompetition in the telecommunications sector appears to be alive and well, as there are many operators in the market—11 international gateway operators for instance, and three significant wireless players operating nationally. However, the fact is that the SAS actually created a series of regional duopolies, each with its own chosen domestic and international long-distance connections, duplicating switching and outside plant in many situations. Interconnection is provided to allow for calls between public switched telephone network points, but there is no long-distance carrier preselection or even “dial-around” arrangements for users to select among the many international or domestic long-distance carriers. Users of a local exchange carrier are “captives” in terms of the long-distance carrier to be used, which is the one that is affiliated or part of the local exchange carrier organization.
Resale is not permitted for international private lines, despite the fact that in other countries it has often been a valuable tool for encouraging new entrants to the market. Resellers, however, must still possess a legislative franchise if they put up their own networks, thus limiting market entry by “niche” players. In many countries, where market entry is not restricted, many resellers enter and leave the market, occupying niches that the incumbent players are not interested in or competent to address. This in turn has resulted in aggressive price competition, which is not evident in the Philippine marketplace, although prices have dropped dramatically due to international pressures on all long-distance rates.
The wireless communications segment has two major service providers (Smart and Globe) and one newcomer (Sun). The two dominant players charge essentially the same rates to avoid what they have called “ruinous competition.” However, this duopoly is being challenged by Sun, which is apparently trying to gain market share with lower prices, but is having great difficulty obtaining useful interconnection arrangements. If the third operator can survive, it will augur well for wireless users, but the compe-tition will likely result in lower margins and earnings pressures.
WorldBankInfra.indb 176 12/6/2005 8:42:03 AM

Chapter 9 Telecommunications 1��
However, the introduction of more dynamic competition in the sector generally will require more aggressive and proactive involvement of both DOTC and NTC.
Service availability (universal access)In its 2001 report on the SAS, NTC provided the following compliance information.
As of 2000, six operators—Digitel, Globe, BayanTel, PLDT, Smart, and Pilipino Telephone Corporation—rolled out the required number of local lines and rural deployment, but were deficient in covering the required areas. Three operators—Islacom, Capwire, and Philcom—were deficient in rolling out the required number of lines and required areas to be covered but were able to meet rural development targets. Eastern Telecom, which started the program, failed to roll out the required number of lines and to meet other requirements. Neither Extelcom nor BellTel had started its roll-out program.
Little has changed since this report and both NTC and the industry in general have concluded that the SAS has served a useful purpose, but that its role in effecting further expansion of basic services to rural parts of the country is no longer viable, with wireless technology having supplanted the need for fixed-line expansion into remaining unserved or underserved areas.
NTC has not articulated a specific action plan for completing this important national priority. The initiative inherent in MC 08-07-2002 (“Rules and Regulations Authorizing Entities other than Public Telecommunications Entities to Install and Operate Public Calling Stations/Offices and Telecenters”) has resulted in only a few small operations starting services, but in general, the industry seems unable or unwilling to pull together to provide further expansion of existing services. While market forces are surely driving some expansion of mobile services everywhere in the country, it is unlikely that full coverage will be accomplished in the near future, and any expansion of fixed-line services is even more remote.
Following an assessment of the SAS in 2001, NTC stated that a status report should be developed for determining the situation of the unserved munici-palities, and that the existing carriers should be required to dedicate a part of their capital programs to the expansion of services into these areas. However, without a proactive approach to this objective, it is unlikely that there will be measurable progress. This underscores the importance of a new national tele-communications development plan.
Spectrum managementNTC has limited capacity and resources to set and implement spectrum management policies. A major issue in this regard is the inability of NTC to utilize the proceeds from its fees for spectrum usage to manage and monitor this resource. All of the revenue from NTC fees goes to the general revenue fund of the government, and it has virtually no budget for new equipment or staff support. This lack has led to a largely passive mode of regulation, by necessity. As a result, there has been little enforcement to ensure that allocated spectrum is in fact used effectively and efficiently. Automation of spectrum management and monitoring is minimal currently, and there is a pressing need for a new system to integrate NTC’s licensing and monitoring databases.
With regard to spectrum allocations, the current cellular operators have sufficient spectrum assigned, and there is spectrum available in the 1800 MHz band for assignment to existing operators, or a new entrant.
Broadband services have been authorized in the 3.4/3.5 GHz band, 2.4 and 5.7 GHz band, and 38/42 GHz bands. A circular was issued by NTC in 2003 to facilitate the development and use of wireless Internet and data networks. The development of 3G technology is not a priority for the industry at the present time, and NTC has therefore not been pushing for its introduction—the operators seem to be content to concentrate on 2.5G services.
NTC has no detailed information on the coverage of the wireless cellular operators, though it knows that there are some 7,000 cell sites operating throughout the country. The information on service availability in all of the municipalities, including in this report, suggests that many areas have no cellular coverage. The information should be formalized, and maps developed by each cellular operator and provided to NTC on a regular basis. This information should also be made available to the public, as is the case in most jurisdictions.
Historical methods of assigning frequencies to the current operators have worked reasonably well, with the dynamic growth of wireless users as ample evidence. However, the lack of rural coverage likely requires a different look at this area of frequency management, and a plan for reuse of spectrum in remote areas becomes critical. The pricing of spectrum licenses for application in rural areas may need some adjustment, in order to motivate more entry by entrepreneurs and community-based systems to be installed in rural locations, possibly in
WorldBankInfra.indb 177 12/6/2005 8:42:03 AM

1�� Philippines: Meeting Infrastructure Challenges
partnership with the larger operators who lack the incentive to move into such areas. In other words, new techniques should be examined, to make more effective use of precious spectrum resources.
Findings and recommendations
Universal accessThis is the most serious issue confronting the government and the telecommunications industry today. The continuing role of government (TELOF) as the supplier of last resort has not been an effective solution to the problem of service expansion to currently underserved or unserved locations, nor have the Alternative Communication Program5 (ACP) or SAS programs. The solution is not a simple one, though.
A report in 20026 recommended some form of subsidy to achieve the service expansion required. It concluded as follows:
The government subsidy and other incentives offered in the ACP are insufficient to motivate the private sector to venture into the target areas.The government’s telecenter initiative needs more development work, with the regulator and policymaker working to create the environment for expansion.The government’s privatization efforts need to be strengthened and realistic expectations applied.A phased approach to expansion of service to some 35,000 unserved barangays should be undertaken over a seven-year period: starting with noncash incentives to private operators to achieve extension of telecenter service to 800 municipalities; priva-tizing all government operations; developing a fund to subsidize the final stages of extension of services; and awarding licenses and subsidies for barangays within reach of about 90% of the remaining unserved rural population.
The amount of capital subsidy required to provide telecenters in all unserved barangays was estimated to be some $50 million. This amount is large, but represents only 2% of the annual gross revenues being generated by the sector today. In addition, it is only two years of NTC revenue surplus from fees charged to users of the spectrum and to licensees.
A public process conducted by NTC to address this issue should be considered, to generate recom-mendations to the government. If the recommen-
•
•
••
dations were accepted, NTC could then be required to implement the scheme. Some elements of such a proceeding could be:
NTC should obtain a report from each of the carriers (public telecommunications entity or PTE) on its situation relating to SAS, naming all of the municipalities in its responsibility list and an assessment of the demand for, and costs associated with, the provision of minimum access to services, both wireline and wireless.Each PTE should provide an indication as to its capability or plans to provide this minimal service level.All PTEs should be invited to indicate areas that they would be interested in serving, outside their current assigned territory.If possible, commission an independent study of all of these aspects, to determine overall costs and priorities, in consultation with the carriers, user representatives, government departments, and politicians interested in the subject.Evaluate, with carrier input, the possibility of a special fund for addressing the short-term problem of raising capital for the service expansion effort. Seek input on whether operators would be prepared to assume responsibility for PCOs or other systems for which capital costs were subsidized, but for which operating costs would be their responsibility.Commission a study as to whether wireless tech-nology really is the answer to the universal access issue, bearing in mind the fact that very soon the policy regarding access to basic services will likely include some kind of Internet access. Can this additional requirement be met effectively through current wireless technology? If so, what are the cost implications, and what is the current situ-ation regarding access to such service throughout the country? A related question concerns 2.5G or 3G wireless technology, and whether there is promise in these recent developments to be the basis for a broadband Internet access mechanism. It is also recognized that for cellular services, remote rural areas in the Philippines are generally locations where income levels are such that any individual use of cellular service may be out of the question economically. There is little incentive for the cellular operators to extend their network infrastructure to these areas, and some form of motivation will be required if this last step in the coverage map is to be accomplished.
•
•
•
•
•
•
WorldBankInfra.indb 178 12/6/2005 8:42:03 AM

Chapter 9 Telecommunications 1��
The key to resolving this issue is action. Action should be taken by the government through its regulator and policymaking body, whether it be DOTC or the department for ICT when formed. It has been clear for many years that the private sector will not solve this problem voluntarily. Market forces alone will not motivate the level of commitment required. However, the sector should be capable of funding the needed expansion without outside subsidies. What is required is a concerted effort by all concerned, and rules need to be put in place to ensure that the problem is addressed and resolved within a reasonable time frame.
Institutional structureThe current institutional structure is not in keeping with international best practice. The fact that NTC is not independent and that commissioners are “at pleasure” appointees weakens the regulatory process seriously. In addition, the requirement that all telecoms operators obtain a legislative franchise is a weakness in the overall institutional arrangements governing the sector. While recent announcements acknowledge the need for institutional change and for more independence for NTC, it is unclear when such change is likely to take place.
To resolve these issues completely will probably require legislative change, which would have to be seen as a long-term solution. However, as the bill dealing with the creation of the department for ICT is still pending, perhaps there is a way to add the changes required to the bill.
In the main, the following actions would be needed:
Mandate a solution to the “TELOF problem.” Commit to winding down its operation and selling the systems currently worth transferring to the private sector and commit to a bidding process for all systems, indicating that if no bidders are found, the systems will be closed, or transferred at no cost to local barangay or municipal operators. It should be stressed that the TELOF operational deficit of some $17 million is a direct subsidy by the taxpayer to a sector that should not require any subsidy. The territory served by TELOF may require some subsidy from within the sector, but should not be receiving support from the public purse. It will be important, however, as part of a winding down plan, to provide a suitable way to deal with the employees of TELOF, over a reasonable period of time.
•
Provide for tenure for NTC commissioners. Give to NTC the autonomy needed in operational terms, allowing it to use the revenues from fees but requiring it to submit a budget to the responsible department secretary annually. Excess revenues would be transferred to the general revenue fund and fee structures would be reviewed by the secretary from time to time.Place NTC in the appropriate organizational mode that would allow it to pay its staff at something approaching market rates, subject to review by the DOTC secretary or other appropriate authority.
A change that could possibly be implemented without new legislation may be the funding mechanism for NTC. Allowing NTC to use some of the revenues from its license and other fee charges would do much to energize the agency, especially if compensation levels could be increased for the profes-sional staff and commissioners. Its annual budget should still be subject to approval from the relevant department secretary, with any surpluses going to the general revenue fund.
A further short-term approach could be in the form of an executive order that would make it more difficult to dismiss commissioners during an admin-istration’s term of office (except for cause), a sort of job security guarantee that would at least last for the life of the administration in power.
CompetitionIn theory, there is competition among the many operators, and in some respects this is the case. In reality, by far the dominant player in the market is PLDT, with a dominant share in each major market segment in which it operates. The industry structure, especially the terms and conditions attached to market entry of many of the new players, has influenced the degree and nature of competition in the sector. In the local market for example, there is a kind of duopoly created by the SAS, and a consid-erable oversupply of local facilities, and thus little incentive for any new entry in any of the urban markets that might be candidates for additional local operators. Consequently, the further opening of the local services market is not economically justified at the present time. In the long run, the government’s policy should be to open all market segments by eliminating the requirement for a legis-lative franchise (requiring only a license from the regulator). This would require legislative change, and would take considerable time. In the short
•
•
WorldBankInfra.indb 179 12/6/2005 8:42:03 AM

1�0 Philippines: Meeting Infrastructure Challenges
run, consideration should be given to allowing any existing franchised operator who wants to enter the local market to do so, subject only to its license being modified appropriately.
Firm interconnection rules for local competition should be enacted by NTC. There is a need to review interconnection rules and ensure that incumbents, particularly PLDT, respond to requests for intercon-nection facilities in a time-bound manner. To this end, NTC needs to revise its interconnection regime and likely needs more trained resources to carry out this mandate.
The franchise requirement is not in keeping with the World Trade Organization (WTO) commitments set out in its telecommunications regulatory reference paper, specifically with regard to the public availability of licensing criteria. The requirement for transparency in the licensing process is not met by the franchising process, nor is the requirement for an estimate of the time required to reach a decision. However, the Philippines has yet to commit to this reference paper, although it has agreed to comply with certain other WTO telecoms policy objectives.
The Philippines has no law or regulations applying to competition in general (antitrust, or competition oversight body) as seen in many countries. In some jurisdictions, the furtherance of competition in the telecoms sector is left to the telecoms regulator, as antitrust legislation is usually too broad to apply in practical terms to telecoms matters. Although a general competition law can help, such as dealing with broad issues of concentration of economic power and anticompetitive behavior at the corporate level, such legislation would probably not do much to improve the competitive situation in the Philippine telecoms sector. Government policy is clear in the Philippines—a competitive, private sector-driven telecoms market is desired, and it is now a matter for the policymakers at DOTC and NTC to ensure that the market entry and operational rules maximize the opportunity for real competition to flourish.
In the long-distance market, it is recommended that NTC begin the process of introducing carrier selection mechanisms for long-distance traffic. At the very least, a dial-around mechanism that would allow customers of a local exchange company to route their long-distance calls to a particular long-distance provider would do much to increase the level of competition in the sector. A carrier preselection mode would be even more effective, and should also be considered for later implementation.
Allowing resale in all telecoms services would
likely increase competition and efficiency in the sector as well. Resellers could be considered value-added players, and perhaps would only require registration with NTC.
With regard to cable TV, it is clear that both legislative change and a policy promoting compe-tition are required. The current domination by PLDT creates little if any competitive potential, so the currently fragmented remaining companies may have to consider some sort of joint action to put themselves into a position where they can challenge telephone monopolies with broadband and voice over Internet protocol services via cable. At the moment, this appears to be an unlikely scenario unless the government wishes to act strongly in the area of ICT development and competition. The new department for ICT may hold some promise in this area.
Another general regulatory principle applied in other jurisdictions is the application of “asym-metrical” regulatory rules to the sector. Companies with significant market power are generally subject to more stringent regulatory scrutiny than other market players. Significant market power is defined in various ways, some very simple, others quite sophisticated. The easiest mechanism is a simple revenue/market share calculation that states that significant market power applies if a company has more than a 40% share of the relevant market segment. This would likely mean that only PLDT and the two largest wireless players would be affected by the more stringent regime, with the others essentially deregulated. In addition, significant market power could exist at the regional level, by virtue of the SAS assignments, and it is therefore conceivable that a few entrants would be considered to have significant market power in some regions, and as such, may be subject to regulatory constraints in those areas.
In terms of process, it is recommended that DOTC issue an order or instruction to NTC, requiring it to conduct, within a specified time period, a public proceeding on competition in the telecoms sector in the country. This should be a several-stage proceeding in which the first phase could be the identification of issues seen by stakeholders, including the carriers, ISPs, and other interest groups, followed by a stage in which the stakeholders would be invited to submit position papers on the issues identified in the first phase. From this point on, the proceeding would then be in the form of public hearings in which each issue could be aired, and NTC would decide upon priority requirements and the process for introducing more competition.
WorldBankInfra.indb 180 12/6/2005 8:42:03 AM

Chapter 9 Telecommunications 1�1
Table 9.11 Proposed road map for government action (in order of priority)
Objective Steps to be taken in theshort term (1–2 years)
Steps to be taken in themedium term (up to 5 years)
Universal access to basic services
Carefully define universal access and include the affordability aspect and targets for Internet accessConduct a public proceeding to determine the nature of the problem, including status of commitments, demand factors, and wireless coverageEstablish a subsidy program to achieve coverage needed. If a universal service fund is deemed the answer, NTC and DOTC should define the mechanism and collection methodologyExamine evolving wireless technology, to determine if it is the answer to service extension to rural and remote areas. Costs and any subsidy requirements should be determined
•
•
•
•
Put a mechanism for expansion in place and monitor performanceIf an aid program can be harnessed to provide the needed subsidy, NTC and DOTC should manage its implementation. All funding should support private sector initiativesUniversal access should be an integral part of a long-term ICT plan to be coordinated with the new department for ICT when formed
•
•
•
Institutional changes
Commit the government to ensure tenure for commissioners of NTC. If possible, issue an executive order guaranteeing it during the tenure of the current executive branch Allow NTC to fund its own operation, and pay staff competitive salariesFollow through on the commitment to privatize all government operations and wind down TELOF as part of a two- to three-year plan
•
•
•
Change legislation to ensure that commissioners are appointed for a fixed term with tenureGrant to NTC full powers to license telecoms operators (with no need for a legislative franchise)
•
•
Promoting competition
Open the long-distance market by introducing carrier selection mechanismsAllow resale in all segments by value-added service providers
•
•
Consider opening the local market to all operators, and establish interconnection rules for all entrantsChange legislation to allow market entry without the need for legislative franchises; licensing to be done by NTC
•
•
Spectrum management issues
Conduct a study aimed at developing a plan for spectrum management reform. This would include governance and human resources issues, and management systems needed by NTCConduct a study on frequency usage efficiency, with recognition of the possibility of different treatment of rural and urban areas
•
•
Ensure that staffing and other resources are in place in NTC to implement the plan emanating from the proceeding described in the short-term planExamine the benefits that would accrue from a more efficient monitoring and automated licensing system, as well as the revenue potential of such improvements
•
•
National telecom-munications development plan
DOTC (or its successor department) and the industry should implement a new “edition” of the NTDP, following a similar pattern to the production of the last plan in 1990, concentrating on hard development targets with time frames. This time, the plan should take a broader, ICT perspective, but care should be taken with the focus of the study and development targets in particular
• DOTC should actively monitor progress on the NTDP, taking action as required to ensure compliance by the industry wherever failures occur, or institute the necessary corrective action where feasible. NTC should issue an annual report on compliance with the NTDP, and recommendations for actions
•
Legal framework for telecom-munications governance
Begin the process of developing a successor law to Republic Act 7925, encompassing the needed institutional strengthening, sector reform, universal service funding, and information technology expansion goals
• Review the current legislation, with a view to create a comprehensive ICT bill that would spell out a new role for the government, with an independent, self-funded regulatory body, and policy guidance to ensure expansion of needed services
•
DOTC = Department of Transportation and Communications; ICT = information and communications technology; NTC = National Telecommunications Commission; NTDP = national telecommunications development plan; TELOF = Telecommunications Office.
WorldBankInfra.indb 181 12/6/2005 8:42:04 AM

1�� Philippines: Meeting Infrastructure Challenges
A cautionary note is required here. The proceeding could fail if the various carriers in the industry today see the risks involved outweighing the advantages they might achieve through a more open marketplace. That is, the current situation may be preferable to any change. At least some input to the proceeding that is pro-competition in its best sense—whether this be NEDA, or a consumer or business user group—should be explored. It seems clear though that an advocate for more competition will be needed if there is no champion within the industry.
Radio spectrum managementThe lack of resources by NTC for effective spectrum management is directly linked to the fact that the budget for NTC is drawn from the DOTC allocation, and it would appear that DOTC and/or Congress, which approves the DOTC budget and the NTC allocation, have decided not to strengthen the orga-nization with the additional funding needed as the industry has grown and as the regulatory issues have become more complex and demanding.
The radio spectrum management function should be examined with the aim of establishing a logical and practical plan of action for the future. Additional staff resources and training, as well as software systems, are needed to bring the operation to an efficient state. The policy issues raised by current initiatives in other jurisdictions (e.g. frequency trading) should be examined for potential application in the Philippines, through a separate study by experts in the field, and by a process that would examine the potential benefits of innovations such as frequency resale and sharing, and special pricing of spectrum in rural areas. To attempt to implement such initiatives with the current resources at NTC would not be practical.
Frequency licenses already represent a significant source of government revenue, and while it is not suggested that any increases in these fees should be introduced, a more efficient scheme for allocating and managing the spectrum will likely motivate more usage of the resource, and hence would enhance government revenues from this important segment of the market, which promises to grow more rapidly over the next few years.
Other proposed government initiativesA comprehensive study of telecoms services pricing should be developed, covering both basic services and
business services, especially in the area of ICT infra-structure. The current regulatory regime covering each of these service areas should be addressed, with recommendations made for any deregulatory initiatives that might help in the diffusion of ICT services. There should also be a comprehensive study of services provided to competitors by the larger companies with significant market power. Such services should likely be tariffed, and price/cost rela-tionships mandated by NTC.
With respect to institutional strengthening, it is clear that the current legislation governing NTC—its powers and mandate—is inadequate. Work should be done on the development of a more appropriate institutional structure, including a minimum tenure for commissioners, budget independence, compen-sation levels, and licensing powers. This is a long-term objective, but through appropriate executive orders the government should address the aspects of this reform that can be undertaken through such actions.
It has been 15 years since DOTC published its National Telecommunications Development Plan, and it is time for another such plan to be developed, in order to provide a clear policy direction for the sector. Serious consideration should be given to engaging the stakeholders in a repeat of this exercise, the objectives of which would be a set of time-bound development targets for the sector. As noted above, this plan should be broadened in all likelihood, to be more of a plan for ICT infrastructure, but should not be confused with overall ICT goals, which are more content-oriented than delivery-focused.
More emphasis should be placed upon the new department for ICT to address the policy role of government versus the regulatory role of NTC, setting up more appropriate limits on the role of politics in the telecoms sector. This department would also address the issues relating to Internet development and universal access to an expanded list of needed services in rural areas of the country, and the role of voice over Internet protocol telephony in the growing list of new services that should be encouraged for future technological and economic progress.
Interconnection rules, cited by many players as an obstacle to meaningful competition, should be highlighted by NTC, and a proceeding launched to address the most urgent aspects of this problem, including enforcement mechanisms and penalties for noncompliance.
WorldBankInfra.indb 182 12/6/2005 8:42:04 AM

Chapter 9 Telecommunications 1��
Endnotes1 In 1979, under Executive Order 546, two regulatory bodies, the
Telecom Control Bureau and the Board of Communications, were merged, and NTC was established under the Ministry of Transportation and Communications (now DOTC).
2 However, the national targets for availability of services have always been set at the municipality level—thus, the number of barangays not served may not be strictly relevant—but even then the number is very large, and reflects a serious problem.
3 The reasons for the failure of the government’s efforts appear to relate to the terms attached to privatizing the systems being made available—operators are reluctant to assume responsibility for equipment that they do not support, and in many cases, the areas of operation are not considered lucrative or even sustain-able financially.
4 In this report, NEDA summarized progress to date, and acknowl-edged the challenges ahead, especially the need to achieve more
complete coverage for basic services, and the need for the exten-sion of broadband services to areas currently lacking them. The MTPDP indicates that teledensity had reached the level of 28.06 per 100 population, which presumably includes the penetration of mobile telephones—not usually the approach used in reporting teledensity.
5 The Alternative Communication Program (ACP) was instituted by the DOTC in 2000 in response to a presidential commitment to bridge the information gap in rural parts of the country. It offered incentives for investments in rural infrastructure. It has not resulted in any substantial expansion.
6 Björn Wellenius. 2002. “Extending Access to Communication and Information: Recommended Approach and Implementa-tion Plan.” Report submitted to the Republic of the Philippines Department of Transportation and Communications, February 21. PPIAF and World Bank, Manila.
WorldBankInfra.indb 183 12/6/2005 8:42:04 AM

Tim Graham/Getty Images
WorldBankInfra.indb 184 12/6/2005 8:42:17 AM
Appendix 1
Correlation versus Causation: Does Infrastructure Cause Growth in the Philippines?
Evidence of the positive correlation between infrastructure expenditures and gross domestic product (GDP) growth does not necessarily
imply causation. To test whether infrastructure causes growth, a Granger-causality analysis was performed on existing infrastructure and growth data in the Phil-ippines. The intuition behind a Granger-causality test is that if variable X causes variable Y, then changes in X should precede changes in Y. Therefore, in a statistical regression of Y on other variables (including its own past values), when past values of X are included, and if that significantly improves the prediction of Y, then X is said to (Granger) cause Y.
Checking for causality and robustnessFor Philippine data from 1985 to 2002, in order to assess whether infrastructure capital stock causes GDP, GDP values were regressed against lagged values of GDP and lagged values of infrastructure capital stock (the stock was constructed from the gross fixed capital formation series). The results show that infrastructure capital stock does indeed signifi-cantly Granger-cause GDP. In order to check whether the results were sensitive to the number of lagged values, the test was also repeated using different
lag specifications. Even so, the results did not alter, implying a high degree of robustness.
Checking for sign and duration While the Granger-causality procedure establishes a causal link from infrastructure to GDP, it does not however reveal the sign and the duration of the causality. Further econometric analysis was therefore undertaken to ascertain the sign and duration of the effect. Preliminary results from the analysis show that: investment in infrastructure has a positive impact on level of GDP; and infrastructure capital stock has a long-term impact on level of GDP (i.e. investment in infrastructure affects economic growth). The tests were repeated separately for public and private infrastructure capital stocks. For the Philippines, preliminary results indicate that both public and private infrastructure positively affect economic growth.
The above results are relevant in that they suggest that infrastructure investment—public, private, and combined—contributes positively to economic growth in the Philippines. However, further analysis will be required to measure with accuracy the magnitude of the effect, as well as the relative marginal productivity of private and public infrastructure investment.
Appendixes
WorldBankInfra.indb 185 12/6/2005 8:42:18 AM

1�� Philippines: Meeting Infrastructure Challenges
Appendix 2
Spatial Effects of Infrastructure
Lack of access to adequate infrastructure services is also correlated to uneven development between regions in the Philippines. Existing
empirical evidence indicates that wide income disparities among regions can be attributed, in part, to regional differences in the level of infrastructure development.1 Table A2.1 depicts the close linkage between gross regional domestic product (GRDP) and the associated disparities in infrastructure access across regions. The southern and eastern parts of the Philippines, which have the lowest GRDP, are also the regions that have dismal performance in terms of access to basic infrastructure. The linkage between income and access is remarkably clear in the Autonomous Region in Muslim Mindanao (ARMM) and Region VIII. ARMM, having the lowest GRDP, consistently ranked the lowest for access to safe water, electricity, and sanitation, as well as having the lowest road density in the country. Region VIII on the other
hand scored low in road density, access to electricity, and access to sanitary toilets. In contrast, regions with higher GRDP such as the National Capital Region in Luzon and its surrounding areas, regions III and IV, rank significantly higher for access to basic infrastructure.
Another measure of capturing spatial regional inequalities is total net shift (TNS) analysis. A positive TNS value for a region indicates that the region’s development, as measured by its GRDP, is above average. Figure A2 presents the results of a TNS time-trend analysis for 14 regions over 1987–2000. Table A2.2 shows the strong correlation between TNS values and major infrastructure development indicators for roads, electricity, irrigation, and tele-communications, implying that the least prosperous regions also have the least access to infrastructure services. This is consistent with the findings that areas such as the southern part of the Mindanao
Table A2.1 Uneven regional development and uneven infrastructure access
RegionGross regional
domestic product (% distribution) 2001
Access to safe water (%)
2000
Access to sanitary toilet facilities (%)
2000
Access to electricity (%)
2000
Road density, (km per sq. km)
CAR 2.4 81.5 80.0 66.9 0.5NCR 30.9 85.1 95.6 99.3 7.5
I 3.0 89.0 92.1 83.0 1.1
II 2.3 83.6 94.4 72.8 0.5
III 9.0 96.4 90.9 93.3 0.8
IV-A 15.2 84.9 90.6 93.9 0.7
IV-B 81.7 74.1 52.9 0.3
V 2.8 65.7 66.8 55.2 0.5
VI 7.0 68.3 70.5 63.7 0.9
VII 7.1 71.9 72.9 66.7 1.0
VIII 2.3 79.9 71.5 55.2 0.4
IX 2.7 63.3 72.7 53.9 0.6
X 3.9 78.4 83.6 70.1 0.9
XI 6.3 70.2 86.5 72.0 0.6
XII 2.6 79.7 83.5 65.6 0.6
CARAGA 1.4 80.0 86.8 65.1 0.4
ARMM 0.9 34.1 47.3 39.5 0.3
Philippines 100 78.5 82.5 75.4 0.6
ARMM = Autonomous Region in Muslim Mindanao; CAR = Cordillera Autonomous Region; NCR = National Capital Region.
Source: Cecilia Reyes. 2003. Socio-economic Profile of the Philippines. Makati: Philippine Institute for Development Studies.
WorldBankInfra.indb 186 12/6/2005 8:42:18 AM

Appendixes 1��
region, with its uneven access to vital infrastructure, have not been able to develop relative to the regions with better infrastructure such as the National Capital Region and Southern Tagalog (Region IV). For areas lacking in infrastructure, the challenge in stimulating economic activity (through increased productivity), and ultimately development, will be much more daunting.
Figure A2Total net shift analysis of gross regional domestic product, 1987–2000
-15,000
-10,000
-5,000
0
5,000
10,000
15,000
20,000
C. Mindanao
S. Mindanao
N. Mindanao
W. Mindanao
E. Visayas
C.Visayas
W. Visayas
Bicol
S. Tagalog
C. Luzon
CagayanIlo
cosCAR
NCR
Source: Rosario G. Manasan and Shiladitya Chatterjee. 2003. “Regional Development.” In Arsenio Balisacan and Hal Hill, eds., The Philippine Economy: Development, Policies and Challenges. New York: Oxford University Press.
Table A2.2Rank correlation coefficients: Total net shift values and infrastructure development indicators, 1987–2000
Infrastructure development indicator
Spearman rank correlation coefficient
Road density 0.47
Percent electrifieda 0.40
Percent irrigatedb 0.69
Telephone density 0.53
a. Refers to the ratio of actual energy connections to potential energy connections. b. Refers to the ratio of irrigated area to potential irrigable area.
Source: Rosario G. Manasan and Shiladitya Chatterjee. 2003. “Regional Development.” In Arsenio Balisacan and Hal Hill, eds., The Philippine Economy: Development, Policies and Challenges. New York: Oxford University Press.
Endnote
1 See Mario B. Lamberte, Rosario G. Manasan, and Gilberto M. Llanto. 1993. Decentralization and Prospects for Regional Growth. Philippine Institute for Development Studies. Makati; L.Q. Basilio and D.M. Gundaya. 1997. “The Impact of Collective Public Infra-structure on Regional Income Disparities.” Undergraduate thesis, University of the Philippines School of Economics. April.
WorldBankInfra.indb 187 12/6/2005 8:42:18 AM

1�� Philippines: Meeting Infrastructure Challenges
Appendix 3
Framework for Local Government Access to Financing and its Implementation Progress
In 1996 the national government developed the LGU Financing Framework, which led to reforms in local government financing
and formed the cornerstone of the current LGU financing arrangements. The government LGU credit programs—consisting of the Municipal Devel-opment Fund (MDF) and the credit programs of the government financial institutions (GFIs)—are expected to pave the way for greater private capital market participation in financing local development. Government credit programs for LGUs should have a built-in graduation program in which LGUs with a good credit track record can readily “graduate” into the private capital markets. This graduation policy is based on LGU creditworthiness. Technical assistance, which includes grants, can be provided to LGUs to improve their creditworthiness.
The LGU Financing Framework recommended the following measures to improve local government access to the private capital markets: increase use of build-operate-transfer (BOT) schemes; develop the local government bond market; improve LGU access to private banks; optimize the role of GFIs in local government financing; restructure and reorient the MDF; improve local government capacity to raise own-source revenues; and use official development assistance (ODA), both loans and grants, to improve local government capacity.
Over the last decade or so, local government borrowing has expanded significantly, though it remains at an overall low level. Total LGU borrowings rose from P448 million in 1991 to an average of P5.2 billion in 2001–2002 (table A3). LGU borrowing accounted for 4% of total LGU receipts in 2001, from less than 2% in 1991. Cities accounted for 53% of total LGU borrowing in 2000–2001, the provinces for 26%, and municipalities for 21%.
Key implementation progress of the 1996 LGU Financing Framework includes the following:
Very limited private investment in LGU infra-structure. Very few LGUs have made use of BOT contracts. Most of the completed BOT projects are unsolicited, with only two LGUs having completed solicited projects, while most of the BOT projects are
for property development (with the exception of two local infrastructure projects). Key concerns with the use of BOT include the higher cost of private sector financing, lack of capacity of local officials to enter into these types of financing arrangements, and the amount of time and effort spent to arrive at financial closure.
Modest LGU bond market development. The Local Government Unit Guarantee Corporation (LGUGC) was created to guarantee debt issues of local governments when these issues are financed from private sources. It is the first privately managed local government guarantee corporation set up in a developing country in Asia. Six LGU bonds have been floated with the backing of LGUGC, for a total amount of P1.35 billion. However, key impediments to the further development of the local government bond market remain, and include: higher costs in issuing bonds than direct borrowing, lack of reliable information about LGUs, the possibility of political interference in project management or in debt servicing, uncertainty about management capacity at the LGU level, uncertainty about the quality of feasibility studies, lack of an independent rating agency, lack of a market for secondary trading, and lack of access to the Internal Revenue Allotment as security for LGU obligations. While the larger LGUs will be able to utilize bond financing more extensively once the institutional and regulatory issues affecting bond issuance are sufficiently addressed, smaller and lower-income LGUs may not be as fortunate, since the relatively small size of their financing requirement may not justify the fixed expense incurred in arranging a bond flotation.
Private financial institution financing not realized. Some private banks have purchased LGU bonds, but direct lending is almost nil. This is due to a number of factors: the lack of information on LGUs, unfamiliarity with LGU lending, and the lack of loan security that could otherwise be provided by the Internal Revenue Allotment intercept mechanism1 and a depository relationship with LGUs.2 Private banks have indicated that their inability to become depository banks for LGUs has been the chief structural impediment to their entry into the market.
WorldBankInfra.indb 188 12/6/2005 8:42:19 AM

Appendixes 1��
Table A3 Local government borrowings, 1985–2002
Levels (P million) Averages 1985–1991 1992–2002 1991 1995 1999 2001 2002
All LGUs 110 3,538 448 2,493 5,949 6,109 4,219
Provinces 57 806 325 593 771 1,943 1,482
Municipalities 12 657 37 579 561 932 915
Cities 41 2,075 87 1,321 4,618 3,234 1,822
Share of LGU income (%) Averages 1985–1991 1992–2002 1991 1995 1999 2001 2002
All LGUs 0.79 3.75 1.88 3.67 4.94 4.10 2.62
Provinces 1.48 3.49 5.22 3.47 2.71 5.07 3.72
Municipalities 0.23 1.91 0.37 2.25 1.30 1.84 1.61
Cities 0.88 5.61 1.12 5.29 9.49 5.39 2.83
Source: Rosario G. Manasan. 2004. “Infrastructure and Decentralization.” May. World Bank, Manila. Estimates based on Commission on Audit data.
Dominant role of government financial insti-tutions. LGU loans have now become an important and profitable part of the portfolios of two GFIs, namely Land Bank of the Philippines (LBP) and the Development Bank of the Philippines (DBP). LBP uses both ODA and its own resources to lend to LGUs. DBP exclusively relies on ODA resources for LGU loans. The positive experience of these GFIs in lending to LGUs provides a track record that may demonstrate to private banks that the LGU market is a relatively secure and profitable one. The main issue, though, is the failure of GFIs to develop a graduation policy for LGUs to be able to tap the private credit markets. Clearly, the graduation policy designed under the original framework has failed to work since GFIs are still the main financiers to LGUs.
MDF restructuring, and establishment of the Municipal Finance Corporation. The MDF was established in 1984 by Presidential Decree 1914 as a revolving fund for ODA-supported projects for LGUs. In 1998 the Municipal Development Fund Office (MDFO) was created as the first phase MDF restructuring and has since handled subloan promotion, appraisal, and supervision, as well as subloan disbursement and collection. In 2004, the government started the second phase of restructuring,
to transform MDFO into a financial intermediary that would catalyze the emergence of a viable LGU credit market. Executive Order 252 enabled the creation of the Municipal Finance Corporation (MFC), to be established as a corporate entity affiliated to LBP with initial capital subscription from the government (using MDF) and LBP (10% of subscribed capital). MFC’s primary purpose is a non-deposit-taking financing company providing loans directly or indirectly to LGUs. The operationalization of MFC is starting, and is likely to have an important impact on LGU access to financing.
ODA financing to LGUs. The numerous ODA programs for LGUs offer considerable scope for greater effectiveness in using these resources to strengthen LGU capacity. Long-standing constraints include incon-sistency of policies, often unhealthy competition among ODA projects, and lack of leverage of domestic and private financing with almost all LGU lending sourced from ODA. Closer coordination between funding insti-tutions and government agencies is necessary to pave the way for private sector funding of local development in the future. Additionally, a major effort should be undertaken in helping local governments come up with a pipeline of local infrastructure projects and prepare and implement these projects.
Endnotes1 In the event of an LGU defaulting on its loan repayment, the
national government, through the Department of Budget and Management, “intercepts” the Internal Revenue Allotment transfer to LGUs and instead transfers the equivalent amount to the lender. Currently, only the MDFO is given such access to the mechanism.
2 Currently, LGUs are only permitted to open deposit accounts in the GFIs, and not in private financial institutions, except in special circumstances.
WorldBankInfra.indb 189 12/6/2005 8:42:19 AM
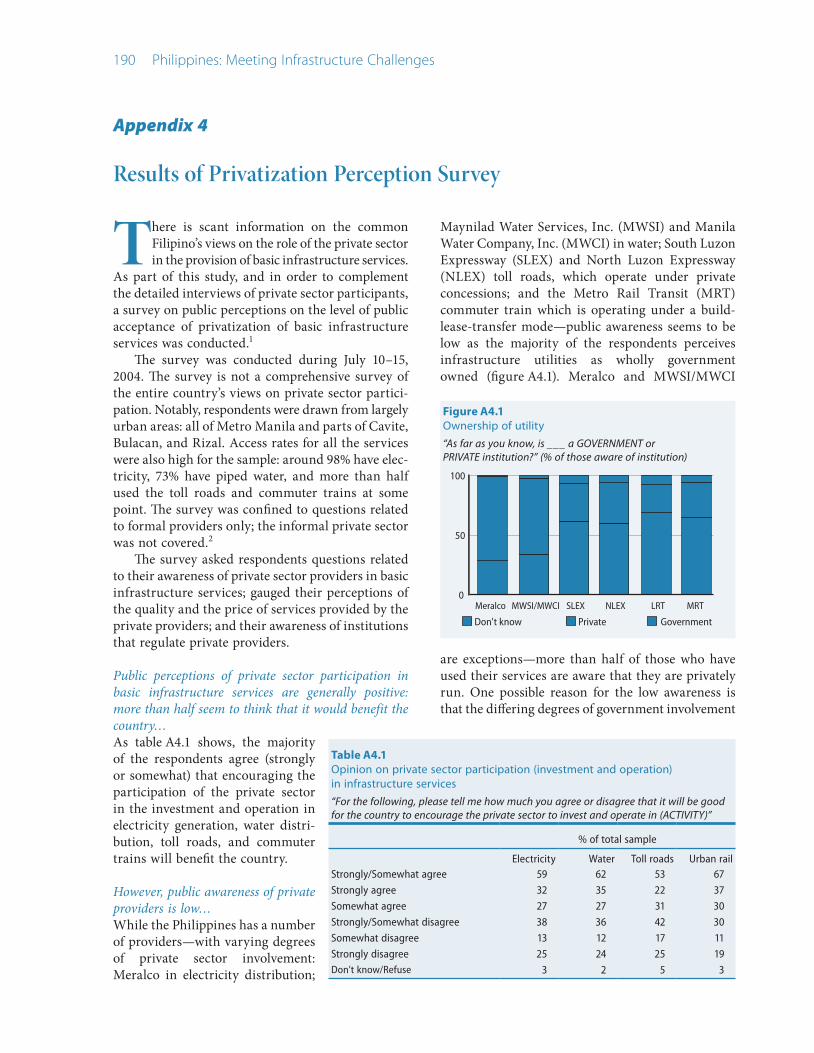
1�0 Philippines: Meeting Infrastructure Challenges
Appendix 4
Results of Privatization Perception Survey
There is scant information on the common Filipino’s views on the role of the private sector in the provision of basic infrastructure services.
As part of this study, and in order to complement the detailed interviews of private sector participants, a survey on public perceptions on the level of public acceptance of privatization of basic infrastructure services was conducted.1
The survey was conducted during July 10–15, 2004. The survey is not a comprehensive survey of the entire country’s views on private sector partici-pation. Notably, respondents were drawn from largely urban areas: all of Metro Manila and parts of Cavite, Bulacan, and Rizal. Access rates for all the services were also high for the sample: around 98% have elec-tricity, 73% have piped water, and more than half used the toll roads and commuter trains at some point. The survey was confined to questions related to formal providers only; the informal private sector was not covered.2
The survey asked respondents questions related to their awareness of private sector providers in basic infrastructure services; gauged their perceptions of the quality and the price of services provided by the private providers; and their awareness of institutions that regulate private providers.
Public perceptions of private sector participation in basic infrastructure services are generally positive: more than half seem to think that it would benefit the country…As table A4.1 shows, the majority of the respondents agree (strongly or somewhat) that encouraging the participation of the private sector in the investment and operation in electricity generation, water distri-bution, toll roads, and commuter trains will benefit the country.
However, public awareness of private providers is low…While the Philippines has a number of providers—with varying degrees of private sector involvement: Meralco in electricity distribution;
Maynilad Water Services, Inc. (MWSI) and Manila Water Company, Inc. (MWCI) in water; South Luzon Expressway (SLEX) and North Luzon Expressway (NLEX) toll roads, which operate under private concessions; and the Metro Rail Transit (MRT) commuter train which is operating under a build-lease-transfer mode—public awareness seems to be low as the majority of the respondents perceives infrastructure utilities as wholly government owned (figure A4.1). Meralco and MWSI/MWCI
are exceptions—more than half of those who have used their services are aware that they are privately run. One possible reason for the low awareness is that the differing degrees of government involvement
Table A4.1 Opinion on private sector participation (investment and operation) in infrastructure services“For the following, please tell me how much you agree or disagree that it will be good for the country to encourage the private sector to invest and operate in (ACTIVITY)”
% of total sample
Electricity Water Toll roads Urban railStrongly/Somewhat agree 59 62 53 67
Strongly agree 32 35 22 37
Somewhat agree 27 27 31 30
Strongly/Somewhat disagree 38 36 42 30
Somewhat disagree 13 12 17 11
Strongly disagree 25 24 25 19Don’t know/Refuse 3 2 5 3
Figure A4.1Ownership of utility“As far as you know, is ___ a GOVERNMENT or PRIVATE institution?” (% of those aware of institution)
0
50
100
Don't know Private Government
MRTLRTNLEXSLEXMWSI/MWCIMeralco
WorldBankInfra.indb 190 12/6/2005 8:42:19 AM

Appendixes 1�1
in private sector participation arrangements is often not clear—for example, the Philippine National Construction Corporation (PNCC) involvement as a government owned and controlled corporation (GOCC) in the SLEX and NLEX toll road concessions. Moreover, in sectors such as electricity and water, there is substantial government involvement in the input/resource side: the National Power Corporation (NPC) provides some electricity to Meralco; MWSI and MWCI are only distributors—they purchase water in bulk from the publicly owned Metropolitan Waterworks and Sewerage System (MWSS).
Public perceptions of profits made by private providers are not accurate…As table A4.2 shows, when asked whether providers
such as MWSS and NPC, along with agencies in the toll roads and commuter rails subsector, are posting profits, an overwhelming majority believe that these agencies are posting profits, be they great or small.3 One interesting outcome is how the respondents see NPC’s financial position: the perception is the exact opposite to reality, i.e. NPC has been operating with a deficit since the early 1990s.
The misperception that most private providers are earning profits gives an impression that service providers are more than capable of shouldering the cost of any activity to improve quality, and thus have no basis for passing the cost on to consumers by increasing the user charges.
Moreover, public awareness of institutions that regulate private providers is also low…The majority (51% for water, more than 75% for commuter trains, 69% for NLEX, and 74% for SLEX) responded that the government controls the price
Table A4.2 Opinion on profits and losses“As far as you know, how big or small are the profits or losses of ___?”
% of total who used/aware of service
Great profits
Some profits
Hardly any profit
or loss
Some losses
Great losses
Don’t know
NPC 53 25 2 8 7.0 5MWSS 44 34 7 7 3.0 5
SLEX 51 36 5 2 1.0 5
NLEX 51 31 10 2 1.0 5
LRT 50 39 6 1 0.3 4MRT 48 37 6 1 1.0 6
of the utilities, though this perception is somewhat split in the power sector (table A4.3). When this majority was further asked to name the government agency responsible for setting tariffs, more than
Table A4.3Knowledge on whether price of service controlled by government“Is the price of the services under GOVERNMENT CONTROL OR NOT? IF CONTROLLED: Which government agency is this?” (% of total who used/aware of servicea)
Electricity Water
Under gov’t. control 49 Under gov’t. control 51Don’t know 63 Don’t know 65
NPC 12 MWSS 23
ERC 11 ERC 2
ERB 4 Can’t recall 2
President 3 NPC 1
DOE 2 LWUA 1
Not under gov’t. control 48 Not under gov’t. control 44
Don’t know 3 Don’t know 5
NLEX SLEX
Under gov’t. control 69 Under gov’t. control 74Don’t know 62 Don’t know 62
DPWH 11 DPWH 12
PNCC 11 PNCC 10
Can’t recall 4 Can’t recall 3
DOTC 2 DOTC 2
LTFRB 2 LTFRB 2
LTO 2 LTO 1
Not under gov’t. control 22 Not under gov’t. control 19
Don’t know 9 Don’t know 7
LRT MRT
Under gov’t. control 78 Under gov’t. control 77Don’t know 68 Don’t know 70
DOTC 10 DOTC 11
LTO 6 LTO 4
Can’t recall 3 Can’t recall 1
LTFRB 2 LTFRB 1
DPWH 2 DPWH 2
No idea 1
Not under gov’t. control 13 Not under gov’t. control 16
Don’t know 10 Don’t know 7
a. For agencies: the corresponding figures are % of those who used the service and say that price is under government control. The agencies reported here are the top seven mentioned.
LTO = Land Transportation Office; DOTC = Department of Transportation and Communications; LTFRB = Land Transportation Franchising and Regulatory Board; DPWH = Department of Public Works and Highways; LWUA = Local Water Utilities Administration; ERC/B = Energy Regulatory Commission/Board; MWSS = Metropolitan Waterworks and Sewerage System; NPC = National Power Corporation; PNCC = Philippine National Construction Corporation.
WorldBankInfra.indb 191 12/6/2005 8:42:20 AM

1�� Philippines: Meeting Infrastructure Challenges
60% responded that they did not know the agency responsible.
Interestingly, the agencies they identified, in reality, are not involved in such activities. For example, only one respondent each for SLEX and NLEX users correctly identified the Toll Regulatory Board while DPWH garnered the highest answer for these two toll roads.4 In electricity, NPC, a power supplier, actually ranked higher than the Energy Regulatory Commission (ERC)/Energy Regulatory Board (ERB) as the agency thought to be responsible for setting tariffs.
When respondents were asked specifically about their perceptions of the ERC, more than a quarter (36%) were not even aware of ERC’s existence, and 17%, while acknowledging ERC’s existence, stated that they did not know what it does (table A4.4). Only 1.7% of the respondents (correctly) identified ERC’s role as a regulator of the price of electricity. A
small fraction (1.3%) incorrectly identified ERC as a supplier of electricity.
These perceptions simply point to the lack of awareness of the various regulatory institutions and their roles.
Public awareness of price and quality by private providers varies …Price. As figure A4.2 shows, the majority of the users of toll roads and urban rail, and the consumers of MWCI/MWSI believe that the price they pay is just right compared to the (perceived) cost of providing the service. For Meralco customers however, the majority perceives that it is paying a higher price vis-à-vis the cost of providing electricity. For the SLEX Skyway, users are somewhat split on whether
Table A4.4Perceived function of the Energy Regulatory Commission“Can you please tell me in one or two sentences only, what you think is the job of the Energy Regulatory Commission?”
% of total sample
Not aware of ERC 36.3Not know what ERC does 17.0
Regulates the price of electricity 1.7
Supplies electricity 1.3
In charge of pricing electricity 0.7
Controls and regulates electricity 0.7
Runs the power industry 0.7
Supplies and regulates electricity 0.7
Others (varying responses) 40.9
they are paying enough, or more than enough. Only a very small percentage of the sample perceives that the price for these services is inadequate to cover the (perceived) cost of provision.
Quality. Overall, as figures A4.3 and A4.4 illustrate, the majority perceives the present quality of services to be good/fair, especially for the commuter trains (i.e. MRT/LRT). Compared to five years ago,
Figure A4.3Present quality“What can you say about the present quality of the service?” (% of aware/used service)
Don't knowVery poorPoorFairGoodVery good
Electricity
Water
SLEX
NLEX
LRT
MRT
0 25 50 75 100
Figure A4.4Quality compared to 5 years ago“Compared to 5 years ago, is the quality of service…” (% of aware/used service)
NA/Don't knowThe sameWorse nowBetter now
Electricity
Water
SLEX
NLEX
LRT
MRT
0 25 50 75 100
Figure A4.2Price vis-à-vis the cost of provision“Compared to the cost of providing the service to you, is the price you pay…” (% of aware/used service)
Don't knowBelow the costAbove the costOnly fair
Electricity
Water
SLEX
SLEX Skyway
NLEX
LRT
MRT
0 25 50 75 100
WorldBankInfra.indb 192 12/6/2005 8:42:20 AM

Appendixes 1��
however, the majority of the respondents perceive that all services neither improved nor worsened. The same can be said for MRT, which has been operational only for a few years.
Price and quality combined. When asked whether they agree on the notion that the quality of services will improve unless consumers pay more for the service, only a little more than a quarter agreed (table A4.5). However, an overwhelming majority (somewhat/strongly) disagreed (74% for electricity, 70% for NLEX, 67% for water and the SLEX, and 66% and 63% for LRT and MRT). This finding is not surprising given the fact that most believe they are paying enough for the quality of service that they perceive to be good/fair, and which appears to them, to have remained at the same levels for the past five years.
Table A4.5Perception on the trade-off between quality and price“Agree or disagree: Quality will not improve unless consumers pay a higher price”
% of total sample
Strongly agree
Somewhat agree
Somewhat disagree
Strongly disagree
Don’t know
Electricity 7 19 33 41 0.3Water 7 25 31 36 1
Toll Roads
SLEX 9 23 31 36 1
NLEX 8 20 34 36 2
Urban Rail
LRT 9 23 32 34 2
MRT 9 25 31 32 3
Endnotes1 The survey was conducted in conjunction with the Social Weather
Stations, a non-stock, nonprofit social research organization. The sample consisted of 300 individuals with equal numbers of males and females residing in service areas of the MWSS concession-aires and from the 25 to 54 age group. Some attained a high school diploma (28%) and some a college education (24%). Only 18% had completed college. A total of 48% were currently employed while more than half were unemployed (39% were not working but had worked before; 13% had never worked). Out of the employed sample, an equal number of the individuals (49% each) were working either for the private sector or were self-employed (mostly nonagricultural entrepreneurs) while a small number (2%) were working for the government. In terms of media access, though only 23% read the newspaper daily, TV seemed to be the more popular type of media with 62% of the
respondents watching TV daily, three or more hours a day; 35% seldom listened to the radio though 27% listened for three or more hours a day.
2 Other data sources on independent or informal private providers are available, such as those in the Filipino Report Card on Pro-Poor Services. 2001. World Bank, Manila. May 30; and Arthur C. McIntosh. 2003. Asian Water Supplies: Reaching the Urban Poor. Manila: ADB.
3 Note that though NPC is a public generating company, it also purchases electricity from private independent power producers, which is sold to distributors.
4 The Department of Public Works and Highways answer should not be classified as wholly incorrect as the Toll Regulatory Board was previously lodged under it.
WorldBankInfra.indb 193 12/6/2005 8:42:21 AM

1�� Philippines: Meeting Infrastructure Challenges
Appendix 5
Costs and Benefits of Sector Reforms
This appendix presents the cost-benefit analyses of some of the elements of the proposed reforms in the power, water supply, road, and
telecommunications sectors.
Power
The Philippine power sector is in a critical state of development. The sector’s immediate concerns are for the National Power Corporation (NPC) to regain financial sustainability. At the same time, the sector is launching a comprehensive and ambitious reform program in a remarkably short amount of time. These developments will be accompanied by significant changes in end-user tariffs. First, NPC’s generation tariff is likely to increase in the near term to help remedy its immediate financial crisis. Second, interclass subsidies will be removed in the near term, raising residential tariffs and lowering commercial and industrial tariffs. Third, tariffs will most likely move to long-run marginal cost (LRMC) levels in the long term as the implementation of the wholesale electricity spot market (WESM) begins. These changes will have significant effects on consumer welfare and NPC’s financial standing.
By estimating end-user tariff paths by region and customer type resulting from the changes described above, and employing standard consumer surplus analysis, one can derive rough estimates of the benefits of reform. The analysis yields short-term (2004 to 2006) losses of approximately $300 million (0.1% of GDP), mainly due to the assumed P1.6/kilowatt-hour (kWh) increase in NPC generation tariffs from its beginning of year 2004 levels (of which P0.98 has already been approved). While losses exist in all three regions, the greatest loss in consumer surplus exists in Mindanao at about $175 million. By customer type, residential and industrial end users suffer losses of about $240 million and $100 million, respectively, while the commercial sector gains approximately $40 million. The improved financial standing of NPC dwarfs the short-term loss in consumer welfare. According to preliminary financial projections, given a P1.4/kWh increase in generation tariffs, reductions in NPC operating costs and capital expenditures by
about P6 billion each, privatization of the majority of NPC assets and the National Transmission Corpo-ration (Transco) by 2006, universal charge for stranded cost recovery, and debt absorption of P194 billion, NPC’s losses decrease by about $4,258 million (2.3% of GDP) in 2005 and 2006 compared to the status quo scenario. This reduction in losses represents a gain to Filipino taxpayers.
In the long run (2004 to 2008) as WESM begins operation in Luzon, electricity costs will approach LRMC. Assuming that end users reap the benefits of lower costs and WESM begins in 2007, taking two years to reach LRMC, initial analysis shows a total gain ranging from $2,400 million (0.5% of GDP) to $3,200 million (0.7% of GDP), depending on assumptions regarding elasticities and stranded cost recovery. Luzon accounts for all of this gain, with losses still occurring in the Visayas and Mindanao, highlighting the need for effective social protection mechanisms, particularly in Mindanao. Further, Luzon’s commercial sector enjoys the greatest benefits at $1,100 million–1,400 million (0.2%–0.3% of GDP). Note that these benefits do not include the long-term improvements in NPC’s financial standing, which would certainly be a significant portion of the benefits derived from the power reform program.
It must be noted that these figures are based on numerous assumptions and should therefore be considered with caution. Due to a lack of data and an uncertain future, assumptions on elasticities, elec-tricity consumption, tariff paths, and the speed and elements of market reform were required, limiting the reliability of the figures. The figures also ignore the broad economic impact of the changes brought about by power reform. Despite these shortcomings, the estimates provide useful figures.
MethodologyThe analysis uses a model that calculates changes in consumer surplus due to changes in end-user tariffs for each of the three types of customers (residential, commercial, industrial) within the three grids (Luzon, Visayas, and Mindanao). The changes in tariffs result from an NPC generation tariff increase and removal of interclass subsidies in the short run. In the long run, tariffs in Luzon are affected by the introduction
WorldBankInfra.indb 194 12/6/2005 8:42:21 AM

Appendixes 1��
of WESM. The model takes into account the steady state of growth in electricity demand due to GDP increases, but isolates the price effect on consumer surplus by comparing the consumer surplus after a change in price with the consumer surplus if no change in price had occurred (but GDP still grew in both cases).
The analysis also considers the financial impact of the tariff increase and other possible reform measures on consolidated NPC/Power Sector Assets and Liabilities Management Corporation (PSALM)/Transco financials. The preliminary projections are based on numerous assumptions on privatization, cost reductions, and government debt absorption, but they do give a sense of the total financial benefits if the reforms are imple-mented according to plan.
Inputs and assumptionsThe model requires numerous inputs and assumptions, which were based on information from the Energy Regulatory Commission (ERC), PSALM, Asian Development Bank (ADB), sector specialists, and best estimates. The main inputs are as follows:
Tariff inputsCurrent average tariffs for each customer type and grid are based on the 2004 beginning of year average tariffs of the 19 private utilities in the Philippines.A P1.6/kWh increase in the NPC generation tariff from the beginning of year 2004 tariff is required to cover operating costs.Of this NPC generation tariff increase, customers in Luzon only experience a P1.04/kWh increase since Meralco, which accounts for 70% of consumption in Luzon, procures only 50% of its electricity from NPC.Average interclass subsidies, derived from the unbundled tariff schedules of 11 private utilities, are gradually removed over three years starting in 2004.WESM will start in 2007 and is implemented only in Luzon, where tariffs are expected to reach LRMC two years after initial implementation.LRMC is derived from the ADB report “Welfare Effects of Power Sector Reforms” and are calcu-
•
•
•
•
•
•
lated to be P3.69/kWh for residential, P2.78/kWh for commercial, and P2.79/kWh for industrial end users.1Stranded cost after the implementation of WESM is estimated to be P0.55/kWh (used for scenario analysis).
Table A5.1 displays the tariff paths that result using the assumptions above. It must be noted that these tariff paths are not the official view of the World Bank and are based on numerous optimistic and simplistic assumptions. They should therefore be considered with caution.
Consumer surplus inputsLow range constant price elasticities are based on sector reports and are –0.6 for Luzon, -0.5 for Visayas, and –0.5 for Mindanao for all customer types.High range constant price elasticities are based on sector reports and are –0.7 for Luzon, -0.6 for Visayas, and –0.6 for Mindanao for all customer types.
•
•
•
Table A5.1Tariff paths at nominal prices (P/kWh)
2003 2004 2005 2006 2007 2008
Residential Luzon 5.75 6.91 7.04 7.16 5.43 3.69 Visayas 4.88 6.52 6.56 6.61 6.61 6.61
Mindanao 3.12 4.90 5.08 5.26 5.26 5.26
Commercial Luzon 6.09 7.00 6.87 6.74 4.76 2.78 Visayas 5.24 6.79 6.74 6.69 6.69 6.69
Mindanao 3.47 5.07 5.08 5.08 5.08 5.08
Industrial Luzon 5.23 6.15 6.03 5.90 4.34 2.78 Visayas 5.00 6.54 6.49 6.44 6.44 6.44 Mindanao 2.78 4.27 4.15 4.04 4.04 4.04
Table A5.2Electricity consumption, 2003 (GWh)
LuzonResidential 14,178Commercial 12,210Industrial 12,166
VisayasResidential 1,744Commercial 632Industrial 2,125
MindanaoResidential 1,677Commercial 826Industrial 3,512
WorldBankInfra.indb 195 12/6/2005 8:42:21 AM

1�� Philippines: Meeting Infrastructure Challenges
Constant income elasticities are based on sector reports and are 0.6 for residential users, 0.6 for commercial users, and 1.2 for industrial users across all grids.2003 electricity consumption figures are presented in table A5.2 above and are estimates based on reports.
Financial analysis inputsBase-case scenario
No asset saleNo debt absorption by national governmentStatus quo organizationNo asset/debt transfer to PSALMTransco capital expenditure capped at $350 million for five yearsSales/generation forecast based on Philippine Energy Plan 2004.
Alternative scenarioTariff increase of P1.4 per kWh (already partially achieved)Reduction in NPC operating costs by P6 billionTransco privatization and most of NPC’s generation assets privatized by 2006Universal charge for stranded cost recoveryReductions in capital expen-ditures by P5 billion and P7 billion in 2005 and 2006 respectivelyNational government debt absorption of P194 billion and related principal repayment and interest expense.
ResultsThe model calculates a range for the net change in consumer surplus, with the results depending on high or low constant price elasticity, and stranded cost recovery after the implemen-tation of WESM. The detailed results of the lowest and highest figures are presented in tables A5.3 and A5.4.
•
•
•◊◊
◊◊
◊
◊
•◊
◊
◊
◊
◊
◊
Table A5.3Net change in consumer surplus due to changes in tariffs, lower bound (high price elasticity, stranded cost recovery, $ million)
2004 2005 2006Short term
% GDP 2007 2008Long term
% GDP
Luzon Residential -99 -47 7 -139 -0.1 249 617 726 0.2
Commercial -46 23 94 70 0.0 323 681 1074 0.2
Industrial -56 7 75 26 0.0 266 588 880 0.2
Total -202 -18 176 -44 0.0 838 1,886 2,680 0.6
Visayas Residential -19 -13 -7 -39 0.0 0 7 -32 0.0
Commercial -6 -3 -1 -10 0.0 2 5 -3 0.0
Industrial -22 -13 -3 -37 0.0 6 17 -14 0.0
Total -47 -29 -11 -86 0.0 8 29 -49 0.0
Mindanao Residential -22 -20 -18 -60 0.0 -14 -9 -83 0.0
Commercial -10 -7 -5 -22 0.0 -3 0 -24 0.0
Industrial -40 -29 -18 -87 0.0 -9 0 -95 0.0
Total -71 -56 -41 -168 -0.1 -25 -9 -202 0.0
Philippines Residential -140 -80 -18 -238 -0.1 235 615 612 0.1
Commercial -62 12 88 38 0.0 323 686 1046 0.2
Industrial -117 -35 54 -98 0.0 264 605 770 0.2Total -320 -103 125 -298 -0.1 822 1,906 2,429 0.5
Table A5.4Net change in consumer surplus due to changes in tariffs, upper bound (low price elasticity, no stranded cost recovery, $ million)
2004 2005 2006Short term
% GDP 2007 2008Long term
% GDP
Luzon Residential -100 -47 7 -140 -0.1 329 709 898 0.2
Commercial -53 26 106 79 0.0 440 857 1376 0.3
Industrial -63 8 84 28 0.0 379 756 1164 0.2
Total -216 -14 197 -33 0.0 1,149 2,323 3,438 0.7
Visayas Residential -21 -15 -8 -43 0.0 0 8 -36 0.0
Commercial -7 -4 -1 -11 0.0 2 5 -4 0.0
Industrial -24 -14 -3 -42 0.0 7 19 -17 0.0
Total -53 -33 -12 -97 0.0 9 32 -56 0.0
Mindanao Residential -24 -22 -19 -65 0.0 -15 -10 -89 0.0
Commercial -10 -8 -5 -24 0.0 -3 0 -27 0.0
Industrial -43 -31 -19 -93 0.0 -10 0 -102 0.0
Total -77 -61 -44 -181 -0.1 -27 -9 -218 0.0
Philippines Residential -145 -84 -20 -248 -0.1 315 707 774 0.2
Commercial -70 14 100 43 0.0 440 863 1346 0.3
Industrial -130 -38 61 -107 0.0 376 775 1045 0.2Total -345 -107 141 -311 -0.1 1,131 2,345 3,165 0.7
WorldBankInfra.indb 196 12/6/2005 8:42:22 AM

Appendixes 1��
The tables show short-term consumer surplus losses of about $300 million, derived mainly from resi-dential customers in Luzon as they lose their interclass subsidy. Short-term losses are also significant for residential customers in Mindanao, which may be more of a concern than the larger losses in Luzon since Mindanao is significantly poorer. Over the long term, Luzon enjoys substantial gains ($2,700 million–3,400 million) as WESM in implemented and end-user tariffs reflect LRMC. However, Mindanao and Visayas continue to suffer losses in the long term. Overall, the net gain in consumer surplus ranges from $2,400 million–3,200 million (0.5–0.7% of GDP).
Preliminary financial estimates show that if the Philippines proceeds with the financial alternative scenario assumptions presented above (tariff increase of P1.4/kWh, reduction of NPC operating costs by P6 billion, Transco and NPC generation asset privati-zation by 2006, stranded cost recovery, capital expen-diture reductions, and debt absorption of P194 billion), the total change in consolidated NPC/PSALM/Transco losses is $4,258 million (2.3% of GDP) over 2005 and 2006 compared to the status quo scenario. This short run financial gain is significant and would only increase if projected out until 2008.
Due to a lack of data and an uncertain future, numerous assumptions on price and income elas-ticities, electricity consumption, tariff paths, and the speed and elements of market reform were required, limiting the reliability of the figures. They are only intended to provide rough estimates of the benefits of reform and must be interpreted with caution. The figures ignore the broad economic impact of the changes brought about by power reform, such as a more competitive industry and commercial sector. Despite these shortcomings, the estimates do provide useful figures that are helpful to consider.
Water supply
Growth in access to water services in the Phil-ippines has stalled. In fact, some estimates indicate that access levels nationwide have fallen over the last few years. Lack of cost-recovery tariffs and high levels of nonrevenue water in the sector constrain the amount of sustainable investment. If the Philippines is to expand level 3 access to the 56% of those who currently do not have it, service providers will have to address these two issues.
Rough estimates of the net benefits of increasing access to level 3 connections through raising water
tariffs by 35% and gradually improving efficiency by 20% total $8.8 billion (1.3% of GDP) over seven years. These figures were derived using standard consumer surplus analysis. The analysis calculates changes in consumer surplus for both inside and outside the National Capital Region. It first determines the increase in profit (as compared to the case in which no reforms take place) due to the increase in tariffs and efficiency, and then calculates the number of new level 3 connections that can be built from those additional profits. Next, it estimates the net change in consumer surplus from increasing current level 3 tariffs and providing level 3 connections to households currently using level 2, level 1, and self-provisioning as their main water source. Table A5.5 summarizes the results of the analysis (table A5.7 gives details).
It must be noted that these figures are based on numerous assumptions and should therefore be considered with caution. Further, data on the sector are scarce and numerous estimates of aggregate figures were required, including assumptions about average consumption, tariffs, connection fees, etc. Therefore, it is likely that location-specific benefits will vary widely. These figures are conservative, underestimating the benefits of reform by not taking into account the time saved from having a household connection in comparison with collecting water from a communal source or private vendor. Despite these shortcomings, the estimates provide useful figures.
Table A5.5Net benefits of increasing level 3 access over seven years
Total net benefit/loss
National Capital Region Number of households gaining level
3 access800,000
Initial loss in CS from existing level 3 customers (P million)
-5,432
Change in CS after gaining level 3 access (P million)
59,833
Outside National Capital Region
Number of households gaining level 3 access
8,160,000
Initial loss in CS from existing level 3 customers (P million)
-48,211
Change in CS after gaining level 3 access (P million)
486,359
Total change in consumer surplus
P million 492,549
$ million 8,843
% of GDP 1.3
CS = consumer surplus.
WorldBankInfra.indb 197 12/6/2005 8:42:22 AM
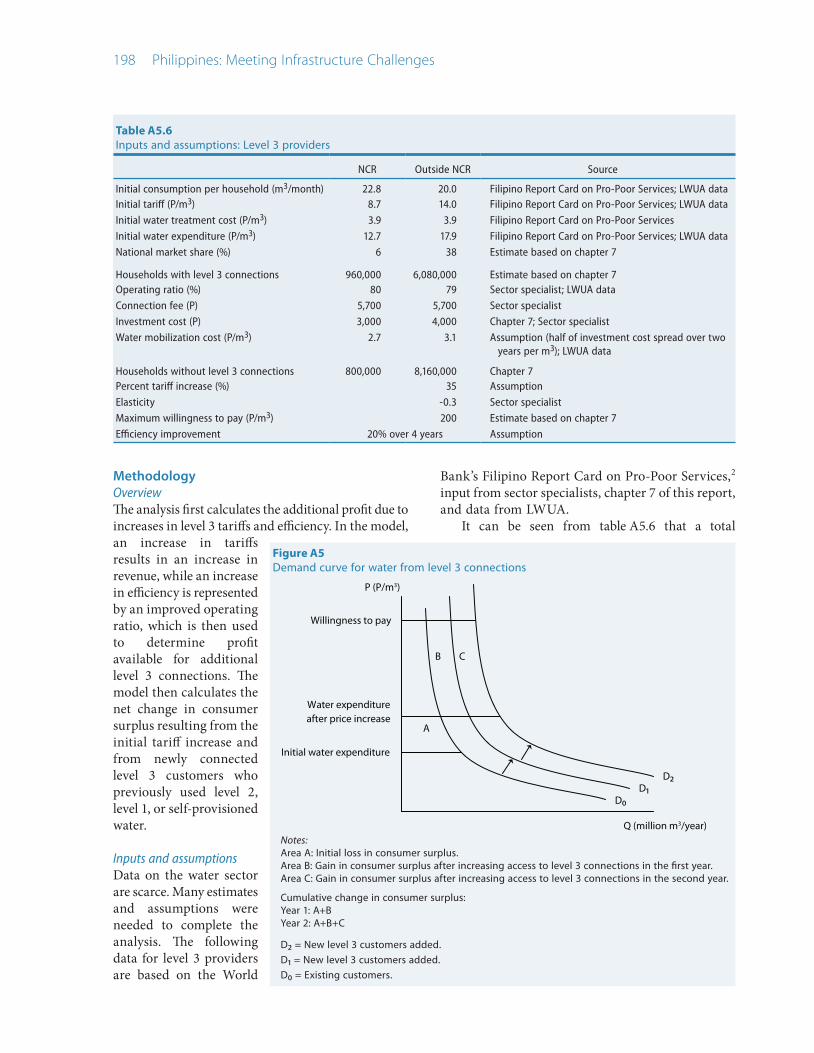
1�� Philippines: Meeting Infrastructure Challenges
MethodologyOverviewThe analysis first calculates the additional profit due to increases in level 3 tariffs and efficiency. In the model, an increase in tariffs results in an increase in revenue, while an increase in efficiency is represented by an improved operating ratio, which is then used to determine profit available for additional level 3 connections. The model then calculates the net change in consumer surplus resulting from the initial tariff increase and from newly connected level 3 customers who previously used level 2, level 1, or self-provisioned water.
Inputs and assumptionsData on the water sector are scarce. Many estimates and assumptions were needed to complete the analysis. The following data for level 3 providers are based on the World
Bank’s Filipino Report Card on Pro-Poor Services,2 input from sector specialists, chapter 7 of this report, and data from LWUA.
It can be seen from table A5.6 that a total
Table A5.6 Inputs and assumptions: Level 3 providers
NCR Outside NCR Source
Initial consumption per household (m3/month) 22.8 20.0 Filipino Report Card on Pro-Poor Services; LWUA dataInitial tariff (P/m3) 8.7 14.0 Filipino Report Card on Pro-Poor Services; LWUA data
Initial water treatment cost (P/m3) 3.9 3.9 Filipino Report Card on Pro-Poor Services
Initial water expenditure (P/m3) 12.7 17.9 Filipino Report Card on Pro-Poor Services; LWUA data
National market share (%) 6 38 Estimate based on chapter 7
Households with level 3 connections 960,000 6,080,000 Estimate based on chapter 7Operating ratio (%) 80 79 Sector specialist; LWUA data
Connection fee (P) 5,700 5,700 Sector specialist
Investment cost (P) 3,000 4,000 Chapter 7; Sector specialist
Water mobilization cost (P/m3) 2.7 3.1 Assumption (half of investment cost spread over two years per m3); LWUA data
Households without level 3 connections 800,000 8,160,000 Chapter 7Percent tariff increase (%) 35 Assumption
Elasticity -0.3 Sector specialist
Maximum willingness to pay (P/m3) 200 Estimate based on chapter 7
Efficiency improvement 20% over 4 years Assumption
Figure A5Demand curve for water from level 3 connections
Q (million m3/year)
A
B C
D0
P (P/m3)
D1D2
Initial water expenditure
Water expenditureafter price increase
Willingness to pay
Notes:Area A: Initial loss in consumer surplus.Area B: Gain in consumer surplus after increasing access to level 3 connections in the first year.Area C: Gain in consumer surplus after increasing access to level 3 connections in the second year.
Cumulative change in consumer surplus:Year 1: A+BYear 2: A+B+C
D2 = New level 3 customers added.D1 = New level 3 customers added.D0 = Existing customers.
WorldBankInfra.indb 198 12/6/2005 8:42:22 AM

Appendixes 1��
of 8.96 million households do not have a level 3 connection. In the analysis, once these households are connected, no additional level 3 connections are built. It is also important to note that the estimated maximum willingness to pay is P200/m3. This figure is an important part of the consumer surplus calcu-lation and is based on the maximum price for water purchased from a water tanker. Figure A5 provides greater detail on the areas that the model calculates to estimate consumer surplus. Changes in consumer surplus are cumulative in order to properly compare the effect of the tariff and efficiency reforms against the status quo scenario in which nothing changes. So, new level 3 users continue to experience gains in consumer surplus in years following the initial connection, while existing level 3 users experience losses even after the initial tariff increase.
ResultsTable A5.7 displays the results of the analysis. In total, all 8.96 million households gain access to level 3 connections over five years if all extra profit from raising tariffs by 35% and improving efficiency by 20% is used to build connections. These reforms result in a net gain of $8.8 billion over seven years (1.3% of GDP). Approximately 90% of the net gain in consumer surplus comes from outside the NCR.
Since numerous assumptions and estimates were needed to derive these figures, they must be inter-preted with caution. In particular, the model required many nationwide averages on tariffs, expenditure, and consumption, which may limit the significance of the results. In addition, there is significant variation in utility characteristics and the situation will therefore
vary by location. Further, the estimates do not take into account time saved from having a household connection instead of having to collect water from communal sources. Despite these shortcomings, the analysis provides a useful, rough estimate of potential benefits of reforms as called for in chapter 7.
Road transport
A cost-benefit analysis (CBA) exercise has been conducted to estimate the net benefits of scaling up maintenance expenditure for the national road network, the backbone of the transport system in the Philippines. As discussed in more detail in chapter 8, scaling up maintenance is identified as a key element in the proposed reform of the Philippines transport sector, given the backlog of maintenance that has been accumulated over time. Whereas significant data constraints prevent a full-fledged CBA from being conducted, the proposed exercise never-theless provides a useful tool to measure the order of magnitude of the net benefits associated with the recommended maintenance expenditure plan.
The financing cost of scaling up maintenanceThe annual requirement for the maintenance of the national road network in the Philippines is estimated at about P16 billion (2003 pesos). As shown in table A5.8, government allocation to road maintenance falls short of the amount needed for network preservation. The backlog of maintenance expenditure is expected to impede further improvements in the condition of the national road network, unless timely policy
Table A5.7 Net changes in consumer surplus
Year 1 2 3 4 5 6 7 Total
National Capital Region Number of households gaining level 3 access 88,896 201,866 339,162 170,076 0 0 0 800,000
Initial loss in CS from existing level 3 customers (P million) -776 -776 -776 -776 -776 -776 -776 -5,432
Change in CS after gaining level 3 access (P million) 1,264 4,133 8,953 11,371 11,371 11,371 11,371 59,833
Outside National Capital Region
Number of households gaining level 3 access 594,866 1,220,746 1,961,820 2,993,252 1,389,316 0 0 8,160,000
Initial loss in CS from existing level 3 customers (P million) -6,887 -6,887 -6,887 -6,887 -6,887 -6,887 -6,887 -48,211
Change in CS after gaining level 3 access (P million) 7,728 23,586 49,072 87,957 106,005 106,005 106,005 486,359
Total change in consumer surplus
P million 1,328 20,056 50,362 91,664 109,713 109,713 109,713 492,549$ million 24 360 904 1,646 1,970 1,970 1,970 8,843
% of GDP 0.0 0.4 1.0 1.6 1.8 1.8 1.7 1.3
CS = consumer surplus.
WorldBankInfra.indb 199 12/6/2005 8:42:22 AM

�00 Philippines: Meeting Infrastructure Challenges
measures are implemented to reverse the declining trend in maintenance expenditure. The proposed policy recommendation is to scale up maintenance for national roads in order to realign expenditure to the optimal level over the next six years. The annual cost (i.e. the financing gap) of the recommended increase in maintenance expenditure over the period 2004–2009 is estimated at P16.2 billion (nominal pesos), a threefold increase over projected expenditure.
This appendix presents an evaluation of the expected benefits of the recommended increase in maintenance expenditure.
Benefit evaluationThe benefits of scaling up maintenance expenditure are derived using standard consumer surplus analysis. Consumers make their travel decisions by comparing the private benefits derived from an additional vehicle-km traveled with its associated incremental cost. Hence, an implicit demand for vehicle-kms can be derived as a function of vehicle operating costs, the perceived shadow price of vehicle transport. An accurate measure of vehicle operating costs would need to include both market costs and nonmarket costs of travel, travel time being often the most significant among the nonmarket costs of vehicle transport.
Deferring maintenance has unequivocally the effect of inflating vehicle operating expenses, by increasing market travel costs (e.g. by reducing the life expectancy of vehicles) as well as nonmarket costs (e.g. travel time, risk of accident). Table A5.9 presents an estimate of vehicle operating costs by type of road—as an example, the vehicle operating cost of traveling on a paved road in good condition is estimated to be only 46% of the vehicle cost incurred when traveling on unpaved roads in very bad conditions. It has, however, to be noted that the available estimate of vehicle operating costs reported
in table A5.9 fail to account for travel time costs and may therefore significantly underestimate the cost savings associated with better road conditions.
In order to calculate a measure of consumer surplus, a counter-factual scenario is simulated on the
assumption that the proposed realignment of main-tenance expenditure to the optimal expenditure path would bring road conditions in line with the ideal scenario presented in table A5.10 by 2009. The benefits associated with the counterfactual scenario are compared with the status quo scenario, where failure to scale up maintenance expenditure would
impede any improvement in road conditions. The benefit evaluation methodology is based
on the assumption that the demand for vehicle-km traveled is inelastic with respect to vehicle operating costs. Hence, the benefits associated with an increase in maintenance expenditure have been computed under the assumptions that the vehicle-kms traveled would remain constant at the 2004 level (table A5.11) throughout the period 2004–2009. This assumption
Table A5.9 Estimated generic vehicle operating costs (P/km)
Road conditions
Very bad Bad Fair Good
Paved 13.251 11.313 9.374 7.834Unpaved 17.029 13.353 10.610 9.159
Source: DPWH Project Monitoring Office Feasibility Study. 2003.
Table A5.10 Road conditions, by region
Type of roadCurrent scenario (2004) (%) Ideal scenario
(2009) (%)Luzon Visayas Mindanao
Paved Very bad 62 9 68 9 51 9 90 0Bad 9 9 9 10
Fair 41 41 41 15
Good 41 41 41 75
Unpaved Very bad 38 9 32 9 49 9 10 0
Bad 9 9 9 10
Fair 41 41 41 15
Good 41 41 41 75
Source: Current conditions—Paved ration is from DPWH, Roads in the Philippines 2003; road conditions are from Japan Bank for International Cooperation. 2003. “Sector Study for the Road Sector in the Philippines.” June. Ideal conditions—assumption based on Thailand and Indonesia road conditions.
Table A5.8 Maintenance expenditure, national road network (P billion)
2004 2005 2006 2007 2008 2009 Average
Projected 4.7 4.8 5.0 5.2 5.4 5.6 5.1Estimated 17.05 18.49 20.15 22.01 24.08 26.34 21.4Financing gap 12.4 13.7 15.2 16.8 18.7 20.7 16.2
Source: Chapter 8.
WorldBankInfra.indb 200 12/6/2005 8:42:23 AM

Appendixes �01
Table A5.11Vehicle-kms traveled, by region, 2004
Vehicle-kms/day
Luzon 48,642,631Visayas 15,239,797
Mindanao 20,431,238
may lead to underestimating total benefits to the extent that a reduction in vehicle operating costs would in fact induce an increase in total vehicle-km traveled. However, the size of the “forgone benefits” is likely to be small given the short time horizon of the analysis (in the short run demand is generally less responsive to price changes than in the long run). Moreover, the benefits associated with an increase in road use may well be offset by an increase in nonmarket costs (e.g. environmental and congestion costs), which are not accounted for in the analysis.
Results and sensitivity analysisTable A5.12 reports the results of the CBA exercise. For each region, a measure of vehicle operating cost is defined as the weighed average of the estimated vehicle operating cost by type of road. A standard measure of consumer surplus is computed as the difference between vehicle operating costs under the status quo scenario and vehicle operating costs under the counterfactual scenario, multiplied by vehicle-kms traveled.
The CBA exercise indicates that net benefits of the order of 0.1% of GDP could be gained by scaling up maintenance of the national road network. A
Table A5.12 Cost-benefit analysis, 2004–2009
2004 2005 2006 2007 2008 2009 Average
Vehicle operating costs (by region)Luzon 9.65 9.43 9.21 8.99 8.77 8.55
Visayas 9.57 9.36 9.16 8.96 8.75 8.55
Mindanao 9.79 9.54 9.29 9.05 8.80 8.55
Annual benefits (consumer surplus change)P billion 6.90 13.70 20.60 27.40 34.30 41.20 41.20
% of GDP 0.10 0.30 0.40 0.50 0.60 0.70 0.40
Annual cost (financing gap)P billion 12.40 13.70 15.20 16.80 18.70 20.70 20.70
% of GDP 0.30 0.30 0.30 0.30 0.30 0.30 0.30
Annual net benefitsP billion 5.50 0.00 5.40 10.60 15.60 20.40 7.80% of GDP (0.10) 0.00 0.10 0.20 0.30 0.30 0.10
sensitivity analysis has also been carried out to check the robustness of the findings. The order of magnitude of the net benefit (% of GDP) is not affected by variations in the ideal scenario reported in table A5.10, confirming the robustness of the findings to change in the underlying parameters of the coun-terfactual scenario.
The CBA exercise indicates that realigning main-tenance expenditure to the optimal path outlined in table A5.8 can deliver net benefits in the order of 0.1% of GDP. Although the sensitivity analysis indicates that the results are relatively robust, some caution is needed in interpreting the findings owing to data constraints. In particular, the estimated net benefits are likely to be conservative given the following assumptions:
Nonmarket costs. The estimated net benefits fail to account for the nonmarket benefits associated with the proposed increase in maintenance, such as travel time savings and/or reduced risk of acci-dents. While these benefits could not be quan-tified due to data constraints, they may represent a significant share of the total benefits of the proposed maintenance plan.Increase in vehicle travel. The analysis also fails to account for any potential increase in vehicle travel associated with economic development over the period 2004–2009. The proposed maintenance plan would deliver higher benefits to the extent that demand for vehicle transport is expected to be driven up by economic growth.Status quo scenario. The status quo scenario is based on the conservative assumption that road
conditions would not improve if maintenance were not scaled up. However, a more pessimistic status quo scenario could also be envisaged where road conditions would deteriorate further should maintenance expenditure not be realigned to an optimal level. The consumer surplus would clearly be higher if the benefits of the counterfactual scenario were compared against this more pessimistic status quo scenario.Price elasticity. As mentioned, the analysis fails to account for the benefits associated with vehicle travel that would occur as a result of the decline in vehicle operating costs.
•
•
•
•
WorldBankInfra.indb 201 12/6/2005 8:42:23 AM

�0� Philippines: Meeting Infrastructure Challenges
Telecommunications
About 30 million people (40% of the population), mostly rural and poor, remain excluded from the most basic means of modern communication. Some 200 municipalities (out of 1,609) and 34,000 barangays (out of approximately 42,500) do not have a payphone. To address this issue, the 2002 World Bank report “Extending Access to Communication and Information: Recommended Approach and Imple-mentation Plan”3 calls for an expansion of service to underserved municipalities and barangays over five years through the installation of 1,500 municipal telecenters and 8,000 barangay payphones.
This section estimates that the approximate net economic benefit resulting from this expansion plan totals $123 million (0.02% of GDP) over 12 years. On the benefits side, this figure considers the additional operating revenues and added consumer surplus resulting from the new services. On the costs side, it includes the initial and recurrent costs incurred by the operators to supply the services. The $123 million net benefit is comprised of $55 million from the municipal telecenters and $68 million from the barangay payphones.
Due to a lack of data, these estimates are based on numerous assumptions and should therefore be considered with caution. They do not take into account increased access to computers and the Internet, which the telecenters will also include. They also do not consider the opportunity cost of the build-out plan. In addition, broad assumptions on average prices, quantities, costs, and municipalities and barangays limit the reliability of the figures. The figures used in the analysis are best estimates of “representative” figures, but are still useful reference points.
MethodologyOverviewThe analysis calculates the net benefit from building 1,500 municipal telecenters and 8,000 barangay payphones. The net benefit is derived from the following equation:
Net Benefit = Change in Consumer Surplus + Incremental Revenue to Operator – Incremental
Investment and Operating Costs
In order to make this calculation, the analysis first estimates the annual gains in consumer surplus for an individual. For users of both telecenters and
barangay payphones, separate individual gains are calculated for local and long-distance phone calls. Additionally, consumer surplus gains are calculated for those with absolutely no prior access to phone service and those with sparse prior phone service. It then multiplies these individual figures by the expected total number of new telecenter and payphone users to calculate the total change in consumer surplus.
The revenue to the operator is simply the local and national long-distance minutes called from the municipal telecenters and barangay payphones multiplied by their respective prices.
On the cost side, average capital and recurrent costs of municipal telecenters and barangay payphones are taken from the above World Bank report. The average investment costs are multiplied by the number of newly built telecenters and payphones, while the average operation and maintenance costs are multiplied by the number of telecenters and payphones in operation each year.
Inputs and assumptionsSince data on this topic are difficult to obtain, numerous estimates and assumptions were needed to complete the analysis. The following lists the main assumptions needed to calculate the net benefits from telecenters and payphones.
Municipal telecentersEach new municipal telecenter will be built either in a municipality with no phone service, or in one with sparse phone service. The model assumes that the first 105 telecenters built will be built in municipalities with no phone service. The other 1,395 will be built in municipalities with sparse phone service.Users of the new telecenters are assumed to make two 3-minute local phone calls and two 3-minute national long-distance phone calls per month at the current rates of P0.7/min and P5/min, respectively. The alternative price per minute (the price prior to implementation of the plan) used to calculate consumer surplus takes into account travel and time cost needed to gain access to another phone.
In previously unserved areas, the average distance to the nearest phone is 10 km.In previously sparsely served areas, the average distance to the nearest phone is 5 km.Average transport cost is P10/km.
•
•
•
◊
◊
◊
WorldBankInfra.indb 202 12/6/2005 8:42:23 AM

Appendixes �0�
Table A5.13 Inputs and assumptions
Municipal telecenters Source
Number of people served by each municipal telecenter 25,000 Sector specialists
Number of municipalities without any phone service 105 Telecommunications chapter
Local minutes per user per year 78 Sector specialists
National long-distance minutes per user per year 78 Sector specialists
Local price per minute (P) 0.7 Sector specialists
National long-distance price per minute (P) 5.0 Sector specialists
Local payphone calls constant elasticity -0.5 a
National long-distance payphone calls constant elasticity -0.6 Estimate based on a
Average distance to nearest phone in served areas (km one way) 5 Estimate based on a
Average distance to nearest phone in unserved areas (km one way) 10 Estimate
Average transport cost per km (P) 10 Sector specialists
Average travel speed (km/hr) 30 Estimate
Average cost of time per hour (P) 22.5 Estimate based on minimum wage
Share of travel and time cost for phone call (%) 50 Estimate
Alternative local price per minute in served areas (P) 18.6 Calculation based on figures above
Alternative local price per minute in unserved areas (P) 36.5 Calculation based on figures above
Alternative national long-distance price per minute in served areas (P) 22.9 Calculation based on figures above
Alternative national long-distance price per minute in unserved areas (P) 40.8 Calculation based on figures above
New telecenter users as % of those served in previously served areas 2 Estimate
New telecenter users as % of those served in previously unserved areas 10 Estimate
Capital Investment per telecenter ($) 8,000 b
O&M cost per telecenter per year ($) 12,000 b
Useful life (years) 7 Estimate
Barangay payphones Source
Number of people served by each barangay payphone 1,000 Estimate
Local minutes per user per year 78 Sector specialists
National long-distance minutes per user per year 78 Sector specialists
Local price per minute (P) 0.7 Assumed to be same price as municipal telecenters
National long-distance price per minute (P) 5.0 Assumed to be same price as municipal telecenters
Local payphone calls constant elasticity -0.5 a
National long-distance payphone calls constant elasticity -0.6 Estimate based on a
Average distance to nearest phone in unserved areas (km one way) 10 Estimate
Average transport cost per km (P) 10 Sector specialists
Average travel speed (km/hr) 30 Estimate
Average cost of time per hour (P) 22.5 Estimate based on minimum wage
Share of travel and time cost for phone call (%) 50 Estimate
Alternative local price per minute in unserved areas (P) 36.5 Estimate
Alternative national long-distance price per minute in unserved areas (P) 40.8 Estimate
New payphone users as % of those served in previously unserved areas 10 Estimate
Capital investment per payphone ($) 1,000–1,500
b
O&M cost per telecenter per year (% of investment) 15 b
Useful life (years) 7 Estimate
a. Robert J. Saunders. 1983. “Telecommunications and Economic Development.” A World Bank Country Economic Report. The Johns Hopkins University Press.
b. Björn Wellenius. 2002. “Extending Access to Communication and Information: Recommended Approach and Implementation Plan.” Report submitted to the Republic of the Philippines Department of Transportation and Communication, February 21. PPIAF and World Bank, Manila.
Note: Estimates are by World Bank staff.
WorldBankInfra.indb 203 12/6/2005 8:42:24 AM

�0� Philippines: Meeting Infrastructure Challenges
Table A5.14Telecom build-out plan and users during initial construction period
Year 1 Year 2 Year 3 Year 4 Year 5 Total
New municipal telecenters built 100 200 600 400 200 1,500
New telecenter users in unserved municipalities
250,000 12,500 0 0 0 262,500
New telecenter users in municipalities already served
0 97,500 300,000 200,000 100,000 697,500
New barangay payphones built 500 1,000 4,000 2,000 500 8,000
New payphone users in unserved barangays
50,000 100,000 400,000 200,000 50,000 800,000
Average travel speed is 30 km/hr.Average cost of time based on the current minimum wage is P22.5/hr.Since it is rare for someone to travel just to make a call, the model assumes that 50% of the travel and time costs are attributable to the cost of the call.
The alternative prices per minute are calculated to be P18.6/min for a local call in previously served areas, P36.5/min for a local call in previ-ously unserved areas, P22.9/min for a national long-distance call in previous served areas, and P40.8/min for a national long-distance call in previously unserved areas.If each new municipal telecenter serves about 25,000, 10% of those served become users in areas with no prior phone service. The corresponding figure for areas with sparse phone service is 2%.Constant price elasticities are assumed to be –0.5 and –0.6 for local and national long-distance payphones, respectively.The capital investment required to build a tele-center is $8,000.The operation and maintenance cost of a tele-center is $12,000 per year.Each telecenter has a useful life of seven years before additional rehabilitation is needed.
Barangay payphonesEach new barangay payphone will be built in an area with no prior phone service. Users of the new payphones are assumed to make two 3-minute local phone calls and two 3-minute national long-distance phone calls per month at the current rates of P0.7/min and P5/min, respectively. The alternative price per minute used to calculate consumer surplus takes into account travel and time cost needed to gain access to another phone.
The average distance to the nearest phone is 10 km.Average transport cost is P10/km.Average travel speed is 30 km/hr.Average cost of time based on the current minimum wage is P22.5/hr.Since it is rare for someone to travel just to make a call, the model assumes that 50%
◊◊
◊
•
•
•
•••
••
•
◊
◊
◊
◊
◊
of the travel and time costs are attributable to the cost of the call.
The alternative prices per minute are calculated to be P36.5/min for a local call and P40.8/min for a national long-distance call in previously unserved areas.If each new barangay payphone serves approxi-mately 1,000, 10% of those served become payphone users. Constant price elasticities are assumed to be –0.5 and –0.6 for local and national long-distance payphones, respectively.The capital investment per payphone increases over time—$1,000 for payphones built in year 1, $3,000 for payphones built in year 2, $5,000 for payphones built in year 3, $10,000 for payphones built in year 4, and $15,000 for payphones built in year 5 (no payphones are built after year 5).The operation and maintenance cost of a payphone is assumed to be 15% of the investment cost.Each payphone has a useful life of seven years before additional rehabilitation is needed.
Table A5.13 above lists these assumptions and sources.
ResultsUsing the inputs and assumptions above, along with the five-year build-out plan as prescribed by the World Bank report “Extending Access to Commu-nication and Information: Recommended Approach and Implementation Plan,” table A5.14 describes the number of telecenters and payphones built, as well as the number of users disaggregated by type of area. In total, the plan results in over 1 million more telephone users who had no previous access. It should be noted that the table only describes new telecenters, payphones, and users during the initial construction period. It is assumed that these new users continue to use existing assets over their useful life. New
•
•
•
•
••
WorldBankInfra.indb 204 12/6/2005 8:42:24 AM

Appendixes �0�
telecenters and payphones are built up until year 5, each of which will be in operation for seven years, making the time frame for this analysis 12 years in total. The number of telecenter and payphone users, disaggregated by service area, is multiplied by the individual changes in consumer surplus calculated below to determine the total change in consumer surplus.
Table A5.15 presents the results of the first step of the consumer surplus analysis, namely calculation of the individual gains in consumer surplus for tele-centers and payphones by type of service (local vs. national long distance) and type of area (served vs. unserved). As can be seen from the results, gains in consumer surplus are higher for those individuals without any prior access to telecoms services. This is due to the higher travel and time costs for those needing to make calls in previously unserved areas. Further, gains from national long-distance calls are higher than for local calls. Lastly, because of similar assumptions, the gains to users of telecenters and
Table A5.15 Individual gains in consumer surplus
Previously served areas Previously unserved areas
Local National long-distance
Total Local National long-distance
Total
Municipal telecenters
454 818 1,272 680 1,284 1,963
Barangay payphones
680 1,284 1,963
payphones are the same. These individual consumer surplus gains are multiplied by the number of telecenter and payphone users resulting from the build-out plan. It should be noted that calculation of consumer surplus is cumulative, meaning that new users continue to experience gains in consumer surplus in years following the initial construction of the phone or telecenter.
In order to calculate revenue and costs, the model first determines the number of minutes consumed and phones is operation. Table A5.16 shows the plan over the entire life of the assets, along with the total number of minutes called from the telecenters and payphones. The number of minutes is based on the average consumption per user and the average number of users per telecenter and payphone, as described in table A5.13.
Table A5.17 shows the full output of the model. It can be seen that the benefits and costs gradually increase up to year 7, then decrease. This is because the telecenters and payphones have a seven-year life, after which they are considered retired for purposes of this analysis. Also worth noting is that, in comparison with municipal telecenters, barangay payphones have higher gains in consumer surplus, lower incremental revenues, and lower costs. This results in a higher net economic benefit for barangay payphones. Assuming a discount rate of 10%, the net present value of the total net benefits stream is $123 million, comprising
Table A5.16 Total number of telecenters and payphones in operation, and in minutes
YearMunicipal
telecenters in operation (BOY)
Municipal telecenter local
minutes
Municipal telecenter national
LD minutes
Barangay payphones in
operation (BOY)
Barangay payphones local
minutes
Barangay payphones national LD minutes
1 0 9.8 9.8 0 2.0 2.0
2 100 23.8 23.8 500 7.8 7.8
3 300 39.8 39.8 1,500 27.3 27.3
4 900 59.3 59.3 5,500 50.7 50.7
5 1,300 71.0 71.0 7,500 60.5 60.5
6 1,500 74.9 74.9 8,000 62.4 62.4
7 1,500 74.9 74.9 8,000 62.4 62.4
8 1,500 65.1 65.1 8,000 60.5 60.5
9 1,400 51.1 51.1 7,500 54.6 54.6
10 1,200 35.1 35.1 6,500 35.1 35.1
11 600 15.6 15.6 2,500 11.7 11.7
12 200 3.9 3.9 500 2.0 2.0
BOY = beginning of year; LD = long-distance.
WorldBankInfra.indb 205 12/6/2005 8:42:24 AM

�0� Philippines: Meeting Infrastructure Challenges
Table A5.17 Benefits, costs, and net economic flows of the build-out plan ($ million)
1. Benefits in year 1 2 3 4 5 6 7 8 9 10 11 12 Total
Change in CS from municipal telecenters 4.4 10.1 14.9 20.6 24.0 25.2 25.2 20.8 15.0 10.3 4.6 1.1 176.2
Change in CS from barangay payphones 0.9 3.5 12.3 22.9 27.3 28.2 28.2 27.3 24.7 15.9 5.3 0.9 197.4
1a. Total change in CS 5.3 13.7 27.2 43.5 51.3 53.4 53.4 48.1 39.7 26.1 9.9 2.0 373.6
Incremental revenue from municipal telecenters
1.0 2.4 4.1 6.1 7.3 7.7 7.7 6.7 5.2 3.6 1.6 0.4 53.6
Incremental revenue from barangay payphones
0.2 0.8 2.8 5.2 6.2 6.4 6.4 6.2 5.6 3.6 1.2 0.2 44.7
1b. Total incremental revenue 1.2 3.2 6.9 11.3 13.4 14.0 14.0 12.9 10.8 7.2 2.8 0.6 98.3
2. Costs in year 1 2 3 4 5 6 7 8 9 10 11 12 Total
Investment and O&M for municipal telecenters
1.4 4.0 12.0 16.4 18.4 18.0 18.0 17.4 15.6 10.8 4.8 1.2 138.0
Investment and O&M for barangay payphones
0.5 3.3 22.0 25.0 14.6 7.7 7.7 7.6 7.4 5.6 2.6 0.6 104.6
2a. Total investment and O&M 1.9 7.3 34.0 41.4 33.0 25.7 25.7 25.0 23.0 16.4 7.4 1.8 242.6
Net economic flows in year 1 2 3 4 5 6 7 8 9 10 11 12 Total
Municipal telecenters 4.0 8.6 7.0 10.3 12.9 14.8 14.8 10.0 4.7 3.1 1.4 0.3 91.9
Barangay payphones 0.5 1.0 -6.9 3.1 18.9 26.9 26.9 25.9 22.9 13.8 3.9 0.5 137.5
Total net economic flows (=1a+1b-2a) 4.5 9.6 0.1 13.3 31.8 41.8 41.8 35.9 27.6 16.9 5.2 0.9 229.4
CS = consumer surplus; O&M = operation and maintenance.
$55 million from telecenters and $68 million from payphones. However, benefits from payphones take longer to accrue than from municipal telecenters, as seen by the lower net benefit figures in years 1 through 4. After this initial period, net benefits from payphones exceed those from telecenters. From a net present value analysis perspective, both components of the rural access strategy are worth undertaking.
These figures are only intended to be a rough estimate of the net benefits of the implementation
plan. Since data were extremely difficult to obtain, numerous assumptions were needed to arrive at these figures, as can be seen from table A5.13. These figures are the best estimates of representative figures for average prices, quantities, travel and time costs, and customer uptake per payphone and telecenter. The results ignore the consumer surplus gains from obtaining Internet and computer access in the tele-centers. They also do not consider the opportunity cost of the build-out plan. Despite these shortcomings, the figures provide useful estimates.
Endnotes1 Commercial and industrial tariffs are the same and include the
generation and transmission component of the residential LRMC plus a 2.5% premium
2 World Bank. 2001. Filipino Report Card on Pro-Poor Services. May 30. Manila. The report card is based on a nationwide survey conducted in 2000, covering 1200 households in four broad
regions: the National Capital Region (NCR), Luzon excluding NCR, Visayas, and Mindanao.
3 Björn Wellenius. 2002. “Extending Access to Communication and Information: Recommended Approach and Implementa-tion Plan.” Report submitted to the Republic of the Philippines Department of Transportation and Communication, February 21. PPIAF and World Bank, Manila.
WorldBankInfra.indb 206 12/6/2005 8:42:24 AM

Appendixes �0�
Table A6.1Legislation relevant to water supply
Legislation Significance
Republic Act 6324, creating MWSS, as amended by PDs 425, 1269, and 1406
In 1971, MWSS was created and made responsible for providing water supply and sanitation services to the cities and municipalities of Metro Manila and adjacent urbanized areas of Rizal and Cavite provinces. In 1997, MWSS was privatized, with the management and operations transferred to two private firms under a 25-year concession contract
Provincial Water Utilities Act of 1973, as amended
Authorized the formation of local water districts in provincial centers of the Philippines, its governance and administration, and the creation of LWUA as a specialized lending institution to provide financing and technical assistance in the development of local water districts. LWUA was mandated to review tariff rates of local water districts where it had financial exposure
Water Code of the Philippines of 1976, as amended
Consolidated all existing legislation relating to ownership, development, utilization, exploitation, and conservation of water resources, and mandated NWRB as the government agency responsible for the implementation of the Water Code, including the appropriation of water resources through the grant of water permits and imposition of penalties for administrative violations
Presidential Decree 424 (1974) Mandated NWRB as the government coordinating body for all water resources development activities
Public Service Law, Presidential Decree 1206 (1977)
Mandated NWRB to have supervision and control of all water utilities and their franchises, equipment, and other properties, and regulation of water rates to be charged by waterworks operators, except those falling under the jurisdiction of MWSS and LWUA, and to act as an appeals body on tariff matters of water districts under LWUA jurisdiction. Executive Order 123 issued in September 2002 mandates NWRB to approve tariffs of local water districts
Local Government Code of 1991 Mandated the block transfer of the Internal Revenue Allotment to LGUs following a formula-based allocation and transferred responsibility for providing basic services to LGUs
Build-Operate-Transfer Law, Republic Act 6957 of 1990, as amended by RA 7718, 1994
Authorized the financing, construction, operation, and maintenance of government infrastructure projects by the private sector
National Water Crisis Act of 1995 Provided the legal basis for the privatization of MWSS in 1997
LWUA = Local Water Utilities Administration; LGU = local government unit; MWSS = Metropolitan Waterworks and Sewerage System; NEDA = National Economic and Development Authority; NWRB = National Water Resources Board; PD = presidential decree.Source: Compiled by World Bank staff.
Appendix 6
Key Legislation Relevant to Water Supply and Sanitation in the Philippines
The Clean Water Act (RA 9275), which was signed on March 22, 2004, imposes stringent measures to prevent the country’s waters from
becoming too polluted. Under the law, the National Water Resources Board will work closely with the Department of Environment and Natural Resources and they will designate water bodies into water quality management areas using appropriate physiographic units such as watersheds, river basins, and water resources regions. The law also mandates the collection
of fees depending on the amount of wastewater discharge to bodies of water to cover the expenses incurred by the government in administering water pollution abatement and control. Businesses shall also be required under the law to secure discharge permits that indicate the effluents contained in the water. Furthermore, RA 9275 encourages business enterprises to modify their production processes and use green technology to treat the water released from their factories and plants.
WorldBankInfra.indb 207 12/6/2005 8:42:24 AM
�0� Philippines: Meeting Infrastructure Challenges
Table A6.2Legislation relevant to sanitation
Legislation Description
National Plumbing Code through PDs 1096, 1959
Present guidelines, criteria, and standards for design and construction of sanitation and sewerage facilities
Creation of Metropolitan Waterworks and Sewerage System (RA 6234), 1971
Constructs, operates, and maintains water systems, and sewerage and sanitation facilities in Metro Manila
PD 198, known as the Provincial Water Utilities Act of 1973
National policy authorizing the formulation of water districts to operate and administer water supply and wastewater disposal systems in the provincial areas outside Metro Manila
The Code on Sanitation of the Philippines (PD 865), 1975
Deals with water supply, excreta disposal, and sewerage and drainage concerns
Revising Republic Act 3931, known as the Pollution Control Law (PD 984), 1976
Requires subdivisions, hospitals, and public buildings to provide sewerage and treatment facility
National Building Code (PD 1096), 1977 Requires new buildings to be connected to a waterborne sewerage system; if system exists, sewage must be disposed of in an Imhoff tanker or septic tank with a subsurface absorption field
Philippine Environment Code (PD 1152), 1977
Provides guidelines to protect and improve the quality of water resources and defines responsibilities for surveillance and mitigation of pollution incidents
Philippine Environmental Impact Statement System (PD 1586), 1978
Mandates environmental impact statement for government and private sector projects affecting the quality of the environment
Rules implementing the Subdivision and Condominium Buyers Protective Decree, 1981
Connection to sewerage system where available and provision of septic tanks when sewerage is not available
Revised Water Usage and Classification/Water Quality Criteria and Revised Effluent Regulations of 1990 (DENR Administrative Order 34 and 35), 1990
DENR Administrative Order 34 amends sections of 1978 NPCC Rules and Regulations and defines beneficial usage and classification of fresh surface and coastal/marine waters; also provides water quality criteria for surface and coastal waters. DENR Administrative Order 35 amends effluent regulations of 1982 and provides effluent standards to all industrial and municipal wastewaters based on the receiving water’s classification
Local Government Code of the Philippines, IRR Rule V (Republic Act 7160), 1992
Enforcement of laws on sanitation and cleanliness as devolved function of DENR to LGUs. LGUs to provide basic services and facilities, including water supply, sanitation, and flood control
NEDA Board Resolution 4 (1994) and 6 (1996)
Increases role of LGUs in provision of sanitation facilities
NEDA Board Resolution 5 (1994) National policy strategy and action plan for urban sewerage and sanitation
DENR = Department of Environment and Natural Resources; DILG = Department of Interior and Local Government; DPWH = Department of Public Works; IRR = implementing rules and regulations; LGU = local government unit; LWUA = Local Water Utilities Administration; NEDA = National Economic and Development Authority; NPCC = National Pollution Control Commission; NWRB = National Water Resources Board; PD = presidential decree; RA = Republic Act.Source: Compiled by World Bank staff.
WorldBankInfra.indb 208 12/6/2005 8:42:25 AM
Appendixes �0�
Appendix 7
Principal Agencies Involved in Water Supply and Sanitation Policy Formulation and Implementation
Agency Function
Local government units (pro-vincial, city, municipal levels)
Responsible for the provision of water supply and sanitation services to their con-stituents whether by administration (i.e. local government departments, local gov-ernment corporations registered with Securities and Exchange Commission); creation of water districts; or contracting services to third parties under service, management, lease/affermage, concession, build-operate-transfer, or joint-venture arrangements
National Economic and Devel-opment Authority
Coordinates the preparation of the national development plan and investment program; sets macroeconomic planning and investment targets; formulates sector policies and strategies; approves public investment programs and projects; and mon-itors implementation of policies, programs, and projects
Department of Finance Guarantees LWUA loan; oversees performance of government-owned and controlled corporations and government financial institutions such as LWUA, DBP, and LBP, and takes the lead in the formulation of financing policies and strategies at the national level, including provision of national government grants for local projects
Local Water Utilities Administration
Provides technical advisory services and financial assistance to local water districts. Sets design standards for water supply systems operated by local water districts and regulates tariffs of local water districts under its jurisdiction
Metropolitan Waterworks and Sewerage System
Responsible for the provision of water supply and sanitation services to the cities and municipalities of Metro Manila; the services are currently being provided through two private concessionaires
National Water Resources Board Responsible for the development and management of water resources in the country and acts as economic regulator of waterworks providers, except those under the jurisdiction of the Metropolitan Waterworks and Sewerage System
Department of Interior and Local Government
Responsible for overall capacity building of local governments. For the water supply and sanitation sector, the Project Management Office for Water Supply and Sani-tation coordinates the programs involving local governments
Department of Public Works and Highways
Responsible for providing technical assistance to local governments in the devel-opment and implementation of rural water supply systems
Department of Health Responsible for setting standards for drinking water quality; and design of on-site sanitation facilities, standards, and procedures for sewerage collection and disposal, and drainage
Environmental Management Bureau under Department of Environment and Natural Resources
Responsible for setting standards for wastewater quality before disposal to natural waterways; approves and issues environmental compliance certificates
Government financial institutions (DBP, LBP)
Serve as wholesale and retail lender of funds for water service providers using inter-nally generated resources and external credit
Build-Operate-Transfer Center Responsible for promoting private sector participation in infrastructure projects to government agencies, local governments, and the private sector
National Statistics Office Census, data collection
DBP = Development Bank of the Philippines; LBP = Land Bank of the Philippines; LWUA = Local Water Utilities Administration.Source: Compiled by World Bank staff.
WorldBankInfra.indb 209 12/6/2005 8:42:25 AM

�10 Philippines: Meeting Infrastructure Challenges
Appendix 8
Estimated Investment Requirements in Water Supply and Sanitation
Table A8.1Estimated investment requirements for water supply, 2004–2009
increase in population served as of 2003
Item Scenario 1: 20% Scenario 2: 30% Scenario 3: 40%
Target incremental population to be served in 2004 at 90% coverage (million)a
5.1 5.1 5.1
Urban 2.3 2.3 2.3 Rural 2.8 2.8 2.8
Incremental population served as of 2003 (million)
1.0 1.5 2.0
Urban 0.5 0.7 0.9 Rural 0.5 0.8 1.1
Shortfall in 2004 target (million) 4.1 3.6 3.1 Urban 1.9 1.7 1.4 Rural 2.2 1.9 1.7
Investment requirements to achieve 90% coverage in 2004 (P million)b
6,922.0 6,156.0 5,144.0
Urban 5,700.0 5,100.0 4,200.0 Ruralc 1,222.0 1,056.0 944.0
Estimated population in 2009 (million)d 92.0 92.0 92.0 Urban 44.0 44.0 44.0 Rural 48.0 48.0 48.0
Estimated incremental population to be served in 2009 at 90% coverage (million)d
9.0 9.0 9.0
Urban 4.3 4.3 4.3 Rural 4.7 4.7 4.7
Investment requirements to achieve 90% coverage in 2009 (P million)
15,511.0 15,511.0 15,511.0
Urban 12,900.0 12,900.0 12,900.0 Ruralc 2,611.0 2,611.0 2,611.0
Rehabilitation costs from 2000 to 2009 (P million)e
1,165.0 1,165.0 1,165.0
Urban 924.0 924.0 924.0 Ruralc 241.0 241.0 241.0
Total investment requirements for 2004–2009 (P million)
23,598.0 22,832.0 21,820.0
Urban 19,524.0 18,924.0 18,024.0 Ruralc 4,074.0 3,908.0 3,796.0
a. Based on 2000 population of 76.3 million: urban 34.1 million (45%) and rural 42.2 million (55%); population served in 2000 is 60 million: urban 24.2 million (40%) and rural 35.8 million (60%). Total population in 2004 is estimated at 82 million: urban 38 million (46%) and rural 44 million (54%). b. Per capita investment cost for level 3 system is P3,000 (based on Local Water Utilities Administration estimate of P2,500 per capita investment cost at 1999 prices and adjusted using 5% annual inflation from 2000 to 2003. Figure was rounded off. Per unit investment cost of a shallow well is P50,000, a deep well, P250,000 (based on engineering estimates under the Rural WSS Project V assisted by the Japan Bank for International Cooperation). Household size is assumed to be 6 persons. c. Assumed that investments would be in shallow wells only, with a well serving an average of 15 households. d. Annual growth rate of population is assumed to be 2.4%, the annual rate of urbanization 1%. e. Assumed rate of rehabilitation is 1% a year.
Source: World Bank staff.
If the Philippines is to achieve the Millennium Development Goal of increasing formal access to
water supply to 90% by 2010, it needs to invest a total of P22–24 billion (table A8.1).
WorldBankInfra.indb 210 12/6/2005 8:42:25 AM
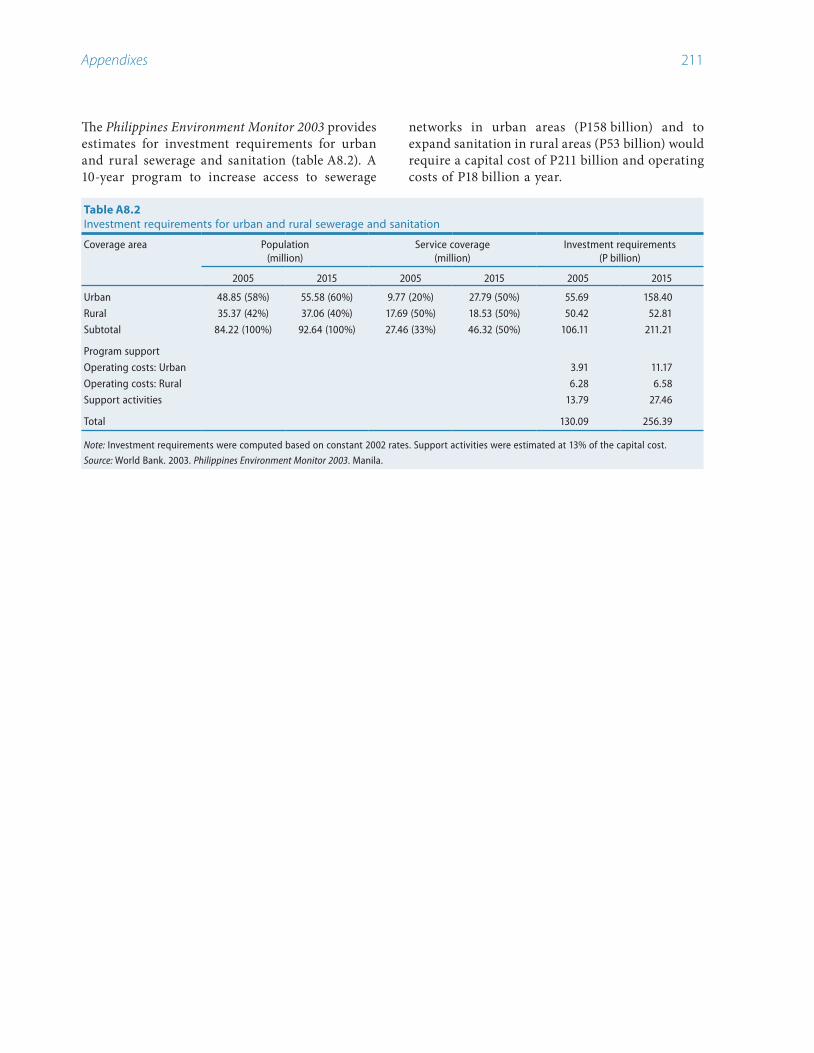
Appendixes �11
The Philippines Environment Monitor 2003 provides estimates for investment requirements for urban and rural sewerage and sanitation (table A8.2). A 10-year program to increase access to sewerage
Table A8.2Investment requirements for urban and rural sewerage and sanitation
Coverage area Population(million)
Service coverage(million)
Investment requirements(P billion)
2005 2015 2005 2015 2005 2015
Urban 48.85 (58%) 55.58 (60%) 9.77 (20%) 27.79 (50%) 55.69 158.40
Rural 35.37 (42%) 37.06 (40%) 17.69 (50%) 18.53 (50%) 50.42 52.81
Subtotal 84.22 (100%) 92.64 (100%) 27.46 (33%) 46.32 (50%) 106.11 211.21
Program support
Operating costs: Urban 3.91 11.17
Operating costs: Rural 6.28 6.58
Support activities 13.79 27.46
Total 130.09 256.39
Note: Investment requirements were computed based on constant 2002 rates. Support activities were estimated at 13% of the capital cost.
Source: World Bank. 2003. Philippines Environment Monitor 2003. Manila.
networks in urban areas (P158 billion) and to expand sanitation in rural areas (P53 billion) would require a capital cost of P211 billion and operating costs of P18 billion a year.
WorldBankInfra.indb 211 12/6/2005 8:42:25 AM

�1� Philippines: Meeting Infrastructure Challenges
Appendix 9
Ownership Structure and Selected Features of Existing/Planned Expressways
SLEX NLEX Skyway MCTE STAR
Length 42.9 km (13.5 km are now part of Skyway)
83.2 km Phase 1: Elevated 9.3 km;At grade 13.5 km (the at grade section was originally part of SLEX)Phase 2: 13.6 kmPhase 3: 16 kmPhase 4: 58 km
Phase 1: 6.2 kmPhase 2: 11.3 km
Phase 1: 22.1 kmPhase 2: 20 km
Status Built and completed in 1970s. Redevelopment of 13.5 km under Skyway.Redevelopment of the remaining 29.4 km is delayed.
Built and completed in 1970s.Redeveloped NLEX opened in February 2005.
Phase 1: 9.3 km elevated portion completed in 2000.Rehab. of the SLEX 13.5 km at grade portion completed in 2001.Phases 2–4: completion dates not known.
Phase 1 completed in 1998. Construction of Phase 2 started in 2004. Completion expected in 2006.
Phase 1 completed in 2002 by DPWH.Phase 2 construction expected to start in 2005.
Lanes 6/4 6/4 6 6 4
Function Urban/intercity Urban/intercity Urban Urban/Intercity Intercity
Car toll rate (P/km) as of January 2005
0.73 2.63: open system 2.38: closed system
Elevated: 9.30At grade: 14.20
2.27 0.73
Project company/ concessionaire
PNCC shareholders:National government–95%; Private investors–5%
PNCC shareholders:National government–95%; Private investors–5%
CMMTC shareholders:Citra (Indonesia)–55%;PNCC 20%;Stradec (Phils.)–5%;Metro Strategic Infrastructure Holdings (Phils.)–5%
UEM-MARA Philippines Corporation (100% local private company) in joint venture with Public Estates Authority
STAR Infrastructure Development Corporation (STAR IDC)–100% local private company
Redevelop-ment phases (project company)
CMMTC for 13.5 km (see “Skyway”)–joint venture between Hopewell Crown Infrastructure Inc. and PNCC for the remaining section.
MNTC for whole stretch of NLEX, (plus new links ~100 km).Shareholders:FPIDC (Phils.)–76%Egis (France)–10%,Leighton Asia Ltd. (Australia)–10%, PNCC–4%.
Not applicable Not applicable Not applicable
Estimated cost CMMT section: see “Skyway”Hopewell Crown section: P10 billion
$377 million Phase 1: $500 million Phase 1: $47 millionPhase 2: $117 million
Phase 1: P1.0 billion ($25 million) Phase 2: Cost estimate P2.2 billion ($46 million)
Mode of private sector participation
SLEX and NLEX built by DPWH in early 1970s with ODA financing, then privatized in 1977; private company taken over by government in 1983, renamed PNCC.For section developed under Skyway, see “Skyway.”For remaining section of SLEX and for redeveloped NLEX, a joint venture between the state-owned company and the private sector.
Build-transfer-operate Build-transfer-operate joint venture of Public Estates Authority with Renong Bhd in 1994; later sold to UEM-MARA, then to Coastal Road Corp. in 1999.
Build-transfer-operate for Phase 2.Phase 1 built by DPWH. Phase 2 was bid out, won by STAR IDC in 1997. Phases 1 & 2 to be operated and maintained by STAR IDC as one system.
CMMTC = Citra Metro Manila Tollways Corporation; MCTE = Manila-Cavite Toll Expressway; MNTC = Manila North Tollways Corporation; NLEX = North Luzon Expressway; PNCC = Philippine National Construction Corporation; SLEX = South Luzon Expressway; STAR = Southern Tagalog Arterial Road.
Sources: Japan International Cooperation Agency. 2003. “Development of Public-Private Partnership Technique for Metro Manila Urban Expressway Network.” January; CEO remarks, First Philippine Holdings Corporation 42nd Annual Stockholders’ Meeting, May 17, 2004; “Philippines’ North Luzon Expressway To Be Upgraded.” ADB Press Release, October 2000; “6 foreign firms eye SLEX.” DTI website (http://www.dti.gov.ph/contentment/7/150/926f.jsp); CMMTC; Metro Manila Skyway (http://www.metromanilaskyway.com/skyway.htm); DPWH website http://www.dpwh.gov.ph/infrastructure/infrastructure_major.htm); Toll Regulatory Board.
WorldBankInfra.indb 212 12/6/2005 8:42:25 AM
IndexCcable television services 172capital expenditure. See also investment
powerNPC 91requirements 89
roads 147low level of 139, 150
share of ODA 46, 147, 148telecoms 173water 107
low level of 116LWUA 118Manila concessionaires 118
cellular telephone services 171–172comparisons, international
access rates 2business environment 6, 60, 75competitiveness 6, 75cost recovery 17EIU competitiveness risk score 5EIU composite country risk score 60FDI 61general 74ICRG 60, 61infrastructure investment, GDP share 11investment attractiveness 61power
access rates 89lifeline tariffs 93prices 92
private investment 56roads
intercity passenger and freight costs 155length and paved share 153length of expressways 155network coverage 153toll rates 156
teledensity 175water
capital expenditure per connection 116drinking water and sanitation access 119sewerage access 119tariffs 122
competition. See also four Csbenchmark 21, 29direct 19–20indirect 20–21, 29insufficient 18–19
Aaccess rates
among the poor 3, 107basic services 1, 3in ARMM 9international comparisons 2power 1roads 3sanitation 1, 107, 119, 120sewerage 3, 107under MDGs 116water 1, 107, 119, 120
accidents. See road accidentsactivist judiciary. See judiciary, interventionsaffordability
and subsidies 24power 25, 92, 93, 97, 101roads 26, 155telecoms 181urban public transport 26water 25, 123, 124, 131
anticorruption 27, 73. See also governanceprogress in 73proposals 78, 79recommendations 27
avoidable economic losses 107
BBOT Law
ambiguities 27, 67–68and private sector 55, 58provisions requiring review 68recommendations 70subsidies and guarantees 64, 68
BOT projects 67CBK hydropower 26, 67guarantees on 12, 67under way 61unsolicited bids 67
budget deficit. See fiscal situationbusiness environment 15–30, 61–62. See also four Cs
ICRG risk assessment 60indicators 6international comparisons 6, 60, 75judicial decisions 24private sector perceptions of 61, 62recommendations 24–29, 78
WorldBankInfra.indb 213 12/6/2005 8:42:26 AM

�1� Philippines: Meeting Infrastructure Challenges
maximizing 28power
introduction 84, 95–96, 99telecoms 173, 176, 179
competitiveness rankings 6, 75competitive wholesale market. See WESMconflict of interest
LWUA 22NWRB 22PPA 23
congestion. See roads, congestioncongressional funds
amount 18, 148channels 18for local roads 148for water projects 117improving use of 134, 161in DPWH budget 38, 147, 158inefficiencies of 11, 18, 38
consumer surplus from reforms 76, 194–206power 75–76roads 77telecoms 77water 76–77
cooperationexample of interjurisdictional 48
coordinationlack of 108, 158. See also fragmentationlack of policy 34–38, 110lack of regulatory 23, 124, 126recommendations 28, 46, 79, 131
corporate governance. See also governancemeans to improve 28weaknesses 23
corruption 17–18. See also governance; See also four Csand unsolicited bids 21, 26business perceptions of 6, 17, 75citizens’ monitoring of 26–27effect on business climate 17private sector perceptions of 62public perceptions of 17, 140tackling 18, 26, 73, 79
cost-benefit analysis of reforms. See consumer surplus from reforms
cost recovery. See also four Csand subsidies 24and user fees 24fostering 24–26, 79inadequate 15–17, 43, 59, 62, 113, 124–125
political intervention main reason for 15international comparison 17political challenges of 74recommendations 130
country risk 60–61, 66, 68, 78coverage rates. See access ratescredibility of institutions 21–23. See also four Cs
private sector perceptions of 62cross subsidies
powerremoval 84, 93, 104
DDBM
recommendations 46, 80role of 36, 142weak oversight by 34
decentralization. See also LGCissues 33, 39–41, 125. See also missing middle
devolution. See decentralizationDOF
recommendations 46, 70, 80role of 67, 110, 124, 142
DPWHpublic’s perception of 140, 152, 157
EEIU competitiveness risk score 5EIU composite country risk score 60electricity. See powerenabling environment
provided by public sector 58, 140, 160ERC
limited regulatory capacity 23
FFDI
declining 60share of GDP 61
financial situation. See also fiscal situationLGUs
lack of data 46recommendations 50–51weakness of 43
LWUAfragility 128
financing 43–46financial market 44–46
recommendations 49government 43–44ODA 46
recommendations 52user charges 43
recommendations 48financing gap
WorldBankInfra.indb 214 12/6/2005 8:42:26 AM

Index �1�
general 43NPC 83roads 150–151
fiscal reformrecommendations 49, 78, 79
fiscal situationinvestor concerns 45relationship with infrastructure 11, 12, 78share of GDP 11target for balanced budget 43
four Cs 15–29, 61. See also competition, insufficient; See also corruption; See also cost recovery, inadequate; See also credibility of institutions
fragmentation 38, 63, 123. See also coordination, lack ofand loss of scale economies 11grants 42of local government 43water 123–124water supply market 110
Ggovernance. See also corporate governance; See also cor-
ruptionpoor 75recommendations 79, 81
growth, economicand infrastructure 6–7, 185, 186–187and poverty 4–7geographic distribution 7–9, 39
growth, population 8–10. See also urbanizationguarantees, government. See also subsidies
ambiguities in BOT Law 64, 67–68and ODA funding 52, 110for GOCCs 12, 25for private projects 66–67LGUGC 50, 73NPC 96overuse of 67recommendations 69, 70, 79, 164risks of 96
measuring 70unsolicited bids 64, 164WESM 84
IICC (NEDA)
role of 35, 142inadequate cost recovery. See cost recoveryinfrastructure
and economic growth 6–7, 185and poverty reduction 6–7
institutions 21–23. See also governance; See also political intervention
insufficient competition. See competitioninternational comparisons. See comparisons, internationalInternet services 172investment. See also FDI; See also capital expenditure; See
also underinvestment5% benchmark need 11, 13, 43attractiveness 61climate 7, 10discouragement of. See also four Cs
Mindanao 9ports 17SSIPs 20
LGU 40, 41needs
power 88–89roads 150, 151sensitivity to population growth 9water 107, 116–118, 210–211
private sector 55–57declining interest 59–68international comparison 56
to GDP ratio 6, 11, 35roads 149, 157
IRAchanges in LGC 35, 39LGU dependence on 36, 42, 44, 51
Jjudicial intervention. See judiciary, interventionsjudiciary. See also credibility of institutions
interventions 22, 23, 24, 84recommendations 29
LLGC. See also decentralization
lack of clarity 41LGU revenue/expenditure mismatch 41LGU revenue increase 35recommendations 47–48
LGUsand guarantee of debt issues 50, 73and inadequate infrastructure provision 40and LGC 40and the missing middle. See missing middlecapacity constraints 43dependence on national government 36, 42, 44, 51example of coordination 48importance in rural water provision 33inefficiency in water systems 3, 11, 66investment in local roads 147–148need for technical assistance 47, 48, 50own-source revenue
as share of GDP 39recommendations 51
WorldBankInfra.indb 215 12/6/2005 8:42:26 AM

�1� Philippines: Meeting Infrastructure Challenges
poor access to financing 46, 188–189recommendations 50–51some progress in 73
recommendations 47, 48, 50responsibility for local roads 140, 142short termism 42–43weak coordination among 39–40, 108, 124, 158
recommendations 47, 80weak investment 35, 108
lifeline tariffs, power 26, 84, 93, 98international comparisons 93
local roads. See also national roadsexpenditures and financing 147–148financing gap 150inadequate maintenance 139investment outlook 149lack of reliable data 139, 157underinvestment 139
low credibility of institutions. See credibility of institutionsLWUA
and water district tariffs 16capital expenditure 118conduit for ODA 118conflict of interest 22importance for water districts 111, 126, 127recommendations 131, 133reform of 127, 128restrictions on private sector financing 65subsidies to 25, 127
MManila water concessions. See MWCI, MWSI, MWSSMetropolitan Waterworks and Sewerage System. See
also MWCI; MWSI; See MWSSMindanao. See ARMMmissing middle 39–40, 108MTPDP 2001–2004
roads 144targets and performance 150
targets and performance 36–37water 109
MTPDP 2004–2010main infrastructure goals 77–78telecoms 168
MTPIProads 149
MWCIand MWSS financial distress 129divergent performance from MWSI 55listing on stock exchange 114tariff increases 15
MWSIdivergent performance from MWCI 55
financial situation 114suspension of concession fee 114tariff increases 15
MWSSand low capital expenditure 108financial situation 128need for restructuring 128privatization 55, 114
lessons from 115recommendations 130, 133responsibilities 110role in financing 117
Nnational roads. See also local roads
condition of 3decrease in investment 147DPWH responsibility for 142employees per km 140expenditure, share of GDP 139, 149expenditures 139, 146–147financing gap 150financing of 147investment outlook 149length of 144maintenance effectiveness 16maintenance of 146underinvestment 139
NEDArecommendations 46, 80role of 35, 36, 142, 168weak oversight by 34
nonrevenue water 11, 114, 121, 122, 125NPC
affordability 93below-cost tariffs 16contribution to public sector deficit 12financial performance 90–92generating losses 90increased tariffs 16, 75in market structure 85overinvestment by 16political intervention 16, 38poor creditworthiness 94privatization of assets 33, 88, 96recommendations 80reforms at 75–76steps toward financial recovery 91sustaining financial viability 94tariffs 92–93
NTClack of independence 175limited regulatory capacity 23role of 167
WorldBankInfra.indb 216 12/6/2005 8:42:27 AM

Index �1�
NWRBbudget constraints 127capacity constraints 127conflict of interest 22, 110limited regulatory capacity 23recommendations 132
OODA
and guarantees 52and ICC (NEDA) 35approval process 142recommendations 50, 52, 80share in national road investment 147significance in infrastructure financing 46water
lack of counterpart funding 118output-based aid 65, 66, 73, 79
recommendations 134overinvestment
in power generation 11oversight
weak central 34, 124oversight agencies
recommendations 46, 79, 80, 163role of 35, 36
Pplanning
lack of 35–38, 40, 63, 108, 124, 149recommendations 134
political intervention 84, 108and tariff increases 16in LGU water utilities 112main reason for inadequate cost recovery 15NPC 38NWRB 130recommendations 47
politicizationpower reforms 84, 96securing telecoms franchise 169tariffs 61
poor business environment. See business environmentpork barrel funds. See congressional fundspoverty reduction
and economic growth 4–7and infrastructure 6–7
power 83–106. See also NPCaccess rates. See access ratescompetitive wholesale market. See WESMinvestment needs 88–89lifeline tariffs. See lifeline tariffs, powermarket structure
current 85–86proposed reforms 86
recommendations 98–104reliability of supply 90system losses 90wholesale market. See WESM
PPAconflict of interest 23
priorities. See recommendationspriority actions. See recommendationsprivate roads 145private sector. See also unsolicited bids; See also privati-
zationand role of public sector 57attracting 58, 78, 97
BOT Law 35National Water Crisis Act 35recommendations 80, 81, 133
declining interest in infrastructure, reasons forambiguous BOT policy 67high general country risk 60–72poor business environment 61–63unclear rationale 64–65weaknesses in planning 63
expenditure as share of GDP 35mixed track record 68potential benefits 57public perceptions of 64, 73, 190–193recommendations 68–70, 163–164roads 147
declining interest 139low level of contribution, reasons for 158
telecomsdomination by PLDT 167, 170, 171
privatizationfirst major power plant 73Manila water concessions 35, 55, 114, 115moves toward 33
but gov’t still major player 33MWSS 55of NPC assets 33, 83ports 37power distribution 57power generation 19, 87–88, 95public perception survey 64, 190–193recommendations 178rural telecoms facilities 169survey 190–193telecoms
recommendations 178Transco 87–88
public sector. See also credibility of institutions; See also governance
and role of private sector 57–59, 140, 160expenditure as share of GDP 35
WorldBankInfra.indb 217 12/6/2005 8:42:27 AM

�1� Philippines: Meeting Infrastructure Challenges
need to strengthen planning 63roles of 33–36, 58–59support to private sector contracts 64–65
Rrankings. See comparisons, internationalRDCs
composition 40recommendations 47, 80weaknesses 40
recommendationsaddressing power sector finances 80attracting private investment transparently and competi-
tively 68budgeting for preinvestment studies 69clarifying rationale for public support for private proj-
ects 69engaging private investment 80enhancing financial mobilization 48–51evaluating all guarantee applications 70expanding water coverage and quality 81fostering cost recovery 24–26, 79implementing fiscal reform 79improving governance 79improving policy planning and coordination 46–48improving private sector planning 80improving public perceptions of private sector 70increasing institutional credibility 28–29maintaining and expanding roads 81maximizing competition 28–29minimizing corruption 26–27providing incentives and technical assistance to LGUs
80reducing general country risk 68resolving issues on stalled private projects 80strengthening and reorienting central agencies 80strengthening enabling policy framework 70
recommendations, powerensuring consumer and industry protection 104focusing investments on priorities 98implementing market restructuring 99–103improving financial performance 98improving regulatory performance 103maximizing benefits from private participation 103
recommendations, roadsimplementing structural changes 161–163improving governance and accountability of DPWH
spending 160–161improving private sector participation 163–164relying more on user charges 163
recommendations, telecomsadopting best practice for the institutional structure 179developing new NTDP 182enhancing competition 179–182moving toward universal access 178–179
reforming spectrum management 182recommendations, water
carrying out public utility reform 132–133enhancing sector financing and rationalizing subsidies
133establishing an integrated sector framework 130–132expanding sanitation and sewerage coverage 134–135implementing cost-recovery tariffs 129–130
reforms. See also recommendations; See also consumer surplus from reforms
and political intervention 38business climate 18estimated impact of 75–77pension system 50prioritizing 74–78
regional infrastructure 39–40regional variations 7–9, 186–187regulators. See also judiciary, interventions
lack of coordination 23lack of political autonomy 22lack of separation between policy, regulatory, and opera-
tional functions 22limited regulatory capacity 23recommendations 28summary of 22
regulatory capacityrecommendations 28
regulatory capacity, limited 23risk. See also guarantees
EIU competitiveness risk scores 5general country 57, 60–61, 66
recommendations 68guarantees in BOT projects 12high, in investing 21, 66political 42power
main 98managing 98, 100market reforms 83–84political, market, price 84political and regulatory 96price volatility 94recommendations 98reforms 98–99WESM 95
private financing 52, 64regulatory 21, 59water
foreign exchange 115risk-aversion
banks 44road accidents 154
cost of 154, 159underreporting of 3
WorldBankInfra.indb 218 12/6/2005 8:42:27 AM

Index �1�
road map. See recommendationsroads 139–166. See also local roads; See also national
roads; See also toll roads; See also vehicle operating costs, high
access rates. See access ratesaccidents. See road accidentsaffordability 155congestion 154
cost of 139increasing 157
financing gapinvestment 150maintenance 150
government expenditure 148international comparisons 153, 155, 156number of employees per km 155ownership structure, selected roads 212recommendations 159–164vehicle overloading 159
road safety 159lack of sustainable strategy 139recommendations 164
Ssanitation. See also water
minimal cost recovery 15sewage
and decline in tourism 4exposure to population 3
sewerageaccess rates 120lack of 118, 120low cost recovery 124recommendations 132, 134, 136underinvestment 129
short termism 42–43, 78recommendation 47
spatial inequalities. See regional variationsspectrum management 177, 182SSIPs
competition 20instability due to political interference 20need for 68recommendations 28transport 20water 20
market share 111, 116service levels 121tariffs 123, 125
subsidies 25, 59, 65. See also guarantees, government; See also lifeline tariffs, power
cost recovery 24for LWUA 128improving delivery 73
LGU water systems 16need for more stringent policies 64poor targeting 26recommendations 69, 79telecoms
TELOF 179universal access 178
waterrationalizing 129, 133, 134recommendations 129, 133, 134
suggested actions. See recommendationsSupreme Court. See also judiciary, interventions
decisions 23, 24, 56, 68, 125
Ttariffs. See also lifeline tariffs; See also subsidies; See
also cost recoverybenchmark 29judicial intervention 23long-distance 171political interference 15, 21, 59, 61ports 17power 16, 92
composition 92international comparison 92lack of cost recovery 91political sensitivities 93recommendations 24–26, 75, 79
recommendations 79roads 16. See also tolls
freight 155intercity freight 139passenger 155public transport 155recommendations 24–26
social considerations 15telecoms
cellular 176decreased 171, 176
waterinternational comparison 122lack of cost recovery 108LGU systems 16, 122limited cost recovery, Manila 16low cost recovery 124–125Manila 122political interference 111, 112public perceptions of 123recommendations 24–25, 76, 79, 81, 129–130set by LWUA, water districts 16SSIPs 20, 123water districts 122
water, lack of information 122telecoms 167–184
access rates. See access rates
WorldBankInfra.indb 219 12/6/2005 8:42:27 AM

��0 Philippines: Meeting Infrastructure Challenges
basic services, shortage of 168cable television 172cellular 171–172competition 176
recommendations 179domination by PLDT 167, 170, 171financing 172–173Internet 172investment 172–173market entry 169regulation 168–169spectrum management 177
recommendations 182structure 170–172teledensity 174teledensity, international comparison 175universal access 177
recommendations 178teledensity, international comparison 175TELOF
losses 168toll roads 144–145, 149
delay in construction 157investment outlook 149legal basis 140limited private sector role 139, 158recommendations 163–164
tollsinternational comparison 156political interference 159recommendations 161
traffic accidents. See road accidentsTRB
autonomy called into question 159public misconceptions 70recommendations 164
Uunderinvestment
power distribution 11, 90regional infrastructure 39roads 139–141sanitation and sewerage 129water 107, 116
unsolicited bidsambiguities in BOT policy 64, 67high number of 20, 63majority of private contracts via 21recommendations 68–70, 80, 164scope for corruption 26
urbanization 1, 4, 8–10, 43, 77
user chargesimportance for financing 43recommendations 48, 81, 163
Vvehicle growth 147vehicle operating costs, high 3, 153, 155, 156vehicle overloading 159
Wwater 107–137. See also SSIPs
access rates. See access ratesaffordability 123avoidable economic losses 107capital expenditure
low level of 116per connection 116
investmentneeds 107, 116–118, 210–211recommendations 133
key legislation 207–208low cost recovery 124
recommendations 129–130Manila water concessions. See MWCI, MWSI, MWSSmarket structure
household provision 116LGUs and community-based organizations 112–113private sector 113SSIPs 114–116water districts 111–112
policy, main gov’t agencies 209–210weak policy and institutional framework 108, 123
recommendations 130weak regulatory framework 108, 126
recommendations 130water districts
ambiguity of relationship with LGUs 108dominant urban service providers outside Manila 111financing constraints 65, 128importance of LWUA 111, 126, 127inadequate cost recovery 15low service coverage 16political interference 15regulation 22, 109, 110small size 108tariffs set by LWUA 16vagueness of ownership structure 23
water supply and sanitation. See waterWESM 67, 75, 83, 86, 95–96
recommendations 99–103
WorldBankInfra.indb 220 12/6/2005 8:42:28 AM

WorldBankInfra.indb 221 12/6/2005 8:42:28 AM

WorldBankInfra.indb 222 12/6/2005 8:42:28 AM