83766 - World Bank Documents & Reports
72
Building Evidence, Shaping Policy Findings of the 2012 Timor-Leste Education Survey M i n i s t e r i u F i n a n s a s Haloita nia mehi sai realidade Public Disclosure Authorized Public Disclosure Authorized Public Disclosure Authorized Public Disclosure Authorized
-
Upload
khangminh22 -
Category
Documents
-
view
0 -
download
0
Transcript of 83766 - World Bank Documents & Reports
Building Evidence, Shaping PolicyFindings of the 2012 Timor-Leste Education Survey
Mini
steriu Finansas
Halo ita nia mehi sai realidade
Pub
lic D
iscl
osur
e A
utho
rized
Pub
lic D
iscl
osur
e A
utho
rized
Pub
lic D
iscl
osur
e A
utho
rized
Pub
lic D
iscl
osur
e A
utho
rized
wb456288
Typewritten Text
83766
THE WORLD BANK OFFICE DILIAvenida dos Direitos Humanos Dili, Timor-LesteTel +670 3312367
August 2013
Building Evidence, Shaping Policy | Findings of the 2012 Timor-Leste Education Survey is a product of staff of the World Bank. The fi ndings, interpretation and conclusion expressed herein do not necessarily refl ect the views of the Board of Executive Directors of the World Bank or the government they represent.
The World Bank does not guarantee the accuracy of the data included in this work. The boundaries, colors, denomination and other information shown on any map in this work do not imply any judgment on the part of the World Bank concerning the legal status of any territory or the endorsement of acceptance of such boundaries.
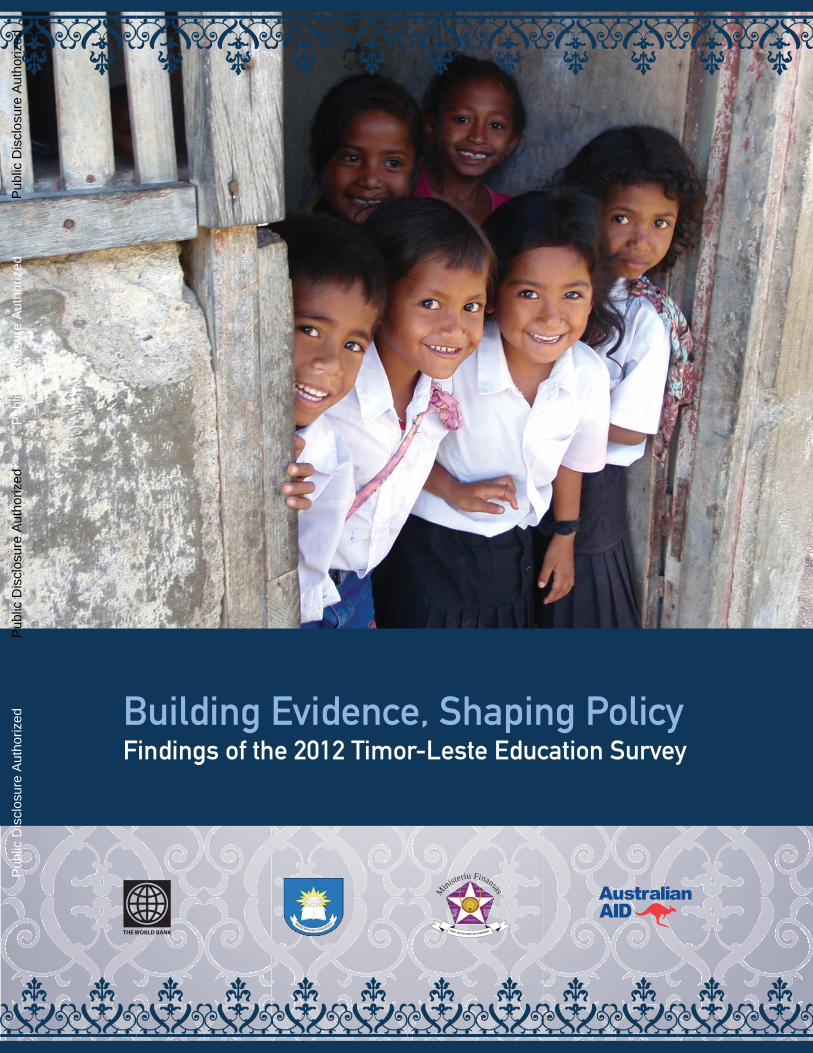
Photo credit: World Bank.

Building Evidence, Shaping PolicyFindings of the 2012 Timor-Leste Education Survey
August 2013
2 Building Evidence, Shaping PolicyFindings of the 2012 Timor-Leste Education Survey
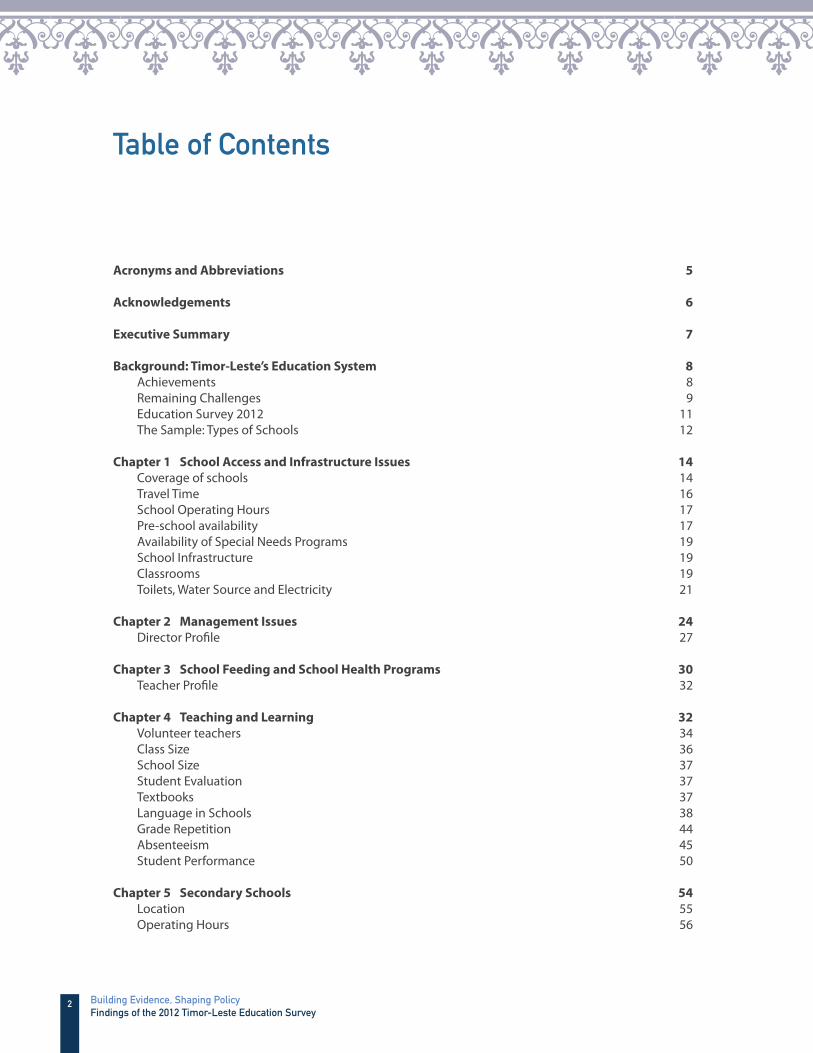
Table of Contents
Acronyms and Abbreviations 5
Acknowledgements 6
Executive Summary 7
Background: Timor-Leste’s Education System 8
Achievements 8 Remaining Challenges 9 Education Survey 2012 11 The Sample: Types of Schools 12
Chapter 1 School Access and Infrastructure Issues 14
Coverage of schools 14 Travel Time 16 School Operating Hours 17 Pre-school availability 17 Availability of Special Needs Programs 19 School Infrastructure 19 Classrooms 19 Toilets, Water Source and Electricity 21
Chapter 2 Management Issues 24
Director Profi le 27
Chapter 3 School Feeding and School Health Programs 30
Teacher Profi le 32
Chapter 4 Teaching and Learning 32
Volunteer teachers 34 Class Size 36 School Size 37 Student Evaluation 37 Textbooks 37 Language in Schools 38 Grade Repetition 44 Absenteeism 45 Student Performance 50
Chapter 5 Secondary Schools 54
Location 55 Operating Hours 56
3Table of Contents
Class Size 56 Teachers 56 Infrastructure and School Materials 57
Key Policy Recommendations 58
Bibliography 61
Appendix 64
Appendix A: Basic Regression Tables 64
List of Figures
Figure 1: Trend of students, teachers, and student/teacher ratio (2002-2010) 8Figure 2: GER gaps by education level, 2010 9Figure 3: Internal ineffi ciency of the system 10Figure 4: School Types of Primary Schools: Public versus Private; Filial versus Central School 13Figure 5: Location of all schools in Timor-Leste 15Figure 6: Percentage of Grade 4 students needing an hour or more to reach school 16Figure 7: Percentage of Grade 4 Students using means of transport other than walking to reach school 17Figure 8: Percentage of Primary Schools with Pre-school by district 18Figure 9: Number of Pre-Schools by District 18Figure 10: Students per classroom ratio for Primary Schools 20Figure 11: Percentage of Primary Schools running more than one shift per day 21Figure 12: Type of Toilet Facility at Primary Schools 22Figure 13: Main Source of Water at the School 22Figure 14: Percentage of Primary Schools using Electric Lighting in Classrooms 23Figure 15: Self-reported highest Education Level 27Figure 16: Percentage of Grade 4 students having received food the previous school day 31Figure 17: Self-reported Highest Level of Education of Primary School Teachers 32Figure 18: Percentage of Primary School Teachers with Secondary Education or less by District 33Figure 19: Percentage of Teachers receiving Portuguese Training by District 34Figure 20: Share of voluntary teachers among Escola Basika teachers by district 35Figure 21: Self-reported highest level of education of voluntary primary school teachers 35Figure 22: Median Grade 1 class size by district and type of school 36Figure 23: Median class size by grade 37Figure 24: Percentage of Primary Schools with no Tetum Textbooks or more than 20 Students per Textbook 38Figure 25: Mother Tongue of Grade 4 Students by District 39Figure 26: Percentage of Teachers using language in instruction 39Figure 27: Percentage of Primary School Teachers using other local languages in instruction 40Figure 28: What languages do Grade 4 students speak and understand? 41Figure 29: What languages do Grade 11 students speak and understand? 41Figure 30: Percentage of Grade 4 Students understanding None or Very little of Portuguese/Tetum 42Figure 31: Percentage of Grade 4 Teachers reporting poor comprehension of instruction language as an obstacle (to a large or some extent) 43Figure 32: Distribution of Local Languages by District 43
4 Building Evidence, Shaping PolicyFindings of the 2012 Timor-Leste Education Survey
Figure 33: Grade 1 Repetition Rates across the Region 44Figure 34: Grade 1 Repetition Rates by District 44Figure 35: Absenteeism Rate of Primary School Teachers (Grade 4) by District and School Type 45Figure 36: Reasons for Teacher Absence 46Figure 37: Observed Grade 1 Absenteeism Rates 46Figure 38: Observed Grade 4 Student Absenteeism Rates 48Figure 39: Self-reported Absence of Grade 4 Students by Student Characteristics 49Figure 41a: Main Reason for Student Absence reported by Grade 4 Students 50Figure 41b: Main Reason for Student Absenteeism according to Grade 4 Teachers 50Figure 42: Median number of Tetum Letters recognized by Grade 1 Students within one Minute 52Figure 43: Gross Attendance Ratio by District 54Figure 44: Total number of secondary schools by District 55Figure 45: Self-reported Highest Level of Education, Secondary School Teachers 56
List of Tables
Table 1: Number of Schools by Type 12Table 2: Decision Making Authority according to School Director 25Table 3: Self-reported activities of Primary School Director 28Table 4: Availability of Textbooks at Primary Schools according to Teachers (in % of schools) 38Table 5: Chores performed at home 48Table 6: Tetum Letter Recognition Test 51Table 7: School Fixed Eff ects Regression of Grade 4 Student Absenteeism 64Table 8: School conditions and Grade 4 Absenteeism Rate 65Table 9: Average school performance 66

5
Acronyms and Abbreviations
CCT Conditional Cash Transfer
DNE National Directorate of Statistics (Direcção Nacional de Estatística)
EGMA Early Grade Mathematics Assessment
EGRA Early Grade Reading Assessment
EMIS Education Management Information System
GAR Gross Attendance Ratio
GER Gross Enrollment Ratio
HIES Household Income and Expenditure Survey
IFPRI International Food Policy Research Institute
IFU Investment Infrastructure Unit
IMF International Monetary Fund
INFORDEPE National Institute for Training of Teachers and Education Professionals
MoE Ministry of Education
OECD Organisation for Economic Co-operation and Development
PTA Parent Teacher Association
RDTL Democratic Republic of Timor-Leste
SABER Systems Approach for Better Education Results
UNTL National University of Timor-Leste
WHO World Health Organization
6 Building Evidence, Shaping PolicyFindings of the 2012 Timor-Leste Education Survey
Acknowledgements
This report was prepared by Lena Lepuschuetz (EASHS) under the guidance of Dandan Chen (EASHE). The report is part of a wider eff ort to strengthen Timor-Leste’s education sector and improve education service delivery though building a solid information source and analytical foundation. The results presented in this study are based on the 2012 Timor-Leste Education Survey which was conducted in collaboration with the National Directorate of Statistics, the Ministry of Education as well as AusAID and Beatriz Godoy (Consultant).
The team would like to thank Fred Brooker (AusAID), Susiana Iskandar (EASHE), Rita Fernandes (EASHD), Amer Hasan (EASHE), Futoshi Yamauchi (EASHE) as well as Stefanie Stallmeister (ECAVP), Muna Meky (AFTEE) and Michel Welmond (HDNED) who peer-reviewed the report for valuable comments and suggestions. Further, the team is grateful to Xiaoqing Yu (Sector Director, EASHD) and Luis Benveniste (Sector Manager, EASHE) for their guidance and input.
7
Executive Summary
Reliable evidence is needed to design policies that will allow overcoming Timor-Leste’s remaining
challenges in provision of quality education. In recent post-confl ict years, aided by availability of oil revenues, Timor-Leste has been able to considerably improve availability of schools and access to education. However, quality of education and ensuring that children actually learn at school remain signifi cant problems as highlighted by numerous recent assessments and confi rmed by a simple performance test undertaken as part of this study.
This report presents fi ndings of the 2012 Education Survey, a collaboration between the Ministry
of Education, the National Directorate of Statistics, AusAID and the World Bank. The survey collected detailed information at all primary, pre-secondary and secondary schools in the country. Its objectives were to support the improvement of Timor-Leste’s education quality and service delivery through building a solid information source and analytical foundation which will allow for sound, evidence-based policy making.
The survey results indicate that student absenteeism should be a major cause for concern. More than one third of Grade 1 students were absent from school on the day of the survey, in some districts it was half or even more. As expected, analysis suggests that opportunity cost matters meaning that students with longer travel times or which have to help in the household are less likely to attend school.
Students’ understanding of Portuguese, even after four years of instruction, is very low. Results show that self-reported understanding of Portuguese, after a couple of years of schooling, is minimal with 78 percent of Grade 4 students reporting that they do not understand Portuguese at all or only very little. In some districts such as Oecusse and Lautem understanding of Tetum is also limited. In relation to this, the use of local languages in instruction is strikingly high. For instance in Oecusse, almost 98 percent of Grade 4 teachers make use of local languages in the classroom.
Despite ten years of investment, lack of infrastructure remains an issue in this new nation. Student to classroom ratios are high, in particular in Dili where 48 percent of schools have more than 60 students per classroom. 33 percent of public schools have no toilets, many no provision of water and only 21 percent of primary schools use electricity. In regards to school materials, a quarter of primary schools lack Math and Portuguese textbooks and the majority have no Tetum textbooks.
Education levels of primary school teachers are low, with the majority only having secondary
education. For 71 percent of primary school teachers the highest level of education is secondary school, for 6 percent it is even lower. Further, there are discussions to convert the large proportion of volunteer teachers, which have even lower levels of average education, into permanent teachers.
Both demand and supply side interventions are needed to tackle the challenges faced. Some key policy areas should be: (1) Improving school attendance through creating appropriate demand-side incentives; (2) Enhancing teacher quality; (3) Strengthening instruction language policy; (4) Improving education system management; (5) Improving school infrastructure and learning environment; and (6) Ensuring adequate supply of textbooks.
8 Building Evidence, Shaping PolicyFindings of the 2012 Timor-Leste Education Survey
Background: Timor-Leste’s Education System
After emerging from a long struggle for independence and internal confl icts between 1999 and 2006,
Timor-Leste has made substantial progress towards restoring stability and rebuilding the country. Economic growth has been in the double-digits in recent post-confl ict years and non-oil GDP has increased from $494 in 2007 to $876 in 2010 (IMF, 2012, GDP at current prices). However, poverty rates and other human development indicators such as malnutrition and stunting remain high or have even increased in recent years. According to the Global Hunger Index, which measures national hunger as a percent of the population, Timor-Leste ranked 75th among the 81 countries surveyed (IFPRI, 2011).
In 2011 the government launched its Strategic Development Plan to transform Timor-Leste into
an upper-middle-income country by 2030. This plan recognizes that education and training are key to improving the life opportunities of the Timorese people as well as are vital to Timor-Leste’s economic development and growth. The Strategic Development Plan stresses that the fi rst step should be to remove barriers to access to education, however in addition to improving access Timor-Leste has to improve quality and equity so that good learning outcomes can be achieved (RDTL, 2011). So far Timor-Leste has made far strides in the fi rst step, improving access, however large obstacles in achieving quality education remain.
Achievements
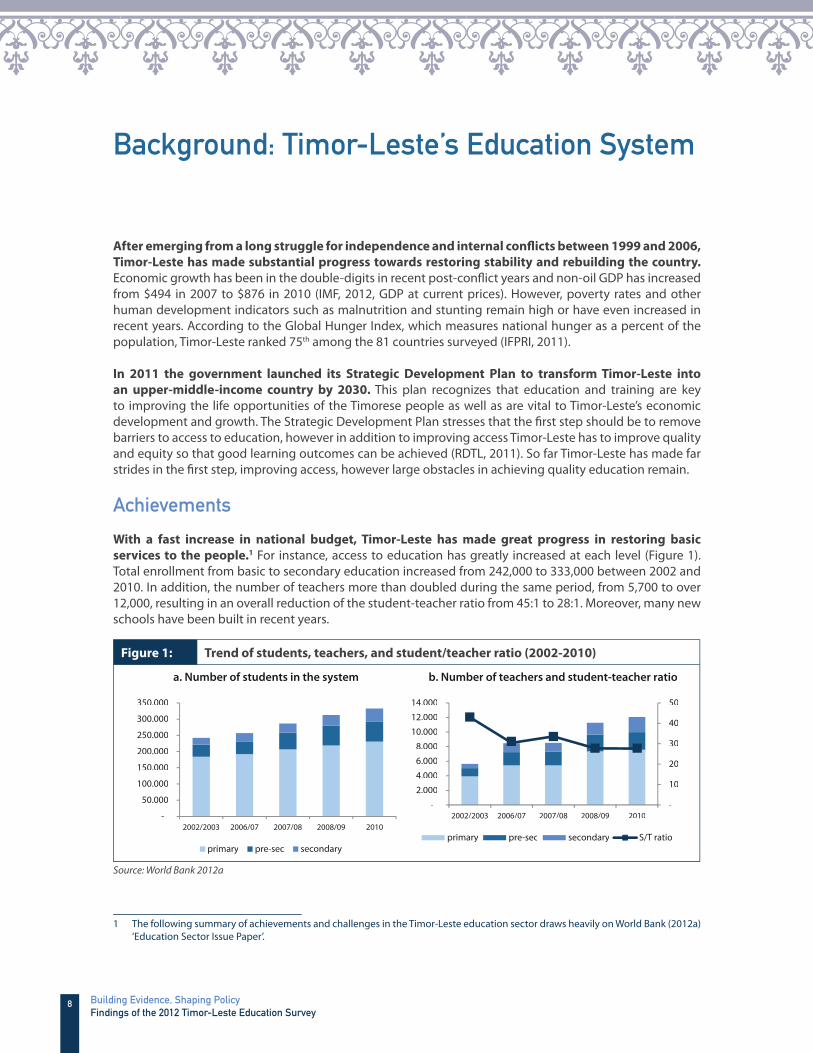
With a fast increase in national budget, Timor-Leste has made great progress in restoring basic
services to the people.1 For instance, access to education has greatly increased at each level (Figure 1). Total enrollment from basic to secondary education increased from 242,000 to 333,000 between 2002 and 2010. In addition, the number of teachers more than doubled during the same period, from 5,700 to over 12,000, resulting in an overall reduction of the student-teacher ratio from 45:1 to 28:1. Moreover, many new schools have been built in recent years.
Figure 1: Trend of students, teachers, and student/teacher ratio (2002-2010)
-
50.000
100.000
150.000
200.000
250.000
300.000
350.000
a. Number of students in the system b. Number of teachers and student-teacher ratio
2002/2003 2006/07 2007/08 2008/09 2010
primary pre-sec secondary
-
10
20
30
40
50
-
2.000
4.000
6.000
8.000
10.000
12.000
14.000
2002/2003 2006/07 2007/08 2008/09 2010
primary pre-sec secondary S/T ratio
Source: World Bank 2012a
1 The following summary of achievements and challenges in the Timor-Leste education sector draws heavily on World Bank (2012a) ‘Education Sector Issue Paper’.
9Background:Timor-Leste’s Education System
The overall enrollment increases in recent years were at faster paces than the population growth
of the relevant age groups and resulted in an increase of the Gross Enrollment Ratio (GER) at each
level. By 2010, the GER of primary education was at 105 percent, and that of pre-secondary and secondary education was at 74 percent and 61 percent respectively compared to 51 and 28 percent in 2001/2002.
Although education spending as a share of GDP decreased from 22 percent in 2004 to 9 percent in
2010, absolute levels of education spending have increased. Natural resource wealth has allowed an increase of government expenditure from 13 percent of GDP in 2004 to 25 percent in 2010 supporting the expansion of the education sector. The increase of public expenditure in education has mostly been at an even faster pace than enrollment growth in basic and secondary education which equaled around 9-10 percent per annum in recent years.
There has been signifi cant eff ort to improve service delivery and capacity building in the education
system. A school grants program was introduced by the government of Timor-Leste in 2006 as part of its commitment to abolish school fees, improving the management and administration of schools and improving the quality of education. The creation of the Investment Infrastructure Unit (IFU) in 2003 has established a good record in identifying, designing and managing the school construction program of the MoE. MoE’s capacity for strategic planning was also strengthened as shown in the preparation of a comprehensive draft strategic plan for the education sector. Further, the Education Management Information System (EMIS) was established in 2003 to gather relevant data to monitor key indicators and help in the design of policy interventions in the sector.
Remaining Challenges
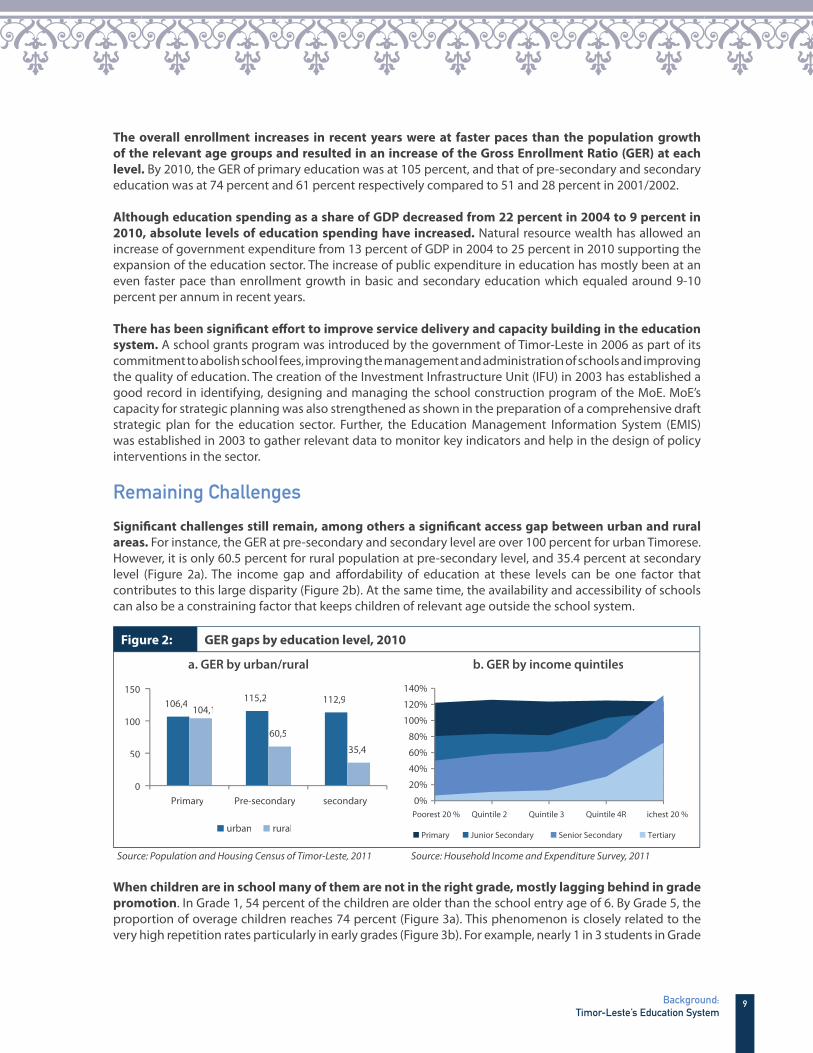
Signifi cant challenges still remain, among others a signifi cant access gap between urban and rural
areas. For instance, the GER at pre-secondary and secondary level are over 100 percent for urban Timorese. However, it is only 60.5 percent for rural population at pre-secondary level, and 35.4 percent at secondary level (Figure 2a). The income gap and aff ordability of education at these levels can be one factor that contributes to this large disparity (Figure 2b). At the same time, the availability and accessibility of schools can also be a constraining factor that keeps children of relevant age outside the school system.
Figure 2: GER gaps by education level, 2010
a. GER by urban/rural b. GER by income quintiles
106,4 115,2 112,9104,1
60,5
35,4
0
50
100
150
Primary Pre-secondary secondary
urban rural
0%
20%
40%
60%
80%
100%
120%
140%
Poorest 20 % Quintile 2 Quintile 3 Quintile 4R ichest 20 %
Primary Junior Secondary Senior Secondary Tertiary
Source: Population and Housing Census of Timor-Leste, 2011 Source: Household Income and Expenditure Survey, 2011
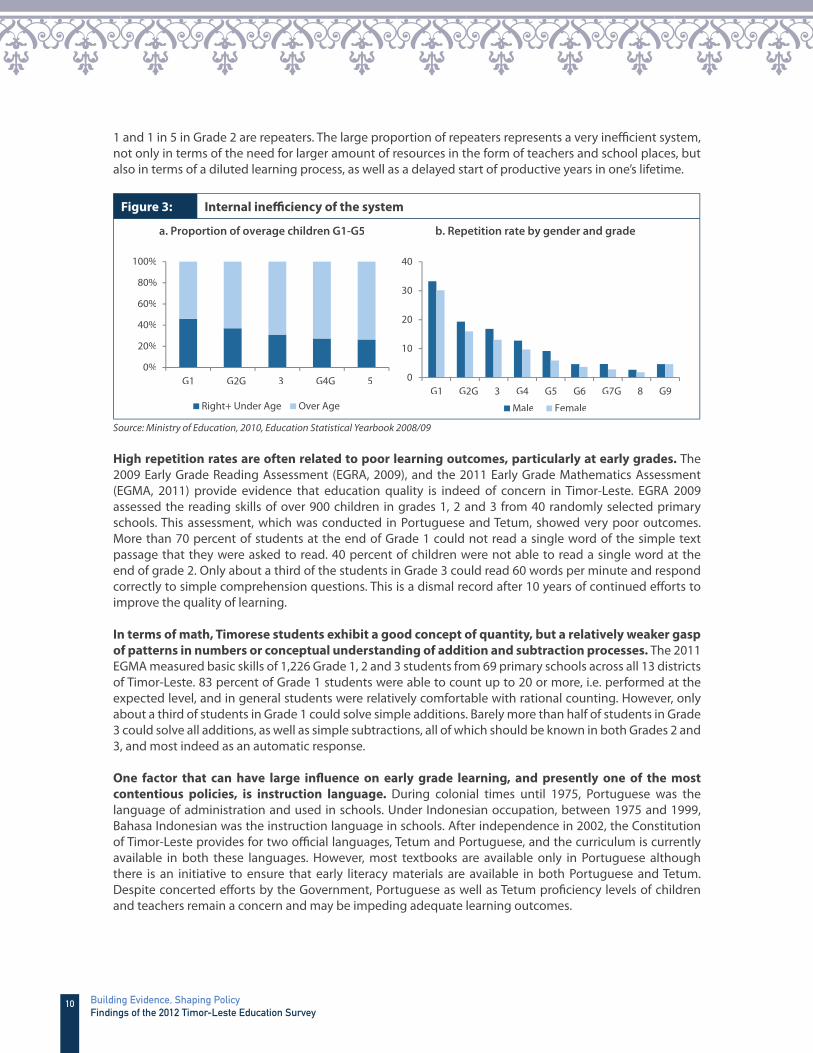
When children are in school many of them are not in the right grade, mostly lagging behind in grade
promotion. In Grade 1, 54 percent of the children are older than the school entry age of 6. By Grade 5, the proportion of overage children reaches 74 percent (Figure 3a). This phenomenon is closely related to the very high repetition rates particularly in early grades (Figure 3b). For example, nearly 1 in 3 students in Grade
10 Building Evidence, Shaping PolicyFindings of the 2012 Timor-Leste Education Survey
1 and 1 in 5 in Grade 2 are repeaters. The large proportion of repeaters represents a very ineffi cient system, not only in terms of the need for larger amount of resources in the form of teachers and school places, but also in terms of a diluted learning process, as well as a delayed start of productive years in one’s lifetime.
Figure 3: Internal ineffi ciency of the system
a. Proportion of overage children G1-G5 b. Repetition rate by gender and grade
0%
20%
40%
60%
80%
100%
G1 G2G 3 G4G 5
Right+ Under Age Over Age
0
10
20
30
40
G1 G2G 3 G4 G5 G6 G7G 8 G9
Male Female
Source: Ministry of Education, 2010, Education Statistical Yearbook 2008/09
High repetition rates are often related to poor learning outcomes, particularly at early grades. The 2009 Early Grade Reading Assessment (EGRA, 2009), and the 2011 Early Grade Mathematics Assessment (EGMA, 2011) provide evidence that education quality is indeed of concern in Timor-Leste. EGRA 2009 assessed the reading skills of over 900 children in grades 1, 2 and 3 from 40 randomly selected primary schools. This assessment, which was conducted in Portuguese and Tetum, showed very poor outcomes. More than 70 percent of students at the end of Grade 1 could not read a single word of the simple text passage that they were asked to read. 40 percent of children were not able to read a single word at the end of grade 2. Only about a third of the students in Grade 3 could read 60 words per minute and respond correctly to simple comprehension questions. This is a dismal record after 10 years of continued eff orts to improve the quality of learning.
In terms of math, Timorese students exhibit a good concept of quantity, but a relatively weaker gasp
of patterns in numbers or conceptual understanding of addition and subtraction processes. The 2011 EGMA measured basic skills of 1,226 Grade 1, 2 and 3 students from 69 primary schools across all 13 districts of Timor-Leste. 83 percent of Grade 1 students were able to count up to 20 or more, i.e. performed at the expected level, and in general students were relatively comfortable with rational counting. However, only about a third of students in Grade 1 could solve simple additions. Barely more than half of students in Grade 3 could solve all additions, as well as simple subtractions, all of which should be known in both Grades 2 and 3, and most indeed as an automatic response.
One factor that can have large infl uence on early grade learning, and presently one of the most
contentious policies, is instruction language. During colonial times until 1975, Portuguese was the language of administration and used in schools. Under Indonesian occupation, between 1975 and 1999, Bahasa Indonesian was the instruction language in schools. After independence in 2002, the Constitution of Timor-Leste provides for two offi cial languages, Tetum and Portuguese, and the curriculum is currently available in both these languages. However, most textbooks are available only in Portuguese although there is an initiative to ensure that early literacy materials are available in both Portuguese and Tetum. Despite concerted eff orts by the Government, Portuguese as well as Tetum profi ciency levels of children and teachers remain a concern and may be impeding adequate learning outcomes.

11Background:Timor-Leste’s Education System
Education Survey 2012
Overcoming remaining challenges will require the right mix of policies which need to be based on
reliable evidence. The objective of the Timor-Leste 2012 Education Survey was to support the improvement of Timor-Leste’s education quality and service delivery through building a solid information source and analytical foundation. There is a clear lack of comprehensive analysis, in particular of what is happening at the school-level. The purpose and scope of this Education Survey diff ered and is complementary to the Education Management Information System (EMIS). Indeed, the survey was not undertaken for administrative purposes, but for policy analysis, and gathered additional detailed information on school-level practices and situation. These survey results will facilitate evidence-based policy dialogue among development partners and the Timor-Leste government.
The 2012 survey obtained representative data on resources, policies and practices at the school level
through face-to-face interviews at all 1372 primary, pre-secondary and secondary schools of Timor-
Leste. The survey consisted of several modules:
1. The largest component of the survey was answered by the school director (or if not possible, as in 13.4 percent of cases, by the deputy director or head teacher) and included questions on education and background of the director, school background and school management practices.
2. Further, enumerators completed a short section on the state and availability of infrastructure based on their own direct observation.
3. Enumerators also interviewed 3 randomly selected teachers posing questions on their background, teaching methods and classroom conditions. Teachers were selected among those teaching in Grade 4 for primary schools, Grade 8 for pre-secondary and Grade 11 for secondary schools. In total 3488 teachers were interviewed.
4. A student module was answered by 5 randomly selected students from the same grade and class at each school. Similar to teachers, students of Grade 4 were interviewed in primary schools, Grade 8 for pre-secondary schools and Grade 11 for secondary schools. In total 6829 students were interviewed.
5. Additional to these items, fi eld teams also conducted a brief reading assessment applying one of the tests used during the Early Grade Reading Assessment (EGRA, 2009). This particular test counts how many letters a student can read correctly within 60 seconds out of a list of 100 letters presented in non-alphabetical order. In small schools with less than 20 students in Grade 1, the test was administered to all Grade 1 students in Tetum. In schools with more than 20 but less than 40 Grade 1 students, 20 students were randomly selected and tested in Tetum. In schools with more than 40 Grade 1 students present, 20 were randomly selected to be tested in Tetum and another 20 were randomly selected to be tested in Portuguese. Thus, this simple letter recognition test was conducted in Tetum in 1084 schools and in 231 schools it was conducted in Portuguese as well.
6. In addition to these school level questionnaires, a very brief survey was administered to all 13 district education authorities.
Field work was conducted from September to November 2012 with some revisits done in December
2012. The 31 survey teams visited all 1372 primary, pre-secondary and secondary schools of Timor-Leste. The project was a cooperation between the Ministry of Education, the National Directorate of Statistics, AusAID as well as the World Bank. Field work was undertaken and managed by the National Directorate of Statistics with procurement and logistical support from a procurement agency working on behalf of AusAID and with technical support provided by the World Bank. The Ministry of Education provided guidance and input in instrument design as well as informed all schools of the upcoming survey.
12 Building Evidence, Shaping PolicyFindings of the 2012 Timor-Leste Education Survey
The Sample: Types of Schools
Table 1 : Number of Schools by Type2
Primary Schools/Escola Basika Central Filial
Schools with Grades 1-4 4 129
Schools with Subset of Grades 1-4 (i.e. 1, 1-2, 1-3) 1 115
Schools with Grades 1-6 96 603
Schools with Subset of Grades 1-6 (i.e. 1-5, 5-6) 2 46
Schools with Grades 1-9 39 36
Schools with Subset of Grades 1-9 (e.g. 1-7, 5-8) 44 5
Pre-Secondary Schools
Schools with Grades 7-9 149
Schools with Subset of Grades 7-9 (i.e. 7, 8, 7-8) 5
Secondary Schools
Schools with Grades 10-12 93
Schools with Subset of Grades 10-12 (i.e. 10, 11-12) 5
Total Number of Schools 1372
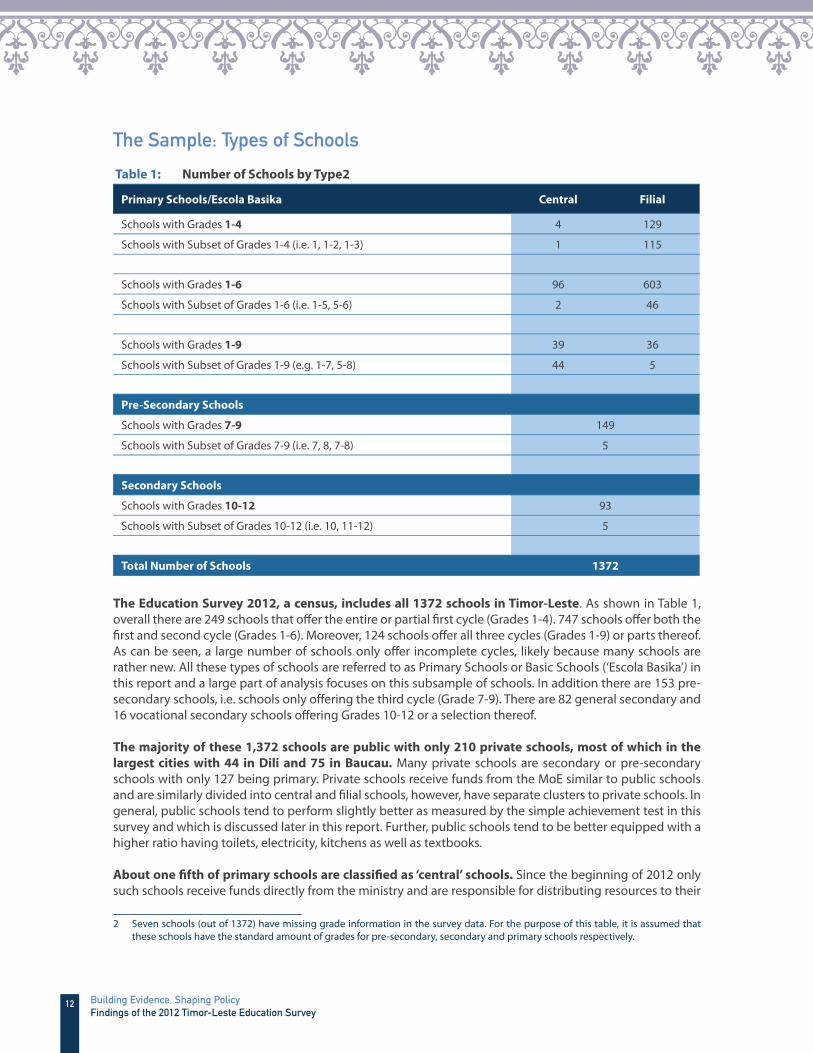
The Education Survey 2012, a census, includes all 1372 schools in Timor-Leste. As shown in Table 1, overall there are 249 schools that off er the entire or partial fi rst cycle (Grades 1-4). 747 schools off er both the fi rst and second cycle (Grades 1-6). Moreover, 124 schools off er all three cycles (Grades 1-9) or parts thereof. As can be seen, a large number of schools only off er incomplete cycles, likely because many schools are rather new. All these types of schools are referred to as Primary Schools or Basic Schools (‘Escola Basika’) in this report and a large part of analysis focuses on this subsample of schools. In addition there are 153 pre-secondary schools, i.e. schools only off ering the third cycle (Grade 7-9). There are 82 general secondary and 16 vocational secondary schools off ering Grades 10-12 or a selection thereof. The majority of these 1,372 schools are public with only 210 private schools, most of which in the
largest cities with 44 in Dili and 75 in Baucau. Many private schools are secondary or pre-secondary schools with only 127 being primary. Private schools receive funds from the MoE similar to public schools and are similarly divided into central and fi lial schools, however, have separate clusters to private schools. In general, public schools tend to perform slightly better as measured by the simple achievement test in this survey and which is discussed later in this report. Further, public schools tend to be better equipped with a higher ratio having toilets, electricity, kitchens as well as textbooks.
About one fi fth of primary schools are classifi ed as ‘central’ schools. Since the beginning of 2012 only such schools receive funds directly from the ministry and are responsible for distributing resources to their
2 Seven schools (out of 1372) have missing grade information in the survey data. For the purpose of this table, it is assumed that these schools have the standard amount of grades for pre-secondary, secondary and primary schools respectively.

13Background:Timor-Leste’s Education System
fi lial schools. 62.3 percent of central schools also state that they provide teaching support, i.e. send teachers to their fi lial schools if necessary. In general, central schools are larger, less remotely located and appear to off er higher grades. As shown in Table 1, central schools appear to off er at least Cycles 1 and 2 (Grades 1-6) or even all three Cycles (Grades 1-9), whereas many fi lial primary schools only off er the fi rst Cycle (Grades 1-4) and only a very small proportion of fi lial schools off ers the third Cycle (Grades 7-9).
Figure 4: School Types of Primary Schools: Public versus Private; Filial versus Central School
89,1%
10,9%
Public Private
19,8%
80,2%
Central Filial
Source: Education Survey 2012
14 Building Evidence, Shaping PolicyFindings of the 2012 Timor-Leste Education Survey
Chapter 1School Access and Infrastructure Issues
Coverage of schools
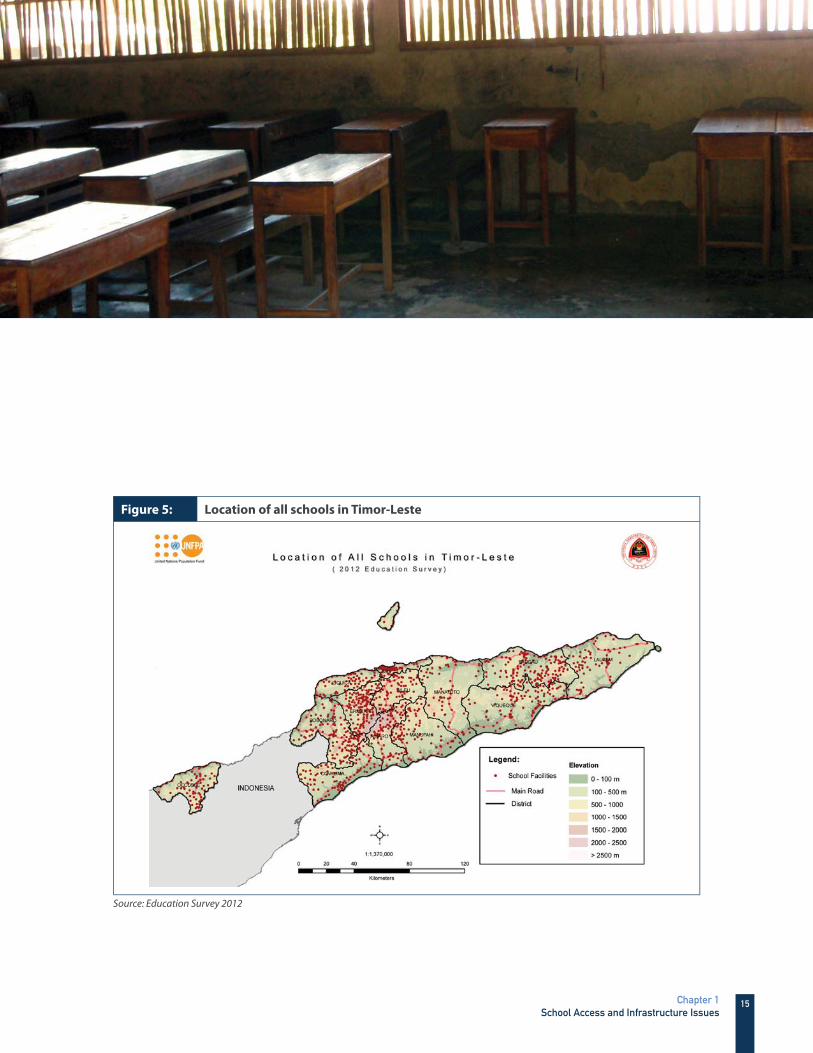
Primary schools are well-spread across Timor-Leste, many very remotely located. On average, schools are more than two hours from the closest bank, 30 minutes from the Chief of Suco (Chefe de Suco) offi ce, 50 minutes from the closest clinic, an hour from the closest police station and an hour and a half from the closest secondary school.3 22.9 percent of primary schools are two hours or more from the closest clinic, 29.7 percent two hours or more from closest police station. Figure 5 shows the geographical location of all schools in Timor-Leste according to GPS coordinates collected during the Education Survey. It can be seen that some areas have fewer schools and many schools are centered along the few existing roads.
3 These travel times refer to the most common means of transport, which in a vast majority of cases is walking.
15Chapter 1School Access and Infrastructure Issues
Figure 5: Location of all schools in Timor-Leste
Source: Education Survey 2012

16 Building Evidence, Shaping PolicyFindings of the 2012 Timor-Leste Education Survey
Catchment areas are well-defi ned with most areas only covered by one school. 73.2 percent of schools state that there are no other schools in their location. 43.6 percent of those schools that are in a location with multiple schools state that there is only one school that potentially competes for students. Not only is there little competition between schools, but schools also do not admit students selectively. The majority of primary schools, 71.9 percent, have not rejected any applications in the past three years. If schools do have to admit selectively, the fi rst criteria of selection is the student residence’s location for 52.4 percent of schools. Academic performance is taken into account by 9.8 percent of those primary schools that do not admit all applying students.
Travel Time
Average students’ travel time to primary school is relatively short, however in some districts
a signifi cant fraction of students has to travel for more than an hour.4 Mean travel time of grade 4 students from home to school is 21 minutes. This varies across districts ranging from an average travel time of 39 minutes in Viqueque, 29 minutes in Aileu to 15 in Bobonaro and 11 in Oecussi. Central schools have an average travel time of 29 minutes compared to 19 minutes for fi lial schools which are smaller and located more conveniently, closer to the households they are catering to. In certain areas distance to school is an issue despite the existence of many new schools and many very remotely located. Overall there are 10.7 percent of Grade 4 students that take one hour or more to travel to school. Again this varies by district with almost a third of students in Viqueque having to travel for an hour or more to reach school (see Figure 9).
Figure 6: Percentage of Grade 4 students needing an hour or more to reach school
Source: Education Survey 2012
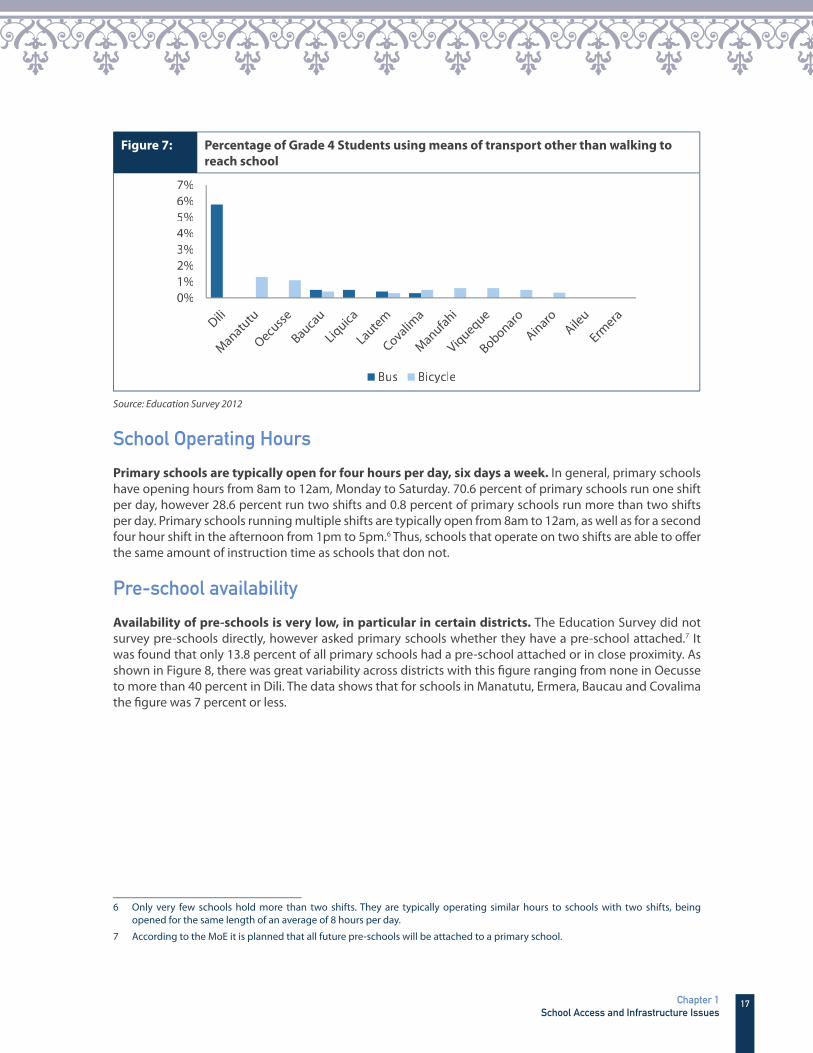
Availability of transport to school appears very limited. The most common means of transport used by Grade 4 students to reach school is almost exclusively walking (98.1 percent). 0.6 percent of students take a bus, 0.4 percent use a bicycle and 0.1 percent use a boat and 0.9 percent other means.5 Figure 7 shows that buses are only common in Dili where 5.8 percent of Grade 4 students travel by bus.
4 Again these reported travel times refer to using the most common means of transport, which for students is almost exclusively walking.
5 ‘Other means’ is particularly common in Dili and is likely to include rides on scooters by family members or similar.
17Chapter 1School Access and Infrastructure Issues
Figure 7: Percentage of Grade 4 Students using means of transport other than walking to
reach school
0%1%2%3%4%5%6%7%
Bus Bicycle
Source: Education Survey 2012
School Operating Hours
Primary schools are typically open for four hours per day, six days a week. In general, primary schools have opening hours from 8am to 12am, Monday to Saturday. 70.6 percent of primary schools run one shift per day, however 28.6 percent run two shifts and 0.8 percent of primary schools run more than two shifts per day. Primary schools running multiple shifts are typically open from 8am to 12am, as well as for a second four hour shift in the afternoon from 1pm to 5pm.6 Thus, schools that operate on two shifts are able to off er the same amount of instruction time as schools that don not.
Pre-school availability
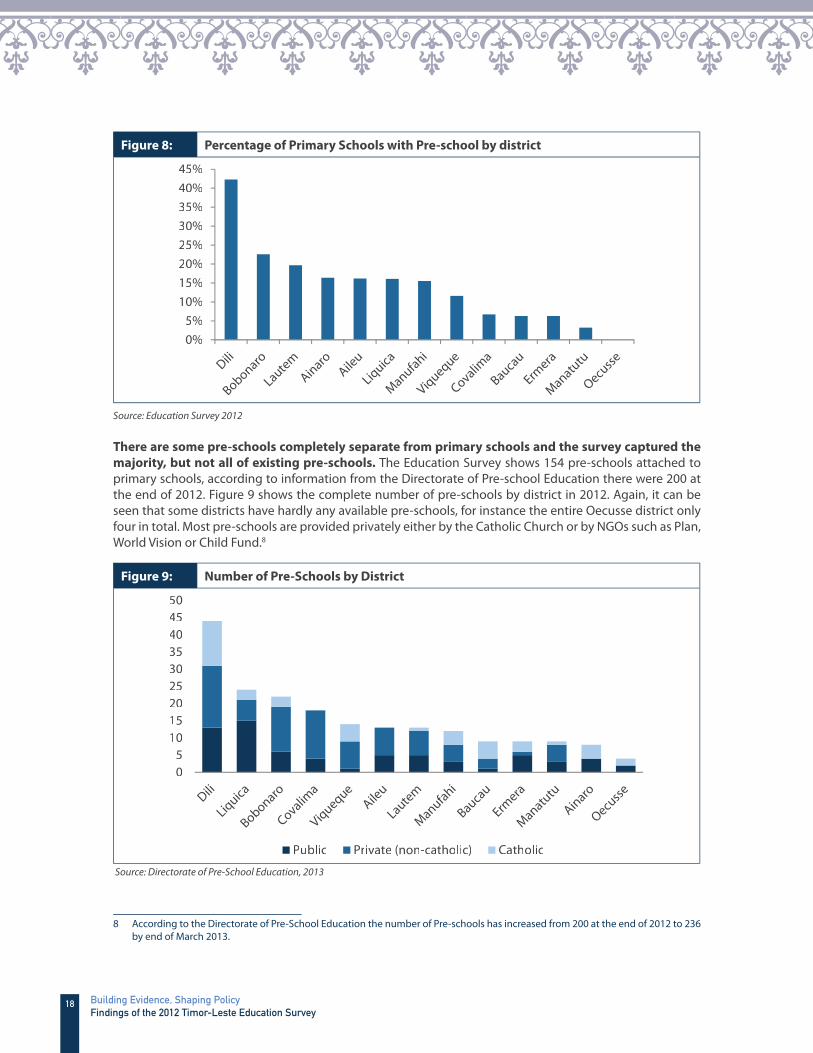
Availability of pre-schools is very low, in particular in certain districts. The Education Survey did not survey pre-schools directly, however asked primary schools whether they have a pre-school attached.7 It was found that only 13.8 percent of all primary schools had a pre-school attached or in close proximity. As shown in Figure 8, there was great variability across districts with this fi gure ranging from none in Oecusse to more than 40 percent in Dili. The data shows that for schools in Manatutu, Ermera, Baucau and Covalima the fi gure was 7 percent or less.
6 Only very few schools hold more than two shifts. They are typically operating similar hours to schools with two shifts, being opened for the same length of an average of 8 hours per day.
7 According to the MoE it is planned that all future pre-schools will be attached to a primary school.
18 Building Evidence, Shaping PolicyFindings of the 2012 Timor-Leste Education Survey
Figure 8: Percentage of Primary Schools with Pre-school by district
0%5%
10%15%20%25%30%35%40%45%
Source: Education Survey 2012
There are some pre-schools completely separate from primary schools and the survey captured the
majority, but not all of existing pre-schools. The Education Survey shows 154 pre-schools attached to primary schools, according to information from the Directorate of Pre-school Education there were 200 at the end of 2012. Figure 9 shows the complete number of pre-schools by district in 2012. Again, it can be seen that some districts have hardly any available pre-schools, for instance the entire Oecusse district only four in total. Most pre-schools are provided privately either by the Catholic Church or by NGOs such as Plan, World Vision or Child Fund.8
Figure 9: Number of Pre-Schools by District
05
101520253035404550
Public Private (non-catholic) Catholic
Source: Directorate of Pre-School Education, 2013
8 According to the Directorate of Pre-School Education the number of Pre-schools has increased from 200 at the end of 2012 to 236 by end of March 2013.
19Chapter 1School Access and Infrastructure Issues
Possibly related to pre-school availability, some children start primary school prematurely. According to student interviews, 13.4 percent of students started primary school before the offi cial Grade 1 age of 6 years. On the other hand many students, 56.5 percent, fi rst started school older than the offi cial age. This accords with administrative data from the MoE which shows that for the fi rst grade only 30 percent of students are at the offi cial school age, with 15 percent being younger and 55 percent older (MoE, 2010).9 The fact that some children start too young and others too old, in addition to high repetition rates, means that the age range in classes is unusually wide. At the end of the school year, when the school survey was undertaken, age of 1st graders ranged from 3 to 13 years. On average, Grade 1 students in a specifi c school had age diff erences of 3 years. In 13 percent of schools Grade 1 students were 5 or more years apart in their age. This can potentially lead to challenges in terms of pedagogy and class management for teachers. Lloyd (2011) suggests that learning is compromised when classrooms are more age diverse and eff ects of age heterogeneity on learning are likely to be greatest in contexts where learning levels are low. Further, the youngest students seem to suff er disproportionately from such age dispersion in the classroom.
Availability of Special Needs Programs
Only 12.7 percent of schools have special programs for children with special needs. Overall, only 36.7 percent of schools report that they do have any children with special needs in their school such as children with physical or mental disabilities. This is rather low compared to WHO fi ndings of 18.0 percent disability rates among adults in lower income countries (WHO, 2011).10 Only 34.5 percent of these schools, i.e. 12.7 percent of all primary schools, have special programs for those children with such special needs.
School Infrastructure
Schools’ physical condition and infrastructure matter for student outcomes. Several studies have documented that the condition of school buildings aff ect completion. Sey et al. (2003) and World Bank (2004a), for instance, show that the availability of certain facilities, such as for water and sanitation, have a positive relation with school completion. Hanushek (1995) reports that a majority of production function studies in developing countries found a positive eff ect of school infrastructure quality on learning achievement. Joseph and Wodon (2012), for example, show a positive association between availability of toilets, water and electricity and student test scores. A study in the Philippines found that the lack of adequate furniture had negative eff ects on learning levels (Tan, Lane and Coustere, 1997).
Classrooms
Shortage of classrooms is one of the most frequently voiced problems by school directors and teachers
in Timor-Leste. 55.2 percent of school directors believe that shortage of classrooms is a large obstacle to providing quality education and 49.1 percent of them believe it hinders student learning to a large extent. Similarly, 48.1 percent of primary school teachers believe that shortage of classrooms constitutes a large obstacle for students’ learning, only second in importance to shortages in textbooks. 42.8 percent of school directors, if given additional resources, would use them to increase infrastructure such as classrooms as their fi rst priority.
9 Some of these older children are repeaters and might have started school at the correct age.
10 In the World Disability Report (2011) the WHO estimates the disability rate among adults across 59 countries and fi nds an average disability rate of 15.6 percent, ranging from 11.8 percent in higher income to 18.0 percent in lower income countries. Disability rates are likely to be even higher in post-confl ict countries. However, these fi gures relate to adults, disability rates among school-age children are likely to be much lower. Yet, it is surprising that 63.3 percent of schools report that they do not have any children with special needs. (Disability rates according to the Timor-Leste Census (2010) are only 4.6 percent, however this is likely due to methodology and restrictive defi nition of disability).
20 Building Evidence, Shaping PolicyFindings of the 2012 Timor-Leste Education Survey
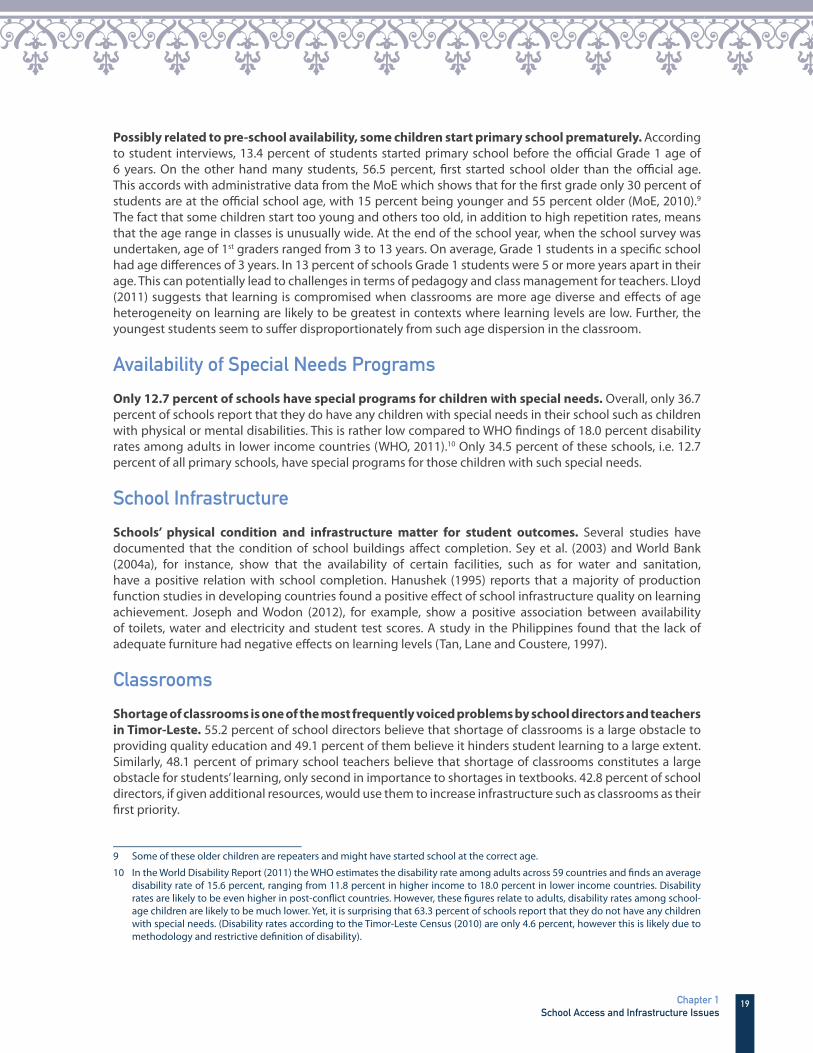
Students to classroom ratios are very high, in particular in Dili.11 According to the survey data, on average there are 39 students per classroom. However, 38.3 percent of primary schools have more than 45 students per classroom and 21.2 percent of schools more than 60 students per classroom. This shortage of classrooms is most severe in Dili where 67.5 percent of schools have more than 45 students per classroom, and 48.1 percent more than 60. Generally central schools tend to be more overcrowded, with a higher ratio of students per existing classroom. There is not much diff erence between public and private schools but fi lial schools have smaller student-classroom ratios than central schools.
Figure 10: Students per classroom ratio for Primary Schools
63
54
47 45 45 4237 36 34 34 33 30 30
68%%65%%
48%% 50%% 47%% 45%%
35%%
24%%
34%%
223%% 23%% 224%% 26%%
48%%
442%%
31%%24%%
28%% 29%%
13%% 110%%20%%
8%% 11%% 12%% 10%%
Median number of students per classroom Share of schools with more than 45 students per classroomShare of schools with more than 60 students per classroom
39 39
38% 38%
21% 20%
0%
5%
10%
15%
20%
25%
30%
35%
40%
45%
Public Private
46
3652%
35%33%
18%
05
101520253035404550
Central Filial
Source: Education Survey 2012
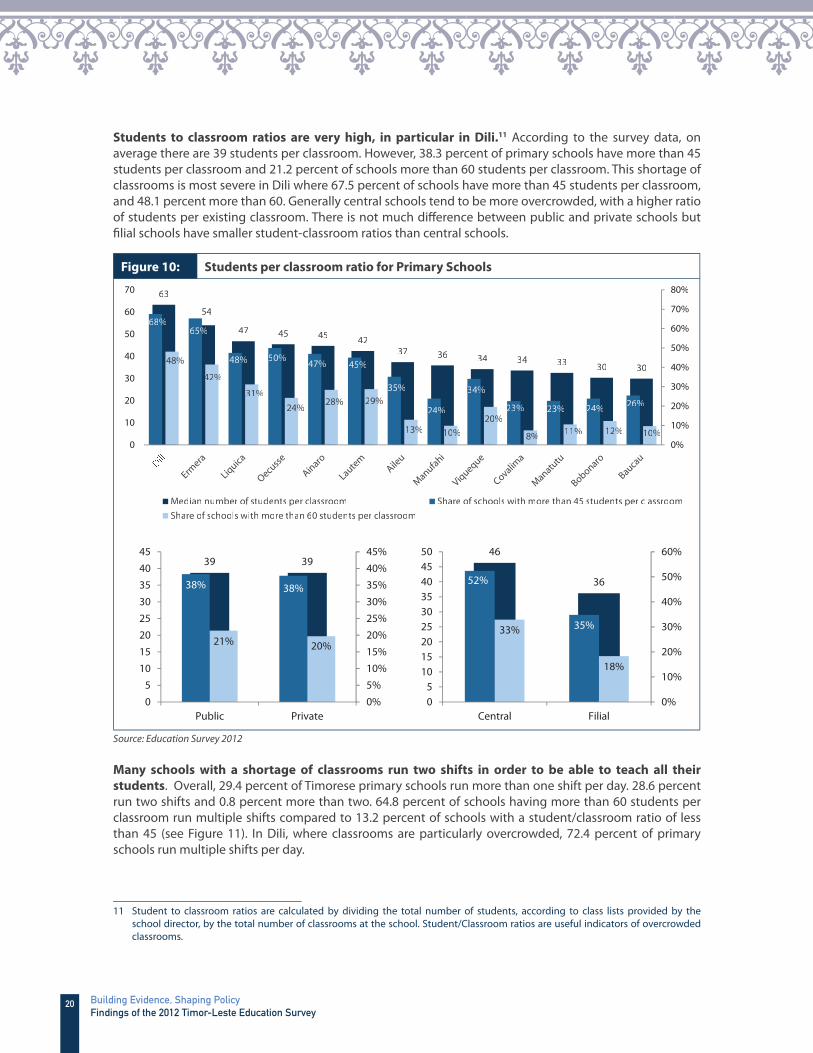
Many schools with a shortage of classrooms run two shifts in order to be able to teach all their
students. Overall, 29.4 percent of Timorese primary schools run more than one shift per day. 28.6 percent run two shifts and 0.8 percent more than two. 64.8 percent of schools having more than 60 students per classroom run multiple shifts compared to 13.2 percent of schools with a student/classroom ratio of less than 45 (see Figure 11). In Dili, where classrooms are particularly overcrowded, 72.4 percent of primary schools run multiple shifts per day.
11 Student to classroom ratios are calculated by dividing the total number of students, according to class lists provided by the school director, by the total number of classrooms at the school. Student/Classroom ratios are useful indicators of overcrowded classrooms.
21Chapter 1School Access and Infrastructure Issues
Figure 11: Percentage of Primary Schools running more than one shift per day
72%
47%
39% 38%
27% 26% 25% 25% 23% 21% 21%
11% 8%
0%
10%
20%
30%
40%
50%
60%
70%
80%
65%
41%
13%
0%
10%
20%
30%
40%
50%
60%
70%
80%
Schools withmore than 60students per
classroom
Schools with45-60
students perclassroom
Schools withless than 45students perclassrooms
Source: Education Survey 2012
There doesn’t appear to be evidence that learning time is reduced due to multiple shifts. The Education Survey collected detailed timetables for one Grade 4 class in every school. Learning time according to this information for Grade 4 students is on average 3.5 hours per day, 6 days a week. This does not appear to diff er between those schools running multiple shifts and those that do not, which indicates that schools which are forced to run multiple shifts due to classroom constraints do not reduce learning time to be able to provide these additional shifts, or at least not for Grade 4 students. It is possible that only teaching hours for earlier grades are reduced. However, examining opening hours of all primary schools indicates that this is unlikely. Schools that run multiple shifts are opened on average for 8 hours per day, exactly twice as long as schools without multiple shifts which are on average only opened for four hours per day.
Not only classrooms but also school furniture such as desks and chairs are lacking. In some cases students have to stand for their lesson as there are not enough available seats. According to the survey, schools are estimated to have on average 28.5 percent more students than available seats.12 28 percent of schools have more than twice as many students than seats, already taking into account that these schools might run multiple shifts. 22.9 percent of schools have no desks for teachers in the classroom.
Toilets, Water Source and Electricity
Almost a third of primary schools still have no toilet facilities on site. 32.3 percent of primary schools, in particular 37.1 percent of all fi lial schools, have no toilet facilities at their location (Figure 12). Such poor sanitation conditions impact students’ health and have been shown to impact student absenteeism, in particular of girls (see for instance, Dreibelbis et al., 2012).13 The Education Survey captures the type of toilet facility at every school, however does not collect further information on their use and maintenance. A recent study (World Bank, 2011) undertook a small survey of Dili schools and found that even if toilets existed there are by far too few for the amount of students; toilets don’t meet the need of the youngest students in terms of height and size; they are not sex segregated and are often claimed by teachers. Maintenance is also problematic with pits/septic tanks rarely being emptied.
12 Survey interviewers were instructed to directly observe contents and state of one Grade 4 classroom. Calculations here assume that all classes of the school on average have the same amount of seats.
13 Dreibelbis et al. (2012) show that indicators of school sanitation quality and cleanliness are clearly associated with school absence, however this is only marginally signifi cant for female students.

22 Building Evidence, Shaping PolicyFindings of the 2012 Timor-Leste Education Survey
Figure 12: Type of Toilet Facility at Primary Schools
32,3%
0%
5%
10%
15%
20%
25%
30%
35%
40%
45%
No Toilet Squat Toilet Pit Latrinewithout Slab
Pit Latrine withSlab/Improved
Pit Latrine
Flush Toilet
32,8% 26,0
%
0%
10%
20%
30%
40%
Public Private
Percentage of Schools
without Toilet Facilities
11,7%
37,1%
0%10%20%30%40%
Centralschool
Filial School
Source: Education Survey 2012
Many schools lack a safe source of drinking water and water to wash hands. 16.5 percent of schools have no water provision at all, relying on rainwater or rivers nearby. Only about half of schools have tap water available on site.
Figure 13: Main Source of Water at the School
16,5%
0%
10%
20%
30%
40%
50%
60%
No Provisionof Water
UnprotectedWell orSpring
ProtectedWell orSpring
Tap Water Bottled Water
Note: ‘No provision’ includes 5.3 percent of directors that state that there is no water, 3.3 percent of schools in which rainwater is the main water source and 8.0 percent for which a river, lake or pond nearby constitutes the main source of water. Source: Education Survey 2012
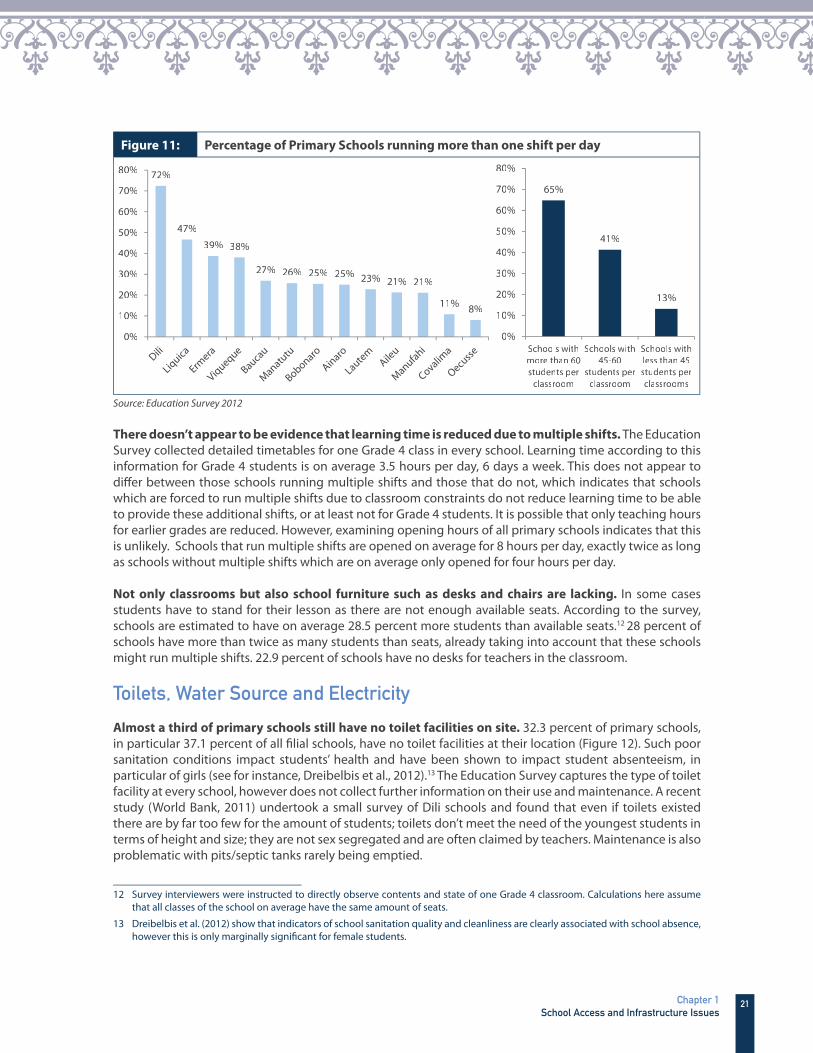
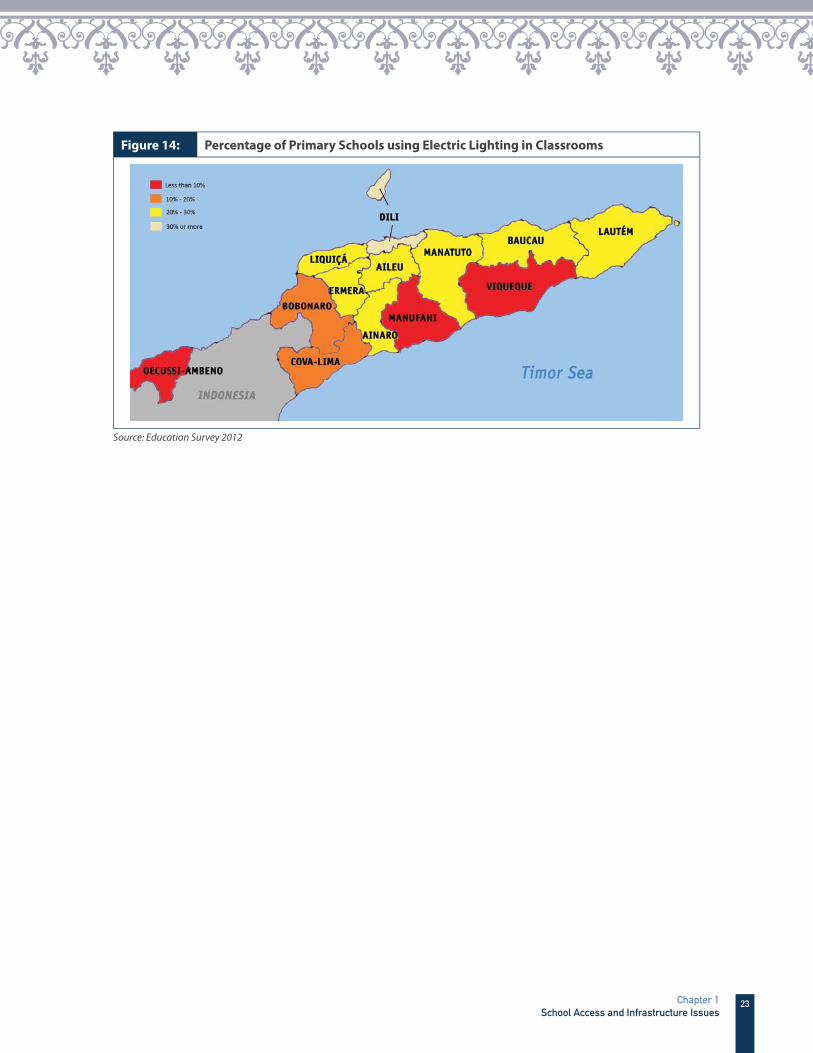
Only a minority of schools uses electric lighting in classrooms. Although 41 percent of households in Timor-Leste now use electric lighting (HIES, 2011), only 21.1 percent of primary schools use electricity in classrooms. Even in Dili where 94.6 percent of households use electric lighting, only 48.7 percent of schools do. In some districts such as Manufahi and Oecusse the percentage of schools with electric lighting is below 10 percent.
23Chapter 1School Access and Infrastructure Issues
Figure 14: Percentage of Primary Schools using Electric Lighting in Classrooms
Source: Education Survey 2012

24 Building Evidence, Shaping PolicyFindings of the 2012 Timor-Leste Education Survey
Quality education is not only about physical inputs such as textbooks, classrooms and teachers, but
also about incentives that lead to better instruction and learning. The provided resources have to be translated into services eff ectively and effi ciently. Institutional incentives that aff ect learning outcomes are, for instance, the degree of school autonomy, school accountability as well as choice and competition (Bruns, 2011). If parents can choose to send their children to a better performing school, these demand-side pressures can provide incentives for improvement. Local decision making and fi scal decentralization can positively impact learning outcomes if service providers are held accountable. Many countries are moving towards school-based-management where schools are given more autonomy over the use of inputs and held accountable for using these effi ciently.
Even though decentralizing service delivery has been on the government agenda, Timor-Leste’s
education system is currently highly centralized. Indeed, most decisions lie with the central ministry according to legislation. However, Table 2 shows de facto decision making authority according to school directors. As can be seen the director holds little authority in personnel or budget decisions, but more infl uence on teaching and student assessment decisions.14 Interestingly, 39.8 percent of directors state that they decide on instruction content and 35.7 percent state that they are responsible to make decisions on which subjects should be taught.
14 See World Bank (2012) ‘SABER- School Autonomy & Accountability, Timor-Leste’ (Draft) for an analysis of current education policies and their implications for school autonomy.
Chapter 2Management Issues
25Chapter 2Management Issues
Tab le 2: Decision Making Authority according to School Director
School director
Central school
Teachers MoEDistrict/Regional Education Offi ce
Selecting teachers for hire as permanent teachers 2.3% 2.8% 0.1% 77.1% 17.7%
Selecting teachers for hire as contract teachers 4.9% 5.7% 0.2% 66.0% 23.2%
Selecting volunteer teachers 44.7% 14.9% 2.8% 21.9% 15.7%
Firing contract teachers 5.0% 5.0% 0.3% 70.0% 19.8%
Establishing teacher salaries 1.0% 0.9% 0.1% 89.0% 9.1%
Determining teachers’ salary increases 1.0% 1.0% 0.1% 89.7% 8.4%
Formulating school budget 12.8% 10.0% 0.8% 65.9% 10.5%
Budget allocation 13.8% 11.9% 1.8% 62.5% 10.0%
Establishing student evaluation policies 43.8% 9.3% 29.1% 13.0% 4.8%
Approving student admission 51.1% 9.1% 32.0% 4.3% 3.5%
Decide whether students have to repeat 16.7% 5.1% 75.0% 2.6% 0.6%
Choose textbooks 30.1% 7.9% 27.4% 30.4% 4.2%
Determine instruction content 39.8% 8.5% 25.2% 22.6% 3.9%
Determine subjects to be taught 35.7% 4.7% 38.6% 19.2% 1.8%
Improving Infrastructure 19.2% 7.3% 2.1% 63.2% 8.4%Source: Education Survey 2012

26 Building Evidence, Shaping PolicyFindings of the 2012 Timor-Leste Education Survey
Schools are expected to receive about 17 inspection visits per year from district and regional
offi ce staff . There are 13 district offi ces which currently have little independence from the central level, however this might change with ongoing decentralization eff orts. According to regulation, district offi ces are responsible for the implementation of education policies at pre-school, basic education and recurrent education level. This means implementation of all policies regarding logistics, such as distribution of school materials and school feeding, all data collection and support for and maintenance of infrastructure and equipment. The fi ve regional offi ces are focused on vocational and general secondary schools. According to offi ce directors, regional offi ces inspect each school on average around 12 times per year. Additionally, schools can expect an average of 5 inspection visits from district offi ces per year, varying widely by district. According to offi ce directors, district inspectors check student and teacher attendance, condition of school facilities, evaluate teacher and director eff ectiveness and check school accounting during their inspection visits. They provide a written report for each of their visits. The most common request made by schools to district inspectors is to provide more teachers to the school.
Parents appear relatively active with Parent Teacher Associations (PTA) in place in almost all schools
and performance information provided to them according to school directors. 97.8 percent of primary school directors state that student assessments are used to report student achievement to parents. 95.7 percent of schools report on the child’s performance relative to other students, 73.3 percent report on the child’s performance relative to the national or district standard and 66.2 percent of schools report on the school’s overall academic performance relative to other schools. 57.0 percent of directors report that there is a high and constant pressure exerted by parents to achieve higher academic performance. 31.7 percent of directors state that there is some pressure on the side of parents and only 11.3 percent of schools report little or no pressure from parents to improve performance. Parent Teacher Associations were introduced by law and exist in 90.2 percent of all primary schools. 96.6 percent of those schools that have a PTA state that it has been active in the current school year. 57.9 percent of directors from schools with active PTAs state that the PTA has a large infl uence, 31.4 percent state that it has some infl uence and 10.7 percent state that it does not aff ect the way the school is run.
Teachers receive feedback on their teaching, however there are no incentives, monetary or otherwise,
associated with good performance. In the school year 2012, 76.1 percent of teachers received comments about their teaching from the director, 50.3 percent from a senior teacher or peer, 58.3 percent from a PTA and 45.2 percent from the district education offi ce. 22.4 percent of those that receive feedback from their director receive it yearly, 30.2 percent received it every semester, 14.2 percent quarterly, and 33.2 monthly or more. 61.2 percent of teachers received an oral evaluation of performance from the director in this school year, 84.8 percent received a written evaluation assessment. It is interesting to note that voluntary teachers are less likely to receive an oral or written evaluation assessment. Only 47.5 percent of voluntary primary school teachers received an evaluation compared to 65.5 percent of other teachers, similarly only 56.0 percent received a written performance evaluation compared to 93.7 percent of others. Only 5.2 percent of teachers stated that teachers who perform receive any kind of incentive, cash, in-kind, awards or other, in this school-year.
27Chapter 2Management Issues
Director Profi le
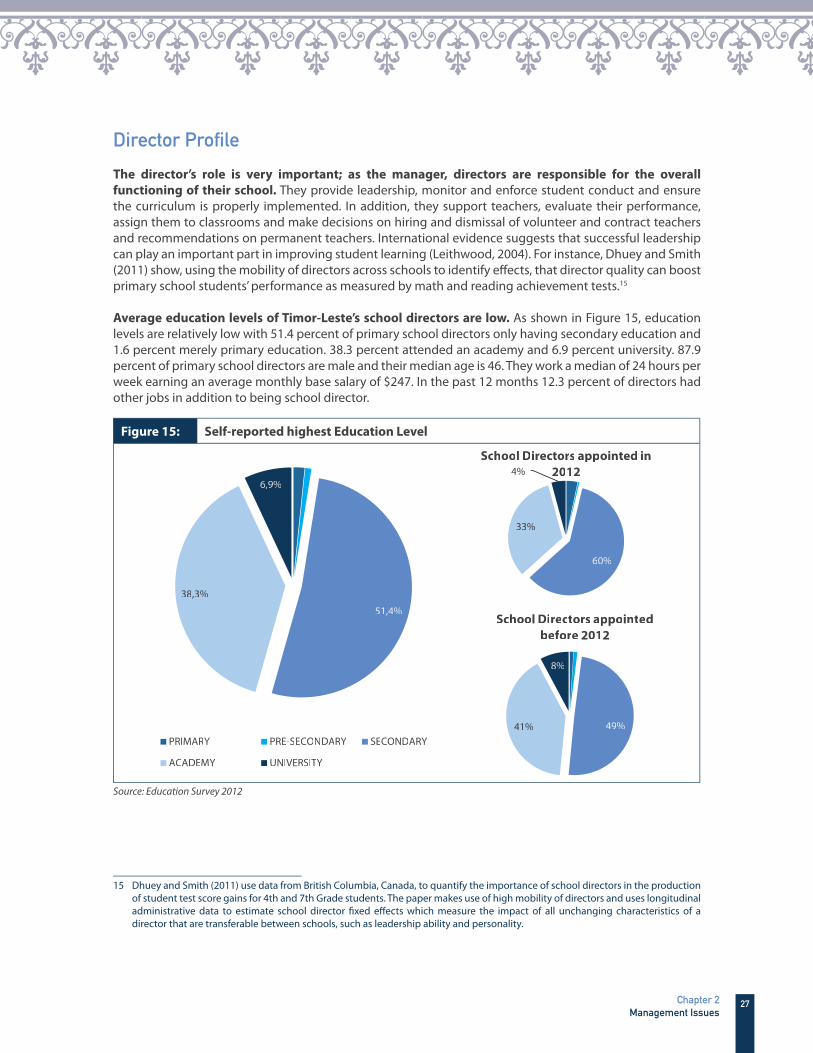
The director’s role is very important; as the manager, directors are responsible for the overall
functioning of their school. They provide leadership, monitor and enforce student conduct and ensure the curriculum is properly implemented. In addition, they support teachers, evaluate their performance, assign them to classrooms and make decisions on hiring and dismissal of volunteer and contract teachers and recommendations on permanent teachers. International evidence suggests that successful leadership can play an important part in improving student learning (Leithwood, 2004). For instance, Dhuey and Smith (2011) show, using the mobility of directors across schools to identify eff ects, that director quality can boost primary school students’ performance as measured by math and reading achievement tests.15
Average education levels of Timor-Leste’s school directors are low. As shown in Figure 15, education levels are relatively low with 51.4 percent of primary school directors only having secondary education and 1.6 percent merely primary education. 38.3 percent attended an academy and 6.9 percent university. 87.9 percent of primary school directors are male and their median age is 46. They work a median of 24 hours per week earning an average monthly base salary of $247. In the past 12 months 12.3 percent of directors had other jobs in addition to being school director.
Figure 15: Self-reported highest Education Level
51,4%
38,3%
6,9%
PRIMARY PRE-SECONDARY SECONDARY
ACADEMY UNIVERSITY
60%
33%
4%School Directors appointed in
2012
49%41%
8%
School Directors appointed
before 2012
Source: Education Survey 2012
15 Dhuey and Smith (2011) use data from British Columbia, Canada, to quantify the importance of school directors in the production of student test score gains for 4th and 7th Grade students. The paper makes use of high mobility of directors and uses longitudinal administrative data to estimate school director fi xed eff ects which measure the impact of all unchanging characteristics of a director that are transferable between schools, such as leadership ability and personality.

28 Building Evidence, Shaping PolicyFindings of the 2012 Timor-Leste Education Survey
Many primary school directors are inexperienced in their role as director. On average directors have been at their current school for 11 years, 3 years of which as the director. However, many directors, in particular of fi lial schools, are very newly appointed. Indeed, for 23.7 percent of all primary school directors 2012 was the fi rst year on the job. In Aileu, Bobonaro and Covalima districts more than one third of directors were in their fi rst year as a director in 2012. These newly appointed directors tend to have lower education levels on average than directors that have been on the job for at least since 2011 (see Figure 15).
Table 3 provides an overview of activities performed by primary school directors. Many substitute absent teachers several times a week or at least once every week, on the other hand almost 30 percent never do. More than half of directors also help individual students with learning diffi culties at least once per month. As expected, directors perform management activities such as observing teachers during instruction, recording their attendance, holding coordination meetings and managing administrative tasks. However, only 48.9 percent of directors have attended any type of management training in the past 6 years. Out of those directors that were newly appointed in 2012 and are new to the role of director, only 27.9 percent received any type of management training in line with their new duties.
Table 3: S elf-reported activities of Primary School Director
Several
times a
week
Once
every
week
Once
every
month
Once
every
semester
Once in a
year
Never
Observe teachers in classroom 42.7% 27.8% 7.5% 5.8% 4.4% 11.8%
Record teachers’ attendance 35.4% 18.3% 16.7% 10.6% 6.7% 12.1%
Discuss with teachers how to improve their teaching
4.5% 15.7% 29.5% 32.2% 4.8% 13.2%
Help individual students with learning diffi culties
28.9% 19.4% 14.2% 14.3% 9.3% 13.9%
Meet parents discussing school and student issues
1.4% 1.2% 8.6% 65.8% 13.1% 9.9%
Contact District Education Offi ce to seek help
1.9% 3.3% 20.3% 19.0% 18.6% 36.8%
Substitute absent teachers 28.2% 22.8% 14.2% 3.1% 3.1% 28.7%
Manage administrative tasks 25.6% 8.0% 19.4% 18.7% 9.5% 18.6%
Hold coordination meetings with teachers
3.3% 8.2% 32.7% 34.5% 7.2% 14.0%
Source: Education Survey 2012
29Chapter 2Management Issues

30 Building Evidence, Shaping PolicyFindings of the 2012 Timor-Leste Education Survey
Primary schools almost universally report to be providing school feeding and to be receiving food for
this purpose in line with policy. 95.2 percent of directors state that their schools provide school feeding and 96.5 percent report that they have received food such as rice from the MoE or other sources in the 2012 school year. Interestingly this does not appear to diff er signifi cantly with the remoteness of the school. 90.1 percent of schools state that they prepare food, despite the fact that only 68.6 percent of primary schools have kitchens. Private schools are less likely to provide school feeding, although a much higher proportion is equipped with a kitchen, and fewer receive food from the MoE or other sources, 86.4 percent compared to 97.8 for public schools.
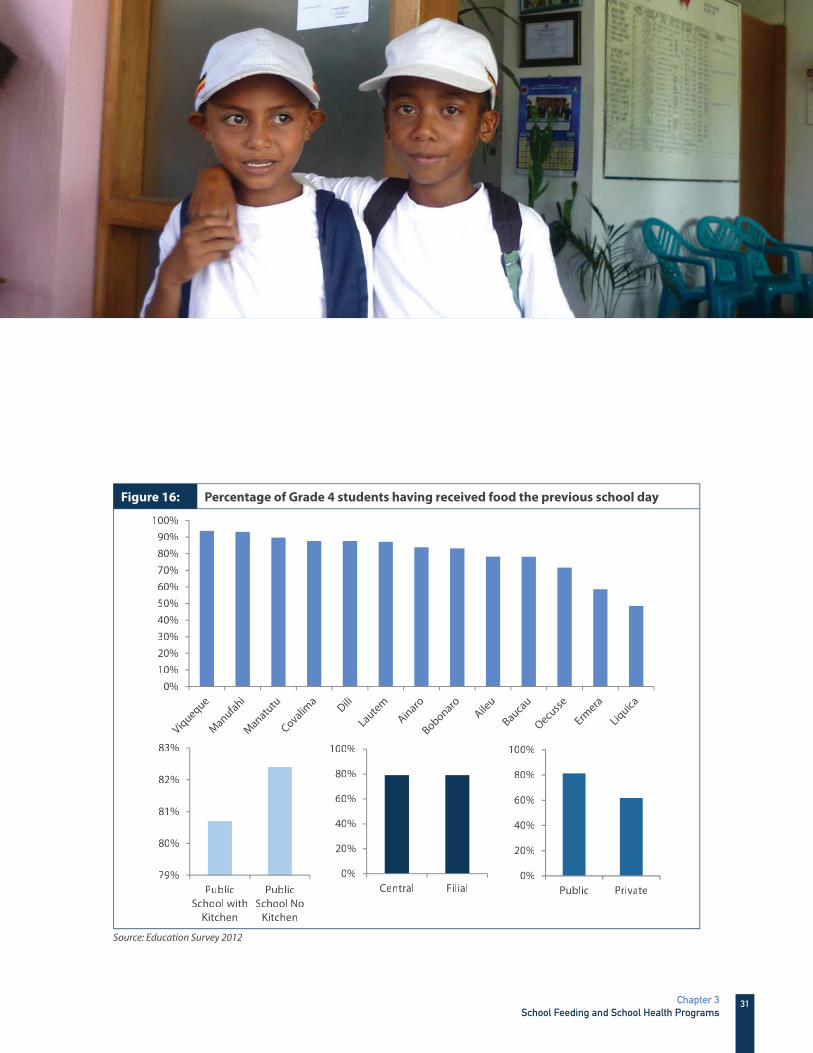
Despite such reports, 21 percent of primary school students did not receive food on the previous
school day. When interviewed only 79.1 percent of Grade 4 students report to have received school feeding on the day prior to the survey interview. This proportion is lower for private schools of which also a lower proportion reported to have a school feeding program and for which a lower proportion received food from the MoE. The proportion of students having received school feeding doesn’t appear to diff er between central and fi lial schools. Interestingly, it appears that in public schools that do not have a kitchen, a similar share of students received school feeding as in those schools that are equipped with a kitchen. This is possible due to community and parent support. As is shown in Figure 16 the percentage of students receiving school feeding varies by districts with some having surprisingly low levels. In Liquica, for example, only 48.6 percent of students report having received school feeding. This does not appear to be driven by the fact that schools do not receive food inputs, in Liquica 96.5 percent of primary schools do report having received food from the MoE or other sources.
A majority of primary schools report to be promoting good health practices. 86.3 percent of directors state that their school regularly promotes health practices such as washing hands before eating, brushing teeth and other practices. 43.1 percent of schools state that they provided students with deworming treatments during the 2012 school year.16
16 In addition to this school-level deworming reported by directors, UNICEF has been undertaking deworming interventions at community level.
Chapter 3School Feeding and School Health Programs
31Chapter 3School Feeding and School Health Programs
Figure 16: Pe rcentage of Grade 4 students having received food the previous school day
0%10%20%30%40%50%60%70%80%90%
100%
0%
20%
40%
60%
80%
100%
Public Private0%
20%
40%
60%
80%
100%
Central Filial79%
80%
81%
82%
83%
PublicSchool with
Kitchen
PublicSchool No
Kitchen
Source: Education Survey 2012
32 Building Evidence, Shaping PolicyFindings of the 2012 Timor-Leste Education Survey
Teacher Profi le
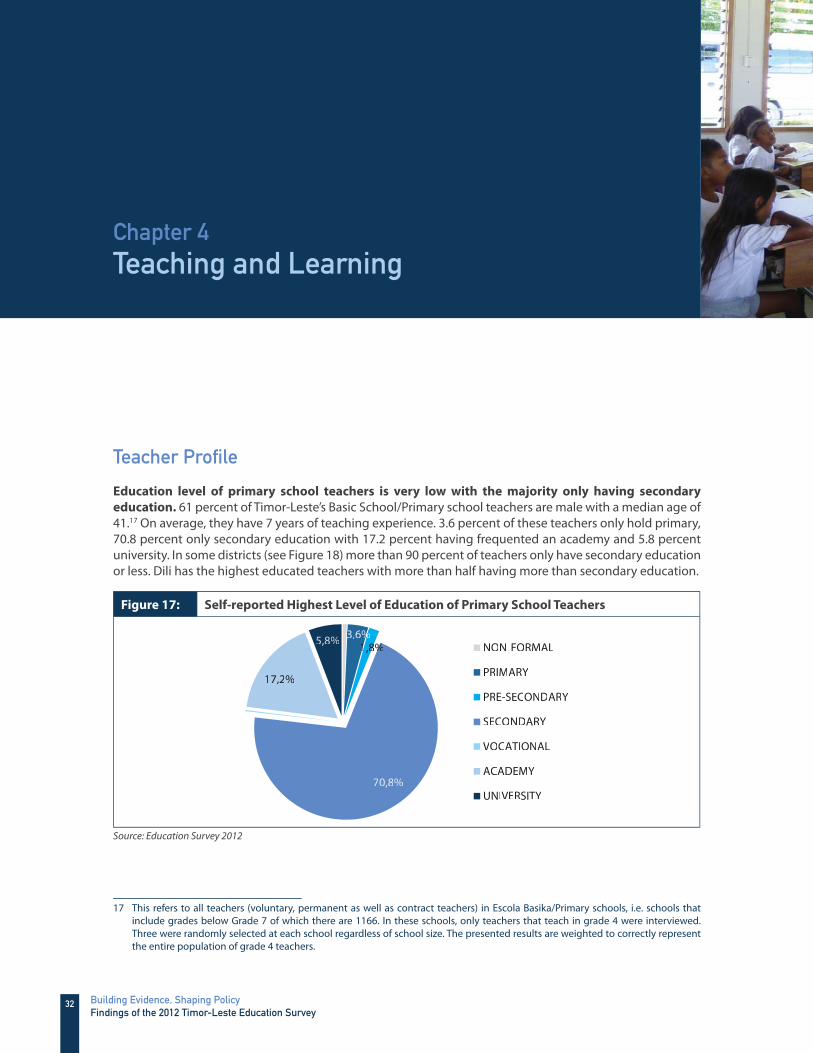
Education level of primary school teachers is very low with the majority only having secondary
education. 61 percent of Timor-Leste’s Basic School/Primary school teachers are male with a median age of 41.17 On average, they have 7 years of teaching experience. 3.6 percent of these teachers only hold primary, 70.8 percent only secondary education with 17.2 percent having frequented an academy and 5.8 percent university. In some districts (see Figure 18) more than 90 percent of teachers only have secondary education or less. Dili has the highest educated teachers with more than half having more than secondary education.
Figure 17: Self-reported Highest Level of Education of Primary School Teachers
33,6%%%111,88%%
70,8%
17,2%
5,8% NON-FORMAL
PRIMARY
PRE-SECONDARY
SECONDARY
VOCATIONAL
ACADEMY
UNIVERSITY
Source: Education Survey 2012
17 This refers to all teachers (voluntary, permanent as well as contract teachers) in Escola Basika/Primary schools, i.e. schools that include grades below Grade 7 of which there are 1166. In these schools, only teachers that teach in grade 4 were interviewed. Three were randomly selected at each school regardless of school size. The presented results are weighted to correctly represent the entire population of grade 4 teachers.
Chapter 4Teaching and Learning

33Chapter 4Teaching and Learning
Figure 18: Per centage of Primary School Teachers with Secondary Education or less by
District
Source: Education Survey 2012
Median monthly income of teachers is $23818, with teachers spending on average 24 hours per week
teaching and 2 hours performing other duties at the school.19 20 64.6 percent are paid though direct
18 This compares to an average wage of all paid employees of $174 (Labor Force Survey, 2010).
19 These self-reported working hours diff er from the law which states that teachers should be working 40h/week; 24h/week on teaching and the rest (16 h/week) should be devoted to other non-classroom activities. It appears that much less time is invested in non-teaching activities than expected by regulation.
20 Average weekly hours worked by teachers are the same in primary schools that run multiple shifts and those that do not. This seems to suggest that schools which run a second shift in the afternoon have more teachers, and might be forced to run multiple shifts more due to classroom than teacher constraints.
34 Building Evidence, Shaping PolicyFindings of the 2012 Timor-Leste Education Survey
deposit in the bank from the treasury, 7.8 percent are paid directly by the school and 10.7 percent by the district offi ce. The median travel time to collect salary is one hour and a half with 10 percent of teachers traveling for 5 hours or more. This is high and likely to impact teacher attendance at least once per month.
15.1 percent of school teachers had a second job in the past 12 months. 79.9 percent of teachers with a second job were unpaid laborers working for the family. 8.7 percent were teaching for a second school. When holding a second job, the median amount of hours spent on the second job per week were 12 hours. Median earnings from other jobs, of those teachers with another job, in the past 12 month was $70.
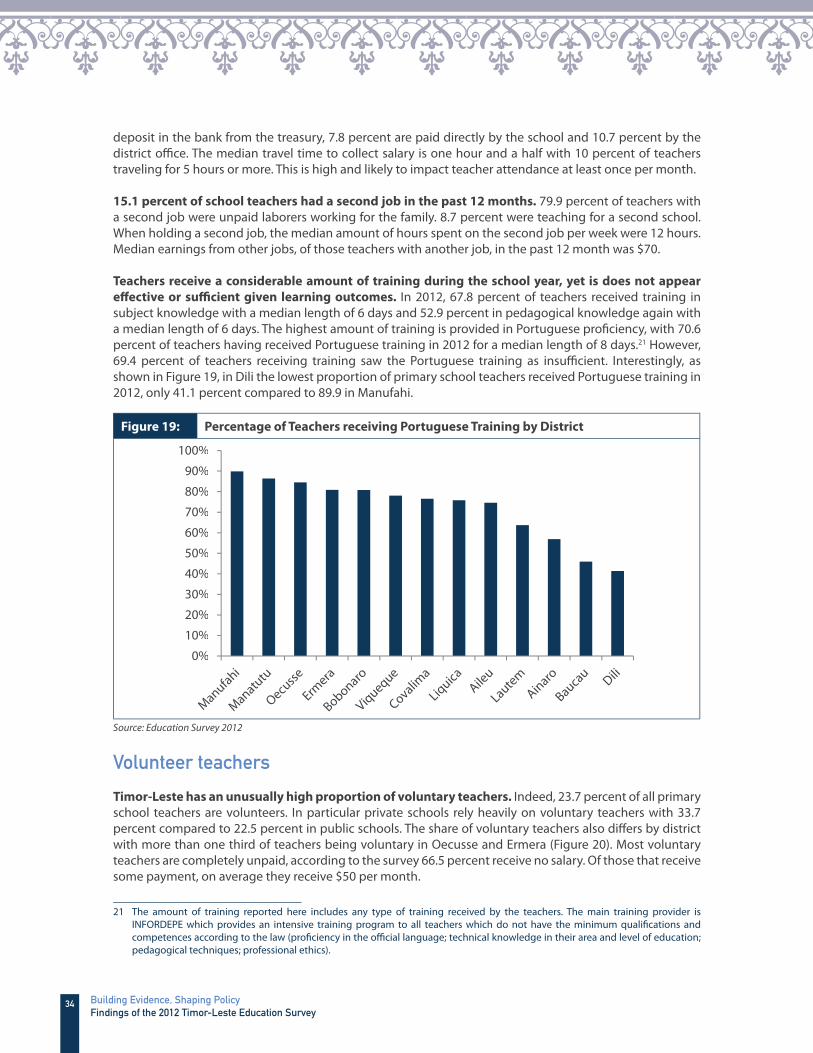
Teachers receive a considerable amount of training during the school year, yet is does not appear
eff ective or suffi cient given learning outcomes. In 2012, 67.8 percent of teachers received training in subject knowledge with a median length of 6 days and 52.9 percent in pedagogical knowledge again with a median length of 6 days. The highest amount of training is provided in Portuguese profi ciency, with 70.6 percent of teachers having received Portuguese training in 2012 for a median length of 8 days.21 However, 69.4 percent of teachers receiving training saw the Portuguese training as insuffi cient. Interestingly, as shown in Figure 19, in Dili the lowest proportion of primary school teachers received Portuguese training in 2012, only 41.1 percent compared to 89.9 in Manufahi.
Figure 19: Per centage of Teachers receiving Portuguese Training by District
0%
10%
20%
30%
40%
50%
60%
70%
80%
90%
100%
Source: Education Survey 2012
Volunteer teachers
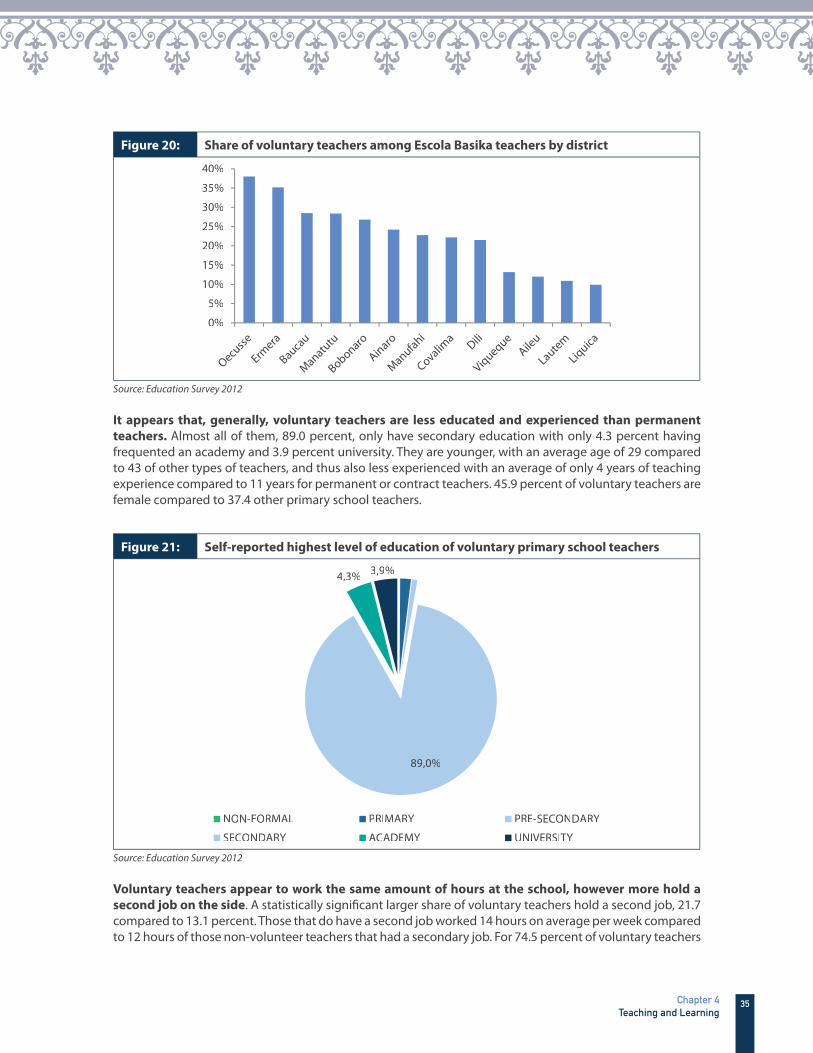
Timor-Leste has an unusually high proportion of voluntary teachers. Indeed, 23.7 percent of all primary school teachers are volunteers. In particular private schools rely heavily on voluntary teachers with 33.7 percent compared to 22.5 percent in public schools. The share of voluntary teachers also diff ers by district with more than one third of teachers being voluntary in Oecusse and Ermera (Figure 20). Most voluntary teachers are completely unpaid, according to the survey 66.5 percent receive no salary. Of those that receive some payment, on average they receive $50 per month.
21 The amount of training reported here includes any type of training received by the teachers. The main training provider is INFORDEPE which provides an intensive training program to all teachers which do not have the minimum qualifi cations and competences according to the law (profi ciency in the offi cial language; technical knowledge in their area and level of education; pedagogical techniques; professional ethics).
35Chapter 4Teaching and Learning
Figure 20: Sha re of voluntary teachers among Escola Basika teachers by district
0%
5%
10%
15%
20%
25%
30%
35%
40%
Source: Education Survey 2012
It appears that, generally, voluntary teachers are less educated and experienced than permanent
teachers. Almost all of them, 89.0 percent, only have secondary education with only 4.3 percent having frequented an academy and 3.9 percent university. They are younger, with an average age of 29 compared to 43 of other types of teachers, and thus also less experienced with an average of only 4 years of teaching experience compared to 11 years for permanent or contract teachers. 45.9 percent of voluntary teachers are female compared to 37.4 other primary school teachers.
Figure 21: Self-reported highest level of education of voluntary primary school teachers
89,0%
4,3% 3,9%
NON-FORMAL PRIMARY PRE-SECONDARY
SECONDARY ACADEMY UNIVERSITY
Source: Education Survey 2012
Voluntary teachers appear to work the same amount of hours at the school, however more hold a
second job on the side. A statistically signifi cant larger share of voluntary teachers hold a second job, 21.7 compared to 13.1 percent. Those that do have a second job worked 14 hours on average per week compared to 12 hours of those non-volunteer teachers that had a secondary job. For 74.5 percent of voluntary teachers

36 Building Evidence, Shaping PolicyFindings of the 2012 Timor-Leste Education Survey
with a second job, this is also unpaid work for the family. 7.6 percent also teach in other schools and 18.0 percent have non-teaching jobs. Median earnings from other jobs in the past 12 months was $100.
Voluntary teachers received a similar amount of training to other types of teachers. In the school year 2012, 60.4 percent of voluntary teachers received training on subject knowledge, 42.1 percent on pedagogical knowledge and 69.1 percent on Portuguese language which is overall slightly less than for other types of teachers.22
Discussion with the MoE shows that these volunteer teachers are ‘pipeline’ permanent teachers.
There is a plan to convert a large percentage of current volunteer teachers into permanent positions as has been done in the past. Thus, the incentive to work without salary is to eventually receive a secure, well-paid civil servant job. There are no clear guidelines in how school directors select voluntary teachers, however, if these are converted into permanent positions quality control and training needs to be put in place.
Class Size
Average class size in Grade 1 is 37, however the distribution is uneven. 25.9 percent of schools have 50 or more students per Grade 1 class, 5.5 percent of schools 80 students or more. These average Grade 1 class sizes vary from 51 in Ermera to 26 in Manufahi (Figure 22). For example, Dili has relatively large class sizes with 36.1 percent of schools having at least 50 students per class. Class sizes are largest for earliest grades with the average class size dropping from 37 in Grade 1 to 25 in Grade 6 (see Figure 23). This is related to high repetition rates in early Grades and drop-out rates at higher grades. Note that Figure 23 shows theoretical class sizes if all students appear to school. As discussed in the section on student absenteeism, absenteeism rates are highest for early grades and thus in practice class sizes of those students actually appearing to class might be similar in Grade 1 and Grade 6. These average class sizes compare to an OECD average of 21.4 across primary education (OECD, 2011).
Figure 22: Med ian Grade 1 class size by district and type of school
0
10
20
30
40
50
60
0
10
20
30
40
50
Central School Filial School
0
10
20
30
40
Public School Private School
Source: Education Survey 2012
22 Most volunteer teachers were identifi ed by the MoE last year, although since then more volunteer teachers have started. The identifi ed volunteer teachers are equally required to take the intensive training provided by INFORDEPE if they do not have the specifi ed minimum qualifi cations and competencies.

37Chapter 4Teaching and Learning
Figure 23: Med ian class size by grade
0
5
10
15
20
25
30
35
40
Grade 1 Grade 2 Grade 3 Grade 4 Grade 5 Grade 6
Source: Education Survey 2012
School Size
On average, primary schools have a total of 177 students. This varies between central and fi lial schools, with central schools having an average of 304 students compared to 157. The largest schools are located in Dili where primary schools have a median of 453 students.
Student Evaluation
Most teachers evaluate students more than once per month. Timor-Leste has national examinations at grade 9 and 12 which are predominantly used for selection into university. Assessments at lower level and classroom assessments are dependent on district and individual school’s policy. There appears to be limited guidance on the use of assessments at all levels including during teacher and school director training (World Bank, 2013). The Education Survey collected information on the actual student evaluation practice at school level. According to Grade 4 teachers, 22.8 percent evaluate students more than every week, 30.3 percent once every week or multiple times per month, 14.3 percent once every month or less and 32.7 percent once every semester or less. 78.9 percent of schools give homework every week. According to teachers, student evaluations are used to identify problems and improve the content of classes, identify students in need of assistance and report progress to parents.
Textbooks
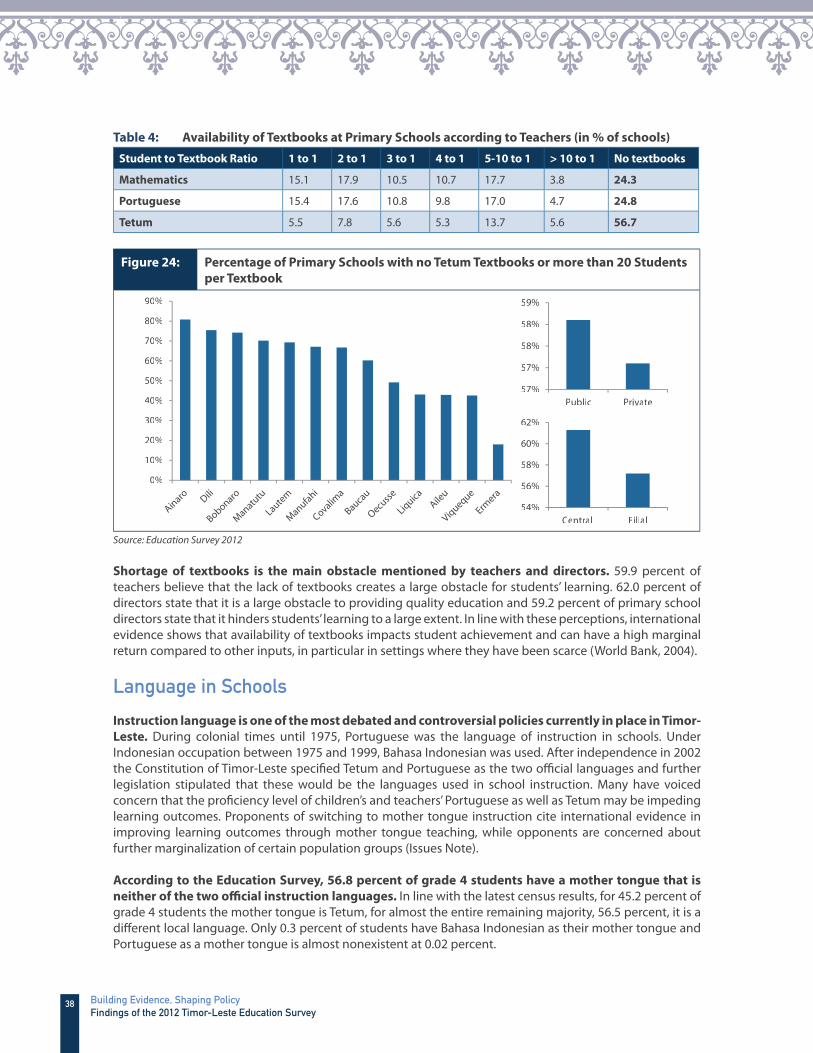
Availability of textbooks, in particular of Tetum books, is still very low. In 32.2 percent of primary schools more than three students share one mathematics textbook, 24.3 percent have no book at all. This is similar for Portuguese textbooks. The availability of Tetum textbooks is particularly restricted with 56.7 percent of schools having no books at all. Figure 24 shows the percentage of primary schools with no Tetum textbooks or more than 20 students per textbook. Interestingly, Dili has comparatively poorer conditions with 75.4 percent of primary schools having no textbooks.
38 Building Evidence, Shaping PolicyFindings of the 2012 Timor-Leste Education Survey
Table 4: Availability of Textbooks at Primary Schools according to Teachers (in % of schools)
Student to Textbook Ratio 1 to 1 2 to 1 3 to 1 4 to 1 5-10 to 1 > 10 to 1 No textbooks
Mathematics 15.1 17.9 10.5 10.7 17.7 3.8 24.3
Portuguese 15.4 17.6 10.8 9.8 17.0 4.7 24.8
Tetum 5.5 7.8 5.6 5.3 13.7 5.6 56.7
Figure 24: Percentag e of Primary Schools with no Tetum Textbooks or more than 20 Students
per Textbook
0%
10%
20%
30%
40%
50%
60%
70%
80%
90%
57%
57%
58%
58%
59%
Public Private
54%
56%
58%
60%
62%
Central Filial
Source: Education Survey 2012
Shortage of textbooks is the main obstacle mentioned by teachers and directors. 59.9 percent of teachers believe that the lack of textbooks creates a large obstacle for students’ learning. 62.0 percent of directors state that it is a large obstacle to providing quality education and 59.2 percent of primary school directors state that it hinders students’ learning to a large extent. In line with these perceptions, international evidence shows that availability of textbooks impacts student achievement and can have a high marginal return compared to other inputs, in particular in settings where they have been scarce (World Bank, 2004).
Language in Schools
Instruction language is one of the most debated and controversial policies currently in place in Timor-
Leste. During colonial times until 1975, Portuguese was the language of instruction in schools. Under Indonesian occupation between 1975 and 1999, Bahasa Indonesian was used. After independence in 2002 the Constitution of Timor-Leste specifi ed Tetum and Portuguese as the two offi cial languages and further legislation stipulated that these would be the languages used in school instruction. Many have voiced concern that the profi ciency level of children’s and teachers’ Portuguese as well as Tetum may be impeding learning outcomes. Proponents of switching to mother tongue instruction cite international evidence in improving learning outcomes through mother tongue teaching, while opponents are concerned about further marginalization of certain population groups (Issues Note).
According to the Education Survey, 56.8 percent of grade 4 students have a mother tongue that is
neither of the two offi cial instruction languages. In line with the latest census results, for 45.2 percent of grade 4 students the mother tongue is Tetum, for almost the entire remaining majority, 56.5 percent, it is a diff erent local language. Only 0.3 percent of students have Bahasa Indonesian as their mother tongue and Portuguese as a mother tongue is almost nonexistent at 0.02 percent.

39Chapter 4Teaching and Learning
Figure 25: Mother Ton gue of Grade 4 Students by District
0%
20%
40%
60%
80%
100%
120%
Other Local Language Tetum
Source: Education Survey 2012
A high proportion of teachers make use of local languages other than Tetum in classrooms. 97 percent of primary school teachers state that they use Tetum, 95 percent Portuguese for instruction purpose. Teachers might be overstating their use of Portuguese or Tetum in instruction in order to appear to comply with national policy. However, strikingly 45.6 percent of primary school teachers report that they also use other local languages in instruction. This means that while fi erce debates have been taking place on a national level on whether Timor-Leste should switch to some form of mother tongue teaching, eff ectively some form of mother tongue teaching has been taking place in a majority of schools. In secondary schools the use of Bahasa Indonesian is still very common with 31.5 percent of teachers also using Bahasa Indonesian in instruction.
Figure 26: Percentage of Teachers using language in instruction
45,6%
21,5%
0%
20%
40%
60%
80%
100%
120%
Tetum Portuguese Other LocalLanguage
BahasaIndonesian
English
Primary school/Escola Basika Secondary School
Per c
ent a
geof
Teac
hers
mak
ing
use
ofth
ela
ngua
gein
inst
ruc
on(s
elf-
repo
rted
)
Note: For Primary schools/Escola Basikas, teachers from Grade 4 were interviewed. For Secondary schools, a random selection of teachers teaching Grade 11 was interviewed. Source: Education Survey 2012

40 Building Evidence, Shaping PolicyFindings of the 2012 Timor-Leste Education Survey
In some districts the use of local languages in instruction is strikingly high. In Oecusse almost 98 percent of teachers teaching Grade 4 state that they use local languages in instruction. In Baucau it is 90.5 percent and in Lautem 77.9 percent. Filial schools which tend to be more remotely located make stronger use of local languages as well as private schools (Figure 27). In general, a higher proportion of those teachers with low education levels appear to make use of local languages. Further, those teachers which teach Grade 1 and 2 as opposed to only higher Grades are more likely to use local languages indicating that local language instruction might be more prevalent during the fi rst years at school.
Figure 27: Percentage of Primary School Teachers using other local languages in instruction
0%
20%
40%
60%
80%
100%
120%
0%
20%
40%
60%
80%
Filial Central0%
10%
20%
30%
40%
50%
60%
Private Public
0%
10%
20%
30%
40%
50%
Teachers withSecondary
Education or less
Teachers withhigher thanSecondaryEducation
0%
10%
20%
30%
40%
50%
60%
Teachers teachingGrade 1 and 2
Teachers onlyteaching Grades
higher than 1 and 2
Source: Education Survey 2012
Even after four years of instruction in Portuguese, students’ self-reported understanding of the
language is extremely poor. 30.3 percent of Grade 4 students towards the end of the school year state that they do not understand Portuguese at all, an additional 47.9 percent state that they understand and
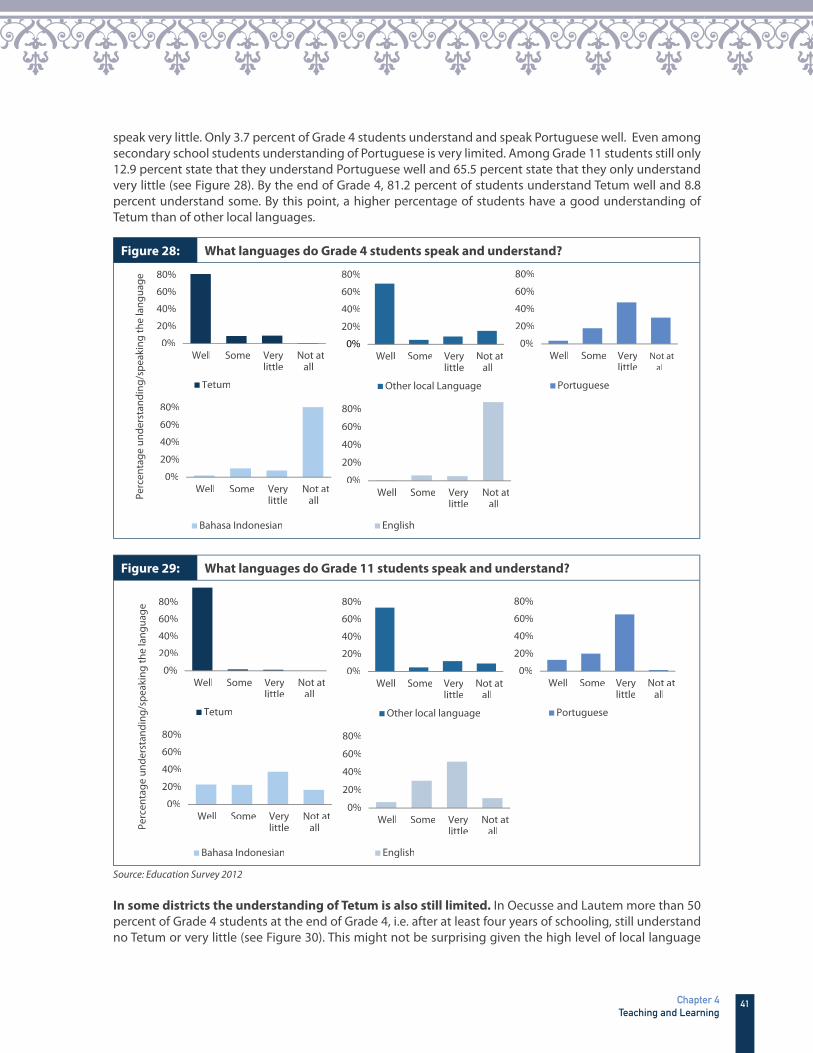
41Chapter 4Teaching and Learning
speak very little. Only 3.7 percent of Grade 4 students understand and speak Portuguese well. Even among secondary school students understanding of Portuguese is very limited. Among Grade 11 students still only 12.9 percent state that they understand Portuguese well and 65.5 percent state that they only understand very little (see Figure 28). By the end of Grade 4, 81.2 percent of students understand Tetum well and 8.8 percent understand some. By this point, a higher percentage of students have a good understanding of Tetum than of other local languages.
Figure 28: What langu ages do Grade 4 students speak and understand?
0%
20%
40%
60%
80%
Well Some Verylittle
Not atall
Bahasa Indonesian
0%
20%
40%
60%
80%
Well Some Verylittle
Not atall
Tetum
0%
20%
40%
60%
80%
Well Some Verylittle
Not atall
English
0%
20%
40%
60%
80%
Well Some Verylittle
Not atall
Other local Language
0%
20%
40%
60%
80%
Well Some Verylittle
Not atall
Portuguese
Perc
enta
ge u
nder
stan
ding
/spe
akin
g th
e la
ngua
ge
Figure 29: What languages do Grade 11 students speak and understand?
0%
20%
40%
60%
80%
Well Some Verylittle
Not atall
Bahasa Indonesian
0%
20%
40%
60%
80%
Well Some Verylittle
Not atall
Tetum
0%
20%
40%
60%
80%
Well Some Verylittle
Not atall
English
0%
20%
40%
60%
80%
Well Some Verylittle
Not atall
Other local language
0%
20%
40%
60%
80%
Well Some Verylittle
Not atall
Portuguese
Perc
enta
ge u
nder
stan
ding
/spe
akin
g th
e la
ngua
ge
Source: Education Survey 2012
In some districts the understanding of Tetum is also still limited. In Oecusse and Lautem more than 50 percent of Grade 4 students at the end of Grade 4, i.e. after at least four years of schooling, still understand no Tetum or very little (see Figure 30). This might not be surprising given the high level of local language
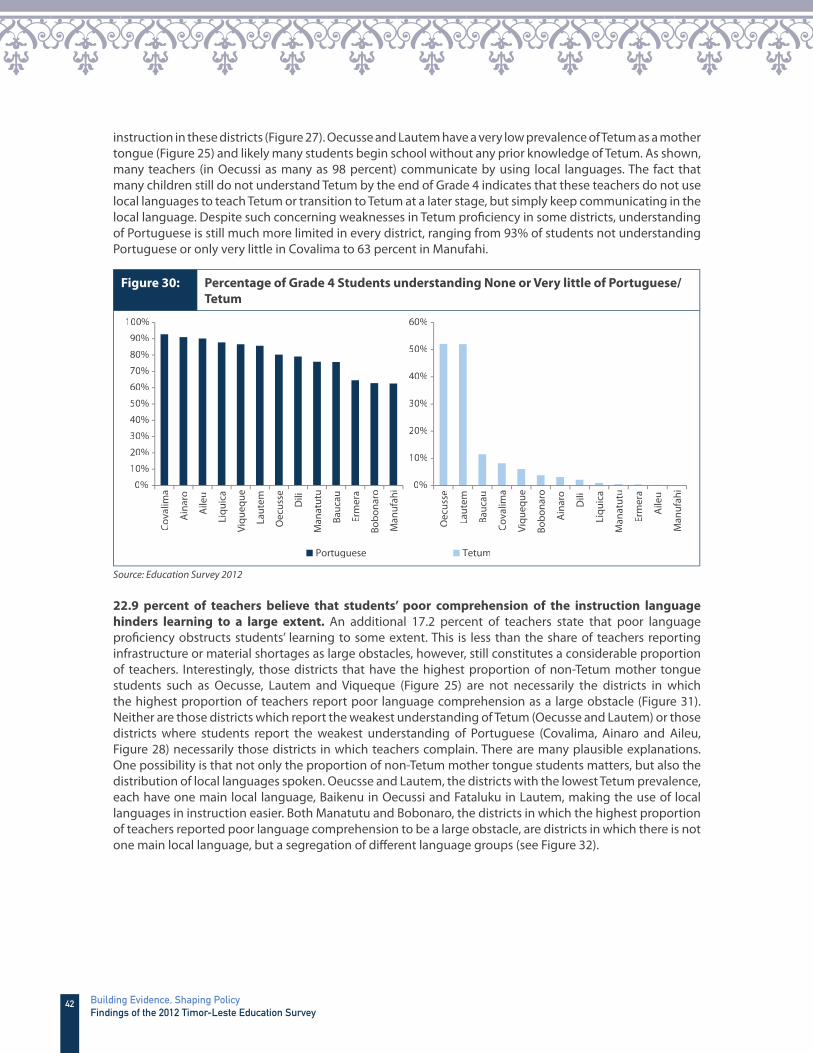
42 Building Evidence, Shaping PolicyFindings of the 2012 Timor-Leste Education Survey
instruction in these districts (Figure 27). Oecusse and Lautem have a very low prevalence of Tetum as a mother tongue (Figure 25) and likely many students begin school without any prior knowledge of Tetum. As shown, many teachers (in Oecussi as many as 98 percent) communicate by using local languages. The fact that many children still do not understand Tetum by the end of Grade 4 indicates that these teachers do not use local languages to teach Tetum or transition to Tetum at a later stage, but simply keep communicating in the local language. Despite such concerning weaknesses in Tetum profi ciency in some districts, understanding of Portuguese is still much more limited in every district, ranging from 93% of students not understanding Portuguese or only very little in Covalima to 63 percent in Manufahi.
Figure 30: Percentage of Grade 4 Students understanding None or Very little of Portuguese/
Tetum
0%
10%
20%
30%
40%
50%
60%
70%
80%
90%
100%
Cova
lima
Ain
aro
Aile
u
Liqu
ica
Viqu
eque
Laut
em
Oec
usse
Dili
Man
atut
u
Bauc
au
Erm
era
Bobo
naro
Man
ufah
i 0%
10%
20%
30%
40%
50%
60%
Oec
usse
Laut
em
Bauc
au
Cova
lima
Viqu
eque
Bobo
naro
Ain
aro
Dili
Liqu
ica
Man
atut
u
Erm
era
Aile
u
Man
ufah
i
Portuguese Tetum
Source: Education Survey 2012
22.9 percent of teachers believe that students’ poor comprehension of the instruction language
hinders learning to a large extent. An additional 17.2 percent of teachers state that poor language profi ciency obstructs students’ learning to some extent. This is less than the share of teachers reporting infrastructure or material shortages as large obstacles, however, still constitutes a considerable proportion of teachers. Interestingly, those districts that have the highest proportion of non-Tetum mother tongue students such as Oecusse, Lautem and Viqueque (Figure 25) are not necessarily the districts in which the highest proportion of teachers report poor language comprehension as a large obstacle (Figure 31). Neither are those districts which report the weakest understanding of Tetum (Oecusse and Lautem) or those districts where students report the weakest understanding of Portuguese (Covalima, Ainaro and Aileu, Figure 28) necessarily those districts in which teachers complain. There are many plausible explanations. One possibility is that not only the proportion of non-Tetum mother tongue students matters, but also the distribution of local languages spoken. Oeucsse and Lautem, the districts with the lowest Tetum prevalence, each have one main local language, Baikenu in Oecussi and Fataluku in Lautem, making the use of local languages in instruction easier. Both Manatutu and Bobonaro, the districts in which the highest proportion of teachers reported poor language comprehension to be a large obstacle, are districts in which there is not one main local language, but a segregation of diff erent language groups (see Figure 32).
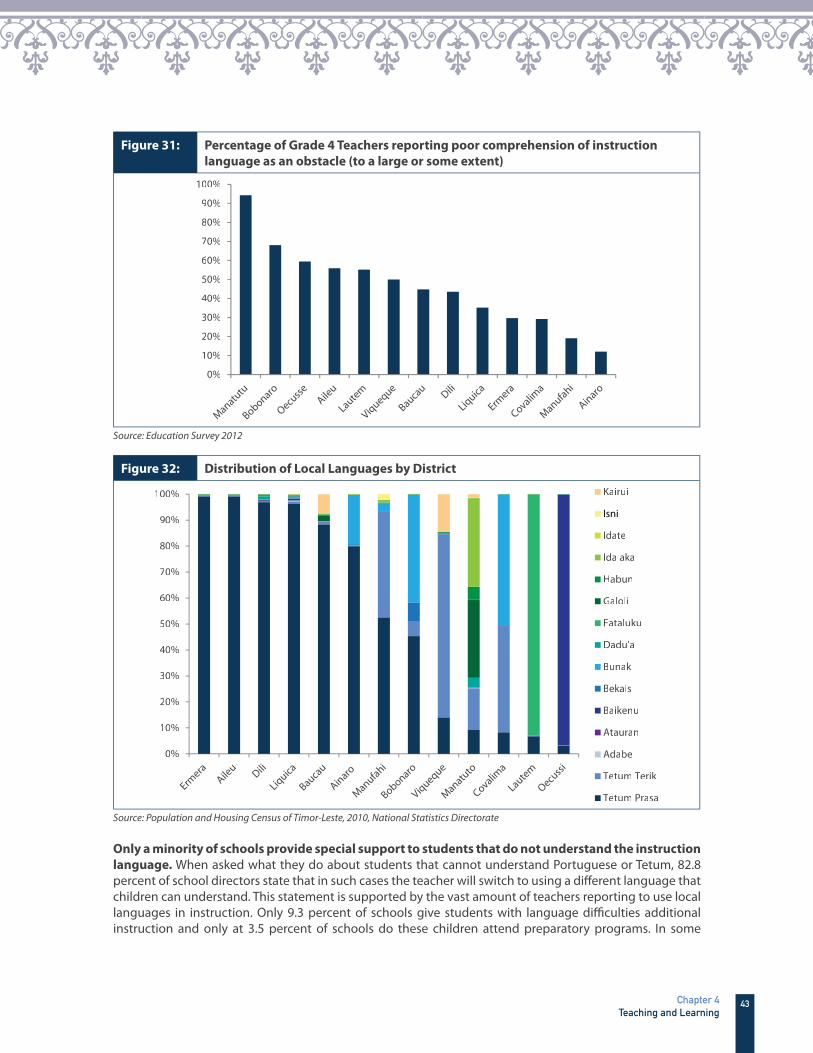
43Chapter 4Teaching and Learning
Figure 31: Percentage of Grade 4 Teachers reporting poor comprehension of instruction
language as an obstacle (to a large or some extent)
0%
10%
20%
30%
40%
50%
60%
70%
80%
90%
100%
Source: Education Survey 2012
Figure 32: Distributi on of Local Languages by District
0%
10%
20%
30%
40%
50%
60%
70%
80%
90%
100% Kairui
Isni
Idate
Idalaka
Habun
Galoli
Fataluku
Dadu'a
Bunak
Bekais
Baikenu
Atauran
Adabe
Tetum Terik
Tetum Prasa
Source: Population and Housing Census of Timor-Leste, 2010, Nati onal Statistics Directorate
Only a minority of schools provide special support to students that do not understand the instruction
language. When asked what they do about students that cannot understand Portuguese or Tetum, 82.8 percent of school directors state that in such cases the teacher will switch to using a diff erent language that children can understand. This statement is supported by the vast amount of teachers reporting to use local languages in instruction. Only 9.3 percent of schools give students with language diffi culties additional instruction and only at 3.5 percent of schools do these children attend preparatory programs. In some
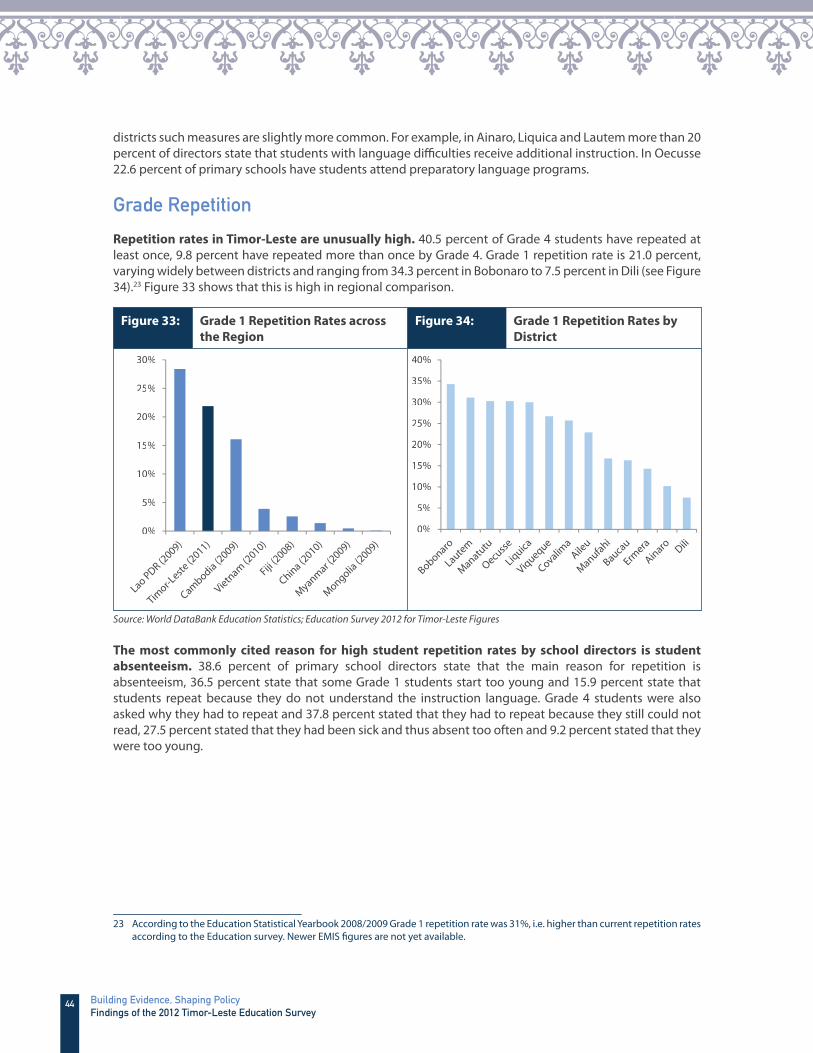
44 Building Evidence, Shaping PolicyFindings of the 2012 Timor-Leste Education Survey
districts such measures are slightly more common. For example, in Ainaro, Liquica and Lautem more than 20 percent of directors state that students with language diffi culties receive additional instruction. In Oecusse 22.6 percent of primary schools have students attend preparatory language programs.
Grade Repetition
Repetition rates in Timor-Leste are unusually high. 40.5 percent of Grade 4 students have repeated at least once, 9.8 percent have repeated more than once by Grade 4. Grade 1 repetition rate is 21.0 percent, varying widely between districts and ranging from 34.3 percent in Bobonaro to 7.5 percent in Dili (see Figure 34).23 Figure 33 shows that this is high in regional comparison.
Figure 33: Grade 1 Repetition Rates across
the Region
Figure 34: Grade 1 Repetition Rates by
District
0%
5%
10%
15%
20%
25%
30%
0%
5%
10%
15%
20%
25%
30%
35%
40%
Source: World DataBank Education Statistics; Education Survey 2012 for Timor-Leste Figures
The most commonly cited reason for high student repetition rates by school directors is student
absenteeism. 38.6 percent of primary school directors state that the main reason for repetition is absenteeism, 36.5 percent state that some Grade 1 students start too young and 15.9 percent state that students repeat because they do not understand the instruction language. Grade 4 students were also asked why they had to repeat and 37.8 percent stated that they had to repeat because they still could not read, 27.5 percent stated that they had been sick and thus absent too often and 9.2 percent stated that they were too young.
23 According to the Education Statistical Yearbook 2008/2009 Grade 1 repetition rate was 31%, i.e. higher than current repetition rates according to the Education survey. Newer EMIS fi gures are not yet available.

45Chapter 4Teaching and Learning
Absenteeism
Teacher Absenteeism
13.1 percent of primary school teachers and 24.9 percent of secondary school teachers were absent
on the day of the survey. The school survey team contacted schools prior to arrival and schools had been informed about the education survey by a letter from the Ministry of Education. Thus, this fi gure could underestimate usual teacher absenteeism if teachers were more likely to appear given that the MoE had announced an education survey.24 Teacher absenteeism rates are higher in central schools, 14.4 compared to 12.7 percent in fi lial schools, and in public schools where it is 13.4 percent compared to 10.7 percent in private schools (Figure 35).
Figure 35: Absenteei s m Rate of Primary School Teachers (Grade 4) by District and School Type
0%
5%
10%
15%
20%
25%
0%
5%
10%
15%
20%
Central School Filial School
0%
5%
10%
15%
Public SchoolP rivate School
Source: Education Survey 2012
The most common reasons cited by teachers for their absence were illness (28.1 percent) and working
on another job (28.1 percent).25 19.5 percent of teachers stated that they were absent due to the weather, which is surprising given that the survey was undertaken in dry season. 5.2 percent of teachers were absent due to pregnancy or post-natal care, 5 percent were attending a ceremony (Figure 36). Absenteeism rates were higher for female teachers (15 percent compared to 11.8 percent for male teachers). Given the extremely high fertility rates in Timor-Leste it is perhaps not surprising that 11.5 percent of all female teachers were absent due to pregnancy or post-natal care.
24 By similar logic, these fi gures might overestimate teacher absenteeism if teachers were more likely to be absent on the day of the survey, for instance because they assumed they wouldn’t have to teach anyway because something else was happening at the school.
25 Survey interviewers were instructed to create a roster and write down the names of all Grade 4 teachers (in the case of primary schools). Then for each teacher enumerators asked whether he/she is present and if not, asked the director or other teachers for the reason of their absence.
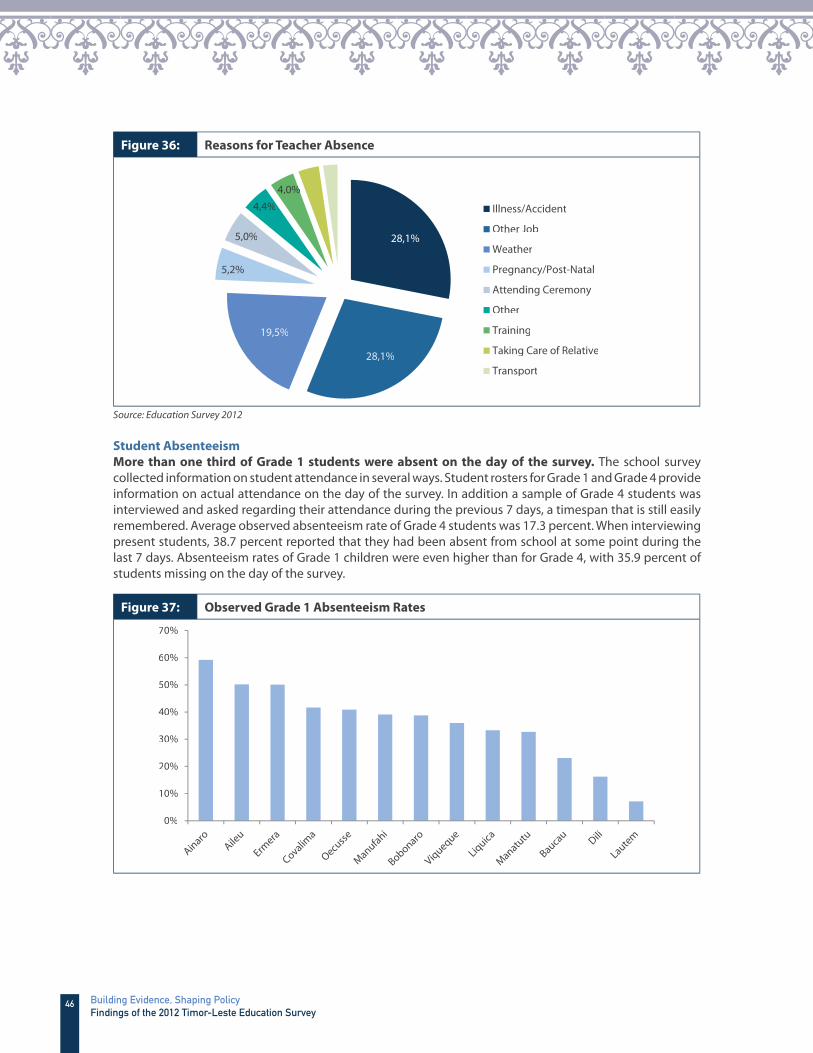
46 Building Evidence, Shaping PolicyFindings of the 2012 Timor-Leste Education Survey
Figure 36: Reasons fo r Teacher Absence
28,1%
28,1%
19,5%
5,2%
5,0%
%4,4%%4,0%
Illness/Accident
Other Job
Weather
Pregnancy/Post-Natal
Attending Ceremony
Other
Training
Taking Care of Relative
Transport
Source: Education Survey 2012
Student Absenteeism
More than one third of Grade 1 students were absent on the day of the survey. The school survey collected information on student attendance in several ways. Student rosters for Grade 1 and Grade 4 provide information on actual attendance on the day of the survey. In addition a sample of Grade 4 students was interviewed and asked regarding their attendance during the previous 7 days, a timespan that is still easily remembered. Average observed absenteeism rate of Grade 4 students was 17.3 percent. When interviewing present students, 38.7 percent reported that they had been absent from school at some point during the last 7 days. Absenteeism rates of Grade 1 children were even higher than for Grade 4, with 35.9 percent of students missing on the day of the survey.
Figure 37: Observed G rade 1 Absenteeism Rates
0%
10%
20%
30%
40%
50%
60%
70%
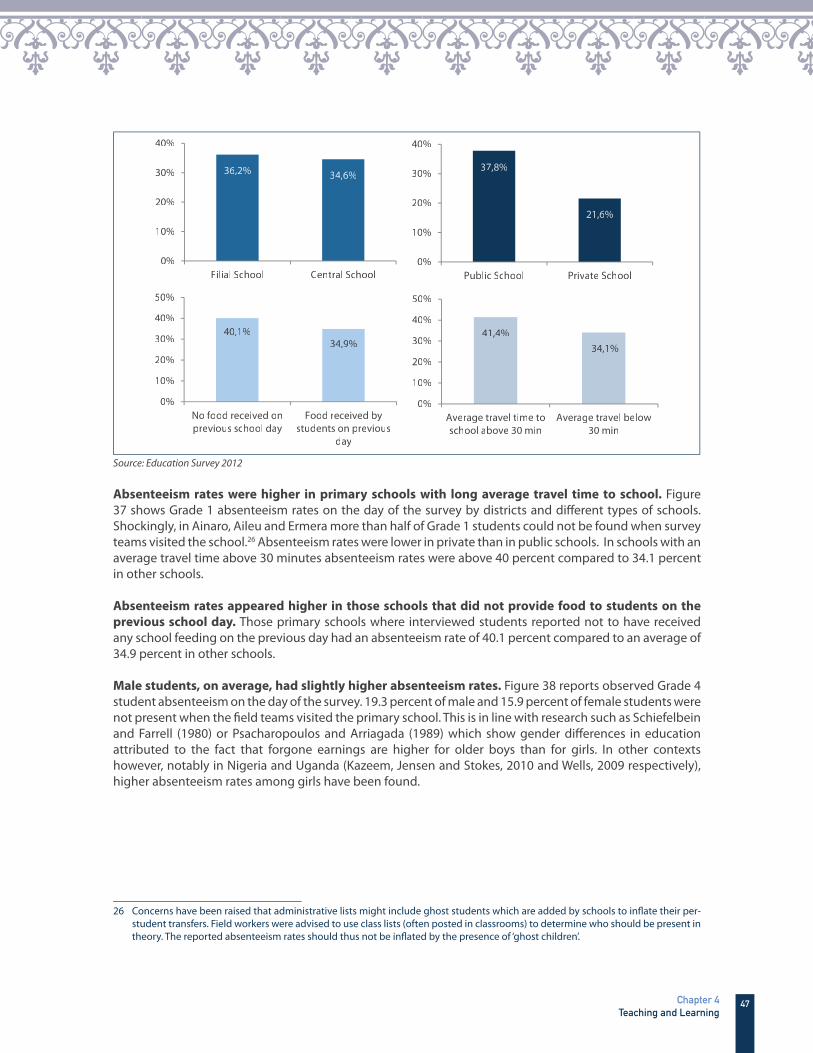
47Chapter 4Teaching and Learning
36,2% 34,6%37,8%
21,6%
0%
10%
20%
30%
40%
0%
10%
20%
30%
40%
Filial School Central School Public School Private School
40,1%34,9%
0%
10%
20%
30%
40%
50%
No foff od received onprevious school day
Food received bystudents on previous
day
41,4%34,1%
0%
10%
20%
30%
40%
50%
Average travel time toschool above 30 min
Average travel below30 min
Source: Education Survey 2012
Absenteeism rates were higher in primary schools with long average travel time to school. Figure 37 shows Grade 1 absenteeism rates on the day of the survey by districts and diff erent types of schools. Shockingly, in Ainaro, Aileu and Ermera more than half of Grade 1 students could not be found when survey teams visited the school.26 Absenteeism rates were lower in private than in public schools. In schools with an average travel time above 30 minutes absenteeism rates were above 40 percent compared to 34.1 percent in other schools.
Absenteeism rates appeared higher in those schools that did not provide food to students on the
previous school day. Those primary schools where interviewed students reported not to have received any school feeding on the previous day had an absenteeism rate of 40.1 percent compared to an average of 34.9 percent in other schools.
Male students, on average, had slightly higher absenteeism rates. Figure 38 reports observed Grade 4 student absenteeism on the day of the survey. 19.3 percent of male and 15.9 percent of female students were not present when the fi eld teams visited the primary school. This is in line with research such as Schiefelbein and Farrell (1980) or Psacharopoulos and Arriagada (1989) which show gender diff erences in education attributed to the fact that forgone earnings are higher for older boys than for girls. In other contexts however, notably in Nigeria and Uganda (Kazeem, Jensen and Stokes, 2010 and Wells, 2009 respectively), higher absenteeism rates among girls have been found.
26 Concerns have been raised that administrative lists might include ghost students which are added by schools to infl ate their per-student transfers. Field workers were advised to use class lists (often posted in classrooms) to determine who should be present in theory. The reported absenteeism rates should thus not be infl ated by the presence of ‘ghost children’.

48 Building Evidence, Shaping PolicyFindings of the 2012 Timor-Leste Education Survey
Figure 38: Observed G rade 4 Student Absenteeism Rates
0%
5%
10%
15%
20%
25%
30%
19,3%%15,9%%
0%
5%
10%
15%
20%
25%
Boys Girls
18,6%%16,6%%
0%
5%
10%
15%
20%
School has noToilet
School has aToilet
Source: Education Survey 2012
Table 5: Chores perfo rmed at home
Percentage of Grade 4 Students performing Household Chores
Male Female
Collect water at home 95.7% 95.2% 96.2%
Collect Firewood at home 91.6% 91.9% 91.4%
Taking care of siblings at home 87.6% 85.9% 89.2%
Taking care of livestock at home 75.3% 79.6% 71.1%
Cook at home 66.3% 43.3% 88.3%
Taking care of other relatives at home 48.5% 46.5% 50.4%
Students in Timor-Leste appear to be performing a large amount of chores in the household. More than 90 percent of students report to be collecting water and fi rewood at home. Perhaps not surprisingly, given one of the highest fertility rates and household sizes in the world, many children also report to be helping with taking care of siblings at home (Table 5).
Students who have to take care of siblings or livestock at home have a higher average absenteeism
rate. Figure 39 shows the percentage of Grade 4 students that report having been absent from school in the previous seven days in their interview by diff erent student characteristics. 40.5 percent of those children who report that they help taking care of siblings at home had been absent in the previous week. 41.3 percent of Grade 4 students reporting that they normally help at home taking care of livestock report having been absent, compared to 30.8 percent of those students that do not. Children with a low understanding of the instruction languages, Tetum and Portuguese, on average had higher absenteeism rates.27
27 Note that the statistics reported here are simple correlations. A higher average absenteeism rate for children with poor understanding of languages doesn’t mean that a poor understanding of the instruction language causes children to stay home from school. It could be that children with certain household or location background know these languages less and also have diff erent attendance rates because of these household or location characteristics. Similarly, it could be that children with certain characteristics attend school less and because of this know these languages less.
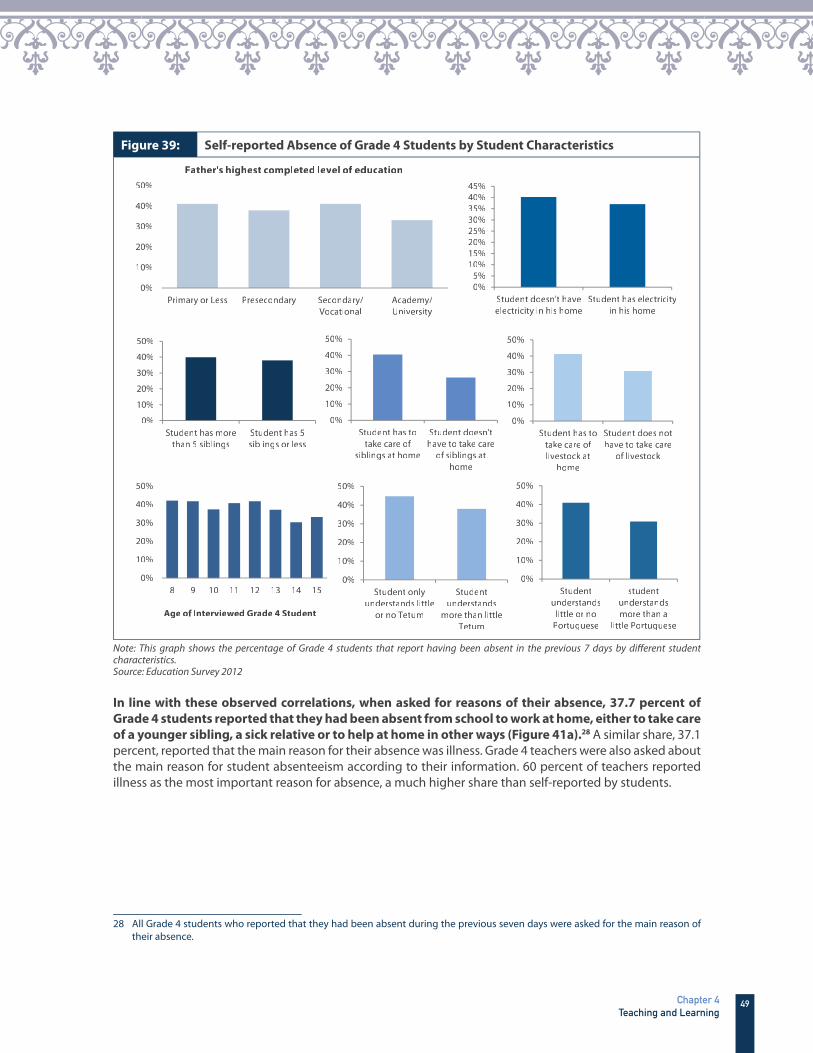
49Chapter 4Teaching and Learning
Figure 39: Self-reported Absence o f Grade 4 Students by Student Characteristics
0%
10%
20%
30%
40%
50%
Primary or Less Presecondary Secondary/Vocational
Academy/University
Father's highest completed level of education
0%
10%
20%
30%
40%
50%
Student has morethan 5 siblings
Student has 5siblings or less
0%
10%
20%
30%
40%
50%
8 9 10 11 12 13 14 15
Age of Interviewed Grade 4 Student
0%
10%
20%
30%
40%
50%
Student onlyunderstands little
or no Tetum
Studentunderstands
more than littleTetum
0%
10%
20%
30%
40%
50%
Studentunderstands
little or noPortuguese
studentunderstandsmore than a
little Portuguese
0%
10%
20%
30%
40%
50%
Student has totake care of
siblings at home
Student doesn'thave to take care
of siblings athome
0%
10%
20%
30%
40%
50%
Student has totake care oflivestock at
home
Student does nothave to take care
of livestock
0%5%
10%15%20%25%30%35%40%45%
Student doesn't haveelectricity in his home
Student has electricityin his home
Note: This graph shows the percentage of Grade 4 students that report having been absent in the previ ous 7 days by diff erent student characteristics. Source: Education Survey 2012
In line with these observed correlations, when asked for reasons of their absence, 37.7 percent of
Grade 4 students reported that they had been absent from school to work at home, either to take care
of a younger sibling, a sick relative or to help at home in other ways (Figure 41a).28 A similar share, 37.1 percent, reported that the main reason for their absence was illness. Grade 4 teachers were also asked about the main reason for student absenteeism according to their information. 60 percent of teachers reported illness as the most important reason for absence, a much higher share than self-reported by students.
28 All Grade 4 students who reported that they had been absent during the previous seven days were asked for the main reason of their absence.
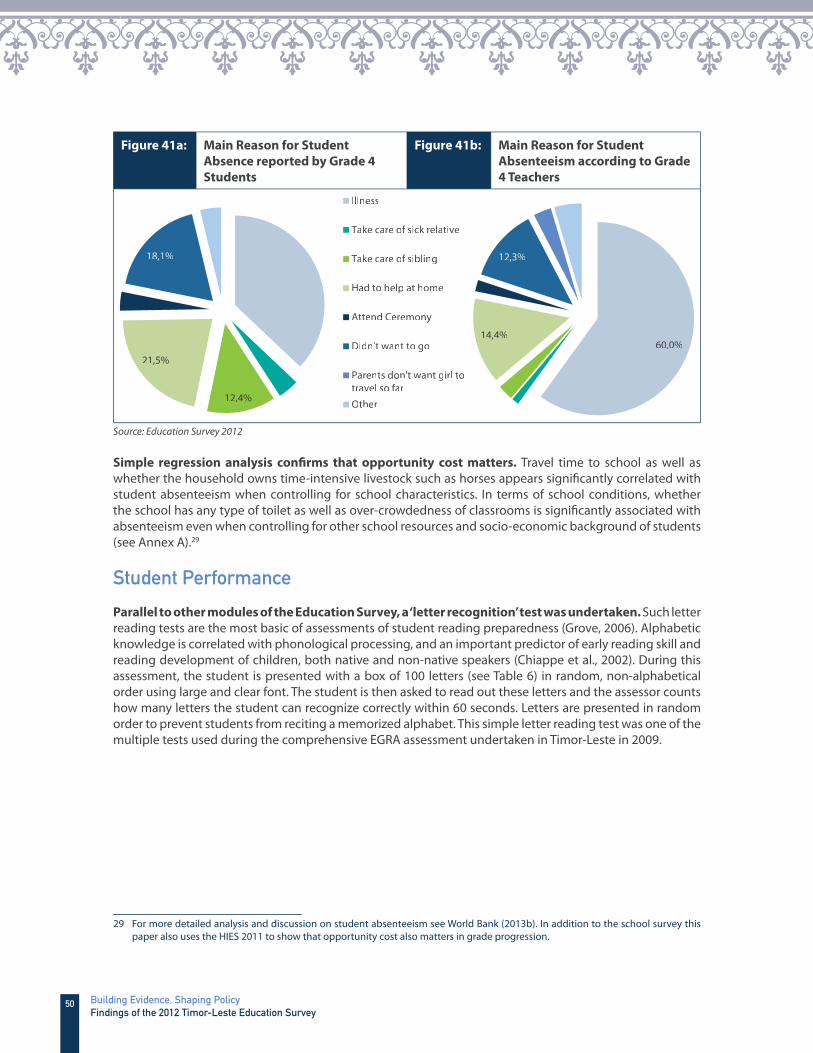
50 Building Evidence, Shaping PolicyFindings of the 2012 Timor-Leste Education Survey
Figure 41a: Main Reason for Student
Absence reported by Grade 4
Students
Figure 41b: Main Reason for Student
Absenteeism according to Grade
4 Teachers
37,1%
12,4%
21,5%
18,1%
Illness
Take care of sick relative
Take care of sibling
Had to help at home
Attend Ceremony
Didn't want to go
Parents don't want girl totravel so faff rOther
60,0%14,4%
12,3%
Source: Education Survey 2012
Simple regression analysis confi rms that opportunity cost matters. Travel time to school as well as whether the household owns time-intensive livestock such as horses appears signifi cantly correlated with student absenteeism when controlling for school characteristics. In terms of school conditions, whether the school has any type of toilet as well as over-crowdedness of classrooms is signifi cantly associated with absenteeism even when controlling for other school resources and socio-economic background of students (see Annex A).29
Student Performance
Parallel to other modules of the Education Survey, a ‘letter recognition’ test was undertaken. Such letter reading tests are the most basic of assessments of student reading preparedness (Grove, 2006). Alphabetic knowledge is correlated with phonological processing, and an important predictor of early reading skill and reading development of children, both native and non-native speakers (Chiappe et al., 2002). During this assessment, the student is presented with a box of 100 letters (see Table 6) in random, non-alphabetical order using large and clear font. The student is then asked to read out these letters and the assessor counts how many letters the student can recognize correctly within 60 seconds. Letters are presented in random order to prevent students from reciting a memorized alphabet. This simple letter reading test was one of the multiple tests used during the comprehensive EGRA assessment undertaken in Timor-Leste in 2009.
29 For more detailed analysis and discussion on student absenteeism see World Bank (2013b). In addition to the school survey this paper also uses the HIES 2011 to show that opportunity cost also matters in grade progression.

51Chapter 4Teaching and Learning
Table 6: Tetum Letter Recognition Test
1 2 3 4 5 6 7 8 9 10
L a i R S d E O n T (10)
f e T D A t a d e b (20)
h O e m U r L G R u (30)
g R B E i f m t s r (40)
S T K N p A i W a E (50)
a s ñ A M K O t n P (60)
e A e s O F h u A t (70)
R ll H b S i g m i L (80)
L a N O e o E r p X (90)
N A ‘ D rr a O j e n (100)
In total, 22,301 Grade 1 students were tested including students from all primary schools within
Timor-Leste that off er Grade 1. In small schools with less than 20 Grade 1 students, all students were tested using Tetum letters. In schools with more than 20 Grade 1 students, 20 students were randomly selected to be tested in Tetum. In larger schools with more than 40 Grade 1 students present, 20 students were selected to be tested in Tetum and an additional 20 students were randomly selected to undertake the same type of test using Portuguese letters. By this logic, 17,741 children were tested in Tetum, 4,560 in Portuguese.
On average Grade 1 students, after about 9 months of instruction, were able to recognize 10 Tetum
letters correctly within one minute. Indeed, 34 percent of Grade 1 students nationwide were unable to recognize a single letter correctly at the end of the school year. This is in line with the poor 2009 EGRA results which showed that 70 percent of Grade 1 students could not read a single word out of a simple text passage (World Bank, 2009).30
Figure 42 shows that the youngest Grade 1 students perform most poorly. For this there are many possible explanations. For instance, Grade 1 students that are six years old at the end of the school year almost certainly were below offi cial starting age at the beginning of the year. These children might have been less prepared and ready when starting school. Further, children starting school pre-maturely might have a particular socio-economic background and school conditions impacting their performance. Moreover, older children in Grade 1 might already be repeating the grade for the second time.
30 The reported 10 Tetum letters read correctly per minute is the median. The mean is higher (15.6) driven by few students performing very highly with up to all 100 letters read correctly. Taking school-level averages of letters read correctly, the median of school-level scores is 13.3.
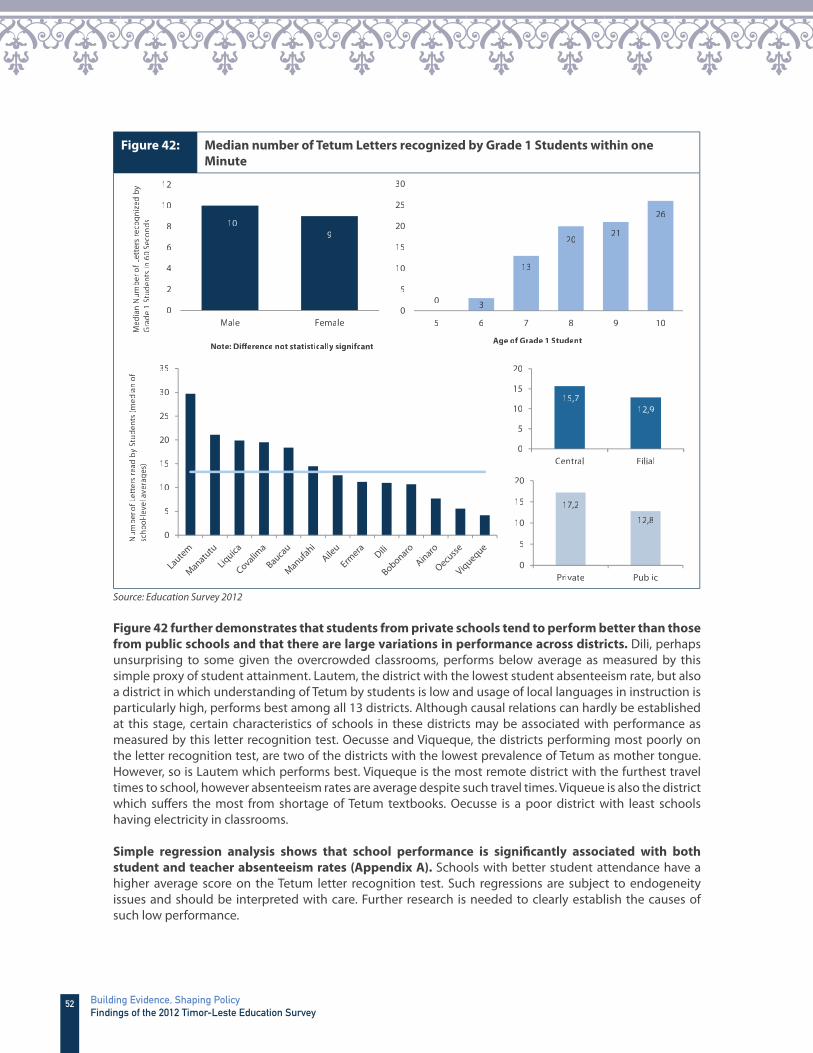
52 Building Evidence, Shaping PolicyFindings of the 2012 Timor-Leste Education Survey
Figure 42: Median number of Tetum Let ters recognized by Grade 1 Students within one
Minute
109
0
2
4
6
8
10
12
Male Female
Note: Di erence not statistically signifcant
Med
ian
Num
bero
fLet
ters
reco
gniz
edby
Gra
de1
Stud
ents
in60
Seco
nds
0 3
13
2021
26
0
5
10
15
20
25
30
5 6 7 8 9 10
Age of Grade 1 Student
15,712,9
0
5
10
15
20
Central Filial
17,2
12,8
0
5
10
15
20
Private Public
0
5
10
15
20
25
30
35
Num
bero
fLet
ters
read
bySt
uden
ts(m
edia
nof
sch o
o l- lll
evel
aver
age s
)
Source: Education Survey 2012
Figure 42 further demonstrates that students from private schools tend to perform better than those
from public schools and that there are large variations in performance across districts. Dili, perhaps unsurprising to some given the overcrowded classrooms, performs below average as measured by this simple proxy of student attainment. Lautem, the district with the lowest student absenteeism rate, but also a district in which understanding of Tetum by students is low and usage of local languages in instruction is particularly high, performs best among all 13 districts. Although causal relations can hardly be established at this stage, certain characteristics of schools in these districts may be associated with performance as measured by this letter recognition test. Oecusse and Viqueque, the districts performing most poorly on the letter recognition test, are two of the districts with the lowest prevalence of Tetum as mother tongue. However, so is Lautem which performs best. Viqueque is the most remote district with the furthest travel times to school, however absenteeism rates are average despite such travel times. Viqueue is also the district which suff ers the most from shortage of Tetum textbooks. Oecusse is a poor district with least schools having electricity in classrooms.
Simple regression analysis shows that school performance is signifi cantly associated with both
student and teacher absenteeism rates (Appendix A). Schools with better student attendance have a higher average score on the Tetum letter recognition test. Such regressions are subject to endogeneity issues and should be interpreted with care. Further research is needed to clearly establish the causes of such low performance.
53Chapter 4Teaching and Learning
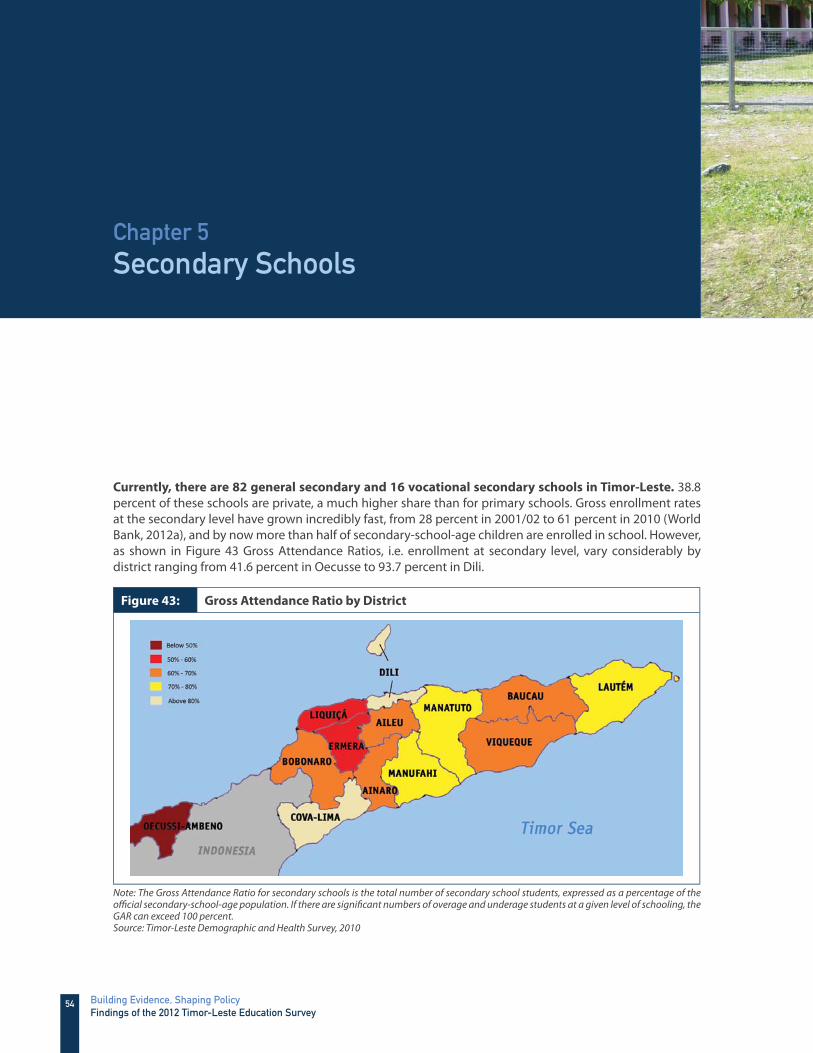
54 Building Evidence, Shaping PolicyFindings of the 2012 Timor-Leste Education Survey
Currently, there are 82 general secondary and 16 vocational secondary schools in Timor-Leste. 38.8 percent of these schools are private, a much higher share than for primary schools. Gross enrollment rates at the secondary level have grown incredibly fast, from 28 percent in 2001/02 to 61 percent in 2010 (World Bank, 2012a), and by now more than half of secondary-school-age children are enrolled in school. However, as shown in Figure 43 Gross Attendance Ratios, i.e. enrollment at secondary level, vary considerably by district ranging from 41.6 percent in Oecusse to 93.7 percent in Dili.
Figure 43: Gross Attendance Ratio by D istrict
Note: The Gross Attendance Ratio for secondary schools is the total number of secondary school students, expressed as a percentage of the offi cial secondary-school-age population. If there are signifi cant numbers of overage and underage students at a given level of schooling, the GAR can exceed 100 percent. Source: Timor-Leste Demographic and Health Survey, 2010
Chapter 5Secondary Schools

55Chapter 5Secondary Schools
Location
Secondary schools are more centrally located than primary schools and travel times are longer. Many secondary schools are located in the largest cities, 13 in Baucau and 24 in Dili. Figure 44 shows the number of secondary schools by district. In general, locations are less remote than for primary schools. Indeed, on average, secondary schools are located less than 30 minutes from the closest bank (compared to more than 2 hours for primary schools), 15 minutes from the closest clinic and 10 minutes from the closest policy offi ce. Average travel time to school is 26 compared to 21 minutes. 14.0 percent of Grade 11 students travel for an hour or more compared to 10.7 percent of grade 4 students.
Figure 44: Total number of secondary s chools by District
0
5
10
15
20
25
Source: Education Survey 2012
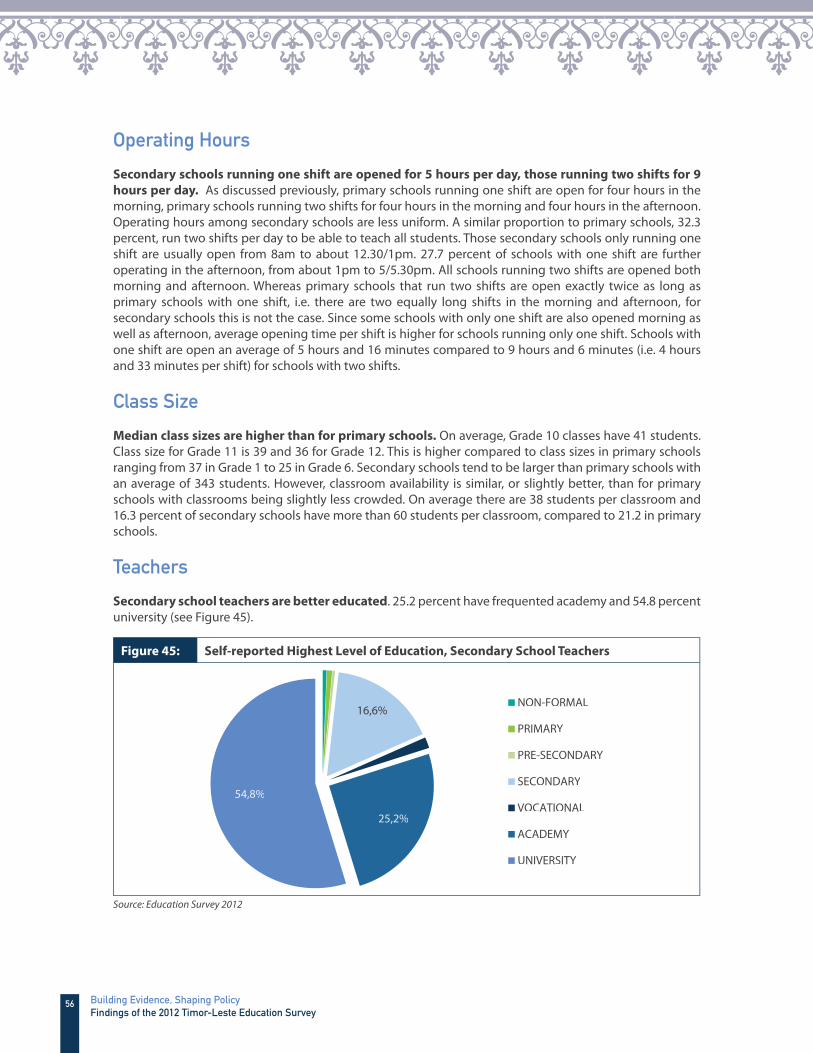
56 Building Evidence, Shaping PolicyFindings of the 2012 Timor-Leste Education Survey
Operating Hours
Secondary schools running one shift are opened for 5 hours per day, those running two shifts for 9
hours per day. As discussed previously, primary schools running one shift are open for four hours in the morning, primary schools running two shifts for four hours in the morning and four hours in the afternoon. Operating hours among secondary schools are less uniform. A similar proportion to primary schools, 32.3 percent, run two shifts per day to be able to teach all students. Those secondary schools only running one shift are usually open from 8am to about 12.30/1pm. 27.7 percent of schools with one shift are further operating in the afternoon, from about 1pm to 5/5.30pm. All schools running two shifts are opened both morning and afternoon. Whereas primary schools that run two shifts are open exactly twice as long as primary schools with one shift, i.e. there are two equally long shifts in the morning and afternoon, for secondary schools this is not the case. Since some schools with only one shift are also opened morning as well as afternoon, average opening time per shift is higher for schools running only one shift. Schools with one shift are open an average of 5 hours and 16 minutes compared to 9 hours and 6 minutes (i.e. 4 hours and 33 minutes per shift) for schools with two shifts.
Class Size
Median class sizes are higher than for primary schools. On average, Grade 10 classes have 41 students. Class size for Grade 11 is 39 and 36 for Grade 12. This is higher compared to class sizes in primary schools ranging from 37 in Grade 1 to 25 in Grade 6. Secondary schools tend to be larger than primary schools with an average of 343 students. However, classroom availability is similar, or slightly better, than for primary schools with classrooms being slightly less crowded. On average there are 38 students per classroom and 16.3 percent of secondary schools have more than 60 students per classroom, compared to 21.2 in primary schools.
Teachers
Secondary school teachers are better educated. 25.2 percent have frequented academy and 54.8 percent university (see Figure 45).
Figure 45: Self-reported Highest Level of Education, Secondary School Teachers
16,6%
25,2%
54,8%
NON-FORMAL
PRIMARY
PRE-SECONDARY
SECONDARY
VOCATIONAL
ACADEMY
UNIVERSITY
Source: Education Survey 2012
57Chapter 5Secondary Schools
Interestingly, teacher absenteeism rates were higher among secondary than primary schools. On the day of the survey, 24.9 percent of Grade 11 teachers were absent from school compared to 13.1 percent of Grade 4 primary school teachers. Student absenteeism rates on the other hand were similar. 16.8 percent of secondary school students, from Grade 11, were absent compared to 17.6 percent of Grade 4 primary school students. Student absenteeism rates of both these grades are low compared to the shockingly high absenteeism rates in Grade 1 as discussed previously.
Infrastructure and School Materials
Secondary schools face similar infrastructure and material constraints. Secondary schools are more centrally located and a higher proportion is private. It is thus not surprising that in some ways they tend to be slightly better equipped. Only 13.4 percent are lacking a toilet and more than half, 55.7 percent, have electricity which is high compared to primary schools. However, the same proportion, 16.5 percent, lacks water provision at the school and classroom availability, as mentioned, is similar with an average of 38 students per classroom compared to 39. Textbook availability is considerably worse than in primary schools with 48.9 percent of secondary schools not having mathematics textbooks compared to 24.3 percent of primary schools. 59.0 percent of secondary schools have no Portuguese textbook and 78.7 lack Tetum textbooks.

58 Building Evidence, Shaping PolicyFindings of the 2012 Timor-Leste Education Survey
Key Policy Recommendations
Despite fast progress since independence, improving access to education needs continued policy
attention particularly in remote areas. As shown by the survey data, 11 percent of Grade 4 students need an hour or more to travel to school. In some districts such as Viqueque, almost a third of students do. There is evidence that a long commute to school is closely associated with student absenteeism, which is a major cause for concern according to the results of this survey. Indeed, 17 percent of Grade 4 students and 36 percent of Grade 1 students were absent from school on the day of the interviews. Furthermore, Grade 1 absenteeism rate is as high as 41 percent in schools with an average travel time of 30 minutes or more, compared to 34 percent in other schools. Since only less than 2 percent of students make use of any means of transport other than walking to reach school, providing transportation subsidies or other direct support such as school buses may be worth considering and piloting in selected geographic areas.
Improving quality of education should be a key policy focus. According to the survey, 34 percent of Grade 1 students nationwide were unable to recognize a single letter correctly at the end of the school year. This is in line with poor results from other assessments such as EGRA and EGMA which provide clear evidence that education quality is of particular concern in Timor-Leste. To improve education quality and learning, attention should be paid in the following areas:
Enhancing Teacher quality. Research shows that the quality of teachers, what they know and how they are able to teach, has signifi cant impact on the academic performance of their students. Providing high quality teachers has been a problem in Timor-Leste with most teachers from Indonesia leaving the country during the independence struggle. In 2000 a majority of schools were offi cially reopened, but with many inexperienced and under-qualifi ed teachers. The survey results show that 71 percent of primary school teachers only hold secondary education, 6 percent even less. There is also an unusually high proportion of volunteer teachers, 24 percent of primary school teachers are volunteers, most of which are even less educated and experienced than permanent teachers.
A comprehensive review of teacher policies needs to be carried out. The policy review should aim at identifying the gaps in policy coverage, clarity, implementation arrangements, monitoring and evaluation processes, and overall eff ectiveness; and lead to necessary further revisions to support the overall goal of improving teacher quality. The policy domains should cover: (1) Attracting the best into teaching; (2) Preparing teachers with useful training and experience; (3) Matching teachers’ skills with students’ needs; (4) Monitoring teaching and learning; (5) Supporting teachers to improve instruction; and (6) Motivating teachers to perform.
The initial teacher education programs need to be reformed to signifi cantly improve teacher quality as well as to address the teacher supply shortage in particular in certain subjects. This reform needs to focus on increasing teacher training provision and standards as well as improving training content. Reforming in-service teacher training programs is equally important to broaden the knowledge teachers acquired during their initial teacher education and upgrade skills of existing teachers. In the immediate term a key focus will be to support under-qualifi ed teachers that do not meet the minimum qualifi cations and competencies to enter the ‘teacher career regime’. INFORDEPE may continue playing the main role in providing in-service training to teachers who have acquired an equivalence to ‘bacharelato’ level under the intensive teacher training, while the National University
59Key Policy Recommendations
of Timor-Leste (UNTL) and other higher education institutions may want to focus on the in-service training of all other teachers.31
Strengthening instruction language policy. Instruction language is one of the most debated and controversial policies currently in place in Timor-Leste. According to global experience, language policy is an important factor that supports development of literacy at early grades and sets the foundation for advanced learning in the future. The survey highlights that comprehension of Portuguese, even after years of instruction, is very limited. In some districts understanding of Tetum is also below expectations. The survey further shows that mother tongue teaching, despite current policy, is widely practiced. However, since local languages are used unoffi cially ignoring national policy, there are no guidelines and training in how such languages can best be utilized to support learning.
International evidence shows that with proper training and adequate policy, mother tongue teaching can be a powerful tool for better learning. However, without clear guidance, adequate training and necessary learning materials, it is unlikely that it can reach its potential in developing early literacy. In addition, mother tongue teaching is meant to ‘bridge’ towards using national instruction language later. There is no evidence that teachers currently transition away from using local languages in instruction during higher grades. This is possibly one of the reasons why comprehension of national instruction languages is so low even at later grades.
There is a need to review current language policies. If Portuguese and Tetum remain the offi cial languages of instruction even at lowest grades, language training for teachers needs to be reinforced and the necessary materials supplied. Enforcement of the policy and guidance to teachers also needs to be strengthened. If the decision is made to move to some form of mother tongue teaching at low grades, as is de facto currently happening, teachers again need to be provided with the necessary training, guidance and materials. For instance, teachers need to be instructed on how to transition away from local language instruction towards using national languages at a later stage.
Improving education system management. Timor-Leste’s education system is highly centralized, however this might be beginning to change with decentralization high on the government’s agenda. Contrary to expectation, the education survey shows that school directors currently de facto take many decisions, for instance on instruction content and subject choice. School directors, often very inexperienced and under-educated, take these decisions despite the decision authority lying with the central ministry according to legislation and despite not having any guidance or training in how to take such decisions. Improving the school system, prior to any decentralization eff orts, might fi rst require strengthening national standards and quality assurance at central level. As a second stage school leadership as well as service delivery capacity at local and school level needs to be strengthened.
Improving school attendance through innovative interventions. As outlined, high student absenteeism is a major cause of concern and strongly associated with student performance. It appears strongly related to the opportunity cost of schooling with children that have to help at home, for instance by taking care of livestock, and children with a longer travel time to school being absent more. The national school feeding program does not seem to be enough to counter the large absenteeism rates observed. Possible interventions could be scholarships or conditional cash transfers tied to attendance. Such CCT programs have been found to have a positive eff ect on school enrolment in multiple settings. Some research has also shown positive eff ects on attendance, for
31 For further detail see World Bank (2013c) ‘Concept Note on Teacher Quality Improvement in Timor-Leste’, Internal Document.
60 Building Evidence, Shaping PolicyFindings of the 2012 Timor-Leste Education Survey
instance Filmer and Schady (2008) focusing on such a scholarship program in Cambodia. (For further detail see World Bank 2013b.)
Improving school infrastructure and learning environment. Despite 10 years of investment, lack of infrastructure remains a large issue in this young nation. 33 percent of public schools have no toilet, many no provision of water and only 21 percent of primary schools have electricity. In particular, student to classroom ratios are also still very high. Indeed, in Dili 48 percent of schools have more than 60 students per classroom. According to the survey, lack of classrooms is one of the most frequently voiced problems by directors and teachers and is related to larger classes as well as the running of multiple shifts per day. Although it appears that in the case of primary schools the running of multiple shifts is not necessarily related to a reduction in learning time or an increase in teaching time by the same teachers, it can still be problematic if the conditions in the afternoon shift are less conducive for learning.
Ensuring adequate supply of textbooks. Lack of textbooks is mentioned as the main obstacle by school directors and teachers. In line with these perceptions international evidence shows that the availability of textbooks impacts student achievement. Currently, 24 percent of primary schools have no mathematics textbooks, 25 percent no Portuguese textbooks and 57 percent no Tetum textbooks. In some cases this is a distribution problem rather than a matter of availability of books or resources.
Overall, both demand and supply side interventions are needed. Timor-Leste’s education system has seen large progress and investment in recent years, however the largest challenges remain to be tackled. Improving education quality requires the right mix of policies and will be crucial on Timor-Leste’s path to an upper-middle-income country by 2030.
61Bibliography
Bibliography
Bruns, B. et al (2011), ‘Making Schools Work: New Evidence on Accountability Reforms’, The World Bank, Washington, DC
Chiappe, P., Siegel, L. and Wade-Woolley, L. (2001), ‘Linguistic diversity and the development of reading skills: A longitudinal study’, Scientifi c Studies of Reading, 6(4), 369-400
Democratic Republic of Timor-Leste (2011), ‘Timor-Leste Strategic Development Plan 2011-2030’, Dili, Timor-Leste
Dhuey, E. and Smith, J. (2011), ‘How important are school principals in the Production of Student Achievement’, CLSRN Working Papers, UBC Department of Economics
Dreibelbis, R. et al. (2012), ‘Water, sanitation, and primary school attendance: A multi-level assessment of determinants of household-reported absence in Kenya’, International Journal of Educational Development, (http://www.sciencedirect.com/science/article/pii/S0738059312000Filmer, D. and Schady, N. (2008), ‘Getting Girls into School: Evidence from a Scholarship Program in Cambodia’, Economic Development and Cultural Change, 56(2), pp. 85-120
Grove, Amber et al (2008), ‘Early Grade Reading Assessment Toolkit’, World Bank and RTI International
Hanushek, E.A. (1995), ‘Interpreting Recent Research on Schooling in Developing Countries’, World Bank Research Observer, 10(2), 227-246
International Food Policy Research Institute (IFPRI) (2011), ‘Global Hunger Index, The challenge of hunger: taming price spikes and excessive food price volatility’, Bonn, Washington DC, Dublin
International Monetary Fund (2012), ‘Democratic Republic of Timor-Leste: 2011 Article IV Consultation – Staff Report; Informational Annex; Debt Sustainability Analysis; and Public Information Notice’, IMF Country Report No. 12/24
Joseph, G. and Wodon, Q. (2012), ‘Test Scores in Ghana’s Primary Schools: Measuring the Impact of School Inputs and Socio-Economic Factors’, the World Bank, Washington, DC
Kazeem, A., Jensen, L. and Stokes, C. (2010), ‘School attendance in Nigeria: understanding the impact and intersection of gender Urban-Rural residence, and socio-economic status’, Comparative Education Review, 54 (2)
Leithwood, K. et al. (2004), ‘How Leadership Infl uences Student Learning. Review of Research’, The Wallace Foundation, New York, USA
Lloyd, C.B. (2011), ‘The demography of the classroom in the primary grades; Patterns of enrollment by age and implications for early learning’, Hewlett Foundation
Ministry of Education and The World Bank (2012), ‘2011 Early Grade Mathematics Assessment: Result Analysis

62 Building Evidence, Shaping PolicyFindings of the 2012 Timor-Leste Education Survey
and Recommendation Report’, Draft, Dili, Timor-Leste
Ministry of Education (2010), ‘Education Statistical Yearbook 2008/09’, Dili, Timor-Leste
National Directorate of Statistics (2012), ‘Education Survey’, Dili, Timor-Leste
National Directorate of Statistics (2011), ‘Household Income and Expenditure Survey’, Dili, Timor-Leste
National Directorate of Statistics (2011b), ‘Timor-Leste: Labor Force Survey 2010’, Dili, Timor-Leste
National Directorate of Statistics (2010), ‘Timor-Leste Demographic and Health Survey 2009-10’, Dili, Timor-Leste
National Directorate of Statistics, United Nations Population Fund (2010a), ‘Population and Housing Census of Timor-Leste, Volume 2: Population Distribution by Administrative Areas’, Dili, Timor-Leste
National Directorate of Statistics, United Nations Population Fund (2010b), ‘Population and Housing Census of Timor-Leste, 2010, Volume 3: Social and Economic Characteristics’, Dili, Timor-Leste
OECD (2011), ’Education at a Glance 2011: OECD Indicators’, OECD Publishing, http://www.oecd.org/edu/skills-beyond-school/48631582.pdf
Psacharopoulos, G. and Arriagada, A. M. (1989), ‘The determinants of early age human capital formation: Evidence from Brazil’, Economic Development and Cultural Change, 37(4)
Sey, H., Mukhpadhyay, S., Laurin, E., and Banerjee, S. (2003), ‘Enhancing Education Opportunities for Vulnerable People: Exploring UNICEF SWASTHH for Support- A Rapid Assessment’, Washington DC, Creative Associates International
Schiefelbein, E. and Farrell, J. (1980), ‘Women, Schooling, and Work in Chile: Evidence from a Longitudinal Study’, Comparative Education Review, 24(2)
Tan, J.P., Lane, J., Coustere, P. (1997), ‘Putting Inputs to Work in Elementary Schools: What Can Be Done in the Philippines?’, Economic Development and Cultural Change, 45(4), 857-879
Wells, R. (2009), ‘Gender and age-appropriate enrolment in Uganda’, International Journal of Educational Research, 48(1)
World Bank (2013), ‘SABER- Student Assessment’, Dili, Timor-Leste, Draft, forthcoming
World Bank (2013b), ’Improving learning outcomes in Timor-Leste: A proposal for evaluating the impact of community and school-based interventions’, Washington DC, Draft, forthcoming
World Bank (2013c), ‘Concept Note on Teacher Quality Improvement in Timor-Leste’, Washington DC, Draft, forthcoming
World Bank (2012a), ‘Education Sector Issue Paper’, Washington DC
World Bank (2012b), ‘SABER- School Autonomy & Accountability, Timor-Leste’, Draft, forthcoming
63Bibliography
World Bank (2011), ‘Dili Drainage and Sanitation Master Plan: School Survey Report & Recommendations’
World Bank (2009), ‘An Analysis of Early Grade Reading Acquisition’, Dili, Timor-Leste
The World Bank (2004), ‘Determinants of Primary Education Outcomes in Developing Countries’, Background Paper for the Evaluation of the World Bank’s Support to Primary Education, The World Bank Operations Evaluation Department, Washington, DC
The World Bank (2004a), ‘Books, Buildings and Learning Outcomes: An Impact Evaluation of World Bank Support to Basic Education in Ghana’, Operations Evaluations Department, Washington, DC
World Bank, World Databank Education Statistics, http://databank.worldbank.org/data/views/variableselection/selectvariables.aspx?source=education-statistics
World Health Organization and the World Bank (2011), ‘World Report on Disability’, Geneva, Switzerland
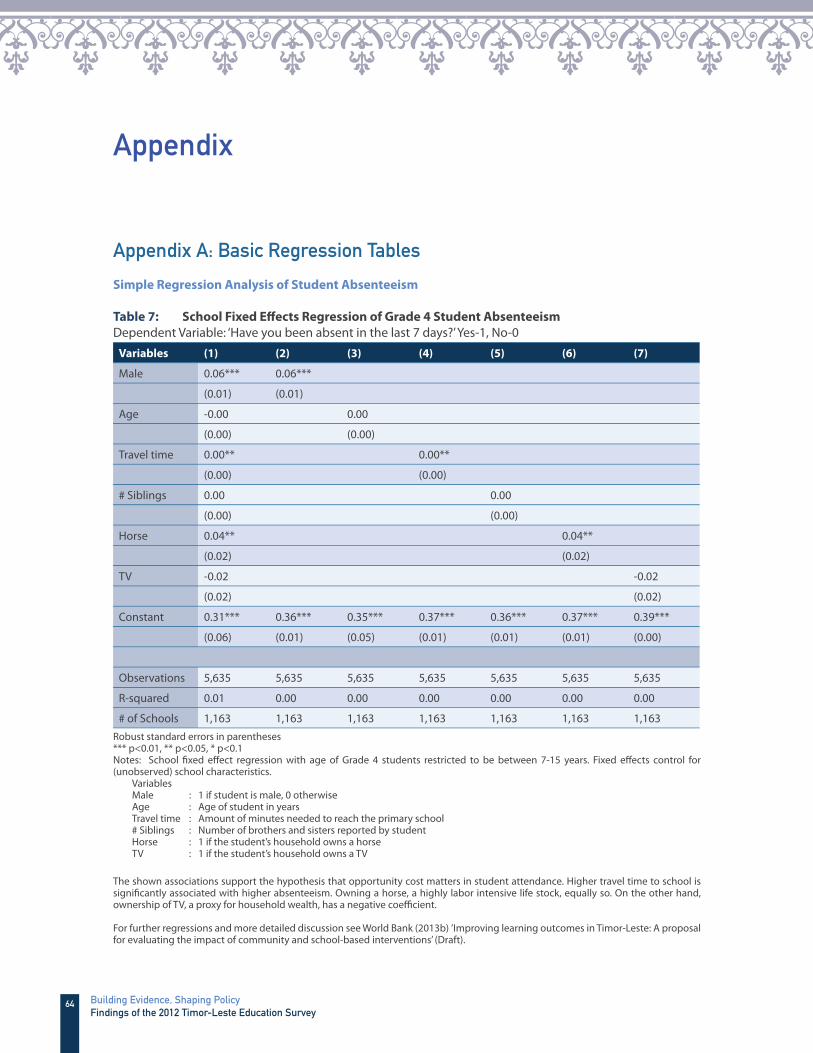
64 Building Evidence, Shaping PolicyFindings of the 2012 Timor-Leste Education Survey
Appendix
Appendix A: Basic Regression Tables
Simple Regression Analysis of Student Absenteeism
Table 7: School Fixed Eff ects Regression of Grade 4 Student Absenteeism
Dependent Variable: ‘Have you been absent in the last 7 days?’ Yes-1, No-0
Variables (1) (2) (3) (4) (5) (6) (7)
Male 0.06*** 0.06***
(0.01) (0.01)
Age -0.00 0.00
(0.00) (0.00)
Travel time 0.00** 0.00**
(0.00) (0.00)
# Siblings 0.00 0.00
(0.00) (0.00)
Horse 0.04** 0.04**
(0.02) (0.02)
TV -0.02 -0.02
(0.02) (0.02)
Constant 0.31*** 0.36*** 0.35*** 0.37*** 0.36*** 0.37*** 0.39***
(0.06) (0.01) (0.05) (0.01) (0.01) (0.01) (0.00)
Observations 5,635 5,635 5,635 5,635 5,635 5,635 5,635
R-squared 0.01 0.00 0.00 0.00 0.00 0.00 0.00
# of Schools 1,163 1,163 1,163 1,163 1,163 1,163 1,163Robust standard errors in parentheses*** p<0.01, ** p<0.05, * p<0.1Notes: School fi xed eff ect regression with age of Grade 4 students restricted to be between 7-15 years. Fixed eff ects control for (unobserved) school characteristics.
VariablesMale : 1 if student is male, 0 otherwiseAge : Age of student in yearsTravel time : Amount of minutes needed to reach the primary school# Siblings : Number of brothers and sisters reported by studentHorse : 1 if the student’s household owns a horseTV : 1 if the student’s household owns a TV
The shown associations support the hypothesis that opportunity cost matters in student attendance. Higher travel time to school is signifi cantly associated with higher absenteeism. Owning a horse, a highly labor intensive life stock, equally so. On the other hand, ownership of TV, a proxy for household wealth, has a negative coeffi cient.
For further regressions and more detailed discussion see World Bank (2013b) ’Improving learning outcomes in Timor-Leste: A proposal for evaluating the impact of community and school-based interventions’ (Draft).

65Appendix
Table 8: School conditions and Grade 4 Absenteeism Rate
Dependent Variable: School-level Grade 4 Student Absenteeism rate according to student roster
Variables (1) (2) (3) (4) (5) (6) (7) (8) (9)
Public School 0.01 0.01
(0.02) (0.01)
Central School 0.01 0.00
(0.01) (0.01)
Electricity 0.01 -0.00
(0.01) (0.01)
Toilet -0.03** -0.03**
(0.01) (0.01)
Math Textbooks 0.01 -0.00
(0.01) (0.01)
Student/Classroom ratio 0.00** 0.00
(0.00) (0.00)
School prepares food -0.02 -0.02
(0.02) (0.02)
Student Wealth Index -0.01*** -0.01***
(0.00) (0.00)
District Dummies Included in all regressions
Constant 0.25*** 0.25*** 0.26*** 0.26*** 0.28*** 0.26*** 0.25*** 0.27*** 0.25***
(0.03) (0.02) (0.02) (0.02) (0.02) (0.02) (0.02) (0.02) (0.02)
Observations 1,041 1,165 1,165 1,165 1,165 1,165 1,130 1,165 1,074
R-squared 0.13 0.11 0.11 0.11 0.11 0.11 0.11 0.11 0.12Robust standard errors in parentheses*** p<0.01, ** p<0.05, * p<0.1Notes:
VariablesPublic School : 1 if school is public, 0 otherwiseCentral School : 1 if school is a central, 0 if fi lialElectricity : 1 if school uses electric lightening in classrooms, 0 otherwiseToilet : 1 if school has any type of toilet, 0 otherwiseMath Textbooks : 1 if school has math textbooks, 0 otherwiseStudent/Classroom ratio : Total number of students per available classroomSchool prepares food : 1 if food is prepared at the school, 0 otherwiseStudent Wealth Index : Average household wealth index at the school. Constructed using principal component analysis based on questions of which assets the student’s household owns.
The availability of toilets as well as the overcrowding of classrooms appears signifi cantly associated with student absenteeism even after controlling for other proxies of school resources and the average socio-economic background of the school.
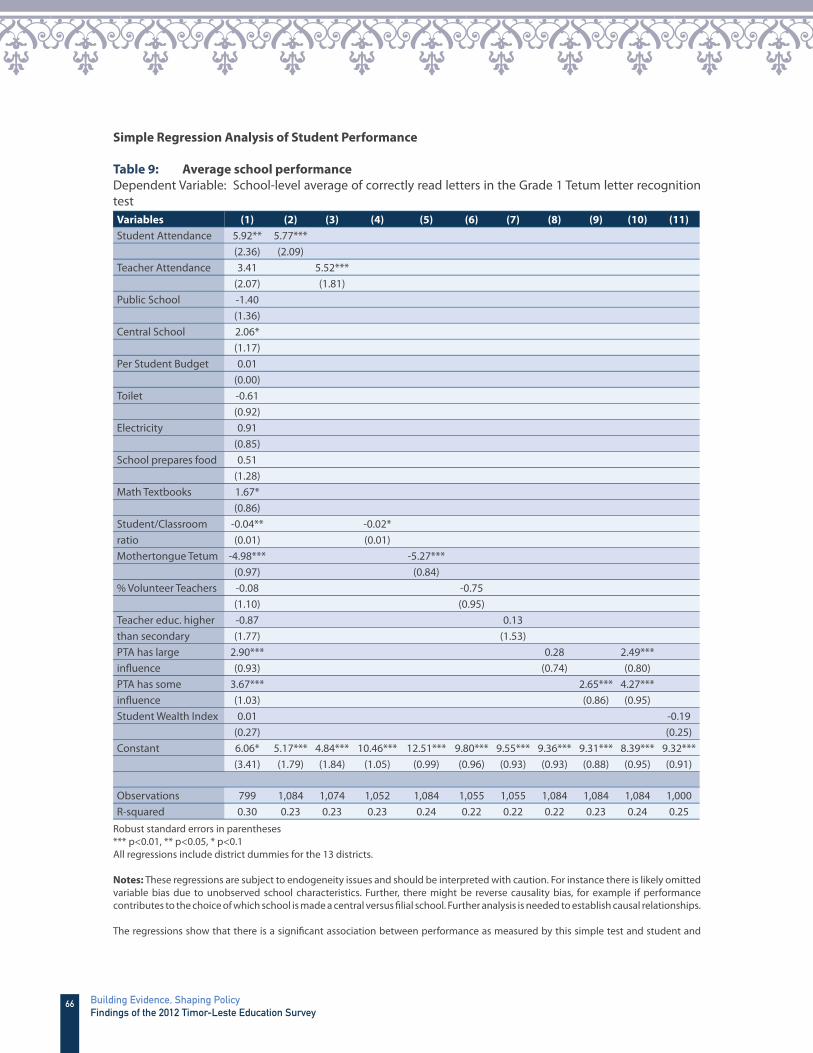
66 Building Evidence, Shaping PolicyFindings of the 2012 Timor-Leste Education Survey
Simple Regression Analysis of Student Performance
Table 9: Average school performance
Dependent Variable: School-level average of correctly read letters in the Grade 1 Tetum letter recognition testVariables (1) (2) (3) (4) (5) (6) (7) (8) (9) (10) (11)
Student Attendance 5.92** 5.77***(2.36) (2.09)
Teacher Attendance 3.41 5.52***(2.07) (1.81)
Public School -1.40(1.36)
Central School 2.06*(1.17)
Per Student Budget 0.01(0.00)
Toilet -0.61(0.92)
Electricity 0.91(0.85)
School prepares food 0.51(1.28)
Math Textbooks 1.67*(0.86)
Student/Classroom -0.04** -0.02*ratio (0.01) (0.01)Mothertongue Tetum -4.98*** -5.27***
(0.97) (0.84)% Volunteer Teachers -0.08 -0.75
(1.10) (0.95)Teacher educ. higher -0.87 0.13than secondary (1.77) (1.53)PTA has large 2.90*** 0.28 2.49***infl uence (0.93) (0.74) (0.80)PTA has some 3.67*** 2.65*** 4.27***infl uence (1.03) (0.86) (0.95)Student Wealth Index 0.01 -0.19
(0.27) (0.25)Constant 6.06* 5.17*** 4.84*** 10.46*** 12.51*** 9.80*** 9.55*** 9.36*** 9.31*** 8.39*** 9.32***
(3.41) (1.79) (1.84) (1.05) (0.99) (0.96) (0.93) (0.93) (0.88) (0.95) (0.91)
Observations 799 1,084 1,074 1,052 1,084 1,055 1,055 1,084 1,084 1,084 1,000R-squared 0.30 0.23 0.23 0.23 0.24 0.22 0.22 0.22 0.23 0.24 0.25
Robust standard errors in parentheses*** p<0.01, ** p<0.05, * p<0.1All regressions include district dummies for the 13 districts.
Notes: These regressions are subject to endogeneity issues and should be interpreted with caution. For instance there is likely omitted variable bias due to unobserved school characteristics. Further, there might be reverse causality bias, for example if performance contributes to the choice of which school is made a central versus fi lial school. Further analysis is needed to establish causal relationships.
The regressions show that there is a signifi cant association between performance as measured by this simple test and student and
67Appendix
teacher attendance. Further, schools that have math textbooks and less crowded classrooms appear to perform better. Having a strong parent teacher association is also associated with higher performance. It is surprising to note that those schools with a higher proportion of students with Tetum as mother tongue perform worse in this Tetum letter test. The same correlation holds when including further geographical fi xed eff ects, i.e. controlling for subdistricts.
Variables: Student Attendance : Attendance rate of students Teacher Attendance : Attendance rate of teachersPer Student Budget : Per Student Budget in 2011 as reported by school director Mothertongue Tetum : Proportion of students at school who report Tetum as their mothertongue% Volunteer Teachers : Share of teachers at the school that are volunteersTeacher educ. higher than secondary : Share of teachers at school with more than secondary educationPTA has large infl uence : 1 if Parent Teacher Association has large infl uence according to director, 0 otherwisePTA has some infl uence : 1 if PTA has some infl uence according to director, 0 otherwise

68 Building Evidence, Shaping PolicyFindings of the 2012 Timor-Leste Education Survey