Città Architettura Edilizia pubblica. Napoli e il Piano INA-Casa
Upload
khangminh22Category
view
0download
0
1
2020
2 3
01
02
0304
OVERVIEW 4Mission, vision and core values 6
INA Group at a glance 8
About INA Group integrated reporting 13
Letter from the President of the Management Board 14
Materiality and stakeholder engagement 16
Awards and Recognitions 20
CORPORATE GOVERNANCE 22Management Board 24
Council of Directors 26
Statement on the Corporate Governance Code 28
Quality management 33
OUR BUSINESSES 34Exploration and Production Overview 36
Refining and Marketing Overview 44
Consumer Services and Retail Overview 54
MANAGEMENT DISCUSSION AND ANALYSIS 62Overview of the macroeconomic and industry environment 64
Financial risk management 67
Climate-related financial disclosures 68
Summary of 2020 financial results 69
Branch and representative offices 77
CRISIS MANAGEMENT 7805
06
07
08
71
SUSTAINABILITY IN INA GROUP 86Sustainable development management in INA Group 88
Health and safety 90
Climate change 100
Environment 110
Human capital 118
Communities 126
Ethics and governance 128
Additional Sustainability data 136
Independent reviews 148
APPENDICES 152Glossary of terms and acronyms 154
Report on Payments to Governments 156
Information for shareholders 160
FINANCIAL STATEMENTS & INDEPENDENT AUDITOR’S REPORT 162
c o n t e n t
02 03
IMPRESSUM:INA-Industrija nafte, d.d. Avenija V. Holjevca 10, 10 020 Zagreb
PUBLISHED BY: INA-Industrija nafte, d.d., Controlling, SD&HSE
FOR THE PUBLISHER: Bálint Dervalics, Angelika Brnada
EDITOR-IN-CHIEF: Martina Jergović, Zrinka Belošić, Lidija Korošec, Sonja Tadić
PHOTOGRAPHY: INA’s archive
Design: Emil Čubretović
DTP: Stela Blažok

4 5
0
6 7
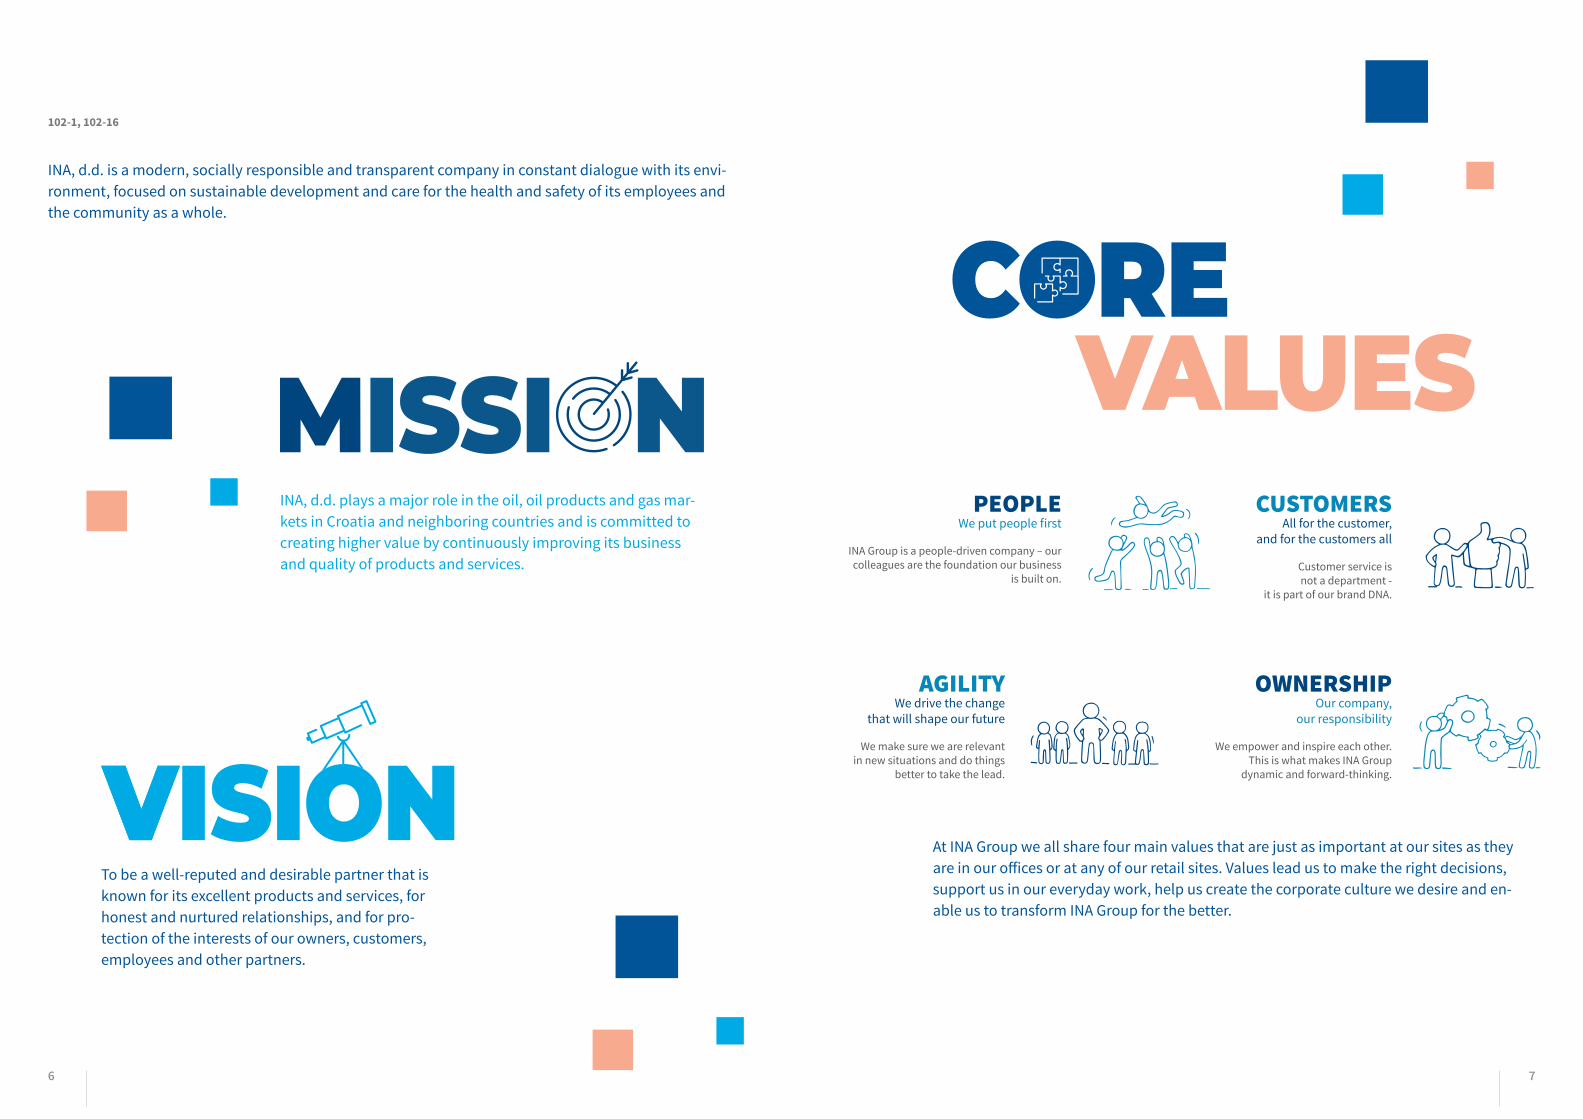
INA, d.d. is a modern, socially responsible and transparent company in constant dialogue with its envi-ronment, focused on sustainable development and care for the health and safety of its employees and the community as a whole.
PEOPLEWe put people first
INA Group is a people-driven company – our colleagues are the foundation our business
is built on.
OWNERSHIPOur company,
our responsibility
We empower and inspire each other. This is what makes INA Group
dynamic and forward-thinking.
CUSTOMERSAll for the customer,
and for the customers all
Customer service isnot a department -
it is part of our brand DNA.
AGILITYWe drive the change
that will shape our future
We make sure we are relevantin new situations and do things
better to take the lead.
At INA Group we all share four main values that are just as important at our sites as they are in our offices or at any of our retail sites. Values lead us to make the right decisions, support us in our everyday work, help us create the corporate culture we desire and en-able us to transform INA Group for the better.
INA, d.d. plays a major role in the oil, oil products and gas mar-kets in Croatia and neighboring countries and is committed to creating higher value by continuously improving its business and quality of products and services.
To be a well-reputed and desirable partner that is known for its excellent products and services, for honest and nurtured relationships, and for pro-tection of the interests of our owners, customers, employees and other partners.
102-1, 102-16
8 9
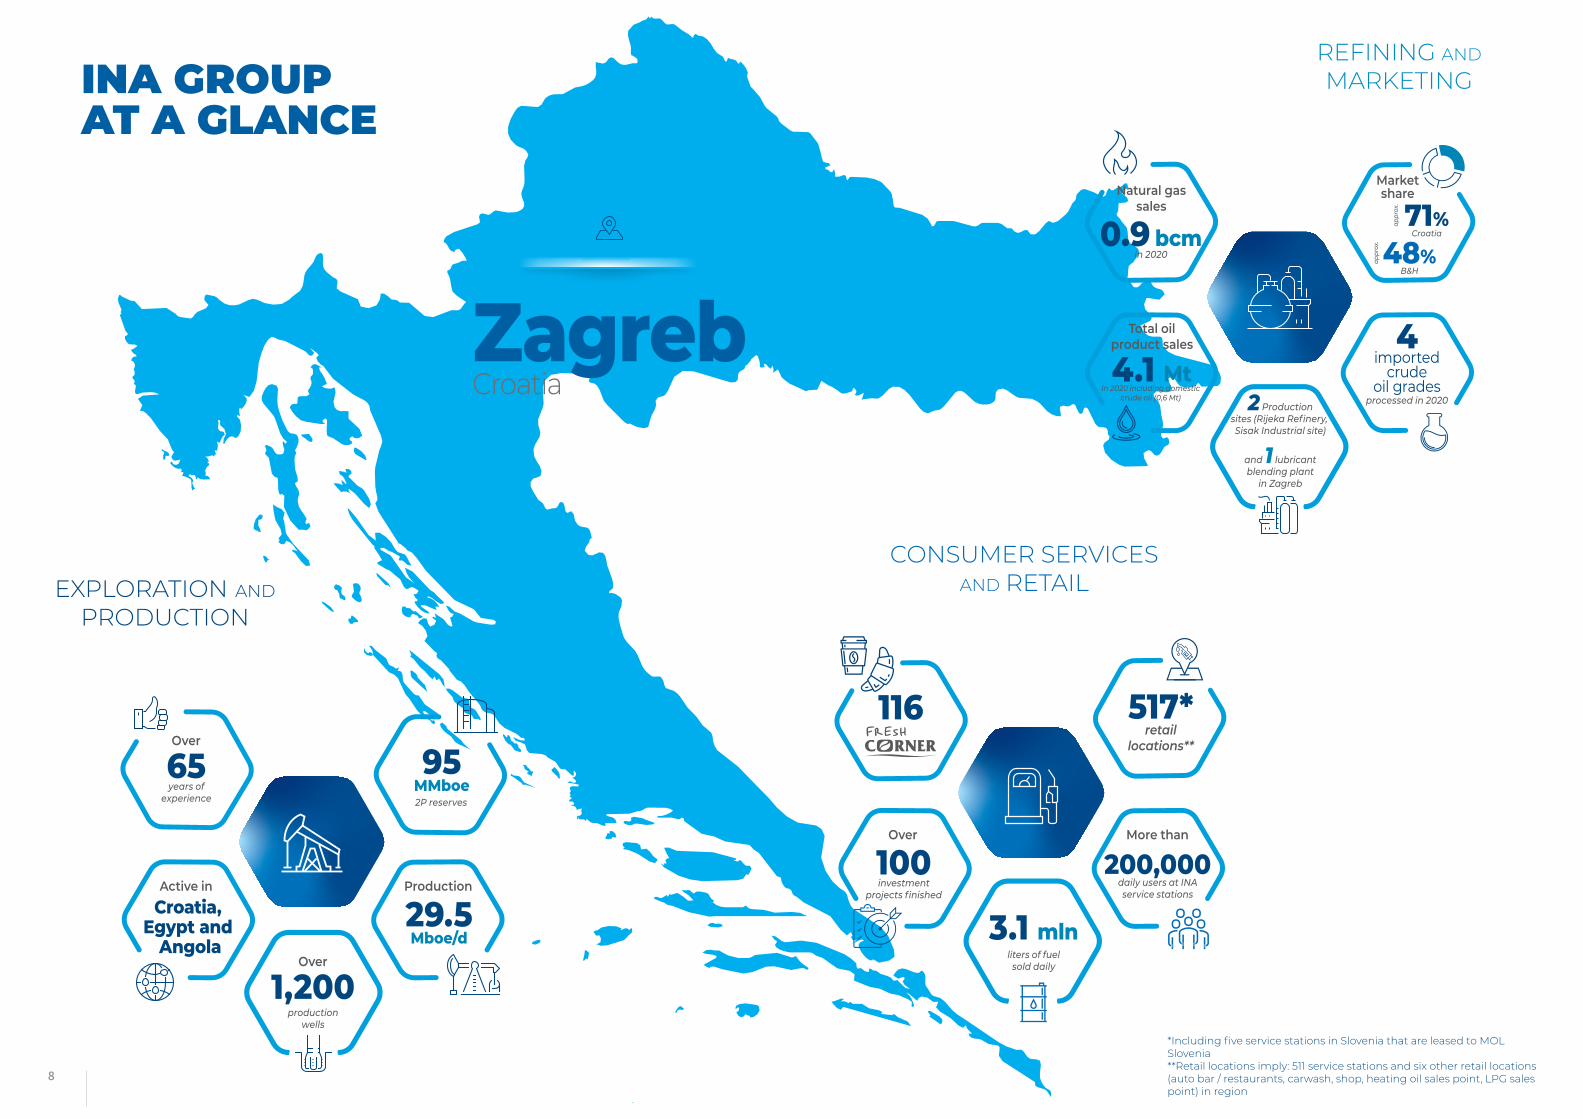
REFINING AND
MARKETINGINA GROUP AT A GLANCE
CONSUMER SERVICES AND RETAIL
headquarters
65years of
experience
Over
1,200production
wells
100investment
projects finished
Over
Croatia,Egypt and
Angola
Active in
517*retail
locations**
116
200,000daily users at INAservice stations
More than
Marketshare
4imported
crudeoil grades
processed in 2020
71%Croatia
48%B&H
EXPLORATION AND
PRODUCTION
Production
2P reserves
95MMboe
29.5Mboe/d 3.1 mln
liters of fuelsold daily
Over
*Including five service stations in Slovenia that are leased to MOL Slovenia**Retail locations imply: 511 service stations and six other retail locations (auto bar / restaurants, carwash, shop, heating oil sales point, LPG sales point) in region
4.1 Mtin 2020 including domestic
crude oil (0,6 Mt) 2 Productionsites (Rijeka Refinery, Sisak Industrial site)
and 1 lubricantblending plant
in Zagreb
Total oilproduct sales
0.9 bcmin 2020
Natural gas sales
ZagrebCroatia
10 11
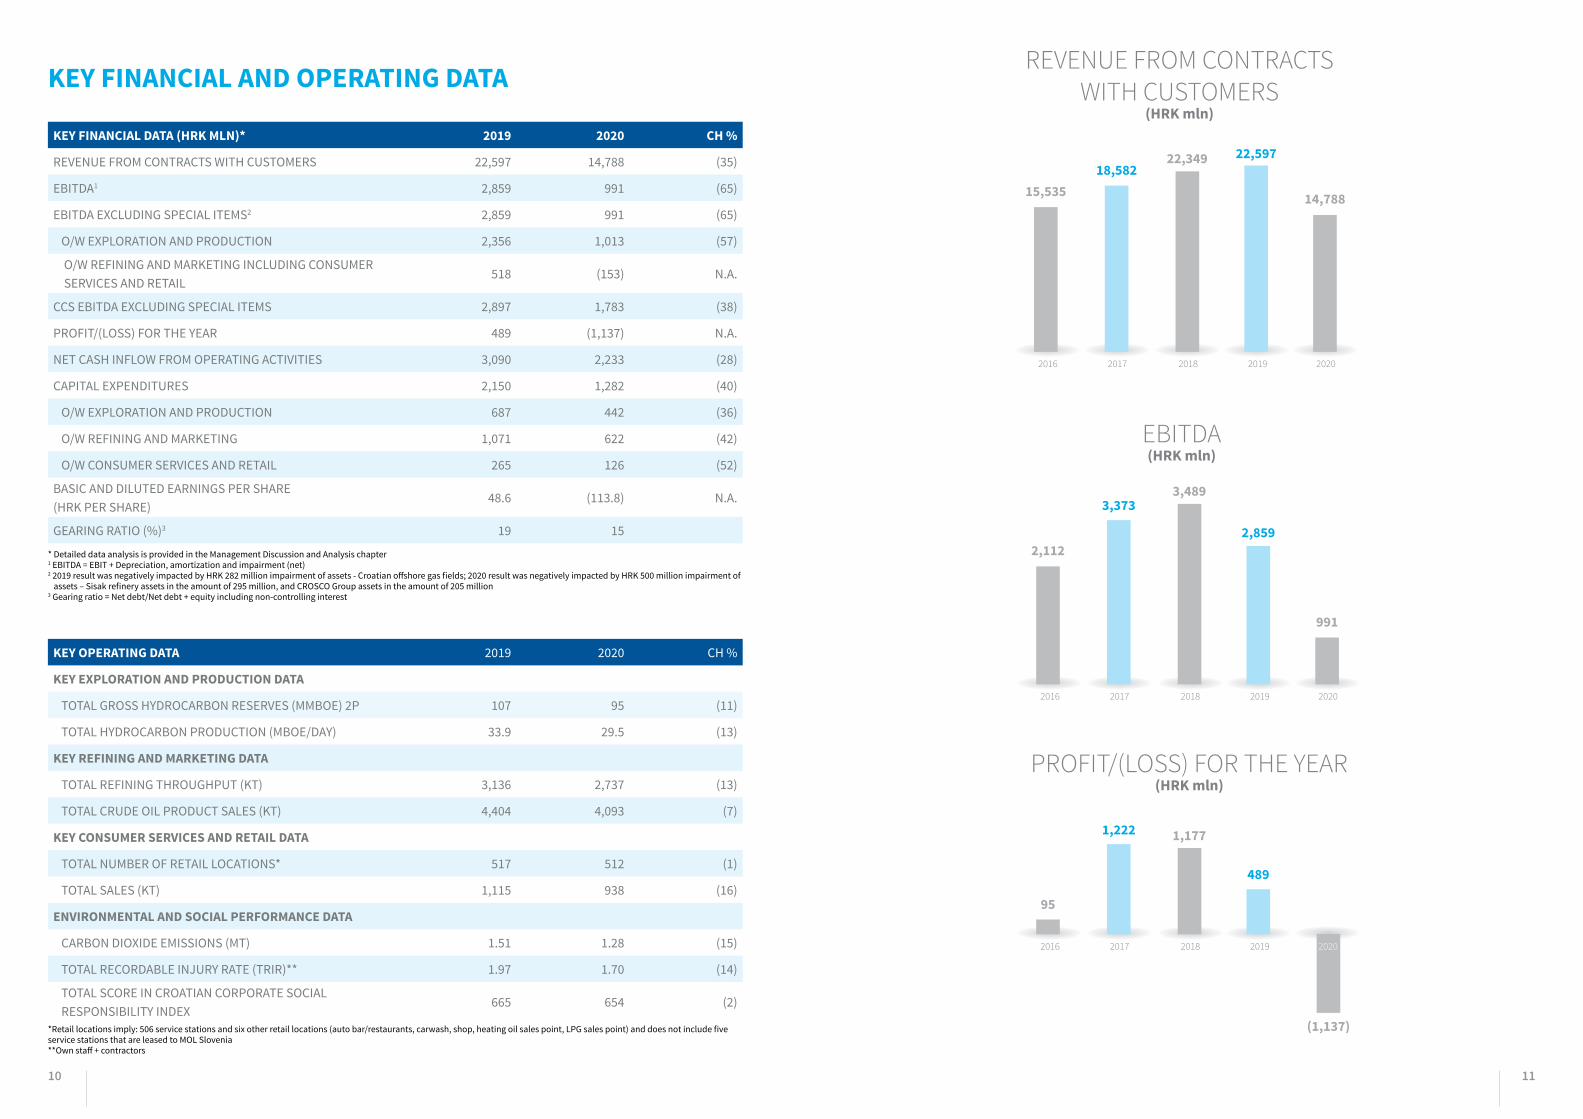
KEY FINANCIAL AND OPERATING DATA
KEY FINANCIAL DATA (HRK MLN)* 2019 2020 CH %
REVENUE FROM CONTRACTS WITH CUSTOMERS 22,597 14,788 (35)
EBITDA1 2,859 991 (65)
EBITDA EXCLUDING SPECIAL ITEMS2 2,859 991 (65)
O/W EXPLORATION AND PRODUCTION 2,356 1,013 (57)
O/W REFINING AND MARKETING INCLUDING CONSUMER SERVICES AND RETAIL
518 (153) N.A.
CCS EBITDA EXCLUDING SPECIAL ITEMS 2,897 1,783 (38)
PROFIT/(LOSS) FOR THE YEAR 489 (1,137) N.A.
NET CASH INFLOW FROM OPERATING ACTIVITIES 3,090 2,233 (28)
CAPITAL EXPENDITURES 2,150 1,282 (40)
O/W EXPLORATION AND PRODUCTION 687 442 (36)
O/W REFINING AND MARKETING 1,071 622 (42)
O/W CONSUMER SERVICES AND RETAIL 265 126 (52)
BASIC AND DILUTED EARNINGS PER SHARE (HRK PER SHARE)
48.6 (113.8) N.A.
GEARING RATIO (%)3 19 15
* Detailed data analysis is provided in the Management Discussion and Analysis chapter1 EBITDA = EBIT + Depreciation, amortization and impairment (net)2 2019 result was negatively impacted by HRK 282 million impairment of assets - Croatian offshore gas fields; 2020 result was negatively impacted by HRK 500 million impairment of assets – Sisak refinery assets in the amount of 295 million, and CROSCO Group assets in the amount of 205 million3 Gearing ratio = Net debt/Net debt + equity including non-controlling interest
KEY OPERATING DATA 2019 2020 CH %
KEY EXPLORATION AND PRODUCTION DATA
TOTAL GROSS HYDROCARBON RESERVES (MMBOE) 2P 107 95 (11)
TOTAL HYDROCARBON PRODUCTION (MBOE/DAY) 33.9 29.5 (13)
KEY REFINING AND MARKETING DATA
TOTAL REFINING THROUGHPUT (KT) 3,136 2,737 (13)
TOTAL CRUDE OIL PRODUCT SALES (KT) 4,404 4,093 (7)
KEY CONSUMER SERVICES AND RETAIL DATA
TOTAL NUMBER OF RETAIL LOCATIONS* 517 512 (1)
TOTAL SALES (KT) 1,115 938 (16)
ENVIRONMENTAL AND SOCIAL PERFORMANCE DATA
CARBON DIOXIDE EMISSIONS (MT) 1.51 1.28 (15)
TOTAL RECORDABLE INJURY RATE (TRIR)** 1.97 1.70 (14)
TOTAL SCORE IN CROATIAN CORPORATE SOCIAL RESPONSIBILITY INDEX
665 654 (2)
*Retail locations imply: 506 service stations and six other retail locations (auto bar/restaurants, carwash, shop, heating oil sales point, LPG sales point) and does not include five service stations that are leased to MOL Slovenia **Own staff + contractors
REVENUE FROM CONTRACTS WITH CUSTOMERS
(HRK mln)
EBITDA(HRK mln)
PROFIT/(LOSS) FOR THE YEAR(HRK mln)
2016 2017 2018 2019 2020
2016 2017 2018 2019 2020
2016 2017 2018 2019 2020
15,535
2,112
95
22,349
3,489
1,177
18,582
3,373
1,222
22,597
2,859
489
14,788
991
(1,137)
12 13
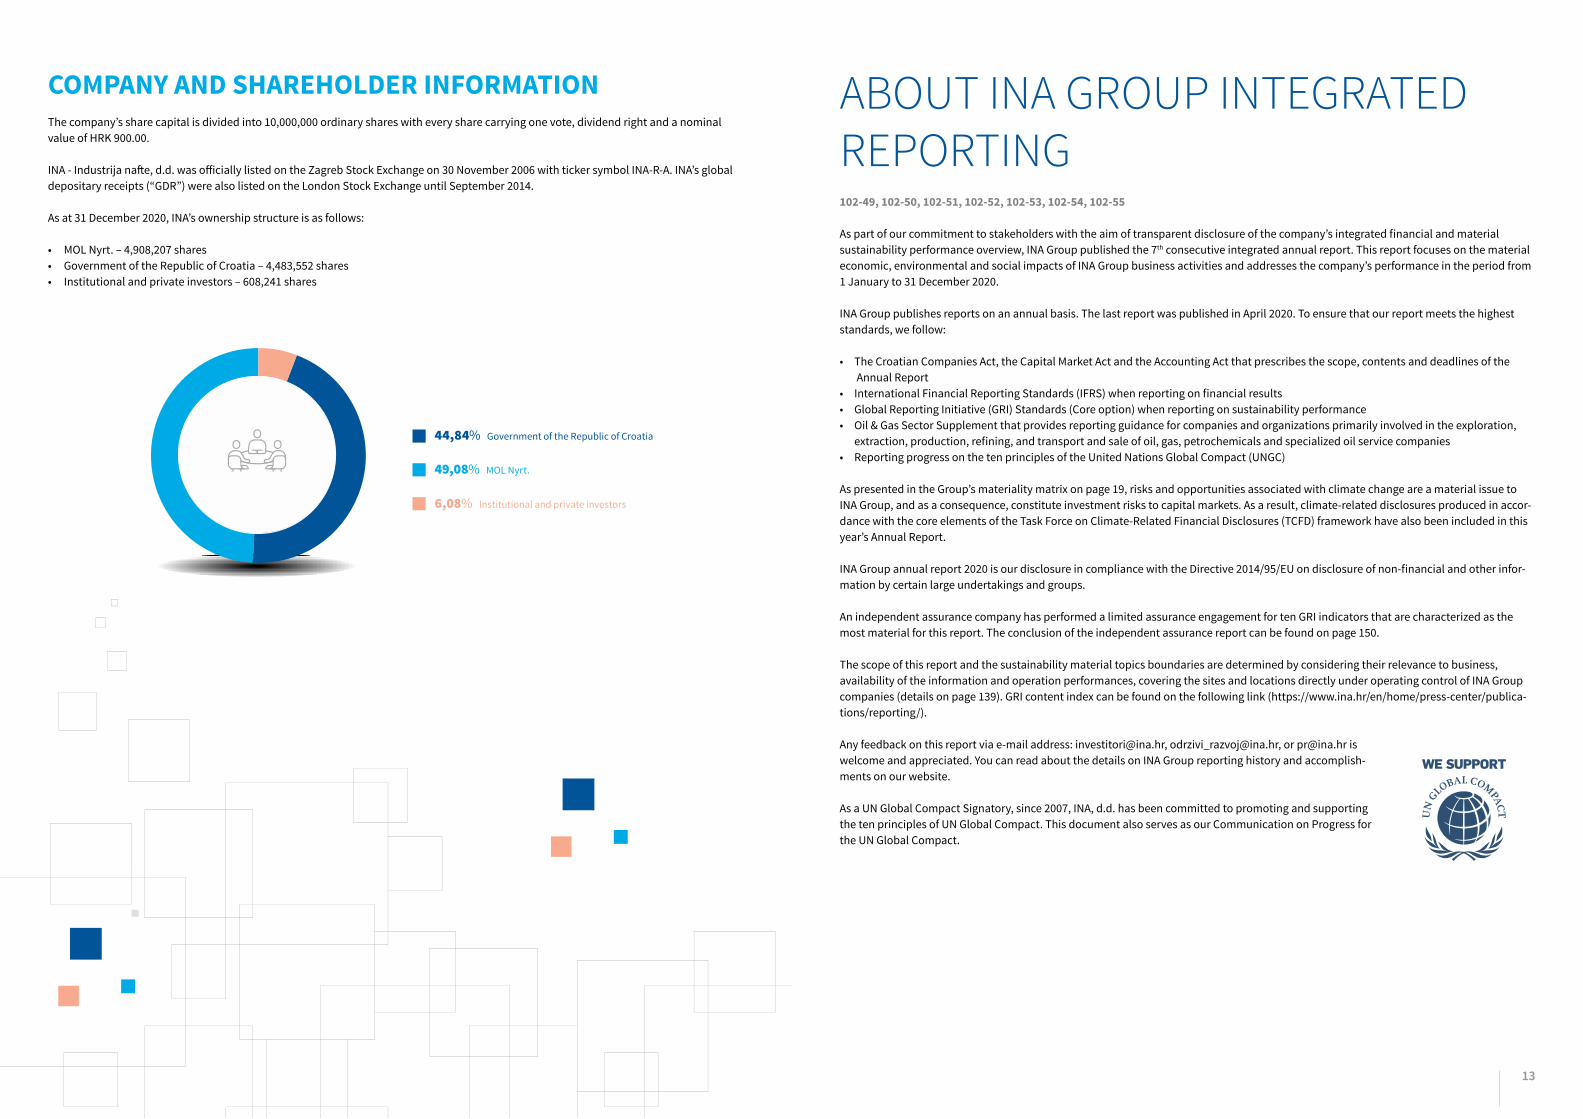
COMPANY AND SHAREHOLDER INFORMATION The company’s share capital is divided into 10,000,000 ordinary shares with every share carrying one vote, dividend right and a nominal value of HRK 900.00.
INA - Industrija nafte, d.d. was officially listed on the Zagreb Stock Exchange on 30 November 2006 with ticker symbol INA-R-A. INA’s global depositary receipts (“GDR”) were also listed on the London Stock Exchange until September 2014.
As at 31 December 2020, INA’s ownership structure is as follows:
• MOL Nyrt. – 4,908,207 shares• Government of the Republic of Croatia – 4,483,552 shares • Institutional and private investors – 608,241 shares
44,84% Government of the Republic of Croatia
49,08% MOL Nyrt.
6,08% Institutional and private investors
ABOUT INA GROUP INTEGRATED REPORTING102-49, 102-50, 102-51, 102-52, 102-53, 102-54, 102-55
As part of our commitment to stakeholders with the aim of transparent disclosure of the company’s integrated financial and material sustainability performance overview, INA Group published the 7th consecutive integrated annual report. This report focuses on the material economic, environmental and social impacts of INA Group business activities and addresses the company’s performance in the period from 1 January to 31 December 2020.
INA Group publishes reports on an annual basis. The last report was published in April 2020. To ensure that our report meets the highest standards, we follow:
• The Croatian Companies Act, the Capital Market Act and the Accounting Act that prescribes the scope, contents and deadlines of the Annual Report • International Financial Reporting Standards (IFRS) when reporting on financial results• Global Reporting Initiative (GRI) Standards (Core option) when reporting on sustainability performance• Oil & Gas Sector Supplement that provides reporting guidance for companies and organizations primarily involved in the exploration, extraction, production, refining, and transport and sale of oil, gas, petrochemicals and specialized oil service companies• Reporting progress on the ten principles of the United Nations Global Compact (UNGC) As presented in the Group’s materiality matrix on page 19, risks and opportunities associated with climate change are a material issue to INA Group, and as a consequence, constitute investment risks to capital markets. As a result, climate-related disclosures produced in accor-dance with the core elements of the Task Force on Climate-Related Financial Disclosures (TCFD) framework have also been included in this year’s Annual Report.
INA Group annual report 2020 is our disclosure in compliance with the Directive 2014/95/EU on disclosure of non-financial and other infor-mation by certain large undertakings and groups.
An independent assurance company has performed a limited assurance engagement for ten GRI indicators that are characterized as the most material for this report. The conclusion of the independent assurance report can be found on page 150.
The scope of this report and the sustainability material topics boundaries are determined by considering their relevance to business, availability of the information and operation performances, covering the sites and locations directly under operating control of INA Group companies (details on page 139). GRI content index can be found on the following link (https://www.ina.hr/en/home/press-center/publica-tions/reporting/).
Any feedback on this report via e-mail address: [email protected], [email protected], or [email protected] is welcome and appreciated. You can read about the details on INA Group reporting history and accomplish-ments on our website.
As a UN Global Compact Signatory, since 2007, INA, d.d. has been committed to promoting and supporting the ten principles of UN Global Compact. This document also serves as our Communication on Progress for the UN Global Compact.

14 15
The COVID-19 pandemic, resulting in a reduced demand and a sharp drop in hydrocarbon prices, marked the global economy in 2020, and oil and gas industry in particular. INA was not immune to this and adding to it all the cyber-attack on the company that happened in early February plus several strong earthquakes that hit the areas in which we operate in March and December, we might say this was one of the most challenging years in our history. All global energy companies, including INA, have adapted their business to the new circumstances. Our priority was to preserve the health and safety of our workers and customers, while providing uninterrupted market supply in order to continue key economic activities unimpeded. To ensure the company’s liquidity and business continuity, we introduced operational and financial measures. While we had to postpone some activi-ties, the Management Board remained committed to strategic projects such as those set out in our INA Downstream 2023 New Course program, which will ensure a sustainable future for the company.
Unfavorable external factors affected the company’s financial results, yet in 2020, INA Group managed to maintain a stable financial position and continue with strategic investments. Time-ly and targeted introduction of measures, which included the postponement of non-critical investments and internal optimiza-tion, ensured the sustainable operation of the company, as well as the future of our long-term strategic investments. Regardless of the situation, INA’s goal is to operate in a sustainable manner, to remain a financially strong company and successfully respond to the challenges that new energy sources, environmental issues and technological progress pose. Seeing how oil and gas will remain an important source of energy for some time to come, our goal is to upgrade our traditional activities with a modern value chain by entering into new business opportunities.
Therefore, as part of the INA Downstream 2023 New Course program adopted in late 2018, we concentrated oil refining in the Republic of Croatia in the Rijeka Refinery and, despite the declining Refining and Marketing results in 2020 and extremely low refinery margins, we continued to work on the construction of the residue upgrade unit worth about HRK 4 billion. Addition-ally, the propane propylene splitter unit, worth more than half a billion HRK, was put into operation in mid-2020. This unit allows the Rijeka Refinery to produce high-purity propylene used in the petrochemical industry, thus expanding our portfolio and raising the refinery’s competitiveness. We also continued to transform the Sisak site into sustainable alternatives that include bitumen production, a logistics hub, a solar power plant and a bio-com-ponent refinery (The Biorefinery project). The Biorefinery project is important for INA and the Republic of Croatia because all of its elements align with the European energy strategy, and it would allow INA to produce second-generation biofuels from biomass, along with the production of green energy. It is an investment worth about EUR 300 million and we are planning to apply to the EU Funds to cover a part of the required funding. Furthermore, in 2020, the Biorefinery met the formal criteria set by the Ministry of Economy and Sustainable Development, which officially included it in the List of Strategic Projects, and the Task Force lead was assigned to the project to facilitate the preparation for implementation.
The profitability of Exploration and Production has suffered a severe blow due to extremely low oil and gas prices, but we continue to invest and actively seek new business opportunities in the region and abroad. In 2020, we also signed hydrocarbon exploration and production sharing agreements with the Govern-ment of the Republic of Croatia for three new exploration areas. On the Drava-03 block we have already initiated 3D seismic sur-
veying of the area covering 600 km², which is the single largest seismic project ever carried out in Croatia. Our goal remains the same, which is to have a sustainable portfolio resilient to price changes in the long run.
The unpredictable 2020 also brought a historic turn in INA’s business results. Although the Exploration and Production has traditionally been the largest cash generator, due to extraor-dinary circumstances, Retail has taken over this role. We have accelerated the process of business digitalization in INA and introduced modern technological and IT solutions – both inter-nally and with regard to products and services we offer to our customers. We made it possible for INA card users to make con-tactless payments without having to enter retail premises via the INA PAY app. We also launched the INA Loyalty program, through which we provide customers with discounts, prizes, benefits and special promotions, and the entire program is accompanied by the INA Loyalty mobile app. Our goal is to remain the first choice for customers on the go and the market leader with a targeted range of gastronomy products and services, consumer goods and products for vehicles. In addition, we are working on fortifying our leading market position, market share and brand strength in Croatia, Bosnia and Herzegovina and Montenegro, while profit-ably expanding into new markets in Southeast Europe.
The implementation of planned projects, especially those within the INA Downstream 2023 New Course program, will enable us to convert losses into profits, which we will use to fund our transformation projects. The company is permanently focused on a balanced integration of economic, environmental and social factors in business, so in cooperation with the City of Zagreb we started working on the introduction of hydrogen in urban
transport – given that it is an environmentally friendly fuel – and on the development of the hydrogen market in the transport sector in Croatia. We have also launched a program for the de-velopment of solar power plants at existing industrial facilities, which especially applies to two projects – solar power plants in Sisak and Molve. There is also our start-up ANI through which we continuously monitor the development of dozens of young companies and look for the right ways to cooperate and improve business, in line with the new trends and challenges.
Transformation of the energy sector is inevitable and is happen-ing at the global level with the aim of achieving global sustain-ability goals. INA is also turning its business in the direction of sustainability, and it is on these settings that we have developed our strategic guidelines and simultaneously – with the aim of using the potential offered by our core business – defined directions for transformation into new business segments. Our business is focused on reducing harmful emissions, and when defining our business strategy and decision-making process, we also took into account the climate aspect and considered climate risks and opportunities, all in accordance with the recommenda-tions of the TCFD.
The whole year and the crises that have happened one after the other have once again proven that people are one of our greatest assets. The professional knowledge and agility of the experts working in INA, but also the commitment of the company in a challenging situation, played a significant role in ensuring business continuity and ultimately in the results we achieved. The situation on the market will not go back to pre-crisis levels for a while, but with the right team, I believe we will be better prepared to face what lies ahead.
LETTER FROM THE PRESIDENT OF THE MANAGEMENT BOARD
16 17
WHAT DO OUR CUSTOMERS SAY? Through a special survey we collected opinions from a representative sample of 210 customers at INA Group service stations in seven cities: Zagreb, Split, Osijek, Rijeka, Dubrovnik, Varaždin and Sisak, with an equal share of respondents.
We analyzed customer opinions and attitudes towards environmental and management aspects, in relation with local community and responsible approach to products and services. We did this by examining their assessments and opinion of the importance of INA Group business and impact in these areas on INA Group sustainability as well as their decisions to use INA Group products and services. Customers showed significant interest and sensitivity to the influence of INA Group in the management segment, with an average rating of the impor-tance of these topics of 3.5 (out of 5).
Average interest of customers is in the responsible operations of the INA Group in local communities and the protection of human rights (average score 3.3). Customers attach less importance to INA Group sustainable efforts in environmental issues (average score 3.1), of which they attribute greater impact to pollution and spill management, water and waste management, and it is interesting that they link their assessments and decisions the least to climate change and energy efficiency issues.
According to customers, INA Group is especially recognized in the quality of customer relations, high environmental protection measures, development of new products and services and investment in communities.
STAKEHOLDER OPINIONS ON THE IMPORTANCE AND MANAGEMENT OF MATERIAL TOPICS In the online questionnaire which we used to analyze the opinions of relevant stakeholders, 44 representatives of various stakeholder groups participated.
As the six most important material topics for the INA Group the following stood out: health and safety, energy efficiency and climate change, environmental spills, waste management, research and development of responsible products and services, human capital. This confirms the stability of the stakeholder assessment compared to the previous reporting period. In addition to assessing the importance and impact on operations, stakeholders also assessed the management performance of INA Group in certain material areas.
Looking towards the future, we can assume that material topics that stakeholders recognize as important will continue to be dominant, but with growing importance of some topics.
MATERIALITY AND STAKEHOLDER ENGAGEMENT 102-40, 102-43, 102-43, 102-44, 102-46, 102-47, 102-49, 413-1
2020 was a year of extraordinary situations and changes that in many ways affected the operations of INA Group business. To better under-stand the opinions, attitudes and priorities of our stakeholders, we deepened our approach to them and to the material topics, and during the year we conducted comprehensive analysis and mapping of stakeholders, made an in-depth review of topics of interest and influence of INA Group and analyzed the areas for improvement. In the process of in-depth analysis of our relations with stakeholders, key INA, d.d. business segments and functions participated, a large customer survey at service stations was conducted, as well as online questionnaire among various intreasted groups. We consulted stakeholders on INA Group material topics through an open panel discussion in an online format called “Open about the sustainability of the INA Group”.
With a multidimensional approach, we gained a comprehensive insight into INA Group material topics, set a quality framework for creating a materiality matrix and determining boundaries of aspects for reporting and processing individual areas in non-financial reporting. Even though the ways in which we operate, work and live have changed significantly in 2020, emphasis on material topics and stakeholders’ pri-orities in areas where INA Group has an impact on stakeholders remained largely the same. Compared to the previous two reporting cycles, this proves that INA Group adequately connects its material topics and areas of influence with the business goals and sustainability goals of the Group and successfully integrates them into business and development strategies. Dialog about material topics, goals and the success of the implementation of sustainable business in INA Group helps us steer in the right direction, adjust the strategies, goals and practices, as well introduce improvements in various material areas.
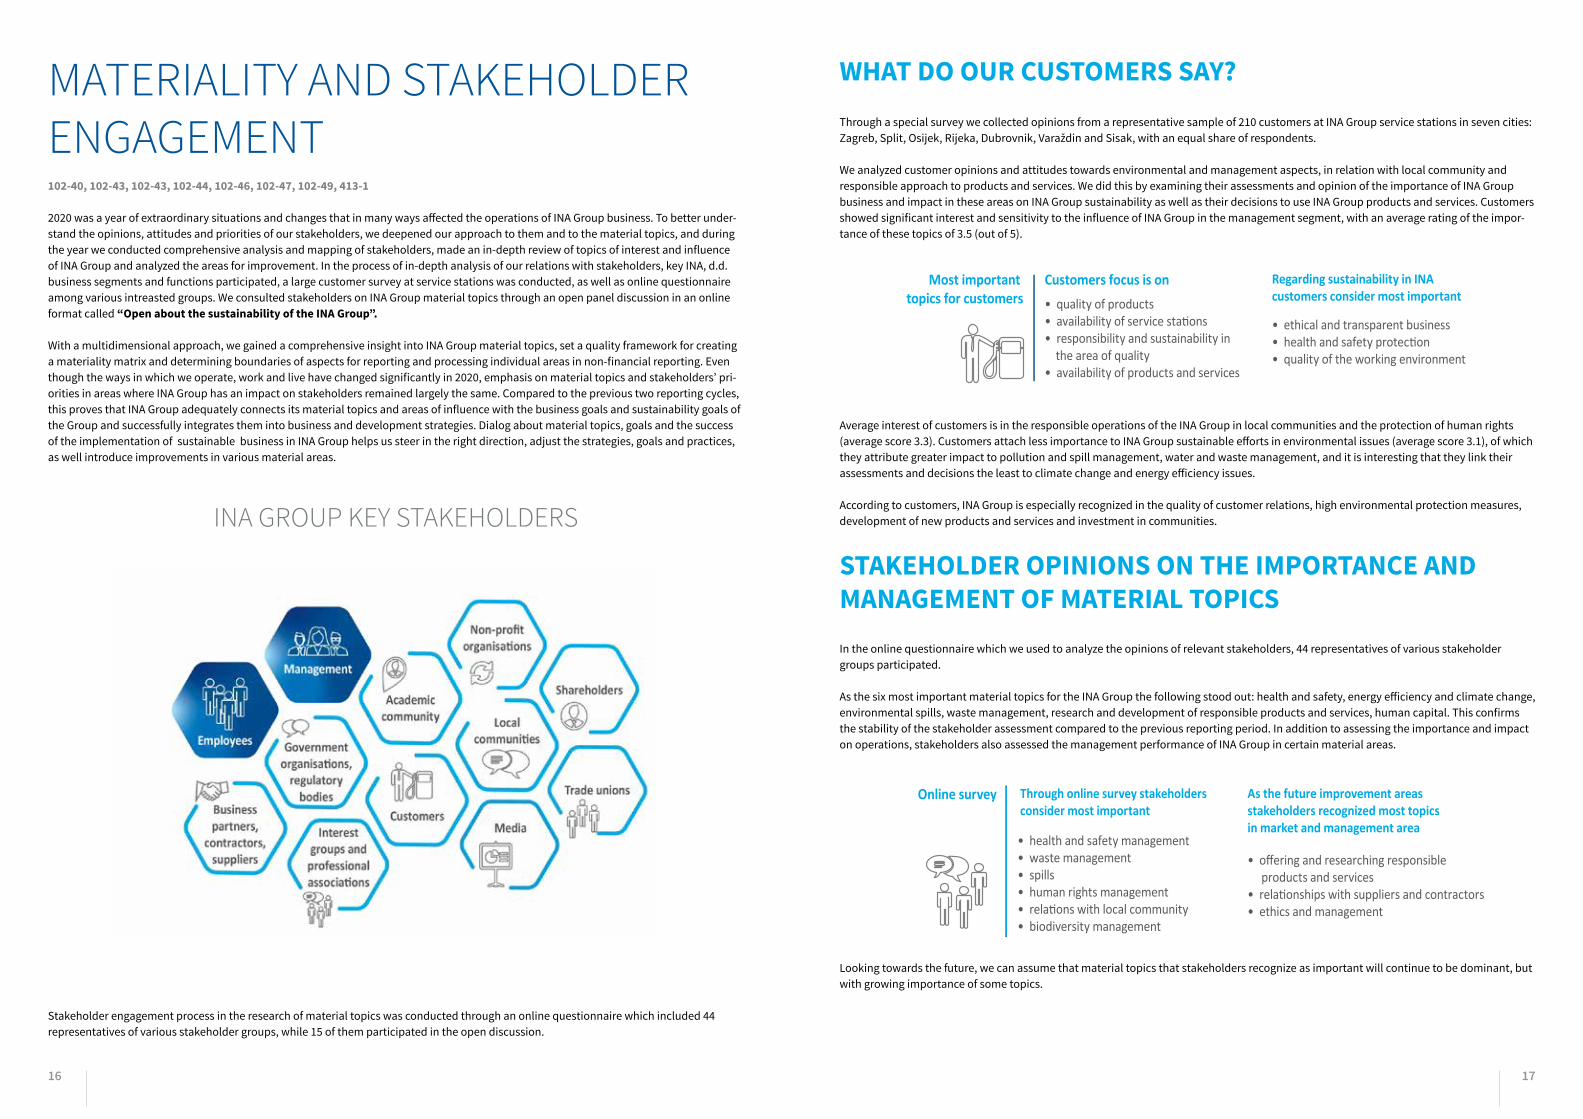
INA GROUP KEY STAKEHOLDERS
Stakeholder engagement process in the research of material topics was conducted through an online questionnaire which included 44 representatives of various stakeholder groups, while 15 of them participated in the open discussion.
Most important topics for customers
Customers focus is on Regarding sustainability in INA customers consider most important
• ethical and transparent business• health and safety protection • quality of the working environment
• quality of products • availability of service stations• responsibility and sustainability in the area of quality• availability of products and services
Online survey Through online survey stakeholders consider most important
As the future improvement areas stakeholders recognized most topics in market and management area
• offering and researching responsible products and services • relationships with suppliers and contractors • ethics and management
• health and safety management • waste management • spills • human rights management • relations with local community • biodiversity management
recognize health and safety as a topic that will significantly impact development
75%believe that the most important topic for Croatia and the world by 2030 will be climate change management and energy efficiency
recognize the growing importance in matters of technological development and research of sustainable energy products and services as well as sustainable use of resources and waste management
50over
% 30over
%stakeholders stakeholders stakeholders

18 19
These insights are similar to those we collected in the customer survey, who attach slightly more importance to the topic of health and safe-ty, but also recognize the growing concern for the impact of climate change, energy efficiency and human rights issues.
In the context of overall development of sustainability and responsible business, as many as 80% of stakeholders recognize INA Group pos-itive practices in the implementation of environmental protection measures. More than 50% of stakeholders believe that INA Group stands out in positive practices in cooperation with local communities in which it operates as well as invests.
Stakeholders recognize the importance of non-financial reporting, and most of the stakeholders have read the INA Group Annual Report.
In the analysis of material topics with internal stakeholders (managers involved), it was determined that there will be modifications, i.e. refinement of material topics for the next reporting period, as well as redefining of some key areas. Representatives of individual INA Group business segments and functions, as a rule, assess relations with stakeholders as high-quality, meaningful, open and cooperative, but also recognize the possibility of applying new models of cooperation in order to combine positive influences. Stakeholder analysis and mapping opened up some new opportunities for collaboration and improving relationships with stakeholders.
STAKEHOLDER CONSULTATION:OPEN ABOUT SUSTAINABILITY Special stakeholder consultation in the format of an online panel discussion named “Open about the sustainability of the INA Group” was held, in which 15 representatives of various stakeholder groups participated.
In the discussion, stakeholders focused on all segments of sustainability and social responsibility and discussed topics in areas where they specifically monitor operations of INA Group or in which INA Group has an impact. The consultation was held in a collaborative atmosphere, and stakeholders spoke openly about the challenges and their views on sustainable development and the responsibility of INA Group.
Stakeholders believe that INA Group recognized the need for an energy transition and that projects aimed at reducing emissions are being developed. In terms of strategic planning and reporting, stakeholders expect clear goals, risk assessments and descriptions of the impact of INA Group business on climate change. Topics that are becoming increasingly important are biodiversity and natural capital management.
Most important topics for customers
Customers focus is on Regarding sustainability in INA customers consider most important
• ethical and transparent business• health and safety protection • quality of the working environment
• quality of products • availability of service stations• responsibility and sustainability in the area of quality• availability of products and services
Online survey Through online survey stakeholders consider most important
As the future improvement areas stakeholders recognized most topics in market and management area
• offering and researching responsible products and services • relationships with suppliers and contractors • ethics and management
• health and safety management • waste management • spills • human rights management • relations with local community • biodiversity management
recognize health and safety as a topic that will significantly impact development
75%believe that the most important topic for Croatia and the world by 2030 will be climate change management and energy efficiency
recognize the growing importance in matters of technological development and research of sustainable energy products and services as well as sustainable use of resources and waste management
50over
% 30over
%stakeholders stakeholders stakeholders
As the future improvement areas stakeholders recognized most topics in market and management area
consider INA Group Annual report to be of high quality, comprehensive and relevant
96%think that Annual report is of exceptional quality, and they especially praise the comprehensiveness of non-financial disclosures, especially those related to sustainable development, environmental impact, and management
50over
%
In the environmental issues segment, stakeholders emphasize the importance of management and solution development in response to climate change.
Energy sector is expecting major changes, including a stronger focus on low-carbon development, which is a great challenge but also an opportunity for INA Group.
“
stakeholdersstakeholders
A special challenge lies in the development of electromobility and its impact on INA Group business development and plans. They believe that fossil fuels should be openly discussed, not only in the context of climate change, but also as the healthier habits of citizens.
In management topics, stakeholders especially recognize INA Group advanced practices in the field of health and safety of employees, but also other stakeholders. It is important for stakeholders to have an insight into how INA Group initiates competitiveness through socially responsible initiatives and how it includes its own innovation capital.
Some stakeholders point out the positive practices and advanced INA Group initiatives in good work environment practices and that the company recognizes the importance of employees as its key capital. The readiness of INA Group to introduce telecommuting in 2020 was recognized, as it previously had trial practices of this type of work for those employees where it was possible. Stakeholders believe that INA Group is one of the leaders in this field, but also that it has the potential for further flexibility and digitalization of business. INA Group actively cares about the health and well-being of employees, including through the developed platform for a better life balance, which the stakeholders consider to be a positive potential of the company.
Stakeholders recognize multiple influences of INA Group in the community - as a major employer throughout the country, in cooperation with the non-profit sector and in terms of its significant investments in community projects. Stakeholders from the non-profit sector see even greater potential of INA Group as a source of education, inspiration and motivation for young people and other stakeholders in the community in various topics, especially in environmental protection. In the field of human rights, INA Group has significant and diverse influences, according to stakeholders. Human rights protection includes a good understanding of labor rights, but also other rights and responsible behavior. Protection against discrimination is important in companies of great social influence, both in internal relations and in relations with external stakeholders. As an economically significant company with great influence in its supply chain, INA Group has a special responsibility for managing this material topic.
During the discussion with stakeholders, many stated that the format of including stakeholder opinions in discussions on material topics is extremely useful. They expressed satisfaction, because open talks encourage cooperation, and during the discussion new incentives and proposals for multi-stakeholder cooperation and useful topics in which INA Group can be a leader were proposed.
MATERIALITY MATRIX Stakeholder engagement processes, surveys and stakeholder consultation helped us in compiling a matrix of material topics. Materiality matrix reflects goals and programs of sustainable development and compares levels of impact on business with the importance for external stakeholders and their expectations.
As the most important material topics in 2020 are recognized: occupational health and safety, energy efficiency and climate change, spills into the environment, waste management and research and development of future responsible products and services.
INA GROUP MATERIALITY MATRIX
Human capital
Spills into the environment
Occupational health and safety
Energy efficiency and climate change
Waste management
Research and development of future responsible products and services
Human rights
Ethics and governance
Supplier and contractor management
Biodiversity
Process safety management and crisis
managementProvision of responsible products and services
Community relationship
Production and water management
Customer, services
Significance of economic, environmental and social impacts
High importanceLow importance
Economic and financial aspectsMarket aspectsEnvironment aspectsSocial aspects
20 21
GOLDEN BALANCE AWARD INA, d.d. received an award for the largest entrepreneur by total revenue in 2019. The Golden Balance is an award given by the Financial Agency to the most successful entrepreneurs in a particular industry, according to the overall ranking derived by measuring 11 financial indicators in five categories: profitability, liquidity, indebtedness, activity and economy.
INOVA 2020 INTERNA-TIONAL INNOVATION EXHIBITION AWARDS At the International Innovation Exhibition, INA Group won seven awards. Gold medal was awarded to the following innovation proposals: Company’s own apparatus and development of a modified method for testing accelerated corrosivity of steel; Simultaneous receipt and dispatch of products at the Osijek terminal; INA DEZINOL AQUA - water-based disinfectant. Silver medal was awarded to: Computer tool for retail network organi-zation; Body Bushing ĐĐ – BG 900 x DELTA 7. Bronze medal was awarded to: Innovation of cost rationalization with the change of the unit of account day; Independent production of sanitary water - increasing business efficiency.
EXCELLENCE DURING CHALLENGES In 2020 INA, d.d., STSI d.o.o., CROSCO d.o.o., PLAVI TIM d.o.o., TOP RAČUNOVODSTVO SERVISI d.o.o., INA MAZIVA d.o.o. and INA MALOPRODAJNI SERVISI d.o.o. received an acknowledgement for quality employee management during unforeseen circumstanc-es. This project offers organizations the opportunity to evaluate their HR management practices in the following areas: Agile HR, Strategic Planning and Work Organization, Crisis Commu-nication, Physical Health and Safety of Employees, Employee Empowerment and Well-being, Leadership in Times of Crisis and Technological and Digital Readiness.
EMPLOYER PARTNER CERTIFICATE For the 10th time, INA, d.d. was presented with the Employer Partner Certificate, an award for excellence in human resourc-es management. The certificate aims to draw attention and offer recognition to companies that have high-quality human resources management and that implement standards proven to advance business results and quality of labor. In this year’s certification process, INA, d.d. has earned an impressive score of 100%, thus ranking first among the TOP 5 Employer Partners as the top most desirable employer in Croatia. Several other INA Group companies also received a certificate: INA MALO-PRODAJNI SERVISI d.o.o. for the 2nd time; CROSCO d.o.o., STSI d.o.o., PLAVI TIM d.o.o., TOP RAČUNOVODSTVO SERVISI d.o.o., and INA MAZIVA d.o.o. for the 3rd time.
FIRST CHOICE EMPLOYER In the last 11 years INA, d.d. was ranked a TOP 10 Employer in Croatia ten times. The First Choice Employer Survey is a tradi-tional survey conducted by MojPosao portal for the past 13 years. The aim of the research is to find out which employers in the Cro-atian labor market are the most attractive to the general public. Each year, independent respondents create a list of employers they would like to work for the most and explain why these em-ployers deserve to be on their most wanted lists.
CROATIA’S BEST EMPLOYER BRAND AWARDS For the 2nd year in a row, INA, d.d. received the Croatia’s Best Employer Brand Award for the best EB brand in the technology sector. The award is a testament to the quality of the activities we carry out to improve our current and future employees’ work experience and job satisfaction and show that we understand the importance and accept responsibility for the satisfaction of our employees. To receive this award means to increase the organi-zation’s visibility in the job market and to further rise above the competition.
MAMFORCEAccording to the MAMFORCE method, INA, d.d. stood out as the best employer, receiving two special recognitions in two catego-ries: best company for women and best company for well-being. INA is the 1st company in Croatia to introduce a comprehensive well-being program through the beneFIT platform, providing benefits to every employee in accordance with their needs in life. For many years, women in INA have been provided with the same employment and career opportunities as their male colleagues, which is confirmed by transparent indicators on the participation of women at all management levels. INA is committed to ensur-ing the quality of the work experience, development of corporate culture and the principles of diversity and inclusion.
DADFORCE STANDARD In addition to the MAMFORCE standard, INA, d.d. has become the holder of the DADFORCE standard in 2020. This certificate is awarded to companies with outstandingly high awareness of the importance of active involvement of fathers in child care and is awarded by the company Spona Code. It testifies to an organizational culture that enables flexible work arrangements, responsible child care, and a father-friendly workplace. Further-more, it encourages equality for working parents and promotion based on merit, as well as a positive perception of parental and paternity leave usage.
OPEN SPOTLIGHT AWARD INA, d.d. received a golden award in the category “We see you here”. The OPEN Spotlight Award is for those organizations that have gone through an inspiring journey working towards better diversity and inclusion. INA Group is a driver of substantial changes in ensuring work-life balance for fathers within the com-pany, but also in the entire community. Creating organizational environment for fathers where they can develop relationship with their families is extremely important within the company.
GOLDEN INDEX In 2020, INA, d.d. received its 5th Golden Index in the “Schol-arships” category. The aim of the Golden Index is to reward companies which contributed to better student life, education and professional development of students. Companies are rated by students themselves, and the goal of the project is to establish a closer cooperation between students and companies, which should contribute to the development of professional competen-cies and relations. Golden Index is organized by eSTUDENT, one of the most active student organizations in Croatia.
LEARNING TECHNOLOGIES ONLINE AWARDS INA, d.d. has won the prestigious award for the best internation-al implementation of the eSMILE learning platform. Successful implementation of this program across the entire MOL Group was proclaimed the best project at the Learning Technologies Online Awards Ceremony. Communication with colleagues at retail locations via the platform eSMILE is an important step forward in digitalization of learning at INA.
AWARDS AND RECOGNITIONS

22 23
020

24 25
SÁNDOR FASIMON - President of the Management Board DARKO MARKOTIĆ - member of the Management Board
NIKO DALIĆ - member of the Management Board
ZSOLT PETHŐ - member of the Management Board
BARBARA DORIĆ, PHD - member of the Management Board
Mr. Fasimon was appointed President of INA Management Board on 1 July 2018. From 1991, he held various leadership positions in the oil and gas trading company Mineralimpex. Between 1996 and 1997, he served as the Head of the Hungarian Commercial Section in Tripoli, Libya. Mr. Fasimon joined MOL in 1998 when he was appointed Supply Director in the field of crude oil and crude oil products. In 2002, he became the CEO of Moltrade - Mineralimpex. A year later, he was appointed Managing Director of the Natural Gas Division. Between 2006 and 2009, he was the Chief Executive Officer of MOL’s Russia Office, after which he continued his career as the Senior Vice President of Supply & Trading. In 2011, he became the Managing Director of the Exploration and Production Division and he served as the Chief Operating Officer of MOL Hungary from 2012. On 15 October 2018 he was appointed to the function of the President of Supervisory Board of Petrokemija d.d. Kutina. Mr. Fasimon is also a Vice President of the Hungarian Chamber of Commerce and Trade.
Sándor Fasimon graduated from the Moscow State Institute of International Relations (IMO) with an economics degree in 1990. Between 1990 and 1991, he attended postgraduate studies at the University of Cairo, where he studied Arabic.
Mr. Markotić was appointed member of INA Management Board in April 2020. He has been working at INA since 2000, having held different positions in the company’s various organizational units. At the very beginning of his career at INA, d.d., he worked in the Legal Sector. In June 2002, he assumed the position of Business Secretary in the Office of the Management Board member in charge of the coordination of the privatization of INA, d.d., and in 2005 he was appointed Company Secretary, a position that he held for three years. He was appointed member of the INA Management Board in 2008; after a year at that position, he was appointed Executive director of BF Corporate Services. He assumed the position of Executive Director of Retail in October 2010, while in July 2017 he was appointed to the position of Operating Director of Consumer Services and Retail. Since July 2019, Mr. Markotić has been an advisor to the President of the INA Management Board.
Darko Markotić graduated in 1998 from the Faculty of Law at the University of Zagreb.
Mr. Dalić was appointed member of INA Management Board in February 2011. He started his career in 1986 as a geologist working on upstream projects in Croatia. In 1996, he was appointed Head of the business unit responsible for Eastern Slavonia and Podravina. From 2005 to 2008, he was the Assis-tant Executive Director of Naftaplin, where he was in charge of running international projects. Apart from that, he was also the Head of the strategy team in Naftaplin and the team for Energy Strategy of the Republic of Croatia, as well as the IPO team. After that, from 2008 to 2009, he was the Head of the Exploration Sector. As of June 2009, he has been serving as a member of the Management Board of ED-INA d.o.o., a joint venture of INA, d.d. and Italian company Edison, where he has focused on the activities in the Izabela field in Northern Adriatic.
Niko Dalić graduated from the Faculty of Science at Zagreb University, where he later acquired his master’s degree. He passed his state license exam at the Ministry of Science in 1996. Mr. Dalić attended a number of seminars and professional trainings in Croatia and abroad. He is a member of numerous professional associations and has published several papers. From 2005 to 2009, he was the President of the Croatian Geological Society. From December 2014 to October 2018, Mr. Dalić served as the Vice President for Geology in HUNIG (Croatian Association of Petroleum Engineers and Geologists).
Mr. Pethő was appointed member of INA Management Board on 1 July 2018. Mr. Pethő joined MOL in 1998 and has since held several senior managerial roles within the Downstream business. He worked as the LPG (propane-butane) Product Director, Fuel Products Director and as Sales Director, before being ap-pointed Commercial Director of Refining and Marketing in 2006. He was appointed Senior Vice President of MOL Group Petrochemical Division and CEO of TVK Plc. in 2011. In 2012, he became the head of MOL Hungary’s Downstream operations. In 2016, he was appointed Senior Vice President for the Group Sup-ply, Trading & Optimization organization and he has been serving as the Senior Vice President for Down-stream Commerce & Optimization in MOL Group since the organization’s establishment in May 2017.
Zsolt Pethő graduated from the Donát Bánki Faculty of Mechanical and Safety Engineering in Budapest. He also acquired an Advanced Certificate in Marketing from the Marketing Academy of Budapest in 1997.
Ms. Dorić, PhD was appointed member of INA Management Board in April 2020 after she previously held the position of Managing Director of LNG Croatia. She has more than 12 years of experience in manag-ing projects and companies in the energy sector. From February 2014 to April 2018, she served as the President of the Management Board of the Croatian Hydrocarbon Agency, where she was in charge of monitoring and supervision of all oil and gas exploration and production activities in Croatia, including the mandatory reserves of crude oil and petroleum products. She started her business career at Dal-macijacement, where she worked in sales and operations. During her MBA program, she started to work for an American consulting company A. T. Kearney, where she gained extensive experience working on projects focused on the organization and transformation of various industries in the Southeastern Eu-rope with the focus on energy and telecommunications industries. She was in charge of energy projects at the Centre for Monitoring Business Activities in the Energy Sector and Investments.
Barbara Dorić graduated from the Faculty of Economics in Vienna, completed an MBA program and ob-tained a PhD from the University of Ljubljana with a thesis on management in the oil and gas industry.
Mr. Székely, PhD was appointed member of INA Management Board on 1 July 2018 and member of Slovnaft Supervisory Board in April 2019. Dr. Székely started his career at Budapest Waterworks, and in 2003, he became the Controlling Manager for the company Provident. In 2007, he started working at E.ON Hungary as Group Controlling Manager. Dr. Székely joined MOL Group in 2013 as a subsidiary CFO, working in Hungary, Slovakia and France, and from May 2015, he served as the CFO of MOL Hun-gary. Dr. Székely was appointed Chief Financial Officer in INA, d.d. in February 2016, and in November 2017, he returned to his previous position in MOL Hungary. Dr. Székely has been serving as the Senior Vice President for Financial Planning and Reporting in MOL Group since February 2018.
Dr. Ákos Székely graduated from the Faculty of Management and Business Administration at the Bu-dapest University of Economic Sciences in 1999. He also holds a PhD in Business Administration and Management.
MANAGEMENT BOARD102-18
At the meeting of the INA, d.d. Supervisory Board held on 31 March 2020, new members of the company Management Board were appointed at the proposal of the Government of the Republic of Croatia. New members of the INA Management Board are Barbara Dorić, Darko Markotić and Niko Dalić. They were appointed for a five-year term, starting from 1 April 2020. Other members of INA Management Board are the President of the Management Board Sándor Fasimon, as well as members Ákos Székely and Zsolt Pethő.
A meeting of INA Supervisory Board was held on 29 January 2021 to appoint new members of the company Management Board. New members of the INA Management Board are Ferenc Horváth and József Simola. They were appointed starting from 1 February 2021, until 31 March 2024. The terms of office of the President of INA Management Board Sándor Fasimon has also been extended until 31 March 2024. In addition to the newly appointed members, other members of INA Management Board are Niko Dalić, Barbara Dorić and Darko Markotić.
ÁKOS SZÉKELY, PHD - member of the Management Board
26 27
VLATKO DUJANIĆ - Operating Director of Consumer Services and Retail GORAN PAVLOVIĆ - Operating Director of Industrial Services
GÁBOR HORVÁTH - Chief Financial Officer TVRTKO PERKOVIĆ - Operating Director of Exploration and Production
STJEPAN NIKOLIĆ - Operating Director of Refining and Marketing
Mr. Dujanić was appointed Operating Director of Consumer Services and Retail on 1 July 2019. He joined INA, d.d. in October 2018 as the Director of Retail. From November 2014 and till joining INA, d.d. he held the position of Group VP Retail Sales and Marketing in MOL in Budapest. Mr. Dujanić began his career in The Gillette Company in 1997. Over the following 14 years, he worked in various marketing and commer-cial positions with The Gillette Company and later Procter and Gamble in Central Europe and UK includ-ing the position of Marketing Director for CEE and the Regional Sales Director position for CEEMEA.
Vlatko Dujanić graduated from Rijeka Faculty of Economics and completed MBA in Marketing and Man-agement at the San Diego State University.
Mr. Pavlović was appointed to the position of Industrial Services Operating Director on 1 May 2019. Mr. Pavlović comes from the position of Information Services Director that he held from the time he joined INA, d.d. in 2008. From 2015, he was also appointed as PLAVI TIM d.o.o. Director and became TOP RAČUNOVODSTVO SERVISI d.o.o. Director in 2017. Goran Pavlović joined INA in 2008 from Zagrebačka banka where he held various managerial positions. He started his career in 1994 and in 1997 became the IT Subsystems Integration Director and IT Division Deputy Director in 2000. From 2002 he held several managerial positions outside of IT, ranging from Change Management Director, Corporate Market Posi-tioning Director to Retail Transactional Products Director.
Goran Pavlović graduated from the Faculty of Electrical Engineering at Computer Sciences study. He also obtained a diploma in Management from Henley Management School in Great Britain and attended numerous trainings on management and leadership.
Mr. Horváth was appointed Chief Financial Officer on 1 November 2017. Before that, Mr. Horváth held the position of Director of Controlling. He began his career in Ernst & Young auditing company in Budapest, and in 2006, he started working in MOL. In January 2010, he became the Advisor to the Executive Director of Finance Business Function in INA, d.d., where he stayed until 2011. In May 2011, Mr. Horváth became the Head of MOL Group Risk Management, and from March 2015, he served as the Director of INA, d.d. Controlling Sector.
Gábor Horváth studied at Budapest University of Economic Sciences and Public Administration where he earned his master’s degree in Economics. Additionally, he completed the ACCA (Association of Chartered Certified Accountants) exams.
Mr. Perković was appointed to this position in July 2017 after serving as the Corporate Centre Operat-ing Director since September 2012. He began his career as an intern in INA, d.d. in 1986 in the Explora-tion and Production business division, Workover and Well Services Facility, after which he worked as an operating engineer and went on to become the head of the Special Services Sector in 1990. From 1995 to 1997, he was the Assistant Director of the Technical Services Sector, after which he transferred to CROSCO d.o.o. to the position of the Director of the Strategy and Development Sector. In 1999 and 2000, he managed the SAP system implementation project in INA, after which he was appointed to the position of the Director of the Strategy, Human Resources and IT Sector in CROSCO d.o.o. In July 2009, he returned to INA, d.d. to serve as the Director of the Upstream Support Sector and was appointed to the position of the president of the Management Board of STSI d.o.o. in 2010, which he held until July 2012.
Tvrtko Perković graduated from the Faculty of Mining, Geology and Petroleum Engineering at the University of Zagreb in 1985. He completed a number of courses and attended additional education at the international postgraduate study of Business Management - MBA at the Faculty of Economics and Business in Zagreb in 1993.
Mr. Nikolić was appointed Operating Director of Refining and Marketing on 1 December 2018. Before that, Mr. Nikolić held the position of Director of Logistics. He started his career in 1995, as a designer of process and energy utilities in Mundus. From 1998 to 2000, he worked in the head office of Crodux as a fuel supply chain analyst and planner. In 2000, he joined Coca-Cola Beverages Croatia where he held various positions in the operations sector for a period of ten years, ranging from a production analyst, production manager and plant manager to country manufacturing manager and country supply manager.
Stjepan Nikolić graduated from the Faculty of Mechanical Engineering and Naval Architecture at the University of Zagreb in 1995 at the process-energy department and holds a degree in mechanical engineering. He was active in the founding of the Lean association and temporarily worked as an assistant - external associate at the Department of Industrial Engineering. He has enrolled in the inter-national MBA program at the Faculty of Economics and has completed a series of business educations at international universities in South Africa, the United Kingdom, Switzerland and the USA.
COUNCIL OF DIRECTORS
Effective from 1 March 2021, following a Management Board decision, Mr. Goran Pleše has been appointed Operating Director of Refining and Marketing. Mr. Goran Pleše has replaced Mr. Stjepan Nikolić in that position.
Effective from 1 April 2021, following a Management Board decision, Mr. Borko Buturac has been appointed Acting Operating Director of Con-sumer Services and Retail. Mr. Borko Buturac has replaced Mr. Vlatko Dujanić in that position.

28 29
Management Board of INA – INDUSTRIJA NAFTE, d.d. makes the Statement on the Corporate Governance Code based on Article 22 of the Accounting Act.
Given the fact that INA’s shares are listed on a regulated market, INA – Industrija nafte, d.d. applies the Corporate Governance Code effective from 1 January 2020, which was jointly prepared by the Croatian Financial Services Supervisory Agency (Hrvatska agencija za nadzor financijskih usluga) and the Zagreb Stock Exchange (Zagrebačka burza d.d. Zagreb) and is published on the Zagreb Stock Exchange website (www.zse.hr) and Croatian Financial Services Supervisory Agency website (www.hanfa.hr).
In addition to the Corporate Governance Code, INA Group also applies its own Code of Ethics, which defines the basic val-ues and principles of conduct of INA Group management and employees regarding their attitude towards work, associates, business partners and the public. The Code also sets forth the obligations of INA Group to secure appropriate work condi-tions and professional development to employees and ensure avoidance of unacceptable forms of behavior. The Code covers a broad area of business relationships and processes and has to be observed by all persons acting in the name and on behalf of INA Group, including natural persons and legal entities who are in a contractual relationship with INA Group (business partners, consultants, suppliers, sellers, etc.). The Code can be accessed at INA, d.d. website (www.ina.hr). INA, d.d. generally abides by the provisions of the Corporate Governance Code, with the excep-tions stated in the Annual Corporate Governance Questionnaire published on INA’s website.
Some of the exceptions are as follows:
INA, d.d. does not publish data on the Company’s shares held by the Management Board or Supervisory Board members on its website. Instead, all announcements in reference to the new securities transactions by the Management Board or Supervisory Board members can be found on the Company’s website.
INA, d.d. does not provide proxies to the Company’s sharehold-ers who are not able to vote at the General Assembly, for any reason. The shareholders who are not able to vote themselves should, at their own discretion, appoint appropriate proxies who are obliged to vote in accordance with their instructions. The Company has not received any requests from shareholders in this respect.
The Supervisory Board is not composed of a majority of indepen-dent members. It is composed of major shareholders’ represen-tatives and a workers’ representative in accordance with the Companies Act.
The long-term succession plan has not been published; howev-er, the existing systems of electing members to the Supervisory Board, Management Board and top management take into account the continuity in performing supervisory, management and administrative functions.
The Company does not have a Nomination Committee, all nom-inations are performed in line with internal procedures and a Nomination Committee can be established if needed.
The Company does not publish information on the attendance of Supervisory Board members at its meetings, since this informa-tion is not considered relevant for the shareholders and public.
In line with internal rules, internal audit director is appointed by the Management Board and not the Supervisory Board.
INTERNAL SUPERVISION AND RISK MANAGEMENT The main responsibilities of the Audit Committee, as a body founded by the Supervisory Board, are assisting the Superviso-ry Board and supervising the implementation of its decisions related to controlling, financial reporting and audit within the Company. The Audit Committee monitors audit processes in the Company (internal and external), discusses certain topics raised by auditors or the management and advises the Supervisory Board. The Audit Committee is responsible for ensuring objectiv-ity and credibility of information and reports that are submitted to the Supervisory Board.
Members of the INA, d.d. Audit Committee as of 1 July 2019 are:
• Judit Szilágyi - Chairman of the Audit Committee
• Ratko Marković - member of the Audit Committee
• Hrvoje Šimović - member of the Audit Committee
The Audit Committee is in charge of and has the following re-sponsibilities:
• Passing decisions on approval of flash reports for the stock exchange reporting purposes
• Giving recommendations to the Supervisory and Management Board on appointment or withdrawal of the appointment of the Company’s external auditors responsible for annual audit of financial reports, taking into account independence, objec-tivity, efficiency and expenses of external auditors
• Meeting with external auditors to evaluate the scope and contents of the annual audit and appraise the results of their work
• At least once a year, a discussion of INA, d.d. – auditor rela-tion and other services provided by the audit firm to ensure that none of the non-audit services influence the indepen-dence and objectivity of the external audit
• Discussing the results of the annual audit with external audi-tors, including:
▶ Assessment of audited financial reports
▶ Analysis of external and internal auditors’ recommen-dations for improvement of accounting processes and internal control
▶ Assessment of application of internal and external audi-tors’ recommendations
▶ Assessment of accounting processes and policies in INA, d.d. in comparison with other entities in the sector
• Approval of accounting policies and principles used by INA, d.d.
• Assessment of completeness and accuracy of data in the overall picture, presented in INA’s financial statements to INA’s shareholders and creditors
• Assessment of all important issues connected to legal disputes, contingencies, requests, taxes or penalties and all important accounting issues that have to be included in financial statements, in cooperation with the Management Board and external auditors
• Assessment of the scope and efficiency of the risk manage-ment system
• Assessment of the work of Internal Audit, including:
▶ Competence of Internal Audit
▶ Planned scope of Internal Audit, objectives, authorities and human resources necessary for achieving relevant objectives
▶ Internal Audit activities in the previous period and a sum-mary of Internal Audit report in written form
▶ Cooperation of Internal Audit and the external audit
• Meeting with the director of Internal Audit upon request of the Audit Committee members or the director of Internal Audit
• Meeting with the director of Accounting and Tax upon request of the Audit Committee members or the director of Account-ing and Tax
• Submitting a report about the activities and conclusions of the Audit Committee to the Supervisory Board.
Internal Audit enables an independent and objective assess-ment of financial, operative and control activities carried out within the Group on behalf of the Management Board and reports to the management through comprehensive reports on performed audits. Internal Audit also reports on adequacy of
internal controls and level of compliance with internal and exter-nal regulations. Charter of Internal Audit is a strategic document that defines the main principles and scope of work used in the Internal Audit within the Group.
The main tasks of Internal Audit include, but are not limited to:
• Testing, analysis, assessment and reporting of data in an ob-jective and independent manner, as well as recommending preventive measures aimed at adding value and improving the company operations through application of professional audit standards and ethical standards established by the Institute of Internal Auditors (IIA)
• Check of operational and functional activities carried out in the Group and establishing, understanding, testing and assessing the existing controls with the aim to minimize iden-tified operational risks to the most favorable cost/benefit level
• Testing and assessing adequacy and efficiency of internal control mechanisms, assessment of information technology system and related risk areas, as well as assessment of quali-ty in performing assigned duties
• Assessment of work or program to determine whether the results are in line with the set targets and the work and pro-grams are carried out in a planned manner
• Assessment of reliability and accuracy of financial and opera-tive reports, as well as the manner of identifying, measuring, sorting and reporting this data
• Assessment of the system established by the management to ensure compliance with laws, regulations, procedures, policies and plans that might significantly affect the work and reporting
• Carrying out special checks or investigations as requested by the Management or Supervisory Board of the Company
• Identification of possible frauds and reporting to Corporate Security for the purpose of further investigations.
SIGNIFICANT SHAREHOLDERS OF THE COMPANY
As at 31 December 2020, INA’s ownership structure is as follows:
• MOL Nyrt. – 49.08%
• Government of the Republic of Croatia – 44.84%
• Institutional and private investors – 6.08%
GENERAL ASSEMBLY OPERATION
General Assembly shall be held at least once a year (ordinary meeting) and whenever a meeting is required in the interest of the Company (extraordinary meeting). The General Assembly is convened by the Management Board, and may also be convened
STATEMENT ON THE CORPORATE GOVERNANCE CODE
30 31
by the Supervisory Board, as well as under conditions deter-mined by the law, by shareholders holding shares that represent at least one twentieth part of the Company share capital. Each shareholder registered within the computer system of the Central Depository has the right to participate in the General Assembly, provided that they have sent a prior application for participation at the General Assembly meeting. A notification of their intention to participate at the General Assembly needs to be delivered to the Company within the deadline set in the invitation, six days before the General Assembly.
The President of the Supervisory Board, or any other person appointed by the Supervisory Board to chair the General Assem-bly, shall preside as the Chairman of the General Assembly. The General Assembly shall be entitled to pass valid resolutions if shareholders representing at least 50% of the total number of votes are present (quorum). Resolutions of the General Assem-bly are passed by an ordinary majority of votes, except in cases where a larger majority is required by the law or the Articles (qualified majority).
COMPOSITION AND OPERATIONS OF MANAGEMENT AND SUPERVISORY BODIES
INA’s management structure is based on a two-tier board system, comprising of a Supervisory Board and a Management Board. Along with the General Assembly, these constitute the three mandatory internal bodies of INA, d.d. in accordance with INA’s Articles of Association and the Companies Act.
The Supervisory Board is responsible for the appointment and recall of the Management Board members and supervises the conduct of the Company’s business operations. Pursuant to INA’s Articles of Association, the Supervisory Board consists of nine members, one member being the employees’ representative. Based on the Shareholders’ Agreement signed between MOL and the Croatian Government, five members are appointed by MOL and three by the Croatian Government. The General Assembly appoints and recalls eight members of the Supervisory Board. One member of the Supervisory Board is elected and recalled by employees pursuant to the Labor Act. The members of the Supervisory Board to be elected and recalled by the General Assembly may resign from their position by delivering a letter of resignation to the President or Vice President of the Supervisory Board and to the Management Board of the Company. A member of the Supervisory Board elected and recalled by employees may hand in their resignation to the Supervisory Board pursuant to the provisions of the Labor Act. The Supervisory Board elects a President and Vice President of the Supervisory Board from among its members by a simple majority of votes. The President and Vice President of the Supervisory Board are elected for a term not exceeding four years and may be re-elected.
Members of the Supervisory Board from 14 June 2017 until 18 December 2020:
• Damir Vanđelić - President of the Supervisory Board
• József Molnár - Vice President of the Supervisory Board
• Luka Burilović - member of the Supervisory Board
• Szabolcs I. Ferencz - member of the Supervisory Board
• Ferenc Horváth - member of the Supervisory Board
• Damir Mikuljan - member of the Supervisory Board
• József Simola - member of the Supervisory Board
• László Uzsoki - member of the Supervisory Board
• Jasna Pipunić - representative of employees in the Supervisory Board
Members of the Supervisory Board from 18 December 2020:
• Damir Vanđelić - President of the Supervisory Board
• József Molnár - Vice President of the Supervisory Board
• Luka Burilović - member of the Supervisory Board
• Zsuzsanna Ortutay - member of the Supervisory Board
• Gabriel Szabó - member of the Supervisory Board
• Damir Mikuljan - member of the Supervisory Board
• Domokos Szollár - member of the Supervisory Board
• László Uzsoki - member of the Supervisory Board
• Jasna Pipunić - representative of employees in the Supervisory Board
The Company’s Management Board shall consist of six members. Based on the Shareholders’ Agreement, three members are ap-pointed by MOL, including the President, and three by the Croatian Government. The Management Board has a President, and it may also have a Vice President specified by the Rules of Procedure of the Management Board. The President of the Management Board may have assistants and advisers appointed by the President. The President and members of the Management Board shall be appointed and recalled by the Supervisory Board. The Supervisory Board shall decide on the term of office of the members of the Management Board, but their term of office shall not exceed five years. Once their term expires, members of the Management Board may be reappointed without limitation as to the number of terms they may serve. The Company is represented by two members of the Management Board acting jointly, or one member of the Man-agement Board acting jointly with one procurator.
Members of the Management Board until 31 March 2020:
• Sándor Fasimon - President of the Management Board
• Niko Dalić - member of the Management Board
• Ivan Krešić - member of the Management Board
• Davor Mayer - member of the Management Board
• Zsolt Pethő - member of the Management Board
• Ákos Székely, PhD - member of the Management Board
Members of the Management Board from 1 April 2020 until 31 January 2021:
• Sándor Fasimon - President of the Management Board
• Niko Dalić - member of the Management Board
• Barbara Dorić, PhD - member of the Management Board
• Darko Markotić - member of the Management Board
• Zsolt Pethő - member of the Management Board
• Ákos Székely, PhD - member of the Management Board
Members of the Management Board from 1 February 2021:
• Sándor Fasimon - President of the Management Board
• Niko Dalić - member of the Management Board
• Barbara Dorić, PhD - member of the Management Board
• Ferenc Horváth - member of the Management Board
• Darko Markotić - member of the Management Board
• József Simola - member of the Management Board
Members of the Council of Directors are appointed based on a Management Board’s decision. They are authorized and responsi-ble for the management of operations of INA’s individual business divisions (Exploration and Production, Refining and Marketing, Consumer Services and Retail, Finance and Industrial Services).
Members of the Council of Directors appointed by the decision of the Management Board until 28 February 2021:
• Vlatko Dujanić - Operating Director of Consumer Services and Retail
• Gábor Horváth - Chief Financial Officer
• Stjepan Nikolić - Operating Director of Refining and Marketing
• Goran Pavlović - Operating Director of Industrial Services
• Tvrtko Perković - Operating Director of Exploration and Production
Members of the Council of Directors appointed by the decision of the Management Board from 1 March 2021 until 31 March 2021:
• Vlatko Dujanić - Operating Director of Consumer Services and Retail
• Gábor Horváth - Chief Financial Officer
• Goran Pleše - Operating Director of Refining and Marketing
• Goran Pavlović - Operating Director of Industrial Services
• Tvrtko Perković - Operating Director of Exploration and Production
Members of the Council of Directors appointed by the decision of the Management Board from 1 April 2021:
• Borko Buturac – Acting Operating Director of Consumer Services and Retail
• Gábor Horváth - Chief Financial Officer
• Goran Pleše - Operating Director of Refining and Marketing
• Goran Pavlović - Operating Director of Industrial Services
• Tvrtko Perković - Operating Director of Exploration and Production
Business address for all members of the Management Board, Supervisory Board and members of the Council of Directors is Avenija Većeslava Holjevca 10, 10 020 Zagreb, Croatia.
DIVERSITY STRATEGYAs a company, INA, d.d. builds a culture of diversity and ac-ceptance of differences in line with its fundamental values and with the aim of attracting, hiring and retaining talents and its employees. In INA, d.d., under diversity management we imply introduction of diversity into the work environment in any form (gender, age, ethnicity, religion, language, sexual orientation, social background, hobbies, styles of learning, political atti-tudes, etc.), while under diversity acceptance we imply creation of an organizational culture where differences are respected and where everybody has the opportunity to develop their skills and talents.
The procedure of career and succession management for posi-tions in INA, d.d. is carried out for all managerial positions and since it is an objective and unbiased system, it ensures represen-tation of all important competencies/areas of activities aimed to achieve efficient and professional performance of successors in their future managerial roles. Currently, there is a total of 40% female successors of the total successor population, prepared to take over managerial positions. Through the use of the men-tioned Procedure for Managers, and for employees of operative companies, “Employee Performance Management System in INA Group”, a system for identifying and developing talents is carried out both for managers and other employees. This is also an ob-jective and unbiased tool to ensure gender diversity in executive, management and supervisory bodies. The ratio of promotions and the ratio of talents by gender is in line with the ratio of em-ployees by gender.
In addition to the aforementioned, in 2020 we continued with building a diversity culture through specific projects and initia-tives, such as:
D&I SURVEY
In 2020, Diversity & Inclusion survey was conducted at the level of the entire MOL Group and INA Group with the aim of better understanding the perspective of employees on this topic and identifying strengths and improvement areas regarding diversity and inclusion. The results will be published in 2021 and D&I activ-ities will be set accordingly.
D&I EVENT
In 2020 we held a D&I event as part of the annual Employ-ee Awards Ceremony. During the event, we emphasized the diversity of our employees in different aspects and emphasized how important it is for the company to be diverse and inclusive. Special emphasis was placed on fathers who used parental leave and we wanted to show that we are a company that sup-ports fatherly roles and encourages employees to use the same opportunity.
32 33
DADFORCE STANDARD
In 2020, based on the implementation of a responsible policy of supporting working fathers and strengthening their parental role, INA, d.d. received the DADFORCE standard. Besides that, INA, d.d. is still a proud owner of MAMFORCE © certificate. In this audit INA, d.d. has reached 93%, which is the highest percentage so far. A commitment to the area of work-life balance and equal professional opportunities for women and men places INA, d.d. at the top of the best companies in Croatia, as it is 28% better than the average of comparable companies.
THE BEST COMPANY FOR WOMEN AND WELL-BEING
INA, d.d. stood out as the best for women and for well-being of employees in the category of large companies in an independent research conducted by the MAMFORCE team.
The best companies for women provide fair conditions for em-ployment, career development and promotion without paycheck
differences based on gender, while companies that take care of the well-being of employees develop positive interpersonal rela-tionships, provide a stimulating work environment and efficient-ly organize working hours to ensure harmony of all life roles.
INA Group was the first in Croatia to introduce a comprehen-sive well-being program through the beneFIT platform which provides every employee with benefits in accordance with their needs in life.
Furthermore, for many years now women in INA Group have been provided with the same employment and career development opportunities as their male colleagues, which is confirmed by transparent indicators that show there is an equal share of wom-en at all management levels.
INA Group is committed to the quality of the work experience, development of corporate culture and the principles of diversity and inclusion.
INNOVATION
For more than half a century, INA Group workers have been applying their innovation proposals categorized as patent (invention), industrial design, technical improvement, business rationalization or useful idea.
During 2020, INA Group faced several major challenges in the form of a cyber-attack, the COVID-19 pandemic and earthquakes that significantly affected our work activities. However, this has not hampered workers’ efforts to improve work processes through innovation. In the INA, d.d. Refining and Marketing an innovation competition was conducted according to the EIFFEL methodology, to which 28 innovation proposals were submitted, while another 19 innovation proposals were submitted to the INA Group’s Innovation Assessment Committee in the usual manner. Thus, in 2020, despite all the challenges, a total of 49 innovation proposals were submitted.
INA Group successfully presented itself at the 45th Croatian Inno-vation Salon INOVA-Croatia 2020, which was held online due to the pandemic, where our innovators presented seven innova-tions and won three gold, two silver and two bronze medals for new products and business process improvements.
QUALITY Quality management is applied in all business processes through the integrated company system which was also introduced by major INA Group companies. The goal is to continuously improve processes and to further develop the quality of products and services. In 2020, INA Group possessed the certificates according to ISO 9001, ISO 14001, ISO 50001, OHSAS 18001 standards and EU-ISCC certificate on biofuels sustainability, which is a manda-tory condition for the sale of biofuels on the EU market. Moni-toring of the entire quality management system is implemented with external monitoring management system (MS) audit (one held), as well as with integral process MS internal audits for all management systems (134 planned) and supplier quality audits (four held). Through the cooperation with related company moni-toring processes such as health and safety audits, internal audits, compliance with the regulation audits and security audits, better control of the processes is accomplished. In 2020, due to the hacker attack on the INA company, COVID-19 pandemic and the earthquakes that significantly affected the work activities, the internal quality audit plan was revised in order to adapt it and provide better support to business processes in such a specific and challenging situation. A slightly reduced total number of internal quality audits (91) was held, which were therefore aimed at meeting legal requirements and specific requirements of oper-ational processes, with part of the quality audits (74) held online due to epidemiological measures, and a part of planned internal quality audits (43) postponed for the first quarter of 2021.
INA, d.d. experts actively participate in the work of the Croatian Society for Quality (CCS) and the Croatian Standards Institute, and through membership in the CCS Supervisory Board, they contribute to the development of good relations with stakehold-ers and build the reputation of our company.
STANDARDIZATION INA standards define and specify the quality of our products and raw materials, as well as the elements of the company’s visual identity, and prescribe rules and standards in the field of business communication. In 2020, one new INA standard was developed, and seven existing INA standards were revised, while eight safety data sheets were prepared.
INA, d.d. experts actively participate in the work of more than 34 technical committees and numerous subcommittees and working groups at the Croatian Standards Institute (CSI) where they help improve the process of sustainable development of our company.
INTELLECTUAL PROPERTY Protection of intellectual property rights includes the protection of inventions (patents), trade and service mark, product names, elements of the visual identity of service stations (trademark), and the protection of the external appearance, i.e. product appearance (industrial design). In line with its business interests, INA, d.d. protects: INA’s name through international registration, which ensures protection of INA’s name in 27 countries (Republic of Croatia, Albania, Algeria, Austria, Benelux, Bosnia and Herze-govina, Bulgaria, Montenegro, Czech Republic, Egypt, Italy, Koso-vo, Liberia, Hungary, Macedonia, Morocco, Germany, Poland, Romania, Russian Federation, Slovakia, Slovenia, Serbia, Swiss, Ukraine), 58 trademarks in Croatia, 38 trademarks in Slovenia, 22 in Macedonia, 43 in Bosnia and Herzegovina, 24 in Serbia, 12 in Albania, 32 in Kosovo, 33 in Montenegro, ten in Hungary, two in Belarus, as well as six industrial designs in Croatia, five industrial designs in Bosnia and Herzegovina and Slovenia, four industrial designs in Serbia, Macedonia, Montenegro and Kosovo, and INA web domain in Macedonia, Bosnia and Herzegovina and Croatia.
In the year 2020, five new trademarks were registered (INA MAZIVA, INA LOYALTY - two versions, INA PAY, INA TRANSHIDROL) in Croatia and five Internet domains related to the INA LOYALTY program were launched, with protection extended for several trademarks (INA TURBO, INA AGRINA, INA KOMPRINA, INA FUNG-IA, INA GORGONELA, INA LOKOMOL) in Croatia.
The other part of INA, d.d. intellectual property are employees and all their knowledge, ideas and skills applied in their work. The Company Knowledge Base, in which one can find all infor-mation related to the creative work of INA, d.d. employees, is continuously maintained.
QUALITY MANAGEMENT

34 35
030

36 37
EXPLORATIONAND PRODUCTION OVERVIEW
Key message from theOperating Director
Thanks to the dedication of our people, we managed to overcome all the difficult challenges this year had presented us with. We have also had a string of positive news. In Onshore Croatia we signed three new PSAs, had our second discovery on Drava-02 and started the single largest 3D seismic acquisition in the country’s history on Drava-03. Offshore Croatia we successfully drilled our first offshore well in five years. Internationally, we have entered a new explo-ration concession after 12 years, further expanding our portfolio in Egypt. All of this clearly shows our commitment to growth, both in Croatia and abroad.
Tvrtko Perković Operating Director ofExploration and Production
ACHIEVEMENTS
• Declared our second discovery on the exploration block Drava-02
• Completed first part of the single larg-est 3D seismic acquisition in Croatia’s history
• Successfully drilled our first offshore well in five years
CHALLENGES
• Reserves replacement through organic and inorganic growth
• Minimizing the effects of natural decline on our highly mature fields
• Continuing exploration activities in Croatia and starting exploration activities on our new concession in Egypt
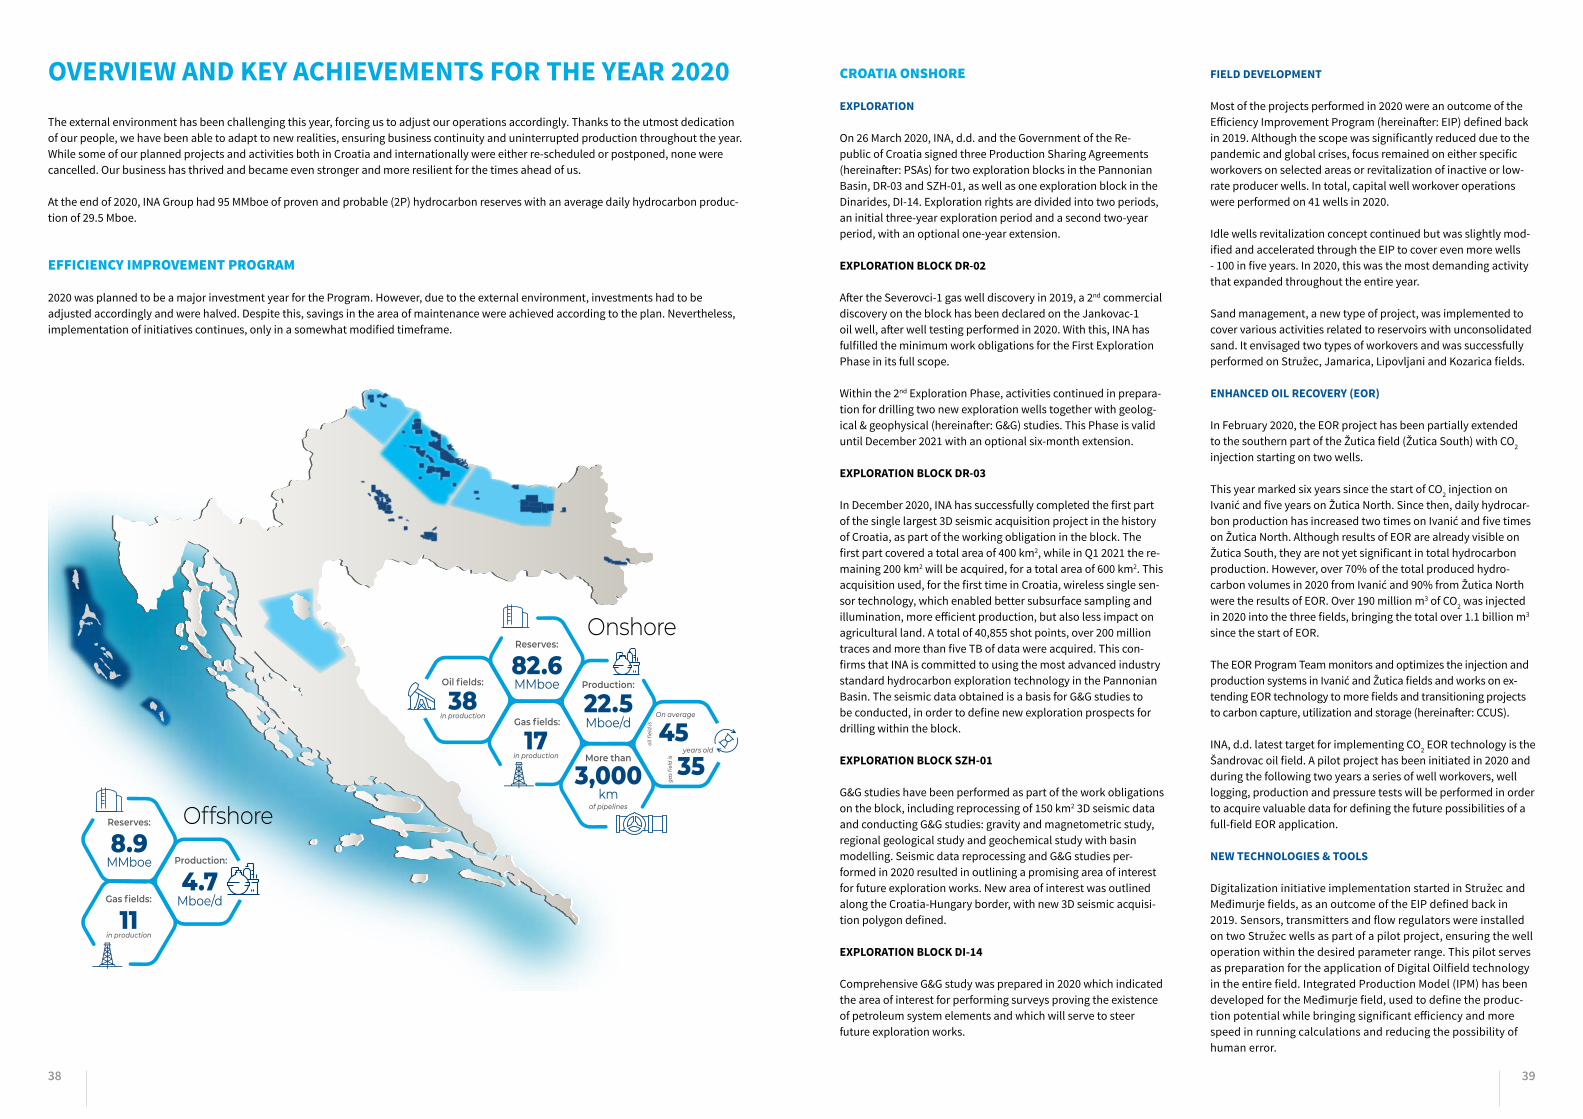
38 39
OVERVIEW AND KEY ACHIEVEMENTS FOR THE YEAR 2020 The external environment has been challenging this year, forcing us to adjust our operations accordingly. Thanks to the utmost dedication of our people, we have been able to adapt to new realities, ensuring business continuity and uninterrupted production throughout the year. While some of our planned projects and activities both in Croatia and internationally were either re-scheduled or postponed, none were cancelled. Our business has thrived and became even stronger and more resilient for the times ahead of us.
At the end of 2020, INA Group had 95 MMboe of proven and probable (2P) hydrocarbon reserves with an average daily hydrocarbon produc-tion of 29.5 Mboe.
EFFICIENCY IMPROVEMENT PROGRAM
2020 was planned to be a major investment year for the Program. However, due to the external environment, investments had to be adjusted accordingly and were halved. Despite this, savings in the area of maintenance were achieved according to the plan. Nevertheless, implementation of initiatives continues, only in a somewhat modified timeframe.
Onshore82.6MMboe
3,000km
Reserves:
38in production
Oil fields:
22.5Mboe/d
Production:
17in production
Gas fields:
More than
of pipelines
On average
years old45
35
Offshore8.9
MMboe
Reserves:
11in production
Gas fields: 4.7
Mboe/d
Production:
CROATIA ONSHORE
EXPLORATION
On 26 March 2020, INA, d.d. and the Government of the Re-public of Croatia signed three Production Sharing Agreements (hereinafter: PSAs) for two exploration blocks in the Pannonian Basin, DR-03 and SZH-01, as well as one exploration block in the Dinarides, DI-14. Exploration rights are divided into two periods, an initial three-year exploration period and a second two-year period, with an optional one-year extension.
EXPLORATION BLOCK DR-02
After the Severovci-1 gas well discovery in 2019, a 2nd commercial discovery on the block has been declared on the Jankovac-1 oil well, after well testing performed in 2020. With this, INA has fulfilled the minimum work obligations for the First Exploration Phase in its full scope.
Within the 2nd Exploration Phase, activities continued in prepara-tion for drilling two new exploration wells together with geolog-ical & geophysical (hereinafter: G&G) studies. This Phase is valid until December 2021 with an optional six-month extension.
EXPLORATION BLOCK DR-03
In December 2020, INA has successfully completed the first part of the single largest 3D seismic acquisition project in the history of Croatia, as part of the working obligation in the block. The first part covered a total area of 400 km2, while in Q1 2021 the re-maining 200 km2 will be acquired, for a total area of 600 km2. This acquisition used, for the first time in Croatia, wireless single sen-sor technology, which enabled better subsurface sampling and illumination, more efficient production, but also less impact on agricultural land. A total of 40,855 shot points, over 200 million traces and more than five TB of data were acquired. This con-firms that INA is committed to using the most advanced industry standard hydrocarbon exploration technology in the Pannonian Basin. The seismic data obtained is a basis for G&G studies to be conducted, in order to define new exploration prospects for drilling within the block.
EXPLORATION BLOCK SZH-01
G&G studies have been performed as part of the work obligations on the block, including reprocessing of 150 km2 3D seismic data and conducting G&G studies: gravity and magnetometric study, regional geological study and geochemical study with basin modelling. Seismic data reprocessing and G&G studies per-formed in 2020 resulted in outlining a promising area of interest for future exploration works. New area of interest was outlined along the Croatia-Hungary border, with new 3D seismic acquisi-tion polygon defined.
EXPLORATION BLOCK DI-14
Comprehensive G&G study was prepared in 2020 which indicated the area of interest for performing surveys proving the existence of petroleum system elements and which will serve to steer future exploration works.
FIELD DEVELOPMENT
Most of the projects performed in 2020 were an outcome of the Efficiency Improvement Program (hereinafter: EIP) defined back in 2019. Although the scope was significantly reduced due to the pandemic and global crises, focus remained on either specific workovers on selected areas or revitalization of inactive or low-rate producer wells. In total, capital well workover operations were performed on 41 wells in 2020.
Idle wells revitalization concept continued but was slightly mod-ified and accelerated through the EIP to cover even more wells - 100 in five years. In 2020, this was the most demanding activity that expanded throughout the entire year.
Sand management, a new type of project, was implemented to cover various activities related to reservoirs with unconsolidated sand. It envisaged two types of workovers and was successfully performed on Stružec, Jamarica, Lipovljani and Kozarica fields.
ENHANCED OIL RECOVERY (EOR)
In February 2020, the EOR project has been partially extended to the southern part of the Žutica field (Žutica South) with CO2 injection starting on two wells.
This year marked six years since the start of CO2 injection on Ivanić and five years on Žutica North. Since then, daily hydrocar-bon production has increased two times on Ivanić and five times on Žutica North. Although results of EOR are already visible on Žutica South, they are not yet significant in total hydrocarbon production. However, over 70% of the total produced hydro-carbon volumes in 2020 from Ivanić and 90% from Žutica North were the results of EOR. Over 190 million m3 of CO2 was injected in 2020 into the three fields, bringing the total over 1.1 billion m3 since the start of EOR.
The EOR Program Team monitors and optimizes the injection and production systems in Ivanić and Žutica fields and works on ex-tending EOR technology to more fields and transitioning projects to carbon capture, utilization and storage (hereinafter: CCUS).
INA, d.d. latest target for implementing CO2 EOR technology is the Šandrovac oil field. A pilot project has been initiated in 2020 and during the following two years a series of well workovers, well logging, production and pressure tests will be performed in order to acquire valuable data for defining the future possibilities of a full-field EOR application.
NEW TECHNOLOGIES & TOOLS
Digitalization initiative implementation started in Stružec and Međimurje fields, as an outcome of the EIP defined back in 2019. Sensors, transmitters and flow regulators were installed on two Stružec wells as part of a pilot project, ensuring the well operation within the desired parameter range. This pilot serves as preparation for the application of Digital Oilfield technology in the entire field. Integrated Production Model (IPM) has been developed for the Međimurje field, used to define the produc-tion potential while bringing significant efficiency and more speed in running calculations and reducing the possibility of human error.
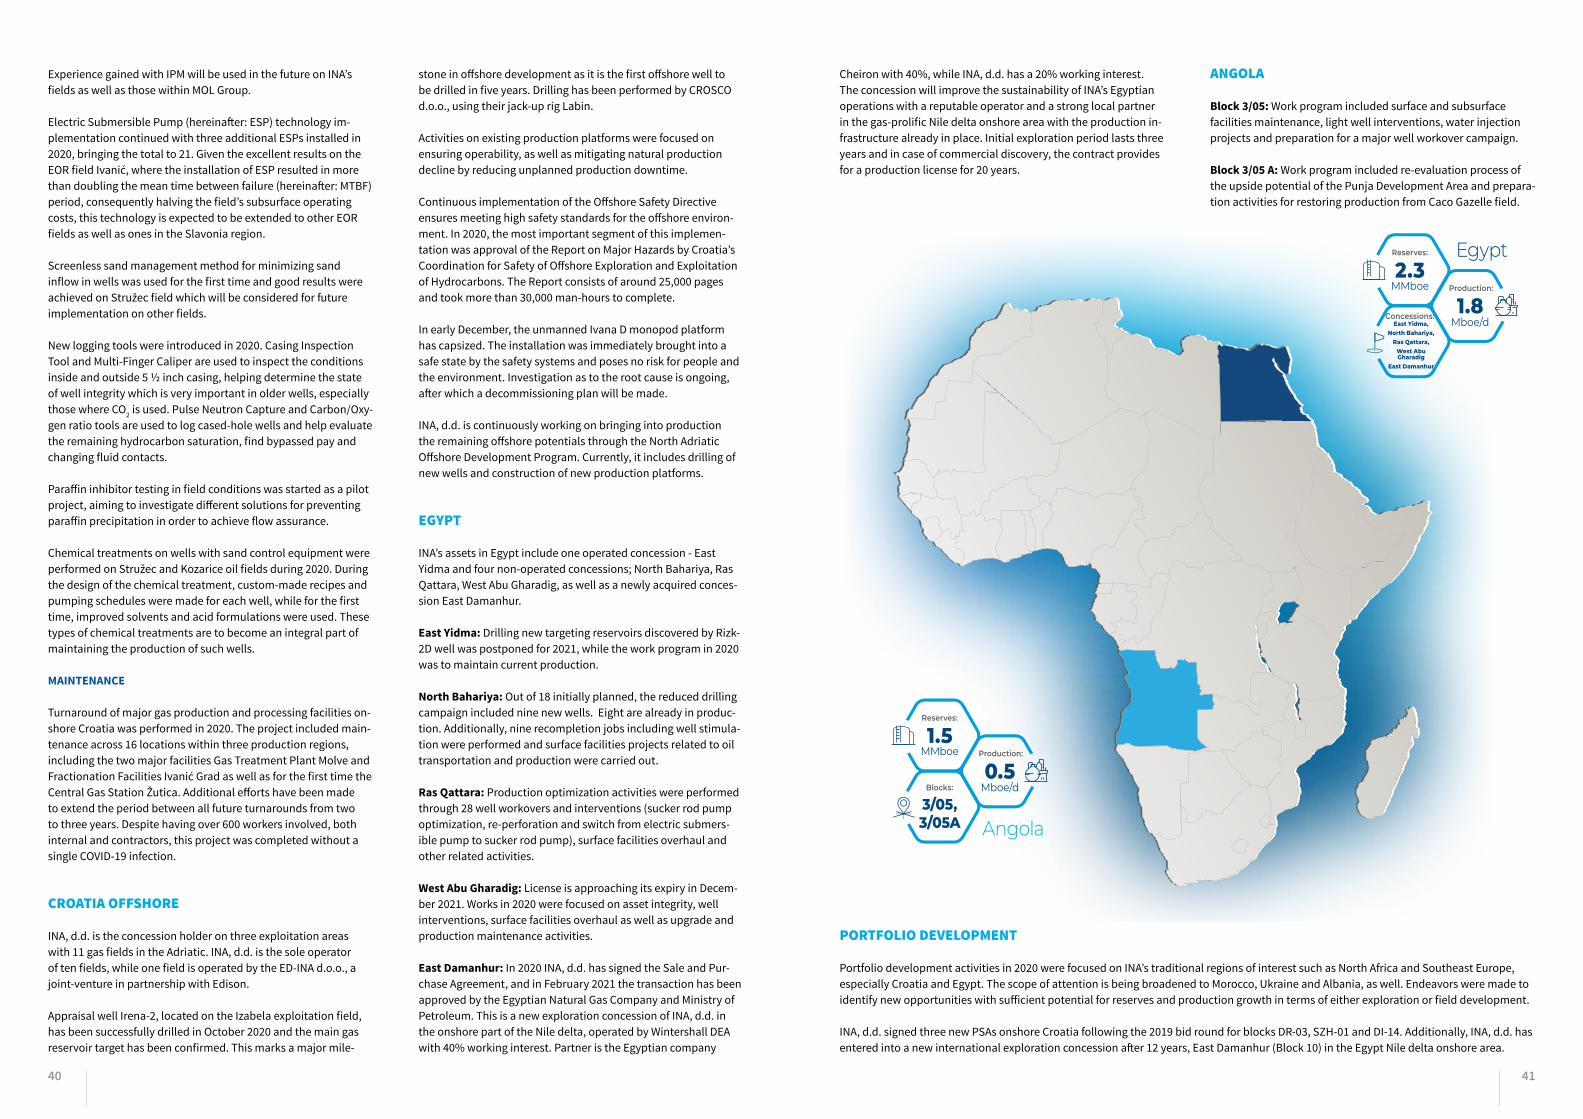
40 41
Experience gained with IPM will be used in the future on INA’s fields as well as those within MOL Group.
Electric Submersible Pump (hereinafter: ESP) technology im-plementation continued with three additional ESPs installed in 2020, bringing the total to 21. Given the excellent results on the EOR field Ivanić, where the installation of ESP resulted in more than doubling the mean time between failure (hereinafter: MTBF) period, consequently halving the field’s subsurface operating costs, this technology is expected to be extended to other EOR fields as well as ones in the Slavonia region.
Screenless sand management method for minimizing sand inflow in wells was used for the first time and good results were achieved on Stružec field which will be considered for future implementation on other fields.
New logging tools were introduced in 2020. Casing Inspection Tool and Multi-Finger Caliper are used to inspect the conditions inside and outside 5 ½ inch casing, helping determine the state of well integrity which is very important in older wells, especially those where CO2 is used. Pulse Neutron Capture and Carbon/Oxy-gen ratio tools are used to log cased-hole wells and help evaluate the remaining hydrocarbon saturation, find bypassed pay and changing fluid contacts.
Paraffin inhibitor testing in field conditions was started as a pilot project, aiming to investigate different solutions for preventing paraffin precipitation in order to achieve flow assurance.
Chemical treatments on wells with sand control equipment were performed on Stružec and Kozarice oil fields during 2020. During the design of the chemical treatment, custom-made recipes and pumping schedules were made for each well, while for the first time, improved solvents and acid formulations were used. These types of chemical treatments are to become an integral part of maintaining the production of such wells.
MAINTENANCE
Turnaround of major gas production and processing facilities on-shore Croatia was performed in 2020. The project included main-tenance across 16 locations within three production regions, including the two major facilities Gas Treatment Plant Molve and Fractionation Facilities Ivanić Grad as well as for the first time the Central Gas Station Žutica. Additional efforts have been made to extend the period between all future turnarounds from two to three years. Despite having over 600 workers involved, both internal and contractors, this project was completed without a single COVID-19 infection.
CROATIA OFFSHORE
INA, d.d. is the concession holder on three exploitation areas with 11 gas fields in the Adriatic. INA, d.d. is the sole operator of ten fields, while one field is operated by the ED-INA d.o.o., a joint-venture in partnership with Edison.
Appraisal well Irena-2, located on the Izabela exploitation field, has been successfully drilled in October 2020 and the main gas reservoir target has been confirmed. This marks a major mile-
stone in offshore development as it is the first offshore well to be drilled in five years. Drilling has been performed by CROSCO d.o.o., using their jack-up rig Labin.
Activities on existing production platforms were focused on ensuring operability, as well as mitigating natural production decline by reducing unplanned production downtime.
Continuous implementation of the Offshore Safety Directive ensures meeting high safety standards for the offshore environ-ment. In 2020, the most important segment of this implemen-tation was approval of the Report on Major Hazards by Croatia’s Coordination for Safety of Offshore Exploration and Exploitation of Hydrocarbons. The Report consists of around 25,000 pages and took more than 30,000 man-hours to complete.
In early December, the unmanned Ivana D monopod platform has capsized. The installation was immediately brought into a safe state by the safety systems and poses no risk for people and the environment. Investigation as to the root cause is ongoing, after which a decommissioning plan will be made.
INA, d.d. is continuously working on bringing into production the remaining offshore potentials through the North Adriatic Offshore Development Program. Currently, it includes drilling of new wells and construction of new production platforms.
EGYPT
INA’s assets in Egypt include one operated concession - East Yidma and four non-operated concessions; North Bahariya, Ras Qattara, West Abu Gharadig, as well as a newly acquired conces-sion East Damanhur.
East Yidma: Drilling new targeting reservoirs discovered by Rizk-2D well was postponed for 2021, while the work program in 2020 was to maintain current production.
North Bahariya: Out of 18 initially planned, the reduced drilling campaign included nine new wells. Eight are already in produc-tion. Additionally, nine recompletion jobs including well stimula-tion were performed and surface facilities projects related to oil transportation and production were carried out.
Ras Qattara: Production optimization activities were performed through 28 well workovers and interventions (sucker rod pump optimization, re-perforation and switch from electric submers-ible pump to sucker rod pump), surface facilities overhaul and other related activities.
West Abu Gharadig: License is approaching its expiry in Decem-ber 2021. Works in 2020 were focused on asset integrity, well interventions, surface facilities overhaul as well as upgrade and production maintenance activities.
East Damanhur: In 2020 INA, d.d. has signed the Sale and Pur-chase Agreement, and in February 2021 the transaction has been approved by the Egyptian Natural Gas Company and Ministry of Petroleum. This is a new exploration concession of INA, d.d. in the onshore part of the Nile delta, operated by Wintershall DEA with 40% working interest. Partner is the Egyptian company
Cheiron with 40%, while INA, d.d. has a 20% working interest. The concession will improve the sustainability of INA’s Egyptian operations with a reputable operator and a strong local partner in the gas-prolific Nile delta onshore area with the production in-frastructure already in place. Initial exploration period lasts three years and in case of commercial discovery, the contract provides for a production license for 20 years.
ANGOLA
Block 3/05: Work program included surface and subsurface facilities maintenance, light well interventions, water injection projects and preparation for a major well workover campaign.
Block 3/05 A: Work program included re-evaluation process of the upside potential of the Punja Development Area and prepara-tion activities for restoring production from Caco Gazelle field.
Egypt
Angola
2.3MMboe
Reserves:
Concessions: 1.8
Mboe/d
Production:
East Yidma,North Bahariya,
Ras Qattara,West Abu Gharadig
East Damanhur
1.5MMboe
Reserves:
3/05,3/05A
Blocks: 0.5
Mboe/d
Production:
PORTFOLIO DEVELOPMENT
Portfolio development activities in 2020 were focused on INA’s traditional regions of interest such as North Africa and Southeast Europe, especially Croatia and Egypt. The scope of attention is being broadened to Morocco, Ukraine and Albania, as well. Endeavors were made to identify new opportunities with sufficient potential for reserves and production growth in terms of either exploration or field development.
INA, d.d. signed three new PSAs onshore Croatia following the 2019 bid round for blocks DR-03, SZH-01 and DI-14. Additionally, INA, d.d. has entered into a new international exploration concession after 12 years, East Damanhur (Block 10) in the Egypt Nile delta onshore area.
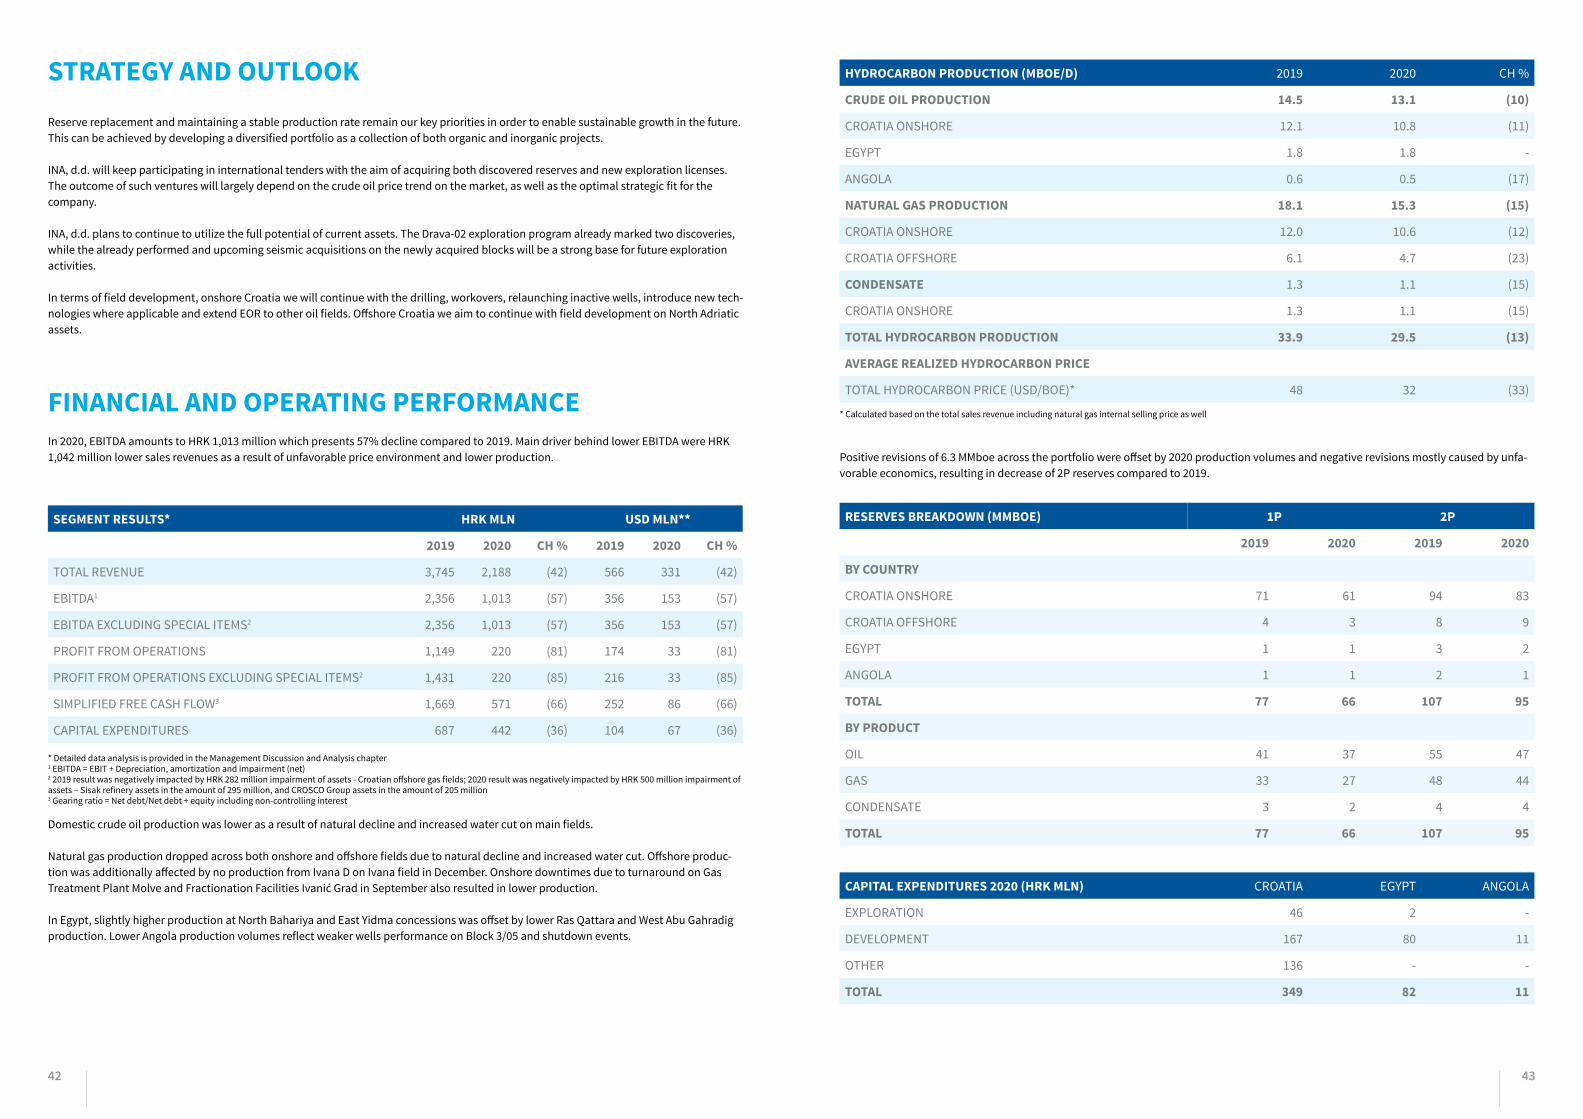
42 43
STRATEGY AND OUTLOOK Reserve replacement and maintaining a stable production rate remain our key priorities in order to enable sustainable growth in the future. This can be achieved by developing a diversified portfolio as a collection of both organic and inorganic projects.
INA, d.d. will keep participating in international tenders with the aim of acquiring both discovered reserves and new exploration licenses. The outcome of such ventures will largely depend on the crude oil price trend on the market, as well as the optimal strategic fit for the company.
INA, d.d. plans to continue to utilize the full potential of current assets. The Drava-02 exploration program already marked two discoveries, while the already performed and upcoming seismic acquisitions on the newly acquired blocks will be a strong base for future exploration activities.
In terms of field development, onshore Croatia we will continue with the drilling, workovers, relaunching inactive wells, introduce new tech-nologies where applicable and extend EOR to other oil fields. Offshore Croatia we aim to continue with field development on North Adriatic assets.
FINANCIAL AND OPERATING PERFORMANCE In 2020, EBITDA amounts to HRK 1,013 million which presents 57% decline compared to 2019. Main driver behind lower EBITDA were HRK 1,042 million lower sales revenues as a result of unfavorable price environment and lower production.
SEGMENT RESULTS* HRK MLN USD MLN**
2019 2020 CH % 2019 2020 CH %
TOTAL REVENUE 3,745 2,188 (42) 566 331 (42)
EBITDA1 2,356 1,013 (57) 356 153 (57)
EBITDA EXCLUDING SPECIAL ITEMS2 2,356 1,013 (57) 356 153 (57)
PROFIT FROM OPERATIONS 1,149 220 (81) 174 33 (81)
PROFIT FROM OPERATIONS EXCLUDING SPECIAL ITEMS2 1,431 220 (85) 216 33 (85)
SIMPLIFIED FREE CASH FLOW3 1,669 571 (66) 252 86 (66)
CAPITAL EXPENDITURES 687 442 (36) 104 67 (36)
* Detailed data analysis is provided in the Management Discussion and Analysis chapter1 EBITDA = EBIT + Depreciation, amortization and impairment (net)2 2019 result was negatively impacted by HRK 282 million impairment of assets - Croatian offshore gas fields; 2020 result was negatively impacted by HRK 500 million impairment of assets – Sisak refinery assets in the amount of 295 million, and CROSCO Group assets in the amount of 205 million3 Gearing ratio = Net debt/Net debt + equity including non-controlling interest
* Calculated based on the total sales revenue including natural gas internal selling price as well
Domestic crude oil production was lower as a result of natural decline and increased water cut on main fields.
Natural gas production dropped across both onshore and offshore fields due to natural decline and increased water cut. Offshore produc-tion was additionally affected by no production from Ivana D on Ivana field in December. Onshore downtimes due to turnaround on Gas Treatment Plant Molve and Fractionation Facilities Ivanić Grad in September also resulted in lower production.
In Egypt, slightly higher production at North Bahariya and East Yidma concessions was offset by lower Ras Qattara and West Abu Gahradig production. Lower Angola production volumes reflect weaker wells performance on Block 3/05 and shutdown events.
HYDROCARBON PRODUCTION (MBOE/D) 2019 2020 CH %
CRUDE OIL PRODUCTION 14.5 13.1 (10)
CROATIA ONSHORE 12.1 10.8 (11)
EGYPT 1.8 1.8 -
ANGOLA 0.6 0.5 (17)
NATURAL GAS PRODUCTION 18.1 15.3 (15)
CROATIA ONSHORE 12.0 10.6 (12)
CROATIA OFFSHORE 6.1 4.7 (23)
CONDENSATE 1.3 1.1 (15)
CROATIA ONSHORE 1.3 1.1 (15)
TOTAL HYDROCARBON PRODUCTION 33.9 29.5 (13)
AVERAGE REALIZED HYDROCARBON PRICE
TOTAL HYDROCARBON PRICE (USD/BOE)* 48 32 (33)
CAPITAL EXPENDITURES 2020 (HRK MLN) CROATIA EGYPT ANGOLA
EXPLORATION 46 2 -
DEVELOPMENT 167 80 11
OTHER 136 - -
TOTAL 349 82 11
RESERVES BREAKDOWN (MMBOE) 1P 2P
2019 2020 2019 2020
BY COUNTRY
CROATIA ONSHORE 71 61 94 83
CROATIA OFFSHORE 4 3 8 9
EGYPT 1 1 3 2
ANGOLA 1 1 2 1
TOTAL 77 66 107 95
BY PRODUCT
OIL 41 37 55 47
GAS 33 27 48 44
CONDENSATE 3 2 4 4
TOTAL 77 66 107 95
Positive revisions of 6.3 MMboe across the portfolio were offset by 2020 production volumes and negative revisions mostly caused by unfa-vorable economics, resulting in decrease of 2P reserves compared to 2019.

44 45
REFININGAND MARKETING OVERVIEW
Key message from theOperating Director
Although most of the year we have been through unprecedent-ed challenges, thanks to our discipline we managed to secure stable operations, market supply and create a sustainable plan for further development of the INA Downstream 2023 New Course program, marked as crucial for the future of INA R&M. It is of utmost importance to notice how the biggest project in R&M history, the Rijeka Refinery Upgrade Project, is on track and proceeding as expected. With realization of this project and the New Course program in general we are creating conditions for the next investment cycle after 2024, with focus on renewable energy and CO2 capture which will guarantee long-lasting sustainability for our company.
The times that we live in are extremely demanding, challeng-ing and exciting, and the dedication of our employees to creat-ing and shaping a future for this company is a precondition to success.
Stjepan NikolićOperating Director of Refining and Marketing
ACHIEVEMENTS
• Start-up of Propane-Propylene Split-ter Unit in the Rijeka Refinery
• Strong market position on core mar-kets
• Stable market supply throughout the whole year despite the challenges
CHALLENGES
• Continue to successfully adapt to external environments and keep the position of a market leader on core markets and improve influ-ence in the region
• Continue with implementation of the INA Downstream 2023 New Course transformation program
• Create long-term strategy and vision for INA R&M in line with sus-tainability trends
46 47
SISAKINDUSTRIAL SITE
DEPOTS*
RETAIL
WHOLESALE(HR,BiH,SLO,IT)
1,657 kt
938 kt
1,498 kt
OTHEREXPORTS
RIJEKAREFINERY
4.5 MtpaNCI: 9.1
4
7
7
liquid depots
LPG depots
into plane locations
LOGISTICS TRANSPORTATION ASSETS**
more than more than
500 3250 road tanker cars rail tanker cars own vessels* includes Rijeka and Sisak depots
** includes rented and owned assets

48 49
COMMERCIAL ACTIVITIES
Considering the unfavorable external environment and the increased competition in the region, INA, d.d. successfully safe-guarded its market position on core markets in Croatia and Bosnia & Herzegovina. Motor fuel demand decline was partially offset by strong wholesale performance and cost control in Refining and Marketing. The severe decline in jet fuel demand was compensat-ed by higher diesel production and the successful start-up of the Propane-Propylene Splitter counterbalanced some of the negative effects of lower LPG demand on the core markets. Trading activi-ties were mainly focused on competitive crude sourcing, inventory risk management, and contango opportunities.
REFINING OPERATIONS
As an integral part of INA Downstream 2023 New Course program, processing was concentrated at one location, the Rijeka Refinery. In response to the International Maritime Organization (here-inafter: IMO) marine fuel regulation, Rijeka Refinery processed only light low sulphur crudes to enable fuel oil production with 0.5% sulphur content as the optimal economic solution. From the approved low sulphur crude basket, mainly Azeri crude was processed. Part of domestic crude from Podravina was constant-ly delivered to Rijeka and added into processing.
Two Rijeka Refinery optimizations were planned and executed in 2020. Works during January-February were focused on HCU furnace repair. The second refinery optimization started in the beginning of November and was driven by economic reasons - low market demand and deteriorating margins. Performance in this period was better than planned (i.e. white product yields, operational availability, and slop processing).
Start-up of a new process unit, the Propane-Propylene Splitter, was a major event on production side in 2020. Unit test produc-tion started in late June, while the first quantities of propylene were sold in the beginning of August.
LOGISTICS AND DISTRIBUTION
Logistics continued with efficiency increase by reorganizing busi-ness processes in planning and transportation, which resulted in unit cost decrease of 7%. At the same time, according to external survey, customer satisfaction with Logistics services increased with a stable OTIF (on time in full) rate of 98%. In line with the transformation of Sisak, Logistics took over blending activities in Sisak, including gasoline and fuel oil blending processes and coor-dination of crude oil transfer. Despite operational and investment budget cuts, Logistics succeeded in technical upgrades such as enabling E5 gasoline storage at Osijek Terminal and putting new firefighting system in full operation at Into-plane Terminal Zagreb. With zero own staff injuries, injury rate in Logistics continued with a positive trend. More than 40 different trainings for more than 400 blue collar workers aimed at competencies improvement were conducted, which resulted in salary increase for many workers.
GAS AND POWER
INA, d.d. total natural gas sales amounted to 894 bcm, securing the position as a major supplier on the Croatian market. By the end of June, INA, d.d. secured deliveries of natural gas for the gas year 2020/2021, thus ensuring the leading role among traders and sup-pliers in Croatia. Due to domestic production decline, the need for contracting other gas suppliers increased. In June, two contracts were signed with reputable suppliers ensuring flexible natural gas source on VTP Croatia with the possibility to import up to 270 mcm of natural gas per gas year. In 2020, INA, d.d. obtained the energy li-cense for the next three years for power trading and energy license for power supply. For the first time a big step in improving power procurement and optimization of power cost for INA Group was made. Having insight into the power market and buying power in tranches through HEPI TRADER platform decreased the power price by 9.2% in 2021 compared to 2020, with no “take or pay” obligation and full flexibility in consumption.
RESIDUE UPGRADE PROJECT
Despite a challenging business environment and minor delays during preventive measures introduced due to pandemic, works on currently the largest project in INA, d.d. has not stopped, and the start of operation is planned for 2023 as contracted.
Preparation of engineering documentation proceeds as planned, while the review of Piping and Instrumentation Diagram (hereinafter: P&ID), Hazard and Operability Study (hereinafter: HAZOP) and 30% of 3D model review of Project process units was performed. All equipment with a long delivery time has been ordered and manufacturing of coke drums and fractionator has started. Preparatory activities at the construction site started in accordance with the obtained building permits, as well as the relocation of underground installations. In November, the main excavation and laying of the foundation in the area of the future Residue Upgrade Unit began. In December, civil engineering works started on units to be revamped during Refinery economic optimization, ahead of the schedule, while the site preparation activities also started for the new electrical substation.
Croatian companies are largely participating in the execution of the project, through engineering, material and equipment delivery as well as construction and other works. During the per-formance of all works, special attention is paid to the safety and health of all involved, both INA Group employees and workers of all contractors and subcontractors.
DEVELOPMENT
In order to mitigate the negative effect of crisis on refining business and projects, measures were taken to decrease CAPEX budget to 57% for business essentials, HSE and legal compliance. The Biorefinery Project contracted technology and license for which Basic Engineering Design package was delivered in Q3. The Government also provided support to the Project by listing it as a
Strategic Project for the Republic of Croatia. Read more about the Biorefinery project in chapter Global overview on climate change and our response.
New projects are highly focused on energy efficiency improvement and renewable energy utilization. Hydrogen project is creating new value chain which would be a significant contributor in GHG emission reduction in transport. For its development, a joint project with the City of Zagreb was awarded financial backing by the Fuel Cells and Hydrogen Joint Undertaking. Read more about the Hydrogen project in chapter Global overview on climate change and our response.
OVERVIEW AND KEY ACHIEVEMENTS FOR THE YEAR 2020
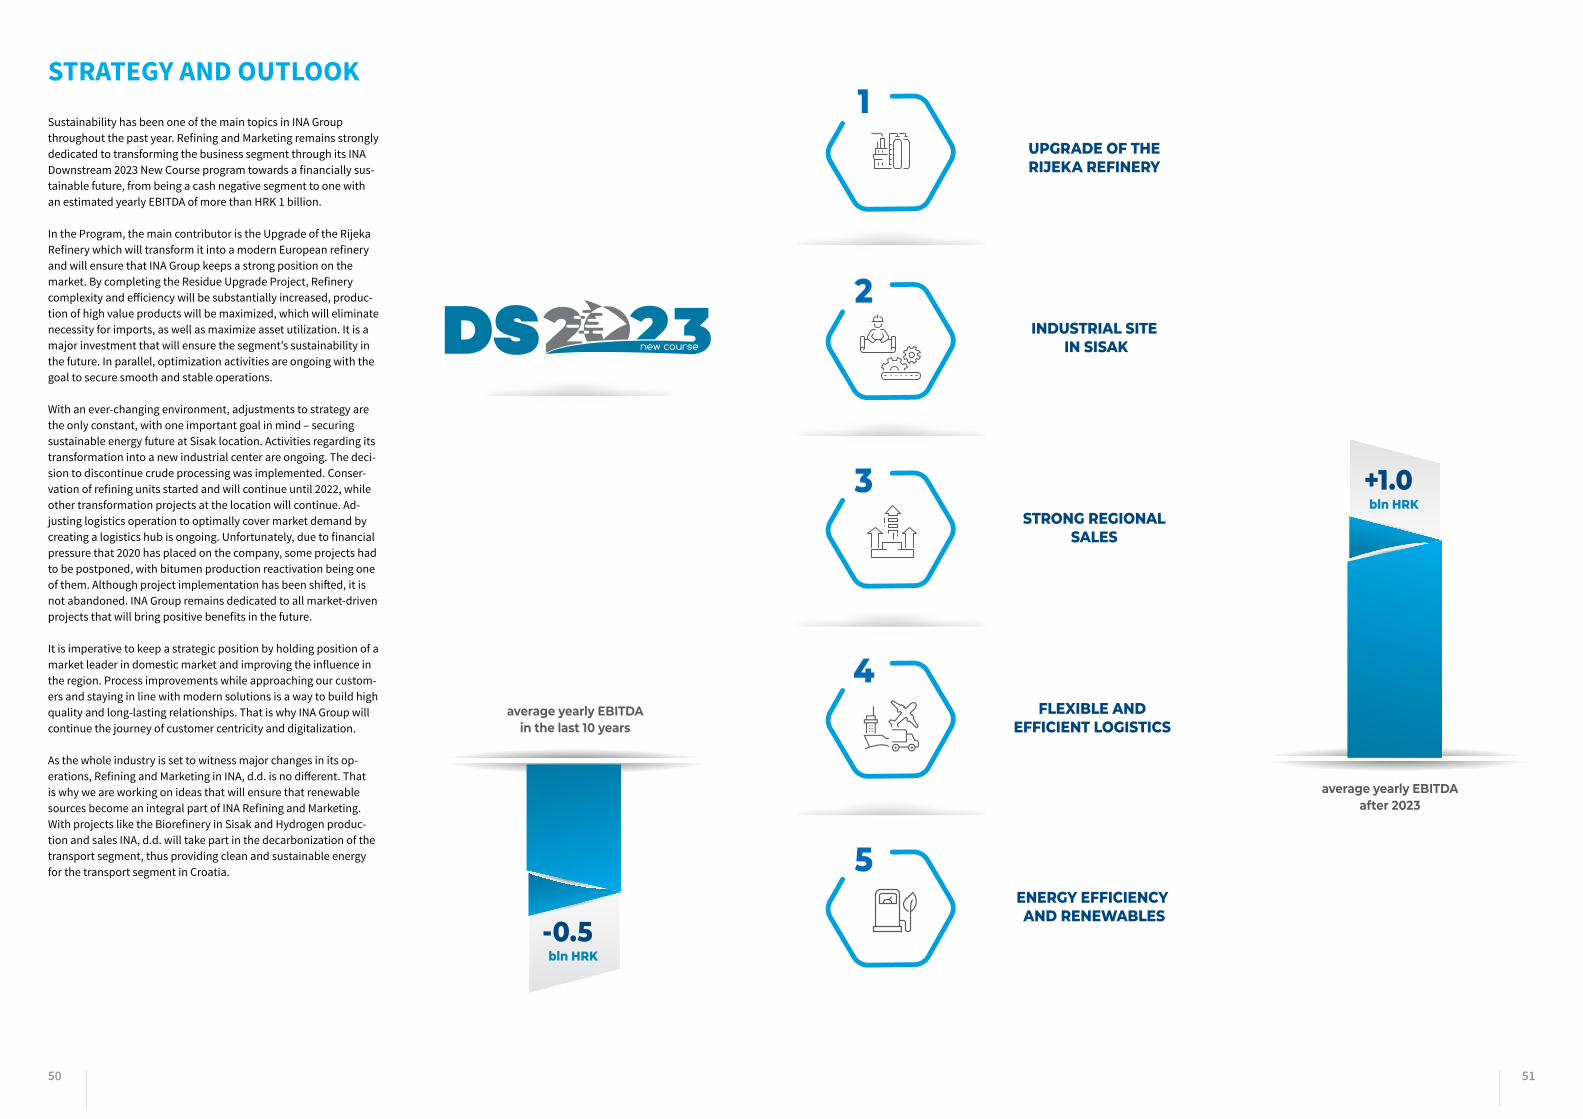
50 51
average yearly EBITDAin the last 10 years
UPGRADE OF THERIJEKA REFINERY
INDUSTRIAL SITE IN SISAK
STRONG REGIONALSALES
1
2
3
average yearly EBITDAafter 2023
FLEXIBLE AND EFFICIENT LOGISTICS
4
ENERGY EFFICIENCY AND RENEWABLES
5
bln HRK-0.5
bln HRK+1.0
STRATEGY AND OUTLOOK Sustainability has been one of the main topics in INA Group throughout the past year. Refining and Marketing remains strongly dedicated to transforming the business segment through its INA Downstream 2023 New Course program towards a financially sus-tainable future, from being a cash negative segment to one with an estimated yearly EBITDA of more than HRK 1 billion.
In the Program, the main contributor is the Upgrade of the Rijeka Refinery which will transform it into a modern European refinery and will ensure that INA Group keeps a strong position on the market. By completing the Residue Upgrade Project, Refinery complexity and efficiency will be substantially increased, produc-tion of high value products will be maximized, which will eliminate necessity for imports, as well as maximize asset utilization. It is a major investment that will ensure the segment’s sustainability in the future. In parallel, optimization activities are ongoing with the goal to secure smooth and stable operations.
With an ever-changing environment, adjustments to strategy are the only constant, with one important goal in mind – securing sustainable energy future at Sisak location. Activities regarding its transformation into a new industrial center are ongoing. The deci-sion to discontinue crude processing was implemented. Conser-vation of refining units started and will continue until 2022, while other transformation projects at the location will continue. Ad-justing logistics operation to optimally cover market demand by creating a logistics hub is ongoing. Unfortunately, due to financial pressure that 2020 has placed on the company, some projects had to be postponed, with bitumen production reactivation being one of them. Although project implementation has been shifted, it is not abandoned. INA Group remains dedicated to all market-driven projects that will bring positive benefits in the future.
It is imperative to keep a strategic position by holding position of a market leader in domestic market and improving the influence in the region. Process improvements while approaching our custom-ers and staying in line with modern solutions is a way to build high quality and long-lasting relationships. That is why INA Group will continue the journey of customer centricity and digitalization.
As the whole industry is set to witness major changes in its op-erations, Refining and Marketing in INA, d.d. is no different. That is why we are working on ideas that will ensure that renewable sources become an integral part of INA Refining and Marketing. With projects like the Biorefinery in Sisak and Hydrogen produc-tion and sales INA, d.d. will take part in the decarbonization of the transport segment, thus providing clean and sustainable energy for the transport segment in Croatia.

52 53
FINANCIAL AND OPERATING PERFORMANCE In 2020, Refining and Marketing performance was affected by a deteriorating refining margin environment, lower Brent price (-17 USD/bbl) and crack spreads of key products compared to 2019: decreased diesel (-43 USD/t), gasoline (-18 USD/t), jet (-55 USD/t), which were partially mitigated by higher crack spreads of fuel oil (+18 USD/t) and LPG (+153 USD/t).
Refining profitability and utilization was pressured by the depressed external environment during most of 2020, which resulted in adjusting processing in Rijeka Refinery to the minimum capacity and even shutting down the refinery for economic reasons in November and Decem-ber. Rijeka Refinery processed only light crudes achieving 80% yield of white products.
On the other hand, INA's fuel sales performance on captive markets was driven by strong wholesale activity which remained relatively close to 2019 level (-8%), despite a significantly impacted demand. Transfers to retail -139 kt (-15%) were lower than last year. The overall com-mercial performance on captive markets, Croatia (-208 kt) and B&H market (-130 kt) was lower as a result of the significant demand drop due to the impact of the pandemic. However, the lost volume could be partially compensated by the +11 USD/t higher commercial margin achieved for own fuel sales on captive market vs 2019 (+12 USD/t in Croatia and +2 USD/t in B&H).
The segment results in terms of Clean CCS EBITDA were at a similar level compared to the previous year, mainly driven by strict and robust cost saving measures, strong wholesale performance on captive markets, higher sales margins on captive markets and lower energy costs, partly offsetting lower demand for refined products and depressed refinery economics caused by the pandemic and slow-down in econom-ic activity.
Refining and Marketing capital expenditures decreased mainly as a measure to counter the effects of the pandemic and amounted to HRK 622 million compared to HRK 1,071 million in 2019, mainly related to the Rijeka Refinery Upgrade, Biorefinery project and Propane-Propyl-ene Splitter project.
SEGMENT RESULTS* HRK MLN USD MLN**
2019 2020 CH % 2019 2020 CH %
TOTAL REVENUE 21,530 14,153 (34) 3,252 2,141 (34)
EBITDA1 518 (153) (130) 78 (23) (129)
EBITDA EXCLUDING SPECIAL ITEMS2 518 (153) (130) 78 (23) (129)
CCS-BASED DS EBITDA EXCLUDING SPECIAL ITEMS2 556 639 15 84 97 15
LOSS FROM OPERATIONS (230) (1,231) 435 (35) (186) 431
LOSS FROM OPERATIONS EXCLUDING SPECIAL ITEMS2 (230) (936) 307 (35) (142) 306
CCS-BASED DS LOSS FROM OPERATIONS (192) (144) (25) (29) (22) (24)
SIMPLIFIED FREE CASH FLOW3 (780) (109) (86) (118) (16) (86)
CAPITAL EXPENDITURES 1,336 748 (44) 202 113 (44)
O/W REFINING AND MARKETING 1,071 622 (42) 162 94 (42)
* Refers to Refining and Marketing including Consumer Services and Retail INA, d.d. and the following subsidiaries: INA MAZIVA d.o.o., INA Slovenija d.o.o., Holdina d.o.o., INA Crna Gora d.o.o., INA d.o.o. Beograd, INA Kosovo d.o.o., Energopetrol d.d., INA MALOPRODAJNI SERVISI d.o.o., Croplin d.o.o. ** In converting HRK figures into USD, the following average CNB rates were used: for 2019 – 6.62 HRK/USD; for 2020 – 6.61 HRK/USD1 EBITDA = EBIT + Depreciation, amortization and impairment (net)2 In 2020, result was negatively impacted by HRK 295 million of impairment of assets - Sisak refinery assets 3 Simplified free cash flow = CCS EBITDA excluding special items – Capital expenditures
REFINING AND MARKETING INCLUDING CONSUMER SERVICES AND RETAIL 2019 2020 CH %
REFINING PROCESSING (KT)
DOMESTIC CRUDE OIL 516 90 (83)
IMPORTED CRUDE OIL 2,032 1,889 (7)
CONDENSATE 38 - N.A.
OTHER FEEDSTOCK 550 757 38
TOTAL 3,136 2,737 (13)
REFINING PRODUCTION (KT)
LPG* 157 153 (3)
NAPHTHA 14 122 771
GASOLINE 775 616 (21)
KEROSENE 162 58 (64)
DIESEL 1,096 1,119 2
HEATING OIL 89 79 (11)
FUEL OIL 371 247 (33)
OTHER PRODUCTS** 121 69 (43)
TOTAL 2,785 2,464 (12)
REFINING LOSS 44 26 (41)
OWN CONSUMPTION 307 247 (20)
TOTAL REFINING PRODUCTION 3,136 2,737 (13)
REFINED PRODUCT SALES BY COUNTRY (KT)
CROATIA 2,218 1,803 (19)
BOSNIA AND HERZEGOVINA 769 607 (21)
SLOVENIA 64 44 (31)
ITALY 309 140 (55)
OTHER MARKETS 1,044 1,498 43
TOTAL 4,404 4,093 (7)
REFINED PRODUCT SALES BY PRODUCT (KT)
LPG* 248 227 (8)
NAPHTHA 13 38 192
GASOLINE 848 737 (13)
KEROSENE 220 58 (74)
DIESEL 2,135 1,808 (15)
HEATING OIL 128 123 (4)
FUEL OIL 364 252 (31)
BITUMEN 74 75 1
OTHER PRODUCTS*** 374 775 107
TOTAL 4,404 4,093 (7)
O/W CONSUMER SERVICES AND RETAIL SEGMENT SALES 1,115 938 (16)
TOTAL NATURAL GAS SALES (mcm) 1,271 894 (30)* LPG + propylene**Other products = Benzene concentrate, liquid Sulphur, coke, motor oils, industrial lubricants, other intermediates ***Other products = Benzene concentrate, heavy naphtha, vacuum gas oil, liquid sulphur, coke, crude oil, motor oils, industrial lubricants
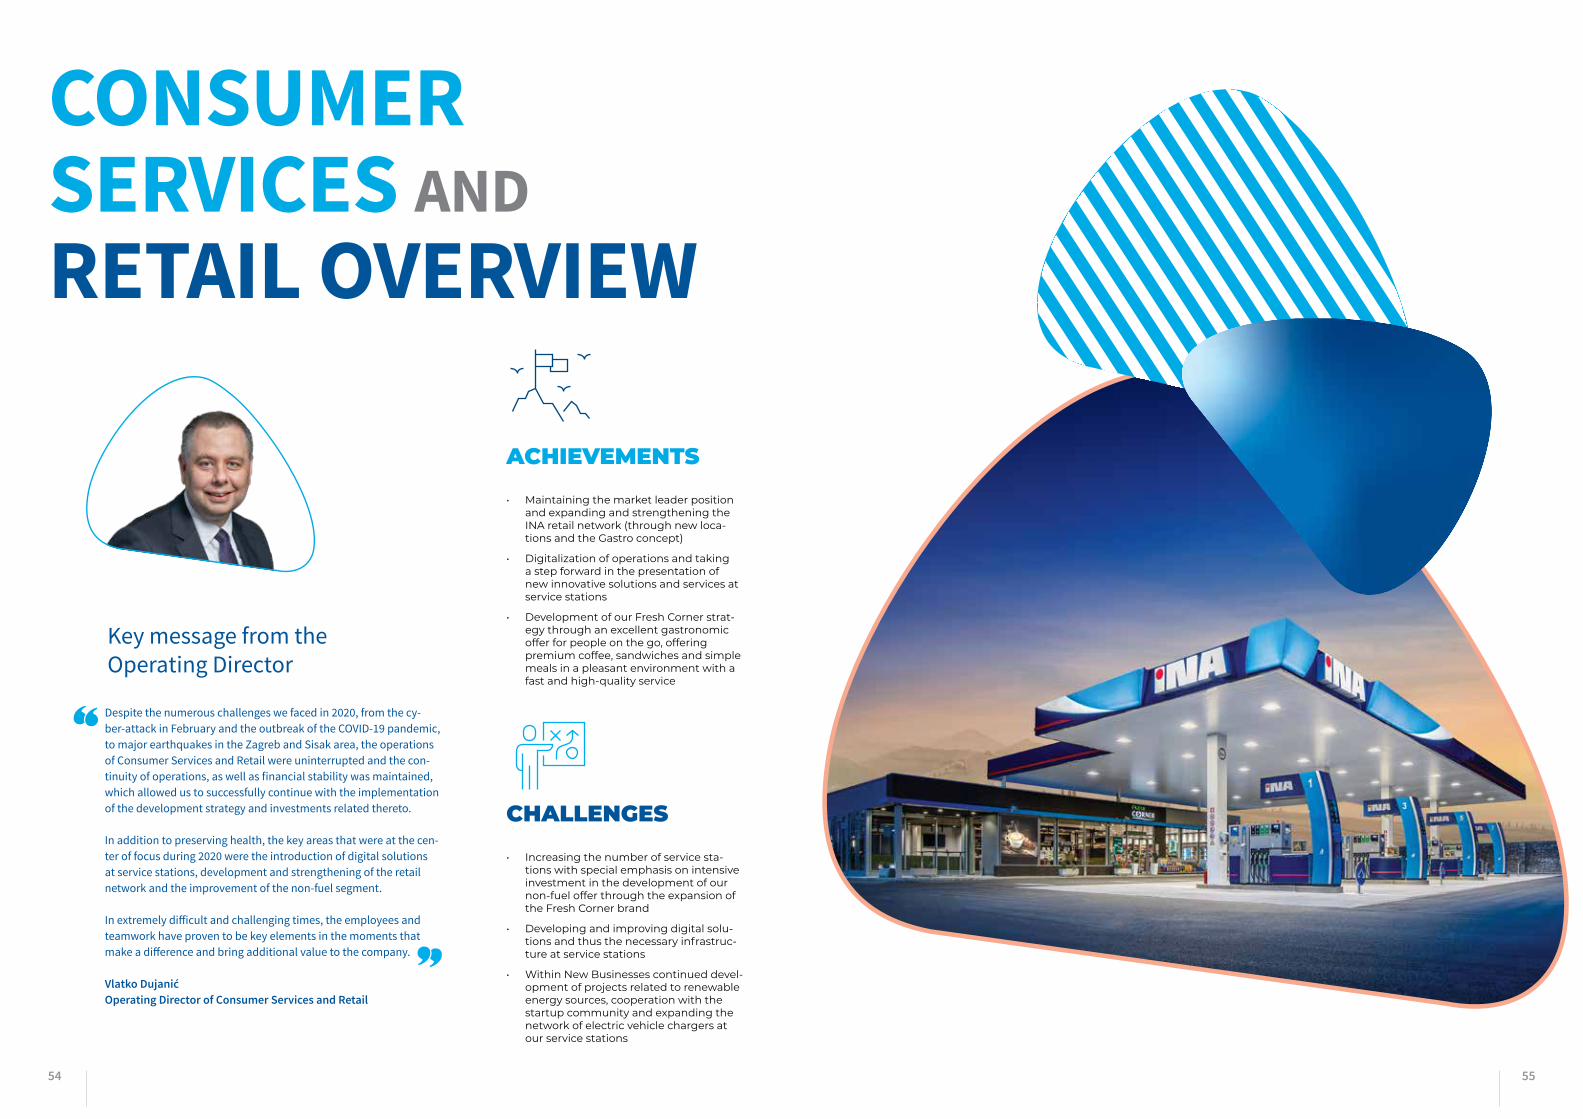
54 55
CONSUMER SERVICES AND RETAIL OVERVIEW
Key message from theOperating Director
Despite the numerous challenges we faced in 2020, from the cy-ber-attack in February and the outbreak of the COVID-19 pandemic, to major earthquakes in the Zagreb and Sisak area, the operations of Consumer Services and Retail were uninterrupted and the con-tinuity of operations, as well as financial stability was maintained, which allowed us to successfully continue with the implementation of the development strategy and investments related thereto.
In addition to preserving health, the key areas that were at the cen-ter of focus during 2020 were the introduction of digital solutions at service stations, development and strengthening of the retail network and the improvement of the non-fuel segment.
In extremely difficult and challenging times, the employees and teamwork have proven to be key elements in the moments that make a difference and bring additional value to the company.
Vlatko DujanićOperating Director of Consumer Services and Retail
ACHIEVEMENTS
• Maintaining the market leader position and expanding and strengthening the INA retail network (through new loca-tions and the Gastro concept)
• Digitalization of operations and taking a step forward in the presentation of new innovative solutions and services at service stations
• Development of our Fresh Corner strat-egy through an excellent gastronomic offer for people on the go, offering premium coffee, sandwiches and simple meals in a pleasant environment with a fast and high-quality service
CHALLENGES
• Increasing the number of service sta-tions with special emphasis on intensive investment in the development of our non-fuel offer through the expansion of the Fresh Corner brand
• Developing and improving digital solu-tions and thus the necessary infrastruc-ture at service stations
• Within New Businesses continued devel-opment of projects related to renewable energy sources, cooperation with the startup community and expanding the network of electric vehicle chargers at our service stations

56 57
OVERVIEW AND KEY ACHIEVEMENTS FOR THE YEAR 2020
CONSUMER SERVICES AND RETAIL
During the extremely challenging year 2020, in which we were forced to face a cyber-attack, the coronavirus epidemic and earthquakes in the Zagreb and Sisak area, from the very begin-ning we were aware of the area in relation to which no compro-mise was acceptable for us, and that is protecting the health of our employees, customers and business partners.
The economic crisis caused by the coronavirus pandemic has had a severe impact on the global oil and gas industry, leading to a sharp decline in demand for oil products, but we have never-theless managed to maintain the continuity of operations and financial stability at the level of Consumer Services and Retail. We have also continued with the implementation of the success-ful development strategy and investment.
RETAIL NETWORK AND SERVICE DEVELOPMENT
Despite the challenges, we have not stopped paying attention to the needs of our customers. Through capital expenditures, service quality improvement, preparation for the tourist season and various strategic projects, we have continued with the strong development of the largest retail network in Croatia and B&H consisting of more than 500 retail locations that are visited by more than 200.000 of our customers on a daily basis, and through which more than a billion liters of fuel is sold annually.
In such a precarious situation, our decision to expand the range of products and services and develop the gastronomic concept, with an emphasis on the "on the go" segment, also proved to be well-founded.
Customer satisfaction has always been our number one priority and our goal is to be the first choice for people on the go and the market leader with a targeted range of products and services, as well as the number one gastronomic destination on a journey. Although the circumstances were demanding, we were able to expand our retail network and launch new services.
Reconstructions of important service stations that are parts of the INA Group retail network have been completed - Zagreb Heinzelova, Split Pojišan and Vukova Gorica. There is now a Fresh Corner with a terrace at the Heinzelova service station in Zagreb, we have modernized service stations in Ploče and in the imme-diate vicinity of Rijeka, and the Split-Pojišan service station, with a fresh and pleasant setting for rest and refreshment and a rich Fresh Corner offer, has been renovated and put into operation.
At the beginning of July, INA Group opened a unique gastro-nomic corner at the well-known retail location and busy rest stop of Vukova Gorica - the first Fresh Corner restaurant in our retail network consisting of a total of 85 Fresh Corners in Croatia, and the menu was created in collaboration with top experts in gastronomy. In addition to the newly furnished Fresh Corner, the first McDonald's restaurant on Croatian highways was opened at the location as part of a partnership with the company Globalna Hrana d.o.o. This location also offers customers the opportunity to refuel with high-quality fuels and purchase other products and services from a wide range of products, all in one place.
With the aim of strengthening our market position, several leading locations on the market have joined INA’s retail network, and a noticeable step forward has been made in the development of our Fresh Corner strategy in the central business facility in Zagreb.
The Fresh Corner mezzanine in INA’s headquarters building be-gan its operation in the midst of a cyber-attack and it continued during the coronavirus epidemic. Next to the Fresh Corner mez-zanine, the "Innovation HUB Center" was opened, equipped with a state-of-the-art conference room and a room for brainstorming and fostering creative inspiration, which fulfilled even better conditions for the continued transformation of INA, d.d. into an even more innovative and creative company.
In addition to the aforementioned, it should be noted that INA Group’s presence on the A3 highway has been ensured for the next 25 years since the company was awarded the concession contract after a tender procedure.
Fresh Corners at our service stations have become an indispens-able place where customers can take a break from traveling and enjoy the rich gastronomic offer, freshly brewed coffee, hot fast food and a diverse range of products and services.
In the year 2020, we also launched Fresh Corner digital com-munication via microsite, and for the first time we conducted a national campaign for our Hot Dog product. In addition to coffee in the beverage category, we consider the Hot Dog to be our hero product in the food category. At as many as 62 Fresh Corner locations, top quality professional Hot Dog rollers have been im-plemented, which will ensure even faster preparation and better presentation of food at retail locations, as well as the implemen-tation of high standards in food preparation.
In line with the requirement of as urgent adjustment as possible to the new emergency situation we were facing, and in parallel with consumer expectations, the range of our products and services at retail locations evolved as well. Thus, our product portfolio was expanded with basic hygiene supplies, including disinfection products and protective masks, as well as basic foodstuffs.
DIGITALIZATION
The importance and need for the use of digital solutions is more pronounced than ever. Thus, we were among the first companies in Croatia to raise the limit for contactless card payments at our retail locations in order to reduce the time customers spend in the shop area. We have also made it possible for customers who are users of INA card to perform contactless payment via the INA PAY application, and we have expanded the network of self-checkout devices. All epidemiological measures prescribed by the Civil Protection Headquarters of the Republic of Croatia, as well as the recommendations of the Croatian Institute of Public Health, continue to be strictly implemented at our retail locations.
The most challenging project implemented by the Consumer Services and Retail business division in 2020 is certainly the introduction of the INA Loyalty digital platform. This is a new and unique loyalty program for customers, which was, as such, first launched by INA, d.d. Colleagues from Customer Relations Management worked diligently on this project and it was officially presented in September 2020. The loyalty program was first presented to our employees, journalists and INA Group business partners, after which the launch for customers began. During October, a large national campaign was launched through all forms of advertising in order to familiarize the customers with the program as much as possible.
The entire program is accompanied by a new INA Loyalty mobile application that has easily and quickly become a companion for loyal customers in collecting points and realizing benefits at INA service stations, such as discounts on fuel, car cosmetics and other services, participation in exciting prize-winning games and special promotions, using collected points for Fresh Corner food and beverages, finding the nearest INA service station and managing one’s INA Loyalty profile.
The INA Loyalty program is unique in that it is possible to create personalized benefits and rewards for each customer in accordance with their actual shopping habits and needs, and thus the customer actively participates in independent fashioning of their experience in the INA Loyalty program. By participating in the program, points are earned for every liter of fuel purchased and for almost every HRK spent on products or services at INA Group’s retail locations, for which INA Group rewards you in return. By joining the program, one immediately becomes a Blue Tier member and by collecting further points, the tiers change and access to various benefits of the Silver, Gold or VIP Tier is realized.
7/2020Application launch
1,100registered users with assigned card
B2BAvailable only for INA Card business users
1,460transactions monthly
419business partners has registered
service with assigned card
AvailabilityCan be used on all retail
locations in Croatia
8,758transactions in 2020
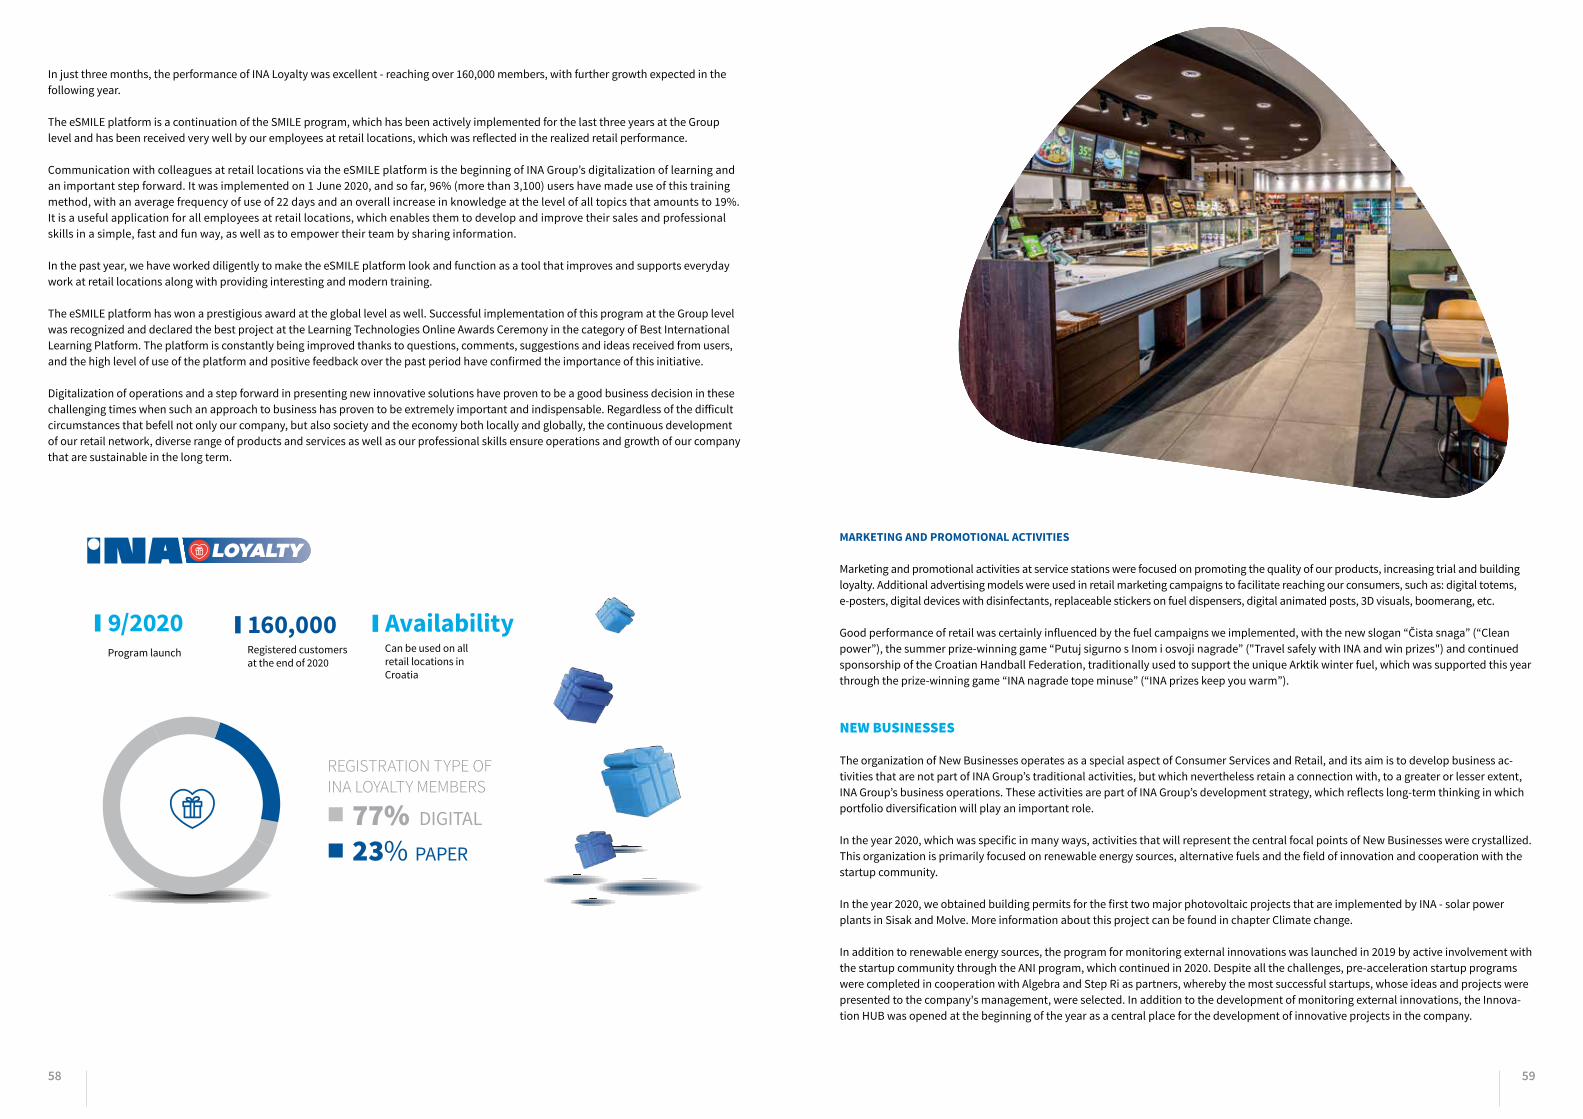
58 59
MARKETING AND PROMOTIONAL ACTIVITIES
Marketing and promotional activities at service stations were focused on promoting the quality of our products, increasing trial and building loyalty. Additional advertising models were used in retail marketing campaigns to facilitate reaching our consumers, such as: digital totems, e-posters, digital devices with disinfectants, replaceable stickers on fuel dispensers, digital animated posts, 3D visuals, boomerang, etc.
Good performance of retail was certainly influenced by the fuel campaigns we implemented, with the new slogan “Čista snaga” (“Clean power”), the summer prize-winning game “Putuj sigurno s Inom i osvoji nagrade” ("Travel safely with INA and win prizes") and continued sponsorship of the Croatian Handball Federation, traditionally used to support the unique Arktik winter fuel, which was supported this year through the prize-winning game “INA nagrade tope minuse” (“INA prizes keep you warm”).
REGISTRATION TYPE OF INA LOYALTY MEMBERS
9/2020Program launch
AvailabilityCan be used on all retail locations in Croatia
160,000Registered customers at the end of 2020
23% PAPER
77% DIGITAL
NEW BUSINESSES
The organization of New Businesses operates as a special aspect of Consumer Services and Retail, and its aim is to develop business ac-tivities that are not part of INA Group’s traditional activities, but which nevertheless retain a connection with, to a greater or lesser extent, INA Group’s business operations. These activities are part of INA Group’s development strategy, which reflects long-term thinking in which portfolio diversification will play an important role.
In the year 2020, which was specific in many ways, activities that will represent the central focal points of New Businesses were crystallized. This organization is primarily focused on renewable energy sources, alternative fuels and the field of innovation and cooperation with the startup community.
In the year 2020, we obtained building permits for the first two major photovoltaic projects that are implemented by INA - solar power plants in Sisak and Molve. More information about this project can be found in chapter Climate change.
In addition to renewable energy sources, the program for monitoring external innovations was launched in 2019 by active involvement with the startup community through the ANI program, which continued in 2020. Despite all the challenges, pre-acceleration startup programs were completed in cooperation with Algebra and Step Ri as partners, whereby the most successful startups, whose ideas and projects were presented to the company's management, were selected. In addition to the development of monitoring external innovations, the Innova-tion HUB was opened at the beginning of the year as a central place for the development of innovative projects in the company.
In just three months, the performance of INA Loyalty was excellent - reaching over 160,000 members, with further growth expected in the following year.
The eSMILE platform is a continuation of the SMILE program, which has been actively implemented for the last three years at the Group level and has been received very well by our employees at retail locations, which was reflected in the realized retail performance.
Communication with colleagues at retail locations via the eSMILE platform is the beginning of INA Group’s digitalization of learning and an important step forward. It was implemented on 1 June 2020, and so far, 96% (more than 3,100) users have made use of this training method, with an average frequency of use of 22 days and an overall increase in knowledge at the level of all topics that amounts to 19%. It is a useful application for all employees at retail locations, which enables them to develop and improve their sales and professional skills in a simple, fast and fun way, as well as to empower their team by sharing information.
In the past year, we have worked diligently to make the eSMILE platform look and function as a tool that improves and supports everyday work at retail locations along with providing interesting and modern training.
The eSMILE platform has won a prestigious award at the global level as well. Successful implementation of this program at the Group level was recognized and declared the best project at the Learning Technologies Online Awards Ceremony in the category of Best International Learning Platform. The platform is constantly being improved thanks to questions, comments, suggestions and ideas received from users, and the high level of use of the platform and positive feedback over the past period have confirmed the importance of this initiative.
Digitalization of operations and a step forward in presenting new innovative solutions have proven to be a good business decision in these challenging times when such an approach to business has proven to be extremely important and indispensable. Regardless of the difficult circumstances that befell not only our company, but also society and the economy both locally and globally, the continuous development of our retail network, diverse range of products and services as well as our professional skills ensure operations and growth of our company that are sustainable in the long term.
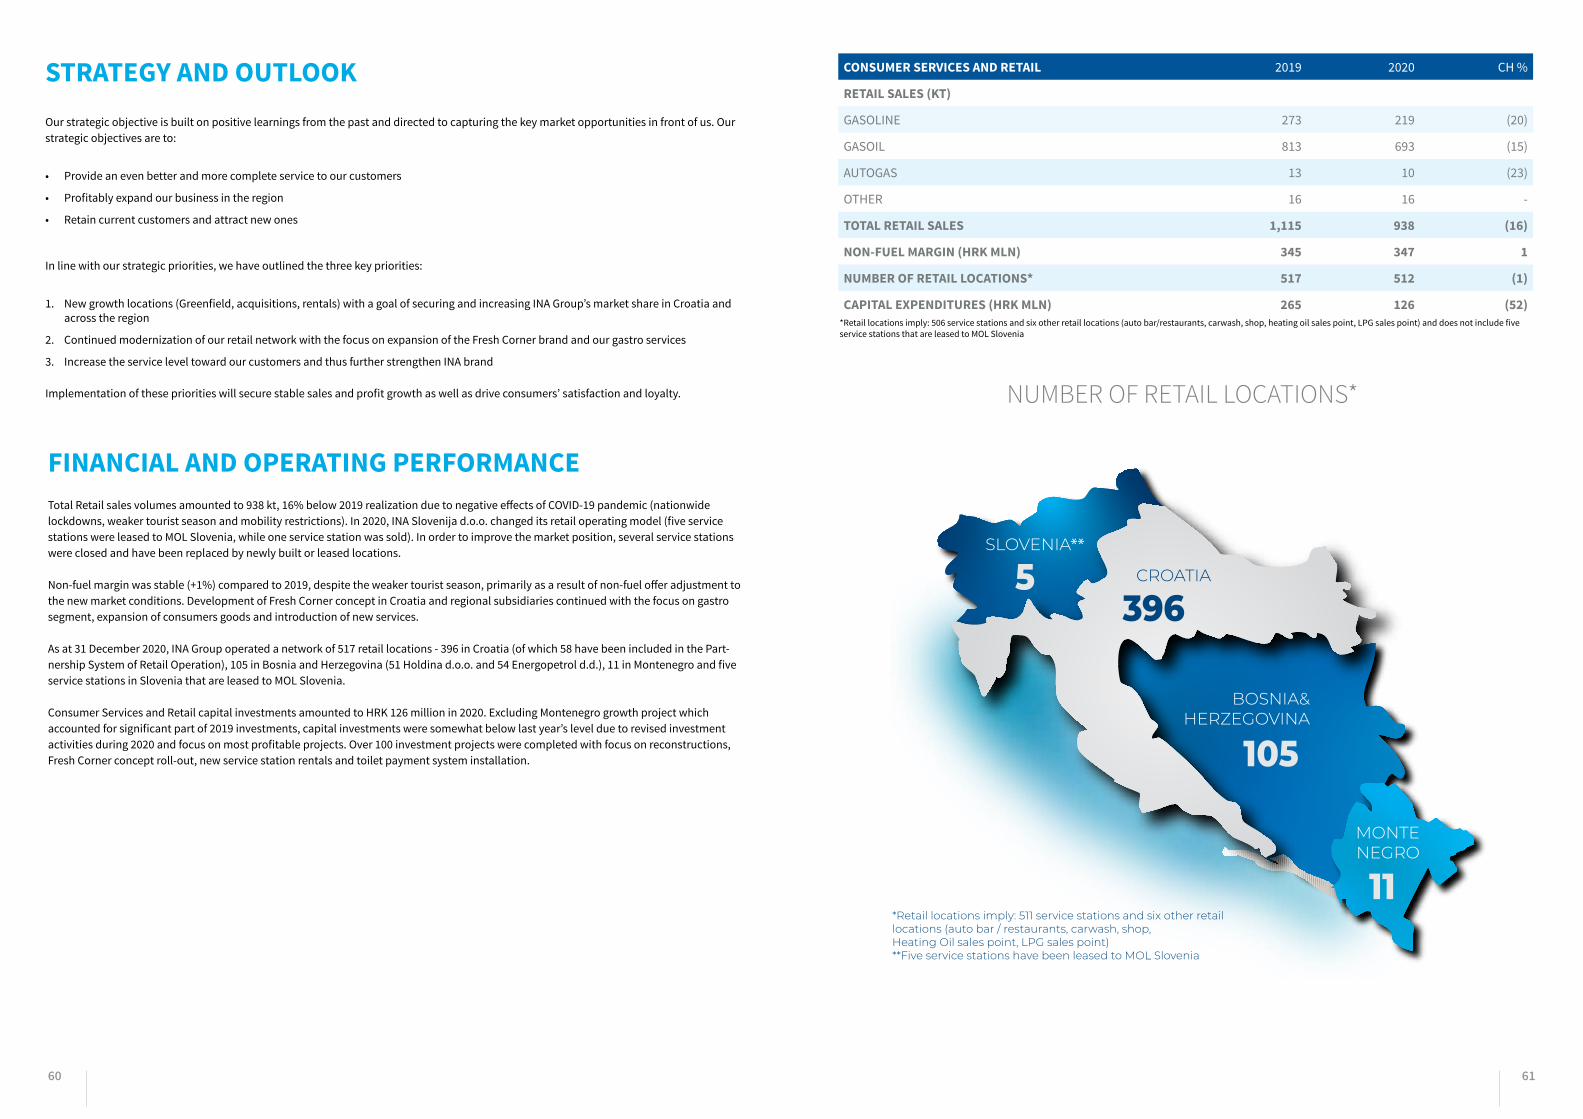
60 61
396
105
11
5
*Retail locations imply: 511 service stations and six other retail locations (auto bar / restaurants, carwash, shop,Heating Oil sales point, LPG sales point)**Five service stations have been leased to MOL Slovenia
**
NUMBER OF RETAIL LOCATIONS*
CONSUMER SERVICES AND RETAIL 2019 2020 CH %
RETAIL SALES (KT)
GASOLINE 273 219 (20)
GASOIL 813 693 (15)
AUTOGAS 13 10 (23)
OTHER 16 16 -
TOTAL RETAIL SALES 1,115 938 (16)
NON-FUEL MARGIN (HRK MLN) 345 347 1
NUMBER OF RETAIL LOCATIONS* 517 512 (1)
CAPITAL EXPENDITURES (HRK MLN) 265 126 (52)*Retail locations imply: 506 service stations and six other retail locations (auto bar/restaurants, carwash, shop, heating oil sales point, LPG sales point) and does not include five service stations that are leased to MOL Slovenia
FINANCIAL AND OPERATING PERFORMANCE Total Retail sales volumes amounted to 938 kt, 16% below 2019 realization due to negative effects of COVID-19 pandemic (nationwide lockdowns, weaker tourist season and mobility restrictions). In 2020, INA Slovenija d.o.o. changed its retail operating model (five service stations were leased to MOL Slovenia, while one service station was sold). In order to improve the market position, several service stations were closed and have been replaced by newly built or leased locations.
Non-fuel margin was stable (+1%) compared to 2019, despite the weaker tourist season, primarily as a result of non-fuel offer adjustment to the new market conditions. Development of Fresh Corner concept in Croatia and regional subsidiaries continued with the focus on gastro segment, expansion of consumers goods and introduction of new services.
As at 31 December 2020, INA Group operated a network of 517 retail locations - 396 in Croatia (of which 58 have been included in the Part-nership System of Retail Operation), 105 in Bosnia and Herzegovina (51 Holdina d.o.o. and 54 Energopetrol d.d.), 11 in Montenegro and five service stations in Slovenia that are leased to MOL Slovenia.
Consumer Services and Retail capital investments amounted to HRK 126 million in 2020. Excluding Montenegro growth project which accounted for significant part of 2019 investments, capital investments were somewhat below last year’s level due to revised investment activities during 2020 and focus on most profitable projects. Over 100 investment projects were completed with focus on reconstructions, Fresh Corner concept roll-out, new service station rentals and toilet payment system installation.
STRATEGY AND OUTLOOK Our strategic objective is built on positive learnings from the past and directed to capturing the key market opportunities in front of us. Our strategic objectives are to:
• Provide an even better and more complete service to our customers
• Profitably expand our business in the region
• Retain current customers and attract new ones
In line with our strategic priorities, we have outlined the three key priorities:
1. New growth locations (Greenfield, acquisitions, rentals) with a goal of securing and increasing INA Group’s market share in Croatia and across the region
2. Continued modernization of our retail network with the focus on expansion of the Fresh Corner brand and our gastro services
3. Increase the service level toward our customers and thus further strengthen INA brand
Implementation of these priorities will secure stable sales and profit growth as well as drive consumers’ satisfaction and loyalty.

62 63
040
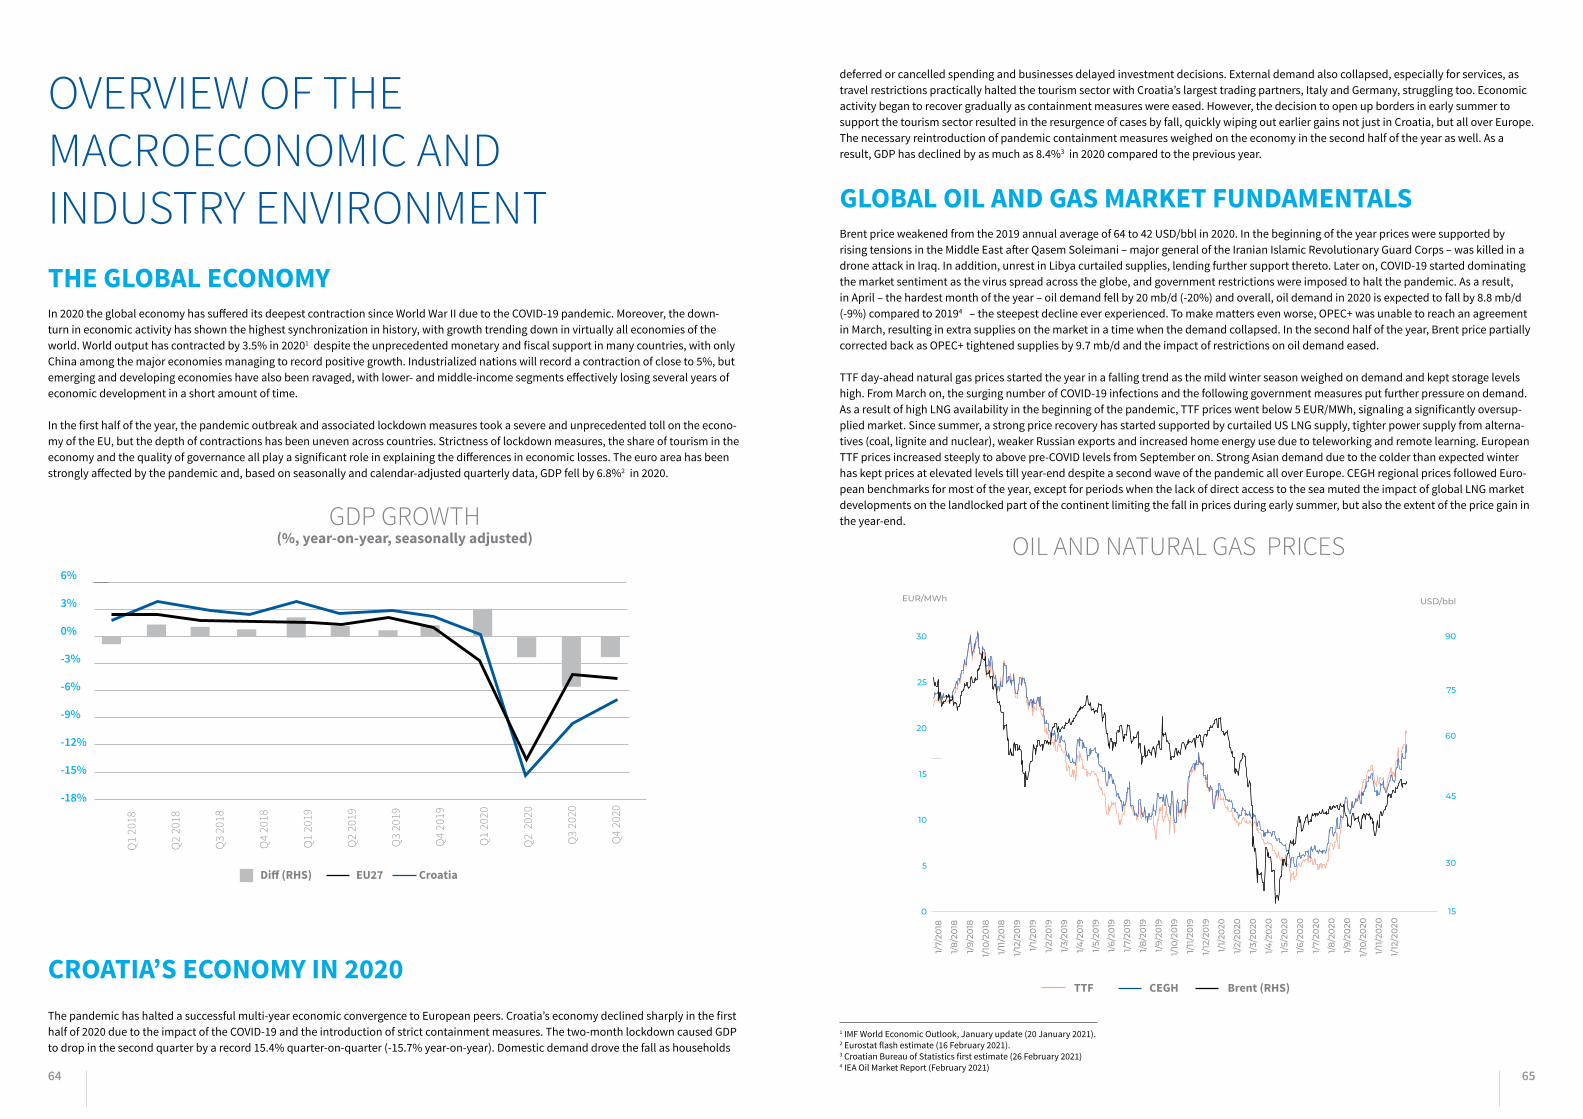
64 65
OVERVIEW OF THE MACROECONOMIC AND INDUSTRY ENVIRONMENT THE GLOBAL ECONOMY In 2020 the global economy has suffered its deepest contraction since World War II due to the COVID-19 pandemic. Moreover, the down-turn in economic activity has shown the highest synchronization in history, with growth trending down in virtually all economies of the world. World output has contracted by 3.5% in 20201 despite the unprecedented monetary and fiscal support in many countries, with only China among the major economies managing to record positive growth. Industrialized nations will record a contraction of close to 5%, but emerging and developing economies have also been ravaged, with lower- and middle-income segments effectively losing several years of economic development in a short amount of time.
In the first half of the year, the pandemic outbreak and associated lockdown measures took a severe and unprecedented toll on the econo-my of the EU, but the depth of contractions has been uneven across countries. Strictness of lockdown measures, the share of tourism in the economy and the quality of governance all play a significant role in explaining the differences in economic losses. The euro area has been strongly affected by the pandemic and, based on seasonally and calendar-adjusted quarterly data, GDP fell by 6.8%2 in 2020.
CROATIA’S ECONOMY IN 2020 The pandemic has halted a successful multi-year economic convergence to European peers. Croatia’s economy declined sharply in the first half of 2020 due to the impact of the COVID-19 and the introduction of strict containment measures. The two-month lockdown caused GDP to drop in the second quarter by a record 15.4% quarter-on-quarter (-15.7% year-on-year). Domestic demand drove the fall as households
deferred or cancelled spending and businesses delayed investment decisions. External demand also collapsed, especially for services, as travel restrictions practically halted the tourism sector with Croatia’s largest trading partners, Italy and Germany, struggling too. Economic activity began to recover gradually as containment measures were eased. However, the decision to open up borders in early summer to support the tourism sector resulted in the resurgence of cases by fall, quickly wiping out earlier gains not just in Croatia, but all over Europe. The necessary reintroduction of pandemic containment measures weighed on the economy in the second half of the year as well. As a result, GDP has declined by as much as 8.4%3 in 2020 compared to the previous year.
GLOBAL OIL AND GAS MARKET FUNDAMENTALS Brent price weakened from the 2019 annual average of 64 to 42 USD/bbl in 2020. In the beginning of the year prices were supported by rising tensions in the Middle East after Qasem Soleimani – major general of the Iranian Islamic Revolutionary Guard Corps – was killed in a drone attack in Iraq. In addition, unrest in Libya curtailed supplies, lending further support thereto. Later on, COVID-19 started dominating the market sentiment as the virus spread across the globe, and government restrictions were imposed to halt the pandemic. As a result, in April – the hardest month of the year – oil demand fell by 20 mb/d (-20%) and overall, oil demand in 2020 is expected to fall by 8.8 mb/d (-9%) compared to 20194 – the steepest decline ever experienced. To make matters even worse, OPEC+ was unable to reach an agreement in March, resulting in extra supplies on the market in a time when the demand collapsed. In the second half of the year, Brent price partially corrected back as OPEC+ tightened supplies by 9.7 mb/d and the impact of restrictions on oil demand eased.
TTF day-ahead natural gas prices started the year in a falling trend as the mild winter season weighed on demand and kept storage levels high. From March on, the surging number of COVID-19 infections and the following government measures put further pressure on demand. As a result of high LNG availability in the beginning of the pandemic, TTF prices went below 5 EUR/MWh, signaling a significantly oversup-plied market. Since summer, a strong price recovery has started supported by curtailed US LNG supply, tighter power supply from alterna-tives (coal, lignite and nuclear), weaker Russian exports and increased home energy use due to teleworking and remote learning. European TTF prices increased steeply to above pre-COVID levels from September on. Strong Asian demand due to the colder than expected winter has kept prices at elevated levels till year-end despite a second wave of the pandemic all over Europe. CEGH regional prices followed Euro-pean benchmarks for most of the year, except for periods when the lack of direct access to the sea muted the impact of global LNG market developments on the landlocked part of the continent limiting the fall in prices during early summer, but also the extent of the price gain in the year-end.
6%
3%
0%
-3%
-6%
-9%
-12%
-15%
-18%
30
25
20
15
10
5
0
EUR/MWh USD/bbl
90
75
60
45
30
15
GDP GROWTH(%, year-on-year, seasonally adjusted)
Diff (RHS) EU27 Croatia
OIL AND NATURAL GAS PRICES
TTF CEGH Brent (RHS)
1 IMF World Economic Outlook, January update (20 January 2021).2 Eurostat flash estimate (16 February 2021).3 Croatian Bureau of Statistics first estimate (26 February 2021)4 IEA Oil Market Report (February 2021)

66 67
MAIN EXTERNAL PARAMETERS 2019 2020 CH %
CRUDE OIL PRICES
BRENT DTD (USD/BBL) 64 42 (34.4)
BRENT-URAL SPREAD (USD/BBL) 0.02 0.26 12.0
CEGH GAS PRICE (EUR/MWH) 16.4 11.1 (32.3)
FOB MED PRODUCT PRICES AND CRACK SPREADS
GASOLINE - PREMIUM UNLEADED 10 PPM (USD/T) 595 382 (35.8)
DIESEL – ULSD 10 PPM (USD/T) 586 362 (38.2)
FUEL OIL 3.5% (USD/T) 324 216 (33.3)
LPG (USD/T) 454 395 (13.0)
CRACK SPREAD – GASOLINE (USD/T) 109 65 (40.4)
CRACK SPREAD – DIESEL (USD/T) 100 45 (55.0)
CRACK SPREAD – FUEL OIL 3.5% (USD/T) (162) (101) (37.7)
CRACK SPREAD – LPG (USD/T) (32) 78 N.A.
INDICATIVE REFINING MARGINS (USD/BBL)* (0.70) (2.49) N.A.
FOREIGN EXCHANGE
HRK/USD AVERAGE 6.62 6.61 (0.3)
HRK/USD CLOSING 6.65 6.14 (7.7)
HRK/EUR AVERAGE 7.41 7.53 1.6
HRK/EUR CLOSING 7.44 7.54 1.3
3M USD LIBOR (%) 2.33 0.65 (72.1)
3M EURIBOR (%) (0.36) (0.43) N.A.
*Indicative refining margins based on 2018 Solomon yields, dated Ural price used for all feedstock
INA Group continuously monitors and manages financial risks. In accordance with the internal procedures, INA, d.d. and its con-solidated subsidiaries manage and maintain commodity, foreign exchange and interest rate risk at an acceptable level, allowing INA Group to achieve its strategic objectives while protecting the future financial stability and flexibility of INA Group.
In addition to financial (market) risks, the most important risks include credit risk and liquidity risk.
MARKET RISK
COMMODITY PRICE RISK
INA, d.d. buys crude oil mostly through short-term arrangements in USD at the current spot market price. Necessary natural gas quantities in 2020 INA Group imported in EUR based on spot price. Derivative instruments (forward, swap and option instruments) are available for managing company’s commodity exposure. In 2020, INA, d.d. entered into short-term forward swap transactions to hedge its exposure to changes in inventory levels, changes in pricing periods and crack spreads.
FOREIGN CURRENCY RISK
Many INA Group’s transactions are priced and denominated in a foreign currency. Thus, INA Group is exposed to foreign currency risk. INA Group has net long USD and EUR and net short HRK exposure of operative cash flow position. INA, d.d. may use cross currency swaps to adjust the currency mix of its debt portfolio. As at 31 December 2020, there were no open cross currency swap transactions.
INTEREST RATE RISK
INA Group is exposed to interest rate risk, since entities in INA Group generally borrow funds at floating interest rates. INA Group does not speculate on interest rate developments. INA, d.d. may use interest rate swap to manage the interest rate risk. As at 31 December 2020, there were no open interest rate swap transactions.
OTHER PRICE RISKS
INA, d.d. is exposed to equity price risks arising from equity investments held for strategic reasons and not for trading.
CREDIT RISK When selling goods and services on a deferred payment term, credit risk is present. Credit risk means a risk that the counterpar-ty will default on its contractual obligations, i.e. risk of non-pay-ment. According to internal procedures, customer credit risk is estimated by internal credit assessment model and, additionally, by external creditworthiness assessment agencies. Depending on their creditworthiness, customers provide payment security instruments. There is no significant credit risk exposure of INA Group that is not covered by payment security instruments, other than the exposure toward the institutions and entities controlled by the state and the local government, and customers under certain concession agreements abroad. In addition to the above stated, in order to minimize credit risk, INA Group also uses credit risk insurance services, services of agencies and attorneys-at-law offices for “out of-court” collection of receivables.
LIQUIDITY RISK 102-11
INA Group’s liquidity risk is managed by maintaining adequate liquidity reserves and credit lines and by continuous monitoring the projected and actual cash flow and due dates for account receivables and payables.
As at 31 December 2020, INA Group’s contracted and available short-term credit lines amounted to HRK 2,570 million (CNB middle exchange rate), excluding overdrafts and trade financing credit lines established with the purpose to finance the purchase of crude oil and oil products, while the contracted and available long-term credit lines amounted to HRK 2,179 million (CNB middle rate).
FINANCIAL RISK MANAGEMENT 102-11
DOWNSTREAMEuropean refinery margins had an extremely weak year in 2020, remaining on the edge of profitability. Surging Urals differential to Brent, weak gasoline crack spreads and collapsing middle distillate markets were the main factors behind the poor performance. The Urals market was supported by tighter supplies as OPEC+ cut production while reduced mobility due to the virus containment measures resulted in a huge oversupply on all transportation fuel markets, where in particular jet crack spreads were hit because of the disruptive decline in aviation demand. Nevertheless, refinery consolidation, outages and run cuts on the supply side coupled with improving demand conditions after the reopening resulted in a slow-pace recovery of refinery margins in the second half of the year. However, the levels could not come close to the long-term average values until the end of the year.
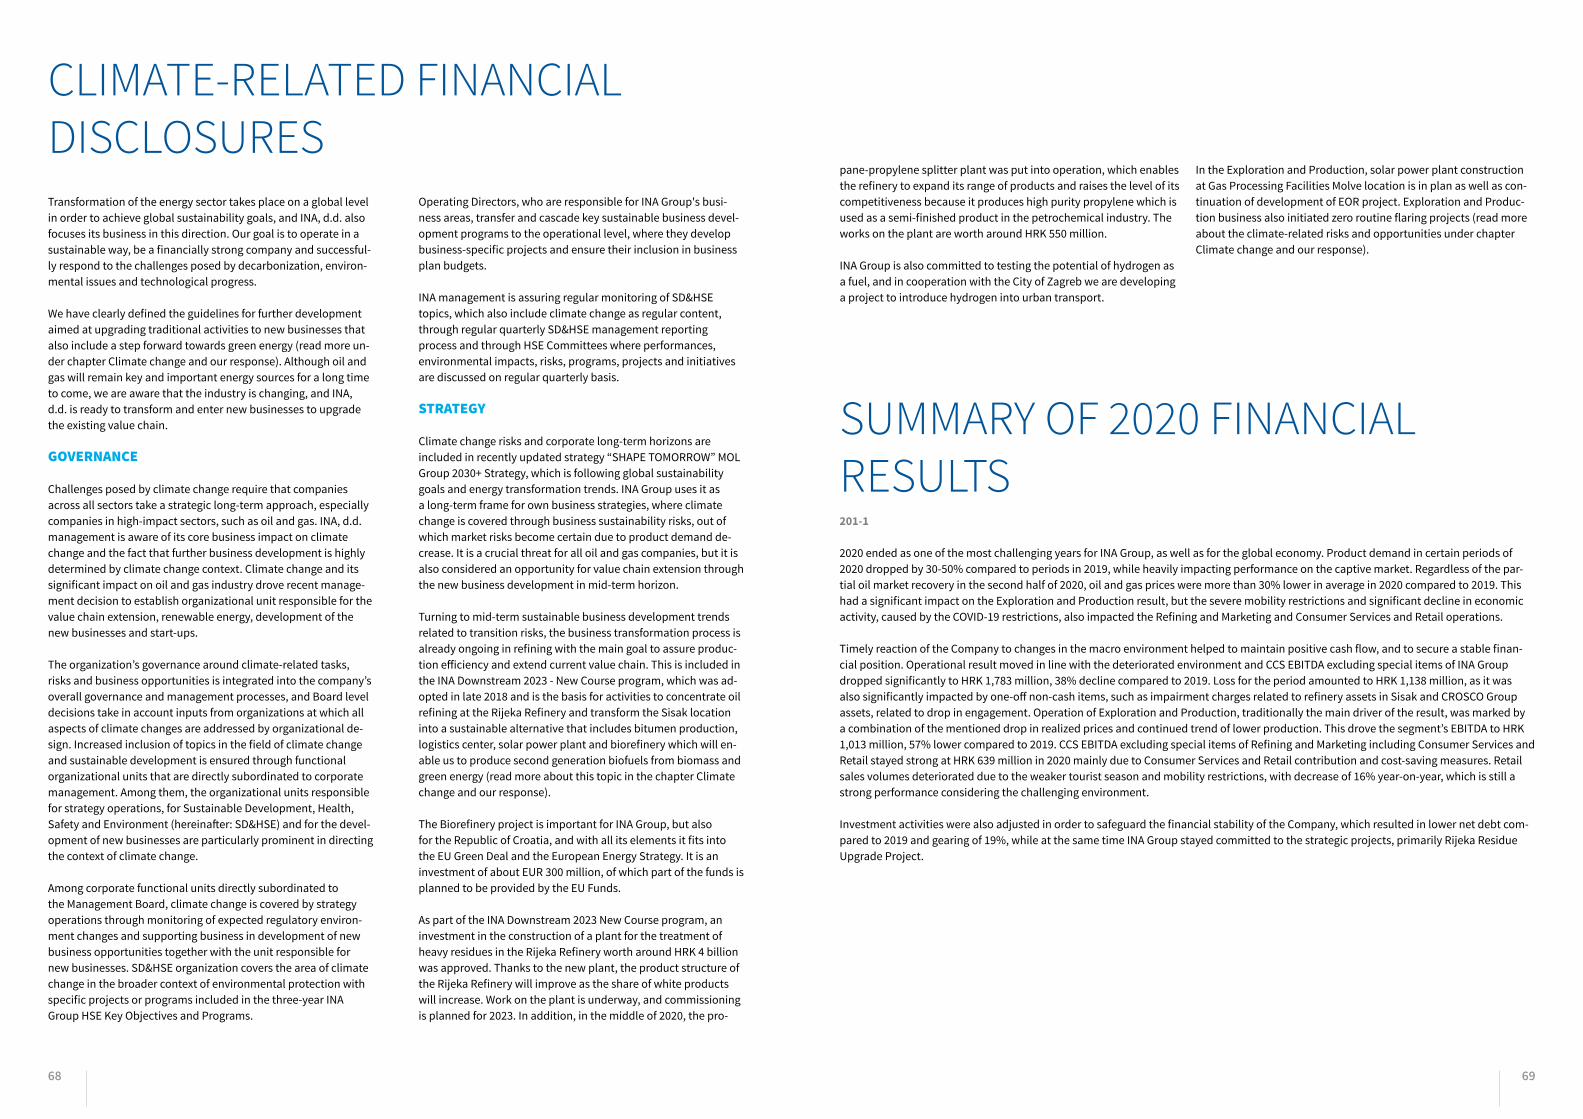
68 69
Transformation of the energy sector takes place on a global level in order to achieve global sustainability goals, and INA, d.d. also focuses its business in this direction. Our goal is to operate in a sustainable way, be a financially strong company and successful-ly respond to the challenges posed by decarbonization, environ-mental issues and technological progress.
We have clearly defined the guidelines for further development aimed at upgrading traditional activities to new businesses that also include a step forward towards green energy (read more un-der chapter Climate change and our response). Although oil and gas will remain key and important energy sources for a long time to come, we are aware that the industry is changing, and INA, d.d. is ready to transform and enter new businesses to upgrade the existing value chain.
GOVERNANCE
Challenges posed by climate change require that companies across all sectors take a strategic long-term approach, especially companies in high-impact sectors, such as oil and gas. INA, d.d. management is aware of its core business impact on climate change and the fact that further business development is highly determined by climate change context. Climate change and its significant impact on oil and gas industry drove recent manage-ment decision to establish organizational unit responsible for the value chain extension, renewable energy, development of the new businesses and start-ups.
The organization’s governance around climate-related tasks, risks and business opportunities is integrated into the company’s overall governance and management processes, and Board level decisions take in account inputs from organizations at which all aspects of climate changes are addressed by organizational de-sign. Increased inclusion of topics in the field of climate change and sustainable development is ensured through functional organizational units that are directly subordinated to corporate management. Among them, the organizational units responsible for strategy operations, for Sustainable Development, Health, Safety and Environment (hereinafter: SD&HSE) and for the devel-opment of new businesses are particularly prominent in directing the context of climate change.
Among corporate functional units directly subordinated to the Management Board, climate change is covered by strategy operations through monitoring of expected regulatory environ-ment changes and supporting business in development of new business opportunities together with the unit responsible for new businesses. SD&HSE organization covers the area of climate change in the broader context of environmental protection with specific projects or programs included in the three-year INA Group HSE Key Objectives and Programs.
Operating Directors, who are responsible for INA Group's busi-ness areas, transfer and cascade key sustainable business devel-opment programs to the operational level, where they develop business-specific projects and ensure their inclusion in business plan budgets.
INA management is assuring regular monitoring of SD&HSE topics, which also include climate change as regular content, through regular quarterly SD&HSE management reporting process and through HSE Committees where performances, environmental impacts, risks, programs, projects and initiatives are discussed on regular quarterly basis.
STRATEGY
Climate change risks and corporate long-term horizons are included in recently updated strategy “SHAPE TOMORROW” MOL Group 2030+ Strategy, which is following global sustainability goals and energy transformation trends. INA Group uses it as a long-term frame for own business strategies, where climate change is covered through business sustainability risks, out of which market risks become certain due to product demand de-crease. It is a crucial threat for all oil and gas companies, but it is also considered an opportunity for value chain extension through the new business development in mid-term horizon.
Turning to mid-term sustainable business development trends related to transition risks, the business transformation process is already ongoing in refining with the main goal to assure produc-tion efficiency and extend current value chain. This is included in the INA Downstream 2023 - New Course program, which was ad-opted in late 2018 and is the basis for activities to concentrate oil refining at the Rijeka Refinery and transform the Sisak location into a sustainable alternative that includes bitumen production, logistics center, solar power plant and biorefinery which will en-able us to produce second generation biofuels from biomass and green energy (read more about this topic in the chapter Climate change and our response).
The Biorefinery project is important for INA Group, but also for the Republic of Croatia, and with all its elements it fits into the EU Green Deal and the European Energy Strategy. It is an investment of about EUR 300 million, of which part of the funds is planned to be provided by the EU Funds.
As part of the INA Downstream 2023 New Course program, an investment in the construction of a plant for the treatment of heavy residues in the Rijeka Refinery worth around HRK 4 billion was approved. Thanks to the new plant, the product structure of the Rijeka Refinery will improve as the share of white products will increase. Work on the plant is underway, and commissioning is planned for 2023. In addition, in the middle of 2020, the pro-
pane-propylene splitter plant was put into operation, which enables the refinery to expand its range of products and raises the level of its competitiveness because it produces high purity propylene which is used as a semi-finished product in the petrochemical industry. The works on the plant are worth around HRK 550 million.
INA Group is also committed to testing the potential of hydrogen as a fuel, and in cooperation with the City of Zagreb we are developing a project to introduce hydrogen into urban transport.
In the Exploration and Production, solar power plant construction at Gas Processing Facilities Molve location is in plan as well as con-tinuation of development of EOR project. Exploration and Produc-tion business also initiated zero routine flaring projects (read more about the climate-related risks and opportunities under chapter Climate change and our response).
CLIMATE-RELATED FINANCIAL DISCLOSURES
SUMMARY OF 2020 FINANCIAL RESULTS 201-1
2020 ended as one of the most challenging years for INA Group, as well as for the global economy. Product demand in certain periods of 2020 dropped by 30-50% compared to periods in 2019, while heavily impacting performance on the captive market. Regardless of the par-tial oil market recovery in the second half of 2020, oil and gas prices were more than 30% lower in average in 2020 compared to 2019. This had a significant impact on the Exploration and Production result, but the severe mobility restrictions and significant decline in economic activity, caused by the COVID-19 restrictions, also impacted the Refining and Marketing and Consumer Services and Retail operations.
Timely reaction of the Company to changes in the macro environment helped to maintain positive cash flow, and to secure a stable finan-cial position. Operational result moved in line with the deteriorated environment and CCS EBITDA excluding special items of INA Group dropped significantly to HRK 1,783 million, 38% decline compared to 2019. Loss for the period amounted to HRK 1,138 million, as it was also significantly impacted by one-off non-cash items, such as impairment charges related to refinery assets in Sisak and CROSCO Group assets, related to drop in engagement. Operation of Exploration and Production, traditionally the main driver of the result, was marked by a combination of the mentioned drop in realized prices and continued trend of lower production. This drove the segment’s EBITDA to HRK 1,013 million, 57% lower compared to 2019. CCS EBITDA excluding special items of Refining and Marketing including Consumer Services and Retail stayed strong at HRK 639 million in 2020 mainly due to Consumer Services and Retail contribution and cost-saving measures. Retail sales volumes deteriorated due to the weaker tourist season and mobility restrictions, with decrease of 16% year-on-year, which is still a strong performance considering the challenging environment.
Investment activities were also adjusted in order to safeguard the financial stability of the Company, which resulted in lower net debt com-pared to 2019 and gearing of 19%, while at the same time INA Group stayed committed to the strategic projects, primarily Rijeka Residue Upgrade Project.
70 71
INA GROUP FINANCIAL RESULTS HRK MLN USD MLN*
2019 2020 CH % 2019 2020 CH %
REVENUE FROM CONTRACTS WITH CUSTOMERS 22,597 14,788 (35) 3,413 2,237 (34)
EBITDA1 2,856 991 (65) 431 150 (65)
EBITDA EXCLUDING SPECIAL ITEMS2 2,856 991 (65) 431 150 (65)
CCS EBITDA EXCLUDING SPECIAL ITEMS 2,894 1,783 (38) 437 270 (38)
PROFIT/(LOSS) FROM OPERATIONS 722 (1,298) N.A. 109 (196) N.A.
PROFIT/(LOSS) FROM OPERATIONS EXCLUDING SPECIAL ITEMS2 1,004 (798) N.A. 152 (121) N.A.
CCS PROFIT/(LOSS) FROM OPERATIONS EXCLUDING SPECIAL ITEMS2 1,043 (6) N.A. 158 (1) N.A.
NET LOSS FROM FINANCIAL ACTIVITIES (73) (68) N.A. (11) (10) N.A.
PROFIT/(LOSS) FOR THE YEAR ATTRIBUTABLE TO THE OWNERS OF THE COMPANY
486 (1,138) N.A. 73 (172) N.A.
PROFIT/(LOSS) FOR THE YEAR EXCLUDING SPECIAL ITEMS2 768 (638) N.A. 116 (97) N.A.
SIMPLIFIED FREE CASH FLOW3 744 501 (33) 112 76 (32)
NET CASH INFLOW FROM OPERATING ACTIVITIES 3,090 2,233 (28) 467 338 (28)
EARNINGS/(LOSS) PER SHARE
BASIC AND DILUTED EARNINGS/(LOSS) PER SHARE (HRK PER SHARE)
48.52 (113.82) N.A. 7.33 (17.22) N.A.
NET DEBT 2,554 1,608 (37) 384 262 (32)
GEARING RATIO4 (%) 19 15
CAPITAL EXPENDITURES 2,150 1,282 (40) 325 194 (40)
O/W DOMESTIC 1,829 1,161 (37) 276 176 (36)
O/W INTERNATIONAL 321 121 (62) 48 18 (63)
KEY FINANCIAL DATA BY BUSINESS SEGMENTS HRK MLN USD MLN*2019 2020 CH % 2019 2020 CH %
TOTAL REVENUE EXPLORATION AND PRODUCTION 3,745 2,188 (42) 566 331 (42)REFINING AND MARKETING INCLUDING CONSUMER SERVICES AND RETAIL
21,530 14,153 (34) 3,252 2,141 (34)
CORPORATE AND OTHER 2,137 1,543 (28) 323 233 (28)INTER-SEGMENT TRANSFERS AND CONSOLIDATION ADJUSTMENTS
(4,815) (3,096) N.A. (727) (468) N.A.
TOTAL 22,597 14,788 (35) 3,413 2,237 (34)EBITDA1 EXPLORATION AND PRODUCTION 2,356 1,013 (57) 356 153 (57)REFINING AND MARKETING INCLUDING CONSUMER SERVICES AND RETAIL
518 (153) N.A. 78 (23) N.A.
CORPORATE AND OTHER 24 (52) N.A. 4 (8) N.A.INTER-SEGMENT TRANSFERS AND CONSOLIDATION ADJUSTMENTS
(42) 183 N.A. (6) 28 N.A.
TOTAL 2,856 991 (65) 431 150 (65)EBITDA EXCLUDING SPECIAL ITEMS2 EXPLORATION AND PRODUCTION 2,356 1,013 (57) 356 153 (57)REFINING AND MARKETING INCLUDING CONSUMER SERVICES AND RETAIL
518 (153) N.A. 78 (23) N.A.
CORPORATE AND OTHER 24 (52) N.A. 4 (8) N.A.INTER-SEGMENT TRANSFERS AND CONSOLIDATION ADJUSTMENTS
(42) 183 N.A. (6) 28 N.A.
TOTAL 2,856 991 (65) 431 150 (65)PROFIT/(LOSS) FROM OPERATIONS EXPLORATION AND PRODUCTION 1,149 220 (81) 174 36 (79)REFINING AND MARKETING INCLUDING CONSUMER SERVICES AND RETAIL (230) (1,231) N.A. (35) (200) N.A.
CORPORATE AND OTHER (156) (472) N.A. (24) (77) N.A.INTER-SEGMENT TRANSFERS AND CONSOLIDATION ADJUSTMENTS (41) 185 N.A. (6) 30 N.A.
TOTAL 722 (1,298) N.A. 109 (211) N.A.PROFIT/(LOSS) FROM OPERATIONS EXCLUDING SPECIAL ITEMS2 EXPLORATION AND PRODUCTION 1,431 220 (85) 216 33 (85)REFINING AND MARKETING INCLUDING CONSUMER SERVICES AND RETAIL (230) (936) N.A. (35) (142) N.A.
CORPORATE AND OTHER (156) (267) N.A. (24) (40) N.A.INTER-SEGMENT TRANSFERS AND CONSOLIDATION ADJUSTMENTS (41) 185 N.A. (6) 28 N.A.
TOTAL 1,004 (798) N.A. 152 (121) N.A.PROPERTY, PLANT AND EQUIPMENT EXPLORATION AND PRODUCTION 4,932 4,592 (7) 742 695 (6)REFINING AND MARKETING INCLUDING CONSUMER SERVICES AND RETAIL 6,674 6,417 (4) 1,004 971 (3)
CORPORATE AND OTHER 1,422 1,177 (17) 214 178 (17)INTER-SEGMENT TRANSFERS AND CONSOLIDATION ADJUST-MENTS (461) (486) N.A. (69) (74) N.A.
TOTAL 12,567 11,700 (7) 1,890 1,770 (6)
*In converting HRK figures into USD, the following average CNB rates were used: for 2019 – 6.62 HRK/USD; for 2020 6.61; as at 31 December 2019 – 6.65 HRK/USD; as at 31 December 2020 – 6.14 HRK/USD1 EBITDA = EBIT + Depreciation, amortization and impairment (net)22019 result was negatively impacted by HRK 282 million impairment of assets - Croatian offshore gas fields; 2020 result was negatively impacted by HRK 500 million impairment of assets – Sisak refinery assets in the amount of 295 million, and CROSCO Group assets in the amount of 205 million 3 Simplified free cash flow = CCS EBITDA excluding special items – Capital expenditures4 Gearing ratio = Net debt/Net debt + equity including non-controlling interest
*In converting HRK figures into USD, the following average CNB rates were used: for 2019 – 6.62 HRK/USD; for 2020 6.61; as at 31 December 2019 – 6.65 HRK/USD; as at 31 December 2020 – 6.14 HRK/USD1 EBITDA = EBIT + Depreciation, amortization and impairment (net)22019 result was negatively impacted by HRK 282 million impairment of assets - Croatian offshore gas fields; 2020 result was negatively impacted by HRK 500 million impairment of assets – Sisak refinery assets in the amount of 295 million, and CROSCO Group assets in the amount of 205 million
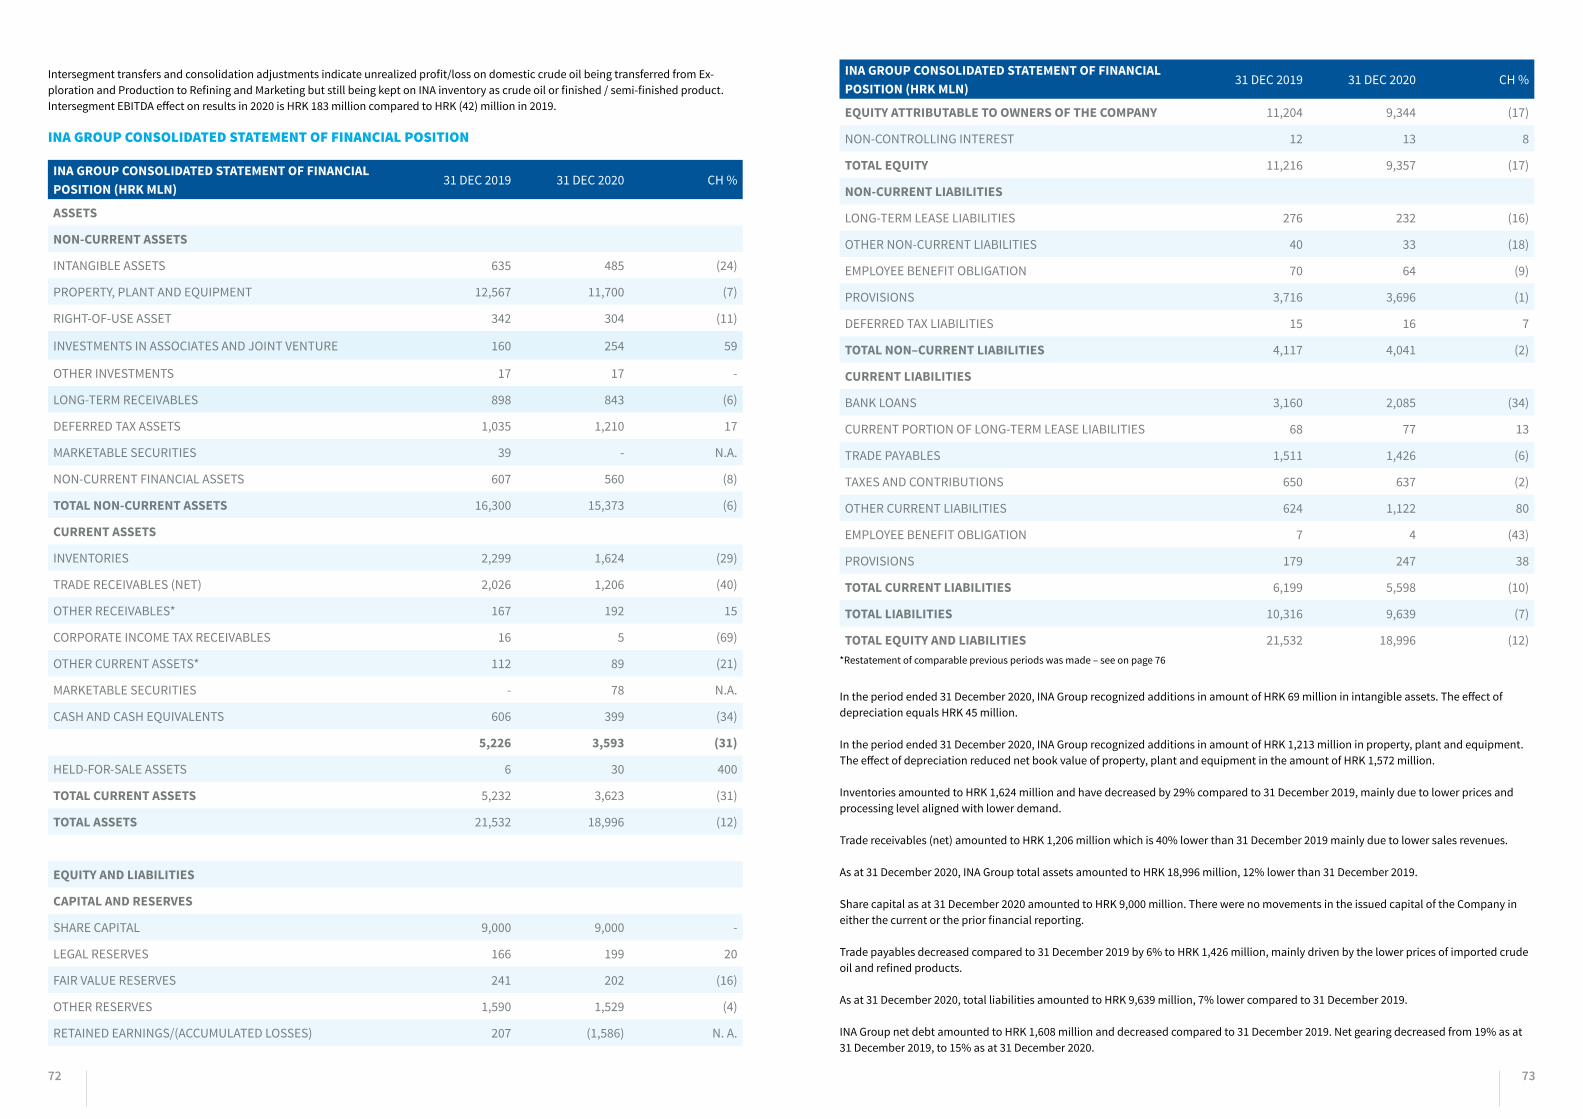
72 73
Intersegment transfers and consolidation adjustments indicate unrealized profit/loss on domestic crude oil being transferred from Ex-ploration and Production to Refining and Marketing but still being kept on INA inventory as crude oil or finished / semi-finished product. Intersegment EBITDA effect on results in 2020 is HRK 183 million compared to HRK (42) million in 2019.
INA GROUP CONSOLIDATED STATEMENT OF FINANCIAL POSITION
INA GROUP CONSOLIDATED STATEMENT OF FINANCIAL POSITION (HRK MLN)
31 DEC 2019 31 DEC 2020 CH %
ASSETS
NON-CURRENT ASSETS
INTANGIBLE ASSETS 635 485 (24)
PROPERTY, PLANT AND EQUIPMENT 12,567 11,700 (7)
RIGHT-OF-USE ASSET 342 304 (11)
INVESTMENTS IN ASSOCIATES AND JOINT VENTURE 160 254 59
OTHER INVESTMENTS 17 17 -
LONG-TERM RECEIVABLES 898 843 (6)
DEFERRED TAX ASSETS 1,035 1,210 17
MARKETABLE SECURITIES 39 - N.A.
NON-CURRENT FINANCIAL ASSETS 607 560 (8)
TOTAL NON-CURRENT ASSETS 16,300 15,373 (6)
CURRENT ASSETS
INVENTORIES 2,299 1,624 (29)
TRADE RECEIVABLES (NET) 2,026 1,206 (40)
OTHER RECEIVABLES* 167 192 15
CORPORATE INCOME TAX RECEIVABLES 16 5 (69)
OTHER CURRENT ASSETS* 112 89 (21)
MARKETABLE SECURITIES - 78 N.A.
CASH AND CASH EQUIVALENTS 606 399 (34)
5,226 3,593 (31)
HELD-FOR-SALE ASSETS 6 30 400
TOTAL CURRENT ASSETS 5,232 3,623 (31)
TOTAL ASSETS 21,532 18,996 (12)
EQUITY AND LIABILITIES
CAPITAL AND RESERVES
SHARE CAPITAL 9,000 9,000 -
LEGAL RESERVES 166 199 20
FAIR VALUE RESERVES 241 202 (16)
OTHER RESERVES 1,590 1,529 (4)
RETAINED EARNINGS/(ACCUMULATED LOSSES) 207 (1,586) N. A.
INA GROUP CONSOLIDATED STATEMENT OF FINANCIAL POSITION (HRK MLN)
31 DEC 2019 31 DEC 2020 CH %
EQUITY ATTRIBUTABLE TO OWNERS OF THE COMPANY 11,204 9,344 (17)
NON-CONTROLLING INTEREST 12 13 8
TOTAL EQUITY 11,216 9,357 (17)
NON-CURRENT LIABILITIES
LONG-TERM LEASE LIABILITIES 276 232 (16)
OTHER NON-CURRENT LIABILITIES 40 33 (18)
EMPLOYEE BENEFIT OBLIGATION 70 64 (9)
PROVISIONS 3,716 3,696 (1)
DEFERRED TAX LIABILITIES 15 16 7
TOTAL NON–CURRENT LIABILITIES 4,117 4,041 (2)
CURRENT LIABILITIES
BANK LOANS 3,160 2,085 (34)
CURRENT PORTION OF LONG-TERM LEASE LIABILITIES 68 77 13
TRADE PAYABLES 1,511 1,426 (6)
TAXES AND CONTRIBUTIONS 650 637 (2)
OTHER CURRENT LIABILITIES 624 1,122 80
EMPLOYEE BENEFIT OBLIGATION 7 4 (43)
PROVISIONS 179 247 38
TOTAL CURRENT LIABILITIES 6,199 5,598 (10)
TOTAL LIABILITIES 10,316 9,639 (7)
TOTAL EQUITY AND LIABILITIES 21,532 18,996 (12)*Restatement of comparable previous periods was made – see on page 76
In the period ended 31 December 2020, INA Group recognized additions in amount of HRK 69 million in intangible assets. The effect of depreciation equals HRK 45 million.
In the period ended 31 December 2020, INA Group recognized additions in amount of HRK 1,213 million in property, plant and equipment. The effect of depreciation reduced net book value of property, plant and equipment in the amount of HRK 1,572 million.
Inventories amounted to HRK 1,624 million and have decreased by 29% compared to 31 December 2019, mainly due to lower prices and processing level aligned with lower demand.
Trade receivables (net) amounted to HRK 1,206 million which is 40% lower than 31 December 2019 mainly due to lower sales revenues.
As at 31 December 2020, INA Group total assets amounted to HRK 18,996 million, 12% lower than 31 December 2019.
Share capital as at 31 December 2020 amounted to HRK 9,000 million. There were no movements in the issued capital of the Company in either the current or the prior financial reporting.
Trade payables decreased compared to 31 December 2019 by 6% to HRK 1,426 million, mainly driven by the lower prices of imported crude oil and refined products.
As at 31 December 2020, total liabilities amounted to HRK 9,639 million, 7% lower compared to 31 December 2019.
INA Group net debt amounted to HRK 1,608 million and decreased compared to 31 December 2019. Net gearing decreased from 19% as at 31 December 2019, to 15% as at 31 December 2020.
74 75
INA GROUP CONSOLIDATED STATEMENT OF PROFIT OR LOSS
INA GROUP CONSOLIDATED STATEMENT OF PROFIT OR LOSS (HRK MLN)
2019 2020 CH %
REVENUE FROM CONTRACTS WITH CUSTOMERS 22,597 14,788 (35)
CAPITALIZED VALUE OF OWN PERFORMANCE 466 286 (39)
OTHER OPERATING INCOME 234 181 (23)
TOTAL OPERATING INCOME 23,297 15,255 (35)
CHANGES IN INVENTORIES OF FINISHED PRODUCTS AND WORK IN PROGRESS (160) (686) 329
COST OF RAW MATERIALS AND CONSUMABLES (8,460) (5,710) (33)
DEPRECIATION, AMORTIZATION AND IMPAIRMENT (NET) (2,134) (2,289) 7
OTHER MATERIAL COSTS (2,125) (1,874) (12)
SERVICE COSTS* (629) (465) (26)
STAFF COSTS (1,970) (1,731) (12)
COST OF OTHER GOODS SOLD (7,114) (3,699) (48)
IMPAIRMENT CHARGES (NET) (109) (108) (1)
PROVISION FOR CHARGES AND RISKS (NET) 126 9 (93)
TOTAL OPERATING EXPENSES (22,575) (16,553) (27)
PROFIT/(LOSS) FROM OPERATIONS 722 (1,298) N.A.
FINANCE INCOME 104 165 59
FINANCE COSTS* (177) (233) 32
NET LOSS FROM FINANCIAL ACTIVITIES (73) (68) (7)
SHARE OF NET PROFIT OF JOINT VENTURES ACCOUNTED FOR USING THE EQUITY METHOD 10 94 840
PROFIT/(LOSS) BEFORE TAX 659 (1,272) N.A.
INCOME TAX GAIN/(BENEFIT) (170) 135 N.A.
PROFIT/(LOSS) FOR THE YEAR 489 (1,137) N.A.
ATTRIBUTABLE TO:
OWNERS OF THE COMPANY 486 (1,138) N.A.
NON-CONTROLLING INTERESTS 3 1 (67)
489 (1,137) N.A.
EARNINGS/(LOSS) PER SHARE
BASIC AND DILUTED EARNINGS/(LOSS) PER SHARE (HRK PER SHARE) 48.52 (113.82) N.A.
*Restatement of comparable previous periods was made – see on page 76
Revenue from contract with customers in 2020 amounted to HRK 14,788 million and is below the 2019 level, triggered mainly by lower sales on core markets (Croatia and Bosnia and Herzegovina) as a result of lower economic activity caused by the COVID-19 pandemic, together with sharp drop in Brent price and product quotations.
Costs of raw materials and consumables were 33% lower than 2019 level at HRK 5,710 million, reflecting different dynamic of refinery oper-ations and lower crude prices.
Other operating costs realized in 2020 include:
• Depreciation, amortization and impairment (net) in the amount of HRK 2,289 million were 7% higher compared to 2019
• Other material costs in the amount of HRK 1,874 million were lower by 12%, mainly driven by costs dependent on oil prices and lower scope of works
• Service costs in the amount of HRK 465 million were 26% lower than the 2019 level, mainly due to lower intellectual services in 2020
• Impairment charges in the amount of HRK (108) million were 1% lower compared to 2019
• Provisions for charges and risk had a positive effect in the amount of HRK 9 million in 2020 compared to HRK 126 million positive effect in 2019.
Staff costs in the amount of HRK 1,731 million were 12% lower compared to 2019.
Costs of other goods sold in in 2020 decreased by 48% compared to 2019 and amounted to HRK 3,699 million resulting from lower sales and prices.
Net loss from financial activities was mainly a result of the following:
• Net foreign exchange loss amounted to HRK 16 million in 2020, while in 2019 it reached HRK 25 million
• Interest expense amounted to HRK 76 million and interest income to HRK 3 million in 2020, while in 2019 interest expense amounted to HRK 75 million and interest income to HRK 5 million
• Other financial net income amounted to HRK 21 million in 2020, slightly lower compared to the HRK 22 million financial income in 2019.
Income tax gain in 2020 amounted to HRK 135 million compared to HRK 170 million income tax expense in 2019. Tax costs and deferred tax-es during the reporting period are calculated based on actual results and the profit tax rate, 18% for the periods ended 31 December 2019 and 2020.
INA GROUP CONSOLIDATED STATEMENT OF CASH FLOWS
INA GROUP CONSOLIDATED STATEMENT OF CASH FLOWS (HRK MLN)
2019 2020 CH %
NET CASH INFLOW FROM OPERATING ACTIVITIES 3,090 2,233 (28)
NET CASH USED FOR INVESTING ACTIVITIES (2,516) (1,177) (53)
NET CASH USED IN FINANCING ACTIVITIES (401) (1,222) N.A.
NET INCREASE/(DECREASE) IN CASH AND CASH EQUIVALENTS 173 (166) N.A.
Net cash inflow from operating activities before movements in working capital amounted to HRK 1,313 million in 2020 representing a de-crease compared to 2019, which is in line with the change in EBITDA performance excluding non-cash items.
Movements in working capital positively affected the operating cash flow by HRK 939 million, due to:
• Decreased value of inventories in the amount of HRK 402 million mainly related to lower prices together with lower crude oil inventories and finished products
• Decrease in receivables in the amount of HRK 570 million mainly related to lower sales volumes and prices
• Decrease in trade and other payables which amounted to (33) HRK million mainly related to lower purchase prices and volumes in line with production dynamics.
Net cash used for investing activities amounted to HRK (1,177) million of outflows, compared to HRK (2,516) million outflows in 2019 mainly due to lower business activities.
76 77
RESTATEMENT
INA Group adjusted its EBIT methodology and classification between financial cost and service cost lines to align with the Group reporting standards in the amount of HRK 3 million. Additionally, reclassification was made for accounts of margining receivables that are reclassified from line Other current assets to line Other receivables in the amount of HRK 24 million. The reclassification is performed in accordance with the new INA Group Accounting policies and procedures and the comparable periods are restated.
IMPACT OF SPECIAL ITEMS
In addition to international accounting standards, international reporting standards and regulatory requests, the Company discloses spe-cial items to achieve a higher level of transparency and to provide better understanding of the usual business operations. Business events not occurring regularly and having significant effect on operations and results are considered as special items. INA Group has adopted the materiality level for the special items in the amount of USD 10 million or more. If special items reach materiality level on cumulative basis, previous quarters are restated. Furthermore, in accordance with the adopted accounting policies and IAS 36 – Impairment of Assets, INA Group performs impairment testing at the end of each reporting period if impairment indicators are assessed as significant. In 2019, the result was negatively impacted by HRK 282 million of special items related to impairment of assets - Croatian offshore gas fields, due to lower gas prices. In 2020, the result was negatively impacted by impairment of refinery assets in Sisak in the amount of HRK 295 million, due to the concentration of refining operations in Rijeka refinery and impairment of CROSCO Group assets due to the decreased demand for oil field services on the market in the amount of HRK 205 million.
SPECIAL ITEMS (HRK MLN) 2019 2020
INA GROUP
TOTAL IMPACT OF SPECIAL ITEMS ON PROFIT/(LOSS) FOR THE YEAR (282) (500)
TOTAL IMPACT OF SPECIAL ITEMS ON PROFIT/(LOSS) FROM OPERATIONS (282) (500)
EXPLORATION AND PRODUCTION
TOTAL IMPACT OF SPECIAL ITEMS ON PROFIT FROM OPERATIONS (282) -
IMPAIRMENT OF ASSETS - CROATIAN OFFSHORE GAS FIELDS (282) -
REFINING AND MARKETING INCLUDING CONSUMER SERVICES AND RETAIL
TOTAL IMPACT OF SPECIAL ITEMS ON LOSS FROM OPERATIONS - (295)
IMPAIRMENT OF ASSETS - SISAK REFINERY ASSETS - (295)
CORPORATE FUNCTIONS
TOTAL IMPACT OF SPECIAL ITEMS ON LOSS FROM OPERATIONS - (205)
IMPAIRMENT OF ASSETS - CROSCO GROUP ASSETS - (205)
COMPANY BRANCH OFFICE/REPRESENTATIVE OFFICE
INA, D.D.
BRANCH OFFICE DAMASCUS, SYRIA
BRANCH OFFICE CAIRO, EGYPT
REPRESENTATIVE OFFICE LUANDA, ANGOLA
REPRESENTATIVE OFFICE MOSCOW, RUSSIA
CROSCO D.O.O.
BRANCH OFFICE ZADAR
BRANCH OFFICE CROSCO NAFTNI SERVISI D.O.O. DEGA TIRANA
CROSCO INTEGRATED DRILLING & WELL SERVICES CO. LTD. - G.S.P.L.A.J. BRANCH
CROSCO INTEGRATED DRILLING & WELL SERVICES CO. LTD. - SYRIAN BRANCH OFFICE, DAMASCUSCROSCO NAFTNI SERVISI D.O.O. - PRESTATIONS PETROLIERES (IN THE REACTIVATION PROCESS)
CROSCO INTEGRATED DRILLING & WELL SERVICES CO. LTD. - EGYPTIAN BRANCH, CAIRO
CROSCO INTEGRATED DRILLING & WELL SERVICE CO. LTD. - HUNGARIAN BRANCH OFFICE - MAGYARORSZAGI FIOKTELEPECROSCO INTEGRATED DRILLING & WELL SERVICES CO. LTD. - AZERBAIJAN BRANCH OFFICE (IN THE REACTIVATION PROCESS)
CROSCO INTEGRATED DRILLING & WELL SERVICE CO. LTD. - ITALIAN BRANCH OFFICE
ROTARY ZRT.BRANCH OFFICE ERBIL, IRAQ
BRANCH OFFICE ALBANIA
STSI D.O.O.STSI - INTEGRIRANI TEHNIČKI SERVISI D.O.O. - BRANCH OFFICE IN SYRIA, DAMASK
STSI - REPRESENTATIVE OFFICE BELARUS, NOVOPOLOTSK
HOLDINA D.O.O. 37 RETAIL LOCATIONS REGISTERED AS BRANCH OFFICE
ENERGOPETROL D.D. BRANCH OFFICE - MALOPRODAJNO MJESTO VARAŠ 2
BRANCH AND REPRESENTATIVE OFFICES Branch and representative offices as at 31 December 2020:

78 79
050
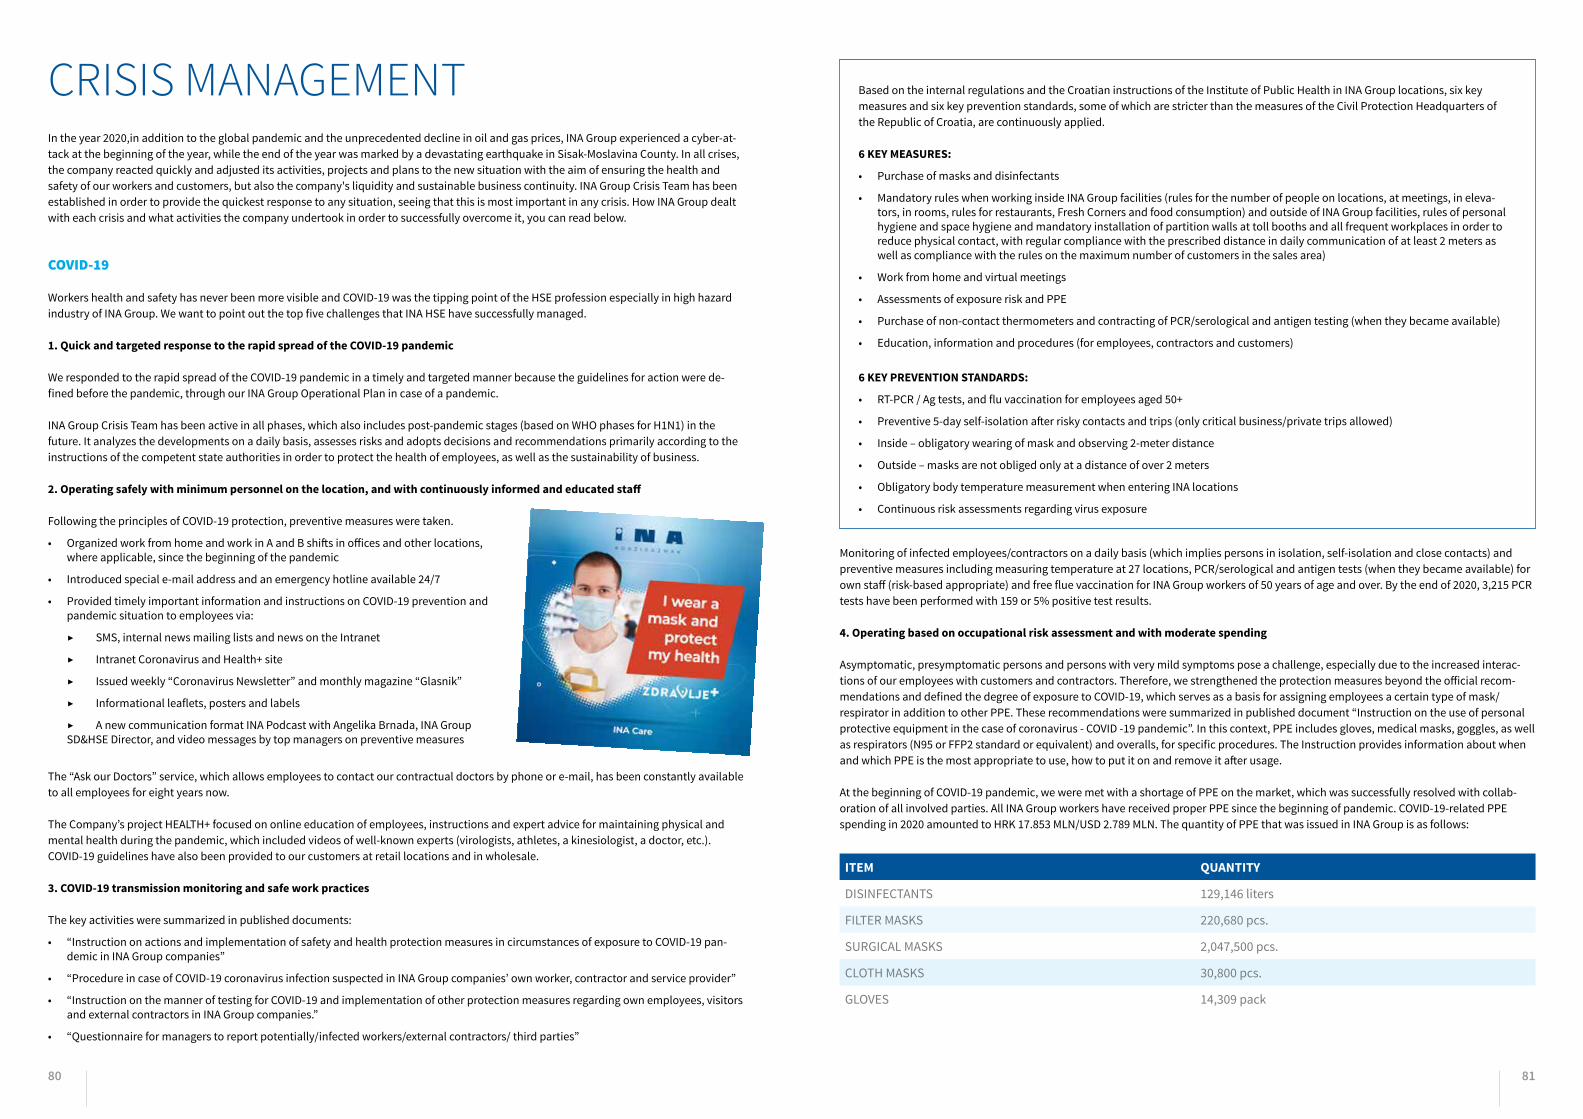
80 81
CRISIS MANAGEMENTIn the year 2020,in addition to the global pandemic and the unprecedented decline in oil and gas prices, INA Group experienced a cyber-at-tack at the beginning of the year, while the end of the year was marked by a devastating earthquake in Sisak-Moslavina County. In all crises, the company reacted quickly and adjusted its activities, projects and plans to the new situation with the aim of ensuring the health and safety of our workers and customers, but also the company's liquidity and sustainable business continuity. INA Group Crisis Team has been established in order to provide the quickest response to any situation, seeing that this is most important in any crisis. How INA Group dealt with each crisis and what activities the company undertook in order to successfully overcome it, you can read below.
COVID-19
Workers health and safety has never been more visible and COVID-19 was the tipping point of the HSE profession especially in high hazard industry of INA Group. We want to point out the top five challenges that INA HSE have successfully managed.
1. Quick and targeted response to the rapid spread of the COVID-19 pandemic
We responded to the rapid spread of the COVID-19 pandemic in a timely and targeted manner because the guidelines for action were de-fined before the pandemic, through our INA Group Operational Plan in case of a pandemic.
INA Group Crisis Team has been active in all phases, which also includes post-pandemic stages (based on WHO phases for H1N1) in the future. It analyzes the developments on a daily basis, assesses risks and adopts decisions and recommendations primarily according to the instructions of the competent state authorities in order to protect the health of employees, as well as the sustainability of business.
2. Operating safely with minimum personnel on the location, and with continuously informed and educated staff
Following the principles of COVID-19 protection, preventive measures were taken.
• Organized work from home and work in A and B shifts in offices and other locations, where applicable, since the beginning of the pandemic
• Introduced special e-mail address and an emergency hotline available 24/7
• Provided timely important information and instructions on COVID-19 prevention and pandemic situation to employees via:
▶ SMS, internal news mailing lists and news on the Intranet
▶ Intranet Coronavirus and Health+ site
▶ Issued weekly “Coronavirus Newsletter” and monthly magazine “Glasnik”
▶ Informational leaflets, posters and labels
▶ A new communication format INA Podcast with Angelika Brnada, INA Group SD&HSE Director, and video messages by top managers on preventive measures
The “Ask our Doctors” service, which allows employees to contact our contractual doctors by phone or e-mail, has been constantly available to all employees for eight years now.
The Company’s project HEALTH+ focused on online education of employees, instructions and expert advice for maintaining physical and mental health during the pandemic, which included videos of well-known experts (virologists, athletes, a kinesiologist, a doctor, etc.). COVID-19 guidelines have also been provided to our customers at retail locations and in wholesale.
3. COVID-19 transmission monitoring and safe work practices
The key activities were summarized in published documents:
• “Instruction on actions and implementation of safety and health protection measures in circumstances of exposure to COVID-19 pan-demic in INA Group companies”
• “Procedure in case of COVID-19 coronavirus infection suspected in INA Group companies’ own worker, contractor and service provider”
• “Instruction on the manner of testing for COVID-19 and implementation of other protection measures regarding own employees, visitors and external contractors in INA Group companies.”
• “Questionnaire for managers to report potentially/infected workers/external contractors/ third parties”
Based on the internal regulations and the Croatian instructions of the Institute of Public Health in INA Group locations, six key measures and six key prevention standards, some of which are stricter than the measures of the Civil Protection Headquarters of the Republic of Croatia, are continuously applied.
6 KEY MEASURES:
• Purchase of masks and disinfectants
• Mandatory rules when working inside INA Group facilities (rules for the number of people on locations, at meetings, in eleva-tors, in rooms, rules for restaurants, Fresh Corners and food consumption) and outside of INA Group facilities, rules of personal hygiene and space hygiene and mandatory installation of partition walls at toll booths and all frequent workplaces in order to reduce physical contact, with regular compliance with the prescribed distance in daily communication of at least 2 meters as well as compliance with the rules on the maximum number of customers in the sales area)
• Work from home and virtual meetings
• Assessments of exposure risk and PPE
• Purchase of non-contact thermometers and contracting of PCR/serological and antigen testing (when they became available)
• Education, information and procedures (for employees, contractors and customers)
6 KEY PREVENTION STANDARDS:
• RT-PCR / Ag tests, and flu vaccination for employees aged 50+
• Preventive 5-day self-isolation after risky contacts and trips (only critical business/private trips allowed)
• Inside – obligatory wearing of mask and observing 2-meter distance
• Outside – masks are not obliged only at a distance of over 2 meters
• Obligatory body temperature measurement when entering INA locations
• Continuous risk assessments regarding virus exposure
Monitoring of infected employees/contractors on a daily basis (which implies persons in isolation, self-isolation and close contacts) and preventive measures including measuring temperature at 27 locations, PCR/serological and antigen tests (when they became available) for own staff (risk-based appropriate) and free flue vaccination for INA Group workers of 50 years of age and over. By the end of 2020, 3,215 PCR tests have been performed with 159 or 5% positive test results.
4. Operating based on occupational risk assessment and with moderate spending
Asymptomatic, presymptomatic persons and persons with very mild symptoms pose a challenge, especially due to the increased interac-tions of our employees with customers and contractors. Therefore, we strengthened the protection measures beyond the official recom-mendations and defined the degree of exposure to COVID-19, which serves as a basis for assigning employees a certain type of mask/respirator in addition to other PPE. These recommendations were summarized in published document “Instruction on the use of personal protective equipment in the case of coronavirus - COVID -19 pandemic”. In this context, PPE includes gloves, medical masks, goggles, as well as respirators (N95 or FFP2 standard or equivalent) and overalls, for specific procedures. The Instruction provides information about when and which PPE is the most appropriate to use, how to put it on and remove it after usage.
At the beginning of COVID-19 pandemic, we were met with a shortage of PPE on the market, which was successfully resolved with collab-oration of all involved parties. All INA Group workers have received proper PPE since the beginning of pandemic. COVID-19-related PPE spending in 2020 amounted to HRK 17.853 MLN/USD 2.789 MLN. The quantity of PPE that was issued in INA Group is as follows:
ITEM QUANTITY
DISINFECTANTS 129,146 liters
FILTER MASKS 220,680 pcs.
SURGICAL MASKS 2,047,500 pcs.
CLOTH MASKS 30,800 pcs.
GLOVES 14,309 pack

82 83
5. Preserving business continuity and enterprise resilience
With the management and operational support by INA Group Crisis Team, with regard to protection measures that are adhered to without exception, our managers, employees and contractors have shown a high level of personal responsibility and discipline, thus allowing us to ensure business continuity.
As the completion of extremely important projects (Propane-Propylene Splitter and construction of a plant for processing heavy residues in the Rijeka Refinery, etc.) has priority, we have established the minimum conditions for epidemic activities within CAPEX projects, defined anti-epidemic measures for generic activities and improved the electronic permits to work as well as digitized the training system. In these exceptional circumstances, in just a few days, INA MAZIVA d.o.o. experts produced INA Dezinol surface disinfectant, which is now available to our customers at all INA retail locations, in a 0.6-liter package, as well as INA Dezinol Plus line for hand disinfection.
At the end of 2020, we developed a plan to fight the new coronavirus for the next year in which we continued with the campaign for vaccina-tion against COVID-19 and QA moments for employees.
MARKET DISTURBANCE
Except bearing a high impact on everyday life, COVID-19 also heavily affected the market demand. After a good start, trending with increas-ing demand compared to previous years, restrictive measures all around Croatia and B&H caused an estimated drop in market demand for motor fuels on our core markets of 13% compared to 2019. Highest drop was in the jet fuel segment, which took a heavy swing with drop in demand of over 70%. In some weeks, demand for fuels on core markets decreased by up to 50%. These kinds of disturbances all over the world caused surplus of products on the market, thus decreasing the price of the products, as well as the price of the feedstock. It left an effect on crack spreads and refinery margins, lowering them, but with good management of the situation INA, d.d. succeeded in exploiting the situation in the best manner possible through hedging and proper and timely production and supply optimization.
!
FOR-a – MOVE FROM FLEXIBLE TO REMOTE WORK ARRANGEMENTS
Flexible work arrangements (FORa) have been implemented in INA Group since 2016 providing employees the benefit of flexible work schedule (Flexitime) or occasional remote work (Flexiplace) with around 1,280 active users. The fact that we had set and implemented flexi-ble work arrangements before, helped us quickly adapt to new ways of working during the pandemic and quarantine period.
During the pandemic, remote work was heavily utilized for more than three months across the entire Group by 2,500 employees as a successful way of maintaining operation (among employees where this practice was possible) and ensuring health and protection of em-ployees in the pandemic situation.
QUALITY OF WORK MOTIVATION
Quality, well-based and structured work output maintained
Motivation & organization of own work
Overall task and meeting organizationTime managementTeam efficiency
consider that it is similar or better in home office
95 %consider that it is similar or better in home office
92 %
Clear priorities from managers
consider that it is similar or better in home office
88 %consider that it is similar or better in home office
91 %
PRODUCTIVITY & EFFICIENCY
CLEAR PRIORITIES
FOCUS COMMUNICATION
Ability to concentrate on tasksWork-life balance
Information sharing Resolving communication challengesMeetings efficiency
Sense of belongingQuality of social interactions
consider that it is similar or better in home office
82 %consider that it is similar or better in home office
73 %
Same or better as work from office: quality of work, productivity and efficiency.Prioritization, focus and efficient communication did not suffer.Lack of social interactions is less of an issue in case of occasional home office.
consider that it is similar or better in home office
46 %
CONNECTION KEY FINDINGS
EMPLOYEE SURVEY RESULTSREMOTE WORK IS EFFICIENT.
HOWEVER, SOCIAL CONNECTIONS WERE MISSED.
With gradual return to offices and business premises, internal survey was launched regarding remote work experiences with the pur-pose of finding new ways of working efficiently and sustainably.
With regard to working remotely, the managers believe as follows:
• Results and productivity of teams can be maintained in the same way as in the office or even easier
• On average, one third of managers believe work can be performed more efficiently
• Nine out of ten managers were certain in their team productivity despite minor obstacles to supervision, monitoring and managing team dynamics, which were influenced by continuous physical distancing during pandemic
With regard to working remotely, the employees believe as follows:
• The quality of work, productivity, and efficiency were the same as in the office or even higher
• Prioritizing work tasks, their focus, and efficient communication did not suffer
• Lack of social interactions is considered the biggest challenge, but it was not an issue in case of occasional remote work
Survey shows that, moving forward, 65% of employees would like the possibility to work remotely at least two days per week (current pol-icy) while 35% would like even more days of remote work to be available. In order to provide new possibilities and models of flexible work arrangements to successfully meet the needs of employees, changes to current legislation are needed. Therefore, INA Group is collaborating closely with the Croatian Employers’ Association on a proposal for the Croatian Government regarding further flexibilization of working arrangements and relevant legislation in Croatia.
BeneFIT PLATFORM
During quarantine, the well-being platform became the central reference point for employees to access trusted news, guidelines and support. The aim of the platform was two-fold: to encourage and promote responsible behavior during pandemic and to support holistic well-being of employees in adapting to new life circumstances. Content for the employees was in part created by other employees (beneFIT sport and culture ambassadors, bikeZONE community) providing sense of community and belonging during this period. Cross-functional collaboration and alignment was ensured to keep all messages clear, accessible and consistent.
TOTAL SALES OF REFINED PRODUCTS ON CORE MARKETS(CRO+B&H)
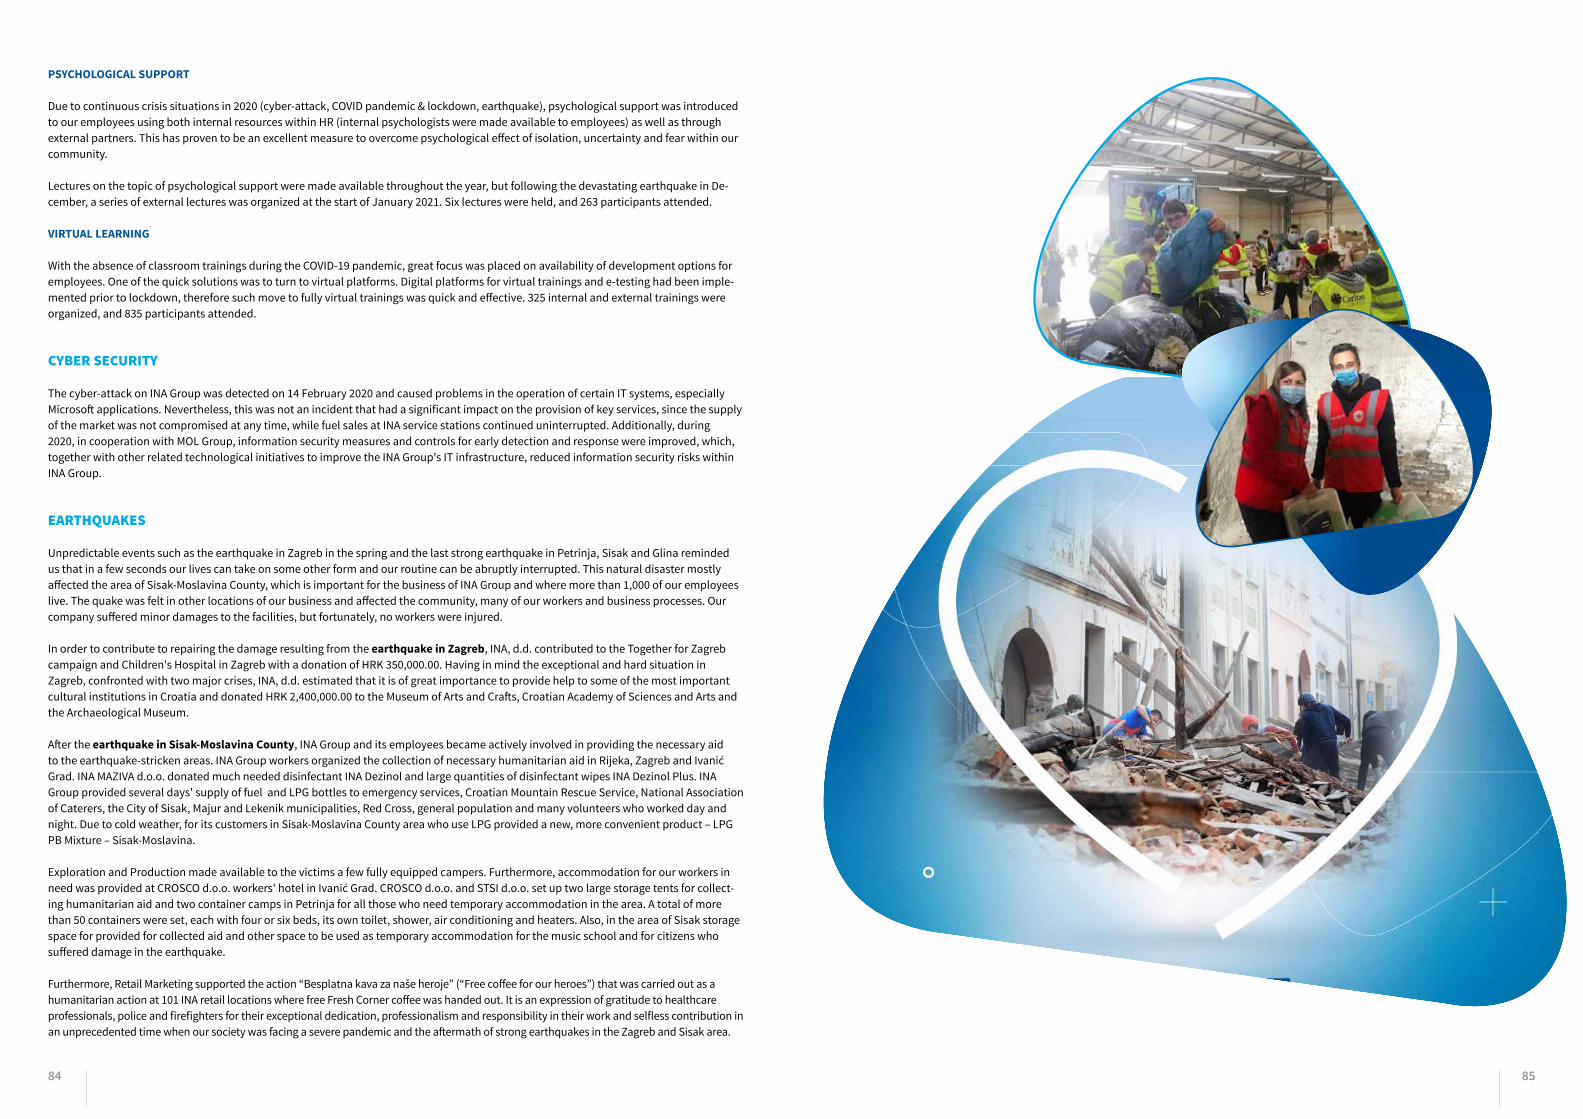
84 85
PSYCHOLOGICAL SUPPORT
Due to continuous crisis situations in 2020 (cyber-attack, COVID pandemic & lockdown, earthquake), psychological support was introduced to our employees using both internal resources within HR (internal psychologists were made available to employees) as well as through external partners. This has proven to be an excellent measure to overcome psychological effect of isolation, uncertainty and fear within our community.
Lectures on the topic of psychological support were made available throughout the year, but following the devastating earthquake in De-cember, a series of external lectures was organized at the start of January 2021. Six lectures were held, and 263 participants attended.
VIRTUAL LEARNING
With the absence of classroom trainings during the COVID-19 pandemic, great focus was placed on availability of development options for employees. One of the quick solutions was to turn to virtual platforms. Digital platforms for virtual trainings and e-testing had been imple-mented prior to lockdown, therefore such move to fully virtual trainings was quick and effective. 325 internal and external trainings were organized, and 835 participants attended.
CYBER SECURITY
The cyber-attack on INA Group was detected on 14 February 2020 and caused problems in the operation of certain IT systems, especially Microsoft applications. Nevertheless, this was not an incident that had a significant impact on the provision of key services, since the supply of the market was not compromised at any time, while fuel sales at INA service stations continued uninterrupted. Additionally, during 2020, in cooperation with MOL Group, information security measures and controls for early detection and response were improved, which, together with other related technological initiatives to improve the INA Group's IT infrastructure, reduced information security risks within INA Group.
EARTHQUAKES
Unpredictable events such as the earthquake in Zagreb in the spring and the last strong earthquake in Petrinja, Sisak and Glina reminded us that in a few seconds our lives can take on some other form and our routine can be abruptly interrupted. This natural disaster mostly affected the area of Sisak-Moslavina County, which is important for the business of INA Group and where more than 1,000 of our employees live. The quake was felt in other locations of our business and affected the community, many of our workers and business processes. Our company suffered minor damages to the facilities, but fortunately, no workers were injured.
In order to contribute to repairing the damage resulting from the earthquake in Zagreb, INA, d.d. contributed to the Together for Zagreb campaign and Children's Hospital in Zagreb with a donation of HRK 350,000.00. Having in mind the exceptional and hard situation in Zagreb, confronted with two major crises, INA, d.d. estimated that it is of great importance to provide help to some of the most important cultural institutions in Croatia and donated HRK 2,400,000.00 to the Museum of Arts and Crafts, Croatian Academy of Sciences and Arts and the Archaeological Museum.
After the earthquake in Sisak-Moslavina County, INA Group and its employees became actively involved in providing the necessary aid to the earthquake-stricken areas. INA Group workers organized the collection of necessary humanitarian aid in Rijeka, Zagreb and Ivanić Grad. INA MAZIVA d.o.o. donated much needed disinfectant INA Dezinol and large quantities of disinfectant wipes INA Dezinol Plus. INA Group provided several days' supply of fuel and LPG bottles to emergency services, Croatian Mountain Rescue Service, National Association of Caterers, the City of Sisak, Majur and Lekenik municipalities, Red Cross, general population and many volunteers who worked day and night. Due to cold weather, for its customers in Sisak-Moslavina County area who use LPG provided a new, more convenient product – LPG PB Mixture – Sisak-Moslavina.
Exploration and Production made available to the victims a few fully equipped campers. Furthermore, accommodation for our workers in need was provided at CROSCO d.o.o. workers' hotel in Ivanić Grad. CROSCO d.o.o. and STSI d.o.o. set up two large storage tents for collect-ing humanitarian aid and two container camps in Petrinja for all those who need temporary accommodation in the area. A total of more than 50 containers were set, each with four or six beds, its own toilet, shower, air conditioning and heaters. Also, in the area of Sisak storage space for provided for collected aid and other space to be used as temporary accommodation for the music school and for citizens who suffered damage in the earthquake.
Furthermore, Retail Marketing supported the action “Besplatna kava za naše heroje” (“Free coffee for our heroes”) that was carried out as a humanitarian action at 101 INA retail locations where free Fresh Corner coffee was handed out. It is an expression of gratitude to healthcare professionals, police and firefighters for their exceptional dedication, professionalism and responsibility in their work and selfless contribution in an unprecedented time when our society was facing a severe pandemic and the aftermath of strong earthquakes in the Zagreb and Sisak area.
86 87
060
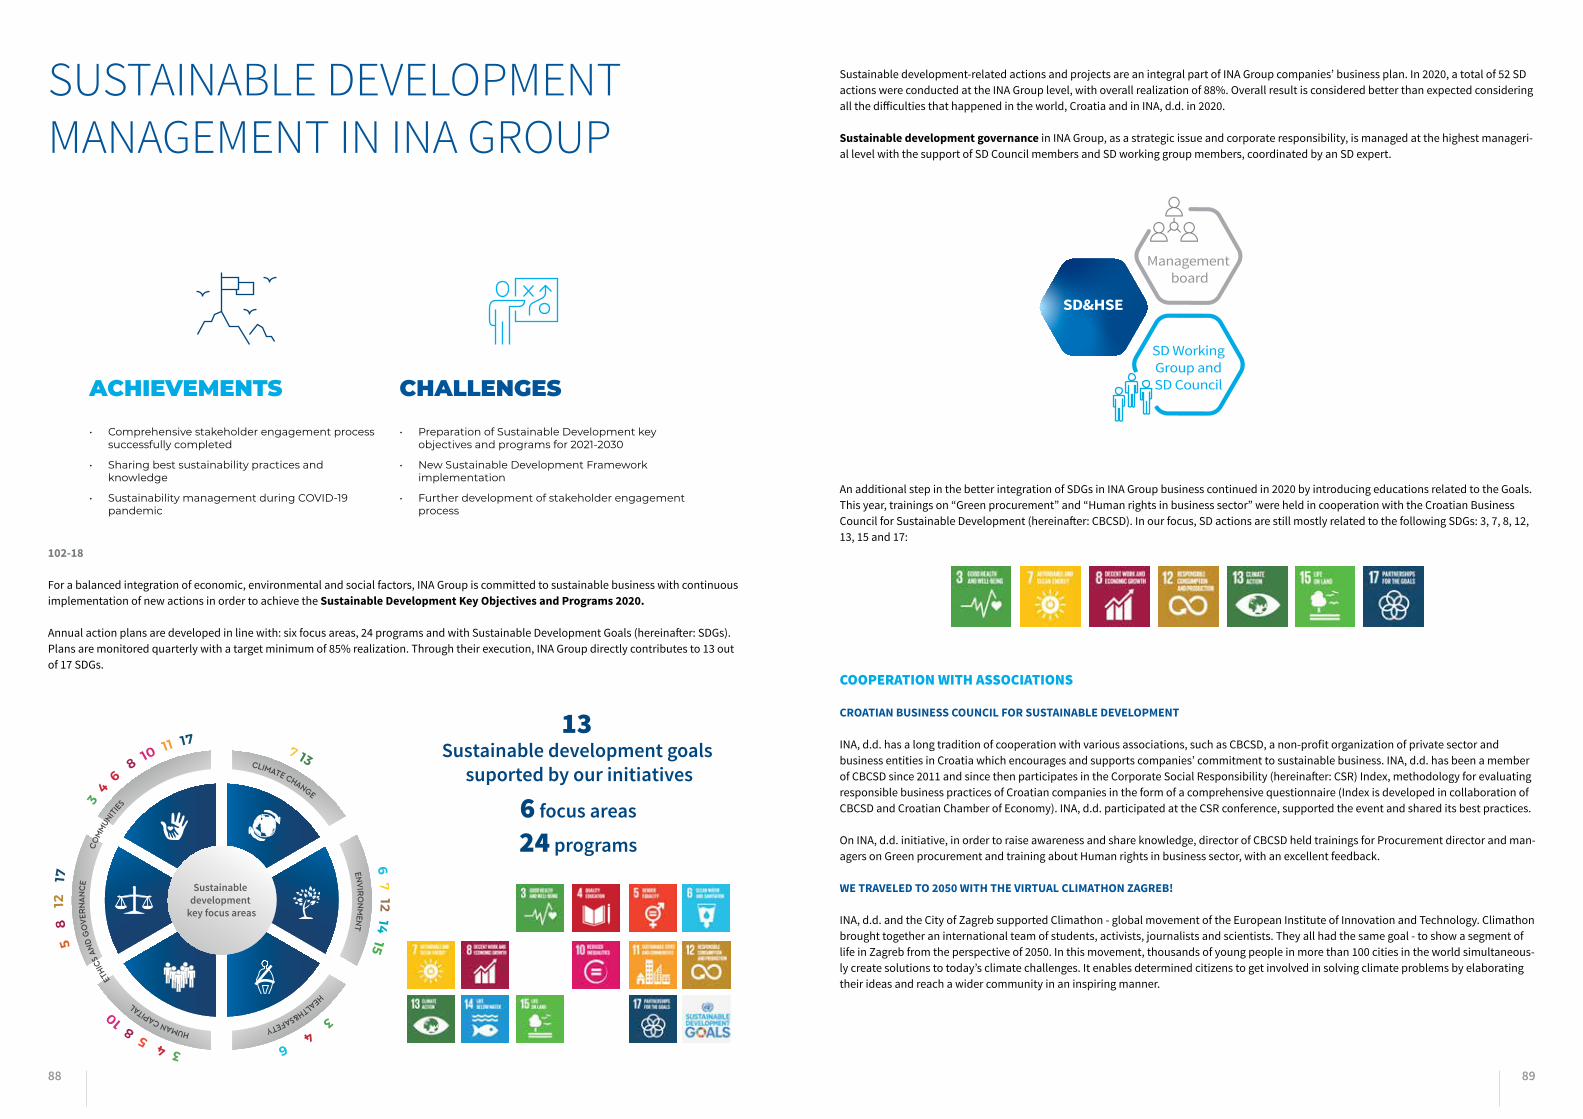
88 89
SUSTAINABLE DEVELOPMENT MANAGEMENT IN INA GROUP
ACHIEVEMENTS
• Comprehensive stakeholder engagement process successfully completed
• Sharing best sustainability practices and knowledge
• Sustainability management during COVID-19 pandemic
CHALLENGES
• Preparation of Sustainable Development key objectives and programs for 2021-2030
• New Sustainable Development Framework implementation
• Further development of stakeholder engagement process
102-18
For a balanced integration of economic, environmental and social factors, INA Group is committed to sustainable business with continuous implementation of new actions in order to achieve the Sustainable Development Key Objectives and Programs 2020.
Annual action plans are developed in line with: six focus areas, 24 programs and with Sustainable Development Goals (hereinafter: SDGs). Plans are monitored quarterly with a target minimum of 85% realization. Through their execution, INA Group directly contributes to 13 out of 17 SDGs.
CLIMATE CHANGE
EN
VIR
ON
MEN
T
HEALTH&SAFETY HUMAN CAPITAL
ETH
ICS
AN
D G
OV
ERN
AN
CE
CO
MM
UNITIE
S
13 Sustainable development goals
suported by our initiatives
6 focus areas
24 programs
Sustainable development
key focus areas
Sustainable development-related actions and projects are an integral part of INA Group companies’ business plan. In 2020, a total of 52 SD actions were conducted at the INA Group level, with overall realization of 88%. Overall result is considered better than expected considering all the difficulties that happened in the world, Croatia and in INA, d.d. in 2020.
Sustainable development governance in INA Group, as a strategic issue and corporate responsibility, is managed at the highest manageri-al level with the support of SD Council members and SD working group members, coordinated by an SD expert.Sustainable development governance
Management board
SD Working Group and SD Council
SD&HSE
An additional step in the better integration of SDGs in INA Group business continued in 2020 by introducing educations related to the Goals. This year, trainings on “Green procurement” and “Human rights in business sector” were held in cooperation with the Croatian Business Council for Sustainable Development (hereinafter: CBCSD). In our focus, SD actions are still mostly related to the following SDGs: 3, 7, 8, 12, 13, 15 and 17:
COOPERATION WITH ASSOCIATIONS
CROATIAN BUSINESS COUNCIL FOR SUSTAINABLE DEVELOPMENT
INA, d.d. has a long tradition of cooperation with various associations, such as CBCSD, a non-profit organization of private sector and business entities in Croatia which encourages and supports companies’ commitment to sustainable business. INA, d.d. has been a member of CBCSD since 2011 and since then participates in the Corporate Social Responsibility (hereinafter: CSR) Index, methodology for evaluating responsible business practices of Croatian companies in the form of a comprehensive questionnaire (Index is developed in collaboration of CBCSD and Croatian Chamber of Economy). INA, d.d. participated at the CSR conference, supported the event and shared its best practices.
On INA, d.d. initiative, in order to raise awareness and share knowledge, director of CBCSD held trainings for Procurement director and man-agers on Green procurement and training about Human rights in business sector, with an excellent feedback.
WE TRAVELED TO 2050 WITH THE VIRTUAL CLIMATHON ZAGREB!
INA, d.d. and the City of Zagreb supported Climathon - global movement of the European Institute of Innovation and Technology. Climathon brought together an international team of students, activists, journalists and scientists. They all had the same goal - to show a segment of life in Zagreb from the perspective of 2050. In this movement, thousands of young people in more than 100 cities in the world simultaneous-ly create solutions to today’s climate challenges. It enables determined citizens to get involved in solving climate problems by elaborating their ideas and reach a wider community in an inspiring manner.

90 91
HEALTH AND SAFETY
ACHIEVEMENTS
• No fatalities, best result of indicator TRIR since the start of tracking for own employees and contractors
• Timely and targeted response to the rapid spread of the COVID-19 pandemic - INA Group Operational Plan in case of a pandemic with guidelines defined before the pandemic
• Turnaround in Exploration and Production conducted without any major incidents and lost time injuries
CHALLENGES
• Business continuity in COVID-19 new normal
• Strategic project management (Residue Upgrade Project) from the aspect of health and safety regarding contractors
• Full compliance with the new occupational health limit for benzene
• Compliance with the new minimum exposure lim-its for workers in processes of working with benzene
“ENSURE OPERATIONAL HSE EXCELLENCE”
OCCUPATIONAL HEALTH AND SAFETY INA Group relies on effective and sustainable system of managing the SD&HSE. The lives and health of employees are a key priority for INA Group. In order to define the basic requirements related to SD&HSE in INA Group companies, as well as the impact on the community, and to serve as support to the business objectives of INA Group and create a basis for defining the guidelines for the management in the imple-mentation of SD&HSE principles in daily business activities, the “Sustainable Development, Health, Safety and Environment Management System in INA Group Companies” was developed. In addition to the aforementioned, in the years to come we are going to primarily focus on health and well-being of our employees, as well as the development and collaboration of our most significant contractors in the aspects of health and safety. In fire safety and firefighting, most of our focus will be on standardization and harmonization and restoration of aged assets. The system is based on 16 basic elements with assigned general principles as follows:
������������������������������������������
��� ��������������������
����������������������������������
���������������������
�����������������������������������������������������������������
�������������������������������������������������������
��������������������� �����������
�������������������������������
�����������������������������������
�������������������������������������������
�������������������
������������������������������
������������������������������������
��������������������������������
���������������������������������������������������
��������������
SUSTAINABLE DEVELOPMENT, HEALTH, SAFETY AND ENVIRONMENT MANAGEMENT SYSTEM IN INA GROUP COMPANIES
OCCUPATIONAL HEALTH AND SAFETY MANAGEMENT
403-1, 403-7, 403-8
INA Group strives towards high health protection and safety standards for our employees, contractors and customers, promotion of proac-tive health and safety corporate culture that is recognized by all our employees and contractors, prevention of incidents, assurance of asset integrity and immediate response in emergency and crisis situations. In relation to the health and safety impacts, we are committed to act responsibly and develop goals and actions as an integrative part of all our daily operations.
This is especially important to emphasize in a situation where the company was exposed to challenging situations such as the COVID-19 pandemic or devastating earthquakes in 2020, which required rapid and effective action.
Occupational Health and Safety System at INA Group Companies (hereinafter: OHS system) defines the key elements of work safety in INA Group Companies, with clearly stated duties and responsibilities of the employer, managers, employees and contracted workers through all phases of the system. The general principles of control and the hierarchy of risk reduction measures are based on the principles of develop-ing a culture of safety in the workplace.
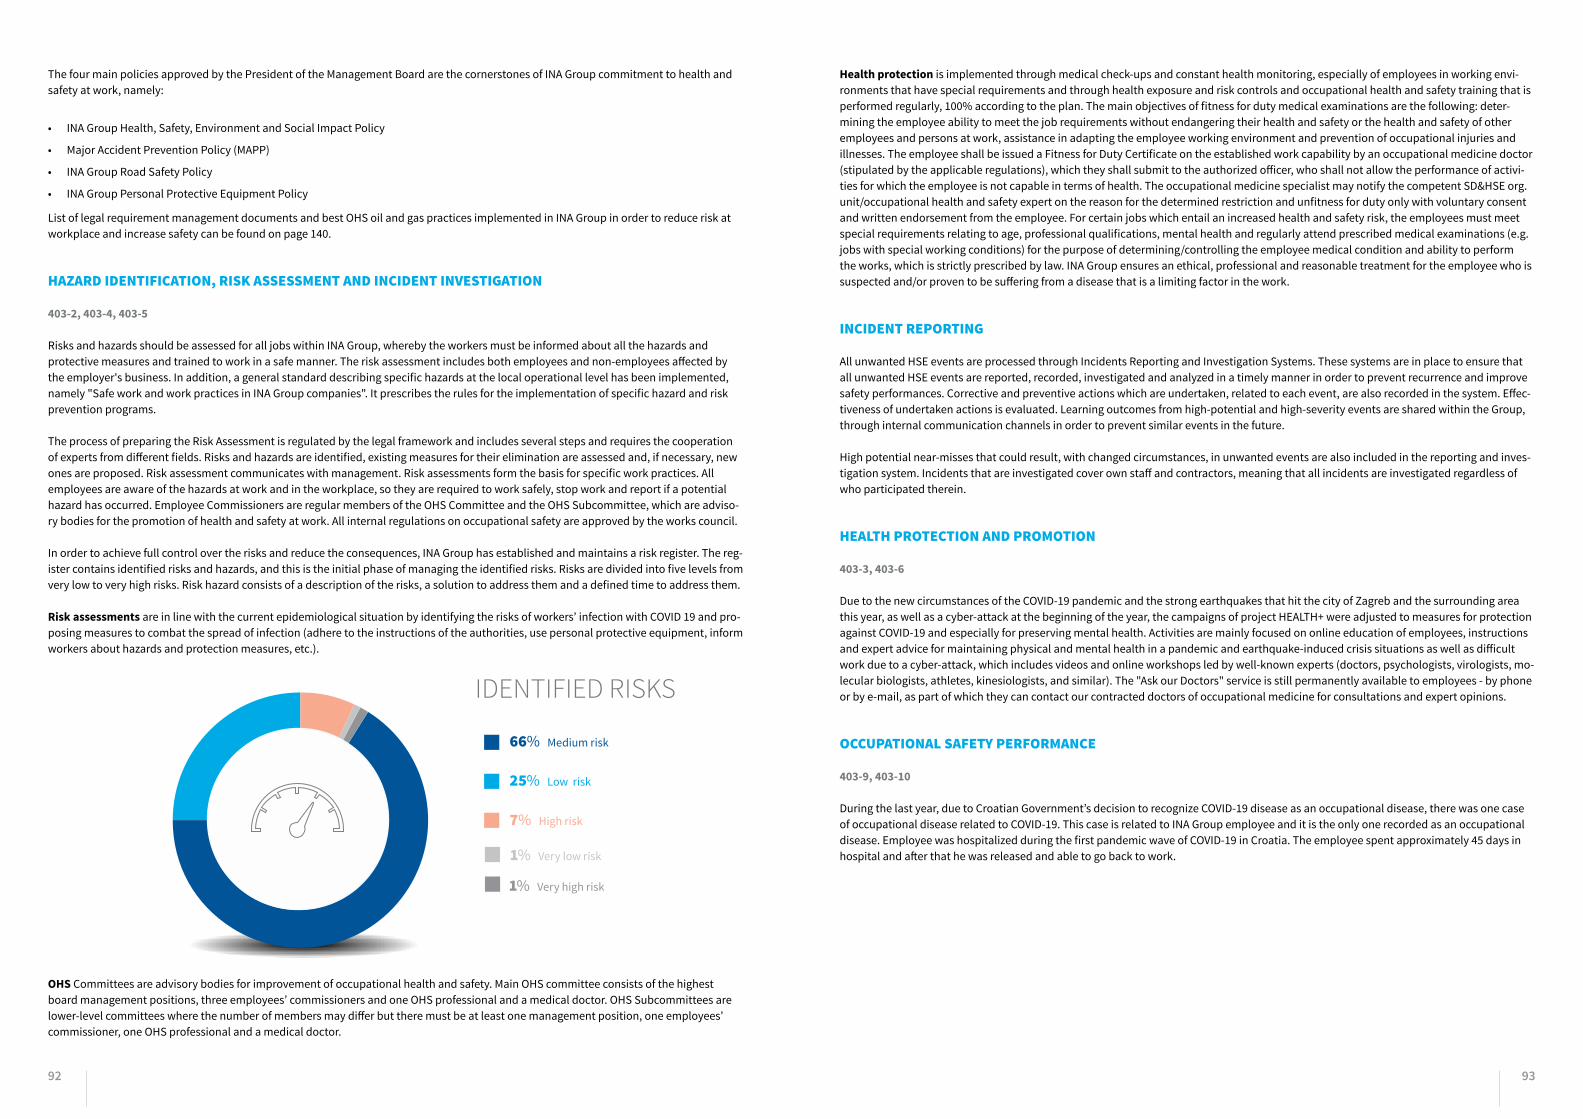
92 93
The four main policies approved by the President of the Management Board are the cornerstones of INA Group commitment to health and safety at work, namely:
• INA Group Health, Safety, Environment and Social Impact Policy
• Major Accident Prevention Policy (MAPP)
• INA Group Road Safety Policy
• INA Group Personal Protective Equipment Policy
List of legal requirement management documents and best OHS oil and gas practices implemented in INA Group in order to reduce risk at workplace and increase safety can be found on page 140.
HAZARD IDENTIFICATION, RISK ASSESSMENT AND INCIDENT INVESTIGATION
403-2, 403-4, 403-5
Risks and hazards should be assessed for all jobs within INA Group, whereby the workers must be informed about all the hazards and protective measures and trained to work in a safe manner. The risk assessment includes both employees and non-employees affected by the employer's business. In addition, a general standard describing specific hazards at the local operational level has been implemented, namely "Safe work and work practices in INA Group companies". It prescribes the rules for the implementation of specific hazard and risk prevention programs.
The process of preparing the Risk Assessment is regulated by the legal framework and includes several steps and requires the cooperation of experts from different fields. Risks and hazards are identified, existing measures for their elimination are assessed and, if necessary, new ones are proposed. Risk assessment communicates with management. Risk assessments form the basis for specific work practices. All employees are aware of the hazards at work and in the workplace, so they are required to work safely, stop work and report if a potential hazard has occurred. Employee Commissioners are regular members of the OHS Committee and the OHS Subcommittee, which are adviso-ry bodies for the promotion of health and safety at work. All internal regulations on occupational safety are approved by the works council.
In order to achieve full control over the risks and reduce the consequences, INA Group has established and maintains a risk register. The reg-ister contains identified risks and hazards, and this is the initial phase of managing the identified risks. Risks are divided into five levels from very low to very high risks. Risk hazard consists of a description of the risks, a solution to address them and a defined time to address them.
Risk assessments are in line with the current epidemiological situation by identifying the risks of workers’ infection with COVID 19 and pro-posing measures to combat the spread of infection (adhere to the instructions of the authorities, use personal protective equipment, inform workers about hazards and protection measures, etc.).
66% Medium risk
25% Low risk
7% High risk
1% Very low risk
1% Very high risk
OHS Committees are advisory bodies for improvement of occupational health and safety. Main OHS committee consists of the highest board management positions, three employees’ commissioners and one OHS professional and a medical doctor. OHS Subcommittees are lower-level committees where the number of members may differ but there must be at least one management position, one employees’ commissioner, one OHS professional and a medical doctor.
Health protection is implemented through medical check-ups and constant health monitoring, especially of employees in working envi-ronments that have special requirements and through health exposure and risk controls and occupational health and safety training that is performed regularly, 100% according to the plan. The main objectives of fitness for duty medical examinations are the following: deter-mining the employee ability to meet the job requirements without endangering their health and safety or the health and safety of other employees and persons at work, assistance in adapting the employee working environment and prevention of occupational injuries and illnesses. The employee shall be issued a Fitness for Duty Certificate on the established work capability by an occupational medicine doctor (stipulated by the applicable regulations), which they shall submit to the authorized officer, who shall not allow the performance of activi-ties for which the employee is not capable in terms of health. The occupational medicine specialist may notify the competent SD&HSE org. unit/occupational health and safety expert on the reason for the determined restriction and unfitness for duty only with voluntary consent and written endorsement from the employee. For certain jobs which entail an increased health and safety risk, the employees must meet special requirements relating to age, professional qualifications, mental health and regularly attend prescribed medical examinations (e.g. jobs with special working conditions) for the purpose of determining/controlling the employee medical condition and ability to perform the works, which is strictly prescribed by law. INA Group ensures an ethical, professional and reasonable treatment for the employee who is suspected and/or proven to be suffering from a disease that is a limiting factor in the work.
INCIDENT REPORTING
All unwanted HSE events are processed through Incidents Reporting and Investigation Systems. These systems are in place to ensure that all unwanted HSE events are reported, recorded, investigated and analyzed in a timely manner in order to prevent recurrence and improve safety performances. Corrective and preventive actions which are undertaken, related to each event, are also recorded in the system. Effec-tiveness of undertaken actions is evaluated. Learning outcomes from high-potential and high-severity events are shared within the Group, through internal communication channels in order to prevent similar events in the future.
High potential near-misses that could result, with changed circumstances, in unwanted events are also included in the reporting and inves-tigation system. Incidents that are investigated cover own staff and contractors, meaning that all incidents are investigated regardless of who participated therein.
HEALTH PROTECTION AND PROMOTION
403-3, 403-6
Due to the new circumstances of the COVID-19 pandemic and the strong earthquakes that hit the city of Zagreb and the surrounding area this year, as well as a cyber-attack at the beginning of the year, the campaigns of project HEALTH+ were adjusted to measures for protection against COVID-19 and especially for preserving mental health. Activities are mainly focused on online education of employees, instructions and expert advice for maintaining physical and mental health in a pandemic and earthquake-induced crisis situations as well as difficult work due to a cyber-attack, which includes videos and online workshops led by well-known experts (doctors, psychologists, virologists, mo-lecular biologists, athletes, kinesiologists, and similar). The "Ask our Doctors" service is still permanently available to employees - by phone or by e-mail, as part of which they can contact our contracted doctors of occupational medicine for consultations and expert opinions.
OCCUPATIONAL SAFETY PERFORMANCE
403-9, 403-10
During the last year, due to Croatian Government’s decision to recognize COVID-19 disease as an occupational disease, there was one case of occupational disease related to COVID-19. This case is related to INA Group employee and it is the only one recorded as an occupational disease. Employee was hospitalized during the first pandemic wave of COVID-19 in Croatia. The employee spent approximately 45 days in hospital and after that he was released and able to go back to work.
IDENTIFIED RISKS
94 95
5 MAIN CAUSES OF TOTAL RECORDABLE INJURIES INA GROUP
SEVERITIES OF INA GROUP TOTAL RECORDABLE INJURIES IN 2020
PRIMARY CAUSE OF TOTAL RECORDABLE INJURIES INA GROUP
ROOT CAUSE OF TOTAL RECORDABLE INJURIES
19% Struck by
12% Overexertion, strain
12% Cut, puncture, scrape
41% Slips and trips (at the same height)
16% Transportation accident (land, air, inland water, marine)
18% Methods
13% Equipment Factors
4% Transportation Factors
47% Manpower
16% Working Environment
2% Other
13% Organisation and Supervision (incl. Contractor Management)
5% Communication
10% Risk Assessment and Management (Hazard Identification and Analysis)9% Training
42% Human Factors
8% Rules, Regulations, Documentation
5% Other
4% Design, Layout
4% Rules, Regulations, Documentation
7% Severity 1
2% Severity 3
27% Severity 2
Total number of total recordable injuries (hereinafter: TRI) was 36, out of which 30 lost-time injuries and six medical treatment cases. 36 TRIs include contractors and own staff. Severity is measured on the scale from 0 to 5, with 0 being near-miss, and 5 the worst possible inci-dent (from OHS point of view this would be an event with multiple deaths). As shown in graph above, we can clearly see that in 2020 we had only two high-severity incidents.

96 97
INA GROUP EMPLOYEES AND CONTRACTORS 2018 2019 2020
NUMBER OF FATALITIES AS A RESULT OF WORK-RELATED INJURY
0 0 0
FATALITY RATES AS A RESULT OF WORK-RELATED INJURY 0 0 0
NUMBER OF HIGH–CONSEQUENCE WORK-RELATED INJURIES (EXCLUDING FATALITIES)
1 1 2
HIGH–CONSEQUENCE WORK-RELATED INJURY RATE (EXCLUD-ING FATALITIES)
0.04 0.08 0.09
NUMBER OF RECORDABLE WORK-RELATED INJURIES 69 51 36
RECORDABLE WORK-RELATED INJURY RATE 2.70 1.97 1.70
NUMBER OF HOURS WORKED 25,571,939 25,906,895 21,614,971
INA GROUP CONTRACTORS 2018 2019 2020
NUMBER OF FATALITIES AS A RESULT OF WORK-RELATED INJURY 0 0 0
FATALITY RATES AS A RESULT OF WORK-RELATED INJURY 0 0 0
NUMBER OF HIGH–CONSEQUENCE WORK-RELATED INJURIES (EXCLUDING FATALITIES) 0 1 2
HIGH–CONSEQUENCE WORK-RELATED INJURY RATE (EXCLUD-ING FATALITIES) 0 0.14 0.34
NUMBER OF RECORDABLE WORK-RELATED INJURIES 12 9 8
RECORDABLE WORK-RELATED INJURY RATE 1.77 1.23 1.36
NUMBER OF HOURS WORKED 6,779,520 7,344,237 5,861,637*rates have been calculated based on 1,000,000 hours worked
When looking at two high-consequence work-related injuries, the main reason behind was fall from height and the 2nd was due to a traffic accident. Both of them were related to contractors and both of them were investigated from all possible aspects, with corrective and pre-ventive actions already implemented so that this kind of incident would not happen again.
OCCUPATIONAL SAFETY PROGRAMS
NEW LIFE SAVING RULES SET
INA Group has shortened and updated its 10 Life Saving Rules to improve the safety performance and to give everyone the license to say ‘NO’ when safety is at risk, focusing on the most important aspects of safe work in our industrial environment. These rules are designed to increase individual awareness of the ownership of critical safeguarding measures in order to prevent serious personal injuries and fatalities.
The rules improve clarity and provide for standardized operations by operators and contractors doing work across INA Group. The rules are simple, concise and do what they say – save lives; that is why they are critical, and it is expected that everyone adheres to them.
During 2020, the top management was involved in the LSR campaign. They filmed their video messages related to each Life Saving rule. Introduction of the video which reviewed the entire set of LSR was conducted by the President of the Management Board. Message for each LSR was conveyed by a different operational director. The campaign was launched through all available internal communication channels. Each of these video messages was shared with more than 4,500 employees through internal digital channels.
Life Saving Rules:
• Use all required personal protective equipment and equipment fit for purpose
• Monitor the atmosphere and follow the permit to work
• Apply lockout/tagout devices, ensure safety controls are in place
• Obtain authorization before entering a confined space
• Follow the safe lifting rules
• Drive safely
Remember, we are all personally responsible for our safety!
SMART AWARD
Training and improving driving skills Since 2010
SAFE DRIVING PROGRAM
LIFE SAVING RULES
Years
3“SMART”
Contractors
3
“SMART” Project
cooperation
3
“SMART” Employees
3
Award for outstanding contribution in the field of SD&HSE for employees and contractors.
241 Training
3,040Employees
FIRE PROTECTION AND PROCESS SAFETY MANAGEMENT
PROCESS SAFETY MANAGEMENT
OG – 13
In 2020, our focus in the process safety management system (hereinafter: PSM) was on the successful implementation of two Enablon mod-ules (Risk Management and Incident Investigation) which can provide a better insight into the operational risk management and incident investigation at Downstream businesses.
A new practice was implemented – this is to require Ready for Start-up Certificate at Pre-Startup Safety Review for all new investment proj-ects. A new procedure was issued: Management of Change for personnel critical for process safety.
*rates have been calculated based on 1,000,000 hours worked
SMART AWARD
Training and improving driving skills Since 2010
SAFE DRIVING PROGRAM
LIFE SAVING RULES
Years
3“SMART”
Contractors
3
“SMART” Project
cooperation
3
“SMART” Employees
3
Award for outstanding contribution in the field of SD&HSE for employees and contractors.
241 Training
3,040Employees

98 99
Regarding the process safety events (hereinafter: PSE), in 2020 we recorded six TIER 1 (process safety events with highest consequence) and 20 TIER 2 events (process safety events with lower consequence). All six of TIER 1 PSEs were caused by material release over threshold quan-tities under API 754 standard - one hydrochloric acid leakage from the truck tanker and five hydrocarbon leaks from underground pipelines, all of them in Exploration and Production. For all of these PSEs, preventive and corrective measures were determined and implemented in order to prevent their recurrence. Reasoning behind a bigger number of reported TIER 1 and TIER 2 events was better tracking of PSEs and reporting through standard reporting system Enablon.
PROCESS SAFETY EVENTS
NUMBER OF FIRE CASES
2018 2019 2020
7
3
6
4
11
20
Tier 1 Tier 2
FIRE PROTECTION AND RISK AND CHANGE MANAGEMENT
102-11
Fire protection and firefighting in INA Group are regulated by national regulations of the Republic of Croatia (laws and regulations) as well as INA internal documents covering these areas (Fire Prevention, Protection and Fire Brigade Management in INA Group Companies). To-gether, they form an integral part of protective activities at all INA Group sites and locations.
INA Group is responsible and dedicated to ensure fire protection/firefighting requirements and meet the local legislation (but not necessar-ily limited to them). The entire fire protection system (passive/active) must be harmonized with the requirements of legal regulations, but also with the constant trend of improvement based on the best world standards and industrial practices.
The core business of INA, d.d. as a company is exploration, production of oil and gas as well as processing, production, manipulation, stor-age and distribution of petroleum products in the Republic of Croatia, but also in the surrounding countries. Due to the risks and dangers that accompany this type of industry, it can be characterized as one of the most dangerous industries and activities regarding the risk of occurrence and spread of fire and explosion.
In the Republic of Croatia, according to the current legislation, there are four fire hazard categories (category 1-4). According to this fire hazard categorization, INA Group has 23 categorized (Category 1 and 2) sites and locations. 13 locations in INA Group are also categorized as SEVESO sites. As Part of SD&HSE 2020 strategy in the field of Firefighting, the newly established OpCo INA VATROGASNI SERVISI d.o.o. successfully continued to provide services in INA Group in 2020.
According to the new Firefighting Act (2019), it is necessary to employ our own firefighters (FTE) at locations classified in the fire risk catego-ry 1. Therefore, during 2020, the fire brigades of INA VATROGASNI SERVISI d.o.o. employed firefighters up to the required number. In 2020, 77/77 new firefighters were hired, based on the needs required by categorized locations.
With the aim of increasing the level of operability in FF intervention, raising INA Group's benchmark and aligning with the best industrial practices for firefighting and fire protection in general, one out of three new fire trucks for INA VATROGASNI SERVISI d.o.o. Fire Brigades (one in Exploration and Production, two in Refining and Marketing) planned for procurement were delivered. For the other two fire trucks, the procurement activities will be completed in Q1 2021.
2018 2019 2020
1624
19
The total number of recorded fires in 2020 was 19. Out of the total number of fires, 16 fire cases were categorized as severity 1 (very low) and only three fire cases were categorized as severity 2 (low). 18 of 19 fire cases (95%) were classified as initial fires, with no significant damage/costs, injuries and impact to the environment. In 2020, there were no fires with severity 3 (medium), 4 (high) and 5 (very high).
Comparing the recorded fires in 2020 to the previous 2019, there was a decrease of 21%.
In 2020, in „May – Fire Protection Month” all activities were conducted in the light of measures of protection against COVID-19, with special focus on fire prevention.
Work activities and their implementation at all INA Group locations have been harmonized with the applicable preventive measures in order to prevent the spread of the COVID-19 pandemic and ensure safe work, as well as to maintain the continuity of work.
Fire Brigades conducted fire drills and other firefighting activities, as in all work operations (aforementioned), adhering to the preventive measures against COVID-19.
16% Equipment failure
11% Equipment filure (vehicle)
10% Mechanical failure
16% Electric failure
47% Housekeeping
FIRE CASES CAUSES
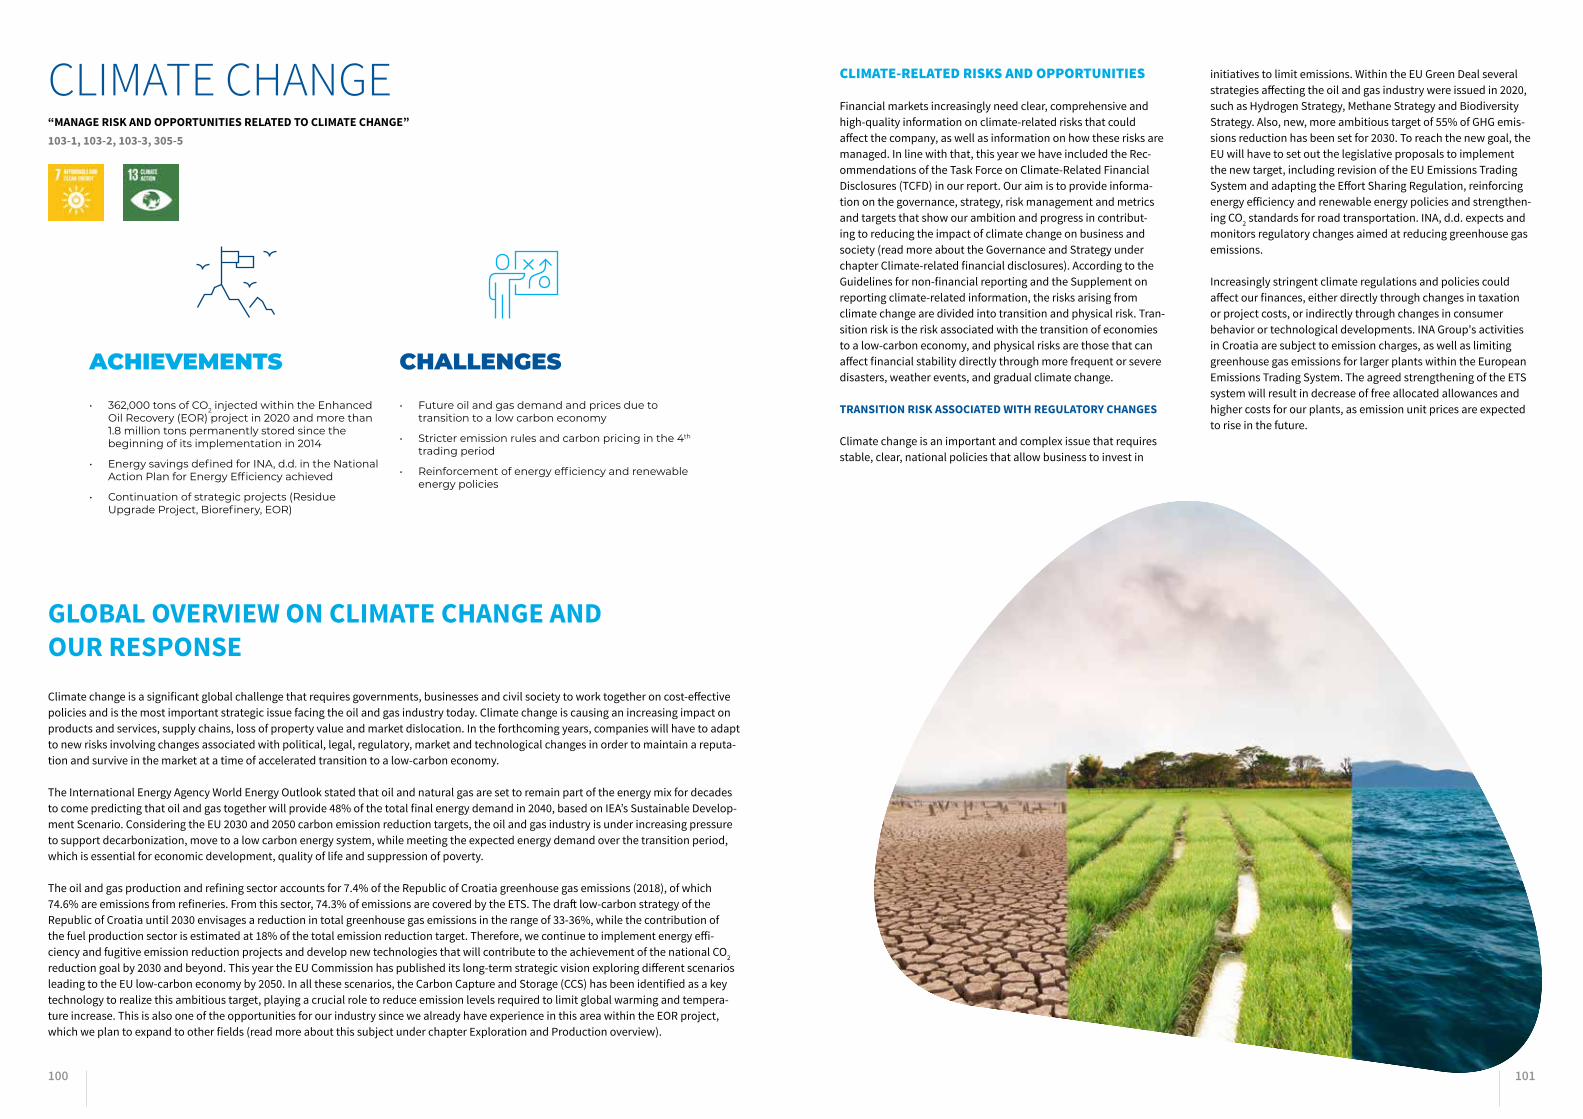
100 101
CLIMATE-RELATED RISKS AND OPPORTUNITIES
Financial markets increasingly need clear, comprehensive and high-quality information on climate-related risks that could affect the company, as well as information on how these risks are managed. In line with that, this year we have included the Rec-ommendations of the Task Force on Climate-Related Financial Disclosures (TCFD) in our report. Our aim is to provide informa-tion on the governance, strategy, risk management and metrics and targets that show our ambition and progress in contribut-ing to reducing the impact of climate change on business and society (read more about the Governance and Strategy under chapter Climate-related financial disclosures). According to the Guidelines for non-financial reporting and the Supplement on reporting climate-related information, the risks arising from climate change are divided into transition and physical risk. Tran-sition risk is the risk associated with the transition of economies to a low-carbon economy, and physical risks are those that can affect financial stability directly through more frequent or severe disasters, weather events, and gradual climate change.
TRANSITION RISK ASSOCIATED WITH REGULATORY CHANGES
Climate change is an important and complex issue that requires stable, clear, national policies that allow business to invest in
initiatives to limit emissions. Within the EU Green Deal several strategies affecting the oil and gas industry were issued in 2020, such as Hydrogen Strategy, Methane Strategy and Biodiversity Strategy. Also, new, more ambitious target of 55% of GHG emis-sions reduction has been set for 2030. To reach the new goal, the EU will have to set out the legislative proposals to implement the new target, including revision of the EU Emissions Trading System and adapting the Effort Sharing Regulation, reinforcing energy efficiency and renewable energy policies and strengthen-ing CO2 standards for road transportation. INA, d.d. expects and monitors regulatory changes aimed at reducing greenhouse gas emissions.
Increasingly stringent climate regulations and policies could affect our finances, either directly through changes in taxation or project costs, or indirectly through changes in consumer behavior or technological developments. INA Group's activities in Croatia are subject to emission charges, as well as limiting greenhouse gas emissions for larger plants within the European Emissions Trading System. The agreed strengthening of the ETS system will result in decrease of free allocated allowances and higher costs for our plants, as emission unit prices are expected to rise in the future.
CLIMATE CHANGE
ACHIEVEMENTS
• 362,000 tons of CO2 injected within the Enhanced Oil Recovery (EOR) project in 2020 and more than 1.8 million tons permanently stored since the beginning of its implementation in 2014
• Energy savings defined for INA, d.d. in the National Action Plan for Energy Efficiency achieved
• Continuation of strategic projects (Residue Upgrade Project, Biorefinery, EOR)
CHALLENGES
• Future oil and gas demand and prices due to transition to a low carbon economy
• Stricter emission rules and carbon pricing in the 4th trading period
• Reinforcement of energy efficiency and renewable energy policies
“MANAGE RISK AND OPPORTUNITIES RELATED TO CLIMATE CHANGE”103-1, 103-2, 103-3, 305-5
GLOBAL OVERVIEW ON CLIMATE CHANGE AND OUR RESPONSE Climate change is a significant global challenge that requires governments, businesses and civil society to work together on cost-effective policies and is the most important strategic issue facing the oil and gas industry today. Climate change is causing an increasing impact on products and services, supply chains, loss of property value and market dislocation. In the forthcoming years, companies will have to adapt to new risks involving changes associated with political, legal, regulatory, market and technological changes in order to maintain a reputa-tion and survive in the market at a time of accelerated transition to a low-carbon economy.
The International Energy Agency World Energy Outlook stated that oil and natural gas are set to remain part of the energy mix for decades to come predicting that oil and gas together will provide 48% of the total final energy demand in 2040, based on IEA’s Sustainable Develop-ment Scenario. Considering the EU 2030 and 2050 carbon emission reduction targets, the oil and gas industry is under increasing pressure to support decarbonization, move to a low carbon energy system, while meeting the expected energy demand over the transition period, which is essential for economic development, quality of life and suppression of poverty.
The oil and gas production and refining sector accounts for 7.4% of the Republic of Croatia greenhouse gas emissions (2018), of which 74.6% are emissions from refineries. From this sector, 74.3% of emissions are covered by the ETS. The draft low-carbon strategy of the Republic of Croatia until 2030 envisages a reduction in total greenhouse gas emissions in the range of 33-36%, while the contribution of the fuel production sector is estimated at 18% of the total emission reduction target. Therefore, we continue to implement energy effi-ciency and fugitive emission reduction projects and develop new technologies that will contribute to the achievement of the national CO2 reduction goal by 2030 and beyond. This year the EU Commission has published its long-term strategic vision exploring different scenarios leading to the EU low-carbon economy by 2050. In all these scenarios, the Carbon Capture and Storage (CCS) has been identified as a key technology to realize this ambitious target, playing a crucial role to reduce emission levels required to limit global warming and tempera-ture increase. This is also one of the opportunities for our industry since we already have experience in this area within the EOR project, which we plan to expand to other fields (read more about this subject under chapter Exploration and Production overview).
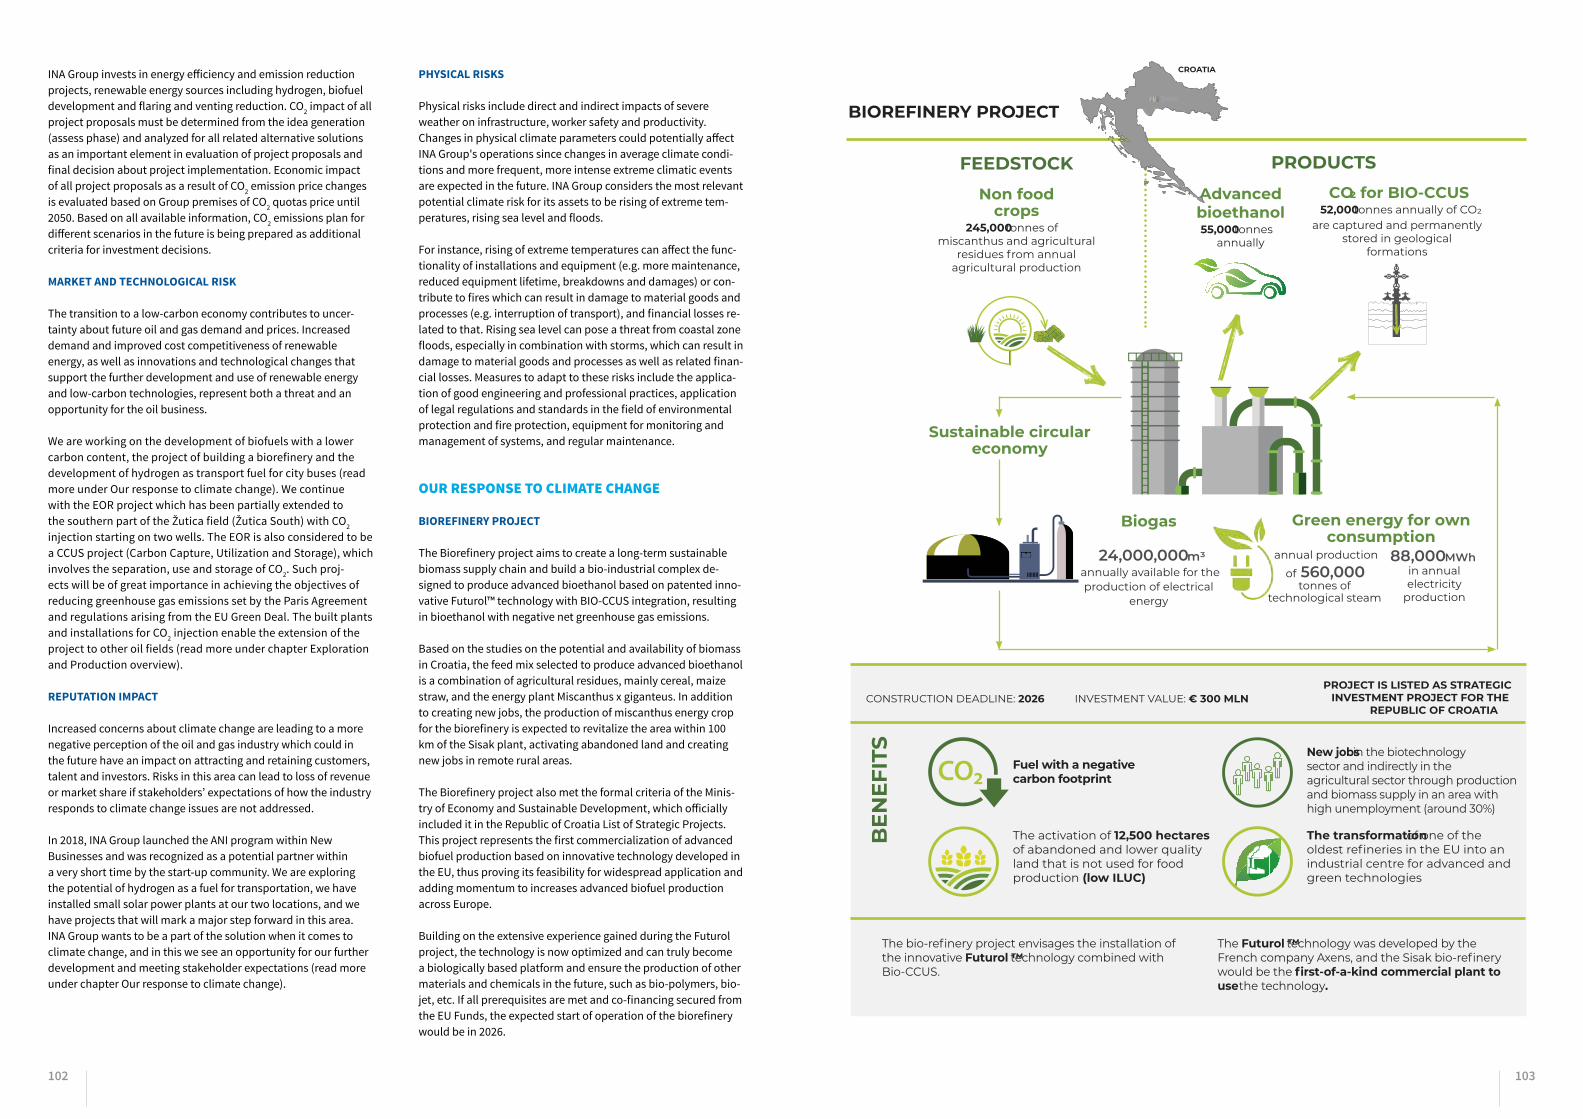
102 103
INA Group invests in energy efficiency and emission reduction projects, renewable energy sources including hydrogen, biofuel development and flaring and venting reduction. CO2 impact of all project proposals must be determined from the idea generation (assess phase) and analyzed for all related alternative solutions as an important element in evaluation of project proposals and final decision about project implementation. Economic impact of all project proposals as a result of CO2 emission price changes is evaluated based on Group premises of CO2 quotas price until 2050. Based on all available information, CO2 emissions plan for different scenarios in the future is being prepared as additional criteria for investment decisions.
MARKET AND TECHNOLOGICAL RISK
The transition to a low-carbon economy contributes to uncer-tainty about future oil and gas demand and prices. Increased demand and improved cost competitiveness of renewable energy, as well as innovations and technological changes that support the further development and use of renewable energy and low-carbon technologies, represent both a threat and an opportunity for the oil business.
We are working on the development of biofuels with a lower carbon content, the project of building a biorefinery and the development of hydrogen as transport fuel for city buses (read more under Our response to climate change). We continue with the EOR project which has been partially extended to the southern part of the Žutica field (Žutica South) with CO2 injection starting on two wells. The EOR is also considered to be a CCUS project (Carbon Capture, Utilization and Storage), which involves the separation, use and storage of CO2. Such proj-ects will be of great importance in achieving the objectives of reducing greenhouse gas emissions set by the Paris Agreement and regulations arising from the EU Green Deal. The built plants and installations for CO2 injection enable the extension of the project to other oil fields (read more under chapter Exploration and Production overview).
REPUTATION IMPACT
Increased concerns about climate change are leading to a more negative perception of the oil and gas industry which could in the future have an impact on attracting and retaining customers, talent and investors. Risks in this area can lead to loss of revenue or market share if stakeholders’ expectations of how the industry responds to climate change issues are not addressed.
In 2018, INA Group launched the ANI program within New Businesses and was recognized as a potential partner within a very short time by the start-up community. We are exploring the potential of hydrogen as a fuel for transportation, we have installed small solar power plants at our two locations, and we have projects that will mark a major step forward in this area. INA Group wants to be a part of the solution when it comes to climate change, and in this we see an opportunity for our further development and meeting stakeholder expectations (read more under chapter Our response to climate change).
PHYSICAL RISKS
Physical risks include direct and indirect impacts of severe weather on infrastructure, worker safety and productivity. Changes in physical climate parameters could potentially affect INA Group's operations since changes in average climate condi-tions and more frequent, more intense extreme climatic events are expected in the future. INA Group considers the most relevant potential climate risk for its assets to be rising of extreme tem-peratures, rising sea level and floods.
For instance, rising of extreme temperatures can affect the func-tionality of installations and equipment (e.g. more maintenance, reduced equipment lifetime, breakdowns and damages) or con-tribute to fires which can result in damage to material goods and processes (e.g. interruption of transport), and financial losses re-lated to that. Rising sea level can pose a threat from coastal zone floods, especially in combination with storms, which can result in damage to material goods and processes as well as related finan-cial losses. Measures to adapt to these risks include the applica-tion of good engineering and professional practices, application of legal regulations and standards in the field of environmental protection and fire protection, equipment for monitoring and management of systems, and regular maintenance.
OUR RESPONSE TO CLIMATE CHANGE
BIOREFINERY PROJECT
The Biorefinery project aims to create a long-term sustainable biomass supply chain and build a bio-industrial complex de-signed to produce advanced bioethanol based on patented inno-vative Futurol™ technology with BIO-CCUS integration, resulting in bioethanol with negative net greenhouse gas emissions.
Based on the studies on the potential and availability of biomass in Croatia, the feed mix selected to produce advanced bioethanol is a combination of agricultural residues, mainly cereal, maize straw, and the energy plant Miscanthus x giganteus. In addition to creating new jobs, the production of miscanthus energy crop for the biorefinery is expected to revitalize the area within 100 km of the Sisak plant, activating abandoned land and creating new jobs in remote rural areas.
The Biorefinery project also met the formal criteria of the Minis-try of Economy and Sustainable Development, which officially included it in the Republic of Croatia List of Strategic Projects. This project represents the first commercialization of advanced biofuel production based on innovative technology developed in the EU, thus proving its feasibility for widespread application and adding momentum to increases advanced biofuel production across Europe.
Building on the extensive experience gained during the Futurol project, the technology is now optimized and can truly become a biologically based platform and ensure the production of other materials and chemicals in the future, such as bio-polymers, bio-jet, etc. If all prerequisites are met and co-financing secured from the EU Funds, the expected start of operation of the biorefinery would be in 2026.
Fuel with a negative carbon footprint
The activation of 12,500 hectares of abandoned and lower quality land that is not used for food production (low ILUC)
New jobs in the biotechnology sector and indirectly in the agricultural sector through production and biomass supply in an area with high unemployment (around 30%)
The transformation of one of the oldest refineries in the EU into an industrial centre for advanced and green technologies
BIOREFINERY PROJECT
CO for BIO-CCUS52,000 tonnes annually of CO
are captured and permanently stored in geological
formations
Biogas
24,000,000 m annually available for the
production of electrical energy
annual production
of 560,000 tonnes of
technological steam
88,000 MWh in annual electricity
production
Green energy for own consumption
FEEDSTOCK
Non food crops
245,000 tonnes of miscanthus and agricultural
residues from annual agricultural production
Advanced bioethanol 55,000 tonnes
annually
PRODUCTS
Sustainable circular economy
Sisak
CONSTRUCTION DEADLINE: 2026 INVESTMENT VALUE: € 300 MLN PROJECT IS LISTED AS STRATEGIC INVESTMENT PROJECT FOR THE
REPUBLIC OF CROATIA
CROATIA
BEN
EFIT
S
The bio-refinery project envisages the installation of the innovative Futurol ™ technology combined with Bio-CCUS.
The Futurol ™ technology was developed by the French company Axens, and the Sisak bio-refinery would be the first-of-a-kind commercial plant to use the technology.

104 105
ENHANCED OIL RECOVERY PROJECT
The EU Commission has published its long-term strategic vision exploring different scenarios leading to an EU low-carbon economy by 2050. In all these scenarios, the Carbon Capture and Storage (CCS) has been identified as a key technology to achieve this ambitious target, playing a crucial role to reduce emission levels required to limit global warming and temperature increase.
Our EOR project is considered to be a CCUS project. It involves the injection of CO2 and water into depleted oil fields of Ivanić and Žutica in monthly cycles, which contributes to increasing production but also has an important environmental aspect since it significantly reduces CO2 emissions.
Since the beginning of its implementation in 2014, more than 1.8 million tons of CO2 have been permanently stored, which is equivalent to around 30% of annual passenger car emissions in Croatia. The built plants and installations for CO2 injection enable the extension of the project to other oil fields near Ivanić and Žutica, on which we are actively working (read more about this project in 2020 under chapter Exploration and Production overview).
HYDROGEN PROJECT
INA Group is committed to testing the potential of hydrogen as a fuel, and in cooperation with the City of Zagreb we are developing a proj-ect to introduce hydrogen into urban transport. The project refers to detailed analyses of the current situation and comprehensive prepa-rations for the introduction of hydrogen buses in public urban transport, together with all the accompanying infrastructure such as filling stations and hydrogen storage facilities. The activities are carried out according to the Action Plan for Sustainable Energy Development and Adaptation to Climate Change of the City of Zagreb.
Hydrogen is an environmentally friendly fuel powering electric vehicles without the emission of greenhouse gases, particles, noise and vibration. In addition to reducing pollution, it will ensure the implementation of policies and strategies of the EU and the Republic of Croatia to promote sustainable, secure and low-carbon development. At the beginning of 2020, the City of Zagreb applied for the "Project Develop-ment Assistance for Regions", primarily intended for regions and cities of the EU 13 that do not have developed infrastructure or application of hydrogen technologies.
PRODUCTIONH2
STORE&LOADH2
TRANSPORT
REFUELING STATION FOR BUSES&CARS
H2 CITYBUSES
SOLAR POWER PLANTS
A good example of meeting the key principles of sustainability is INA Group's program for the development of solar power plants at existing industrial plants in Sisak, Molve, Rijeka and Kaštel Sućurac. In Rijeka refinery and LPG terminal in Kaštel Sućurac, solar power plants were installed in 2019, and the plan is to install a solar power plant at the Gas Processing Facilities in Molve (9 MW) and at our location in Sisak (3 MW). In total, more than 35,000 panels are planned to be installed on these two power plants on the surface area of almost 15,000 m2. For both projects, building permits were obtained.
Solar power plant in Rijeka Refinery was built at the main entrance parking lot on the canopy construction. So far, it is our largest solar power plant built and the first in a refinery. Expected yearly production is around 100,000 kWh of 100% renewable electric energy intended for own consumption. This photovoltaic power plant will generate financial savings on electricity as well as carbon footprint reduction of about 41 ton of CO2 per year.
These projects open the door to new development for us as a company, that does not end with solar power plants, but gives the potential for development in the direction of other renewable sources, such as the use of geothermal energy or wind energy. Since it is an investment in existing industrial plants, in this manner we give added value to our locations, which is especially important in the context of the transfor-mation of Sisak refinery into sustainable alternatives.
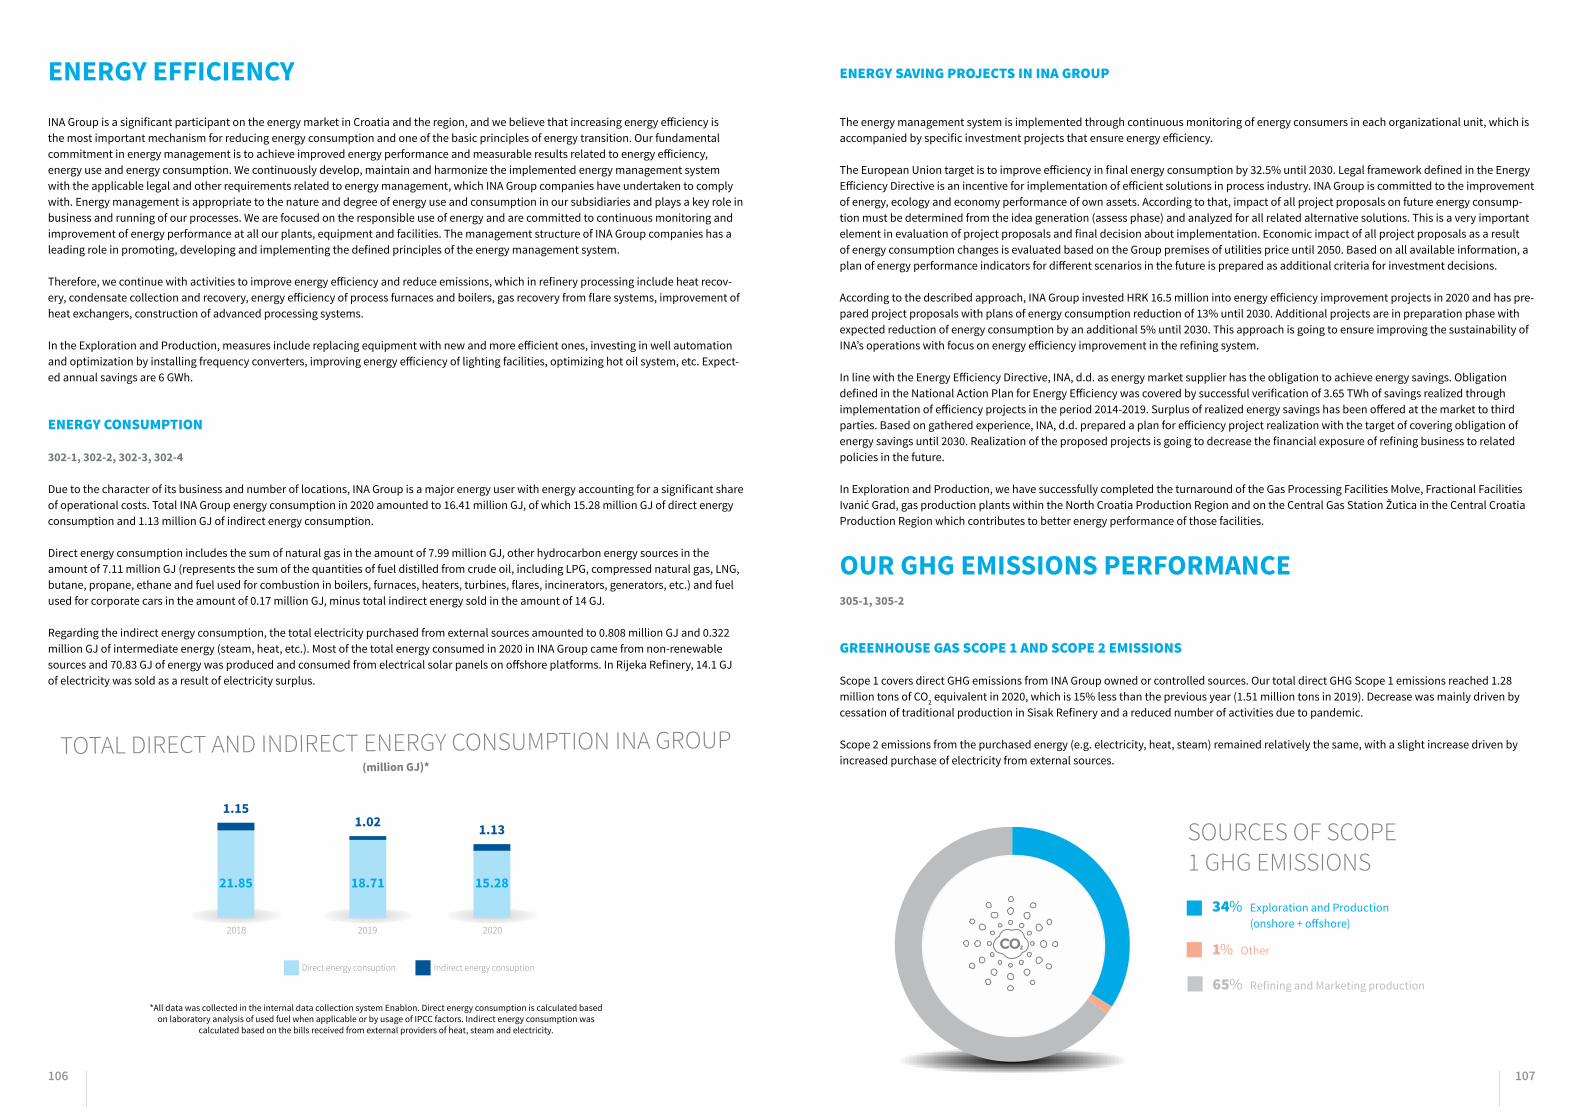
106 107
ENERGY EFFICIENCY INA Group is a significant participant on the energy market in Croatia and the region, and we believe that increasing energy efficiency is the most important mechanism for reducing energy consumption and one of the basic principles of energy transition. Our fundamental commitment in energy management is to achieve improved energy performance and measurable results related to energy efficiency, energy use and energy consumption. We continuously develop, maintain and harmonize the implemented energy management system with the applicable legal and other requirements related to energy management, which INA Group companies have undertaken to comply with. Energy management is appropriate to the nature and degree of energy use and consumption in our subsidiaries and plays a key role in business and running of our processes. We are focused on the responsible use of energy and are committed to continuous monitoring and improvement of energy performance at all our plants, equipment and facilities. The management structure of INA Group companies has a leading role in promoting, developing and implementing the defined principles of the energy management system.
Therefore, we continue with activities to improve energy efficiency and reduce emissions, which in refinery processing include heat recov-ery, condensate collection and recovery, energy efficiency of process furnaces and boilers, gas recovery from flare systems, improvement of heat exchangers, construction of advanced processing systems.
In the Exploration and Production, measures include replacing equipment with new and more efficient ones, investing in well automation and optimization by installing frequency converters, improving energy efficiency of lighting facilities, optimizing hot oil system, etc. Expect-ed annual savings are 6 GWh.
ENERGY CONSUMPTION
302-1, 302-2, 302-3, 302-4
Due to the character of its business and number of locations, INA Group is a major energy user with energy accounting for a significant share of operational costs. Total INA Group energy consumption in 2020 amounted to 16.41 million GJ, of which 15.28 million GJ of direct energy consumption and 1.13 million GJ of indirect energy consumption.
Direct energy consumption includes the sum of natural gas in the amount of 7.99 million GJ, other hydrocarbon energy sources in the amount of 7.11 million GJ (represents the sum of the quantities of fuel distilled from crude oil, including LPG, compressed natural gas, LNG, butane, propane, ethane and fuel used for combustion in boilers, furnaces, heaters, turbines, flares, incinerators, generators, etc.) and fuel used for corporate cars in the amount of 0.17 million GJ, minus total indirect energy sold in the amount of 14 GJ.
Regarding the indirect energy consumption, the total electricity purchased from external sources amounted to 0.808 million GJ and 0.322 million GJ of intermediate energy (steam, heat, etc.). Most of the total energy consumed in 2020 in INA Group came from non-renewable sources and 70.83 GJ of energy was produced and consumed from electrical solar panels on offshore platforms. In Rijeka Refinery, 14.1 GJ of electricity was sold as a result of electricity surplus.
*All data was collected in the internal data collection system Enablon. Direct energy consumption is calculated based on laboratory analysis of used fuel when applicable or by usage of IPCC factors. Indirect energy consumption was
calculated based on the bills received from external providers of heat, steam and electricity.
ENERGY SAVING PROJECTS IN INA GROUP
The energy management system is implemented through continuous monitoring of energy consumers in each organizational unit, which is accompanied by specific investment projects that ensure energy efficiency.
The European Union target is to improve efficiency in final energy consumption by 32.5% until 2030. Legal framework defined in the Energy Efficiency Directive is an incentive for implementation of efficient solutions in process industry. INA Group is committed to the improvement of energy, ecology and economy performance of own assets. According to that, impact of all project proposals on future energy consump-tion must be determined from the idea generation (assess phase) and analyzed for all related alternative solutions. This is a very important element in evaluation of project proposals and final decision about implementation. Economic impact of all project proposals as a result of energy consumption changes is evaluated based on the Group premises of utilities price until 2050. Based on all available information, a plan of energy performance indicators for different scenarios in the future is prepared as additional criteria for investment decisions.
According to the described approach, INA Group invested HRK 16.5 million into energy efficiency improvement projects in 2020 and has pre-pared project proposals with plans of energy consumption reduction of 13% until 2030. Additional projects are in preparation phase with expected reduction of energy consumption by an additional 5% until 2030. This approach is going to ensure improving the sustainability of INA’s operations with focus on energy efficiency improvement in the refining system.
In line with the Energy Efficiency Directive, INA, d.d. as energy market supplier has the obligation to achieve energy savings. Obligation defined in the National Action Plan for Energy Efficiency was covered by successful verification of 3.65 TWh of savings realized through implementation of efficiency projects in the period 2014-2019. Surplus of realized energy savings has been offered at the market to third parties. Based on gathered experience, INA, d.d. prepared a plan for efficiency project realization with the target of covering obligation of energy savings until 2030. Realization of the proposed projects is going to decrease the financial exposure of refining business to related policies in the future.
In Exploration and Production, we have successfully completed the turnaround of the Gas Processing Facilities Molve, Fractional Facilities Ivanić Grad, gas production plants within the North Croatia Production Region and on the Central Gas Station Žutica in the Central Croatia Production Region which contributes to better energy performance of those facilities.
OUR GHG EMISSIONS PERFORMANCE 305-1, 305-2
GREENHOUSE GAS SCOPE 1 AND SCOPE 2 EMISSIONS
Scope 1 covers direct GHG emissions from INA Group owned or controlled sources. Our total direct GHG Scope 1 emissions reached 1.28 million tons of CO2 equivalent in 2020, which is 15% less than the previous year (1.51 million tons in 2019). Decrease was mainly driven by cessation of traditional production in Sisak Refinery and a reduced number of activities due to pandemic.
Scope 2 emissions from the purchased energy (e.g. electricity, heat, steam) remained relatively the same, with a slight increase driven by increased purchase of electricity from external sources.
TOTAL DIRECT AND INDIRECT ENERGY CONSUMPTION INA GROUP
(million GJ)*
2018 2019 2020
21.85 18.71 15.28
1.151.02 1.13
Direct energy consuption Indirect energy consuption
34% Exploration and Production (onshore + offshore)
1% Other
65% Refining and Marketing production
SOURCES OF SCOPE 1 GHG EMISSIONS

108 109
GREENHOUSE GAS SCOPE 3 EMISSIONS
305-3, 305-5
Scope 3 includes other indirect GHG emissions generated from INA Group value chain activities that are not accounted for and reported in Scope 1 and Scope 2 emissions, such as purchased goods and services, use of sold products and services, business travel by air etc. Most of our Scope 3 GHG emissions are the result of the use of sold liquid fuel (86%) and natural gas (12%). The remaining part is mainly generated by suppliers who provide services to INA Group and business trips, as shown in the table below.
GREENHOUSE GAS EMISSIONS – SCOPE 3 (tons of CO2 equivalent) 2020
TOTAL INDIRECT GHG (SCOPE-3) 11,608,432
O/W CUSTOMERS - USE OF PURCHASED REFINERY PRODUCTS 9,996,804
O/W CUSTOMERS - USE OF PURCHASED NATURAL GAS (OWN PRODUCTION) 1,360,255
O/W INA GROUP - BUSINESS TRIPS BY AIR 133
O/W SUPPLIERS - PRODUCTION OF CRUDE OIL (PURCHASED FROM EXTERNAL SOURCES) 251,240
Scope 1
Scope 2
Scope 3
Flaring Venting
Physical & Chemical processingGeneration of heat, steam, electricity
Transportation
direct GHG emissions
indirect GHG emissions
Purchased electricity,heat and steam
indirect GHG emissions
Use of sold products and services
Business travel by air
Purchased goods and services
Supplier emissions
EMISSIONS FROM FLARING AND VENTING
OG 6
Methane is the primary component of natural gas and more powerful than carbon dioxide as a warming agent. Smart methane management not only contributes to emission reduction, but it is also an economic opportunity since emissions represent a loss of saleable product.
In 2020, our direct GHG emissions from flaring amounted to 67.87 thousand tons, 23% down from 2019. In Refining and Marketing, reduc-tion was mainly achieved due to cessation of traditional production in Sisak Refinery and better work of process units after turnaround conducted in 2019 in Rijeka Refinery. In Exploration and Production safety flaring was increased mainly at North and Central Production Region due to conducted turnaround. Emissions from venting are slightly higher than last year due to slight increase in CO2 saparated from gas and smaller amounts of compressed gas from EOR project.
As part of the EU Methane Strategy adopted in 2020, the EU Commission is developing a legislative proposal to prevent methane leaks, which is essential for reaching 2030 climate targets and the 2050 climate neutrality goal. It will include binding rules on monitoring, report-ing, verification, leak detection and repair in the energy sector and will consider legislation to prohibit routine flaring and venting practices.
MOL Group, as a signatory of the initiative without routine flaring until 2030, is obliged to plan zero routine flaring in new oil field develop-ments and seek economic solutions to end routine flaring at existing oil fields no later than by 2030, with INA, d.d. also participating and contributing in the initiative by implementing relevant projects.
In 2020, we have implemented projects for flaring reduction at our two Oil and Gas Exploration and Production locations. At the Gathering Station Mramor Brdo, a compressing plant with rotary screw compressor driven by electric motor was installed to eliminate gas flaring after separation of produced oil and gas as well as to increase oil production without gas losses. Expected CO2 reduction is 5,300 tons per year. At the Measurement and Gathering Station Đeletovci, a gas processing plant was installed to increase gas quality and enable its monetization during the entire year. Expected CO2 reduction amounts to 4,160 tons per year. HRK 23 million was invested in these projects.
In the next period we will focus on review of current methane reporting process, preparation of a full scope of methane source inventory and other steps necessary to prepare a methane emission reduction plan.
Every year we perform the Leak Detection and Repair (hereinafter: LDAR) program at our major facilities. LDAR is performed on equipment with the potential to emit fugitive emissions with infrared camera that visually displays even the slightest leaks on equipment elements and installations through which the fluid flows. Leak detection is performed annually, and repair of leaks is undertaken immediately or within defined time frames, in accordance with the site’s maintenance plans. LDAR program, together with the steps we are taking to reduce flaring, will help further reduce our fugitive emissions. Within our new HSE strategy, which we have started to develop, the focus will be on further expansion of LDAR program to our Logistics and Exploration and Production sites.
DIRECT GHG EMISSIONS FROM VENTING IN EXPLORATION AND PRODUCTION
(in thousand tCO2eq)
2018 2019 2020
236241
255
DIRECT GHG EMISSIONS FROM FLARING
(in thousand tCO2eq)
2018 2019 2020
37.3 31.7
27.631
28.2
4.7
83.4
27.335.6
Rijeka Refinery Sisak Refinery Exploration and Production

110 111
ENVIRONMENT
ACHIEVEMENTS
• Significantly decreased total SOx emissions
• Improvement of soil & groundwater management through provision-based environmental liability revision
• Successful cooperation with relevant authority related to environmental permit revision process and baseline report development
CHALLENGES
• Increased number of spills and leakages mostly due to pipeline corrosion in Exploration and Production
• Supporting business in Sisak Refinery transformation and new projects as part of its transition
• Supporting circular economy via single use plastic reduction programmed and investigation opportunities to utilize waste and residues
“REDUCE ENVIRONMENTAL FOOTPRINT”
We are aware that poor environmental management can contribute to operational risk, damage a company’s reputation and impact financ-es, and that minimizing our environmental footprint is crucial to maintain our license to operate. In accordance with the requirements of customers, suppliers, employees, business partners and other stakeholders, we strive to continuously improve business processes, quality of products and services and reduce environmental impact, as evidenced by the certificates of quality, energy and environmental protec-tion management and sustainability of biofuels.
ENVIRONMENTAL PROTECTION MANAGEMENT IN INA GROUP 102-11
Companies are expected to manage their operations in a way that is good for the environment, people and climate. INA Group major princi-ples and development concepts in environmental protection area are clearly determined in INA Group SD&HSE 2017 – 2020 Key Objectives and Programs which provide an overall long-term development concept towards achieving the highest HSE standards and reflect HSE service orientation and support to business activities.
The main environmental protection objectives and programs were related to:
• Ensuring compliance with environmental legislation: The oil and gas industry is highly regulated and will remain under the spotlight of EU regulators and national governments. The number of environmental laws and regulations is rising, consequently posing an in-creasing challenge for energy-intensive industries to comply with the regulatory obligations. The impact on the business is continuously assessed in order to identify the most cost-effective projects that must be implemented in order to comply with the requirements.
• Implementation of Zero Routine Flaring initiative: The "Zero Routine Flaring by 2030" initiative was launched in 2015 by the UN and World Bank. The objective is to end routine flaring at oil production sites by 2030. During oil production, associated gas is produced and a part of it is utilized, but some of it is flared because of technical, regulatory, or economic constraints. Flaring contributes to climate change and environmental pollution and wastes valuable energy resources.
• Implementation of the Green Fund projects: The Green Fund finances technological and process-related projects with significant environmental benefits, but not those driven by legal obligations.
• Preparation of biodiversity action plans: Oil and gas related activities can affect the natural environment in which they take place, including potential and actual impacts on biodiversity and the natural resources on which local communities depend. Oil and gas operations and activities may also rely on ecosystem services provided by the natural environment, such as freshwater supply or coastal storm-surge protection. INA Group recognizes that it must operate safely and responsibly in order to protect the natural environment and local communities.
• Improvement of soil and groundwater management: The reputation, ecological and human related risks and the financial impact of soil & groundwater protection activities are critical, so the program addressed two issues:
▶ Sites operated by INA Group that may have an impact on soil & groundwater – site-specific risk assessment is conducted
▶ Soil & groundwater contamination that exists at certain sites as a result of past or current activities – remediation activity is conducted. Risk-based remediation strategy for INA Group is defined in order to prevent and control possible migration of underground contamination
Through yearly action plans, realization of defined objectives and programs is monitored, and achievements are accomplished.
In 2020, we have continued with realization of Rijeka Refinery Upgrade Project, which is the single largest investment project in INA’s history in Croatia, worth more than HRK 4 billion. This project will improve refinery configuration and allow better yield. Key elements of project are the construction of Delayed Coker Unit together with coke handling system, coke storage facility, coke port and necessary off-sites, as well as revamps of product treatment units. Coke port and coke logistics systems include closed coke storage (silo solution) which present environmentally friendly high-level technology.
The Green Belt Program was launched in 2014, through which INA Group co-finances projects aimed at sustainable development, envi-ronmental protection and climate change mitigation. Over the past seven years, more than 100 projects have been supported with more than HRK 2 million and 8,137 seedlings of trees, flowers and plants have been planted, with an area of 65,424 m2 greened. The Green Belt has been included in the UN Global Report on Sustainable Development for 2018 as a project that directly contributes to the global goal of sustainable development 15 - the preservation of life on Earth.
We have also assessed our locations in terms of risks and impacts on biodiversity in order to determine the habitats and species of flora and fauna present at the sites and their endangerment. Based thereon, eight locations were identified in the sensitive areas. For three exploita-tion fields biodiversity action plans were developed, while for five identified service stations leaflets are periodically created with informa-tion on what INA, d.d. is doing to protect the environment, as well as information on the protected areas themselves.
FUTURE PERSPECTIVE ON ENVIRONMENTAL PROTECTION
We share a passion for improving the world for the future generations and believe that facing challenges we have ahead of us regarding environmental protection is crucial for further sustainable development. The most important environmental chal-lenges we all face are climate change, loss of biodiversity, natural disasters, extreme weather events, water shortages and waste management. Therefore, we started to develop a new HSE strategy which will move us to more boldly realize our environmental protection aspirations while developing sustainably. Focus areas for further increase of environmental protection and minimiz-ing negative impacts are:
• Implementation of Leak Detection and Repair program in Logistics and Exploration and Production sites
• Methane emission monitoring program development
• Minimization of produced waste landfilling and setting the quantitative target for landfill and recycling
• Reduction of the negative impact on the surface and subsurface water bodies
• Establishment of action plan for reduction of community complaints (noise and smell)

112 113
SPILLS INTO THE ENVIRONMENT 306-3
We continuously strive to prevent any spill that can have an impact on the environment. Spills are monitored and reported in accordance with a well-established practice in our incident investigation and reporting system. Events are investigated and analyzed to prevent their reoccurrence. Actions are applied and acquired knowledge and experiences are shared.
In order to effectively respond to emergency situations, to protect the employees and the environment, as well as to preserve the company assets and reputation, we act in accordance with our internal emergency plans and immediately activate our preparedness and response team and if necessary, specialized contracted companies for environmental remediation and protection against further spread of pollution.
In 2020, we have recorded a significantly higher number of spills than in the previous years. A total of 123 spills were reported of which more than 95% in Exploration and Production. From that total number, 85 spills included hydrocarbon content. Total volume of hydrocarbons spilled amounts to 119 m3 and financial loss connected with the events reached HRK 4.9 million. In 71% of all cases, events were caused by corrosion of aged infrastructure.
Out of the total number, there were ten significant spills with hydrocarbon content above 1 m3, all in Exploration and Production. Total spilled hydrocarbon volume during these events amounts to 108 m3. The most significant one happened in Ivanić, where a third party reported oil leakage in an irrigation canal. Approximately 70 m3 of hydrocarbons were spilled and 370 meters of canal and approximately 2,000 m2 of soil inside the canal were contaminated. Investigation showed that the corrosion of the saltwater pipeline from the dispatching station Graberje to the gathering station Iva-1 was the cause of the spill. Remediation activities were started immediately by the contracted company. The next two events happened at Žutica location where 10 m3 of gas and 0.1 m3 of gas condensate leaked from the collective liq-uid phase pipeline on two occasions. Approximately 3 m2 of soil was polluted. Work on repairing the damaged gas pipeline and remediation of terrain began immediately.
By investigating the spills, we have identified “hot spots” within our production assets, therefore we have planned preventive measures to reduce the incident rate. More than HRK 20 million have been planned for mechanical integrity activities in 2021 – pipelines and vessels repairs and replacements. The focus will be on Production Region Central Croatia with major budget allocation for most critical assets – Žu-tica and Ivanić locations where the majority of spills occurred. We will focus on pipeline rehabilitation between Dispatching station Graberje and Gathering Station Iva-1 which had eight leaks in 2020.
Critical pipelines selection process has started in 2020 and will continue in 2021, with detailed maintenance plan prepared for most critical equipment. Current production assets will be analyzed in order to identify “dead-legs“ and non-operational equipment which could also lead to leakages. After analysis, necessary equipment plan replacement will be developed and implemented accordingly on the most criti-cal assets.
WASTE MANAGEMENT IN INA GROUP 306-2, 306-4, OG 7
Waste management practices play an extremely important role in the global cleanliness and sustainability drive, with human health and the conservation of resources being the responsibility of every company. The avoidance and reduction of waste is a very important part of INA Group waste management.
In 2020, we have continued with implementation of INA Group 2018-2021 Key Waste Management Objectives, which are recognized priority actions that will improve our waste management system.
In order to raise awareness about proper waste management among INA, d.d. employees, articles were prepared and published on the Intranet, with topics covering circular economy, plastic waste reduction, selective waste collection at Retail, waste energy recovery and tips for waste-free holidays.
INA Group IT waste management software was successfully recovered at the end of the year, since the application was damaged in 2020 during the cyber-attack.
In the midst of COVID-19 pandemic, the pilot project of Collection of used cooking oil continued with growing results. Better response of cit-izens may be attributed to months of lockdown, which resulted in over 6.8 tons of used cooking oil collected at our service stations in 2020. Moreover, in three years since the project started, 17 tons of used cooking oil from households were collected. Through separate collection of special waste categories, INA, d.d. helps to meet the Waste Management Plan of the Republic of Croatia for the period 2017-2022. During 2020, a plan of activities was staged in the direction of further project expansion, PR solutions and funding possibilities, whose first results are expected in 2021.
Recognizing the importance and issues of waste management in Croatia as part of research and development, in 2020 INA, d.d. started developing a project plan aimed at waste-to-energy production, which often includes cooperation with universities, laboratories and other partners within and outside the energy sector. Understanding the changes that are happening and accepting the new needs of society and customers, INA, d.d. is willingly opening the door to a new platform for the future.
During 2020, STSI d.o.o. continued with bioremediation activities which are used to remove oil contamination from the soil, mostly excavat-ed during capital reconstructions of service stations. This method is based on the ability of microorganisms to decompose hydrocarbons by their metabolic processes, reducing their concentration to the level when the soil is considered cleaned and can be reused rationally in the environment, which corresponds to the principles of circular waste management. In 2020 STSI d.o.o. started to collect and treat contam-inated soil from pipeline leakages. The concentration of petroleum hydrocarbons in these soils was significantly higher compared to the soils from Retail. However, even with the high concentration of total petroleum hydrocarbons (TPH), purification of contaminated soil was successfully conducted to the level where soil can be reused in the environment.
HYDROCARBON SPILLS ABOVE 1m3 IN INA GROUP
DISTRIBUTION OF SPILLS BY CAUSE
2018 2019 2020
3 2
10
15% Equipment failure
2% Failures
4% Other
71% Corrasian
4% Quality of equipment
4% Mechanical failure
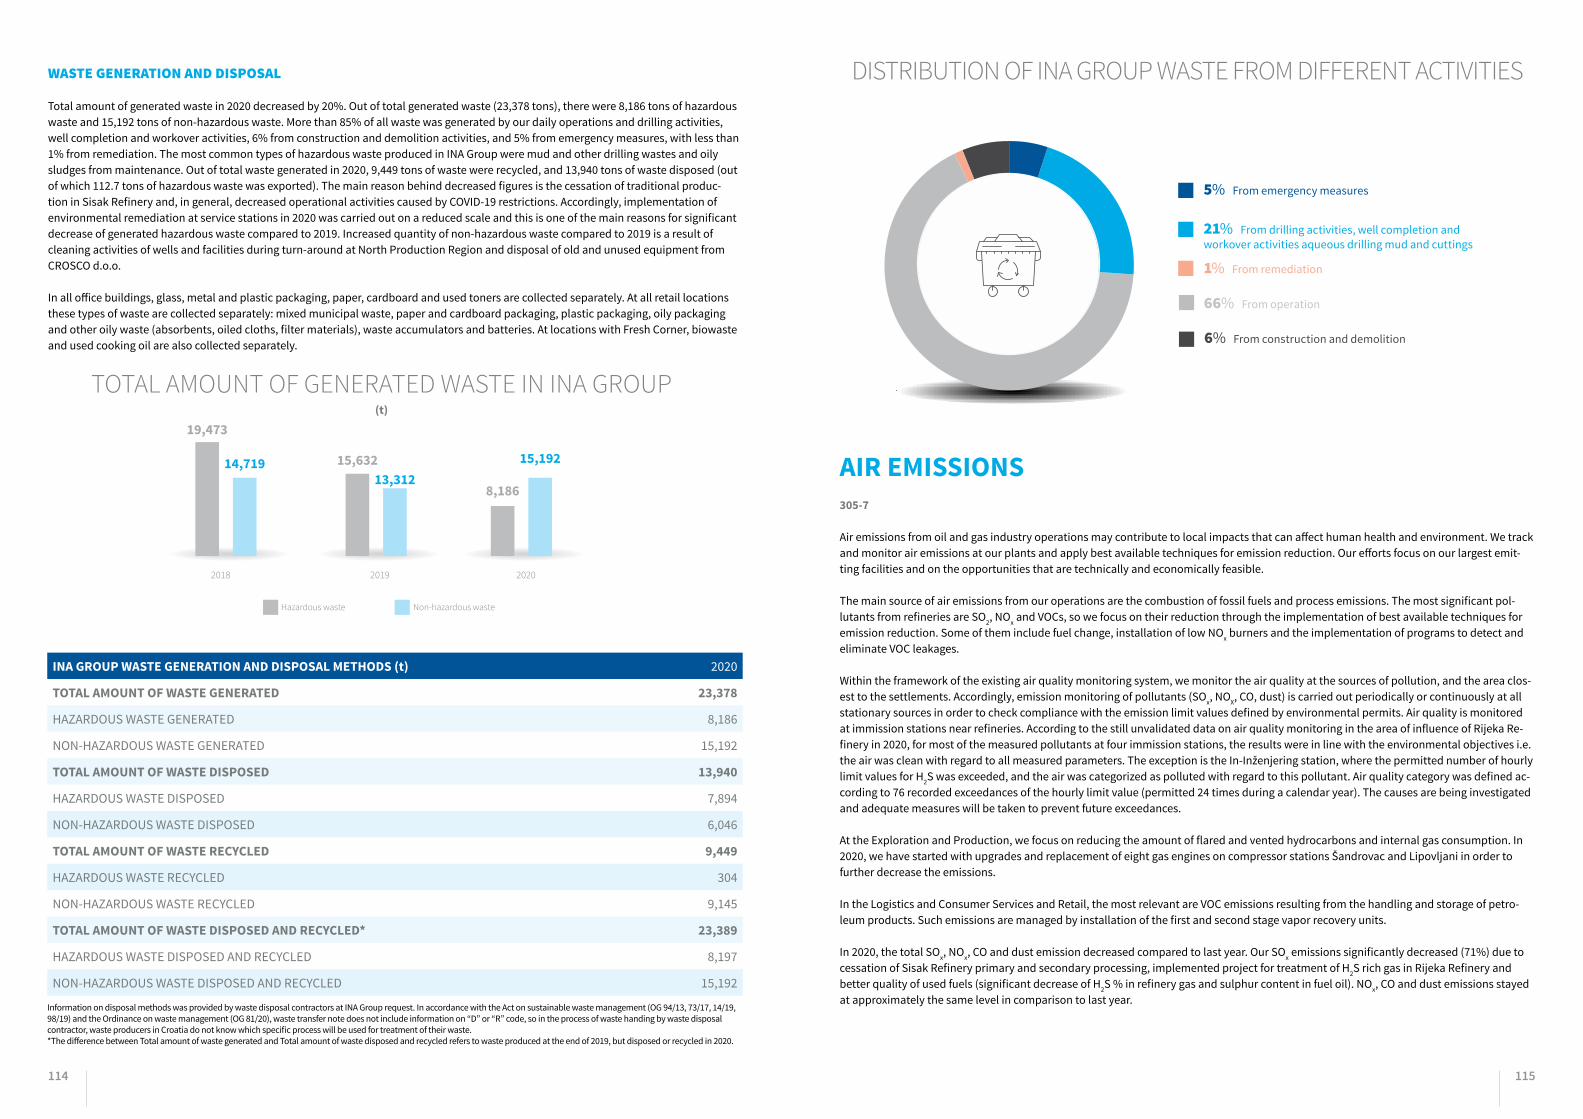
114 115
WASTE GENERATION AND DISPOSAL
Total amount of generated waste in 2020 decreased by 20%. Out of total generated waste (23,378 tons), there were 8,186 tons of hazardous waste and 15,192 tons of non-hazardous waste. More than 85% of all waste was generated by our daily operations and drilling activities, well completion and workover activities, 6% from construction and demolition activities, and 5% from emergency measures, with less than 1% from remediation. The most common types of hazardous waste produced in INA Group were mud and other drilling wastes and oily sludges from maintenance. Out of total waste generated in 2020, 9,449 tons of waste were recycled, and 13,940 tons of waste disposed (out of which 112.7 tons of hazardous waste was exported). The main reason behind decreased figures is the cessation of traditional produc-tion in Sisak Refinery and, in general, decreased operational activities caused by COVID-19 restrictions. Accordingly, implementation of environmental remediation at service stations in 2020 was carried out on a reduced scale and this is one of the main reasons for significant decrease of generated hazardous waste compared to 2019. Increased quantity of non-hazardous waste compared to 2019 is a result of cleaning activities of wells and facilities during turn-around at North Production Region and disposal of old and unused equipment from CROSCO d.o.o.
In all office buildings, glass, metal and plastic packaging, paper, cardboard and used toners are collected separately. At all retail locations these types of waste are collected separately: mixed municipal waste, paper and cardboard packaging, plastic packaging, oily packaging and other oily waste (absorbents, oiled cloths, filter materials), waste accumulators and batteries. At locations with Fresh Corner, biowaste and used cooking oil are also collected separately.
INA GROUP WASTE GENERATION AND DISPOSAL METHODS (t) 2020
TOTAL AMOUNT OF WASTE GENERATED 23,378
HAZARDOUS WASTE GENERATED 8,186
NON-HAZARDOUS WASTE GENERATED 15,192
TOTAL AMOUNT OF WASTE DISPOSED 13,940
HAZARDOUS WASTE DISPOSED 7,894
NON-HAZARDOUS WASTE DISPOSED 6,046
TOTAL AMOUNT OF WASTE RECYCLED 9,449
HAZARDOUS WASTE RECYCLED 304
NON-HAZARDOUS WASTE RECYCLED 9,145
TOTAL AMOUNT OF WASTE DISPOSED AND RECYCLED* 23,389
HAZARDOUS WASTE DISPOSED AND RECYCLED 8,197
NON-HAZARDOUS WASTE DISPOSED AND RECYCLED 15,192
Information on disposal methods was provided by waste disposal contractors at INA Group request. In accordance with the Act on sustainable waste management (OG 94/13, 73/17, 14/19, 98/19) and the Ordinance on waste management (OG 81/20), waste transfer note does not include information on “D” or “R” code, so in the process of waste handing by waste disposal contractor, waste producers in Croatia do not know which specific process will be used for treatment of their waste. *The difference between Total amount of waste generated and Total amount of waste disposed and recycled refers to waste produced at the end of 2019, but disposed or recycled in 2020.
AIR EMISSIONS 305-7
Air emissions from oil and gas industry operations may contribute to local impacts that can affect human health and environment. We track and monitor air emissions at our plants and apply best available techniques for emission reduction. Our efforts focus on our largest emit-ting facilities and on the opportunities that are technically and economically feasible.
The main source of air emissions from our operations are the combustion of fossil fuels and process emissions. The most significant pol-lutants from refineries are SO2, NOx and VOCs, so we focus on their reduction through the implementation of best available techniques for emission reduction. Some of them include fuel change, installation of low NOx burners and the implementation of programs to detect and eliminate VOC leakages.
Within the framework of the existing air quality monitoring system, we monitor the air quality at the sources of pollution, and the area clos-est to the settlements. Accordingly, emission monitoring of pollutants (SOx, NOX, CO, dust) is carried out periodically or continuously at all stationary sources in order to check compliance with the emission limit values defined by environmental permits. Air quality is monitored at immission stations near refineries. According to the still unvalidated data on air quality monitoring in the area of influence of Rijeka Re-finery in 2020, for most of the measured pollutants at four immission stations, the results were in line with the environmental objectives i.e. the air was clean with regard to all measured parameters. The exception is the In-Inženjering station, where the permitted number of hourly limit values for H2S was exceeded, and the air was categorized as polluted with regard to this pollutant. Air quality category was defined ac-cording to 76 recorded exceedances of the hourly limit value (permitted 24 times during a calendar year). The causes are being investigated and adequate measures will be taken to prevent future exceedances.
At the Exploration and Production, we focus on reducing the amount of flared and vented hydrocarbons and internal gas consumption. In 2020, we have started with upgrades and replacement of eight gas engines on compressor stations Šandrovac and Lipovljani in order to further decrease the emissions.
In the Logistics and Consumer Services and Retail, the most relevant are VOC emissions resulting from the handling and storage of petro-leum products. Such emissions are managed by installation of the first and second stage vapor recovery units.
In 2020, the total SOx, NOx, CO and dust emission decreased compared to last year. Our SOx emissions significantly decreased (71%) due to cessation of Sisak Refinery primary and secondary processing, implemented project for treatment of H2S rich gas in Rijeka Refinery and better quality of used fuels (significant decrease of H2S % in refinery gas and sulphur content in fuel oil). NOx, CO and dust emissions stayed at approximately the same level in comparison to last year.
TOTAL AMOUNT OF GENERATED WASTE IN INA GROUP (t)
2018 2019 2020
19,473
15,632
8,186
14,71913,312
15,192
Hazardous waste Non-hazardous waste
DISTRIBUTION OF INA GROUP WASTE FROM DIFFERENT ACTIVITIES
5% From emergency measures
21% From drilling activities, well completion and workover activities aqueous drilling mud and cuttings
1% From remediation
66% From operation
6% From construction and demolition
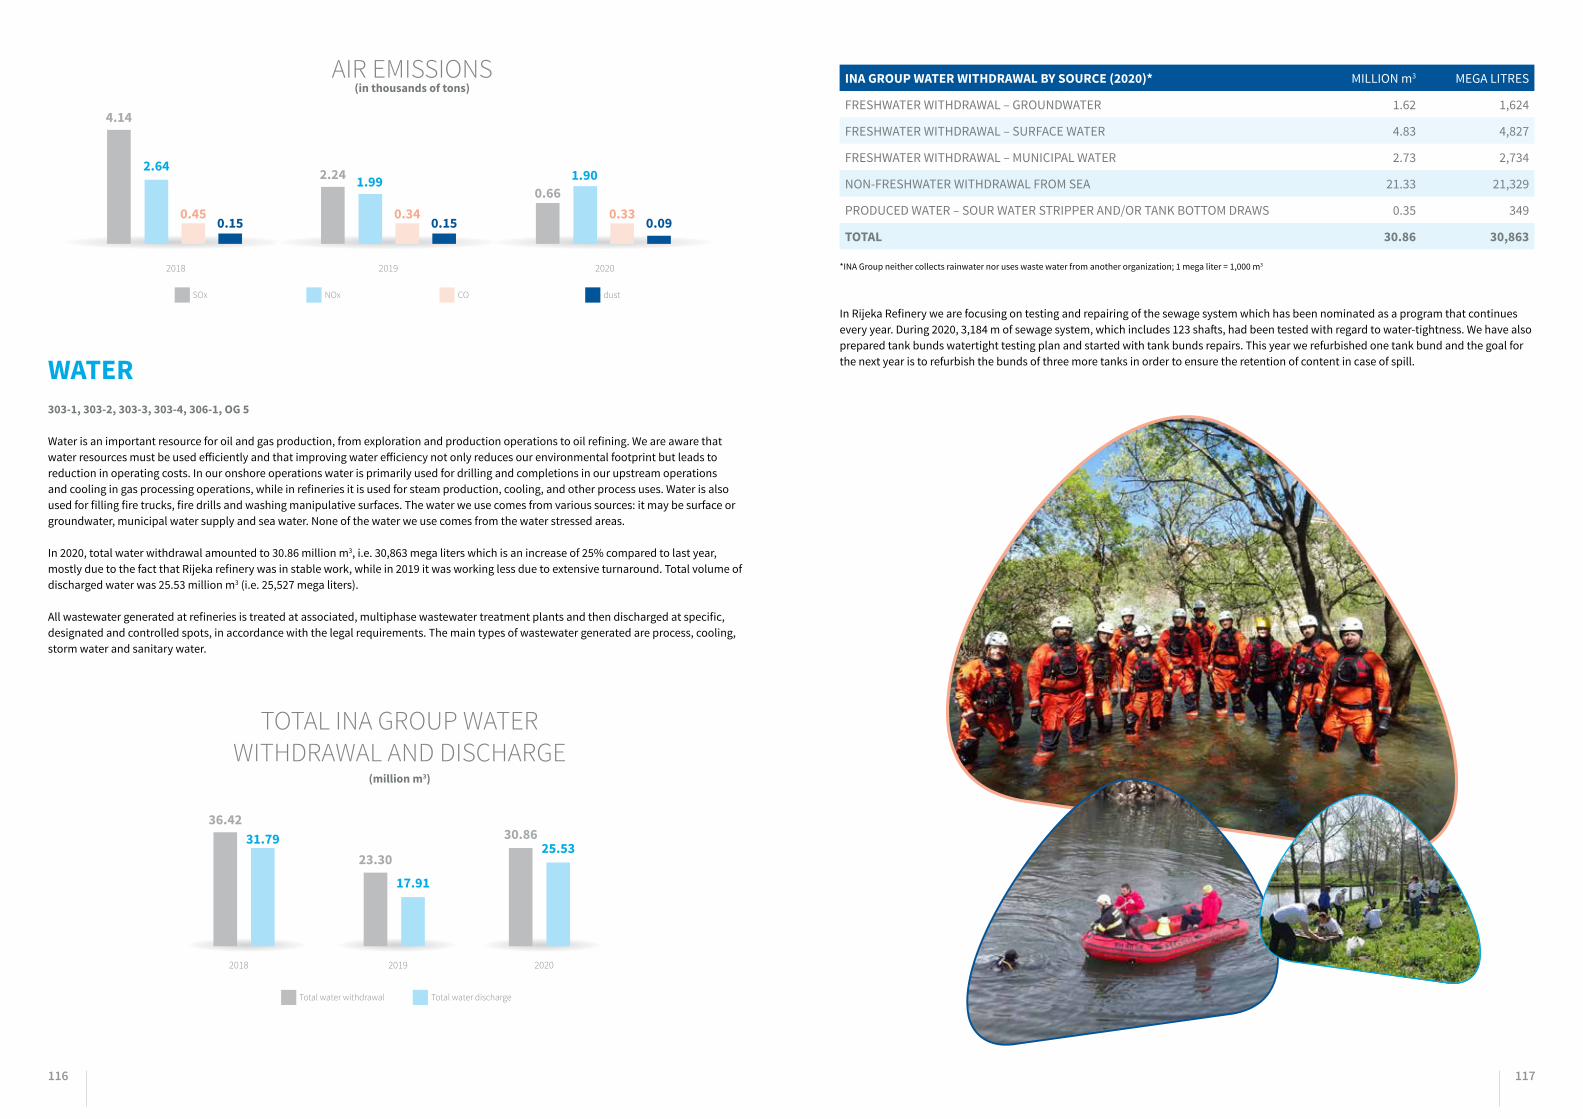
116 117
WATER 303-1, 303-2, 303-3, 303-4, 306-1, OG 5
Water is an important resource for oil and gas production, from exploration and production operations to oil refining. We are aware that water resources must be used efficiently and that improving water efficiency not only reduces our environmental footprint but leads to reduction in operating costs. In our onshore operations water is primarily used for drilling and completions in our upstream operations and cooling in gas processing operations, while in refineries it is used for steam production, cooling, and other process uses. Water is also used for filling fire trucks, fire drills and washing manipulative surfaces. The water we use comes from various sources: it may be surface or groundwater, municipal water supply and sea water. None of the water we use comes from the water stressed areas.
In 2020, total water withdrawal amounted to 30.86 million m3, i.e. 30,863 mega liters which is an increase of 25% compared to last year, mostly due to the fact that Rijeka refinery was in stable work, while in 2019 it was working less due to extensive turnaround. Total volume of discharged water was 25.53 million m3 (i.e. 25,527 mega liters).
All wastewater generated at refineries is treated at associated, multiphase wastewater treatment plants and then discharged at specific, designated and controlled spots, in accordance with the legal requirements. The main types of wastewater generated are process, cooling, storm water and sanitary water.
INA GROUP WATER WITHDRAWAL BY SOURCE (2020)* MILLION m3 MEGA LITRES
FRESHWATER WITHDRAWAL – GROUNDWATER 1.62 1,624
FRESHWATER WITHDRAWAL – SURFACE WATER 4.83 4,827
FRESHWATER WITHDRAWAL – MUNICIPAL WATER 2.73 2,734
NON-FRESHWATER WITHDRAWAL FROM SEA 21.33 21,329
PRODUCED WATER – SOUR WATER STRIPPER AND/OR TANK BOTTOM DRAWS 0.35 349
TOTAL 30.86 30,863
*INA Group neither collects rainwater nor uses waste water from another organization; 1 mega liter = 1,000 m3
In Rijeka Refinery we are focusing on testing and repairing of the sewage system which has been nominated as a program that continues every year. During 2020, 3,184 m of sewage system, which includes 123 shafts, had been tested with regard to water-tightness. We have also prepared tank bunds watertight testing plan and started with tank bunds repairs. This year we refurbished one tank bund and the goal for the next year is to refurbish the bunds of three more tanks in order to ensure the retention of content in case of spill.
AIR EMISSIONS (in thousands of tons)
TOTAL INA GROUP WATER WITHDRAWAL AND DISCHARGE
(million m3)
2018 2019 2020
2018 2019 2020
4.14
36.42
23.30
30.86
2.240.66
2.64
31.79
17.91
25.53
1.99 1.90
0.45 0.34 0.330.15 0.15 0.09
SOx
Total water withdrawal
NOx
Total water discharge
CO dust
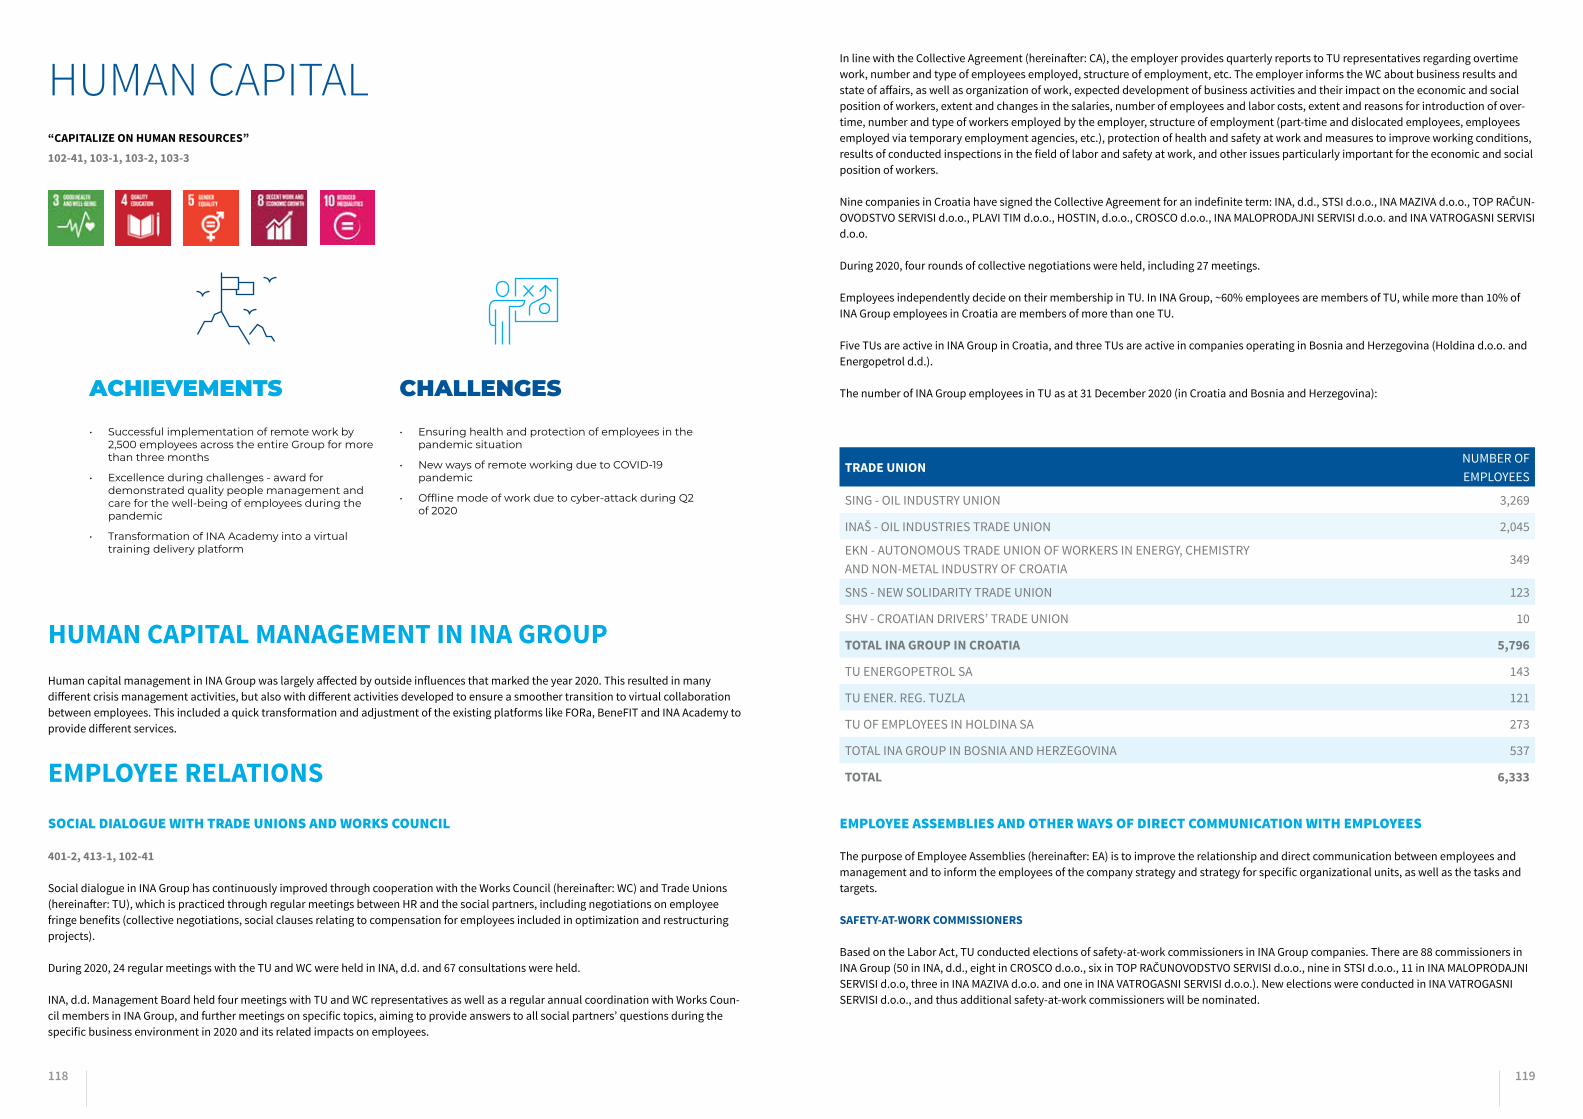
118 119
HUMAN CAPITAL
ACHIEVEMENTS
• Successful implementation of remote work by 2,500 employees across the entire Group for more than three months
• Excellence during challenges - award for demonstrated quality people management and care for the well-being of employees during the pandemic
• Transformation of INA Academy into a virtual training delivery platform
CHALLENGES
• Ensuring health and protection of employees in the pandemic situation
• New ways of remote working due to COVID-19 pandemic
• Offline mode of work due to cyber-attack during Q2 of 2020
“CAPITALIZE ON HUMAN RESOURCES”
102-41, 103-1, 103-2, 103-3
HUMAN CAPITAL MANAGEMENT IN INA GROUP Human capital management in INA Group was largely affected by outside influences that marked the year 2020. This resulted in many different crisis management activities, but also with different activities developed to ensure a smoother transition to virtual collaboration between employees. This included a quick transformation and adjustment of the existing platforms like FORa, BeneFIT and INA Academy to provide different services.
EMPLOYEE RELATIONS
SOCIAL DIALOGUE WITH TRADE UNIONS AND WORKS COUNCIL
401-2, 413-1, 102-41
Social dialogue in INA Group has continuously improved through cooperation with the Works Council (hereinafter: WC) and Trade Unions (hereinafter: TU), which is practiced through regular meetings between HR and the social partners, including negotiations on employee fringe benefits (collective negotiations, social clauses relating to compensation for employees included in optimization and restructuring projects).
During 2020, 24 regular meetings with the TU and WC were held in INA, d.d. and 67 consultations were held.
INA, d.d. Management Board held four meetings with TU and WC representatives as well as a regular annual coordination with Works Coun-cil members in INA Group, and further meetings on specific topics, aiming to provide answers to all social partners’ questions during the specific business environment in 2020 and its related impacts on employees.
In line with the Collective Agreement (hereinafter: CA), the employer provides quarterly reports to TU representatives regarding overtime work, number and type of employees employed, structure of employment, etc. The employer informs the WC about business results and state of affairs, as well as organization of work, expected development of business activities and their impact on the economic and social position of workers, extent and changes in the salaries, number of employees and labor costs, extent and reasons for introduction of over-time, number and type of workers employed by the employer, structure of employment (part-time and dislocated employees, employees employed via temporary employment agencies, etc.), protection of health and safety at work and measures to improve working conditions, results of conducted inspections in the field of labor and safety at work, and other issues particularly important for the economic and social position of workers.
Nine companies in Croatia have signed the Collective Agreement for an indefinite term: INA, d.d., STSI d.o.o., INA MAZIVA d.o.o., TOP RAČUN-OVODSTVO SERVISI d.o.o., PLAVI TIM d.o.o., HOSTIN, d.o.o., CROSCO d.o.o., INA MALOPRODAJNI SERVISI d.o.o. and INA VATROGASNI SERVISI d.o.o.
During 2020, four rounds of collective negotiations were held, including 27 meetings.
Employees independently decide on their membership in TU. In INA Group, ~60% employees are members of TU, while more than 10% of INA Group employees in Croatia are members of more than one TU.
Five TUs are active in INA Group in Croatia, and three TUs are active in companies operating in Bosnia and Herzegovina (Holdina d.o.o. and Energopetrol d.d.).
The number of INA Group employees in TU as at 31 December 2020 (in Croatia and Bosnia and Herzegovina):
TRADE UNIONNUMBER OF EMPLOYEES
SING - OIL INDUSTRY UNION 3,269
INAŠ - OIL INDUSTRIES TRADE UNION 2,045
EKN - AUTONOMOUS TRADE UNION OF WORKERS IN ENERGY, CHEMISTRY AND NON-METAL INDUSTRY OF CROATIA
349
SNS - NEW SOLIDARITY TRADE UNION 123
SHV - CROATIAN DRIVERS’ TRADE UNION 10
TOTAL INA GROUP IN CROATIA 5,796
TU ENERGOPETROL SA 143
TU ENER. REG. TUZLA 121
TU OF EMPLOYEES IN HOLDINA SA 273
TOTAL INA GROUP IN BOSNIA AND HERZEGOVINA 537
TOTAL 6,333
EMPLOYEE ASSEMBLIES AND OTHER WAYS OF DIRECT COMMUNICATION WITH EMPLOYEES
The purpose of Employee Assemblies (hereinafter: EA) is to improve the relationship and direct communication between employees and management and to inform the employees of the company strategy and strategy for specific organizational units, as well as the tasks and targets.
SAFETY-AT-WORK COMMISSIONERS
Based on the Labor Act, TU conducted elections of safety-at-work commissioners in INA Group companies. There are 88 commissioners in INA Group (50 in INA, d.d., eight in CROSCO d.o.o., six in TOP RAČUNOVODSTVO SERVISI d.o.o., nine in STSI d.o.o., 11 in INA MALOPRODAJNI SERVISI d.o.o, three in INA MAZIVA d.o.o. and one in INA VATROGASNI SERVISI d.o.o.). New elections were conducted in INA VATROGASNI SERVISI d.o.o., and thus additional safety-at-work commissioners will be nominated.

120 121
COMMITTEE FOR AMICABLE DISPUTE SETTLEMENT
The Committee for Amicable Dispute Settlement is prescribed by the CA. The Committee consists of two employer’s representatives and three TU representatives.
HELP FOR EMPLOYEES AND THEIR FAMILIES IN CASES OF SERIOUS ILLNESSES
The committee for establishing the eligibility of employees to aid in case of illness reviews individual requests of employees, acquires expert opinions of the contracted primary health physician on the grounds of their request and the amount of necessary funds, and prepares pro-posals for decisions on allocation of aid within the framework of planned costs.
Within the approved budget, during the calendar year, the Committee approved aid in 11 cases - supporting the cost of medical treatment, purchase of drugs or certain aid supplies. These donations help our seriously ill employees or their family members to improve the medical treatment and their quality of life during illness.
REWARDS AND HR OPERATIONS
BENEFITS PROVIDED TO EMPLOYEES
INA Group companies provide guaranteed benefits deriving from the Collective Agreement (e.g. Christmas bonus, Christmas gift for children, Easter gift, annual leave contribution, jubilee award, transportation contribution, additional health insurance, life and accident in-surance, benefits for mothers and pregnant women, (un)paid leave for different purposes such as education or other important life events, financial aids in different undesirable situations, severance pay, etc.).
In addition, INA Group enables a series of benefits to its employees through the beneFIT platform – addressing and promoting all aspects of employee well-being and importance of work-life balance. The aim of the platform is to support employees in all their life roles through articles, targeted campaigns and trainings that are part of INA Academy. The platform provides more than 200 benefits for using and/or paying for services in 20 categories (Insurance; Sports and fitness; Shopping; Home; ICT; Parental benefits; Travel; Culture; Lifelong learning; Personal finance; Gastronomy, Personal care; Health; Cars and vehicles; Pets; Entertainment, Transport; Collective Agreement Benefits; FORa-flexible work arrangements; Other). During the quarantine, beneFIT well-being platform became the central reference point for employees to access trusted news, guidelines and support (for more detail see chapter Crisis management).
INA-bikeZONE community continued to share information and updates about cycling and promote cycling activities and their positive impact on health and the environment. A total of three business locations remain certified as cycling friendly by the European Cycling Fed-eration.
Flexible work arrangements (FORa) are one of the most recognized well-being benefits among our employees. FORa was introduced in INA Group in 2016 as a benefit providing white collar employees (where the nature of work allows) Flexitime (work schedule with variable starting and ending times) and Flexiplace (the possibility of remote work four days per month). Now FORa is available to employees of ten companies across INA Group, and more than 1,280 employees have used Flexitime and Flexiplace on a daily basis.
Based on employee and manager feedback, FORa ensured better work-life balance, employee satisfaction, motivation and engagement, but with increased or, at the very least, maintained levels of productivity and innovation. Additionally, FORa increased INA Group’s ability to attract, recruit and retain talent and ensured positive company image both internally and externally – INA Group is often invited to share the best practices and insights regarding flexible work arrangements on panels, conferences and professional association meetings. The fact that we had set and implemented flexible work arrangements helped us quickly adapt to new ways of working during the pandemic and quarantine period (for more detail see chapter Crisis management).
RECOGNITION & REWARD SYSTEM
INA Group has a comprehensive and well-rounded employee recognition system closely associated with our corporate culture. The purpose of recognition and reward systems is to promote and reward desired values, behaviors, achievements and teamwork.
Some of the recognition and reward programs are listed below:
• Presidential Award
• Lifetime Achievement Award
• Eiffel Program
• Best INA Academy Trainer
• Award your colleague (Best Colleague, Best Mentor, Best Manager, Think Green, Big Heart, Heartfelt Smile)
• Recognition Program for Extraordinary SD&HSE Contribution (SMART Employee, SMART Constructor, SMART Project Collaboration)
• Recognition for projects
INA Group has a performance driven culture and therefore has implemented performance management systems as a basis for Short-Term Incentive (bonus) pay-outs as part of the employee compensation package.
Employee Performance Management System (EPMS), Annual People Cycle for managers (APC) and Sales Incentive System for sales repre-sentatives (SIS) are already tested and proven performance management systems currently implemented in INA Group companies through which bonuses for employees are paid out either quarterly or annually.
In addition, other types of performance management systems are developed and implemented for strategic employee groups aligned with the needs of the business segment in order to track performance and boost both employees’ motivation and business results, as was the case in 2020.
The aim of developing these different systems is to have incentives that are competitive on the market and able to motivate and award out-standing individual performance, but flexible enough to reflect the market changes. In addition, these systems allow better differentiation based on individual performance and motivate overperformance with higher bonus pay-out possibility.
122 123
TALENT ATTRACTION AND CAREER DEVELOPMENT CAREER DEVELOPMENT
404-1, 404-2, 404-3
Like in every other business segment, the year 2020 was very much influenced by external factors when it comes to capability development in INA Group. Absence of classroom trainings and the switch to virtual collaboration for the most part of the year resulted in a large shift in career development focus, which resulted in fewer external trainings and the implementation of internal virtual learning.
Individual development plans were created as a result of performance, competencies and employee potential assessment, as this is a vital performance management process for ensuring sustainability in human capital. Furthermore, all INA Group employees receive regular feed-back on their performance and development at least once a year.
Success principles, which are expected to replace the existing competency framework, were developed in 2020. The five principles define behavior expected from all INA Group employees, leaders and leaders of leaders with the goal of achieving results and goals in a sustainable way, in order to support the desired culture.
AVERAGE HOURS OF TRAINING PER EMPLOYEE IN CROATIA 2018 2019 2020
BY GENDER
INA GROUP (MALE) 20 16 10
INA GROUP (FEMALE) 24 22 14
BY BUSINESS SEGMENT INA, D.D.
EXPLORATION AND PRODUCTION 22 25 11
REFINING AND MARKETING 26 24 9
CONSUMER SERVICES AND RETAIL 17 21 7
CORPORATE FUNCTIONS 22 32 34
INA GROUP 21 20 11
BY EMPLOYEE PERFORMANCE MANAGEMENT SYSTEM
EMPLOYEES IN APC 63 62 40
EMPLOYEES IN SURU 21 23 15
EMPLOYEES IN MPM 16 10 4
EMPLOYEES IN SIS 108 23 13
MB MEMBER 13 18 23
BY LEVEL
EXECUTOR 16 15 9
EXPERT 32 16 15
GROWWW 40 40 36
MANAGER 61 77 32
SENIOR EXPERT 45 45 15
AVERAGE HOURS OF TRAINING PER EMPLOYEE 2018 2019 2020
TOTAL 18,7 17,0 11,5 *INA Group excluding INA Slovenija d.o.o., which makes for less than 0.5% of total INA Group employees
*INA Group excluding Rotary Zrt., Holdina d.o.o., Energopetrol d.d., INA Slovenija d.o.o. and INA Crna Gora d.o.o. due to less detailed data for international companies, which makes for 14% of total INA Group employees
NUMBER AND PERCENTAGE OF EMPLOYEES RECEIVING REGULAR FEEDBACK
2018* 2019* 2020
INA GROUP (MALE) 8,241 (76%) 7,972 (75%) 7,309 (74%)
INA GROUP (FEMALE) 2,603 (24%) 2,603 (25%) 2,520 (26%)
TOTAL INA GROUP 10,842 (100%) 10,575 (100%) 9,829 (100%) *2018 and 2019 numbers adjusted due to change in methodology
Classroom trainings were organized when the external factors permitted it, but for the most of the year development programs were adjust-ed to socially distant methods such as self-learning, virtual workshops, online learning, on-the-job training and professional practice, with the goal of preserving the integrated platform known as the “blended learning approach”.
EMPLOYEE DEVELOPMENT
In 2019, the Technical Competence and Career Development (hereinafter: TCCD) program was redesigned with the goal to ensure that the main focus is on the development and reception of technical knowledge for all program participants. Knowledge and other technical competencies are assessed for every petrol-technical professional (hereinafter: PTP) and in accordance with that IDPs for every PTP are created. Assessments give insight to knowledge gaps of every PTP and they can see which competencies they should improve. This provides the PTP’s, their managers and the company valuable insight which areas need to be developed in order to maintain sustainable business processes.
In 2020, a new program Growing Personal Skills (GPS) was introduced to cover non-technical employees with the focus on growing profes-sional skills. As a part of this program, an assessment was conducted for employees in Investment management.
Over the year the program has grown to include 650 employees, with most of them from Exploration and Production (250) and Refining and Marketing (220). More experts are expected to be included in 2021 as new competency maps are being created.
Through different development programs and initiatives, as well as internal and external workshops based on individual development needs, which are available to all employees, INA Group ensures development and boosts employees to make them effective and efficient in their everyday challenges.
For a long time, INA Group has been implementing various methods to evaluate the development potential of its employees and manage-ment, and the long-term goal is to know in a professional and objective manner the potential of all its employees, for it to be used within the company with the best possible outcome for both employees and for the company. Developmental assessment centers have been used extensively for this purpose and despite the negative external influences, 47 employees participated in such programs in 2020. The greatest benefit for the employees connected with assessment centers is that they receive expert feedback on their strengths and improvement areas, which is then used to create development activities.
LEADERSHIP DEVELOPMENT
In order to enable and ensure development of all employees, INA Group provides a large selection of development opportunities for all. By participating in MBA programs from Cotrugli or selected programs from SEED Business School (Part-time MBA, Business Leadership Pro-gram, Foundation of Management Program), the employees are developing their leadership competencies.
In addition, there is also the LEAD talent program for future leaders, Intensity program, First time manager etc. with the aim to strength-en four leadership competencies (thought-, result-, people- and personal leadership), and prepare leaders for current and future challenges. The four leadership competencies will be replaced by success principles in 2021.
INA ACADEMY
Internal knowledge sharing is one of the most effective sustainability tools when it comes to human capital. During the 2020 Covid-19 pan-demic, INA Academy has proved to be one of the most popular development tools. Since its creation in 2016 to the start of 2021, trainings held via INA Academy were classroom trainings. As the situation changed, so did the platform. Virtual trainings were introduced in May 2020, which resulted in 140 trainings held in 2020.

124 125
TALENT ATTRACTION
401-1
For the last decade, INA Group has been strategically planning, attracting and employing white-collar young talents due to anticipated future business need caused by aging of the top oil and gas experts. Attraction and recruitment programs for young graduates have been continuously implemented. In 2020 Growww program and Growww Female Engineers Scholarship Program continued with great success. We received more than 1,300 applications for ten Growww positions and 21 applications for the female scholarship program. We also put an emphasis on developing a new blue-collar concept that is focused on students, but also on retaining blue-collar employees (assessed activities are planned for 2021).
Based on future business needs, we continued our collaboration with vocational schools and participated in different programs and proj-ects to support and improve vocational education:
• 37 scholarships (including ten scholarships for children of our employees) were assigned to students in engineering, electrical engineer-ing, chemical technology, ecology, geology, traffic and logistics, petroleum mining
• We became partners of the Regional Center of Competence of the Technical School in Sisak (EU project), and we have a representative in the Center Council
• National program “Get involved for a better education”- more than 20 experts participated in a survey on the needs of employers in order to modernize vocational curriculums
• We prepared a professional development program for vocational school teachers in Rijeka Refinery (realization expected in 2021)
• We started a cooperation with a Croatian Employers’ Association
EMPLOYER BRANDING
Awards received by INA Group during 2020 are a testament to the quality of the activities carried out to improve our current and future employees' work experience and job satisfaction and show that INA Group companies understand the importance and accept responsibility for the satisfaction of our employees. Some of the awards and certifications are:
• Employer Partner Certificate
• TOP 10 Employers in Croatia
• Croatia’s Best Employer Brand Awards 2020
• Golden Index 2020
• Excellence during challenges
You can read more about these awards in the chapter Awards and recognitions.
ENGAGEMENT, DIVERSITY AND INCLUSION
At the end of 2019, a new Employee Engagement Survey was conducted. The results were communicated at the beginning of 2020 and action plans were created.
In INA Group there were 187 engagement actions set in motion. Priority areas that have been recognized and will drive sustainable engagement in the coming year are empowerment, communication and working relationships which are all very important aspects of work-life at INA Group. One very important driver of engagement, which is continuously being worked on, is Diversity & Inclusion. As a com-pany, INA, d.d. builds a culture of diversity and inclusion in line with its fundamental values and with the aim of attracting, hiring and retain-ing talents and its employees. More information about Engagement, Diversity and Inclusion can be found in chapter Corporate governance.
In order to fully adopt the virtual nature of interaction with other colleagues, virtual trainer training workshops were held, which pre-pared the trainers for the new aspects of holding virtual trainings. As employee feedback is very important for future improvements of the platform, an online feedback form was created. Different trainings with the goal of improving virtual collaboration were organized for all employees through the whole year.
A new training category, Innovation, was introduced and launched with a series of topics on new technologies and innovative business. These trainings were organized with external trainers who are experts in their fields related to innovation.
412 6,266PARTICIPANTSWORKSHOPS
TRAINING HOURS
21,875
134TOPICS
87INTERNAL TRAINERS
Since 2016
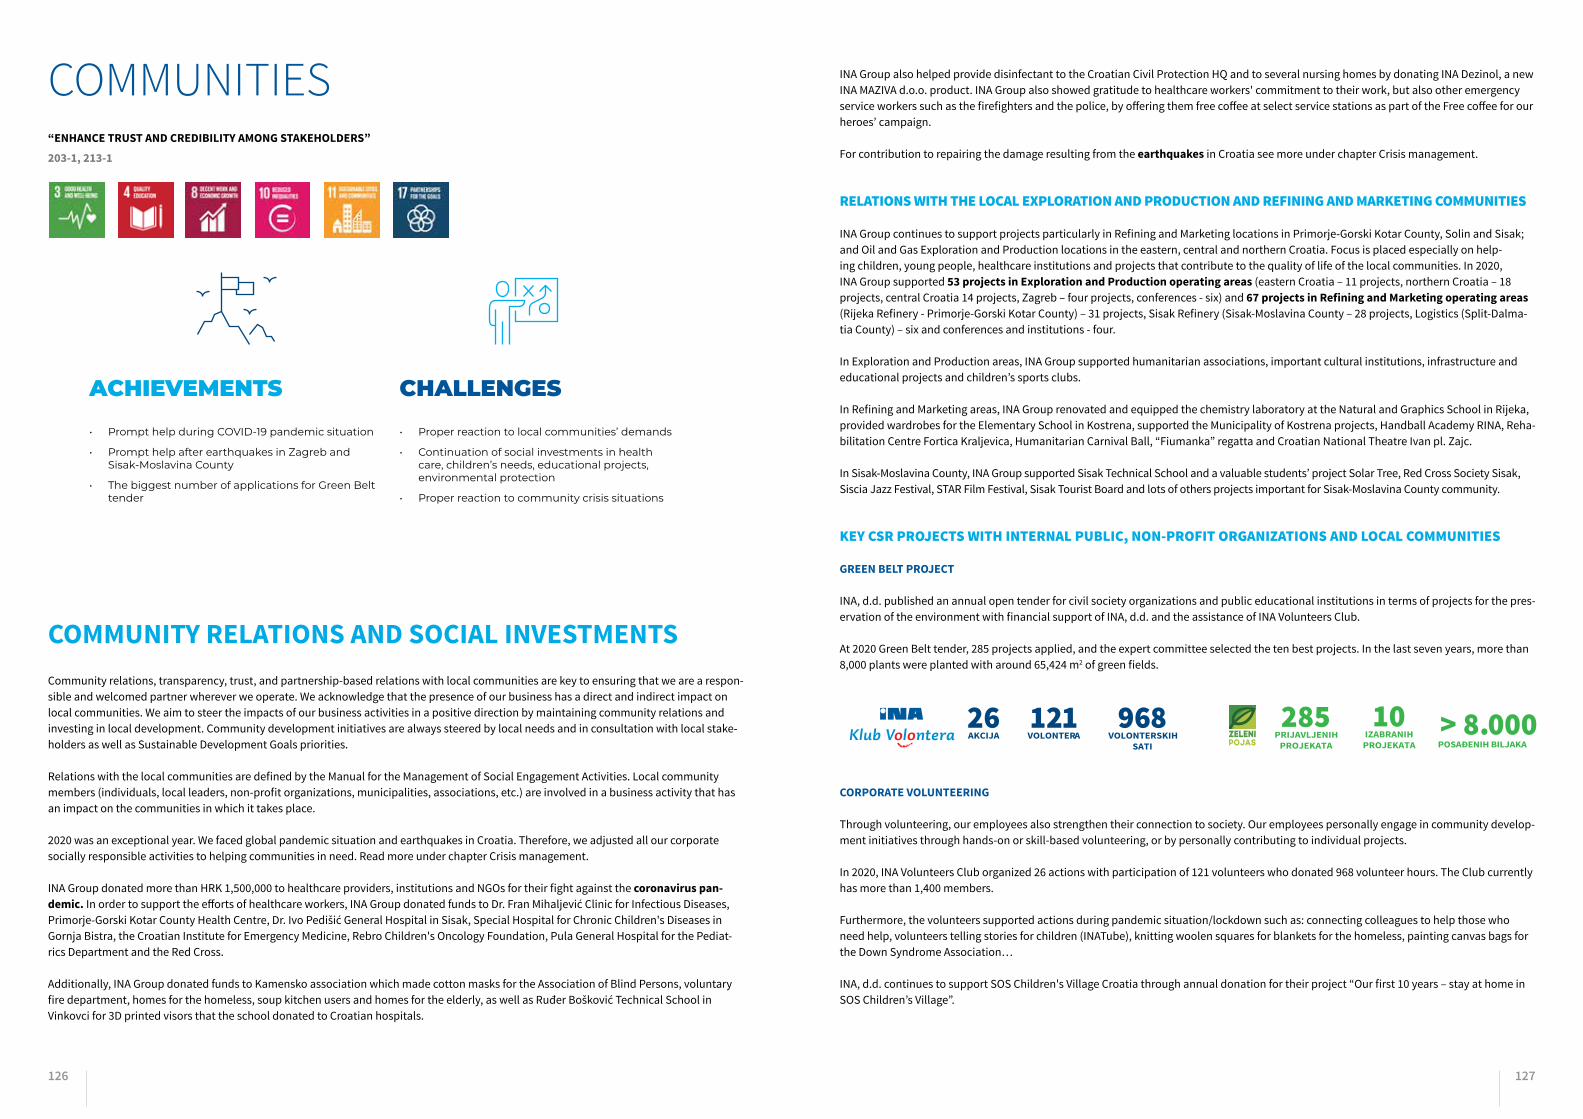
126 127
COMMUNITIES
ACHIEVEMENTS
• Prompt help during COVID-19 pandemic situation
• Prompt help after earthquakes in Zagreb and Sisak-Moslavina County
• The biggest number of applications for Green Belt tender
CHALLENGES
• Proper reaction to local communities’ demands
• Continuation of social investments in health care, children’s needs, educational projects, environmental protection
• Proper reaction to community crisis situations
“ENHANCE TRUST AND CREDIBILITY AMONG STAKEHOLDERS”
203-1, 213-1
COMMUNITY RELATIONS AND SOCIAL INVESTMENTS Community relations, transparency, trust, and partnership-based relations with local communities are key to ensuring that we are a respon-sible and welcomed partner wherever we operate. We acknowledge that the presence of our business has a direct and indirect impact on local communities. We aim to steer the impacts of our business activities in a positive direction by maintaining community relations and investing in local development. Community development initiatives are always steered by local needs and in consultation with local stake-holders as well as Sustainable Development Goals priorities.
Relations with the local communities are defined by the Manual for the Management of Social Engagement Activities. Local community members (individuals, local leaders, non-profit organizations, municipalities, associations, etc.) are involved in a business activity that has an impact on the communities in which it takes place.
2020 was an exceptional year. We faced global pandemic situation and earthquakes in Croatia. Therefore, we adjusted all our corporate socially responsible activities to helping communities in need. Read more under chapter Crisis management.
INA Group donated more than HRK 1,500,000 to healthcare providers, institutions and NGOs for their fight against the coronavirus pan-demic. In order to support the efforts of healthcare workers, INA Group donated funds to Dr. Fran Mihaljević Clinic for Infectious Diseases, Primorje-Gorski Kotar County Health Centre, Dr. Ivo Pedišić General Hospital in Sisak, Special Hospital for Chronic Children's Diseases in Gornja Bistra, the Croatian Institute for Emergency Medicine, Rebro Children's Oncology Foundation, Pula General Hospital for the Pediat-rics Department and the Red Cross. Additionally, INA Group donated funds to Kamensko association which made cotton masks for the Association of Blind Persons, voluntary fire department, homes for the homeless, soup kitchen users and homes for the elderly, as well as Ruđer Bošković Technical School in Vinkovci for 3D printed visors that the school donated to Croatian hospitals.
INA Group also helped provide disinfectant to the Croatian Civil Protection HQ and to several nursing homes by donating INA Dezinol, a new INA MAZIVA d.o.o. product. INA Group also showed gratitude to healthcare workers' commitment to their work, but also other emergency service workers such as the firefighters and the police, by offering them free coffee at select service stations as part of the Free coffee for our heroes’ campaign.
For contribution to repairing the damage resulting from the earthquakes in Croatia see more under chapter Crisis management.
RELATIONS WITH THE LOCAL EXPLORATION AND PRODUCTION AND REFINING AND MARKETING COMMUNITIES
INA Group continues to support projects particularly in Refining and Marketing locations in Primorje-Gorski Kotar County, Solin and Sisak; and Oil and Gas Exploration and Production locations in the eastern, central and northern Croatia. Focus is placed especially on help-ing children, young people, healthcare institutions and projects that contribute to the quality of life of the local communities. In 2020, INA Group supported 53 projects in Exploration and Production operating areas (eastern Croatia – 11 projects, northern Croatia – 18 projects, central Croatia 14 projects, Zagreb – four projects, conferences - six) and 67 projects in Refining and Marketing operating areas (Rijeka Refinery - Primorje-Gorski Kotar County) – 31 projects, Sisak Refinery (Sisak-Moslavina County – 28 projects, Logistics (Split-Dalma-tia County) – six and conferences and institutions - four.
In Exploration and Production areas, INA Group supported humanitarian associations, important cultural institutions, infrastructure and educational projects and children’s sports clubs.
In Refining and Marketing areas, INA Group renovated and equipped the chemistry laboratory at the Natural and Graphics School in Rijeka, provided wardrobes for the Elementary School in Kostrena, supported the Municipality of Kostrena projects, Handball Academy RINA, Reha-bilitation Centre Fortica Kraljevica, Humanitarian Carnival Ball, “Fiumanka” regatta and Croatian National Theatre Ivan pl. Zajc.
In Sisak-Moslavina County, INA Group supported Sisak Technical School and a valuable students’ project Solar Tree, Red Cross Society Sisak, Siscia Jazz Festival, STAR Film Festival, Sisak Tourist Board and lots of others projects important for Sisak-Moslavina County community.
KEY CSR PROJECTS WITH INTERNAL PUBLIC, NON-PROFIT ORGANIZATIONS AND LOCAL COMMUNITIES
GREEN BELT PROJECT
INA, d.d. published an annual open tender for civil society organizations and public educational institutions in terms of projects for the pres-ervation of the environment with financial support of INA, d.d. and the assistance of INA Volunteers Club.
At 2020 Green Belt tender, 285 projects applied, and the expert committee selected the ten best projects. In the last seven years, more than 8,000 plants were planted with around 65,424 m2 of green fields.
CORPORATE VOLUNTEERING
Through volunteering, our employees also strengthen their connection to society. Our employees personally engage in community develop-ment initiatives through hands-on or skill-based volunteering, or by personally contributing to individual projects.
In 2020, INA Volunteers Club organized 26 actions with participation of 121 volunteers who donated 968 volunteer hours. The Club currently has more than 1,400 members.
Furthermore, the volunteers supported actions during pandemic situation/lockdown such as: connecting colleagues to help those who need help, volunteers telling stories for children (INATube), knitting woolen squares for blankets for the homeless, painting canvas bags for the Down Syndrome Association…
INA, d.d. continues to support SOS Children's Village Croatia through annual donation for their project “Our first 10 years – stay at home in SOS Children’s Village”.
> 8.000285 PRIJAVLJENIH
PROJEKATA
10 IZABRANIH
PROJEKATA
26AKCIJA
121VOLONTERA
968VOLONTERSKIH
SATI
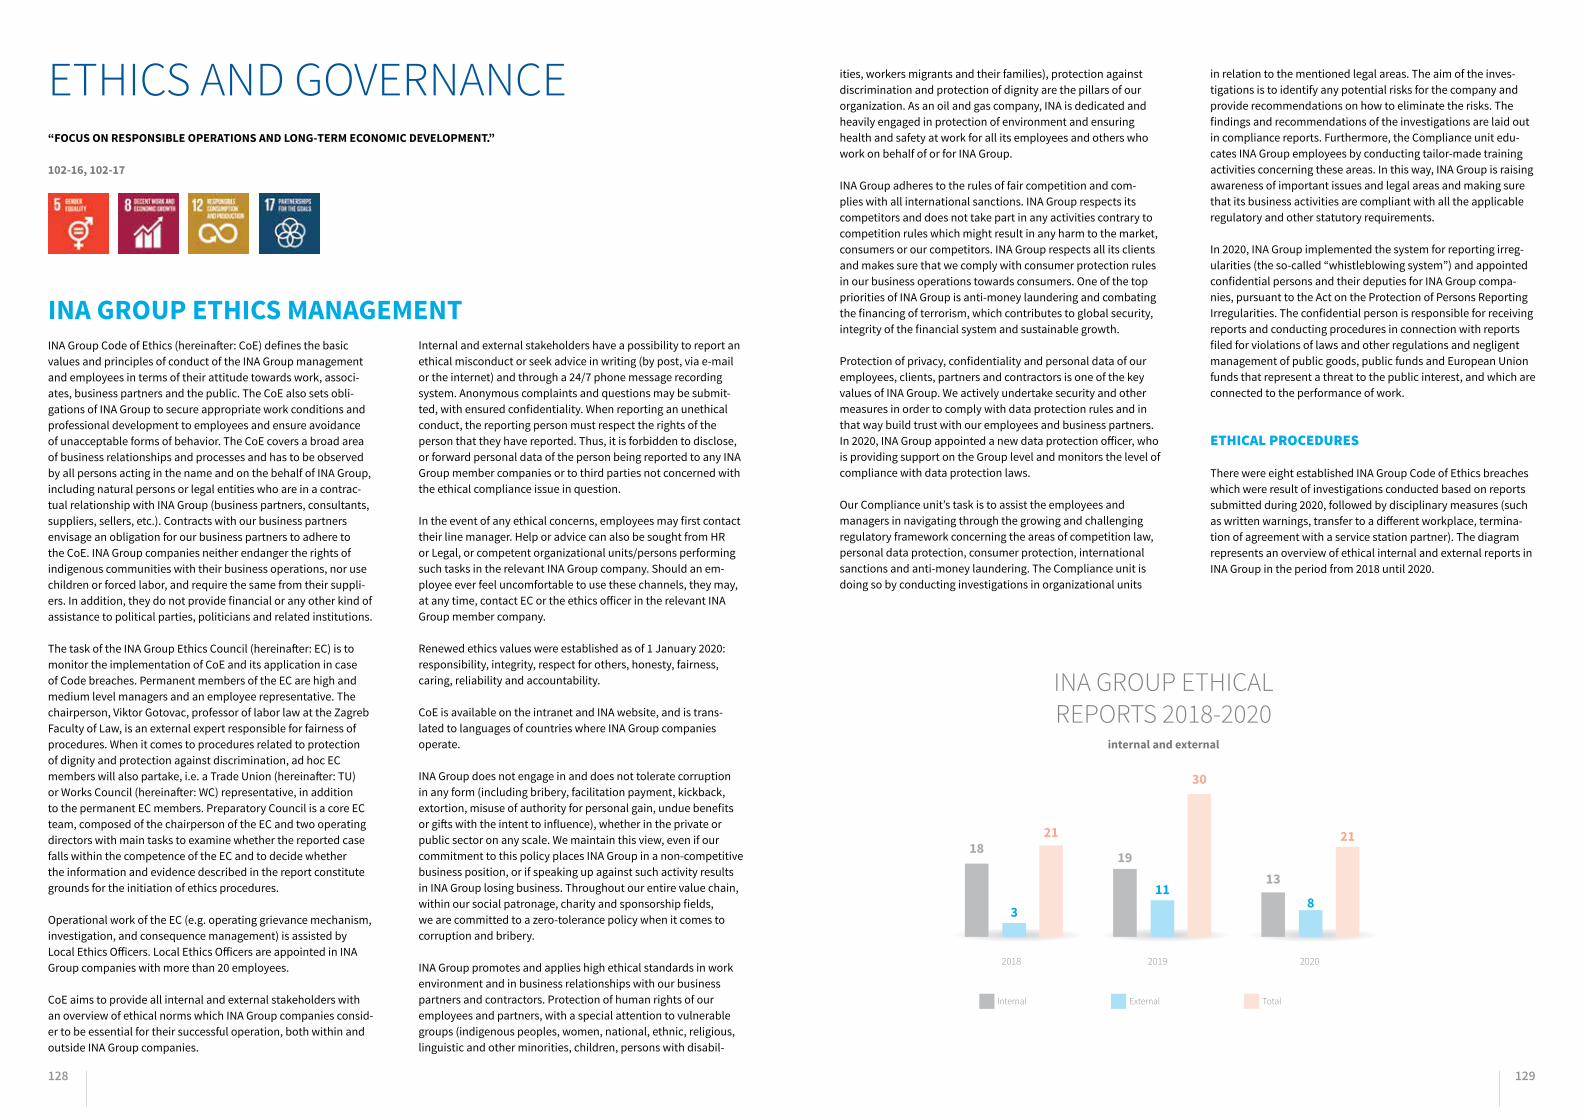
128 129
ETHICS AND GOVERNANCE “FOCUS ON RESPONSIBLE OPERATIONS AND LONG-TERM ECONOMIC DEVELOPMENT.”
INA Group Code of Ethics (hereinafter: CoE) defines the basic values and principles of conduct of the INA Group management and employees in terms of their attitude towards work, associ-ates, business partners and the public. The CoE also sets obli-gations of INA Group to secure appropriate work conditions and professional development to employees and ensure avoidance of unacceptable forms of behavior. The CoE covers a broad area of business relationships and processes and has to be observed by all persons acting in the name and on the behalf of INA Group, including natural persons or legal entities who are in a contrac-tual relationship with INA Group (business partners, consultants, suppliers, sellers, etc.). Contracts with our business partners envisage an obligation for our business partners to adhere to the CoE. INA Group companies neither endanger the rights of indigenous communities with their business operations, nor use children or forced labor, and require the same from their suppli-ers. In addition, they do not provide financial or any other kind of assistance to political parties, politicians and related institutions.
The task of the INA Group Ethics Council (hereinafter: EC) is to monitor the implementation of CoE and its application in case of Code breaches. Permanent members of the EC are high and medium level managers and an employee representative. The chairperson, Viktor Gotovac, professor of labor law at the Zagreb Faculty of Law, is an external expert responsible for fairness of procedures. When it comes to procedures related to protection of dignity and protection against discrimination, ad hoc EC members will also partake, i.e. a Trade Union (hereinafter: TU) or Works Council (hereinafter: WC) representative, in addition to the permanent EC members. Preparatory Council is a core EC team, composed of the chairperson of the EC and two operating directors with main tasks to examine whether the reported case falls within the competence of the EC and to decide whether the information and evidence described in the report constitute grounds for the initiation of ethics procedures.
Operational work of the EC (e.g. operating grievance mechanism, investigation, and consequence management) is assisted by Local Ethics Officers. Local Ethics Officers are appointed in INA Group companies with more than 20 employees.
CoE aims to provide all internal and external stakeholders with an overview of ethical norms which INA Group companies consid-er to be essential for their successful operation, both within and outside INA Group companies.
Internal and external stakeholders have a possibility to report an ethical misconduct or seek advice in writing (by post, via e-mail or the internet) and through a 24/7 phone message recording system. Anonymous complaints and questions may be submit-ted, with ensured confidentiality. When reporting an unethical conduct, the reporting person must respect the rights of the person that they have reported. Thus, it is forbidden to disclose, or forward personal data of the person being reported to any INA Group member companies or to third parties not concerned with the ethical compliance issue in question.
In the event of any ethical concerns, employees may first contact their line manager. Help or advice can also be sought from HR or Legal, or competent organizational units/persons performing such tasks in the relevant INA Group company. Should an em-ployee ever feel uncomfortable to use these channels, they may, at any time, contact EC or the ethics officer in the relevant INA Group member company.
Renewed ethics values were established as of 1 January 2020: responsibility, integrity, respect for others, honesty, fairness, caring, reliability and accountability.
CoE is available on the intranet and INA website, and is trans-lated to languages of countries where INA Group companies operate.
INA Group does not engage in and does not tolerate corruption in any form (including bribery, facilitation payment, kickback, extortion, misuse of authority for personal gain, undue benefits or gifts with the intent to influence), whether in the private or public sector on any scale. We maintain this view, even if our commitment to this policy places INA Group in a non-competitive business position, or if speaking up against such activity results in INA Group losing business. Throughout our entire value chain, within our social patronage, charity and sponsorship fields, we are committed to a zero-tolerance policy when it comes to corruption and bribery.
INA Group promotes and applies high ethical standards in work environment and in business relationships with our business partners and contractors. Protection of human rights of our employees and partners, with a special attention to vulnerable groups (indigenous peoples, women, national, ethnic, religious, linguistic and other minorities, children, persons with disabil-
ities, workers migrants and their families), protection against discrimination and protection of dignity are the pillars of our organization. As an oil and gas company, INA is dedicated and heavily engaged in protection of environment and ensuring health and safety at work for all its employees and others who work on behalf of or for INA Group.
INA Group adheres to the rules of fair competition and com-plies with all international sanctions. INA Group respects its competitors and does not take part in any activities contrary to competition rules which might result in any harm to the market, consumers or our competitors. INA Group respects all its clients and makes sure that we comply with consumer protection rules in our business operations towards consumers. One of the top priorities of INA Group is anti-money laundering and combating the financing of terrorism, which contributes to global security, integrity of the financial system and sustainable growth.
Protection of privacy, confidentiality and personal data of our employees, clients, partners and contractors is one of the key values of INA Group. We actively undertake security and other measures in order to comply with data protection rules and in that way build trust with our employees and business partners. In 2020, INA Group appointed a new data protection officer, who is providing support on the Group level and monitors the level of compliance with data protection laws.
Our Compliance unit’s task is to assist the employees and managers in navigating through the growing and challenging regulatory framework concerning the areas of competition law, personal data protection, consumer protection, international sanctions and anti-money laundering. The Compliance unit is doing so by conducting investigations in organizational units
in relation to the mentioned legal areas. The aim of the inves-tigations is to identify any potential risks for the company and provide recommendations on how to eliminate the risks. The findings and recommendations of the investigations are laid out in compliance reports. Furthermore, the Compliance unit edu-cates INA Group employees by conducting tailor-made training activities concerning these areas. In this way, INA Group is raising awareness of important issues and legal areas and making sure that its business activities are compliant with all the applicable regulatory and other statutory requirements.
In 2020, INA Group implemented the system for reporting irreg-ularities (the so-called “whistleblowing system”) and appointed confidential persons and their deputies for INA Group compa-nies, pursuant to the Act on the Protection of Persons Reporting Irregularities. The confidential person is responsible for receiving reports and conducting procedures in connection with reports filed for violations of laws and other regulations and negligent management of public goods, public funds and European Union funds that represent a threat to the public interest, and which are connected to the performance of work.
ETHICAL PROCEDURES
There were eight established INA Group Code of Ethics breaches which were result of investigations conducted based on reports submitted during 2020, followed by disciplinary measures (such as written warnings, transfer to a different workplace, termina-tion of agreement with a service station partner). The diagram represents an overview of ethical internal and external reports in INA Group in the period from 2018 until 2020.
102-16, 102-17
INA GROUP ETHICS MANAGEMENT
INA GROUP ETHICAL REPORTS 2018-2020
internal and external
2018 2019 2020
1819
13
311
8
21
30
21
Internal External Total
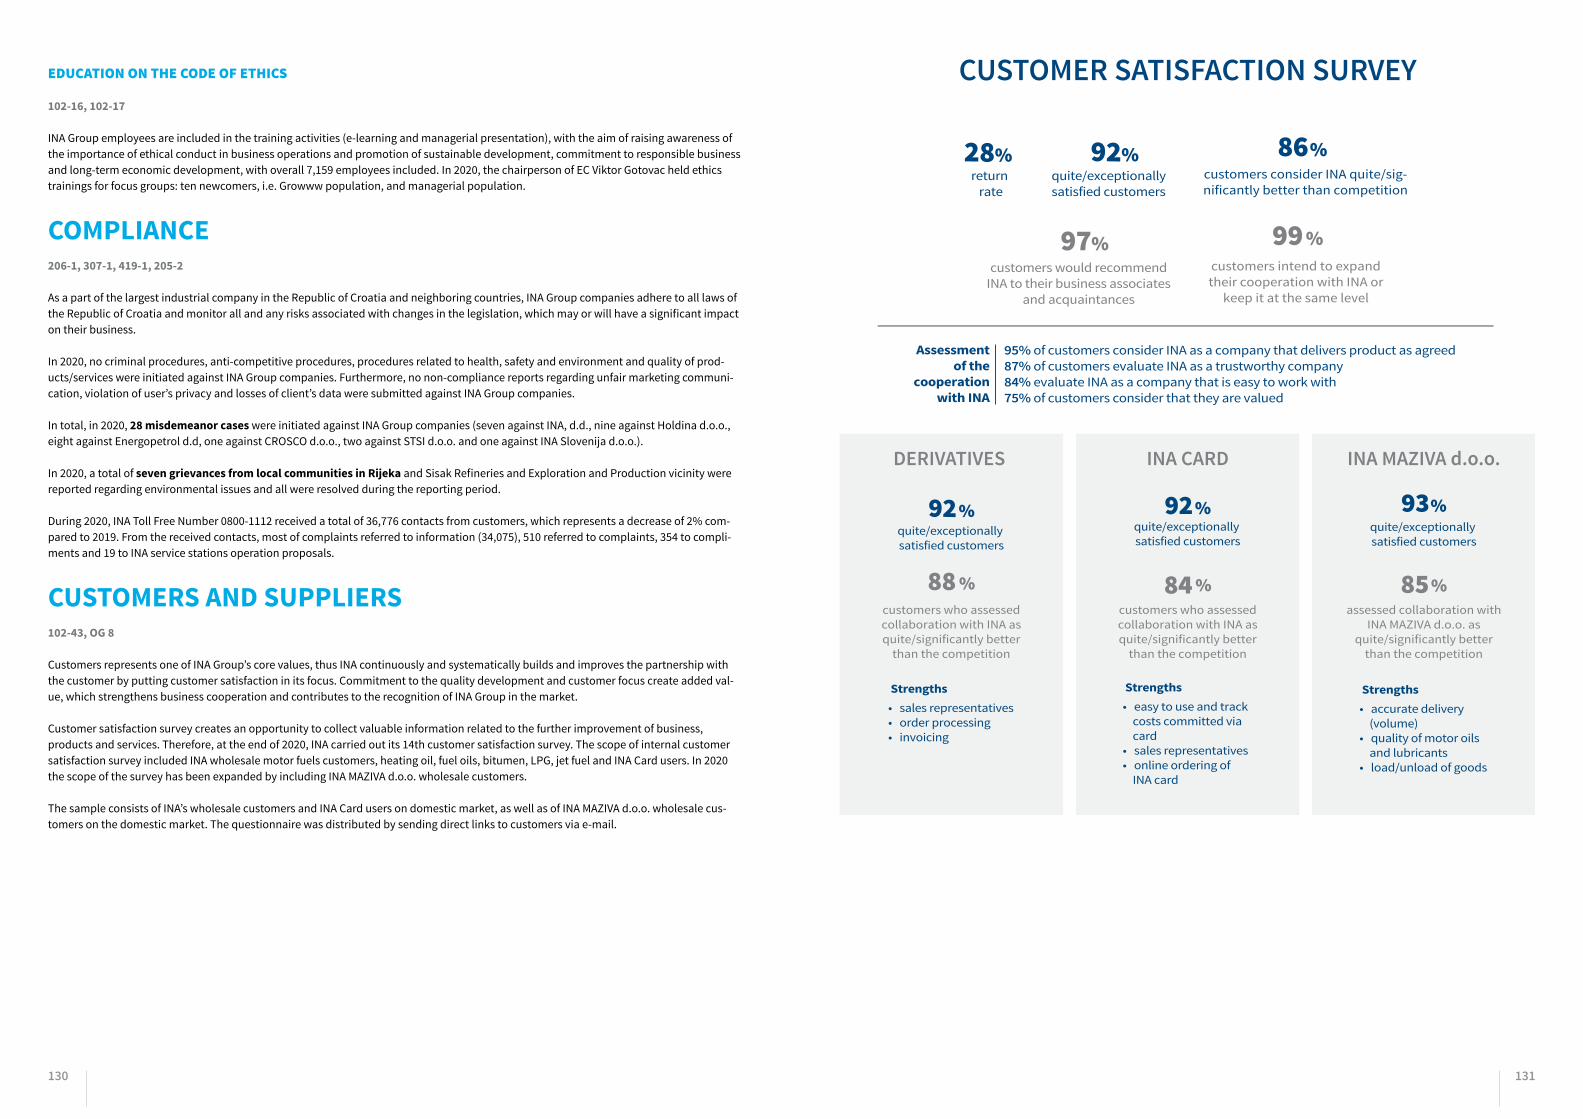
130 131
EDUCATION ON THE CODE OF ETHICS
102-16, 102-17
INA Group employees are included in the training activities (e-learning and managerial presentation), with the aim of raising awareness of the importance of ethical conduct in business operations and promotion of sustainable development, commitment to responsible business and long-term economic development, with overall 7,159 employees included. In 2020, the chairperson of EC Viktor Gotovac held ethics trainings for focus groups: ten newcomers, i.e. Growww population, and managerial population.
COMPLIANCE 206-1, 307-1, 419-1, 205-2
As a part of the largest industrial company in the Republic of Croatia and neighboring countries, INA Group companies adhere to all laws of the Republic of Croatia and monitor all and any risks associated with changes in the legislation, which may or will have a significant impact on their business.
In 2020, no criminal procedures, anti-competitive procedures, procedures related to health, safety and environment and quality of prod-ucts/services were initiated against INA Group companies. Furthermore, no non-compliance reports regarding unfair marketing communi-cation, violation of user’s privacy and losses of client’s data were submitted against INA Group companies.
In total, in 2020, 28 misdemeanor cases were initiated against INA Group companies (seven against INA, d.d., nine against Holdina d.o.o., eight against Energopetrol d.d, one against CROSCO d.o.o., two against STSI d.o.o. and one against INA Slovenija d.o.o.).
In 2020, a total of seven grievances from local communities in Rijeka and Sisak Refineries and Exploration and Production vicinity were reported regarding environmental issues and all were resolved during the reporting period.
During 2020, INA Toll Free Number 0800-1112 received a total of 36,776 contacts from customers, which represents a decrease of 2% com-pared to 2019. From the received contacts, most of complaints referred to information (34,075), 510 referred to complaints, 354 to compli-ments and 19 to INA service stations operation proposals.
CUSTOMERS AND SUPPLIERS 102-43, OG 8
Customers represents one of INA Group’s core values, thus INA continuously and systematically builds and improves the partnership with the customer by putting customer satisfaction in its focus. Commitment to the quality development and customer focus create added val-ue, which strengthens business cooperation and contributes to the recognition of INA Group in the market.
Customer satisfaction survey creates an opportunity to collect valuable information related to the further improvement of business, products and services. Therefore, at the end of 2020, INA carried out its 14th customer satisfaction survey. The scope of internal customer satisfaction survey included INA wholesale motor fuels customers, heating oil, fuel oils, bitumen, LPG, jet fuel and INA Card users. In 2020 the scope of the survey has been expanded by including INA MAZIVA d.o.o. wholesale customers.
The sample consists of INA’s wholesale customers and INA Card users on domestic market, as well as of INA MAZIVA d.o.o. wholesale cus-tomers on the domestic market. The questionnaire was distributed by sending direct links to customers via e-mail.
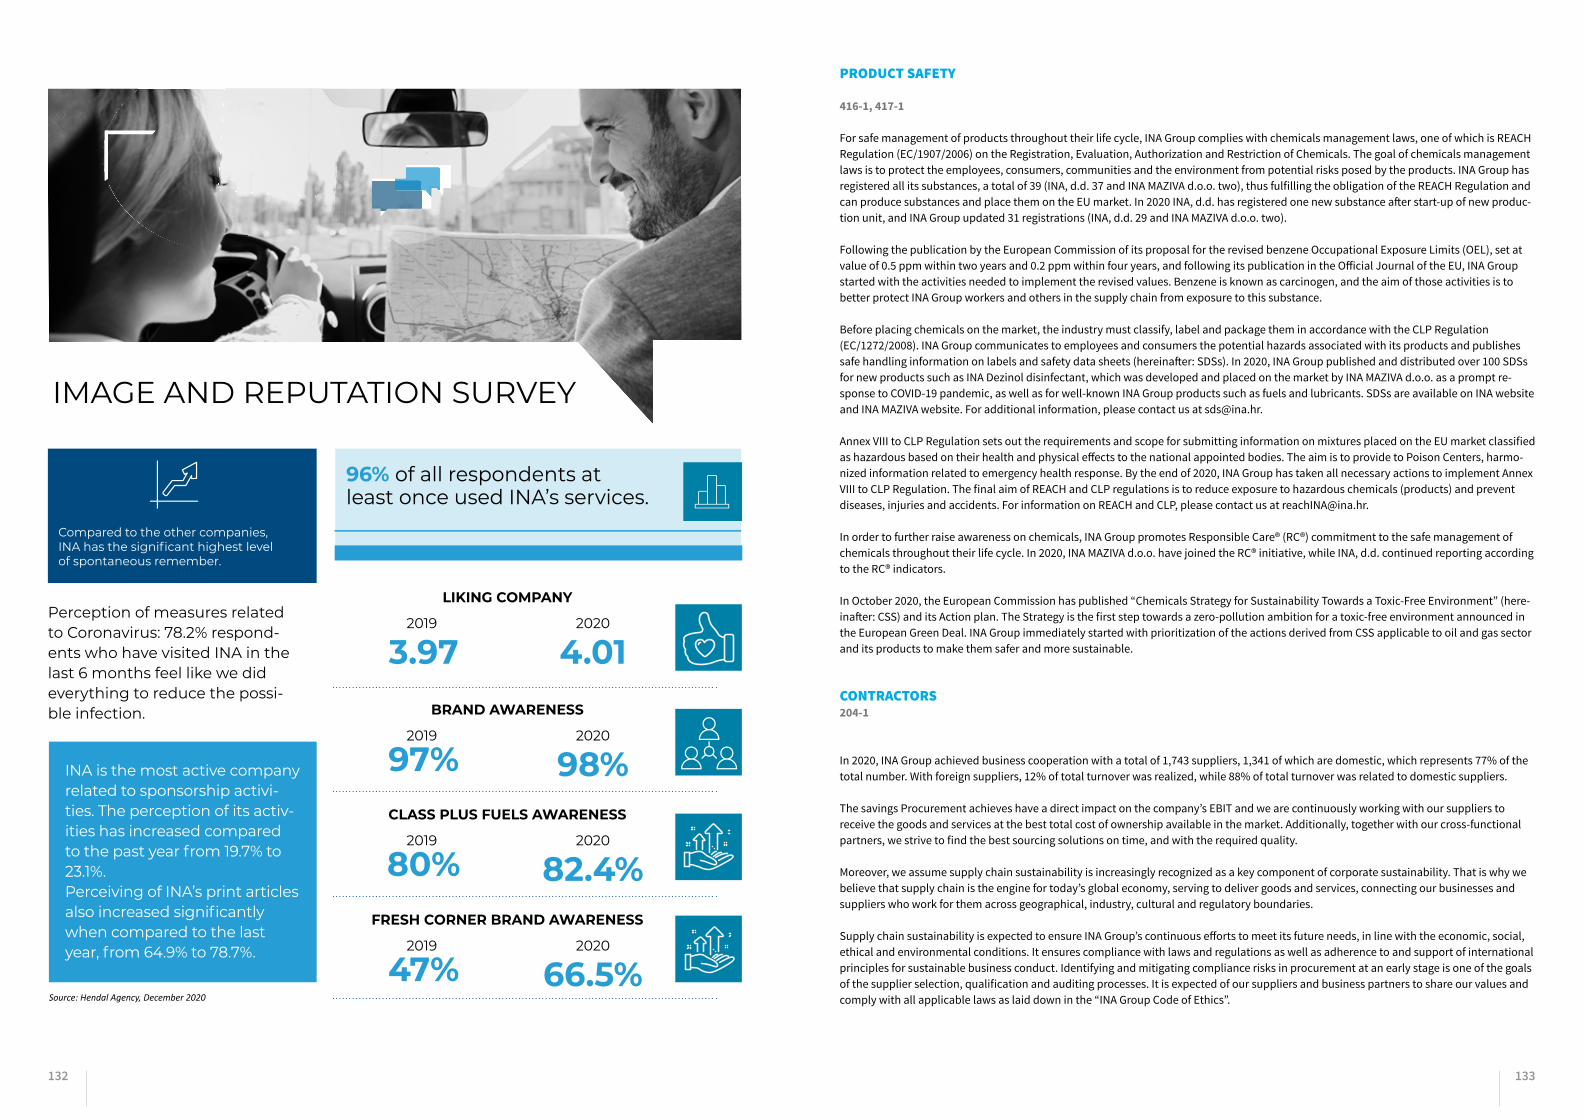
132 133
IMAGE AND REPUTATION SURVEY
Source: Hendal Agency, December 2020
INA is the most active company related to sponsorship activi-ties. The perception of its activ-ities has increased compared to the past year from 19.7% to 23.1%. Perceiving of INA’s print articles also increased significantly when compared to the last year, from 64.9% to 78.7%.
Compared to the other companies, INA has the significant highest level of spontaneous remember.
Perception of measures related to Coronavirus: 78.2% respond-ents who have visited INA in the last 6 months feel like we dideverything to reduce the possi-ble infection.
96% of all respondents at least once used INA’s services.
LIKING COMPANY
BRAND AWARENESS
CLASS PLUS FUELS AWARENESS
FRESH CORNER BRAND AWARENESS
2019
3.972020
4.01
2019
97%2020
98%
2019
80%2020
82.4%
2019
47%2020
66.5%
PRODUCT SAFETY
416-1, 417-1
For safe management of products throughout their life cycle, INA Group complies with chemicals management laws, one of which is REACH Regulation (EC/1907/2006) on the Registration, Evaluation, Authorization and Restriction of Chemicals. The goal of chemicals management laws is to protect the employees, consumers, communities and the environment from potential risks posed by the products. INA Group has registered all its substances, a total of 39 (INA, d.d. 37 and INA MAZIVA d.o.o. two), thus fulfilling the obligation of the REACH Regulation and can produce substances and place them on the EU market. In 2020 INA, d.d. has registered one new substance after start-up of new produc-tion unit, and INA Group updated 31 registrations (INA, d.d. 29 and INA MAZIVA d.o.o. two).
Following the publication by the European Commission of its proposal for the revised benzene Occupational Exposure Limits (OEL), set at value of 0.5 ppm within two years and 0.2 ppm within four years, and following its publication in the Official Journal of the EU, INA Group started with the activities needed to implement the revised values. Benzene is known as carcinogen, and the aim of those activities is to better protect INA Group workers and others in the supply chain from exposure to this substance.
Before placing chemicals on the market, the industry must classify, label and package them in accordance with the CLP Regulation (EC/1272/2008). INA Group communicates to employees and consumers the potential hazards associated with its products and publishes safe handling information on labels and safety data sheets (hereinafter: SDSs). In 2020, INA Group published and distributed over 100 SDSs for new products such as INA Dezinol disinfectant, which was developed and placed on the market by INA MAZIVA d.o.o. as a prompt re-sponse to COVID-19 pandemic, as well as for well-known INA Group products such as fuels and lubricants. SDSs are available on INA website and INA MAZIVA website. For additional information, please contact us at [email protected].
Annex VIII to CLP Regulation sets out the requirements and scope for submitting information on mixtures placed on the EU market classified as hazardous based on their health and physical effects to the national appointed bodies. The aim is to provide to Poison Centers, harmo-nized information related to emergency health response. By the end of 2020, INA Group has taken all necessary actions to implement Annex VIII to CLP Regulation. The final aim of REACH and CLP regulations is to reduce exposure to hazardous chemicals (products) and prevent diseases, injuries and accidents. For information on REACH and CLP, please contact us at [email protected].
In order to further raise awareness on chemicals, INA Group promotes Responsible Care® (RC®) commitment to the safe management of chemicals throughout their life cycle. In 2020, INA MAZIVA d.o.o. have joined the RC® initiative, while INA, d.d. continued reporting according to the RC® indicators.
In October 2020, the European Commission has published “Chemicals Strategy for Sustainability Towards a Toxic-Free Environment” (here-inafter: CSS) and its Action plan. The Strategy is the first step towards a zero-pollution ambition for a toxic-free environment announced in the European Green Deal. INA Group immediately started with prioritization of the actions derived from CSS applicable to oil and gas sector and its products to make them safer and more sustainable.
CONTRACTORS 204-1
In 2020, INA Group achieved business cooperation with a total of 1,743 suppliers, 1,341 of which are domestic, which represents 77% of the total number. With foreign suppliers, 12% of total turnover was realized, while 88% of total turnover was related to domestic suppliers.
The savings Procurement achieves have a direct impact on the company’s EBIT and we are continuously working with our suppliers to receive the goods and services at the best total cost of ownership available in the market. Additionally, together with our cross-functional partners, we strive to find the best sourcing solutions on time, and with the required quality.
Moreover, we assume supply chain sustainability is increasingly recognized as a key component of corporate sustainability. That is why we believe that supply chain is the engine for today’s global economy, serving to deliver goods and services, connecting our businesses and suppliers who work for them across geographical, industry, cultural and regulatory boundaries.
Supply chain sustainability is expected to ensure INA Group’s continuous efforts to meet its future needs, in line with the economic, social, ethical and environmental conditions. It ensures compliance with laws and regulations as well as adherence to and support of international principles for sustainable business conduct. Identifying and mitigating compliance risks in procurement at an early stage is one of the goals of the supplier selection, qualification and auditing processes. It is expected of our suppliers and business partners to share our values and comply with all applicable laws as laid down in the “INA Group Code of Ethics”.
134 135
It is important to highlight that INA Group defines the mandatory minimal SD&HSE requirements for contractors performing hazardous works in INA Group companies, with the aim of protecting own and contractors’ employees against occupational injuries and illnesses, as well as losses relating to extraordinary events, through all parts of the process (contracting, performance of works and works handover). Depending on the preliminary risk assessment, contractors are required to provide certain certificates, management systems or regulations, for example:
• Low risk level, the Bidder shall be obliged by Statement that they and their subcontractors shall comply with legal requirements and INA Group SD&HSE requirements
• Medium risk level shall prove the existence of safety management systems:
▶ Certificate on Contractor safety SCC** SCCp or
▶ ISO 45 001 and ISO 14 001 (both) certificates or
▶ A successful pre-qualification audit implemented by an accredited certification authority contracted by INA Group (renewed within two years), or
▶ A successful pre-qualification audit based on pre-qualification supervision (valid for two years) and post-evaluation by INA Group companies, or
▶ Bidders who are on the list of MOL Group contractors shall not be subject to pre-qualification
• High risk level shall be subject to pre-screening and pre-qualification by proving the established SCC** or SCCp certification for the company and workers.
Contractor Management is one of elements of the HSE Management System. Contractors are assessed for their capabilities and competen-cies and selected to perform work for/on behalf of INA Group where they are monitored to ensure their HSE performance is in alignment with INA Group requirements.
One of the most important contract management decisions to be made by the client is to identify the responsibilities for managing HSE between client and contractor (or association of contractors). The decision should be based on the outcome of the risk assessment process and the capability of the contractor to manage all risks.
The main areas and elements that we focus on are:
SUPPLIER SELECTION
HAZARD COMMUNICATION
SUPPLIER DEVELOPMENT
PERFORMANCE MANAGEMENT
PLANNING
QUALIFICATION
CONTRACTING
MOBILIZATION
EXECUTION
POST-EVALUATION
• Supplier pre-screening• Supplier qualification• HSE Support of tendering • Improved training system• On-site Control and Consequence management
• Proper hazard communication• Dealing with foreign contractors
• Improved training system• Communication and Learning network of suppliers
• On-site Control and Consequence man-agement • Enhanced Performance manage-ment of key suppliers• Incentive system for contractors• Supplier post-evaluation
The main aims of this process are:
1. Effective processes to support the selection of suppliers
2. Contractors are aware of the technological hazards and mobilize their workforce prepared for the risk mitigation measures
3. Efficient, practical and interactive training sessions. Trained people instead of people who participated in training
4. Safe execution through supervision and performance management
5. HSE-related info and good practices are shared efficiently
6. Increased HSE commitment of key, most critical suppliers
7. Motivate contractors and their employees to improve their HSE performance
8. Overcome barriers of working with international contractors
9. Objective HSE performance evaluation of contractors
*Assessment of the legal and financial capacity of the supplier and compliance with the HSE requirements

136 137
ADDITIONAL SUSTAINABILITY DATA MEMBERSHIPS, EXTERNAL INITIATIVES AND PUBLIC POLICIES
102-12, 102-13
ASSOCIATION PARTICIPATION STATUS
CONCAWE - EUROPEAN PETROLEUM REFINERS ASSOCIATION (JOINT INA-MOL MEMBERSHIP)
Member of the Scientific Council
UN GLOBAL COMPACT Member
EUROPEAN ASSOCIATION OF COMMUNICATION DIRECTORS Member
INTERNATIONAL ORGANIZATION FOR INDUSTRIAL HAZARD MANAGEMENT Member
IOGP – INTERNATIONAL ASSOCIATION OF OIL & GAS PRODUCERS Member
SOCIETY OF PETROLEUM ENGINEERS (CROATIAN BRANCH) Member of the Presidency
LOWER OLEFINS AND AROMATICS CONSORTIUM (LOA) Member
CEEC - CENTRAL EASTERN EUROPEAN AND CASPIAN SCOUT GROUP Member
IPLOCA - INTERNATIONAL PIPE LINE & OFFSHORE CONTRACTORS ASSOCIATION Member
IATA - INTERNATIONAL AIR TRANSPORT ASSOCIATION Member
CROATIAN CHAMBER OF ECONOMY Member of the Assembly
CROATIAN EMPLOYERS' ASSOCIATION
Member of the Assembly and the Council of Members, the Executive Board, the representative of INA is the President of the HUP of the Energy Association and a member of the Economic and Social Council (GSV)
CROATIAN GAS ASSOCIATION The main sponsor, member of the MB, INA’s representative is the Vice-President
CROATIAN ASSOCIATION OF PETROLEUM ENGINEERS AND GEOLOGISTS The principal founder
CROATIAN NATIONAL COMMITTEE OF WORLD PETROLEUM COUNCIL Member of the Presidency
CROATIAN ENERGY ASSOCIATION Member of the Managing Board
CROATIAN BUSINESS COUNCIL FOR SUSTAINABLE DEVELOPMENT Member
CROATIAN STANDARDS INSTITUTE Member
CROATIAN EXPORTERS Member
CROATIAN GEOLOGICAL ASSOCIATIONINA’s representative is the President of the MB, member of the SB and of the Court of Honor
ACADEMY OF TECHNICAL SCIENCES Member
CROATIAN SOCIETY FOR QUALITY Member
CROATIAN METROLOGY SOCIETY Member
CROATIA GREEN BUILDING COUNCIL Member
LABORATORIA CROATICA Member
ASSOCIATION PARTICIPATION STATUS
CROATIAN ASSOCIATION OF CORPORATE TREASURERS Member
INTERNATIONAL CHAMBER OF COMMERCE (ICC) Member
CROATIAN INFORMATION TECHNOLOGY SOCIETY – SOCIETY OF SAP USERS Member
CROATIAN PUBLIC RELATIONS ASSOCIATION Member
CROATIAN WATER POLLUTION CONTROL SOCIETY Member
CROATIAN SOCIETY FOR A HEALTHY WORK PLACE Member
CROATIAN INSTITUTE FOR HEALTH PROTECTION & SAFETY AT WORK Member
ASSOCIATION FOR THE ADVANCEMENT OF HUMAN SAFETY Member
CROATIAN ASSOCIATION FOR PROFESSIONAL FIRE-FIGHTERS Member
CROATIAN ACADEMY OF SCIENCES AND ARTS Member
CROATIAN INSTITUTE OF INTERNAL AUDITORS Member
CROATIAN FIRE-FIGHTING ASSOCIATION Member
RESPONSIBLE CARE GROUP Member
CROATIAN LAW AND COMPETITION PROTECTION SOCIETY Member
ECONOMIC SUSTAINABILITY DATA
DIRECT ECONOMIC VALUE GENERATED AND DISTRIBUTED (HRK MLN)
2018 2019 2020
REALIZED REVENUES 22,349 22,597 14,788
FINANCIAL ASSISTANCE RECEIVED FROM GOVERNMENT - - 23
OPERATING COSTS 21,607 22,575 16,553
CASH ADDED VALUE (COMPANY CASH) 422 606 399
EMPLOYEE WAGES AND BENEFITS 1,927 1,970 1,731
CAPITAL INVESTORS 812 2,150 1,282
PAYMENTS TO GOVERNMENTS 495 417 298
ECONOMIC VALUE RETAINED 1,036 207 (1,586)
CAPITAL EXPENDITURES (HRK MLN) 265 126 (52)
INA GROUP REALIZED REVENUE BY REGION (HRK MLN) 2018 2019 2020
CROATIA 12,289 13,100 8,819
BOSNIA AND HERZEGOVINA 2,966 3,251 1,834
EUROPEAN COUNTRIES 6,420 5,614 3,775
OTHER COUNTRIES 674 632 361
TOTAL 22,349 22,597 14,788
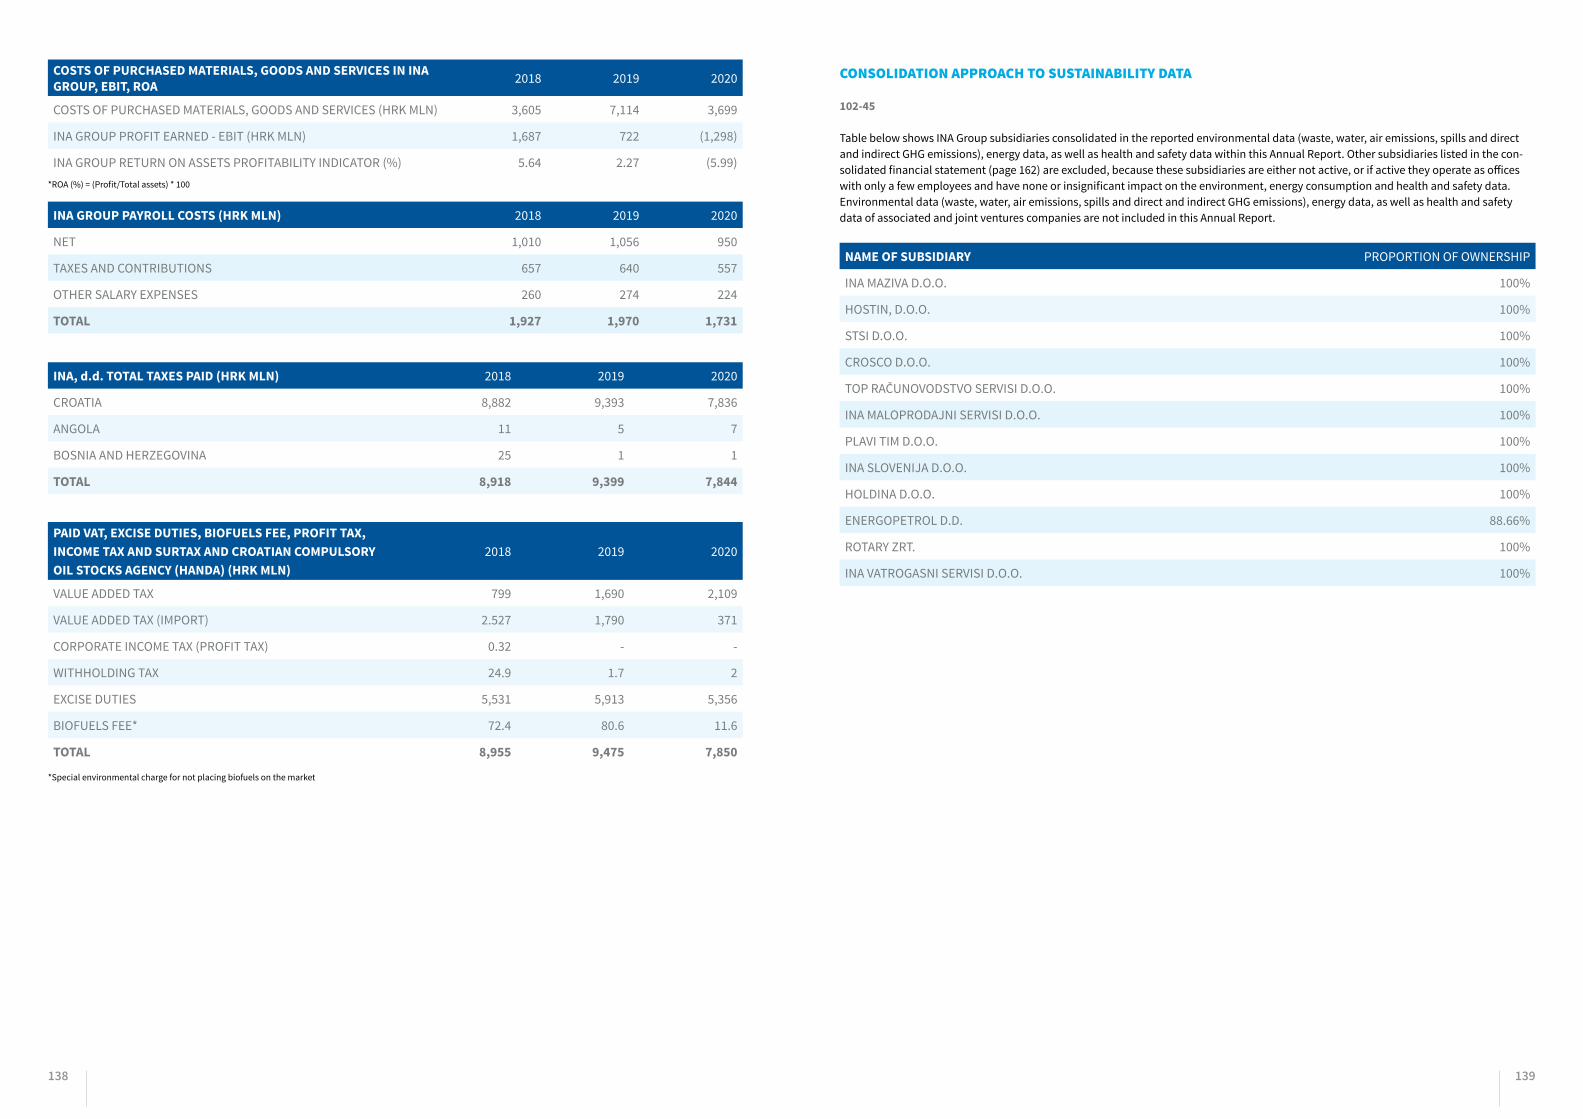
138 139
COSTS OF PURCHASED MATERIALS, GOODS AND SERVICES IN INA GROUP, EBIT, ROA 2018 2019 2020
COSTS OF PURCHASED MATERIALS, GOODS AND SERVICES (HRK MLN) 3,605 7,114 3,699
INA GROUP PROFIT EARNED - EBIT (HRK MLN) 1,687 722 (1,298)
INA GROUP RETURN ON ASSETS PROFITABILITY INDICATOR (%) 5.64 2.27 (5.99)
INA GROUP PAYROLL COSTS (HRK MLN) 2018 2019 2020
NET 1,010 1,056 950
TAXES AND CONTRIBUTIONS 657 640 557
OTHER SALARY EXPENSES 260 274 224
TOTAL 1,927 1,970 1,731
INA, d.d. TOTAL TAXES PAID (HRK MLN) 2018 2019 2020
CROATIA 8,882 9,393 7,836
ANGOLA 11 5 7
BOSNIA AND HERZEGOVINA 25 1 1
TOTAL 8,918 9,399 7,844
PAID VAT, EXCISE DUTIES, BIOFUELS FEE, PROFIT TAX, INCOME TAX AND SURTAX AND CROATIAN COMPULSORYOIL STOCKS AGENCY (HANDA) (HRK MLN)
2018 2019 2020
VALUE ADDED TAX 799 1,690 2,109
VALUE ADDED TAX (IMPORT) 2.527 1,790 371
CORPORATE INCOME TAX (PROFIT TAX) 0.32 - -
WITHHOLDING TAX 24.9 1.7 2
EXCISE DUTIES 5,531 5,913 5,356
BIOFUELS FEE* 72.4 80.6 11.6
TOTAL 8,955 9,475 7,850
*Special environmental charge for not placing biofuels on the market
CONSOLIDATION APPROACH TO SUSTAINABILITY DATA
102-45
Table below shows INA Group subsidiaries consolidated in the reported environmental data (waste, water, air emissions, spills and direct and indirect GHG emissions), energy data, as well as health and safety data within this Annual Report. Other subsidiaries listed in the con-solidated financial statement (page 162) are excluded, because these subsidiaries are either not active, or if active they operate as offices with only a few employees and have none or insignificant impact on the environment, energy consumption and health and safety data. Environmental data (waste, water, air emissions, spills and direct and indirect GHG emissions), energy data, as well as health and safety data of associated and joint ventures companies are not included in this Annual Report.
NAME OF SUBSIDIARY PROPORTION OF OWNERSHIP
INA MAZIVA D.O.O. 100%
HOSTIN, D.O.O. 100%
STSI D.O.O. 100%
CROSCO D.O.O. 100%
TOP RAČUNOVODSTVO SERVISI D.O.O. 100%
INA MALOPRODAJNI SERVISI D.O.O. 100%
PLAVI TIM D.O.O. 100%
INA SLOVENIJA D.O.O. 100%
HOLDINA D.O.O. 100%
ENERGOPETROL D.D. 88.66%
ROTARY ZRT. 100%
INA VATROGASNI SERVISI D.O.O. 100%
*ROA (%) = (Profit/Total assets) * 100

140 141
LEGAL REQUIREMENT MANAGEMENT DOCUMENTS
OCCUPATIONAL HEALTH AND SAFETY SYSTEM AT INA GROUP COMPANIESIMPLEMENTATION OF REACH REGULATION AT INA GROUP COMPANIESPERSONAL PROTECTIVE EQUIPMENT AT INA GROUP COMPANIESPREPARATION OF SAFETY REPORTS, INTERNAL PLANS, AS WELL AS RISK ASSESSMENTS AND OPERATIONAL PLANS BY LEGAL ENTITIES PERFORMING BUSINESS ACTIVITIES BY USING DANGEROUS SUBSTANCES IN INA GROUP COMPANIESFIRE PREVENTION, PROTECTION AND FIRE BRIGADE MANAGEMENT IN INA GROUP COMPANIESPREPAREDNESS AND EMERGENCY RESPONSE AT INA GROUP COMPANIESHEALTH PROTECTION AND PROMOTION IN INA GROUP COMPANIESRULES OF PROCEDURES, CONDITIONS AND METHODS OF OBTAINING SAFETY AT WORK IN INA, D.D.TRAINING PROGRAM FOR WORK IN SAFE MANNER IN INA, D.D.WORKPLACES WITH SPECIAL CONDITIONS OF WORK AND OTHER CRITICAL OPERATIONS REGULATION IN INA, D.D.OHS TRAINING PROGRAM FOR EMPLOYER AND EMPLOYER AUTHORIZED PERSON IN INA, D.D.
INSTRUCTION ON THE SAFETY DATA SHEET AT INA, D.D.
INSTRUCTION ON KEEPING THE INQUEST REGISTER OF HAZARDOUS CHEMICALS IN INA, D.D.
OHS BEST OIL AND GAS PRACTICES
SAFE DRIVING STANDARD IN INA GROUP COMPANIES
SD&HSE ASPECTS OF DESIGN, CONSTRUCTION, COMMISSIONING AND DECOMMISSIONING OF PLANTS/FACILITIES IN INA GROUP COMPANIESHEALTH, SAFETY, ENVIRONMENT AND FIRE PROTECTION INCIDENT REPORTING AND INVESTIGATION SYSTEM AT INA GROUP COMPANIES
LIFE SAVING RULES AT INA GROUP COMPANIES
SD&HSE MANAGEMENT IN THE CONTRACTING AND SERVICE PROCUREMENT PROCESSES IN INA GROUP COMPANIESPROCESS SAFETY MANAGEMENT AT INA GROUP COMPANIES
PERMITS TO WORK IN INA GROUP COMPANIES
SAFE OPERATION AND WORK PRACTICE IN INA GROUP COMPANIESPROCEDURE FOR IMPLEMENTING HEALTH, SAFETY AND ENVIRONMENT AUDITS AND SUPERVISIONS IN INA GROUP COMPANIESREGULATION ON CONDITIONS, PRIORITIES AND METHOD OF SENDING INA, D.D. WORKERS ON MEDICINE PROGRAMED ACTIVE VACATION AND HEALTH PROGRAMED ACTIVE VACATION
INA, D.D. PROCEDURE IN CASE OF EARTHQUAKE
OPERATIONAL RISK MANAGEMENT IN INA, D.D.
TESTING AND INSPECTION OF BUNDS IN INA GROUP COMPANIESINSTRUCTION ON ACTIONS AND IMPLEMENTATION OF SAFETY AND HEALTH PROTECTION MEASURES IN CIRCUMSTANCES OF EXPOSURE TO COVID-19 PANDEMIC IN INA GROUP COMPANIESPROCEDURE IN CASE OF COVID-19 CORONAVIRUSINFECTION SUSPECTED IN INA GROUP COMPANIES’ OWN WORKER, CONTRACTOR AND SERVICE PROVIDERINSTRUCTION ON THE MANNER OF TESTING FOR COVID-19 AND IMPLEMENTATION OF OTHER PROTECTION MEASURES REGARDING OWN EMPLOYEES, VISITORS AND EXTERNAL CONTRACTORS IN INA GROUP COMPANIESINSTRUCTION ON THE USE OF PERSONAL PROTECTIVE EQUIPMENT AND MEDICAL EQUIPMENT IN THE CASE OF COVID-19 PANDEMIC
TCFD RECOMMENDATION REFERENCE TO INA DISCLOSURE
GOVERNANCE – DISCLOSE THE ORGANIZATION’S GOVERNANCE AROUND CLIMATE RELATED RISKS AND OPPORTUNITIES
A) DESCRIBE ORGANIZATION’S GOVERNANCE AROUND CLIMATE-RELATED RISKS AND OPPORTUNITIES.
B) DESCRIBE MANAGEMENT’S ROLE IN ASSESSING AND MANAGING CLIMATE-RELATED RISKS AND OPPORTUNITIES.
PAGE 68
STRATEGY – DISCLOSE THE ACTUAL AND POTENTIAL IMPACTS OF CLIMATE RELATED RISKS AND OPPORTUNITIES ON THE ORGANIZATION’S BUSINESSES, STRATEGY, AND FINANCIAL PLANNING WHERE SUCH INFORMATION IS MATERIAL
A) DESCRIBE THE CLIMATE-RELATED RISKS AND OPPORTUNITIES THE ORGANIZATION HAS IDENTIFIED OVER THE SHORT, MEDIUM, AND LONG TERM.
PAGE 68, 103-105B) DESCRIBE THE IMPACT OF CLIMATE-RELATED RISKS AND OPPORTUNITIES ON BUSINESSES, STRATEGY, AND FINANCIAL PLANNING.
C) DESCRIBE THE RESILIENCE OF THE ORGANIZATION’S STRATEGY, TAKING INTO CONSIDERATION DIFFERENT CLIMATE-RELATED SCENARIOS, INCLUDING A 2°C OR LOWER SCENARIO.RISK MANAGEMENT – DISCLOSE HOW THE ORGANIZATION IDENTIFIES, ASSESSES, AND MANAGES CLIMATE-RELATED RISKS
A) DESCRIBE THE ORGANIZATION’S PROCESSES FOR IDENTIFYING AND ASSESSING CLIMATE-RELATED RISKS.
PAGE 68, 100, 102B) DESCRIBE THE ORGANIZATION’S PROCESSES FOR MANAGING CLIMATE-RELATED RISKS.
C) DESCRIBE HOW PROCESSES FOR IDENTIFYING, ASSESSING, AND MANAGING CLI-MATE-RELATED RISKS ARE INTEGRATED INTO THE ORGANIZATION’S OVERALL RISK MANAGEMENT.METRICS & TARGETS – DISCLOSE THE METRICS AND TARGETS USED TO ASSESS AND MANAGE RELEVANT CLIMATE-RELATED RISKS AND OPPORTUNITIES WHERE SUCH INFORMATION IS MATERIAL
A) DISCLOSE THE METRICS USED TO ASSESS CLIMATE-RELATED RISKS AND OPPORTU-NITIES IN LINE WITH ITS STRATEGY AND RISK MANAGEMENT PROCESS.
PAGE 100-102, 106-109B) DISCLOSE SCOPE 1, SCOPE 2 AND, IF APPROPRIATE, SCOPE 3 GHG EMISSIONS AND RELATED RISKS.
C) DESCRIBE THE TARGETS USED TO MANAGE CLIMATE-RELATED RISKS AND OPPOR-TUNITIES AND PERFORMANCE AGAINST TARGETS.
LIST OF LEGAL OHS DOCUMENTS AND BEST PRACTICES IN INA GROUP CLIMATE-RELATED FINANCIAL DISCLOSURES CROSS-REFERENCE TABLE
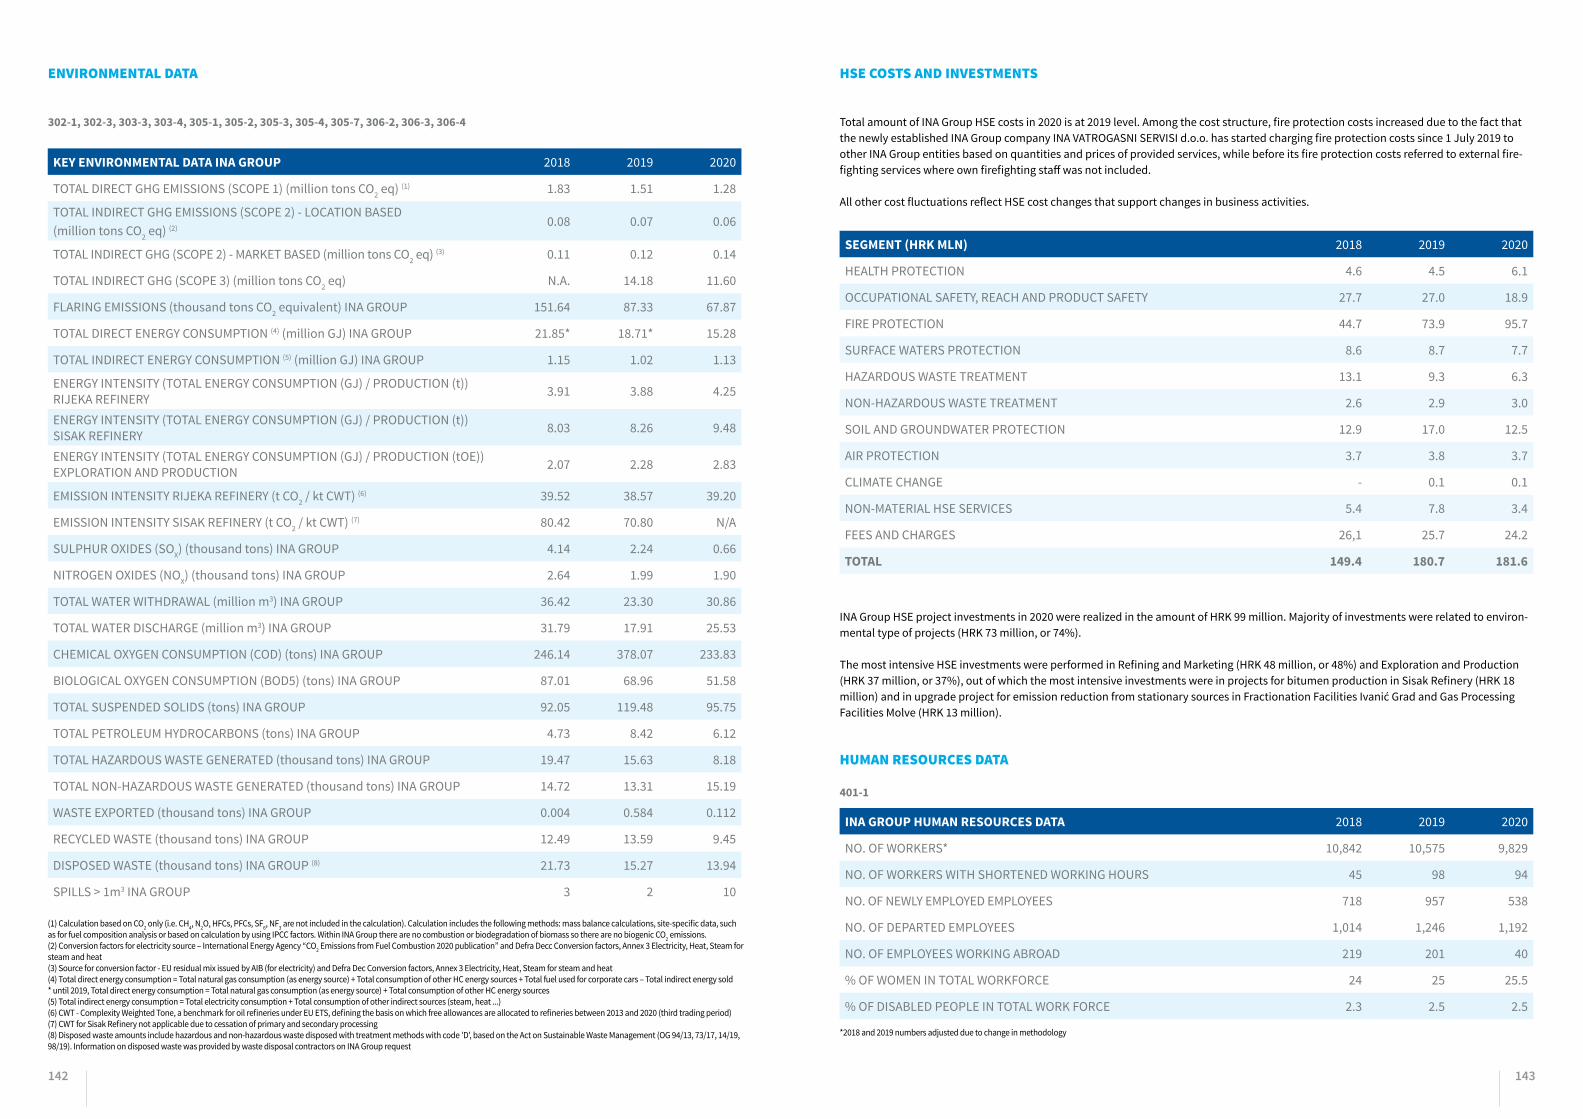
142 143
ENVIRONMENTAL DATA
302-1, 302-3, 303-3, 303-4, 305-1, 305-2, 305-3, 305-4, 305-7, 306-2, 306-3, 306-4
KEY ENVIRONMENTAL DATA INA GROUP 2018 2019 2020
TOTAL DIRECT GHG EMISSIONS (SCOPE 1) (million tons CO2 eq) (1) 1.83 1.51 1.28
TOTAL INDIRECT GHG EMISSIONS (SCOPE 2) - LOCATION BASED (million tons CO2 eq) (2) 0.08 0.07 0.06
TOTAL INDIRECT GHG (SCOPE 2) - MARKET BASED (million tons CO2 eq) (3) 0.11 0.12 0.14
TOTAL INDIRECT GHG (SCOPE 3) (million tons CO2 eq) N.A. 14.18 11.60
FLARING EMISSIONS (thousand tons CO2 equivalent) INA GROUP 151.64 87.33 67.87
TOTAL DIRECT ENERGY CONSUMPTION (4) (million GJ) INA GROUP 21.85* 18.71* 15.28
TOTAL INDIRECT ENERGY CONSUMPTION (5) (million GJ) INA GROUP 1.15 1.02 1.13
ENERGY INTENSITY (TOTAL ENERGY CONSUMPTION (GJ) / PRODUCTION (t)) RIJEKA REFINERY 3.91 3.88 4.25
ENERGY INTENSITY (TOTAL ENERGY CONSUMPTION (GJ) / PRODUCTION (t)) SISAK REFINERY 8.03 8.26 9.48
ENERGY INTENSITY (TOTAL ENERGY CONSUMPTION (GJ) / PRODUCTION (tOE)) EXPLORATION AND PRODUCTION 2.07 2.28 2.83
EMISSION INTENSITY RIJEKA REFINERY (t CO2 / kt CWT) (6) 39.52 38.57 39.20
EMISSION INTENSITY SISAK REFINERY (t CO2 / kt CWT) (7) 80.42 70.80 N/A
SULPHUR OXIDES (SOX) (thousand tons) INA GROUP 4.14 2.24 0.66
NITROGEN OXIDES (NOX) (thousand tons) INA GROUP 2.64 1.99 1.90
TOTAL WATER WITHDRAWAL (million m3) INA GROUP 36.42 23.30 30.86
TOTAL WATER DISCHARGE (million m3) INA GROUP 31.79 17.91 25.53
CHEMICAL OXYGEN CONSUMPTION (COD) (tons) INA GROUP 246.14 378.07 233.83
BIOLOGICAL OXYGEN CONSUMPTION (BOD5) (tons) INA GROUP 87.01 68.96 51.58
TOTAL SUSPENDED SOLIDS (tons) INA GROUP 92.05 119.48 95.75
TOTAL PETROLEUM HYDROCARBONS (tons) INA GROUP 4.73 8.42 6.12
TOTAL HAZARDOUS WASTE GENERATED (thousand tons) INA GROUP 19.47 15.63 8.18
TOTAL NON-HAZARDOUS WASTE GENERATED (thousand tons) INA GROUP 14.72 13.31 15.19
WASTE EXPORTED (thousand tons) INA GROUP 0.004 0.584 0.112
RECYCLED WASTE (thousand tons) INA GROUP 12.49 13.59 9.45
DISPOSED WASTE (thousand tons) INA GROUP (8) 21.73 15.27 13.94
SPILLS > 1m3 INA GROUP 3 2 10
(1) Calculation based on CO2 only (i.e. CH4, N2O, HFCs, PFCs, SF6, NF3 are not included in the calculation). Calculation includes the following methods: mass balance calculations, site-specific data, such as for fuel composition analysis or based on calculation by using IPCC factors. Within INA Group there are no combustion or biodegradation of biomass so there are no biogenic CO2 emissions.(2) Conversion factors for electricity source – International Energy Agency “CO2 Emissions from Fuel Combustion 2020 publication” and Defra Decc Conversion factors, Annex 3 Electricity, Heat, Steam for steam and heat (3) Source for conversion factor - EU residual mix issued by AIB (for electricity) and Defra Dec Conversion factors, Annex 3 Electricity, Heat, Steam for steam and heat(4) Total direct energy consumption = Total natural gas consumption (as energy source) + Total consumption of other HC energy sources + Total fuel used for corporate cars – Total indirect energy sold* until 2019, Total direct energy consumption = Total natural gas consumption (as energy source) + Total consumption of other HC energy sources(5) Total indirect energy consumption = Total electricity consumption + Total consumption of other indirect sources (steam, heat ...)(6) CWT - Complexity Weighted Tone, a benchmark for oil refineries under EU ETS, defining the basis on which free allowances are allocated to refineries between 2013 and 2020 (third trading period)(7) CWT for Sisak Refinery not applicable due to cessation of primary and secondary processing(8) Disposed waste amounts include hazardous and non-hazardous waste disposed with treatment methods with code 'D', based on the Act on Sustainable Waste Management (OG 94/13, 73/17, 14/19, 98/19). Information on disposed waste was provided by waste disposal contractors on INA Group request
HSE COSTS AND INVESTMENTS
Total amount of INA Group HSE costs in 2020 is at 2019 level. Among the cost structure, fire protection costs increased due to the fact that the newly established INA Group company INA VATROGASNI SERVISI d.o.o. has started charging fire protection costs since 1 July 2019 to other INA Group entities based on quantities and prices of provided services, while before its fire protection costs referred to external fire-fighting services where own firefighting staff was not included.
All other cost fluctuations reflect HSE cost changes that support changes in business activities.
SEGMENT (HRK MLN) 2018 2019 2020
HEALTH PROTECTION 4.6 4.5 6.1
OCCUPATIONAL SAFETY, REACH AND PRODUCT SAFETY 27.7 27.0 18.9
FIRE PROTECTION 44.7 73.9 95.7
SURFACE WATERS PROTECTION 8.6 8.7 7.7
HAZARDOUS WASTE TREATMENT 13.1 9.3 6.3
NON-HAZARDOUS WASTE TREATMENT 2.6 2.9 3.0
SOIL AND GROUNDWATER PROTECTION 12.9 17.0 12.5
AIR PROTECTION 3.7 3.8 3.7
CLIMATE CHANGE - 0.1 0.1
NON-MATERIAL HSE SERVICES 5.4 7.8 3.4
FEES AND CHARGES 26,1 25.7 24.2
TOTAL 149.4 180.7 181.6
INA GROUP HUMAN RESOURCES DATA 2018 2019 2020
NO. OF WORKERS* 10,842 10,575 9,829
NO. OF WORKERS WITH SHORTENED WORKING HOURS 45 98 94
NO. OF NEWLY EMPLOYED EMPLOYEES 718 957 538
NO. OF DEPARTED EMPLOYEES 1,014 1,246 1,192
NO. OF EMPLOYEES WORKING ABROAD 219 201 40
% OF WOMEN IN TOTAL WORKFORCE 24 25 25.5
% OF DISABLED PEOPLE IN TOTAL WORK FORCE 2.3 2.5 2.5
INA Group HSE project investments in 2020 were realized in the amount of HRK 99 million. Majority of investments were related to environ-mental type of projects (HRK 73 million, or 74%).
The most intensive HSE investments were performed in Refining and Marketing (HRK 48 million, or 48%) and Exploration and Production (HRK 37 million, or 37%), out of which the most intensive investments were in projects for bitumen production in Sisak Refinery (HRK 18 million) and in upgrade project for emission reduction from stationary sources in Fractionation Facilities Ivanić Grad and Gas Processing Facilities Molve (HRK 13 million).
HUMAN RESOURCES DATA
401-1
*2018 and 2019 numbers adjusted due to change in methodology

144 145
102-8, 401-1, 401-3, 404-1
HUMAN RESOURCES DATA, INA GROUP COMPANIES IN 2020 INA, D.D.CROSCO
D.O.O.ROTARY ZRT. STSI D.O.O. INA MAZIVA
D.O.O.HOSTIN,
D.O.O.
INA MALO-PRODAJNI
SERVISI D.O.O.
PLAVI TIM D.O.O.
TOP RAČUN-OVODSTVO
SERVISI D.O.O.
INA SLO-VENIJA D.O.O.
HOLDINA D.O.O.
INA CRNA GORA D.O.O.
ENERGOPE-TROL D.D.
INA VATRO-GASNI SER-VISI D.O.O.
NO. OF WORKERS 3,411 741 287 769 131 6 2,743 197 223 48 523 59 459 238
NO. OF WORKERS WITH SHORTENED WORKING HOURS 26 3 11 1 2 0 3 3 6 2 18 0 18 1
NO. OF NEWLY EMPLOYED EMPLOYEES 61 1 7 96 5 0 287 5 11 1 24 1 15 24
NO. OF DEPARTED EMPLOYEES 356 252 2 126 15 0 190 19 26 1 93 2 78 32
NO. OF EMPLOYEES WORKING ABROAD 11 13 0 8 0 0 0 0 0 0 2 0 0 0
NO. OF WOMEN IN TOTAL WORKFORCE 932 24 22 49 41 3 900 75 200 18 156 21 65 11
% OF WOMEN IN MANAGERIAL POSITIONS 37 11 0 33 29 100 0 45 78 4 5 0 5 0
% OF DISABLED PERSONS IN TOTAL WORK FORCE 2 2 0 2 6 0 2 2 3 8 4 0 9 1
NO. OF UNSKILLED WORKERS 9 2 0 4 0 0 2 0 0 0 0 0 3 0
NO. OF SEMI-SKILLED WORKERS 6 1 28 14 0 0 2 0 0 0 1 0 0 0
NO. OF PRIMARY SCHOOL DEGREE WORKERS 10 5 3 4 6 0 3 0 0 0 0 1 0 0
NO. OF SKILLED WORKERS 84 76 109 62 4 0 73 0 1 19 156 0 208 3
NO. OF HIGH SCHOOL DEGREE WORKERS 1,691 505 7 406 63 3 2,473 76 109 18 257 39 213 205
NO. OF HIGHLY SKILLED WORKERS 132 13 72 87 1 0 15 1 0 3 4 0 2 0
NO. OF ASSOC.DEGR./BACC. WORKERS 261 23 37 66 11 2 125 24 33 7 23 12 11 14
NO. OF UNIV. DEGR. / MAG. WORKERS 1,041 113 19 109 36 1 46 77 67 1 78 2 22 9
NO. OF MA / UNIV. SPEC. WORKERS 87 0 11 13 9 0 3 12 9 0 0 5 0 6
NO. OF PHD WORKERS 90 3 1 4 1 0 1 7 3 0 4 0 0 1
UNDER THE AGE OF 30 210 40 11 68 5 0 696 12 5 6 95 14 82 48
31-40 YEARS 720 243 78 181 17 1 779 46 53 10 144 21 98 73
41-50 YEARS 1,024 204 80 215 32 3 796 48 64 14 159 19 140 55
51-60 YEARS 1,359 238 103 273 73 1 438 80 99 17 111 5 121 62
OVER 61 YEARS 98 16 15 32 4 1 34 11 2 1 14 0 18 0
AVERAGE TRAINING TIME PER EMPLOYEE (HOURS) 14 11 45 12 7 0 7 7 14 N/A 5,23 3,66 8 18
AVERAGE COST OF TRAINING PER EMPLOYEE (HRK) 948 360 607 477 247 0 228 301 168 N/A 83 329,5 103 1.988
% OF EMPLOYEES IN TRADE UNIONS 53 77 32 60 64 0 69 43 55 31 52 41 57 62
% OF EMPLOYEES COVERED BY THE COLLECTIVE AGREEMENT 100 100 99 100 100 100 100 100 100 97 100 0 100 100
F/M F/M F/M F/M F/M F/M F/M F/M F/M F/M F/M F/M F/M F/M
NUMBER OF EMPLOYEES ENTITLED TO PARENTAL LEAVE 15/53 0/16 1/0 0/21 1/1 0/0 20/50 1/2 5/0 0 13/0 1/0 6/0 0/10
NUMBER OF EMPLOYEES BY GENDER THAT TOOK PARENTAL LEAVE 81/12 4/26 1/0 2/2 3/1 1/0 113/47 5/0 14/0 3/0 6/0 1/0 6/0 0/0
NUMBER OF EMPLOYEES WHO RETURNED TO WORK AFTER THEIR PARENTAL LEAVE ENDED 31/9 4/25 1/0 0/2 1/1 0 34/40 3/0 4/0 3/0 3/0 0 4/0 0
NUMBER OF EMPLOYEES WHO RETURNED TO WORK AFTER THEIR PARENTAL LEAVE ENDED AND WHO ARE STILL EMPLOYED TWELVE MONTHS AFTER THEIR RETURN TO WORK
43/1 1/3 0 1/1 3/0 0 43/16 0 5/0 0 4/1 1/0 3/0 0
THE RETURN TO WORK AND RETENTION RATES OF EMPLOYEES WHO RETURNED TO WORK AFTER THE LEAVE ENDED (%) N/A N/A N/A N/A N/A N/A N/A N/A N/A N/A N/A N/A N/A N/A
Holdina d.o.o. and Energopetrol d.d. employees work halftime for one company and other halftime for the other

146 147
102-8, 202-2
Proportion of senior management hired from the local community at significant locations of operation in 2020:
COMPANY LOCAL/EXTERNAL
CROSCO D.O.O. 1/0
ED-INA D.O.O. N/A
HOLDINA D.O.O. 1/2
ENERGOPETROL D.D. 0/3
HOSTIN, D.O.O. 0
INA CRNA GORA D.O.O. 0
INA KOSOVO D.O.O. 0
INA MAZIVA D.O.O. 1/0
INA, D.D. 7/1
INA SLOVENIJA D.O.O. 1/0
PLAVI TIM D.O.O. 1/0
ROTARY ZRT. 1/0
STSI d.o.o. 1/0
TOP RAČUNOVODSTVO SERVISI d.o.o. 1/0
148 149
ers’ perspectives on material topics showed that there is a sepa-rate group of customers who exhibit lower awareness of climate issues than the other stakeholders involved in the discussion.
In the part of the report regarding the bribery and corruption, we suggest that some of the GRI indicators be selected to indicate the status of reported and investigated incidents by individual areas instead of the current summary. We believe that stakehold-ers may be interested in to which topics the reports relate, i.e. whether they relate to bribery, whistleblowers or human rights violations. It would also be good to state what the compliance department warned about during the reporting period as well as to indicate the stage in which the misdemeanor and other proceedings initiated during the reporting period are. In the past year, a new framework for sustainable development management was implemented, which in a high-quality, compre-hensive manner connected the previous efforts to continuously reduce the impact on the environment, which is the primary and most important goal of the sustainability program.
Within this framework, the topic of climate change is especially emphasized, to which a special chapter is dedicated, where for the first time the risks related to climate change are strategical-ly and systematically presented. It is shown how the business adapts to sustainability, and it is on these settings that strategic guidelines have been developed with the aim of using the potential offered by the core business, while defining directions for transformation into new business segments. INA Group
hereby demonstrates its intention to focus on reducing harmful emissions by introducing climate risk criteria and the ability to manage them in the processes of defining the business strategy and decision-making, in accordance with the recommendations of the Task Force on Climate-Related Financial Disclosures (TCFD). Climate-related publications are also in line with the TCFD.
Given the much greater importance assigned to the topic of cli-mate change in this report, we hope to see more information in the next report on actual plans and strategies to achieve the goal of reducing greenhouse gas emissions, as well as actual results of the activities conducted. In the future reports, we expect infor-mation on implemented GHG emission reduction projects, such as the biofuels project and others, as well as more material data on such reduced emissions and the impact on risks associated with climate change.
In conclusion, we believe that this year's INA Group report is comprehensive and provides many data important for the assessment of specific activities, strategies and plans. We commend in particular the introduction of a special chapter on climate change, which represents a huge step forward and a basis for further development of the emission reduction process and its regular monitoring and reporting. We thank INA Group for this great progress and will gladly follow up on future reports and information regarding the results of the implementation of these initiatives.
This year's INA Group Annual Report is the seventh integrated report that presents a comprehensive overview of the company's financial and material sustainability topics. The report focuses on the material economic, environmental and social impacts of INA Group's business activities and deals with operations in the period from 1 January to 31 December 2020. INA Group Sustain-able Development Report for 2020 meets the legal regulations of the Republic of Croatia which set out the scope, content and deadlines of the annual report, and is also in accordance with the requirements of the core sustainability reporting option of the Global Reporting Initiative (GRI).
The report presents INA's business activities in one of the most challenging business years since the organization’s establish-ment. The pandemic, which affected the world and damaged the global economy, also had a strong impact on business in Croatia. The oil industry and fuel processing activities are among the most affected by this pandemic due to the slow-down in economic activity, reduced mobility of citizens and a weak tourist season. Everything was accompanied by a sharp drop in prices. Due to all these reasons INA Group suffered a decrease in reve-nues and losses in the subject year, but managed to preserve the business stability and continuity in spite of that.
It was in these extraordinary circumstances of the pandemic and unplanned strong business impacts that INA Group ensured a timely and effective response to the pandemic and ensuing quarantine. Employees have been re-organized to work in accor-dance with the epidemiological measures, thus preserving health and efficient business operations, as well as jobs. In addition to a detailed presentation of the response to the pandemic, which includes increased business digitalization and various forms of psychological support to employees, the employee care pro-grams such as flexi programs, as well as Mamforce and Dadforce programs continued, and were further strengthened during the pandemic.
Following the reinstatement of stable operations at the level of the entire MOL and INA Group, a survey on diversity and inclu-
sion was conducted with the aim of better understanding the perspective of employees on this topic and identifying strengths, as well as improvement areas.
A serious and systematic approach to occupational health and safety has continued, which includes awarding the Smart recog-nition for outstanding contribution to employees, management and contractors, as well as training in safe driving.
Despite the times of crisis, works on environmental protection projects continued, therefore the construction of a plant for the treatment of heavy residues, worth around HRK 4 billion, also continued. In addition, in the middle of the year, the pro-pane-propylene splitter unit, worth more than half a billion kuna, was put into operation, allowing the Rijeka Refinery to produce high-purity propylene used in the petrochemical industry.
Furthermore, in Sisak, investments are being made in alternative sustainable forms of production, which include bitumen produc-tion, a logistics hub, a solar power plant and a biorefinery. These investments are partly co-financed from the European Union Innovation Fund. Furthermore, in cooperation with the City of Zagreb, INA is implementing a project to introduce hydrogen as an alternative, CO2-neutral fuel in urban transport. We are also working on the construction of solar power plants at the existing industrial facilities.
We especially commend the very high-quality and thorough consultation with stakeholders on material topics of INA Group. Of particular interest was the open panel discussion on material topics in an online format entitled "Open about the sustainability of the INA Group". On that occasion, 15 stakeholder represen-tatives participated in the open panel discussion, engaging in a very open and dynamic discussion that opened various topics and defined the key interests of stakeholders, but also the risks of the INA Group. The process of involving stakeholders in the research of material topics was conducted through an online questionnaire, which included 44 representatives of various stakeholder groups. This comprehensive analysis of stakehold-
OPINION OF THE COMMISSION OF THE ADMINISTRATIVE COUNCIL OF THE CROATIAN BUSINESS COUNCIL FOR SUSTAINABLE DEVELOPMENT ON THE INA GROUP SUSTAINABILITY REPORT FOR 2020
INDEPENDENT REVIEWS
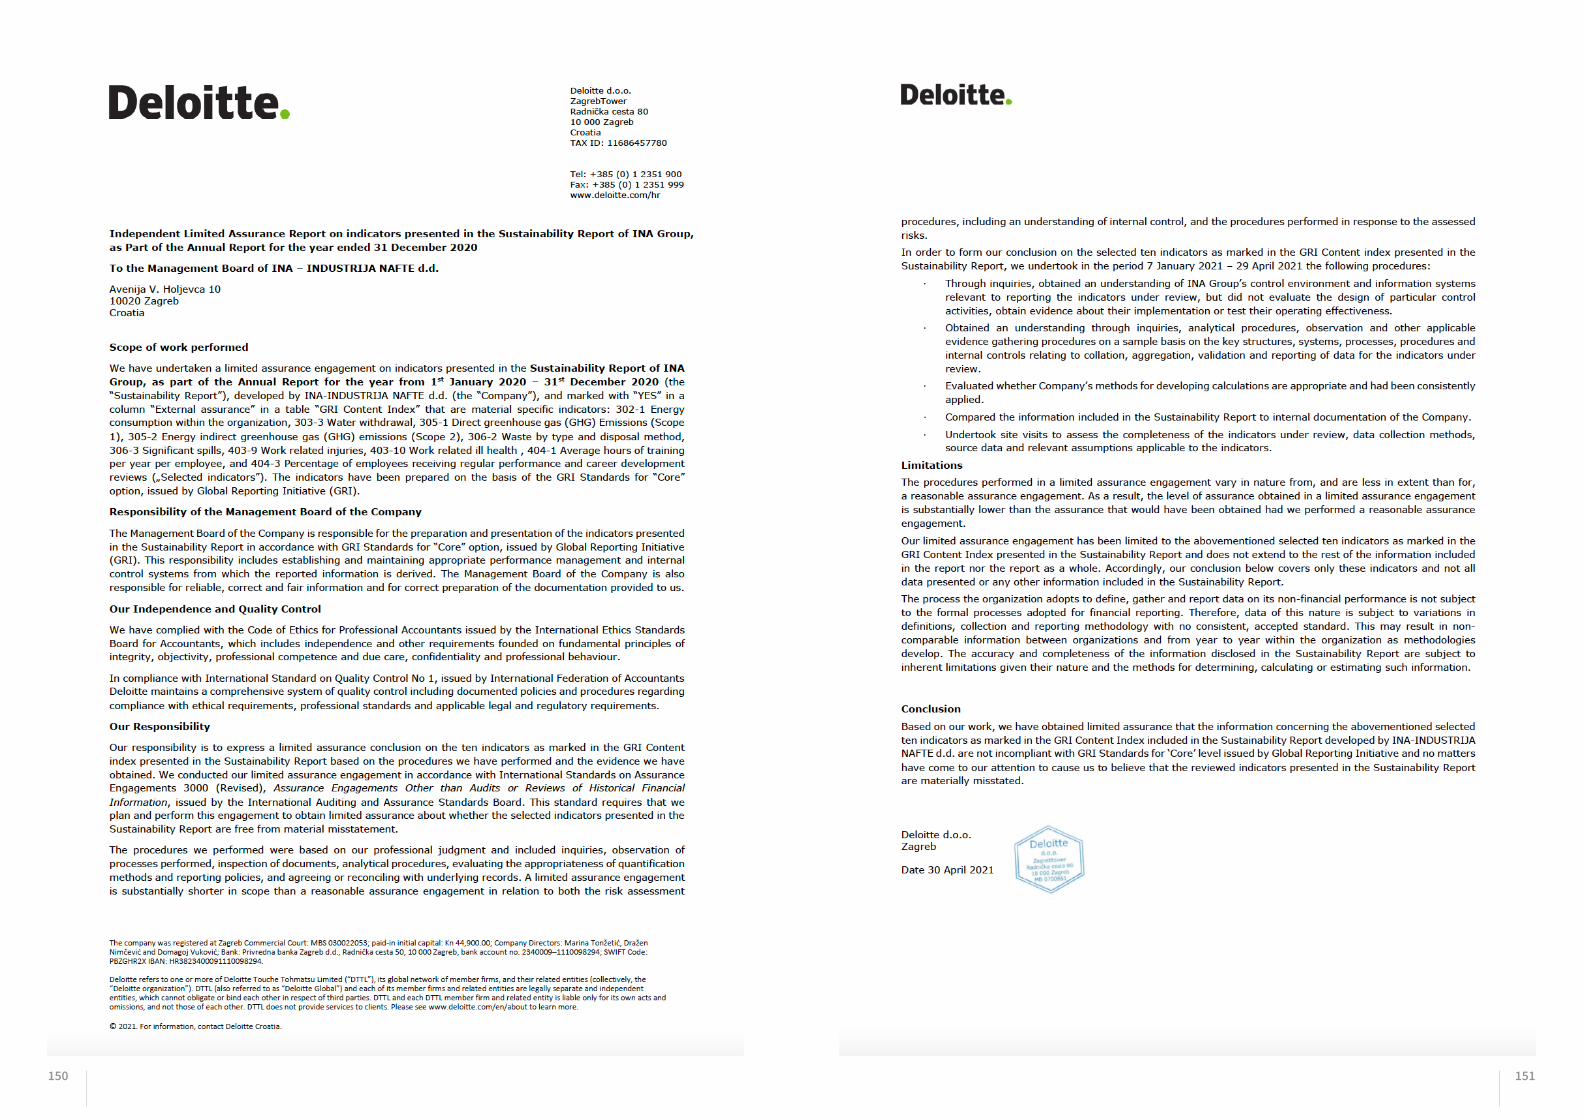
150 151

152 153
060
154 155
GLOSSARY OF TERMS AND ACRONYMS TERM/ACRONYIM DEFINITION1P RESERVES Proven reserves
2P RESERVES Proven and probable reserves
BCM - MCM Billion cubic meters - million cubic meters
BLN - MLN Billion - Million
BLN USD/HRK – MLN USD/HRK Billion USD/HRK – Million USD/HRK
CAPEX Capital expenditures
CBCSD Croatian Business Council for Sustainable Development
CCS EBITDA/ 1/0
PROFIT/(LOSS) FROM OPERATIONS
CCS methodology eliminates from EBITDA/Profit/(loss) from operations inventory holding profit/(loss) (i.e.: reflecting actual cost of supply of crude oil and other major raw materials); impairment on inventories; furthermore, adjusts EBITDA/Profit/(loss) by capturing the results of underlying hedge transactions. Clean CCS figures of the base periods were modified as well according to the improved methodology
CCUS Carbon capture, utilization and storage
CEE Central and Eastern Europe
CEGH Central European Gas Hub
CEEMEA Central and Eastern Europe, Middle East and Africa
CEO Chief Executive Officer
CFO Chief Financial Officer
CH % Percentage change
CLP Classification, labelling and packaging of substances and mixtures
CNB Croatian National Bank
CSI Croatian Standards Institute
CSR Corporate Social Responsibility
D.D. PLC (Public Limited Company)
D.O.O. LLC (Limited Liability Company)
DS Downstream/Refining and Marketing
D&I Diversity and inclusion
EARNINGS PER SHAREEarnings per share is based on the profit attributable to ordinary shareholders using the weighted average number of shares outstanding during the year after deduction of the average number of treasury shares held over the period
EB Employee Brand
EBITDA EBIT + Depreciation, amortization and impairment (net)
EIP Efficiency Improvement Program
EOR Enhanced Oil Recovery
ESP Electric Submersible Pump
EU European Union
EU ETS European Union Emission Trading System
EURIBOR Europe Interbank Offered Rate
G&GS Geological and Geophysical
GDR Global depositary receipts
GEARING RATIO Net debt/Net debt + equity including non-controlling interest
TERM/ACRONYIM DEFINITIONGHG Greenhouse gases
GJ Giga Joules
GRI Global Reporting Initiative
HAZOP Hazard and Operability Study
HR Human Resources
HSE Health, Safety and Environment
HUNIG Croatian Association of Petroleum Engineers and Geologists
IFRS International Financial Reporting Standards, formerly International Accounting Standards (IAS)
IMO International Maritime Organization
IPM Integrated Production Model
LIBOR London Interbank Offered Rate
LNG Liquefied natural gas
MBA Master of Business Administration
MBOE/D Thousand barrels of oil equivalent per day
MMBOE - MBOE Million Barrels of Oil Equivalent - Thousands of Barrels of Oil Equivalent
MT – KT - T Million tons – kiloton - ton
MTBF Mean time between failure
MTPA Million tons per annum
NCI Nelson Complexity Index
OHS Occupational Health and Safety
OPEC Organization of the Petroleum Exporting Countries
OTIF On time in full
P&ID Piping and Instrumentation Diagram
PPE Personal Protective Equipment
PSAS Production sharing agreement
PSM Process Safety Management
REACH Registration, Evaluation, Authorization and Restriction of Chemicals
RETAIL LOCATIONS Service stations and other retail locations (auto bar/ restaurants, carwash, shop, Heating Oil sales point, LPG sales point)
R&M Downstream/Refining and Marketing
SD Sustainable Development
SD&HSE Sustainable Development and Health, Safety and Environment
SDG Sustainable Development Goals
SDS Safety data sheet
SIMPLIFIED FREE CASH FLOW CCS EBITDA excluding special items – Capital expenditures
TCFD Task Force on Climate-related Financial Disclosures
TIER Process Safety Events (Tier 1 higher consequence, Tier 2 lower consequence)
TRIR Total Recordable Injury Rate
TTF Title Transfer Facility
TU Trade Union
UK United Kingdom
UNGC United Nations Global Compact
WC Works Council
156 157
REPORT ON PAYMENTS TO GOVERNMENTS FOR THE YEAR ENDED 31 DECEMBER 2020
1. INTRODUCTIONS
INA – INDUSTRIJA NAFTE, d.d. has prepared the present Report on Payments to Government in accordance with Accounting Act (Official Ga-zette 78/15,134/15,120/16,116/18,42/20,47/20) compliance with Chapter 10 of DIRECTIVE 2013/34/EU (26 June 2013) on the annual financial statements, consolidated financial statements and related reports of certain types of undertakings.
The „Reporting Principles“ section below contains information about the content of the Report, the types of payments included and the principles that have been applied in preparing the Report.
2. REPORTING PRINCIPLES
The Directive requires extractive sector companies listed on a stock exchange to publicly disclose payments made to the governments of those countries where they carry out extractive operations (involving the exploration, prospection, discovery, development and extraction of minerals, oil and natural gas deposits or other materials).
Under the Accounting Act, INA, d.d. is required to prepare a consolidated report on payments made to governments for each financial year in relation to relevant activities of both INA, d.d. and any of its subsidiary undertakings included in the consolidated group accounts.
The Report also provides details on the total amount of such payments by type, specific project and government paid. In light of these requirements INA Group has assessed its reporting obligations to be as follows:
• Where INA Group has made a payment to a government, such payment is reported in full, whether made in INA Group’s sole capacity or in INA Group’s capacity as the operator of a joint-arrangement.
• When a national oil company is the operator of a project to whom INA Group makes a reportable payment which is distinguishable in the cash-calls, it is included in this Report.
• Payments made by an incorporated joint arrangement where INA Group is not the operator are not included within this Report.
• For some payments it may not be possible to attribute a payment to a single project and therefore such payments may be reported at the country level. Corporate income taxes, which are typically not levied at a project level, are an example of this.
IN-KIND PAYMENTS
Production entitlement and Royalties paid in kind owed to Governments pursuant to legal or contractual provisions (not booked in the Ex-tractive Companies’ accounts pursuant to the accounting standards) are reported in proportion to the interest held in the Project. Payments in kind are estimated at fair value which corresponds to the contractual price of oil and gas, market price (if available) or an appropriate benchmark price. These prices may be calculated on an averaged basis over a given period.
CASH BASIS
Payments are reported on a cash basis, meaning that they are reported in the period in which they are paid, as opposed to being reported on an accruals basis (which would mean that they were reported in the period for which the liabilities arise).
REPORTING CURRENCY
All amounts presented in the Report are stated in Croatian kuna. Payments made to Governments in foreign currencies (currencies other than the Croatian kuna) were translated into the equivalent Croatian kuna amount using a weighted average of the relevant exchange rates during the reporting period.
3. DEFINITIONS
PAYMENT TYPES
A single payment or multiple interconnected payments, whether in cash or in kind, for extractives activities.
PAYMENT TYPES INCLUDED IN THIS REPORT
Production entitlement: host Government’s share of production in the reporting period derived from projects operated by INA Group. This payment is generally paid in kind. The value of these payments is calculated based on the market price at the time of the in-kind payment.
Taxes: taxes and levies paid on income, production or profits, excluding taxes levied on consumption such as value added tax, excises du-ties, personal income taxes, sales taxes, and property and environmental taxes.
Royalties: payments for the rights to extract oil and gas resources, typically at set percentage of revenue less any deductions that may be taken.
Dividends: dividends, other than dividends paid to a government as an ordinary shareholder unless they are paid in lieu of a production entitlement or royalty.
Bonuses: bonuses paid for and in consideration of signature, discovery, production, awards, grants and transfers of extraction rights; bo-nuses related to achievement or failure to achieve certain production levels or targets, and the discovery of additional mineral reserves or deposits.
License and other fees: license fees, rental fees, entry fees and other considerations for licenses and/or concessions that are paid for access to the area where the extractive activities will be conducted. Administrative government fees that are not specifically related to the extractive sector, or to access to extractive resources, are excluded. Also excluded are payments made in return for services provided by a government.
Infrastructure improvements: payments for local infrastructure development, including the improvement of infrastructure, except where the infrastructure is exclusively used for operational purposes. Payments which are of a social investment in nature, for example building of a school or hospital, are excluded.
GOVERNMENT
Under the Regulations, a ‘government’ is defined as any national, regional or local authority of a country, and includes a department, agen-cy or undertaking that is a subsidiary undertaking controlled by such an authority.
4. PROJECT DEFINITION
Operational activities governed by a single contract, license, lease, concession or similar legal agreement that form the basis for payment liabilities with a Government. If multiple such agreements are substantially interconnected (meaning that the agreements are governed by a single overarching agreement, that the agreements have more or less identical terms, and that the agreements are geographically and operationally interconnected), they are considered as a single Project.
5. SUMMARY REPORT
The table below shows the relevant payments to governments made by INA Group in the year ended 31 December 2020 shown by country and payment type.
In the summary report, all amounts are stated in million HRK.
158 159
SUMMARY BY COUNTRIES:
PAYMENTS BY COUNTRIES
PRODUCTION ENTITLE-
MENTSTAXES ROYALTIES DIVIDENDS
SIGNATURE, DISCOVERY
AND PRO-DUCTION
BONUSES
LICENSE AND OTHER FEES
INFRASTRUC-TURE IM-
PROVEMENTSTOTAL
CROATIA - - 236 - 10 32 - 278
ANGOLA - 7 - - - - - 7
EGYPT 13 - - - - - - 13
TOTAL 13 7 236 - 10 32 - 298
PAYMENTS BY GOVERNMENTS
PRODUCTION ENTITLE-
MENTSTAXES ROYALTIES DIVIDENDS
SIGNATURE, DISCOVERY
AND PRO-DUCTION
BONUSES
LICENSE AND OTHER FEES
INFRASTRUC-TURE IM-
PROVEMENTS TOTAL
LOCAL MUNICIPALITIES
- - 194 - - 21 - 215
CROATIAN MINISTRY OF FINANCE
- - 42 - 10 9 - 61
HYDROCARBON AGENCY
- - - - - 2 - 2
TOTAL - - 236 - 10 32 - 278
PAYMENTS BY PROJECTS
PRODUCTION ENTITLE-
MENTSTAXES ROYALTIES DIVIDENDS
SIGNATURE, DISCOVERY
AND PRO-DUCTION
BONUSES
LICENSE AND OTHER FEES
INFRASTRUC-TURE IM-
PROVEMENTSTOTAL
CROATIA ON SHORE
- - 194 - - 16 - 210
CROATIA OFF SHORE
- - 42 - - 9 - 51
DRAVA-02 - - - - - 1 - 1
DRAVA-03 - - - - 7 2 - 9
SZH-01* - - - - 2 1 - 3
DINARIDI-14 - - - - 1 3 - 4
TOTAL - - 236 - 10 32 - 278
6. PAYMENTS TO GOVERNMENT BY COUNTRIES
CROATIA
ANGOLA
Payments by governments
PRODUCTION ENTITLE-
MENTSTAXES ROYALTIES DIVIDENDS
SIGNATURE, DISCOVERY
AND PRO-DUCTION
BONUSES
LICENCE AND OTHER FEES
INFRASTRUC-TURE IM-
PROVEMENTSTOTAL
ANGOLAN TAX AUTHORITY
- 7 - - - - - 7
TOTAL - 7 - - - - - 7
PAYMENTS BY GOVERNMENTS
PRODUCTION ENTITLE-
MENTSTAXES ROYALTIES DIVIDENDS
SIGNATURE, DISCOVERY
AND PRO-DUCTION
BONUSES
LICENCE AND OTHER FEES
INFRASTRUC-TURE IM-
PROVEMENTS TOTAL
EGYPTIAN GOVERNMENT (EGPC)
13 - - - - - - 13
TOTAL 13 - - - - - - 13
PAYMENTS BY PROJECTS
PRODUCTION ENTITLE-
MENTSTAXES ROYALTIES DIVIDENDS
SIGNATURE, DISCOVERY
AND PRO-DUCTION
BONUSES
LICENCE AND OTHER FEES
INFRASTRUC-TURE IM-
PROVEMENTS TOTAL
BLOCK 3/05 - 7 - - - - - 7
TOTAL - 7 - - - - - 7
PAYMENTS BY PROJECTS
PRODUCTION ENTITLE-
MENTSTAXES ROYALTIES DIVIDENDS
SIGNATURE, DISCOVERY
AND PRO-DUCTION
BONUSES
LICENCE AND OTHER FEES
INFRASTRUC-TURE IM-
PROVEMENTS TOTAL
EGYPT OPER-ATION - EAST YIDMA
13 - - - - - - 13
TOTAL 13 - - - - - - 13
*Sjeverozapadna Hrvatska
EGYPT
160 161
INFORMATION FOR SHAREHOLDERS CORPORATE ADDRESS
INA - Industrija nafte, d.d.Avenija Većeslava Holjevca 1010 020 ZagrebPhone: 0800 1112Web: www.ina.hr
CONTROLLING
Avenija Većeslava Holjevca 1010 020 ZagrebPhone: +385 1 459 2718Fax: + 385 1 645 2444E-mail: [email protected]
SUSTAINABLE DEVELOPMENT AND HEALTH, SAFETY AND ENVIRONMENT
Avenija Većeslava Holjevca 1010 020 ZagrebE-mail: [email protected]
CORPORATE COMMUNICATIONS AND MARKETING
Avenija Većeslava Holjevca 1010 020 ZagrebPhone: +385 1 6450 552Fax: +385 1 6452 406E-mail: [email protected]
CENTRAL DEPOSITORY AND CLEARING COMPANY
Heinzelova 62a10 000 ZagrebPhone: +385 1 4607 300Web: www.skdd.hr
ZAGREB STOCK EXCHANGE
Ivana Lučića 2a10 000 ZagrebPhone: +385 1 4686 800Web: www.zse.hr
ANNOUNCEMENTS
The company publishes its announcements on INA’s website: www.ina.hr, at Zagreb Stock Exchange’s website: http://www.zse.hr and on Croatian News Agency’s website: www.hina.hr

162 163
070

INA - INDUSTRIJA NAFTE, d.d.
Content
Page
Responsibility for the Financial Statements 165
Independent Auditors' Report 166
INA Group Consolidated Statement of Profit or Loss 172
INA Group Consolidated Statement of Other Comprehensive Income 173
INA, d.d. Separate Statement of Profit or Loss 174
INA, d.d. Separate Statement of Other Comprehensive Income 175
INA Group Consolidated Statement of Financial Position 176
INA, d.d. Separate Statement of Financial Position 178
INA Group Consolidated Statement of Changes in Equity 180
INA, d.d. Separate Statement of Changes in Equity 181
INA Group Consolidated Statement of Cash Flows 182
INA, d.d. Separate Statement of Cash Flows 184
Notes to Financial Statements 186

165
166
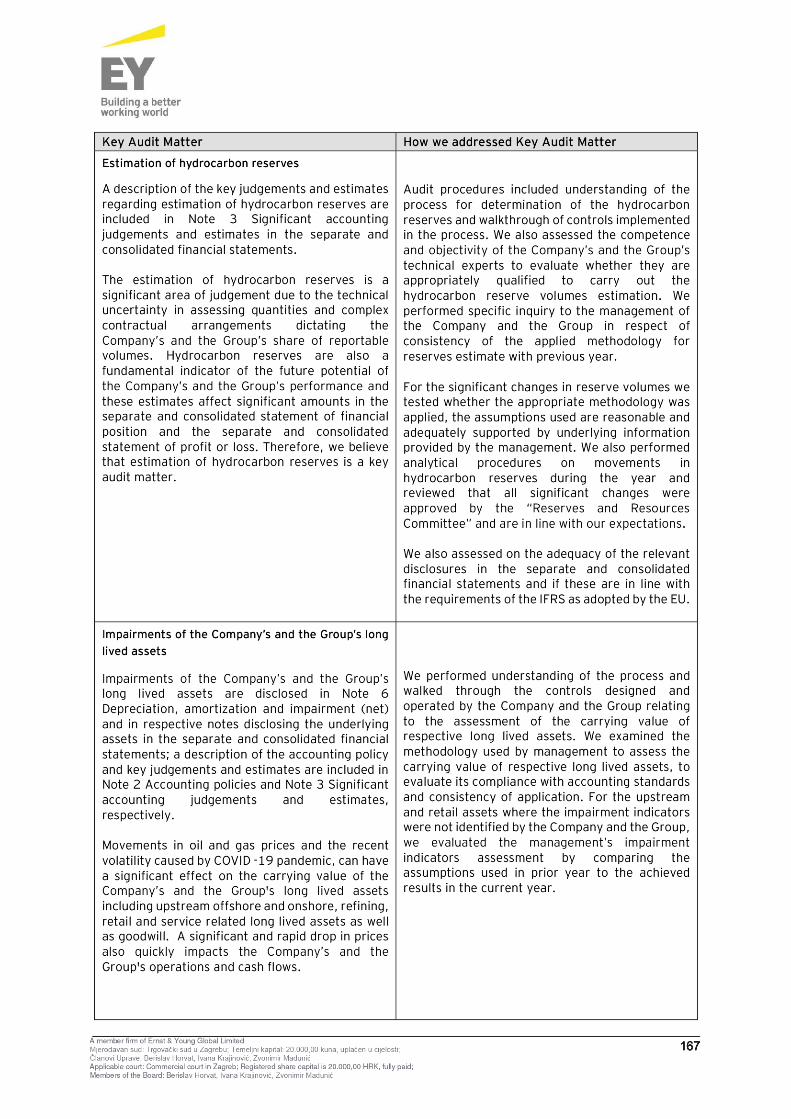
167
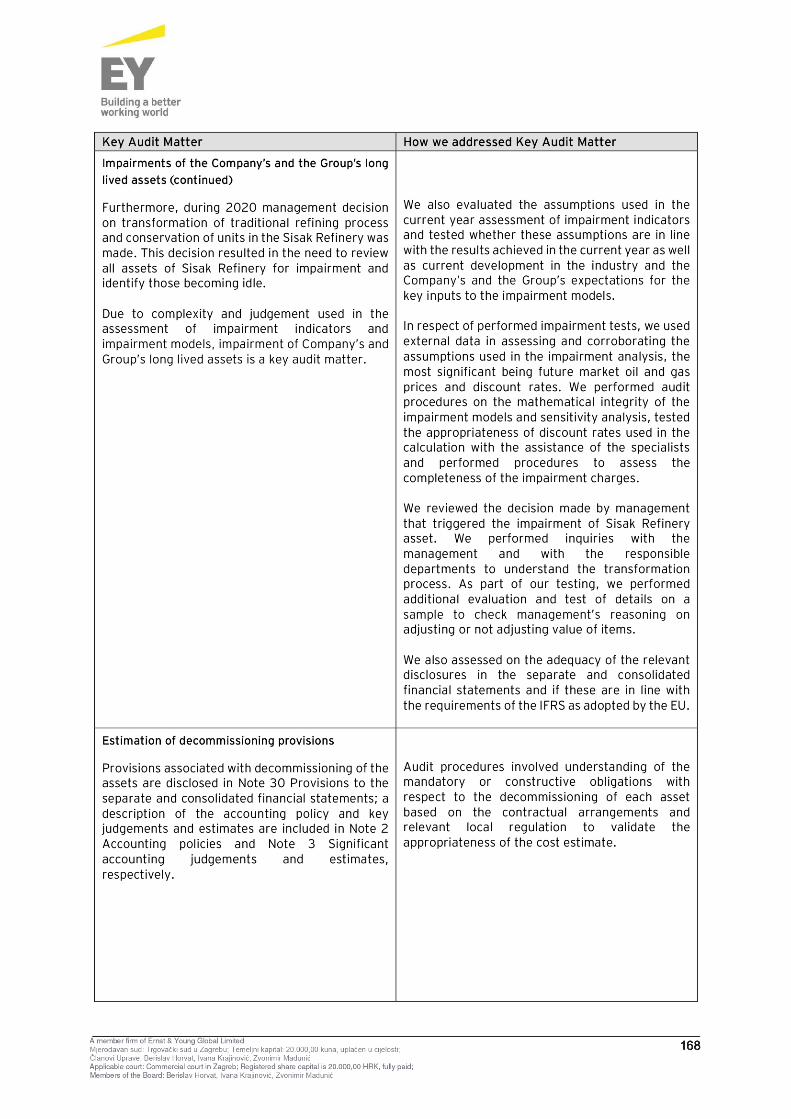
168
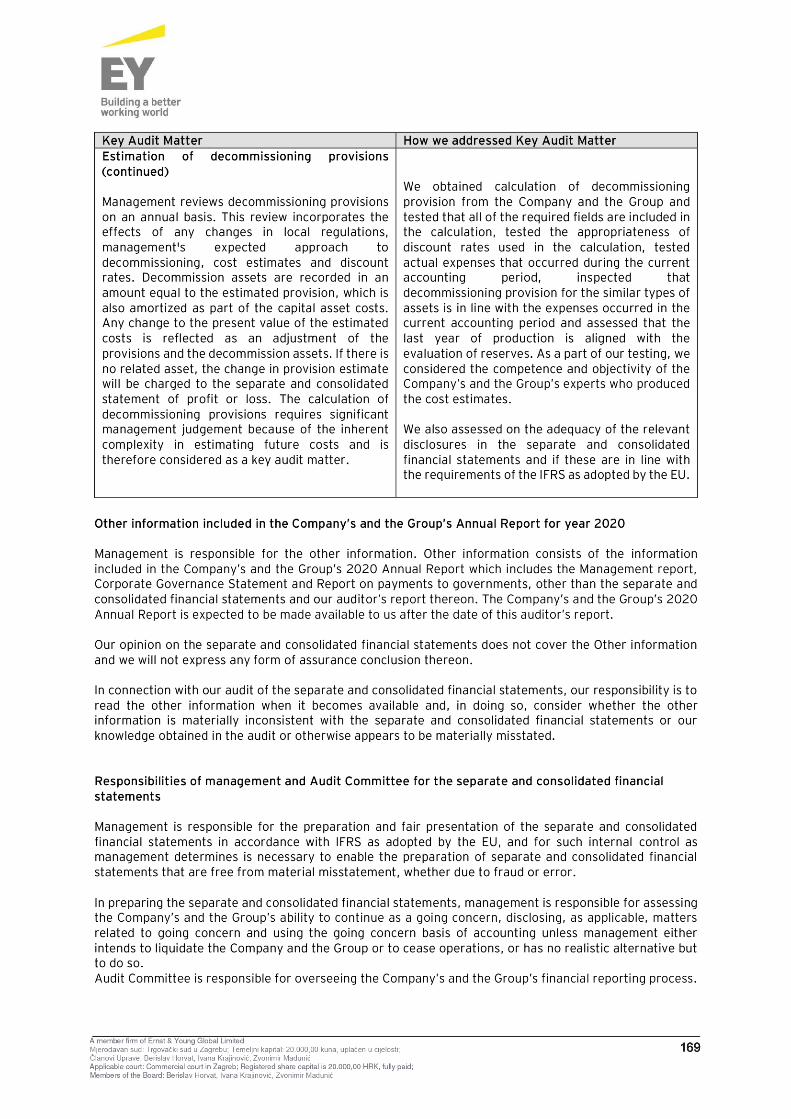
169
170

171

INA - INDUSTRIJA NAFTE, d.d.
INA Group Consolidated Statement of Profit or Loss
For the year ended 31 December 2020
(all amounts are presented in HRK millions)
INA - Industrija nafte, d.d. 172
Year ended Year ended
Note 31 December 2020 31 December 2019
Revenue from contracts with customers 4 14,788 22,597
Capitalised value of own performance
286 466 Other operating income 5
181 234
Total operating income
15,255 23,297
Changes in inventories of finished products and work in progress
(686) (160)
Cost of raw materials and consumables
(5,710) (8,460)
Depreciation, amortisation and impairment (net) 6
(2,289) (2,134)
Other material costs
(1,874) (2,125)
Service costs
(465) (629)
Staff costs 7
(1,731) (1,970)
Cost of other goods sold
(3,699) (7,114) Impairment charges (net) 8 (108) (109)
Provision for charges and risks (net) 9
9 126
Total operating expenses
(16,553) (22,575)
(Loss)/Profit from operations
(1,298) 722
Finance income 10
165 104 Finance costs 10
(233) (177)
Net loss from financial activities
(68) (73)
Share of profit of joint ventures accounted for using the equity method
16
94
10
(Loss)/Profit before tax
(1,272) 659
Income tax gain/(expense) 11
135 (170)
(Loss)/Profit for the year
(1,137) 489
Attributable to:
Owners of the Company
(1,138) 486
Non-controlling interests 1 3
(1,137) 489
(Loss)/Earnings per share
Basic and diluted (loss)/earnings per share (HRK per share) 12 (113.82) 48.52
The accompanying accounting policies and notes form an integral part of this consolidated statement of profit or loss.

INA - INDUSTRIJA NAFTE, d.d.
INA Group Consolidated Statement of Other Comprehensive Income
For the year ended 31 December 2020
(all amounts are presented in HRK millions)
INA - Industrija nafte, d.d. 173
Year ended Year ended
Note 31 December 2020 31 December 2019
(Loss)/Profit for the year (1,137) 489
Other comprehensive income, net of income tax:
Items that will not be reclassified subsequently to profit or loss:
Remeasurement of defined benefit obligation 34 2 12
Items that may be reclassified subsequently to profit or loss:
Exchange differences on translating foreign operations 34 (60) 34
(Loss)/Gain on non-current financial assets 33 (39) 106
Other comprehensive (loss)/gain, net of income tax (97) 152
Total comprehensive (loss)/income for the year (1,234) 641
Attributable to:
Owners of the Company (1,235) 638
Non-controlling interests 1 3
The accompanying accounting policies and notes form an integral part of this consolidated statement of other
comprehensive income.

INA - INDUSTRIJA NAFTE, d.d.
INA, d.d. Separate Statement of Profit or Loss
For the year ended 31 December 2020
(all amounts are presented in HRK millions)
INA - Industrija nafte, d.d. 174
Year ended Year ended
Note 31 December 2020 31 December 2019
Revenue from contracts with customers 4
13,758
21,096
Capitalised value of own performance 28 14
Other operating income 5
166 320
Total operating income 13,952 21,430
Changes in inventories of finished products and work in progress
(660)
(179)
Cost of raw materials and consumables
(5,665) (8,348)
Depreciation, amortisation and impairment (net) 6
(1,963) (1,825) Other material costs
(1,834) (1,927) Service costs
(728) (859) Staff costs 7
(803) (918) Cost of other goods sold
(3,344) (6,577)
Impairment charges (net) 8
(80) (79) Provision for charges and risks (net) 9
11 56
Total operating expenses
(15,066) (20,656)
(Loss)/Profit from operations
(1,114) 774
Finance income 10 175 173 Finance costs 10
(202) (155)
Net (loss)/gain from financial activities (27) 18
Share of profit of joint ventures accounted for using the equity method
94
10
(Loss)/Profit before tax (1,047) 802
Income tax gain/(expense) 11 114 (146)
(Loss)/Profit for the year
(933) 656
The accompanying accounting policies and notes form an integral part of this separate statement of profit or loss.

INA - INDUSTRIJA NAFTE, d.d.
INA, d.d. Separate Statement of Other Comprehensive Income
For the year ended 31 December 2020
(all amounts are presented in HRK millions)
INA - Industrija nafte, d.d. 175
Year ended Year ended
Note 31 December 2020 31 December 2019
(Loss)/Profit for the year (933) 656
Other comprehensive income, net of income tax:
Items that will not be reclassified subsequently to profit or loss:
Remeasurement of defined benefit obligation 34 - 12
Items that may be reclassified subsequently to profit or loss:
Exchange differences on translating foreign operations 34 (43) 18
(Loss)/Gain on non-current financial assets 33 (39) 106
Other comprehensive (loss)/gain, net of income tax
(82) 136
Total comprehensive (loss)/income for the year
(1,015) 792
The accompanying accounting policies and notes form an integral part of this separate statement of other
comprehensive income.
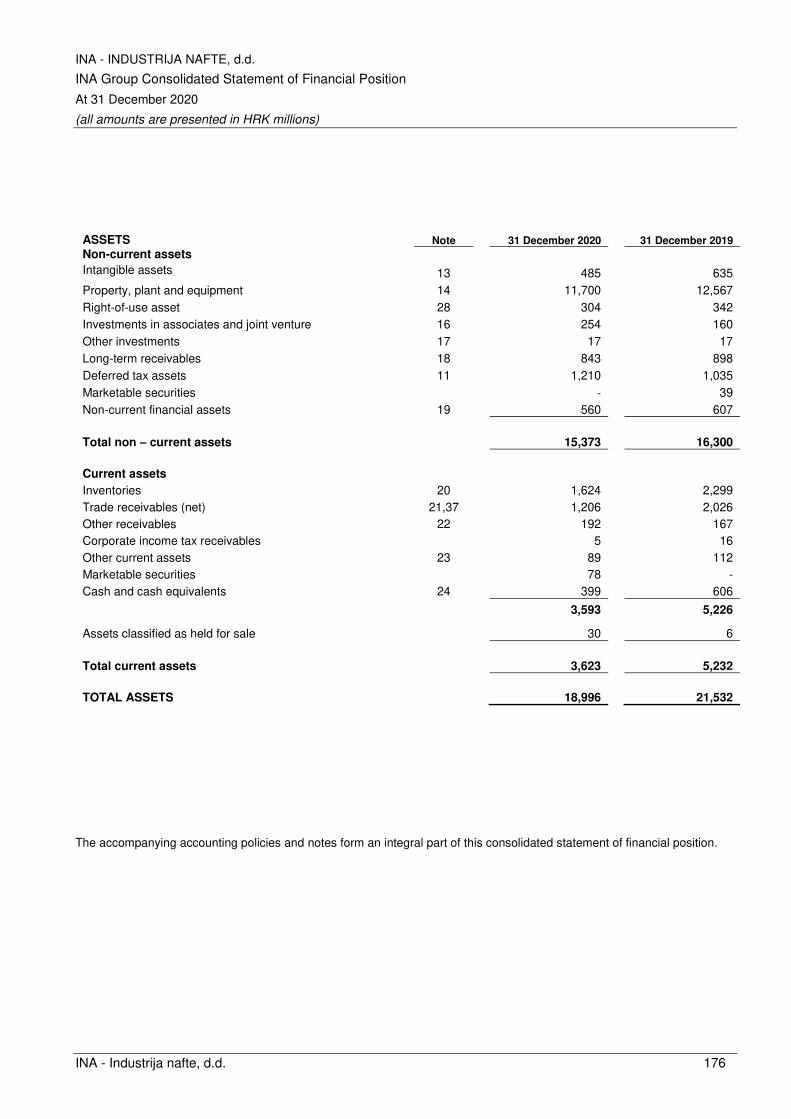
INA - INDUSTRIJA NAFTE, d.d.
INA Group Consolidated Statement of Financial Position
At 31 December 2020
(all amounts are presented in HRK millions)
INA - Industrija nafte, d.d. 176
ASSETS Note 31 December 2020 31 December 2019
Non-current assets
Intangible assets 13 485 635
Property, plant and equipment 14 11,700 12,567
Right-of-use asset 28 304 342
Investments in associates and joint venture 16 254 160
Other investments 17 17 17
Long-term receivables 18 843 898
Deferred tax assets 11 1,210 1,035
Marketable securities - 39
Non-current financial assets 19 560 607
Total non – current assets 15,373 16,300
Current assets
Inventories 20 1,624 2,299
Trade receivables (net) 21,37 1,206 2,026
Other receivables 22 192 167
Corporate income tax receivables 5 16
Other current assets 23 89 112
Marketable securities 78 -
Cash and cash equivalents 24 399 606
3,593 5,226
Assets classified as held for sale 30 6
Total current assets 3,623 5,232
TOTAL ASSETS 18,996 21,532
The accompanying accounting policies and notes form an integral part of this consolidated statement of financial position.
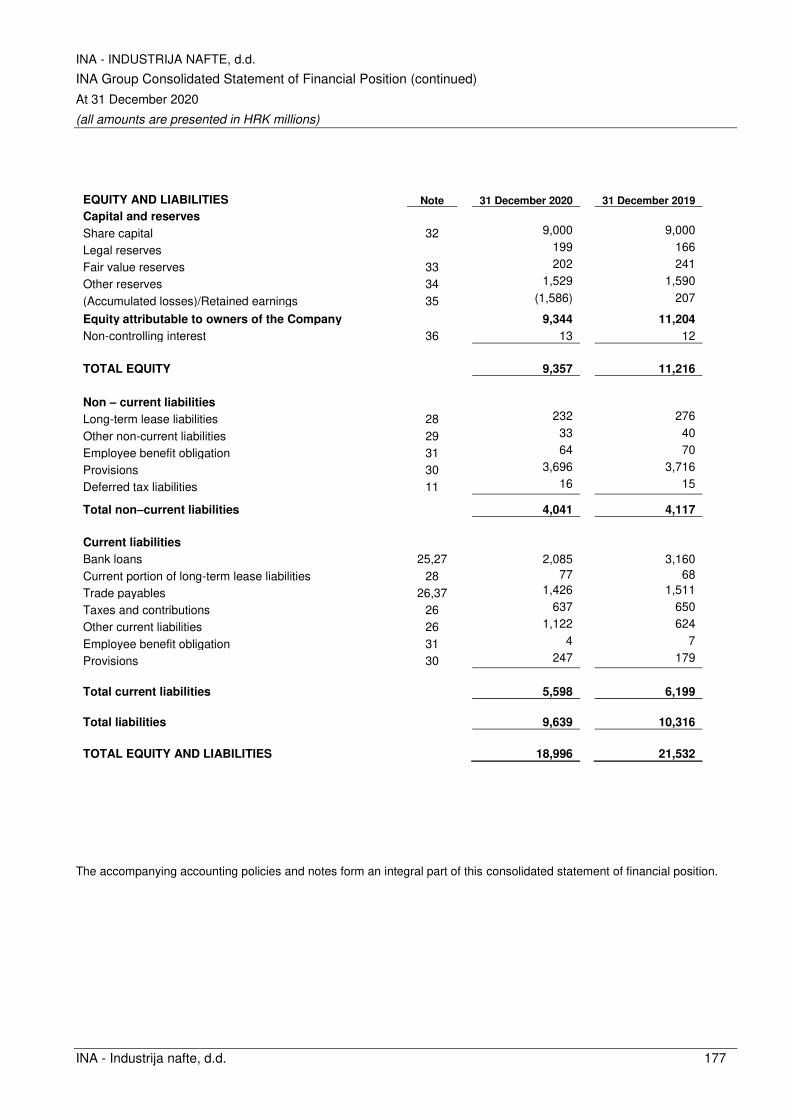
INA - INDUSTRIJA NAFTE, d.d.
INA Group Consolidated Statement of Financial Position (continued)
At 31 December 2020
(all amounts are presented in HRK millions)
INA - Industrija nafte, d.d. 177
EQUITY AND LIABILITIES Note 31 December 2020 31 December 2019
Capital and reserves
Share capital 32 9,000
9,000
Legal reserves
199
166
Fair value reserves 33 202
241
Other reserves 34 1,529
1,590
(Accumulated losses)/Retained earnings 35 (1,586)
207
Equity attributable to owners of the Company 9,344 11,204
Non-controlling interest 36 13 12
TOTAL EQUITY 9,357 11,216
Non – current liabilities
Long-term lease liabilities 28 232
276
Other non-current liabilities 29 33
40
Employee benefit obligation 31 64
70
Provisions 30 3,696
3,716
Deferred tax liabilities 11 16
15
Total non–current liabilities 4,041 4,117
Current liabilities
Bank loans 25,27 2,085 3,160
Current portion of long-term lease liabilities 28 77 68
Trade payables 26,37 1,426
1,511
Taxes and contributions 26 637
650
Other current liabilities 26 1,122
624
Employee benefit obligation 31 4
7
Provisions 30 247
179
Total current liabilities 5,598 6,199
Total liabilities 9,639 10,316
TOTAL EQUITY AND LIABILITIES 18,996 21,532
The accompanying accounting policies and notes form an integral part of this consolidated statement of financial position.
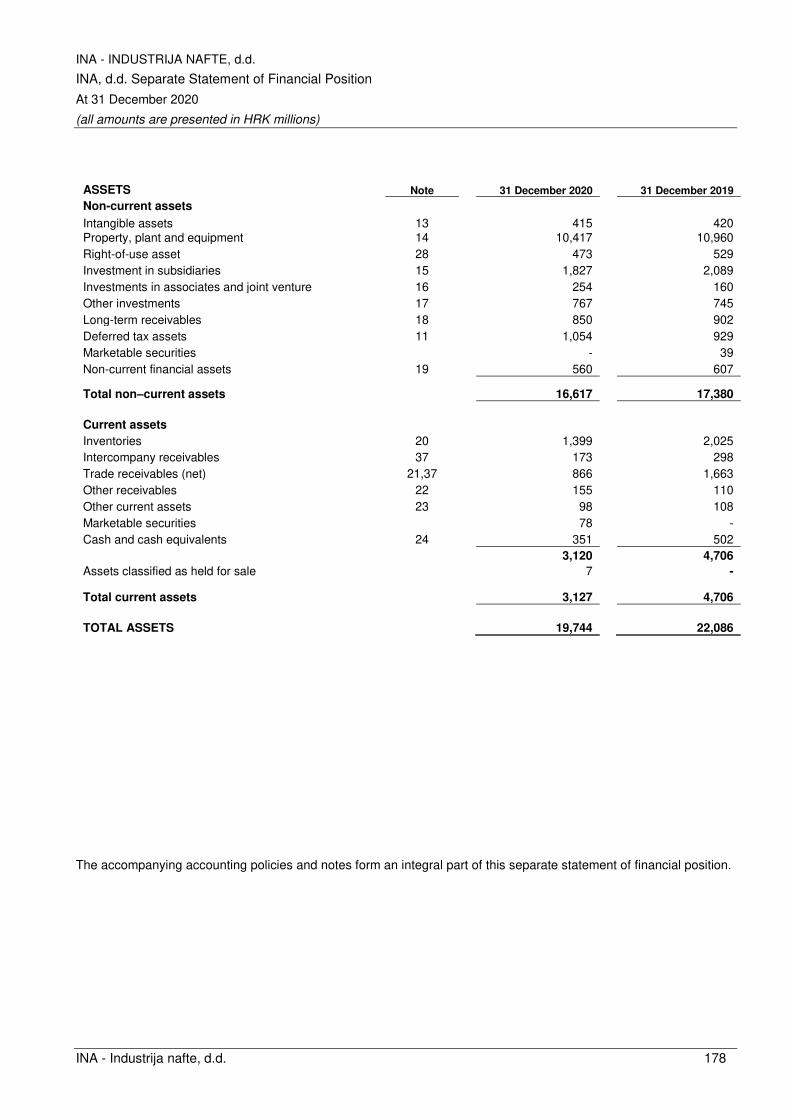
INA - INDUSTRIJA NAFTE, d.d.
INA, d.d. Separate Statement of Financial Position
At 31 December 2020
(all amounts are presented in HRK millions)
INA - Industrija nafte, d.d. 178
ASSETS Note 31 December 2020 31 December 2019
Non-current assets
Intangible assets 13 415 420
Property, plant and equipment 14 10,417 10,960
Right-of-use asset 28 473 529
Investment in subsidiaries 15 1,827 2,089
Investments in associates and joint venture 16 254 160
Other investments 17 767 745
Long-term receivables 18 850 902
Deferred tax assets 11 1,054 929
Marketable securities - 39
Non-current financial assets 19 560 607
Total non–current assets 16,617 17,380
Current assets
Inventories 20 1,399 2,025
Intercompany receivables 37 173 298
Trade receivables (net) 21,37 866 1,663
Other receivables 22 155 110
Other current assets 23 98 108
Marketable securities 78 -
Cash and cash equivalents 24 351 502
3,120 4,706
Assets classified as held for sale 7 -
Total current assets 3,127 4,706
TOTAL ASSETS 19,744 22,086
The accompanying accounting policies and notes form an integral part of this separate statement of financial position.
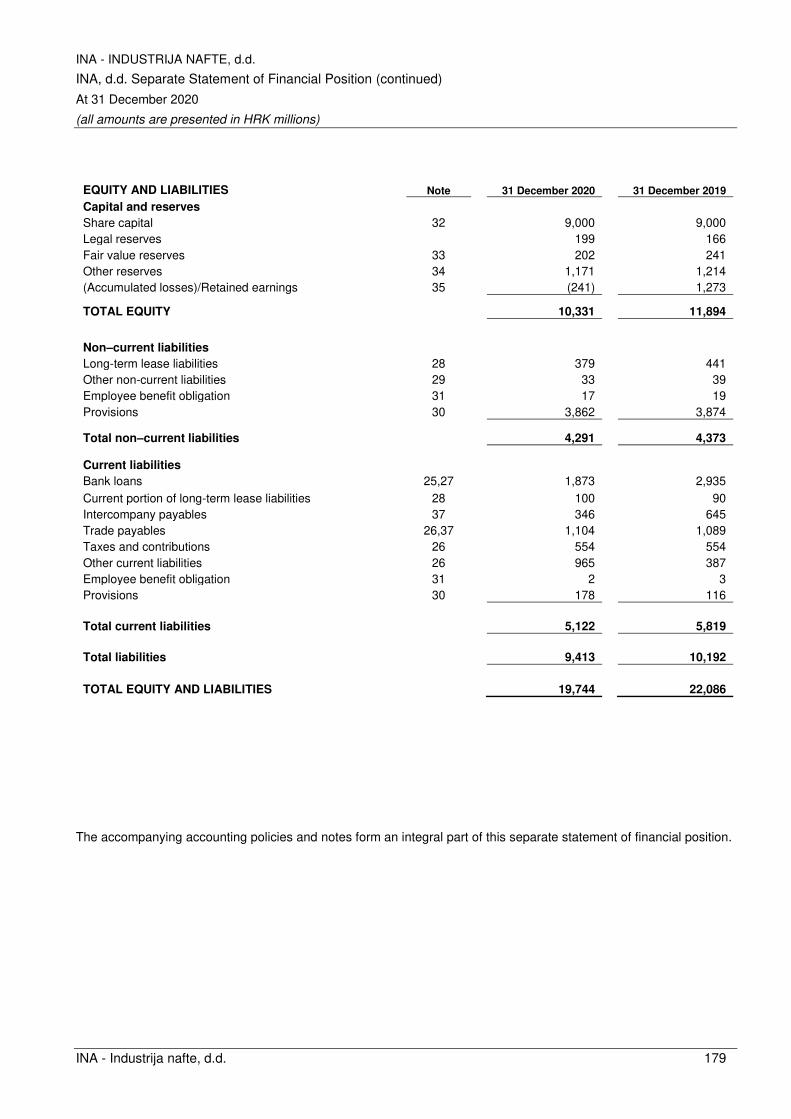
INA - INDUSTRIJA NAFTE, d.d.
INA, d.d. Separate Statement of Financial Position (continued)
At 31 December 2020
(all amounts are presented in HRK millions)
INA - Industrija nafte, d.d. 179
EQUITY AND LIABILITIES Note 31 December 2020 31 December 2019
Capital and reserves
Share capital 32 9,000 9,000
Legal reserves 199 166
Fair value reserves 33 202 241
Other reserves 34 1,171 1,214
(Accumulated losses)/Retained earnings 35 (241) 1,273
TOTAL EQUITY 10,331 11,894
Non–current liabilities
Long-term lease liabilities 28 379 441
Other non-current liabilities 29 33 39
Employee benefit obligation 31 17 19
Provisions 30 3,862 3,874
Total non–current liabilities 4,291 4,373
Current liabilities
Bank loans 25,27 1,873 2,935
Current portion of long-term lease liabilities 28 100 90
Intercompany payables 37 346 645
Trade payables 26,37 1,104 1,089
Taxes and contributions 26 554 554
Other current liabilities 26 965 387
Employee benefit obligation 31 2 3
Provisions 30 178 116
Total current liabilities 5,122 5,819
Total liabilities 9,413 10,192
TOTAL EQUITY AND LIABILITIES 19,744 22,086
The accompanying accounting policies and notes form an integral part of this separate statement of financial position.
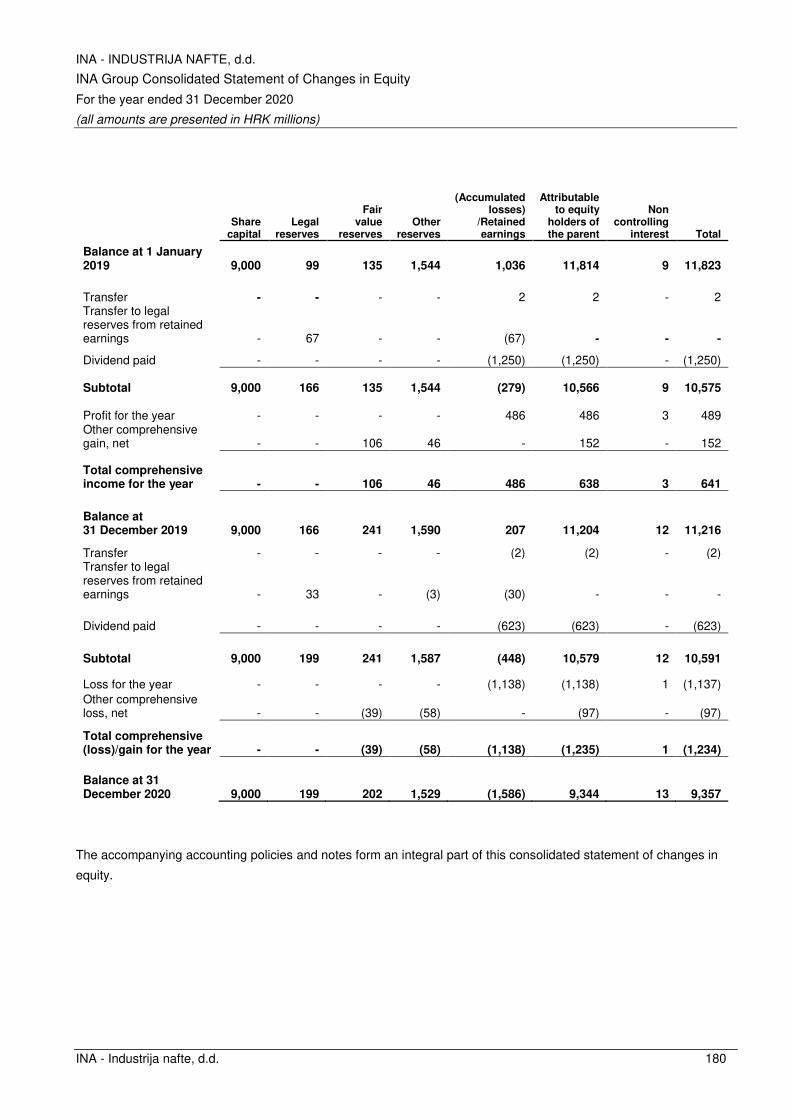
INA - INDUSTRIJA NAFTE, d.d.
INA Group Consolidated Statement of Changes in Equity
For the year ended 31 December 2020
(all amounts are presented in HRK millions)
INA - Industrija nafte, d.d. 180
Share capital
Legal reserves
Fair value
reserves Other
reserves
(Accumulated
losses) /Retained earnings
Attributable to equity
holders of the parent
Non controlling
interest Total
Balance at 1 January 2019 9,000 99 135 1,544 1,036 11,814 9 11,823
Transfer - - - - 2 2 - 2 Transfer to legal reserves from retained earnings - 67 - - (67) - - -
Dividend paid - - - - (1,250) (1,250) - (1,250)
Subtotal 9,000 166 135 1,544 (279) 10,566 9 10,575
Profit for the year - - - - 486 486 3 489 Other comprehensive gain, net - - 106 46 - 152 - 152
Total comprehensive income for the year - - 106 46 486 638 3 641
Balance at 31 December 2019 9,000 166 241 1,590 207 11,204 12 11,216
Transfer - - - - (2) (2) - (2) Transfer to legal reserves from retained earnings - 33 - (3) (30) - - -
Dividend paid - - - - (623) (623) - (623)
Subtotal 9,000 199 241 1,587 (448) 10,579 12 10,591
Loss for the year - - - - (1,138) (1,138) 1 (1,137)
Other comprehensive loss, net - - (39) (58) - (97) - (97)
Total comprehensive (loss)/gain for the year - - (39) (58) (1,138) (1,235) 1 (1,234)
Balance at 31 December 2020 9,000 199 202 1,529 (1,586) 9,344 13 9,357
The accompanying accounting policies and notes form an integral part of this consolidated statement of changes in
equity.
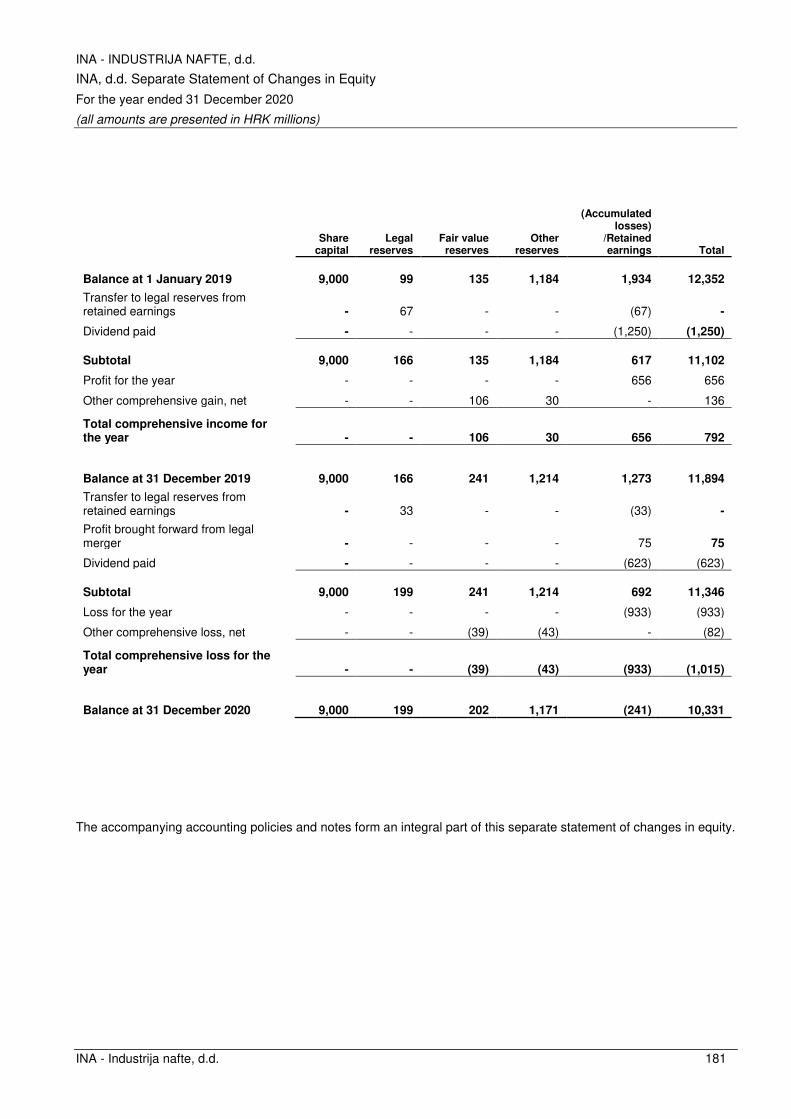
INA - INDUSTRIJA NAFTE, d.d.
INA, d.d. Separate Statement of Changes in Equity
For the year ended 31 December 2020
(all amounts are presented in HRK millions)
INA - Industrija nafte, d.d. 181
Share capital
Legal reserves
Fair value reserves
Other reserves
(Accumulated
losses) /Retained earnings Total
Balance at 1 January 2019 9,000 99 135 1,184 1,934 12,352
Transfer to legal reserves from retained earnings - 67 - - (67) -
Dividend paid - - - - (1,250) (1,250)
Subtotal 9,000 166 135 1,184 617 11,102
Profit for the year - - - - 656 656
Other comprehensive gain, net - - 106 30 - 136
Total comprehensive income for the year - - 106 30 656 792
Balance at 31 December 2019 9,000 166 241 1,214 1,273 11,894
Transfer to legal reserves from retained earnings - 33 - - (33) -
Profit brought forward from legal merger - - - - 75 75
Dividend paid - - - - (623) (623)
Subtotal 9,000 199 241 1,214 692 11,346
Loss for the year - - - - (933) (933)
Other comprehensive loss, net - - (39) (43) - (82)
Total comprehensive loss for the year - - (39) (43) (933) (1,015)
Balance at 31 December 2020 9,000 199 202 1,171 (241) 10,331
The accompanying accounting policies and notes form an integral part of this separate statement of changes in equity.
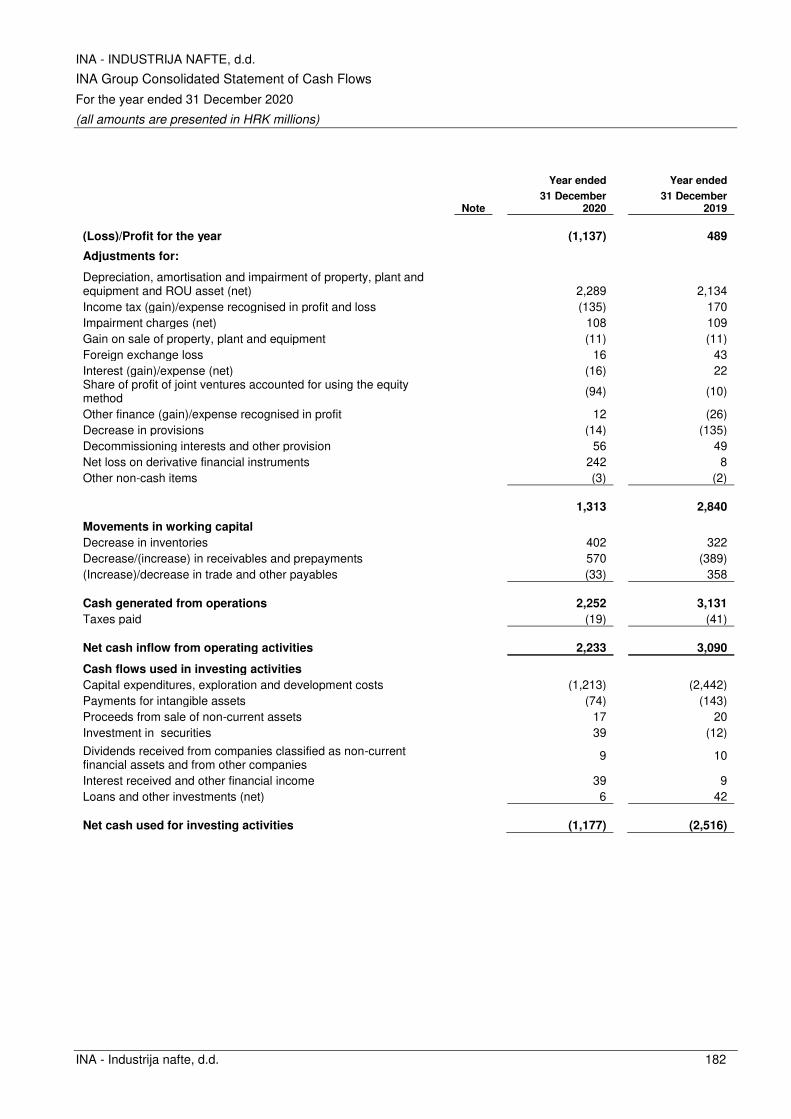
INA - INDUSTRIJA NAFTE, d.d.
INA Group Consolidated Statement of Cash Flows
For the year ended 31 December 2020
(all amounts are presented in HRK millions)
INA - Industrija nafte, d.d. 182
Year ended Year ended
Note
31 December 2020
31 December 2019
(Loss)/Profit for the year (1,137) 489
Adjustments for:
Depreciation, amortisation and impairment of property, plant and equipment and ROU asset (net)
2,289 2,134
Income tax (gain)/expense recognised in profit and loss (135) 170
Impairment charges (net) 108 109
Gain on sale of property, plant and equipment (11) (11)
Foreign exchange loss 16 43
Interest (gain)/expense (net) (16) 22
Share of profit of joint ventures accounted for using the equity method
(94) (10)
Other finance (gain)/expense recognised in profit 12 (26)
Decrease in provisions (14) (135)
Decommissioning interests and other provision 56 49
Net loss on derivative financial instruments 242 8
Other non-cash items (3) (2)
1,313 2,840
Movements in working capital
Decrease in inventories 402 322
Decrease/(increase) in receivables and prepayments 570 (389)
(Increase)/decrease in trade and other payables (33) 358
Cash generated from operations 2,252 3,131
Taxes paid (19) (41)
Net cash inflow from operating activities 2,233 3,090
Cash flows used in investing activities
Capital expenditures, exploration and development costs (1,213) (2,442)
Payments for intangible assets (74) (143)
Proceeds from sale of non-current assets 17 20
Investment in securities 39 (12)
Dividends received from companies classified as non-current financial assets and from other companies
9 10
Interest received and other financial income 39 9
Loans and other investments (net) 6 42
Net cash used for investing activities (1,177) (2,516)

INA - INDUSTRIJA NAFTE, d.d.
INA Group Consolidated Statement of Cash Flows
For the year ended 31 December 2020
(all amounts are presented in HRK millions)
INA - Industrija nafte, d.d. 183
Year ended Year ended
Note
31 December 2020
31 December 2019
Cash flows from financing activities
Change in long-term borrowings (332) 208
Change in short-term borrowings (net) (685) 823
Payment of principal portion of lease liabilities (net) (70) (60)
Dividends paid (38) (1,250)
Interest paid on long-term loans - (1)
Interest paid on short-term loans and other interest charges
(97) (121)
Net cash used in financing activities (1,222) (401)
Net increase/(decrease) in cash and cash equivalents (166) 173
At 1 January 606 422
Effect of foreign exchange rate changes (36) 6
At 31 December 24 404 601
Overdrafts (5) 5
Cash and cash equivalents in statement of financial position
399 606
The accompanying accounting policies and notes form an integral part of this consolidated statement of cash flow.
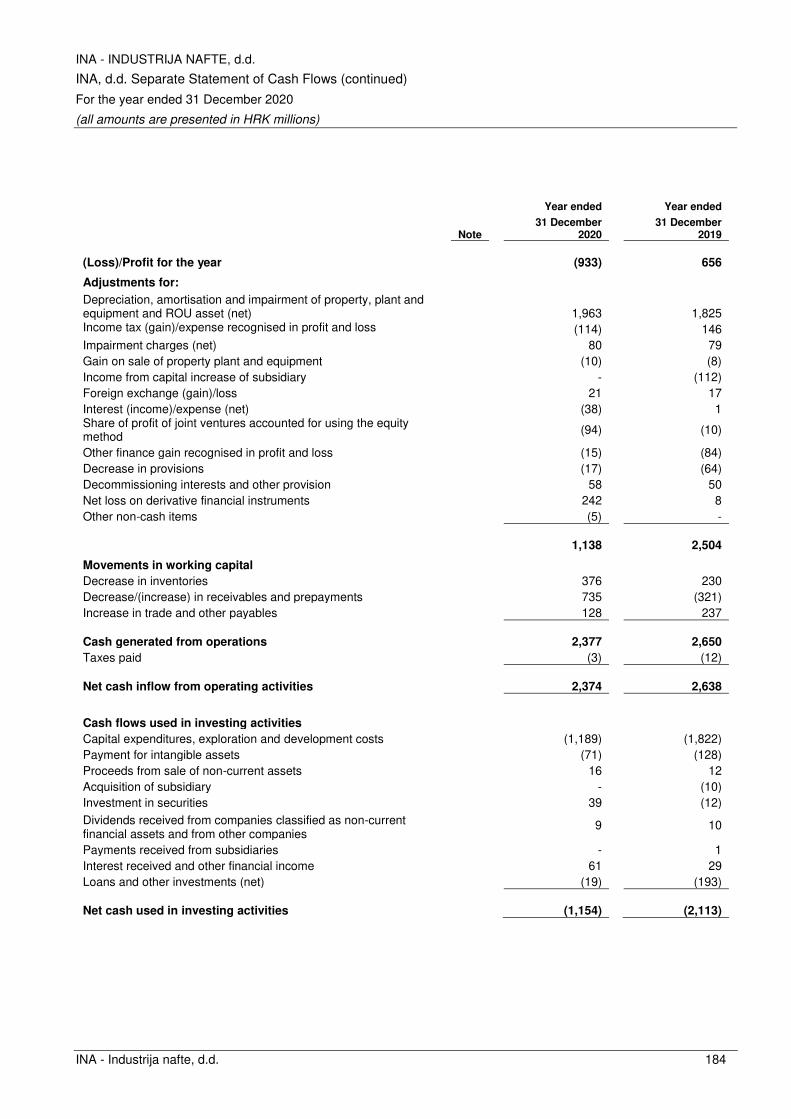
INA - INDUSTRIJA NAFTE, d.d.
INA, d.d. Separate Statement of Cash Flows (continued)
For the year ended 31 December 2020
(all amounts are presented in HRK millions)
INA - Industrija nafte, d.d. 184
Year ended Year ended
Note
31 December 2020
31 December 2019
(Loss)/Profit for the year (933) 656
Adjustments for:
Depreciation, amortisation and impairment of property, plant and equipment and ROU asset (net)
1,963 1,825 Income tax (gain)/expense recognised in profit and loss
(114) 146
Impairment charges (net) 80 79
Gain on sale of property plant and equipment (10) (8)
Income from capital increase of subsidiary - (112)
Foreign exchange (gain)/loss 21 17
Interest (income)/expense (net) (38) 1
Share of profit of joint ventures accounted for using the equity method
(94) (10)
Other finance gain recognised in profit and loss (15) (84)
Decrease in provisions (17) (64)
Decommissioning interests and other provision 58 50
Net loss on derivative financial instruments 242 8
Other non-cash items (5) -
1,138 2,504
Movements in working capital
Decrease in inventories 376 230
Decrease/(increase) in receivables and prepayments 735 (321)
Increase in trade and other payables 128 237
Cash generated from operations 2,377 2,650
Taxes paid (3) (12)
Net cash inflow from operating activities 2,374 2,638
Cash flows used in investing activities
Capital expenditures, exploration and development costs (1,189) (1,822)
Payment for intangible assets (71) (128)
Proceeds from sale of non-current assets 16 12
Acquisition of subsidiary - (10)
Investment in securities 39 (12)
Dividends received from companies classified as non-current financial assets and from other companies
9 10
Payments received from subsidiaries - 1
Interest received and other financial income 61 29
Loans and other investments (net) (19) (193)
Net cash used in investing activities (1,154) (2,113)

INA - INDUSTRIJA NAFTE, d.d.
INA, d.d. Separate Statement of Cash Flows (continued)
For the year ended 31 December 2020
(all amounts are presented in HRK millions)
INA - Industrija nafte, d.d. 185
Year ended Year ended
Note
31 December 2020
31 December 2019
Cash flows from financing activities
Change in long-term borrowings (332) 208
Change in short-term borrowings (net) (783) 885
Payment of principal portion of lease liabilities (96) (80)
Dividends paid (38) (1,250)
Interest paid on long-term loans - (1)
Interest paid on short-term loans and other interest charges
(97) (123)
Net cash used in financing activities (1,346) (361)
Net increase/(decrease) in cash and cash equivalents (126) 164
At 1 January 502 335
Effect of foreign exchange rate changes (25) 3
At 31 December 24 351 502
The accompanying accounting policies and notes form an integral part of this separate statement of cash flow.
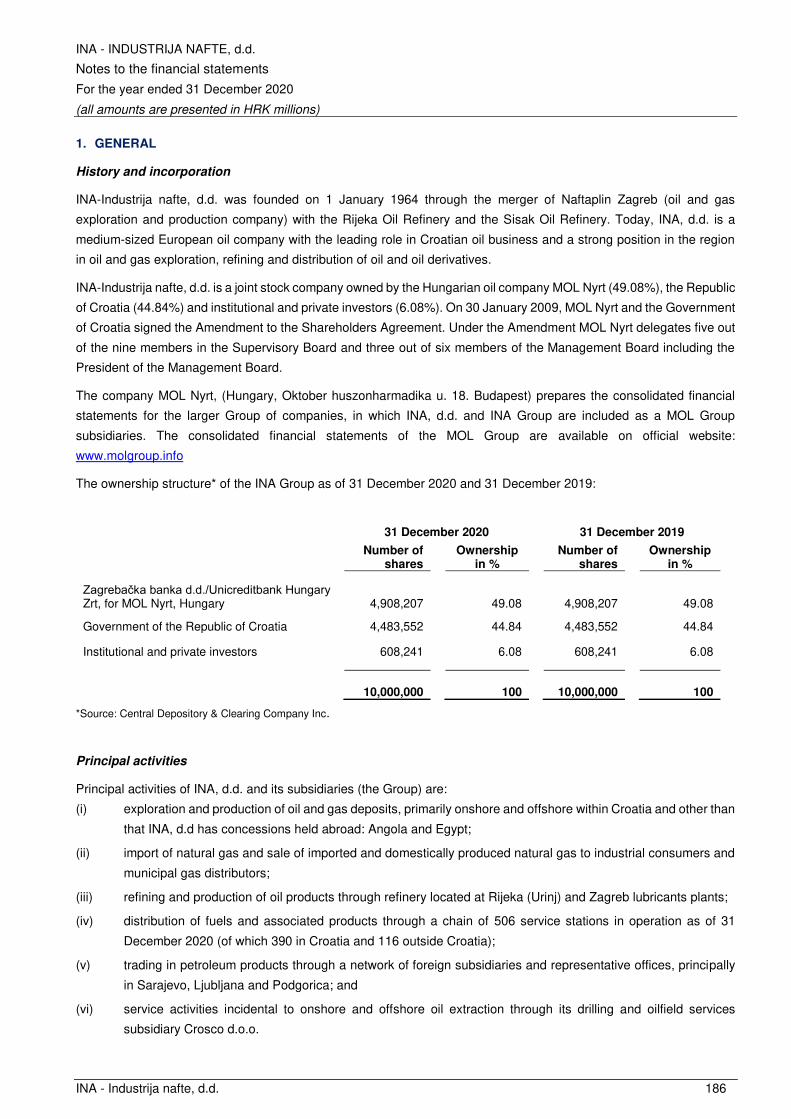
INA - INDUSTRIJA NAFTE, d.d.
Notes to the financial statements
For the year ended 31 December 2020
(all amounts are presented in HRK millions)
INA - Industrija nafte, d.d. 186
1. GENERAL
History and incorporation
INA-Industrija nafte, d.d. was founded on 1 January 1964 through the merger of Naftaplin Zagreb (oil and gas
exploration and production company) with the Rijeka Oil Refinery and the Sisak Oil Refinery. Today, INA, d.d. is a
medium-sized European oil company with the leading role in Croatian oil business and a strong position in the region
in oil and gas exploration, refining and distribution of oil and oil derivatives.
INA-Industrija nafte, d.d. is a joint stock company owned by the Hungarian oil company MOL Nyrt (49.08%), the Republic
of Croatia (44.84%) and institutional and private investors (6.08%). On 30 January 2009, MOL Nyrt and the Government
of Croatia signed the Amendment to the Shareholders Agreement. Under the Amendment MOL Nyrt delegates five out
of the nine members in the Supervisory Board and three out of six members of the Management Board including the
President of the Management Board.
The company MOL Nyrt, (Hungary, Oktober huszonharmadika u. 18. Budapest) prepares the consolidated financial
statements for the larger Group of companies, in which INA, d.d. and INA Group are included as a MOL Group
subsidiaries. The consolidated financial statements of the MOL Group are available on official website:
www.molgroup.info
The ownership structure* of the INA Group as of 31 December 2020 and 31 December 2019:
31 December 2020 31 December 2019
Number of shares
Ownership in %
Number of shares
Ownership in %
Zagrebačka banka d.d./Unicreditbank Hungary Zrt, for MOL Nyrt, Hungary 4,908,207 49.08 4,908,207 49.08
Government of the Republic of Croatia 4,483,552 44.84 4,483,552 44.84
Institutional and private investors 608,241 6.08 608,241 6.08
10,000,000 100 10,000,000 100
*Source: Central Depository & Clearing Company Inc.
Principal activities
Principal activities of INA, d.d. and its subsidiaries (the Group) are:
(i) exploration and production of oil and gas deposits, primarily onshore and offshore within Croatia and other than
that INA, d.d has concessions held abroad: Angola and Egypt;
(ii) import of natural gas and sale of imported and domestically produced natural gas to industrial consumers and
municipal gas distributors;
(iii) refining and production of oil products through refinery located at Rijeka (Urinj) and Zagreb lubricants plants;
(iv) distribution of fuels and associated products through a chain of 506 service stations in operation as of 31
December 2020 (of which 390 in Croatia and 116 outside Croatia);
(v) trading in petroleum products through a network of foreign subsidiaries and representative offices, principally
in Sarajevo, Ljubljana and Podgorica; and
(vi) service activities incidental to onshore and offshore oil extraction through its drilling and oilfield services
subsidiary Crosco d.o.o.
INA - INDUSTRIJA NAFTE, d.d.
Notes to the financial statements (continued)
For the year ended 31 December 2020
(all amounts are presented in HRK millions)
INA - Industrija nafte, d.d. 187
1. GENERAL (CONTINUED)
The Group has dominant positions in Croatia over oil and gas exploration and production, oil refining, and the sale of
gas and petroleum products. INA, d.d. also holds an 11.795% interest in JANAF d.d., the company that owns and
operates the Adria pipeline system.
Headquarter of the Group is located in Zagreb, Avenija V. Holjevca 10, Croatia. As at 31 December 2020, there were
9,829 employees at the Group (10,575 as at 31 December 2019). As at 31 December 2020, there were 3,411 employees
at INA, d.d. (3,677 as at 31 December 2019).
During 2020, the average number of employees of the INA Group was 10,174 (2019: 10,758 employees), while the
average number of employees of INA, d.d. was 3,536 (2019: 3,863 employees).
The Group comprises a number of wholly and partially owned subsidiaries operating largely within the Republic of
Croatia. Foreign subsidiaries include a number of trading subsidiaries that generally act as distributors of INA Group
products and as representative offices within their local markets.
Supervisory Board, Management Board and Council of Directors at the date of approval of these financial
statements
Supervisory Board
Damir Vanđelić President of the Supervisory Board (since 19 December 2016 until 17 June 2021)
József Molnár Vice President of the Supervisory Board (since 14 June 2017 until 17 December 2024)
Luka Burilović Member of the Supervisory Board (since 14 June 2017 until 17 June 2021)
Damir Mikuljan Member of the Supervisory Board (since 14 June 2017 until 17 June 2021)
László Uzsoki Member of the Supervisory Board (since 14 June 2017 until 17 December 2024)
Zsuzsanna Ortutay Member of the Supervisory Board (since 18 December 2020 until 17 December 2024)
Gabriel Szabó Member of the Supervisory Board (since 18 December 2020 until 17 December 2024)
Domokos Szollár Member of the Supervisory Board (since 18 December 2020 until 17 December 2024)
Jasna Pipunić Representative of employees in the Supervisory Board (since 5 May 2020 until 5 May
2024)
Management Board
Sándor Fasimon
Niko Dalić
President of the Management Board (since 1 July 2018 until 31 March 2024)
Member of the Management Board (since 1 April 2020 until 31 March 2025)
Barbara Dorić
Darko Markotić
Member of the Management Board (since 1 April 2020 until 31 March 2025)
Member of the Management Board (since 1 April 2020 until 31 March 2025)
Ferenc Horváth
József Simola
Member of the Management Board (since 1 February 2021 until 31 March 2024)
Member of the Management Board (since 1 February 2021 until 31 March 2024)
Council of Directors
Members of the Council of Directors appointed by the decision of the Management Board:
Vlatko Dujanić
Gábor Horváth
Goran Pleše
Operating Director of Consumer Services and Retail
Chief Financial Officer
Operating Director of Refining and Marketing
Goran Pavlović
Tvrtko Perković
Operating Director of Industrial Services
Operating Director of Exploration and Production

INA - INDUSTRIJA NAFTE, d.d.
Notes to the financial statements (continued)
For the year ended 31 December 2020
(all amounts are presented in HRK millions)
INA - Industrija nafte, d.d. 188
2. ACCOUNTING POLICIES
The principal accounting policies applied in the preparation of these consolidated and separate financial statements are
set out below. These policies have been consistently applied to all the years presented, unless otherwise stated.
Presentation of the financial statements
These consolidated and separate financial statements are prepared on the consistent presentation and classification
basis. When the presentation or classification of items in the consolidated and separate financial statements is
amended, comparative amounts are reclassified unless the reclassification is impracticable.
The Company’s and the Group’s financial statements are prepared in millions of HRK, which is the Company’s functional currency.
Basis of accounting
The Company maintains its accounting records in Croatian language, in Croatian kuna, in accordance with Croatian
law and the accounting principles and practices observed by enterprises in Croatia. The accounting records of the
Company's subsidiaries in Croatia and abroad are maintained in accordance with the requirements of the respective
local jurisdictions.
The Company’s and the Group’s financial statements are prepared under the historical cost convention, modified by
the revaluation of certain assets and liabilities under conditions of hyperinflation in the period to 1993 and except for
certain financial instruments that are measured at fair values at the end of each reporting period, and in accordance
with International Financial Reporting Standards as adopted by European Union (EU) (IFRS).
Historical cost is generally based on the fair value of the consideration given in exchange for goods and services.
Fair value is the price that would be received to sell an asset or paid to transfer a liability in an orderly transaction
between market participants at the measurement date, regardless of whether that price is directly observable or
estimated using another valuation technique. In estimating the fair value of an asset or a liability, the Group takes into
account the characteristics of the asset or liability if market participants would consider those characteristics when
pricing the asset or liability at the measurement date. Fair value for measurement and/or disclosure purposes in these
consolidated financial statements is determined on such a basis, except for leasing transactions that are within the
scope of IFRS 16, and measurements that have some similarities to fair value but are not fair value, such as net
realisable value in IAS 2 or value in use in IAS 36.
Adoption of new and revised International Financial Reporting Standards
Standards and Interpretations effective in the current period
The following new standards and amendments to the existing standards issued by the International Accounting
Standards Board (IASB) and interpretations issued by the International Financial Reporting Interpretations Committee
and adopted by the EU are effective for the current period:

INA - INDUSTRIJA NAFTE, d.d.
Notes to the financial statements (continued)
For the year ended 31 December 2020
(all amounts are presented in HRK millions)
INA - Industrija nafte, d.d. 189
2. ACCOUNTING POLICIES (CONTINUED)
Adoption of new and revised International Financial Reporting Standards (continued)
Standards and Interpretations effective in the current period (continued)
• Amendment to IFRS 16 Leases Covid 19-Related Rent Concessions, issued on 28 May 2020 (effective date
for annual periods beginning on or after 1 June 2020).
• Amendments to IFRS 3 Business Combinations, issued on 22 October 2018 (effective date for annual periods
beginning on or after 1 January 2020).
• Interest Rate Benchmark Reform (Amendments to IFRS 9, IAS 39 and IFRS 7), issued on 26 September
2019 (effective date for annual periods beginning on or after 1 January 2020).
• Amendments to IAS 1 and IAS 8 Definition of Material, issued on 31 October 2018 (effective date for annual
periods beginning on or after 1 January 2020).
• Amendments to References to the Conceptual Framework in IFRS Standards, issued on 29 March 2018
(effective date for annual periods beginning on or after 1 January 2020).
The adoption of these Standards and Interpretations had no significant impact on the financial statements of the
Company and the Group.
Standards and Interpretations issued by IASB and adopted by the EU but not yet effective
• Amendments to IFRS 9, IAS 39, IFRS 7, IFRS 4 and IFRS 16 Interest Rate Benchmark Reform – Phase 2,
issued on 27 August 2020 (effective date for annual periods beginning on or after 1 January 2021).
• Amendments to IFRS 4 Insurance Contracts – deferral of IFRS 9, issued on 25 June 2020 (effective date for
annual periods beginning on or after 1 January 2021).

INA - INDUSTRIJA NAFTE, d.d.
Notes to the financial statements (continued)
For the year ended 31 December 2020
(all amounts are presented in HRK millions)
INA - Industrija nafte, d.d. 190
2. ACCOUNTING POLICIES (CONTINUED)
Adoption of new and revised International Financial Reporting Standards (continued)
Standards and Interpretations issued by IASB but not yet adopted by the EU
At the date of authorization of these financial statements the following standards, revisions and interpretations were in
issue by the International Accounting Standards Board but not yet adopted by the EU. The endorsement might be
expected in 2021:
• IFRS 17 Insurance contracts, issued on 18 May 2017; including Amendments to IFRS 17 issued on 25 June
2020, (effective date for annual periods beginning on or after 1 January 2023).
• Amendments to IAS 1 Presentation of Financial Statements: Classification of Liabilities as Current or Non-
current and Classification of Liabilities as Current or Non-current - Deferral of Effective Date, issued on 23
January 2020 and 15 July 2020 respectively (effective date for annual periods beginning on or after 1 January
2023).
• Amendments to IFRS 3 Business Combinations; IAS 16 Property, Plant and Equipment; IAS 37 Provisions,
Contingent Liabilities and Contingent Assets and Annual Improvements 2018-2020, all issued on 14 May 2020
(effective date for annual periods beginning on or after 1 January 2022).
• Amendments to IAS 1 Presentation of Financial Statements and IFRS Practice Statement 2: Disclosure of
Accounting policies, issued on 12 February 2021 (effective date for annual periods beginning on or after 1
January 2023).
• Amendments to IAS 8 Accounting policies, Changes in Accounting Estimates and Errors: Definition of
Accounting Estimates issued on 12 February 2021 (effective date for annual periods beginning on or after 1
January 2023).
The Company and the Group does not anticipate that the adoption of these Standards and Interpretations will have a
significant impact on the financial statements of the Company and the Group.
Going concern in COVID-19 pandemic
The COVID-19 pandemic had a massive negative impact on the global economy as well as the society at large. Social
distancing and lockdown measures were adopted to reduce the spread of the pandemic. The virus exposed INA Group,
its employees, customers and partners to significant health and safety risks, it created unseen operational challenges
during the lockdown and put INA Group financial flexibility and strength to the test too. The oil and gas industry were
particularly hit hard as a combination of demand and supply-side shocks occurring at the same time. Since petroleum
products are considered a necessity, the industry remained operative.
The Management Board consider it appropriate to adopt the going concern basis of accounting in preparing the annual
financial statements. The impact of COVID-19 and the current economic environment has been considered as part of
the going concern assessment. The management determined that there are no material uncertainties in relation to going
concern.

INA - INDUSTRIJA NAFTE, d.d.
Notes to the financial statements (continued)
For the year ended 31 December 2020
(all amounts are presented in HRK millions)
INA - Industrija nafte, d.d. 191
2. ACCOUNTING POLICIES (CONTINUED)
Investments in subsidiaries in Parent Company financial statement (INA, d.d.)
In the Company’s financial statements, investments in subsidiaries are accounted for at cost and reduced for impairment.
Basis of consolidated financial statements (INA Group)
The consolidated financial statements incorporate the financial statements of INA, d.d. (the Company) and entities
controlled by the Company (its subsidiaries) made up to 31 December each year. Control is achieved when the Group
is exposed, or has rights, to variable returns from its involvement with the investee and has ability to affect those returns
through its power over the investee. The Group controls an investee if, and only if, the Group:
• has power over the investee;
• is exposed, or has rights, to variable returns from its involvement with the investee; and
• has the ability to use its power to affect its returns.
When the Company has less than a majority of the voting rights of an investee, it has power over the investee when the
voting rights are sufficient to give it the practical ability to direct the relevant activities of the investee unilaterally. The
Company considers all relevant facts and circumstances in assessing whether or not the Company's voting rights in an
investee are sufficient to give it power, including:
• the size of the Company's holding of voting rights relative to the size and dispersion of holdings of the other vote
holders;
• potential voting rights held by the Company, other vote holders or other parties;
• rights arising from other contractual arrangements; and
• any additional facts and circumstances that indicate that the Company has, or does not have, the current ability
to direct the relevant activities at the time that decisions need to be made, including voting patterns at previous
shareholders' meetings.
The Group re-assesses whether or not it controls an investee if facts and circumstances indicate that there are changes
to one or more of the three elements of control. Consolidation of a subsidiary begins when the Company obtains control
over the subsidiary and ceases when the Company loses control of the subsidiary. Assets, liabilities, income and
expenses of a subsidiary acquired or disposed of during the year are included in the consolidated financial statements
from the date the Company gains control until the date when the Company ceases to control the subsidiary.
Profit or loss and each component of other comprehensive income are attributed to the owners of the Company and to
the non-controlling interests, even if this results in the non-controlling interests having a deficit balance. When
necessary, adjustments are made to the financial statements of subsidiaries to bring their accounting policies in line
with the Group's accounting policies.
All intragroup assets and liabilities, equity, income, expenses and cash flows relating to transactions between members
of the Group are eliminated in full on consolidation.
A change in the ownership interest of a subsidiary, without a loss of a control, is accounted for as equity transaction. If
the Group loses control over a subsidiary, it derecognises the related assets (including goodwill), liabilities, non-
controlling interest and other components of equity, while any resultant gain or loss is recognised in profit or loss. Any
investment retained is recognised at fair value.
INA - INDUSTRIJA NAFTE, d.d.
Notes to the financial statements (continued)
For the year ended 31 December 2020
(all amounts are presented in HRK millions)
INA - Industrija nafte, d.d. 192
2. ACCOUNTING POLICIES (CONTINUED)
Basis of consolidated financial statements (INA Group) (continued)
The carrying amounts of the Group's interests and the non-controlling interests are adjusted to reflect the changes in
their relative interests in the subsidiaries. Any difference between the amount by which the non-controlling interests are
adjusted and the fair value of the consideration paid or received is recognised directly in equity and attributed to owners
of the Company.
When the Group loses control of a subsidiary, the profit or loss on disposal is calculated as the difference between (i)
the aggregate of the fair value of the consideration received and the fair value of any retained interest and (ii) the
previous carrying amount of the assets (including goodwill), and liabilities of the subsidiary and any non-controlling
interests.
All amounts previously recognised in other comprehensive income in relation to that subsidiary are accounted for as if
the Group had directly disposed of the related assets or liabilities of the subsidiary. The fair value of any investment
retained in the former subsidiary at the date when control is lost is regarded as the fair value on initial recognition for
subsequent accounting under IFRS 9 Financial Instruments or, when applicable, the cost on initial recognition of an
investment in an associate.
Legal merger
In a case of legal merger of the companies in the Group, pooling of interest method is applied, balances of company
that is merged are carried at net book values to a company, which is legal successor, and no restatements of prior
periods are done.
Business combination
Business combinations are accounted for using the acquisition method.
The cost of an acquisition is measured as the aggregate of the consideration transferred, which is measured at
acquisition date fair value, and the amount of any non-controlling interests in the acquiree. For each business
combination, the Group elects whether to measure the non-controlling interests in the acquiree at fair value or at the
proportionate share of the acquiree’s identifiable net assets. Acquisition-related costs are expensed as incurred and
included in administrative expenses.
When the Group acquires a business, it assesses the financial assets and liabilities assumed for appropriate
classification and designation in accordance with the contractual terms, economic circumstances and pertinent
conditions as at the acquisition date. Any contingent consideration to be transferred by the acquirer will be recognised
at fair value at the acquisition date. Contingent consideration classified as an asset or liability that is a financial
instrument and within the scope of IFRS 9 Financial Instruments, is measured at fair value with the changes in fair value
recognised in the statement of profit or loss.
Goodwill is initially measured at cost (being the excess of the aggregate of the consideration transferred and the amount
recognised for non-controlling interests and any previous interest held over the net identifiable assets acquired and
liabilities assumed). If the fair value of the net assets acquired is in excess of the aggregate consideration transferred,
the Group re-assesses whether it has correctly identified all of the assets acquired and all of the liabilities assumed and
reviews the procedures used to measure the amounts to be recognised at the acquisition date. If the reassessment still
results in an excess of the fair value of net assets acquired over the aggregate consideration transferred, then the gain
is recognised in profit or loss.
INA - INDUSTRIJA NAFTE, d.d.
Notes to the financial statements (continued)
For the year ended 31 December 2020
(all amounts are presented in HRK millions)
INA - Industrija nafte, d.d. 193
2. ACCOUNTING POLICIES (CONTINUED)
Business combination (continued)
After initial recognition, goodwill is measured at cost less any accumulated impairment losses. For the purpose of
impairment testing, goodwill acquired in a business combination is, from the acquisition date, allocated to each of the
Group’s cash-generating units that are expected to benefit from the combination, irrespective of whether other assets
or liabilities of the acquiree are assigned to those units.
A cash-generating unit to which goodwill has been allocated is tested for impairment annually, or more frequently when
there is indication that the unit may be impaired. If the recoverable amount of the cash-generating unit is less than its
carrying amount, the impairment loss is allocated first to reduce the carrying amount of any goodwill allocated to the
unit and then to the other assets of the unit pro rata based on the carrying amount of each asset in the unit.
Any impairment loss for goodwill is recognised directly in profit or loss. An impairment loss recognised for goodwill is
not reversed in subsequent periods.
On disposal of the relevant cash-generating unit, the attribute amount of goodwill is included in the determination of the
gain or loss on disposal.
Acquisition of entities under common control
Business combinations arising from transfers of interests in entities that are under the control of the shareholder that
ultimately controls the Group are accounted for using pooling of interest accounting at the date of acquisition. The
assets and liabilities acquired are recognised at the carrying amounts recognised previously in the consolidated financial
statements of the parent group. The components of equity of the acquired entities are added to the same components
within the Group equity except for issued capital. Consolidated financial statements reflect the results of combining
entities from the date of acquisition.
Business combinations under common control are accounted for based on carrying values, with any effects directly
recognised in equity.
Investments in associates and joint ventures
An associate is an entity over which the Group has significant influence. Significant influence is the power to participate
in the financial and operating policy decisions of the investee but is not control or joint control over those policies.
A joint venture is a joint arrangement and legal entity whereby the parties that have joint control of the arrangement
have rights to the net assets of the joint arrangement. Joint control is the contractually agreed sharing of control of an
arrangement, which exists only when decisions about the relevant activities require unanimous consent of the parties
sharing control. The considerations made in determining significant influence or joint control are similar to those
necessary to determine control over subsidiaries.
An investment in an associate or a joint venture is accounted for using the equity method on separate and consolidated
financial statements from the date on which the investee becomes an associate or a joint venture. The Company and
the Group discontinues the use of the equity method from the date when the investment ceases to be an associate or
a joint venture, or when the investment is classified as held for sale.
INA - INDUSTRIJA NAFTE, d.d.
Notes to the financial statements (continued)
For the year ended 31 December 2020
(all amounts are presented in HRK millions)
INA - Industrija nafte, d.d. 194
2. ACCOUNTING POLICIES (CONTINUED)
Interests in joint operations
A joint operation is a joint arrangement whereby the parties that have joint control of the arrangement have rights to the
assets, and obligations for the liabilities, relating to the arrangement. Joint control is the contractually agreed sharing of
control of an arrangement, which exists only when decisions about the relevant activities require unanimous consent of
the parties sharing control.
The Group accounts for the assets, liabilities, revenues and expenses relating to its interest in a joint operation in
accordance with the IFRSs applicable to the particular assets, liabilities, revenues and expenses.
When the Group entity transacts with a joint operation in which a group entity is a joint operator (such as a sale or
contribution of assets), the Group is considered to be conducting the transaction with the other parties to the joint
operation, and gains and losses resulting from the transactions are recognised in the Group's consolidated financial
statements only to the extent of other parties' interests in the joint operation.
When a Group entity transacts with a joint operation in which the Group entity is a joint operator (such as a purchase
of assets), the Group does not recognise its share of the gains and losses until it resells those assets to a third party.
Oil and gas properties
Exploration and appraisal costs
Exploration and appraisal costs are accounted for on the successful efforts method. Costs relating to exploration and
appraisal drilling are initially capitalised as intangible oil and gas assets pending determination of the commercial
viability of the relevant oil and gas properties.
License and data provision costs and costs associated with geological and geophysical activities are charged to the
statement of profit or loss in the period in which they are incurred.
If prospects are subsequently deemed unsuccessful on completion of evaluation, the associated costs are charged to
the statement of profit or loss in the period. If the prospects are deemed commercially viable, such costs are transferred
to oil and gas properties. Management Board reviews the status of such prospects regularly.
Fields under development
Oil and gas field development costs are capitalised as tangible oil and gas assets.
Depreciation
Capitalised exploration and development costs of producing domestic and foreign oil and gas properties are depreciated
using a unit of production method, in the proportion of actual production for the period to the total estimated remaining
commercial reserves of the field.
Commercial reserves
Commercial reserves are proved developed oil and gas reserves. Changes in the commercial reserves of fields affecting
unit of production calculations are dealt with prospectively over the revised remaining reserves. The Group performed
reserves determination in accordance with SPE PRMS (Society of Petroleum Engineers Petroleum Resources
Management System) guidelines.
INA - INDUSTRIJA NAFTE, d.d.
Notes to the financial statements (continued)
For the year ended 31 December 2020
(all amounts are presented in HRK millions)
INA - Industrija nafte, d.d. 195
2. ACCOUNTING POLICIES (CONTINUED)
Intangible assets
Intangible assets acquired separately are capitalized at cost and intangible assets acquired from a business acquisition
are capitalized at fair value as at the date of acquisition. Intangible assets are recognized if it is probable that the future
economic benefits that are attributable to the asset will flow to the enterprise and the cost of the asset can be measured
reliably. Amortisation is charged on assets with a finite useful life over the best estimate of their useful lives using the
straight line method, except intangible assets on oil and gas fields are charged with a unit of production method. The
amortisation period and the amortisation method are reviewed annually at each financial year-end.
Intangible assets are tested for impairment annually either individually or at the cash generating unit level. Research
costs are expensed as incurred. Development expenditure incurred on an individual project is carried forward when its
future recoverability can reasonably be regarded as assured.
Following the initial recognition of the development expenditure, the cost model is applied requiring the asset to be
carried at cost less any accumulated impairment losses. Costs in development stage cannot be amortized. The carrying
value of development costs is reviewed for impairment annually when the asset is not yet in use or more frequently
when an indicator of impairment arises during the reporting year indicating that the carrying value may not be
recoverable.
Property, plant and equipment
Property, plant and equipment are shown at historical cost or valuation less accumulated depreciation and any
accumulated impairment loss, except for land, which is stated at cost less any accumulated impairment loss. The initial
cost of property, plant and equipment comprises its purchase price, including import duties and non-refundable
purchase taxes and any directly attributable costs of bringing an asset to its working condition and location for its
intended use.
Expenditures incurred after property, plant and equipment have been put into operation are normally charged to
statement of profit or loss in the period in which the costs are incurred.
In situations where it can be clearly demonstrated that the expenditures have resulted in an increase in the future
economic benefits expected to be obtained from the use of an item of property, plant and equipment beyond its originally
assessed standard performance, the expenditures are capitalised as an additional cost of property, plant and
equipment. Costs eligible for capitalisation include costs of periodic, planned significant inspections and overhauls
necessary for further operation.
The gain or loss arising on the disposal or retirement of an item of property, plant and equipment is determined as the
difference between the sales proceeds and the carrying amount of the asset and is recognised in the statement of profit
or loss.
Depreciation, Depletion and Amortisation
Intangible assets and property, plant and equipment in use (excluding oil and gas properties) are depreciated on a
straight-line basis on the following basis:
Software 5 years
Buildings 5 - 50 years
Refineries and chemicals manufacturing plants 3 - 15 years
Service stations 30 years
Telecommunication and office equipment 2 - 10 years
The residual values, useful lives and depreciation methods are reviewed at least annually.
INA - INDUSTRIJA NAFTE, d.d.
Notes to the financial statements (continued)
For the year ended 31 December 2020
(all amounts are presented in HRK millions)
INA - Industrija nafte, d.d. 196
2. ACCOUNTING POLICIES (CONTINUED)
Impairment of tangible and intangible assets other than goodwill
At least annually and whenever there is an indication that the assets may be impaired, the Group reviews the carrying
amounts of its tangible and intangible assets to determine whether there is any indication that those assets have
suffered an impairment loss. If any such indication exists, the recoverable amount of the asset is estimated in order to
determine the extent of the impairment loss (if any). Where it is not possible to estimate the recoverable amount of an
individual asset, the Group estimates the recoverable amount of the cash-generating unit to which the asset belongs.
Where a reasonable and consistent basis of allocation can be identified, corporate assets are also allocated to individual
cash-generating units, or otherwise they are allocated to the smallest group of cash-generating units for which a
reasonable and consistent allocation basis can be identified.
Intangible assets with indefinite useful lives and intangible assets not yet available for use are tested for impairment at
least annually, and whenever there is an indication that the asset may be impaired.
Recoverable amount is the higher of fair value less costs to sell and value in use. In assessing value in use, the
estimated future cash flows are discounted to their present value using a pre-tax discount rate that reflects current
market assessments of the time value of money and the risks specific to the asset for which the estimates of future
cash flows have not been adjusted.
If the recoverable amount of an asset (or cash-generating unit) is estimated to be less than its carrying amount, the
carrying amount of the asset (or cash-generating unit) is reduced to its recoverable amount. An impairment loss is
recognised immediately as expenditure, unless the relevant asset is carried at a revalued amount, in which case the
impairment loss is treated as a revaluation decrease.
When an impairment loss subsequently reverses, the carrying amount of the asset (or a cash-generating unit) is
increased to the revised estimate of its recoverable amount, but so that the increased carrying amount does not exceed
the carrying amount that would have been determined had no impairment loss been recognised for the asset (or cash-
generating unit) in prior years. A reversal of an impairment loss is recognised immediately in profit or loss, unless the
relevant asset is carried at a revalued amount, in which case the reversal of the impairment loss is treated as a
revaluation increase.
Leases
The Company and the Group assess contracts to evaluate whether a contract contains a lease or not. That is, lease is
a contract (or part of a contract), that conveys the right to use an asset (the underlying asset), for specified period in
exchange for consideration.
The Company and the Group as a lessee
The Group applies a single recognition and measurement approach for all leases, except for short-term leases and
leases of low-value assets. The Group recognises lease liabilities to make lease payments and right-of-use assets
representing the right to use the underlying assets. There are two key aspects:
1. Right-of-use assets
The Company and the Group recognises right-of-use assets at the commencement date of the lease (i.e., the date the
underlying asset is available for use). Right-of-use assets are measured at cost, less any accumulated depreciation
and impairment losses, and adjusted for any remeasurement of lease liabilities. The cost of right-of-use assets includes
the amount of lease liabilities recognised, initial direct costs incurred, and lease payments made at or before the
commencement date less any lease incentives received.

INA - INDUSTRIJA NAFTE, d.d.
Notes to the financial statements (continued)
For the year ended 31 December 2020
(all amounts are presented in HRK millions)
INA - Industrija nafte, d.d. 197
2. ACCOUNTING POLICIES (CONTINUED)
Leases (continued)
Right-of-use assets are depreciated on straight-line basis over the shorter of the lease term and the estimated useful
lives of the assets as presented in Property, plant and equipment. If ownership of the leased asset transfers to the
Company and the Group at the end of the lease term or the cost reflects the exercise of a purchase option, depreciation
is calculated using the estimated useful life of the asset. Right of use assets are presented as seperate line in the
statement of financial position.
The right-of-use assets are also subject to impairment. Refer to the accounting policies depreciation shall be calculated
as for Property, plant and equipment in accordance with IAS 16.
2. Lease liabilities
At the commencement date of the lease, the Group recognises lease liabilities measured at the present value of lease
payments to be made over the lease term. The lease payments include fixed payments (including in-substance fixed
payments) less any lease incentives receivable, variable lease payments that depend on an index or a rate, and
amounts expected to be paid under residual value guarantees.
Variable lease payments that do not depend on an index or a rate are recognised as expenses in the period in which
the event or condition that triggers the payment occurs. In calculating the present value of lease payments, the Group
uses its incremental borrowing rate at the lease commencement date because the interest rate implicit in the lease is
not readily determinable. After the commencement date, the amount of lease liabilities is increased to reflect the
accretion of interest and reduced for the lease payments made. In addition, the carrying amount of lease liabilities is
remeasured if there is a modification, a change in the lease term, a change in the lease payments (e.g., changes to
future payments resulting from a change in an index or rate used to determine such lease payments) or a change in the
assessment of an option to purchase the underlying asset. Lease liabilities are presented as seperated lines in the
statement of financial position.
Short-term leases and leases of low-value assets
The Group applies the short-term lease recognition exemption to its short-term leases (i.e., those leases that have a
lease term of 12 months or less). A lease that contains a purchase option cannot be classified as a short-term lease.
The Company and the Group apply recognition exemption to office equipment lease that are considered to be of low
value. Lease payments on short-term leases and leases of low value assets are recognised as expense on a straight-
line basis over the lease term.
Group as a lessor
Leases in which the Group does not transfer substantially all the risks and rewards incidental to ownership of an asset
are classified as operating leases. Rental income arising is accounted for on a straight-line basis over the lease terms
and is included in other operating income in the statement of profit or loss due to its operating nature. Initial direct costs
incurred in negotiating and arranging an operating lease are added to the carrying amount of the leased asset and
recognised over the lease term on the same basis as rental income. Contingent rents are recognised as revenue in the
period in which they are earned.

INA - INDUSTRIJA NAFTE, d.d.
Notes to the financial statements (continued)
For the year ended 31 December 2020
(all amounts are presented in HRK millions)
INA - Industrija nafte, d.d. 198
2. ACCOUNTING POLICIES (CONTINUED)
Receivables from customers
Trade receivables are carried at amortised cost less impairment. Receivables from customers are shown in amounts
identified in the invoices issued to the customers in accordance with the agreement, order, delivery note and other
documents which serves as basis for invoicing, decreased with impairment of receivables.
Accrued revenues are recorded at the end of reporting period for delivered goods or services if they have not been
invoiced yet.
The Group recognises an allowance for forward-looking exspected credit loss (ECL) for all debt instruments not held at
fair value through profit or loss and contract assets.
Expected credit loss model is used for calculation of impairment of receivables. The model incorporates forward-looking
factors into assessment of impairment. INA Group applies the simplified approach for receivables. This means that
allowance for the full lifetime expected credit loss is accounted for upon recognition of the financial instrument.
According to the impairment policy, following events are considered as objective evidence on impairment:
• legal claim against the customer;
• default of the issuer;
• total or partial release of claim;
• claim is under external connection;
• >180 days overdue;
• disappearance of an active market.
The calculation of loss rate:
• in case of performing third party items under simplified approach, loss rates are used to calculate the expected
credit loss on these items at initial recognition;
• the loss rate is the arithmetic average of the yearly historical loss rates of the last three years. Upon calculating
the historical loss rate for a given year, only receivables originated in given year are considered in the calculation;
• this average of yearly historical loss rates is adjusted by the forward-looking macroeconomic element.
Receivables that are a subject of a court process (court dispute, bankruptcy, liquidation) are written off from accounting
records.
Inventories
Inventories of crude oil, finished and semi-finished products and natural gas are valued as follows:
• Crude oil is carried at the weighted average cost or the production cost. If finished i.e. refined products are
impaired, a calculation is used to reduce the crude oil reserve by an aliquot share to its net recoverable amount.
• Finished products are valued at the lower of cost or approximately 98.32% of future average sales price, which
approximates the net recoverable amount.
INA - INDUSTRIJA NAFTE, d.d.
Notes to the financial statements (continued)
For the year ended 31 December 2020
(all amounts are presented in HRK millions)
INA - Industrija nafte, d.d. 199
2. ACCOUNTING POLICIES (CONTINUED)
Inventories (continued)
• Semi-finished products are measured using a calculation method, by which they are impaired to the extent that
finished products on the basis of actual inventories at the period-end are impaired i.e. when the calculation shows
that their net realisable value may not be recovered, by applying the impairment percentage to each individual
semi-finished product on stock at the period-end.
• Imported natural gas held in underground storage is valued at the lower of cost, based on the price of imported
gas at year-end including transport costs and weighted average sales price based on year-end prices.
• Domestic natural gas held in underground storage is valued at the lower of average sales price and cost.
• Other inventories, which comprise mainly spare parts, materials and supplies, are valued at the lower of cost or
valuation and net realisable value.
Cash and cash equivalents
Cash and cash equivalents comprise cash on hand and bank, and demand deposits and other short-term highly liquid
investments that are readily convertible to a known amount of cash and are subject to an insignificant risk of changes
in value.
Borrowing costs
Borrowing costs directly attributable to the acquisition, construction or production of qualifying assets, which are assets
that necessarily take a substantial period of time to get ready for their intended use or sale, are added to the cost of
those assets, until such time as the assets are substantially ready for their intended use or sale.
Investment income earned on the temporary investment of specific borrowings pending their expenditure on qualifying
assets is deducted from the borrowing costs eligible for capitalisation. Used capitalisation rate for 2020 was 1% and for
2019, it was 0.88%.
All other borrowing costs are recognised in profit or loss in the period in which they are incurred. Borrowing costs consist
of interest and other costs that an entity incurs in connection with the borrowing of funds.
Foreign currencies
The individual financial statements of each Company and the Group entity are prepared in the currency of the primary
economic environment in which the entity operates (its functional currency). For the purpose of the consolidated
financial statements, the results and financial position of each entity are expressed in Croatian kuna (HRK), which is
the functional currency of the Company, and the presentation currency for the consolidated financial statements.
In the financial statements of the individual Group entities, transactions in currencies other than the entity’s functional currency are translated to the functional currency of entity at the rates of exchange prevailing on the dates of the
transactions.
At each statement of financial position date, monetary items denominated in foreign currencies are retranslated to the
functional currency of the entity at the rates prevailing on the statement of financial position date. Non-monetary items
carried at fair value that are denominated in foreign currencies are retranslated at the rates prevailing on the date when
the fair value was determined. Non-monetary items that are measured in terms of historical cost in a foreign currency
are not retranslated.
INA - INDUSTRIJA NAFTE, d.d.
Notes to the financial statements (continued)
For the year ended 31 December 2020
(all amounts are presented in HRK millions)
INA - Industrija nafte, d.d. 200
2. ACCOUNTING POLICIES (CONTINUED)
Foreign currencies (continued)
Exchange differences are recognised in profit or loss in the period in which they arise except for:
• exchange differences on foreign currency borrowings relating to assets under construction for future productive
use, which are included in the cost of those assets when they are regarded as an adjustment to interest costs on
those foreign currency borrowings;
• exchange differences on transactions entered into in order to hedge certain foreign currency risks;
• exchange differences on monetary items receivable from or payable to a foreign operation for which settlement is
neither planned nor likely to occur (therefore forming part of the net investment in the foreign operation), which are
recognised initially in other comprehensive income and reclassified from equity to profit or loss on disposal or
partial disposal of the net investment.
For the purpose of presenting consolidated financial statements, the assets and liabilities of the Group’s foreign operations (including comparatives) are expressed in Croatian kuna using exchange rates prevailing on the statement
of financial position date. Income and expense items (including comparatives) are translated at the average exchange
rates for the period, unless exchange rates fluctuated significantly during that period, in which case the exchange rates
at the dates of the transactions are used. Exchange differences arising from year-end translation, if any, are classified
as equity and transferred to the Group’s other reserve. Such translation differences are recognised in profit or loss in
the period in which the foreign operation is disposed of.
The foreign concessions of INA, d.d. meet the definition of foreign operation and are treated as such.
Business activities of INA, d.d. in Egypt and Angola are carried out with a significant degree of autonomy so the
functional currency is US dollar (USD) except on gas field Isabella, (located in international waters in the North Adriatic
Sea) where the functional currency is euro (EUR). The total revenue of a foreign operation (from the sale of crude oil
and natural gas) is denominated in that currency (USD or EUR), as most of the costs. Capital expenditures are planned
and presented in dollars or euros. Although they are not separate legal entities, they meet the definition of a foreign
operation in accordance with IAS 21.
In the case of a partial disposal that does not result in the Group losing control over a subsidiary that includes a foreign
operation, the proportionate share of accumulated exchange differences are re-attributed to non-controlling interests
and are not recognised in profit or loss. For all other partial disposals, the proportionate share of the accumulated
exchange differences is reclassified to profit or loss.
Goodwill and fair value adjustments on identifiable assets and liabilities acquired arising on the acquisition of a foreign
operation are treated as assets and liabilities of the foreign operation and translated at the rate of exchange prevailing
at the end of each reporting period. Exchange differences arising are recognised in other comprehensive income.
Retirement Benefit and Jubilee Costs
For defined benefit plans for retirement and jubilee awards, the cost of providing benefits is determined using the
projected unit credit method, with actuarial valuations being carried out at each annual reporting period.
Remeasurement, comprising actuarial gains and losses, the effect of the changes to the asset ceiling (if applicable) and
the return on plan assets (excluding interest), is reflected immediately in the statement of financial position with a charge
or credit recognised in other comprehensive income in the period in which they occur. Remeasurement recognised in
other comprehensive income is reflected immediately in retained earnings and will not be reclassified to profit or loss.
Past service cost is recognised in profit or loss in the period of a plan amendment.

INA - INDUSTRIJA NAFTE, d.d.
Notes to the financial statements (continued)
For the year ended 31 December 2020
(all amounts are presented in HRK millions)
INA - Industrija nafte, d.d. 201
2. ACCOUNTING POLICIES (CONTINUED)
Retirement Benefit and Jubilee Costs (continued)
Net interest is calculated by applying the discount rate at the beginning of the period to the net defined benefit liability
or asset. Defined benefit costs are categorised as follows:
• service cost (including current service cost, past service cost, as well as gains and losses on curtailments and
settlements);
• net interest expense or income; and
• remeasurement.
The Group presents the first two components of defined benefit costs in profit or loss in the line item. Curtailment gains
and losses are accounted for as past service costs.
The retirement benefit obligation recognised in the consolidated statement of financial position represents the actual
deficit or surplus in the Group’s defined benefit plans. Any surplus resulting from this calculation is limited to the present
value of any economic benefits available in the form of refunds from the plans or reductions in future contributions to
the plans. A liability for a termination benefit is recognised when the entity can no longer withdraw the offer of the
termination benefit or when the entity recognises any related restructuring costs.
Taxation
The tax expense represents the sum of the tax currently payable and deferred tax.
Current tax
The tax currently payable is based on taxable profit for the year. Taxable profit differs from profit as reported in the
consolidated statement of profit or loss because of items of income or expense that are taxable or deductible in other
years and it further excludes items that are never taxable or deductible. The Company’s and the Group’s liability for current tax is calculated using tax rates that have been enacted or substantively enacted by the statement of financial
position date.
Deferred tax
Deferred tax is recognised on differences between the carrying amounts of assets and liabilities in the financial
statements and the corresponding tax bases used in the computation of taxable profit and are accounted for using the
statement of financial position liability method.
Deferred tax is calculated using tax rates that have been enacted or substantively enacted by the end of the reporting
year and are expected to apply to taxable income in the years in which those temporary differences are expected to be
recovered or settled.
Deferred tax assets are recognised where it is more likely than not the assets will be realised in the future. At each date,
the Company re-assessed unrecognised deferred tax assets and the carrying amount of deferred tax assets. No
deferred tax liability is provided in respect of any future remittance of earnings of foreign subsidiaries where the Group
is able to control the remittance of earnings and it is probable that such earnings will not be remitted in the foreseeable
future, or where no liability would arise on the remittance.
Deferred tax assets and liabilities are offset when there is a legally enforceable right to set off current tax assets against
current tax liabilities and when they relate to income taxes levied by the same taxation authority and the Company and
the Group intend to settle its current tax assets and liabilities.
INA - INDUSTRIJA NAFTE, d.d.
Notes to the financial statements (continued)
For the year ended 31 December 2020
(all amounts are presented in HRK millions)
INA - Industrija nafte, d.d. 202
2. ACCOUNTING POLICIES (CONTINUED)
Taxation (continued)
Deferred tax (continued)
Deferred tax liabilities are recognised for taxable temporary differences associated with investments in subsidiaries and
associates except where the Group is able to control the reversal of the temporary difference and it is probable that the
temporary difference will not reverse in the foreseeable future.
Current and deferred tax for the period
Current and deferred tax are recognized in profit or loss, except when they relate to items that are recognized in other
comprehensive income or directly in equity, in which case, the current and deferred tax are also recognized in other
comprehensive income or directly in equity respectively. Where current tax and deferred tax arises from the accounting
for a business acquisition, the tax effect is included in accounting for the business combination.
Financial assets
Initial measurement of financial instruments
Financial assets are divided into two main categories, those measured at amortized cost and those measured at fair
value. Fair value measurement is further divided into fair value through profit and loss (FVTPL) and fair value through
other comprehensive income (FVTOCI).
Subsequent measurement of financial assets
Financial assets are classified in four categories:
Financial assets at amortized cost (debt instruments)
A debt instrument that meets the following two conditions is measured at amortized cost:
• Business model test: The financial asset is held to collect the contractual cash flows (rather than to sell the
instrument prior to its contractual maturity to realize its fair value changes); and
• Cash flow characteristics test: The contractual terms of the financial asset give rise on specified dates to cash
flows that are solely payments of principal and interest on the principal amount outstanding.
Financial assets at fair value through other comprehensive income (debt instruments)
A debt instrument that meets the following two conditions must be measured at FVTOCI unless the asset is designated
at FVTPL under the fair value option:
• Business model test: The financial asset is held within a business model with the objective of both holding to
collect contractual cash flows and selling; and
• Cash flow characteristics test: The contractual terms of the financial asset give rise on specified dates to cash
flows that are solely payments of principal and interest on the principal amount outstanding.
The Company’s and the Group’s debt instruments at FVTOCI includes only investments in long-term quoted debt
marketable securities with very low credit risk.
Financial assets at fair value through profit or loss (debt instruments)
All other debt instruments must be measured at FVTPL (including derivatives).
INA - INDUSTRIJA NAFTE, d.d.
Notes to the financial statements (continued)
For the year ended 31 December 2020
(all amounts are presented in HRK millions)
INA - Industrija nafte, d.d. 203
2. ACCOUNTING POLICIES (CONTINUED)
Financial assets (continued)
Financial assets designated at fair value through other comprehensive income (equity instruments)
Upon initial recognition, the Company and Group can elect to classify irrevocably its equity investments as equity
instruments designated at FVTOCI when they meet the definition of equity under IAS 32 Financial Instruments:
Presentation and are not held for trading. The classification is determined on an instrument-by-instrument basis.
The Company and the Group elected to classify its listed equity investments under this category (see note 40).
Derecognition of financial assets
The basic premise for the derecognition model is to determine whether the asset under consideration for derecognition
is:
• an asset in its entirety;
• specifically identified cash flows from an asset (or a group of similar financial assets);
• fully proportionate (pro rata) share of the cash flows from an asset (or a group of similar financial assets); or
• fully proportionate (pro rata) share of specifically identified cash flows from a financial asset (or a group of similar
financial assets).
Once the asset under consideration for derecognition has been determined, an assessment is made as to whether the
asset has been transferred, and if so, whether the transfer of that asset is subsequently eligible for derecognition.
Impairment
The impairment model is based on the premise of providing for expected losses.
General approach
With the exception of purchased or originated credit impaired financial assets, expected credit losses are measured
through a loss allowance at an amount equal to:
• the 12-month expected credit losses (expected credit losses that result from those default events on the financial
instrument that are possible within 12 months after the reporting date);
• or full lifetime expected credit losses (expected credit losses that result from all possible default events over the
life of the financial instrument).
A loss allowance for full lifetime expected credit losses is required for a financial instrument if the credit risk of that
financial instrument has increased significantly since initial recognition, as well as to contract assets or trade receivables
that do not constitute a financing transaction in accordance with IFRS 15.
Simplified approach
The Company and the Group apply the simplified approach for the following financial assets: trade receivables, IFRS
15 contract assets and lease receivables. For all other financial instruments, general approach is applied.
Independently of the two approaches mentioned above, the impairment method stayed the same under the new
standard in case of financial assets where there is an objective evidence on impairment. These are required to be
assessed on a case-by-case basis. The maximum amount of impairment accounted for by the Company and Group is
100% of unsecured part of the financial asset.
INA - INDUSTRIJA NAFTE, d.d.
Notes to the financial statements (continued)
For the year ended 31 December 2020
(all amounts are presented in HRK millions)
INA - Industrija nafte, d.d. 204
2. ACCOUNTING POLICIES (CONTINUED)
Financial liabilities
Initial recognition and measurement
Financial liabilities are classified, at initial recognition, as financial liabilities at fair value through profit or loss, loans and
borrowings, payables, or as derivatives designated as hedging instruments.
All financial liabilities are recognised initially at fair value and, in the case of loans and borrowings and payables, net of
directly attributable transaction costs. The Company’s and the Group’s financial liabilities include trade and other payables, loans and borrowings including bank overdrafts and derivative financial instruments.
Subsequent measurement
The measurement of financial liabilities depends on their classification.
Financial liabilities at fair value through profit or loss
Financial liabilities at fair value through profit or loss include financial liabilities held for trading and financial liabilities
designated upon initial recognition as at fair value through profit or loss. Financial liabilities are classified as held for
trading if they are incurred for the purpose of repurchasing in the near term. This category also includes derivative
financial instruments entered into by the Company and the Group that are not designated as hedging instruments in
hedge relationships as defined by IFRS 9. Separated embedded derivatives are also classified as held for trading unless
they are designated as effective hedging instruments. The Company and the Group do not have financial liabilities at
fair value through profit or loss.
Loans and borrowings
This is the category most relevant to the Company and the Group. After initial recognition, interest-bearing loans and
borrowings are subsequently measured at amortised cost. Gains and losses are recognised in profit or loss when the
liabilities are derecognised.
Amortised cost is calculated by taking into account any discount or premium on acquisition and fees or costs.
Derecognition of financial liabilities
A financial liability is removed from the statement of financial position when, and only when, it is extinguished, that is,
when the obligation specified in the contract is either discharged or cancelled or expires.
Where there has been an exchange between an existing borrower and lender of debt instruments with substantially
different terms, or there has been a substantial modification of the terms of an existing financial liability, this transaction
is accounted for as an extinguishment of the original financial liability and the recognition of a new financial liability. A
gain or loss from extinguishment of the original financial liability is recognized in profit or loss.
The Company and the Group do not have any financial instrument whose classification has changed as a result of
applying IFRS 9 and does not have any instrument that the Company and the Group designated upon initial recognition
as at fair value through profit or loss in order to reduce a measurement or recognition inconsistency.
Impairment is only accounted for trade receivables. No impairment is recognised on the remaining financial instruments
based on materiality, history and expectations.
INA - INDUSTRIJA NAFTE, d.d.
Notes to the financial statements (continued)
For the year ended 31 December 2020
(all amounts are presented in HRK millions)
INA - Industrija nafte, d.d. 205
2. ACCOUNTING POLICIES (CONTINUED)
Segmental information
IFRS 8 Operating segments requires operating segments to be identified on the basis of internal reports about
components of the Group that are regularly reviewed by the chief operating decision maker in order to allocate resources
to the segments and to assess their performance.
Provisions for decommissioning and other obligations
Provisions are recognised when the Company and the Group have a present obligation (legal or constructive) as a
result of a past event and it is probable (i.e. more likely than not) that an outflow of resources will be required to settle
the obligation, and a reliable estimate can be made of the amount of the obligation. The amount recognised as a
provision is the best estimate of the consideration required to settle the present obligation at the end of the reporting
period, taking into account the risks and uncertainties surrounding the obligation. When the effect of discounting is
material, the amount of the provision is the present value of the expenditures expected to be required to settle the
obligation, determined using the discount factor, which is calculated as CPI (Consumer Price Index), and real interest
rate. When discounting is used, the reversal of such discounting in each year is recognised as a financial expense and
the carrying amount of the provision increases in each year to reflect the passage of time.
Provision relating to the decommissioning and removal of assets, such as an oil and gas production facility are initially
treated as part of the cost of the related property, plant and equipment. Subsequent adjustments to the provision arising
from changes in estimates as decommissioning costs, reserves and production of oil and gas, risk free interest such as
discount rate and inflation rate are also treated as an adjustment to the cost of the property, plant and equipment and
thus dealt with prospectively in the statement of profit or loss through future depreciation of the asset. Any change to
the present value of the estimated costs is reflected as an adjustment of the provisions and the decommission assets.
Provision for emission quotas
Liability for emission is not recognized until the amount of actual emission reaches the amount of quota allocated free
of charge. This approach is due to the fact that allocated emission allowances are not recorded as intangibles, their
asset value is zero. When actual emission exceeds the amount of emission rights granted, provision should be made
on the actual market price for the exceeding emission allowances. It also means that it is not possible to record a
provision earlier than the date when emissions reach the amount of allowances granted, nor is it possible to spread the
expected shortfall through the calendar years.
Settlement with Government is carried out by offsetting the purchased rights with the provision recorded for the
exceeding emissions. Penalty will be accounted for if the shortfall is not covered by purchased quotas.
Provision should be calculated for each installation separately and recorded on emitting segment.
Revenue from Contracts with Customers
Under IFRS 15 the Company and the Group recognise revenue to depict the transfer of promised goods or services to
customers in an amount that reflects the consideration to which the Company and Group expect to be entitled in
exchange for those goods or services. This core principle is delivered in a five-step model framework.
The Company and the Group consider whether there are other promises in the contract that are separate performance
obligations to which a portion of the transaction price needs to be allocated.
INA - INDUSTRIJA NAFTE, d.d.
Notes to the financial statements (continued)
For the year ended 31 December 2020
(all amounts are presented in HRK millions)
INA - Industrija nafte, d.d. 206
2. ACCOUNTING POLICIES (CONTINUED)
Revenue from Contracts with Customers (continued)
In determining the transaction price, the Company and the Group consider the effects of variable consideration, the
existence of significant financing components, noncash consideration and consideration payable to the customer.
Presentation and disclosure
Contracts with customers are presented in statement of financial position as a contract liability, a contract asset, or a
receivable, depending on the relationship between the performance of the Company and the Group and the customer's
payment.
A contract liability is presented in the statement of financial position where a customer has paid an amount of
consideration prior to the performing by transferring the related good or service to the customer.
Where the Company and the Group have performed the obligation by transferring a good or service to the customer
and the customer has not yet paid the related consideration, a contract asset or a receivable is presented in the
statement of financial position, depending on the nature of right to consideration. A contract asset is recognised when
the Company’s and the Group’s right to consideration is conditional on something other than the passage of time, for
example future performance of the Company and the Group. A receivable is recognised when the Company’s and the
Group’s right to consideration is unconditional except for the passage of time.
Company’s and Group’s sales contracts generally comprise of only one performance obligation with the exception of
loyalty points programme. As such, the Company and the Group do not disclose information about the allocation of the
transaction price.
Excise duties
Excise duty is part of amounts collected on behalf of third parties and is excluded from revenues.
Construction – maintenance and service contracts
For each performance obligation satisfied over time, the Company and the Group recognizes revenue over time by
measuring the progress towards complete satisfaction of that performance obligation. Management elected to use input
method of calculating progress (costs incurred to date) in revenue recognition from construction contracts.
Loyalty points programme
The Company and the Group have an INA Loyalty Programme, Loyalty Points, which allows customers to accumulate
points and reach certain status. Each status achived enables customer to receive certain benefits. The Loyalty Points
give rise to a separate performance obligation as they provide a material right to the customer.
A portion of the transaction price is allocated to the loyalty points awarded to customers based on relative stand-alone
selling price and recognised as a contract liability until the benefits are used. Revenue is recognised upon usage of
benefits by the customer.
When estimating the stand-alone selling price of the loyalty points, Company and the Group conside the likelihood that
the customer will use the benefit. The Company and the Group updates its estimates of the benefits that will be used
by the customers on a monthly basis and any adjustments to the contract liability balance are charged against revenue.
INA - INDUSTRIJA NAFTE, d.d.
Notes to the financial statements (continued)
For the year ended 31 December 2020
(all amounts are presented in HRK millions)
INA - Industrija nafte, d.d. 207
2. ACCOUNTING POLICIES (CONTINUED)
Government grants
Government grants are recognised where there is reasonable assurance that the grant will be received and all attached
conditions will be complied with. When the grant relates to an expense item, it is recognised as income on a systematic
basis over the periods that the related costs, for which it is intended to compensate, are expensed. When the grant
relates to an asset, it is recognised as income in equal amounts over the expected useful life of the related asset.
When the Company and the Group receives grants of non-monetary assets, the asset and the grant are recorded at
nominal amounts and released to profit or loss over the expected useful life of the asset, based on the pattern of
consumption of the benefits of the underlying asset by equal annual instalments. The Group has chosen to present
grants related to income to be deducted with related expense in the statement of profit or loss.
INA - INDUSTRIJA NAFTE, d.d.
Notes to the financial statements (continued)
For the year ended 31 December 2020
(all amounts are presented in HRK millions)
INA - Industrija nafte, d.d. 208
3. SIGNIFICANT ACCOUNTING JUDGEMENTS AND ESTIMATES
Critical judgements and estimates in applying accounting policies
In the application of the accounting policies, which are described in note 2, Management made certain judgements and
estimates that had a significant impact on the amounts reported in the financial statements (irrespective of the
underlying estimates).
The preparation of financial statements in conformity with International Financial Reporting Standards, as adopted by
EU requires management to make estimates and assumptions that affect the reported amounts of assets, liabilities,
income and expenses and disclosure of contingencies. The significant areas of estimation used in the preparation of
the accompanying financial statements relate to employee benefits, impairment of assets, determination of fair values
of assets and liabilities, estimated decommissioning costs, environmental provision and provision for legal cases as
well as carrying value of investments and given loans to subsidiaries and contract balances. Future events may occur
which will cause the assumptions used in arriving at the estimates to change. The effect of any changes in estimates
will be recorded in the financial statements when determinable.
These judgements and estimates are provided in detail in the accompanying notes. However, the critical judgements
and estimates relate to the following areas:
Consequences of certain legal actions
The Group is involved in number of litigations arisen from the regular course of business. If there is a present obligation
as a result of a past event (taking into account all available evidence, including the opinion of law experts) for which it
is probable that outflow of resources will be required to settle the obligation and if a reliable estimate can be made of
the amount of the obligation, provisions are recorded (see note 30).
Carrying value of property, plant and equipment
The impairment calculation requires the estimate of the value in use of the cash generating units. Value in use is
measured using the discounted cash flow projections. The most significant variables in determining cash flows are
expected oil and gas prices, production volumes, operating and capital expenditures, discount rates, period of cash flow
projections, as well as assumptions and judgments used in determining cash receipts and payments. The net
impairment of assets in the consolidated statement of profit or loss amounted to HRK 490 million in 2020 at INA Group
and 353 million at INA, d.d. (2019: INA Group HRK 325 million and INA, d.d.187 million HRK).
Carrying value of goodwill
In 2020 impairment of goodwill was recognised in amount of 94 million (2019 there was no goodwill impairment). The
carrying amount of goodwill amounted to HRK 58 million as of 31 December 2020 (31 December 2019: 152 million (see
note 13).
Carrying value of intangible exploration and appraisal assets
The carrying amount of intangible exploration and appraisal assets amounted to HRK 209 million as of 31 December
2020 and HRK 245 million as of 31 December 2019 (see note 13). In 2020 write-off of negative wells is reported in
amount of HRK 1 million at INA Group and INA, d.d. In 2019 no impairment was reported.
INA - INDUSTRIJA NAFTE, d.d.
Notes to the financial statements (continued)
For the year ended 31 December 2020
(all amounts are presented in HRK millions)
INA - Industrija nafte, d.d. 209
3. SIGNIFICANT ACCOUNTING JUDGEMENTS AND ESTIMATES (CONTINUED)
Critical judgements and estimates in applying accounting policies (continued)
Carrying value of production oil and gas assets
The carrying amount of production oil and gas assets amounted to HRK 4,024 million as of 31 December 2020 (2019:
HRK 3,224 million) (see note 14). In 2020 the Group recognized impairment of production oil and gas assets for HRK
94 million and asset impairment reversals for HRK 96 million for 2020 in line with the industry and MOL Group practice
to estimate the future cash flows based on the Proved and Probable (2P) reserve level, which is a more accurate basis
for determining management’s best estimate of future cash flows instead of earlier used Proved (1P) reserve level
(2019: HRK 289 million impairment) (see note 14). As of 31 December 2020, write-off of negative wells in the amount
of HRK 57 million was recognized (2019: no write-off of negative wells).
Carrying value of Refining and Marketing assets
The carrying amount of Refining and Marketing assets amounted to HRK 6,278 as of 31 December 2020 and HRK
6,547 million as of 31 December 2019. In 2020 the Group and INA, d.d. recognized impairment of Refinery Sisak in the
amount of HRK 295 million (2019: HRK 36 million).
Key assumptions used
Refining and Marketing
INA’s management conducted an analysis of potential impairment triggers, in order to identify whether the key value drivers of the business (market demand, crack spreads, oil price) turned considerably to the worse and whether there
have been significant changes in business operation which could disrupt future cash flows.
Due to the Refining and Marketing restructuring and decision to suspend the operation of major part of Sisak Refinery
units for an indefinite period, INA’s management saw the indication that Sisak Refinery assets, which will be no longer
in use, should be impaired. Identification of assets that will no longer be in use was made based on detailed asset by
asset analysis, conducted by multidisciplined team, separating the assets that will still be in use and bring future value
for the Refining & Marketing CGU from the assets that will no longer be in use in its current state and will not generate
future cash flows starting from October 2020. Impairment of identified unutilized Sisak Refinery assets was conducted
in Q3 2020 in the amount of HRK 295 million, meaning that such assets was fully impaired to zero net book value.
Further on, due to the longer lasting and remarkable impact of COVID-19 pandemic and consequent economic crisis
on crude derivatives demand and margins, triggering event for impairment test was identified at the Refining & Marketing
CGU. Impairment test was performed on the entire Refining & Marketing segment CGU level with the conclusion that
there was no need for further impairment of Refining & Marketing assets.
Exploration and Production
Following the disruption of oil and gas prices caused by the temporary suspension of part of the economic activities due
to the COVID-19 pandemic, an indicator for testing the impairment of INA's oil and gas fields was identified in Q2 2020.
Impairment of assets in the amount of HRK 44 million was recorded as at 30 June 2020.
INA - INDUSTRIJA NAFTE, d.d.
Notes to the financial statements (continued)
For the year ended 31 December 2020
(all amounts are presented in HRK millions)
INA - Industrija nafte, d.d. 210
3. SIGNIFICANT ACCOUNTING JUDGEMENTS AND ESTIMATES (CONTINUED)
Critical judgements and estimates in applying accounting policies (continued)
Key assumptions used (continued)
Exploration and Production (continued)
As part of standard practice, resources and reserves level wass assessed at the year end. Within the most relevant
profiles, no fields with negative reserves change above materiality threshold have been identified. However, in line with
the industry and MOL Group practice the Proved and Probable (2P) reserve level is a more accurate basis for
determining management’s best estimate on future cash flows instead of earlier used Proved (1P) reserve level. Therefore, trigger exists for the reversal of earlier accounted impairment. Impairment test was performed as at 31
December 2020, with HRK 96 million reversal and HRK 50 million impairment recorded. The write-off of negative wells
in amount of HRK 57 million were recorded during 2020.
At 31 December 2020, the total effect of impairment test and value adjustments in Exploration & Production resulted in
HRK 151 million of impairment and HRK 96 million reversal of impairment.
Investments in Syria
Since 1998 INA, d.d. has had six (6) commercial discoveries on the Hayan Block (Jihar, Al Mahr, Jazal, Palmyra,
Mustadira and Mazrur) with significant oil, gas and condensate reserves. INA, d.d. temporarily suspended all business
activities in Syria on 26 February 2012 by announcing Force Majeure to comply with the relevant sanctions of the US
and the EU.
Current situation
Main production activities have been taken over by Hayan Petroleum Company’s local workforce, which INA, d.d.
considers illegal.
Company has assessed situation in Syria and identified no material change compared to previous years. EU sanctions
remain in place and the political situation has not changed significantly either for the better of worse from INA’s investment perspective. INA, d.d. expects similar costs and benefits in case of return to operation of Syrian fields.
Therefore, no triggering event for asset impairment was identified in 2020.
In line with the Petroleum Resources Management System (PRMS) rules, and the fact that Syrian assets are under
Force Majeure and INA, d.d. has no control for a period of almost 8 years, the reserves are shifted from 2P to 2C
category in 2017. No changes in 2020.
Political developments in Egypt
Concerning the INA, d.d. operations in Egypt the key uncertainty of business is the timing of receivables collection. At
31 December 2020 gross book value of Egyptian General Petroleum Corporation receivables amounted to HRK 165
million out of which HRK 61 million was value adjusted. During 2020, INA, d.d. managed to collect previously value
adjusted receivables in the amount of HRK 47 million. Improvement in collection of receivables is due to better market
environment in Egypt.
INA - INDUSTRIJA NAFTE, d.d.
Notes to the financial statements (continued)
For the year ended 31 December 2020
(all amounts are presented in HRK millions)
INA - Industrija nafte, d.d. 211
3. SIGNIFICANT ACCOUNTING JUDGEMENTS AND ESTIMATES (CONTINUED)
Critical judgements and estimates in applying accounting policies (continued)
Quantification and determination of the decommissioning obligations for oil and gas properties
Decommissioning costs are uncertain and cost estimates can vary in response to many factors, including changes to
legal and regulatory requirements, new technologies becoming available and experience of decommissioning other
assets. The expected timing, scope, expenditure and risk profile may also change. Therefore, significant estimates and
assumptions are made in determining decommissioning provisions. The provision estimate requires significant
management judgement and is reviewed on annual basis.
Management makes estimates of future expenditure in connection with decommissioning obligations using prices by
reference to prior similar activities, as well as other assumptions like the estimated effects of any changes in local
regulations, management's expected approach to decommissioning, cost estimates and discount rates. Furthermore,
the time determined for the cash flows reflects the current estimates of priorities, technical equipment requirements and
urgency of the obligations. The obligation with respect to the decommissioning provision for oil and gas properties
amounted to HRK 3,369 for INA, d.d. and HRK 3,146 million at INA Group as at 31 December 2020 (31 December
2019: HRK 3,301 million INA, d.d. and HRK 3,086 INA Group) (see note 30).
The level of provisioning for environmental obligations
The applicable regulations, specifically the environmental protection legislation, do not specify the exact scope of
activities or technology to be applied in provision based environmental liabilities. Provisions are recognised when the
Group has a present obligation (legal or constructive) because of a past event and it is probable (i.e. more likely than
not) that an outflow of resources will be required to settle the obligation, and a reliable estimate can be made of the
amount of the obligation.
Generally, the timing of provisions coincides with the commitment to a formal plan of action or, if earlier, on divestment
or on closure of inactive sites. In determining the level of provisions for environmental obligations, the management
relies on prior experience and their own interpretation of the related legislation. Where the liability will not be settled for
a number of years, the amount recognized is the present value of the estimated future expenditure. At 31 December
2020 INA Group recognized environmental provision in the amount of HRK 327 million (2019: HRK 361 million) and
INA, d.d in the amount of HRK 323 million (2019: HRK 356 million) (see note 30), which covers investigation to
determine the extent of contamination at specific site, treatment of accumulated waste generated by former activity,
preliminary site investigation with corresponding laboratory analyses, soil excavation and replacement during the
reconstruction of service stations and provision for emission quotas. It does not cover the cost of remediation in lack of
detailed National regulations.
INA - INDUSTRIJA NAFTE, d.d.
Notes to the financial statements (continued)
For the year ended 31 December 2020
(all amounts are presented in HRK millions)
INA - Industrija nafte, d.d. 212
3. SIGNIFICANT ACCOUNTING JUDGEMENTS AND ESTIMATES (CONTINUED)
Critical judgements and estimates in applying accounting policies (continued)
Availability of taxable profit against which the deferred tax assets can be utilised
A deferred tax asset is recognized for unused tax losses to the extent that is probable that taxable profit will be available
against which the losses can be utilised. Significant management judgement is required to determine the amount of
deferred tax assets that can be recognised, based upon the likely timing and the level of future taxable profits, together
with future tax planning savings. Determining the amount of deferred taxes that can be recognised requires a significant
level of judgement, which is based on the probable quantification of the time and level of future taxable profits, together
with the future tax planning strategy.
Management believes that deferred tax asset recognized is recoverable. At 31 December 2020 the carrying amount of
deferred tax assets of the INA Group amounted to HRK 1,210 million (2019: HRK 1,035 million) and deferred tax
liabilities amounted to HRK 16 million at 31 December 2020 (2019: HRK 15 million). At 31 December 2020 the carrying
amount of deferred tax assets of INA, d.d. amounted to HRK 1,054 million, (31 December 2019: HRK 929 million
respectively) (see note 11). If the Group was able to recognise all unrecognised deferred tax assets, profit and equity
would have increased by HRK 19 million at 31 December 2020 (31 December 2019: HRK 28 million).
Actuarial estimates used determining the retirement bonuses
The cost of defined benefits is determined using actuarial estimates. Actuarial estimates involve assumptions of
discount rates, future salary increases and the mortality or fluctuation rates. Because of the long-term nature of those
plans, there is uncertainty surrounding those estimates. Provisions for retirement bonuses and jubilee awards for INA
Group amounted to HRK 68 million as at 31 December 2020 (31 December 2019: HRK 77 million), and INA, d.d.
amounted to HRK 19 million as at 31 December 2020 (31 December 2019: HRK 22 million) (see note 31).
Useful life of the assets
The INA Group and INA, d.d. review the estimated useful lives of property, plant and equipment at the end of each
reporting period. Estimation of useful life is considered to be a significant accounting estimation that effects on the
change in depreciation rates. The new review of asset useful life at the end of 2020 had no significant changes
compared to the previous estimate.
Lease term duration estimates
The Company and the Group has applied judgement to determine the lease term for all lease contracts that include
renewal or termination options. The assessment of whether the Company or Group is reasonably certain to exercise
such options impacts the lease term, which significantly affects the amount of lease liabilities and leased assets
recognised. A change in the scope of a lease includes adding or terminating the right to use one or more underlying
assets or shortening the contractual lease term. A lease payment holiday or lease payment reduction caused by COVID-
19 alone is a change in consideration for a lease and is not, a change in the scope of a lease.
INA - INDUSTRIJA NAFTE, d.d.
Notes to the financial statements (continued)
For the year ended 31 December 2020
(all amounts are presented in HRK millions)
INA - Industrija nafte, d.d. 213
3. SIGNIFICANT ACCOUNTING JUDGEMENTS AND ESTIMATES (CONTINUED)
Critical judgements and estimates in applying accounting policies (continued)
Estimates of incremental borrowing rate for lease contracts
The Company and the Group cannot readily determine the interest rate implicit in the lease, therefore, it uses its
incremental borrowing rate (IBR) to measure lease liabilities. The incremental borrowing rate is the rate of interest that
the company would have to pay to borrow over a similar term, and with a similar security, the funds necessary to obtain
an asset of a similar value to the right-of-use asset in a similar economic environment. The incremental borrowing rate
therefore reflects what the company ‘would have to pay’, which requires estimation when no observable rates are available (such as for subsidiaries that do not enter into financing transactions) or when they need to be adjusted to
reflect the terms and conditions of the lease.
The Group estimates the incremental borrowing rate using observable inputs (such as market interest rates) when
available and is required to make certain entity-specific estimates (such as the subsidiary’s stand-alone credit rating).
INA, d.d and INA Group review the estimated borrowing rates on quarterly basis.
Hydrocarbon reserves
Exploration and development projects involve many uncertainties and business risks that may give rise to significant
expenditures. Exploration and development projects of the Company and the Group may be delayed or unsuccessful
for many various reasons, including budgeted cost overrun, geological issues, difficulties in meeting the requirements
of competent bodies, lacks of equipment and technical problems. These projects, particularly those pertaining to the
wells in continental areas or other demanding terrain, often require deployment of new and advanced technologies, the
development, purchase and installation of which may be expensive and that may not operate as expected.
Oil and natural gas exploration and drilling activities are subject to a wide range of inherent risks, including the risk of
eruption, deposit damage, loss of control over the wells, perforation, craters, fire and natural disasters.
The Company and the Group estimate and report hydrocarbon reserves in line with the principles contained in the SPE
Petroleum Resources Management Reporting System (PRMS) framework. Estimation of hydrocarbon reserves is a
significant area of judgement due to the technical uncertainty in assessing quantities and complex contractual
arrangements dictating the Company’s and the Group’s share of reportable volumes.
As the economic assumptions used may change and as additional geological information is obtained during the
operation of a field, estimates of recoverable reserves may change. Such changes may affect the Company’s and the Group’s reported financial position and results, which include:
• The carrying value of exploration and evaluation assets; oil and gas properties; property, plant and equipment;
and goodwill may be affected due to changes in estimated future cash flows;
• Depreciation and amortization charges in the statement of profit or loss and other comprehensive income may
change where such charges are determined using the Units of Production (UOP) method, or where the useful
life of the related assets change;
• Provisions for decommissioning may require revision where changes to the reserve estimates affect expectations
about when such activities will occur and the associated cost of these activities;
• The recognition and carrying value of deferred tax assets may change due to changes in the judgments regarding
the existence of such assets and in estimates of the likely recovery of such assets.
As part of standard practice, resources and reserves level were assessed at the year end. Within the most relevant
profiles, no fields with negative reserves change above materiality threshold have been identified. However, in line with
the industry practice the Proved and Probable (2P) reserve level is a more accurate basis for determining management’s best estimate on future cash flows instead of earlier used Proved (1P) reserve level.
INA - INDUSTRIJA NAFTE, d.d.
Notes to the financial statements (continued)
For the year ended 31 December 2020
(all amounts are presented in HRK millions)
INA - Industrija nafte, d.d. 214
3. SIGNIFICANT ACCOUNTING JUDGEMENTS AND ESTIMATES (CONTINUED)
Critical judgements and estimates in applying accounting policies (continued)
Carrying value of investments and given loans to subsidiaries (INA, d.d.)
The carrying amount of the investment in subsidiaries amounts to HRK 1,827 million as at 31 December 2020 and HRK
2,089 million as at 31 December 2019. The carrying amount of loans granted to subsidiaries amounts to HRK 793
million as at 31 December 2020 and HRK 768 million at 31 December 2019.
Due to the significance exposure to subsidiaries (calculated as the sum of carrying value of investment and given loans,
net) the existence of impairment indicators requires significant Management judgment in determining the appropriate
approach for testing impairment.
Contract balances
INA Group INA, d.d.
2020 2019 2020 2019
Trade receivables 1,206 2,026 866 1,663
Contract asset - 7 - -
Contract liabilities 22 99 - 38
Trade receivables are non-interest bearing and are generally on terms of 3 to 30 days.
Contract assets are initially recognised for revenue earned from construction services as receipt of consideration is
conditional on successful completion of construction. Upon completion of construction services and acceptance by the
customer, the amounts recognised as contract assets are reclassified to trade receivables.
Contract liabilities include short-term advances received for construction services in amount of HRK 22 million in 2020
as well as HRK 99 million in 2019. The remaining performance obligations are expected to be recognised in following
year.
Contract assets and contract liabilities are not presented in separate line in statement of financial position because they
are not considered to be significant for the Company and the Group. Contract assets are presented in line other current
asset while contract liabilities are presented in line other current liabilities in statement of financial position.
Performance obligations
Revenue from the sale and transportation of crude oil, natural gas, petroleum products and other merchandise is
recognised when the customer obtains control of the goods, which is normally when title passes to the customer and
the customer takes the physical possession, based on the contractual terms of the agreements.
Sales agreements mainly represent one performance obligation and the Company and the Group principally satisfies
its performance obligations at a point in time.

INA - INDUSTRIJA NAFTE, d.d.
Notes to the financial statements (continued)
For the year ended 31 December 2020
(all amounts are presented in HRK millions)
INA - Industrija nafte, d.d. 215
3. SIGNIFICANT ACCOUNTING JUDGEMENTS AND ESTIMATES (CONTINUED)
Reclassification position of profit and loss and statement of financial position account
In 2020 INA Group and INA, d.d. reclassified interest arising from tax liabilities and contributions from financial expenses
to service costs. Reclassification was made for accounts of margining receivables that are reclassified from line Other
current asset to line Other receivables in amount of HRK 24 million. The reclassification is performed in accordance
with new INA Group Accounting policies and procedures and the comparable periods restated.
The effect of reclassification of account of profit and loss and statement of financial position are as follows:
INA Group
31 December 2019 before
reclassification Reclassification 31 December 2019
reclassified
Service costs (626) (3) (629)
Financial expenses (180) 3 (177)
Total (806) - (806)
Other receivables 143 24 167
Other current assets 136 (24) 112
Total 279 - 279
INA, d.d.
31 December 2019 before
reclassification Reclassification 31 December 2019
reclassified
Service costs (859) - (859)
Financial expenses (155) - (155)
Total (1,014) - (1,014)
Other receivables 86 24 110
Other current assets 132 (24) 108
Total 218 - 218
INA - INDUSTRIJA NAFTE, d.d.
Notes to the financial statements (continued)
For the year ended 31 December 2020
(all amounts are presented in HRK millions)
INA - Industrija nafte, d.d. 216
4. SEGMENT INFORMATION
The INA Group operates through three core business segments. The strategic business segments offer different
products and services. Reporting segments, which in INA Group represent business operations, have been defined
along value chain standard for the oil companies:
• Exploration and Production - exploration, production and selling of crude oil;
• Refining and Marketing - crude oil processing, wholesale of refinery products, selling of natural gas, selling of
fuels and commercial goods in retail stations and logistics; and
• Corporate and other - in addition to the core segments above, the operations of INA Group provides services for
core activities.
Information regarding the results of each reportable segment is included below. Profit from operations is used to
measure performance, as management believes that such information is the most relevant in evaluating the result of
certain segments. However, Group financing (including finance costs and finance income) and income taxes are
managed on Group basis and are not relevant to making business decisions at the level of business segments.
Intersegment transfer represents the effect of unrealized profit arising in respect of transfers of inventories from
Exploration and Production to Refining and Marketing. Evaluation of inventories of domestic crude, finished and semi-
finished products in Refining and Marketing is based on the transfer price from Exploration and Production to Refining
and Marketing. Elimination of unrealized profit (difference between transfer price and cost of domestic crude) is
performed through intersegment transfer. For segmental reporting purposes, the transferor segment records a profit
immediately at the point of transfer. However, at the Company level profit is only reported when the related third party
sale has taken place.
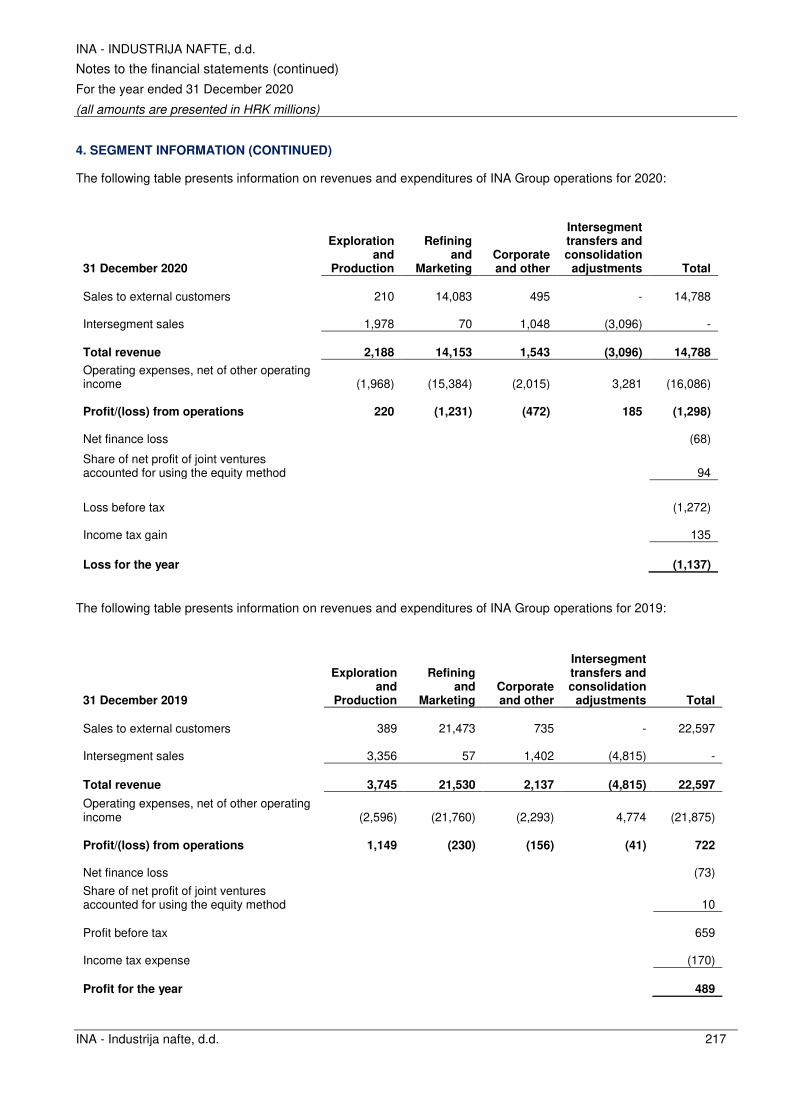
INA - INDUSTRIJA NAFTE, d.d.
Notes to the financial statements (continued)
For the year ended 31 December 2020
(all amounts are presented in HRK millions)
INA - Industrija nafte, d.d. 217
4. SEGMENT INFORMATION (CONTINUED)
The following table presents information on revenues and expenditures of INA Group operations for 2020:
31 December 2020
Exploration
and Production
Refining and
Marketing Corporate and other
Intersegment transfers and consolidation
adjustments Total
Sales to external customers
210
14,083
495
-
14,788
Intersegment sales
1,978
70
1,048
(3,096)
-
Total revenue
2,188
14,153
1,543
(3,096)
14,788
Operating expenses, net of other operating income
(1,968)
(15,384)
(2,015)
3,281
(16,086)
Profit/(loss) from operations
220
(1,231)
(472)
185
(1,298)
Net finance loss
(68)
Share of net profit of joint ventures accounted for using the equity method
94
Loss before tax
(1,272)
Income tax gain
135
Loss for the year
(1,137)
The following table presents information on revenues and expenditures of INA Group operations for 2019:
31 December 2019
Exploration
and Production
Refining and
Marketing Corporate and other
Intersegment transfers and consolidation
adjustments Total
Sales to external customers
389
21,473
735
-
22,597
Intersegment sales
3,356
57
1,402
(4,815)
-
Total revenue
3,745
21,530
2,137
(4,815)
22,597
Operating expenses, net of other operating income
(2,596)
(21,760)
(2,293)
4,774
(21,875)
Profit/(loss) from operations
1,149
(230)
(156)
(41)
722
Net finance loss
(73)
Share of net profit of joint ventures accounted for using the equity method
10
Profit before tax
659
Income tax expense
(170)
Profit for the year
489

INA - INDUSTRIJA NAFTE, d.d.
Notes to the financial statements (continued)
For the year ended 31 December 2020
(all amounts are presented in HRK millions)
INA - Industrija nafte, d.d. 218
4. SEGMENT INFORMATION (CONTINUED)
The following table presents information of financial position of INA Group operations for 2020:
31 December 2020 Assets and liabilities
Exploration
and Production
Refining and
Marketing Corporate and other
Intersegment transfers and consolidation
adjustments Total
Intangible assets 229 44 212 - 485
Property, plant and equipment 4,592 6,417 1,177 (486) 11,700
Right-of-use asset 11 257 41 (5) 304 Investments in associates and joint venture - 254 - - 254
Inventories 166 1,343 220 (105) 1,624
Trade receivables, net 116 944 334 (188) 1,206
Not allocated assets 3,423
Total assets 18,996
Trade payables 196 1,064 353 (187) 1,426
Not allocated liabilities 8,213
Total liabilities 9,639
Other segment information
Property, plant and equipment 426 747 64 (24) 1,213
Intangible assets 16 1 52 - 69
Capital expenditure: 442 748 116 (24) 1,282
Depreciation, amortisation (net) 739 783 279 (2) 1,799 Impairment of tangible and intangible assets (net) 54 295 141 - 490
Impairment charges (net)* 22 58 24 4 108
The following table presents information of financial position of INA Group operations for 2019:
31 December 2019 Assets and liabilities
Exploration
and Production
Refining and
Marketing Corporate and other
Intersegment transfers and consolidation
adjustments Total
Intangible assets 276 76 283 - 635
Property, plant and equipment 4,932 6,674 1,422 (461) 12,567
Right-of-use asset 13 283 52 (6) 342 Investments in associates and joint venture - 160 - - 160
Inventories 170 2,212 231 (314) 2,299
Trade receivables, net 199 1,730 455 (358) 2,026
Not allocated assets 3,503
Total assets 21,532
Trade payables 289 1,138 443 (359) 1,511
Not allocated liabilities 8,805
Total liabilities 10,316
Other segment information
Property, plant and equipment 608 1,329 135 (54) 2,018
Intangible assets 79 7 46 - 132
Capital expenditure: 687 1,336 181 (54) 2,150
Depreciation, amortisation (net) 918 712 180 (1) 1,809 Impairment of tangible and intangible assets (net) 289 36 - - 325
Impairment charges (net)* 5 (87) (19) (8) (109)
* See note 8

INA - INDUSTRIJA NAFTE, d.d.
Notes to the financial statements (continued)
For the year ended 31 December 2020
(all amounts are presented in HRK millions)
INA - Industrija nafte, d.d. 219
4. SEGMENT INFORMATION (CONTINUED)
BY GEOGRAPHICAL
INA Group
31 December 2020
Republic of Croatia Egypt Angola Syria
Other countries Total
Intangible assets 397 - - - 88 485
Property, plant and equipment 10,408 130 54 242 866 11,700
Right-of-use asset 285 - - - 19 304 Investments in associates and joint venture - - - - 254 254
Inventories 1,461 9 45 - 109 1,624
Trade receivables, net 823 114 - - 269 1,206
Not allocated assets 3,423
Total assets 18,996
Other segment information
Property, plant and equipment 1,092 82 12 - 27 1,213
Intangible assets 69 - - - - 69
Capital expenditure: 1,161 82 12 - 27 1,282
INA Group
31 December 2019
Republic of Croatia Egypt Angola Syria
Other countries Total
Intangible assets 451 - - - 184 635
Property, plant and equipment 11,040 224 56 263 984 12,567
Right-of-use asset 317 - - - 25 342 Investments in associates and joint venture
160 - - - -
160
Inventories 2,099 10 16 - 174 2,299
Trade receivables, net 1,181 182 - - 663 2,026
Not allocated assets 3,503
Total assets 21,532
Other segment information
Property, plant and equipment 1,758 99 8 - 153 2,018
Intangible assets 71 60 - - 1 132
Capital expenditure: 1,829 159 8 - 154 2,150
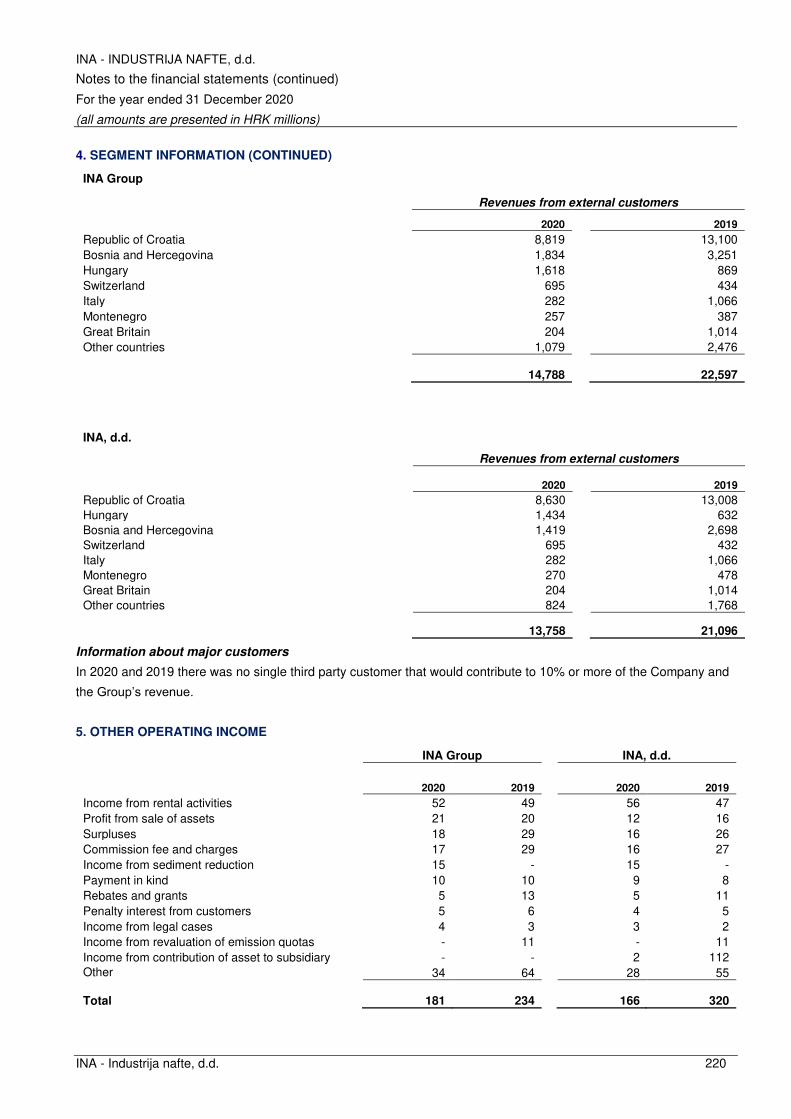
INA - INDUSTRIJA NAFTE, d.d.
Notes to the financial statements (continued)
For the year ended 31 December 2020
(all amounts are presented in HRK millions)
INA - Industrija nafte, d.d. 220
4. SEGMENT INFORMATION (CONTINUED)
INA Group
Revenues from external customers
2020 2019
Republic of Croatia 8,819 13,100
Bosnia and Hercegovina 1,834 3,251
Hungary 1,618 869
Switzerland 695 434
Italy 282 1,066
Montenegro 257 387
Great Britain 204 1,014
Other countries 1,079 2,476
14,788 22,597
INA, d.d.
Revenues from external customers
2020 2019
Republic of Croatia 8,630 13,008
Hungary 1,434 632
Bosnia and Hercegovina 1,419 2,698
Switzerland 695 432
Italy 282 1,066
Montenegro 270 478
Great Britain 204 1,014
Other countries 824 1,768
13,758 21,096
Information about major customers
In 2020 and 2019 there was no single third party customer that would contribute to 10% or more of the Company and
the Group’s revenue.
5. OTHER OPERATING INCOME
INA Group INA, d.d.
2020 2019 2020 2019
Income from rental activities 52 49 56 47
Profit from sale of assets 21 20 12 16
Surpluses 18 29 16 26
Commission fee and charges 17 29 16 27
Income from sediment reduction 15 - 15 -
Payment in kind 10 10 9 8
Rebates and grants 5 13 5 11
Penalty interest from customers 5 6 4 5
Income from legal cases 4 3 3 2
Income from revaluation of emission quotas - 11 - 11
Income from contribution of asset to subsidiary - - 2 112
Other 34 64 28 55
Total 181 234 166 320
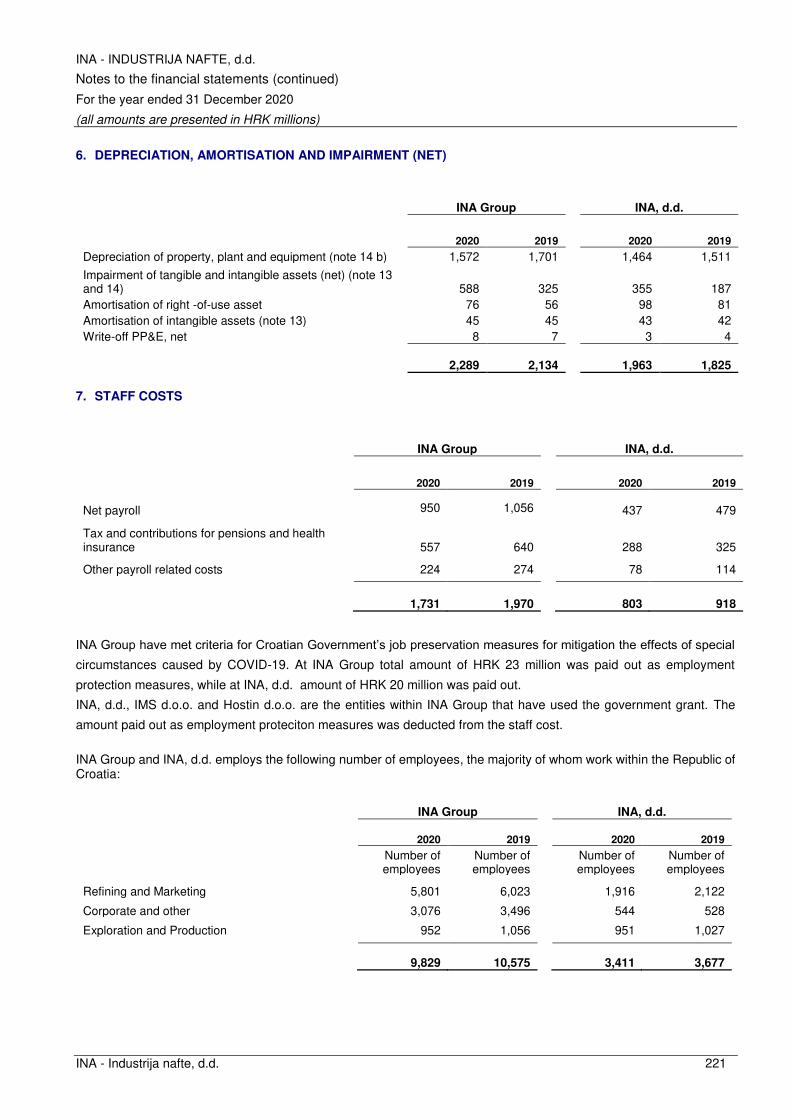
INA - INDUSTRIJA NAFTE, d.d.
Notes to the financial statements (continued)
For the year ended 31 December 2020
(all amounts are presented in HRK millions)
INA - Industrija nafte, d.d. 221
6. DEPRECIATION, AMORTISATION AND IMPAIRMENT (NET)
INA Group
INA, d.d.
2020 2019 2020 2019
Depreciation of property, plant and equipment (note 14 b) 1,572 1,701 1,464 1,511
Impairment of tangible and intangible assets (net) (note 13 and 14) 588 325 355 187
Amortisation of right -of-use asset 76 56 98 81
Amortisation of intangible assets (note 13) 45 45 43 42
Write-off PP&E, net 8 7 3 4
2,289 2,134 1,963 1,825
7. STAFF COSTS
INA Group
INA, d.d.
2020 2019 2020 2019
Net payroll 950 1,056
437 479
Tax and contributions for pensions and health insurance 557 640 288 325
Other payroll related costs 224 274 78 114
1,731 1,970 803 918
INA Group have met criteria for Croatian Government’s job preservation measures for mitigation the effects of special circumstances caused by COVID-19. At INA Group total amount of HRK 23 million was paid out as employment
protection measures, while at INA, d.d. amount of HRK 20 million was paid out.
INA, d.d., IMS d.o.o. and Hostin d.o.o. are the entities within INA Group that have used the government grant. The
amount paid out as employment proteciton measures was deducted from the staff cost.
INA Group and INA, d.d. employs the following number of employees, the majority of whom work within the Republic of Croatia:
INA Group
INA, d.d.
2020 2019 2020 2019
Number of employees
Number of employees
Number of employees
Number of employees
Refining and Marketing 5,801 6,023 1,916 2,122
Corporate and other 3,076 3,496 544 528
Exploration and Production 952 1,056 951 1,027
9,829 10,575 3,411 3,677

INA - INDUSTRIJA NAFTE, d.d.
Notes to the financial statements (continued)
For the year ended 31 December 2020
(all amounts are presented in HRK millions)
INA - Industrija nafte, d.d. 222
8. IMPAIRMENT CHARGES (NET)
INA Group
INA, d.d.
2020 2019
2020 2019
Impairment of inventory, net 83 107 65 96
Impairment of trade receivables, net* 10 (7) 10 (24)
Other impairment, net 15 9 5 7
108 109
80 79
*see note 3
9. PROVISIONS FOR CHARGES AND RISKS (NET)
INA Group
INA, d.d.
2020 2019
2020 2019
Provision for incentives 28 5 21 8
Provision/(utilisation of provision) for renewable energy 3 (63)
3 (63)
Utilisation of provision for emission rights (25) (51) (25) (51)
Utilisation of provision for environmental liabilities (15) (6) (14) (4)
Utilisation of provision for legal claims (8) (29) (4) (23)
(Utilisation of provision)/provision for retirement and jubilee benefits (5) 7 (2) -
Provision for decommissioning charges - - - 69
Other provisions 13 11 10 8
(9) (126)
(11) (56)

INA - INDUSTRIJA NAFTE, d.d.
Notes to the financial statements (continued)
For the year ended 31 December 2020
(all amounts are presented in HRK millions)
INA - Industrija nafte, d.d. 223
10. FINANCE INCOME AND FINANCE COST
INA Group
INA, d.d.
2020 2019 2020 2019
Foreign exchange gains from trade receivables and payables 69 44 29 27
Foreign exchange gains from loans and cash 59 20 58 19
Interest received and other financial income 28 30 53 54
Dividends received 9 10 9 10
Profit allocation received from subsidiaries - - 25 62
Reversal of impairment from investment - - 1 1
Finance income 165 104 175 173
Foreign exchange losses from trade receivables and payables 103 40 71 17
Interest expense 71 76 77 80
Foreign exchange losses from loans and cash 41 42 38 40
Fees on bank loans 18 11 18 11
Interest lease for right-of-use asset 4 3 3 2
Capitalized borrowing costs (7) (5) (7) (5)
Foreign exchange losses from provisions - 7 - 7
Interest for long-term loans - 1 - 1
Other financial costs 3 2 2 2
Finance costs 233 177 202 155
Net (loss)/gain from financial activities (68) (73) (27) 18
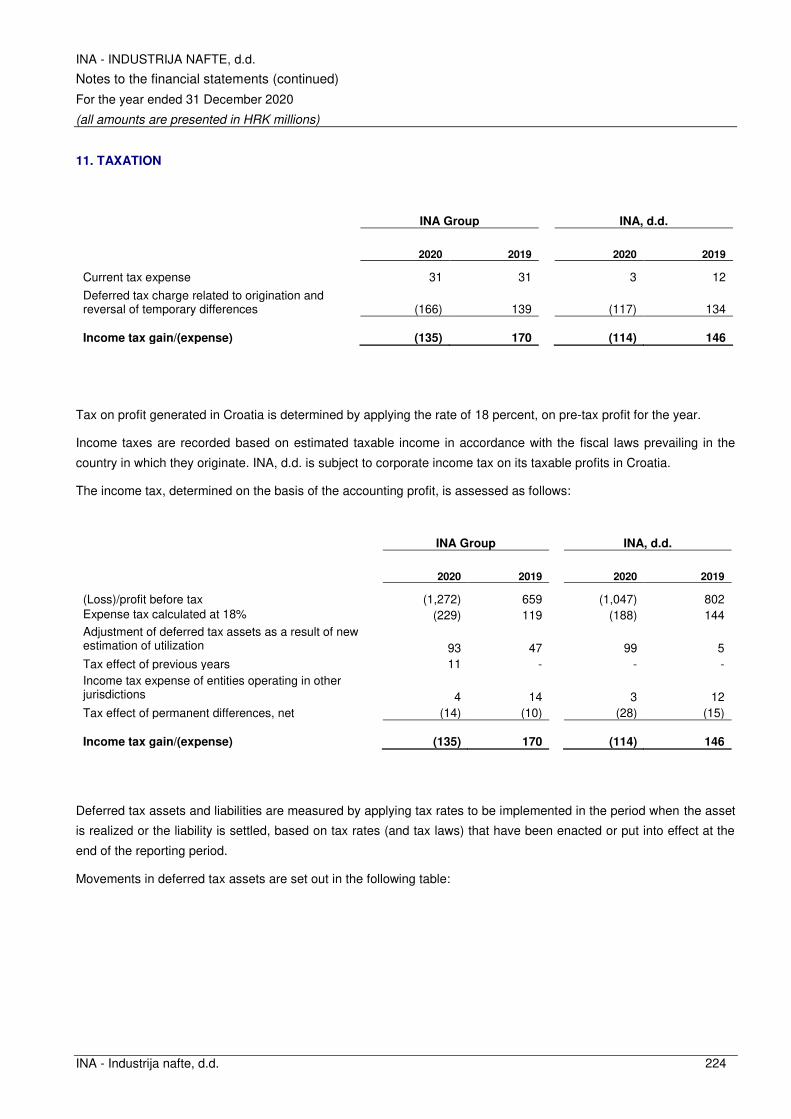
INA - INDUSTRIJA NAFTE, d.d.
Notes to the financial statements (continued)
For the year ended 31 December 2020
(all amounts are presented in HRK millions)
INA - Industrija nafte, d.d. 224
11. TAXATION
INA Group INA, d.d.
2020 2019 2020 2019
Current tax expense 31 31 3 12
Deferred tax charge related to origination and reversal of temporary differences (166) 139 (117) 134
Income tax gain/(expense) (135) 170 (114) 146
Tax on profit generated in Croatia is determined by applying the rate of 18 percent, on pre-tax profit for the year.
Income taxes are recorded based on estimated taxable income in accordance with the fiscal laws prevailing in the
country in which they originate. INA, d.d. is subject to corporate income tax on its taxable profits in Croatia.
The income tax, determined on the basis of the accounting profit, is assessed as follows:
INA Group INA, d.d.
2020 2019 2020 2019
(Loss)/profit before tax (1,272) 659 (1,047) 802
Expense tax calculated at 18% (229) 119 (188) 144
Adjustment of deferred tax assets as a result of new estimation of utilization 93 47 99 5
Tax effect of previous years 11 - - -
Income tax expense of entities operating in other jurisdictions 4 14 3 12
Tax effect of permanent differences, net (14) (10) (28) (15)
Income tax gain/(expense) (135) 170 (114) 146
Deferred tax assets and liabilities are measured by applying tax rates to be implemented in the period when the asset
is realized or the liability is settled, based on tax rates (and tax laws) that have been enacted or put into effect at the
end of the reporting period.
Movements in deferred tax assets are set out in the following table:
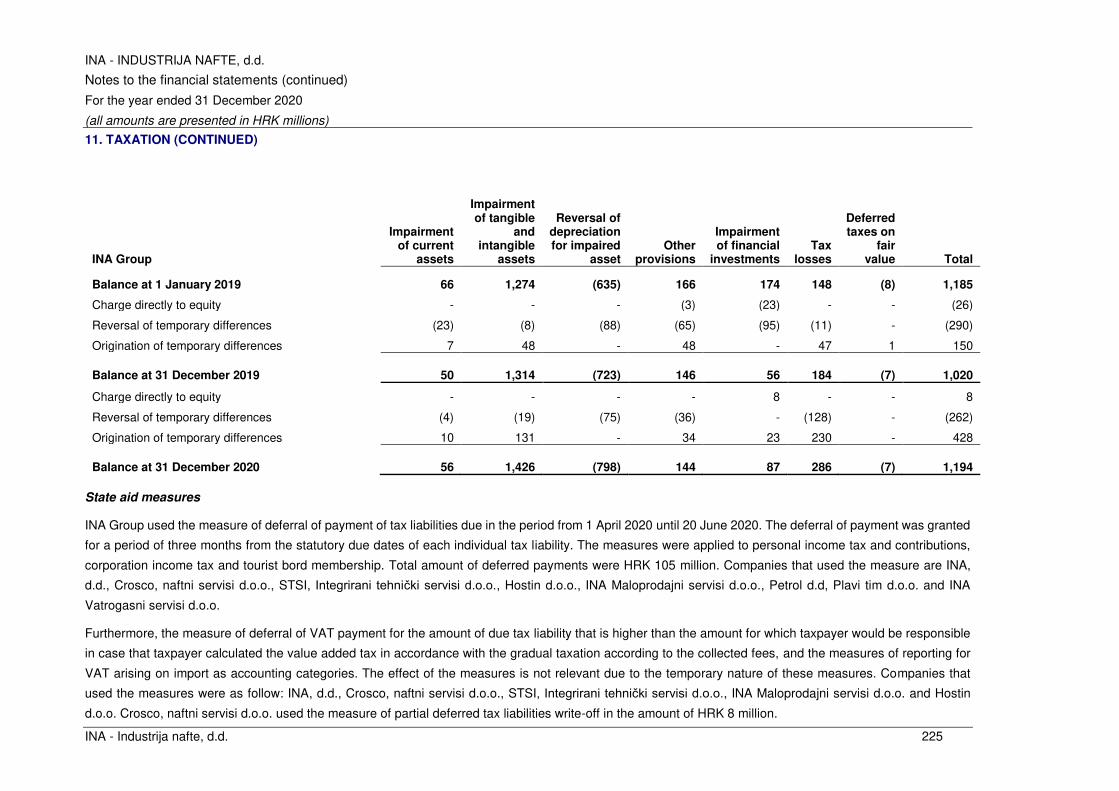
INA - INDUSTRIJA NAFTE, d.d.
Notes to the financial statements (continued)
For the year ended 31 December 2020
(all amounts are presented in HRK millions)
INA - Industrija nafte, d.d. 225
11. TAXATION (CONTINUED)
INA Group
Impairment of current
assets
Impairment of tangible
and intangible
assets
Reversal of depreciation for impaired
asset Other
provisions
Impairment of financial
investments Tax
losses
Deferred taxes on
fair value Total
Balance at 1 January 2019 66 1,274 (635) 166 174 148 (8) 1,185
Charge directly to equity - - - (3) (23) - - (26)
Reversal of temporary differences (23) (8) (88) (65) (95) (11) - (290)
Origination of temporary differences 7 48 - 48 - 47 1 150
Balance at 31 December 2019 50 1,314 (723) 146 56 184 (7) 1,020
Charge directly to equity - - - - 8 - - 8
Reversal of temporary differences (4) (19) (75) (36) - (128) - (262)
Origination of temporary differences 10 131 - 34 23 230 - 428
Balance at 31 December 2020 56 1,426 (798) 144 87 286 (7) 1,194
State aid measures
INA Group used the measure of deferral of payment of tax liabilities due in the period from 1 April 2020 until 20 June 2020. The deferral of payment was granted
for a period of three months from the statutory due dates of each individual tax liability. The measures were applied to personal income tax and contributions,
corporation income tax and tourist bord membership. Total amount of deferred payments were HRK 105 million. Companies that used the measure are INA,
d.d., Crosco, naftni servisi d.o.o., STSI, Integrirani tehnički servisi d.o.o., Hostin d.o.o., INA Maloprodajni servisi d.o.o., Petrol d.d, Plavi tim d.o.o. and INA
Vatrogasni servisi d.o.o.
Furthermore, the measure of deferral of VAT payment for the amount of due tax liability that is higher than the amount for which taxpayer would be responsible
in case that taxpayer calculated the value added tax in accordance with the gradual taxation according to the collected fees, and the measures of reporting for
VAT arising on import as accounting categories. The effect of the measures is not relevant due to the temporary nature of these measures. Companies that
used the measures were as follow: INA, d.d., Crosco, naftni servisi d.o.o., STSI, Integrirani tehnički servisi d.o.o., INA Maloprodajni servisi d.o.o. and Hostin
d.o.o. Crosco, naftni servisi d.o.o. used the measure of partial deferred tax liabilities write-off in the amount of HRK 8 million.
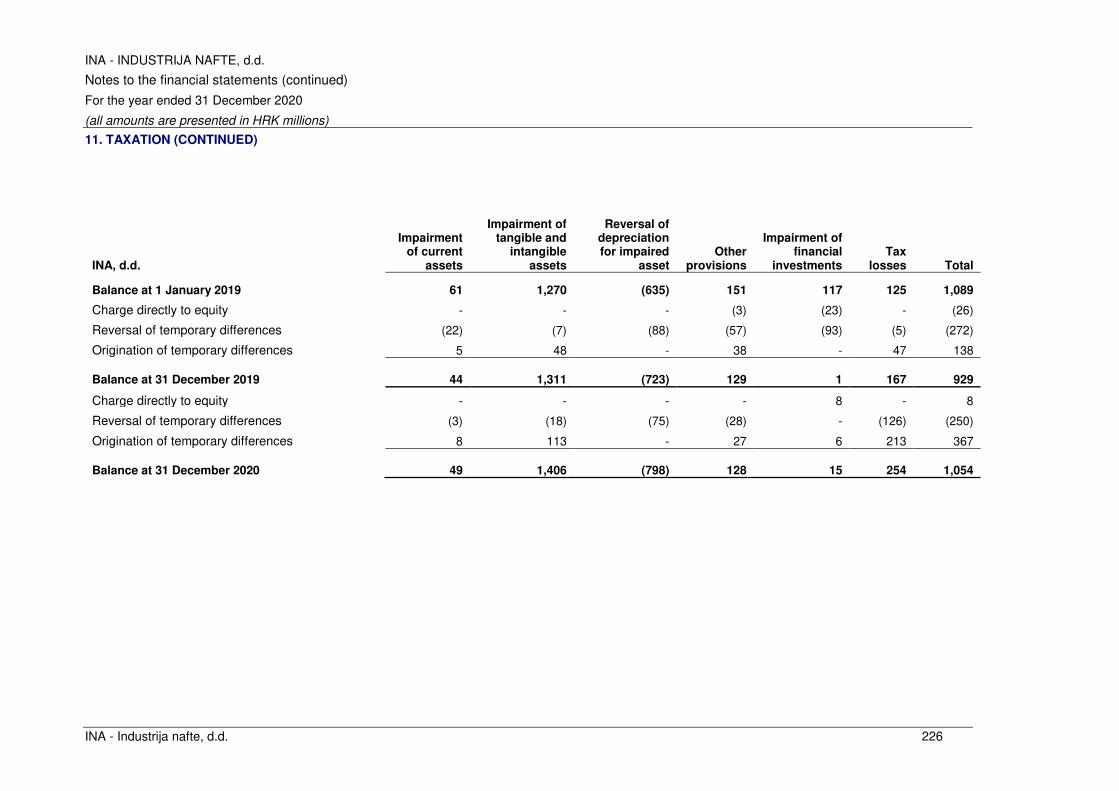
INA - INDUSTRIJA NAFTE, d.d.
Notes to the financial statements (continued)
For the year ended 31 December 2020
(all amounts are presented in HRK millions)
INA - Industrija nafte, d.d. 226
11. TAXATION (CONTINUED)
INA, d.d.
Impairment of current
assets
Impairment of tangible and
intangible assets
Reversal of depreciation for impaired
asset Other
provisions
Impairment of financial
investments Tax
losses Total
Balance at 1 January 2019 61 1,270 (635) 151 117 125 1,089
Charge directly to equity - - - (3) (23) - (26)
Reversal of temporary differences (22) (7) (88) (57) (93) (5) (272)
Origination of temporary differences 5 48 - 38 - 47 138
Balance at 31 December 2019 44 1,311 (723) 129 1 167 929
Charge directly to equity - - - - 8 - 8
Reversal of temporary differences (3) (18) (75) (28) - (126) (250)
Origination of temporary differences 8 113 - 27 6 213 367
Balance at 31 December 2020 49 1,406 (798) 128 15 254 1,054
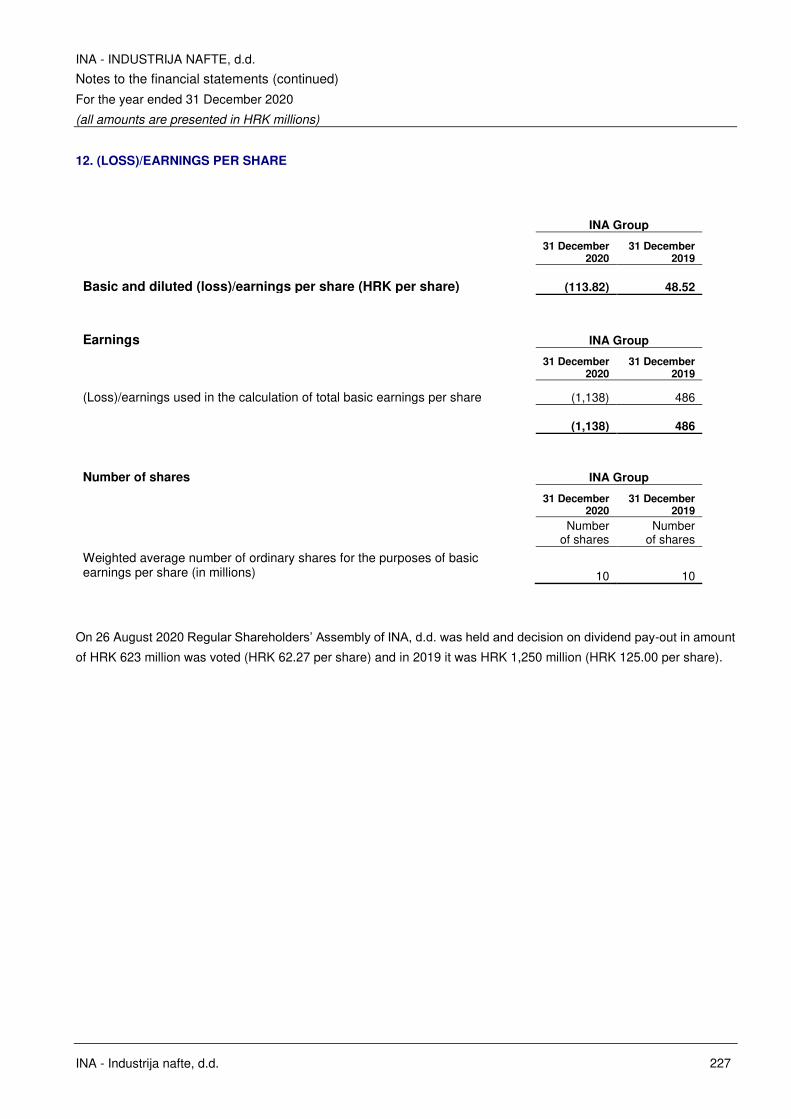
INA - INDUSTRIJA NAFTE, d.d.
Notes to the financial statements (continued)
For the year ended 31 December 2020
(all amounts are presented in HRK millions)
INA - Industrija nafte, d.d. 227
12. (LOSS)/EARNINGS PER SHARE
INA Group
31 December 2020
31 December 2019
Basic and diluted (loss)/earnings per share (HRK per share) (113.82) 48.52
Earnings INA Group
31 December 2020
31 December 2019
(Loss)/earnings used in the calculation of total basic earnings per share (1,138) 486
(1,138) 486
Number of shares INA Group
31 December 2020
31 December 2019
Number of shares
Number of shares
Weighted average number of ordinary shares for the purposes of basic earnings per share (in millions) 10 10
On 26 August 2020 Regular Shareholders’ Assembly of INA, d.d. was held and decision on dividend pay-out in amount
of HRK 623 million was voted (HRK 62.27 per share) and in 2019 it was HRK 1,250 million (HRK 125.00 per share).
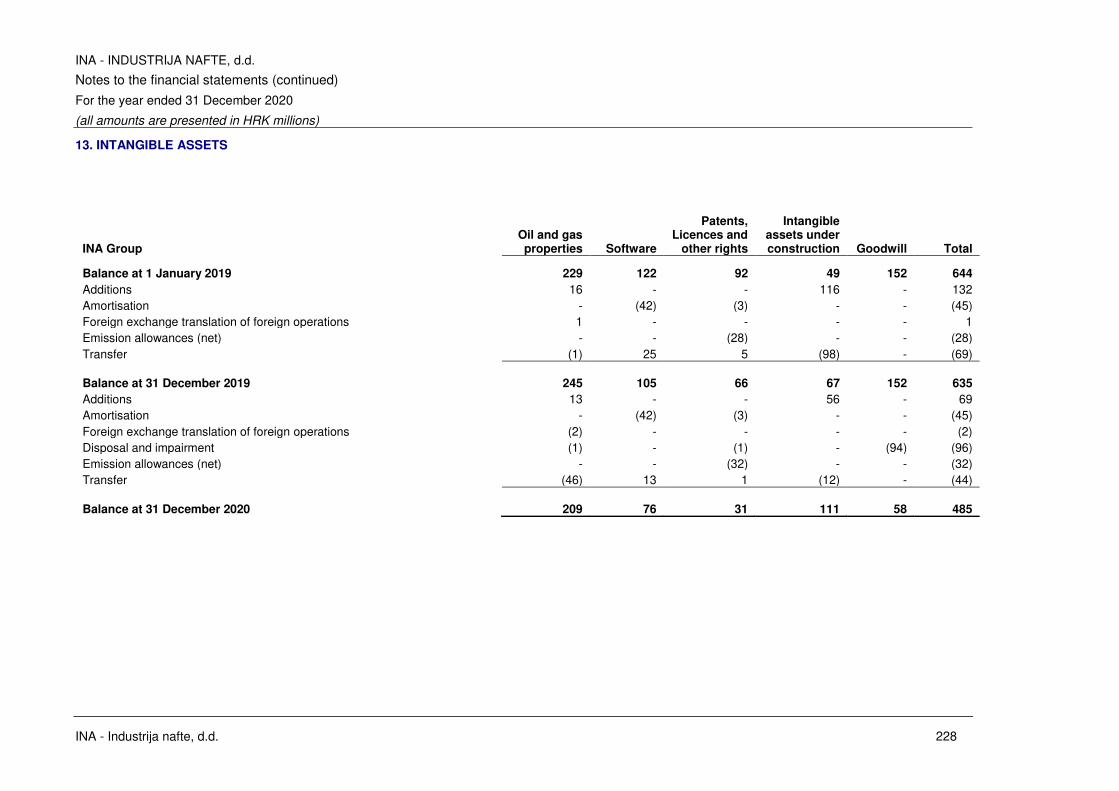
INA - INDUSTRIJA NAFTE, d.d.
Notes to the financial statements (continued)
For the year ended 31 December 2020
(all amounts are presented in HRK millions)
INA - Industrija nafte, d.d. 228
13. INTANGIBLE ASSETS
INA Group
Oil and gas properties Software
Patents, Licences and
other rights
Intangible assets under construction Goodwill Total
Balance at 1 January 2019 229 122 92 49 152 644
Additions 16 - - 116 - 132
Amortisation - (42) (3) - - (45)
Foreign exchange translation of foreign operations 1 - - - - 1
Emission allowances (net) - - (28) - - (28)
Transfer (1) 25 5 (98) - (69)
Balance at 31 December 2019 245 105 66 67 152 635
Additions 13 - - 56 - 69
Amortisation - (42) (3) - - (45)
Foreign exchange translation of foreign operations (2) - - - - (2)
Disposal and impairment (1) - (1) - (94) (96)
Emission allowances (net) - - (32) - - (32)
Transfer (46) 13 1 (12) - (44)
Balance at 31 December 2020 209 76 31 111 58 485
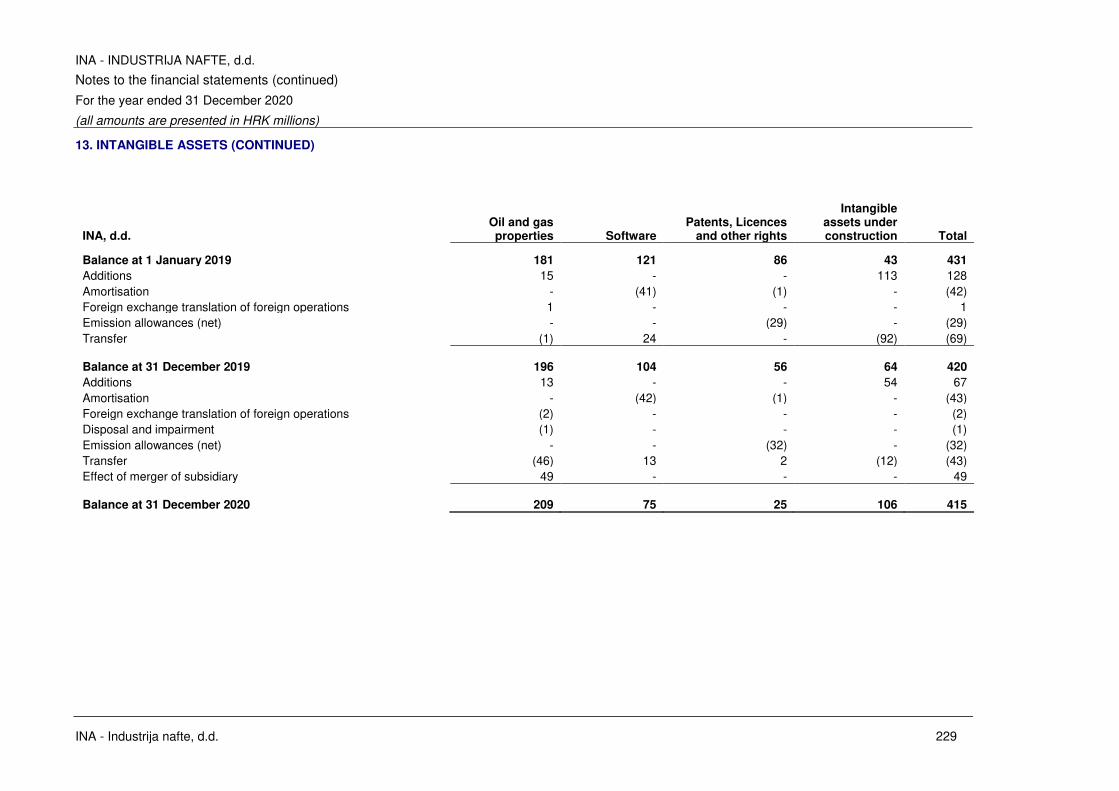
INA - INDUSTRIJA NAFTE, d.d.
Notes to the financial statements (continued)
For the year ended 31 December 2020
(all amounts are presented in HRK millions)
INA - Industrija nafte, d.d. 229
13. INTANGIBLE ASSETS (CONTINUED)
INA, d.d. Oil and gas properties Software
Patents, Licences and other rights
Intangible assets under construction Total
Balance at 1 January 2019 181 121 86 43 431
Additions 15 - - 113 128
Amortisation - (41) (1) - (42)
Foreign exchange translation of foreign operations 1 - - - 1
Emission allowances (net) - - (29) - (29)
Transfer (1) 24 - (92) (69)
Balance at 31 December 2019 196 104 56 64 420
Additions 13 - - 54 67
Amortisation - (42) (1) - (43)
Foreign exchange translation of foreign operations (2) - - - (2)
Disposal and impairment (1) - - - (1)
Emission allowances (net) - - (32) - (32)
Transfer (46) 13 2 (12) (43)
Effect of merger of subsidiary 49 - - - 49
Balance at 31 December 2020 209 75 25 106 415

INA - INDUSTRIJA NAFTE, d.d.
Notes to the financial statements (continued)
For the year ended 31 December 2020
(all amounts are presented in HRK millions)
INA - Industrija nafte, d.d. 230
13. INTANGIBLE ASSETS (CONTINUED)
Goodwill
Investment of Crosco, d.o.o. in Rotary Zrt. Hungary
INA Group
31 December 2020 31 December 2019
Cost 202 202
Accumulated impairment losses (144) (50)
Net book value 58 152
End of 2020 goodwill relating to the company Rotary Zrt. was tested for impairment and the test showed that the
impairment of HRK 94 million is required.
After impairment, the carrying amount of goodwill decreased from HRK 152 million to HRK 58 million as of 31
December 2020.
The recoverable amount of Rotary Zrt. business as at 31 December 2020, has been determined based on a value
in use calculation using cash flow projections from financial budgets approved by Company management covering
a five-year period. The discount rate applied to cash flow projections is 8.1% (2019 is 8.6%) and cash flows beyond
the five-year period are prepared taking into consideration utilization days of Rotary’s assets, average daily rates based on past experience and future predictions in the projected period. The growth rates are based on industry
growth forecasts and Upstream segment assumptions, where for this particular case no long-term growth rate is
foreseen in line with expectations. Expenses are determined also in relation to the utilization of the assets.
The calculation of Rotary's net present value is most sensitive to the following assumptions:
• Daily rates
• Utilization
• Discount rates
• Employee cost.
Change in the estimates of these premises would influence the net present value (NPV) of the CGU, having an
impact on the amount of impairment recognized in relation to Rotary's net realisable value. Under the current
circumstances and main assumptions currently applied, change in any of the main factors may lead to further
impairment: -1.5% decrease in daily rate, -10% decrease in utilisation, +1% increase in discount rate and +2%
higher employee costs.
Forecast daily rate prices and utilization days are based on management’s estimates and available market data. Discount rates represent the current market assessment of the risks specific to Rotary Zrt., taking into
consideration the time value of money and individual risks of the underlying assets that have not been incorporated
in the cash flow estimates.
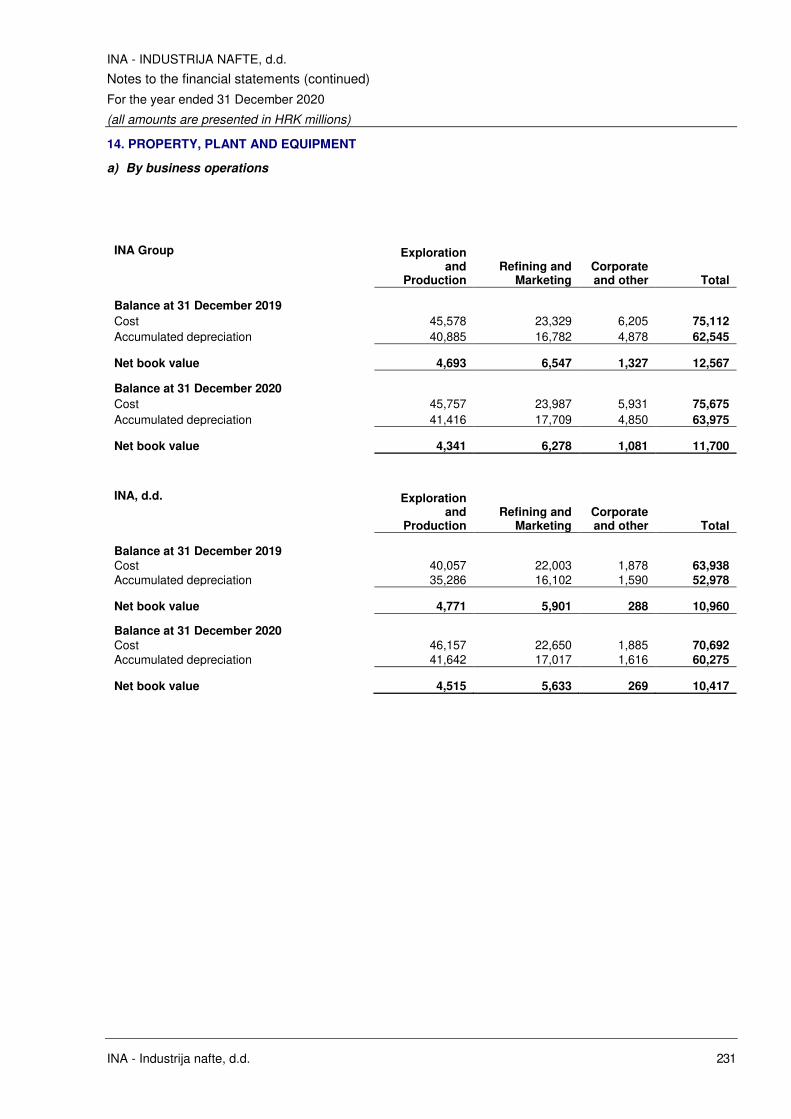
INA - INDUSTRIJA NAFTE, d.d.
Notes to the financial statements (continued)
For the year ended 31 December 2020
(all amounts are presented in HRK millions)
INA - Industrija nafte, d.d. 231
14. PROPERTY, PLANT AND EQUIPMENT
a) By business operations
INA Group Exploration and
Production Refining and
Marketing Corporate and other Total
Balance at 31 December 2019
Cost 45,578 23,329 6,205 75,112
Accumulated depreciation 40,885 16,782 4,878 62,545
Net book value 4,693 6,547 1,327 12,567
Balance at 31 December 2020
Cost 45,757 23,987 5,931 75,675
Accumulated depreciation 41,416 17,709 4,850 63,975
Net book value 4,341 6,278 1,081 11,700
INA, d.d. Exploration and
Production Refining and
Marketing Corporate and other Total
Balance at 31 December 2019
Cost 40,057 22,003 1,878 63,938
Accumulated depreciation 35,286 16,102 1,590 52,978
Net book value 4,771 5,901 288 10,960
Balance at 31 December 2020
Cost 46,157 22,650 1,885 70,692
Accumulated depreciation 41,642 17,017 1,616 60,275
Net book value 4,515 5,633 269 10,417

INA - INDUSTRIJA NAFTE, d.d.
Notes to the financial statements (continued)
For the year ended 31 December 2020
(all amounts are presented in HRK millions)
INA - Industrija nafte, d.d. 232
14. PROPERTY, PLANT AND EQUIPMENT (CONTINUED)
b) By asset type
INA Group
Oil and gas properties
Land and buildings
Plant and machinery
Vehicles and office
equipment
Collective Consumption
assets
Assets under
construction Total
At cost
Balance at 1 January 2019 40,504 13,079 14,381 2,457 47 2,604 73,072
Additions - - - - - 2,018 2,018
Change in capitalised decommissioning costs 218 - - - - - 218
Assets put in use, Transfer 641 423 1,205 121 - (2,390) -
Transfer to assets held for sale - (28) (2) 1 (1) - (30)
Transfer from intangible asset - - 8 - - 61 69
Share capital increase of subsidiary - (7) (90) (6) - - (103)
Disposals - (17) (169) (41) (8) (33) (268)
Currency translation 158 (4) (11) - - 1 144
Other - 1 (31) 16 6 - (8)
Balance at 31 December 2019 41,521 13,447 15,291 2,548 44 2,261 75,112
Additions 384 - - - - 829 1,213
Change in capitalised decommissioning costs 21 - - - - - 21
Assets put in use, Transfer 1,003 263 427 178 - (1,871) -
Transfer to assets held for sale - (40) (142) (6) - - (188)
Transfer from intangible asset 81 2 2 - - (6) 79
Disposals (2) (46) (148) (32) - (2) (230)
Currency translation, FX of foreign operations (36) (209) (73) (14) - - (332)
Other - - 2 (2) - - -
Balance at 31 December 2020 42,972 13,417 15,359 2,672 44 1,211 75,675
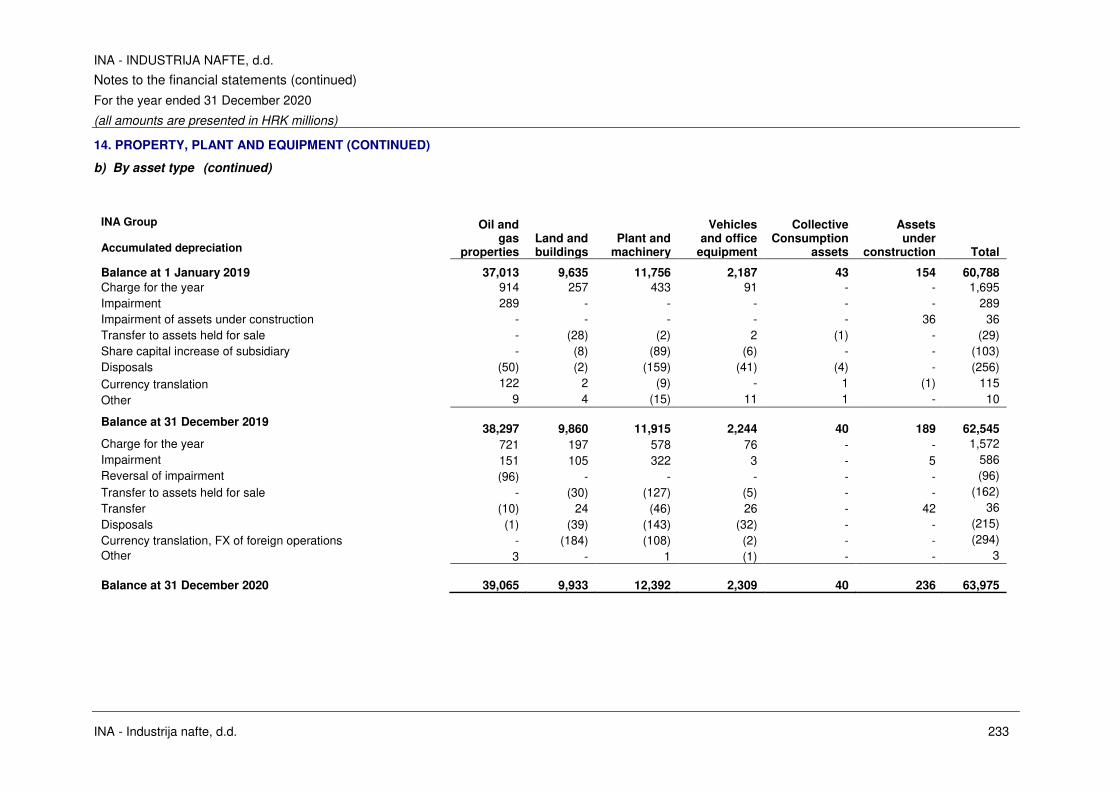
INA - INDUSTRIJA NAFTE, d.d.
Notes to the financial statements (continued)
For the year ended 31 December 2020
(all amounts are presented in HRK millions)
INA - Industrija nafte, d.d. 233
14. PROPERTY, PLANT AND EQUIPMENT (CONTINUED)
b) By asset type (continued)
INA Group Accumulated depreciation
Oil and gas
properties Land and buildings
Plant and machinery
Vehicles and office
equipment
Collective Consumption
assets
Assets under
construction Total
Balance at 1 January 2019 37,013 9,635 11,756 2,187 43 154 60,788
Charge for the year 914 257 433 91 - - 1,695
Impairment 289 - - - - - 289
Impairment of assets under construction - - - - - 36 36
Transfer to assets held for sale - (28) (2) 2 (1) - (29)
Share capital increase of subsidiary - (8) (89) (6) - - (103)
Disposals (50) (2) (159) (41) (4) - (256)
Currency translation 122 2 (9) - 1 (1) 115
Other 9 4 (15) 11 1 - 10
Balance at 31 December 2019 38,297 9,860 11,915 2,244 40 189 62,545
Charge for the year 721 197 578 76 - - 1,572
Impairment 151 105 322 3 - 5 586
Reversal of impairment (96) - - - - - (96)
Transfer to assets held for sale - (30) (127) (5) - - (162)
Transfer (10) 24 (46) 26 - 42 36
Disposals (1) (39) (143) (32) - - (215)
Currency translation, FX of foreign operations - (184) (108) (2) - - (294)
Other 3 - 1 (1) - - 3
Balance at 31 December 2020 39,065 9,933 12,392 2,309 40 236 63,975
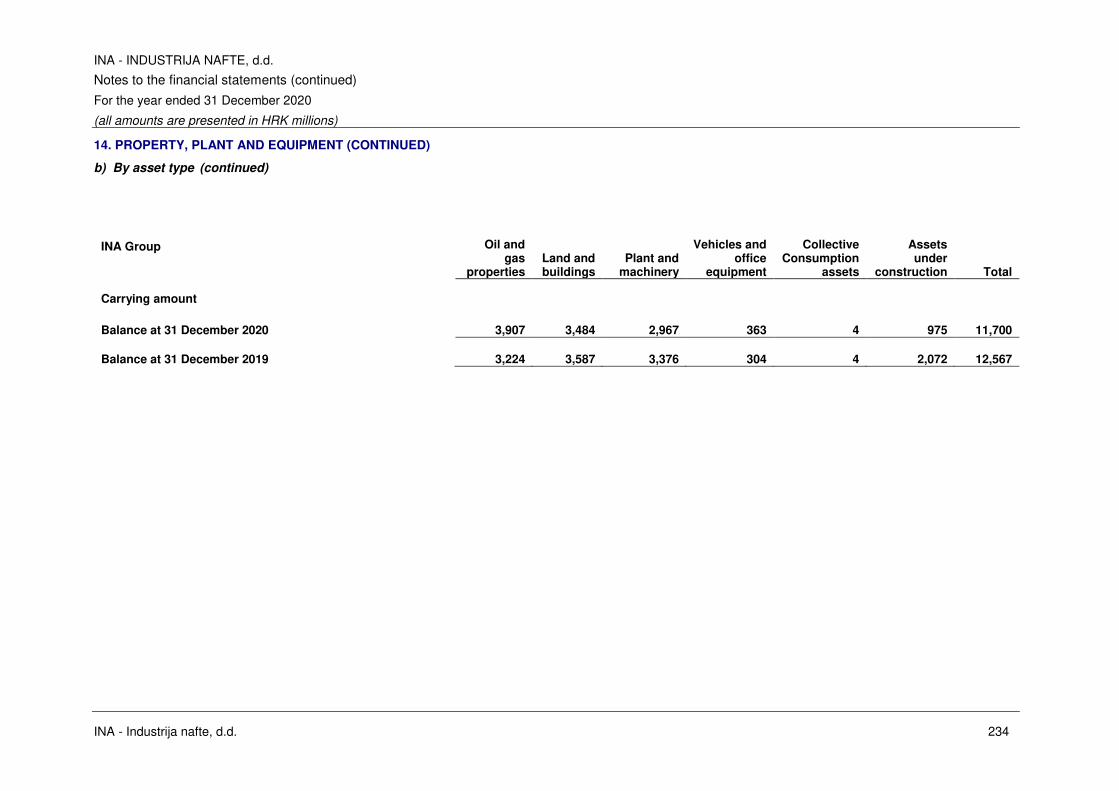
INA - INDUSTRIJA NAFTE, d.d.
Notes to the financial statements (continued)
For the year ended 31 December 2020
(all amounts are presented in HRK millions)
INA - Industrija nafte, d.d. 234
14. PROPERTY, PLANT AND EQUIPMENT (CONTINUED)
b) By asset type (continued)
INA Group Oil and gas
properties Land and buildings
Plant and machinery
Vehicles and office
equipment
Collective Consumption
assets
Assets under
construction Total
Carrying amount
Balance at 31 December 2020 3,907 3,484 2,967 363 4 975 11,700
Balance at 31 December 2019 3,224 3,587 3,376 304 4 2,072 12,567
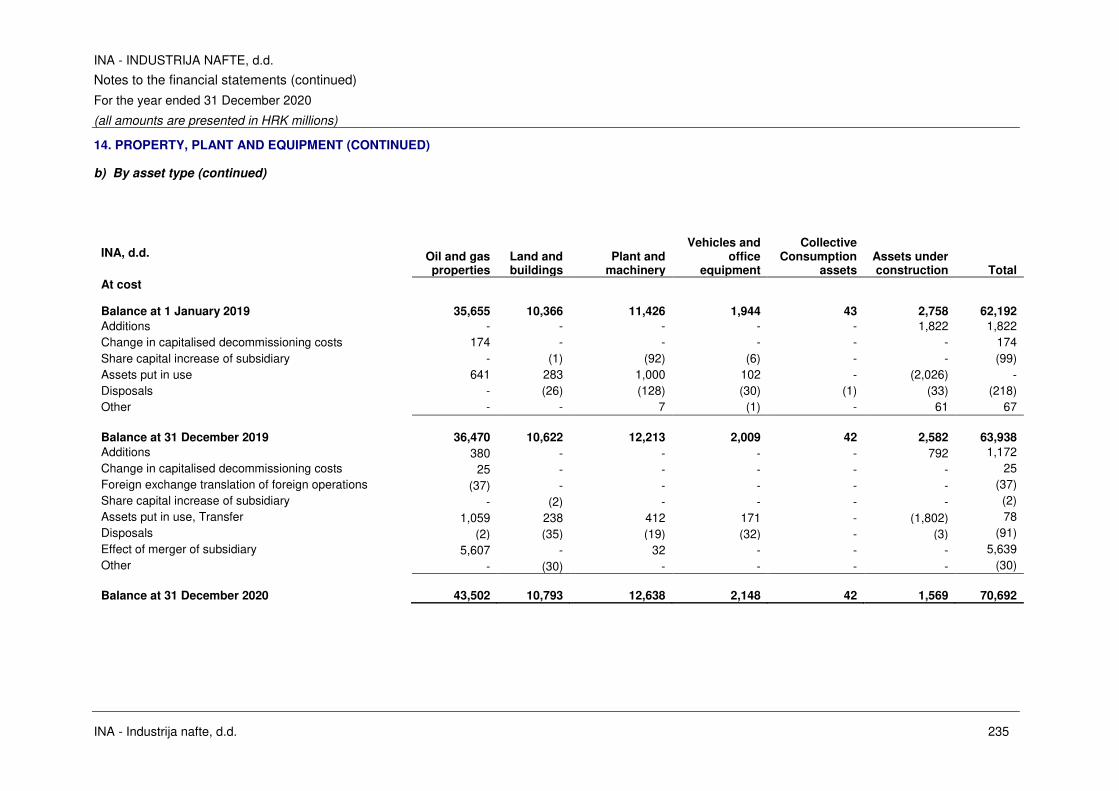
INA - INDUSTRIJA NAFTE, d.d.
Notes to the financial statements (continued)
For the year ended 31 December 2020
(all amounts are presented in HRK millions)
INA - Industrija nafte, d.d. 235
14. PROPERTY, PLANT AND EQUIPMENT (CONTINUED)
b) By asset type (continued)
INA, d.d. Oil and gas properties
Land and buildings
Plant and machinery
Vehicles and office
equipment
Collective Consumption
assets Assets under construction Total
At cost
Balance at 1 January 2019 35,655 10,366 11,426 1,944 43 2,758 62,192
Additions - - - - - 1,822 1,822
Change in capitalised decommissioning costs 174 - - - - - 174
Share capital increase of subsidiary - (1) (92) (6) - - (99)
Assets put in use 641 283 1,000 102 - (2,026) -
Disposals - (26) (128) (30) (1) (33) (218)
Other - - 7 (1) - 61 67
Balance at 31 December 2019 36,470 10,622 12,213 2,009 42 2,582 63,938
Additions 380 - - - - 792 1,172
Change in capitalised decommissioning costs 25 - - - - - 25
Foreign exchange translation of foreign operations (37) - - - - - (37)
Share capital increase of subsidiary - (2) - - - - (2)
Assets put in use, Transfer 1,059 238 412 171 - (1,802) 78
Disposals (2) (35) (19) (32) - (3) (91)
Effect of merger of subsidiary 5,607 - 32 - - - 5,639
Other - (30) - - - - (30)
Balance at 31 December 2020 43,502 10,793 12,638 2,148 42 1,569 70,692
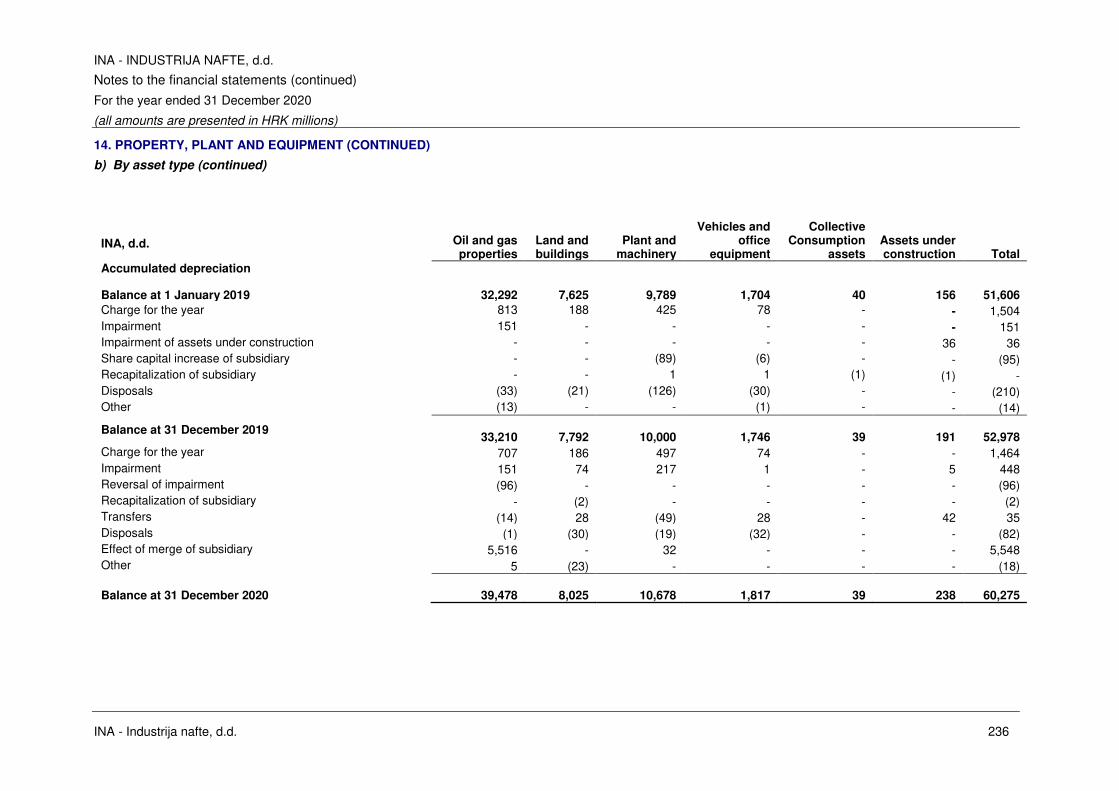
INA - INDUSTRIJA NAFTE, d.d.
Notes to the financial statements (continued)
For the year ended 31 December 2020
(all amounts are presented in HRK millions)
INA - Industrija nafte, d.d. 236
14. PROPERTY, PLANT AND EQUIPMENT (CONTINUED)
b) By asset type (continued)
INA, d.d. Oil and gas
properties Land and buildings
Plant and machinery
Vehicles and office
equipment
Collective Consumption
assets Assets under construction Total
Accumulated depreciation
Balance at 1 January 2019 32,292 7,625 9,789 1,704 40 156 51,606
Charge for the year 813 188 425 78 - - 1,504
Impairment 151 - - - - - 151
Impairment of assets under construction - - - - - 36 36
Share capital increase of subsidiary - - (89) (6) - - (95)
Recapitalization of subsidiary - - 1 1 (1) (1) -
Disposals (33) (21) (126) (30) - - (210)
Other (13) - - (1) - - (14)
Balance at 31 December 2019 33,210 7,792 10,000 1,746 39 191 52,978
Charge for the year 707 186 497 74 - - 1,464
Impairment 151 74 217 1 - 5 448
Reversal of impairment (96) - - - - - (96)
Recapitalization of subsidiary - (2) - - - - (2)
Transfers (14) 28 (49) 28 - 42 35
Disposals (1) (30) (19) (32) - - (82)
Effect of merge of subsidiary 5,516 - 32 - - - 5,548
Other 5 (23) - - - - (18)
Balance at 31 December 2020 39,478 8,025 10,678 1,817 39 238 60,275
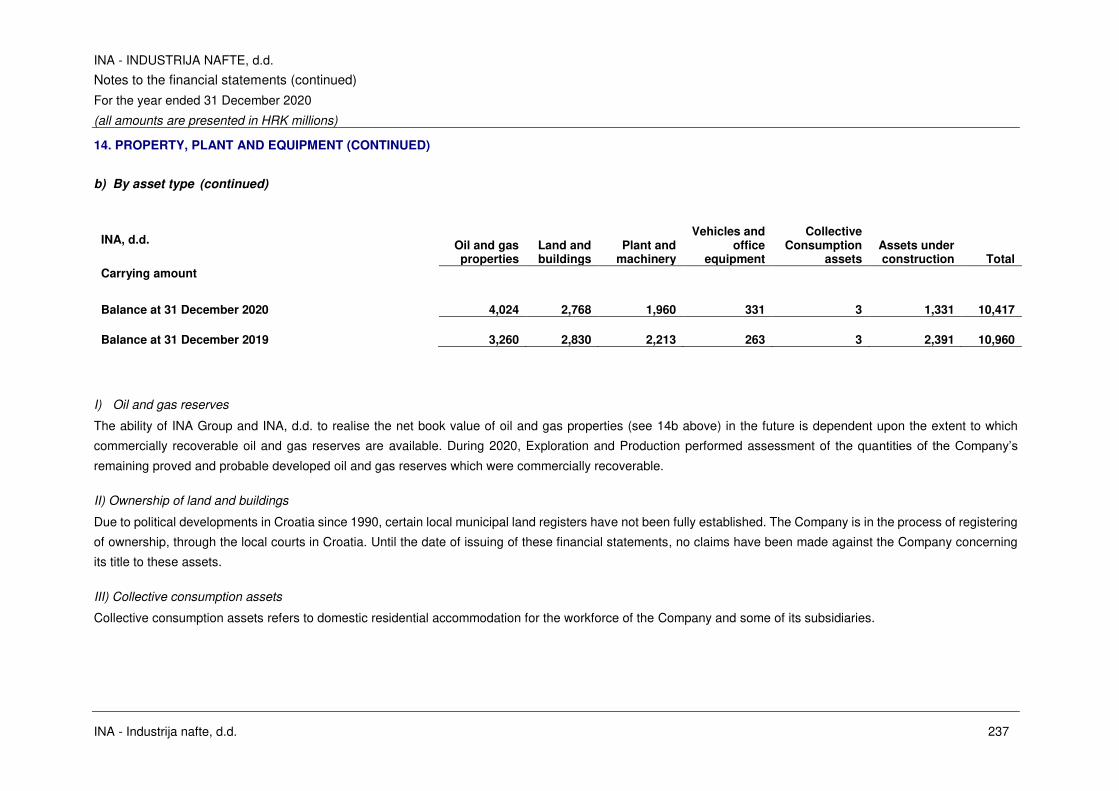
INA - INDUSTRIJA NAFTE, d.d.
Notes to the financial statements (continued)
For the year ended 31 December 2020
(all amounts are presented in HRK millions)
INA - Industrija nafte, d.d. 237
14. PROPERTY, PLANT AND EQUIPMENT (CONTINUED)
b) By asset type (continued)
INA, d.d. Oil and gas
properties Land and buildings
Plant and machinery
Vehicles and office
equipment
Collective Consumption
assets Assets under construction Total
Carrying amount
Balance at 31 December 2020 4,024 2,768 1,960 331 3 1,331 10,417
Balance at 31 December 2019 3,260 2,830 2,213 263 3 2,391 10,960
I) Oil and gas reserves
The ability of INA Group and INA, d.d. to realise the net book value of oil and gas properties (see 14b above) in the future is dependent upon the extent to which
commercially recoverable oil and gas reserves are available. During 2020, Exploration and Production performed assessment of the quantities of the Company’s remaining proved and probable developed oil and gas reserves which were commercially recoverable.
II) Ownership of land and buildings
Due to political developments in Croatia since 1990, certain local municipal land registers have not been fully established. The Company is in the process of registering
of ownership, through the local courts in Croatia. Until the date of issuing of these financial statements, no claims have been made against the Company concerning
its title to these assets.
III) Collective consumption assets
Collective consumption assets refers to domestic residential accommodation for the workforce of the Company and some of its subsidiaries.

INA - INDUSTRIJA NAFTE, d.d.
Notes to the financial statements (continued)
For the year ended 31 December 2020
(all amounts are presented in HRK millions)
INA - Industrija nafte, d.d. 238
14. PROPERTY, PLANT AND EQUIPMENT (CONTINUED)
IV) Carrying value of property, plant and equipment
The Management Board performed identification and assessment of indicators in accordance with IAS 36. Impairment
test was performed on assets where indicators of impairment have been identified.
The total net impairment charge of INA Group is HRK 494 million and INA, d.d. is HRK 350 million in 2020 (2019: INA
Group HRK 325 million, INA, d.d HRK 187 million).
a) Exploration and Production recorded an impairment of property, plant and equipment in amount of HRK 151
million and reversal of impairment in amount of HRK 96 million at 31 December 2020 at INA Group and INA, d.d.
(compared to impairment in amount of HRK 289 million in 2019).
• Following the disruption of oil prices caused by the temporary suspension of part of the economic
activities due to the COVID-19 pandemic, an indicator for testing the impairment of INA's oil and gas
fields was identified in Q2 2020. Oil price assumptions used in the value in use models used for
impairment testing were the following: 51 to 53 USD/barrel for the years from 2021 to 2023 and the long
term oil price assumed for the years after 2023 was 65 USD / barrel. Gas price assumptions used in the
value in use models used for impairment testing were the following: 15 to 17 EUR/MWh the years from
2021 to 2023 and the long term gas price assumed for the years after 2023 was 19 EUR/MWh. Based
on the value in use calculation following impairment by CGU has been determined at 30 June 2020:
o Egypt concession – assessed recoverable amount of HRK 29 million (Egypt RQ HRK 15 million;
Egypt NB HRK 14 million). Impairment of HRK 15 million was recorded on field Egypt North
Bahariya.
o Croatia onshore – assessed recoverable amount of HRK 3,926 million (cumulative for 43 tested
fields). Total impairment amounted to HRK 29 million was recorded on fields Hampovica Čepelovac (HRK 7 million), Bunjani (HRK 7 million), Mramor Brdo (HRK 6 million), Bilogora (HRK 4 million),
Zebanec (HRK 3 million) and Lupoglav (HRK 2 million).
• As part of standard practice, resources and reserves level is assessed at each year end. Within the most
relevant profiles, no fields with negative reserves change above materiality threshold have been
identified. However, in line with the industry and MOL Group practice, using the proved and probable
(2P) reserve level is a more accurate basis for determining management’s best estimate on future cash flows instead of earlier used Proved (1P) reserve level, therefore a trigger for impairment reversal was
identified. Oil price assumptions used in the value in use models used for impairment testing were the
following: 51 to 52 USD / barrel for the years from 2021 to 2023 and the long term oil price assumed for
the years after 2023 was 69 USD / barrel. Gas price assumptions used in the value in use models used
for impairment testing were the following: 13 to 17 EUR/MWh for the years from 2021 to 2023 and the
long term gas price assumed for the years after 2023 was 23 EUR/MWh. Based on the value in use
calculation following impairment by CGU has been determined at 31 December 2020:
o Croatia offshore – assessed recoverable amount of HRK 282 million (Ivana D no recoverable
amount; NACA HRK 224 million; ALCA HRK 58 million). Impairment amounted to HRK 28 million
was recorded on Ivana D field. Total reversal of impairment in the amount of HRK 67 million was
recorded on NACA (HRK 66 million) and ALCA (HRK 1 million).

INA - INDUSTRIJA NAFTE, d.d.
Notes to the financial statements (continued)
For the year ended 31 December 2020
(all amounts are presented in HRK millions)
INA - Industrija nafte, d.d. 239
14. PROPERTY, PLANT AND EQUIPMENT (CONTINUED)
IV) Carrying value of property, plant and equipment (continued)
o Egypt concession – assessed recoverable amount of HRK 175 million (Egypt NB HRK 156 million;
Egypt RQ HRK 19 million). Total reversal of impairment amounted to HRK 7 million on the field
Egypt North Bahariya
o Angola concession – assessed recoverable amount of HRK 62 million (Angola Blok 3/05 HRK 50
million; Angola Blok 3/05a HRK 12 million). Total reversal of impairment amounted to HRK 11
million was recorded on fields Angola Blok 3/05 (HRK 2 million) and Angola 3/05a field (HRK 9
million).
o Croatia onshore – assessed recoverable amount of HRK 3,193 million (cumulative for 19 tested
fields). Total impairment amounted to HRK 22 million was recorded on fields Križ Bunjani (HRK 11
million), Beničanci (HRK 8 million), Crnac (HRK 2 million) and Števkovica (HRK 1 million). Total
reversal of impairment amounted to HRK 11 million was recorded on fields Zebanec (HRK 3
million), Kozarice (HRK 2 million), Kućanci Kapelna (HRK 1 million), Mramor Brdo (HRK 1 million), Lupoglav field (HRK 1 million) and HRK 3 million on other fields.
o Croatia onshore - impairment of assets under construction in amount of HRK 57 million (Legrad
HRK 32 million, Selnica HRK 25 million).
b) Refining and Marketing recorded impairment of assets in use in Refinery Sisak in the amount of HRK 290 million
and impairment of asset of under construction was recorded in Refinery Sisak in the amount of HRK 5 million (in
2019 impairment of assets under construction was recorded in Refinery Sisak in amount of HRK 36 million).
c) Corporate and other recorded impairment of Crosco d.o.o. assets in the amount of HRK 104 million to the
recoverable amount of HRK 130 million, impairment of platform Labin in the amount of HRK 36 million to the
recoverable amount of HRK 51 million and other (Rotary HRK 2 million, Hostin HRK 1 million and INA, d.d.
impairment in the amount of HRK 1 million) in 2020. In 2019 no impairment or reversal of impairment was
recorded.
Discount rates used in the current assessment in 2020 and for 2019 are assets specific and are as follows:
Exploration and Production
December 2020 June 2020 December 2019
Croatia 8.1% 8.8% 8.5%
Egypt 12.6% 12.3% 12.3%
Angola 18.6% 12.3% 12.3% Refining and marketing
Croatia 7.7% 9.7% 9.7%
A risk factor is included in the discount rates considering the individual country risk (see note 3).
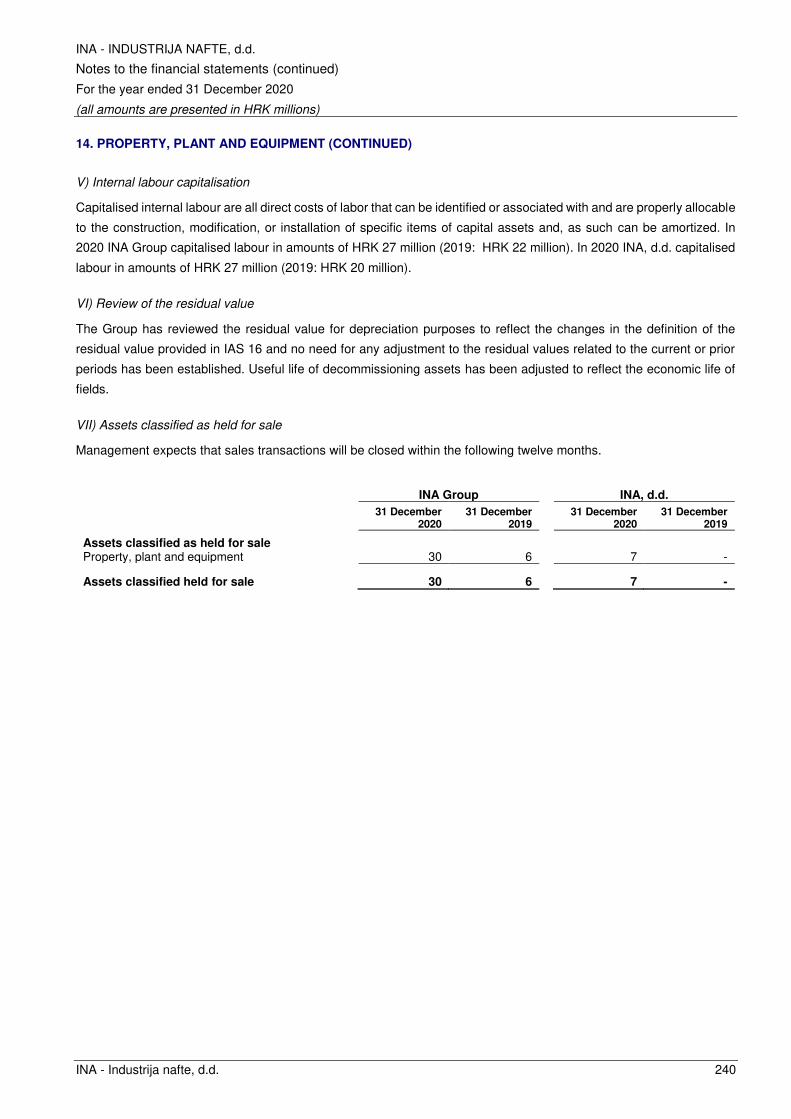
INA - INDUSTRIJA NAFTE, d.d.
Notes to the financial statements (continued)
For the year ended 31 December 2020
(all amounts are presented in HRK millions)
INA - Industrija nafte, d.d. 240
14. PROPERTY, PLANT AND EQUIPMENT (CONTINUED)
V) Internal labour capitalisation
Capitalised internal labour are all direct costs of labor that can be identified or associated with and are properly allocable
to the construction, modification, or installation of specific items of capital assets and, as such can be amortized. In
2020 INA Group capitalised labour in amounts of HRK 27 million (2019: HRK 22 million). In 2020 INA, d.d. capitalised
labour in amounts of HRK 27 million (2019: HRK 20 million).
VI) Review of the residual value
The Group has reviewed the residual value for depreciation purposes to reflect the changes in the definition of the
residual value provided in IAS 16 and no need for any adjustment to the residual values related to the current or prior
periods has been established. Useful life of decommissioning assets has been adjusted to reflect the economic life of
fields.
VII) Assets classified as held for sale
Management expects that sales transactions will be closed within the following twelve months.
INA Group INA, d.d.
31 December 2020
31 December 2019
31 December 2020
31 December 2019
Assets classified as held for sale
Property, plant and equipment 30 6 7 -
Assets classified held for sale 30 6 7 -
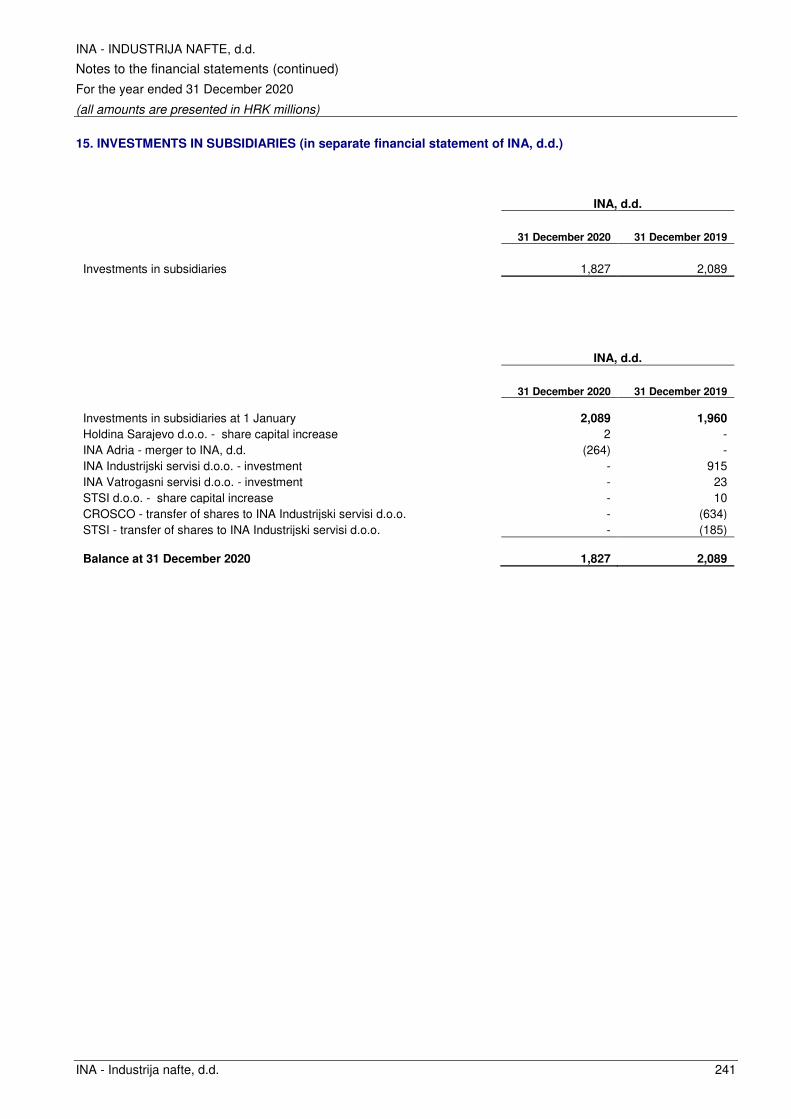
INA - INDUSTRIJA NAFTE, d.d.
Notes to the financial statements (continued)
For the year ended 31 December 2020
(all amounts are presented in HRK millions)
INA - Industrija nafte, d.d. 241
15. INVESTMENTS IN SUBSIDIARIES (in separate financial statement of INA, d.d.)
INA, d.d.
31 December 2020 31 December 2019
Investments in subsidiaries 1,827 2,089
INA, d.d.
31 December 2020 31 December 2019
Investments in subsidiaries at 1 January 2,089 1,960
Holdina Sarajevo d.o.o. - share capital increase 2 -
INA Adria - merger to INA, d.d. (264) -
INA Industrijski servisi d.o.o. - investment - 915
INA Vatrogasni servisi d.o.o. - investment - 23
STSI d.o.o. - share capital increase - 10
CROSCO - transfer of shares to INA Industrijski servisi d.o.o. - (634)
STSI - transfer of shares to INA Industrijski servisi d.o.o. - (185)
Balance at 31 December 2020 1,827 2,089
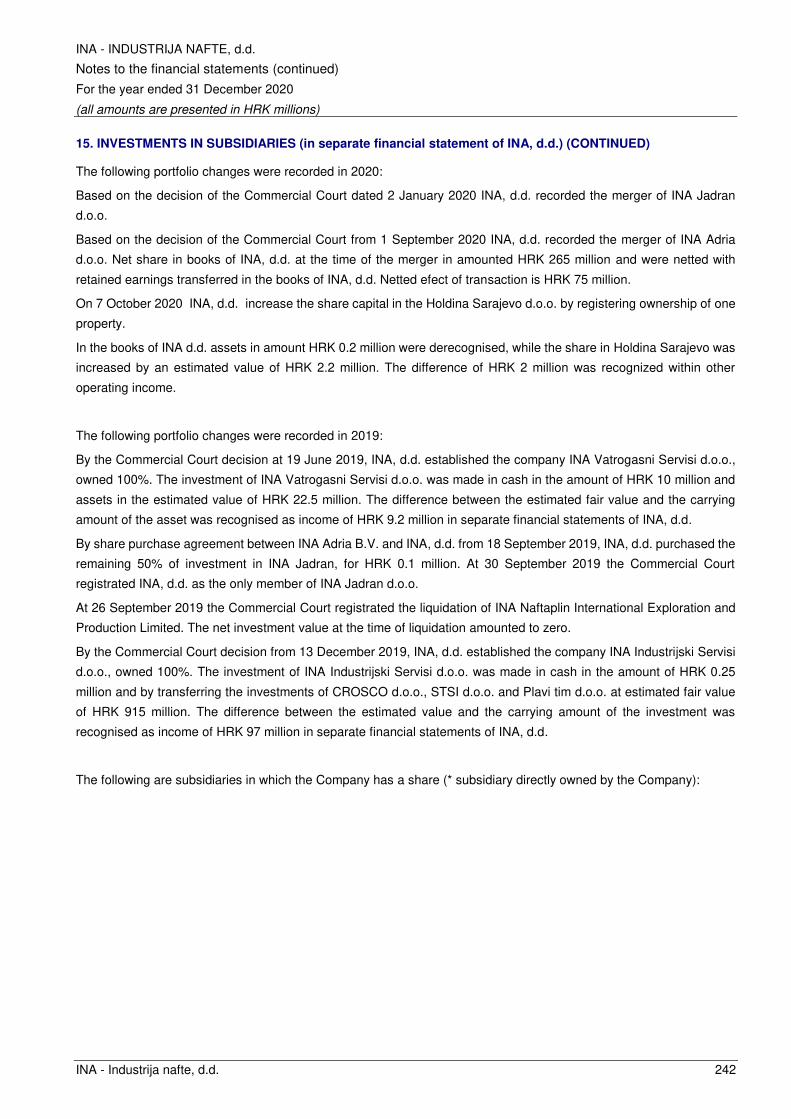
INA - INDUSTRIJA NAFTE, d.d.
Notes to the financial statements (continued)
For the year ended 31 December 2020
(all amounts are presented in HRK millions)
INA - Industrija nafte, d.d. 242
15. INVESTMENTS IN SUBSIDIARIES (in separate financial statement of INA, d.d.) (CONTINUED)
The following portfolio changes were recorded in 2020:
Based on the decision of the Commercial Court dated 2 January 2020 INA, d.d. recorded the merger of INA Jadran
d.o.o.
Based on the decision of the Commercial Court from 1 September 2020 INA, d.d. recorded the merger of INA Adria
d.o.o. Net share in books of INA, d.d. at the time of the merger in amounted HRK 265 million and were netted with
retained earnings transferred in the books of INA, d.d. Netted efect of transaction is HRK 75 million.
On 7 October 2020 INA, d.d. increase the share capital in the Holdina Sarajevo d.o.o. by registering ownership of one
property.
In the books of INA d.d. assets in amount HRK 0.2 million were derecognised, while the share in Holdina Sarajevo was
increased by an estimated value of HRK 2.2 million. The difference of HRK 2 million was recognized within other
operating income.
The following portfolio changes were recorded in 2019:
By the Commercial Court decision at 19 June 2019, INA, d.d. established the company INA Vatrogasni Servisi d.o.o.,
owned 100%. The investment of INA Vatrogasni Servisi d.o.o. was made in cash in the amount of HRK 10 million and
assets in the estimated value of HRK 22.5 million. The difference between the estimated fair value and the carrying
amount of the asset was recognised as income of HRK 9.2 million in separate financial statements of INA, d.d.
By share purchase agreement between INA Adria B.V. and INA, d.d. from 18 September 2019, INA, d.d. purchased the
remaining 50% of investment in INA Jadran, for HRK 0.1 million. At 30 September 2019 the Commercial Court
registrated INA, d.d. as the only member of INA Jadran d.o.o.
At 26 September 2019 the Commercial Court registrated the liquidation of INA Naftaplin International Exploration and
Production Limited. The net investment value at the time of liquidation amounted to zero.
By the Commercial Court decision from 13 December 2019, INA, d.d. established the company INA Industrijski Servisi
d.o.o., owned 100%. The investment of INA Industrijski Servisi d.o.o. was made in cash in the amount of HRK 0.25
million and by transferring the investments of CROSCO d.o.o., STSI d.o.o. and Plavi tim d.o.o. at estimated fair value
of HRK 915 million. The difference between the estimated value and the carrying amount of the investment was
recognised as income of HRK 97 million in separate financial statements of INA, d.d.
The following are subsidiaries in which the Company has a share (* subsidiary directly owned by the Company):

INA - INDUSTRIJA NAFTE, d.d.
Notes to the financial statements (continued)
For the year ended 31 December 2020
(all amounts are presented in HRK millions)
INA - Industrija nafte, d.d. 243
15. INVESTMENTS IN SUBSIDIARIES (in separate financial statement of INA, d.d.) (CONTINUED)
Composition of the Group
The name of subsidiary Principal activity Place of incorporation and operation
Proportion of ownership interest and voting power
held by the Group
31 December 2020
31 December 2019
Oilfield services
CROSCO, naftni servisi d.o.o. Oilfield services Croatia 100% 100% Crosco B.V. Oilfield services Netherland 100% 100%
NORDIC SHIPPING LIMITED Lease of drilling platforms Marshall Islands 100% 100% SEA HORSE SHIPPING Inc Lease of drilling platforms Marshall Islands 100% 100% Rotary Zrt. Oilfield services Hungary 100% 100% CROSCO UKRAINE LLC. Oilfield services Ukraine 100% 100% Crosco S.A. DE C.V. Oilfield services Mexico 99.90% 99.90% ROTARY D&WS S.R.L. Oilfield services Romania 100% -
CROSCO International d.o.o. Oilfield services Bosnia and Herzegovina
- 100%
Oil exploration and production
*INA ADRIA B.V. Extraction of natural gas Netherland - 100%
*INA Jadran d.o.o. Extraction of natural gas Croatia - 100%
Tourism
*Hostin d.o.o. Asset management, tourism Croatia 100% 100%
Ancillary services
STSI Integrirani tehnički servisi d.o.o. Technical services Croatia 100% 100%
*Top Računovodstvo Servisi d.o.o. Accounting services Croatia 100% 100%
Plavi tim d.o.o. Informatics service Croatia 100% 100%
*INA Vatrogasni Servisi d.o.o. Firefighting Croatia 100% 100%
*INA Industrijski Servisi d.o.o. Holding company Croatia 100% 100%
Production and trading
*INA MAZIVA d.o.o. Production and lubricants trading
Croatia 100% 100%
Trading
*INA Slovenija d.o.o. Ljubljana Foreign trading Slovenia 100% 100%
*INA BH d.d. Sarajevo Foreign trading Bosnia and Herzegovina
100% 100%
*Holdina d.o.o. Sarajevo Foreign trading Bosnia and Herzegovina
100% 100%
*INA d.o.o. Beograd Foreign trading Serbia 100% 100%
*INA Kosovo d.o.o. Foreign trading Kosovo 100% 100%
*Adrigas S.r.l. Milano Pipeline project company Italy 100% 100%
*INA Crna Gora d.o.o. Podgorica Foreign trading Montenegro 100% 100%
*PETROL d.d. Trading Croatia 100% 100%
*CROPLIN d.o.o. Production of gas, distribution network of gas fuels
Croatia 100% 100%
*INA Maloprodajni servisi d.o.o. Trade agency in the domestic and foreign market
Croatia 100% 100%
*ENERGOPETROL d.d. Retail (oil and lubricant) Bosnia and Herzegovina
88.66% 88.66%
*INA BL d.o.o. Banja Luka Trading Bosnia and Herzegovina
100% 100%
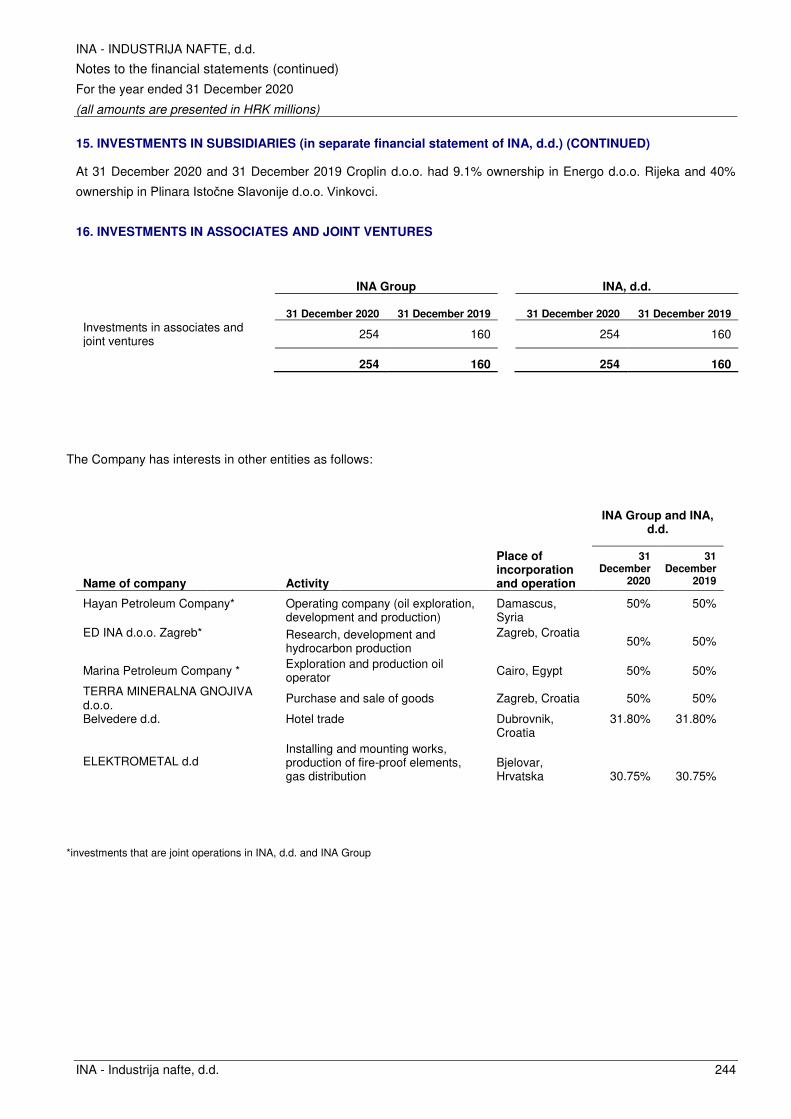
INA - INDUSTRIJA NAFTE, d.d.
Notes to the financial statements (continued)
For the year ended 31 December 2020
(all amounts are presented in HRK millions)
INA - Industrija nafte, d.d. 244
15. INVESTMENTS IN SUBSIDIARIES (in separate financial statement of INA, d.d.) (CONTINUED)
At 31 December 2020 and 31 December 2019 Croplin d.o.o. had 9.1% ownership in Energo d.o.o. Rijeka and 40%
ownership in Plinara Istočne Slavonije d.o.o. Vinkovci.
16. INVESTMENTS IN ASSOCIATES AND JOINT VENTURES
INA Group INA, d.d.
31 December 2020 31 December 2019 31 December 2020 31 December 2019
Investments in associates and joint ventures
254 160 254 160
254 160 254 160
The Company has interests in other entities as follows:
INA Group and INA,
d.d.
Name of company Activity
Place of incorporation and operation
31 December
2020
31 December
2019
Hayan Petroleum Company* Operating company (oil exploration, development and production)
Damascus, Syria
50% 50%
ED INA d.o.o. Zagreb* Research, development and hydrocarbon production
Zagreb, Croatia 50% 50%
Marina Petroleum Company * Exploration and production oil operator
Cairo, Egypt 50% 50%
TERRA MINERALNA GNOJIVA d.o.o.
Purchase and sale of goods Zagreb, Croatia 50% 50%
Belvedere d.d. Hotel trade Dubrovnik, Croatia
31.80% 31.80%
ELEKTROMETAL d.d
Installing and mounting works, production of fire-proof elements, gas distribution
Bjelovar, Hrvatska 30.75% 30.75%
*investments that are joint operations in INA, d.d. and INA Group

INA - INDUSTRIJA NAFTE, d.d.
Notes to the financial statements (continued)
For the year ended 31 December 2020
(all amounts are presented in HRK millions)
INA - Industrija nafte, d.d. 245
16. INVESTMENTS IN ASSOCIATES AND JOINT VENTURE (CONTINUED)
Non-material associates and joint operations are as follows: Hayan Petroleum Company, Belvedere d.d., ED - INA
d.o.o. Zagreb, Marina Petroleum Company and ELEKTROMETAL d.d.
The following table summarises, in aggregate, the financial information of all individually non-material associates and
joint ventures in which the Group has interests:
INA Group and INA, d.d.
31 December 2020
31 December
2019
Aggregate carrying amount of the interests in these associates and joint ventures
- -
The Group's share of profit from interest in non individually material associates and joint ventures
- -
The Group's share of other comprehensive income - -
The Group's share of total comprehensive income - -
In 2020, by equity method INA, d.d. recorded a share of profit in the amount of HRK 94 million (2019: HRK 10 milion)
presented in the line Share of profit of joint ventures accounted for using the equity method of Statement of Profit and
Loss.
Based on the decision of the Commercial Court from 7 October 2020 the company Terra mineralna gnojiva d.o.o. was
recapitalized in the amount of HRK 100 thousand.
By decision of the Commercial Court in Zagreb from 14 May 2019 the liquidation process of the company Terme Zagreb
d.o.o was completed and in the books of INA, d.d. investment was written off. The net investment value at the time of
liquidation amounted to zero.
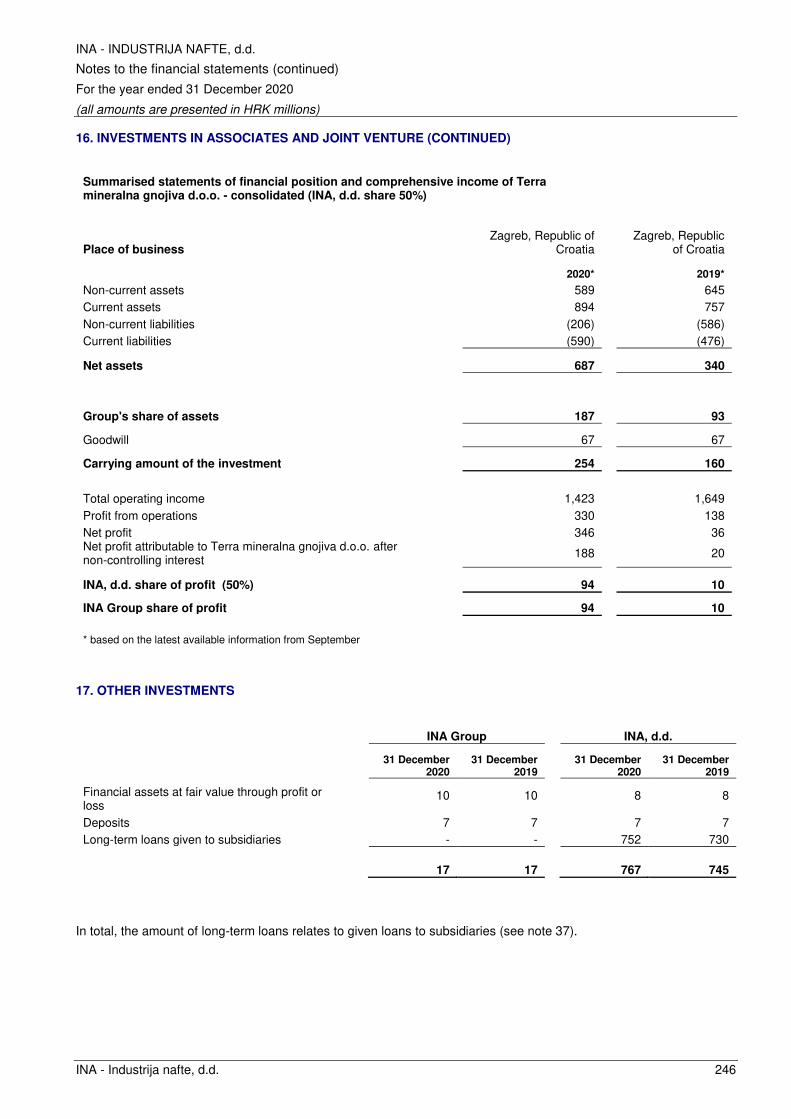
INA - INDUSTRIJA NAFTE, d.d.
Notes to the financial statements (continued)
For the year ended 31 December 2020
(all amounts are presented in HRK millions)
INA - Industrija nafte, d.d. 246
16. INVESTMENTS IN ASSOCIATES AND JOINT VENTURE (CONTINUED)
Summarised statements of financial position and comprehensive income of Terra mineralna gnojiva d.o.o. - consolidated (INA, d.d. share 50%)
Place of business
Zagreb, Republic of Croatia
Zagreb, Republic of Croatia
2020* 2019*
Non-current assets 589 645
Current assets 894 757
Non-current liabilities (206) (586)
Current liabilities (590) (476)
Net assets 687 340
Group's share of assets 187 93
Goodwill 67 67
Carrying amount of the investment 254 160
Total operating income 1,423 1,649
Profit from operations 330 138
Net profit 346 36
Net profit attributable to Terra mineralna gnojiva d.o.o. after non-controlling interest
188 20
INA, d.d. share of profit (50%) 94 10
INA Group share of profit 94 10
* based on the latest available information from September
17. OTHER INVESTMENTS
INA Group INA, d.d.
31 December 2020
31 December 2019
31 December 2020
31 December 2019
Financial assets at fair value through profit or loss
10 10 8 8
Deposits 7 7 7 7
Long-term loans given to subsidiaries - - 752 730
17 17 767 745
In total, the amount of long-term loans relates to given loans to subsidiaries (see note 37).
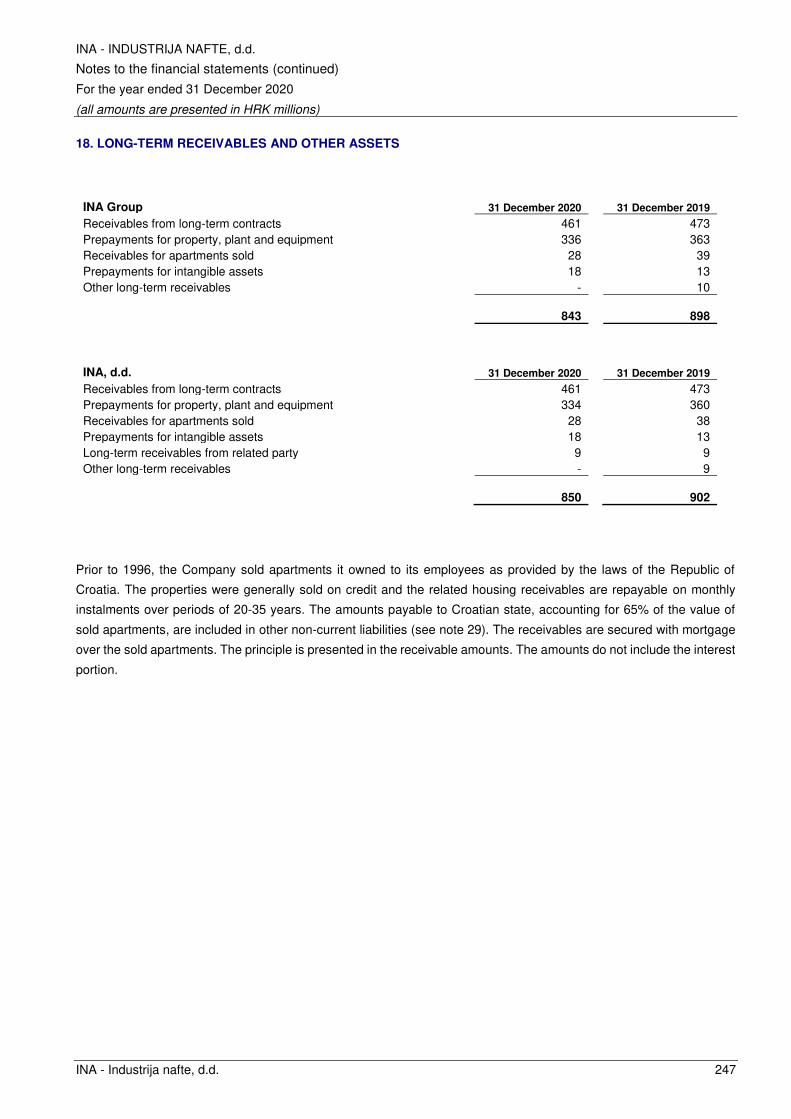
INA - INDUSTRIJA NAFTE, d.d.
Notes to the financial statements (continued)
For the year ended 31 December 2020
(all amounts are presented in HRK millions)
INA - Industrija nafte, d.d. 247
18. LONG-TERM RECEIVABLES AND OTHER ASSETS
INA Group 31 December 2020 31 December 2019
Receivables from long-term contracts 461 473
Prepayments for property, plant and equipment 336 363
Receivables for apartments sold 28 39
Prepayments for intangible assets 18 13
Other long-term receivables - 10
843 898
INA, d.d. 31 December 2020 31 December 2019
Receivables from long-term contracts 461 473
Prepayments for property, plant and equipment 334 360
Receivables for apartments sold 28 38
Prepayments for intangible assets 18 13
Long-term receivables from related party 9 9
Other long-term receivables - 9
850 902
Prior to 1996, the Company sold apartments it owned to its employees as provided by the laws of the Republic of
Croatia. The properties were generally sold on credit and the related housing receivables are repayable on monthly
instalments over periods of 20-35 years. The amounts payable to Croatian state, accounting for 65% of the value of
sold apartments, are included in other non-current liabilities (see note 29). The receivables are secured with mortgage
over the sold apartments. The principle is presented in the receivable amounts. The amounts do not include the interest
portion.

INA - INDUSTRIJA NAFTE, d.d.
Notes to the financial statements (continued)
For the year ended 31 December 2020
(all amounts are presented in HRK millions)
INA - Industrija nafte, d.d. 248
19. NON-CURRENT FINANCIAL ASSETS
Equity instruments
INA Group and INA, d.d.
Name of the Company Activity Place of incorporation and operation
31 December 2020
31 December 2019
Jadranski Naftovod d.d. Pipeline ownership and operations
Zagreb, Croatia 11.795% 11.795%
OMV Slovenia d.o.o. Koper Oil trading Koper, Slovenia 7.75% 7.75%
Plinara d.o.o. Pula Distribution and oil trading Pula, Croatia 49.00% 49.00%
BINA-FINCOM d.d. Zagreb Construction of highways and other roads, airfields airports
Zagreb, Croatia 5.00% 5.00%
HOC Bjelolasica d.o.o. Ogulin
Operations of sports facilities Ogulin, Croatia 7.17% 7.17%
2020 2019
Balance at the beginning of the year Jadranski Naftovod d.d. 559 431
Remeasurement recognistion in OCI, gross of income tax (48) 128
Balance at the end of the year Jadranski Naftovod d.d. 511 559
Other investments 49 48
Balance at the end of the year non-current financial assets 560 607
As explained in note 37, a substantial portion of the trading income of JANAF d.d. is derived from INA, d.d.
The value of equity share in JANAF was reported by reference to the market value of a share as quoted on the Zagreb
Stock Exchange as of 31 December 2020. The net book value of the equity investment in JANAF decreased by HRK
48 million compared to the balance as of 31 December 2019 due to decrease in the market value of the JANAF shares
on Zagreb Stock Exchange. The market value of the shares (118,855 shares) as of 31 December 2020 amounted to
HRK 4,300 per share (31 December 2019: HRK 4,700 per share).

INA - INDUSTRIJA NAFTE, d.d.
Notes to the financial statements (continued)
For the year ended 31 December 2020
(all amounts are presented in HRK millions)
INA - Industrija nafte, d.d. 249
20. INVENTORIES
INA Group INA, d.d.
31 December 2020
31 December 2019
31 December 2020
31 December 2019
Refined products 459 911 419 844
Work in progress 221 408 219 407
Crude oil 251 392 252 392
Merchandise 326 248 275 188
Raw material 195 155 150 105
Spare parts, materials and supplies 172 185 84 89
1,624 2,299 1,399 2,025
Inventories are measured at the lower of cost or net realizable value.
During 2020, HRK 6 million was recognized reversal of impairment for refined products and work in progress for INA
Group and INA, d.d. (2019: reversal of impairment in amount of HRK 91 million). This reversal of impairment of refined
products and work in progress is recognized in Changes in inventories of finished products and work in progress line
within consolidated and separate statement of profit or loss.
During 2020, HRK 3 million was recognized as impairment for merchandise for INA Group and INA, d.d. (2019: HRK 8
million was recognized as reversal of impairment for merchandise for INA Group and INA, d.d.). This impairment of
merchandise is recognized in Cost of other goods sold line within consolidated and separate statement of profit or loss.
21. TRADE RECEIVABLES, NET
INA Group INA, d.d.
31 December 2020
31 December 2019
31 December 2020
31 December 2019
Trade receivables 1,662 2,498 1,164 1,965
Impairment of trade receivables (456) (472) (298) (302)
1,206 2,026 866 1,663
Receivables classified as performing are impaired by using the ECL rate. The effect of impairment losses using ECL
for performing receivables of 0.04 % is HRK 1 million in 2020 (2019: ECL: 0.04%).
Impairment of trade receivables:
INA Group INA, d.d.
31 December 2020
31 December 2019
31 December 2020
31 December 2019
Balance at beginning of the year 472 495 302 339
Impairment losses recognised on receivables 65 69 64 55
Amounts written off as uncollectible (18) (21) (10) (20)
Reversal of impairment on amounts recovered (63) (71) (58) (72)
Balance at end of the year 456 472 298 302
Trade receivables, net balance of INA Group above also includes related party receivables of HRK 151 million as of 31
December 2020 (2019: HRK 356 million) with related party entities out of INA Group (see note 37).
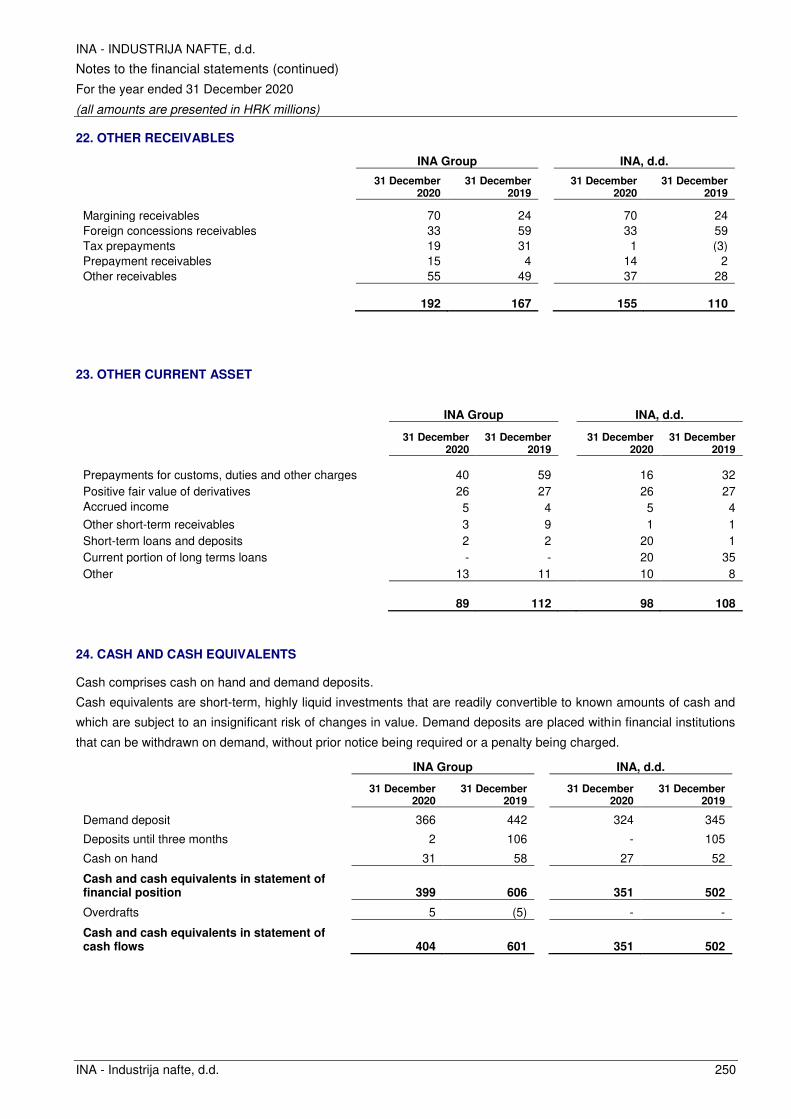
INA - INDUSTRIJA NAFTE, d.d.
Notes to the financial statements (continued)
For the year ended 31 December 2020
(all amounts are presented in HRK millions)
INA - Industrija nafte, d.d. 250
22. OTHER RECEIVABLES
INA Group INA, d.d.
31 December 2020
31 December 2019
31 December 2020
31 December 2019
Margining receivables 70 24 70 24
Foreign concessions receivables 33 59 33 59
Tax prepayments 19 31 1 (3)
Prepayment receivables 15 4 14 2
Other receivables 55 49 37 28
192 167 155 110
23. OTHER CURRENT ASSET
INA Group INA, d.d.
31 December 2020
31 December 2019
31 December 2020
31 December 2019
Prepayments for customs, duties and other charges 40 59 16 32
Positive fair value of derivatives 26 27 26 27
Accrued income 5 4 5 4
Other short-term receivables 3 9 1 1
Short-term loans and deposits 2 2 20 1
Current portion of long terms loans - - 20 35
Other 13 11 10 8
89 112 98 108
24. CASH AND CASH EQUIVALENTS
Cash comprises cash on hand and demand deposits.
Cash equivalents are short-term, highly liquid investments that are readily convertible to known amounts of cash and
which are subject to an insignificant risk of changes in value. Demand deposits are placed within financial institutions
that can be withdrawn on demand, without prior notice being required or a penalty being charged.
INA Group INA, d.d.
31 December
2020 31 December
2019
31 December 2020
31 December 2019
Demand deposit 366 442 324 345
Deposits until three months 2 106 - 105
Cash on hand 31 58 27 52
Cash and cash equivalents in statement of financial position 399 606 351 502
Overdrafts 5 (5) - -
Cash and cash equivalents in statement of cash flows 404 601 351 502

INA - INDUSTRIJA NAFTE, d.d.
Notes to the financial statements (continued)
For the year ended 31 December 2020
(all amounts are presented in HRK millions)
INA - Industrija nafte, d.d. 251
25. BANK LOANS
INA Group INA, d.d.
31 December 2020
31 December 2019
31 December 2020
31 December 2019
Bank loans 2,085 2,825 1,873 2,600
Current portion of long-term loans - 335 - 335
2,085 3,160 1,873 2,935
INA Group INA, d.d.
31 December 2020
31 December 2019
31 December 2020
31 December 2019
Unsecured bank loans in EUR 1,107 2,057 1,066 2,017
Unsecured bank loans in USD 557 503 557 503
Unsecured bank loans in HRK 402 231 250 80
Unsecured bank loans in HUF 19 34 - -
2,085 2,825 1,873 2,600
The most significant short-term loans as at 31 December 2020 are credit facilities for the financing of crude oil and
petroleum products purchase (‘’trade finance’’) concluded with the first class banks, framework agreements for granting
loans, issuing bank guarantees and opening letters of credits concluded with domestic banks, as well as short-term
credit lines with foreign creditors.
Short-term loans are contracted as multicurrency lines with variable interest rates. INA, d.d. short-term loans are
unsecured and do not contain financial covenants.
In order to secure INA Group subsidiaries short–term credit facilities, INA, d.d. issued corporate guarantees.
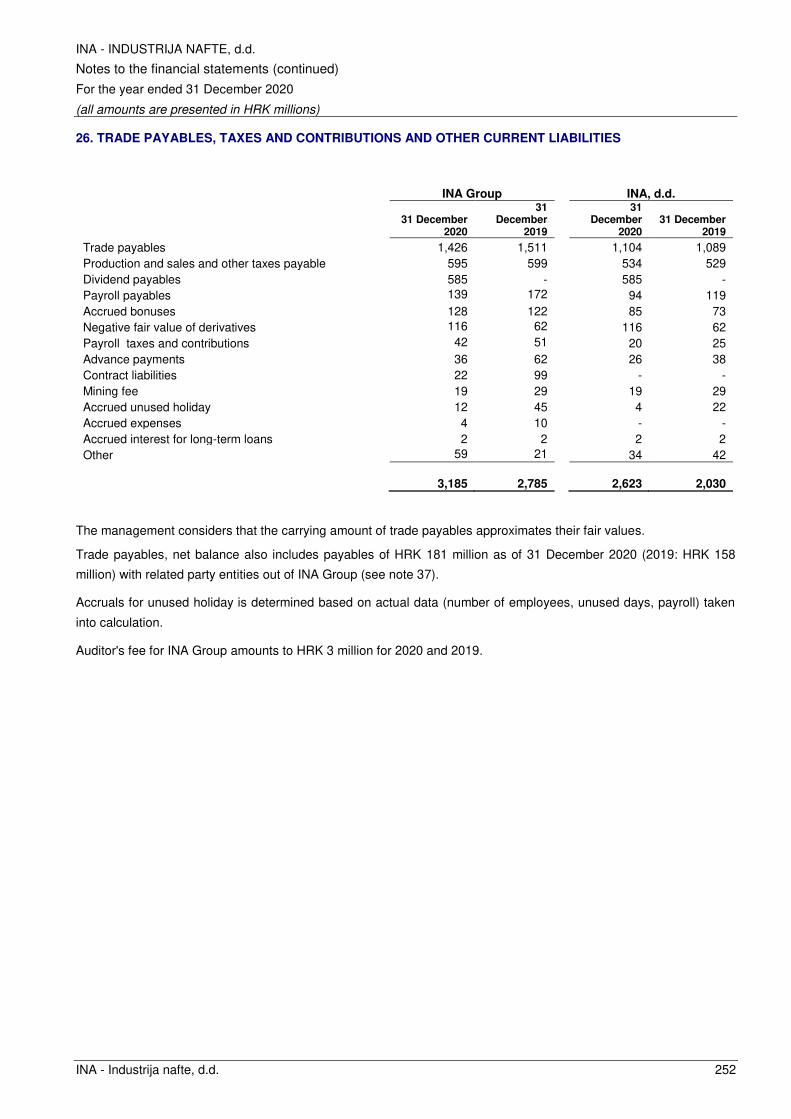
INA - INDUSTRIJA NAFTE, d.d.
Notes to the financial statements (continued)
For the year ended 31 December 2020
(all amounts are presented in HRK millions)
INA - Industrija nafte, d.d. 252
26. TRADE PAYABLES, TAXES AND CONTRIBUTIONS AND OTHER CURRENT LIABILITIES
INA Group INA, d.d.
31 December 2020
31 December
2019
31 December
2020 31 December
2019
Trade payables 1,426 1,511 1,104 1,089
Production and sales and other taxes payable 595 599 534 529
Dividend payables 585 - 585 -
Payroll payables 139 172 94 119
Accrued bonuses 128 122 85 73
Negative fair value of derivatives 116 62 116 62
Payroll taxes and contributions 42 51 20 25
Advance payments 36 62 26 38
Contract liabilities 22 99 - -
Mining fee 19 29 19 29
Accrued unused holiday 12 45 4 22
Accrued expenses 4 10 - -
Accrued interest for long-term loans 2 2 2 2
Other 59 21 34 42
3,185 2,785 2,623 2,030
The management considers that the carrying amount of trade payables approximates their fair values.
Trade payables, net balance also includes payables of HRK 181 million as of 31 December 2020 (2019: HRK 158
million) with related party entities out of INA Group (see note 37).
Accruals for unused holiday is determined based on actual data (number of employees, unused days, payroll) taken
into calculation.
Auditor's fee for INA Group amounts to HRK 3 million for 2020 and 2019.
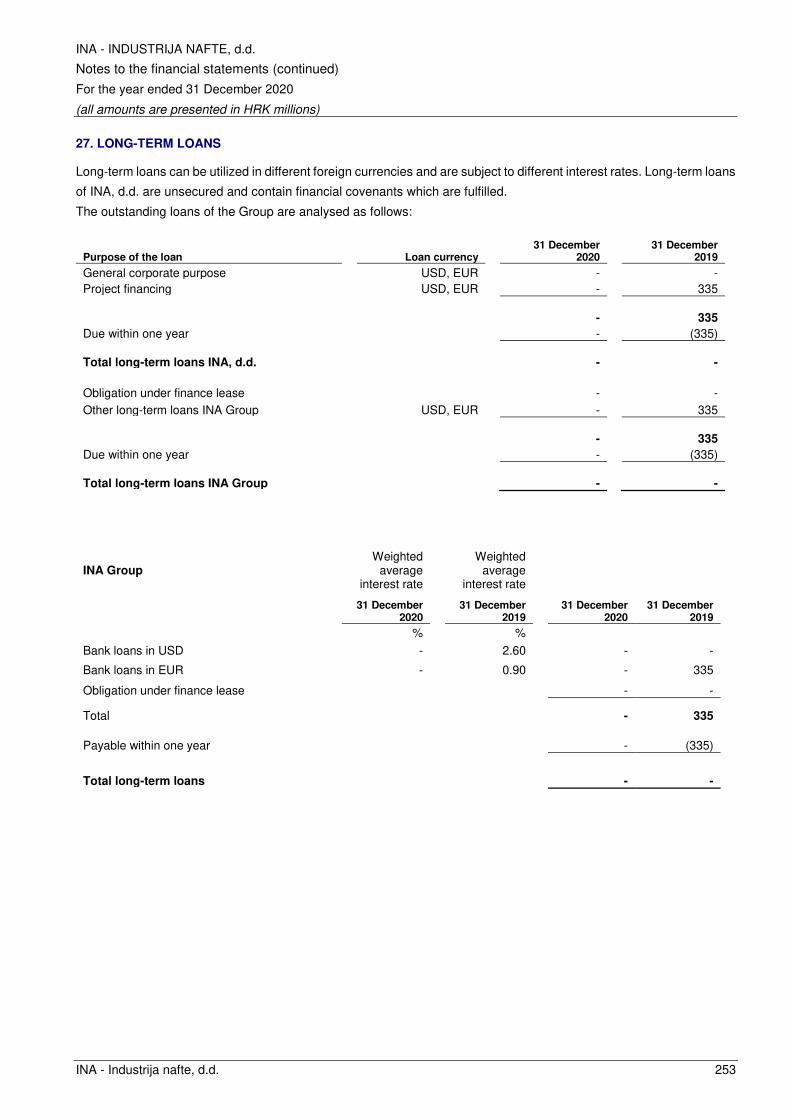
INA - INDUSTRIJA NAFTE, d.d.
Notes to the financial statements (continued)
For the year ended 31 December 2020
(all amounts are presented in HRK millions)
INA - Industrija nafte, d.d. 253
27. LONG-TERM LOANS
Long-term loans can be utilized in different foreign currencies and are subject to different interest rates. Long-term loans
of INA, d.d. are unsecured and contain financial covenants which are fulfilled.
The outstanding loans of the Group are analysed as follows:
Purpose of the loan Loan currency
31 December 2020
31 December 2019
General corporate purpose USD, EUR - -
Project financing USD, EUR - 335
- 335
Due within one year - (335)
Total long-term loans INA, d.d. - -
Obligation under finance lease - -
Other long-term loans INA Group USD, EUR - 335
- 335
Due within one year - (335)
Total long-term loans INA Group - -
INA Group Weighted
average interest rate
Weighted
average interest rate
31 December 2020
31 December 2019
31 December 2020
31 December 2019
% %
Bank loans in USD - 2.60 - -
Bank loans in EUR - 0.90 - 335
Obligation under finance lease - -
Total - 335
Payable within one year - (335)
Total long-term loans - -
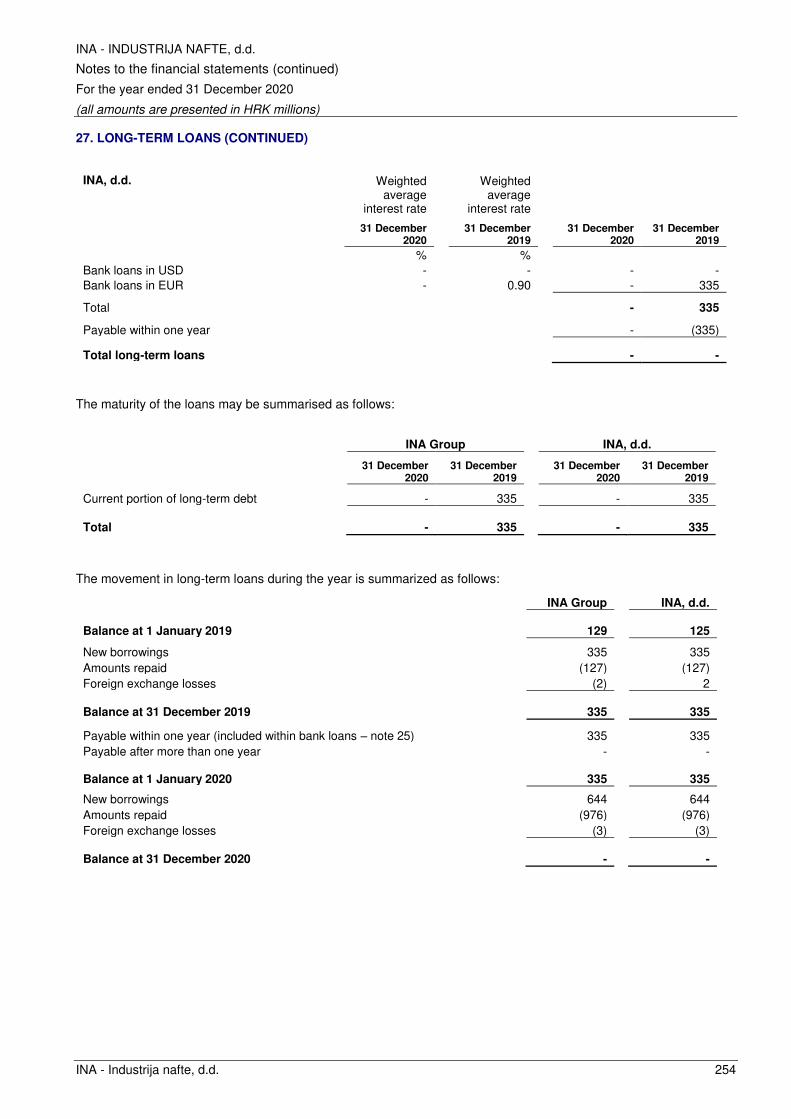
INA - INDUSTRIJA NAFTE, d.d.
Notes to the financial statements (continued)
For the year ended 31 December 2020
(all amounts are presented in HRK millions)
INA - Industrija nafte, d.d. 254
27. LONG-TERM LOANS (CONTINUED)
INA, d.d. Weighted average
interest rate
Weighted
average interest rate
31 December 2020
31 December 2019
31 December 2020
31 December 2019
% %
Bank loans in USD - - - -
Bank loans in EUR - 0.90 - 335
Total - 335
Payable within one year - (335)
Total long-term loans - -
The maturity of the loans may be summarised as follows:
INA Group INA, d.d.
31 December 2020
31 December 2019
31 December 2020
31 December 2019
Current portion of long-term debt - 335 - 335
Total - 335 - 335
The movement in long-term loans during the year is summarized as follows:
INA Group INA, d.d.
Balance at 1 January 2019 129 125
New borrowings 335 335
Amounts repaid (127) (127)
Foreign exchange losses (2) 2
Balance at 31 December 2019 335 335
Payable within one year (included within bank loans – note 25) 335 335
Payable after more than one year - -
Balance at 1 January 2020 335 335
New borrowings 644 644
Amounts repaid (976) (976)
Foreign exchange losses (3) (3)
Balance at 31 December 2020 - -
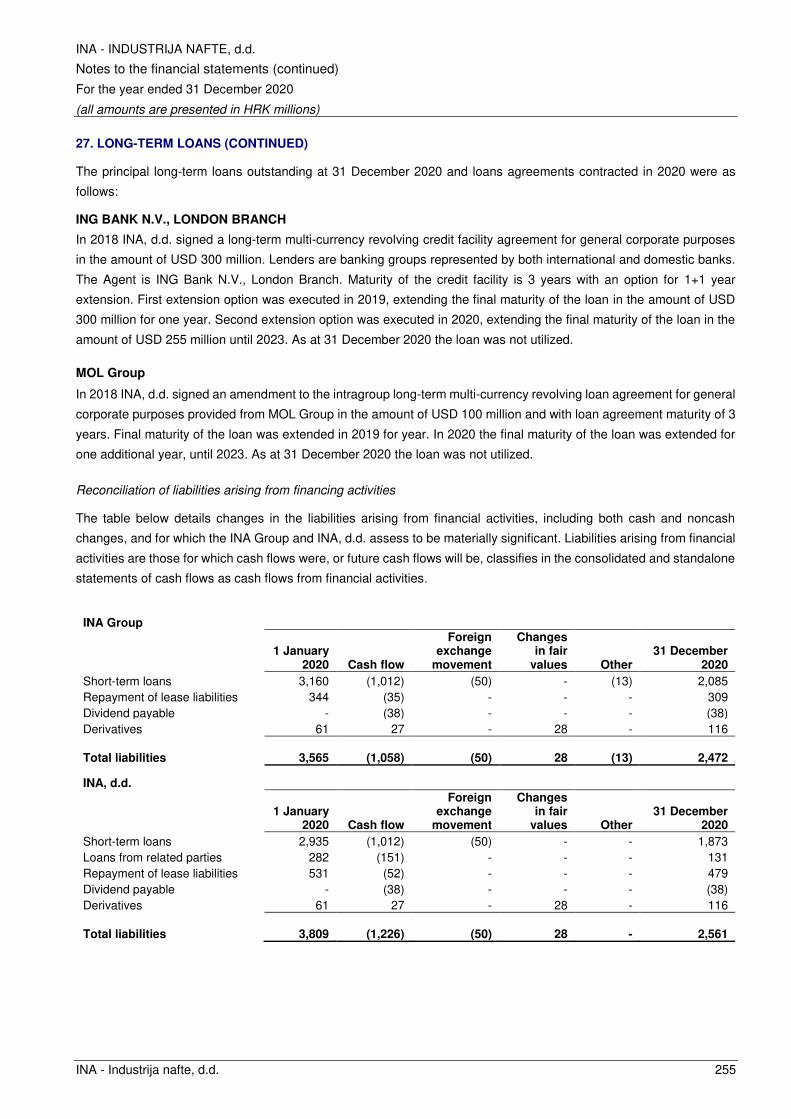
INA - INDUSTRIJA NAFTE, d.d.
Notes to the financial statements (continued)
For the year ended 31 December 2020
(all amounts are presented in HRK millions)
INA - Industrija nafte, d.d. 255
27. LONG-TERM LOANS (CONTINUED)
The principal long-term loans outstanding at 31 December 2020 and loans agreements contracted in 2020 were as
follows:
ING BANK N.V., LONDON BRANCH
In 2018 INA, d.d. signed a long-term multi-currency revolving credit facility agreement for general corporate purposes
in the amount of USD 300 million. Lenders are banking groups represented by both international and domestic banks.
The Agent is ING Bank N.V., London Branch. Maturity of the credit facility is 3 years with an option for 1+1 year
extension. First extension option was executed in 2019, extending the final maturity of the loan in the amount of USD
300 million for one year. Second extension option was executed in 2020, extending the final maturity of the loan in the
amount of USD 255 million until 2023. As at 31 December 2020 the loan was not utilized.
MOL Group
In 2018 INA, d.d. signed an amendment to the intragroup long-term multi-currency revolving loan agreement for general
corporate purposes provided from MOL Group in the amount of USD 100 million and with loan agreement maturity of 3
years. Final maturity of the loan was extended in 2019 for year. In 2020 the final maturity of the loan was extended for
one additional year, until 2023. As at 31 December 2020 the loan was not utilized.
Reconciliation of liabilities arising from financing activities
The table below details changes in the liabilities arising from financial activities, including both cash and noncash
changes, and for which the INA Group and INA, d.d. assess to be materially significant. Liabilities arising from financial
activities are those for which cash flows were, or future cash flows will be, classifies in the consolidated and standalone
statements of cash flows as cash flows from financial activities.
INA Group
1 January 2020 Cash flow
Foreign exchange
movement
Changes in fair
values Other 31 December
2020
Short-term loans 3,160 (1,012) (50) - (13) 2,085
Repayment of lease liabilities 344 (35) - - - 309
Dividend payable - (38) - - - (38)
Derivatives 61 27 - 28 - 116
Total liabilities 3,565 (1,058) (50) 28 (13) 2,472
INA, d.d.
1 January 2020 Cash flow
Foreign exchange
movement
Changes in fair
values Other 31 December
2020
Short-term loans 2,935 (1,012) (50) - - 1,873
Loans from related parties 282 (151) - - - 131
Repayment of lease liabilities 531 (52) - - - 479
Dividend payable - (38) - - - (38)
Derivatives 61 27 - 28 - 116
Total liabilities 3,809 (1,226) (50) 28 - 2,561
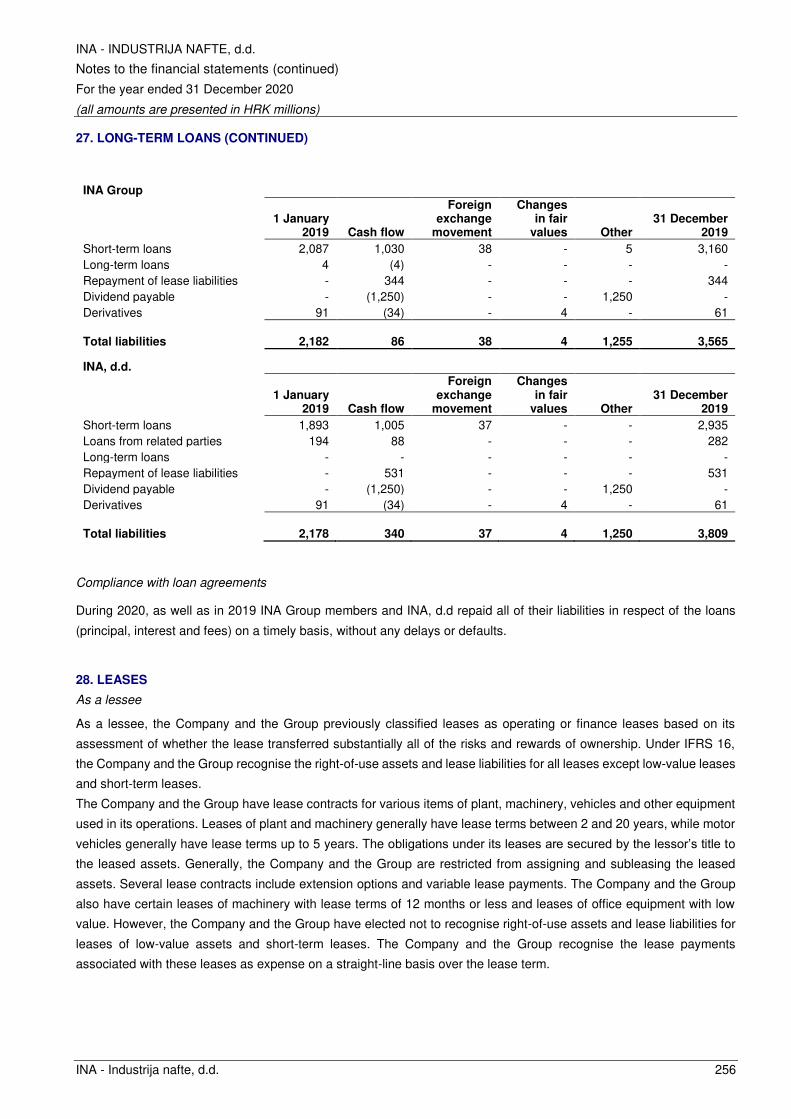
INA - INDUSTRIJA NAFTE, d.d.
Notes to the financial statements (continued)
For the year ended 31 December 2020
(all amounts are presented in HRK millions)
INA - Industrija nafte, d.d. 256
27. LONG-TERM LOANS (CONTINUED)
INA Group
1 January 2019 Cash flow
Foreign exchange
movement
Changes in fair
values Other 31 December
2019
Short-term loans 2,087 1,030 38 - 5 3,160
Long-term loans 4 (4) - - - -
Repayment of lease liabilities - 344 - - - 344
Dividend payable - (1,250) - - 1,250 -
Derivatives 91 (34) - 4 - 61
Total liabilities 2,182 86 38 4 1,255 3,565
INA, d.d.
1 January 2019 Cash flow
Foreign exchange
movement
Changes in fair
values Other 31 December
2019
Short-term loans 1,893 1,005 37 - - 2,935
Loans from related parties 194 88 - - - 282
Long-term loans - - - - - -
Repayment of lease liabilities - 531 - - - 531
Dividend payable - (1,250) - - 1,250 -
Derivatives 91 (34) - 4 - 61
Total liabilities 2,178 340 37 4 1,250 3,809
Compliance with loan agreements
During 2020, as well as in 2019 INA Group members and INA, d.d repaid all of their liabilities in respect of the loans
(principal, interest and fees) on a timely basis, without any delays or defaults.
28. LEASES
As a lessee
As a lessee, the Company and the Group previously classified leases as operating or finance leases based on its
assessment of whether the lease transferred substantially all of the risks and rewards of ownership. Under IFRS 16,
the Company and the Group recognise the right-of-use assets and lease liabilities for all leases except low-value leases
and short-term leases.
The Company and the Group have lease contracts for various items of plant, machinery, vehicles and other equipment
used in its operations. Leases of plant and machinery generally have lease terms between 2 and 20 years, while motor
vehicles generally have lease terms up to 5 years. The obligations under its leases are secured by the lessor’s title to
the leased assets. Generally, the Company and the Group are restricted from assigning and subleasing the leased
assets. Several lease contracts include extension options and variable lease payments. The Company and the Group
also have certain leases of machinery with lease terms of 12 months or less and leases of office equipment with low
value. However, the Company and the Group have elected not to recognise right-of-use assets and lease liabilities for
leases of low-value assets and short-term leases. The Company and the Group recognise the lease payments
associated with these leases as expense on a straight-line basis over the lease term.

INA - INDUSTRIJA NAFTE, d.d.
Notes to the financial statements (continued)
For the year ended 31 December 2020
(all amounts are presented in HRK millions)
INA - Industrija nafte, d.d. 257
28. LEASES (continued)
The Company and the Group present right-of-use assets from leases in separate line item of statement of financial
position. The recognised right-of-use assets relate to the following types of assets and the movements during the period:
INA GROUP Land and buildings Vehicles
Plant and machinery, office
equipment and other Total
Additions and capitalisations due to new standard (IFRS 16) at 1 January 2019
28 72 56 156
Additions in period due to new contracts 83 152 12 247 Depreciation for the period (7) (34) (15) (56)
Other decreasing (i.e. impairment, termination) (4) - (1) (5)
Balance at 31 December 2019 100 190 52 342
Additions in period due to new contracts 27 13 (2) 38
Depreciation for the period (13) (45) (14) (72)
Other decreasing (i.e. impairment, termination) - (3) (1) (4)
Balance at 31 December 2020 114 155 35 304
INA, d.d.
Land and buildings Vehicles
Plant and machinery, office
equipment and other Total
Additions and capitalisations due to new standard (IFRS 16) at 1 January 2019
277 62 58 397
Additions in period due to new contracts 75 121 17 213
Depreciation for the period (34) (29) (18) (81)
Balance at 31 December 2019 318 154 57 529
Additions in period due to new contracts 32 13 (2) 43
Depreciation for the period (41) (39) (18) (98)
Other decreasing (i.e. impairment, termination) (1) - - (1)
Balance at 31 December 2020 308 128 37 473
Lease liabilities
Maturity analysis contractual undiscounted cash flow as at 31 December 2020 and 31 December 2019:
INA Group INA, d.d.
31 December 2020
31 December 2019
31 December 2020
31 December 2019
Analysed as:
Liabilities within 1 year 81 76 104 95
Liabilities between 1-5 years 185 231 282 319
Liabilities over 5 years 54 54 109 136
Total undiscounted liabilities 320 361 495 550
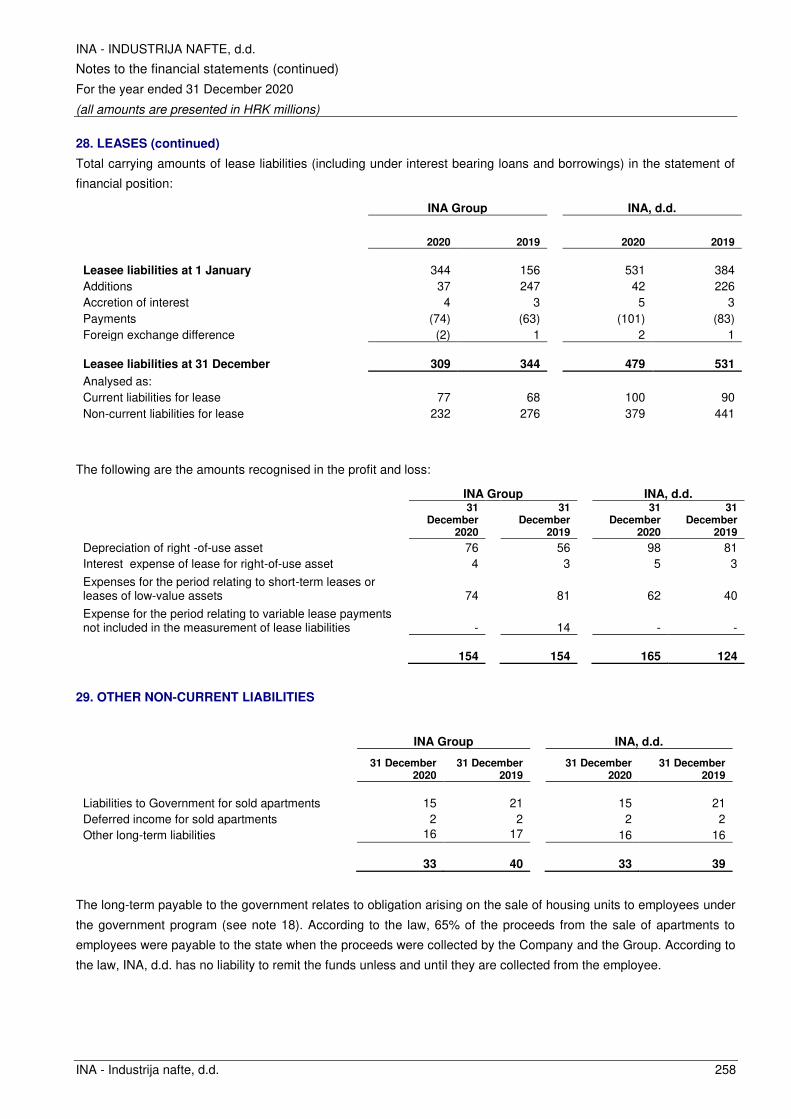
INA - INDUSTRIJA NAFTE, d.d.
Notes to the financial statements (continued)
For the year ended 31 December 2020
(all amounts are presented in HRK millions)
INA - Industrija nafte, d.d. 258
28. LEASES (continued)
Total carrying amounts of lease liabilities (including under interest bearing loans and borrowings) in the statement of
financial position:
INA Group INA, d.d.
2020 2019 2020 2019
Leasee liabilities at 1 January 344 156 531 384
Additions 37 247 42 226
Accretion of interest 4 3 5 3
Payments (74) (63) (101) (83)
Foreign exchange difference (2) 1 2 1
Leasee liabilities at 31 December 309 344 479 531
Analysed as:
Current liabilities for lease 77 68 100 90
Non-current liabilities for lease 232 276 379 441
The following are the amounts recognised in the profit and loss:
INA Group INA, d.d.
31 December
2020
31 December
2019
31 December
2020
31 December
2019
Depreciation of right -of-use asset 76 56 98 81
Interest expense of lease for right-of-use asset 4 3 5 3
Expenses for the period relating to short-term leases or leases of low-value assets 74 81 62 40
Expense for the period relating to variable lease payments not included in the measurement of lease liabilities - 14 - -
154 154 165 124
29. OTHER NON-CURRENT LIABILITIES
INA Group INA, d.d.
31 December 2020
31 December 2019
31 December 2020
31 December 2019
Liabilities to Government for sold apartments 15 21 15 21
Deferred income for sold apartments 2 2 2 2
Other long-term liabilities 16 17 16 16
33 40 33 39
The long-term payable to the government relates to obligation arising on the sale of housing units to employees under
the government program (see note 18). According to the law, 65% of the proceeds from the sale of apartments to
employees were payable to the state when the proceeds were collected by the Company and the Group. According to
the law, INA, d.d. has no liability to remit the funds unless and until they are collected from the employee.
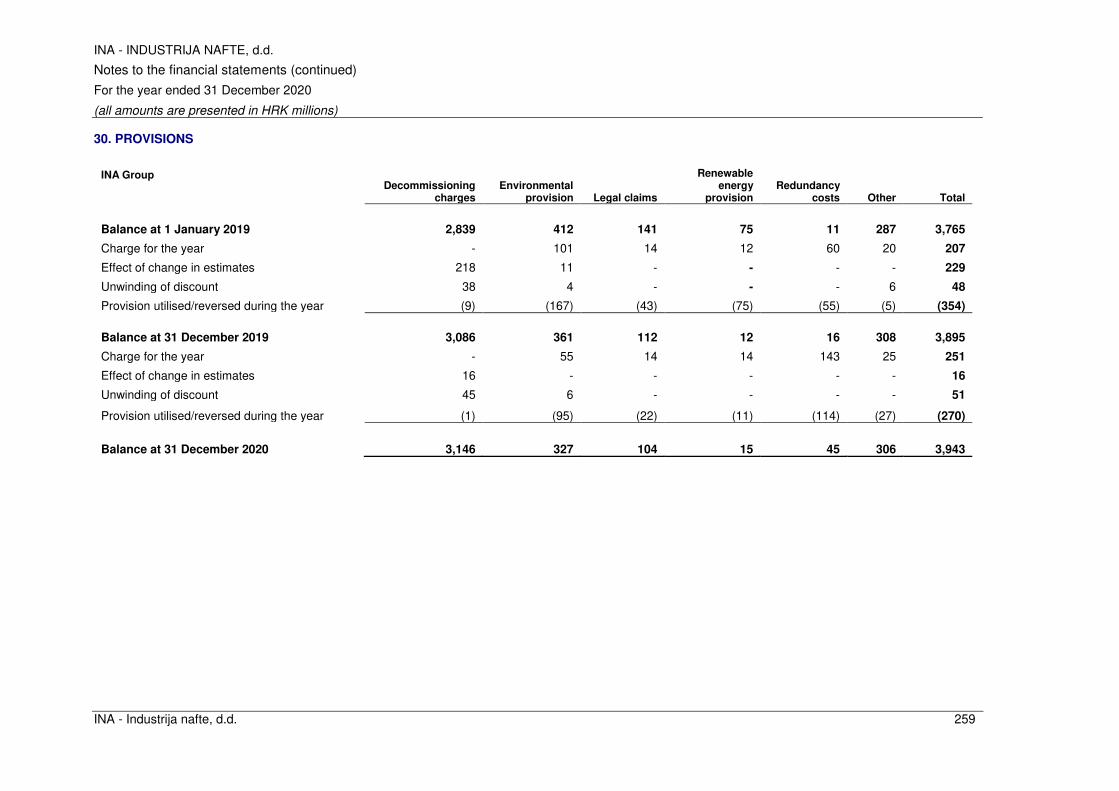
INA - INDUSTRIJA NAFTE, d.d.
Notes to the financial statements (continued)
For the year ended 31 December 2020
(all amounts are presented in HRK millions)
INA - Industrija nafte, d.d. 259
30. PROVISIONS
INA Group Decommissioning
charges Environmental
provision Legal claims
Renewable energy
provision Redundancy
costs Other Total
Balance at 1 January 2019 2,839 412 141 75 11 287 3,765
Charge for the year - 101 14 12 60 20 207
Effect of change in estimates 218 11 - - - - 229
Unwinding of discount 38 4 - - - 6 48
Provision utilised/reversed during the year (9) (167) (43) (75) (55) (5) (354)
Balance at 31 December 2019 3,086 361 112 12 16 308 3,895
Charge for the year - 55 14 14 143 25 251
Effect of change in estimates 16 - - - - - 16
Unwinding of discount 45 6 - - - - 51
Provision utilised/reversed during the year (1) (95) (22) (11) (114) (27) (270)
Balance at 31 December 2020 3,146 327 104 15 45 306 3,943

INA - INDUSTRIJA NAFTE, d.d.
Notes to the financial statements (continued)
For the year ended 31 December 2020
(all amounts are presented in HRK millions)
INA - Industrija nafte, d.d. 260
30. PROVISIONS (CONTINUED)
INA, d.d. Decommissioning
charges Environmental
provision Legal claims
Renewable energy
provision Redundancy
costs Other Total
Balance at 1 January 2019 3,029 408 30 75 2 284 3,828
Charge for the year - 97 5 12 60 20 194
Effect of change in estimates 232 11 - - - - 243
Unwinding of discount 40 4 - - - 6 50
Provision utilised/reversed during the year - (164) (28) (75) (52) (6) (325)
Balance at 31 December 2019 3,301 356 7 12 10 304 3,990
Charge for the year - 50 8 14 77 15 164
Effect of change in estimates 21 (7) - - - (20) (6)
Unwinding of discount 48 6 - - - 5 59
Provision utilised/reversed during the year (1) (82) (12) (12) (56) (4) (167)
Balance at 31 December 2020 3,369 323 3 14 31 300 4,040
INA Group INA, d.d.
31 December
2020 31 December
2019
31 December 2020
31 December 2019
Analysed as:
Current liabilities 247 179 178 116
Non-current liabilities 3,696 3,716 3,862 3,874
3,943 3,895 4,040 3,990
INA - INDUSTRIJA NAFTE, d.d.
Notes to the financial statements (continued)
For the year ended 31 December 2020
(all amounts are presented in HRK millions)
INA - Industrija nafte, d.d. 261
30. PROVISIONS (CONTINUED)
Decommissioning charges
The Company and the Group record provisions at present value of estimated future costs of abandoning oil and gas
production facilities estimated at the end of production. The estimate of provisions is based on the applicable legal
regulations, technology and price levels. Decommission assets are created in an amount equal to the estimated
provision, which is also amortized as part of the capital asset costs. Any change to the present value of the estimated
costs is reflected as an adjustment of the provisions and the decommission assets. In case there is no related asset,
the change in provision estimate is charged to profit and loss statement.
As of 31 December 2020, INA, d.d. recognised a decommissioning provision for 45 oil and gas production fields, 7
non-production fields, 10 positive non-production fields and 357 dry non-production wells. As of 31 December 2019,
INA, d.d. recognised a decommissioning provision for 45 oil and gas production fields, 7 non-production fields, 10
positive non-production fields and 357 dry non-production wells.
Environmental provision
The environmental provision recorded by INA Group is HRK 327 million as of 31 December 2020 (31 December 2019:
HRK 361 million). The environmental provision covers treatment of accumulated waste generated by former activity,
soil excavation and replacement during the reconstruction of service stations and comprehensive investigation to
determine the extent of the soil and groundwater contaminations.
Emission allowances
Under European Union Emission Trading Scheme, INA, d.d. plants receive a certain amount of emission allowances
for free. The allowances are received on an annual basis, and in return, INA, d.d. is required to submit allowances
equal to its actual verified emissions. The number of emission allowances allocated for free is calculated by the
European Commission filled in by installations, and submitted to Ministry of Environmental and Nature protection by
31 December of the current year for that year.
INA, d.d. has adopted the net liability approach to the emission allowances granted. Therefore, a provision is
recognised only when actual emissions exceed the allocated emission allowances. Provision recorded for exceeding
amount of emission rights granted should be charged with purchased rights. The emission costs are recognised as
other material costs. Detail explanation on the accounting and provision calculation is regulated by internal Regulation
on greenhouse gas and emission allowances management in INA, d.d.
Free Emission allowances are granted with respect to one-year period and are distributed by competent authority.
Legal claims
Provisions for legal claims are based on the legal counsel and management estimate, taking into consideration claim
value and probability that outflow of resources will be required to settle the obligation
Renewable energy provision
Renewable energy provision relates to the potential compliance cost which can arise from the Act on bio fuels for
transports and further regulated by Regulation on special environmental fee.
INA - INDUSTRIJA NAFTE, d.d.
Notes to the financial statements (continued)
For the year ended 31 December 2020
(all amounts are presented in HRK millions)
INA - Industrija nafte, d.d. 262
30. PROVISIONS (CONTINUED)
Other provisions
Other provisions of INA, d.d. in amount of HRK 300 million relate to provision for contractual liability for investments
in Iran of HRK 248 million initially recognized in 2012. INA, d.d. is committed to spending certain resources by
Production Agreement. Since Iran activities have been discontinued, the difference between contractual liability and
actual funds spent was recognized as provisions. Remaining amount relates to provision for Sisak Refinery
conservation, sediment and non-pumpable inventories in the total amount of HRK 51 million.
31. RETIREMENT AND OTHER EMPLOYEE BENEFITS
According to the Collective Agreement, the Group bears the obligation to pay jubilee awards, retirement and other
benefits to employees. The Group operates defined benefit schemes for qualifying employees. Under the schemes,
the employees are entitled to an early retirement benefit in the net amount of HRK 20,000 of which HRK 12,000
represent taxable portion. No other post-retirement benefits are provided. Jubilee awards are paid out according to
Collective Agreement in the following fixed amounts and anniversary dates for total service in the Company and the
Group:
Anniversary of continuous services -
years 10 15 20 25 30 35
40 and every 5
more years
Fixed amounts - HRK 1,500 2,000 2,500 3,000 3,500 4,000 5,000
The net amounts specified above, in terms of tax regulations are non-taxable. Defined amounts of jubilee awards are
effective for Collective Agreement signed in 2020.
The actuarial valuations of the present value of the defined benefit obligation were carried out at 31 December 2020
and 2019 by independent actuarial expert. In 2020, the Company made a provision of HRK 13 million in respect of
jubilee awards and HRK 7 million for regular retirement allowance, whereas in 2019 Company made provision in
respect of jubilee awards in amount of HRK 15 million and for regular retirement HRK 7 million.
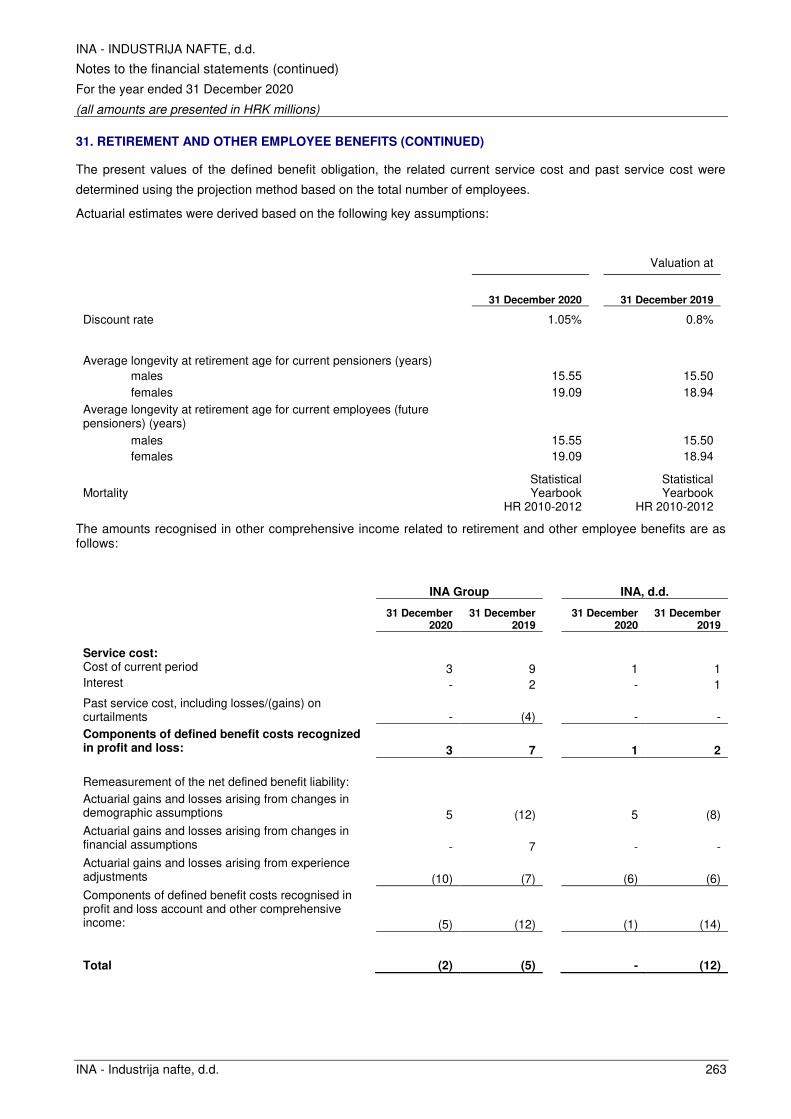
INA - INDUSTRIJA NAFTE, d.d.
Notes to the financial statements (continued)
For the year ended 31 December 2020
(all amounts are presented in HRK millions)
INA - Industrija nafte, d.d. 263
31. RETIREMENT AND OTHER EMPLOYEE BENEFITS (CONTINUED)
The present values of the defined benefit obligation, the related current service cost and past service cost were
determined using the projection method based on the total number of employees.
Actuarial estimates were derived based on the following key assumptions:
Valuation at
31 December 2020 31 December 2019
Discount rate 1.05% 0.8%
Average longevity at retirement age for current pensioners (years)
males 15.55 15.50
females 19.09 18.94
Average longevity at retirement age for current employees (future pensioners) (years)
males 15.55 15.50
females 19.09 18.94
Mortality Statistical Yearbook
HR 2010-2012
Statistical Yearbook
HR 2010-2012
The amounts recognised in other comprehensive income related to retirement and other employee benefits are as follows:
INA Group
INA, d.d.
31 December 2020
31 December 2019
31 December 2020
31 December 2019
Service cost:
Cost of current period 3 9 1 1 Interest - 2 - 1
Past service cost, including losses/(gains) on curtailments - (4) - -
Components of defined benefit costs recognized in profit and loss: 3 7 1 2
Remeasurement of the net defined benefit liability:
Actuarial gains and losses arising from changes in demographic assumptions 5 (12) 5 (8)
Actuarial gains and losses arising from changes in financial assumptions - 7 - -
Actuarial gains and losses arising from experience adjustments (10) (7) (6) (6)
Components of defined benefit costs recognised in profit and loss account and other comprehensive income: (5) (12) (1) (14)
Total (2) (5) - (12)
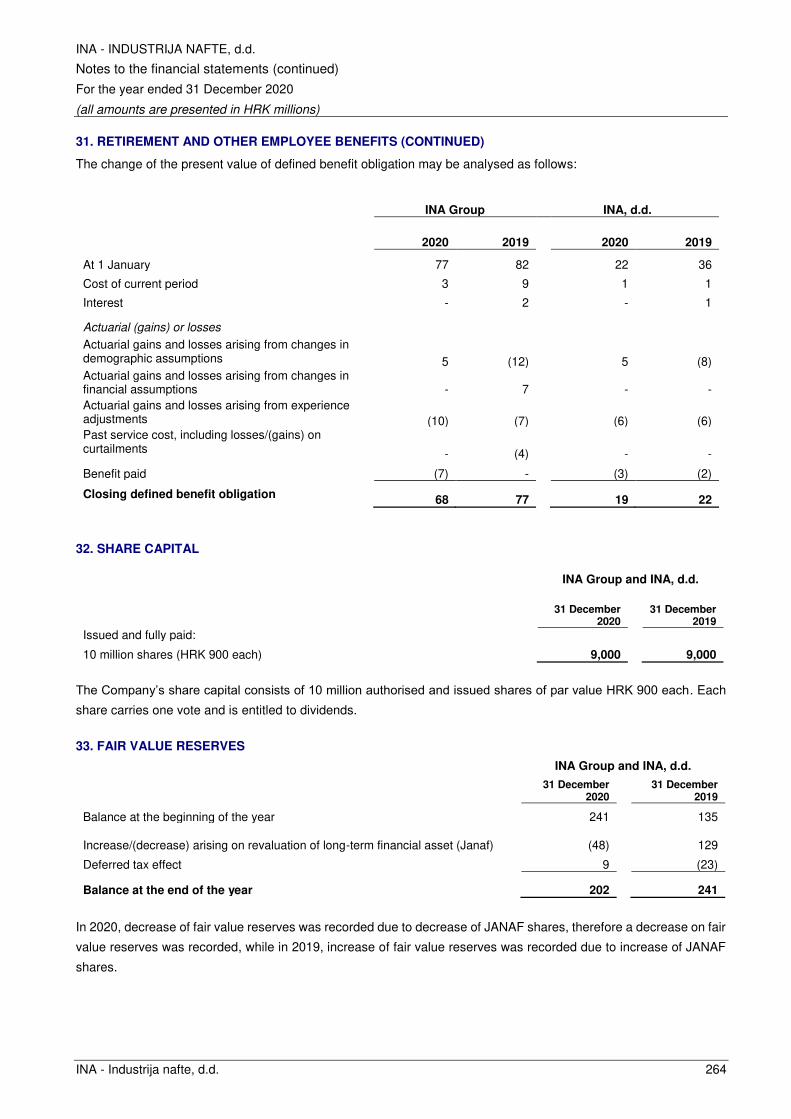
INA - INDUSTRIJA NAFTE, d.d.
Notes to the financial statements (continued)
For the year ended 31 December 2020
(all amounts are presented in HRK millions)
INA - Industrija nafte, d.d. 264
31. RETIREMENT AND OTHER EMPLOYEE BENEFITS (CONTINUED)
The change of the present value of defined benefit obligation may be analysed as follows:
INA Group INA, d.d.
2020 2019 2020 2019
At 1 January 77 82 22 36
Cost of current period 3 9 1 1
Interest - 2 - 1
Actuarial (gains) or losses
Actuarial gains and losses arising from changes in demographic assumptions 5 (12) 5 (8) Actuarial gains and losses arising from changes in financial assumptions - 7 - -
Actuarial gains and losses arising from experience adjustments (10) (7) (6) (6) Past service cost, including losses/(gains) on curtailments - (4) - -
Benefit paid (7) - (3) (2)
Closing defined benefit obligation 68 77 19 22
32. SHARE CAPITAL
INA Group and INA, d.d.
31 December 2020
31 December
2019
Issued and fully paid:
10 million shares (HRK 900 each) 9,000 9,000
The Company’s share capital consists of 10 million authorised and issued shares of par value HRK 900 each. Each
share carries one vote and is entitled to dividends.
33. FAIR VALUE RESERVES
INA Group and INA, d.d.
31 December 2020
31 December 2019
Balance at the beginning of the year 241 135
Increase/(decrease) arising on revaluation of long-term financial asset (Janaf) (48) 129
Deferred tax effect 9 (23)
Balance at the end of the year 202 241
In 2020, decrease of fair value reserves was recorded due to decrease of JANAF shares, therefore a decrease on fair
value reserves was recorded, while in 2019, increase of fair value reserves was recorded due to increase of JANAF
shares.
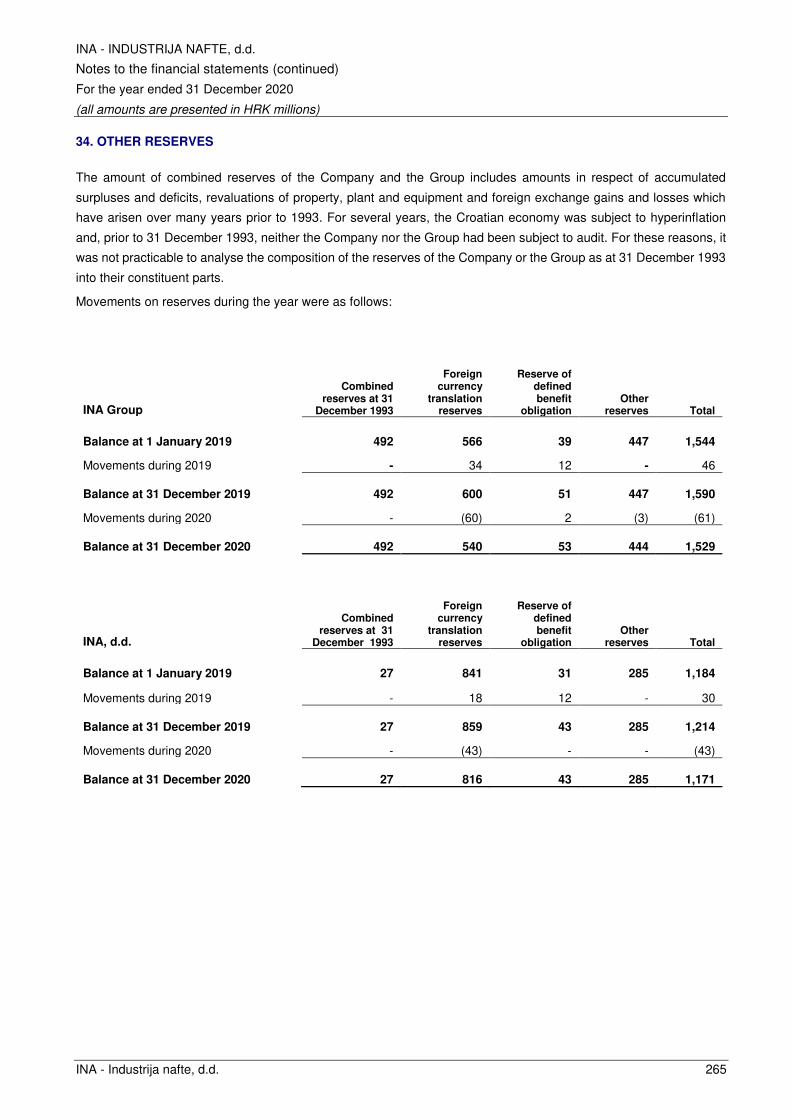
INA - INDUSTRIJA NAFTE, d.d.
Notes to the financial statements (continued)
For the year ended 31 December 2020
(all amounts are presented in HRK millions)
INA - Industrija nafte, d.d. 265
34. OTHER RESERVES
The amount of combined reserves of the Company and the Group includes amounts in respect of accumulated
surpluses and deficits, revaluations of property, plant and equipment and foreign exchange gains and losses which
have arisen over many years prior to 1993. For several years, the Croatian economy was subject to hyperinflation
and, prior to 31 December 1993, neither the Company nor the Group had been subject to audit. For these reasons, it
was not practicable to analyse the composition of the reserves of the Company or the Group as at 31 December 1993
into their constituent parts.
Movements on reserves during the year were as follows:
INA Group
Combined reserves at 31
December 1993
Foreign currency
translation reserves
Reserve of defined benefit
obligation Other
reserves Total
Balance at 1 January 2019 492 566 39 447 1,544
Movements during 2019 - 34 12 - 46
Balance at 31 December 2019 492 600 51 447 1,590
Movements during 2020 - (60) 2 (3) (61)
Balance at 31 December 2020 492 540 53 444 1,529
INA, d.d.
Combined reserves at 31
December 1993
Foreign currency
translation reserves
Reserve of defined benefit
obligation Other
reserves Total
Balance at 1 January 2019 27 841 31 285 1,184
Movements during 2019 - 18 12 - 30
Balance at 31 December 2019 27 859 43 285 1,214
Movements during 2020 - (43) - - (43)
Balance at 31 December 2020 27 816 43 285 1,171
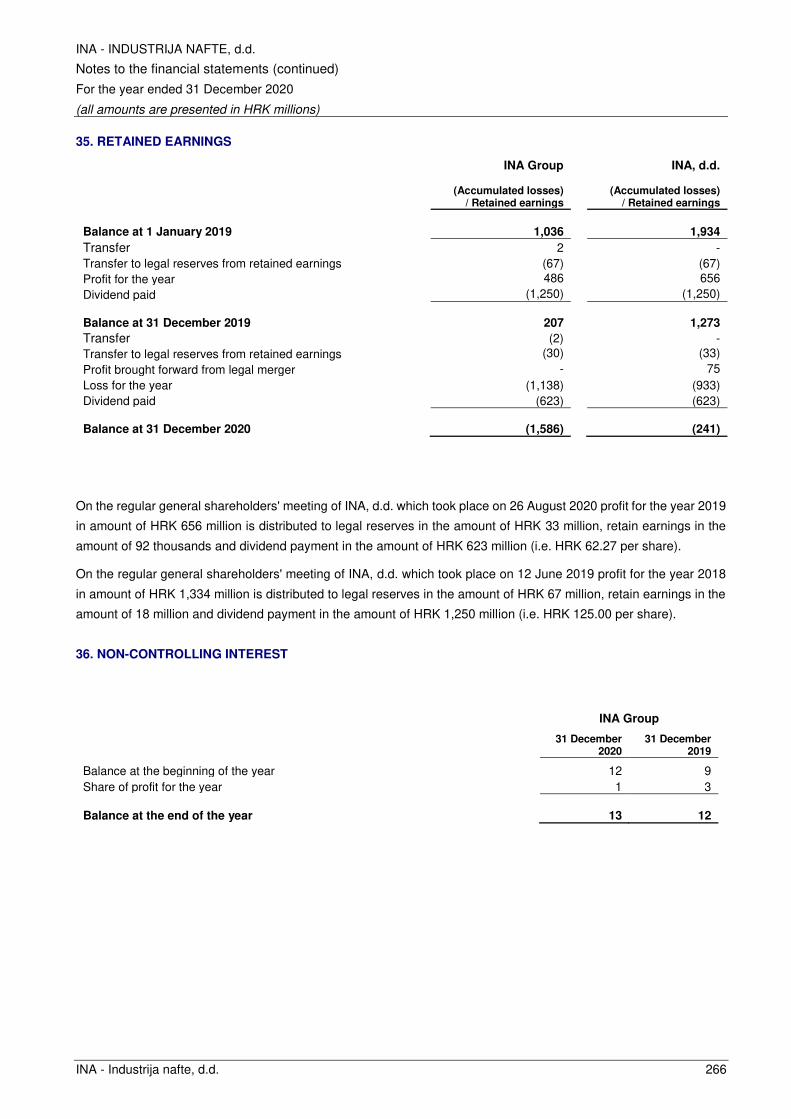
INA - INDUSTRIJA NAFTE, d.d.
Notes to the financial statements (continued)
For the year ended 31 December 2020
(all amounts are presented in HRK millions)
INA - Industrija nafte, d.d. 266
35. RETAINED EARNINGS
INA Group INA, d.d.
(Accumulated losses)
/ Retained earnings
(Accumulated losses)
/ Retained earnings
Balance at 1 January 2019 1,036
1,934
Transfer 2 -
Transfer to legal reserves from retained earnings (67) (67)
Profit for the year 486 656
Dividend paid (1,250) (1,250)
Balance at 31 December 2019 207
1,273
Transfer (2) -
Transfer to legal reserves from retained earnings (30) (33)
Profit brought forward from legal merger - 75
Loss for the year (1,138) (933)
Dividend paid (623) (623)
Balance at 31 December 2020 (1,586) (241)
On the regular general shareholders' meeting of INA, d.d. which took place on 26 August 2020 profit for the year 2019
in amount of HRK 656 million is distributed to legal reserves in the amount of HRK 33 million, retain earnings in the
amount of 92 thousands and dividend payment in the amount of HRK 623 million (i.e. HRK 62.27 per share).
On the regular general shareholders' meeting of INA, d.d. which took place on 12 June 2019 profit for the year 2018
in amount of HRK 1,334 million is distributed to legal reserves in the amount of HRK 67 million, retain earnings in the
amount of 18 million and dividend payment in the amount of HRK 1,250 million (i.e. HRK 125.00 per share).
36. NON-CONTROLLING INTEREST
INA Group
31 December 2020
31 December 2019
Balance at the beginning of the year 12 9
Share of profit for the year 1 3
Balance at the end of the year 13 12
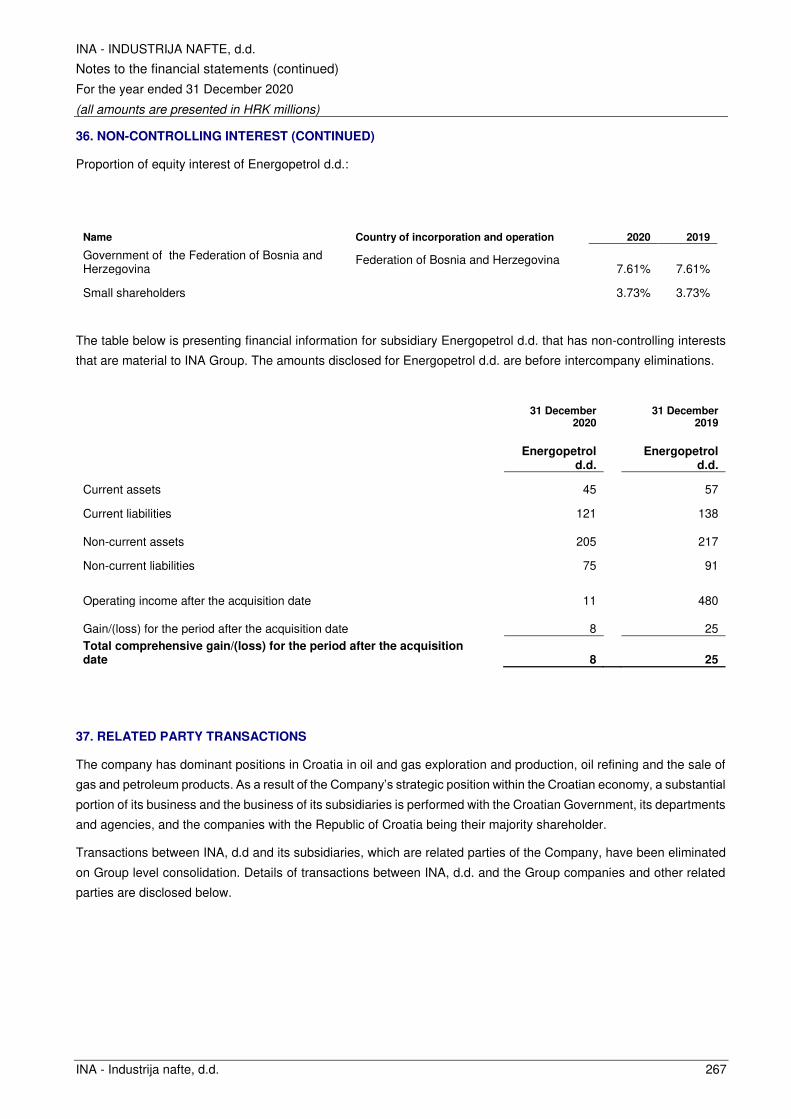
INA - INDUSTRIJA NAFTE, d.d.
Notes to the financial statements (continued)
For the year ended 31 December 2020
(all amounts are presented in HRK millions)
INA - Industrija nafte, d.d. 267
36. NON-CONTROLLING INTEREST (CONTINUED)
Proportion of equity interest of Energopetrol d.d.:
Name Country of incorporation and operation 2020 2019
Government of the Federation of Bosnia and Herzegovina
Federation of Bosnia and Herzegovina 7.61% 7.61%
Small shareholders 3.73% 3.73%
The table below is presenting financial information for subsidiary Energopetrol d.d. that has non-controlling interests
that are material to INA Group. The amounts disclosed for Energopetrol d.d. are before intercompany eliminations.
31 December 2020
31 December 2019
Energopetrol
d.d. Energopetrol
d.d.
Current assets 45 57
Current liabilities 121 138
Non-current assets 205 217
Non-current liabilities 75 91
Operating income after the acquisition date 11 480
Gain/(loss) for the period after the acquisition date 8 25
Total comprehensive gain/(loss) for the period after the acquisition date 8 25
37. RELATED PARTY TRANSACTIONS
The company has dominant positions in Croatia in oil and gas exploration and production, oil refining and the sale of
gas and petroleum products. As a result of the Company’s strategic position within the Croatian economy, a substantial portion of its business and the business of its subsidiaries is performed with the Croatian Government, its departments
and agencies, and the companies with the Republic of Croatia being their majority shareholder.
Transactions between INA, d.d and its subsidiaries, which are related parties of the Company, have been eliminated
on Group level consolidation. Details of transactions between INA, d.d. and the Group companies and other related
parties are disclosed below.
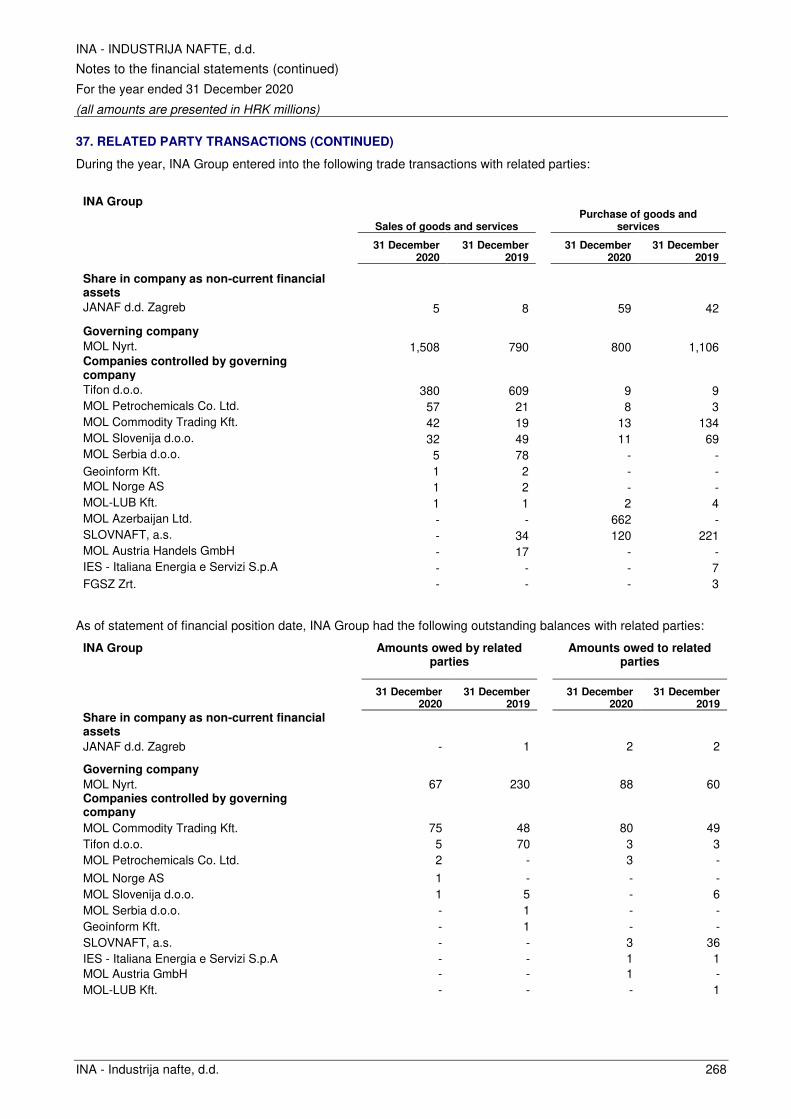
INA - INDUSTRIJA NAFTE, d.d.
Notes to the financial statements (continued)
For the year ended 31 December 2020
(all amounts are presented in HRK millions)
INA - Industrija nafte, d.d. 268
37. RELATED PARTY TRANSACTIONS (CONTINUED)
During the year, INA Group entered into the following trade transactions with related parties:
INA Group
Sales of goods and services
Purchase of goods and services
31 December 2020
31 December 2019
31 December 2020
31 December 2019
Share in company as non-current financial assets
JANAF d.d. Zagreb 5 8 59 42
Governing company
MOL Nyrt. 1,508 790 800 1,106 Companies controlled by governing company
Tifon d.o.o. 380 609 9 9
MOL Petrochemicals Co. Ltd. 57 21 8 3
MOL Commodity Trading Kft. 42 19 13 134
MOL Slovenija d.o.o. 32 49 11 69
MOL Serbia d.o.o. 5 78 - -
Geoinform Kft. 1 2 - -
MOL Norge AS 1 2 - -
MOL-LUB Kft. 1 1 2 4
MOL Azerbaijan Ltd. - - 662 -
SLOVNAFT, a.s. - 34 120 221
MOL Austria Handels GmbH - 17 - -
IES - Italiana Energia e Servizi S.p.A - - - 7
FGSZ Zrt. - - - 3
As of statement of financial position date, INA Group had the following outstanding balances with related parties:
INA Group
Amounts owed by related parties
Amounts owed to related
parties
31 December 2020
31 December 2019
31 December 2020
31 December 2019
Share in company as non-current financial assets
JANAF d.d. Zagreb - 1 2 2
Governing company
MOL Nyrt. 67 230 88 60 Companies controlled by governing company
MOL Commodity Trading Kft. 75 48 80 49
Tifon d.o.o. 5 70 3 3
MOL Petrochemicals Co. Ltd. 2 - 3 -
MOL Norge AS 1 - - -
MOL Slovenija d.o.o. 1 5 - 6
MOL Serbia d.o.o. - 1 - -
Geoinform Kft. - 1 - -
SLOVNAFT, a.s. - - 3 36
IES - Italiana Energia e Servizi S.p.A - - 1 1
MOL Austria GmbH - - 1 -
MOL-LUB Kft. - - - 1
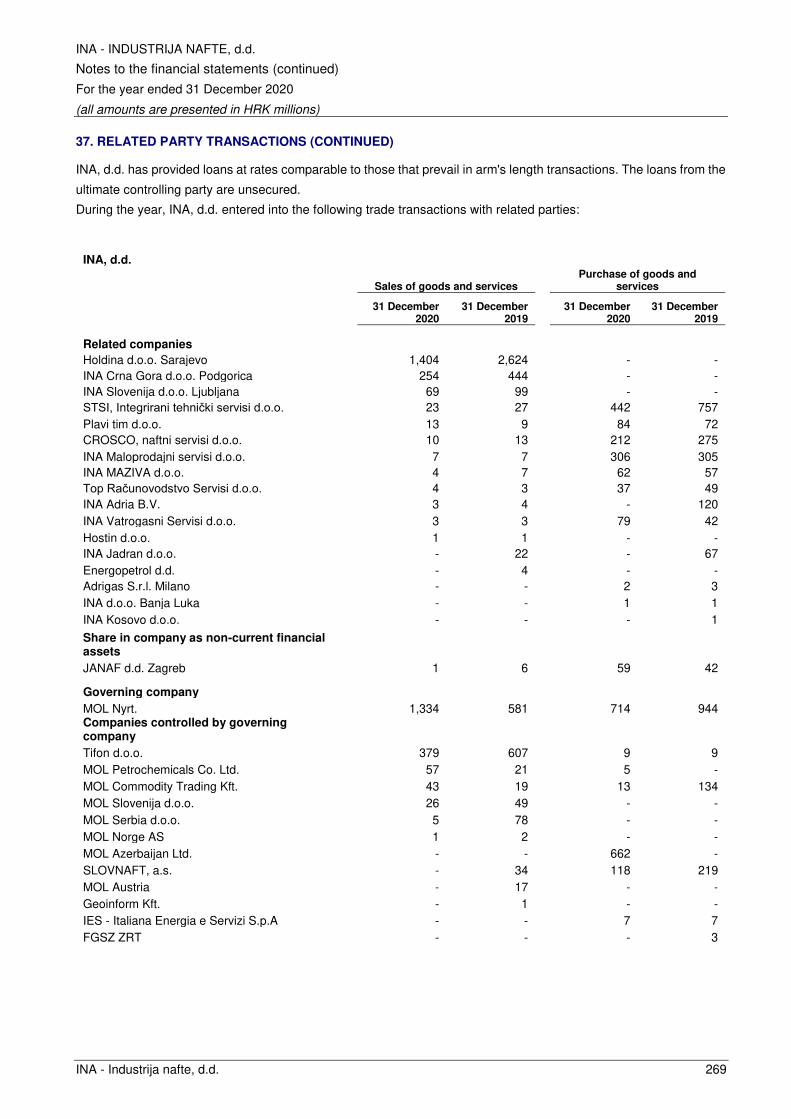
INA - INDUSTRIJA NAFTE, d.d.
Notes to the financial statements (continued)
For the year ended 31 December 2020
(all amounts are presented in HRK millions)
INA - Industrija nafte, d.d. 269
37. RELATED PARTY TRANSACTIONS (CONTINUED)
INA, d.d. has provided loans at rates comparable to those that prevail in arm's length transactions. The loans from the
ultimate controlling party are unsecured.
During the year, INA, d.d. entered into the following trade transactions with related parties:
INA, d.d.
Sales of goods and services
Purchase of goods and services
31 December 2020
31 December 2019
31 December 2020
31 December 2019
Related companies
Holdina d.o.o. Sarajevo 1,404 2,624 - -
INA Crna Gora d.o.o. Podgorica 254 444 - -
INA Slovenija d.o.o. Ljubljana 69 99 - -
STSI, Integrirani tehnički servisi d.o.o. 23 27 442 757
Plavi tim d.o.o. 13 9 84 72
CROSCO, naftni servisi d.o.o. 10 13 212 275
INA Maloprodajni servisi d.o.o. 7 7 306 305
INA MAZIVA d.o.o. 4 7 62 57
Top Računovodstvo Servisi d.o.o. 4 3 37 49
INA Adria B.V. 3 4 - 120
INA Vatrogasni Servisi d.o.o. 3 3 79 42
Hostin d.o.o. 1 1 - -
INA Jadran d.o.o. - 22 - 67
Energopetrol d.d. - 4 - -
Adrigas S.r.l. Milano - - 2 3
INA d.o.o. Banja Luka - - 1 1
INA Kosovo d.o.o. - - - 1
Share in company as non-current financial assets
JANAF d.d. Zagreb 1 6 59 42
Governing company
MOL Nyrt. 1,334 581 714 944 Companies controlled by governing company
Tifon d.o.o. 379 607 9 9
MOL Petrochemicals Co. Ltd. 57 21 5 -
MOL Commodity Trading Kft. 43 19 13 134
MOL Slovenija d.o.o. 26 49 - -
MOL Serbia d.o.o. 5 78 - -
MOL Norge AS 1 2 - -
MOL Azerbaijan Ltd. - - 662 -
SLOVNAFT, a.s. - 34 118 219
MOL Austria - 17 - -
Geoinform Kft. - 1 - -
IES - Italiana Energia e Servizi S.p.A - - 7 7
FGSZ ZRT - - - 3

INA - INDUSTRIJA NAFTE, d.d.
Notes to the financial statements (continued)
For the year ended 31 December 2020
(all amounts are presented in HRK millions)
INA - Industrija nafte, d.d. 270
37. RELATED PARTY TRANSACTIONS (CONTINUED)
As of statement of financial position date, INA, d.d. had the following outstanding balances with related parties:
INA, d.d.
Amounts owed by related parties
Amounts owed to related
parties
31 December 2020
31 December 2019
31 December 2020
31 December 2019
Related companies
Holdina d.o.o. Sarajevo 115 203 - 1
INA Crna Gora d.o.o. Podgorica 33 52 - -
INA Beograd d.o.o. 8 - - -
INA Slovenija d.o.o. Ljubljana 7 11 - -
STSI, Integrirani tehnički servisi d.o.o. 5 9 104 199
CROSCO, naftni servisi d.o.o. 3 14 28 59
Plavi tim d.o.o. 3 3 22 16
INA MAZIVA d.o.o. 2 3 11 9
INA Maloprodajni servisi d.o.o. 1 3 43 38
Top Računovodstvo Servisi d.o.o. 1 2 1 -
INA Jadran d.o.o. - 2 - 14
INA Adria B.V. - 1 - 16
INA Vatrogasni Servisi d.o.o. - - 5 11
Adrigas S.r.l. Milano - - 1 -
Share in company as non-current financial assets
JANAF d.d. Zagreb - - 3 2
Governing company
MOL Nyrt. 30 198 64 43 Companies controlled by governing company
MOL Commodity Trading Kft. 75 48 80 49
Tifon d.o.o. 5 70 3 3
MOL Petrochemicals Co. Ltd. 2 - 2 -
MOL Norge AS 1 - - -
MOL Slovenija d.o.o. - 5 1 5
MOL Serbia d.o.o. - 1 - -
SLOVNAFT, a.s. - - 2 35
IES - Italiana Energia e Servizi S.p.A - - 1 1
Receivables of INA, d.d. are presented net of impairment of bad and doubtful receivables.
In 2020 and 2019 INA, d.d. has not recognised impairment on receivables from related parties.
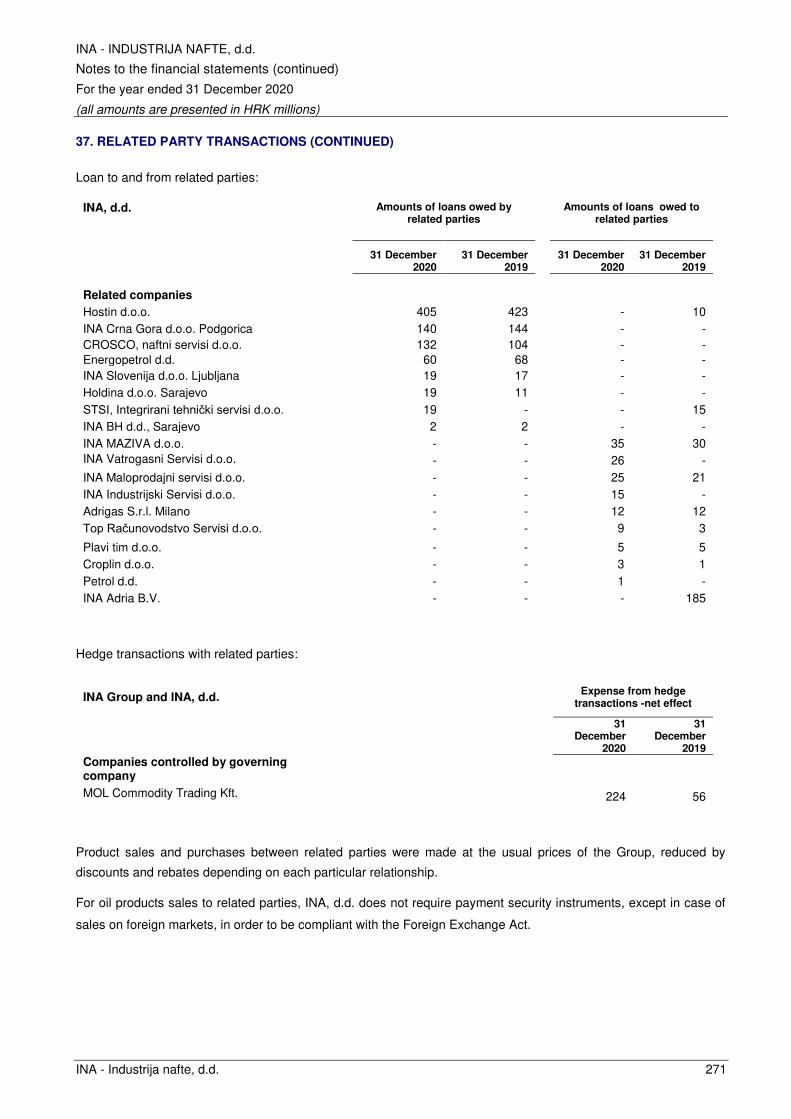
INA - INDUSTRIJA NAFTE, d.d.
Notes to the financial statements (continued)
For the year ended 31 December 2020
(all amounts are presented in HRK millions)
INA - Industrija nafte, d.d. 271
37. RELATED PARTY TRANSACTIONS (CONTINUED)
Loan to and from related parties:
INA, d.d.
Amounts of loans owed by related parties
Amounts of loans owed to
related parties
31 December 2020
31 December 2019
31 December 2020
31 December 2019
Related companies
Hostin d.o.o. 405 423 - 10
INA Crna Gora d.o.o. Podgorica 140 144 - -
CROSCO, naftni servisi d.o.o. 132 104 - -
Energopetrol d.d. 60 68 - -
INA Slovenija d.o.o. Ljubljana 19 17 - -
Holdina d.o.o. Sarajevo 19 11 - -
STSI, Integrirani tehnički servisi d.o.o. 19 - - 15
INA BH d.d., Sarajevo 2 2 - -
INA MAZIVA d.o.o. - - 35 30
INA Vatrogasni Servisi d.o.o. - - 26 -
INA Maloprodajni servisi d.o.o. - - 25 21
INA Industrijski Servisi d.o.o. - - 15 -
Adrigas S.r.l. Milano - - 12 12
Top Računovodstvo Servisi d.o.o. - - 9 3
Plavi tim d.o.o. - - 5 5
Croplin d.o.o. - - 3 1
Petrol d.d. - - 1 -
INA Adria B.V. - - - 185
Hedge transactions with related parties:
INA Group and INA, d.d.
Expense from hedge transactions -net effect
31 December
2020
31 December
2019
Companies controlled by governing company
MOL Commodity Trading Kft.
224 56
Product sales and purchases between related parties were made at the usual prices of the Group, reduced by
discounts and rebates depending on each particular relationship.
For oil products sales to related parties, INA, d.d. does not require payment security instruments, except in case of
sales on foreign markets, in order to be compliant with the Foreign Exchange Act.

INA - INDUSTRIJA NAFTE, d.d.
Notes to the financial statements (continued)
For the year ended 31 December 2020
(all amounts are presented in HRK millions)
INA - Industrija nafte, d.d. 272
37. RELATED PARTY TRANSACTIONS (CONTINUED)
Compensation of key management personnel
The remuneration of directors and other members of key management during the year were as follows:
INA, d.d.
31 December 2020 31 December 2019
Short-term employee benefits 30 41
Termination bonuses 1 3
Total 31 44
The amount included above refers to the remuneration of the Management Board Members and directors of second
and third level organizational units.
A number of key management in INA, d.d. or their related parties, hold positions in other companies of INA Group that
result in them having control or significant influence over these companies.
38. COMMITMENTS
The Company and the Group have a number of continuing operational and financial commitments in the normal course
of their businesses including:
⚫ exploration and development commitments arising under production sharing agreements;
⚫ exploratory drilling and well commitments abroad;
⚫ take or pay contract, gas transportation contract and gas selling contract;
⚫ guarantees, performance bonds and letters of credit with Croatian and foreign banks;
⚫ completion of the construction of certain assets.

INA - INDUSTRIJA NAFTE, d.d.
Notes to the financial statements (continued)
For the year ended 31 December 2020
(all amounts are presented in HRK millions)
INA - Industrija nafte, d.d. 273
38. COMMITMENTS (CONTINUED)
Gas Transportation contracts
At 31 December 2020 the future gas transportation contracted commitments with PPD Vukovar and Met Austria until
1 October 2021 amount to HRK 27 million.
At 31 December 2019 the future gas transportation contracted commitments with Met Croatia and PPD Vukovar, until
1 October 2020 amount to approximately HRK 40 million in total.
Gas purchase contract obligations (Take or pay)
INA, d.d concluded a Gas Purchase Obligation (Take or pay). The obligation refers to one-year natural gas import
contract signed for gas year. Through this contract INA, d.d. will procure the quantities of gas needed to cover the gap
in the sales. At 31 December 2020, the future contractual obligations for natural gas concluded with Met Austria until
1 October 2021 amount to HRK 73 milion. At 31 December 2019, the future contractual obligations for natural gas
concluded with Met Croatia until 1 October 2020 amount to HRK 176 million.
Lease contracts
The Group has various lease contracts that have not yet commenced as at 31 December 2020. The future lease
payments under non-cancellable lease contracts outside INA Group are as follows:
INA Group INA, d.d.
31 December
2020 31 December
2019
31 December 2020
31 December 2019
within 1 year 32 18 22 17
between 1 - 5 years 56 17 37 17
beyond 5 years - - - -
88 35 59 34
Out of the outstanding operating lease liabilities as of 31 December 2020 HRK 59 million were contracted by INA,
d.d., while for 31 December 2019 HRK 8 million were contracted by INA, d.d., HRK 2 million were contracted by Plavi
tim d.o.o.
Guarantees
The Group has guaranteed the performance under the respective contract. The total value of guarantees undertaken
to third parties is contractually HRK 2,560 million, which is the maximum amount the Group is exposed to. In the event
of default, the terms of the contract contain a maximum compensation payment to the unrelated party. Based on
expectations at the end of the reporting period, the Group considers that no liability is expected to arise. The
contractual maturity is based on the earliest date on which the Group may be required to pay.
INA - INDUSTRIJA NAFTE, d.d.
Notes to the financial statements (continued)
For the year ended 31 December 2020
(all amounts are presented in HRK millions)
INA - Industrija nafte, d.d. 274
39. CONTINGENT LIABILITIES
Environmental matters
The principal activities of the Company and the Group, comprising oil and gas exploration, production, transportation,
refining and distribution, can have inherent effects on the environment in terms of emissions into soil, water and air.
Both, the Company and the Group regularly record, monitor and report on environmental emissions in accordance
with their obligations specified in applicable laws.
Safeguarding the environment is one of the biggest imperatives of our time. Businesses across every size, geography
and sectors are rising up to the challenge and setting the pace through ambitious commitments and actions to reduce
their environmental footprint and integrate sustainability into their core operations. In a changing regulatory
environment, the impact on the business must be continuously assessed in order to identify the most cost effective
measures for complying with increasingly stringent legal requirements. By implementing such measures in production
and refining, we are reducing our impact on the environment. At the same time, we are improving reporting obligations,
implementation and enforcement of environmental regulation at every organizational level.
Environmental permit revision process for 4 INA’s facilities is still in progress. All requested documentation for revision
has been submitted to relevant regulatory authority, and main proposed change in refineries environmental permit is
implementation of integrated SOx and NOx emission management (bubble concept), complying with one emission
limit value for SOx and one for NOx instead of harmonizing each emission sources individually. Baseline reports for
refineries have also been prepared in phases as required by the competent authority.
European Union Emissions Trading System, EU ETS, is one of the fundamental mechanisms of the European Union
in the fight against climate change. Inside the System, a part of the emission allowances (one allowance = 1 tonne of
CO2) are allocated to installations for free and they are used to "cover" the emissions from the previous year. If the
installation has a shortage of allowances in respect to verified emissions, the rest must be bought on the market
through auctioning. To achieve the EU's overall greenhouse gas emissions reduction target for 2030, the sectors
covered by the EU ETS must reduce their emissions. All four INA's ETS installations conducted preparation for the
revised EU ETS Directive, which will apply for the period 2021 until 2030.
The Company and the Group continued to implement best available techniques, invest in renewable energy sources
(two smaller solar power plants have been installed) and energy efficiency projects. Also, with the decision to invest
in Rijeka Refinery Upgrade project (DCU complex), the refinery business will be more profitable and sustainable in
the long term.
Environmental provisions
Environmental obligations are the obligations of a company to recover pollutions caused by the company's operations.
They can be divided into two categories: environmental provisions and contingencies. Liabilities for environmental
costs are recognised when environmental assessments or clean-ups are probable and the amount recognised is the
best estimate of the expenditure required. In case of long-term liability, the present value of the estimated future
expenditure is recognised. Typical provision based actions are soil and groundwater pollution assessment,
remediation, monitoring actions in order to control the long-term compliance and re-cultivation of old waste storage
depots. Provision based environmental liabilities are audited in every quarter using internal resource, and in 2020
revision of provision based environmental liability calculation has been conducted.
INA - INDUSTRIJA NAFTE, d.d.
Notes to the financial statements (continued)
For the year ended 31 December 2020
(all amounts are presented in HRK millions)
INA - Industrija nafte, d.d. 275
39. CONTINGENT LIABILITIES (CONTINUED)
Environmental matters (continued)
Environmental provisions (continued)
At 31 December 2020, INA, d.d. made environmental provisions in the amount of HRK 323 million, whereas the
provisions at the Group level amounted to HRK 327 million, while at 31 December 2019, INA, d.d. made environmental
provisions in the amount of HRK 356 million, whereas the provisions at the Group level amounted to HRK 361 million.
At 31 December 2020, contingencies at INA, d.d. was estimated at HRK 340 million and for INA Group level was
estimated at HRK 542 million, while at 31 December 2019 contingencies at INA, d.d. was estimated at HRK 391
million and for INA Group level was estimated at HRK 599 million. The estimates were not recognised because the
timing of the event is uncertain and there is no evidence of pollution.
Litigation
The Group is exposed to various legal claims. The following claims are considered as contingencies and no provision
is recognised in the financial statements in their respect.
GWDF
In the dispute initiated by GWDF Partnership Gesellschaft Bürgerlicher Rechts and GWDF Limited, Cyprus against INA-Industrija nafte, d.d. and INA-Naftaplin International Exploration, Channel Islands, before the Commercial Court
in Zagreb, the plaintiffs claim compensation for damage in the amount of app HRK 60 million incurred due to
ungrounded termination of negotiations. On 10 March 2016 the judgment was rendered and the plaintiff’s claim was dismissed in its entirety. On 18 March 2016 the plaintiff filed an appeal against the judgment of the court of first
instance. In its judgment rendered on 7 November 2018, the High Commercial Court of the Republic of Croatia rejected
the plaintiff’s appeal and confirmed the judgement of the court of first instance. Therefore, the proceedings are concluded with a judgment that is final and binding. On 10 January 2019 the plaintiffs filed a petition with the Supreme
Court of the Republic of Croatia for extraordinary legal remedy (revision) against the final and binding judgment of the
High Commercial Court. On 23 September 2019 the Commercial Court in Zagreb delivered a copy of the
aforementioned plaintiff's revision to the defendants which, subsequently, filled their reply to the revision on 3rd
October 2019. There were no changes in 2020.
EKO MEDIA d.o.o.
In September 2012 INA, d.d. entered into an agreement with company EKO MEDIA d.o.o. EKO MEDIA failed to
regularly comply with its obligations. INA, d.d. terminated the agreement with EKO MEDIA d.o.o. at the beginning of
2014. On 19 December 2014 EKO MEDIA d.o.o. filed a lawsuit against INA, d.d. in which EKO MEDIA d.o.o. specified
its claim in the amount of HRK 106 million. INA, d.d. filed its official reply to such EKO MEDIA’s lawsuit and filed a counterclaim for the return of unjust enrichment and asked for the issuance of interim measure for prohibition of use
of advertising boards. The first instance procedure is in progress and the court expert for finances delivered his opinion
in which he determined the amount of the claim towards EKO MEDIA at the moment of termination of the agreement.
A financial expert conducted an evaluation in relation to the circumstance of lost profit. Since bankruptcy proceeding
has been initiated against the company EKO MEDIA d.o.o., INA has submitted a claim in the bankruptcy proceeding,
while the litigation had to be formally stopped and then continuated against EKO MEDIA d.o.o. – in bankruptcy.
INA - INDUSTRIJA NAFTE, d.d.
Notes to the financial statements (continued)
For the year ended 31 December 2020
(all amounts are presented in HRK millions)
INA - Industrija nafte, d.d. 276
39. CONTINGENT LIABILITIES (CONTINUED)
Litigation (continued)
LJUBLJANSKA BANKA
The claims of plaintiff Ljubljanska banka, Ljubljana, Slovenia against INA, d.d. in amount of HRK 60 million have arisen
from two contracts of 1982 on the use of short-term foreign currency loan abroad which were concluded between INA,
d.d. - Rafinerija nafte Rijeka and Ljubljanska banka - Osnovna banka Zagreb. The outcome of the procedure is still
uncertain due to the complexity of the legal matter (claims for altered default interest). The Supreme Court has
rendered a decision which was not yet delivered to INA, d.d.
Belvedere cases (CLEOSTONE claim included)
In 2005 INA, d.d. and Belvedere d.d. concluded the Loan agreement on notarial insurance of the claim by establishing
lien over the real estate of Belvedere d.d. for the purpose of ensuring loan repayment. Since the loan was not repaid,
INA, d.d. initiated the procedure of real estate sale, and the real estate was sold to company Vila Larus d.o.o., whereby
INA, d.d. collected HRK 24 million on behalf of principle amount and contractual interest rate.
The plaintiff initiated the proceeding to proclaim the real estate sale and purchase agreement as null and void, as well
as the proceeding to cancel the enforceability clause on the Fiduciary Agreement. The first instance proceeding for
the annulment of the agreement on the sale and purchase of real estate has been finalized in favour of INA, d.d. and
upon an appeal filed by the plaintiff, the first instance decision became legally binding after the High Commercial Court
of the Republic of Croatia rejected the appeal and confirmed the judgment. The Supreme Court of the Republic of
Croatia has also rejected the plaintiff`s review.
Belvedere – HRK 24 million, 018-11/17
The plaintiff has filed a claim with the Commercial Court in Zagreb, seeking reimbursement of funds received for the
sale of “Hotel Belvedere”, claiming that the sale of the real estate, encumbered by INA’s liens – fiduciary, is illegal.
The plaintiff alleges that INA, d.d. had no right to collect its claims by selling the real estate, because the plaintiff was
in crisis at the moment of loan placement, so the loan was actually a loan substituting the capital which is settled in a
bankruptcy proceeding as a lower payment priority claim. It is also stated that the notary public violated other legal
regulations. The response to the claim has been submitted, in which the plaintiff’s allegations have been contested, i.e. that the loan was not actually a loan substituting the capital. A preparatory hearing was held, as well as hearings
at which witnesses were heard. The first instance court reached a judgment in favour of the plaintiff, against which an
appeal was lodged. Based on INA`s appeal, the appellate court reversed the judgement and rejected the plaintff`s
request. The Plaintiff filed a request for granting a second instance appeal.
Belvedere – HRK 220 million, 018-14/17
The plaintiff has filed a claim with the Commercial Court in Zagreb, seeking reimbursement of damages, claiming that
INA, d.d. has caused damage to the plaintiff by selling its real estate encumbered by INA’s liens – fiduciary, whereby
the plaintiff was prevented from continuing its business operations. The plaintiff claims that the damage is evident
from the fact that the loan was actually a loan substituting the capital which is settled in a bankruptcy proceeding as
a lower payment priority claim. INA, d.d. submitted its response to the lawsuit in which it contested all the plaintiff’s allegations, both in relation to the grounds and the amount and stated that the collection of the concerned claims was
in any case insured by a separate satisfaction right, granting the creditor in bankruptcy the right to a separate
settlement. The court granted a stay at the first hearing untill the proceeding 018-11/17 is finished.
INA - INDUSTRIJA NAFTE, d.d.
Notes to the financial statements (continued)
For the year ended 31 December 2020
(all amounts are presented in HRK millions)
INA - Industrija nafte, d.d. 277
39. CONTINGENT LIABILITIES (CONTINUED)
Litigation (continued)
Labour procedure against Energopetrol d.d.
At Municipal Court in Sarajevo, 449 plaintiffs filed labour lawsuits against Energopetrol for which, depending on the
prospect of success as well as the legal basis of the claim, Energopetrol reserved amounts of 10% and 30%
respectively of the value of the dispute.
The total principal amount of these disputes amounts to HRK 68 million. The lawsuits were filed in period 2018 till
2019, and the plaintiffs are seeking payment of salary differences in line with the Branch Collective Agreement and
payment based on discrimination for the workers who did not file lawsuits for the period 2015 till 2018.
The Company expects that the plaintiff's attorney will specify all the claims in the course of the procedure, in
accordance with the findings of the financial expert. During 2020, preparatory hearings were held and the procedure
was adjourned until final decision is reached in the case which represents the base for the payment of the salary
differences (for 3 cases), and for other cases (5 merged cases into 1). The preliminatory hearing was not held due to
the illness of the judge, therefore a new hearing has to be appointed.
MOL Plc. and INA vs Federation of the Bosnia and Herzegovina (FBIH)
MOL Plc. and INA initiated arbitration against FBIH in year 2012, in front of ICC Zurich. Case was in abeyance till
November 2019.
INA/MOL claim:
In the Energopetrol (EP) Recapitalization Agreement, signed September 2006, FBIH gave representations and
warranties to the Consortium in respect of EP’s compliance with legal regulations relating to labour and employment matters, that there was no risk of legal proceedings to be brought against EP. Following the closing of the transaction,
a significant number of then former and existing employees started lawsuits against EP.
FBIH counterclaim:
According to the EP Recapitalization Agreement (RA), INA and MOL Plc. obligation was to provide for the investments
in the EP. According to the text of RA, investment means to ensure necessary funds, including, without limitation, the
loans, to the EP, with a purpose to renew and expand the existing network of PS, as foreseen in the Investment plan
which was enclosed to the RA. Deloitte, who was engaged by the parties to the RA to confirm performance of the
agreed RA provisions, confirmed the Consortium has performed its investment obligations.
Hearing is likely to be set during the second half of 2021.
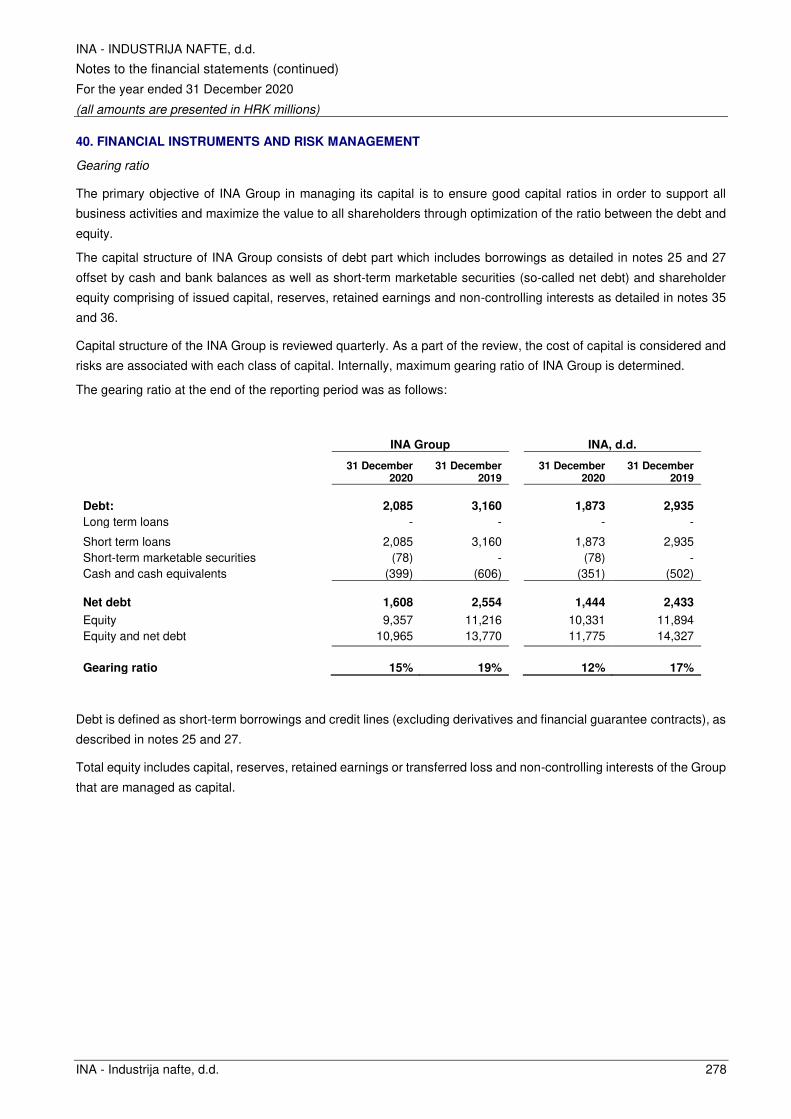
INA - INDUSTRIJA NAFTE, d.d.
Notes to the financial statements (continued)
For the year ended 31 December 2020
(all amounts are presented in HRK millions)
INA - Industrija nafte, d.d. 278
40. FINANCIAL INSTRUMENTS AND RISK MANAGEMENT
Gearing ratio
The primary objective of INA Group in managing its capital is to ensure good capital ratios in order to support all
business activities and maximize the value to all shareholders through optimization of the ratio between the debt and
equity.
The capital structure of INA Group consists of debt part which includes borrowings as detailed in notes 25 and 27
offset by cash and bank balances as well as short-term marketable securities (so-called net debt) and shareholder
equity comprising of issued capital, reserves, retained earnings and non-controlling interests as detailed in notes 35
and 36.
Capital structure of the INA Group is reviewed quarterly. As a part of the review, the cost of capital is considered and
risks are associated with each class of capital. Internally, maximum gearing ratio of INA Group is determined.
The gearing ratio at the end of the reporting period was as follows:
INA Group INA, d.d.
31 December 2020
31 December 2019
31 December 2020
31 December 2019
Debt: 2,085 3,160 1,873 2,935
Long term loans - - - -
Short term loans 2,085 3,160 1,873 2,935
Short-term marketable securities (78) - (78) -
Cash and cash equivalents (399) (606) (351) (502)
Net debt 1,608 2,554 1,444 2,433
Equity 9,357 11,216 10,331 11,894
Equity and net debt 10,965 13,770 11,775 14,327
Gearing ratio 15% 19% 12% 17%
Debt is defined as short-term borrowings and credit lines (excluding derivatives and financial guarantee contracts), as
described in notes 25 and 27.
Total equity includes capital, reserves, retained earnings or transferred loss and non-controlling interests of the Group
that are managed as capital.

INA - INDUSTRIJA NAFTE, d.d.
Notes to the financial statements (continued)
For the year ended 31 December 2020
(all amounts are presented in HRK millions)
INA - Industrija nafte, d.d. 279
40. FINANCIAL INSTRUMENTS AND RISK MANAGEMENT (CONTINUED)
Categories of financial instruments
Carrying amount
INA Group INA, d.d.
31 December 2020
31 December 2019
31 December 2020
31 December 2019
Financial assets
Cash and cash equivalents 399 606 351 502
Loans and receivables 2,490 3,272 4,927 6,019
Non-current financial assets 560 607 560 607
Positive fair value of derivatives 26 27 26 27 Financial assets designated as at fair value through profit and loss 9 9 7 7
Financial liabilities
Loans and borrowings 2,085 3,160 1,873 2,935
Lease liabilities 309 344 478 531
Trade payables 1,426 1,511 1,450 1,734
Negative fair value of derivatives 116 62 116 62
Financial risk management objectives
INA Group continuously monitors and manages financial risks. In accordance with internal procedures INA, d.d. and
its consolidated subsidiaries manage and maintain commodity, foreign exchange and interest rate risk at an
acceptable level, allowing to achieve its strategic objectives while protecting the future financial stability and flexibility
of INA Group. INA, d.d. integrates financial risks in the financial risk model using Monte Carlo simulation and scenario
analyses, which can include changes in a single quotation, but also significant changes in external environment as
well, as was the case in 2020. Analysis of financial risks allows quantification of their effects on INA Group's overall
business activities and selection of appropriate measures in order to minimize negative effects. Senior management
regularly reviews the financial risk reports.
By taking this general approach, INA, d.d. assumes the business activities as a well-balanced integrated portfolio and
does not hedge individual elements of its exposure to financial risks in a normal course of business. Therefore, INA,
d.d. actively manages its financial risk exposure for the following purposes:
⚫ corporate level – maintaining financial ratios, covering exposure to significant monetary transactions, etc.;
⚫ business operations level – decreasing the exposure to market prices fluctuation in case of deviations from the
normal course of business (e.g. planned regular shutdown of refinery units for the purpose of overhaul).
INA, d.d. Treasury carries out finance activities of INA, d.d., coordinates finance operations of INA Group on domestic
and international financial markets, monitors and manages the financial risks related to the operations of INA Group.
The most significant risks, together with methods used for management of these risks are described below.
INA Group used derivative financial instruments to a very limited extent in order to manage financial risks. Derivative
financial instruments are regulated by signing an ISDA (International Swaps and Derivatives Association) Agreement
with counterparties. INA Group does not use derivative financial instruments for speculative purposes.
INA - INDUSTRIJA NAFTE, d.d.
Notes to the financial statements (continued)
For the year ended 31 December 2020
(all amounts are presented in HRK millions)
INA - Industrija nafte, d.d. 280
40. FINANCIAL INSTRUMENTS AND RISK MANAGEMENT (CONTINUED)
Market risk
Commodity price risk management
The volatility of crude oil and gas prices is the prevailing element in the business environment of INA Group. INA
Group buys crude oil mostly through short-term arrangements in USD at the current spot market price. Necessary
natural gas quantities in 2020 INA Group imported in EUR based on spot price.
In addition to exploration and production, and refinery operations, one of the main core activities of INA, d.d. are
marketing and sale of refinery products and natural gas. Prices of crude products were determined weekly based on
market principles, which enables quicker responses to market prices fluctuations.
In accordance with internal procedures, for the purpose of hedging financial risk exposure on corporate and business
operations level, INA, d.d. may use forward, swap and option instruments. In 2020, INA, d.d. entered into short-term
forward swap transactions to hedge its exposure on changes in inventory levels, changes in pricing periods and crack
spreads. The transactions were initiated to reduce exposures to potential fluctuations in prices over the period of
decreasing inventories at the refineries, as well as to match the pricing period of purchased crude oil and crude
products with the crude oil processing and refinery product retail pricing periods.
At 31 December 2020 and 31 December 2019, there is no fair value based on hedged transaction related to the price
of the goods.
Foreign currency risk management
As INA Group operates both in Croatia and abroad, many of its transactions are denominated and executed in foreign
currencies, hence INA, d.d. is exposed to exchange rate risks.
INA Group has a net long USD and EUR, and a net short HRK operating cash flow position. Generally, INA Group
manages its currency risk using natural hedging, which is based on the principle that the combination of currencies in
the debt portfolio should reflect the currency position of INA Group's free cash flow. Furthermore, in order to avoid
excessive exposures to fluctuations in the foreign exchange rate with respect to a single currency (i.e. USD), INA, d.d.
applies a portfolio-based approach while selecting the currency mix for its debt portfolio.
INA, d.d. may use a cross-currency swap to adjust its currency mix in the debt portfolio. At 31 December 2020 and 31
December 2019 there were no outstanding cross-currency transactions.
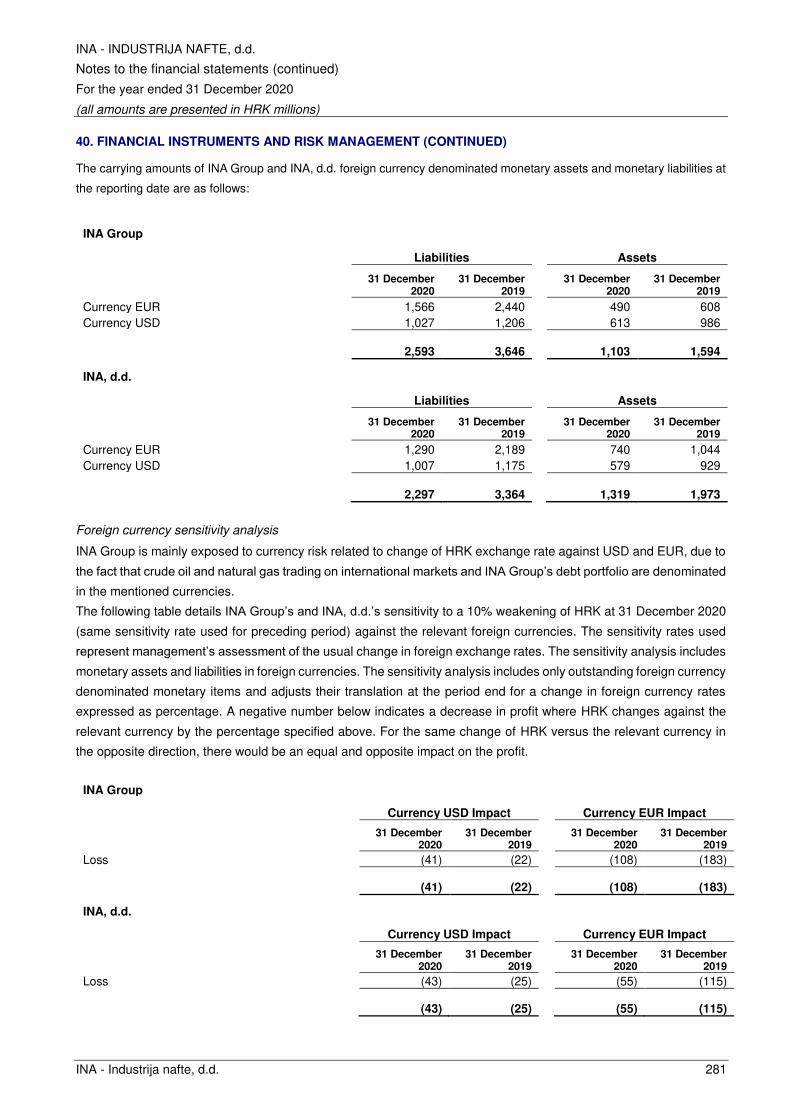
INA - INDUSTRIJA NAFTE, d.d.
Notes to the financial statements (continued)
For the year ended 31 December 2020
(all amounts are presented in HRK millions)
INA - Industrija nafte, d.d. 281
40. FINANCIAL INSTRUMENTS AND RISK MANAGEMENT (CONTINUED)
The carrying amounts of INA Group and INA, d.d. foreign currency denominated monetary assets and monetary liabilities at
the reporting date are as follows:
INA Group
Liabilities Assets
31 December 2020
31 December 2019
31 December 2020
31 December 2019
Currency EUR 1,566 2,440 490 608
Currency USD 1,027 1,206 613 986
2,593 3,646 1,103 1,594
INA, d.d.
Liabilities Assets
31 December
2020 31 December
2019
31 December 2020
31 December 2019
Currency EUR 1,290 2,189 740 1,044
Currency USD 1,007 1,175 579 929
2,297 3,364 1,319 1,973
Foreign currency sensitivity analysis
INA Group is mainly exposed to currency risk related to change of HRK exchange rate against USD and EUR, due to
the fact that crude oil and natural gas trading on international markets and INA Group’s debt portfolio are denominated
in the mentioned currencies.
The following table details INA Group’s and INA, d.d.’s sensitivity to a 10% weakening of HRK at 31 December 2020
(same sensitivity rate used for preceding period) against the relevant foreign currencies. The sensitivity rates used
represent management’s assessment of the usual change in foreign exchange rates. The sensitivity analysis includes
monetary assets and liabilities in foreign currencies. The sensitivity analysis includes only outstanding foreign currency
denominated monetary items and adjusts their translation at the period end for a change in foreign currency rates
expressed as percentage. A negative number below indicates a decrease in profit where HRK changes against the
relevant currency by the percentage specified above. For the same change of HRK versus the relevant currency in
the opposite direction, there would be an equal and opposite impact on the profit.
INA Group
Currency USD Impact Currency EUR Impact
31 December
2020 31 December
2019
31 December 2020
31 December 2019
Loss (41) (22) (108) (183)
(41) (22) (108) (183)
INA, d.d.
Currency USD Impact Currency EUR Impact
31 December 2020
31 December 2019
31 December 2020
31 December 2019
Loss (43) (25) (55) (115)
(43) (25) (55) (115)

INA - INDUSTRIJA NAFTE, d.d.
Notes to the financial statements (continued)
For the year ended 31 December 2020
(all amounts are presented in HRK millions)
INA - Industrija nafte, d.d. 282
40. FINANCIAL INSTRUMENTS AND RISK MANAGEMENT (CONTINUED)
Foreign currency sensitivity analysis (continued)
The exposure on the 10% fluctuation in the exchange rates for the currencies presented above is mostly attributable
to the outstanding liabilities towards suppliers and borrowings denominated in USD and EUR.
Interest rate risk management
INA Group is exposed to interest rate risk, since entities in INA Group generally borrow funds at floating interest rates.
INA Group does not speculate on fluctuations in interest rates, and therefore primarily chooses floating interest rates.
However, in certain instruments and certain macro environment, there is a possibility of selecting the fixed interest
rate and utilization of longer interest periods.
INA, d.d. in accordance with internal procedures can use interest rate swap transactions in order to manage the
relative level of exposure to interest rate risk on cash flows related to borrowings with floating interest rates. As of 31
December 2020 there were no outstanding interest rate swap transactions.
Interest rate risk analysis
The sensitivity analysis below has been determined based on the exposure to interest rates at the statement of
financial position date. For floating rate liabilities, the analysis is prepared assuming the amount of liability outstanding
at the balance sheet date was outstanding for the whole year. A 50 or 200 basis point increase or decrease is used
when reporting interest rate risk internally, and represents management’s assessment of the reasonably possible change in interest rates.
If the interest rates would be 200 basis points higher/lower and all other variables were held constant, the changes in
interest expense of INA Group and INA, d.d. would be as presented below.
INA Group INA, d.d.
31 December 2020
31 December 2019
31 December 2020
31 December 2019
Short-term interest expense change 42 57 37 52
Long-term interest expense change - 7 - 7
Total change: 42 64 37 59
If interest rates would be 200 basis points higher, INA Group’s interest expenses in 2020 would increase by HRK 42
million, while with a change of 50 basis points the increase would be HRK 10 million (in 2019: increase by HRK 64
million had the interest rated been 200 basis points higher, and by HRK 16 million had the interest rates been 50 basis
points higher).
At the same time INA, d.d.’s interest expenses in 2020 would increase by HRK 37 million if interest rates had been
200 basis points higher, while the increase would be HRK 9 million with a change of 50 basis points (2019: increase
by HRK 59 million had the interest rates been 200 basis points higher, and by HRK 15 million had the interest rates
been 50 basis points higher). Equivalent decrease of interest rates would result in decreased interest expenses by
equal amounts.
INA - INDUSTRIJA NAFTE, d.d.
Notes to the financial statements (continued)
For the year ended 31 December 2020
(all amounts are presented in HRK millions)
INA - Industrija nafte, d.d. 283
40. FINANCIAL INSTRUMENTS AND RISK MANAGEMENT (CONTINUED)
Other price risks
INA Group is exposed to equity price risks arising from equity investments. Equity investments are held for strategic
rather than trading purposes.
Equity price sensitivity analysis
The sensitivity analyses below have been determined based on the exposure to equity price risks at the reporting
date.
If equity prices had been 10% higher:
⚫ net profit for the year ended at 31 December 2020 would have been unaffected as the equity investments are
classified as non-current financial assets; and
⚫ other equity reserves of INA, d.d. would increase by HRK 51 million as a result of the changes in fair value of
non-current financial assets.
If equity prices had been 10% lower, there would be an equal and opposite impact on equity.
Credit risk management
Sales of products and services with deferred payment gives rise to credit risk, risk of default or non-performance of
contractual obligations by INA Group customers. Overdue receivables have an adverse effect on the liquidity of INA
Group, whereas impaired overdue receivables have a negative impact on the financial results of INA Group as well.
Under currently valid internal procedures, measures are taken as a precaution against the risk of default. Customers
are classified into risk groups by reference to their financial indicators and the trading records with INA Group, and
appropriate measures to provide protection against credit risk are taken for each group. The information used to
classify the customers into risk groups is derived from the official financial statements and is obtained from
independent rating agencies. The exposure and the credit ratings of customers are continuously monitored and credit
exposure is controlled by credit limits that are reviewed at least on an annual basis. In 2020, credit risk management
was under additional scrutiny, taking into account potential decrease of market liquidity caused by COVID-19
pandemic. Whenever possible, INA Group collects collaterals (payment security instruments) from customers in order
to minimize risk of collection of payments arising from contractual liabilities of customers.
The exposure of INA Group and the credit ratings of its customers are continuously monitored to mitigate the risk of
default (see note 21).
INA Group transacts with a large number of customers from various industries and of various size. A portion of goods
sold with deferred payment includes government institutions and customers owned by the state and local self-
governments that do not provide any payment security instruments. Regarding other customers, provided collaterals
are mainly debentures, being the most frequently used payment security instrument on the Croatian market, and bank
guarantees and insurance of receivables is used as well, whereas from foreign customers are mostly obtained letters
of credit, and to a lesser extent bank and corporate guarantees and exceptionally bills of exchange.
There is no significant credit risk exposure of INA Group that is not covered with collateral, other than those to the
above-mentioned institutions and entities controlled by the state, local self-government, and those arising from certain
foreign concession agreements.
INA - INDUSTRIJA NAFTE, d.d.
Notes to the financial statements (continued)
For the year ended 31 December 2020
(all amounts are presented in HRK millions)
INA - Industrija nafte, d.d. 284
40. FINANCIAL INSTRUMENTS AND RISK MANAGEMENT (CONTINUED)
Liquidity risk management
Responsibility for liquidity risk management rests with the Management Board, which has built an appropriate liquidity
risk management framework for the management of INA Group’s short and long-term funding and liquidity
management requirements. INA Group manages liquidity risk by maintaining and utilizing adequate reserves and
credit facilities with monitoring of due dates of receivables and liabilities. On operative level within INA Group, liquidtiy
optimization is additionally achieved throug cash pooling.
The policy of INA Group is to ensure sufficient external funding sources in order to achieve the sufficient level of
available frame credit lines ensuring the liquidity of INA Group as well as investment needs.
As of 31 December 2020, INA Group had contracted and available short-term credit lines amounting to HRK 2,570
million (CNB middle rate), excluding overdrafts and trade financing credit lines established with the purpose to finance
the purchase of crude oil and oil products.
As of 31 December 2020, INA Group has contracted and available long-term credit lines amounting to HRK 2,179
million (CNB middle rate).
Based on business needs and industry practice, INA, d.d. has contracted short-term credit facilities (’trade finance’’) with first class banking groups for financing crude oil and oil products purchase. As of 31 December 2020, INA Group
had contracted and available short-term credit facilities for financing crude oil and oil products purchase amounting to
USD 7,980 million (CNB middle rate).
For details of the main external sources of funding for INA Group, see note 25 and 27.
With the purpose of diversification of funding sources and in order to ensure sufficient liquidity and financial stability
level, INA, d.d. is continuously considering different funding opportunities with other creditors as well.

INA - INDUSTRIJA NAFTE, d.d.
Notes to the financial statements (continued)
For the year ended 31 December 2020
(all amounts are presented in HRK millions)
INA - Industrija nafte, d.d. 285
40. FINANCIAL INSTRUMENTS AND RISK MANAGEMENT (CONTINUED)
Liquidity risk management (continued)
Liquidity and interest risk tables
The following tables detail the remaining contractual maturity for financial liabilities of INA Group and INA, d.d. and at
the period end. Analyses have been drawn up based on the undiscounted cash flows based on the earliest date on
which the payment can be required. The tables include both principal and interest cash flows.
INA Group
Less than 1 month
1 - 12 months 1 - 5 years 5+ years Total
31 December 2020
Non-interest bearing 2,126 427 28 1 2,582
Interest bearing 1,034 1,129 178 53 2,394
3,160 1,556 206 54 4,976
31 December 2019
Non-interest bearing 1,634 505 34 2 2,175
Interest bearing 2,029 1,203 224 51 3,507
3,663 1,708 258 53 5,682
INA, d.d.
Less than 1 month
1 - 12 months 1 - 5 years 5+ years Total
31 December 2020
Non-interest bearing 1,958 420 27 1 2,406
Interest bearing 1,036 1,067 272 107 2,482
2,994 1,487 299 108 4,888
31 December 2019
Non-interest bearing 1,404 441 32 1 1,878
Interest bearing 2,029 1,281 308 133 3,751
3,433 1,722 340 134 5,629
Non-interest bearing liabilities of INA, d.d. due in a period of less than one month consist mainly of trade accounts
payable in the amount of HRK 1,105 million in 2020 (2019: HRK 1,089 million).
Included in non-interest bearing liabilities of INA, d.d. due in a period of over five years are, liabilities to Government
for sold flats and deferred income for sold flats.
Interest bearing liabilities include short-term borrowings, long-term borrowings and leases.
INA - INDUSTRIJA NAFTE, d.d.
Notes to the financial statements (continued)
For the year ended 31 December 2020
(all amounts are presented in HRK millions)
INA - Industrija nafte, d.d. 286
40. FINANCIAL INSTRUMENTS AND RISK MANAGEMENT (CONTINUED)
Fair value of financial instruments
Valuation techniques and assumptions applied for the purposes of measuring fair value
The fair values of financial assets and financial liabilities are determined as follows:
• the fair value of financial assets and financial liabilities with standard terms and conditions and traded on active
liquid markets is determined with reference to quoted market prices;
• the fair value of other financial assets and financial liabilities is determined in accordance with generally accepted
pricing models based on discounted cash flow analysis using prices from observable current market transactions
and dealer quotes for similar instruments;
• the fair values of derivative instruments are calculated using quoted prices. Where such prices are not available,
a discounted cash flow analysis is performed using the applicable yield curve for the duration of the instruments
for non-optional derivatives, and option pricing models for optional derivatives. Foreign currency forward
contracts are measured using quoted forward exchange rates and yield curves derived from quoted interest rates
matching maturities of the contracts. Interest rate swaps are measured at the present value of future cash flows
estimated and discounted based on the applicable yield curves derived from quoted interest rates.
The following table provides an analysis of financial instruments that are measured subsequent to initial recognition
at fair value, grouped into Levels 1 to 3 based on the degree to which the fair value is observable:
• Level 1 fair value measurements are those derived from quoted prices (unadjusted) in active markets for identical
assets or liabilities;
• Level 2 fair value measurements are those derived from inputs other than quoted prices included within Level 1
that are observable for the asset or liability, either directly (i.e. as prices) or indirectly (i.e. derived from prices); and
• Level 3 fair value measurements are those derived from valuation techniques that include inputs for the asset or
liability that are not based on observable market data (unobservable inputs).
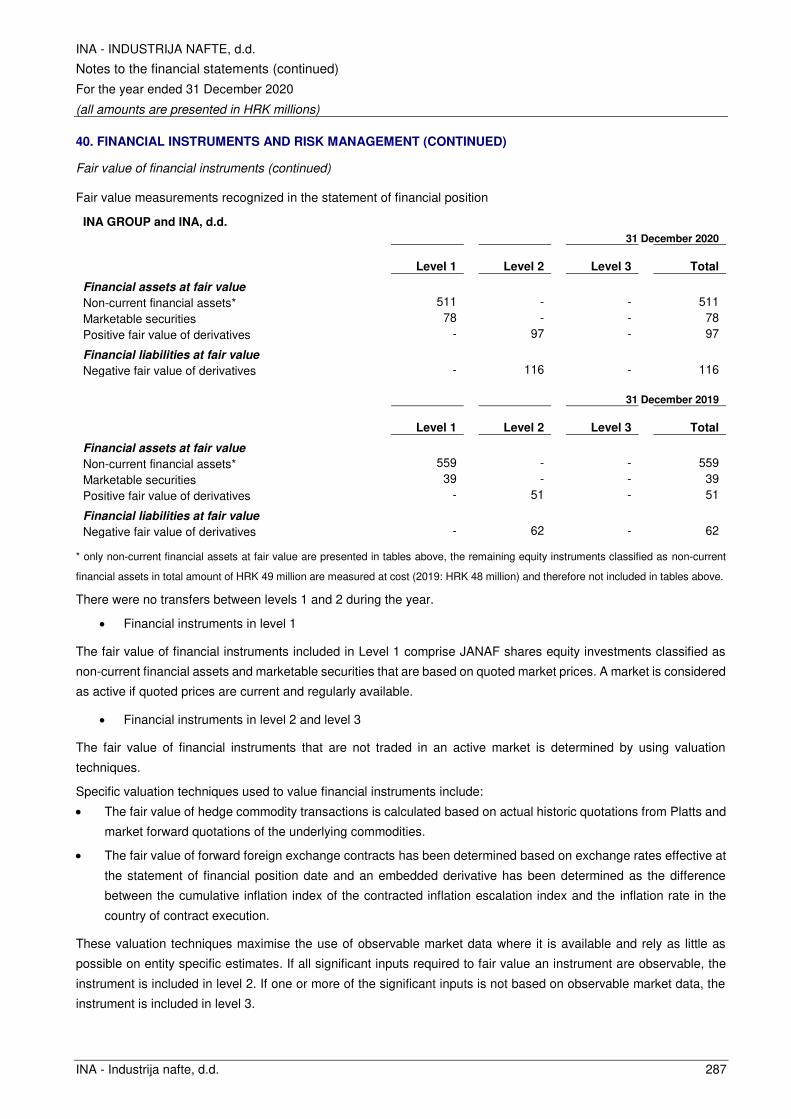
INA - INDUSTRIJA NAFTE, d.d.
Notes to the financial statements (continued)
For the year ended 31 December 2020
(all amounts are presented in HRK millions)
INA - Industrija nafte, d.d. 287
40. FINANCIAL INSTRUMENTS AND RISK MANAGEMENT (CONTINUED)
Fair value of financial instruments (continued)
Fair value measurements recognized in the statement of financial position
INA GROUP and INA, d.d.
31 December 2020
Level 1 Level 2 Level 3 Total
Financial assets at fair value
Non-current financial assets* 511 - - 511
Marketable securities 78 - - 78
Positive fair value of derivatives - 97 - 97
Financial liabilities at fair value
Negative fair value of derivatives - 116 - 116
31 December 2019
Level 1 Level 2 Level 3 Total
Financial assets at fair value
Non-current financial assets* 559 - - 559
Marketable securities 39 - - 39
Positive fair value of derivatives - 51 - 51
Financial liabilities at fair value
Negative fair value of derivatives - 62 - 62
* only non-current financial assets at fair value are presented in tables above, the remaining equity instruments classified as non-current
financial assets in total amount of HRK 49 million are measured at cost (2019: HRK 48 million) and therefore not included in tables above.
There were no transfers between levels 1 and 2 during the year.
• Financial instruments in level 1
The fair value of financial instruments included in Level 1 comprise JANAF shares equity investments classified as
non-current financial assets and marketable securities that are based on quoted market prices. A market is considered
as active if quoted prices are current and regularly available.
• Financial instruments in level 2 and level 3
The fair value of financial instruments that are not traded in an active market is determined by using valuation
techniques.
Specific valuation techniques used to value financial instruments include:
• The fair value of hedge commodity transactions is calculated based on actual historic quotations from Platts and
market forward quotations of the underlying commodities.
• The fair value of forward foreign exchange contracts has been determined based on exchange rates effective at
the statement of financial position date and an embedded derivative has been determined as the difference
between the cumulative inflation index of the contracted inflation escalation index and the inflation rate in the
country of contract execution.
These valuation techniques maximise the use of observable market data where it is available and rely as little as
possible on entity specific estimates. If all significant inputs required to fair value an instrument are observable, the
instrument is included in level 2. If one or more of the significant inputs is not based on observable market data, the
instrument is included in level 3.
INA - INDUSTRIJA NAFTE, d.d.
Notes to the financial statements (continued)
For the year ended 31 December 2020
(all amounts are presented in HRK millions)
INA - Industrija nafte, d.d. 288
41. SUBSEQUENT EVENTS
Subsequent events and other considerations related to COVID-19
The COVID-19 pandemic and the economic crisis that came as a result created unprecedented challenges and reset
priorities for everyone, including INA, d.d. and INA Group. The virus exposed INA, d.d., its employees, customers and
partners to significant health and safety risks, it created unseen operational challenges during the lockdown and tested
INA’s financial flexibility and strength. The oil and gas industry were particularly hit hard as a combination of demand
and supply-side shocks occurring at the same time. COVID-19 pandemic affected significant judgements and
estimation uncertainties during the period and these uncertainties have been taken into account in certain areas, for
instance impairment testing, credit risk and deferred tax recoverability. Growth prospects over the next few months
will depend on how COVID-19 situation evolves and how quickly COVID-19 vaccine can be deployed, but also on the
implementation and the effectiveness of fiscal and monetary policy support.
Dividend payment finalized
On 14 January 2021 INA, d.d. has finalised dividend payout in the amount of HRK 62.27 per share in accordance with
General Assembly from 26 August 2020. Dividend has been paid out to the two largest shareholders, who agreed to
receive their respective parts of the dividend on a later date.
Apponitment of new members of INA Management Board
At the INA Supervisory Board meeting held on 29 January 2021, new members of the company's Management Board
were appointed: Ferenc Horváth and József Simola, while Ákos Székely and Zsolt Pethő ceased their Management Board membership. New members are appointed starting from 1 February 2021 until 31 March 2024. The terms of
office of the President of INA Management Board Sándor Fasimon has also been extended until 31 March 2024.
289
A member firm of Ernst & Young Global Limited Mjerodavan sud: Trgovački sud u Zagrebu; Temeljni kapital: 20.000,00 kuna, uplaćen u cijelosti; Članovi Uprave: Berislav Horvat, Ivana Krajinović, Zvonimir Madunić Applicable court: Commercial court in Zagreb; Registered share capital is 20.000,00 HRK, fully paid;
Members of the Board: Berislav Horvat, Ivana Krajinović, Zvonimir Madunić
290
Ernst & Young d.o.o. Radnička cesta 50, 10 000 Zagreb Hrvatska / Croatia MBS: 080435407 OIB: 58960122779 PDV br. / VAT no.: HR58960122779
Tel: +385 1 5800 800 Fax: +385 1 5800 888 www.ey.com/hr
Banka / Bank: Erste & Steiermärkische Bank d.d. Jadranski trg 3A, 51000 Rijeka Hrvatska / Croatia IBAN: HR3324020061100280716 SWIFT: ESBCHR22
To the Shareholders of INA-Industrija nafte, d.d.:
I. Report on the audit of the separate and consolidated financial statements
We have audited the separate financial statements of INA – Industrija nafte, d.d. (“the Company”), and consolidated financial statements of INA – Industrija nafte, d.d. and it’s subsidiaries (together “the Group”) as at 31 December 2020
which have been issued on 17 March 2021. We issued the following audit report dated 17 March 2021 on the
consolidated and separate financial statements (presented in the Annual report on pages 164 to 289):
INDEPENDENT AUDITOR’S REPORT
To the Shareholders of INA – Industrija Nafte, d.d.
Report on the audit of the separate and consolidated financial statements
Opinion
We have audited the separate financial statements of INA – Industrija Nafte, d.d. (the Company), and
consolidated financial statements of INA – Industrija Nafte, d.d. and its subsidiaries (together -the Group),
which comprise the separate and consolidated statement of financial position as at 31 December 2020, the
separate and consolidated statement of profit or loss and the separate and consolidated statement of other
comprehensive income, the separate and consolidated statement of changes in equity and the separate and
consolidated statement of cash flows for the year then ended, and notes to the separate and consolidated
financial statements, including a summary of significant accounting policies.
In our opinion, the accompanying separate and consolidated financial statements give a true and fair view of
the separate and consolidated financial position of the Company and Group as at 31 December 2020 and of
its separate and consolidated financial performance and its separate and consolidated cash flows for the year
then ended in accordance with International Financial Reporting Standards as adopted by the EU (IFRS as
adopted by the EU).
Basis for opinion
We conducted our audit in accordance with International Standards on Auditing (ISAs). Our responsibilities
under those standards are further described in the Auditor’s responsibilities for the audit of the separate and consolidated financial statements section of our report.
We are independent of the Company and the Group in accordance with the International Ethics Standards
Board of Accountants’ (IESBA) International Code of Ethics for Professional Accountants, including International Independence Standards (IESBA Code), and we have fulfilled our other ethical responsibilities
in accordance with these requirements and the IESBA Code.
We believe that the audit evidence we have obtained is sufficient and appropriate to provide a basis for our
opinion.
Key audit matters
Key audit matters are those matters that, in our professional judgment, were of most significance in our audit
of the separate and consolidated financial statements of the current period. These matters were addressed
in the context of our audit of the separate and consolidated financial statements as a whole, and in forming
our opinion thereon, and we do not provide a separate opinion on these matters. For each matter below, our
description of how our audit addressed the matter is provided in that context.
We have fulfilled the responsibilities described in the Auditor’s responsibilities for the audit of the separate and consolidated financial statements section of our report, including in relation to these matters.
Accordingly, our audit included the performance of procedures designed to respond to our assessment of the
risks of material misstatement of the separate and consolidated financial statements. The results of our audit
procedures, including the procedures performed to address the matters below, provide the basis for our audit
opinion on the accompanying separate and consolidated financial statements.

291
Key Audit Matter How we addressed Key Audit Matter
Estimation of hydrocarbon reserves
A description of the key judgements and estimates regarding
estimation of hydrocarbon reserves are included in Note 3
Significant accounting judgements and estimates in the
separate and consolidated financial statements.
The estimation of hydrocarbon reserves is a significant area of
judgement due to the technical uncertainty in assessing
quantities and complex contractual arrangements dictating
the Company’s and the Group’s share of reportable volumes.
Hydrocarbon reserves are also a fundamental indicator of the
future potential of the Company’s and the Group’s
performance and these estimates affect significant amounts
in the separate and consolidated statement of financial
position and the separate and consolidated statement of profit
or loss. Therefore, we believe that estimation of hydrocarbon
reserves is a key audit matter.
Audit procedures included understanding of the process for
determination of the hydrocarbon reserves and walkthrough
of controls implemented in the process. We also assessed
the competence and objectivity of the Company’s and the
Group’s technical experts to evaluate whether they are
appropriately qualified to carry out the hydrocarbon reserve
volumes estimation. We performed specific inquiry to the
management of the Company and the Group in respect of
consistency of the applied methodology for reserves
estimate with previous year.
For the significant changes in reserve volumes we tested
whether the appropriate methodology was applied, the
assumptions used are reasonable and adequately supported
by underlying information provided by the management. We
also performed analytical procedures on movements in
hydrocarbon reserves during the year and reviewed that all
significant changes were approved by the “Reserves and
Resources Committee” and are in line with our expectations.
We also assessed on the adequacy of the relevant
disclosures in the separate and consolidated financial
statements and if these are in line with the requirements of
the IFRS as adopted by the EU.
Impairments of the Company’s and the Group’s long lived assets
Impairments of the Company’s and the Group’s long lived
assets are disclosed in Note 6 Depreciation, amortization and
impairment (net) and in respective notes disclosing the
underlying assets in the separate and consolidated financial
statements; a description of the accounting policy and key
judgements and estimates are included in Note 2 Accounting
policies and Note 3 Significant accounting judgements and
estimates, respectively.
Movements in oil and gas prices and the recent volatility
caused by COVID -19 pandemic, can have a significant effect
on the carrying value of the Company’s and the Group's long
lived assets including upstream offshore and onshore,
refining, retail and service related long lived assets as well as
goodwill. A significant and rapid drop in prices also quickly
impacts the Company’s and the Group's operations and cash
flows.
We performed understanding of the process and walked
through the controls designed and operated by the Company
and the Group relating to the assessment of the carrying
value of respective long lived assets. We examined the
methodology used by management to assess the carrying
value of respective long lived assets, to evaluate its
compliance with accounting standards and consistency of
application. For the upstream and retail assets where the
impairment indicators were not identified by the Company
and the Group, we evaluated the management’s impairment
indicators assessment by comparing the assumptions used
in prior year to the achieved results in the current year.
We also evaluated the assumptions used in the current year
assessment of impairment indicators and tested whether
these assumptions are in line with the results achieved in the
current year as well as current development in the industry
and the Company’s and the Group’s expectations for the key
inputs to the impairment models.
292
Key Audit Matter How we addressed Key Audit Matter
Impairments of the Company’s and the Group’s long lived assets (continued)
Furthermore, during 2020 management decision on
transformation of traditional refining process and
conservation of units in the Sisak Refinery was made. This
decision resulted in the need to review all assets of Sisak
Refinery for impairment and identify those becoming idle.
Due to complexity and judgement used in the assessment of
impairment indicators and impairment models, impairment of
Company’s and Group’s long lived assets is a key audit matter.
In respect of performed impairment tests, we used external
data in assessing and corroborating the assumptions used in
the impairment analysis, the most significant being future
market oil and gas prices and discount rates. We performed
audit procedures on the mathematical integrity of the
impairment models and sensitivity analysis, tested the
appropriateness of discount rates used in the calculation
with the assistance of the specialists and performed
procedures to assess the completeness of the impairment
charges.
We reviewed the decision made by management that
triggered the impairment of Sisak Refinery asset. We
performed inquiries with the management and with the
responsible departments to understand the transformation
process. As part of our testing, we performed additional
evaluation and test of details on a sample to check
management’s reasoning on adjusting or not adjusting value
of items.
We also assessed on the adequacy of the relevant
disclosures in the separate and consolidated financial
statements and if these are in line with the requirements of
the IFRS as adopted by the EU.
Estimation of decommissioning provisions
Provisions associated with decommissioning of the assets are
disclosed in Note 30 Provisions to the separate and
consolidated financial statements; a description of the
accounting policy and key judgements and estimates are
included in Note 2 Accounting policies and Note 3 Significant
accounting judgements and estimates, respectively.
Management reviews decommissioning provisions on an
annual basis. This review incorporates the effects of any
changes in local regulations, management's expected
approach to decommissioning, cost estimates and discount
rates. Decommission assets are recorded in an amount equal
to the estimated provision, which is also amortized as part of
the capital asset costs. Any change to the present value of the
estimated costs is reflected as an adjustment of the provisions
and the decommission assets. If there is no related asset, the
change in provision estimate will be charged to the separate
and consolidated statement of profit or loss. The calculation
of decommissioning provisions requires significant
management judgement because of the inherent complexity
in estimating future costs and is therefore considered as a key
audit matter.
Audit procedures involved understanding of the mandatory
or constructive obligations with respect to the
decommissioning of each asset based on the contractual
arrangements and relevant local regulation to validate the
appropriateness of the cost estimate.
We obtained calculation of decommissioning provision from
the Company and the Group and tested that all of the
required fields are included in the calculation, tested the
appropriateness of discount rates used in the calculation,
tested actual expenses that occurred during the current
accounting period, inspected that decommissioning
provision for the similar types of assets is in line with the
expenses occurred in the current accounting period and
assessed that the last year of production is aligned with the
evaluation of reserves. As a part of our testing, we
considered the competence and objectivity of the Company’s
and the Group’s experts who produced the cost estimates.
We also assessed on the adequacy of the relevant
disclosures in the separate and consolidated financial
statements and if these are in line with the requirements of
the IFRS as adopted by the EU.
293
Other information included in the Company’s and the Group’s Annual Report for year 2020
Management is responsible for the other information. Other information consists of the information included
in the Company’s and the Group’s 2020 Annual Report which includes the Management report, Corporate
Governance Statement and Report on payments to governments, other than the separate and consolidated
financial statements and our auditor’s report thereon. The Company’s and the Group’s 2020 Annual Report is expected to be made available to us after the date of this auditor’s report.
Our opinion on the separate and consolidated financial statements does not cover the Other information and
we will not express any form of assurance conclusion thereon.
In connection with our audit of the separate and consolidated financial statements, our responsibility is to
read the other information when it becomes available and, in doing so, consider whether the other
information is materially inconsistent with the separate and consolidated financial statements or our
knowledge obtained in the audit or otherwise appears to be materially misstated.
Responsibilities of management and Audit Committee for the separate and consolidated financial
statements
Management is responsible for the preparation and fair presentation of the separate and consolidated
financial statements in accordance with IFRS as adopted by the EU, and for such internal control as
management determines is necessary to enable the preparation of separate and consolidated financial
statements that are free from material misstatement, whether due to fraud or error.
In preparing the separate and consolidated financial statements, management is responsible for assessing
the Company’s and the Group’s ability to continue as a going concern, disclosing, as applicable, matters
related to going concern and using the going concern basis of accounting unless management either intends
to liquidate the Company and the Group or to cease operations, or has no realistic alternative but to do so.
Audit Committee is responsible for overseeing the Company’s and the Group’s financial reporting process.
Auditor’s responsibilities for the audit of the separate and consolidated financial statements
Our objectives are to obtain reasonable assurance about whether the separate and consolidated financial
statements as a whole are free from material misstatement, whether due to fraud or error, and to issue an
auditor’s report that includes our opinion. Reasonable assurance is a high level of assurance, but is not a guarantee that an audit conducted in accordance with ISAs will always detect a material misstatement when
it exists. Misstatements can arise from fraud or error and are considered material if, individually or in the
aggregate, they could reasonably be expected to influence the economic decisions of users taken on the basis
of these separate and consolidated financial statements.
As part of an audit in accordance with ISAs, we exercise professional judgment and maintain professional
skepticism throughout the audit. We also:
• Identify and assess the risks of material misstatement of the separate and consolidated financial
statements, whether due to fraud or error, design and perform audit procedures responsive to those
risks, and obtain audit evidence that is sufficient and appropriate to provide a basis for our opinion.
The risk of not detecting a material misstatement resulting from fraud is higher than for one
resulting from error, as fraud may involve collusion, forgery, intentional omissions,
misrepresentations, or the override of internal control.
294
Auditor’s responsibilities for the audit of the separate and consolidated financial statements (continued)
• Obtain an understanding of internal control relevant to the audit in order to design audit procedures
that are appropriate in the circumstances, but not for the purpose of expressing an opinion on the
effectiveness of the Company’s and the Group’s internal control.
• Evaluate the appropriateness of accounting policies used and the reasonableness of accounting
estimates and related disclosures made by management.
• Conclude on the appropriateness of management’s use of the going concern basis of accounting and, based on the audit evidence obtained, whether a material uncertainty exists related to events
or conditions that may cast significant doubt on the Company’s and the Group’s ability to continue as a going concern. If we conclude that a material uncertainty exists, we are required to draw
attention in our auditor’s report to the related disclosures in the separate and consolidated financial
statements or, if such disclosures are inadequate, to modify our opinion. Our conclusions are based
on the audit evidence obtained up to the date of our auditor’s report. However, future events or conditions may cause the Company and the Group to cease to continue as a going concern.
• Evaluate the overall presentation, structure and content of the separate and consolidated financial
statements, including the disclosures, and whether the separate and consolidated financial
statements represent the underlying transactions and events in a manner that achieves fair
presentation.
• Obtain sufficient appropriate audit evidence regarding the financial information of the entities or
business activities within the Group to express an opinion on the consolidated financial statements.
We are responsible for the direction, supervision and performance of the group audit. We remain
solely responsible for our audit opinion.
We communicate with Audit Committee regarding, among other matters, the planned scope and timing of
the audit and significant audit findings, including any significant deficiencies in internal control that we
identify during our audit.
We also provide Audit Committee with a statement that we have complied with relevant ethical requirements
regarding independence, and to communicate with them all relationships and other matters that may
reasonably be thought to bear on our independence, and where applicable, actions taken to eliminate threats
or safeguards applied.
From the matters communicated with Audit Committee, we determine those matters that were of most
significance in the audit of the separate and consolidated financial statements of the current period and are
therefore the key audit matters. We describe these matters in our auditor’s report unless law or regulation precludes public disclosure about the matter or when, in extremely rare circumstances, we determine that a
matter should not be communicated in our report because the adverse consequences of doing so would
reasonably be expected to outweigh the public interest benefits of such communication.

295
Report on Other Legal and Regulatory Requirements
In compliance with Article 10(2) of Regulation (EU) No. 537/2014 of the European Parliament
and the Council, we provide the following information in our independent auditor’s report, which is required in addition to the requirements of ISAs:
Appointment of Auditor and Period of Engagement
We were initially appointed as auditors of the Company by the General Meeting of Shareholders on 24
June 2014. Our appointment has been renewed annually by shareholder resolution, with the most recent
reappointment on 26 August 2020, representing a total period of uninterrupted engagement appointment
of 7 years.
Consistence with Additional Report to Audit Committee
We confirm that our audit opinion on the separate and consolidated financial statements expressed herein is
consistent with the additional report to the Audit Committee of the Company, which we issued on
17 March 2021 in accordance with Article 11 of Regulation (EU) No. 537/2014 of the European Parliament
and the Council.
Provision of Non-audit Services
We declare that no prohibited non-audit services referred to in Article 5(1) of Regulation (EU) No. 537/2014
of the European Parliament and the Council were provided by us to the Company and its controlled
undertakings within the European Union. In addition, there are no other non-audit services which were
provided by us to the Company and its controlled undertakings and which have not been disclosed in the
separate and consolidated financial statements.
Report on Regulatory requirements
The partner in charge of the audit resulting in this independent auditor’s report is Berislav Horvat.
________________________________
Berislav Horvat, President of the Management Board and certified auditor
Ernst & Young d.o.o.
Radnička cesta 50
10000 Zagreb
Republic of Croatia 17 March 2021
II. Other information included in the Company’s and the Group’s Annual Report for year 2020
Management is responsible for the other information. Other information consists of the information included in the
Annual Report which includes the Management report, Corporate Governance Statement and Report on payments to
governments, other than the separate and consolidated financial statements and our auditor’s report thereon. Our
opinion on the separate and consolidated financial statements does not cover the Other information including the
Management report, Corporate Governance Statement and Report on payments to governments.

296
II. Other information included in the Company’s and the Group’s Annual Report for year 2020 (continued)
In connection with our audit of the separate and consolidated financial statements, our responsibility is to read the
other information and, in doing so, consider whether the other information is materially inconsistent with the separate
and consolidated financial statements or our knowledge obtained in the audit or otherwise appears to be materially
misstated.
With respect to the Management report, Corporate Governance Statement and Report on payments to governments,
we also performed procedures required by the Accounting Act. Those procedures include considering whether the
Management report includes the disclosures required by Article 21 of the Accounting Act, whether the Corporate
Governance Statement includes the information specified in Article 22 of the Accounting Act, and whether the Report
on the payments to governments includes the information specified in Article 27 of the Accounting Act.
Based on the procedures undertaken, to the extent we are able to assess it, we report that:
1. the information given in the enclosed Management report for the 2020 financial year are consistent, in all material
respects, with the enclosed separate and consolidated financial statements;
2. the enclosed Management report for 2020 financial year is prepared in accordance with requirements of Article 21
of the Accounting Act;
3. Corporate Governance Statement, included in the Company’s and the Group's annual report, includes the information referred to in Article 22, paragraph 1, items 2, 5, 6 and 7 of the Accounting Act;
4. elements of Corporate Governance Statement containing the information referred to in Article 22, paragraph 1,
items 3 and 4 of the Accounting Act, included in the Company’s and the Group's annual report for the year 2020 are
prepared in accordance with requirements of the Accounting Act and are consistent, in all material respects, with the
enclosed separate and consolidated financial statements; and
5. Report on payments to governments, included in the Company's and Group’s annual report, includes the information
referred to in Article 27, paragraph 4, items 1, 2 and 3 and paragraph 5 of the Accounting Act.
In addition, in the light of the knowledge and understanding of the Company and Group and its environment obtained
in the course of the audit, we are also required to report if we have identified material misstatements in the
Management report, Corporate Governance Statement, Report on payments to governments and Annual report. We
have nothing to report in this respect.
________________________________
Berislav Horvat, President of the Management Board and certified auditor
Ernst & Young d.o.o.
Radnička cesta 50
10000 Zagreb
Republic of Croatia
30 April 2021
Copyright © 2022 FDOKUMEN