Half-Year Financial Report at June 30, 2020 - Enel Group
240
HALF-YEAR FINANCIAL REPORT AT JUNE 30, 2020 WE EMPOWER SUSTAINABLE PROGRESS. OPEN POWER FOR A BRIGHTER FUTURE.
-
Upload
khangminh22 -
Category
Documents
-
view
0 -
download
0
Transcript of Half-Year Financial Report at June 30, 2020 - Enel Group

HALF -YEAR FINANCIAL REPORTAT JUNE 30, 2020
WE EMPOWER SUSTAINABLE PROGRESS.
OPEN POWERFOR A BRIGHTER FUTURE.
Hal
f-Yea
r Fi
nanc
ial R
epor
t at
Jun
e 30
, 202
0


HALF-YEAR FINANCIAL REPORT AT JUNE 30, 2020

Relazione finanziaria annuale consolidata 2019Half-Year Financial Report at June 30, 2020

2.
Consolidated Income Statement
Statement of Consolidated Comprehensive Income
Consolidated Balance Sheet
Statement of Changes in Consolidated Shareholders’ Equity
Consolidated Statement of Cash Flows
Explanatory notes
Declaration of the Chief Executive Officer and the officer responsible for the preparation of the corporate financial documentation
Reports
- Report of the Audit Firm
Attachments
- Subsidiaries, associates and other significant equity investments of the Enel Group at June 30, 2020
Condensed interim consolidated financial statements
1.
Enel is Open Power
Highlights
Enel organizational model
Corporate boards
Reference scenario
- Developments in the main market indicators
- Economic and energy conditions in the 1st Half of 2020
- Electricity and natural gas markets
Risk management
Signficant events in the 1st Half of 2020
Group performance and operations
Analysis of the Group’s financial position and financial structure
People centricity
Results by business area
- Thermal Generation and Trading
- Enel Green Power
- Infrastructure and Networks
- End-user Markets
- Enel X
- Services and Other
Definition of performance indicators
Outlook
6
8
9
11
13
13
15
18
20
29
37
47
52
54
61
67
75
81
85
89
91
106
110
111
112
114
116
117
167
168
169
172
172
5
109
Interim report on operations

4 Relazione Finanziaria Annuale 2019

5
INTERIM REPORT ON OPERATIONS
1.

PV
CPPositioning
Open Power
MPurpose
Open Power for
a brighter future.
We empower
sustainable progress.
VPrinciples of conduct
• Make decisions in daily activities and take
responsibility for them.
• Share information, being willing to collaborate
and open to the contribution of others.
• Follow through with commitments, pursuing
activities with determination and passion.
• Change priorities rapidly if the situation evolves.
• Get results by aiming for excellence.
• Adopt and promote safe behavior and move
pro-actively to improve conditions for health,
safety and well-being.
• Work for the integration of all, recognizing and
leveraging individual diversity (culture, gender,
age, disabilities, personality etc.).
• Work focusing on satisfying customers and/or
co-workers, acting effectively and rapidly.
• Propose new solutions and do not give up
when faced with obstacles or failure.
• Recognize merit in co-workers and give
feedback that can improve their contribution.
Enel is Open Power
Mission
• Open access to electricity for more
people.
• Open the world of energy to new
technology.
• Open up to new uses of energy.
• Open up to new ways of managing
energy for people.
• Open up to new partnerships.
Vision
Open Power to tackle
some of the world’s
biggest challenges.
ValuesTrust
Proactivity
Responsibility
Innovation
6 Half-Year Financial Report at June 30, 2020

PV
CPPositioning
Open Power
MPurpose
Open Power for
a brighter future.
We empower
sustainable progress.
VPrinciples of conduct
• Make decisions in daily activities and take
responsibility for them.
• Share information, being willing to collaborate
and open to the contribution of others.
• Follow through with commitments, pursuing
activities with determination and passion.
• Change priorities rapidly if the situation evolves.
• Get results by aiming for excellence.
• Adopt and promote safe behavior and move
pro-actively to improve conditions for health,
safety and well-being.
• Work for the integration of all, recognizing and
leveraging individual diversity (culture, gender,
age, disabilities, personality etc.).
• Work focusing on satisfying customers and/or
co-workers, acting effectively and rapidly.
• Propose new solutions and do not give up
when faced with obstacles or failure.
• Recognize merit in co-workers and give
feedback that can improve their contribution.
Enel is Open Power
Mission
• Open access to electricity for more
people.
• Open the world of energy to new
technology.
• Open up to new uses of energy.
• Open up to new ways of managing
energy for people.
• Open up to new partnerships.
Vision
Open Power to tackle
some of the world’s
biggest challenges.
ValuesTrust
Proactivity
Responsibility
Innovation
7Enel is Open Power

8 Half-Year Financial Report at June 30, 2020
Highlights
1st Half
SDG 2020 2019 Change
Revenue (millions of euro) (1) 33,375 40,967 -18.5%
Gross operating margin (millions of euro) 8,645 8,907 -2.9%
Ordinary gross operating margin (millions of euro) 8,794 8,763 0.4%
Net income attributable to the shareholders of the Parent Company (millions of euro) 1,947 2,215 -12.1%Ordinary net income attributable to the shareholders of the Parent Company (millions of euro) 2,405 2,277 5.6%
Net financial debt (millions of euro) 50,411 45,175 (2) 11.6%
Cash flows from operating activities (millions of euro) 2,042 4,619 -55.8%
Capital expenditure on property, plant and equipment and intangible assets (millions of euro) 4,137 4,167 (3) -0.7%
Total net efficient installed capacity (GW) 82.7 84.3 (2) -1.9%
7 Net efficient installed renewable capacity (GW)) 42.9 42.1 (2) 1.9%
7 Net efficient installed renewable capacity (%) 51.9% 50.0% (2) 3.8%
7 Additional efficient installed renewable capacity (GW) 0.76 0.76 -
Net electricity generation (TWh) 97.6 112.9 -13.6%
7 Net renewable electricity generation (TWh) 51.1 47.1 8.6%
9 Electricity distribution and transmission grid (km) 2,236,038 2,230,029 (2) 0.3%
9 Electricity transported on Enel’s distribution grid (TWh) (4) 228.7 249.5 -8.3%
End users (no.) (5) 74,035,488 73,718,567 0.4%
9 End users with active smart meters (no.) 44,736,784 44,165,543 1.3%
Electricity sold by Enel (TWh) (6) 145.0 158.1 -8.3%
Retail customers (no.) (5) 70,013,654 71,019,124 -1.4%
- of which free market 23,139,223 22,477,894 2.9%
11 Storage (MW) (7) 110.0 110.0 (2) -
11 Charging points (no.) 89,301 63,352 41.0%
11 Demand response (MW) 6,128 6,023 1.7%
No. of employees 66,825 68,253 (2) -2.1%
(1) The figures for the 1st Half of 2019 have been adjusted to take account of the interpretations of the IFRS Interpretations Committee (IFRIC) contained in the Agenda Decision of 2019, which involved changes in the classification, with no impact on margins, of the effects of purchase and sales contracts for commodi-ties measured at fair value through profit or loss (for more details, see note 4 to the condensed interim consolidated financial statements at June 30, 2020).
(2) At December 31, 2019.(3) Does not include €4 million regarding units classified as “held for sale” in the 1st Half of 2019.(4) The figures for 2019 reflect a more accurate calculation of quantities transported.(5) The figures for 2019 reflect a more accurate calculation of the numbers.(6) Volumes include sales to large customers by generation companies in Latin America. The figure for the 1st Half of 2019 has consequently been adjusted to
ensure comparability.(7) The figure includes 14 MW of storage ready for connection to the grid in Peru.

9
Conden
sed inte
rim
conso
lidat
ed fi
nan
cial
sta
tem
ents
Inte
rim
rep
ort
on o
per
atio
ns
Enel organizational model
The Enel Group structure is organized into a matrix that comprises:
Global Business Lines
The Global Business Lines are responsible for managing and developing assets, optimizing their
performance and the return on capital employed in the various geographical areas in which the Group
operates. The Business Lines are also tasked with improving the efficiency of the processes they
manage and sharing best practices at the global level. The Group, which also draws on the work of an
Investment Committee,1 benefits from a centralized industrial vision of projects in the various Business
Lines. Each project is assessed not only on the basis of its financial return but also in relation to the
best technologies available at the Group level, which reflect the new strategic line adopted, explicitly
integrating the SDGs within our financial strategy and promoting a low-carbon business model.
Furthermore, each Business Line contributes to guiding Enel’s leadership in the energy transition and
in the fight against climate change, managing the associated risks and opportunities in its area of
competence. In 2019, Global Power Generation was created with the merger of Enel Green Power and
Global Thermal Generation to confirm the Enel Group’s leading role in the energy transition, pursuing
an integrated process of decarbonization and the sustainable development of renewable capacity. In
addition, the Grid Blue Sky project was launched. Its objective is to innovate and digitalize infrastructures
and networks in order to make them an enabling factor for the achievement of the Climate Action
objectives, thanks to the progressive transformation of Enel into a platform-based group.
Regions and Countries
Regions and Countries are responsible for managing relationships with institutional bodies and regulatory
authorities, as well as selling electricity and gas, in each of the countries in which the Group is present,
while also providing staff and other service support to the Business Lines. They are also charged with
promoting decarbonization and guiding the energy transition towards a low-carbon business model
within their areas of responsibility. In 2019, the Group’s geographical organization in the Americas was
revised with the creation of the North America Region, which includes Mexico, and the integration of
Costa Rica, Guatemala and Panama into the Latin America Region.
The following functions provide support to Enel’s business operations:
Global Service Functions
The Global Service Functions are responsible for managing information and communication technology
activities and procurement at the Group level. They are also responsible for adopting sustainability criteria
in managing the supply chain and developing digital solutions to support the development of enabling
technologies for the energy transition and the fight against climate change.
Holding Company Functions
The Holding Company Functions are responsible for managing governance processes at the
Group level. The Administration, Finance and Control function is also responsible for consolidating
scenario analysis and managing the strategic and financial planning process aimed at promoting the
decarbonization of the energy mix and the electrification of energy demand, key actions in the fight
against climate change.
(1) The Group Investment Committee is made up of the heads of Administration, Finance and Control, Innovability, Legal and Corporate Affairs, Global Procure-ment, the heads of the Regions and the Business Lines.
Enel organizational model

10 Half-Year Financial Report at June 30, 2020
C
HLD
CEOEnel Group ChairmanM. Crisostomo
Administration, Finance and ControlA. De Paoli
Enel Group CEOF. Starace
Global ProcurementS. Bernabei
Global Digital SolutionsC. Bozzoli
HOLDING FUNCTIONS
CRCOUNTRY AND REGION
GBLGLOBAL BUSINESS LINES
People and OrganizationF. Di Carlo
CommunicationsR. Deambrogio
Legal and Corporate AffairsG. Fazio
InnovabilityE. Ciorra
AuditS. Fiori
GlobalInfrastructureand Networks
––L. Gallo
GlobalTrading
––C. Machetti
Global PowerGeneration
––A. Cammisecra
Italy | C. Tamburi
Iberia | J. D. Bogas Gálvez
Europe | S. Mori
Africa, Asia and Oceania | A. Cammisecra
North America | E. Viale
Latin America | M. Bezzeccheri
Enel X
––F. Venturini

11
Conden
sed inte
rim
conso
lidat
ed fi
nan
cial
sta
tem
ents
Inte
rim
rep
ort
on o
per
atio
ns
ChairmanBarbara Tadolini
AuditorsRomina GuglielmettiClaudio Sottoriva
Alternate auditors Maurizio De FilippoFrancesca Di DonatoPiera Vitali
ChairmanMichele Crisostomo
Chief Executive Of�cerand General ManagerFrancesco Starace
DirectorsCesare CalariCostanza Esclapon de VilleneuveSamuel LeupoldAlberto MarchiMariana MazzucatoMirella PellegriniAnna Chiara Svelto
SecretarySilvia Alessandra Fappani
BOARD OF DIRECTORS
BOARD OF STATUTORY AUDITORS
KPMG SpA
AUDIT FIRM
Corporate boards
Corporate boards

12 Half-Year Financial Report at June 30, 2020
Powers
Board of Directors
The Board is vested by the bylaws with the broadest powers for the ordinary and extraordinary
management of the Company, and specifically has the power to carry out all the actions it deems
advisable to implement and attain the corporate purpose.
Chairman of the Board of Directors
The Chairman is vested by the bylaws with the powers to represent the Company and to sign on its
behalf, presides over Shareholders’ Meetings, convenes and presides over the Board of Directors, and
ascertains that the Board’s resolutions are carried out. Pursuant to a Board resolution of May 15, 2020,
the Chairman has been vested with a number of additional non-executive powers.
Chief Executive Officer
The Chief Executive Officer is also vested by the bylaws with the powers to represent the Company and
to sign on its behalf, and in addition is vested by a Board resolution of May 15, 2020 with all powers for
managing the Company, with the exception of those that are otherwise assigned by law or the bylaws or
that the aforesaid resolution reserves for the Board of Directors.
13
Conden
sed inte
rim
conso
lidat
ed fi
nan
cial
sta
tem
ents
Inte
rim
rep
ort
on o
per
atio
ns
Reference scenario
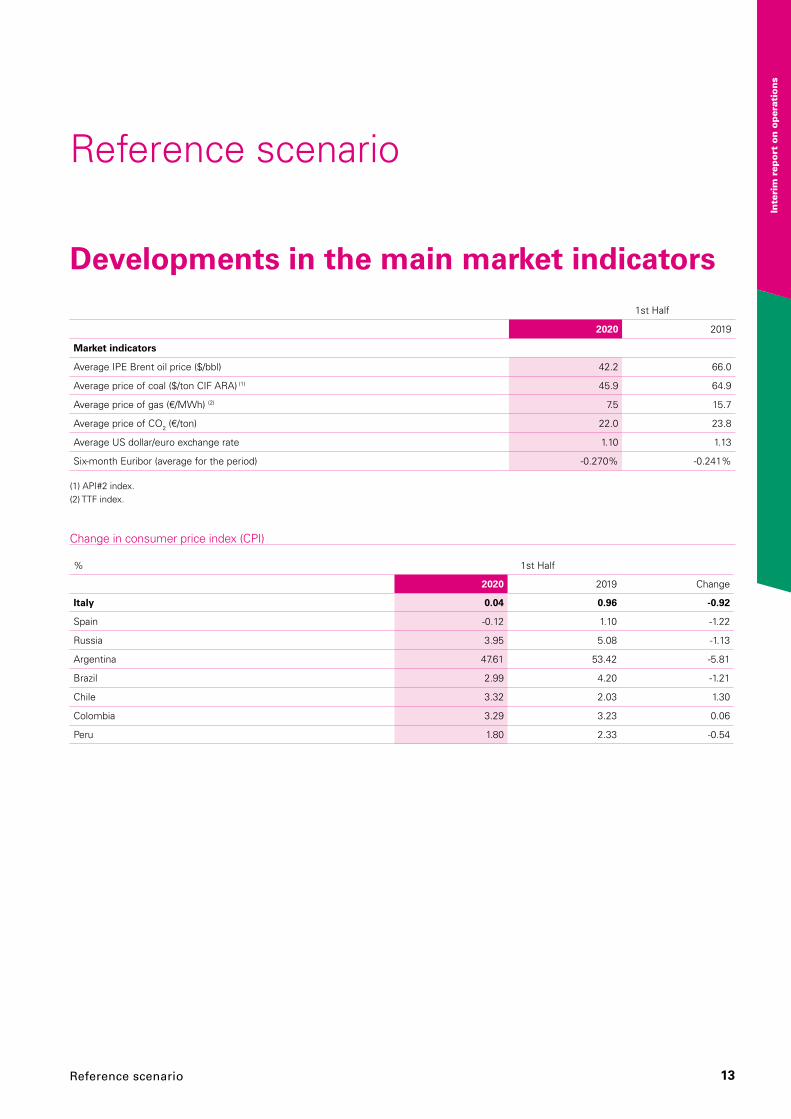
Developments in the main market indicators1st Half
2020 2019
Market indicators
Average IPE Brent oil price ($/bbl) 42.2 66.0
Average price of coal ($/ton CIF ARA) (1) 45.9 64.9
Average price of gas (€/MWh) (2) 7.5 15.7
Average price of CO2 (€/ton) 22.0 23.8
Average US dollar/euro exchange rate 1.10 1.13
Six-month Euribor (average for the period) -0.270% -0.241%
(1) API#2 index.(2) TTF index.
Change in consumer price index (CPI)
% 1st Half
2020 2019 Change
Italy 0.04 0.96 -0.92
Spain -0.12 1.10 -1.22
Russia 3.95 5.08 -1.13
Argentina 47.61 53.42 -5.81
Brazil 2.99 4.20 -1.21
Chile 3.32 2.03 1.30
Colombia 3.29 3.23 0.06
Peru 1.80 2.33 -0.54
Reference scenario

14 Half-Year Financial Report at June 30, 2020
Exchange rates
1st Half
2020 2019 Change
Euro/US dollar 1.10 1.13 -2.49%
Euro/British pound 0.87 0.87 0.19%
Euro/Swiss franc 1.06 1.13 -6.12%
US dollar/Japanese yen 108.26 110.06 -1.66%
US dollar/Canadian dollar 1.36 1.33 2.27%
US dollar/Australian dollar 1.52 1.42 7.03%
US dollar/Russian ruble 69.57 65.25 6.21%
US dollar/Argentine peso 64.59 41.48 35.78%
US dollar/Brazilian real 4.92 3.84 21.85%
US dollar/Chilean peso 813 676 16.93%
US dollar/Colombian peso 3.693 3.189 13.65%
US dollar/Peruvian sol 3.42 3.32 2.82%
US dollar/Mexican peso 21.66 19.15 11.57%
US dollar/Turkish lira 6.49 5.62 13.38%
US dollar/Indian rupee 74.15 70.02 5.58%
US dollar/South African rand 16.67 14.20 14.81%

15
Conden
sed inte
rim
conso
lidat
ed fi
nan
cial
sta
tem
ents
Inte
rim
rep
ort
on o
per
atio
ns
Economic and energy conditions in the 1st Half of 2020
Economic developments In the 1st Half of 2020, the effects of the COVID-19 pan-
demic were reflected in the economic activity and aggregate
demand of all economies, producing a sharp contraction in
international trade in April and May. Current conditions re-
main heavily influenced by the persistence of the pandemic,
especially in certain areas of the globe, and the consequent
containment measures that are impacting the economy on a
global level. Starting in the 2nd Half of May, we witnessed a
gradual reopening of economies, particularly in Europe, and a
consequent recovery in consumption in almost all sectors, in-
cluding those most severely affected such as services. In par-
allel, the virus continued to expand rapidly in North and South
America. The United States and Brazil are currently the first
and second countries in the world by number of infections,
with a sharp increase in the speed of contagion, not particular-
ly stringent or uniform containment measures and very tense
political and social situations. In response to the spread of
the pandemic and the related economic-health crisis, the au-
thorities (governments and central banks) have acted swiftly
and very effectively. In the euro area, direct and indirect fiscal
stimulus measures (in the form of state guarantees on bank
loans) amounted to about 15% of GDP, while in the United
States they exceeded 20% of GDP, and the government also
implemented stimulus measures totaling over $3 trillion. In
order to stave off another liquidity crisis, the world’s four main
central banks (Federal Reserve, European Central Bank, Bank
of Japan, Bank of England) deployed a major program of (i)
purchases of public and private securities (adding total assets
to their balance sheet in the amount of about €18 trillion) in
order to stimulate demand; and (ii) targeted interventions (FX
swap lines). The huge volume of liquidity injected into the sys-
tem and the confidence in the unlimited support (“whatever
it takes”) of the central banks have enabled equity markets to
reverse the downward slide begun at the end of February and
post new highs, although economic conditions have not yet
matured into a solid recovery. The mature countries were the
hardest hit by the pandemic. This is attributable in part to the
early imposition of restrictive measures, which have been in
place since the beginning of March, to the strong connection
of these economies with the rest of the world, as well as to
the larger “weight” of the services they produce. In its early
stages, the impact of the pandemic was less severe on the
emerging economies. However, their more limited economic
resources and the lower quality of their healthcare systems
increased the vulnerability of these countries, a circumstance
that was reflected in a sharp drop in activity in the 2nd Quar-
ter, with the situation regarding new infections still critical.
At the moment, the world economy is estimated to be in re-
cession, with a contraction of GDP of about 4% on an annual
basis in 2020.
The United States, the country hitherto most severely af-
fected by the virus, recorded a drop in output of 4.8% and
a much larger one in the 2nd Quarter, at between 30-40%.
Furthermore, the much more flexible labor market in the Unit-
ed States caused the unemployment rate to rise from an es-
timated 3.5% in February (a historic low) to around 15% in
April, before falling to 11.1% in June with the reopening of
economic activity. Inflationary pressures, which were close to
the Federal Reserve’s target in the 1st Quarter, have subsided
considerably, reaching around 0.4% year on year in the 2nd
Quarter of 2020.
Preliminary data on GDP developments in the 1st Quarter of
the year show that Italy, the first European country to intro-
duce restrictive measures to contain the spread of COVID-19,
recorded a contraction of 5.4%, revised downwards from the
preliminary figures giving a decline of 4.7% in the 1st Quarter
of 2020. The Bank of Italy expected an even more significant
contraction in the 2nd Quarter of 2020, with values close to
10% quarter on quarter. Growth is expected to rebound in
the 3rd Quarter of 2020 and then proceed at a much slower
and more gradual pace from 2021. The labor market in Italy
suffered a severe blow as a result of the pandemic with an
unemployment rate of 7.8% in May, up 1.2 percentage points
from April. Average inflation since the beginning of the year
has been close to 0%, well below the target (2%) of the Euro-
pean Central Bank, with preliminary data indicating negative
values in May and June, mainly due to the reduction in prices
of energy goods.
In this 1st Half of the year, the Spanish economy has expe-
rienced its first recession since 2013, although there is opti-
mism for the 2nd Half of 2020. The Spanish national statistical
institute has confirmed a contraction of GDP of 4.1% year
Reference scenario

16 Half-Year Financial Report at June 30, 2020
on year in the 1st Quarter, forecasting an even more marked
slowdown in the 2nd Quarter (about -20% year on year), with
economic growth expected to resume starting in the 3rd
Quarter of 2020. After suffering huge losses in April and May,
the labor market is showing signs of a gradual recovery in
June. During the 1st Half of 2020, inflationary pressure was
slightly below 0% on average, driven downwards by the re-
sults for the 2nd Quarter, in which inflation is put at -0.6%,
well below the monetary policy target (2%) of the European
Central Bank.
Russia’s economy grew 1.8% year on year in the 1st Quarter
before experiencing a sharp contraction in the second, drop-
ping by close to 9%. Domestic consumption and investments
are slowing and the pace of growth in external demand has
decreased significantly compared with 2019 due to the entire
macroeconomic context. Due to the devaluation of the cur-
rency, inflation is expected to increase in the 2nd Half of the
year, although for all of 2020 it is forecast to average less than
the 4% target set by the Russian central bank. For the 1st
Half of the year, inflation is expected to be around 2.8% year
on year, after registering 2.4% year on year in the 1st Quarter.
In Latin America and Central America, the economic impacts
have lagged but clear signs are now emerging with the closure
of all non-essential activities and the imposition of social dis-
tancing restrictions. The area will be in economic recession,
with the most affected countries being Peru, Brazil, Chile and
Argentina (due in part to the weakness of the commodities
market). Chile and Peru, having adopted more responsible
economic and fiscal policies in the past, are however better
positioned to take advantage of the post-lockdown recovery,
and by 2021 they will recoup lost output levels. South Ameri-
ca is expected to see a general recovery from the 4th Quarter
of this year, with a marked improvement in 2021 when the
virus containment measures will have produced their effects
and fiscal stimuli have reached their maximum level.
If managed effectively, the crisis could be temporary, without
the prolonged effects of the previous financial crisis. Com-
pared with the latter, the banking sector is now much more
solid and capable of withstanding strong financial shocks,
and there is no risk of an asset price bubble (such as the
real estate bubble) or excessive debt in the private sector.
The open-ended commitment of the central banks also rep-
resents an important guarantee, increasing confidence in a
rapid recovery starting next year.
As noted earlier, Brazil currently has the second-largest num-
ber of COVID-19 cases in the world after the United States
and is also second in number of deaths, but both numbers are
rising faster than any other country in the world. The Brazilian
government did not impose a national lockdown and initially
minimized the risk associated with the pandemic. Although it
has revised its position in recent weeks, the country has been
left in a critical situation. From an economic point of view,
Brazil will be impacted primarily by the sharp deterioration in
its fiscal position (with an expected deficit above 10% of GDP,
and a debt level around 90%). The current climate of political
uncertainty could also compromise the achievement of im-
portant structural reforms, slowing the path of recovery.
Argentina is in a deep recession and has a large budget deficit
and a still significant external deficit, with high inflation, an
unstable currency vulnerable to international contagion and
a growing debt. The stringent COVID-19 containment meas-
ures implemented led to a contraction in GDP of 5.5% year on
year in the 1st Quarter, triggering even more negative expec-
tations for the 2nd Quarter, when the contraction is expected
to be 15% compared with the 2nd Quarter of 2019. Inflation
remained above 40% in the 1st Half of 2020, with the Ar-
gentine government seeking to lower this rate by increasing
control over prices and reducing the indexing of rates.
The Chilean economy grew by 0.46% year on year in the 1st
Quarter of 2020, driven mainly by exports and investment.
The effects of the pandemic began to make themselves felt
from May, generating a contraction of GDP in the 2nd Quarter
of around 12% year on year. The COVID-19 pandemic appears
to being generating deflationary trends in many Latin Amer-
ican countries. In Chile, the decline in energy prices and the
appreciation of the Chilean peso in recent months have been
the main factors in the reduction in inflation, which in June
was 0.2% lower than in May, averaging close to 3.3% year on
year for the 1st Half as a whole.
In the last two months, Peru has positioned itself in second
place among the countries most affected by the pandemic
in Latin America. In the 1st Quarter of 2020, GDP contracted
by around 3% year on year, with a much steeper decline in
the 2nd Quarter, when GDP is expected to have contracted
by about 9% year on year. Since March, inflation has hovered
around 1.8% year on year, despite the relative resilience of the
Peruvian sol, with disinflation held back by supply chain dis-
ruptions in the economy. However, the deep economic crisis
should exert greater downward pressure on domestic prices
17
Conden
sed inte
rim
conso
lidat
ed fi
nan
cial
sta
tem
ents
Inte
rim
rep
ort
on o
per
atio
ns
over the remainder of the year. Accordingly, inflation is expect-
ed to end the year at around 1.3% on an annual basis, close to
the lower limit of the central bank’s target range (1-3%).
The Colombian economy suffered a significant contraction in
the 1st Quarter of 2020, with GDP decreasing by 2.4% on the
previous quarter, mainly due to the collapse of exports and
the reduction in inventories. GDP is expected to drop sharply
for the half-year as a whole, with a more significant decelera-
tion in the 2nd Quarter, contracting by around 15% quarter on
quarter. In Colombia, inflation has followed the deflationary
path driven by the pandemic, falling to close to 2.2% in June
compared with 2.8% year on year in May. Inflation rate is ex-
pected to average 3.3% year on year in the 1st Half.
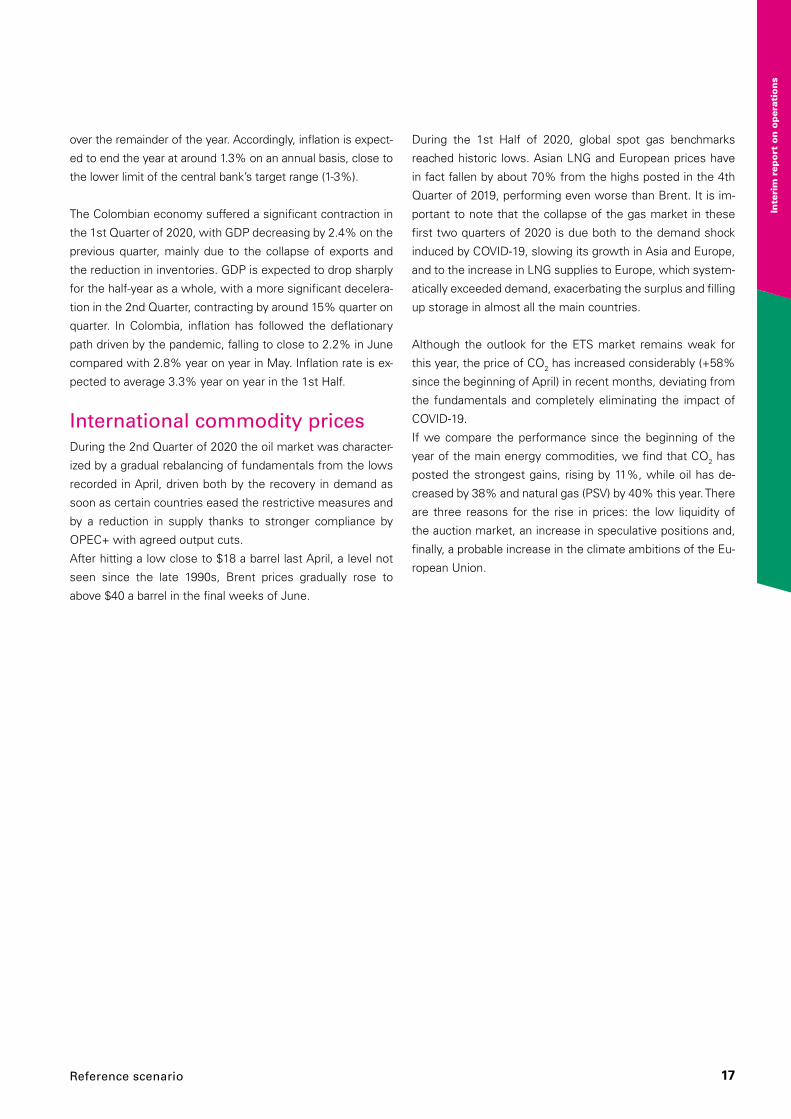
International commodity prices During the 2nd Quarter of 2020 the oil market was character-
ized by a gradual rebalancing of fundamentals from the lows
recorded in April, driven both by the recovery in demand as
soon as certain countries eased the restrictive measures and
by a reduction in supply thanks to stronger compliance by
OPEC+ with agreed output cuts.
After hitting a low close to $18 a barrel last April, a level not
seen since the late 1990s, Brent prices gradually rose to
above $40 a barrel in the final weeks of June.
During the 1st Half of 2020, global spot gas benchmarks
reached historic lows. Asian LNG and European prices have
in fact fallen by about 70% from the highs posted in the 4th
Quarter of 2019, performing even worse than Brent. It is im-
portant to note that the collapse of the gas market in these
first two quarters of 2020 is due both to the demand shock
induced by COVID-19, slowing its growth in Asia and Europe,
and to the increase in LNG supplies to Europe, which system-
atically exceeded demand, exacerbating the surplus and filling
up storage in almost all the main countries.
Although the outlook for the ETS market remains weak for
this year, the price of CO2 has increased considerably (+58%
since the beginning of April) in recent months, deviating from
the fundamentals and completely eliminating the impact of
COVID-19.
If we compare the performance since the beginning of the
year of the main energy commodities, we find that CO2 has
posted the strongest gains, rising by 11%, while oil has de-
creased by 38% and natural gas (PSV) by 40% this year. There
are three reasons for the rise in prices: the low liquidity of
the auction market, an increase in speculative positions and,
finally, a probable increase in the climate ambitions of the Eu-
ropean Union.
Reference scenario

18 Half-Year Financial Report at June 30, 2020
Electricity and natural gas markets Developments in electricity demand
2nd Quarter GWh 1st Half
2020 2019 Change 2020 2019 Change
67 77 -13.0% Italy 143 158 -9.5%
52 59 -11.9% Spain 114 124 -8.1%
13 15 -13.3% Romania 29 31 -6.5%
175 185 -5.4% Russia 389 403 -3.5%
30 32 -6.3% Argentina 65 65 -
133 145 -8.3% Brazil 286 299 -4.3%
19 19 - Chile 39 38 2.6%
16 18 -11.1% Colombia 35 35 -
Source: national TSOs.
In the 1st Half of 2020, electricity demand decreased by 9.5%
and 8.1% in Italy and Spain respectively. In the early months
of the year the decline was mainly attributable to temperatu-
res exceeding their seasonal averages, followed by steep fall
deriving from the lockdowns imposed to counter the worl-
dwide spread of the COVID-19 pandemic. The situation was
similar in Eastern Europe, where there was a 3.5% decrease
in Russia and 6.5% in Romania.
As far as Latin America is concerned, the acute phase of the
pandemic lagged that in Europe by a couple of months. As
a result, in the 1st Half of the year Argentina and Colombia
recorded a level of electricity demand in line with that of last
year. Brazil, the country that has experienced the worst health
impacts in South America, registered a 4.3% drop compared
with the same period last year. Chile is the only country to
have seen demand increase (+2.6%) compared with 2019,
mainly due to the fact that the lockdown measures were ini-
tially imposed only on Santiago and the surrounding areas,
which did not restrict industrial activities, in particular mining,
which is the main source of the country’s energy demand.
Electricity prices
Average baseload price H1 2020
(€/MWh)
Change in average baseload price
H1 2020 - H1 2019
Average peakload price H1 2020
(€/MWh)
Change in average peakload price
H1 2020 - H1 2019
Italy 32.2 -41.5% 36.4 -40.4%
Spain 29.0 -47.3% 31.4 -43.9%
Russia 14.6 -14.0% 17.1 -10.1%
Brazil 14.4 -24.6% 35.0 -32.0%
Chile 38.1 -33.1% 55.6 -45.5%
Colombia 81.7 108.0% 126.9 73.7%

19
Conden
sed inte
rim
conso
lidat
ed fi
nan
cial
sta
tem
ents
Inte
rim
rep
ort
on o
per
atio
ns
Natural gas demand
2nd Quarter Millions of m3 1st Half
2020 2019 Change 2020 2019 Change
12 14 (2) -14.3% Italy 35 39 (4) -10.3%
6 8 (2) -25.0% Spain 15 17 (2) -11.8%
Demand for natural gas in the 1st Half of 2020 dropped shar-
ply compared with the same period of 2019 both in Italy and
Spain, which registered decreases of 10.3% and 11.8% re-
spectively. In both countries, gas demand was driven by hi-
gher-than-average temperatures in the 1st Quarter, which did
not support demand, while in the 2nd Quarter the lockdown
measures adopted in response to the COVID-19 pandemic
and the closure of all industrial activities and services sup-
pressed demand even further.
Natural gas demand in Italy
2nd Quarter Millions of m3 1st Half
2020 2019 Change 2020 2019 Change
4 5 (1) -20.0%Distribution networks 17 19 (2) -10.5%
3 3 - - Industry 6 7 (1) -14.3%
5 6 (1) -16.7%Thermal generation 11 12 (1) -8.3%
- - - - Other (1) 1 1 - -
12 14 (2) -14.3% Total 35 39 (4) -10.3%
(1) Includes other consumption and losses.Source: Enel based on data from the Ministry for Economic Development and Snam Rete Gas.
Natural gas demand in Italy in the 1st Half of 2020 amounted
to 35 million cubic meters, a decrease of 10.3% on the same
period of 2019. The decrease was generalized across all sec-
tors owing to warmer temperatures than last year and the
slowdown in economic activity, which reduced industrial de-
mand by 14.3% and that for distribution networks by 10.5%.
Reference scenario

20 Half-Year Financial Report at June 30, 2020
Risk management
Due to the nature of its business, the Group is exposed to a
variety of risks, notably financial risks, industrial and environ-
mental risks, strategic risk connected with the evolution of
markets and risks connected with sustainability and climate
change.
In order to effectively deal with such risks, Enel has adopt-
ed an internal control and risk management system (ICRMS).
This system is the set of rules, procedures, and organization-
al structures aimed at identifying, measuring, monitoring and
managing the main risks applicable to the Group.
The Board of Directors performs a policy-setting role and is
committed to developing guidelines to ensure that decisions
at all levels of the Group are made in an informed manner
consistent with the associated risks (including those connect-
ed with climate change). To this end, the Board draws on the
expertise of the Control and Risk Committee, which issues
prior opinions on a variety of matters, including the guidelines
of the ICRMS.
The Group also has specific internal committees composed
of senior management personnel that are responsible for
governing and overseeing risk management, monitoring and
control.
The following discusses the main types of risks facing the
Group.
Country riskBy now, more than 50% of the Enel Group’s total revenue
is generated abroad. The substantial internationalization of
the Group – which among other regions operates in South
America, North America, Africa and Russia – requires Enel to
consider and assess country risk, which consists of the mac-
roeconomic, financial, regulatory, market, social and geopolit-
ical risks whose manifestation could have an adverse impact
on income or threaten corporate assets. Enel has therefore
adopted a model for assessing country risk in the countries
in which it operates. In order to mitigate country risk, the
model supports capital allocation and investment evaluation
processes.
In the 1st Half of 2020, the global economy, due to the out-
break of the COVID-19 pandemic, contracted by about 5%
on an annual basis, with economic, political and health risks
linked to the evolution of the virus and the related political
responses.
The global recession, in Europe as elsewhere in the world,
has led to a significant increase in sovereign debt, which in
this initial phase appears to have been supported by the Cen-
tral Bank and the European Commission, although the risks
associated with the lack of approval of the announced support
measures remain substantial. A reduction in the securities
purchase programs of the ECB (PEPP and APP) starting from
the 3rd Quarter of next year, and any delays in the disburse-
ment of grants under the Recovery Plan to the peripheral
countries connected with more complex governance arrange-
ments could compromise the prospects for recovery and the
stability of the countries in which Enel operates in Europe.
Considering the economic and political environment, the
threat that the implementation of additional protectionist pol-
icies could further impact world trade as well as the emer-
gence of new tensions between the United States and China
should not be overlooked.
Brazil and Argentina, which are among the countries analyzed
in the model, present economic and socio-political risk factors
that must be considered. Argentina experienced a deep re-
cession in the 1st Half of the year, after having given positive
signs of recovery before the spread of the pandemic, which
still seems to have no end. Further risk factors are linked to
inflation, which remains very high (well above 40% year on
year), an unstable currency vulnerable to international con-
tagion and a growing debt due to the response measures
implemented by the government to support the economy.
Again on the debt front, negotiations between the Argentine
government and international creditors have stalled over the
conditions for restructuring debt worth $65 billion. The final
deadline for accepting the offer of the Argentine government
is August 4, but the parties are still far apart. Another default,
the ninth in Argentinian history, cannot be ruled out.

21
Conden
sed inte
rim
conso
lidat
ed fi
nan
cial
sta
tem
ents
Inte
rim
rep
ort
on o
per
atio
ns
Brazil, currently the second country in the world by number
of infected people after the United States and second in
terms of the number of deaths (with both indicators still ris-
ing steeply, outpacing all other countries in the world), risks
a sharp deterioration in its fiscal position (with an expected
deficit above 10% of GDP, and a debt level around 90%), con-
sequently threatening the sustainability of the public finances
and the country’s growth potential in the medium term. The
current climate of political uncertainty could also compromise
the achievement of important structural reforms, slowing the
path of recovery.
Regulatory risks The Group operates in regulated markets, and changes in the
rules governing operations in such systems, and the associat-
ed instructions and requirements with which the Group must
comply, impact our operations and performance.
In order to mitigate the risks that regulatory factors can en-
gender, Enel has forged closer relationships with local gov-
ernment and regulatory bodies, adopting a transparent, col-
laborative and proactive approach in tackling and eliminating
sources of instability in regulatory arrangements.
Financial risksAs part of its operations, Enel is exposed to a variety of fi-
nancial risks that, if not appropriately mitigated, can directly
impact our performance. These include commodity risk, ex-
change rate risk, interest rate risk, credit risk and liquidity risk.
The financial risk governance arrangements adopted by Enel
establish specific internal committees, composed of top man-
agement and chaired by the Chief Executive Officers of the
companies involved (including Enel SpA), which are responsi-
ble for policy setting and supervision of risk management, as
well as the definition and application of specific policies at the
Group and individual Region, Country and Global Business
Line levels that establish the roles and responsibilities for risk
management, monitoring and control processes, ensuring
compliance with the principle of organizational separation of
units responsible for operations and those in charge of moni-
toring and managing risk.
The financial risk governance system also defines a system of
operating limits at the Group and individual Region, Country
and Global Business Line levels for each risk, which are mon-
itored periodically by risk management units. For the Group,
the system of limits constitutes a decision-making tool to
achieve its objectives.
Risk management

22 Half-Year Financial Report at June 30, 2020
Commodity risk
Enel operates in energy markets and for this reason is exposed to changes in the prices of fuel and
electricity, which can have a significant impact on results if not managed effectively.
To mitigate this exposure, the Group has developed a strategy of stabilizing margins by contracting for
supplies of fuel and the delivery of electricity to end users or wholesalers in advance.
Enel has also implemented a formal procedure that provides for the measurement of the residual
commodity risk, the specification of a ceiling for maximum acceptable risk and the implementation
of a hedging strategy using derivatives on regulated markets and over-the-counter (OTC) markets. The
commodity risk control process limits the impact of unexpected changes in market prices on margins
and, at the same time, ensures an adequate margin of flexibility that makes it possible to seize short-
term opportunities.
In order to mitigate the risk of interruptions in fuel supplies, the Group has diversified fuel sources,
using suppliers from different geographical areas.
Thanks to the mitigation strategies it has adopted, the Group was able to minimize the effects of
commodity price volatility on the results for the 1st Half of 2020.
The risk of changes in commodity prices is mainly associated with the purchase and sale of electricity
and fuels at variable prices (e.g. indexed bilateral contracts and transactions on the spot electricity
market, etc.).
The exposures in respect of indexed contracts are quantified by breaking down the contracts that
generate exposure into the underlying risk factors.
As regards electricity sold by the Group, Enel uses fixed-price contracts in the form of bilateral physical
contracts and financial contracts (e.g. contracts for differences, VPP contracts, etc.) in which differences
are paid to the counterparty if the market electricity price exceeds the strike price and to Enel in the
opposite case.
The residual exposure in respect of the sale of energy on the spot market not hedged with such
contracts is aggregated on the basis of uniform risk factors that can be hedged in the market. For
industrial portfolios, proxy hedging techniques have been adopted where the hedge instruments for the
specific risk factors that generate the exposure are not available on the market or are not sufficiently
liquid. In addition, Enel also uses portfolio hedging techniques to assess netting opportunities among
intercompany exposures.
The hedging instruments used by the Group are largely plain vanilla derivatives (specifically, forwards,
swaps, commodity options, futures, contracts for differences).
Enel also engages in proprietary trading in order to maintain a presence in the Group’s reference
energy commodity markets. These operations consist in taking on exposures in energy commodities
(oil products, gas, coal, CO2 certificates and electricity) using financial derivatives and physical contracts
traded on regulated and OTC markets, optimizing profit thanks to transactions conducted on the basis
of expected market developments.

23
Conden
sed inte
rim
conso
lidat
ed fi
nan
cial
sta
tem
ents
Inte
rim
rep
ort
on o
per
atio
ns
Exchange rate risk
In view of their geographical diversification, access to international markets for the issuance of debt
instruments and transactions in commodities, Group companies are exposed to the risk that changes
in exchange rates between the currency of account and other currencies could generate unexpected
changes in the performance and financial aggregates in their respective financial statements.
Given the current structure of Enel, the exposure to exchange rate risk is mainly linked to the US dollar
and is attributable to:
> cash flows in respect of the purchase or sale of fuel or electricity;
> cash flows in respect of investments, dividends from foreign subsidiaries or the purchase or sale of
equity investments;
> cash flows connected with commercial relationships;
> financial assets and liabilities.
The Group’s consolidated financial statements are also exposed to the exchange rate risk deriving from
the conversion into euros of the items relating to investments in companies whose currency of account
is not the euro (translation risk).
The exchange rate risk management policy is based on systematically hedging the exposures to which
the Group companies are exposed, with the exception of translation risk.
Appropriate operational processes ensure the definition and implementation of appropriate hedging
strategies, which typically employ financial derivatives obtained on OTC markets.
Risk control through specific processes and indicators enables us to limit possible adverse financial
impacts and, at the same time, to optimize the management of cash flows on the managed portfolios.
During the 1st Half of 2020, exchange rate risk was managed through compliance with the risk
management policies, encountering no difficulties in accessing the derivatives market.
The volatility that characterized the financial markets during the initial phase of the pandemic has in
many cases returned to pre-COVID-19 levels and was offset by risk mitigation actions using derivative
financial instruments.
An analysis of the Group’s financial debt shows that 53% of long-term gross debt (52% at December
31, 2019) is denominated in currencies other than the euro, which declines to 18% (18% at December
31, 2019) taking account of the associated hedging transactions.
The overall exposure of the financial debt of Group companies to exchange rate risk is negligible, taking
account of the share of debt denominated in the currency of account of the Group company holding
the debtor position as well as the effect of any natural hedges of operational flows denominated in a
foreign currency.
At June 30, 2020, assuming a 10% appreciation of the euro against all currencies, all other variables
being equal, shareholders’ equity would have been €3,223 million lower (€2,929 million at December
31, 2019) as a result of the decrease in the net fair value of CFH derivatives on exchange rates.
Conversely, assuming a 10% depreciation of the euro at the same date, all other variables being equal,
shareholders’ equity would have been €3,937 million higher (€3,580 million at December 31, 2019) as a
result of the increase in the net fair value of CFH derivatives on exchange rates.
Risk management

24 Half-Year Financial Report at June 30, 2020
Interest rate risk
The Group is exposed to the risk that changes in the level of interest rates could produce unexpected
changes in net financial expense or the value of financial assets and liabilities measured at fair value.
The exposure to interest rate risk derives mainly from the variability of the terms of financing, in the
case of new debt, and from the variability of the cash flows in respect of interest on floating-rate debt.
The interest rate risk management policy seeks to contain financial expense and its volatility by
optimizing the Group’s portfolio of financial liabilities and using OTC derivatives.
Risk control through specific processes and indicators enables us to limit possible adverse financial
impacts and, at the same time, to optimize the structure of debt with an adequate degree of flexibility.
The volatility that characterized the financial markets during the initial phase of the pandemic has in
many cases returned to pre-COVID-19 levels and was offset by risk mitigation actions using derivative
financial instruments.
At June 30, 2020, 32% of gross financial debt was floating rate (27% at December 31, 2019). Taking
into account the hedge accounting of interest rates considered effective pursuant to the IFRS-EU, 24%
of the debt was exposed to interest rate risk at June 30, 2020 (20% at December 31, 2019).
If interest rates had been 25 basis points higher at June 30, 2020, all other variables being equal,
shareholders’ equity would have been €147 million higher (€166 million at December 31, 2019) as a
result of the increase in the fair value of CFH derivatives on interest rates. Conversely, if interest rates
had been 25 basis points lower at that date, all other variables being equal, shareholders’ equity would
have been €147 million lower (€166 million at December 31, 2019) as a result of the decrease in the fair
value of CFH derivatives on interest rates.
An equivalent increase (decrease) in interest rates, all other variables being equal, would have a negative
(positive) impact on the income statement in terms of higher (lower) annual interest expense on the
portion of gross debt not hedged against interest rate risk of about €20 million (€21 million at December
31, 2019).

25
Conden
sed inte
rim
conso
lidat
ed fi
nan
cial
sta
tem
ents
Inte
rim
rep
ort
on o
per
atio
ns
Credit risk
The Group’s commercial, commodity and financial operations expose it to credit risk, i.e. the possibility
that a deterioration in the creditworthiness of a counterparty has an adverse impact on the expected
value of the creditor position or, for trade receivables only, increase average collection times.
Accordingly, the exposure to credit risk is attributable to the following types of operations:
> the sale and distribution of electricity and gas in free and regulated markets and the supply of goods
and services (trade receivables);
> trading activities that involve the physical exchange of assets or transactions in financial instruments
(the commodity portfolio);
> trading in derivatives, bank deposits and, more generally, financial instruments (the financial portfo-
lio).
The policy for managing credit risk associated with commercial activities and transactions in commodities
provides for a preliminary assessment of the creditworthiness of counterparties and the adoption of
mitigation instruments, such as obtaining guarantees.
The control process based on specific risk indicators and, where possible, limits ensures that the
economic and financial impacts associated with a possible deterioration in credit standing are contained
within sustainable levels. At the same time, this approach preserves the necessary flexibility to optimize
portfolio management.
In addition, the Group undertakes transactions to assign receivables without recourse, which results in
the complete derecognition of the corresponding assets involved in the assignment.
Finally, with regard to financial and commodity transactions, risk mitigation is pursued through the
diversification of the portfolio (giving preference to counterparties with a high credit rating) and the
adoption of specific standardized contractual frameworks that contain risk mitigation clauses (e.g.
netting arrangements) and possibly the exchange of cash collateral.
The deterioration in macroeconomic conditions associated with the COVID-19 emergency has not had a
significant impact on the creditworthiness of our counterparties. The results of specific internal analyses
have shown that there are no significant statistical correlation between the main economic indicators
(GDP, unemployment rate, etc.) and creditworthiness. However, we have found a deterioration in the
collection status of certain customer segments, which was taken into consideration in determining
impairment of trade receivables.
Risk management

26 Half-Year Financial Report at June 30, 2020
Liquidity risk
Liquidity risk is the risk that the Group, while solvent, would not be able to discharge its obligations in
a timely manner or would only be able to do so on unfavorable terms owing to situations of tension or
systemic crises (credit crunches, sovereign debt crises, etc.) or changes in the perception of Group riskiness
by the market.
Among the factors that define the risk perceived by the market, the credit rating assigned to Enel by rating
agencies plays a decisive role, since it influences its ability to access sources of financing and the related
financial terms of that financing. A deterioration in the credit rating could therefore restrict access to the
capital market and/or increase the cost of funding, with consequent negative effects on the performance
and financial situation of the Group.
At June 30, 2020, Enel’s ratings from the rating agencies Moody’s, Standard & Poor’s and Fitch did not
change. Accordingly, at June 30, 2020, Enel’s rating was: (i) “BBB+” with a stable outlook for Standard &
Poor’s; (ii) “A-” with a stable outlook for Fitch; and (iii) “Baa2” with a positive outlook for Moody’s.
Enel’s liquidity risk management policies are designed to maintain a level of liquidity sufficient to meet its
obligations over a specified time horizon without having recourse to additional sources of financing as well
as to maintain a prudential liquidity buffer sufficient to meet unexpected obligations. In addition, in order to
ensure that the Group can discharge its medium and long-term commitments, Enel pursues a borrowing
strategy that provides for a diversified structure of financing sources to which it can turn and a balanced
maturity profile.
In order to manage liquidity efficiently, treasury activities have largely been centralized at the holding
company level, meeting liquidity requirements primarily by drawing on the cash generated by ordinary
operations and managing any cash surpluses appropriately.
In the 1st Half of 2020, the Group carried out bond issues totaling €5 million.
At June 30, 2020, the Enel Group has a total of about €5.9 billion in cash and cash equivalents, as well as
available committed credit lines of €20.6 billion with about €21.6 billion under contract.
In addition, the Group has outstanding commercial paper programs totaling €12.8 billion (€4.5 billion drawn).
Risks connected with human capital The profound transformations of the energy sector, which
has experienced sweeping technological developments, re-
quire companies in the industry to recruit people with new
experience and professional skills, as well as imposing the
need for major cultural and organizational changes. Organi-
zations must move to adopt new, agile and flexible business
models. Policies to enhance diversity and to manage and pro-
mote talent have become key factors for companies that are
managing the transition and have a widespread geographical
presence.
Enel places the people who work for it at the center of its bu-
siness model: the management of human capital is a priority
for which specific objectives have been established. The main
goals include: the development of the digital capabilities and
skills made necessary by the Fourth Industrial Revolution, as
well as the promotion of reskilling and upskilling programs
for employees in order to support the energy transition; the
effective involvement of employees in the pursuit of the cor-
porate purpose, which ensures the achievement of better
results while offering greater satisfaction to our people; the
development of systems for evaluating the working environ-
ment and performance; the dissemination of diversity and in-
clusion policies to all countries in which the Group operates,
as well as instilling an inclusive organizational culture based
on the principles of non-discrimination and equal opportunity,
a key driver in ensuring that everyone can make an effective
contribution. In addition, Enel is developing specific initiatives
to foster the diffusion of agile working methods in business
processes.

27
Conden
sed inte
rim
conso
lidat
ed fi
nan
cial
sta
tem
ents
Inte
rim
rep
ort
on o
per
atio
ns
Risks connected with digital technology
Cyber attacks
The speed of technological developments that constantly generate new challenges, the ever increasing
frequency and intensity of cyber attacks and the attraction of critical infrastructures and strategic
industrial sectors as targets underscore the potential risk that, in extreme cases, the normal operations
of companies could grind to a halt. Cyber attacks have evolved dramatically in recent years: their
number has grown exponentially, as has their complexity and impact, making it increasingly difficult to
promptly identify the source of threats. In the case of the Enel Group, this exposure reflects the many
environments in which it operates (data, industry and people), a circumstance that accompanies the
intrinsic complexity and interconnection of the resources that over the years have been increasingly
integrated into the Group’s daily operating processes.
The Group has adopted a holistic governance approach to cyber security that is applied to all the sectors
of IT (Information Technology), OT (Operational Technology) and IoT (Internet of Things). The framework
is based on the commitment of top management, on global strategic management, on the involvement
of all business areas as well as on the units involved in the design and management of our systems. It
seeks to use cutting edge technologies, to design ad hoc business processes, to strengthen people’s
IT awareness and to implement regulatory requirements for IT security.
In addition, the Group has developed an IT risk management methodology founded on “risk-based”
and “cyber security by design” approaches, thus integrating the analysis of business risks into all
strategic decisions. Enel has also created its own Cyber Emergency Readiness Team (CERT) in order to
proactively respond to any IT security incidents.
Finally, in 2019, the Group also took out an insurance policy for cyber security risks in order to mitigate
IT threats.
All of these measures enabled the Group to respond effectively to a ransomware attack on June 7, 2020
without suffering interruptions of service or normal Group operations with the exception of a slight and
temporary degradation of IT services supporting customer care activities.
Digitalization, IT effectiveness and service continuity
The Group is carrying out a complete digital transformation of how it manages the entire energy value
chain, developing new business models and digitizing its business processes. A consequence of this
digital transformation is that the Group is increasingly exposed to risks related to the functioning of the
IT systems implemented throughout the Company, which could lead to service interruptions or data
losses.
These risks are managed using a series of internal measures developed by the Global Digital Solutions
unit, which is responsible for guiding the Group’s digital transformation. It has set up an internal
control system that introduces control points along the entire IT value chain, enabling us to prevent the
emergence of risks engendered by such issues as the creation of services that do not meet business
needs, the failure to implement adequate security measures and service interruptions. The internal
control system of the Global Digital Solutions unit oversees both the activities performed in-house and
those outsourced to external associates and service providers. Furthermore, Enel is promoting the
dissemination of a digital culture and digital skills within the Group in order to successfully guide the
digital transformation and minimize the associated risks.
Risk management

28 Half-Year Financial Report at June 30, 2020
Risks connected with the protection of personal dataThe collection and processing of personal data represents
one of the biggest challenges in the era of digitalization and
globalization of markets. The Group has taken up this chal-
lenge by accelerating the digital transformation process while
rapidly expanding the number of customers and geographical
scope of operations at the global level. This naturally increas-
es our exposure to the risks connected with the protection
of personal data, an issue that must also take account of the
substantial growth in privacy legislation: implementing these
regulations inappropriately can cause financial losses and rep-
utational harm.
In order to manage and mitigate this risk, Enel has adopted
a structure designed to fully protect the personal data of all
the individuals with whom we interact. This effort is sustained
by our Data Protection Officers, who are responsible for sup-
porting the business areas in the adoption of a “privacy by
design” approach, in which the protection of personal data
is a key element of the design of any initiative or business
process.
Environmental risksLast year saw the continuation of the growth in the sensitiv-
ity of the entire community to risks connected with develop-
ment models that generate environmental impacts and ex-
ploit scarce natural resources (including many raw materials
and water).
In response to these needs, governments have imposed in-
creasingly restrictive environmental regulations, placing ever
more stringent constraints on the development of new indus-
trial initiatives and, in the most impactful industries, incentiv-
izing or requiring the elimination of technologies no longer
considered sustainable.
In this context, companies in every sector, and above all in-
dustry leaders, are ever more aware that environmental risks
are increasingly economic risks. As a result, they are called
upon to increase their commitment and accountability for
developing and adopting innovative and sustainable technical
solutions and development models.
Enel has made the effective prevention and minimization of
environmental impacts and risks a foundational element of
each project across its entire life cycle.
The adoption of ISO 14001-certified environmental manage-
ment systems across the entire Group ensures the imple-
mentation of structured policies and procedures to identify
and manage the environmental risks and opportunities asso-
ciated with all corporate activities.
Also contributing are the multitude of actions to achieve
the challenging environmental improvement objectives set
by Enel, such as, for example, those regarding atmospheric
emissions, waste production and water consumption, espe-
cially in areas with high water stress.
The risk of water scarcity is directly mitigated by Enel’s devel-
opment strategy, which is based on the growth of generation
from renewable sources that are essentially not dependent
on the availability of water for their operation. Special atten-
tion is also devoted to assets in areas with a high level of
water stress, in order to develop technological solutions to
reduce consumption.
Finally, ongoing collaboration with local river basin manage-
ment authorities enables us to adopt the most effective
shared strategies for the sustainable management of hydroe-
lectric generation assets.

29
Conden
sed inte
rim
conso
lidat
ed fi
nan
cial
sta
tem
ents
Inte
rim
rep
ort
on o
per
atio
ns
Significant events in the 1st Half of 2020
Significant events in the 1st Half of 2020
Fortaleza - BrazilPetroleo Brasileiro SA - Petrobras, the gas supplier for the For-
taleza plant (Central Geradora Termelétrica Fortaleza or CGTF) in
Brazil, has notified its intention to terminate the contract signed
in 2003 between those parties on the basis of an alleged financial
imbalance in consideration of current market conditions.
Accordingly, on January 27, 2020, Petrobras filed two different
types of extraordinary appeal before, respectively, the Supreme
Court and the Federal Court of Brasilia, which are currently pend-
ing, in order to contest the precautionary measures taken by the
courts in favor of CGTF.
Endesa industrial relationsAfter a series of meetings of the Comisión Negociadora del V
Convenio Colectivo Marco de Endesa (Comisión Negociadora)
which began in October 2017 and continued throughout 2018,
in view of the impossibility of reaching an agreement, Endesa
notified the workers and their union representatives that, with
effect from January 1, 2019, the 4th Endesa Collective Bargaining
Agreement must be considered terminated in the same way as
the “framework guarantee contract” and the “agreement on vol-
untary measures to suspend or terminate employment contracts
in the period 2013-2018”, applying from that date the provisions
of general labor law, as well as the legal criteria established in
the matter.
Despite the resumption of negotiations within the Comisión
Negociadora in February 2019, the interpretative differences be-
tween Endesa and the trade union representatives concerning
the effects of the termination of the 4th Endesa Collective Bar-
gaining Agreement with regard to, in particular, the social bene-
fits granted to retired personnel led to the initiation of a suit by
the unions having representation in the company. On March 13,
2019 a hearing was held before the court of first instance, which
on March 26, 2019 issued a ruling in favor of Endesa. The unions
have appealed this decision before the Supreme Court, while the
initial ruling remains provisionally enforceable. On June 19, 2019,
Endesa submitted its defense. In December 2019, Endesa’s larg-
est union agreed to waive its appeal pending before the Supreme
Court to voluntarily participate in an arbitration proceeding before
the Servicio Interconfederal de Mediación y Arbitraje (SIMA) to
resolve the key issues concerning the V Convenio Colectivo Mar-
co de Endesa (5th Endesa Collective Bargaining Agreement). As
a prerequisite to the arbitration proceeding, in December 2019,
Endesa’s largest union had agreed to waive its appeal pending
before the Supreme Court against the judgment of the court of
first instance of March 26, 2019, which was favorable to Ende-
sa, finding that the company’s interpretation was legitimate as
regards the appropriateness of the elimination of certain social
benefits for retired staff as a consequence of the termination of
the 4th Endesa Collective Bargaining Agreement. The other trade
unions had refused to join the arbitration proceeding, electing to
go ahead with the proceedings before the Supreme Court.
On January 21, 2020, the arbitration ruling was issued. It was
then used as the basis for amending the corresponding sections
of the 5th Endesa Collective Bargaining Agreement, which was
subsequently signed by the social partners and took effect on
January 23, 2020. On the same date, Endesa also signed two
further collective bargaining agreements (a “framework guar-
antee contract” and an “agreement on voluntary measures to
suspend or terminate employment contracts”) with all the un-
ions present in the company. On April 1, 2020, three unions
(“Comisiones Obreras”, “SIE” and “CIG”) notified Endesa that
they had appealed the arbitration ruling of January 21, 2020, with
the conciliation hearing being set for June 24, 2020. On June
17, 2020, the 5th Endesa Collective Bargaining Agreement was
published in the Spanish Official Journal (Boletín Oficial del Es-
tado), taking full effect. Therefore, at the conciliation hearing of
June 24, 2020, the three unions that had contested the award of
January 21, 2020 acknowledged that the substance of the award
had been fully incorporated into the 5th Endesa Collective Bar-
gaining Agreement and that the latter took full effect following
its publication, leaving the award without effect. Therefore, the
appeal proceeding against the award had been extinguished and
is no longer pending.
In view of the foregoing, the proceedings before the Supreme

30 Half-Year Financial Report at June 30, 2020
Court continue at the request of the three minority unions that
had initially initiated the action together with the most represent-
ative union.
In parallel, numerous individual actions have been filed by retired
staff and former employees who had agreed to participate in
termination incentive agreements in order to obtain judicial con-
firmation that the termination of the 4th Endesa Collective Bar-
gaining Agreement did not affect them. Currently, the majority of
these proceedings have been suspended or are being suspend-
ed, pending the definition of the collective action pending before
the Supreme Court, on whose outcome these proceedings de-
pend.
Brindisi plant - Ash disputeWith regard to the criminal investigation initiated by the Public
Prosecutor’s Office of the Court of Lecce in 2017 concerning the
use of fly ash, in the cement industry, on August 1, 2018, the
Lecce Public Prosecutor lifted its seizure of the plant, with the
termination of the judicial custody/administration of the facility
and the restitution of about €523 million to Enel Produzione.
However, the preliminary investigation is continuing both against
the accused individuals and the company pursuant to Legisla-
tive Decree 231/2001. On October 10, 2018, the Definitive Tech-
nical Report was filed. On December 6, 2018, the investigating
magistrate of the Court of Lecce, at the request of the Public
Prosecutor, scheduled a hearing for January 22, 2019, to receive
testimony from the experts on the report. The investigating mag-
istrate then postponed the hearing until April 15, 2019. Following
this hearing, the experts reiterated the accuracy of the assess-
ment and the non-hazardous nature of the ash produced by the
thermoelectric plant and the possibility of using that ash in the
production of cement.
With a notice communicated on June 7, 2019, the Lecce Public
Prosecutor announced the completion of the preliminary inves-
tigation (pursuant to Article 415-bis of the Code of Criminal Pro-
cedure) in relation to the criminal proceedings in question. On
July 1, 2019, the brief pursuant to Article 415-bis of the Code
of Criminal Procedure was filed jointly by all the defendants, re-
questing that the case against the defendants and the company
be dismissed, given the clear conclusions of the expert testimo-
ny, which fully confirmed the appropriateness of the ash manage-
ment process adopted at the Brindisi plant.
On January 9, 2020, the original notices of the preliminary hear-
ing set for January 29, 2020 were received. Due to a number of
irregularities in the notices, the preliminary hearing was initially
postponed until April 8, 2020; however, owing to the measures
imposed to counter the COVID-19 pandemic, the hearing was
again postponed until June 10, 2020 and then again until Novem-
ber 20, 2020, as a result of the impossibility of conducting the
argument phase with the necessary guarantees provided for in
health and safety guidelines.
Criminal proceedings connected with Pietrafitta plantWith regard to the Pietrafitta thermal generation plant, the Pe-
rugia Public Prosecutor had started an investigation involving a
number of officers of Enel Produzione SpA, as well as certain
third parties who are today owners of the land adjacent to the
plant – formerly Enel’s – on which ash was found. This discovery
was followed by a series of inspections by control entities and
the competent authorities, leading on September 21, 2018 to the
closure of the investigations and the filing of charges against six
officers of the company and a number of the third-party owners
of the sites under investigation.
The alleged offenses are as follows: failure to restore the site
(Article 452-terdecies of the Italian Criminal Code) for the failure
to restore and recover the areas located in the town of Piega-
ro (Perugia) affected by the spillage of ash produced up to the
1980s by the Pietrafitta power plant (as well as ash from other
company plants), and other areas where contamination with pol-
ychlorinated biphenyls (PCBs) was found associated with min-
ing equipment owned by Enel Produzione SpA and used in the
past for lignite excavation, which had remained deposited on the
third-party sites under investigation; environmental pollution pur-
suant to Article 452-bis of the Italian Criminal Code, for having
caused a “significant and measurable deterioration” in managing
the mining equipment, consisting in the PCB contamination of
the area, with respect to which Enel Produzione SpA was also
charged with administrative liability pursuant to Legislative De-
cree 231/2001.
In the summer of 2019, Enel Produzione SpA filed a petition for
dismissal, which was accepted by the prosecutor for the crime of

31
Conden
sed inte
rim
conso
lidat
ed fi
nan
cial
sta
tem
ents
Inte
rim
rep
ort
on o
per
atio
ns
environmental pollution pursuant to Article 452-bis of the Italian
Criminal Code, with consequent dismissal of the charge pursuant
to Legislative Decree 231/2001.
A number of environmental associations filed an objection to the
dismissal, and on February 21, 2020 a hearing was held before
the investigating magistrate that ended with dismissal of the
charges (May 28, 2020), which, in brief, accepted all of Enel’s de-
fenses and confirmed the dismissal of any other possible charg-
es – even if not brought by the Prosecutor’s Office – relating to
the possible health effects of the presence of the ashes.
Accordingly, the criminal proceedings are continuing with sole
regard to the crime of failure to restore the site, with respect
to which in December 2019 Enel Produzione SpA presented an
application for a stay of proceedings with probation, consisting in
the implementation of a program agreed with the Prosecutor’s
Office for proportionate and fair restoration with respect to the
complaints filed against the defendants. The probation hearing is
set for October 29, 2020.
Funac and the ICMS tax reliefWith Law 20416 of February 5, 2019, the state of Goiás
shortened from January 27, 2015 to April 24, 2012 the period
of operation of the Funac fund (established with Law 17555
of January 20, 2012) and the tax benefit system (created
with Law 19473 of November 3, 2016) that allowed Celg Dis-
tribuição SA - Celg-D (now Enel Distribuição Goiás) to offset
payment obligations in respect of the ICMS - Imposto sobre
Circulação de Mercadorias e Serviços (tax on the circulation of
goods and services). On February 25, 2019, Celg-D appealed
the provisions of Law 20416 before the Court of the state of
Goiás, filing a writ of mandamus and an accompanying peti-
tion for a precautionary suspension, which was denied on a
preliminary basis on February 26, 2019. Celg-D appealed this
ruling and the Court of the state of Goiás allowed the appeal
on June 11, 2019. On October 1, 2019, the Court of the state
of Goiás issued an order revoking the precautionary measure
previously granted in favor of Celg-D and, accordingly, the
effects of the law were restored as from that date. Celg-D
filed an appeal against this decision, claiming that the right to
guarantee tax credits has both a legal and contractual basis
and that, therefore, the actions that the state of Goiás has
taken in order to fully suspend the application of these laws
are patently unfounded. On October 2, 2019, the appeal filed
by Celg-D was denied. On November 21, 2019, Celg-D chal-
lenged this decision before the Superior Tribunal de Justiça
(STJ). On February 27, 2020, the Tribunal de Justiça (TJ) de-
clared inadmissible the appeal by Celg-D, which on May 5,
2020 appealed this decision before the STJ. These proceed-
ings are under way. It is important to note that the coverage
of the Funac fund is provided for in the agreement for the
acquisition of Celg-D by Enel Brasil SA.
On April 26, 2019, Law 20468 was promulgated. With the
law, the state of Goiás fully revoked the tax relief referred to
above. On May 5, 2019, Celg-D filed an ordinary petition and
a request for a precautionary suspension against the state of
Goiás to contest this law. On September 16, 2019, the Court
of the state of Goiás denied the petition for precautionary re-
lief, citing the absence of any danger in delay, a requirement
for the granting of precautionary relief. On September 26,
2019, Celg-D filed an appeal (agravo de instrumento) before
the Court of the state of Goiás against the decision denying
the precautionary suspension, claiming that the repeal of the
tax credit law is unconstitutional to the extent that these cred-
its were established in accordance with applicable law and
constitute acquired rights. The proceeding is under way.
An action for a ruling on constitutionality is currently pending
before the Constitutional Court of Brazil (Supremo Tribunal
Federal) with regard to Laws 20416 and 20468, filed at the
request of the Brazilian association of electricity distribution
companies (ABRADEE). On June 3, 2020, the Brazilian Con-
stitutional Court, in an individual Decision by the judge-rap-
porteur, preliminarily denied the action for lack of formal re-
quirements. On June 24, 2020, the ABRADEE filed an appeal
(agravo regimental) against the decision.
Connection to the grid of São Gonçalo, the largest photovoltaic plant in South America On January 13, 2020 Enel Green Power Brasil Participações Ltda
(EGPB) started operations to connect the 475 MW section of
São Gonçalo photovoltaic plant, located in São Gonçalo do Gur-
guéia, in Brazil’s northeastern state of Piauí, to the grid. The con-
Significant events in the 1st Half of 2020

32 Half-Year Financial Report at June 30, 2020
struction of the 475 MW section of the solar plant involved an
investment of around 1.4 billion Brazilian real, equivalent to ap-
proximately $390 million. Once fully up and running, the 475 MW
section of the plant will be able to generate over 1,200 GWh per
year while avoiding the emission of over 600,000 metric tons of
CO2 into the atmosphere.
Three new wind farms connected to grid in North AmericaOn May 21, 2020, Enel, acting through its US renewables subsid-
iary Enel Green Power North America, began operating a 50 MW
expansion of the High Lonesome wind farm in Upton and Crock-
ett counties, in Texas, increasing the largest operational wind
farm in the Group’s global renewables portfolio to 500 MW. The
company also connected to the grid its 105 MW Riverview and
29.4 MW Castle Rock Ridge II wind farms in Alberta, Canada.
The investment in the construction of the High Lonesome wind
farm in Texas amounts to around $720 million, while the total
investment for the two Canadian projects amounts to over 210
million Canadian dollars.
Enel increases its stake in Enel Américas up to 65%On May 28, 2020, Enel increased its shareholding in its Chilean
subsidiary Enel Américas SA (Enel Américas) to 62.3% following
settlement of two share swap transactions entered into in June
2019 with a financial institution for the acquisition of up to 5% of
the share capital of Enel Américas.
Consistent with the Enel Group’s objective announced to inves-
tors of reducing the presence of minority shareholders in the
Group’s South American companies, Enel also entered into two
new share swap transactions with a financial institution that en-
able Enel to acquire, on dates that are expected to occur by the
end of 2020, additional shares of Enel Américas’ common stock
and American Depositary Shares (ADSs), up to an additional
2.7%, which would bring Enel’s stake to 65%.
Early closure of Unit 2 of the Brindisi plant is authorizedOn May 28, 2020, Italy’s Ministry of Economic Development
gave Enel the green light for the early closure of Unit 2 of the Fed-
erico II thermal power plant in Brindisi as from January 1, 2021,
following the company’s request presented in January 2020. This
is the first of the plant’s four coal-fired generation units set to be
closed definitively. In line with Enel’s strategy to decarbonize its
electricity generation mix and with the objectives of Italy’s Inte-
grated National Energy and Climate Plan, in recent months the
company has started the permitting process for the conversion
of the site into a high efficiency gas-fired plant. This process is
necessary to ensure the complete closure of the Brindisi coal
plant by 2025, while also guaranteeing the security of the nation-
al electricity grid. In addition, Enel is developing projects for the
installation of photovoltaic capacity within the site, as part of the
broader development initiative for the installation of new renew-
ables capacity throughout Italy.
The early closure of Unit 2 of the Federico II plant in Brindisi is
part of Enel’s commitment to the energy transition towards an
increasingly sustainable model.

33
Conden
sed inte
rim
conso
lidat
ed fi
nan
cial
sta
tem
ents
Inte
rim
rep
ort
on o
per
atio
ns
The Enel Group accelerates the closure of its last coal plant in ChileIn line with its decarbonization strategy, the Enel Group expects
to close Unit I of the Bocamina plant by December 31, 2020
and Unit II of the same plant by May 31, 2022, simultaneously
planning the completion of 2 GW of renewables capacity in the
country through Enel Green Power Chile. More specifically, on
May 28, 2020 Enel SpA (“Enel”) announced that its Chilean sub-
sidiaries Enel Chile SA (“Enel Chile”) and Enel Generación Chile
SA (“Enel Generación Chile”) had informed the market of the
decision of their respective Boards of Directors to expedite the
closure of the Bocamina coal-fired plant located in Coronel. Spe-
cifically, Enel Generación Chile will ask the Chilean National Ener-
gy Commission (CNE) to authorize the termination of operations
at Unit I (128 MW) and II (350 MW) of the plant by the scheduled
dates. The closure, which is subject to that authorization, has
been accelerated compared with the original plans of Enel Gen-
eración Chile in the national decarbonization plan signed with the
Ministry of Energy of Chile on June 4, 2019, a plan that provided
for the closure of Bocamina I by the end of 2023 and of Bocamina
II by 2040. The Enel Group will ensure the re-employment of the
workers at Bocamina within the Group, and at the same time will
evaluate the possible conversion of the plant’s structures.
Enel Board authorizes the issue of hybrid bonds in the maximum amount of €1.5 billionOn June 10, 2020, the Board of Directors of Enel SpA (“Enel”
or the “Company”), meeting under the chairmanship of Michele
Crisostomo, authorized the issue by Enel, by December 31,
2021, of one or more hybrid non-convertible subordinated bonds
in the maximum amount of €1.5 billion, to be placed exclusive-
ly with EU and non-EU institutional investors, including through
private placements. The new issues are intended to refinance
outstanding hybrid bonds for which early repayment options may
be exercised as from this year, thus allowing the Enel Group to
maintain a financial structure that is consistent with the assess-
ment criteria of rating agencies and to actively manage maturities
and the cost of debt.
The Board of Directors has also delegated the Chief Executive
Officer with the task of deciding the issue of the new bonds
and their respective characteristics, and therefore to establish,
for each issue, times, amount, currency, interest rate and further
terms and conditions, as well as placement methods and any list-
ing on regulated markets or multilateral trading facilities, taking
account of developments in market conditions.
Enel included in MSCI ESG Leaders Indexes for the first timeOn June 17, 2020, Enel was included for the first time in the
MSCI ESG Leaders Indexes following the annual review car-
ried out by the leading Environmental, Social and Governance
(ESG) research and index provider MSCI of its sustainability
indexes. This capitalization-weighted index series provides ex-
posure to companies with high ESG performance relative to
their sector peers. In addition, Enel has been confirmed in the
prestigious FTSE4Good Index series and Euronext Vigeo-Eiris
120 indexes.
The indexes, designed for institutional investors willing to in-
tegrate ESG factors into investment decision processes, uses
a best-in-class approach by only selecting companies with
the highest MSCI ESG ratings, which measure a company’s
resilience to long-term, financially-relevant ESG risks. In 2019
Enel received for the first time the highest MSCI ESG rating
(“AAA”), paving the way for the Company’s inclusion this year in
the MSCI ESG Leaders Indexes, the most prestigious among
MSCI’s index series measuring companies’ sustainability per-
formance. In addition, the inclusion is attributable to Enel’s con-
tinued investments in renewables and to its ambitious carbon
emissions reduction target aligned with the Paris Agreement,
under which the Company commits to a 70% reduction in its
direct greenhouse gas emissions per kWh by 2030 with re-
spect to 2017 levels.
Enel’s sustainability leadership is also extended to other listed
Enel Group companies, such as its Spanish subsidiary Endesa,
Significant events in the 1st Half of 2020

34 Half-Year Financial Report at June 30, 2020
which renewed its position in the FTSE4Good index and in all the
three indexes of Vigeo-Eiris. In addition, Enel Américas and Enel
Chile, Enel subsidiaries operating in Latin America, were also
confirmed in the FTSE4Good Index series.
Enel Green Power starts construction on expansion of Cimarron Bend wind farm in the United StatesOn June 18, 2020, Enel Green Power started construction on
the 199 MW expansion of the Cimarron Bend wind farm in Clark
County, Kansas. The expansion, consisting of 74 turbines, will re-
quire an investment of more than $281 million and will increase
the wind farm’s capacity to 599 MW from the current 400 MW,
making it the largest wind farm in Enel’s North American portfo-
lio. Construction is expected to be completed by the end of 2020.
The electricity is being sold under a 150 MW power purchase
agreement (PPA) with Evergy and a 30 MW PPA with the Mis-
souri Public Utility Alliance (MPUA).
COVID-19The novel coronavirus (COVID-19) epidemic began in Wuhan, Chi-
na, and was first reported by national authorities to the World
Health Organization on December 30, 2019.
In the early weeks of 2020, despite the considerable concern ex-
pressed by international organizations, the epidemic appeared to
be limited to certain areas of Southeast Asia and the Middle East,
affecting only a number of regions in China, South Korea and Iran.
In the 2nd Half of February, the first sporadic full-blown cases of
COVID-19 in Italy started a second phase of the epidemic, with a
rapid escalation of its spread throughout Europe.
The World Health Organization declared that the health emer-
gency linked to COVID-19 has risen to the level of a pandemic
and, just over two months after its initial reporting, the number
of cases identified outside China exceeded those reported within
the country in which the epidemic first occurred. This is due to
the growing spread of the virus in Europe, where Italy and Spain
have the largest number of infections, and the rapid growth of
cases in the United States, as well as the spread of the first hot
spots in Latin America and Africa.
To contain the effects of the disease, pending medical trials to
develop a vaccine that can be administered to humans, govern-
ments have adopted numerous containment measures, essen-
tially intended to restrict the free movement of people. In the
2nd Quarter of 2020, the European countries gradually eased
restrictions as the virus was progressively contained, although at
the same time other countries (especially the United States and
the South American nations) have seen the situation deteriorate,
prompting them to adopt more restrictive measures at the local
level.
Already during the 1st Quarter, the Group had issued guidelines
aimed at ensuring compliance with the measures introduced at
the local level and taken numerous steps to adopt the most suit-
able procedures to prevent and/or mitigate the effects of conta-
gion in the workplace.
In particular, business continuity is managed thanks above all to:
> the use of smart working for all employees whose jobs can
be done remotely in the countries where the Group has
its largest presences, an approach introduced some years
ago that, thanks to investments in digitalization, allows our
people to work remotely at the same level of efficiency and
effectiveness;
> the use of digitalized infrastructures, which ensure the
normal operation of our generation assets, the continuity
of electricity service and the remote management of all
activities relating to the market and our relationship with
customers.
An Enel Global Task Force is also operational at the Country lev-
el, which is charged with coordinating and directing the actions
to be undertaken in the countries where the Group operates, in
synergy with the global technological business lines.

35
Conden
sed inte
rim
conso
lidat
ed fi
nan
cial
sta
tem
ents
Inte
rim
rep
ort
on o
per
atio
ns
Auditing of figures for the 2nd Quarter of 2020 and 2019
The figures in this Half-Year Financial Report concerning the
2nd Quarter of 2020, which are compared with the corre-
sponding figures for the 2nd Quarter of 2019, did not under-
go an audit or limited review.
Auditing of figures for the 2nd Quarter of 2020 and 2019

36 Half-Year Financial Report at June 30, 2020

37
Conden
sed inte
rim
conso
lidat
ed fi
nan
cial
sta
tem
ents
Inte
rim
rep
ort
on o
per
atio
ns
Group performance and operations
The operations and performance of the Group are discussed below.
Operations
1st Half
SDG 2020 2019 Change
Net electricity generation (TWh) 97.6 112.9 (15.3)
of which:
7 - renewable (TWh) 51.1 47.1 4.0
Total net efficient installed capacity (GW) 82.7 84.3 (1) (1.6)
7 Net efficient installed renewable capacity (GW)) 42.9 42.1 (1) 0.8
7 Net efficient installed renewable capacity (%) 51.9% 50.0% (1) -
7 Additional efficient installed renewable capacity (GW) 0.76 0.76 -
9 Electricity transported on Enel’s distribution grid (TWh) (2) 228.7 249.5 (20.8)
9 End users with active smart meters (no.) 44,736,784 44,165,543 571,241
9 Electricity distribution and transmission grid (km) 2,236,038 2,230,029 (1) 6,009
End users (no.) (3) 74,035,488 73,718,567 316,921
Electricity sold by Enel (TWh) (4) 145.0 158.1 (13.1)
Gas sold to end users (billions of m3) 5.3 6.0 (0.7)
Retail customers (no.) (3) 70,013,654 71,019,124 (1,005,470)
- of which free market 23,139,223 22,477,894 661,329
11 Demand response capacity (MW) 6,128 6,023 105
11 Charging points (no.) 89,301 63,352 25,949
11 Storage (MW) (5) 110.0 110.0 (1) -
(1) At December 31, 2019.(2) The figures for 2019 reflect a more accurate calculation of quantities transported.(3) The figures for 2019 reflect a more accurate calculation of the numbers.(4) Volumes include sales to large customers by generation companies in Latin America. The 2019 figure has been adjusted to ensure comparability.(5) The figure includes 14 MW of storage ready for connection to the grid in Peru.
Net electricity generation in the 1st Half of 2020 de-
creased by 15.3 TWh compared with the same period of 2019
(-13.6%). The decline reflected a contraction in thermal gener-
ation (-18.8 TWh), mainly due to a reduction on coal-fired out-
put (-16.0 TWh) in Italy, Spain and Russia, partly offset by an
increase in renewables generation (+4.0 TWh), including +1.9
TWh of wind generation, +1.3 TWh of hydro generation and
+0.8 TWh of solar and geothermal output. Nuclear generation
fell slightly compared with the 1st Half of 2019 (-0.5 TWh).
Group performance and operations

38 Half-Year Financial Report at June 30, 2020
Hydroelectric33.0%
Wind12.3%
Geothermaland other 1.0%
Solar3.7%
Nuclear plants3.9%
Combined-cycle plants 17.8%
Fuel-oil and turbo-gas plants 14.5%
Coal-fired plants13.8%
Hydroelectric33.7%
Wind12.9%
Geothermaland other 1.1%
Solar4.2%
Combined-cycle plants 18.1%
Fuel-oil and turbo-gas plants 14.3%
Coal-fired plants11.7%
Nuclear plants4.0%
Total 82.7 GWh
Total renewable sources 51.9% Total traditional sources 48.1%
Total 84.3 GW
Total renewable sources 50.0% Total traditional sources 50.0%
Net efficient installed capacity by source at June 30, 2020
At June 30, 2020
At Dec. 31, 2019
Hydroelectric25.9%
Wind11.3%
Geothermaland other 2.7%
Solar1.8%
Nuclear plants11.7%
Combined-cycle plants 17.8%
Fuel-oil and turbo-gas plants 9.2%
Coal-fired plants19.6%
Total 112.9 TWh
Hydroelectric31.3%
Wind15.1%
Geothermaland other 3.2%
Solar2.8%
Combined-cycle plants19.5%
Fuel-oil and turbo-gas plants 8.9%
Coal-fired plants 6.3%
Nuclear plants12.9%
1st Half 2020 Total 97.6 TWh
Total renewable sources 52.4% Total traditional sources 47.6%
Total renewable sources 41.7% Total traditional sources 58.3%
1st Half 2019
Net electricity generation by source in the 1st Half of 2020
Enel’s total net efficient installed capacity decreased by 1.6 GW in the 1st Half of 2020, mainly reflecting the closure of 2.1
GW of coal-fired plants in Spain.
Idroelettrico33,0%
Eolico12,3%
Geotermicoe altro 1,0%
Solare3,7%
Nucleare3,9%
Ciclo combinato17,8%
Olio combustibilee turbogas 14,5%
Carbone13,8%
Idroelettrico32,9%
Eolico12,4%
Geotermicoe altro 1,0%
Solare3,9%
Ciclo combinato17,7%
Olio combustibilee turbogas 14,4%
Carbone13,8%
Nucleare3,9%
Totale 84,7 GWh
Totale fonti rinnovabili 50,2% Totale fonti tradizionali 49,8%
Totale 84,3 GW
Totale fonti rinnovabili 50,0% Totale fonti tradizionali 50,0%
Potenza efficiente netta installata (%)
1° trim. 2020
1° trim. 2019
Idroelettrico23,5%
Eolico10,6%
Geotermicoe altro 2,6%
Solare1,8%
Nucleare12,0%
Ciclo combinato17,6%
Olio combustibilee turbogas 9,0%
Carbone22,9%
Totale 59,1 TWh
Idroelettrico29,6%
Eolico14,5%
Geotermicoe altro 3,1%
Solare2,4%
Ciclo combinato21,8%
Olio combustibilee turbogas 9,1%
Carbone5,5%
Nucleare14,0%
1° trim. 2020 Totale 51,4 TWh
Totale fonti rinnovabili 49,6% Totale fonti tradizionali 50,4%
Totale fonti rinnovabili 38,5% Totale fonti tradizionali 61,5%
1° trim. 2019
Produzione netta di energia elettrica (%)
Hydroelectric33.0%
Wind12.3%
Geothermaland other 1.0%
Solar3.7%
Nuclear plants3.9%
Combined-cycle plants 17.8%
Fuel-oil and turbo-gas plants 14.5%
Coal-fired plants13.8%
Hydroelectric33.7%
Wind12.9%
Geothermaland other 1.1%
Solar4.2%
Combined-cycle plants 18.1%
Fuel-oil and turbo-gas plants 14.3%
Coal-fired plants11.7%
Nuclear plants4.0%
Total 82.7 GWh
Total renewable sources 51.9% Total traditional sources 48.1%
Total 84.3 GW
Total renewable sources 50.0% Total traditional sources 50.0%
Net efficient installed capacity by source at June 30, 2020
At June 30, 2020
At Dec. 31, 2019
Hydroelectric25.9%
Wind11.3%
Geothermaland other 2.7%
Solar1.8%
Nuclear plants11.7%
Combined-cycle plants 17.8%
Fuel-oil and turbo-gas plants 9.2%
Coal-fired plants19.6%
Total 112.9 TWh
Hydroelectric31.3%
Wind15.1%
Geothermaland other 3.2%
Solar2.8%
Combined-cycle plants19.5%
Fuel-oil and turbo-gas plants 8.9%
Coal-fired plants 6.3%
Nuclear plants12.9%
1st Half 2020 Total 97.6 TWh
Total renewable sources 52.4% Total traditional sources 47.6%
Total renewable sources 41.7% Total traditional sources 58.3%
1st Half 2019
Net electricity generation by source in the 1st Half of 2020

39
Conden
sed inte
rim
conso
lidat
ed fi
nan
cial
sta
tem
ents
Inte
rim
rep
ort
on o
per
atio
ns
Electricity transported on Enel’s distribution grid in the 1st
Half of 2020 amounted to 228.7 TWh, down 20.8 TWh (-8.3%)
compared with the same period of 2019, mainly in Italy (-12.1
TWh), Spain (-3.6 TWh) and Brazil (-3.2 TWh).
The number of Enel end users with active smart meters
showed an increase of 571,241 in the 1st Half of 2020, mainly
in Spain (+293,829) and Romania (+275,244).
Electricity sold by Enel in the 1st Half of 2020 amounted to
145.0 TWh, a decrease of 13.1 TWh (-8.3%) compared with
the year-earlier period. Quantities sold decreased in Italy (-4.5
TWh), Spain (-4.1 TWh) and Latin America (-4.0 TWh), mainly
in Brazil (-2.3 TWh).
Gas sold in the 1st Half of 2020 amounted to 5.3 billion cubic
meters, with a reduction compared with the same period of 2019,
mainly reflecting a decline in consumption in Italy and Spain.
Enel charging points increased by 25,949 in the 1st Half of
2020 compared with the same period of 2019.
Charging points sold to private citizens posted an increase of
22,457, mainly in North America, while public charging points
increased by 3,492, mainly in Italy.
Group performance
Millions of euro 1st Half
2020 2019 Change
Revenue (1) 33,375 40,967 (7,592) -18.5%
Costs (1) 24,129 31,872 (7,743) -24.3%
Net income/(expense) from commodity risk management (1) (601) (188) (413) -
Gross operating margin 8,645 8,907 (262) -2.9%
Depreciation, amortization and impairment losses 4,102 3,694 408 11.0%
Operating income 4,543 5,213 (670) -12.9%
Financial income 2,084 1,798 286 15.9%
Financial expense 3,203 3,039 164 5.4%
Total net financial income/(expense) (1,119) (1,241) 122 9.8%
Share of income/(losses) from equity investments accounted for using the equity method 13 (85) 98 -
Income before taxes 3,437 3,887 (450) -11.6%
Income taxes 1,034 994 40 4.0%
Net income from continuing operations 2,403 2,893 (490) -16.9%
Net income from discontinued operations - - - -
Net income (Group and non-controlling interests) 2,403 2,893 (490) -16.9%Net income attributable to the shareholders of the Parent Company 1,947 2,215 (268) -12.1%Net income attributable to non-controlling interests 456 678 (222) -32.7%
(1) The figures for the 1st Half of 2019 have been adjusted to take account of the interpretations of the IFRS Interpretations Committee (IFRIC) contained in the Agenda Decision of 2019, which involved changes in the classification, with no impact on margins, of the effects of purchase and sales contracts for commodi-ties measured at fair value through profit or loss (for more details, see note 4 to the condensed interim consolidated financial statements at June 30, 2020).
Group performance and operations

40 Half-Year Financial Report at June 30, 2020
Financial impact of COVID-19In compliance with recent recommendations of ESMA and
CONSOB, the Group has initiated internal analyses to assess
the real and potential impacts of COVID-19 on business activ-
ities, on the financial situation and on performance.
In light of the macroeconomic scenario discussed earlier, the
impact of COVID-19 is most significant for the Business Lines
most closely involved with the market such as End-user Mar-
kets and Enel X, taking account of the fact that they have been
affected by a significant reduction in demand and a general
slowdown in the acquisition of new customers. More spe-
cifically, End-user Markets are affected by the overcontract-
ing of electricity as demand and the related volumes decline,
as well as the slowdown in collections on accounts receiva-
ble, due both to the effects of the crisis and the lockdowns
that affected the timeliness of payments and the practices
adopted in certain countries that suspended the possibility
of cutting off electricity supply to defaulting customers. Enel
X, on the other hand, has experienced a general slowdown in
the development of its portfolio of new businesses, even if a
positive rebound is expected, especially in Italy, in light of the
measures adopted by the government to encourage the reviv-
al of economic activity. The other Business Lines have been
affected by a reduction in demand and a slight slowdown in
investment activities due to lockdowns.
Bearing in mind the current climate of uncertainty and based
on the best information available to date, the estimated finan-
cial impact of COVID-19 on the gross operating margin, the
ordinary gross operating margin, operating income, ordinary
operating income, Group net income and Group ordinary net
income are reported below. For further information, please
see the discussion in section “COVID-19” of the note 1 to
the condensed interim consolidated financial statements at
June 30, 2020.
Millions of euro Demand COVID costsImpairment of
receivables Total
Gross operating margin (273) (82) - (355)
Operating income (273) (82) (133) (488)
Group net income (108) (52) (59) (219)
Ordinary gross operating margin (273) - - (273)
Ordinary operating income (273) - (133) (140)
Group ordinary net income (108) - (59) (167)
The gross operating margin was affected by the COVID-19
emergency mainly in terms of a decrease of €273 million in
demand for electricity, with a decrease in sales volumes and
the related margins, mainly in End-user Markets of Italy and
Spain and in Distribution in Latin America. This figure was de-
termined by using benchmark prices to measure the reduc-
tion in quantities distributed and sold, as observed during the
peak of the COVID-19 pandemic in the various countries in
which the Group operates.
Another factor impacting the gross operating margin was the
direct cost of the health emergency (€82 million) for work-
place sanitization activities, personal protective equipment
and donations. These costs do not impact the determination
of the ordinary gross operating margin.
At the same time, taking into account the most recent col-
lection status and the results of the valuation model used
to measure the recoverability of receivables, the Group rec-
ognized an increase in impairment losses on receivables of
about €133 million at the marketing companies, in particular
in Italy and Spain.
Taking account of tax effects and minority interests, the over-
all impact of COVID-19 on the Group’s net income at June
30, 2020 was a negative €219 million (€167 million on Group
ordinary net income).

41
Conden
sed inte
rim
conso
lidat
ed fi
nan
cial
sta
tem
ents
Inte
rim
rep
ort
on o
per
atio
ns
Revenue
Millions of euro 1st Half
2020 2019 Change
Sale of electricity (1) 16,699 19,747 (3,048) -15.4%
Transport of electricity 5,177 5,208 (31) -0.6%
Fees from network operators 458 450 8 1.8%
Transfers from institutional market operators 711 789 (78) -9.9%
Sale of gas 1,682 2,482 (800) -32.2%
Transport of gas 353 380 (27) -7.1%
Sale of fuels (1) 301 488 (187) -38.3%
Fees for connection to electricity and gas networks 347 376 (29) -7.7%
Revenue from construction contracts 369 335 34 10.1%
Sale of commodities under contracts with physical delivery (IFRS 9) (1) 5,666 8,468 (2,802) -33.1%
Other revenue (1) 1,612 2,244 (632) -28.2%
Total 33,375 40,967 (7,592) -18.5%
(1) The figures for the 1st Half of 2019 have been adjusted to take account of the interpretations of the IFRS Interpretations Committee (IFRIC) contained in the Agenda Decision of 2019, which involved changes in the classification, with no impact on margins, of the effects of purchase and sales contracts for commodi-ties measured at fair value through profit or loss (for more details, see note 4 to the condensed interim consolidated financial statements at June 30, 2020).
In the 1st Half of 2020 revenue experienced a significant re-
duction due to:
> a decrease in the volume of electricity sold to end users in
Italy (€657 million) and Spain (€700 million);
> a contraction in volumes and average prices applied to sales
in Latin America and the impact of the depreciation of Latin
American currencies against the euro (€841 million);
> a decrease in volumes of gas sales (€800 million), mainly in
in Spain and Italy.
The change also reflected lower revenues from commodities
contracts with physical delivery (IFRS 9), due to the reduction
in volumes handled and prices applied (€2,802 million), par-
tially offset by an increase in revenue from Distribution oper-
ations in Italy as a result of the application of the Regulatory
Authority for Energy, Networks and the Environment (ARERA)
Resolutions nos. 50/2018 and 568/2019 regarding the agree-
ment reached with a trader in bankruptcy proceedings (€156
million) and the increase posted by Enel Green Power North
America as a result of income from tax partnership agree-
ments of €46 million and other revenue of €50 million from
indemnities and disputes.
Revenue in the 1st Half of 2019 included other revenue in
respect of:
> the agreement between Edesur (€246 million, of which
€215 million in respect of the Distribution Business Line and
€31 million for End-user Markets) and the Argentine govern-
ment settling reciprocal disputes originating between 2006
and 2016;
> the gain on the disposal of Mercure Srl (€108 million);
> negative goodwill (€106 million) from the definitive allocation
of the purchase price, performed by independent experts, in
the acquisition by Enel North America (formerly Enel Green
Power North America) of a number of companies sold by
Enel Green Power North America Renewable Energy Part-
ners LLC (EGPNA REP) in the 1st Quarter of 2019;
> the contractual indemnity received following the exercise of
the option to withdraw from an electricity supply contract by
a major industrial customer of Enel Generación Chile (€160
million, of which €80 million pertaining to the Thermal Gen-
eration and Trading Business Line and €80 million pertaining
to the Enel Green Power Business Line);
> the adjustment of the price for the acquisition of eMotorW-
erks in 2017 following application of a number of contractual
clauses (€58 million);
> the fee of €50 million provided for in the agreement reached
by e-distribuzione with F2i and 2i Rete Gas for the early
all-inclusive settlement of the second indemnity connected
with the sale in 2009 of the interest held in Enel Rete Gas.
Group performance and operations

42 Half-Year Financial Report at June 30, 2020
Costs
Millions of euro 1st Half
2020 2019 Change
Electricity purchases (1) 7,260 10,470 (3,210) -30.7%
Consumption of fuel for electricity generation 1,332 2,181 (849) -38.9%
Fuel for trading and gas for sale to end users (1) 5,291 7,841 (2,550) -32.5%
Materials (1) 766 772 (6) -0.8%
Personnel 1,855 2,338 (483) -20.7%
Services, leases and rentals 7,452 7,973 (521) -6.5%
Other operating expenses 1,089 1,315 (226) -17.2%
Capitalized costs (916) (1,018) 102 10.0%
Total 24,129 31,872 (7,743) -24.3%
(1) The figures for the 1st Half of 2019 have been adjusted to take account of the interpretations of the IFRS Interpretations Committee (IFRIC) contained in the Agenda Decision of 2019, which involved changes in the classification, with no impact on margins, of the effects of purchase and sales contracts for commodities measured at fair value through profit or loss (for more details, see note 4 to the condensed interim consolidated financial statements at June 30, 2020).
Gross operating margin
Millions of euro 1st Half
2020 2019 Change
Thermal Generation and Trading 1,001 905 96 10.6%
Enel Green Power 2,291 2,274 17 0.7%
Infrastructure and Networks 3,816 3,971 (155) -3.9%
End-user Markets 1,582 1,661 (79) -4.8%
Enel X 23 72 (49) -68.1%
Services 10 82 (72) -87.8%
Other, eliminations and adjustments (78) (58) (20) -34.5%
Total 8,645 8,907 (262) -2.9%
The gross operating margin amounted to €8,645 million, a
decrease of €262 million (-2.9%) compared with the 1st Half
of 2019.
The decrease in gross operating margin is essentially attrib-
utable to:
> Infrastructure and Networks in the amount of €155 million,
reflecting:
- a decrease in wheeling volumes, especially in Latin
America, as a result of the impact on demand of the
COVID-19 health emergency, as well as adverse ex-
change rate developments in the 1st Half of 2020,
mainly in Brazil (a total of €141 million);
- the recognition in Spain of greater provisions for the
Plan de Salida on the basis of the changes made with
the “agreement on voluntary measures to suspend or
terminate employment contracts” (€91 million net of
additional updates in the period);
- the negative impact of the application of the new regu-
latory framework in Spain;
- the positive effects recognized in 2019 associated with
the Edesur settlement agreement (€215 million) and
the indemnity for the sale of Enel Rete Gas (€50 mil-
lion) noted earlier.
These factors were partly offset by:
- the modification of the electricity discount benefit in
Spain (€269 million) following the signing of the 5th
Endesa Collective Bargaining Agreement, which led to

43
Conden
sed inte
rim
conso
lidat
ed fi
nan
cial
sta
tem
ents
Inte
rim
rep
ort
on o
per
atio
ns
the partial reversal of the provision;
- the income of €156 million from the application of AR-
ERA Resolutions nos. 50/2018 and 568/2019 following
an agreement with a trader in bankruptcy proceedings;
> End-user Markets in the amount of €79 million as a result
of the adverse impact on electricity demand of the COV-
ID-19 health emergency, which caused volumes to con-
tract, especially on the free markets in Italy and Spain in
business-to-business transactions, and the effect of the in-
demnity received in the 1st Half of 2019 from Edesur (€31
million). These effects were partly offset by a reduction in
the provisioning costs of commodities, primarily in Spain;
> Enel X, where operating improvements despite the effects
of the pandemic were more than offset by the effect of the
recognition in 2019 of an indemnity of €58 million received
in application of contractual clauses connected with the
disposal of eMotorWerks.
These reductions were partly offset by increases at:
> Enel Green Power (€17 million), mainly due to:
- an improvement in the gross operating margin in Italy
(€130 million), mainly reflecting the improvement in the
performance of hydroelectric plants;
- an improvement in the gross operating margin in Spain
(€33 million) as a result of the increase in quantities
generated and sold, thanks in part to the greater in-
stalled capacity of wind plants;
- an improvement in the margin in the United States
owing to the entry into service of new wind farms,
an increase in income from tax partnerships (€46
million) and an increase in income from indemnities
and disputes (€50 million), whose overall impact was
partly offset by the recognition the 1st Half of 2019 of
negative goodwill (€106 million) on the acquisition by
Enel North America (formerly Enel Green Power North
America - EGPNA) of a number of companies sold by
Enel Green Power North America Renewable Energy
Partners LLC (EGPNA REP);
- an improvement in the margin in Europe, primarily due
to the entry into service of new wind plants in Greece.
These positive effects were partially offset by the effect of
the recognition in the 1st Half of 2019 of income deriving
from an indemnity for early withdrawal on an electricity
supply contract in Chile (€80 million) and by the lower mar-
gins in Brazil deriving from the sale in 2019 of a number of
wind farms, as well as adverse exchange rate developmen-
ts during the 1st Half of 2020;
> Thermal Generation and Trading, which benefitted from the
positive effects of:
- the modification of the electricity discount benefit net
of the provision for voluntary early termination incen-
tives in Spain (€165 million);
- a decrease in costs for fuels in Spain (€131 million),
mainly reflecting the decline in the spot prices of ener-
gy commodities;
- an improvement in operating efficiency, mainly in Italy
and Spain.
These positive factors were partially offset by:
- writedowns of the fuels and spare parts inventories of
certain plants being decommissioned in Italy (€44 mil-
lion), Chile (€14 million) and Spain (€9 million);
- a decrease in the ordinary gross operating margin in
Russia attributable to the disposal of the Reftinskaya
plant in October 2019;
- an increase of €62 million in taxes, reflecting the tem-
porary suspension for 2019 only of the tax on electric-
ity generation and on fuels used in conventional and
nuclear thermal generation in Spain (Royal Decree Law
15/2018);
- the recognition in the 1st Quarter of 2019 of the income
noted above (€80 million for the indemnity in Chile and
€108 million on the sale of Mercure Srl in Italy).
Group performance and operations
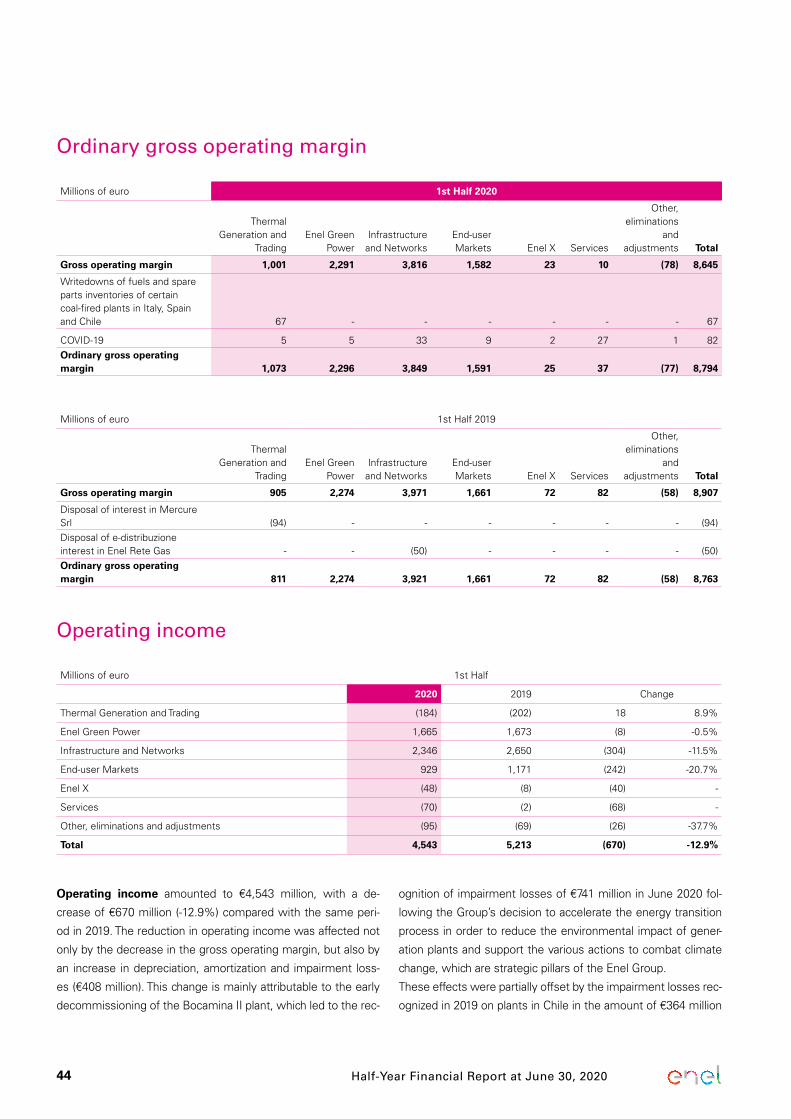
44 Half-Year Financial Report at June 30, 2020
Ordinary gross operating margin
Millions of euro 1st Half 2020
Thermal Generation and
TradingEnel Green
PowerInfrastructure and Networks
End-user Markets Enel X Services
Other, eliminations
and adjustments Total
Gross operating margin 1,001 2,291 3,816 1,582 23 10 (78) 8,645
Writedowns of fuels and spare parts inventories of certain coal-fired plants in Italy, Spain and Chile 67 - - - - - - 67
COVID-19 5 5 33 9 2 27 1 82Ordinary gross operating margin 1,073 2,296 3,849 1,591 25 37 (77) 8,794
Millions of euro 1st Half 2019
Thermal Generation and
TradingEnel Green
PowerInfrastructure and Networks
End-user Markets Enel X Services
Other, eliminations
and adjustments Total
Gross operating margin 905 2,274 3,971 1,661 72 82 (58) 8,907
Disposal of interest in Mercure Srl (94) - - - - - - (94)Disposal of e-distribuzione interest in Enel Rete Gas - - (50) - - - - (50)Ordinary gross operating margin 811 2,274 3,921 1,661 72 82 (58) 8,763
Operating income
Millions of euro 1st Half
2020 2019 Change
Thermal Generation and Trading (184) (202) 18 8.9%
Enel Green Power 1,665 1,673 (8) -0.5%
Infrastructure and Networks 2,346 2,650 (304) -11.5%
End-user Markets 929 1,171 (242) -20.7%
Enel X (48) (8) (40) -
Services (70) (2) (68) -
Other, eliminations and adjustments (95) (69) (26) -37.7%
Total 4,543 5,213 (670) -12.9%
Operating income amounted to €4,543 million, with a de-
crease of €670 million (-12.9%) compared with the same peri-
od in 2019. The reduction in operating income was affected not
only by the decrease in the gross operating margin, but also by
an increase in depreciation, amortization and impairment loss-
es (€408 million). This change is mainly attributable to the early
decommissioning of the Bocamina II plant, which led to the rec-
ognition of impairment losses of €741 million in June 2020 fol-
lowing the Group’s decision to accelerate the energy transition
process in order to reduce the environmental impact of gener-
ation plants and support the various actions to combat climate
change, which are strategic pillars of the Enel Group.
These effects were partially offset by the impairment losses rec-
ognized in 2019 on plants in Chile in the amount of €364 million

45
Conden
sed inte
rim
conso
lidat
ed fi
nan
cial
sta
tem
ents
Inte
rim
rep
ort
on o
per
atio
ns
(Bocamina I and Tarapacá) and in Russia in the amount of €120
million (Reftinskaya), as well as the reduction in depreciation rec-
ognized on coal-fired plants in Italy, Spain, Chile and Russia, on
which impairment losses were recognized in 2019.
Finally, there was an increase of €292 million in writedowns of
receivables, especially in the Distribution segment in Italy, main-
ly following the agreement between e-distribuzione and a trader
(€156 million) for which associated income had been recognized,
as commented above. The remaining increase in writedowns of
receivables (€136 million) was due to the deterioration in the
collection status of certain customer segments, mainly due to
the COVID-19 health emergency, which prompted an update of
the estimates of the recoverability of the receivables.
Ordinary operating income
Millions of euro 1st Half 2020
Thermal Generation and
TradingEnel Green
PowerInfrastructure and Networks
End-user Markets Enel X Services
Other, eliminations
and adjustments Total
Operating income (184) 1,665 2,346 929 (48) (70) (95) 4,543
Writedown of Funac receivable of Enel Distribuição Goiás - - - 6 - - - 6Writedown of CIS Interporto di Nola - 14 - - - - - 14Writedown of fuel and spare parts inventories of certain coal-fired plants in Italy, Spain and Chile 67 - - - - - - 67Writedown of a number of coal-fired plants in Italy, Spain and Chile 743 - - - - - - 743
COVID-19 5 5 33 9 2 27 1 82
Ordinary operating income 631 1,684 2,379 944 (46) (43) (94) 5,455
Millions of euro 1st Half 2019
Thermal Generation and
TradingEnel Green
PowerInfrastructure and Networks
End-user Markets Enel X Services
Other, eliminations
and adjustments Total
Operating income (202) 1,673 2,650 1,171 (8) (2) (69) 5,213
Disposal of interest in Mercure Srl (94) - - - - - - (94)Disposal of e-distribuzione interest in Enel Rete Gas - - (50) - - - - (50)
Writedown of Reftinskaya plant 120 - - - - - - 120
Writedown of coal-fired plants in Chile (Tarapacá and Bocamina I) 364 - - - - - - 364
Ordinary operating income 188 1,673 2,600 1,171 (8) (2) (69) 5,553
Group performance and operations

46 Half-Year Financial Report at June 30, 2020
Group net incomeGroup net income in the 1st Half of 2020 amounted to
€1,947 million, a decrease of €268 million on the €2,215 mil-
lion posted in the same period of the previous year (-12.1%).
The decline is mainly attributable to the decrease in operating
income noted above, as well as an increase in taxes due to
the tax effects recognized in 2019, namely:
> the “revalúo” at a number of generation companies in Ar-
gentina;
> the preferential tax treatment (PEX) applied to the gain on
the disposal of Mercure Srl;
> the reversal of deferred tax liabilities of EGPNA in connec-
tion with the acquisition of a number of companies from
EGPNA REP.
These factors were partly offset by:
> a reduction in net financial expense in Latin America, pri-
marily in Brazil, due to the depreciation of local currencies
against the euro;
> a decrease in charges connected with equity investments
accounted for using the equity method as a result of the
effect recognized in the 1st Quarter of 2019 in connection
with the repurchase of a number of companies from the
EGPNA REP joint venture, which led to the recognition of a
capital loss on EGPNA REP;
> a decrease in non-controlling interests compared with the
1st Half of 2019.
Group ordinary net income
Millions of euro 1st Half
2020 2019
Group net income 1,947 2,215
Writedown of Funac receivable of Enel Distribuição Goiás 3 -
Writedown of certain assets held by Slovak Power Holding BV 22 -
Writedown of CIS Interporto di Nola 9 -
Writedown of a number of coal-fired plants and inventories in Italy, Spain and Chile 372 -
COVID-19 52 -
Disposal of interest in Mercure Srl - (97)
Disposal of e-distribuzione interest in Enel Rete Gas - (49)
Writedown of Reftinskaya plant - 54
Writedown of coal-fired plants in Chile (Tarapacá and Bocamina I) - 154
Group ordinary net income (1) 2,405 2,277
(1) Taking account of taxes and non-controlling interests.
Group ordinary net income amounted to €2,405 million in
the 1st Half of 2020, an increase of €128 million compared
with the €2,277 million posted in the same period of 2019.
The table above reconciles Group net income and Group ordi-
nary net income in the 1st Half of 2020, reporting the extraor-
dinary items and their respective effects on performance, net
of the related tax effects and non-controlling interests.
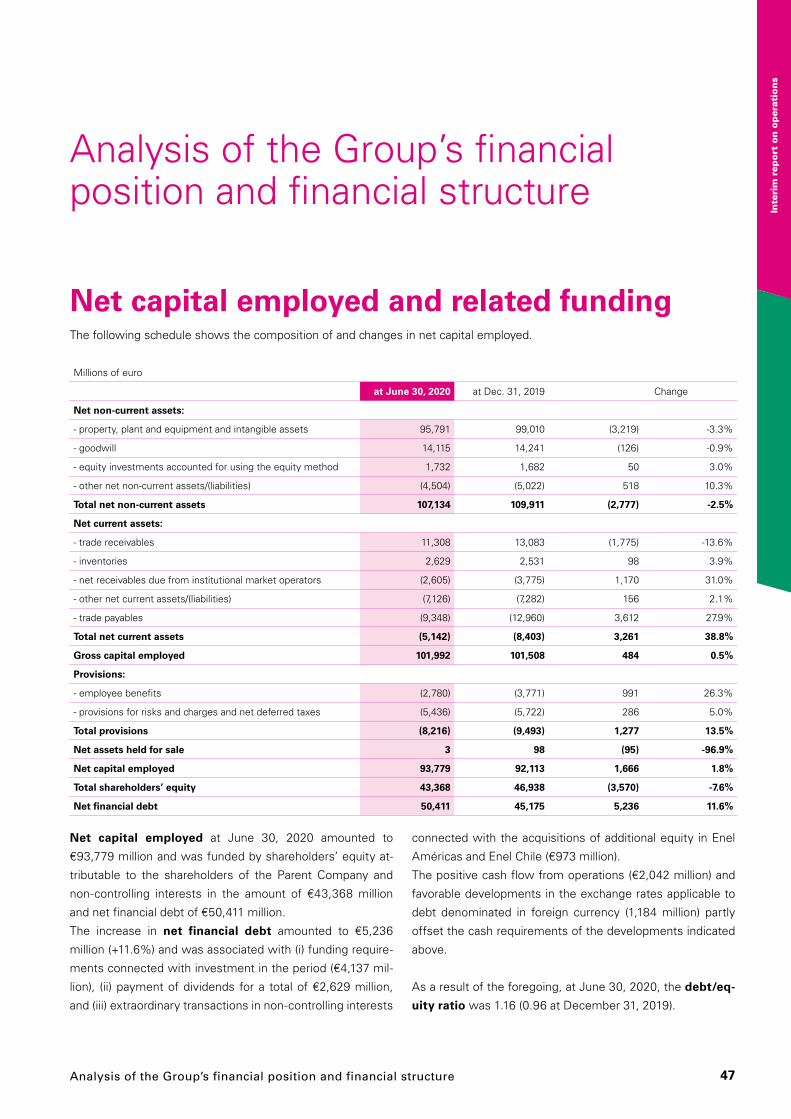
47
Conden
sed inte
rim
conso
lidat
ed fi
nan
cial
sta
tem
ents
Inte
rim
rep
ort
on o
per
atio
ns
Analysis of the Group’s financial position and financial structure
Net capital employed and related funding The following schedule shows the composition of and changes in net capital employed.
Millions of euro
at June 30, 2020 at Dec. 31, 2019 Change
Net non-current assets:
- property, plant and equipment and intangible assets 95,791 99,010 (3,219) -3.3%
- goodwill 14,115 14,241 (126) -0.9%
- equity investments accounted for using the equity method 1,732 1,682 50 3.0%
- other net non-current assets/(liabilities) (4,504) (5,022) 518 10.3%
Total net non-current assets 107,134 109,911 (2,777) -2.5%
Net current assets:
- trade receivables 11,308 13,083 (1,775) -13.6%
- inventories 2,629 2,531 98 3.9%
- net receivables due from institutional market operators (2,605) (3,775) 1,170 31.0%
- other net current assets/(liabilities) (7,126) (7,282) 156 2.1%
- trade payables (9,348) (12,960) 3,612 27.9%
Total net current assets (5,142) (8,403) 3,261 38.8%
Gross capital employed 101,992 101,508 484 0.5%
Provisions:
- employee benefits (2,780) (3,771) 991 26.3%
- provisions for risks and charges and net deferred taxes (5,436) (5,722) 286 5.0%
Total provisions (8,216) (9,493) 1,277 13.5%
Net assets held for sale 3 98 (95) -96.9%
Net capital employed 93,779 92,113 1,666 1.8%
Total shareholders’ equity 43,368 46,938 (3,570) -7.6%
Net financial debt 50,411 45,175 5,236 11.6%
Net capital employed at June 30, 2020 amounted to
€93,779 million and was funded by shareholders’ equity at-
tributable to the shareholders of the Parent Company and
non-controlling interests in the amount of €43,368 million
and net financial debt of €50,411 million.
The increase in net financial debt amounted to €5,236
million (+11.6%) and was associated with (i) funding require-
ments connected with investment in the period (€4,137 mil-
lion), (ii) payment of dividends for a total of €2,629 million,
and (iii) extraordinary transactions in non-controlling interests
connected with the acquisitions of additional equity in Enel
Américas and Enel Chile (€973 million).
The positive cash flow from operations (€2,042 million) and
favorable developments in the exchange rates applicable to
debt denominated in foreign currency (1,184 million) partly
offset the cash requirements of the developments indicated
above.
As a result of the foregoing, at June 30, 2020, the debt/eq-
uity ratio was 1.16 (0.96 at December 31, 2019).
Analysis of the Group’s financial position and financial structure

48 Half-Year Financial Report at June 30, 2020
One notable development was the decrease in property,
plant and equipment and intangible assets associated
with the writedown of the Bocamina II coal-fired plant in
Chile, as well as depreciation and amortization for the pe-
riod and, above all, the adverse developments in exchange
rates in Latin America net of investment for the period. This
decrease in net capital employed was more than offset by
the change in net current assets, reflecting normal devel-
opments in accounts receivable/payable in the COVID-19
environment and the general decline in operating costs, es-
pecially for fuels.
Finally, shareholders’ equity declined in particular as a re-
sult of the dividend distribution and adverse exchange rate
developments, especially in Latin America.
Net financial debtThe Enel Group’s net financial debt and changes in the period are detailed in the table below.
Millions of euro
at June 30, 2020 at Dec. 31, 2019 Change
Long-term debt:
- bank borrowings 8,830 8,407 423 5.0%
- bonds 42,299 43,294 (995) -2.3%
- other borrowings 2,494 2,473 21 0.8%
Long-term debt 53,623 54,174 (551) -1.0%
Long-term financial receivables and securities (3,166) (3,185) 19 0.6%
Net long-term debt 50,457 50,989 (532) -1.0%
Short-term debt
Bank borrowings:
- short-term portion of long-term bank borrowings 1,458 1,121 337 30.1%
- other short-term bank borrowings 1,214 579 635 -
Short-term bank borrowings 2,672 1,700 972 57.2%
Bonds (short-term portion) 932 1,906 (974) -51.1%
Other borrowings (short-term portion) 348 382 (34) -8.9%
Commercial paper 4,495 2,284 2,211 96.8%
Cash collateral on derivatives and other financing 1,418 750 668 89.1%
Other short-term financial payables (1) 96 351 (255) -72.6%
Other short-term debt 7,289 5,673 1,616 28.5%
Long-term financial receivables (short-term portion) (1,472) (1,585) 113 7.1%
Financial receivables - cash collateral (2,326) (2,153) (173) -8.0%
Other short-term financial receivables (286) (369) 83 22.5%
Cash and cash equivalents with banks and short term securities (5,923) (9,080) 3,157 34.8%
Cash and cash equivalents and short-term financial receivables (10,007) (13,187) 3,180 24.1%
Net short-term debt (46) (5,814) 5,768 -
NET FINANCIAL DEBT 50,411 45,175 5,236 11.6%
Net financial debt of “Assets held for sale” - - - -
(1) Includes current financial payables included in Other current financial liabilities.

49
Conden
sed inte
rim
conso
lidat
ed fi
nan
cial
sta
tem
ents
Inte
rim
rep
ort
on o
per
atio
ns
Net financial debt amounted to €50,411 million at June 30,
2020, an increase of €5,236 million on December 31, 2019,
due mainly to the change in net short-term debt.
At June 30, 2020, gross financial debt amounted to €63,584
million, an increase of €2,037 million on December 31, 2019.
Gross financial debt
Millions of euro at June 30, 2020 at Dec. 31, 2019
Gross long-term debt
Gross short-term debt Gross debt
Gross long-term debt
Gross short-term debt Gross debt
Gross financial debt 56,361 7,223 63,584 57,583 3,964 61,547
of which:
Debt connected with achievement of sustainability goals 14,577 3,527 18,104 13,758 - 13,758Debt connected with achievement of sustainability goals/Total gross debt (%) 28% 22%
More specifically, gross long-term financial debt (including
the short-term portion) amounted to €56,361 million, of which
€14,577 million in respect of financing linked to sustainability
goals. It breaks down as follows:
> bonds in the amount of €43,231 million, of which €7,274
million in respect of bonds linked to sustainability goals.
More specifically, bonds decreased by €1,969 million com-
pared with December 31, 2019, mainly reflecting repay-
ments of bonds in the period and exchange rate gains;
> bank borrowings of €10,288 million, of which €7,303 mil-
lion in respect of loans linked to sustainability goals. That
financing increased by a total of €760 million compared
with December 31, 2019, mainly reflecting new loans, only
partly offset by exchange rate gains and repayments in the
period;
> other borrowings of €2,842 million, essentially unchanged
compared with December 31, 2019.
In the first six months of 2020 the following credit lines con-
nected with the achievement of sustainability goals were si-
gned. At June 30, 2020 they had not been drawn:
> €5,000 million granted to Enel SpA by a pool of banks ma-
turing in May 2021, with a renewal option for an additional
12 months;
> €250 million granted to Endesa by a pool of banks maturing
in April 2022.
Gross short-term financial debt amounted to €7,223 mil-
lion, an increase of €3,259 million compared with December
31, 2019. It mainly includes commercial paper of €4,495 mil-
lion, cash collateral on derivatives of €1,418 million and other
short-term bank borrowings of €1,214 million.
In the 1st Half of 2020, Enel Finance International and Endesa
structured commercial paper programs linked to sustainabili-
ty objectives and at June 30, 2020 total issues amounted to
€3,527 million.
Analysis of the Group’s financial position and financial structure

50 Half-Year Financial Report at June 30, 2020
Cash flows
Millions of euro 1st Half
2020 2019 Change
Cash and cash equivalents at the beginning of the period (1) 9,080 6,714 2,366
Cash flows from operating activities 2,042 4,619 (2,577)
Cash flows from investing/disinvesting activities (4,119) (4,012) (107)
Cash flows from financing activities (706) (1,551) 845
Effect of exchange rate changes on cash and cash equivalents (374) 31 (405)
Cash and cash equivalents at the end of the period (2) 5,923 5,801 122
(1) Of which cash and cash equivalents equal to €9,029 million at January 1, 2020 (€6,630 million at January 1, 2019), short-term securities equal to €51 million at January 1, 2020 (€63 million at January 1, 2019) and cash and cash equivalents pertaining to assets held for sale in the amount of €21 million at January 1, 2019.
(2) Of which cash and cash equivalents equal to €5,840 million at June 30, 2020 (€5,747 million at June 30, 2019) and short-term securities equal to €83 million at June 30, 2020 (€54 million at June 30, 2019).
Cash flows from operating activities in the 1st Half of 2020
were a positive €2,042 million, down €2,577 million on the cor-
responding period of the previous year, largely reflecting the
increase in cash requirements connected with the change in
net current assets.
Cash flows from investing/disinvesting activities in the 1st
Half of 2020 absorbed funds in the amount of €4,119 million,
compared with €4,012 million in the 1st Half of 2019.
Investments in property, plant and equipment, intangible as-
sets and non-current assets from contracts with customers
amounted to €4,137 million in the 1st Half Quarter of 2020,
essentially unchanged on the same period of the previous year.
Please see the next section for more information.
Disposals of entities and business units, net of cash and cash
equivalents sold, amounted to €88 million, mainly in respect
of the disposal by Enel Green Power North America of a num-
ber of companies owning hydroelectric plants that had been
accounted for using the equity method and the disposal by
Endesa of 80% of its stake in Endesa Soluciones. The positive
impact of that disposal was partly offset by the payment of VAT
connected with the sale last year of the Russian coal-fired plant
of Reftinskaya. In the 1st Half of 2019, the item amounted to
€454 million, mainly reflecting the disposal of 100% of three
solar plants in Brazil and the sale of the Mercure generation
plant business unit.
Liquidity absorbed by other investing/disinvesting activities in
the 1st Half of 2020 amounted to €63 million, essentially re-
garding the capital contribution to the OpEn Fiber joint venture,
partly offset by the liquidity generated by small disinvestments,
mainly in Italy, Latin America and Iberia.
Cash flows from financing activities showed funds absorbed
in the amount of €706 million, while in the 1st Half of 2019
financing activities had absorbed cash of €1,551 million. The
flow in the 1st Half of 2020 essentially reflected:
> the payment of dividends in the amount of €2,629 million;
> the cash requirements generated by transactions in
non-controlling interests in the amount of €973 million.
These mainly included the increase in the stake held in
Enel Américas and Enel Chile through a number of share
swap agreements with a leading financial institution;
> an increase of €2,896 million in net financial debt (the ba-
lance of repayments, new borrowing and other changes),
primarily reflecting commercial paper issues.
In the 1st Half of 2020, cash flows from operating activities in
the amount of €2,042 million only partly funded the cash needs
for financing activities totaling €706 million and for investment
activities in the amount of €4,119 million. The difference was
reflected in a decrease in cash and cash equivalents, which
at June 30, 2020 amounted to €5,923 million, compared with
€9,080 million at the end of 2019. This also reflected the effects
of adverse developments in the exchange rates of the various
local currencies against the euro in the amount of €374 million.

51
Conden
sed inte
rim
conso
lidat
ed fi
nan
cial
sta
tem
ents
Inte
rim
rep
ort
on o
per
atio
ns
Capital expenditureCapital expenditure in the 1st Half of 2020 amounted to
€4,137 million, essentially unchanged on the previous year
(-€30 million). The main developments were as follows:
> the decrease in capital expenditure on Infrastructure and
Networks in Argentina (€54 million) and Italy (€40 million)
mainly reflects the slowdown in the mass replacement of
meters due to the COVID-19 emergency. This factor was
only partly offset by an increase in expenditure in other
countries in Latin America and Romania;
> the decrease in capital expenditure on plants in the Ther-
mal Generation and Trading area was mainly registered in
Argentina (€20 million), Iberia (€16 million) and Russia (€7
million), primarily due to the Group’s strategic choices to
give preference to clean low-emission technologies that
strengthen the Group’s commitment to pursuing the fight
against climate change;
> these contractions were offset by an increase in capital
expenditure by Enel Green Power, primarily in the United
States (€230 million), South Africa (€136 million), Brazil
(€134 million) and Chile (€127 million). Conversely, invest-
ment in renewables declined in Spain (€262 million), Mexi-
co (€128 million) and Greece (€74 million), above all owing
to the entry into service of plants and projects begun in
previous years.
Millions of euro 1st Half
2020 2019 Change
Thermal Generation and Trading 239 292 (53) -18.2%
Enel Green Power 1,912 1,816 (1) 96 5.3%
Infrastructure and Networks 1,668 1,726 (58) -3.4%
End-user Markets 182 187 (5) -2.7%
Enel X 103 105 (2) -1.9%
Services 19 31 (12) -38.7%
Other, eliminations and adjustments 14 10 4 40.0%
Total 4,137 4,167 (30) -0.7%
(1) The figure does not include €4 million regarding units classified as “held for sale” in the 1st Half of 2019.
Analysis of the Group’s financial position and financial structure

52 Half-Year Financial Report at June 30, 2020
People centricity
People managementThe Enel Group workforce at June 30, 2020 numbered 66,825, of whom 56.3% were employed in companies outside of Italy.
The following table provides a breakdown:
No.
at June 30, 2020 at Dec. 31, 2019
Thermal Generation and Trading 8,541 9,432
Enel Green Power 7,996 7,957
Infrastructure and Networks 34,485 34,822
End-user Markets 6,373 6,336
Enel X 2,901 2,808
Services 5,670 6,013
Other 859 885
Total 66,825 68,253
Compared with December 31, 2019, the Group’s workforce
decreased by 1,428 during the period, reflecting the negative
balance between new hires and terminations (-447) and chang-
es in the scope of consolidation (-981) due to:
> the disposal of hydro plants in the United States;
> the disposal of the Reftinskaya plant in Russia.
The changes break down by geographical area as follows: 22%
of new hires came in Italy, while the remaining 78% were dis-
tributed among other countries. About 28% of terminations
came in Italy, encouraged by the application of the procedure
provided for under Article 4 of Law 92/2012 governing early
retirement, while the remaining 72% were registered abroad.
No.
Balance at December 31, 2019 68,253
Hirings 1,182
Terminations (1,629)
Change in the scope of consolidation (981)
Balance at June 30, 2020 66,825
Enel responded with various actions to the emergency linked
to the spread of coronavirus (COVID-19) in all the countries in
which it operates.
It has adopted remote flexible working practices by gradually
extending it to new groups of personnel and new countries
(Peru, South Africa, Canada and Enel X Europe), involving over
50% of our people (from over 17,000 at the end of 2019 to
around 36,000 at the end of the 1st Half of 2020).
To protect human health and ensure business continuity, a
specific task force was also set up to monitor developments
in the emergency, defining appropriate responses and sharing
best practices in the various countries. Finally, in all countries
numerous initiatives and services have been launched with-
in the #iolavorodacasa (“I work from home”) project to keep
people constant updated, support remote work and guaran-
tee personal and family well-being.

53
Conden
sed inte
rim
conso
lidat
ed fi
nan
cial
sta
tem
ents
Inte
rim
rep
ort
on o
per
atio
ns
Health and safety
at June 30, 2020 at Dec. 31, 2019
Injury frequency rate (FR) - Enel i 0.681 0.899
Injury frequency rate (FR) - Contractors i 0.473 0.653
Fatal injuries at Enel no. 1 1
Fatal injuries at contractors no. 3 7
In the 1st Half of 2020, the injury frequency rate (FR) for Enel
employees declined to 0.68 injuries for every million hours
worked (0.90 in 2019), while the FR for the personnel of
contractors also decreased to 0.47 injuries per million hours
worked (0.65 in 2019), in line with the trend in recent years
and confirming the effectiveness of the safety strategy and
policies implemented in the Group.
In the 1st Half of 2020, 1 fatal accident occurred involving an
employee of the Enel Group, and 3 fatal accidents involving
contractors.
In the wake of the novel coronavirus pandemic (COVID-19),
Enel promptly took a range of actions in all the geographical
areas in which the Group operates to reduce the risk of con-
tagion to a minimum and, at the same time, to guarantee the
delivery of the essential electricity services. In addition to the
adoption of flexible working practices, specific prevention and
reaction measures (shift work, organization of work team into
cells, preventive home isolation, etc.) have been implement-
ed for essential operations.
A Global Task Force and specific Local Task Forces have also
been created, consisting of the People and Organization,
Health, Safety, Environment and Quality, Security and Real
Time Communications units. In all countries, the Local Task
Force coordinates the associated activities and determines
the actions necessary.
Analysis of the Group’s financial position and financial structure

54 Half-Year Financial Report at June 30, 2020
Results by business area
The representation of performance by business area present-
ed here is based on the approach used by management in
monitoring Group performance for the two periods under re-
view, taking account of the operational model adopted by the
Group as described above.
With regard to disclosures for operating segments, beginning
with the close of the accounts at September 30, 2019, the
Enel Group has changed its primary and secondary reporting
segments in accordance with the provisions of IFRS 8. Spe-
cifically, bearing in mind that in 2019 management began to
report performance by business area, the Group has there-
fore adopted the following reporting sectors:
> primary sector: business area;
> secondary sector: geographical area.
The business area is therefore the main discriminant in the
analyses performed and decisions taken by the management
of the Enel Group, and is fully consistent with the internal
reporting prepared for these purposes since the results are
measured and evaluated first and foremost for each business
area and only thereafter are they broken down by country.
The following chart outlines these organizational arrangements.
Holding
Regions and Countries
Global Business Lines Local Businesses
Africa, Asia and Oceania
North America
Latin America
Enel GreenPower
Italy
Iberia
Europe
Infrastructure and Networks
Enel X End-user Markets
ServicesThermal Generation
Trading

55
Conden
sed inte
rim
conso
lidat
ed fi
nan
cial
sta
tem
ents
Inte
rim
rep
ort
on o
per
atio
ns
The organization continues to be based on a matrix of Busi-
ness Lines (Thermal Generation and Trading, Enel Green Pow-
er, Infrastructure and Networks, End-user Markets, Enel X,
Services and Holding/Other) and geographical areas (Italy,
Iberia, Europe, Latin America, North America, Africa, Asia and
Oceania, Central/Holding). It should be noted that, with ef-
fect from September 2019, the Latin America area connected
with the Enel Green Power Business Line also includes the
countries Panama, Costa Rica, Guatemala, El Salvador and
Nicaragua, which had previously been reported in the North
and Central America geographical area (now renamed North
America and consisting of the following countries: United
States, Canada and Mexico). In addition, as from March 31,
2020, in Latin America the data pertaining to large customers
managed by the generation companies have been reallocat-
ed to the End-user Markets Global Business Line. In order to
ensure full comparability of the figures commented here in
the light of the new breakdown of the primary and secondary
reporting sectors for IFRS 8 disclosure purposes, the reallo-
cation of countries in the Enel Green Power segment and the
reallocation of large customers to the End-user Markets Glob-
al Business Line, the comparative figures for the 1st Half of
2019 have been adjusted appropriately.
Results by business area

56 Half-Year Financial Report at June 30, 2020
Results by business area for the 2nd Quarter of 2020 and 20192nd Quarter of 2020 (1)
Millions of euro
Thermal Generation and Trading
Enel Green Power
Infrastructure and
NetworksEnd-user Markets Enel X Services
Other, eliminations
and adjustments Total
Revenue and other income from third parties 3,354 1,712 4,218 3,486 209 397 14 13,390Revenue and other income from transactions with other segments 348 44 368 2,570 31 32 (3,393) -Total revenue and other income 3,702 1,756 4,586 6,056 240 429 (3,379) 13,390Net income/(expense) from commodity risk management (71) 48 - 215 - 1 (2) 191
Gross operating margin 309 1,153 1,871 649 16 (13) (48) 3,937
Depreciation, amortization and impairment losses 968 314 788 347 38 40 8 2,503
Operating income (659) 839 1,083 302 (22) (53) (56) 1,434
(1) Revenue and other income includes both revenue from third parties and revenue flows between the segments. An analogous approach was taken for other income and costs for the period.
2nd Quarter of 2019 (1)
Millions of euro
Thermal Generation and
TradingEnel Green
PowerInfrastructure and Networks
End-user Markets Enel X Services
Other, eliminations
and adjustments Total
Revenue and other income from third parties 6,026 1,692 5,038 4,694 269 501 (8) 18,212Revenue and other income from transactions with other segments 352 126 398 2,864 30 13 (3,783) -Total revenue and other income 6,378 1,818 5,436 7,558 299 514 (3,791) 18,212Net income/(expense) from commodity risk management 103 (9) - 50 - (45) (1) 98
Gross operating margin 310 1,026 2,145 800 69 38 (29) 4,359
Depreciation, amortization and impairment losses 812 298 635 285 50 40 7 2,127
Operating income (502) 728 1,510 515 19 (2) (36) 2,232
(1) Revenue and other income includes both revenue from third parties and revenue flows between the segments. An analogous approach was taken for other income and costs for the period.

57
Conden
sed inte
rim
conso
lidat
ed fi
nan
cial
sta
tem
ents
Inte
rim
rep
ort
on o
per
atio
ns
Results by business area for the 1st Half of 2020 and 20191st Half of 2020 (1)
Millions of euro
Thermal Generation and Trading
Enel Green Power
Infrastructure and
NetworksEnd-user Markets Enel X Services
Other, eliminations
and adjustments Total
Revenue and other income from third parties 11,588 3,468 8,809 8,333 398 774 5 33,375Revenue and other income from transactions with other segments 688 107 739 6,084 65 50 (7,733) -Total revenue and other income 12,276 3,575 9,548 14,417 463 824 (7,728) 33,375Net income/(expense) from commodity risk management (797) 57 - 140 - (4) 3 (601)
Gross operating margin 1,001 2,291 3,816 1,582 23 10 (78) 8,645
Depreciation, amortization and impairment losses 1,185 626 1,470 653 71 80 17 4,102
Operating income (184) 1,665 2,346 929 (48) (70) (95) 4,543
Capital expenditure 239 1,912 1,668 182 103 19 14 4,137
(1) Revenue and other income includes both revenue from third parties and revenue flows between the segments. An analogous approach was taken for other income and costs for the period.
1st Half of 2019 (1)
Millions of euro
Thermal Generation and
TradingEnel Green
PowerInfrastructure and Networks
End-user Markets Enel X Services
Other, eliminations
and adjustments Total
Revenue and other income from third parties 15,834 3,576 9,890 10,362 430 870 5 40,967Revenue and other income from transactions with other segments 612 259 797 6,479 62 33 (8,242) -Total revenue and other income 16,446 3,835 10,687 16,841 492 903 (8,237) 40,967Net income/(expense) from commodity risk management (167) (18) - (2) - - (1) (188)
Gross operating margin 905 2,274 3,971 1,661 72 82 (58) 8,907
Depreciation, amortization and impairment losses 1,107 601 1,321 490 80 84 11 3,694
Operating income (202) 1,673 2,650 1,171 (8) (2) (69) 5,213
Capital expenditure 292 1,816 (2) 1,726 187 105 31 10 4,167
(1) Revenue and other income includes both revenue from third parties and revenue flows between the segments. An analogous approach was taken for other income and costs for the period.
(2) Does not include €4 million regarding units classified as “held for sale”.
In addition to the above, the Group monitors performance by
geographical area, classifying performance by Region/Coun-
try. In the table below, gross operating margin is shown for
the two periods under review with the goal of providing a
view of performance not only by Business Line, but also by
Region/Country.
Results by business area

58 Half-Year Financial Report at June 30, 2020
Gross operating margin
Millions of euroThermal Generation and
Trading Enel Green Power Infrastructure and Networks End-user Markets Enel X Services Other Total
1st Half 1st Half 1st Half 1st Half 1st Half 1st Half 1st Half 1st Half
2020 2019 Change 2020 2019 Change 2020 2019 Change 2020 2019 Change 2020 2019 Change 2020 2019 Change 2020 2019 Change 2020 2019 Change
Italy 180 176 4 745 615 130 1,873 1,824 49 1,134 1,167 (33) 9 - 9 33 81 (48) - - - 3,974 3,863 111
Iberia 605 309 296 216 183 33 1,121 974 147 305 324 (19) 25 23 2 2 44 (42) - - - 2,274 1,857 417
Latin America 125 321 (196) 953 1,132 (179) 773 1,138 (365) 105 173 (68) 23 19 4 (54) (49) (5) - - - 1,925 2,734 (809)
Argentina 50 70 (20) 18 26 (8) 23 242 (219) (3) 16 (19) - - - - (2) 2 - - - 88 352 (264)
Brazil 20 53 (33) 118 187 (69) 384 487 (103) 55 83 (28) (3) (2) (1) (19) (23) 4 - - - 555 785 (230)
Chile (3) 121 (124) 366 462 (96) 83 116 (33) 15 19 (4) 4 3 1 (35) (24) (11) - - - 430 697 (267)
Colombia (4) 10 (14) 314 310 4 185 185 - 27 39 (12) 23 18 5 - - - - - - 545 562 (17)
Peru 62 67 (5) 63 70 (7) 98 108 (10) 11 16 (5) (1) - (1) - - - - - - 233 261 (28)
Panama - - - 54 58 (4) - - - - - - - - - - - - - - - 54 58 (4)
Other countries - - - 20 19 1 - - - - - - - - - - - - - - - 20 19 1
Europe 77 114 (37) 80 69 11 55 47 8 39 (6) 45 3 - 3 2 2 - - - - 256 226 30
Romania - (1) 1 42 42 - 55 47 8 39 (6) 45 4 3 1 2 2 - - - - 142 87 55
Russia 76 115 (39) (2) - (2) - - - - - - - - - - - - - - - 74 115 (41)
Other countries 1 - 1 40 27 13 - - - - - - (1) (3) 2 - - - - - - 40 24 16
North America 10 (5) 15 305 297 8 - - - (1) 3 (4) (20) 43 (63) (1) - (1) - - - 293 338 (45)United States and Canada 9 (5) 14 260 250 10 - - - - - - (20) 43 (63) (1) - (1) - - - 248 288 (40)
Mexico 1 - 1 45 47 (2) - - - (1) 3 (4) - - - - - - - - - 45 50 (5)Africa, Asia and Oceania - - - 22 28 (6) - - - - - - (1) (3) 2 - - - - - - 21 25 (4)
South Africa - - - 24 27 (3) - - - - - - - - - - - - - - - 24 27 (3)
India - - - 2 5 (3) - - - - - - - - - - - - - - - 2 5 (3)
Other countries - - - (4) (4) - - - - - - - (1) (3) 2 - - - - - - (5) (7) 2
Other 4 (10) 14 (30) (50) 20 (6) (12) 6 - - - (16) (10) (6) 28 4 24 (78) (58) (20) (98) (136) 38
Total 1,001 905 96 2,291 2,274 17 3,816 3,971 (155) 1,582 1,661 (79) 23 72 (49) 10 82 (72) (78) (58) (20) 8,645 8,907 (262)

59
Conden
sed inte
rim
conso
lidat
ed fi
nan
cial
sta
tem
ents
Inte
rim
rep
ort
on o
per
atio
ns
Gross operating margin
Millions of euroThermal Generation and
Trading Enel Green Power Infrastructure and Networks End-user Markets Enel X Services Other Total
1st Half 1st Half 1st Half 1st Half 1st Half 1st Half 1st Half 1st Half
2020 2019 Change 2020 2019 Change 2020 2019 Change 2020 2019 Change 2020 2019 Change 2020 2019 Change 2020 2019 Change 2020 2019 Change
Italy 180 176 4 745 615 130 1,873 1,824 49 1,134 1,167 (33) 9 - 9 33 81 (48) - - - 3,974 3,863 111
Iberia 605 309 296 216 183 33 1,121 974 147 305 324 (19) 25 23 2 2 44 (42) - - - 2,274 1,857 417
Latin America 125 321 (196) 953 1,132 (179) 773 1,138 (365) 105 173 (68) 23 19 4 (54) (49) (5) - - - 1,925 2,734 (809)
Argentina 50 70 (20) 18 26 (8) 23 242 (219) (3) 16 (19) - - - - (2) 2 - - - 88 352 (264)
Brazil 20 53 (33) 118 187 (69) 384 487 (103) 55 83 (28) (3) (2) (1) (19) (23) 4 - - - 555 785 (230)
Chile (3) 121 (124) 366 462 (96) 83 116 (33) 15 19 (4) 4 3 1 (35) (24) (11) - - - 430 697 (267)
Colombia (4) 10 (14) 314 310 4 185 185 - 27 39 (12) 23 18 5 - - - - - - 545 562 (17)
Peru 62 67 (5) 63 70 (7) 98 108 (10) 11 16 (5) (1) - (1) - - - - - - 233 261 (28)
Panama - - - 54 58 (4) - - - - - - - - - - - - - - - 54 58 (4)
Other countries - - - 20 19 1 - - - - - - - - - - - - - - - 20 19 1
Europe 77 114 (37) 80 69 11 55 47 8 39 (6) 45 3 - 3 2 2 - - - - 256 226 30
Romania - (1) 1 42 42 - 55 47 8 39 (6) 45 4 3 1 2 2 - - - - 142 87 55
Russia 76 115 (39) (2) - (2) - - - - - - - - - - - - - - - 74 115 (41)
Other countries 1 - 1 40 27 13 - - - - - - (1) (3) 2 - - - - - - 40 24 16
North America 10 (5) 15 305 297 8 - - - (1) 3 (4) (20) 43 (63) (1) - (1) - - - 293 338 (45)United States and Canada 9 (5) 14 260 250 10 - - - - - - (20) 43 (63) (1) - (1) - - - 248 288 (40)
Mexico 1 - 1 45 47 (2) - - - (1) 3 (4) - - - - - - - - - 45 50 (5)Africa, Asia and Oceania - - - 22 28 (6) - - - - - - (1) (3) 2 - - - - - - 21 25 (4)
South Africa - - - 24 27 (3) - - - - - - - - - - - - - - - 24 27 (3)
India - - - 2 5 (3) - - - - - - - - - - - - - - - 2 5 (3)
Other countries - - - (4) (4) - - - - - - - (1) (3) 2 - - - - - - (5) (7) 2
Other 4 (10) 14 (30) (50) 20 (6) (12) 6 - - - (16) (10) (6) 28 4 24 (78) (58) (20) (98) (136) 38
Total 1,001 905 96 2,291 2,274 17 3,816 3,971 (155) 1,582 1,661 (79) 23 72 (49) 10 82 (72) (78) (58) (20) 8,645 8,907 (262)
Results by business area

60 Half-Year Financial Report at June 30, 202060 Half-Year Financial Report at June 30, 2020

61
Conden
sed inte
rim
conso
lidat
ed fi
nan
cial
sta
tem
ents
Inte
rim
rep
ort
on o
per
atio
ns
Thermal Generation and Trading
Operations
Net electricity generation
Millions of kWh 1st Half
2020 2019 Change
Coal-fired plants 6,131 22,130 (15,999) -72.3%
Fuel-oil and turbo-gas plants 8,706 10,349 (1,643) -15.9%
Combined-cycle plants 19,002 20,131 (1,129) -5.6%
Nuclear plants 12,672 13,212 (540) -4.1%
Total net generation 46,511 65,822 (19,311) -29.3%
- of which Italy 6,997 10,979 (3,982) -36.3%
- of which Iberia 20,178 25,453 (5,275) -20.7%
- of which Latin America 11,008 11,780 (772) -6.6%
- of which Europe 8,328 17,610 (9,282) -52.7%
The decrease in net generation was essentially due to a sharp
decrease in coal generation in the amount of 15,999 million
kWh, primarily in Russia (8,431 million kWh), due to the di-
sposal of the Reftinskaya GRES coal-fired plant on October
1, 2019, Iberia (4,332 million kWh) and Italy (2,551 million
kWh) due to the acceleration of the decarbonization process.
In general, generation from other high-emissions plants de-
clined to the benefit of generation from renewables. More
specifically, in the 1st Half of 2020, decreases were registe-
red in fuel-oil generation in the amount of 1,643 million kWh
and combined-cycle generation (1,129 million kWh), mainly
in Italy.
Net efficient installed capacity
MW 1st Half
2020 2019 (1) Change
Coal-fired plants 9,634 11,695 (2,061) -17.6%
Fuel-oil and turbo-gas plants 11,863 12,211 (348) -2.8%
Combined-cycle plants 15,004 14,991 13 0.1%
Nuclear plants 3,318 3,318 - -
Total 39,819 42,215 (2,396) -5.7%
- of which Italy 13,178 13,480 (302) -2.2%
- of which Iberia 13,861 15,957 (2,096) -13.1%
- of which Latin America 7,525 7,523 2 -
- of which Europe 5,255 5,255 - -
(1) At December 31, 2019.
Net efficient thermal installed capacity decreased by 2,396 MW in the 1st Half of 2020, mainly reflecting the decommissioning
of 2,061 MW of coal-fired capacity in Spain.
Results by business area

62 Half-Year Financial Report at June 30, 2020
Millions of euro 1st Half Change
Revenue 2020 2019
Revenue from thermal generation 3,497 5,333 -34.4%
- of which: coal generation 853 1,527 -44.1%
Revenue from nuclear generation 646 632 +2.2%
Revenue from thermal generation as a percentage of total revenue 10.5% 13.0%
- of which: revenue from coal generation as a percentage of total revenue 2.6% 3.7%
Revenue from nuclear generation as a percentage of total revenue 1.9% 1.5%
Performance
2nd Quarter Millions of euro 1st Half
2020 2019 Change 2020 2019 Change
3,702 6,378 (2,676) -42.0% Revenue (1) 12,276 16,446 (4,170) -25.4%
309 310 (1) -0.3%Gross operating margin 1,001 905 96 10.6%Ordinary gross operating margin 1,073 811 262 32.3%
(659) (502) (157) -31.3% Operating income (184) (202) 18 8.9%
Capital expenditure 239 292 (53) -18.2%
(1) The figures for the 1st Half of 2019 have been adjusted to take account of the interpretations of the IFRS Interpretations Committee (IFRIC) contained in the Agenda Decision of 2019, which involved changes in the classification, with no impact on margins, of the effects of purchase and sales contracts for commodities measured at fair value through profit or loss (for more details, see note 4 of the condensed interim consolidated financial statements at June 30, 2020).

63
Conden
sed inte
rim
conso
lidat
ed fi
nan
cial
sta
tem
ents
Inte
rim
rep
ort
on o
per
atio
ns
The following tables show a breakdown of performance by Region/Country in the 2nd Quarter and the 1st Half of 2020.
Revenue (1)
2nd Quarter Millions of euro 1st Half
2020 2019 Change 2020 2019 Change
2,094 4,489 (2,395) -53.4% Italy 8,763 12,279 (3,516) -28.6%
1,047 1,332 (285) -21.4% Iberia 2,519 2,859 (340) -11.9%
272 408 (136) -33.3% Latin America 674 1,001 (327) -32.7%
24 63 (39) -61.9% - of which Argentina 88 164 (76) -46.3%
24 58 (34) -58.6% - of which Brazil 68 126 (58) -46.0%
168 191 (23) -12.0% - of which Chile 336 493 (157) -31.8%
46 26 20 76.9% - of which Colombia 95 45 50 -
10 70 (60) -85.7% - of which Peru 87 173 (86) -49.7%
(157) 4 (161) - North America 8 5 3 60.0%
277 229 48 21.0% Europe 277 495 (218) -44.0%
(165) 5 (170) - - of which Romania - 14 (14) -
275 224 51 22.8% - of which Russia 275 481 (206) -42.8%
2 - 2 - - of which other countries 2 - 2 -
231 11 220 - Other 62 26 36 -
(8,601) (95) (8,506) -Eliminations and adjust-ments (27) (219) 192 87.7%
3,702 6,378 (2,676) -42.0% Total 12,276 16,446 (4,170) -25.4%
(1) The figures for the 1st Half of 2019 have been adjusted to take account of the interpretations of the IFRS Interpretations Committee (IFRIC) contained in the Agenda Decision of 2019, which involved changes in the classification, with no impact on margins, of the effects of purchase and sales contracts for commodi-ties measured at fair value through profit or loss (for more details, see note 4 of the condensed interim consolidated financial statements at June 30, 2020).
Results by business area

64 Half-Year Financial Report at June 30, 2020
Gross operating margin
2nd Quarter Millions of euro 1st Half
2020 2019 Change 2020 2019 Change
50 42 8 19.0% Italy 180 176 4 2.3%
177 151 26 17.2% Iberia 605 309 296 95.8%
49 85 (36) -42.4% Latin America 125 321 (196) -61.1%
9 26 (17) -65.4%- of which Argentina 50 70 (20) -28.6%
7 7 - - - of which Brazil 20 53 (33) -62.3%
10 13 (3) -23.1% - of which Chile (3) 121 (124) -
(2) 7 (9) -- of which Colombia (4) 10 (14) -
25 32 (7) -21.9% - of which Peru 62 67 (5) -7.5%
4 (5) 9 - North America 10 (5) 15 -
28 43 (15) -34.9% Europe 77 114 (37) -32.5%
- (1) 1 -- of which Romania - (1) 1 -
27 44 (17) -38.6% - of which Russia 76 115 (39) -33.9%
1 - 1 -- of which other countries 1 - 1 -
1 (6) 7 - Other 4 (10) 14 -
309 310 (1) -0.3% Total 1,001 905 96 10.6%
The increase in the gross operating margin in the 1st Half of
2020 mainly reflects:
> an increase in the margin posted in Iberia, essentially at-
tributable to:
- the decrease in personnel costs of €189 million, due
essentially to the application of the 5th Endesa Collecti-
ve Bargaining Agreement, which modified the electri-
city discount benefit for employees and former em-
ployees. This positive effect was only partly offset by
the provision for early termination incentives following
the entry into force of the new “agreement on volun-
tary measures to suspend or terminate employment
contracts” (€24 million);
- the decrease in costs for the purchase of fuels of €131
million, mainly reflecting the reduction in the spot pri-
ces of energy commodities;
- the decrease in costs associated with services in
reflection of the lockdown imposed in response to the
COVID-19 health emergency;
- an increase in tax charges of €62 million, due to the
effect of the temporary suspension, for 2019 only, of
the tax on electricity generation and on fuels used in
conventional thermal and nuclear generation (Royal De-
cree Law 15/2018);
> a decrease in the margin in Latin America, reflecting:
- the reduction of €124 million in the margin in Chile, due
mainly to the effect of the recognition in the 1st Half of
2019 of an indemnity of €80 million received from An-
glo American for having exercised the early withdrawal
option as well as a decrease in volumes sold;
- the reduction of €33 million in the margin in Brazil, due
primarily to the decrease in volumes sold in an environ-
ment of declining average prices;
- the reduction of €20 million in the margin in Argentina, pri-
marily attributable to adverse exchange rate developments;
> a decrease of €37 million in the margin posted in Europe,
especially in Russia, essentially as a result of the disposal
of the Reftinskaya GRES coal-fired plant;
> the margin in Italy was virtually unchanged on that in the
1st Half of 2019, as the increase in operating efficiency in
the 1st Half of 2020 was entirely offset by writedowns of
fuel inventories at the power plants for which impairment
losses were recognized and the effect of the capital gain
on the disposal of Mercure Srl in the 1st Half of 2019.
The ordinary gross operating margin increased by €262
million in the 1st Half of 2020. In addition to the changes al-
ready noted in the comments on the gross operating margin,
the rise was attributable to the impact of the following non-re-
curring items:
> an increase in writedowns recognized in the 1st Half of
2020 on the fuel inventories of plants that suffered impair-
ment losses (€67 million, of which €44 million in Italy, €14
million in Chile and €9 million in Spain);

65
Conden
sed inte
rim
conso
lidat
ed fi
nan
cial
sta
tem
ents
Inte
rim
rep
ort
on o
per
atio
ns
> costs for addressing the COVID-19 pandemic (€5 million)
for the sanitization of workplaces, personal protective equi-
pment and donations.
In the same period of 2019, the only extraordinary item was the
income from the sale of the Valle del Mercure biomass plant (€94
million net of the contractually agreed site restoration costs).
Operating income
2nd Quarter Millions of euro 1st Half
2020 2019 Change 2020 2019 Change
16 (25) 41 - Italy 102 46 56 -
34 (27) 61 - Iberia 356 (35) 391 -
(734) (345) (389) - Latin America (708) (158) (550) -
(4) 2 (6) -- of which Argentina 19 37 (18) -48.6%
4 8 (4) -50.0% - of which Brazil 15 47 (32) -68.1%
(747) (381) (366) -96.1% - of which Chile (776) (292) (484) -
(5) 4 (9) -- of which Colombia (12) 2 (14) -
18 22 (4) -18.2% - of which Peru 46 48 (2) -4.2%
5 (6) 11 - North America 11 (6) 17 -
19 (91) 110 - Europe 52 (37) 89 -
- - - -- of which Romania - - - -
19 (91) 110 - - of which Russia 52 (37) 89 -
- - - -- of which other countries - - - -
1 (8) 9 - Other 3 (12) 15 -
- - - -Eliminations and adjustments - - - -
(659) (502) (157) -31.3% Total (184) (202) 18 8.9%
The improvement in the operating result was attributable to
the developments noted in the comments on the gross ope-
rating margin and despite the increase in depreciation, amor-
tization and impairment in the amount of €78 million. Note
that in the 1st Half of 2020 the impairment recognized on
the Bocamina II coal-fired plant (€741 million) following the
Group’s decision to accelerate the energy transition process
in Chile towards zero-emission technologies more than offset
the writedowns recognized in the 1st Half of 2019 on the Bo-
camina I and Tarapacá plants in Chile (in the total amount of
€364 million) and the Reftinskaya GRES plant in Russia (€120
million), net of a decline in depreciation and amortization on
plants for which impairment losses were recognized in 2019
in Italy, Spain, Chile and Russia.
Capital expenditure
Millions of euro 1st Half
2020 2019 Change
Italy 55 59 (4) -6.8%
Iberia 116 132 (16) -12.1%
Latin America 45 71 (26) -36.6%
Europe 23 30 (7) -23.3%
Other - - - -
Total 239 292 (53) -18.2%
Capital expenditure in the 1st Half of 2020 amounted to
€239 million, a decrease of €53 million compared with the
same period of the previous year, essentially reflecting the
reduction in certain environmental upgrading works in Spain
at coal-fired plants, a decrease in investment in Colombia and
changes in the programming of expenditure in Argentina.
Results by business area

66 Half-Year Financial Report at June 30, 202066 Half-Year Financial Report at June 30, 2020

67
Conden
sed inte
rim
conso
lidat
ed fi
nan
cial
sta
tem
ents
Inte
rim
rep
ort
on o
per
atio
ns
Enel Green Power
Operations
Net electricity generation (1)
Millions of kWh 1st Half
2020 2019 Change
Hydroelectric 30,522 29,266 1,256 4.3%
Geothermal 3,127 3,040 87 2.9%
Wind 14,684 12,752 1,932 15.2%
Solar 2,763 1,988 775 39.0%
Other sources 1 20 (19) -95.0%
Total net generation 51,097 47,066 4,031 8.6%
- of which Italy 11,919 11,794 125 1.1%
- of which Iberia 7,397 4,905 2,492 50.8%
- of which Latin America 21,353 22,492 (1,139) -5.1%
- of which Europe 1,174 1,003 171 17.0%
- of which North America 8,531 6,118 2,413 39.4%
- of which Africa, Asia and Oceania 723 754 (31) -4.1%
(1) These figures have been adjusted for the purposes of comparison with those for the 1st Half of 2019 to take account of the fact that Panama, Costa Rica, Gua-temala, El Salvador and Nicaragua, which were previously included in the North and Central America geographical area, are now included within Latin America.
In the 1st Half of 2020, net electricity generation mainly incre-
ased due to greater hydroelectric and wind output.
More specifically, hydroelectric output increased in Italy (+191
million kWh) and Iberia (+1,883 million kWh) and decreased
in Latin America (-788 million kWh). In the latter area, deve-
lopments in hydroelectric generation differed by country, with
increases in Peru (+123 million kWh), Argentina (+175 million
kWh) and Guatemala (+40 million kWh) and decreases in Co-
lombia (-237 million kWh), Chile (-805 million kWh), Brazil (-71
million kWh) and Panama (-16 million kWh).
The most significant changes in wind generation came in
North America, with increases of 1,530 million kWh in the
United States, 133 million kWh in Canada and 127 million
kWh in Mexico, and in Iberia, with an increase of 365 million
kWh. Wind generation expanded in Greece (149 million kWh),
mainly reflecting the start-up of the new Kafireas wind farms.
By contrast, wind output in Brazil decreased by 255 million
kWh, partly reflecting the sale of eight companies in the 2nd
Quarter of 2019 (the Gamma operation).
Solar generation increased mainly in the United States (+368
million kWh), Mexico (+231 million kWh) and Iberia (+244 mil-
lion kWh), partly offset by lower output in Brazil (-122 million
kWh) as a result of the change in the scope of operations
noted above.
Results by business area

68 Half-Year Financial Report at June 30, 2020
Net efficient installed capacity
MW 1st Half
2020 2019 (1) Change
Hydroelectric 27,832 27,830 2 -
Geothermal 880 878 2 0.2%
Wind 10,661 10,327 334 3.2%
Solar 3,514 3,094 420 13.6%
Other sources 5 5 - -
Total 42,892 42,134 758 1.8%
- of which Italy 13,977 13,972 5 -
- of which Iberia 7,405 7,391 14 0.2%
- of which Latin America 13,852 13,676 176 1.3%
- of which Europe 1,037 1,037 - -
- of which North America 5,792 5,282 510 9.7%
- of which Africa, Asia and Oceania 829 776 53 6.8%
(1) At December 31, 2019.
The increase in net efficient capacity was recorded mainly in
the United States with the Roadrunner Ph II, Roadrunner Ph
III and Roadrunner Ph IV solar plants, Mexico, with the Do-
lores Wind SA de Cv and Parque Amistad III SA de Cv wind
farms, and in Brazil, as a result of the increase in installed
capacity in respect of the São Gonçalo photovoltaic plants.
Performance (1) (2)
2nd Quarter Millions of euro 1st Half
2020 2019 Change 2020 2019 Change
1,756 1,818 (62) -3.4% Revenue 3,575 3,835 (260) -6.8%
1,153 1,026 127 12.4%Gross operating margin 2,291 2,274 17 0.7%Ordinary gross operating margin 2,296 2,274 22 1.0%
839 728 111 15.2% Operating income 1,665 1,673 (8) -0.5%
Capital expenditure 1,912 1,816 (3) 96 5.3%
(1) The figures have been adjusted for the purposes of comparison with those for the 1st Half of 2019 to take account of the fact that Panama, Costa Rica, Guate-mala, El Salvador and Nicaragua, which were previously included in the North and Central America geographical area, are now included within Latin America.
(2) The figures have been adjusted to take account of the fact that in Latin America the figures pertaining to large customers managed by the generation companies have been reallocated to the End-user Markets Global Business Line.
(3) The figure does not include €4 million regarding units classified as “held for sale”.

69
Conden
sed inte
rim
conso
lidat
ed fi
nan
cial
sta
tem
ents
Inte
rim
rep
ort
on o
per
atio
ns
The following tables show a breakdown of performance by Region/Country in the 2nd Quarter and the 1st Half of 2020.
Revenue (1) (2)
2nd Quarter Millions of euro 1st Half
2020 2019 Change 2020 2019 Change
550 520 30 5.8% Italy 1,092 957 135 14.1%
176 149 27 18.1% Iberia 390 329 61 18.5%
682 896 (214) -23.9% Latin America 1,432 1,930 (498) -25.8%
10 17 (7) -41.2%- of which Argentina 23 32 (9) -28.1%
83 162 (79) -48.8% - of which Brazil 233 360 (127) -35.3%
323 363 (40) -11.0% - of which Chile 587 839 (252) -30.0%
202 244 (42) -17.2%- of which Colombia 422 492 (70) -14.2%
17 47 (30) -63.8% - of which Peru 66 89 (23) -25.8%
31 45 (14) -31.1% - of which Panama 71 86 (15) -17.4%
16 18 (2) -11.1%- of which other countries 30 32 (2) -6.3%
249 167 82 49.1% North America 459 447 12 2.7%
224 150 74 49.3%- of which United States and Canada 407 371 36 9.7%
25 17 8 47.1% - of which Mexico 52 76 (24) -31.6%
72 66 6 9.1% Europe 164 132 32 24.2%
46 47 (1) -2.1%- of which Romania 109 92 17 18.5%
24 17 7 41.2% - of which Greece 49 35 14 40.0%
2 2 - - - of which Bulgaria 6 5 1 20.0%
- - - -- of which other countries - - - -
19 26 (7) -26.9%Africa, Asia and Oceania 44 49 (5) -10.2%
59 22 37 - Other 99 52 47 90.4%
(51) (28) (23) -82.1%Eliminations and adjustments (105) (61) (44) -72.1%
1,756 1,818 (62) -3.4% Total 3,575 3,835 (260) -6.8%
(1) The figures have been adjusted for the purposes of comparison with those for the 1st Half of 2019 to take account of the fact that Panama, Costa Rica, Guate-mala, El Salvador and Nicaragua, which were previously included in the North and Central America geographical area, are now included within Latin America.
(2) The figures have been adjusted to take account of the fact that in Latin America the figures pertaining to large customers managed by the generation companies have been reallocated to the End-user Markets Global Business Line.
Results by business area

70 Half-Year Financial Report at June 30, 2020
Gross operating margin (1) (2)
2nd Quarter Millions of euro 1st Half
2020 2019 Change 2020 2019 Change
386 347 39 11.2% Italy 745 615 130 21.1%
109 77 32 41.6% Iberia 216 183 33 18.0%
436 510 (74) -14.5% Latin America 953 1,132 (179) -15.8%
9 16 (7) -43.8%- of which Argentina 18 26 (8) -30.8%
43 82 (39) -47.6% - of which Brazil 118 187 (69) -36.9%
179 169 10 5.9% - of which Chile 366 462 (96) -20.8%
146 161 (15) -9.3%- of which Colombia 314 310 4 1.3%
27 37 (10) -27.0% - of which Peru 63 70 (7) -10.0%
22 35 (13) -37.1% - of which Panama 54 58 (4) -6.9%
10 10 - -- of which other countries 20 19 1 5.3%
189 78 111 - North America 305 297 8 2.7%
161 73 88 -- of which United States and Canada 260 250 10 4.0%
28 5 23 - - of which Mexico 45 47 (2) -4.3%
31 31 - - Europe 80 69 11 15.9%
14 18 (4) -22.2%- of which Romania 42 42 - -
(2) - (2) - - of which Russia (2) - (2) -
18 13 5 38.5% - of which Greece 37 26 11 42.3%
2 1 1 - - of which Bulgaria 5 3 2 66.7%
(1) (1) - -- of which other countries (2) (2) - -
8 11 (3) -27.3%Africa, Asia and Oceania 22 28 (6) -21.4%
(6) (28) 22 -78.6% Other (30) (50) 20 -40.0%
1,153 1,026 127 12.4% Total 2,291 2,274 17 0.7%
(1) The figures have been adjusted for the purposes of comparison with those for the 1st Half of 2019 to take account of the fact that Panama, Costa Rica, Guate-mala, El Salvador and Nicaragua, which were previously included in the North and Central America geographical area, are now included within Latin America.
(2) The figures have been adjusted to take account of the fact that in Latin America the figures pertaining to large customers managed by the generation companies have been reallocated to the End-user Markets Global Business Line.

71
Conden
sed inte
rim
conso
lidat
ed fi
nan
cial
sta
tem
ents
Inte
rim
rep
ort
on o
per
atio
ns
The change in the gross operating margin for the 1st Half of
2020 is essentially attributable to:
> an increase in the margin in Italy, mainly reflecting an im-
provement in the performance of hydro plants;
> an increase in the margin in Spain thanks to the expansion
in installed wind capacity in 2019;
> an increase in the margin posted by Europe, especially
Greece (€11 million) following the start of operations by the
Kafireas wind farms, which were not operational in 2019;
> an increase in the margin posted in North America, main-
ly in the United States as a result of an increase in sales
and an improvement in the electricity margin (€40 million),
which mainly reflected plants acquired in 2019, an increase
in income from tax partnership agreements (€46 million) in
the 1st Half of 2020 following the entry into service of new
plants by Enel North America (formerly Enel Green Pow-
er North America), notably High Lonesome, Cimarron and
Roadrunner, and an increase in income from indemnities
and disputes (€50 million).
These effects were largely offset by the impact of the re-
cognition in the 1st Quarter of 2019 of negative goodwill
in the amount of €106 million following the acquisition by
Enel North America (formerly Enel Green Power North
America) of 13 companies from Enel Green Power North
America Renewable Energy Partner LLC (EGPNA REP);
> the decline in the margin in Latin America, mainly due to:
- a decrease in the margin in Chile, mainly reflecting the
effect of the recognition in the 1st Quarter of 2019 by
Enel Generación Chile of revenue for indemnities of
€80 million following the exercise of the right of with-
drawal by a major industrial customer from a long-term
electricity supply contract, as well as the reduction in
sales of electricity and adverse exchange rate develop-
ments (€35 million);
- a decrease in the margin in Brazil, mainly reflecting a
decline in quantities generated and sold, partly in re-
flection of the change in the scope of operations fol-
lowing the sale of eight companies in the 2nd Quarter
of 2019, and the significant depreciation of the Brazilian
real against the euro;
- a decrease in the margin in Argentina, primarily re-
flecting the contraction of €8 million in revenue from
electricity sales, which was not accompanied by a cor-
responding decrease in costs, as well as adverse ex-
change rate developments.
The ordinary gross operating margin amounted to €2,296
million (€2,274 million in the 1st Half of 2019). It reflected ex-
traordinary costs incurred in Italy (€5 million) in responding to
the COVID-19 pandemic for the sanitization of workplaces,
personal protective equipment and donations.
Results by business area

72 Half-Year Financial Report at June 30, 2020
Operating income (1) (2)
2nd Quarter Millions of euro 1st Half
2020 2019 Change 2020 2019 Change
300 272 28 10.3% Italy 585 467 118 25.3%
64 37 27 73.0% Iberia 122 102 20 19.6%
342 419 (77) -18.4% Latin America 765 930 (165) -17.7%
7 13 (6) -46.2%- of which Argentina 16 23 (7) -30.4%
28 63 (35) -55.6% - of which Brazil 85 140 (55) -39.3%
138 136 2 1.5% - of which Chile 283 380 (97) -25.5%
133 145 (12) -8.3%- of which Colombia 287 281 6 2.1%
18 27 (9) -33.3% - of which Peru 45 50 (5) -10.0%
15 30 (15) -50.0% - of which Panama 43 50 (7) -14.0%
3 5 (2) -40.0%- of which other countries 6 6 - -
123 12 111 - North America 170 170 - -
103 13 90 -- of which United States and Canada 141 136 5 3.7%
20 (1) 21 - - of which Mexico 29 34 (5) -14.7%
19 15 4 26.7% Europe 52 46 6 13.0%
9 12 (3) -25.0%- of which Romania 32 32 - -
(1) (1) - - - of which Russia (2) (1) (1) -
10 6 4 66.7% - of which Greece 21 16 5 31.3%
1 - 1 - - of which Bulgaria 3 2 1 50.0%
- (2) 2 -- of which other countries (2) (3) 1 -33.3%
(2) 1 (3) -Africa, Asia and Oceania 3 8 (5) -62.5%
(6) (28) 22 -78.6% Other (32) (50) 18 -36.0%
(1) - (1) -Eliminations and adjustments - - - -
839 728 111 15.2% Total 1,665 1,673 (8) -0.5%
(1) The figures have been adjusted for the purposes of comparison with those for the 1st Half of 2019 to take account of the fact that Panama, Costa Rica, Guate-mala, El Salvador and Nicaragua, which were previously included in the North and Central America geographical area, are now included within Latin America.
(2) The figures have been adjusted to take account of the fact that in Latin America the figures pertaining to large customers managed by the generation companies have been reallocated to the End-user Markets Global Business Line.
The decrease in operating income, which reflects the de-
velopments discussed in the section on the gross operating
margin, is also attributable to an increase of €25 million in
depreciation, amortization and impairment, of which €14 mil-
lion in impairment losses on the Interporto di Nola solar plant.

73
Conden
sed inte
rim
conso
lidat
ed fi
nan
cial
sta
tem
ents
Inte
rim
rep
ort
on o
per
atio
ns
Capital expenditure (1)
Millions of euro 1st Half
2020 2019 Change
Italy 80 82 (2) -2.4%
Iberia 221 483 (262) -54.2%
Latin America 572 313 (2) 259 82.7%
North America 739 655 84 12.8%
Europe 68 119 (51) -42.9%
Africa, Asia and Oceania 217 155 62 40.0%
Other 15 9 6 66.7%
Total 1,912 1,816 96 5.3%
(1) The figures have been adjusted for the purposes of comparison with those for the 1st Half of 2019 to take account of the fact that Panama, Costa Rica, Guate-mala, El Salvador and Nicaragua, which were previously included in the North and Central America geographical area, are now included within Latin America.
(2) The figure does not include €4 million regarding units classified as “held for sale”.
Capital expenditure in the 1st Half of 2020 increased by €96
million compared with the same period of 2019. The rise is
attributable to:
> an increase in expenditure in Latin America of €259 mil-
lion, mainly on wind farms (€92 million), photovoltaic plants
(€186 million) and geothermal facilities (€12 million), part-
ly offset by a decline in investment in hydroelectric plants
(€42 million). The largest investments were mainly located
in Brazil (€134 million) and Chile (€127 million);
> an increase in expenditure in North America of €84 mil-
lion, primarily in the United States (€230 million) thanks
to greater investment in wind and solar plants in the first
part of 2020, offset by the reduction registered in Mexico
as a result of the start of operations at numerous plants
constructed in 2019;
> an increase in expenditure in Africa, Asia and Oceania of
€62 million, mainly associated with the development of
wind plants in South Africa (€136 million), in particular re-
garding developments in Round 4, partly offset by a de-
cline in expenditure in India (€50 million);
> a decrease in expenditure in Europe of €51 million, notably
in Greece (€74 million) following the entry into service of
projects developed in 2019;
> a decrease in expenditure in Iberia of €262 million, mainly
for wind plants (€255 million) and solar plants (€14 million)
due to the fact that most of the projects in the pipeline
were built in 2019.
Results by business area

74 Half-Year Financial Report at June 30, 202074 Half-Year Financial Report at June 30, 2020

75
Conden
sed inte
rim
conso
lidat
ed fi
nan
cial
sta
tem
ents
Inte
rim
rep
ort
on o
per
atio
ns
Infrastructure and Networks
Operations
Electricity transport
Millions of kWh 1st Half
2020 2019 Change
Electricity transported on Enel’s distribution grid (1) 228,720 249,486 (20,766) -8.3%
- of which Italy 98,719 110,864 (12,145) -11.0%
- of which Iberia 58,788 62,346 (3,558) -5.7%
- of which Latin America 63,845 68,492 (4,647) -6.8%
- of which Europe 7,368 7,784 (416) -5.3%
End users with active smart meters (no.) 44,736,784 44,165,543 571,241 1.3%
(1) The figure for 2019 reflects a more accurate measurement of amounts transported.
The decrease of 8.3% in electricity transported on the grid
in the 1st Half of 2020 generally reflected the effects of the
COVID-19 health emergency, with the following main impacts
by geographical area:
> Italy (-11.0%), mainly due to the decline in demand for
electricity distributed to low-voltage customers, especially
power for non-residential use (-1.36 TWh), and medium-vol-
tage customers (-1.18 TWh). The demand for electricity
from high- and very high-voltage customers also fell slight-
ly (-0.49 TWh);
> Iberia (-5.7%), due essentially to the decline in power tran-
sported by Edistribución Redes Digitales SL;
> Latin America (-6.8%), largely due to the decline in whee-
ling volumes, mainly in Brazil;
> Europe (-5.3%), owing to the decline in electricity distribu-
ted in Romania.
Average frequency of interruptions per customer
1st Half
SAIFI (average no.) 2020 2019 (1) Change
Italy 1.7 1.9 (0.2) -10.5%
Iberia 1.4 1.4 - -
Argentina 5.1 6.0 (0.9) -15.0%
Brazil 5.4 5.8 (0.4) -6.9%
Chile 1.5 1.6 (0.1) -6.3%
Colombia 6.7 6.8 (0.1) -1.5%
Peru 2.6 2.8 (0.2) -7.1%
Romania 3.6 4.1 (0.5) -12.2%
(1) At December 31, 2019.
Results by business area

76 Half-Year Financial Report at June 30, 2020
Average duration of interruptions per customer
1st Half
SAIDI (average min.) 2020 2019 (1) Change
Italy 44.6 48.5 (3.9) -8.0%
Iberia 72.3 75.8 (3.5) -4.6%
Argentina 1,052.0 1,214.1 (162.1) -13.4%
Brazil 646.2 728.8 (82.6) -11.3%
Chile 174.0 184.1 (10.1) -5.5%
Colombia 617.5 666.6 (49.1) -7.4%
Peru 414.0 418.9 (4.9) -1.2%
Romania 137.8 169.6 (31.8) -18.8%
(1) At December 31, 2019.
As indicated in the table, the most significant service interruptions occurred in Argentina, due in particular to faults in high-vol-
tage transmission systems not operated by the Group.
1st Half
Grid losses (average %) 2020 2019 (1) Change
Italy 4.7 4.7 - -
Iberia 7.4 7.5 (0.1) -0.9%
Argentina 15.9 15.5 0.4 2.7%
Brazil 13.2 12.8 0.4 3.4%
Chile 5.2 5.0 0.2 4.4%
Colombia 7.5 7.7 (0.2) -3.0%
Peru 8.3 8.2 0.1 1.0%
Romania 9.4 9.7 (0.3) -3.4%
(1) At December 31, 2019.
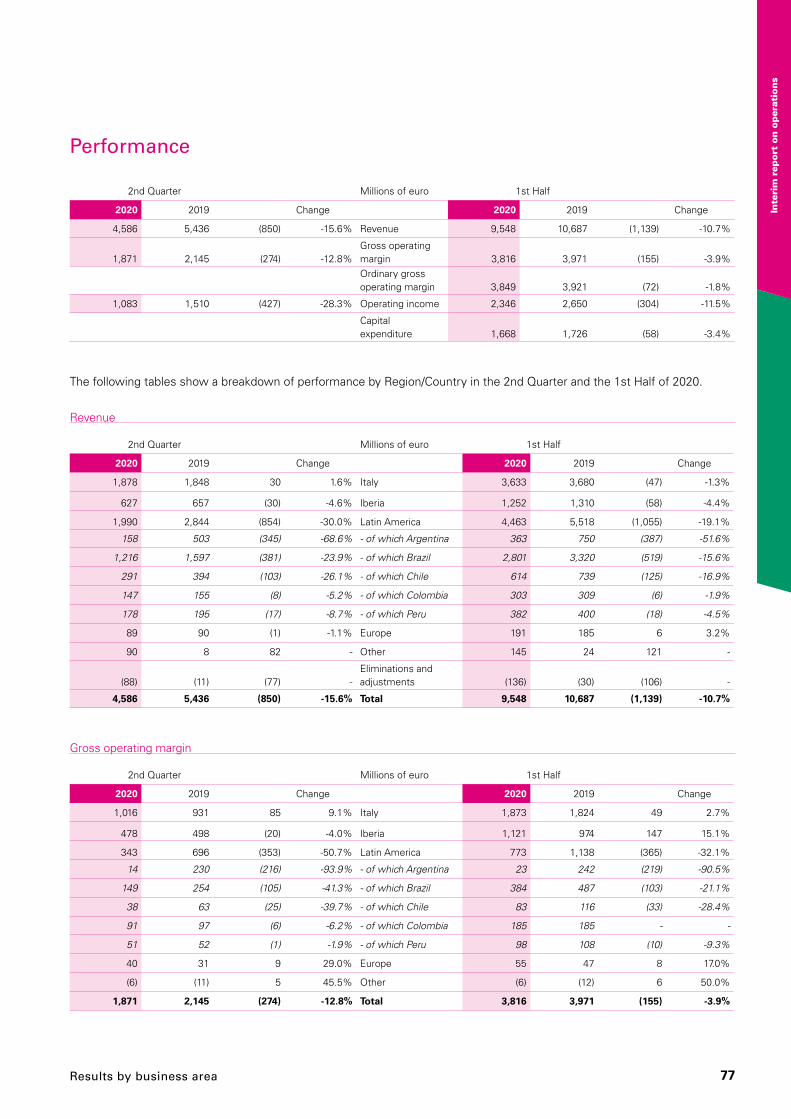
77
Conden
sed inte
rim
conso
lidat
ed fi
nan
cial
sta
tem
ents
Inte
rim
rep
ort
on o
per
atio
ns
Performance
2nd Quarter Millions of euro 1st Half
2020 2019 Change 2020 2019 Change
4,586 5,436 (850) -15.6% Revenue 9,548 10,687 (1,139) -10.7%
1,871 2,145 (274) -12.8%Gross operating margin 3,816 3,971 (155) -3.9%Ordinary gross operating margin 3,849 3,921 (72) -1.8%
1,083 1,510 (427) -28.3% Operating income 2,346 2,650 (304) -11.5%
Capital expenditure 1,668 1,726 (58) -3.4%
The following tables show a breakdown of performance by Region/Country in the 2nd Quarter and the 1st Half of 2020.
Revenue
2nd Quarter Millions of euro 1st Half
2020 2019 Change 2020 2019 Change
1,878 1,848 30 1.6% Italy 3,633 3,680 (47) -1.3%
627 657 (30) -4.6% Iberia 1,252 1,310 (58) -4.4%
1,990 2,844 (854) -30.0% Latin America 4,463 5,518 (1,055) -19.1%
158 503 (345) -68.6% - of which Argentina 363 750 (387) -51.6%
1,216 1,597 (381) -23.9% - of which Brazil 2,801 3,320 (519) -15.6%
291 394 (103) -26.1% - of which Chile 614 739 (125) -16.9%
147 155 (8) -5.2% - of which Colombia 303 309 (6) -1.9%
178 195 (17) -8.7% - of which Peru 382 400 (18) -4.5%
89 90 (1) -1.1% Europe 191 185 6 3.2%
90 8 82 - Other 145 24 121 -
(88) (11) (77) -Eliminations and adjustments (136) (30) (106) -
4,586 5,436 (850) -15.6% Total 9,548 10,687 (1,139) -10.7%
Gross operating margin
2nd Quarter Millions of euro 1st Half
2020 2019 Change 2020 2019 Change
1,016 931 85 9.1% Italy 1,873 1,824 49 2.7%
478 498 (20) -4.0% Iberia 1,121 974 147 15.1%
343 696 (353) -50.7% Latin America 773 1,138 (365) -32.1%
14 230 (216) -93.9% - of which Argentina 23 242 (219) -90.5%
149 254 (105) -41.3% - of which Brazil 384 487 (103) -21.1%
38 63 (25) -39.7% - of which Chile 83 116 (33) -28.4%
91 97 (6) -6.2% - of which Colombia 185 185 - -
51 52 (1) -1.9% - of which Peru 98 108 (10) -9.3%
40 31 9 29.0% Europe 55 47 8 17.0%
(6) (11) 5 45.5% Other (6) (12) 6 50.0%
1,871 2,145 (274) -12.8% Total 3,816 3,971 (155) -3.9%
Results by business area

78 Half-Year Financial Report at June 30, 2020
The gross operating margin declined for the following re-
asons:
> in Latin America, reflecting the decline in wheeling volu-
mes as a result of COVID-19 and adverse exchange rate
developments, especially in Brazil;
> in Argentina, reflecting the effect of the recognition in the
1st Half of 2019 of the agreement between Edesur and the
Argentine government settling reciprocal disputes origina-
ted between 2006 and 2016 (€215 million).
These factors were partly offset by:
> an increase in the margin in Iberia of €147 million, reflecting
in particular the signing in the 1st Half of 2020 of the 5th
Endesa Collective Bargaining Agreement, which modified
the electricity discount benefit for employees and former
employees and thereby led to the reversal of the associated
provision in the total amount of €269 million. This positive
effect was only partly offset by the provision of €91 million
for the voluntary early termination of employment and the
adverse effect of the application of the new regulatory fra-
mework in Spain, which entered force for 2020-2025;
> an increase in the margin in Italy, due essentially to the in-
come associated with the application of the Regulatory Au-
thority for Energy, Networks and the Environment (ARERA)
Resolutions nos. 50/2018 and 568/2019 for the agreement
reached with a trader in bankruptcy proceedings (€156 mil-
lion). This factor was partly offset by the indemnity for the
disposal of Enel Rete Gas (€50 million) and the decline in
the margin as a result of the decrease in wheeling volumes
due to the COVID-19 emergency.
The ordinary gross operating margin decreased by €72
million compared with 2019. Extraordinary items generated
an increase of €83 million in the ordinary gross operating
margin, bearing in mind that the figures for 2020 include
costs of €33 million incurred mainly in Italy and Brazil in re-
sponding to the COVID-19 pandemic for the sanitization of
workplaces, personal protective equipment and donations,
while in the previous year they had included the additional
indemnity (€50 million) connected with the disposal of Enel
Rete Gas in 2009.
Operating income
2nd Quarter Millions of euro 1st Half
2020 2019 Change 2020 2019 Change
591 676 (85) -12.6% Italy 1,169 1,308 (139) -10.6%
297 334 (37) -11.1% Iberia 752 618 134 21.7%
180 504 (324) -64.3% Latin America 418 737 (319) -43.3%
11 222 (211) -95.0%- of which Argentina 13 226 (213) -94.2%
44 122 (78) -63.9% - of which Brazil 152 202 (50) -24.8%
26 50 (24) -48.0% - of which Chile 60 92 (32) -34.8%
66 73 (7) -9.6%- of which Colombia 131 139 (8) -5.8%
33 37 (4) -10.8% - of which Peru 62 78 (16) -20.5%
21 7 14 - Europe 14 - 14 -
(6) (11) 5 45.5% Other (7) (13) 6 46.2%
1,083 1,510 (427) -28.3% Total 2,346 2,650 (304) -11.5%
Operating income, including depreciation, amortization and
impairment of €1,470 million (€1,321 million in the 1st Half
of 2019), essentially reflects the developments discussed for
the gross operating margin for the period and an increase in
depreciation and amortization recognized in Italy following
the entry into service of investments carried out in 2019 as
well as the increase in writedowns of receivables in Italy. In
particular, e-distribuzione wrote down its receivable due from
a trader (€156 million) under the provisions of an agreement
reached in bankruptcy proceedings for which under the provi-
sions of ARERA Resolutions nos. 50/2018 and 568/2019 the
Group recognized associated revenue in the same amount.

79
Conden
sed inte
rim
conso
lidat
ed fi
nan
cial
sta
tem
ents
Inte
rim
rep
ort
on o
per
atio
ns
Capital expenditure
Millions of euro 1st Half
2020 2019 Change
Italy 803 843 (40) -4.7%
Iberia 242 234 8 3.4%
Latin America 537 579 (42) -7.3%
Europe 85 69 16 23.2%
Other 1 1 - -
Total 1,668 1,726 (58) -3.4%
Capital expenditure decreased by a total of €58 million on
the year-earlier period. More specifically, the decline was
mainly registered in Argentina and in Italy as a result of the
lockdowns imposed in response to the COVID-19 pandemic.
Results by business area

80 Half-Year Financial Report at June 30, 202080 Half-Year Financial Report at June 30, 2020

81
Conden
sed inte
rim
conso
lidat
ed fi
nan
cial
sta
tem
ents
Inte
rim
rep
ort
on o
per
atio
ns
End-user Markets
Operations
Electricity sales
Millions of kWh 1st Half
2020 2019 Change
Free market 76,780 83,779 (6,999) -8.4%
Regulated market 68,218 74,370 (6,152) -8.3%
Total (1) 144,998 158,149 (13,151) -8.3%
- of which Italy 43,198 47,681 (4,483) -9.4%
- of which Iberia 39,038 43,134 (4,096) -9.5%
- of which Latin America (1) 58,373 62,394 (4,021) -6.4%
- of which Europe 4,389 4,940 (551) -11.2%
(1) Volumes include sales to large customers by generation companies in Latin America. The figure for the 1st Half of 2019 has consequently been adjusted to ensure comparability.
The decline in electricity sold in the 1st Half of 2020 sub-
stantially reflects the lower quantities sold in Italy and Spain.
In Italy, the decrease was due to smaller sales on both the
regulated market and free market, mainly attributable to the
effects of the COVID-19 pandemic, which for the free market
produced a decrease in volumes sold in business-to-business
(B2B) transactions, partly offset by an increase in quantities
sold in Italy to residential customers (B2C - “business to con-
sumer”). In the regulated market, the decline was attributable
to a contraction in the number of customers compared with
the same period of 2019. In Spain, the change is mainly due
to the decrease in consumption connected with the decline
in the demand for electricity in the country.
Natural gas sales
Millions of m3 1st Half
2020 2019 Change
Business to consumer 2,191 2,353 (162) -6.9%
Business to business 3,122 3,692 (570) -15.4%
Total 5,313 6,045 (732) -12.1%
- of which Italy 2,659 2,945 (286) -9.7%
- of which Iberia 2,588 3,090 (502) -16.2%
- of which Europe 66 10 56 -
The reduction in natural gas sales in the first six months of 2020 compared with the same period of 2019 mainly reflects a
reduction in consumption in Italy and Spain.
Results by business area

82 Half-Year Financial Report at June 30, 2020
Performance
2nd Quarter Millions of euro 1st Half
2020 2019 Change 2020 2019 Change
6,056 7,558 (1,502) -19.9% Revenue 14,417 16,841 (2,424) -14.4%
649 800 (151) -18.9%Gross operating margin 1,582 1,661 (79) -4.8%Ordinary gross operating margin 1,591 1,661 (70) -4.2%
302 515 (213) -41.4% Operating income 929 1,171 (242) -20.7%
Capital expenditure 182 187 (5) -2.7%
The following tables show a breakdown of performance by Region/Country in the 2nd Quarter and the 1st Half of 2020.
Revenue
2nd Quarter Millions of euro 1st Half
2020 2019 Change 2020 2019 Change
2,928 3,538 (610) -17.2% Italy 7,148 8,222 (1,074) -13.1%
2,490 3,341 (851) -25.5% Iberia 5,931 7,244 (1,313) -18.1%
379 417 (38) -9.1% Latin America 759 814 (55) -6.8%
1 34 (33) -97.1% - of which Argentina 2 36 (34) -94.4%
66 102 (36) -35.3% - of which Brazil 158 209 (51) -24.4%
60 71 (11) -15.5% - of which Chile 140 144 (4) -2.8%
167 195 (28) -14.4% - of which Colombia 361 395 (34) -8.6%
85 15 70 - - of which Peru 98 30 68 -
(1) 3 (4) - North America (1) 3 (4) -
260 259 1 0.4% Europe 580 558 22 3.9%
- - - -Eliminations and adjustments - - - -
6,056 7,558 (1,502) -19.9% Total 14,417 16,841 (2,424) -14.4%
Gross operating margin
2nd Quarter Millions of euro 1st Half
2020 2019 Change 2020 2019 Change
515 484 31 6.4% Italy 1,134 1,167 (33) -2.8%
64 195 (131) -67.2% Iberia 305 324 (19) -5.9%
47 102 (55) -53.9% Latin America 105 173 (68) -39.3%
(1) 20 (21) - - of which Argentina (3) 16 (19) -
23 40 (17) -42.5% - of which Brazil 55 83 (28) -33.7%
4 10 (6) -60.0% - of which Chile 15 19 (4) -21.1%
16 25 (9) -36.0% - of which Colombia 27 39 (12) -30.8%
5 7 (2) -28.6% - of which Peru 11 16 (5) -31.3%
(1) 3 (4) - North America (1) 3 (4) -
24 16 8 50.0% Europe 39 (6) 45 -
649 800 (151) -18.9% Total 1,582 1,661 (79) -4.8%

83
Conden
sed inte
rim
conso
lidat
ed fi
nan
cial
sta
tem
ents
Inte
rim
rep
ort
on o
per
atio
ns
The gross operating margin in the 1st Half of 2020 decre-
ased, essentially reflecting the effect of COVID-19, which
reduced sales volumes in Italy, Spain and Brazil, as well as
adverse developments in the exchange rates of the South
American currencies against the euro, especially the Brazilian
real.
In Argentina, the change in the margin mainly reflected the
effect of the recognition in the 1st Half of 2019 of the sett-
lement agreement between Edesur and the Argentine go-
vernment resolving outstanding disputes originated between
2006 and 2016 (€31 million).
These factors were partly offset by a reduction in costs for
provisioning energy commodities, above all in Spain (price
effect) and an increase in margins on the regulated and free
markets in Romania.
The ordinary gross operating margin decreased by €70
million compared with the 1st Half of 2019. The only extraor-
dinary item present in 2020 is represented by costs incurred
(€9 million) in responding to the COVID-19 pandemic for the
sanitization of workplaces, personal protective equipment
and donations.
Operating income
2nd Quarter Millions of euro 1st Half
2020 2019 Change 2020 2019 Change
319 320 (1) -0.3% Italy 758 883 (125) -14.2%
(14) 156 (170) - Iberia 186 247 (61) -24.7%
(17) 26 (43) - Latin America (36) 53 (89) -
(2) 5 (7) - - of which Argentina (16) (10) (6) -60.0%
(21) (14) (7) -50.0% - of which Brazil (44) 6 (50) -
(3) 7 (10) - - of which Chile 3 13 (10) -76.9%
7 22 (15) -68.2% - of which Colombia 15 31 (16) -51.6%
2 6 (4) -66.7% - of which Peru 6 13 (7) -53.8%
(2) 3 (5) - North America (2) 3 (5) -
16 10 6 60.0% Europe 23 (15) 38 -
- - - -Eliminations and adjustments - - - -
302 515 (213) -41.4% Total 929 1,171 (242) -20.7%
Operating income, including the effect of depreciation,
amortization and impairment of €653 million (€490 million in
the 1st Half of 2019), declined above all due to the factors
discussed for the gross operating margin. The increase in
depreciation, amortization and impairment reflected capital
expenditure on projects that entered service last year and an
increase in writedowns of trade receivables in Italy and Spain
following the deterioration in the profile of collections as a
result of COVID-19.
Capital expenditure
Millions of euro 1st Half
2020 2019 Change
Italy 135 144 (9) -6.3%
Iberia 43 36 7 19.4%
Latin America - - - -
Europe 4 7 (3) -42.9%
Total 182 187 (5) -2.7%
Capital expenditure was essentially unchanged on the same period of the previous year.
Results by business area

84 Half-Year Financial Report at June 30, 202084 Half-Year Financial Report at June 30, 2020

85
Conden
sed inte
rim
conso
lidat
ed fi
nan
cial
sta
tem
ents
Inte
rim
rep
ort
on o
per
atio
ns
Enel X
Operations
1st Half
2020 2019 Change
Demand response capacity (MW) 6,128 6,023 105 1.7%
Lighting points (no.) 2,360 2,400 (40) -1.7%
Storage (MW) (1) 63.6 62.4 1.2 1.9%
Charging points (no.) 89,301 63,352 25,949 41.0%
(1) Does not include Storage on Plant. The 2019 figure is at December 31.
In the 1st Half of the year, the Group further expanded char-
ging infrastructure for electric vehicles: charging points sold
to private buyers increased by 22,457, mainly in North Ame-
rica, while public charging points expanded by 3,492, mainly
in Italy.
Performance
2nd Quarter Millions of euro 1st Half
2020 2019 Change 2020 2019 Change
240 299 (59) -19.7% Revenue 463 492 (29) -5.9%
16 69 (53) -76.8%Gross operating margin 23 72 (49) -68.1%Ordinary gross operating margin 25 72 (47) -65.3%
(22) 19 (41) - Operating income (48) (8) (40) -
Capital expenditure 103 105 (2) -1.9%
The following tables show a breakdown of performance by Region/Country in the 2nd Quarter and the 1st Half of 2020.
Results by business area

86 Half-Year Financial Report at June 30, 2020
Revenue
2nd Quarter Millions of euro 1st Half
2020 2019 Change 2020 2019 Change
81 69 12 17.4% Italy 153 128 25 19.5%
58 65 (7) -10.8% Iberia 113 122 (9) -7.4%
35 33 2 6.1% Latin America 72 71 1 1.4%
- - - -- of which Argentina 1 - 1 -
2 4 (2) -50.0% - of which Brazil 5 7 (2) -28.6%
16 12 4 33.3% - of which Chile 27 29 (2) -6.9%
16 16 - -- of which Colombia 37 33 4 12.1%
1 1 - - - of which Peru 2 2 - -
42 121 (79) -65.3% North America 68 145 (77) -53.1%
12 8 4 50.0% Europe 22 14 8 57.1%
8 8 - -Africa, Asia and Oceania 28 23 5 21.7%
27 13 14 - Other 49 21 28 -
(23) (18) (5) -27.8%Eliminations and adjustments (42) (32) (10) -31.3%
240 299 (59) -19.7% Total 463 492 (29) -5.9%
Gross operating margin
2nd Quarter Millions of euro 1st Half
2020 2019 Change 2020 2019 Change
6 3 3 - Italy 9 - 9 -
10 11 (1) -9.1% Iberia 25 23 2 8.7%
12 9 3 33.3% Latin America 23 19 4 21.1%
(1) (1) - - - of which Brazil (3) (2) (1) -50.0%
4 2 2 - - of which Chile 4 3 1 33.3%
10 8 2 25.0%- of which Colombia 23 18 5 27.8%
(1) - (1) - - of which Peru (1) - (1) -
(5) 54 (59) - North America (20) 43 (63) -
2 (1) 3 - Europe 3 - 3 -
(3) (2) (1) -50.0%Africa, Asia and Oceania (1) (3) 2 -66.7%
(6) (5) (1) -20.0% Other (16) (10) (6) -60.0%
16 69 (53) -76.8% Total 23 72 (49) -68.1%
The decrease in the gross operating margin mainly
reflected the effect of the recognition in 2019 of non-recur-
ring revenue of €58 million in respect of the price adjustment
for the acquisition of eMotorWerks in 2017, in application of
a number of contractual clauses. Enel X experienced a sharp
slowdown, especially in Italy and in the United States, in the
development of its innovative businesses as a result of the
restrictive measures adopted by governments in response to
the COVID-19 health emergency.
The ordinary gross operating margin amounted to €25
million, a decrease of €47 million compared with the year-e-
arlier period. The only extraordinary item in 2020 is repre-
sented by costs of €2 million incurred for the sanitization of
workplaces, personal protective equipment and donations in
connection with the COVID-19 pandemic.

87
Conden
sed inte
rim
conso
lidat
ed fi
nan
cial
sta
tem
ents
Inte
rim
rep
ort
on o
per
atio
ns
Operating income
2nd Quarter Millions of euro 1st Half
2020 2019 Change 2020 2019 Change
(8) (7) (1) -14.3% Italy (15) (17) 2 11.8%
4 (5) 9 - Iberia 10 (1) 11 -
10 7 3 42.9% Latin America 19 13 6 46.2%
(2) (2) - - - of which Brazil (4) (2) (2) -
3 2 1 50.0% - of which Chile 2 3 (1) -33.3%
10 7 3 42.9%- of which Colombia 22 12 10 83.3%
(1) - (1) - - of which Peru (1) - (1) -
(18) 35 (53) - North America (42) 15 (57) -
- - - - Europe - (1) 1 -
(3) (4) 1 25.0%Africa, Asia and Oceania (2) (4) 2 -50.0%
(7) (7) - - Other (18) (13) (5) -38.5%
(22) 19 (41) - Total (48) (8) (40) -
Developments in the operating loss are broadly in line with the decrease in the gross operating margin.
Capital expenditure
Millions of euro 1st Half
2020 2019 Change
Italy 27 23 4 17.4%
Iberia 22 23 (1) -4.3%
Latin America 7 10 (3) -30.0%
North America 23 23 - -
Europe - 2 (2) -
Africa, Asia and Oceania 2 - 2 -
Other 22 24 (2) -8.3%
Total 103 105 (2) -1.9%
Capital expenditure decreased slightly overall, but developments in the various countries were in line with the same period
of 2019.
Results by business area

88 Half-Year Financial Report at June 30, 202088 Half-Year Financial Report at June 30, 2020

89
Conden
sed inte
rim
conso
lidat
ed fi
nan
cial
sta
tem
ents
Inte
rim
rep
ort
on o
per
atio
ns
Services and Other
Performance
2nd Quarter Millions of euro 1st Half
2020 2019 Change 2020 2019 Change
497 578 (81) -14.0% Revenue 951 1,026 (75) -7.3%
(61) 9 (70) -Gross operating margin (68) 24 (92) -Ordinary gross operating margin (40) 24 (64) -
(109) (38) (71) - Operating income (165) (71) (94) -
Capital expenditure 33 41 (8) -19.5%
The tables below show a breakdown of performance by Region/Country in the 2nd Quarter and the 1st Half of 2020.
Revenue
2nd Quarter Millions of euro 1st Half
2020 2019 Change 2020 2019 Change
188 327 (139) -42.5% Italy 359 620 (261) -42.1%
95 182 (87) -47.8% Iberia 212 263 (51) -19.4%
1 10 (9) -90.0% Latin America 3 17 (14) -82.4%
5 4 1 25.0% Europe 12 12 - -
251 72 179 - Other 459 142 317 -
(43) (17) (26) -Eliminations and adjustments (94) (28) (66) -
497 578 (81) -14.0% Total 951 1.026 (75) -7.3%
Gross operating margin
2nd Quarter Millions of euro 1st Half
2020 2019 Change 2020 2019 Change
21 40 (19) -47.5% Italy 33 81 (48) -59.3%
(16) 17 (33) - Iberia 2 44 (42) -95.5%
(31) (21) (10) -47.6% Latin America (54) (49) (5) -10.2%
(1) - (1) - North America (1) - (1) -
1 - 1 - Europe 2 2 - -
(35) (27) (8) -29.6% Other (50) (54) 4 7.4%
(61) 9 (70) - Total (68) 24 (92) -
The deterioration in the gross operating margin in the 1st
Half of 2020 mainly reflects the decrease in the margin in
Italy of €48 million, mainly owing to the decrease in revenue
from services and customer contracts with other Group com-
panies. This factor was only partly offset by the decrease in
costs for services and personnel costs. These developments
were mainly attributable to the demerger of the Global Pro-
curement and Global Digital Solutions units, which are now
reported in part under “Other”, whose gross operating mar-
gin improved by €4 million. The reduction of the margin in
Spain is mainly due to an increase in costs for the provision
for the Plan de Salida on the basis of the changes made with
Results by business area

90 Half-Year Financial Report at June 30, 2020
the “agreement on voluntary measures to suspend or termi-
nate employment contracts”, partly offset by the reversal of
the provision for the electricity discount benefit following the
signing of the 5th Endesa Collective Bargaining Agreement.
The margin in both Italy and Spain was reduced by costs for
COVID-19 donations.
The ordinary gross operating margin decreased by €64
million compared with the 1st Half of 2019. The only extraor-
dinary item present in 2020 is represented by costs incurred
(€28 million) in responding to the COVID-19 pandemic for the
sanitization of workplaces, personal protective equipment
and donations.
Operating income
2nd Quarter Millions of euro 1st Half
2020 2019 Change 2020 2019 Change
3 7 (4) -57.1% Italy (1) 20 (21) -
(24) 13 (37) - Iberia (16) 25 (41) -
(30) (23) (7) -30.4% Latin America (54) (52) (2) -3.8%
- - - - North America (1) - (1) -
1 (1) 2 - Europe 1 1 - -
(59) (34) (25) -73.5% Other (94) (65) (29) -44.6%
(109) (38) (71) - Total (165) (71) (94) -
The operating loss in the 1st Half of 2020 broadly reflects the reduction in the gross operating margin.
Capital expenditure
Millions of euro 1st Half
2020 2019 Change
Italy 5 21 (16) -76.2%
Iberia 5 10 (5) -50.0%
Other 23 10 13 -
Total 33 41 (8) -19.5%
The decrease in capital expenditure in the first six months of 2020 is attributable to a decline in spending in Italy.

91
Conden
sed inte
rim
conso
lidat
ed fi
nan
cial
sta
tem
ents
Inte
rim
rep
ort
on o
per
atio
ns
Definition of performance indicators
In order to present the results of the Group and analyze its
financial structure, in the condensed interim consolidated fi-
nancial statements Enel has prepared separate reclassified
schedules that differ from the schedules envisaged under
the IFRS-EU adopted by the Group. These reclassified sche-
dules contain different performance indicators from those
obtained directly from the condensed interim consolidated
financial statements, which management believes are useful
in monitoring the performance of the Group and representati-
ve of the financial performance of our business.
With regard to those indicators, on December 3, 2015, CON-
SOB issued Communication no. 92543/15, which gives force
to the Guidelines issued on October 5, 2015, by the Euro-
pean Securities and Markets Authority (ESMA) concerning
the presentation of alternative performance measures in
regulated information disclosed or prospectuses published
as from July 3, 2016. These Guidelines, which update the
previous CESR Recommendation (CESR/05-178b), are inten-
ded to promote the usefulness and transparency of alternati-
ve performance indicators included in regulated information
or prospectuses within the scope of application of Directive
2003/71/EC in order to improve their comparability, reliability
and comprehensibility.
Accordingly, in line with the regulations cited above, the crite-
ria used to construct these indicators are the following.
Gross operating margin: an operating performance indicator,
calculated as “Operating income” plus “Depreciation, amor-
tization and impairment losses”.
Ordinary gross operating margin: it is calculated by adju-
sting the “Gross operating margin” for all items generated
by non-recurring transactions, such as acquisitions or dispo-
sals of businesses (for example, capital gains and losses),
with the exception of those transactions carried out in the
renewable segment, related to the new “Build, Sell and
Operate” business model launched in the 4th Quarter of
2016, where the income from the disposal (or repurchase)
of projects represents an ordinary activity for the Group. As
a result of the COVID-19 emergency, as from the 1st Quarter
of 2020 extraordinary items also include costs incurred in re-
sponding to the COVID-19 pandemic (such as, for example,
for the sanitization of workplaces, personal protective equip-
ment and donations).
Ordinary operating income: it is calculated by adjusting the
“Operating income” for the effects of the non-recurring tran-
sactions referred to with regard to the ordinary gross opera-
ting margin, as well as significant impairment losses on as-
sets, including following impairment testing or classification
under “Assets held for sale”.
Group ordinary net income: it is defined as “Group net in-
come” generated by Enel’s core business and is equal to
“Group net income” excluding the impact on it (and therefo-
re net of any tax effects and non-controlling interests) of the
items discussed under “Ordinary operating income”.
Net non-current assets: calculated as the difference between
“Non-current assets” and “Non-current liabilities” with the
exception of:
> “Deferred tax assets”;
> “Securities” and “Other financial receivables” included in
“Other non-current financial assets”;
> “Long-term borrowings”;
> “Employee benefits”;
> “Provisions for risks and charges (non-current portion)”;
> “Deferred tax liabilities”.
Net current assets: calculated as the difference between “Cur-
rent assets” and “Current liabilities” with the exception of:
> “Current portion of long-term financial receivables”, “Facto-
ring receivables”, “Securities”, “Cash collateral” and “Other
financial receivables” included in “Other current financial
assets”;
> “Cash and cash equivalents”;
> “Short-term borrowings” and the “Current portion of long-
term borrowings”;
> “Provisions for risks and charges (current portion)”;
> “Other financial payables” included in “Other current lia-
bilities”.
Net assets held for sale: calculated as the algebraic sum of
“Assets held for sale” and “Liabilities held for sale”.
Net capital employed: calculated as the sum of “Net non-cur-
rent assets” and “Net current assets”, “Provisions for risks
and charges”, “Deferred tax liabilities” and “Deferred tax as-
sets”, as well as “Net assets held for sale”.
Definition of performance indicators

92 Half-Year Financial Report at June 30, 2020
Net financial debt: a financial structure indicator, determined
by:
> “Long-term borrowings” and “Short-term borrowings
and the current portion of long-term borrowings”, taking
account of “Short-term financial payables” included in
“Other current liabilities”;
> net of “Cash and cash equivalents”;
> net of the “Current portion of long-term financial recei-
vables”, “Factoring receivables”, “Cash collateral” and
“Other financial receivables” included in “Other current
financial assets”;
> net of “Securities” and “Other financial receivables” inclu-
ded in “Other non-current financial assets”.
More generally, the net financial debt of the Enel Group is cal-
culated in accordance with paragraph 127 of Recommendation
CESR/05-054b implementing Regulation (EC) no. 809/2004
and in line with the CONSOB instructions of July 28, 2006, net
of financial receivables and long-term securities.

93
Conden
sed inte
rim
conso
lidat
ed fi
nan
cial
sta
tem
ents
Inte
rim
rep
ort
on o
per
atio
ns
Regulatory and rate issues
Compared with the consolidated financial statements at De-
cember 31, 2019, which readers are invited to consult for
a more detailed discussion of developments, the following
section reports the main changes in the period with regard
to regulatory and rate issues in the countries in which Enel
operates.
The European regulatory framework
Recovery PlanTo contribute to the revitalization of the European economy
following the pandemic, in May 2020 the European Commis-
sion proposed a Recovery Plan with a total value of €1,850
billion. It provides for reinforcing the multiannual financial fra-
mework for 2021-2027 by €1,100 billion to rapidly direct in-
vestment where it is most needed (strengthening the Single
Market, driving the green and digital transition and intensi-
fying cooperation in areas such as health and crisis manage-
ment) and establishes a new instrument – Next Generation
EU – worth a total of €750 billion (€500 billion in the form of
grants and guarantees and €250 billion in loans) to tempo-
rarily (2021-2024) increase the resources available in the EU
budget and support an immediate response to the crisis by
kick-starting the European economy through sustainable and
resilient growth.
With particular regard to Next Generation EU, the most si-
gnificant resources (around 85%) are focused on supporting
Member States to support investments and reforms. In par-
ticular, the Recovery and Resilience Facility is the largest in-
strument. It provides for the allocation of €560 billion (€310
billion in the form of grants and €250 billion in loans) to sup-
port investments and essential reforms for a lasting recovery
(with a focus on investments connected with the green and
digital transitions). In addition, the program would significant-
ly increase the resources of the Just Transition Fund, adding
€32.5 billion to bring the resources available to this program
to €40 billion.
The second pillar of Next Generation EU is made up of in-
struments to kick-start the economy and help private invest-
ment in key sectors and technologies, and to provide urgent
support to viable companies threatened by the crisis. It will
provide €55 billion in EU guarantees to ensure support for
healthy businesses affected by the pandemic and address
any solvency problems (Solvency Support Instrument), and
strengthen the investment capacity of companies and build
strategic autonomy in the vital European value chain (Invest
EU program - Strategic Investment Facility).
The third pillar of Next Generation EU consists of measures to
learn the lessons from the crisis and respond to the strategic
challenges facing Europe. This represents about €40 billion in
additional resources to strengthen health security and prepa-
re for future health crises: EU4Health; reinforced RescEU, the
EU Civil Protection Mechanism to respond to the large-scale
emergencies; and strengthening other programs to enable
them fully play their role in making the Union more resilient
and address the challenges posed by the pandemic and its
consequences (Horizon Europe, Digital Europe, neighborho-
od instruments, development cooperation and international
cooperation, humanitarian aid, etc.).
The European Green DealFollowing the European Green Deal communication presen-
ted at the end of 2019, in the 1st Half of 2020 the European
Commission published a series of legislative and non-legisla-
tive initiatives aimed at implementing the principles set out in
the communication.
European Climate LawThe proposal for a European Regulation, presented by the
Commission on March 4, 2020 and currently under discus-
sion in the European Parliament and the Council, would make
the objective set in the European Green Deal to make the Eu-
ropean economy and society climate neutral by 2050 legally
binding. This means achieving net zero greenhouse gas emis-
sions (balance between emissions and absorption) for EU
countries as a whole, mainly by cutting emissions, investing
in green technologies and protecting the natural environment.
Once approved, this would incorporate the objective of clima-
te neutrality for 2050 in Union legislation for the first time.
Regulatory and rate issues

94 Half-Year Financial Report at June 30, 2020
The European Commission proposal also includes the goal
of reducing greenhouse gas emissions by 50-55% by 2030,
while a more ambitious reduction target of 65% has been
proposed in the European Parliament.
To pursue this objective, the proposal for an EU Regulation
also provides that all European policies should be revised to
ensure they contribute to achieving climate neutrality, so that
all sectors of the European economy do their part. By 2021,
the European Commission will propose a review of all policy
instruments necessary to achieve the additional reductions
planned for 2030.
Industrial StrategyThe new Industrial Strategy was presented on March 10,
2020. It is intended to maintain the global competitiveness of
European industry, make Europe climate neutral by 2050 and
shape Europe’s digital future. The strategy proposes a series
of initiatives (legislative and non-legislative) to support all the
players in European industry, from large to small businesses,
research centers and start-ups. Actions include comprehensi-
ve measures to modernize and decarbonize energy-intensive
industries, to support sustainable and intelligent mobility in-
dustries, to promote energy efficiency and to ensure a suffi-
cient and secure supply of low-carbon energy at competitive
prices. The Industrial Strategy also envisages the launch of
a series of new alliances, such as the European Clean Hy-
drogen Alliance, to accelerate the decarbonization of industry
and maintain industrial leadership, followed by an alliance for
low-carbon industries, one for industrial clouds and platforms
and one for raw materials. In addition to a complete series of
actions, both horizontal and in favor of specific technologies,
the Commission will systematically analyze the risks and ne-
eds of the various industrial ecosystems. In performing this
analysis, the Commission will work in close collaboration with
an open and inclusive industrial forum, which will be set up by
September 2020.
Communication on “Shaping Europe’s digital future”On February 19, 2020, the Commission presented strategies
for data and artificial intelligence (AI). This communication intro-
duces a series of legislative and non-legislative initiatives, with
the aim of developing technology at the service of citizens and
creating a fair and competitive digital economy. The areas in-
volved in these initiatives are manifold: creation of digital skills,
regulation of competition and platforms (through a proposal for
a Digital Services Act) and climate neutrality by 2050.
In more detail, the aim of the European data strategy is to
ensure that the EU takes on the role of model and guide for
companies made more autonomous thanks to data. The stra-
tegy essentially aims to create a true European data space
and a single market for data, in order to unlock so far unu-
sed data to enable their free movement within the European
Union in all sectors, thus benefiting businesses, researchers
and governments. The Commission proposes to establish a
regulatory framework for data governance, access to data
and reuse of data between businesses, between businesses
and governments and within governments. The Commission
intends to support the development of technological systems
and the next generation of infrastructure, which will allow the
EU and all operators to take advantage of the opportunities
offered by the data economy.
In the White Paper on Artificial Intelligence, the Commission
called for a reliable framework based on excellence and trust.
In a partnership between the public and private sectors, the
goal is to mobilize resources along the entire value chain and
create the right incentives to accelerate the adoption of solu-
tions based on AI. The document calls for clear rules to govern
high-risk AI systems without imposing excessive burdens on
less risky ones. The White Paper also underscores the fact
that strict EU rules must continue to apply to protect consu-
mers, to address unfair commercial practices and to protect
personal data and privacy.
Just Transition FundThe Just Transition Fund (JTF) is a funding instrument inclu-
ded within the Just Transition Mechanism (JTM), aimed at
supporting Member States in reducing the economic and so-
cial impacts of the transition to a climate-neutral economy.
The total resources (2021-2027) at Community level proposed
for the JTF, initially equal to €7.5 billion, were increased to €40
billion following the proposal of the Recovery Plan. Currently,
the Commission regulation is under discussion in the Euro-
pean Parliament while the European Council reached a partial
agreement on June 25 and is ready for negotiations with the
European Parliament.
Sustainable FinanceIn March 2020, the Taxonomy Expert Group presented its final
taxonomy report and a guide on recommendations for a Euro-
pean Green Bond standard. With reference to the taxonomy,
in June the European Parliament approved the EU Taxonomy
Regulation. The European Parliament’s approval followed the
adoption of the text by the Council on June 10, 2020. In the

95
Conden
sed inte
rim
conso
lidat
ed fi
nan
cial
sta
tem
ents
Inte
rim
rep
ort
on o
per
atio
ns
4th Quarter of 2020, the Commission is expected to adopt
a delegated regulation on taxonomy which will establish the
technical screening criteria for determining whether a specific
economic activity substantially contributes to achievement of
one or more of the EU’s environmental goals.
State aid decisionsOn March 19, 2020 and subsequently on April 3, May 8 and
June 29, 2020, the European Commission adopted a tempo-
rary framework for addressing the impact of the COVID-19
pandemic in order to support Member States with regard to
the use of State aid to provide the necessary liquidity to the
economic system, including SMEs, to facilitate its applica-
tion to all sectors and types of business affected by the crisis
(with the exception of the financial sector and for companies
already in difficulty at the end of 2019) and to help stabilize
the European economy while preserving the single market.
On May 28, 2020, the European Commission approved a sup-
port scheme for the generation of electricity in the Canary
Islands, Balearic Islands, Ceuta and Melilla within the State
aid framework for the provision of services of general econo-
mic interest (SGEI).
The Commission approved the scheme until the end of 2029
for the Canary Islands, Ceuta and Melilla and 2025 for the
Balearic Islands. In order to ensure the long-term security
of supply, Spain has undertaken to build a second subsea
connection between the mainland and Majorca by 2025. The
mechanism will compensate electricity generators fulfilling a
public service obligation for the additional cost of providing
these services and ensure the establishment of competiti-
ve procedures for the development of new generation plants
and/or decarbonized solutions.
Regulatory framework by business line
Generation and Trading
ItalyThe essential plants of Assemini and Portoferraio have been
declared eligible for cost reimbursement for 2020.
The Brindisi Sud and Sulcis plants were declared eligible for
2019-2020.
The Porto Empedocle plant is eligible for long-term cost reim-
bursement until 2025.
For 2020, the remaining part of essential capacity was con-
tracted under alternative contracts which under current regu-
lations require the supply of capacity to the Ancillary Services
Market (ASM) for a fixed premium.
The Enel Produzione plants located in the smaller islands
identified on an annual basis as plants essential for the securi-
ty of grids not interconnected to the NTG are eligible admitted
by right to the cost compensation regime.
During the 1st Half of 2020, the Regulatory Authority for Ener-
gy, Networks and the Environment (ARERA) adopted a series
of measures for the reimbursement of production costs to
essential plants, shown below:
> adjustments for plants on non-interconnected islands for
2011 and 2012;
> payments on account for plants on non-interconnected
islands for 2016 to 2018;
> adjustments for the Anapo and Guadalami plants for 2015.
On June 28, 2019, the Minister for Economic Development
issued a decree approving the definitive rules governing the
capacity remuneration mechanism (the capacity market). On
November 6 and November 28, 2019 two auctions were held
with delivery in 2022 and 2023 respectively: Enel was awar-
ded capacity for both years. A number of operators and a sec-
toral trade association contested the decree and the results
of the two auctions before the Milan Regional Administrative
Court. Two operators also challenged the European Commis-
sion decision approving the Italian mechanism before the EU
Court. Both proceedings are under way.
ARERA has confirmed the transitional capacity payment me-
chanism for 2020 and 2021 in order to ensure continuity with
the new capacity market, which will produce a financial im-
pact starting from 2022.
As part of the dispatching reform initiated with Resolution no.
393/2015/R/eel aimed at expanding the pool of entities and
resources eligible for the ASM and testing new services nee-
ded by the electric system, with Resolution no. 200/2020/R/
eel ARERA approved the Fast-Reserve pilot project for the
forward procurement of a new ultra-rapid frequency regula-
tion service necessary to safely manage the electric system.
The project provides for Terna to use a competitive auction
procedure to award five-year supply contracts with payment
Regulatory and rate issues

96 Half-Year Financial Report at June 30, 2020
of a fixed premium awarded following the auction in return
for ensuring the availability of capacity. The schedule of the
tender will be announced subsequently by Terna.
Iberia
Proposal for an order to revise fuel prices in non-
peninsular territories Order TEC/1260/2019 of December 26, 2019 revised the te-
chnical and financial parameters of the remuneration of ge-
neration units in the electrical systems of the non-peninsular
territories for the second regulatory period (2020-2025). With
regard to fuel prices, the Order established that within three
months product prices will be reviewed by the ministerial or-
der, with effect from January 1, 2020.
Order to revise the remuneration parameters for
renewable generation plantsOn February 28, 2020, Order TED/171/2020 of February 24,
2020 was published, updating the values applicable in the
second regulatory period (2020-2025) for the various parame-
ters that determine the remuneration of existing renewable
generation plants with a specific remuneration regime.
Europe
RomaniaThe government issued emergency order 74/2020 to allow
new generation capacity commissioned after June 1, 2020 to
sign long-term bilateral contracts (PPAs) outside the centrali-
zed market, thereby increasing the bankability of these new
projects.
RussiaIn December 2019, the Federal Antimonopoly Service establi-
shed the rates for capacity and electricity provided under re-
gulated contracts in 2020. The new rates so established are
lower than planned in the 2020 budget of the Nevinnomys-
skaya GRES plant.
On May 1, 2020, the Market Surveillance Board adopted tem-
porary wholesale market rules valid during the period of the
COVID-19 emergency. They offer the possibility for genera-
tors to extend and postpone scheduled maintenance without
incurring penalties if this is attributable to the state of emer-
gency.
Latin America
Chile
Law 21.185On November 2, 2019, the Ministry of Energy published Law
21.185 introducing a transitional mechanism for stabilizing the
price of electricity for customers subject to rate regulation
(“regulated” customers). Under the provisions of this law,
between July 1, 2019 and December 31, 2020, the rate ap-
plied to regulated customers will remain fixed at the level for
the 1st Half of 2019 (Decree 20T/2018) and will be called the
“Stabilized Price for Regulated Customers” (PEC). Starting
from January 1, 2021 and until the end of the stabilization
mechanism, prices will be those defined in the semi-annual
fixing of the rate provided for in Article 158 of the Electricity
Law, which however cannot be greater than the PEC adjusted
by the consumer price index as of January 1, 2021 (adjusted
PEC). The billing differences between the actual rate and the
stabilized rate (PEC) will generate a receivable in favor of
the generation companies with a limit of $1,350 million until
2023. The balance in favor of these companies will be reco-
vered by them in rates by December 31, 2027 at the latest.
LicitacionesUnder the provisions of the law governing electricity auctions,
three tender processes have been held in Chile: tenders for
the supply of electricity of 2015/01, 2015/02 and 2017/01. In
2019, the National Energy Commission (CNE) announced a
fourth public tender for the supply of electricity denominated
“Licitación Suministro 2019/01”.
The latter provides for the delivery of 5.6 TWh/year from 2026
to 2040. The deadline for submitting bids is November 18,
2020.
Enel Green Power
ItalyThe Ministerial Decree of July 4, 2019 provided for competi-
tive procedures based on Dutch auctions and registers, de-
pending on the installed capacity and by technology groups,
including photovoltaic systems. In particular, up to September
2021, seven procedures will be held with:
> Dutch auctions for plants with a capacity of more than 1
MW;
> registers for plants with a capacity of less than 1 MW.
Unlike previous decrees, the Ministerial Decree of July 4,

97
Conden
sed inte
rim
conso
lidat
ed fi
nan
cial
sta
tem
ents
Inte
rim
rep
ort
on o
per
atio
ns
2019 provides for a new method for supporting renewable
sources through two-way contracts for differences under whi-
ch the successful tenderer returns any positive differences
between the zonal price and the auction price. The winner of
the capacity benefits from the incentive mechanism over the
entire useful life of the plant (20, 25 or 30 years depending on
the technology involved).
These incentive mechanisms will terminate when an indicati-
ve cumulative annual cost of the incentives reaches €5.8 bil-
lion. At March 31, 2020 the indicative annual cumulative cost
was around €5.3 billion.
Enel Green Power participated in the first (October 2019) and
second (February 2020) auctions held by the Energy Services
Operator (GSE), with the award of total renewables capacity
of 128 MW for new wind projects and 36 MW for renovations
of existing renewable plants (wind and hydroelectric).
IberiaAt the end of June the government published the basis for
the granting, through a competitive tender, of subsidies for
the investment of FEDER funds (European Regional Develop-
ment Fund) for photovoltaic systems in the Canary Islands.
The development of around 150 MW is expected.
Europe
RussiaThe government has postponed the auctions for the award
of renewable energy supply contracts scheduled for June to
November 2020. With a decree of April 22, the volumes up for
auction were increased from 182 to 214 MW for wind plants
and from 99.5 MW to 240 MW for photovoltaic plants.
GreeceGreece has approved an ambitious national energy and cli-
mate plan, which sets new targets for the development of
renewable sources equal to 35% of final gross energy consu-
mption by 2030 and includes a plan for the closure of coal-fi-
red plants by 2023.
The Greek Parliament recently approved a number of measu-
res to support the development of renewable sources in the
country. In particular, the use of bilateral contracting (so-called
power purchase agreements or PPA) to sell the power ge-
nerated by renewable energy plants was approved. Further-
more, a series of measures have been introduced to reduce
permitting times for renewables plants.
On February 6, 2020, the interruptibility service provided by
industrial customers and remunerated through resources
from the revenue of generators came to an end. The service
will likely be extended.
RomaniaRomania has approved an ambitious national energy and cli-
mate plan, which sets new targets for the development of
renewable resources by 2030 (with renewable energy as a
proportion of gross final energy consumption ≥30.7%). It also
envisages the installation of 2,300 MW of new wind farms
and 3,700 MW of photovoltaic.
To enable greater development of renewable resources, the
Romanian government has introduced the use of PPAs to sell
the power generated by renewable energy plants. The deci-
sion is awaiting ratification by Parliament.
TurkeyThe government has announced that the next YEKA (Re-
newable Energy Resources Areas) auctions will take place in
the autumn of 2020 and will cover 40 regions with volumes
between 10 and 50 MW.
FranceThe French Ministry for Ecological Transition (MEIT) published
two decrees last April to implement the long-term energy
plan through 2028 (Programmation pluriannuelle de l’énergie -
PPE), which defines the strategy for reducing CO2 emissions,
including a renewable auction plan through 2024. According
to the strategic energy and climate plan, renewable energy
generation capacity is expected to double by 2028 compared
with 2017, and the share of renewable energy in final energy
consumption is expected to increase to 33% by 2030.
The strategy also provides for the complete elimination of
petrol and diesel cars by 2040 and, by 2028, the use of re-
newable hydrogen in industry for a share of between 20%
and 40% of total gas consumption.
GermanyGermany recently published its final national energy and cli-
mate plan. The CO2 reduction target for 2030 has been set at
52% compared with 1990. The renewable energy target for
2030 has been confirmed at 30% of energy consumption (it
is currently less than 20%). Onshore wind power generation
capacity will grow to 71 GW from the current 53 GW. Of-
f-shore wind power will contribute an additional 20 GW, while
photovoltaic power should reach 98 GW of installed capacity.
The German government has also approved a law (Kohleaus-
stiegsgesetz) which sets out the phases for the closure of
coal plants by 2038. Compensation will be paid to the owners
Regulatory and rate issues

98 Half-Year Financial Report at June 30, 2020
of the plants, and economic and social support measures are
envisaged for the areas affected by the plant closures.
In June, the German government published the national
hydrogen strategy. The document plans to use hydrogen to
substantially reduce CO2 emissions and at the same time cre-
ate a strong industrial sector linked to the production of re-
newable hydrogen. The measures envisaged will involve the
energy sector, transport and industrial consumption, as well
as significant investments in research and development.
BulgariaThe Independent Bulgarian Energy Exchange (IBEX), the only
electricity trading platform in Bulgaria, has changed the rules
for trading in long-term products. Following this change, tra-
ding of products related to renewable electricity will only be
possible on the short-term day-ahead and intraday platforms
and excluded from the long-term platform, which guaranteed
greater predictability of cash flows.
Latin America
BrazilEnel Green Power Cachoeira Dourada SA (CDSA) has been
authorized, since June 2, 2020, to export electricity to Argen-
tina and Uruguay. The authorization will remain in force until
December 31, 2022.
North America
United StatesIn May, the United States Treasury Department amended the
administrative guide for renewable energy tax credits, giving
projects two more years to be completed and maintain eli-
gibility under the “continuity requirement”. The guide was
published to take account of construction and supply chain
delays caused by the COVID-19 emergency. Wind projects
that began construction in 2016 can now be put into service
until 2022, receiving 100% of the associated tax credit, while
projects that started construction in 2017 can now be put into
service until 2023, receiving 80% of the tax credit.
Legislative sessions and significant political changes have
been suspended due to the COVID-19 pandemic. Looking
ahead, incentives for the production of green energy create
opportunities for the clean energy sectors, while budgetary
challenges (driven by tax revenues and higher expenditure
induced by COVID-19) threaten to cause cuts in funding pro-
grams.
Africa, Asia and Oceania
AustraliaThe Enel Green Power Cohuna plant has suffered connection
delays since the beginning of 2019, due in part to regulatory
changes imposing stricter technical standards. These changes
occurred in 2019 and their lost revenue effects continued to
unfold in the 1st Half of 2020.
The Australian Energy Market Commission (AEMC) has
established that all renewables generators must maintain
control over the Primary Frequency Response, while exemp-
ting them from the need to maintain storage capacity. This
is an interim provision, which will be in effect from October
2020 until June 2023.
IndiaThe government has declared that the COVID-19 emergency
represents a case of force majeure, allowing the postpone-
ment of contract deadlines and the avoidance of penalties for
delays, containing potential financial losses.
Renewable energy projects saw their must-run status confir-
med during the COVID-19 emergency, thus avoiding curtail-
ments.
Distribution companies (i.e. the buyers of the electricity ge-
nerated by renewable energy projects) had the opportunity to
defer payments to generators.
The exemption from “Inter-State Transmission Charges and
Losses” has been extended to projects that will come into
operation by December 31, 2022 (previously, it was the end
of March 2022), with positive financial effects.
Positive economic effects will also result from the fact that
the national CER regulator (Centre for Energy Regulation)
has established that a bank guarantee will not be required for
the construction of projects that connect through the Central
Transmission Utility if the power purchase agreement (PPA)
is signed directly by the generation company with the distri-
bution company. If the PPA is signed with an intermediary
agency (such as Solar Energy Corporation of India - SECI, in
the case of Enel Green Power), then that agency must have
a back-to-back sales contract with the distribution company.

99
Conden
sed inte
rim
conso
lidat
ed fi
nan
cial
sta
tem
ents
Inte
rim
rep
ort
on o
per
atio
ns
Infrastructure and Networks
ItalyThe rate for the fifth regulatory period (2016-2023) is governed
by the Regulatory Authority for Energy, Networks and the En-
vironment (ARERA) Resolution no. 654/2015/R/eel. This period
lasts eight years and is divided into two sub-periods of four
years each (NPR1 for 2016-2019 and NPR2 for 2020-2023).
With regard to the NPR2 period, on December 27, 2019 ARE-
RA published Resolution no. 568/2019/R/eel, with which it
updated rates for distribution and metering services in force
in the 2020-2023 period, publishing the new integrated texts
(TIT 2020-2023 and TIME 2020-2023), substantially confirming
the pre-existing regulatory framework regarding the return on
capital and depreciation and making only a few changes to the
methods for recognizing operating costs.
With Resolution no. 639/2018/R/com, ARERA set the value of
the WACC for distribution and metering activities, valid for the
2019-2021 period, at 5.9%.
As for distribution and metering rates, with Resolution no.
144/2020/R/eel ARERA approved the definitive reference ra-
tes for 2019, which represent the level of revenue recognized
for each operator, based on the final balance sheet data for
the year 2018 and the other relevant parameters (level of pro-
ductivity gains, inflation, etc.).
With Resolution no. 162/2020/R/eel ARERA published the
provisional reference rates for 2020, based on the preliminary
balance sheet data for 2019 and the other relevant parame-
ters (productivity gains, inflation, etc.).
With Resolution no. 190/2020/R/eel ARERA established ur-
gent measures to implement the provisions of Decree Law
34 of May 19, 2020 (the so-called Revival Decree), containing
urgent measures in the field of health, support for workers
and economy, and social policies connected with the CO-
VID-19 emergency for the reduction of costs for low-voltage
electricity users other than domestic use for May, June and
July 2020, impacting the utility bill items “transport and meter
management” and “general system charges”.
ARERA has postponed to a subsequent measure the acti-
vation of an extraordinary equalization advance payment for
distribution companies to mitigate the financial effects produ-
ced by this provision on collections.
As regards service quality, ARERA, with Resolution no.
566/2019/R/eel, established new rules for the quality of tran-
smission, distribution and metering services for the second
regulatory semi-period for 2020-2023, introducing innovative
regulatory tools to improve grid performance and narrow the
gap between the North and South of Italy.
With Resolution no. 534/2019/R/eel, ARERA published the list
of interventions in the 2019-2021 Resilience Plan of e-distri-
buzione eligible for the bonus-penalty mechanism envisaged
under the provisions of Resolution no. 668/2019/R/eel, which
introduced an incentive mechanism for investments to incre-
ase the resilience of distribution grids in terms of resistance
to loads deriving from extreme weather events.
Iberia
SpainRevenue from the regulated market connected with Distribu-
tion operations in the 1st Half of 2020 declined by about 4.4%
on the same period of the previous year, essentially reflecting
the application of new remuneration parameters, which ente-
red force for the 2020-2025 regulatory period.
Europe
RomaniaThe regulatory authority (ANRE) revised the calculated regu-
lated rate of return (RRR) as equal to the WACC. The previous
year, the regulator had approved a rate of 5.66%, while the
government approved a rate of 6.9% with the aim of increa-
sing investments in the grid. In May 2020, ANRE revised the
calculations and approved a new value of 6.39%. In addition,
with the aim of encouraging investments in grids, a 1% bo-
nus is granted for new investments. Further collaboration is
planned between distribution system operators (DSOs) and
ANRE to clarify how to implement the new incentive.
Latin America
Brazil
Rate revision for Enel Distribuição Rio
On March 10, 2020, the Electricity Regulatory Agency (ANE-
EL) approved the rate revision for Enel Distribuição Rio, star-
ting from March 15, 2020, following which the average effect
for consumers will be an increase of 2.71%, given by a rise
of 3.38% for high-voltage customers and one of 2.48% for
low-voltage customers.
Regulatory and rate issues

100 Half-Year Financial Report at June 30, 2020
Rate revision for Enel Distribuição Ceará
On April 14, 2020, ANEEL approved the rate revision for Enel
Distribuição Ceará, following which the average effect for end
users will be an increase of 3.94%. The rate increase was
proposed by the regulator in response to the economic emer-
gency resulting from the COVID-19 crisis with the aim of pro-
tecting the most vulnerable categories of customer. Rates
have been frozen until June 30, 2020 and as of July 1, 2020
are subject to further revisions.
Note also that the decrease in revenue due to the suspension
of the new rates in the above period will be offset by the pay-
ment of CDE (Energy Development Account) allowances for
May, June and July 2020. These payments will be duly adju-
sted for the Selic rate and the redefinition of the CDE fund for
Enel Distribuição Ceará in order to be rescheduled over a ma-
ximum of five equal installments starting from August 2020.
Finally, the difference between the newly approved rate and
that applied can be adjusted until June 30, 2020 and will in
any case be considered in subsequent rate revisions.
Rate revision for Enel Distribuição São Paulo
On June 30, 2020, ANEEL approved the rate revision for Enel
Distribuição São Paulo, starting from that date, following whi-
ch the average effect for consumers will be an increase of
4.23%, given by a rise of 6.00% for high-voltage customers
and one of 3.58% for low-voltage customers.
ANEEL Resolution no. 878/2020
ANEEL took measures to ensure the distribution of electricity
during the COVID-19 emergency with effect from March 24,
2020, including:
> banning the interruption of service to residential custo-
mers in urban and rural areas;
> granting permission for the suspension of delivery of invoi-
ces issued to consumers, replacing them with the issue of
electronic invoices or barcodes;
> giving priority to emergency and essential services to con-
tribute to social isolation measures and ensuring the conti-
nuous and reliable supply of electricity.
ANEEL release no. 1.511/2020
In the wake of the COVID-19 pandemic, ANEEL exceptionally
and temporarily suspended, with effect from June 1, 2020,
application of the Bandeiras Tarifarias until December 31,
2020.
ArgentinaAs part of the regulatory response to the global COVID-19
pandemic, the government established the following:
> March 17 DNU 287/2020 - Declaration of health emergen-
cy from March 12 for one year;
> March 20 DNU 297/2020 - Preventive and mandatory so-
cial isolation (lockdown);
> March 31 DNU 325/2020 - Extension until April 12;
> April 11 DNU 355/2020 - Extension until April 26;
> March 20 DNU 298/2020 - Suspension of administrative
deadlines during the lockdown;
> March 25 DNU 311/2020 - Limitations on the possibility of
suspensions/strikes involving basic services.
As part of the same regulatory framework, the National
Electricity Regulator (ENRE) announced the creation of a vir-
tual working group to access information and send reports
known to the regulator and at the same time made official the
following resolutions:
> ENRE Resolution 0003 of March 21, 2020 suspending the
customer management services provided in designated
offices, implementing a system for customer manage-
ment through call centers;
> ENRE Resolution 0006 of March 24, 2020 calling for gre-
ater efficiency in processes and ensuring the operation of
the control, management and distribution centers for high-
and low-voltage electricity supply.
On June 19, 2020, an official bulletin was published concerning
Emergency Decree no. 543, which first established a 180-day ex-
tension from the expiry date of the last rate revision established
with Article 5 of Law no. 27541 (the Solidarity and Economic Re-
activation Act). Consequently, the new deadline for performing
the rate review will be December 17, 2020. Secondly, the mea-
sure extends the benefits established under DNU 311/20 (limi-
tations on suspensions of electricity supply) in the event of late
payment or non-payment by customers up to a maximum of six
consecutive or alternate invoices falling due after March 1, 2020.
ColombiaThe Energy and Gas Regulation Commission (CREG) deter-
mines the remuneration methodology for the distribution
network. Distribution rates are set every five years and upda-
ted monthly based on the producer price index.
In response to the national and global impact of the COVID-19
pandemic, in March 2020 the Colombian government decla-
red a state of economic, social and ecological emergency for
the entire country and ordered mandatory preventive isola-
tion for all inhabitants. These measures led to the issue of a

101
Conden
sed inte
rim
conso
lidat
ed fi
nan
cial
sta
tem
ents
Inte
rim
rep
ort
on o
per
atio
ns
range of transitional rules and regulations by Colombian au-
thorities that govern public services, including electricity sup-
ply, in order to ensure the continuity of the delivery of public
domestic services and to mitigate financial and social effects
in the electricity and natural gas sector.
CREG has issued Resolutions CREG.ADM 050/2020 and
CREG.ADM 052/2020 temporarily suspending (until April 12,
2020) deadlines for its administrative actions.
The rules issued by the Ministry of Mining and Energy (MME)
and by CREG in the 2nd Quarter of 2020 in response to CO-
VID-19 include:
> new regulations extending the state of economic emer-
gency and adoption of new measures: Decrees 417, 637
and 798, Resolutions 131 and 132;
> mandatory preventive isolation, Decrees 457, 531, 593,
636 and 749;
> MME Resolution 517: deferred payment extract 1 and 2;
credit lines and grants for businesses;
> CREG Resolutions 058, 108 and 104: transitional measures
for the payment of invoices on the wholesale market;
> CREG Resolution 056.061, CREG Circular 036 and CREG
Resolution 107: financing options in the wholesale market;
> CREG Resolution 043: transitional rules on the limitation of
supply and withdrawal from the market;
> Decree 581: new credit line - Findeter;
> Decree D.C. 123 and Resolution 157: the mayor of Bogota
awards grant of 10% of energy consumption to category
1, 2, 3 and 4 users;
> MME Resolution 40130: contribution mechanism for cu-
stomers in categories 4, 5 and 6, and commercial and in-
dustrial customers.
On June 24, 2020, CREG issued CREG Resolution 122/2020,
which approved the distribution rates of Enel Codensa.
PeruWith Decreto Supremo no. 044-2020-PCM, published on
March 15, 2020 a state of national emergency was declared
for 15 days. This period has since been repeatedly extended
and is now in place until at least July 31 due to the COVID-19
pandemic. During this period, some social distancing measu-
res were taken to prevent the spread of COVID-19. In parti-
cular, Decreto Supremo no. 044-2020-PCM establishes that
the government shall guarantee access to public services and
essential goods and services with no restrictions.
Vice-ministerial Resolution no. 001-2020-MINEM/VME, publi-
shed on March 19, 2020, established that electricity genera-
tion, transmission and distribution companies shall:
> activate safety protocols to safeguard staff, contractors
and third parties;
> take all necessary actions to ensure the continuity of
electricity service;
> send their emergency plans to OSINERGMIN and MINEM
(Ministry of Energy and Mining).
Emergency Decree no. 029-2020, published on March 20,
2020, introduced a 30-day suspension on the calculation of
time limits for the activation of administrative procedures and
proceedings of any kind, including those regulated by laws
and special provisions, that are subject to deadlines.
Emergency Decree no. 035-2020, published on April 3, 2020,
established that distribution companies can allow customers
with invoices issued in March 2020 or that include amoun-
ts consumed during the national emergency by “vulnerable”
users (those with a consumption of up to 100 kWh/month)
to pay in instalments over as many as 24 months. The gover-
nment will pay compensatory interest on the installments,
which will be paid to electricity companies using the Fondo
de Inclusión Social Energético. The measure also establishes
that electricity companies will not be liable for compensation
or penalties for failure to comply with the technical quality
standards for electricity service. Various commercial measu-
res have also been introduced, such as the suspension of the
obligation to read meters, of the delivery of paper invoices
(digital delivery has been introduced), and of the obligation
to physically assist customers at customer care centers, whi-
le customers may be billed using their average consumption
over the last six months until an actual meter reading is pos-
sible.
Emergency Decree no. 062-2020, published on May 28,
2020, expanded the category of customers who can pay their
electricity bills in instalments to include those consuming up
to 300 kWh/month. In this case, the measure establishes that
invoices for May or that include amounts consumed during
the national emergency are eligible for the instalment plan.
The compensatory interest to be paid to electricity compa-
nies will be partly borne by the government and partly by cu-
stomers. Finally, the measure also establishes that electricity
companies will not be liable for compensation or penalties for
violation of technical quality standards for up to 60 calendar
days after the emergency period.
Regulatory and rate issues

102 Half-Year Financial Report at June 30, 2020
Decreto Supremo no. 101-2020-PCM, published on June 4,
2020, authorized the reopening of economic activities inclu-
ded in “Phase II”. Businesses included in this phase must
submit a plan for “the surveillance, prevention and control of
COVID-19 in the workplace and work activities” to the com-
petent authorities.
Decreto Supremo no. 117-2020-PCM, published on June 30,
2020, authorized the reopening of economic activities inclu-
ded in “Phase III”. Businesses included in this phase must
submit a plan for “the surveillance, prevention and control of
COVID-19 in the workplace and work activities” to the com-
petent authorities.
Chile
Law no. 21.194
On December 21, 2019, the Ministry of Energy published Law
no. 21.194 which lowered the remuneration of distribution
companies and enhanced the process for setting electricity di-
stribution rates. The law changes the discount rate for the cal-
culation of annual investment costs, which went from 10% to
a rate that must be between 6% and 8% post tax. The post-tax
remuneration rate for electricity distribution companies must
not be more than two points above or three points below the
remuneration rate set by the CNE (National Energy Commis-
sion). Finally, from January 2021 the distribution companies
will have to operate exclusively in the distribution field.
CNE Resolution no. 176/2020 - Exclusive activity
On June 9, 2020, CNE Resolution no. 176 was published, spe-
cifying the substance of the obligation of exclusive activity
and separate accounting in the provision of public electricity
distribution services in accordance with the provisions of Law
21.194.
Under the provisions of the resolution, companies holding
concessions for the public electricity distribution service ope-
rating in the Chilean national electricity system will have to
set up as companies exclusively engaged in distribution acti-
vities and will only be able to exercise economic activities
involved in the provision of the public distribution service, in
compliance with applicable legislation. The rules established
in the resolution shall apply from January 1, 2021. Where
a company is unable to comply by that date for legitimate
reasons, subject to notifying the CNE the application of the
resolution may be postponed, but in any case not later than
January 1, 2022.
Bill for essential services in response to the COVID-19
health crisis
At the reporting date, a bill on essential (basic) services is
being discussed in the National Congress. It envisages mea-
sures that most distribution companies are already voluntarily
adopting. The measures provided for in the bill include the
suspension of service interruptions for late payment and the
possibility for “vulnerable” customers to pay electricity bills
in installments.
Rate revision and electricity supply process
The end-user rates applied in 2020 were determined on the
basis of the following decrees and resolutions:
> Decree no. 11T/2016, which established the rate formulas
applicable to the supply of electricity at regulated prices,
published in the official journal on August 24, 2017;
> Decree no. 2T/2018, which established the methods for
adjusting the power factor in rates applicable to electricity
supply at regulated prices, published in the official journal
on June 27, 2018 and valid until November 2020;
> Decree no. 5T/2018, which established the rate formulas
applicable to the supply of electricity at regulated prices
set with the Ministry of Energy Decree no. 11T of 2016,
published in the official journal on September 28, 2018;
> Oficio Ordinario SEC no. 15699/2019, which established
the procedure for rate adjustments based on Oficio Ordi-
nario no. 490/2019, which is valid until November 3, 2020;
> Decree no. 6T/2017, which determined the annual value of
transmission systems, which is valid until December 31, 2019;
> price decrees.
Average bare price
On October 5, 2019, the Ministry of Energy published Decree
no. 7T/2019 in the official journal, setting the “bare price” for
the supply of electricity and set adjustments and loads for the
application of the Residential Rate Equity Mechanism, with
retroactive effect from July 1, 2019. On November 2, 2019
the Ministry of Energy published Law no. 21.185, which in-
troduced a transitory mechanism for stabilizing the price of
electricity for customers subject to regulated rates.
Short-term bare price
On October 23, 2019, the Ministry of Energy published De-
cree no. 9T/2019, setting the “bare price” for the supply of
electricity with effect from October 1, 2019.
On April 7, 2020, the Ministry of Energy published Decree no.
2T/2020, which sets the “bare price” for the supply of electri-
city, valid from April 1, 2020.

103
Conden
sed inte
rim
conso
lidat
ed fi
nan
cial
sta
tem
ents
Inte
rim
rep
ort
on o
per
atio
ns
Determination of 2020-2024 distribution rates
With Resolution no. 24 of 21 January 2020, the CNE publi-
shed the preliminary technical bases for the calculation of the
components of the aggregate distribution value for the 2020-
2024 period and the study of the service costs associated
with the supply of electricity, initiating the process of deter-
mining distribution rates.
Following the stages of the process established under appli-
cable legislation, the companies submitted their comments
and on June 11, 2020 the CNE published the definitive techni-
cal bases with Resolution no. 195.
Determination of the 2020-2023 transmission rates
As part of the process of determining 2020-2023 transmis-
sion rates, the following processes are being developed:
> qualification of transmission plants and systems;
> determination of the useful life of transmission plants;
> definition of the technical and administrative basis for the
determination of transmission rates.
In this context, on June 5, 2018, the CNE approved a defini-
tive technical document determining the useful life of tran-
smission systems (Resolution no. 412).
End-user Markets
Italy
Electricity
With Resolution no. 576/2019/R/eel, ARERA updated for 2020
the rate component covering the marketing costs of the ope-
rators of the enhanced protection service (RCV) and the levels
of the PCV fee, which represents the reference price for sel-
lers on the free market.
With Resolution no. 119/2019/R/eel, ARERA introduced me-
asures to enhance the efficiency of managing fraudulent wi-
thdrawals of power by end users in the enhanced protection
market and amended the existing compensation mechanism
for the amounts not collected in respect of such withdrawals.
In connection with a suit filed by Servizio Elettrico Nazionale,
the Milan Regional Administrative Court issued sentence no.
565 of March 27, 2020 voiding the part of resolution in which
it provided for the application of the mechanism for reducing
the amounts to be reimbursed in relation to the billing acti-
vities performed in the period prior to the entry into force of
that resolution.
The measures connected to the COVID-19 emergency adop-
ted by ARERA include Resolution no. 116/2020/R/com, which
established temporary exceptions for the period April-June
2020 to the rules governing payments by sellers to distribu-
tors in order to mitigate the impact on the value chain of the
freeze on customer disconnections during the emergency
period for low-voltage end users (Resolution no. 60/2020/R/
com). The reduction in payments made by sellers will be re-
couped by distributors through a special mechanism provided
for in Resolution no. 248/2020/R/com, which will enable their
recovery by the end of the year.
With regard to rules governing customers in arrears, Resolu-
tion no. 219/2020/R/com implemented the new rules establi-
shed with the 2020 Budget Act (Article 1, paragraph 291) con-
cerning the timing and procedures for suspending supply in
the event of customer default. Concomitantly, it provided for
an upgrade of the indemnity system (compensation paid to
sellers in the event customers leave unpaid receivables when
they change supplier).
Gas
With Resolution no. 89/2020/R/gas, ARERA has initiated a
procedure aimed at complying with ruling 38/2020 concer-
ning the revision of the scope of application and the conse-
quent recalculation of prices to be applied to end users in
order to settle financial items between sellers and end users
for the 2010-2012 period with regard to the gas commodity
for the safeguard service. With Resolution no. 247/2020/R/
gas, ARERA temporarily confirmed the fees applied pending
their redetermination and extension of the scope of applica-
tion starting from January 2021.
With Resolution no. 577/2019/R/gas, ARERA updated the
QVD component of the financial conditions of the natural gas
safeguard service for 2020.
Law 8 of February 28, 2020, which ratified the “Milleproro-
ghe” omnibus extension decree (Decree Law 162 of Decem-
ber 30, 2019), amended the text of the Competition Act (Law
124/2017), providing for the elimination of price protection
regimes for small companies that do not fall under the de-
finition of “micro-enterprises” starting from January 1, 2021
and for micro-enterprises, and January 1, 2022 for residential
customers.
Regulatory and rate issues

104 Half-Year Financial Report at June 30, 2020
Iberia
Rates
On December 28, 2019, Order TEC/1258/2019 of December
20 was published, establishing access rates for 2020. Under
the provisions of the order, the rates shall remain unchanged
until the rates established by the National Markets and Com-
petition Commission enter force (CNMC). As for natural gas,
Order TEC/1259/2019 of December 20 was published on De-
cember 28, 2019, establishing access rates for the gas sector
in 2020.
On December 30, 2019, the resolution of the Directorate-Ge-
neral for Energy Policy and Mining of December 23 was pu-
blished, establishing the rate of last resort (TUR) for natural
gas to be applied from January 1, 2020, giving rise – thanks
to the decline in commodity prices – to an average reduction
of 3.3% (for the Last Resort 1 rate - TUR1) or 4.2% (for Last
Resort 2 - TUR2).
Energy efficiency
Order TED/28/2020 of March 23 set Endesa’s contribution to
the National Energy Efficiency Fund at €28 million for 2020.
Social Rate
Order TEC/1080/2019 of October 23 established the distri-
bution percentage of the 2019 social rate, with Endesa SA’s
share set at 36.26%, compared with 37.15% the previous
year. The preparation of the order establishing the distribution
of the financing obligation for the 2020 social rate began in
January 2020, with the percentage proposed for Endesa SA
being set at 35.57%.
On March 14, 2020, Royal Decree 463/2020 was published,
proclaiming a state of emergency for the management of the
COVID-19 health crisis. In order to counter the economic and
social impact of this exceptional situation, the Spanish gover-
nment has approved a series of legislative measures to ad-
dress the emergency. The most significant measures for the
electricity sector are as follows.
The validity of the social rate was extended until September
15, 2020 for all beneficiaries whose eligibility would have
expired before this date. At the same time, the right to the
social rate was extended to holders of supply points or any
member of their household who qualify as professionals or
self-employed who comply with certain income thresholds
and who, due to the emergency, have ceased trading or who-
se turnover has been reduced significantly. The measure is
limited to the emergency period, with a maximum duration
of six months.
Guarantee of utilities continuity
During the month following the entry into force of Royal De-
cree 8/2020 of March 17, the supply of electricity, water and
natural gas to consumers identified as vulnerable consumers
(in accordance with the criteria of Royal Decree 897/2017)
cannot be cut off. Royal Decree 11/2020 of March 31 exten-
ded this guarantee, establishing that for the duration of the
entire state of emergency the supply of electricity, water, na-
tural gas and other oil derivatives to natural persons at their
habitual residence cannot be suspended except for security
of supply reasons.
Flexibility of electricity supply contracts for professionals
and companies
During the state of emergency, professionals and companies
can suspend or modify their contracts to contract an alterna-
tive offer with their energy supplier that is more appropriate
with current consumption and power requirements without
charge or penalty. At the end of the state of emergency, there
is a period of three months to reactivate the contract or modi-
fy available power without charge except in certain situations.
To compensate the electricity sector for the reduction in reve-
nue that these initiatives entail, measures will be introduced
in the next Budget Act (PGE) after the entry into force of Royal
Decree Law 11/2020 of March 31. Similar measures are envi-
saged for the natural gas sector.
Suspension of supply invoices
During the state of emergency, self-employed workers and
small and medium-sized enterprises can ask their supplier (or
distributor) for a suspension of payment for billing periods in
which the state of emergency applies. In this case, the sup-
plier is exempt from paying the transport and distribution ra-
tes until the customer has fully paid the invoice. The supplier
is also exempted from paying VAT, the special electricity tax
and the special hydrocarbon tax for the generation of electri-
city until the balance of the invoice is paid by the customers
or within six months of end of the state of emergency. Once
the state of emergency has ended, the balance will be settled
in equal instalments over the billing periods in the following
six months. Similarly, suppliers or distributors whose revenue
is reduced can request the activation of the guarantees spe-
cified in Royal Decree Law 8/2020 of March 17 or any other
such relief.

105
Conden
sed inte
rim
conso
lidat
ed fi
nan
cial
sta
tem
ents
Inte
rim
rep
ort
on o
per
atio
ns
Access rights
Access rights expiring on March 31, 2020 have been exten-
ded to the new deadline of two months after the end of the
state of emergency.
In this context, Order SND/260/2020 of March 19 suspended
activation of the demand management service of interruptibi-
lity for economic reasons.
Europe
RomaniaThe regulatory authority (ANRE) has defined wholesale and
retail commercial agreements for the regulated market in two
tranches. For each half-year and for each Last Resort supplier,
ANRE has approved a portfolio of regulated bilateral contracts
with the least expensive generators and a series of regulated
rates for end users, which should guarantee sufficient margin
to enable the recovery of losses incurred in past years. While
the provisions for the 1st Half of 2020 were approved in De-
cember 2019, the provisions for the 2nd Quarter of 2020 were
approved on June 29, 2020.
Latin America
Brazil
Electricity marketing
On April 17, 2020, Enel Trading Brasil SA (Enel Trading), a
company set up by the Group for the sale of electricity, was
authorized to operate as an Electricity Marketing Agent in
Brazil.
Regulatory and rate issues

106 Half-Year Financial Report at June 30, 2020
Outlook
The energy transition that is progressively transforming the
utilities industry underpins the 2020-2022 Strategic Plan pre-
sented in November 2019, which is founded on a sustainable
and fully integrated business model. It is designed to enable
Enel to seize the opportunities linked to the global trends of
decarbonization of generation and electrification of energy
consumption. The digitalization of grids and the adoption of
platforms for all customer-related activities are enablers of
the Group’s strategy, which aims to accelerate the growth of
renewables while at the same time reducing thermal genera-
tion, first and foremost coal generation. More specifically, the
2020-2022 Investment Plan envisages that:
> investments in decarbonization will amount to about €14.4
billion (50% of total capex), aimed at developing new re-
newables capacity and gradually replacing conventional ge-
neration assets. Decarbonization’s contribution to EBITDA
growth will be equal to €1.4 billion over the plan period.
Renewables capacity is expected to reach 60% of total ca-
pacity in three years, driving the increase in the profitability
of plant assets and increasing output with zero CO2 emis-
sions to 68% of the total in 2022. The 2020-2022 Strategic
Plan provides for a rapid and progressive withdrawal from
coal-fired generation, which will mainly be replaced by new
renewables capacity. The sharp acceleration in the growth
of renewables will support the Group’s pursuit of the goal
of reducing emissions of greenhouse gases in line with the
Paris Agreement and achieving total decarbonization of the
generation mix by 2050;
> about €1.2 billion of investment will be dedicated to the
electrification of energy consumption, leveraging the
growth and diversification of the retail customer base and
the efficiencies associated with the transfer of activities to
platforms. The expected contribution of these investments
to the Group’s EBITDA growth amounts to €0.4 billion;
> some €13 billion will be invested in the factors enabling the
energy transition, i.e. infrastructure, to adapt distribution
grids to a generation system based on renewable energy,
and ecosystems and platforms, to develop new services,
such as electric mobility and demand response services,
which will play an increasing role in the energy transition.
The expected contribution to EBITDA growth is about €1.1
billion.
The Group expects to invest €28.7 billion over the course of
the plan. Investments will directly impact three main UN Su-
stainable Development Goals (SDGs): SDG 7 (Affordable and
Clean Energy), SDG 9 (Industry, Innovation and Infrastructure)
and SDG 11 (Sustainable Cities and Communities), thus con-
tributing to SDG 13 for climate action.
Under our dividend policy, over the plan period Enel will conti-
nue to pay out a dividend equal to the greater of 70% of con-
solidated ordinary net income and a guaranteed minimum di-
vidend per share (DPS), with a compound annual growth rate
of 8.6% for the implicit DPS and 7.7% for the minimum DPS.
For 2020 the Plan envisages:
> an acceleration of investment in renewable energy, espe-
cially in Latin America and North America, in support of
industrial growth to drive decarbonization;
> further progress in the digitalization of distribution grids,
mainly in Italy and Latin America, with the aim of impro-
ving the service quality and increasing grid flexibility and
resilience;
> an increase in investment devoted to the electrification of
energy consumption, with the aim of leveraging the expan-
sion of the customer base, and to continuous efficiency
enhancement, supported by the creation of global busi-
ness platforms.
With regard to the ongoing COVID-19 pandemic that began
earlier this year, the Group has issued guidelines aimed at
preventing and/or mitigating the effects of contagion in the
workplace and at the same time ensuring business continuity.
The Group has also implemented constant monitoring of the
impact of the emergency on macroeconomic and business
variables in order to produce real-time estimates of potential
impacts on the Group and enable mitigation of the effects
with response or contingency plans.
Thanks to the geographical diversification of the Group, its
integrated business model along the value chain, a sound fi-
nancial structure and the level of digitalization achieved, which
makes it possible to ensure the continuity of operations with
the same level of service, the Group has displayed conside-
rable resilience, which has been reflected in our strong perfor-
mance and financial position in the 1st Half of 2020.
Nevertheless, the depreciation of the Latin American curren-
cies against the euro, the negative impact of the pandemic

107
Conden
sed inte
rim
conso
lidat
ed fi
nan
cial
sta
tem
ents
Inte
rim
rep
ort
on o
per
atio
ns
on the volume of electricity consumption and the suspension
of dunning processes have prompted us to revise a number
of the targets established in the 2020-2022 Strategic Plan, as
shown in the following table:
Billions of euro 2020-2022 Strategic Plan 2020-2022 Strategic Plan
2020 targets announced in November 2019
New targets for 2020
Ordinary EBITDA 18.6 about 18.0
Ordinary net income 5.4 5.0-5.2
Net financial debt 46.8 48.0-49.0
Related parties
For a detailed discussion of transactions with related parties, please see note 32 to the condensed interim consolidated finan-
cial statements at June 30, 2020.
Outlook

108 Relazione Finanziaria Annuale 2019

109Xxxxxxxxx Xxxxxxxxxxx
CONDENSED INTERIM CONSOLIDATED FINANCIAL STATEMENTS
2.

110 Half-Year Financial Report at June 30, 2020
Consolidated financial statements
Consolidated Income Statement
Millions of euro Notes 1st Half
2020 2019
of which with related parties
of which with related parties
Revenue 6
Revenue from sales and services (1) 32,520 1,933 39,492 2,477
Other revenue 855 6 1,475 5
[Subtotal] 33,375 40,967
Costs 7
Electricity, gas and fuel purchases (1) 13,769 2,306 20,388 4,093
Services and other materials (1) 8,332 1,308 8,849 1,512
Personnel 1,855 2,338
Net impairment/(reversals) of trade receivables and other receivables 637 347
Depreciation, amortization and other impairment losses 3,465 3,347
Other operating expenses 1,089 109 1,315 138
Capitalized costs (916) (1,018)
[Subtotal] 28,231 35,566
Net income/(expense) from commodity risk management (1) 8 (601) (1) (188) 12
Operating income 4,543 5,213
Financial income from derivatives 9 937 595
Other financial income 10 928 31 847 49
Financial expense from derivatives 9 759 665
Other financial expense 10 2,255 29 2,103 15
Net income/(expense) from hyperinflation adjustments 10 30 85
Share of income/(losses) of equity investments accounted for using the equity method 11 13 (85)
Income before taxes 3,437 3,887
Income taxes 12 1,034 994
Net income from continuing operations 2,403 2,893
Net income from discontinued operations - -
Net income for the period (shareholders of the Parent Companyand non-controlling interests) 2,403 2,893
Attributable to shareholders of the Parent Company 1,947 2,215
Attributable to non-controlling interests 456 678
Basic earnings/(loss) per share attributable to shareholders of the Parent Company (euro) 13 0.19 0.22Diluted earnings/(loss) per share attributable to shareholders of the Parent Company (euro) 13 0.19 0.22Basic earnings/(loss) per share from continuing operations attributable to shareholders of the Parent Company (euro) 13 0.19 0.22Diluted earnings/(loss) per share from continuing operations attributable to shareholders of the Parent Company (euro) 13 0.19 0.22
(1) The figures for the 1st Half of 2019 have been adjusted to take account of the interpretations of the IFRS Interpretations Committee (IFRIC) contained in the Agenda Decision of 2019, which involved changes in the classification, with no impact on margins, of the effects of purchase and sales contracts for commodities measured at fair value through profit or loss (for more details, see note 4 in these condensed interim consolidated financial statements at June 30, 2020).

Inte
rim
rep
ort
on o
per
atio
ns
Conden
sed inte
rim
conso
lidat
ed fi
nan
cial
sta
tem
ents
111
Statement of Consolidated Comprehensive IncomeMillions of euro 1st Half
2020 2019
Net income for the period 2,403 2,893
Other comprehensive income recyclable to profit or loss (net of taxes)
Effective portion of change in the fair value of cash flow hedges 811 26
Change in the fair value of hedging costs (154) 10
Share of the other comprehensive income of equity investments accounted for using the equity method (2) (34)
Change in the fair value of financial assets at FVOCI - 6
Change in translation reserve (3,319) 352
Other comprehensive income not recyclable to profit or loss (net of taxes)
Remeasurement of net liabilities/(assets) for employee benefits 33 (176)
Change in the fair value of equity investments in other entities (1) -
Total other comprehensive income/(loss) for the period (2,632) 184
Total comprehensive income/(loss) for the period (229) 3,077
Attributable to:
- shareholders of the Parent Company 544 2,259
- non-controlling interests (773) 818
Consolidated financial statements

112 Half-Year Financial Report at June 30, 2020
Consolidated Balance Sheet
Millions of euro Notes
ASSETS at June 30, 2020 at Dec. 31, 2019
of which with related parties
of which with related parties
Non-current assets
Property, plant and equipment 14 78,418 79,809
Investment property 108 112
Intangible assets 15 17,265 19,089
Goodwill 16 14,115 14,241
Deferred tax assets 17 8,789 9,112
Equity investments accounted for using the equity method 18 1,732 1,682
Derivatives 19 2,877 27 1,383 15
Non-current contract assets 20 401 487
Other non-current financial assets 21 5,376 6,006
Other non-current assets 22 2,642 2,701
[Total] 131,723 134,622
Current assets
Inventories 2,629 2,531
Trade receivables 23 11,308 927 13,083 896
Current contract assets 20 173 166
Tax receivables 1,040 409
Derivatives 19 6,059 3 4,065 8
Other current financial assets 24 4,328 49 4,305 27
Other current assets 22 3,890 203 3,115 183
Cash and cash equivalents 5,840 9,029
[Total] 35,267 36,703
Assets classified as held for sale 26 5 101
TOTAL ASSETS 166,995 171,426

Inte
rim
rep
ort
on o
per
atio
ns
Conden
sed inte
rim
conso
lidat
ed fi
nan
cial
sta
tem
ents
113
Millions of euro Notes
LIABILITIES AND SHAREHOLDERS’ EQUITY at June 30, 2020 at Dec. 31, 2019
of which with related parties
of which with related parties
Equity attributable to the shareholders of the Parent Company
Share capital 10,167 10,167
Treasury share reserve (1) (1)
Other reserves (250) 1,130
Retained earnings/(loss carried forward) 19,264 19,081
[Total] 29,180 30,377
Non-controlling interests 14,188 16,561
Total shareholders’ equity 27 43,368 46,938
Non-current liabilities
Long-term borrowings 25 53,623 670 54,174 715
Employee benefits 28 2,780 3,771
Provisions for risks and charges (non-current portion) 29 4,981 5,324
Deferred tax liabilities 17 8,160 8,314
Derivatives 19 2,958 2,407
Non-current contract liabilities 20 6,257 181 6,301 151
Other non-current liabilities 22 3,419 3,706
[Total] 82,178 83,997
Current liabilities
Short-term borrowings 25 7,196 3,917
Current portion of long-term borrowings 25 2,738 89 3,409 89
Provisions for risks and charges (current portion) 29 1,084 1,196
Trade payables 9,348 2,730 12,960 2,291
Income tax payable 997 209
Derivatives 19 5,381 5 3,554 8
Current contract liabilities 20 1,249 46 1,328 39
Other current financial liabilities 750 754
Other current liabilities 22 12,704 32 13,161 30
[Total] 41,447 40,488
Liabilities included in disposal groups classified as held for sale 26 2 3
Total liabilities 123,627 124,488
TOTAL LIABILITIES AND SHAREHOLDERS’ EQUITY 166,995 171,426
Consolidated financial statements

114 Half-Year Financial Report at June 30, 2020
Statement of Changes in Consolidated Shareholders’ Equity
Share capital and reserves attributable to the shareholders of the Parent Company
Millions of euro Share capital
Share premium
reserveTreasury
share reserve Legal reserveOther
reserves
Reserve from translation of financial
statements in currencies
other than euro
Reserve from measurement
of cash flow hedge financial
instruments
Reserve from measurement
of costs of hedging financial
instruments
Reserve from measurement
of financial instruments
FVOCI
Reserve from equity
investments accounted
for using the equity
method
Reserve from remeasurement of net liabilities/
(assets) of defined-benefit
plans
Reserve from
disposal of equity interests without loss of control
Reserve from
acquisitions of non-
controlling interests
Retained earnings and loss
carried forward
Equity attributable
to the shareholders of the Parent
Company
Non-controlling
interests
Total shareholders’
equity
At January 1, 2019 10,167 7,489 - 2,034 2,262 (3,317) (1,745) (258) 16 (63) (714) (2,381) (1,623) 19,853 31,720 16,132 47,852
Distribution of interim dividends - - - - - - - - - - - - - (1,423) (1,423) (677) (2,100)
Reclassifications - 7 - - - - - - - - - - (7) - - - -
Monetary revaluation - - - - - - - - - - - - - 51 51 92 143
Transactions in non-controlling interests - - - - - - - - - - - - 47 - 47 (130) (83)
Change in the scope of consolidation - - - - - (98) 41 - - - (5) - (1) (2) (65) 1 (64)
Comprehensive income/(loss) for the period - - - - - 193 (12) 13 6 (32) (124) - - 2,215 2,259 818 3,077
of which:
- other comprehensive income/(loss) - - - - - 193 (12) 13 6 (32) (124) - - - 44 140 184
- net income/(loss) for the period - - - - - - - - - - - - - 2,215 2,215 678 2,893
At June 30, 2019 10,167 7,496 - 2,034 2,262 (3,222) (1,716) (245) 22 (95) (843) (2,381) (1,584) 20,694 32,589 16,236 48,825
At January 1, 2020 10,167 7,487 (1) 2,034 2,262 (3,802) (1,610) (147) 21 (119) (1,043) (2,381) (1,572) 19,081 30,377 16,561 46,938
Distribution of interim dividends - - - - - - - - - - - - - (1,708) (1,708) (981) (2,689)
Reserve for share-based payments (LTI bonus) - - - - 2 - - - - - - - - - 2 - 2
Reclassification for curtailment of certain defined-benefit plans (IAS 19) following signing of 5th Endesa Collective Bargaining Agreement - - - - - - - - - - 106 - - (106) - - -
Monetary revaluation - - - - - - - - - - - - - 52 52 74 126
Transactions in non-controlling interests - - - - - (257) (13) - - - (28) - 213 (2) (87) (693) (780)
Comprehensive income/(loss) for the period - - - - - (2,120) 854 (158) (1) (1) 23 - - 1,947 544 (773) (229)
of which:
- other comprehensive income/(loss) - - - - - (2,120) 854 (158) (1) (1) 23 - - - (1,403) (1,229) (2,632)
- net income/(loss) for the period - - - - - - - - - - - - - 1,947 1,947 456 2,403
At June 30, 2020 10,167 7,487 (1) 2,034 2,264 (6,179) (769) (305) 20 (120) (942) (2,381) (1,359) 19,264 29,180 14,188 43,368

Inte
rim
rep
ort
on o
per
atio
ns
Conden
sed inte
rim
conso
lidat
ed fi
nan
cial
sta
tem
ents
115
Share capital and reserves attributable to the shareholders of the Parent Company
Millions of euro Share capital
Share premium
reserveTreasury
share reserve Legal reserveOther
reserves
Reserve from translation of financial
statements in currencies
other than euro
Reserve from measurement
of cash flow hedge financial
instruments
Reserve from measurement
of costs of hedging financial
instruments
Reserve from measurement
of financial instruments
FVOCI
Reserve from equity
investments accounted
for using the equity
method
Reserve from remeasurement of net liabilities/
(assets) of defined-benefit
plans
Reserve from
disposal of equity interests without loss of control
Reserve from
acquisitions of non-
controlling interests
Retained earnings and loss
carried forward
Equity attributable
to the shareholders of the Parent
Company
Non-controlling
interests
Total shareholders’
equity
At January 1, 2019 10,167 7,489 - 2,034 2,262 (3,317) (1,745) (258) 16 (63) (714) (2,381) (1,623) 19,853 31,720 16,132 47,852
Distribution of interim dividends - - - - - - - - - - - - - (1,423) (1,423) (677) (2,100)
Reclassifications - 7 - - - - - - - - - - (7) - - - -
Monetary revaluation - - - - - - - - - - - - - 51 51 92 143
Transactions in non-controlling interests - - - - - - - - - - - - 47 - 47 (130) (83)
Change in the scope of consolidation - - - - - (98) 41 - - - (5) - (1) (2) (65) 1 (64)
Comprehensive income/(loss) for the period - - - - - 193 (12) 13 6 (32) (124) - - 2,215 2,259 818 3,077
of which:
- other comprehensive income/(loss) - - - - - 193 (12) 13 6 (32) (124) - - - 44 140 184
- net income/(loss) for the period - - - - - - - - - - - - - 2,215 2,215 678 2,893
At June 30, 2019 10,167 7,496 - 2,034 2,262 (3,222) (1,716) (245) 22 (95) (843) (2,381) (1,584) 20,694 32,589 16,236 48,825
At January 1, 2020 10,167 7,487 (1) 2,034 2,262 (3,802) (1,610) (147) 21 (119) (1,043) (2,381) (1,572) 19,081 30,377 16,561 46,938
Distribution of interim dividends - - - - - - - - - - - - - (1,708) (1,708) (981) (2,689)
Reserve for share-based payments (LTI bonus) - - - - 2 - - - - - - - - - 2 - 2
Reclassification for curtailment of certain defined-benefit plans (IAS 19) following signing of 5th Endesa Collective Bargaining Agreement - - - - - - - - - - 106 - - (106) - - -
Monetary revaluation - - - - - - - - - - - - - 52 52 74 126
Transactions in non-controlling interests - - - - - (257) (13) - - - (28) - 213 (2) (87) (693) (780)
Comprehensive income/(loss) for the period - - - - - (2,120) 854 (158) (1) (1) 23 - - 1,947 544 (773) (229)
of which:
- other comprehensive income/(loss) - - - - - (2,120) 854 (158) (1) (1) 23 - - - (1,403) (1,229) (2,632)
- net income/(loss) for the period - - - - - - - - - - - - - 1,947 1,947 456 2,403
At June 30, 2020 10,167 7,487 (1) 2,034 2,264 (6,179) (769) (305) 20 (120) (942) (2,381) (1,359) 19,264 29,180 14,188 43,368
Consolidated financial statements

116 Half-Year Financial Report at June 30, 2020
Consolidated Statement of Cash FlowsMillions of euro Notes 1st Half
2020 2019of which with related parties
of which with related parties
Income before taxes for the period 3,437 3,887
Adjustments for:
Net impairment/(reversals) of trade receivables and other receivables 7 637 347
Depreciation, amortization and other impairment losses 7 3,465 3,347
Financial (income)/expense 9-10 1,119 1,241
Net income of equity investments accounted for using the equity method 11 (13) 85
Changes in net working capital: (3,831) (2,229)
- inventories (196) (242)
- trade receivables 660 (31) (251) 91
- trade payables (3,142) 439 (2,605) 145
- other contract assets (1) (7) (95)
- other contract liabilities (1) (118) (1)
- other assets/liabilities (1,028) (13) 965 (94)
Accruals to provisions (199) 398
Utilization of provisions (515) (625)
Interest income and other financial income collected 810 31 684 49
Interest expense and other financial expense paid (1,859) (29) (1,767) (15)
Net (income)/expense from measurement of commodities (122) 55
Income taxes paid (891) (589)
Capital (gains)/losses 4 (215)
Cash flows from operating activities (A) 2,042 4,619
Investments in property, plant and equipment 14 (3,466) (3,503)
Investments in intangible assets 15 (361) (461)
Investments in non-current contract assets 20 (310) (207)Investments in entities (or business units) less cash and cash equivalents acquired (7) (249)Disposals of entities (or business units) less cash and cash equivalents sold 88 454(Increase)/Decrease in other investing activities (63) (46)
Cash flows from investing/disinvesting activities (B) (4,119) (4,012)
Financial debt (new long-term borrowing) 25 1,884 3,824
Repayments of financial debt (1) 25 (1,941) (2,917)
Other changes in net financial debt (1) 25 2,953 (45) 165 (45)
Receipts from disposal of equity investments without loss of control (1) - -Payments for acquisitions of equity investments without change of control and other transactions with non-controlling interests (1) (973) (449)Ancillary charges in disposal of equity investments without loss of control - -
Sale/(Purchase) of treasury shares - -
Dividends and interim dividends paid (2,629) (2,174)
Cash flows from financing activities (C) (706) (1,551)
Impact of exchange rate fluctuations on cash and cash equivalents (D) (374) 31
Increase/(Decrease) in cash and cash equivalents (A+B+C+D) (3,157) (913)
Cash and cash equivalents at the beginning of the period (2) 9,080 6,714
Cash and cash equivalents at the end of the period (3) 5,923 5,801
(1) In order to improve the presentation of these items, they have been broken down to a greater extent than in the past, making it necessary to reclassify the figures for 2019 in order to ensure the uniformity and comparability of the data with the previous year.
(2) Of which cash and cash equivalents equal to €9,029 million at January 1, 2020 (€6,630 million at January 1, 2019), short-term securities equal to €51 million at January 1, 2020 (€63 million at January 1, 2019) and cash and cash equivalents pertaining to “Assets held for sale” in the amount of €21 million at January 1, 2019.
(3) Of which cash and cash equivalents equal to €5,840 million at June 30, 2020 (€5,747 million at June 30, 2019) and short-term securities equal to €83 million at June 30, 2020 (€54 million at June 30, 2019).

Inte
rim
rep
ort
on o
per
atio
ns
Conden
sed inte
rim
conso
lidat
ed fi
nan
cial
sta
tem
ents
117Explanatory notes
Explanatory notes
1. Accounting policies and measurement criteriaEnel SpA, which operates in the energy utility sector, has its
registered office in Viale Regina Margherita 137, Rome, Italy.
The Half-Year Financial Report for the period ended June 30,
2020 comprises the financial statements of the Company, its
subsidiaries and the Group’s share in associated companies
and joint ventures, as well as its share of the assets, liabili-
ties, costs and revenue of joint operations (“the Group”). A
list of the subsidiaries, associated companies, joint ventures
and joint operations included in the scope of consolidation is
reported in the attachments.
For a discussion of the main activities of the Group, please
see the interim report on operations.
This Half-Year Financial Report was approved for publication
by the Board on July 29, 2020.
Compliance with IFRS/IASThe Half-Year Financial Report of the Group at and for the six
months ended at June 30, 2020 has been prepared pursuant
to Article 154-ter of Legislative Decree 58 of February 24,
1998 as amended by Legislative Decree 195 of November 6,
2007 and Article 81 of the Issuers Regulation as amended.
The condensed interim consolidated financial statements
for the six months ended at June 30, 2020 included in the
Half-Year Financial Report have been prepared in complian-
ce with the international accounting standards (International
Accounting Standards - IAS and International Financial Repor-
ting Standards - IFRS) issued by the International Accounting
Standards Board (IASB) as well as the interpretations of the
International Financial Reporting Interpretations Committee
(IFRIC) and the Standing Interpretations Committee (SIC), re-
cognized by the European Union pursuant to Regulation (EC)
no. 1606/2002 and in effect at the same date. All of these
standards and interpretations are hereinafter referred to as
“IFRS-EU”.
More specifically, the financial statements have been drafted
in compliance with “IAS 34 – Interim financial reporting” and
consist of the consolidated income statement, the statement
of consolidated comprehensive income, the consolidated ba-
lance sheet, the statement of changes in consolidated equi-
ty, the consolidated statement of cash flows, and the related
explanatory notes.
The Enel Group has adopted the half-year as the reference
interim period for the purposes of applying IAS 34 and the
definition of interim financial report specified therein.
The accounting standards adopted, the recognition and mea-
surement criteria and the consolidation criteria and methods
used for the condensed interim consolidated financial state-
ments at June 30, 2020 are the same as those adopted for
the consolidated financial statements at December 31, 2019
(please see the related report for more information), with the
exception of the new accounting standards adopted for the
first time and management’s assumptions concerning certain
areas of the financial statements as a result of the COVID-19
pandemic, which are discussed below.
These condensed interim consolidated financial statements
may therefore not include all the information required to be
reported in the annual financial statements and must be read
together with the financial statements for the period ended
December 31, 2019.
In addition to the accounting standards applied in preparing
the consolidated financial statements at December 31, 2019,
the following standards, interpretations and amendments of
existing standards relevant to the Enel Group took effect as
from January 1, 2020.
> “Amendments to IFRS 3 – Definition of a Business”, is-
sued in October 2018, is intended to assist companies
in determining whether a set of activities and assets is a
business. More specifically, the amendments clarify that
a business, considered as an integrated set of activities
and assets, must include, at a minimum, an input and a
substantive process that together significantly contribute
to the ability to create outputs. Accordingly, the amend-
ments clarify that a business cannot exist without inclu-
ding the inputs and substantive processes necessary to
produce outputs. The definition of “output”, as modified by
these amendments, focuses on the goods and services

118 Half-Year Financial Report at June 30, 2020
delivered to customers, on investment income and other
revenue and excludes returns in the form of lower costs or
other economic benefits.
> “Amendments to IFRS 9, IAS 39 and IFRS 7 – Interest
Rate Benchmark Reform”, issued in September 2019. The
amendments: (i) provide for temporary exceptions that
enable hedging relationships to continue during the period
of uncertainty until alternative risk-free rates are establi-
shed with the interbank offered rates (IBORs) reform; and
(ii) require additional disclosures on hedging relationships
directly affected by the uncertainty. In this regard, note
that the reform will impact fair value measurement, the
effects of hedge accounting and the net financial results
when the alternative rates are defined.
> “Amendments to IAS 1 and IAS 8 – Definition of Material”,
issued in October 2018, to align the definition of “material”
between the accounting standards and the Conceptual
Framework for Financial Reporting and clarify a number of
aspects. The definition of material is as follows: “informa-
tion is material if omitting, misstating or obscuring it could
reasonably be expected to influence decisions that the pri-
mary users of general purpose financial statements make
on the basis of those financial statements, which provi-
de financial information about a specific reporting entity.”
More specifically, the amendments clarify that:
- “obscuring information“ regards situations for which
the effect for users of financial statements is similar
to the omission or misstatement of information whose
materiality is assessed in the context of the financial
statements taken as a whole;
- “primary users of financial statements“, to whom ge-
neral purpose financial statements are directed, are
“existing and potential investors, lenders and other
creditors” who must rely on general purpose financial
statements for much of the financial information they
need; and
- “materiality” depends on the nature or magnitude of
information, or both. An entity assesses whether infor-
mation, either individually or in combination with other
information, is material in the context of its financial
statements taken as a whole. A misstatement of infor-
mation is material if it could reasonably be expected to
influence decisions made by the primary users of the
financial statements.
> “Amendments to References to the Conceptual Fra-
mework in IFRS Standards”, issued in March 2018. The do-
cument sets out the amendments to affected standards
in order to update references to the revised Conceptual
Framework. These amendments accompany the latest
version of the Revised Conceptual Framework for Finan-
cial Reporting, issued in March 2018 and in effect as from
January 1, 2020, which includes some new concepts,
provides updated definitions and recognition criteria and
clarifies some important concepts. The main amendments
include:
- an increase in the importance of management’s
stewardship of economic resources for financial repor-
ting purposes;
- the restoration of prudence as an element supporting
neutrality;
- the definition of reporting entity, which may be a legal
entity or a portion of that entity;
- the revision of the definitions of assets and liabilities;
- elimination of the probability threshold in recognition
and the addition of guidelines for derecognition;
- the addition of guidelines on various measurement ba-
ses; and
- the affirmation that profit or loss is the primary indica-
tor of performance and that, in principle, income and
expenses included in other comprehensive income
shall be recycled to the income statement when doing
so results in the income statement providing more re-
levant information or a more faithful representation.
COVID-19In line with the recommendations of ESMA in the public
statements2 published in March, May and July 2020, and of
CONSOB in its warning notices nos. 6/20 of April 9, 2020
and 8/20 of July 16, 2020, the Group has carefully monitored
the evolution of the COVID-19 pandemic with regard to the
main areas and countries in which we operate, based on the
analytical dimensions indicated in the section “Events after
the reporting period” in the notes to the 2019 consolidated
financial statements.
The Half-Year Financial Report at June 30, 2020 provides an
update of the information concerning the COVID-19 pande-
mic, based on the specific company circumstances and the
availability of reliable information, in order to highlight its im-
(2) ESMA 71-99-1290 of March 11 2020, ESMA 32-63-951 of March 25, 2020, ESMA 31-67-742 of March 27, 2020, ESMA 32-63-972 of May 20, 2020 and ESMA 32-61-417 of July 21, 2020.

Inte
rim
rep
ort
on o
per
atio
ns
Conden
sed inte
rim
conso
lidat
ed fi
nan
cial
sta
tem
ents
119Explanatory notes
pact on our business, on the financial position and on Group
performance at that date, also identifying the main risks and
uncertainties to which the Group is exposed. With regard to
the impact on performance of COVID-19, see the discussion
of the Group’s performance in the interim report on opera-
tions in this Half-Year Financial Report at June 30, 2020.
With regard to the assessment of the impacts of COVID-19,
the forecasts for the future evolution of the macroeconomic,
financial and business context in which the Group operates
are in any event characterized by a high degree of uncertainty,
which could be reflected in the assessments and estimates
made by management of the carrying amounts of the assets
and liabilities affected by the greatest volatility. At June 30,
2020, the areas of the financial statements that, based on
the information available at that date and considering the con-
stantly evolving situation, are most affected by estimates and
judgments are the following:
> measurement of non-financial assets: assessments of the
existence of any evidence of impairment and the methods
and assumptions used to estimate the recoverable value
of such assets pursuant to “IAS 36 – Impairment of as-
sets”, including the sensitivity analyses, confirm the full
recoverability at June 30, 2020 of the carrying amounts
of the cash generating units (CGUs). Accordingly, no im-
pairment losses have been recognized in respect of those
assets for reasons associated with COVID-19. Please see
note 16 for more details regarding impairment losses and
writebacks on non-financial assets;
> measurement of financial assets: in some cases, in order
to take account of the effects of COVID-19 on the impair-
ment of trade receivables, specific adjustments have been
made to the results of the impairment model adopted by
the Group on the basis of “IFRS 9 – Financial instrumen-
ts” (so-called post-model adjustments) determined mainly
on the basis of an expert credit judgment based on the
deterioration in the collection status of certain customer
segments. These adjustments prompted the recognition
of certain writedowns based on the information available.
Please see note 23 for more details regarding impairment
losses and writebacks on financial assets;
> employee benefits: as a result of COVID-19, some signifi-
cant actuarial assumptions used to determine the present
value of the employee benefit obligation defined pursuant
to “IAS 19 – Employee benefits” have been updated. Cer-
tain benefits have been remeasured where necessary in
the light of the sensitivity analysis performed. Please see
note 28 for more details;
> provisions for risks and charges: the assumptions under-
lying the assessment of the possible presence of onerous
contracts have been updated. This analysis found no situa-
tions for which it would be necessary to recognize additio-
nal provisions as a result of COVID-19, pursuant to “IAS 37
– Provisions, contingent liabilities and contingent assets”.
Please see note 29 for more details;
> income taxes: where required, any tax relief has been re-
cognized and the timing of the reversal of deductible tem-
porary differences and the recoverability of deferred tax
assets have been monitored pursuant to “IAS 12 – Income
taxes”. See note 12 for more details.
SeasonalityThe turnover and performance of the Group could be im-
pacted, albeit slightly, by developments in weather condi-
tions. More specifically, in warmer periods of the year, gas
sales decline, while during periods in which factories are clo-
sed for holidays, electricity sales decline. Similarly, hydroe-
lectric generation performance is particularly high during the
winter and early spring given the more favorable seasonable
water conditions. In view of the slight financial impact of the-
se variations, further mitigated by the fact that the Group’s
operations are spread across both hemispheres and, therefo-
re, the impact of weather-related factors tends to be uniform
throughout the year, no additional disclosure (required under
IAS 34.21) for developments in the 12 months ended June
30, 2020 is provided.

120 Half-Year Financial Report at June 30, 2020
2. Main changes in the scope of consolidationAt June 30, 2030, the scope of consolidation had changed
with respect to June 30, 2019 and December 31, 2019, as a
result of the following main transactions:
2019 > Disposal, on March 1, 2019, of 100% of Mercure Srl, a
company to which the business unit consisting of the Mer-
cure biomass plant and the related legal relationships had
been previously transferred. As provided for in the preli-
minary sale contract signed on May 30, 2018, the provi-
sional price received for the transaction was €162 million,
corresponding to the value of the business unit at January
1, 2018. At June 30, 2019 that price was adjusted on the
basis of a number of specified variables;
> acquisition, on March 14, 2019, by Enel Green Power SpA,
acting through its US renewables subsidiary Enel Nor-
th America (formerly Enel Green Power North America),
of 100% of 13 companies that own seven operating re-
newable generation plants from Enel Green Power North
America Renewable Energy Partners (EGPNA REP), a joint
venture 50% owned by Enel North America (formerly Enel
Green Power North America) and 50% by General Electric
Capital’s Energy Financial Services;
> acquisition, on March 27, 2019, by Enel Green Power SpA
(EGP), acting through its US renewables subsidiary Enel
North America (formerly Enel Green Power North Ameri-
ca), of Tradewind Energy, a renewable energy project de-
velopment company based in Lenexa, Kansas. EGP has
incorporated the entire Tradewind development platform,
which includes 13 GW of wind, solar and storage projects
located in the United States. The agreement also provided
for the sale, which took place in June, of Savion, a wholly
owned subsidiary of Tradewind;
> acquisition, on April 30, 2019, by Enel X Italia of 100% of
YouSave SpA, an Italian company operating in the energy
services sector, providing assistance to large electricity
consumers;
> finalization, on May 31, 2019, through the renewables sub-
sidiary Enel Green Power Brasil Participações Ltda, of the
disposal of 100% of three renewables plants in Brazil. The
total price of the transaction was about R$2.7 billion, the
equivalent of about €603 million.
2020 > In January 2020, the Wild Plains project company, 100%
owned by Tradewind, was sold. The sale did not have an
impact on profit or loss;
> on May 11, 2020 Endesa Energía sold 80% of Endesa So-
luciones for €21 million. The interest, which had previously
been consolidated on a line-by-line basis, is now accounted
for using the equity method.
Other changesIn addition to the above changes in the scope of consolida-
tion, the following transactions, which although they do not
represent transactions involving the acquisition or loss of con-
trol, gave rise to a change in the interest held by the Group in
the investees:
> disposal, in January 2020, of a number of 50% owned joint
ventures in Enel North America’s hydroelectric portfolio. In
December 2019, the entire portfolio had been classified as
held for sale in accordance with IFRS 5. The gain recogni-
zed in profit or loss was €4 million;
> in the 1st Half of 2020, Enel SpA increased its interest in
Enel Américas by 5.03% under the provisions of share
swaps entered into with a financial institution. The Group’s
total stake is therefore now 65%;
> Enel SpA increased its interest in Enel Chile by 2.89% un-
der the provisions of two share swaps entered into with
a financial institution. The Group’s total stake is therefore
now 64.93%.
3. Restatement of comparative disclosuresThe figures presented in the comments and tables of the no-
tes to these condensed interim consolidated financial state-
ments at June 30, 2020 are consistent and comparable.
In this regard, note that it was necessary to adjust the income
statement figures at June 30, 2019 for the following items:
1) in the light of the introduction of the new accounting policy
following the IFRIC 2019 Agenda Decision, for the recognition
of contracts for the sale and purchase of non-financial items

Inte
rim
rep
ort
on o
per
atio
ns
Conden
sed inte
rim
conso
lidat
ed fi
nan
cial
sta
tem
ents
121Explanatory notes
that are accounted for at fair value through profit or loss in
accordance with IFRS 9 and settled with physical delivery,
analogous reclassifications of the comparative balances for
2019 have been performed to ensure the uniformity and com-
parability of the figures. These reclassifications had no impact
on margins or on shareholders’ equity. Please see note 4 for
further details;
2) with regard to disclosures for operating segments, begin-
ning with the close of the accounts at September 30, 2019,
the Enel Group has changed its primary and secondary re-
porting segments in accordance with the provisions of IFRS
8. Specifically, bearing in mind that in 2019 management has
begun to report performance by business area, the Group has
therefore adopted the following reporting sectors:
> primary sector: business area; and
> secondary sector: geographical area.
The business area is therefore the main discriminant in the
analyses performed and decisions taken by the management
of the Enel Group, and is fully consistent with the internal
reporting prepared for these purposes since the results are
measured and evaluated first and foremost for each business
area and only thereafter are they broken down by country.
The new business structure is organized as follows: Thermal
Generation and Trading, Enel Green Power, Infrastructure and
Networks, End-user Markets, Enel X, Services and Holding/
Other;
3) with effect from September 30, 2019, the Latin America
area connected with the Enel Green Power Business Line
also includes the countries Panama, Costa Rica, Guatemala,
El Salvador and Nicaragua, which had previously been repor-
ted in the North and Central America geographical area (now
renamed North America and consisting of the following coun-
tries: United States, Canada and Mexico);
4) with effect from March 31, 2020, in Latin America the figu-
res for the large customers managed by the generation com-
panies have been reallocated to the End-user Markets Global
Business Line.
The changes in segment reporting referred to in points 2),
3) and 4) had no impact on the overall figures for the Group,
although amounts were reclassified within the various Busi-
ness Lines.
4. Effects of the application of the IFRIC 2019 Agenda Decision and IAS 29 (Financial Reporting in Hyperinflationary Economies)In its Agenda Decision of March 2019, the IFRS Interpreta-
tions Committee (IFRIC) clarified the proper recognition of
contracts entered into to buy or sell fixed-price non-financial
items, accounted for at fair value through profit or loss under
IFRS 9 and physically settled, including energy commodities.
Based on that measure, the Group changed its accounting
policy for the year ended December 31, 2019, with no impact
on net income or equity.
Past practice was based on the recognition in:
> “Net income/(expense) from commodity contracts meas-
ured at fair value” of changes in the fair value of outstand-
ing derivatives as well as of the effects in profit or loss,
at the settlement date, of the derecognition of derivative
assets/liabilities deriving from the fair value measurement
of those contracts;
> “Revenue from sales and services” and “Electricity, gas and
fuel purchases” of revenue and costs on the settlement date.
The current treatment of such contracts for non-financial
items that do not meet the requirements for the own use
exemption envisages recognition:
> under “Revenue” of changes in fair value on outstanding
sale contracts as well as, at the settlement date, of the
revenue together with the effects in profit or loss from the
derecognition of assets/liabilities deriving from the fair val-
ue measurement of those contracts;
> under “Costs”:
- of changes in fair value on outstanding purchase con-
tracts; and
- at the settlement date, of the associated purchase
costs as well as the effects in profit or loss from
derecognition of assets/liabilities deriving from the fair
value measurement of those contracts.
Consequently the income statement line “Net income/(ex-
pense) from commodity contracts measured at fair value”
has been renamed as “Net income/(expense) from commod-
ity risk management”, which currently includes only changes
in fair value and settlement effects of energy commodity de-
rivatives without physical settlement.

122 Half-Year Financial Report at June 30, 2020
Impact on the income statement
Millions of euro Notes 1st Half
2019Effect of IFRIC
application2019
Revenue 6
Revenue from sales and services 37,516 1,976 39,492
Other income 1,475 - 1,475
[Subtotal] 38,991 1,976 40,967
Costs 7
Electricity, gas and fuel purchases 18,729 1,659 20,388
Services and other materials 8,824 25 8,849
Personnel 2,338 - 2,338
Net impairment/(reversals) of trade receivables and other receivables 347 - 347
Depreciation, amortization and other impairment losses 3,347 - 3,347
Other operating expenses 1,315 - 1,315
Capitalized costs (1,018) - (1,018)
[Subtotal] 33,882 1,684 35,566
Net income/(expense) from commodity risk management 8 104 (292) (188)
Operating income 5,213 - 5,213
Financial income from derivatives 9 595 - 595
Other financial income 10 847 - 847
Financial expense from derivatives 9 665 - 665
Other financial expense 10 2,103 - 2,103
Net income/(expense) from hyperinflation adjustments 10 85 - 85Share of income/(losses) of equity investments accounted for using the equity method 11 (85) - (85)
Income before taxes 3,887 - 3,887
Income taxes 12 994 - 994
Net income from continuing operations 2,893 - 2,893
Net income from discontinued operations - - -Net income for the period (shareholders of the Parent Companyand non-controlling interests) 2,893 - 2,893
Attributable to shareholders of the Parent Company 2,215 - 2,215
Attributable to non-controlling interests 678 - 678Basic earnings/(loss) per share attributable to shareholders of the Parent Company (euro) 13 0.22 - 0.22Diluted earnings/(loss) per share attributable to shareholders of the Parent Company (euro) 13 0.22 - 0.22Basic earnings/(loss) per share from continuing operations attributable to shareholders of the Parent Company (euro) 13 0.22 - 0.22Diluted earnings/(loss) per share from continuing operations attributable to shareholders of the Parent Company (euro) 13 0.22 - 0.22

Inte
rim
rep
ort
on o
per
atio
ns
Conden
sed inte
rim
conso
lidat
ed fi
nan
cial
sta
tem
ents
123Explanatory notes
With regard to the details in notes 6 and 7 on revenue and co-
sts, respectively, the following tables give a breakdown of the
effects of the application of the interpretation on contracts in
commodities with physical delivery that fall within the scope
of IFRS 9.
Millions of euro Notes 1st Half
2019Effect of IFRIC
application2019
Revenue from sales and services
Sale of energy commodities under contracts with physical delivery (IFRS 9):
- sale of electricity 6 2,248 (217) 2,031
- sale of fuels 6 4,240 (725) 3,515
- sale of environmental certificates 6 4 - 4- gain/(loss) on derivatives on sale of commodities with physical
delivery 6 - 2,918 2,918
Total 6,492 1,976 8,468
Millions of euro Notes 1st Half
2019Effect of IFRIC
application 2019
Purchase of electricity, gas and fuel
Purchase of energy commodities under contracts with physical delivery (IFRS 9):
- electricity 7 1,971 (165) 1,806
- gas 7 4,502 (767) 3,735
- gain/(loss) on derivatives on purchase of commodities with physical delivery 7 - 2,591 2,591
Total 6,473 1,659 8,132
Costs for services and other materialsPurchase of CO2 allowances under contracts with physical delivery (IFRS 9) 7 391 38 429Gain/(Loss) on derivatives on purchase of CO2 allowances with physical delivery 7 - (13) (13)
Total 391 25 416
Net income/(expense) from commodity risk management 8 104 (292) (188)
Total impact of IFRIC application on profit or loss (268) - (268)
Argentina – Hyperinflationary economy: impact of the application of IAS 29 As from July 1, 2018, the Argentine economy has been con-
sidered hyperinflationary based on the criteria established by
“IAS 29 – Financial reporting in hyperinflationary economies”.
This designation is determined following an assessment of a
series of qualitative and quantitative circumstances, including
the presence of a cumulative inflation rate of more than 100%
over the previous three years.
For the purposes of preparing these condensed interim con-
solidated financial statements and in accordance with IAS 29,
certain items of the balance sheets of the investees in Argen-
tina have been remeasured by applying the general consumer
price index to historical data in order to reflect changes in the
purchasing power of the Argentine peso at the reporting date
for those companies.
Bearing in mind that the Enel Group acquired control of the
Argentine companies on June 25, 2009, the remeasurement
of the non-monetary balance-sheet figures was conducted by
applying the inflation indices starting from that date. In addi-
tion to being already reflected in the opening balance sheet,
the accounting effects of that remeasurement also include
changes during the period. More specifically, the effect of the
remeasurement of non-monetary items, the components of

124 Half-Year Financial Report at June 30, 2020
equity and the components of the income statement recogni-
zed in the 1st Half of 2020 was recognized in a specific line
of the income statement under financial income and expen-
se. The associated tax effect was recognized in taxes for the
period.
In order to also take account of the impact of hyperinflation
on the exchange rate of the local currency, the income sta-
tement balances expressed in the hyperinflationary currency
have been translated into the Group’s presentation curren-
cy (euro) applying, in accordance with IAS 21, the closing
exchange rate rather than the average rate for the period in
order to adjust these amounts to current values.
The cumulative changes in the general price indices at De-
cember 31, 2018, December 31, 2019 and June 30, 2020 are
shown in the following table:
Periods Cumulative change in general consumer price index
From July 1, 2009 to December 31, 2018 346.30%
From January 1, 2019 to December 31, 2019 54.46%
From January 1, 2020 to June 30, 2020 13.05%
In the 1st Half of 2020, the application of IAS 29 generated
net financial income (gross of tax) of €30 million.
The following tables report the effects of IAS 29 on the ba-
lance at June 30, 2020 and the impact of hyperinflation on
the main income statement items for the 1st Half of 2019,
differentiating between that concerning the revaluation on the
basis of the general consumer price index and that due to
the application of the closing exchange rate rather than the
average exchange rate for the period, in accordance with the
provisions of IAS 21 for hyperinflationary economies.
Millions of euro
Cumulative hyperinflation effect at Dec.
31, 2019
Hyperinflation effect for the
periodExchange
differences
Cumulative hyperinflation effect at June
30, 2020
Total assets 857 152 (125) 884
Total liabilities 164 54 (48) 170
Shareholders’ equity 693 98 (1) (77) 714
(1) The figure includes the net loss for the 1st Half of 2019, equal to €28 million.
Millions of euro 1st Half 2020
IAS 29 effect IAS 21 effect Total effect
Revenue 23 (74) (51)
Costs 57 (1) (45) (2) 12
Operating income (34) (29) (63)
Net financial income/(expense) 1 (1) -
Net income/(expense) from hyperinflation adjustments 30 - 30
Income before taxes (3) (30) (33)
Income taxes 25 (8) 17
Net income for the period (shareholders of the Parent Company and non-controlling interests) (28) (22) (50)
Attributable to shareholders of the Parent Company (7) (12) (19)
Attributable to non-controlling interests (21) (10) (31)
(1) Includes impact on depreciation, amortization and impairment losses of €27 million.(2) Includes impact on depreciation, amortization and impairment losses of €(4) million.

Inte
rim
rep
ort
on o
per
atio
ns
Conden
sed inte
rim
conso
lidat
ed fi
nan
cial
sta
tem
ents
125Explanatory notes
5. Segment information The presentation of performance and financial position by bu-
siness area presented here is based on the approach used
by management in monitoring Group performance for the
two periods being compared. For more information on the
developments in performance and financial position that cha-
racterized the period under review, please see the appropriate
section of this Half-Year Financial Report.
Performance by business area
1st Half of 2020 (1)
Millions of euro
Thermal Generation and Trading
Enel Green Power
Infrastructure and
NetworksEnd-user Markets Enel X Services
Other, eliminations
and adjustments Total
Revenue and other income from third parties 11,588 3,468 8,809 8,333 398 774 5 33,375Revenue and other income from transactions with other segments 688 107 739 6,084 65 50 (7,733) -
Total revenue 12,276 3,575 9,548 14,417 463 824 (7,728) 33,375
Total costs 10,478 1,341 5,732 12,975 440 810 (7,647) 24,129
Net income/(expense) from commodity risk management (797) 57 - 140 - (4) 3 (601)
Depreciation and amortization 444 624 1,316 169 66 81 17 2,717
Impairment losses 756 15 175 546 6 1 (1) 1,498
Reversals of impairment losses (15) (13) (21) (62) (1) (2) 1 (113)
Operating income (184) 1,665 2,346 929 (48) (70) (95) 4,543
Capital expenditure 239 1,912 1,668 182 103 19 14 4,137
(1) Segment revenue includes both revenue from third parties and revenue flows between the segments. An analogous approach was taken for other income and costs for the period.

126 Half-Year Financial Report at June 30, 2020
1st Half of 2019 (1) (2) (3) (4)
Millions of euro
Thermal Generation and Trading
Enel Green Power
Infrastructure and
NetworksEnd-user Markets Enel X Services
Other, eliminations
and adjustments Total
Revenue and other income from third parties 15,834 3,576 9,890 10,362 430 870 5 40,967Revenue and other income from transactions with other segments 612 259 797 6,479 62 33 (8,242) -
Total revenue 16,446 3,835 10,687 16,841 492 903 (8,237) 40,967
Total costs 15,374 1,543 6,716 15,178 420 821 (8,180) 31,872
Net income/(expense) from commodity risk management (167) (18) - (2) - - (1) (188)
Depreciation and amortization 616 602 1,320 158 69 83 11 2,859
Impairment losses 494 6 47 448 14 2 - 1,011
Reversals of impairment losses (3) (7) (46) (116) (3) (1) - (176)
Operating income (202) 1,673 2,650 1,171 (8) (2) (69) 5,213
Capital expenditure 292 1,816 (5) 1,726 187 105 31 10 4,167
(1) Segment revenue includes both revenue from third parties and revenue flows between the segments. An analogous approach was taken for other income and costs for the period.
(2) The figures for “Revenue and other income” and “Net income/(expense) from commodity risk management” for the 1st Half of 2019 have been adjusted to take account of the interpretations of the IFRS Interpretations Committee (IFRIC) contained in the Agenda Decision of 2019, which involved changes in the classification, with no impact on margins, of the effects of purchase and sales contracts for commodities measured at fair value through profit or loss (for more details, see note 4 in these condensed interim consolidated financial statements at June 30, 2020).
(3) The figures have been restated to ensure comparability with results for the 1st Half of 2019, which are presented using business area as the primary reporting segment.
(4) The figures have been adjusted to take account of the fact that in Latin America the figures pertaining to large customers managed by the generation companies have been reallocated to the End-user Markets Global Business Line.
(5) Does not include €4 million regarding units classified as “held for sale”.
Financial position by segment
At June 30, 2020
Millions of euro
Thermal Generation and Trading
Enel Green Power
Infrastructure and
NetworksEnd-user Markets Enel X Services
Other, eliminations
and adjustments Total
Property, plant and equipment 10,583 30,401 36,146 151 438 692 11 78,422
Intangible assets 126 4,691 21,789 3,667 632 443 32 31,380
Current and non-current contract assets 5 2 421 - 43 27 76 574
Trade receivables 2,416 1,827 6,375 3,291 701 742 (4,044) 11,308
Other 1,706 1,415 2,831 595 233 1,098 (954) 6,924
Operating assets 14,836 (1) 38,336 (2) 67,562 7,704 2,047 3,002 (4,879) 128,608
Trade payables 2,174 1,599 4,531 3,602 303 753 (3,614) 9,348
Current and non-current contract liabilities 112 192 7,209 22 1 6 (36) 7,506
Sundry provisions 3,140 806 3,398 428 31 571 472 8,846
Other 1,187 1,449 7,528 2,566 442 1,047 34 14,253
Operating liabilities 6,613 4,046 (3) 22,666 6,618 777 2,377 (3,144) 39,953
(1) Of which €4 million regarding units classified as “held for sale”.(2) Of which €1 million regarding units classified as “held for sale”.(3) Of which €2 million regarding units classified as “held for sale”.

Inte
rim
rep
ort
on o
per
atio
ns
Conden
sed inte
rim
conso
lidat
ed fi
nan
cial
sta
tem
ents
127Explanatory notes
At December 31, 2019
Millions of euro
Thermal Generation and Trading
Enel Green Power
Infrastructure and
NetworksEnd-user Markets Enel X Services
Other, eliminations
and adjustments Total
Property, plant and equipment 11,863 30,351 36,333 160 442 663 11 79,823
Intangible assets 134 4,697 23,782 3,624 605 466 29 33,337
Current and non-current contract assets - - 482 - 53 75 43 653
Trade receivables 3,219 1,726 7,649 3,838 607 676 (4,632) 13,083
Other 1,426 1,421 1,654 543 1,098 1,283 (1,350) 6,075
Operating assets 16,642 (1) 38,195 (2) 69,900 (3) 8,165 2,805 3,163 (5,899) 132,971
Trade payables 3,383 2,192 5,411 5,028 414 949 (4,417) 12,960
Current and non-current contract liabilities 199 167 7,271 75 5 16 (104) 7,629
Sundry provisions 3,410 903 4,412 494 34 578 459 10,290
Other 1,074 1,843 8,867 2,642 415 1,451 (503) 15,789
Operating liabilities 8,066 5,105 25,961 (4) 8,239 868 2,994 (4,565) 46,668
(1) Of which €4 million regarding units classified as “held for sale”.(2) Of which €7 million regarding units classified as “held for sale”.(3) Of which €10 million regarding units classified as “held for sale”.(4) Of which €3 million regarding units classified as “held for sale”.
The following table reconciles segment assets and liabilities and the consolidated figures.
Millions of euro
at June 30, 2020 at Dec. 31, 2019
Total assets 166,995 171,426
Equity investments accounted for using the equity method 1,732 1,682
Other non-current financial assets 5,376 6,006
Long-term tax receivables included in “Other non-current assets” 1,599 1,587
Other current financial assets 4,328 4,305
Derivatives 8,936 5,448
Cash and cash equivalents 5,840 9,029
Deferred tax assets 8,789 9,112
Tax receivables 1,787 1,206
Financial and tax assets of “Assets held for sale” - 80
Segment assets 128,608 132,971
Total liabilities 123,627 124,488
Long-term borrowings 53,623 54,174
Non-current financial liabilities - -
Short-term borrowings 7,196 3,917
Current portion of long-term borrowings 2,738 3,409
Other current financial liabilities 750 754
Derivatives 8,339 5,961
Deferred tax liabilities 8,160 8,314
Income tax payable 997 209
Other tax payables 1,871 1,082
Financial and tax liabilities of “Liabilities held for sale” - -
Segment liabilities 39,953 46,668

128 Half-Year Financial Report at June 30, 2020
Revenue
6. Revenue - €33,375 million
Millions of euro 1st Half
2020 2019 Change
Sale of electricity (1) 16,699 19,747 (3,048) -15.4%
Transport of electricity 5,177 5,208 (31) -0.6%
Fees from network operators 458 450 8 1.8%
Transfers from institutional market operators 711 789 (78) -9.9%
Sale of gas 1,682 2,482 (800) -32.2%
Transport of gas 353 380 (27) -7.1%
Sale of fuels (1) 301 488 (187) -38.3%
Connection fees to electricity and gas networks 347 376 (29) -7.7%
Construction contracts 369 335 34 10.1%
Sale of environmental certificates (1) 16 26 (10) -38.5%
Sale of value-added services 82 128 (46) -35.9%
Other sales and services 646 615 31 5.0%
Total IFRS 15 revenue 26,841 31,024 (4,183) -13.5%
Sale of energy commodities under contracts with physical delivery (IFRS 9) (1) 3,163 5,550 (2,387) -43.0%Gain/(Loss) on derivatives on sale of commodities with physical delivery (IFRS 9) (1) 2,501 2,918 (417) -14.3%
Grants for environmental certificates 182 278 (96) -34.5%
Sundry reimbursements 141 325 (184) -56.6%
Gain on sale of subsidiaries, associates, joint ventures, joint operations and non-current assets held for sale 7 213 (206) -96.7%
Gain on sale of property, plant and equipment and intangible assets 9 19 (10) -52.6%
Other revenue and income 531 640 (109) -17.0%
Total revenue 33,375 40,967 (7,592) -18.5%
(1) The figures for the 1st Half of 2019 have been adjusted to take account of the interpretations of the IFRS Interpretations Committee (IFRIC) contained in the Agenda Decision of 2019, which involved changes in the classification, with no impact on margins, of the effects of purchase and sales contracts for commodities measured at fair value through profit or loss (for more details, see note 4 in these condensed interim consolidated financial statements at June 30, 2020).
Revenue from the “sale of electricity” came to €16,699 mil-
lion in the 1st Half of 2020, down €3,048 million on the same
period of the previous year (-15.4%). The decline is essentially
attributable to:
> the reduction in volumes sold in Italy (€657 million) and
Spain (€700 million), primarily due to the effects of CO-
VID-19;
> a significant decline in volumes sold in Latin America
(€1,437 million) due to COVID-19 and the depreciation of
local currencies against the euro;
> a decline in revenue in Russia (€202 million), mainly due to
the sale of the coal-fired Reftinskaya plant in October 2019.
The decrease of €800 million in revenue from the sale of gas
(-32.2%) compared with the 1st Half of 2019, which was lar-
gely registered in Spain and Italy, reflected the decline in vo-
lumes sold as a result of the closure of retailers and factories
in response to COVID-19.
Revenue from the sale of fuels contracted by €187 million
as a result of a decline in volumes handled by Enel Global
Trading.
Revenue from the sale of energy commodities under con-
tracts with physical delivery (IFRS 9) and the results of the fair
value measurement of those contracts decreased by a total
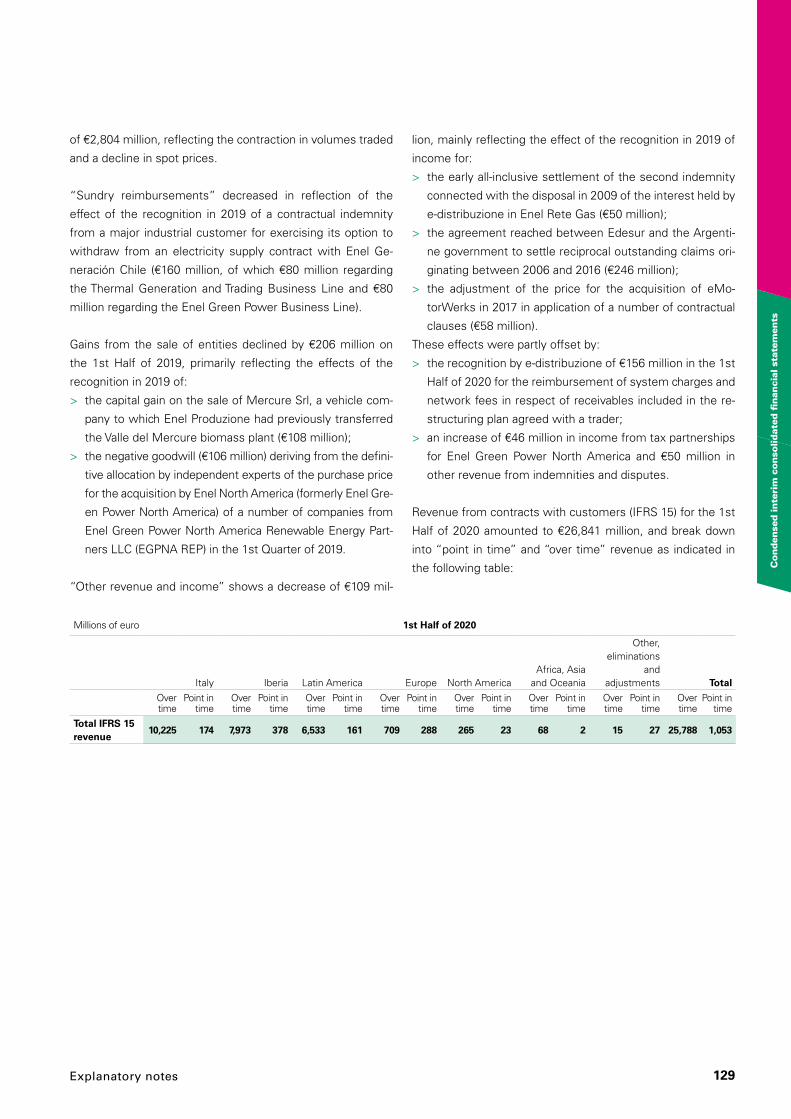
Inte
rim
rep
ort
on o
per
atio
ns
Conden
sed inte
rim
conso
lidat
ed fi
nan
cial
sta
tem
ents
129Explanatory notes
of €2,804 million, reflecting the contraction in volumes traded
and a decline in spot prices.
“Sundry reimbursements” decreased in reflection of the
effect of the recognition in 2019 of a contractual indemnity
from a major industrial customer for exercising its option to
withdraw from an electricity supply contract with Enel Ge-
neración Chile (€160 million, of which €80 million regarding
the Thermal Generation and Trading Business Line and €80
million regarding the Enel Green Power Business Line).
Gains from the sale of entities declined by €206 million on
the 1st Half of 2019, primarily reflecting the effects of the
recognition in 2019 of:
> the capital gain on the sale of Mercure Srl, a vehicle com-
pany to which Enel Produzione had previously transferred
the Valle del Mercure biomass plant (€108 million);
> the negative goodwill (€106 million) deriving from the defini-
tive allocation by independent experts of the purchase price
for the acquisition by Enel North America (formerly Enel Gre-
en Power North America) of a number of companies from
Enel Green Power North America Renewable Energy Part-
ners LLC (EGPNA REP) in the 1st Quarter of 2019.
“Other revenue and income” shows a decrease of €109 mil-
lion, mainly reflecting the effect of the recognition in 2019 of
income for:
> the early all-inclusive settlement of the second indemnity
connected with the disposal in 2009 of the interest held by
e-distribuzione in Enel Rete Gas (€50 million);
> the agreement reached between Edesur and the Argenti-
ne government to settle reciprocal outstanding claims ori-
ginating between 2006 and 2016 (€246 million);
> the adjustment of the price for the acquisition of eMo-
torWerks in 2017 in application of a number of contractual
clauses (€58 million).
These effects were partly offset by:
> the recognition by e-distribuzione of €156 million in the 1st
Half of 2020 for the reimbursement of system charges and
network fees in respect of receivables included in the re-
structuring plan agreed with a trader;
> an increase of €46 million in income from tax partnerships
for Enel Green Power North America and €50 million in
other revenue from indemnities and disputes.
Revenue from contracts with customers (IFRS 15) for the 1st
Half of 2020 amounted to €26,841 million, and break down
into “point in time” and “over time” revenue as indicated in
the following table:
Millions of euro 1st Half of 2020
Italy Iberia Latin America Europe North AmericaAfrica, Asia
and Oceania
Other, eliminations
and adjustments Total
Over time
Point in time
Over time
Point in time
Over time
Point in time
Over time
Point in time
Over time
Point in time
Over time
Point in time
Over time
Point in time
Over time
Point in time
Total IFRS 15 revenue
10,225 174 7,973 378 6,533 161 709 288 265 23 68 2 15 27 25,788 1,053

130 Half-Year Financial Report at June 30, 2020
Costs
7. Costs - €28,231 million
Millions of euro 1st Half
2020 2019 Change
Electricity (1) 7,260 10,470 (3,210) -30.7%
Fuel and gas (1) 6,509 9,918 (3,409) -34.4%
Total purchases of electricity, fuel and gas 13,769 20,388 (6,619) -32.5%
Wheeling 4,741 5,054 (313) -6.2%
Leases and rentals 196 170 26 15.3%
Other services 2,629 2,853 (224) -7.9%
Raw materials (1) 766 772 (6) -0.8%
Total services and other materials 8,332 8,849 (517) -5.8%
Personnel 1,855 2,338 (483) -20.7%
Depreciation 2,121 2,259 (138) -6.1%
Amortization 596 600 (4) -0.7%
Impairment losses and reversals 1,385 835 550 65.9%
Total depreciation, amortization and impairment losses 4,102 3,694 408 11.0%
Charges for environmental certificates 322 589 (267) -45.3%
Other operating expenses 767 726 41 5.6%
Total other operating expenses 1,089 1,315 (226) -17.2%
Capitalized materials costs (334) (372) 38 10.2%
Capitalized personnel costs (357) (371) 14 3.8%
Other capitalized costs (225) (275) 50 18.2%
Total capitalized costs (916) (1,018) 102 10.0%
TOTAL COSTS 28,231 35,566 (7,335) -20.6%
(1) The figures for the 1st Half of 2019 have been adjusted to take account of the interpretations of the IFRS Interpretations Committee (IFRIC) contained in the Agenda Decision of 2019, which involved changes in the classification, with no impact on margins, of the effects of purchase and sales contracts for commodities measured at fair value through profit or loss (for more details, see note 4 in these condensed interim consolidated financial statements at June 30, 2020).
“Electricity” purchases contracted significantly due to a decli-
ne in volumes purchased. The item includes purchases under
contracts with physical settlement (IFRS 9) and the results
of the measurement at fair value of those contracts, which
contracted by €585 million compared with the same period
of the previous year.
The decline in costs for “fuel and gas” reflects a decrease in
volumes traded and those used in electricity generation. The
item includes purchases of gas under contracts with physical
settlement (IFRS 9) and the results of the measurement at
fair value of those contracts, which decreased by €288 million
compared with the 1st Half of 2019.
Costs for “services and other materials” in the 1st Half of
2020 decreased by €517 million compared with the 1st Half
of 2019, mainly reflecting:
> a decline in costs for wheeling, primarily in Spain, Brazil
and Chile as a result of a decrease in volumes transported,
caused by the COVID-19 pandemic;
> a decrease of €67 million in costs for services connected with
the electric and gas business, mainly in Chile and Argentina;
> a decline of €54 million in costs for maintenance and repair
services in Italy.
“Personnel” costs in the 1st Half of 2020 amounted to
€1,855 million, a decrease of €483 million (-20.7%). The chan-
ge mainly reflects:

Inte
rim
rep
ort
on o
per
atio
ns
Conden
sed inte
rim
conso
lidat
ed fi
nan
cial
sta
tem
ents
131Explanatory notes
> a decline in costs in Spain, due to the modification of the
electricity discount benefit for employees following the
contract renewal and the entry into force of the 5th Endesa
Collective Bargaining Agreement, which led to the reversal
of the associated provision in the amount of €515 million;
> a decrease in costs in Latin America, mainly in Brazil, whe-
re efficiency gains reduced the average work force compa-
red with the same period of 2019.
These factors were only partly offset by an increase in costs
in Spain due mainly to an additional provision of €159 million
for the Plan de Salida fund as result of the elimination of the
extinguishment option of the individual agreement concer-
ning the suspension of employment relationships for certain
individual contracts as a result of the signing of the new col-
lective bargaining agreement cited earlier.
At June 30, 2020 Enel Group employees totaled 66,825
(68,253 at December 31, 2019). The decrease of 1,428 com-
pared with December 31, 2019 reflected the negative effect
of the balance between new hires and terminations in the
period (-447) and changes in the scope of consolidation (-981)
connected with the disposal of hydro plants in the United Sta-
tes and the disposal of the Reftinskaya plant in Russia.
“Depreciation, amortization and impairment losses” in the
1st Half of 2020 increased, mainly reflecting greater impair-
ment losses on property, plant and equipment and trade re-
ceivables, only partly offset by a decline in depreciation and
amortization due to the impairment losses recognized on co-
al-fired plants in 2019 in Italy, Spain, Chile and Russia.
Impairment losses for the 1st Half of 2020 (net of associated
reversals) increased by €550 million, as reported in the fol-
lowing table:
Millions of euro 1st Half
2020 2019 Change
Impairment losses:
- property, plant and equipment 759 367 392 -
- investment property - - - -
- intangible assets - 8 (8) -
- goodwill - - - -
- trade receivables 729 510 219 42.9%
- impairment of net contract assets 1 - 1 -
- other assets 9 127 (118) -92.9%
Total impairment losses 1,498 1,012 486 48.0%
Reversals:
- property, plant and equipment (7) (7) - -
- investment property - - - -
- intangible assets (2) - (2) -
- trade receivables (85) (165) 80 48.5%
- assets classified as held for sale (4) - (4) -
- other assets (15) (5) (10) -
Total reversals (113) (177) 64 36.2%
TOTAL IMPAIRMENT LOSSES AND REVERSALS 1,385 835 550 65.9%
Impairment losses on property, plant and equipment increa-
sed despite the recognition in the 1st Half of 2019 of impair-
ment losses relating to the Bocamina I and Tarapacá plants in
Chile (€364 million) and the Reftinskaya plant in Russia (€120
million), reflecting the writedown of the Bocamina II coal-fired
plant in Chile in the amount of €741 million. These actions are
part of the effort to accelerate the Group’s energy transition
towards decarbonization. Furthermore, during the 1st Half of
2020 estimates of the recoverability of trade receivables were
revised in reflection of the impact of the COVID-19 pandemic,
especially in Italy and Spain, where impairment losses increa-
sed by €136 million to take account of the deterioration in the
collection status of certain customer segments. Finally, the
same item includes the writedown by e-distribuzione of the
receivable in respect of a trader on the basis of an agreement
in bankruptcy proceedings, for which ARERA Resolutions
nos. 50/2018 and 568/2019 made it possible to recognize in-
come in the same amount, as discussed in note 6.
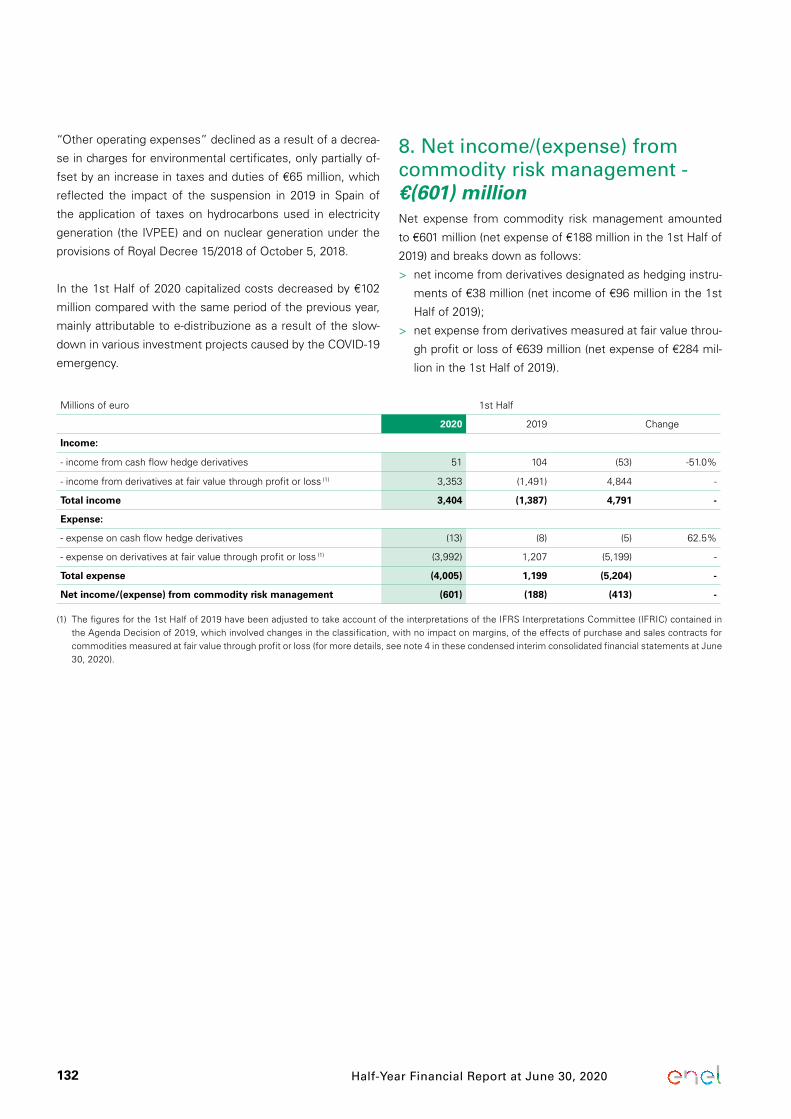
132 Half-Year Financial Report at June 30, 2020
“Other operating expenses” declined as a result of a decrea-
se in charges for environmental certificates, only partially of-
fset by an increase in taxes and duties of €65 million, which
reflected the impact of the suspension in 2019 in Spain of
the application of taxes on hydrocarbons used in electricity
generation (the IVPEE) and on nuclear generation under the
provisions of Royal Decree 15/2018 of October 5, 2018.
In the 1st Half of 2020 capitalized costs decreased by €102
million compared with the same period of the previous year,
mainly attributable to e-distribuzione as a result of the slow-
down in various investment projects caused by the COVID-19
emergency.
8. Net income/(expense) from commodity risk management - €(601) millionNet expense from commodity risk management amounted
to €601 million (net expense of €188 million in the 1st Half of
2019) and breaks down as follows:
> net income from derivatives designated as hedging instru-
ments of €38 million (net income of €96 million in the 1st
Half of 2019);
> net expense from derivatives measured at fair value throu-
gh profit or loss of €639 million (net expense of €284 mil-
lion in the 1st Half of 2019).
Millions of euro 1st Half
2020 2019 Change
Income:
- income from cash flow hedge derivatives 51 104 (53) -51.0%
- income from derivatives at fair value through profit or loss (1) 3,353 (1,491) 4,844 -
Total income 3,404 (1,387) 4,791 -
Expense:
- expense on cash flow hedge derivatives (13) (8) (5) 62.5%
- expense on derivatives at fair value through profit or loss (1) (3,992) 1,207 (5,199) -
Total expense (4,005) 1,199 (5,204) -
Net income/(expense) from commodity risk management (601) (188) (413) -
(1) The figures for the 1st Half of 2019 have been adjusted to take account of the interpretations of the IFRS Interpretations Committee (IFRIC) contained in the Agenda Decision of 2019, which involved changes in the classification, with no impact on margins, of the effects of purchase and sales contracts for commodities measured at fair value through profit or loss (for more details, see note 4 in these condensed interim consolidated financial statements at June 30, 2020).

Inte
rim
rep
ort
on o
per
atio
ns
Conden
sed inte
rim
conso
lidat
ed fi
nan
cial
sta
tem
ents
133Explanatory notes
9. Net financial income/(expense) from derivatives - €178 million
Millions of euro 1st Half
2020 2019 Change
Income:
- income from cash flow hedge derivatives 523 394 129 32.7%
- income from derivatives at fair value through profit or loss 367 198 169 85.4%
- income from fair value hedge derivatives 47 3 44 -
Total income 937 595 342 57.5%
Expense:
- expense on cash flow hedge derivatives (423) (371) (52) -14.0%
- expense on derivatives at fair value through profit or loss (318) (289) (29) -10.0%
- expense on fair value hedge derivatives (18) (5) (13) -
Total expense (759) (665) (94) -14.1%
NET FINANCIAL INCOME/(EXPENSE) FROM DERIVATIVES 178 (70) 248 -
Net income on financial derivatives amounted to €178 million
(net expense of €70 million in the 1st Half of 2019) and largely
regards the hedging strategy for exchange rate risk. It breaks
down as follows:
> net income on derivatives designated as hedging instru-
ments of €129 million (net income of €21 million in the 1st
Half of 2019);
> net income on derivatives at fair value through profit or
loss of €49 million (net expense of €91 million in the 1st
Half of 2019).
10. Other net financial income/(expense) - €(1,297) million
Millions of euro 1st Half
2020 2019 Change
Interest and other income from financial assets 110 162 (52) -32.1%
Exchange gains 691 488 203 41.6%
Income from equity investments 2 2 - -
Income from hyperinflation adjustments 219 356 (137) -38.5%
Other income 125 195 (70) -35.9%
Total other financial income 1,147 1,203 (56) -4.7%
Interest and other expense on financial debt (1,202) (1,293) 91 7.0%
Exchange losses (910) (432) (478) -
Accretion of post-employment and other employee benefits (59) (93) 34 36.6%
Accretion of other provisions (49) (103) 54 52.4%
Expense from hyperinflation adjustments (189) (271) 82 30.3%
Other expenses (35) (182) 147 80.8%
Total other financial expense (2,444) (2,374) (70) -2.9%
TOTAL OTHER NET FINANCIAL INCOME/(EXPENSE) (1,297) (1,171) (126) -10.8%
Other financial income amounted to €1,147 million, a decre-
ase of €56 million compared with the year-earlier period. The
decline mainly reflected:
> a decline in income from hyperinflation adjustments (€137
million) in relation to the application of IAS 29 at the Argen-
tine companies. For more information, see note 4 in these
condensed interim consolidated financial statements at
June 30, 2020;
> a decrease in other income (€70 million), mainly regarding
income on financial assets in respect of public concession
arrangements at the Brazilian companies and default inte-
rest;

134 Half-Year Financial Report at June 30, 2020
> a decline of €52 million in interest and other income from
financial assets, essentially connected with a fall in inte-
rest on financial investments and short-term securities
(€56 million), mainly at Enel Américas (€51 million). This
essentially reflected a decline in the rate of return and the
amount of short-term investments.
These factors were partly offset by an increase of €203 mil-
lion in exchange gains, mainly reflecting developments in the
exchange rates against the euro of the currencies in which
net debt is denominated. The increase mainly involved Enel
SpA (€116 million), Enel Finance International (€113 million)
and Enel Chile (€50 million), partly offset by a decrease in
such gains at Enel Green Power Brasil (€52 million) and Enel
Américas (€33 million).
Other financial expense amounted to €2,444 million, an incre-
ase of €70 million compared with the 1st Half of 2019, due
essentially to an increase of €478 million in exchange losses,
primarily involving Enel Américas (€235 million), Enel Green
Power Brasil (€117 million), Enel Chile (€40 million), Enel Fi-
nance International (€21 million), Enel Green Power México
(€13 million) and Enel SpA (€10 million).
This effect was partly offset by:
> a reduction of €147 million in other expense, mainly
reflecting:
- a decrease in other financial expense at Enel Américas
(€56 million), primarily due to the effect of the settle-
ment agreement with Cammesa, which reduced finan-
cial expense at the Argentine companies;
- an increase in capitalized financial expense (€24 mil-
lion);
- a reduction in financial expense connected with the as-
signment of receivables (€18 million) and the issue of
guarantees (€14 million);
> a contraction of €91 million in interest on financial debt,
mainly regarding medium/long-term bank borrowings (€59
million) and bonds (€39 million), essentially reflecting the
combined effect of exchange rate developments in South
America, especially in Brazil, and financial optimization
strategies involving the negotiation of lower interest rates;
> a decline in charges for hyperinflation adjustments (€82
million) connected with the application of IAS 29 to the
Argentine companies;
> a decrease in financial expense from the discounting of lia-
bilities for employee benefits (€34 million), mainly in Spain,
and of the provision for risks and charges (€54 million), lar-
gely accounted for by Enel Américas, where Edesur redu-
ced the discounting of provisions following the settlement
agreement with the Argentine government resolving reci-
procal claims originating between 2006 and 2016.
11. Share of income/(losses) of equity investments accounted for using the equity method - €13 millionThe share of income and losses of equity investments ac-
counted for using the equity method in the 1st Half of 2020
showed net income of €13 million. The improvement of €98
million mainly reflected the effect of the recognition in the 1st
Quarter of 2019 of a capital loss on Enel Green Power North
America Renewable Energy Partners (EGPNA REP) as a result
of the repurchase by Enel North America (formerly Enel Green
Power North America – EGPNA) of control over 13 companies
previously owned by it.
Other changes reflect the Group’s pro-rated share of the re-
sults of companies accounted for using the equity method.

Inte
rim
rep
ort
on o
per
atio
ns
Conden
sed inte
rim
conso
lidat
ed fi
nan
cial
sta
tem
ents
135Explanatory notes
12. Income taxes - €1,034 million
Millions of euro 1st Half
2020 2019 Change
Current taxes 1,154 1,174 (20) -1.7%
Adjustments for income tax relating to prior years (43) (99) 56 56.6%
Total current taxes 1,111 1,075 36 3.3%
Deferred tax liabilities 265 (174) 439 -
Deferred tax assets (342) 93 (435) -
TOTAL 1,034 994 40 4.0%
Income taxes for the 1st Half of 2020 amounted to €1,034
million, an increase of €40 million despite the decrease in in-
come before tax.
The effective income tax rate for the 1st Half of 2020 was
30.1%, compared with 25.6% in the 1st Half of 2019. The
increase in the effective rate in the 1st Half of 2020 on the
same period of 2019 essentially reflects the effect of the fol-
lowing items recognized in 2019:
> a reduction in taxes in Italy following an agreement with
the tax authorities concerning the optional “patent box”
mechanism, which allows the application of a preferential
tax regime for income from the use of intellectual property
(+€53 million);
> a decrease in taxes (€40 million) recognized in Argentina in
the 1st Quarter of 2019 by the generation companies Enel
Generación Costanera and Central Dock Sud following
their election to participate in the preferential “revalúo im-
positivo” mechanism. Subject to payment of a tax in lieu,
this mechanism permits the monetary revaluation for tax
purposes of certain tangible assets, with the consequent
recognition of deferred tax assets and an increase in the
deductibility of depreciation in the future;
> the reversal of deferred tax liabilities at EGPNA, the an-
cillary effect of the acquisition of a number of companies
from EGPNA REP.
It should also be noted that, as at June 30, 2020, the Group
had not recognized any significant impact from the fiscal me-
asures taken by the governments of the various countries in
which it operates to mitigate the effects of the COVID-19 he-
alth emergency and boost the economic recovery.
13. Basic and diluted earnings per shareBoth values are calculated on the basis of the average num-
ber of ordinary shares in the period, equal in the 1st Half of
2020 to 10,165,130,794 shares.
Millions of euro 1st Half
2020 2019 Change
Net income from continuing operations attributable to shareholders of the Parent Company (millions of euro) 1,947 2,215 (268) -12.1%Net income from discontinued operations attributable to shareholders of the Parent Company (millions of euro) - - - -Net income for the period attributable to shareholders of the Parent Company (millions of euro) 1,947 2,215 (268) -12.1%
Average number of ordinary shares 10,165,130,794 10,166,679,946 (1,549,152) -
Dilutive effect of stock options - - - -
Basic and diluted earnings per share (euro) 0.19 0.22 (0.03) -13.6%
Basic and diluted earnings from continuing operations per share (euro) 0.19 0.22 (0.03) -13.6%
Basic and diluted earnings from discontinued operations per share (euro) - - - -
No events have occurred from the end of the period to the
issuance of these condensed interim consolidated financial
statements that would have changed the actual or potential
number of ordinary shares outstanding at period-end.

136 Half-Year Financial Report at June 30, 2020
14. Property, plant and equipment - €78,418 millionChanges in property, plant and equipment during the 1st Half of 2020 were as follows:
Millions of euro
Total at December 31, 2019 79,809
Capital expenditure 3,466
Exchange rate differences (2,253)
Changes in the scope of consolidation (11)
Depreciation (2,120)
Impairment losses and reversals (752)
Reclassification from/to “Assets held for sale” -
Disposals and other changes 279
Total at June 30, 2020 78,418
Capital expenditure for the 1st Half of 2020 totaled €3,466
million, down €33 million from the 1st Half of 2019. The table
below summarizes investments made during the 1st Half of
2020 by type of plant.
Millions of euro 1st Half
2020 2019
Power plants:
- thermal 151 205
- hydroelectric 113 143
- geothermal 59 59
- nuclear 57 46
- alternative energy resources 1,693 1,577
Total power plants 2,073 2,030
Electricity distribution networks 1,359 1,402
Land, buildings, and other goods and equipment 34 67
TOTAL 3,466 3,499
Capital expenditure on power plants amounted to €2,073 mil-
lion, an increase of €43 million on the same period of 2019,
largely reflecting an increase in investment in wind and solar
plants in North America, Brazil and Chile.
Capital expenditure on the distribution grid amounted to
€1,359 million, a decrease of €43 million on the 1st Half of
2019. The decline was due to a reduction in investment on
distribution grids in South America and Italy as a result of the
slowdown in the mass replacement of meters caused by the
COVID-19 emergency.
The adverse impact of exchange rate developments (€2,253
million) was connected with the general depreciation of the
South America currencies against the euro.
“Changes in the scope of consolidation” essentially concern
the sale of an interest held in the Spanish company Endesa
Soluciones SLU, in which the residual holding is now 14%, as
well as the acquisition of control of a number of renewables
companies by Enel Green Power Italia.
“Impairment losses and reversals” on property, plant and
equipment amounted to €752 million and mainly reflected
the decarbonization process begun by the Group, which will
be completed in 2025 at the latest and which in the 1st Half of
2020 involved the writedown of the Bocamina II plant.
“Disposals and other changes” showed a positive balance
of €279 million, most of which (€238 million) regarding new
leases.

Inte
rim
rep
ort
on o
per
atio
ns
Conden
sed inte
rim
conso
lidat
ed fi
nan
cial
sta
tem
ents
137Explanatory notes
15. Intangible assets - €17,265 millionChanges in intangible assets during the 1st Half of 2020 were as follows:
Millions of euro
Total at December 31, 2019 19,089
Capital expenditure 361
Exchange rate differences (1,844)
Change in the scope of consolidation 8
Amortization (601)
Impairment losses and reversals 2
Other changes 250
Total at June 30, 2020 17,265
The change for the period in intangible assets showed an overall decrease of €1,824 million, essentially reflecting exchange rate
losses in the Latin American countries, especially Brazil.
16. Goodwill - €14,115 millionChanges in goodwill during the 1st Half of 2020 were as follows:
Millions of euro
Total at December 31, 2019 14,241
Exchange rate differences (126)
Total at June 30, 2020 14,115
The change in goodwill, as already indicated in the previous note, mainly reflects exchange rate losses at the Brazilian companies.

138 Half-Year Financial Report at June 30, 2020
Goodwill breaks down as follows:
Millions of euro
Thermal Generation and Trading
Enel Green Power
Infrastructure and
NetworksEnd-user Markets Enel X Services Total
Italy - 20 - 579 19 - 618
Enel Green Power Italia - 20 - - - - 20
Enel Energia - - - 579 - - 579
Other - - - - 19 - 19
Iberia - 1,190 5,788 1,807 - - 8,785
Latin America 43 1,961 1,884 - - - 3,888
Argentina - 40 236 - - - 276
Brazil - 397 892 - - - 1,289
Chile - 996 213 - - - 1,209
Colombia - 307 223 - - - 530
Peru 43 198 320 - - - 561
Panama - 23 - - - - 23
Europe 3 - 338 58 - - 399
Romania - - 338 58 - - 396
Other countries 3 - - - - - 3
North America - 89 - - 336 - 425
United States and Canada - 70 - - 336 - 406
Mexico - 19 - - - - 19
Total 46 3,260 8,010 2,444 355 - 14,115
The assessment of the recoverability of the assets, in accor-
dance with the provisions of IAS 36, was conducted as at
June 30, 2020 in the presence of evidence of impairment
(so-called internal and external indicators). In the current en-
vironment, the analysis of trigger events has become even
more important as it also sought to determine whether the
impact of the COVID-19 emergency could have reduced the
carrying amount of certain assets as at June 30, 2020.
Taking account of the macroeconomic scenario and the eco-
nomic-financial impacts on the Group described in previous
sections, certain considerations drawn from the assessment
of the recoverability of the assets within the Enel Group are
detailed below.
From our analysis, we can briefly state that the impact of the
COVID-19 pandemic on the Group’s performance and financial
position are so far relatively insignificant, underscoring the li-
mited exposure of the Group to the crisis (especially when
compared with companies operating in other industries).
The impacts estimated to date essentially regard short-
term effects deemed to be transitory and non-permanent,
reflecting Enel’s low vulnerability to the effects of the crisis in
the medium term and the resilience of our ability to generate
income in the long term. This aspect further underscores the
weight of terminal value in estimating value in use.
In fact, the estimate of the terminal value has a significant
importance in the determination of enterprise value (EV) with
respect to the value deriving from the cash flows of the bu-
siness plan. Based on the different terminal value calculation
methods, for each business the following impacts are obser-
ved with respect to the EVs at December 31, 2019.
Generation(Traditional)
Generation(Renewables) Distribution Retail Enel X
Annuity + Salvation Value• LH: Perpetuity
• EGP: Annuity + Salvation Value
Perpetuity Annuity Perpetuity
~50% ~85% ~90% ~80% ~100%

Inte
rim
rep
ort
on o
per
atio
ns
Conden
sed inte
rim
conso
lidat
ed fi
nan
cial
sta
tem
ents
139Explanatory notes
It follows that even considering the adverse impact on short-
term cash flows, the long-term cash flows considered for ter-
minal value purposes remain unchanged, lending robustness
to the results deriving from the assessments performed for
the Consolidated Annual Report at December 31, 2019.
The Group calculates EV as the present value of the cash
flows and is therefore influenced by the discount rate used.
The discount rates used for the impairment test are based
on the WACC formula as applied in the Capital Asset Pricing
Model (CAPM).
Accordingly, analyzing the divergence of the main parameters
considered in the calculation of the WACC (risk free, coun-
try risk premium, market risk premium and beta) it is evident
that, despite the COVID-19 crisis, the rates have not undergo-
ne significant increases, with the exception of limited cases
mainly relating to the Latin American countries (which have
been most affected by the pandemic in recent months) and
the retail businesses. In this regard, it should be noted that
sensitivity analyses had already been performed at the annual
closing (2019), simulating a 5% change in the WACC, whi-
ch had demonstrated the full recoverability of the carrying
amounts.
In light of the above considerations, there are no potential
critical issues regarding the recoverability of the carrying
amounts of the Group’s cash generating units (CGUs) with
the exception of the traditional generation businesses in
Argentina and Brazil, reflecting the negative impact of CO-
VID-19. At the same time there is a small difference between
value in use and net invested capital at December 31, 2019,
as well as an increase in the WACC for Argentina.
With regard to the traditional generation businesses in Argen-
tina and Brazil, a sensitivity analysis was performed to verify
the related carrying amounts, taking account of the effects
of the current environment. In this regard, the value in use at
June 30, 2020 was determined based on:
> short-term economic and financial projections consistent
with the half-year flow of the 2020 forecast, which take
account of COVID-19 impacts estimated to date and de-
scribed previously;
> medium/long-term economic and financial projections
(2021-2024) consistent with the 2020-2024 Business Plan
(the most recent);
> discount rates updated to June 30, 2020 using the same
methodology adopted at the closure at December 31,
2019;
> long-term growth rates, which were not changed from tho-
se adopted in the impairment tests carried out at Decem-
ber 31, 2019, consistent with the long-term plan assump-
tions, which have so far been confirmed, in light of the fact
that the effects from COVID-19 are considered transitory
and not permanent.
Based on the results of the sensitivity analyses carried out for
the traditional generation businesses in Argentina and Brazil,
no events were found that prompted the performance of im-
pairment testing at June 30, 2020.
17. Deferred tax assets and liabilities - €8,789 million and €8,160 million
Millions of euro
at June 30, 2020 at Dec. 31, 2019 Change
Deferred tax assets 8,789 9,112 (323) -3.5%
Deferred tax liabilities 8,160 8,314 (154) -1.9%
of which:
- non-offsettable deferred tax assets 6,090 4,743 1,347 28.4%
- non-offsettable deferred tax liabilities 4,029 3,054 975 31.9%
- excess net deferred tax liabilities after any offsetting 1,432 891 541 60.7%
The change in deferred tax assets and liabilities essentially
reflects exchange rate losses, mainly recognized in Brazil, an
increase in derivative assets held by Enel Finance Interna-
tional and the release of the electricity discount provision in
Spain. These adverse factors were partly offset by an increase
in deferred tax assets in respect of the impairment losses
recognized on the coal-fired Bocamina II plant in Chile.
Deferred tax assets mainly originate from provisions for risks
and from differences in the tax and accounting values of as-
sets and derivatives. In addition, only deferred tax assets that
are reasonably certain to be recovered on the basis of cohe-
rent forecasting plans and current estimates of future taxable
income have been recognized.

140 Half-Year Financial Report at June 30, 2020
Deferred taxes are also mainly generated by adjustments to
the fair value, for accounting purposes only, of certain assets
following extraordinary transactions, derivatives and accelera-
ted depreciation.
18. Equity investments accounted for using the equity method - €1,732 millionThe table below shows the changes in the main investments in associated companies accounted for using the equity method.
Millions of euro % holding Income effect
Change in the scope of consolidation Dividends Other changes % holding
at Dec. 31, 2019
at June 30, 2020
Joint ventures
Slovak Power Holding 504 50.0% 11 - - (1) 514 50.0%
EGPNA Renewable Energy Partners 137 20.0% 4 (16) - (6) 119 50.0%
OpEn Fiber 384 50.0% (34) - - 82 432 50.0%
Zacapa Topco Sàrl 133 20.6% (2) - - (9) 122 20.6%
Kino project companies 60 20.0% (9) - - (8) 43 20.0%
Tejo Energia Produção e Distribução de Energia Elétrica 58 43.8% 4 - - (1) 61 43.8%
Rocky Caney Holding 46 20.0% 3 - - - 49 20.0%
Drift Sand Wind Project 36 50.0% 2 - - - 38 50.0%
Front Marítim del Besòs 37 61.4% - - - - 37 61.4%
Enel Green Power Bungala - 51.0% (1) - - 21 20 51.0%
Rusenergosbyt 40 49.5% 24 - (19) 1 46 49.5%
Energie Electrique de Tahaddart 26 32.0% - - (2) 1 25 32.0%
Transmisora Eléctrica de Quillota 7 50.0% - - - 1 8 50.0%
Associates
CESI 61 42.7% (2) - - - 59 42.7%
Tecnatom 30 45.0% 1 - - - 31 45.0%
Suministradora Eléctrica de Cádiz 11 33.5% 1 - - - 12 33.5%
Compañía Eólica Tierras Altas 9 37.5% - - - - 9 37.5%
New Cogenerazione.Si 11 20.0% 1 - - - 12 20.0%
Other 92 10 6 (8) (5) 95
Total 1,682 13 (10) (29) 76 1,732
Changes in the period mainly reflect:
> an increase in OpEn Fiber due to a shareholder capital in-
crease (€85 million) and OCI reserves for cash flow hedge
derivatives (-€3 million);
> the positive impact of €21 million posted by the Enel Gre-
en Power Bungala companies in Australia from the fair
value measurement of PAAs with customers following a
downward adjustment of prices on the Australian forward
market.
These effects were only minimally offset by dividends and
changes in the scope of consolidation involving North Ameri-
ca, owing to the sale of a number of companies, and Spain,
thanks to the reduction in the interest held by Endesa Ener-
gía SA in Endesa Soluciones SLU, which had previously been
consolidated on a line-by-line basis.
The “income effect” reports the profits and losses recogni-
zed by the companies, in proportion to the Enel Group’s stake
in them.

Inte
rim
rep
ort
on o
per
atio
ns
Conden
sed inte
rim
conso
lidat
ed fi
nan
cial
sta
tem
ents
141Explanatory notes
19. Derivatives
Millions of euro Non-current Current
at June 30, 2020 at Dec. 31, 2019 at June 30, 2020 at Dec. 31, 2019
Derivative financial assets 2,877 1,383 6,059 4,065
Derivative financial liabilities 2,958 2,407 5,381 3,554
For more information on these derivatives, please see notes
30.1 et seq.
20. Non-current/current contract assets and liabilitiesNon-current assets deriving from contracts with customers
(€401 million) refer mainly to assets under development resul-
ting from public-to-private service concession arrangements
recognized in accordance with IFRIC 12 and which have an
expiration of beyond 12 months (€394 million). It should also
be noted that the figure at June 30, 2020 includes investmen-
ts for the period in the amount of €310 million.
Current assets deriving from contracts with customers (€173
million) mainly concern assets in respect of construction con-
tracts (€141 million) relating to contracts that are still open,
payment of which is subject to satisfaction of a performance
obligation.
Non-current liabilities deriving from contracts with customers
concern contract liabilities in respect of revenue from electri-
city grid connections, which had previously been recogni-
zed in profit or loss at the moment of the connection. They
amounted to €6,257 million at June 30, 2020. That figure is
mainly attributable to Italy (€3,447 million), Spain (€2,395 mil-
lion) and Romania (€415 million).
Current liabilities deriving from contracts with customers
(€1,249 million) include the contract liabilities related to re-
venue from electricity grid connections expiring within 12
months in the amount of €886 million recognized in Italy and
Spain, as well as liabilities for construction work in progress
(€363 million).
21. Other non-current financial assets - €5,376 million
Millions of euro
at June 30, 2020 at Dec. 31, 2019 Change
Equity investments in other companies measured at fair value 73 72 1 1.4%
Receivables and securities included in net financial debt (see note 25.3) 3,166 3,185 (19) -0.6%
Service concession arrangements 2,094 2,702 (608) -22.5%
Non-current prepaid financial expense 43 47 (4) -8.5%
Total 5,376 6,006 (630) -10.5%
“Other non-current financial assets” decreased by €630 mil-
lion in the 1st Half of 2020, mainly due to the decline in the
value of financial assets in respect of service concession ar-
rangements in Brazil (-€608 million). Also contracting were re-
ceivables and securities included in net financial debt, which
are discussed in note 25.3.

142 Half-Year Financial Report at June 30, 2020
22. Other non-current/current assets and liabilities“Other non-current/current assets” and “other non-current/
current liabilities” mainly reflect the outcome of the PIS/CO-
FINS dispute in Brazil. Following notification of the rulings, at
the close of the 1st Half of 2020, tax receivables of €2,131
million and a regulatory liability of €1,612 million were reco-
gnized in Brazil.
“Other non-current liabilities” include the amount of €113 mil-
lion connected with the closure of the dispute between Enel
Distribuição São Paulo and Eletrobras.
“Other current assets” increased mainly due to an increase
in prepayments of fees for the diversion of water for industrial
use and of insurance premiums, as well as other prepaymen-
ts for cloud services and other IT services.
The decrease in “other current liabilities” is mainly attribu-
table to a decrease in liabilities in respect of employees, a re-
duction in deferrals of unearned premiums and a contraction
in other liabilities, essentially attributable to the recognition of
the liability associated with the acquisition through interme-
diaries (share swap transactions) of additional equity in Enel
Américas and Enel Chile.
23. Trade receivables - €11,308 millionTrade receivables are recognized net of allowances for
doubtful accounts, which totaled €3,145 million at the end
of the period, compared with an opening balance of €2,980
million. The table below reports changes in these allowances.
Millions of euro
Total at December 31, 2019 2,980
Accruals 729
Reversals (85)
Uses (321)
Other changes (158)
Total at June 30, 2020 3,145
Specifically, the reduction of €1,775 million in trade recei-
vables in the period was mainly recognized in Italy and is
attributable to a decline in volumes invoiced, due both to a
reduction in mandatory distribution and metering rates set
for 2020 (ARERA Resolution no. 570/19) and a reduction in
consumption, especially among large customers, as a direct
consequence of the lockdown. During the 1st Half of 2020,
estimates of the recoverability of receivables were revised
following the COVID-19 pandemic, especially in Italy and
Spain, where provisions increased by €136 million to take ac-
count of the deterioration in the collection status of certain
customer segments.
Other changes in the provision for doubtful accounts mainly
reflected adverse exchange rate developments, primarily in
Latin America.
24. Other current financial assets - €4,328 million
Millions of euro
at June 30, 2020 at Dec. 31, 2019 Change
Current financial assets included in debt 4,167 4,158 9 0.2%
Other 161 147 14 9.5%
Total 4,328 4,305 23 0.5%

Inte
rim
rep
ort
on o
per
atio
ns
Conden
sed inte
rim
conso
lidat
ed fi
nan
cial
sta
tem
ents
143Explanatory notes
25. Net financial position and long-term financial receivables and securities - €50,411 millionThe following table reconciles the “Net financial position and
long-term financial receivables and securities” with the items
reported in the consolidated balance sheet.
Millions of euro
Notes at June 30, 2020 at Dec. 31, 2019 Change
Long-term borrowings 25.1 53,623 54,174 (551) -1.0%
Short-term borrowings 25.2 7,196 3,917 3,279 83.7%
Other current financial debt (1) 27 47 (20) -42.6%
Current portion of long-term borrowings 25.1 2,738 3,409 (671) -19.7%
Non-current financial assets included in debt 25.3 (3,166) (3,185) 19 0.6%
Current financial assets included in debt 25.4 (4,167) (4,158) (9) -0.2%
Cash and cash equivalents (5,840) (9,029) 3,189 35.3%
Total 50,411 45,175 5,236 11.6%
(1) Includes current financial payables included in Other current financial liabilities.
Pursuant to the CONSOB instructions of July 28, 2006, the
following table reports the net financial position at June 30,
2020, and December 31, 2019, reconciled with net financial
debt as prepared in accordance with the procedures of the
Enel Group.
Millions of euro
at June 30, 2020 at Dec. 31, 2019 Change
Cash and cash equivalents on hand 36 87 (51) -58.6%
Bank and post office deposits 5,612 7,910 (2,298) -29.1%
Other investments of liquidity 192 1,032 (840) -81.4%
Securities 83 51 32 62.7%
Liquidity 5,923 9,080 (3,157) -34.8%
Short-term financial receivables 2,612 2,522 90 3.6%
Current portion of long-term financial receivables 1,472 1,585 (113) -7.1%
Current financial receivables 4,084 4,107 (23) -0.6%
Bank debt (1,214) (579) (635) -
Commercial paper (4,495) (2,284) (2,211) -96.8%
Current portion of long-term bank borrowings (1,458) (1,121) (337) -30.1%
Bonds issued (current portion) (932) (1,906) 974 51.1%
Other borrowings (current portion) (348) (382) 34 8.9%
Other short-term financial payables (1) (1,514) (1,101) (413) -37.5%
Total current financial debt (9,961) (7,373) (2,588) -35.1%
Net current financial position 46 5,814 (5,768) -
Debt to banks and financing entities (8,830) (8,407) (423) -5.0%
Bonds (42,299) (43,294) 995 2.3%
Other borrowings (2,494) (2,473) (21) -0.8%
Non-current financial position (53,623) (54,174) 551 1.0%
NET FINANCIAL POSITION as per CONSOB instructions (53,577) (48,360) (5,217) -10.8%
Long-term financial receivables and securities 3,166 3,185 (19) -0.6%
NET FINANCIAL DEBT (50,411) (45,175) (5,236) -11.6%
(1) Includes current financial payables included in Other current financial liabilities.

144 Half-Year Financial Report at June 30, 2020
25.1 Long-term borrowings (including the portion falling due within 12 months) - €56,361 millionThe item reports long-term debt in respect of bonds, bank
borrowings and other borrowings in euro and other curren-
cies, including the portion falling due within 12 months.
Millions of euro at June 30, 2020 at Dec. 31, 2019 Change
TotalOf which
current portion
Of which portion falling
due in more than 12 months
Bonds 43,231 932 42,299 45,200 (1,969)
Bank borrowings 10,288 1,458 8,830 9,528 760
Leases 1,991 236 1,755 1,964 27
Other borrowings 851 112 739 891 (40)
Total 56,361 2,738 53,623 57,583 (1,222)
The following table reports a breakdown of bonds outstanding at June 30, 2020.
Millions of euroCarrying amount Fair value
Current portion
Portion falling due in more
than 12 months
Carrying amount Fair value
Maturing at June 30, 2020 at Dec. 31, 2019
Bonds:
- listed, fixed rate 2020-2097 25,200 29,390 702 24,498 26,593 31,073
- listed, floating rate 2020-2031 2,871 2,964 152 2,719 3,488 3,655
- unlisted, fixed rate 2022-2047 14,414 16,583 - 14,414 14,359 15,794
- unlisted, floating rate 2020-2032 746 847 78 668 760 753
Total bonds 43,231 49,784 932 42,299 45,200 51,275
Maturity analysis
The table below summarizes the maturity profile of the Group’s long-term debt.
Millions of euro Maturing in
Current portion 2nd Half 2021 2022 2023 2024 Beyond
Bonds 932 1,404 4,631 5,815 6,687 23,762
Borrowings: 1,806 832 1,541 1,028 929 6,994
- of which leases 236 116 185 145 120 1,189
Total 2,738 2,236 6,172 6,843 7,616 30,756

Inte
rim
rep
ort
on o
per
atio
ns
Conden
sed inte
rim
conso
lidat
ed fi
nan
cial
sta
tem
ents
145Explanatory notes
Long-term financial debt by currency and interest rateThe table below reports long-term financial debt (including
portion falling due within 12 months) by currency and interest
rate.
Millions of euroCarrying amount
Nominal value
Carrying amount
Current average
interest rate
Current effective
interest rate
at June 30, 2020 at Dec. 31, 2019 at June 30, 2020
Euro 26,524 27,114 27,272 2.3% 2.8%
US dollar 20,764 20,909 20,103 4.2% 4.3%
Pound sterling 4,066 4,100 4,354 6.1% 6.2%
Colombian peso 1,192 1,192 1,381 7.2% 7.2%
Brazilian real 1,789 1,817 2,412 5.1% 5.1%
Swiss franc 333 333 419 1.8% 1.8%
Chilean peso/UF 362 369 414 5.0% 5.1%
Peruvian sol 437 437 426 6.0% 6.0%
Russian ruble 278 280 225 8.5% 8.5%
Other currencies 616 623 577
Total non-euro currencies 29,837 30,060 30,311
TOTAL 56,361 57,174 57,583
Change in the nominal value of long-term debt
Millions of euro RepaymentsNew
borrowingOther
changes
Exchange rate
differences
at Dec. 31, 2019 at June 30, 2020
Bonds 46,045 (1,184) 5 - (862) 44,004
Borrowings: 12,418 (757) 1,879 (48) (322) 13,170
- of which leases 1,964 (109) 201 - (65) 1,991
Total 58,463 (1,941) 1,884 (48) (1,184) 57,174
Compared with December 31, 2019, the nominal value of
long-term debt decreased by €1,289 million, due mainly to
exchange rate gains amounting to €1,184 million and repay-
ments of €1,941 million, partly offset by new borrowing of
€1,884 million.
The main repayments made in the 1st Half of 2020 concer-
ned:
> bonds in the amount of €1,184 million, including:
- €410 million in respect of a fixed-rate hybrid bond is-
sued by Enel SpA, which matured in January 2020;
- €100 million in respect of a fixed-rate bond issued by
Enel Finance International, which matured in January
2020;
- €482 million in respect of a fixed-rate bond issued by Enel
Finance International, which matured in March 2020;
- the equivalent of €93 million in respect of a fixed-rate
bond in Swiss francs issued by Enel Finance Internatio-
nal, which matured in June 2020;
- the equivalent of €86 million in respect of a bond is-
sued by the South American companies;
> loans in the amount of €757 million, including:
- €150 million in respect of a floating-rate loan of Enel
SpA;
- the equivalent of €105 million in respect of South Ame-
rican countries;
- €71 million in respect of the repayment of credit lines
by Endesa;
- the equivalent of €201 million in respect of loans to
various Group companies tied to the achievement of
sustainability goals.
In the 1st Half of 2020 new borrowing by the Group mainly
regarded bank loans, including:

146 Half-Year Financial Report at June 30, 2020
> €250 million in respect of a floating-rate loan tied to the
achievement of sustainability goals granted to e-distribu-
zione by the European Investment Bank;
> the equivalent of €375 million in respect of a floating-rate
loan tied to the achievement of sustainability goals granted
to Enel Finance America;
> €300 million in respect of a floating-rate loan tied to the
achievement of sustainability goals granted to Endesa;
> the equivalent of €134 million in respect of floating-rate lo-
ans tied to the achievement of sustainability goals granted
to a number of Mexican companies;
> the equivalent of €219 million in respect of bank loans to
South American companies;
> the equivalent of €131 million in respect of a floating-rate
loan granted to Enel Green Power RSA.
The Group’s main long-term financial liabilities are governed
by covenants containing undertakings by the borrowers (Enel,
Enel Finance International, Endesa and the other Group com-
panies) and in some cases Enel as guarantor that are com-
monly adopted in international business practice. For a more
detailed description, please see the 2019 consolidated finan-
cial statements.
25.2 Short-term borrowings - €7,196 millionAt June 30, 2020, short-term borrowings totaled €7,196 mil-
lion, an increase of €3,279 million with respect to December
31, 2019, as detailed below.
Millions of euro
at June 30, 2020 at Dec. 31, 2019 Change
Short-term bank borrowings 1,214 579 635
Commercial paper 4,495 2,284 2,211
Cash collateral and other liabilities in respect of derivatives 1,418 750 668
Other short-term borrowings (1) 69 304 (235)
Short-term borrowings 7,196 3,917 3,279
(1) Does not include current financial payables included in Other current financial liabilities.
Commercial paper amounting to €4,495 million includes
€2,321 million in issues made under the €6,000 million
program by Enel Finance International (guaranteed by Enel
SpA), the equivalent of €686 million in issues made under
the $3,000 million program by Enel Finance America, €1,346
million in issues made by Endesa SA under a program totaling
€4,000 million and the equivalent of €142 million in issues
made by the South American companies.
In the 1st Half of 2020, Enel Finance International and Endesa
structured commercial paper programs linked to sustainabili-
ty objectives and at June 30, 2020 the total volume of com-
mercial paper issued under these new programs amounted
to €3,527 million.

Inte
rim
rep
ort
on o
per
atio
ns
Conden
sed inte
rim
conso
lidat
ed fi
nan
cial
sta
tem
ents
147Explanatory notes
25.3 Non-current financial assets included in debt - €3,166 million
Millions of euro
at June 30, 2020 at Dec. 31, 2019 Change
Securities measured at FVOCI 413 416 (3) -0.7%
Other financial receivables 2,753 2,769 (16) -0.6%
Total 3,166 3,185 (19) -0.6%
25.4 Current financial assets included in debt - €4,167 million
Millions of euro
at June 30, 2020 at Dec. 31, 2019 Change
Current portion of long-term financial receivables 1,472 1,585 (113) -7.1%
Securities measured at FVOCI 84 61 23 37.7%
Financial receivables and cash collateral 2,326 2,153 173 8.0%
Other 285 359 (74) -20.6%
Total 4,167 4,158 9 0.2%
The “current portion of long-term financial receivables” is es-
sentially accounted for by the short-term component of the
financial receivable in respect of the deficit of the Spanish
electrical system in the amount of €895 million (€950 million
at December 31, 2019).
26. Assets and liabilities held for sale - €3 millionThe following table reports the composition of the two items at June 30, 2020, and December 31, 2019.
Millions of euro Assets held for sale Liabilities held for saleat June 30,
2020at Dec. 31,
2019Change
at June 30, 2020
at Dec. 31, 2019
Change
Enel Américas - 10 (10) - 3 (3)
Enel North America 1 87 (86) 2 - 2
Other 4 4 - - - -
Total 5 101 (96) 2 3 (1)
The balance at June 30, 2020 mainly includes plant held for
sale making up the Enel Produzione business unit formed of
the Ettore Majorana site at Termini Imerese in the amount of
€4 million.
The change for the period essentially regards the disposal of a
number of hydro companies held by Enel North America, whi-
ch had previously been classified as available for sale, which
produced a capital gain of about €4 million, and the Rionegro
plant in Colombia, which was classified in that item and sold
in the 2nd Quarter of 2020.

148 Half-Year Financial Report at June 30, 2020
27. Shareholders’ equity - €43,368 million
27.1 Equity attributable to the shareholders of the Parent Company - €29,180 million
Share capital - €10,167 millionAs at June 30, 2020, the fully subscribed and paid-up share
capital of Enel SpA totaled €10,166,679,946, represented by
the same number of ordinary shares with a par value of €1.00
each.
The share capital is unchanged compared with the amount
reported at December 31, 2019.
At June 30, 2020, based on the shareholders register and the
notices submitted to CONSOB and received by the Company
pursuant to Article 120 of Legislative Decree 58 of February
24, 1998, as well as other available information, the only sha-
reholders with interests of greater than 3% in the Company’s
share capital were the Ministry for the Economy and Finance
(with a 23.585% stake) and Capital Research and Manage-
ment Company (with a 5.029% stake held for asset manage-
ment purposes).
On May 14, 2020, the Enel SpA Shareholders’ Meeting appro-
ved the distribution of a total dividend of €0.328 per share and
authorized the distribution of €0.168 per share as the balance
of the dividend, taking account of the interim dividend of 0.16
per share already paid in January 2020 and excluding the tre-
asury shares held at the record date of July 21, 2020. The ba-
lance of the dividend will be paid, gross of any withholdings,
as from July 22, 2020.
Treasury share reserve - €(1) millionAt June 30, treasury shares were represented by 1,549,152
ordinary shares of Enel SpA with a par value of €1 each, which
were acquired through an authorized intermediary in the total
amount of €10 million.
Other reserves - €250 million
Share premium reserve - €7,487 million
Pursuant to Article 2431 of the Italian Civil Code, the share
premium reserve contains, in the case of the issue of shares
at a price above par, the difference between the issue price
of the shares and their par value, including those resulting
from conversion from bonds. The reserve, which is a capital
reserve, may not be distributed until the legal reserve has
reached the threshold established under Article 2430 of the
Italian Civil Code.
Legal reserve - €2,034 million
The legal reserve is formed as allocation of part of the net
income that, pursuant to Article 2430 of the Italian Civil Code,
cannot be distributed as dividends.
Other reserves - €2,264 million
These include €2,215 million related to the remaining portion
of the value adjustments carried out when Enel was transfor-
med from a public entity to a joint-stock company.
Pursuant to Article 47 of the Uniform Income Tax Code, this
amount does not constitute taxable income when distributed.
Reserve from translation of financial statements in
currencies other than euro - €(6,179) million
The negative change in the period, equal to €2,377 million,
was mainly due to the appreciation of the functional currency
against the other currencies used by the subsidiaries and the
change in the scope of consolidation involving the acquisition
of 5.03% of Enel Américas and 2.89% of Enel Chile.
Reserve from measurement of cash flow hedge financial
instruments - €(769) million
This includes the net charges recognized in equity from the
measurement of hedging derivatives.
Reserve from measurement of costs of hedging financial
instruments - €(305) million
In application of IFRS 9, the reserve reports the change in the
fair value of currency basis points and forward points.
Reserve from measurement of financial instruments
FVOCI - €20 million
This includes net unrealized income from the measurement
at fair value of financial assets.
Reserve from equity investments accounted for using the
equity method - €(120) million
The reserve reports the share of comprehensive income to
be recognized directly in equity of companies accounted for
using the equity method.
Reserve from remeasurement of net liabilities/(assets) of
defined-benefit plans - €(942) million
The reserve includes all actuarial gains and losses, net of tax
effects, in respect of the employee benefit obligation. The

Inte
rim
rep
ort
on o
per
atio
ns
Conden
sed inte
rim
conso
lidat
ed fi
nan
cial
sta
tem
ents
149Explanatory notes
change mainly reflects a reclassification due to the curtail-
ment of a number of defined-benefit plans following the entry
into force of the 5th Endesa Collective Bargaining Agreement.
Reserve from disposal of equity interests without loss of
control - €(2,381) million
This includes the realized gains and losses, including tran-
saction costs, resulting from the sale of minority interests to
third parties without loss of control. The reserve did not chan-
ge during the period.
Reserve from acquisitions of non-controlling interests -
€(1,359) million
This reserve includes the excess of purchase prices over net
book equity acquired following the acquisition from third par-
ties of additional interests in companies already controlled,
primarily in South America.
The change for the period mainly reflects the impact of the
increase of 5.03% in the interest held in Enel Américas and
2.89% in Enel Chile, bringing the overall stakes in those com-
panies to 65% and 64.93%, respectively.
Retained earnings - €19,264 millionThe reserve reports earnings from previous years that have
not been distributed or allocated to other reserves.
The table below shows the changes in gains and losses re-
cognized directly in other comprehensive income at June 30,
2020, including non-controlling interests.
Millions of euro Change
Gains/(Losses) recognized in equity for the
period
Released to income statement Income taxes Total
Of which shareholders of the Parent
Company
Of which non-controlling
interestsReserve from translation of financial statements in currencies other than euro (3,319) - - (3,319) (2,120) (1,199)
Reserve from measurement of cash flow hedge financial instruments 5,689 (4,659) (219) 811 854 (43)
Reserve from measurements of costs of hedging financial instruments (225) (3) 74 (154) (158) 4
Reserve from measurement of financial assets FVOCI - - - - - -
Share of OCI of associates accounted for using the equity method - - (2) (2) (1) (1)
Reserve from measurement of investments in other entities (1) - - (1) (1) -
Remeasurement of net liabilities/(assets) of defined-benefit plans 46 - (13) 33 23 10
Total gains/(losses) recognized in equity 2,190 (4,662) (160) (2,632) (1,403) (1,229)
27.2 Non-controlling interests - €14,188 million
The following table reports the composition of non-controlling interests by geographical area.
Millions of euro Non-controlling interestsResult for the period attributable
to non-controlling interests
at June 30, 2020 at Dec. 31, 2019 at June 30, 2020 at June 30, 2019
Italy 1 1 - (1)
Iberia 6,031 5,961 306 202
Latin America 7,159 9,277 114 494
Europe 656 903 29 (20)
North America 190 222 4 1
Africa, Asia and Oceania 151 197 3 2
Total 14,188 16,561 456 678

150 Half-Year Financial Report at June 30, 2020
The decrease in non-controlling interests mainly reflects
exchange rate developments, dividends and the increase in
the percentage holdings in Enel Américas and Enel Chile.
Finally, note that with effect from September 2019, Latin
America also includes the countries Panama, Costa Rica,
Guatemala, El Salvador and Nicaragua, which were previously
reported under the geographic area North and Central Ameri-
ca (now renamed North America).
In order to ensure full comparability of the figures in the light
of the new organization, the comparative figures for the result
for the period attributable to non-controlling interests for 2019
have been restated appropriately.
28. Employee benefits - €2,780 million
Millions of euro
At December 31, 2019 3,771
Accruals 51
Utilization (172)
Reversal (522)
Unwinding of discount 57
Translation adjustments (406)
Change in the scope of consolidation -
Other changes 1
At June 30, 2020 2,780
The Group provides its employees with a variety of benefits,
including deferred compensation benefits, additional months’
pay for having reached age limits or eligibility for old-age pen-
sion, loyalty bonuses for achievement of seniority milestones,
supplemental retirement and healthcare plans, residential
electricity discounts and similar benefits.
An analysis of the employee benefit liability is conducted
annually, unless significant changes in the actuarial assump-
tions or plans have occurred in the meantime. With regard to
the situation at June 30, 2020 following the COVID-19 health
emergency, the Group deemed it appropriate to perform an
in-depth analysis of the possible impact of the economic cri-
sis generated by the pandemic on the actuarial assumptions
applied in the measurement of actuarial liabilities.
The analysis confirmed the actuarial assumptions used pre-
viously, noting how the effects of COVID-19 are often to be
considered transient and short-term, although updated asses-
sments were made for Chile and Brazil since:
> Chile experienced a significant change in the discount rate;
and
> Brazil has a high level of liabilities, although the rates have
not undergone significant changes.
Following the updates prepared by the actuary, the final re-
sults even indicate a reduction in the overall liability in Brazil,
primarily reflecting the exchange rate effect, while in Chile
they do not involve significant changes.
Very briefly, therefore, the obligations towards the employees
of the Enel Group have not been affected by the effects of the
COVID-19 pandemic.
During the 1st Half of 2020, liabilities in respect of employee
benefits decreased significantly in Spain following the entry
into force of the 5th Endesa Collective Bargaining Agreement,
as the electricity discount benefit for employees and former
employees was reformulated, with the consequent reversal
of excess existing provisions to profit or loss (€515 million).

Inte
rim
rep
ort
on o
per
atio
ns
Conden
sed inte
rim
conso
lidat
ed fi
nan
cial
sta
tem
ents
151Explanatory notes
29. Provisions for risks and charges - €6,065 million
Millions of euro Non-current CurrentTotal provisions for
risks and charges
At December 31, 2019 5,324 1,196 6,520
Accruals 226 141 367
Utilization (83) (260) (343)
Reversal (133) (24) (157)
Unwinding of discount 26 7 33
Translation adjustments (230) (48) (278)
Change in the scope of consolidation - - -
Plant retirement and site restoration (85) - (85)
Other changes (64) 72 8
At June 30, 2020 4,981 1,084 6,065
At June 30, 2020, the item included the litigation provision
in the amount of €845 million (€1,070 million at December
31, 2019), which essentially decreased as a result of adverse
exchange rate developments in Brazil, the nuclear decommis-
sioning provision in the amount of €577 million (€640 million
at December 31, 2019), the plant retirement and site restora-
tion provision in the amount of €1,874 million (€1,942 million
at December 31, 2019), which mainly decreased because of
the redetermination of future plant retirement costs in Ibe-
ria following a review of inflation rates, the provision for ta-
xes and duties in the amount of €298 million (€336 million
at December 31, 2019) and the provision for early retirement
incentives in the amount of €1,133 million (€1,233 million at
December 31, 2019), the decrease in which was mainly attri-
butable utilization in Italy, partly offset by an increase in the
provision in Spain following the entry into force of the new
agreement for the voluntary early termination of employment
relationships.
The item was not affected significantly by the COVID-19 pan-
demic.
30. Risk managementFor a more complete discussion of the hedging instruments
used by the Group to manage the various risks associated
with its business, please see the consolidated financial state-
ments at December 31, 2019.
The impact of COVID-19 on issues related to risk manage-
ment was limited and in any case not such as to directly and
materially affect the measurement of derivative instruments
and the outcome of the assessment of the effectiveness of
exchange rate, interest rate and commodity risk hedges. The
volatility that affected the financial markets during the initial
phase of the pandemic in many cases returned to pre-CO-
VID-19 levels and was in any case offset by risk mitigation
actions using financial derivatives.
With regard to the exposures to hedged risks, there were
slight temporal shifts in the plans for the construction of
some solar and wind plants, although these did not have an
undesirable impact on the application of hedge accounting
(discontinuance, ineffectiveness, etc.). The construction of
these plants remains highly probable and the method for me-
asuring effectiveness applied to this type of exposure shields
the Group from timing problems in the realization of these
projects.
Financial underlyings were also not adversely affected by CO-
VID-19. There were no changes in exposures or in hedging
instruments.
The following notes report the balances for derivative instru-
ments, grouped by the item of the consolidated balance she-
et that contain them.

152 Half-Year Financial Report at June 30, 2020
30.1 Derivative contracts classified under non-current assets - €2,877 millionThe table below reports the fair value of derivative contracts classified under non-current assets, broken down by type of risk
and designation.
Millions of euro
at June 30, 2020 at Dec. 31, 2019 Change
Cash flow hedge derivatives:
- interest rates 36 26 10
- exchange rates 2,237 1,081 1,156
- commodities 518 215 303
Total cash flow hedge derivatives 2,791 1,322 1,469
Fair value hedge derivatives:
- interest rates 8 7 1
- exchange rates 25 25 -
Total fair value hedge derivatives 33 32 1
Trading derivatives:
- interest rates 2 2 -
- exchange rates 1 - 1
- commodities 50 27 23
Total trading derivatives 53 29 24
TOTAL 2,877 1,383 1,494
Cash flow hedge derivatives on interest rates increased by
€10 million, mainly reflecting developments in the yield curve
in the United States and the appreciation of the dollar against
the euro in the 1st Half of 2020.
Fair value hedge derivatives on interest rates saw their fair
value rise by €1 million, mainly due to the decline in the yield
curve in the euro area in the 1st Half of 2020.
Cash flow hedge derivatives on exchange rates essentially
concern the hedging of exchange rate risk on bond issues in
a foreign currency using cross-currency interest rate swaps.
The increase in their fair value is mainly due to the performan-
ce of the euro against the other leading currencies during the
1st Half of 2020.
Cash flow hedge derivatives on commodities regard the hed-
ging of electricity with a fair value of €223 million, derivatives
on gas and oil commodities in the amount of €250 million
and transactions in CO2 and coal in the total amount of €45
million. The fair value of trading derivatives on commodities
regarded derivatives transactions totaling €50 million, mainly
involving electricity.

Inte
rim
rep
ort
on o
per
atio
ns
Conden
sed inte
rim
conso
lidat
ed fi
nan
cial
sta
tem
ents
153Explanatory notes
30.2 Derivative contracts classified under current assets - €6,059 millionThe table below reports the fair value of derivative contracts classified under current assets, broken down by type of risk and
designation.
Millions of euro
at June 30, 2020 at Dec. 31, 2019 Change
Cash flow hedge derivatives:
- exchange rates 235 132 103
- commodities 759 847 (88)
Total cash flow hedge derivatives 994 979 15
Fair value hedge derivatives:
- exchange rates 32 - 32
Total fair value hedge derivatives 32 - 32
Trading derivatives:
- exchange rates 48 34 14
- commodities 4,985 3,052 1,933
Total trading derivatives 5,033 3,086 1,947
TOTAL 6,059 4,065 1,994
Cash flow hedge derivatives on exchange rates regard tran-
sactions to hedge the exchange rate risk on energy commo-
dity prices, investment projects and hedges of the exchan-
ge rate risk on loans denominated in foreign currencies. The
changes in the fair value of these derivatives are associated
with developments of the euro against the main currencies
during the 1st Half of 2020.
Fair value hedge derivatives are entirely accounted for by the
reclassification of €87 million in notional value and €32 million
in fair value from “non-current financial assets” in respect of
exchange rate derivatives entered into to hedge loans deno-
minated in currencies other than the euro.
The fair value of trading derivatives on exchange rates, equal
to €48 million, regards transactions that while entered into for
hedging purposes do not meet the requirements under the
relevant accounting standards for hedge accounting.
The fair value of cash flow hedge derivatives on commodities
regards hedges of electricity for a total of €93 million, gas and
oil derivatives in the amount of €545 million and hedges of
CO2 and coal totaling €121 million.
The fair value of trading derivatives on commodities regards
derivatives on electricity, gas and oil, coal, CO2, and other un-
derlyings in the amount of €4,985 million. The greatest impact
is attributable to transactions on gas and oil, but sharp volati-
lity in the period affected all commodities.
These figures also include transactions that were undertaken
for hedging purposes but which do not meet the requiremen-
ts under the relevant accounting standards for hedge accoun-
ting.

154 Half-Year Financial Report at June 30, 2020
30.3 Derivatives contracts classified under non-current liabilities - €2,958 millionThe following table reports the fair value of cash flow hedge, fair value hedge and trading derivatives.
Millions of euro
at June 30, 2020 at Dec. 31, 2019 Change
Cash flow hedge derivatives:
- interest rates 978 779 199
- exchange rates 1,734 1,560 174
- commodities 126 47 79
Total cash flow hedge derivatives 2,838 2,386 452
Fair value hedge derivatives:
- exchange rates - 1 (1)
Total fair value hedge derivatives - 1 (1)
Trading derivatives:
- interest rates 7 6 1
- exchange rates 1 - 1
- commodities 112 14 98
Total trading derivatives 120 20 100
TOTAL 2,958 2,407 551
The deterioration in the fair value of cash flow hedge derivati-
ves on interest rates was due mainly to developments in yield
curves during the 1st Half of 2020.
Cash flow hedge derivatives on exchange rates essential-
ly regard transactions to hedge bonds denominated in cur-
rencies other than the euro through cross currency interest
rate swaps. The decrease in their fair value with respect to
December 31, 2019 is mainly due to developments in the
exchange rate of the euro against the pound sterling.
Cash flow hedge derivatives on commodities include the he-
dging of electricity in the amount of €61 million and hedges
of gas and oil in the amount of €65 million. The fair value of
trading derivatives totaled €112 million.

Inte
rim
rep
ort
on o
per
atio
ns
Conden
sed inte
rim
conso
lidat
ed fi
nan
cial
sta
tem
ents
155Explanatory notes
30.4 Derivative contracts classified under current liabilities - €5,381 millionThe following table reports the fair value of derivative contracts.
Millions of euro
at June 30, 2020 at Dec. 31, 2019 Change
Cash flow hedge derivatives:
- interest rates 2 1 1
- exchange rates 104 115 (11)
- commodities 511 457 54
Total cash flow hedge derivatives 617 573 44
Trading derivatives:
- interest rates 89 79 10
- exchange rates 28 38 (10)
- commodities 4,647 2,864 1,783
Total trading derivatives 4,764 2,981 1,783
TOTAL 5,381 3,554 1,827
Cash flow hedge derivatives on exchange rates regard he-
dges of exchange rate risk on bond issues denominated in
foreign currencies, revenue from electricity sales contracts
with customers in the regulated market in Chile, which are
indexed to the US dollar, and the purchase of natural gas and
other fuels. The change in the fair value of cash flow hedge
derivatives is mainly due to developments in the euro against
the main currencies and normal foreign exchange operations.
Trading derivatives on exchange rates essentially include
transactions entered into for hedging purposes that although
they were entered into for hedging purposes do not meet
the requirements under the relevant accounting standards for
hedge accounting.
Cash flow hedge derivatives on commodities include hedges
of gas and oil commodities with a fair value of €368 million,
hedges of electricity in the amount of €116 million and tran-
sactions on coal and CO2 totaling €27 million. Commodity de-
rivatives classified as trading instruments include derivatives
on electricity, coal and CO2, gas, oil and other commodities
with a total fair value of €4,647 million.

156 Half-Year Financial Report at June 30, 2020
31. Assets and liabilities measured at fair valueIn compliance with the disclosure requirements under par-
agraph 15B (k) of IAS 34, the Group determines fair value in
conformity with IFRS 13 any time that treatment is required
by an international accounting standard.
Fair value is defined as the price that would be received to sell
an asset or paid to transfer a liability, in an orderly transaction,
between market participants, at the measurement date (i.e.
an exit price).
The best proxy for fair value is market price, i.e. the current
publically available price that is effectively quoted on a liquid
and active market.
The fair value of assets and liabilities is classified in a three-lev-
el hierarchy, defined as follows on the basis of the inputs and
valuation techniques used to measure the fair value:
> Level 1, where the fair value is determined on basis of
quoted prices (unadjusted) in active markets for identical
assets or liabilities that the entity can access at the meas-
urement date;
> Level 2, where the fair value is determined on basis of in-
puts other than quoted prices included within Level 1 that
are observable for the asset or liability, either directly (as
prices) or indirectly (derived from prices);
> Level 3, where the fair value is determined on the basis of
unobservable inputs.
There were no changes in the levels of the fair value hierar-
chy used for the purposes of measuring financial instruments
compared with the most recent annual report (as indicated in
notes 47 and 48 of the consolidated financial statements at
December 31, 2019). The methods used in measuring Level 2
and 3 fair values are consistent with those used in the most
recent annual report. For a more extensive discussion of gen-
eral issues and the Group’s most important valuation process-
es for fair value measurement, please see note 2 “Accounting
policies and measurement criteria” of the 2019 Consolidated
Annual Report.

Inte
rim
rep
ort
on o
per
atio
ns
Conden
sed inte
rim
conso
lidat
ed fi
nan
cial
sta
tem
ents
157Explanatory notes
32. Related parties As an operator in the field of generation, distribution, trans-
port and sale of electricity and the sale of natural gas, Enel
carries out transactions with a number of companies directly
or indirectly controlled by the Italian State, the Group’s con-
trolling shareholder.
The table below summarizes the main types of transactions carried out with such counterparties.
Related party Relationship Nature of main transactions
Single Buyer Fully controlled (indirectly) by the Ministry for the Economy and Finance
Purchase of electricity for the enhanced protection market
Cassa Depositi e Prestiti Group Directly controlled by the Ministry for the Economy and Finance
Sale of electricity on the Ancillary Services Market (Terna)Sale of electricity transport services (Eni Group)Purchase of transport, dispatching and metering services (Terna)Purchase of postal services (Poste Italiane)Purchase of fuels for generation plants and natural gas storage and distribution services (Eni Group)
ESO - Energy Services Operator Fully controlled (directly) by the Ministry for the Economy and Finance
Sale of subsidized electricityPayment of A3 component for renewable resource incentives
EMO - Energy Markets Operator Fully controlled (indirectly) by the Ministry for the Economy and Finance
Sale of electricity on the Power Exchange (EMO)Purchase of electricity on the Power Exchange for pumping and plant planning (EMO)
Leonardo Group Directly controlled by the Ministry for the Economy and Finance
Purchase of IT services and supply of goods
Finally, Enel also maintains relationships with the pension
funds FOPEN and FONDENEL, as well as Enel Cuore, an Enel
non-profit company devoted to providing social and health-
care assistance.
All transactions with related parties were carried out on nor-
mal market terms and conditions, which in some cases are
determined by the Regulatory Authority for Energy, Networks
and the Environment.

158 Half-Year Financial Report at June 30, 2020
The following tables summarize transactions with related
parties, associated companies and joint arrangements carried
out in the 1st Half of 2020 and 2019 and outstanding at June
30, 2020 and December 31, 2019.
Millions of euro
Single Buyer EMOCassa Depositi e
Prestiti Group ESO OtherKey management
personnel Total 1st Half 2020Associates and joint
arrangementsOverall total 1st Half
2020Total in financial
statements % of total
Income statement
Revenue from sales and services - 306 1,257 157 126 - 1,846 87 1,933 32,520 5.9%
Other revenue and income - - - - - - - 6 6 855 0.7%
Other financial income - - - - - - - 31 31 928 3.3%
Purchases of electricity, gas and fuel 842 875 490 - 1 - 2,208 98 2,306 13,769 16.7%
Costs for services and other materials 2 13 1,151 1 67 - 1,234 74 1,308 8,332 15.7%
Other operating expenses - 103 5 1 - - 109 - 109 1,089 10.0%Net income/(expense) from commodity risk management - - - - - - - (1) (1) (601) 0.2%
Other financial expense - - 7 - - - 7 22 29 2,255 1.3%
Millions of euro
Single Buyer EMOCassa Depositi e
Prestiti Group ESO OtherKey management
personnelTotal at June 30,
2020Associates and joint
arrangementsOverall total at June
30, 2020Total in financial
statements % of total
Balance sheet
Non-current derivative assets - - - - - - - 27 27 2,877 0.9%
Trade receivables - 21 608 14 28 - 671 256 927 11,308 8.2%
Current derivative assets - - - - - - - 3 3 6,059 -
Other current financial assets - - - - - - - 49 49 4,328 1.1%
Other current assets - 15 62 110 1 - 188 15 203 3,890 5.2%
Non-current contract liabilities - - 3 - 5 - 8 173 181 6,257 2.9%
Long-term borrowings - - 670 - - - 670 - 670 53,623 1.2%
Current portion of long-term borrowings - - 89 - - - 89 - 89 2,738 3.3%
Trade payables 624 50 719 1,253 21 - 2,668 62 2,730 9,348 29.2%
Current derivative liabilities - - - - - - - 5 5 5,381 0.1%
Current contract liabilities - - - - - - - 46 46 1,249 3.7%
Other current liabilities - - 14 - 11 - 25 7 32 12,704 0.3%
Other information
Guarantees given - 250 324 - 157 - 731 - 731
Guarantees received - - 154 - 42 - 196 - 196
Commitments - - 102 - 4 - 106 - 106

Inte
rim
rep
ort
on o
per
atio
ns
Conden
sed inte
rim
conso
lidat
ed fi
nan
cial
sta
tem
ents
159Explanatory notes
Millions of euro
Single Buyer EMOCassa Depositi e
Prestiti Group ESO OtherKey management
personnel Total 1st Half 2020Associates and joint
arrangementsOverall total 1st Half
2020Total in financial
statements % of total
Income statement
Revenue from sales and services - 306 1,257 157 126 - 1,846 87 1,933 32,520 5.9%
Other revenue and income - - - - - - - 6 6 855 0.7%
Other financial income - - - - - - - 31 31 928 3.3%
Purchases of electricity, gas and fuel 842 875 490 - 1 - 2,208 98 2,306 13,769 16.7%
Costs for services and other materials 2 13 1,151 1 67 - 1,234 74 1,308 8,332 15.7%
Other operating expenses - 103 5 1 - - 109 - 109 1,089 10.0%Net income/(expense) from commodity risk management - - - - - - - (1) (1) (601) 0.2%
Other financial expense - - 7 - - - 7 22 29 2,255 1.3%
Millions of euro
Single Buyer EMOCassa Depositi e
Prestiti Group ESO OtherKey management
personnelTotal at June 30,
2020Associates and joint
arrangementsOverall total at June
30, 2020Total in financial
statements % of total
Balance sheet
Non-current derivative assets - - - - - - - 27 27 2,877 0.9%
Trade receivables - 21 608 14 28 - 671 256 927 11,308 8.2%
Current derivative assets - - - - - - - 3 3 6,059 -
Other current financial assets - - - - - - - 49 49 4,328 1.1%
Other current assets - 15 62 110 1 - 188 15 203 3,890 5.2%
Non-current contract liabilities - - 3 - 5 - 8 173 181 6,257 2.9%
Long-term borrowings - - 670 - - - 670 - 670 53,623 1.2%
Current portion of long-term borrowings - - 89 - - - 89 - 89 2,738 3.3%
Trade payables 624 50 719 1,253 21 - 2,668 62 2,730 9,348 29.2%
Current derivative liabilities - - - - - - - 5 5 5,381 0.1%
Current contract liabilities - - - - - - - 46 46 1,249 3.7%
Other current liabilities - - 14 - 11 - 25 7 32 12,704 0.3%
Other information
Guarantees given - 250 324 - 157 - 731 - 731
Guarantees received - - 154 - 42 - 196 - 196
Commitments - - 102 - 4 - 106 - 106

160 Half-Year Financial Report at June 30, 2020
Millions of euro
Single Buyer EMOCassa Depositi e
Prestiti Group ESO OtherKey management
personnel Total 1st Half 2019Associates and joint
arrangementsOverall total 1st Half
2019Total in financial
statements % of total
Income statement
Revenue from sales and services - 786 1,306 167 76 - 2,335 142 2,477 39,492 6.3%
Other revenue and income - - - - - - - 5 5 1,475 0.3%
Other financial income - - - - - - - 49 49 847 5.8%
Purchases of electricity, gas and fuel 1,524 1,687 592 199 - - 4,002 91 4,093 20,388 20.1%
Costs for services and other materials - 28 1,351 2 63 - 1,444 68 1,512 8,849 17.1%
Other operating expenses 1 133 3 1 - - 138 - 138 1,315 10.5%Net income/(expense) from commodity risk management - - 13 - - - 13 (1) 12 (188) -6.4%
Other financial expense - - 8 - - - 8 7 15 2,103 0.7%
Millions of euro
Single Buyer EMOCassa Depositi e
Prestiti Group ESO OtherKey management
personnelTotal at Dec. 31,
2019Associates and joint
arrangementsOverall total at Dec.
31, 2019Total in financial
statements % of total
Balance sheet
Non-current derivative assets - - - - - - - 15 15 1,383 1.1%
Trade receivables - 45 573 15 13 - 646 250 896 13,083 6.8%
Current derivative assets - - - - - - - 8 8 4,065 0.2%
Other current financial assets - - - - - - - 27 27 4,305 0.6%
Other current assets - 23 69 89 1 - 182 1 183 3,115 5.9%
Long-term borrowings - - 715 - - - 715 - 715 54,174 1.3%
Non-current contract liabilities - - 2 - 6 - 8 143 151 6,301 2.4%
Current portion of long-term borrowings - - 89 - - - 89 - 89 3,409 2.6%
Trade payables 601 92 726 793 18 - 2,230 61 2,291 12,960 17.7%
Current derivative liabilities - - - - - - - 8 8 3,554 0.2%
Current contract liabilities - - - - 1 - 1 38 39 1,328 2.9%
Other current liabilities - - 16 - 9 - 25 5 30 13,161 0.2%
Other information
Guarantees given - 250 354 - 164 - 768 - 768
Guarantees received - - 125 - 35 - 160 - 160
Commitments - - 9 - 4 - 13 - 13

Inte
rim
rep
ort
on o
per
atio
ns
Conden
sed inte
rim
conso
lidat
ed fi
nan
cial
sta
tem
ents
161Explanatory notes
Millions of euro
Single Buyer EMOCassa Depositi e
Prestiti Group ESO OtherKey management
personnel Total 1st Half 2019Associates and joint
arrangementsOverall total 1st Half
2019Total in financial
statements % of total
Income statement
Revenue from sales and services - 786 1,306 167 76 - 2,335 142 2,477 39,492 6.3%
Other revenue and income - - - - - - - 5 5 1,475 0.3%
Other financial income - - - - - - - 49 49 847 5.8%
Purchases of electricity, gas and fuel 1,524 1,687 592 199 - - 4,002 91 4,093 20,388 20.1%
Costs for services and other materials - 28 1,351 2 63 - 1,444 68 1,512 8,849 17.1%
Other operating expenses 1 133 3 1 - - 138 - 138 1,315 10.5%Net income/(expense) from commodity risk management - - 13 - - - 13 (1) 12 (188) -6.4%
Other financial expense - - 8 - - - 8 7 15 2,103 0.7%
Millions of euro
Single Buyer EMOCassa Depositi e
Prestiti Group ESO OtherKey management
personnelTotal at Dec. 31,
2019Associates and joint
arrangementsOverall total at Dec.
31, 2019Total in financial
statements % of total
Balance sheet
Non-current derivative assets - - - - - - - 15 15 1,383 1.1%
Trade receivables - 45 573 15 13 - 646 250 896 13,083 6.8%
Current derivative assets - - - - - - - 8 8 4,065 0.2%
Other current financial assets - - - - - - - 27 27 4,305 0.6%
Other current assets - 23 69 89 1 - 182 1 183 3,115 5.9%
Long-term borrowings - - 715 - - - 715 - 715 54,174 1.3%
Non-current contract liabilities - - 2 - 6 - 8 143 151 6,301 2.4%
Current portion of long-term borrowings - - 89 - - - 89 - 89 3,409 2.6%
Trade payables 601 92 726 793 18 - 2,230 61 2,291 12,960 17.7%
Current derivative liabilities - - - - - - - 8 8 3,554 0.2%
Current contract liabilities - - - - 1 - 1 38 39 1,328 2.9%
Other current liabilities - - 16 - 9 - 25 5 30 13,161 0.2%
Other information
Guarantees given - 250 354 - 164 - 768 - 768
Guarantees received - - 125 - 35 - 160 - 160
Commitments - - 9 - 4 - 13 - 13

162 Half-Year Financial Report at June 30, 2020
33. Contractual commitments and guaranteesThe commitments entered into by the Enel Group and the guarantees given to third parties are summarized below.
Millions of euro
at June 30, 2020 at Dec. 31, 2019 Change
Guarantees issued:
- sureties and other guarantees granted to third parties 11,636 11,078 558
Commitments to suppliers for:
- electricity purchases 72,759 97,472 (24,713)
- fuel purchases 42,196 48,016 (5,820)
- various supplies 1,388 1,034 354
- tenders 3,335 3,522 (187)
- other 4,141 3,391 750
Total 123,819 153,435 (29,616)
TOTAL 135,455 164,513 (29,058)
Commitments for electricity amounted to €72,759 million at
June 30, 2020, of which €19,257 million refer to the period
July 1, 2020-2024, €17,142 million to the period 2025-2029,
€13,898 million to the period 2030-2034 and the remaining
€22,462 million beyond 2034.
Commitments for the purchase of fuels are determined with
reference to the contractual parameters and exchange rates
applicable at the end of the period (given that fuel prices vary
and are mainly set in foreign currencies). The total at June 30,
2020 amounted to €42,196 million, of which €21,327 million
refer to the period July 1, 2020-2024, €11,616 million to the
period 2025-2029, €6,478 million to the period 2030-2034 and
the remaining €2,775 million beyond 2034.
34. Contingent assets and liabilities Compared with the consolidated financial statements at De-
cember 31, 2019, which the reader is invited to consult for
more information, the following main changes have occurred
in contingent assets and liabilities.
Brindisi Sud thermal generation plant - Criminal proceedings against Enel employees With regard to the appeal lodged with the Court of Cassation
on June 22, 2019 against the ruling of the Lecce Court of Ap-
peal of February 8, 2019 concerning the criminal proceeding
against a number of Enel Produzione employees on charges
of criminal damage and dumping of hazardous substances
with regard to the alleged contamination of land adjacent to
the Brindisi Sud thermal plant with coal dust, the hearing ini-
tially scheduled for April 24, 2020 was postponed until Octo-
ber 1, 2020 owing to the COVID-19 health emergency.
With regard to the proceedings before the Court of Vibo Va-
lentia involving a number of Enel Produzione employees on
charges of illegal waste disposal in connection with alleged
violations concerning the disposal of waste from the Brindisi
plant, the prosecution’s expert witness testified at the hearing
of February 24, 2020. Following the postponement of hearin-
gs in all criminal and civil proceedings as part of the measures
to counter COVID-19, the hearings in this case are expected
to resume on September 7, 2020.
Enel Energia and Servizio Elettrico Nazionale antitrust proceedingWith regard to the appeal proceedings pending before the
Council of State against the rulings of the Lazio Regional Ad-
ministrative Court of October 7, 2019, at the trial hearing of
May 21, 2020, the rulings were taken up for decision. With an
order of July 20, 2020, the Council of State (accepting a su-
bordinate petition from the counsel defending the three com-
panies), after the joinder of the three judgments, suspended

Inte
rim
rep
ort
on o
per
atio
ns
Conden
sed inte
rim
conso
lidat
ed fi
nan
cial
sta
tem
ents
163Explanatory notes
the judgment and ordered that the issue be submitted for a
preliminary ruling before the Court of Justice of the European
Union pursuant to Article 267 of the Treaty on the Functioning
of the European Union, formulating a number of questions
aimed at clarifying the interpretation of the concept of “abuse
of a dominant position” to be applied to the present case.
BEG litigation
ItalyWith regard to the proceeding initiated by Enel SpA and Enel-
power SpA currently pending before the Rome Court of Ap-
peal asking the Court to ascertain the liability of BEG SpA for
having evaded compliance with the arbitration ruling issued in
Italy in favor of Enelpower SpA through the legal action taken
by Albania BEG Ambient Shpk, the hearing scheduled for May
7, 2020 was postponed until February 18, 2021 owing to the
COVID-19 health emergency.
FranceWith regard to the proceeding initiated by Albania BEG Am-
bient Shpk to render the ruling of the Albanian court enforce-
able in France, the hearing initially scheduled before the Paris
Court of Appeal for June 9, 2020 was postponed to a date to
be determined owing to the COVID-19 health emergency. The
exchange of briefs between the parties is still under way.
The NetherlandsWith regard to suit filed by Albania BEG Ambient Shpk to ren-
der the ruling of the Albanian court enforceable in the Nether-
lands, on December 3, 2019, the Amsterdam Court of Appeal
issued a ruling in which it quashed the trial court judgment
of June 29, 2016, rejecting any claim made by Albania BEG
Ambient Shpk. The Court came to this conclusion after affir-
ming its jurisdiction over Albania BEG Ambient Shpk’s subor-
dinate claim and re-analyzing the merits of the case under
Albanian law. Enel and Enelpower are therefore not liable to
pay any amount to Albania BEG Ambient Shpk, which was in
fact ordered by the Court of Appeal to reimburse the appellant
companies for the losses incurred in illegitimate conservative
seizures, to be quantified as part of a specific procedure, and
the costs of the trial and appeal proceedings. On March 3,
2020, it was learned that Albania BEG Ambient Shpk had filed
an appeal with the Supreme Court of the Netherlands. On
April 3, 2020, Enel and Enelpower appeared before the Su-
preme Court and the exchange of briefs between the parties
is under way.
Cibran litigation - BrazilWith regard to the first of six suits filed in 1999 regarding the
years from 1995 to 1999 by Cibran against Ampla to obtain
damages for alleged losses incurred as a result of the inter-
ruption of electricity service by the Brazilian distribution com-
pany, on December 16, 2016, Cibran filed an appeal (Recurso
Especial) against the ruling in Ampla’s favor before the Tribu-
nal Superior de Justiça, which was denied on June 19, 2020.
Arbitration proceedings in ColombiaWith regard to the arbitration proceedings initiated against
Codensa and Emgesa by the Grupo Energía de Bogotá (GEB)
and now joined into two separate proceedings for each com-
pany, on February 24, 2020, GEB filed a revision of the arbi-
tration petition filed against Emgesa, including, among other
things, claims concerning the failure to pursue the corporate
purpose and abuse of the exercise of voting rights by Enel
Américas and its directors. Emgesa filed a defense brief chal-
lenging GEB’s new claims. Both of the two suits launched
against Emgesa and Codensa are currently suspended due
to negotiations by agreement of the parties. The value of the
disputes is undetermined and the proceedings are both in the
preliminary phase.
Gabcíkovo dispute - SlovakiaWith regard to the proceeding to void the VEG Indemnity
Agreement, the appeal filed by Vodohospodárska Výstavba
Štátny Podnik (VV) was denied, upholding the trial court de-
cision in favor of Slovenské elektrárne (SE). VV filed a further
appeal (dovolanie) against that decision on March 9, 2020, to
which SE replied with a brief submitted on June 8, 2020.
With regard to the suits filed by VV against SE for alleged
unjustified enrichment on the part of the latter (estimated at
about €360 million plus interest) for the period from 2006 to
2015: (i) for 2006, 2007 and 2008, at the hearing of June 26,
2019, the Court of Bratislava denied the claims of both parties
for procedural reasons. The ruling in first instance was appe-
aled by both VV and SE and a decision is pending; (ii) for the
proceeding regarding 2009, the Court of Bratislava scheduled
the first hearing for September 8, 2020; (iii) with regard to the
proceeding concerning 2010 and 2013, the exchange of final
pleadings was completed and the hearing of the court of first
instance, initially scheduled for May 12, 2020, was postponed
until October 6, 2020; and (iv) with regard to the proceeding
concerning 2014, the hearing of the court of first instance

164 Half-Year Financial Report at June 30, 2020
scheduled for March 31, 2020 was cancelled with no indica-
tion of a new date. Finally, in the proceeding brought by VV
before the Court of Bratislava asking for SE to return the fee
for the transfer from SE to VV of the technology assets of the
Gabcíkovo plant, the hearing originally scheduled for March
12, 2020 was first postponed until May 28, 2020 and then to
October 1, 2020.
Precautionary administrative proceeding and Chucas arbitration The “recurso de aclaración y adición” filed by Chucas on
September 11, 2019 with the Supreme Court of Costa Rica
was partially upheld on June 8, 2020. The Court’s decision
expanded on the ruling of September 5, 2019 with informa-
tion concerning the admission of evidence deposited by Chu-
cas without, however, modifying the decision concerning the
voidance of the arbitration award. On July 15, 2020, Chucas
filed a request for arbitration with the Costa Rican-American
Chamber of Commerce (AMCHAM CICA).
GasAtacama Chile - ChileOn January 15, 2020 the Supreme Court of Chile issued a
ruling upholding the decision of the Santiago Court of Appeal
reducing the fine levied on GasAtacama Chile by the Supe-
rintendencia de Electricidad y Combustibles (SEC) on August
4, 2016 concerning information provided by GasAtacama Chi-
le to the Centro de Despacho Económico de Carga (CDEC-
SING) between January 1, 2011 and October 29, 2015 from
about $6 million to around $300,000. The decision became
definitive and on March 12, 2020, GasAtacama Chile paid the
fine in the amount confirmed by the Supreme Court of Chile.
Withholding tax - Endesa Brasil On November 4, 2014, the Brazilian tax authorities issued an
assessment against Endesa Brasil SA (now Enel Brasil SA)
alleging the failure to apply withholding tax to payments of
allegedly higher dividends to non-resident recipients.
More specifically, in 2009, Endesa Brasil, as a result of the
first-time application of the IFRS-IAS, had cancelled goodwill,
recognizing the effects in equity, on the basis of the correct ap-
plication of the accounting standards it had adopted. The Brazi-
lian tax authorities, however, asserted – during an audit – that
the accounting treatment was incorrect and that the effects of
the cancellation should have been recognized through profit or
loss. As a result, the corresponding value (about €202 million)
was reclassified as a payment of income to non-residents and,
therefore, subject to withholding tax of 15%.
It should be noted that the accounting treatment adopted by
the company was agreed with the external auditor and also
confirmed by a specific legal opinion issued by a local firm.
The first two levels of the administrative courts ruled for the
tax authorities. At the third level of jurisdiction the company’s
appeal was denied for formal reasons. Yet a further appeal of
the decision was also denied and the company continues to
defend its actions and the appropriateness of the accounting
treatment in court.
The overall amount involved in the dispute at June 30, 2020
was about €58 million.
35. Subsequent events
Enel reaches 64.9% of the share capital of Enel ChileOn July 7, 2020, Enel SpA announced that it had increased
its stake in its Chilean subsidiary Enel Chile SA (Enel Chile)
to 64.9% of the company’s share capital, settling two share
swap transactions entered into in December 2019 with a fi-
nancial institution to acquire up to 3% of the share capital of
Enel Chile, as announced to the financial markets at the time.
The transactions, which were funded with cash flow from
operations, are in line with the Enel Group’s announced
objective to increase its stake in the Group’s companies ope-
rating in South America, buying out minorities.
Enel establishes a company to develop a network of customs warehouses in areas no longer used by power plantsOn July 8, 2020, Enel announced that it had established a
company for the recovery and conversion of unused areas
and structures adjacent to power plants in Italy, located near
strategic sites such as ports, airports and interports, to be
used as customs warehouses for logistics, handling and sto-
rage of goods. The first two pilot sites could be operational at
the beginning of 2021, with the collaboration of local officials,

Inte
rim
rep
ort
on o
per
atio
ns
Conden
sed inte
rim
conso
lidat
ed fi
nan
cial
sta
tem
ents
165Explanatory notes
in the areas of the Eugenio Montale plant in La Spezia and the
site of the Marzocco plant in Livorno.
The reuse of existing structures, in keeping with the princi-
ples of the circular economy, will generate significant environ-
mental benefits, thanks to the extension of the life of the are-
as to be converted, economic benefits, with the development
of existing skills and assets, and social benefits, through the
creation of new jobs.
Enel accelerates energy transition towards decarbonizationEnel, in its role as a leader of the energy transition, has pla-
ced decarbonization and growth of renewables around the
world at the center of its strategy. The 2020-2022 Strategic
Plan provides for a significant increase in installed renewables
capacity, from the current 46 GW to 60 GW at the end of
2022, and the progressive reduction of coal-fired capacity and
generation. More specifically, it is expected that such capaci-
ty will decrease by more than 40% in 2022 compared with
2019. In order to manage renewable and thermal generation
assets around the world in an integrated manner and guide
and accelerate its transformation, Enel therefore created a
new Business Line in 2019.
In this context, on June 2, 2020, Enel began restructuring the
activities associated with the energy transition process, whi-
ch will involve thermal generation plants in all the geographi-
cal areas in which the Group operates. The consequent revi-
sion of processes and operating models will require changes
in the roles and skills of employees, which the Group intends
to implement with highly sustainable plans based on rede-
ployment programs, with major upskilling and reskilling plans
and voluntary individual early retirement agreements that will
involve around 1,300 people worldwide.
The Group will define and launch these initiatives over the
next two years, incurring a one-time charge of about €0.4
billion, which will not be included in the calculation of the
Group’s ordinary EBITDA and ordinary net profit and, therefo-
re, will not have an impact on Enel’s dividend policy.
The restructuring plan will be implemented with procedures
and timing that will differ in the various countries in which we
are present, initiating the appropriate dialogue with local com-
munities and the competent institutions and social partners.

166 Half-Year Financial Report at June 30, 2020
Declaration of the Chief Executive Officer and the officer responsible for the preparation of the corporate financial documentation

Inte
rim
rep
ort
on o
per
atio
ns
Conden
sed inte
rim
conso
lidat
ed fi
nan
cial
sta
tem
ents
167
Declaration of the Chief Executive Officer and the officer responsible for the preparation of the corporate financial documentation regarding the condensed interim consolidated financial statements of the Enel Group at June 30, 2020, pursuant to the provisions of Article 154-bis, paragraph 5, of Legislative Decree 58 of February 24, 1998 and Article 81-ter of CONSOB Regulation 11971 of May 14, 1999
1. The undersigned Francesco Starace and Alberto De Paoli, in their respective capacities as Chief Executive Officer and offi-
cer responsible for the preparation of the financial reports of Enel SpA, hereby certify, taking account of the provisions of
Article 154-bis, paragraphs 3 and 4, of Legislative Decree 58 of February 24, 1998:
a. the appropriateness with respect to the characteristics of the Enel Group and
b. the effective adoption of the administrative and accounting procedures for the preparation of the condensed interim
consolidated financial statements of the Enel Group in the period between January 1, 2020 and June 30, 2020.
2. In this regard, we report that:
a. the appropriateness of the administrative and accounting procedures used in the preparation of the condensed interim
consolidated financial statements of the Enel Group has been verified in an assessment of the internal control system
for financial reporting. The assessment was carried out on the basis of the guidelines set out in the “Internal Controls –
Integrated Framework” issued by the Committee of Sponsoring Organizations of the Treadway Commission (COSO);
b. the assessment of the internal control system for financial reporting did not identify any material issues.
3. In addition, we certify that:
3.1 the condensed interim consolidated financial statements of the Enel Group at June 30, 2020:
a. have been prepared in compliance with the international accounting standards recognized in the European Union
pursuant to Regulation (EC) no. 1606/2002 of the European Parliament and of the Council of July 19, 2002;
b. correspond to the information in the books and other accounting records;
c. provide a true and fair representation of the performance and financial position of the issuer and the companies
included in the scope of consolidation;
3.2 the interim report on operations contains a reliable analysis of the major events that occurred during the first six
months of the year and their impact on the condensed interim consolidated financial statements, together with a
description of the main risks and uncertainties to be faced in the remaining six months of the year. The interim report
on operations also contains a reliable analysis of the information on significant transactions with related parties.
Rome, July 29, 2020
Francesco Starace Alberto De Paoli
Chief Executive Officer of Enel SpAOfficer responsible for the preparation
of the financial reports of Enel SpA

168 Half-Year Financial Report at June 30, 2020
ReportsKPMG S.p.A.Revisione e organizzazione contabileVia Ettore Petrolini, 200197 ROMA RMTelefono +39 06 80961.1Email [email protected] PEC [email protected]
KPMG S.p.A. è una società per azioni di diritto italiano e fa parte del network KPMG di entità indipendenti affiliate a KPMG International Cooperative (“KPMG International”), entità di diritto svizzero.
Ancona Aosta Bari Bergamo Bologna Bolzano BresciaCatania Como Firenze Genova Lecce Milano Napoli Novara Padova Palermo Parma Perugia Pescara Roma Torino Treviso Trieste Varese Verona
Società per azioniCapitale sociale Euro 10.415.500,00 i.v.Registro Imprese Milano eCodice Fiscale N. 00709600159 R.E.A. Milano N. 512867Partita IVA 00709600159VAT number IT00709600159Sede legale: Via Vittor Pisani, 25 20124 Milano MI ITALIA
(Translation from the Italian original which remains the definitive version)
Report on review of condensed interim consolidated financial statements
To the Shareholders of Enel S.p.A.
IntroductionWe have reviewed the accompanying condensed interim consolidated financial statements of the Enel Group comprising the income statement, statement of comprehensive income, balance sheet, statement of changes in shareholders’ equity, statement of cash flows and notes thereto, as at and for the six months ended 30 June 2020. The parent’s directors are responsible for the preparation of these condensed interim consolidated financial statements in accordance with the InternationalFinancial Reporting Standard applicable to interim financial reporting (IAS 34), endorsed by the European Union. Our responsibility is to express a conclusion on these condensed interim consolidated financial statements based on our review.
Scope of ReviewWe conducted our review in accordance with Consob (the Italian Commission for Listed Companies and the Stock Exchange) guidelines set out in Consob resolution no. 10867 dated 31 July 1997. A review of condensed interim consolidated financial statements consists of making inquiries, primarily of persons responsible for financial and accounting matters, applying analytical and other review procedures. A review is substantially less in scope than an audit conducted in accordance with International Standards on Auditing (ISA Italia) and, consequently, does not enable us to obtain assurance that we would become aware of all significant matters that might be identified in an audit. Accordingly, we do not express an audit opinion on the condensed interim consolidated financial statements.
ConclusionBased on our review, nothing has come to our attention that causes us to believe that the condensed interim consolidated financial statements of the Enel Group as at and for the six months ended 30 June 2020 have not been prepared, in all material respects, in accordance with the International Financial Reporting Standard applicable to interim financial reporting (IAS 34), endorsed by the European Union.

169
KPMG S.p.A.Revisione e organizzazione contabileVia Ettore Petrolini, 200197 ROMA RMTelefono +39 06 80961.1Email [email protected] PEC [email protected]
KPMG S.p.A. è una società per azioni di diritto italiano e fa parte del network KPMG di entità indipendenti affiliate a KPMG International Cooperative (“KPMG International”), entità di diritto svizzero.
Ancona Aosta Bari Bergamo Bologna Bolzano BresciaCatania Como Firenze Genova Lecce Milano Napoli Novara Padova Palermo Parma Perugia Pescara Roma Torino Treviso Trieste Varese Verona
Società per azioniCapitale sociale Euro 10.415.500,00 i.v.Registro Imprese Milano eCodice Fiscale N. 00709600159 R.E.A. Milano N. 512867Partita IVA 00709600159VAT number IT00709600159Sede legale: Via Vittor Pisani, 25 20124 Milano MI ITALIA
(Translation from the Italian original which remains the definitive version)
Report on review of condensed interim consolidated financial statements
To the Shareholders of Enel S.p.A.
IntroductionWe have reviewed the accompanying condensed interim consolidated financial statements of the Enel Group comprising the income statement, statement of comprehensive income, balance sheet, statement of changes in shareholders’ equity, statement of cash flows and notes thereto, as at and for the six months ended 30 June 2020. The parent’s directors are responsible for the preparation of these condensed interim consolidated financial statements in accordance with the InternationalFinancial Reporting Standard applicable to interim financial reporting (IAS 34), endorsed by the European Union. Our responsibility is to express a conclusion on these condensed interim consolidated financial statements based on our review.
Scope of ReviewWe conducted our review in accordance with Consob (the Italian Commission for Listed Companies and the Stock Exchange) guidelines set out in Consob resolution no. 10867 dated 31 July 1997. A review of condensed interim consolidated financial statements consists of making inquiries, primarily of persons responsible for financial and accounting matters, applying analytical and other review procedures. A review is substantially less in scope than an audit conducted in accordance with International Standards on Auditing (ISA Italia) and, consequently, does not enable us to obtain assurance that we would become aware of all significant matters that might be identified in an audit. Accordingly, we do not express an audit opinion on the condensed interim consolidated financial statements.
ConclusionBased on our review, nothing has come to our attention that causes us to believe that the condensed interim consolidated financial statements of the Enel Group as at and for the six months ended 30 June 2020 have not been prepared, in all material respects, in accordance with the International Financial Reporting Standard applicable to interim financial reporting (IAS 34), endorsed by the European Union.
Reports

170 Half-Year Financial Report at June 30, 2020
Enel GroupReport on review of condensed interim consolidated financial statements30 June 2020
2
Other MatterThe consolidated financial statements of the previous year and the condensed interim consolidated financial statements as at and for the six months ended 30 June 2019have been respectively audited and reviewed by another auditor who expressed an unmodified opinion on the consolidated financial statements and an unmodified conclusion on the condensed interim consolidated financial statements on 8 April 2020and on 2 August 2019, respectively.
Rome, 31 July 2020
KPMG S.p.A.
(signed on the original)
Renato NaschiDirector of Audit

171
Enel GroupReport on review of condensed interim consolidated financial statements30 June 2020
2
Other MatterThe consolidated financial statements of the previous year and the condensed interim consolidated financial statements as at and for the six months ended 30 June 2019have been respectively audited and reviewed by another auditor who expressed an unmodified opinion on the consolidated financial statements and an unmodified conclusion on the condensed interim consolidated financial statements on 8 April 2020and on 2 August 2019, respectively.
Rome, 31 July 2020
KPMG S.p.A.
(signed on the original)
Renato NaschiDirector of Audit
Reports

172 Half-Year Financial Report at June 30, 2020
Attachments
Subsidiaries, associates and other significant equity investments of the Enel Group at June 30, 2020In compliance with CONSOB Notice DEM/6064293 of July 28, 2006, a list of subsidiaries and associates of Enel SpA at June 30, 2020,
pursuant to Article 2359 of the Italian Civil Code, and of other significant equity investments is provided below. Enel has full title to
all investments.
The following information is included for each company: name, registered office, country, share capital, currency in which share
capital is denominated, activity, method of consolidation, Group companies that have a stake in the company and their respective
ownership share, and the Group’s ownership share.
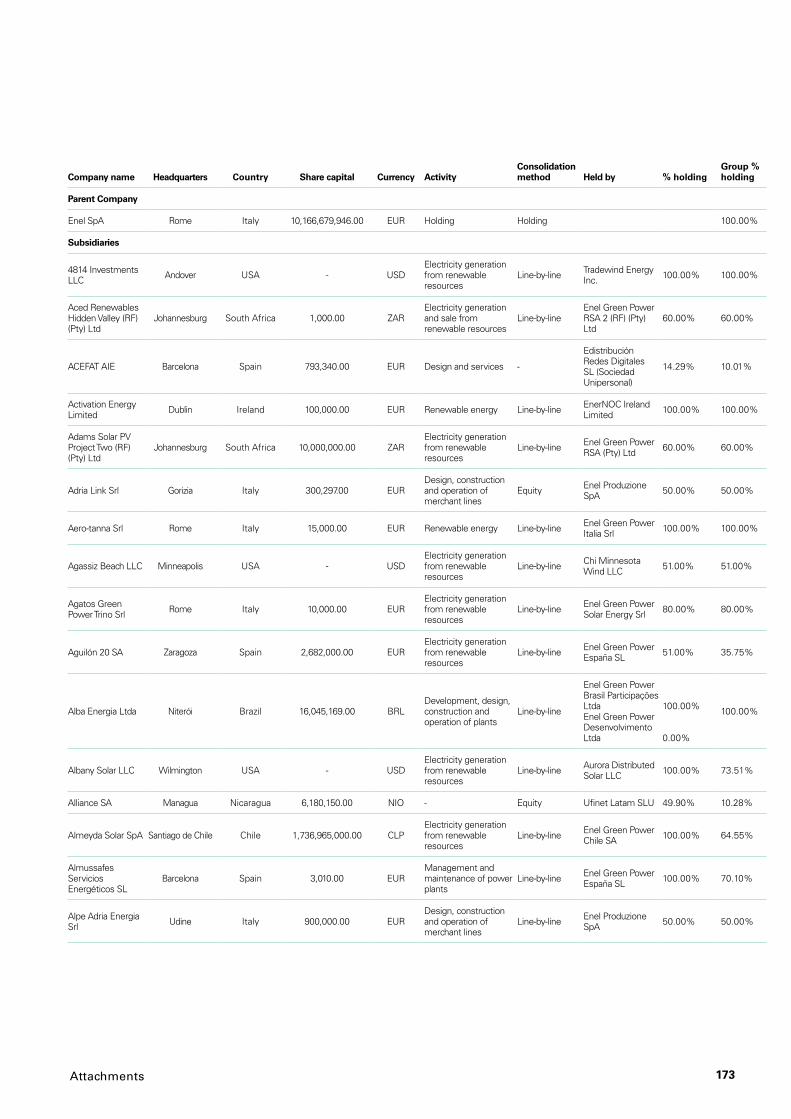
173Attachments
Company name Headquarters Country Share capital Currency ActivityConsolidation method Held by % holding
Group % holding
Parent Company
Enel SpA Rome Italy 10,166,679,946.00 EUR Holding Holding 100.00%
Subsidiaries
4814 Investments LLC Andover USA - USD
Electricity generation from renewable resources
Line-by-line Tradewind Energy Inc. 100.00% 100.00%
Aced Renewables Hidden Valley (RF) (Pty) Ltd
Johannesburg South Africa 1,000.00 ZARElectricity generation and sale from renewable resources
Line-by-lineEnel Green Power RSA 2 (RF) (Pty) Ltd
60.00% 60.00%
ACEFAT AIE Barcelona Spain 793,340.00 EUR Design and services -
Edistribución Redes Digitales SL (Sociedad Unipersonal)
14.29% 10.01%
Activation Energy Limited Dublin Ireland 100,000.00 EUR Renewable energy Line-by-line EnerNOC Ireland
Limited 100.00% 100.00%
Adams Solar PV Project Two (RF) (Pty) Ltd
Johannesburg South Africa 10,000,000.00 ZARElectricity generation from renewable resources
Line-by-line Enel Green Power RSA (Pty) Ltd 60.00% 60.00%
Adria Link Srl Gorizia Italy 300,297.00 EURDesign, construction and operation of merchant lines
Equity Enel Produzione SpA 50.00% 50.00%
Aero-tanna Srl Rome Italy 15,000.00 EUR Renewable energy Line-by-line Enel Green Power Italia Srl 100.00% 100.00%
Agassiz Beach LLC Minneapolis USA - USDElectricity generation from renewable resources
Line-by-line Chi Minnesota Wind LLC 51.00% 51.00%
Agatos Green Power Trino Srl Rome Italy 10,000.00 EUR
Electricity generation from renewable resources
Line-by-line Enel Green Power Solar Energy Srl 80.00% 80.00%
Aguilón 20 SA Zaragoza Spain 2,682,000.00 EURElectricity generation from renewable resources
Line-by-line Enel Green Power España SL 51.00% 35.75%
Alba Energia Ltda Niterói Brazil 16,045,169.00 BRLDevelopment, design, construction and operation of plants
Line-by-line
Enel Green Power Brasil Participações LtdaEnel Green Power Desenvolvimento Ltda
100.00%
0.00%
100.00%
Albany Solar LLC Wilmington USA - USDElectricity generation from renewable resources
Line-by-line Aurora Distributed Solar LLC 100.00% 73.51%
Alliance SA Managua Nicaragua 6,180,150.00 NIO - Equity Ufinet Latam SLU 49.90% 10.28%
Almeyda Solar SpA Santiago de Chile Chile 1,736,965,000.00 CLPElectricity generation from renewable resources
Line-by-line Enel Green Power Chile SA 100.00% 64.55%
Almussafes Servicios Energéticos SL
Barcelona Spain 3,010.00 EURManagement and maintenance of power plants
Line-by-line Enel Green Power España SL 100.00% 70.10%
Alpe Adria Energia Srl Udine Italy 900,000.00 EUR
Design, construction and operation of merchant lines
Line-by-line Enel Produzione SpA 50.00% 50.00%

174 Half-Year Financial Report at June 30, 2020
Company name Headquarters Country Share capital Currency ActivityConsolidation method Held by % holding
Group % holding
Alta Farms Wind Project II LLC Andover USA 1.00 USD
Electricity generation and sale from renewable resources
Line-by-line Tradewind Energy Inc. 100.00% 100.00%
Alvorada Energia SA Niterói Brazil 22,017,415.92 BRL Electricity generation
and sale Line-by-lineEnel Green Power Brasil Participações Ltda
100.00% 100.00%
Ampla Energia e Serviços SA Niterói Brazil 2,498,230,386.65 BRL
Electricity generation, transmission and distribution
Line-by-line Enel Brasil SA 99.73% 63.97%
Annandale Solar LLC Wilmington USA - USD
Electricity generation from renewable resources
Line-by-line Aurora Distributed Solar LLC 100.00% 73.51%
Apiacás Energia SA Niterói Brazil 14,216,846.33 BRL Electricity generation Line-by-lineEnel Green Power Brasil Participações Ltda
100.00% 100.00%
Aquilla Wind Project LLC Andover USA 1.00 USD
Electricity generation and sale from renewable resources
Line-by-line Tradewind Energy Inc. 100.00% 100.00%
Aragonesa de Actividades Energéticas SA
Teruel Spain 60,100.00 EUR Electricity generation Line-by-lineEndesa Red SA (Sociedad Unipersonal)
100.00% 70.10%
Aranort Desarrollos SL Madrid Spain 3,010.00 EUR Wind plants Line-by-line Enel Green Power
España SL 100.00% 70.10%
Asociación Nuclear Ascó-Vandellós II AIE
Tarragona Spain 19,232,400.00 EURManagement and maintenance of power plants
Proportional Endesa Generación SA 85.41% 59.87%
Athonet France SASU Paris France 50,000.00 EUR ICT - Athonet Srl 100.00% 16.00%
Athonet Srl Trieste Italy 6,892,757.00 EUR - - Enel X Srl 16.00% 16.00%
Athonet UK Ltd Battle, East Sussex United Kingdom 1.00 GBP Telecommunications - Athonet Srl 100.00% 16.00%
Athonet USA Inc. Wilmington USA 1.00 USD Any legal activity - Athonet Srl 100.00% 16.00%
Atwater Solar LLC Wilmington USA - USDElectricity generation from renewable resources
Line-by-line Aurora Distributed Solar LLC 100.00% 73.51%
Aurora Distributed Solar LLC Wilmington USA - USD
Electricity generation from renewable resources
Line-by-line Aurora Solar Holdings LLC 73.51% 73.51%
Aurora Land Holdings LLC Wilmington USA - USD
Electricity generation from renewable resources
Line-by-line Enel Kansas LLC 100.00% 100.00%
Aurora Solar Holdings LLC Wilmington USA - USD
Electricity generation from renewable resources
Line-by-line Enel Kansas LLC 100.00% 100.00%
Aurora Wind Holdings LLC Andover USA - USD
Electricity generation from renewable resources
Line-by-line Enel Kansas LLC 100.00% 100.00%
Aurora Wind Project LLC Andover USA 1.00 USD
Electricity generation and sale from renewable resources
Line-by-line Tradewind Energy Inc. 100.00% 100.00%
Autumn Hills LLC Wilmington USA - USDElectricity generation from renewable resources
Line-by-line Chi Minnesota Wind LLC 51.00% 51.00%

175Attachments
Company name Headquarters Country Share capital Currency ActivityConsolidation method Held by % holding
Group % holding
Avikiran Energy India Private Limited
Gurugram India 100,000.00 INRElectricity generation and sale from renewable resources
Line-by-line
Enel Green Power India Private Limited (formerly BLP Energy Private Limited)
100.00% 100.00%
Avikiran Solar India Private Limited New Delhi India 100,000.00 INR
Electricity generation from renewable resources
Line-by-line
Enel Green Power India Private Limited (formerly BLP Energy Private Limited)
100.00% 100.00%
Avikiran Surya India Private Limited Gurugram India 100,000.00 INR
Electricity generation and sale from renewable resources
Line-by-line
Enel Green Power India Private Limited (formerly BLP Energy Private Limited)
100.00% 100.00%
Avikiran Vayu India Private Limited Gurugram India 100,000.00 INR Electricity generation,
distribution and sale Line-by-line
Enel Green Power India Private Limited (formerly BLP Energy Private Limited)
100.00% 100.00%
Azure Sky Solar Project LLC Andover USA 1.00 USD
Electricity generation and sale from renewable resources
Line-by-line Tradewind Energy Inc. 100.00% 100.00%
Azure Sky Wind Holdings LLC Andover USA - USD
Electricity generation from renewable resources
Line-by-line Enel Kansas LLC 100.00% 100.00%
Azure Sky Wind Project LLC Andover USA 1.00 USD
Electricity generation and sale from renewable resources
Line-by-line Tradewind Energy Inc. 100.00% 100.00%
Azure Sky Wind Storage LLC Andover USA - USD
Electricity generation from renewable resources
Line-by-line Enel Kansas LLC 100.00% 100.00%
Baikal Enterprise SL Palma de Mallorca Spain 3,006.00 EUR
Electricity generation and sale from renewable resources
Line-by-line Enel Green Power España SL 100.00% 70.10%
Baleares Energy SL Palma de Mallorca Spain 4,509.00 EUR
Electricity generation and sale from renewable resources
Line-by-line Enel Green Power España SL 100.00% 70.10%
Barnwell County Solar Project LLC Andover USA - USD
Electricity generation from renewable resources
Line-by-line Tradewind Energy Inc. 100.00% 100.00%
Baylio Solar SLU Seville Spain 3,000.00 EURElectricity generation from renewable resources
Line-by-line Enel Green Power España SL 100.00% 70.10%
Beaver Falls Water Power Company Wilmington USA - USD
Electricity generation from renewable resources
Line-by-line Beaver Valley Holdings LLC 67.50% 67.50%
Beaver Valley Holdings LLC Wilmington USA - USD
Electricity generation from renewable resources
Line-by-line Enel Green Power North America Inc. 100.00% 100.00%
Belomechetskaya WPS Moscow Russian
Federation 3,010,000.00 RUB Renewable energy Line-by-lineEnel Green Power Rus Limited Liability Company
100.00% 100.00%
Bioenergy Casei Gerola Srl Rome Italy 100,000.00 EUR
Electricity generation from renewable resources
Line-by-line Enel Green Power Italia Srl 100.00% 100.00%
Bison Meadows Wind Project LLC Andover USA - USD
Electricity generation from renewable resources
Line-by-line Enel Kansas LLC 100.00% 100.00%

176 Half-Year Financial Report at June 30, 2020
Company name Headquarters Country Share capital Currency ActivityConsolidation method Held by % holding
Group % holding
Blue Star Wind Project LLC Andover USA 1.00 USD
Electricity generation and sale from renewable resources
Line-by-line Tradewind Energy Inc. 100.00% 100.00%
BluRe M.A. Manternach Luxembourg 6,400,000.00 EUR Insurance - Slovenské elektrárne AS 5.00% 1.65%
Bogaris PV1 SLU Seville Spain 3,000.00 EUR Photovoltaic plants Line-by-line Enel Green Power España SL 100.00% 70.10%
Boiro Energía SA Boiro Spain 601,010.00 EURElectricity generation from renewable resources
Equity Enel Green Power España SL 40.00% 28.04%
Bondia Energia Ltda Niterói Brazil 2,950,888.00 BRL
Development, design, construction and operation of plants
Line-by-line
Enel Green Power Brasil Participações LtdaEnel Green Power Desenvolvimento Ltda
100.00%
0.00%
100.00%
Bosa del Ebro SL Zaragoza Spain 3,010.00 EURElectricity generation from renewable resources
Line-by-line Enel Green Power España SL 51.00% 35.75%
Bottom Grass Solar Project LLC Andover USA - USD
Electricity generation from renewable resources
Line-by-line Enel Kansas LLC 100.00% 100.00%
Boujdour Wind Farm Casablanca Morocco 300,000.00 MAD
Development, design, construction and operation of plants
EquityNareva Enel Green Power Morocco SA
90.00% 45.00%
Bp Hydro Associates Boise USA - USD
Electricity generation from renewable resources
AFSChi Idaho LLCEnel Green Power North America Inc.
68.00%
32.00%100.00%
Bp Hydro Finance Partnership Salt Lake City USA - USD
Electricity generation from renewable resources
Line-by-line
Bp Hydro AssociatesEnel Green Power North America Inc.
75.92%
24.08%100.00%
Bravo Dome Wind Project LLC Andover USA 1.00 USD
Electricity generation and sale from renewable resources
Line-by-line Tradewind Energy Inc. 100.00% 100.00%
Brazoria County Solar Project LLC Andover USA - USD
Electricity generation from renewable resources
Line-by-line Tradewind Energy Inc. 100.00% 100.00%
Brazoria West Solar Project LLC Andover USA - USD
Electricity generation, transportation, sale and trading
Line-by-line Tradewind Energy Inc. 100.00% 100.00%
Brazos Flat Solar Project LLC Andover USA - USD
Electricity generation from renewable resources
Line-by-line Enel Kansas LLC 100.00% 100.00%
Broadband Comunicaciones SA
Quito Ecuador 30,290.00 USD - EquityUfinet Ecuador Ufiec SAUfinet Latam SLU
99.99%0.01%
20.60%
Buffalo Dunes Wind Project LLC Topeka USA - USD
Electricity generation from renewable resources
Line-by-lineEGPNA Development Holdings LLC
75.00% 75.00%
Buffalo Jump LP Alberta Canada 10.00 CAD Holding Line-by-line
Enel Alberta Wind Inc.Enel Green Power Canada Inc.
0.10%
99.90%100.00%
Buffalo Spirit Wind Project LLC Andover USA 1.00 USD
Electricity generation and sale from renewable resources
Line-by-line Tradewind Energy Inc. 100.00% 100.00%
Bungala One Finco (Pty) Ltd Sydney Australia 1,000.00 AUD
Electricity generation from renewable resources
Equity Bungala One Property (Pty) Ltd 100.00% 51.00%

177Attachments
Company name Headquarters Country Share capital Currency ActivityConsolidation method Held by % holding
Group % holding
Bungala One Operation Holding Trust
Sydney Australia 100.00 AUD Renewable energy Equity Enel Green Power Bungala (Pty) Ltd 50.00% 50.00%
Bungala One Operations Holding (Pty) Ltd
Sydney Australia 100.00 AUDElectricity generation from renewable resources
Equity Enel Green Power Bungala (Pty) Ltd 51.00% 51.00%
Bungala One Operations (Pty) Ltd
Sydney Australia 1,000.00 AUDElectricity generation from renewable resources
EquityBungala One Operations Holding (Pty) Ltd
100.00% 51.00%
Bungala One Operations Trust Sydney Australia - AUD Renewable energy Equity
Bungala One Operations Holding (Pty) Ltd
100.00% 51.00%
Bungala One Property (Pty) Ltd Sydney Australia 1,000.00 AUD
Electricity generation from renewable resources
EquityBungala One Property Holding (Pty) Ltd
100.00% 51.00%
Bungala One Property Holding (Pty) Ltd
Sydney Australia 100.00 AUDElectricity generation from renewable resources
Equity Enel Green Power Bungala (Pty) Ltd 51.00% 51.00%
Bungala One Property Holding Trust
Sydney Australia 100.00 AUDElectricity generation from renewable resources
Equity Enel Green Power Bungala (Pty) Ltd 50.00% 50.00%
Bungala One Property Trust Sydney Australia - AUD
Electricity generation from renewable resources
EquityBungala One Property Holding (Pty) Ltd
100.00% 51.00%
Bungala Two Finco (Pty) Ltd Sydney Australia - AUD
Electricity generation from renewable resources
Equity Bungala Two Property (Pty) Ltd 100.00% 51.00%
Bungala Two Operations Holding (Pty) Ltd
Sydney Australia - AUDElectricity generation from renewable resources
Equity Enel Green Power Bungala (Pty) Ltd 51.00% 51.00%
Bungala Two Operations Holding Trust
Sydney Australia - AUD Renewable energy Equity Enel Green Power Bungala (Pty) Ltd 50.00% 50.00%
Bungala Two Operations (Pty) Ltd
Sydney Australia - AUD Renewable energy EquityBungala Two Operations Holding (Pty) Ltd
100.00% 51.00%
Bungala Two Operations Trust Sydney Australia - AUD Renewable energy Equity
Bungala Two Operations Holding (Pty) Ltd
100.00% 51.00%
Bungala Two Property Holding (Pty) Ltd
Sydney Australia - AUDElectricity generation from renewable resources
Equity Enel Green Power Bungala (Pty) Ltd 51.00% 51.00%
Bungala Two Property Holding Trust
Sydney Australia - AUD Renewable energy Equity Enel Green Power Bungala (Pty) Ltd 50.00% 50.00%
Bungala Two Property (Pty) Ltd Sydney Australia - AUD Renewable energy Equity
Bungala Two Property Holding (Pty) Ltd
100.00% 51.00%
Bungala Two Property Trust Sydney Australia 1.00 AUD Renewable energy Equity
Bungala Two Property Holding (Pty) Ltd
100.00% 51.00%
Business Venture Investments 1468 (Pty) Ltd
Johannesburg South Africa 100.00 ZARElectricity generation from renewable resources
Line-by-line Enel Green Power RSA (Pty) Ltd 100.00% 100.00%
Butterfly Meadows Solar Project LLC Andover USA - USD
Electricity generation from renewable resources
Line-by-line Enel Kansas LLC 100.00% 100.00%
C&C Castelvetere Srl Rome Italy 100,000.00 EUR
Electricity generation from renewable resources
Line-by-line Enel Green Power Italia Srl 100.00% 100.00%

178 Half-Year Financial Report at June 30, 2020
Company name Headquarters Country Share capital Currency ActivityConsolidation method Held by % holding
Group % holding
C&C Uno Energy Srl Rome Italy 118,000.00 EUR
Electricity generation from renewable resources
Line-by-line Enel Green Power Italia Srl 100.00% 100.00%
Canastota Wind Power LLC Andover USA - USD
Electricity generation from renewable resources
Line-by-line Fenner Wind Holdings LLC 100.00% 100.00%
Caney River Wind Project LLC Overland Park USA - USD
Electricity generation from renewable resources
Equity Rocky Caney Wind LLC 100.00% 20.00%
Carbopego - Abastecimientos e Combustíveis SA
Lisbon Portugal 50,000.00 EUR Fuel supply Equity
Endesa Generación Portugal SAEndesa Generación SA
0.01%
49.99%
35.05%
Cascade Energy Storage LLC Wilmington USA - USD Renewable energy Line-by-line
Enel Energy Storage Holdings LLC (formerly EGP Energy Storage Holdings LLC)
100.00% 100.00%
Castiblanco Solar SL Madrid Spain 3,000.00 EUR Photovoltaic Line-by-line Enel Green Power
España SL 100.00% 70.10%
Castle Rock Ridge Limited Partnership Alberta Canada - CAD
Electricity generation from renewable resources
Line-by-line
Enel Alberta Wind Inc.Enel Green Power Canada Inc.
0.10%
99.90%100.00%
Catalana d’Iniciatives SCR SA
Barcelona Spain 30,862,800.00 EUR Holding -Endesa Red SA (Sociedad Unipersonal)
0.94% 0.66%
Ccp.Ro Bucharest SA Bucharest Romania 79,800,000.00 RON Finance company - Enel Romania SA 9.52% 9.52%
Cdec - Sic Ltda Santiago de Chile Chile 709,783,206.00 CLP - - Empresa Eléctrica Panguipulli SA 6.00% 3.87%
Cedar Run Wind Project LLC Andover USA 1.00 USD
Electricity generation and sale from renewable resources
Line-by-line Tradewind Energy Inc. 100.00% 100.00%
Celg Distribuição SA - Celg D Goiás Brazil 5,075,679,362.52 BRL Electricity distribution
and sale Line-by-line Enel Brasil SA 99.96% 64.12%
Central Dock Sud SA Buenos Aires Argentina 1,231,270,567.54 ARS
Electricity generation, transmission and distribution
Line-by-lineEnel Argentina SAInversora Dock Sud SA
0.25%
69.99%25.82%
Central Geradora Fotovoltaica Bom Nome Ltda
Salvador Brazil 4,859,739.00 BRLElectricity generation and sale from renewable resources
Line-by-line
Enel Green Power Brasil Participações LtdaEnel Green Power Desenvolvimento Ltda
100.00%
0.00%
100.00%
Central Geradora Fotovoltaica São Francisco Ltda
Niterói Brazil 11,687,672.00 BRL Energy services Line-by-line Enel Brasil SAEnel X Brasil SA
0.00%100.00% 64.14%
Central Geradora Termelétrica Fortaleza SA
Fortaleza Brazil 151,935,779.00 BRL Thermal generation plants Line-by-line Enel Brasil SA 100.00% 64.14%
Central Hidráulica Güejar-Sierra SL Seville Spain 364,213.34 EUR Plant operation Equity Enel Green Power
España SL 33.30% 23.34%
Central Térmica de Anllares AIE Madrid Spain 595,000.00 EUR Plant operation Equity Endesa
Generación SA 33.33% 23.36%
Central Vuelta de Obligado SA Buenos Aires Argentina 500,000.00 ARS Electrical facilities
construction Equity
Central Dock Sud SAEnel Generación Costanera SAEnel Generación El Chocón SA
6.40%
1.30%
33.20%
16.28%

179Attachments
Company name Headquarters Country Share capital Currency ActivityConsolidation method Held by % holding
Group % holding
Centrales Nucleares Almaraz-Trillo AIE
Madrid Spain - EUR Plant operation EquityEndesa Generación SANuclenor SA
23.57%0.69%
16.76%
Centrum Pre Vedu A Vyskum SRO Kalná Nad Hronom Slovakia 6,639.00 EUR
Research and development in sciences and engineering
Equity Slovenské elektrárne AS 100.00% 33.00%
CESI - Centro Elettrotecnico Sperimentale Italiano Giacinto Motta SpA
Milan Italy 8,550,000.00 EUR
Testing, inspection and certification services, engineering and consulting services
Equity Enel SpA 42.70% 42.70%
Champagne Storage LLC Wilmington USA 1.00 USD
Electricity generation from renewable resources
Line-by-line
Enel Energy Storage Holdings LLC (formerly EGP Energy Storage Holdings LLC)
100.00% 100.00%
Cherokee Falls Hydroelectric Project LLC
Wilmington USA - USDElectricity generation from renewable resources
AFS Enel Green Power North America Inc. 100.00% 100.00%
Cheyenne Ridge Wind Project LLC Andover USA 1.00 USD
Electricity generation and sale from renewable resources
Line-by-line Tradewind Energy Inc. 100.00% 100.00%
Chi Black River LLC Wilmington USA - USDElectricity generation from renewable resources
Line-by-line Enel Green Power North America Inc. 100.00% 100.00%
Chi Idaho LLC Wilmington USA - USDElectricity generation from renewable resources
Line-by-line Enel Green Power North America Inc. 100.00% 100.00%
Chi Minnesota Wind LLC Wilmington USA - USD
Electricity generation from renewable resources
Line-by-line Enel Green Power North America Inc. 100.00% 100.00%
Chi Operations Inc. Andover USA 100.00 USDElectricity generation from renewable resources
Line-by-line Enel Green Power North America Inc. 100.00% 100.00%
Chi Power Inc. Naples USA 100.00 USDElectricity generation from renewable resources
Line-by-line Enel Green Power North America Inc. 100.00% 100.00%
Chi Power Marketing Inc. Wilmington USA 100.00 USD
Electricity generation from renewable resources
Line-by-line Enel Green Power North America Inc. 100.00% 100.00%
Chi West LLC San Francisco USA 100.00 USDElectricity generation from renewable resources
Line-by-line Enel Green Power North America Inc. 100.00% 100.00%
Chinango SAC San Miguel Peru 295,249,298.00 SOLElectricity generation and sale from renewable resources
Line-by-line Enel Generación Perú SAA 80.00% 42.90%
Chisago Solar LLC Wilmington USA - USDElectricity generation from renewable resources
Line-by-line Aurora Distributed Solar LLC 100.00% 73.51%
Chisholm View II Holding LLC Wilmington USA - USD
Electricity generation from renewable resources
Line-by-line Enel Kansas LLC 100.00% 100.00%
Chisholm View Wind Project II LLC Wilmington USA - USD
Electricity generation from renewable resources
Line-by-line Chisholm View II Holding LLC 62.79% 62.79%
Chisholm View Wind Project LLC New York USA - USD
Electricity generation from renewable resources
Equity EGPNA REP Wind Holdings LLC 100.00% 20.00%
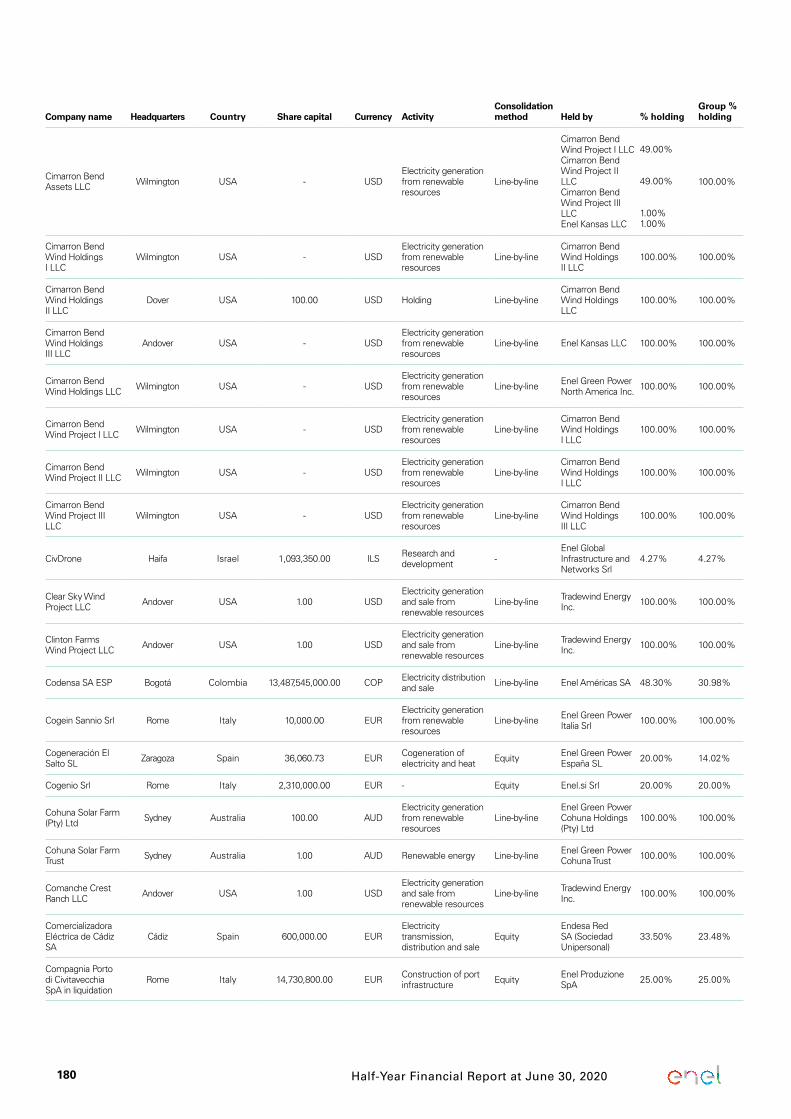
180 Half-Year Financial Report at June 30, 2020
Company name Headquarters Country Share capital Currency ActivityConsolidation method Held by % holding
Group % holding
Cimarron Bend Assets LLC Wilmington USA - USD
Electricity generation from renewable resources
Line-by-line
Cimarron Bend Wind Project I LLCCimarron Bend Wind Project II LLCCimarron Bend Wind Project III LLCEnel Kansas LLC
49.00%
49.00%
1.00%1.00%
100.00%
Cimarron Bend Wind Holdings I LLC
Wilmington USA - USDElectricity generation from renewable resources
Line-by-lineCimarron Bend Wind Holdings II LLC
100.00% 100.00%
Cimarron Bend Wind Holdings II LLC
Dover USA 100.00 USD Holding Line-by-lineCimarron Bend Wind Holdings LLC
100.00% 100.00%
Cimarron Bend Wind Holdings III LLC
Andover USA - USDElectricity generation from renewable resources
Line-by-line Enel Kansas LLC 100.00% 100.00%
Cimarron Bend Wind Holdings LLC Wilmington USA - USD
Electricity generation from renewable resources
Line-by-line Enel Green Power North America Inc. 100.00% 100.00%
Cimarron Bend Wind Project I LLC Wilmington USA - USD
Electricity generation from renewable resources
Line-by-lineCimarron Bend Wind Holdings I LLC
100.00% 100.00%
Cimarron Bend Wind Project II LLC Wilmington USA - USD
Electricity generation from renewable resources
Line-by-lineCimarron Bend Wind Holdings I LLC
100.00% 100.00%
Cimarron Bend Wind Project III LLC
Wilmington USA - USDElectricity generation from renewable resources
Line-by-lineCimarron Bend Wind Holdings III LLC
100.00% 100.00%
CivDrone Haifa Israel 1,093,350.00 ILS Research and development -
Enel Global Infrastructure and Networks Srl
4.27% 4.27%
Clear Sky Wind Project LLC Andover USA 1.00 USD
Electricity generation and sale from renewable resources
Line-by-line Tradewind Energy Inc. 100.00% 100.00%
Clinton Farms Wind Project LLC Andover USA 1.00 USD
Electricity generation and sale from renewable resources
Line-by-line Tradewind Energy Inc. 100.00% 100.00%
Codensa SA ESP Bogotá Colombia 13,487,545,000.00 COP Electricity distribution and sale Line-by-line Enel Américas SA 48.30% 30.98%
Cogein Sannio Srl Rome Italy 10,000.00 EURElectricity generation from renewable resources
Line-by-line Enel Green Power Italia Srl 100.00% 100.00%
Cogeneración El Salto SL Zaragoza Spain 36,060.73 EUR Cogeneration of
electricity and heat Equity Enel Green Power España SL 20.00% 14.02%
Cogenio Srl Rome Italy 2,310,000.00 EUR - Equity Enel.si Srl 20.00% 20.00%
Cohuna Solar Farm (Pty) Ltd Sydney Australia 100.00 AUD
Electricity generation from renewable resources
Line-by-lineEnel Green Power Cohuna Holdings (Pty) Ltd
100.00% 100.00%
Cohuna Solar Farm Trust Sydney Australia 1.00 AUD Renewable energy Line-by-line Enel Green Power
Cohuna Trust 100.00% 100.00%
Comanche Crest Ranch LLC Andover USA 1.00 USD
Electricity generation and sale from renewable resources
Line-by-line Tradewind Energy Inc. 100.00% 100.00%
Comercializadora Eléctrica de Cádiz SA
Cádiz Spain 600,000.00 EURElectricity transmission, distribution and sale
EquityEndesa Red SA (Sociedad Unipersonal)
33.50% 23.48%
Compagnia Porto di Civitavecchia SpA in liquidation
Rome Italy 14,730,800.00 EUR Construction of port infrastructure Equity Enel Produzione
SpA 25.00% 25.00%

181Attachments
Company name Headquarters Country Share capital Currency ActivityConsolidation method Held by % holding
Group % holding
Companhia Energética do Ceará - Coelce
Fortaleza Brazil 892,246,885.77 BRL Electricity distribution Line-by-line Enel Brasil SA 74.05% 47.50%
Compañía de Transmisión del Mercosur Ltda - CTM
Buenos Aires Argentina 14,012,000.00 ARSElectricity generation, transmission and distribution
Line-by-line Enel CIEN SAEnel SpA
100.00%0.00% 64.15%
Compañía Energética Veracruz SAC
San Miguel Peru 2,886,000.00 SOL Hydroelectric projects Line-by-line Enel Perú SAC 100.00% 64.14%
Compañía Eólica Tierras Altas SA Soria Spain 13,222,000.00 EUR Wind plants Equity
Compañía Eólica Tierras Altas SAEnel Green Power España SL
5.00%
35.63%
26.29%
Concert Srl Rome Italy 10,000.00 EUR Product, plant and equipment certification Line-by-line
Enel Global Thermal Generation Srl
100.00% 100.00%
Coneross Power Corporation Inc. Greenville USA 110,000.00 USD
Electricity generation from renewable resources
AFS Enel Green Power North America Inc. 100.00% 100.00%
CONSEL - Consorzio ELIS per la formazione professionale superiore
Rome Italy 51,000.00 EUR Training Equity OpEn Fiber SpA 1.00% 0.50%
Consolidated Hydro New Hampshire LLC
Wilmington USA - USDElectricity generation from renewable resources
Line-by-line Enel Green Power North America Inc. 100.00% 100.00%
Consolidated Hydro Southeast LLC
Wilmington USA - USDElectricity generation from renewable resources
Line-by-line Enel Green Power North America Inc. 100.00% 100.00%
Consolidated Pumped Storage Inc.
Wilmington USA 550,000.00 USDElectricity generation from renewable resources
Line-by-line Enel Green Power North America Inc. 81.83% 81.83%
Consorzio Civita in liquidation Rome Italy 156,000.00 EUR - - Enel SpA 33.30% 33.30%
Conza Green Energy Srl Rome Italy 73,000.00 EUR
Electricity generation from renewable resources
Line-by-line Enel Green Power Italia Srl 100.00% 100.00%
Copper Landing Solar Project LLC Andover USA - USD
Electricity generation from renewable resources
Line-by-line Enel Kansas LLC 100.00% 100.00%
Corporación Empresarial de Extremadura SA
Badajoz Spain 44,538,000.00 EUR Regional development - Endesa SA 1.01% 0.71%
Corporación Eólica de Zaragoza SL
La Puebla de Alfindén Spain 271,652.00 EUR
Electricity generation from renewable resources
Equity Enel Green Power España SL 25.00% 17.53%
Cow Creek Wind Project LLC Andover USA 1.00 USD
Electricity generation and sale from renewable resources
Line-by-line Tradewind Energy Inc. 100.00% 100.00%
Danax Energy (Pty) Ltd Sandton South Africa 100.00 ZAR
Electricity generation from renewable resources
Line-by-line Enel Green Power RSA (Pty) Ltd 100.00% 100.00%
De Rock Int’l Srl Bucharest Romania 5,629,000.00 RONElectricity generation from renewable resources
Line-by-line
Enel Green Power Romania SrlEnel Green Power SpA
100.00%
0.00%
100.00%
Dehesa de los Guadalupes Solar SLU
Seville Spain 3,000.00 EURElectricity generation from renewable resources
Line-by-line Enel Green Power España SL 100.00% 70.10%
Dehesa PV Farm 03 SLU Madrid Spain 3,000.00 EUR Photovoltaic systems Line-by-line Enel Green Power
España SL 100.00% 70.10%

182 Half-Year Financial Report at June 30, 2020
Company name Headquarters Country Share capital Currency ActivityConsolidation method Held by % holding
Group % holding
Dehesa PV Farm 04 SLU Madrid Spain 3,000.00 EUR Photovoltaic plants Line-by-line Enel Green Power
España SL 100.00% 70.10%
Depuración Destilación Reciclaje SL
Boiro Spain 600,000.00 EURElectricity generation from renewable resources
Equity Enel Green Power España SL 40.00% 28.04%
Derivex SA Bogotá Colombia 715,292,000.00 COP Finance company - Emgesa SA ESP 5.00% 1.55%
Desarrollo de Fuerzas Renovables S de RL de Cv
Mexico City Mexico 33,101,350.00 MXNElectricity generation from renewable resources
Line-by-line
Enel Green Power México S de RL de CvEnergía Nueva Energía Limpia Mexico S de RL de Cv
99.99%
0.01%
100.00%
Di.T.N.E. - Distretto Tecnologico Nazionale sull’Energia Società Consortile a Responsabilità Limitata
Rome Italy 398,321.50 EUR
Research and development in natural sciences and engineering
- Enel Produzione SpA 1.89% 1.89%
Diamond Vista Holdings LLC Wilmington USA 1.00 USD Holding Line-by-line Enel Kansas LLC 100.00% 100.00%
Distribuidora de Energía Eléctrica del Bages SA
Barcelona Spain 108,240.00 EUR Electricity distribution and sale Line-by-line
Endesa Red SA (Sociedad Unipersonal)Hidroeléctrica de Catalunya SL
55.00%
45.00%
70.10%
Distribuidora Eléctrica del Puerto de La Cruz SA
Santa Cruz de Tenerife Spain 12,621,210.00 EUR
Electricity purchase, transmission and distribution
Line-by-lineEndesa Red SA (Sociedad Unipersonal)
100.00% 70.10%
Distrilec Inversora SA Buenos Aires Argentina 497,612,021.00 ARS Holding Line-by-line Enel Américas SA 51.50% 33.03%
Dmd Holding AS in liquidation Trenčín-Zlatovce Slovakia 199,543,284.87 EUR Electricity generation - Slovenské
elektrárne AS 2.94% 0.97%
Dodge Center Distributed Solar LLC
Wilmington USA - USDElectricity generation from renewable resources
Line-by-line Aurora Distributed Solar LLC 100.00% 73.51%
Dolores Wind SA de Cv Mexico City Mexico 200.00 MXN
Electricity generation from renewable resources
Line-by-line
Enel Rinnovabile SA de CvHidroelectricidad del Pacífico S de RL de Cv
99.00%
1.00%
100.00%
Dominica Energía Limpia SA de Cv Mexico City Mexico 2,070,600,646.00 MXN
Electricity generation from renewable resources
Equity
Tenedora de Energía Renovable Sol y Viento SAPI de Cv
60.80% 20.00%
Dorset Ridge Wind Project LLC Andover USA 1.00 USD
Electricity generation and sale from renewable resources
Line-by-line Tradewind Energy Inc. 100.00% 100.00%
Dover Solar I LLC Andover USA - USDElectricity generation from renewable resources
Line-by-line Tradewind Energy Inc. 100.00% 100.00%
Drift Sand Wind Holdings LLC Wilmington USA - USD
Electricity generation from renewable resources
Equity Enel Kansas LLC 50.00% 50.00%
Drift Sand Wind Project LLC Wilmington USA - USD
Electricity generation from renewable resources
Equity Drift Sand Wind Holdings LLC 100.00% 50.00%
Dwarka Vayu 1 Private Limited Gurgaon India 100,000.00 INR
Electricity generation from renewable resources
Line-by-line
Enel Green Power India Private Limited (formerly BLP Energy Private Limited)
100.00% 100.00%
E.S.CO. Comuni Srl Bergamo Italy 1,000,000.00 EUR Electricity generation Line-by-line YouSave SpA 60.00% 60.00%

183Attachments
Company name Headquarters Country Share capital Currency ActivityConsolidation method Held by % holding
Group % holding
Eastwood Solar LLC Wilmington USA - USD
Electricity generation from renewable resources
Line-by-line Aurora Distributed Solar LLC 100.00% 73.51%
Edistribución Redes Digitales SL (Sociedad Unipersonal)
Madrid Spain 1,204,540,060.00 EUR Electricity distribution Line-by-lineEndesa Red SA (Sociedad Unipersonal)
100.00% 70.10%
E-Distribučie Banat SA Timisoara Romania 382,158,580.00 RON Electricity distribution Line-by-line Enel SpA 51.00% 51.00%
E-Distribučie Dobrogea SA Constanča Romania 280,285,560.00 RON Electricity distribution Line-by-line Enel SpA 51.00% 51.00%
E-Distribučie Muntenia SA Bucharest Romania 271,635,250.00 RON Electricity distribution Line-by-line Enel SpA 78.00% 78.00%
e-distribuzione SpA Rome Italy 2,600,000,000.00 EUR Electricity distribution Line-by-line Enel Italia SpA 100.00% 100.00%
EF Divesture LLC Andover USA 1.00 USDElectricity generation and sale from renewable resources
Line-by-line Tradewind Energy Inc. 100.00% 100.00%
Efficientya Srl Bergamo Italy 100,000.00 EUR
Testing, inspection and certification services, engineering and consulting services
Equity YouSave SpA 50.00% 50.00%
EGP Australia (Pty) Ltd Sydney Australia 10,000.00 AUD Holding. Energy
services Line-by-line Enel Green Power Australia (Pty) Ltd 100.00% 100.00%
EGP BioEnergy Srl Rome Italy 1,000,000.00 EURElectricity generation from renewable resources
Line-by-line Enel Green Power Puglia Srl 100.00% 100.00%
EGP Geronimo Holding Company Inc.
Wilmington USA 1,000.00 USD Holding Line-by-line Enel Green Power North America Inc. 100.00% 100.00%
EGP HoldCo 1 LLC Andover USA - USDElectricity generation from renewable resources
Line-by-line Enel Kansas LLC 100.00% 100.00%
EGP HoldCo 10 LLC Andover USA - USD Holding. Electricity
generation Line-by-line Enel Kansas LLC 100.00% 100.00%
EGP HoldCo 11 LLC Andover USA - USD Holding. Electricity
generation Line-by-line Enel Kansas LLC 100.00% 100.00%
EGP HoldCo 12 LLC Andover USA - USD Holding. Electricity
generation Line-by-line Enel Kansas LLC 100.00% 100.00%
EGP HoldCo 13 LLC Andover USA - USD Holding. Electricity
generation Line-by-line Enel Kansas LLC 100.00% 100.00%
EGP HoldCo 14 LLC Andover USA - USD Holding. Electricity
generation Line-by-line Enel Kansas LLC 100.00% 100.00%
EGP HoldCo 15 LLC Andover USA - USD Holding. Electricity
generation Line-by-line Enel Kansas LLC 100.00% 100.00%
EGP HoldCo 16 LLC Andover USA - USD Holding. Electricity
generation Line-by-line Enel Kansas LLC 100.00% 100.00%
EGP HoldCo 17 LLC Andover USA - USD Holding. Electricity
generation Line-by-line Enel Kansas LLC 100.00% 100.00%
EGP HoldCo 18 LLC Andover USA - USD Holding. Electricity
generation Line-by-line Enel Kansas LLC 100.00% 100.00%
EGP HoldCo 2 LLC Andover USA - USD Holding. Electricity generation Line-by-line Enel Kansas LLC 100.00% 100.00%
EGP HoldCo 3 LLC Andover USA - USD Holding. Electricity generation Line-by-line Enel Kansas LLC 100.00% 100.00%
EGP HoldCo 4 LLC Andover USA - USD Holding. Electricity generation Line-by-line Enel Kansas LLC 100.00% 100.00%
EGP HoldCo 5 LLC Andover USA - USD Holding. Electricity generation Line-by-line Enel Kansas LLC 100.00% 100.00%

184 Half-Year Financial Report at June 30, 2020
Company name Headquarters Country Share capital Currency ActivityConsolidation method Held by % holding
Group % holding
EGP HoldCo 6 LLC Andover USA - USD Holding. Electricity generation Line-by-line Enel Kansas LLC 100.00% 100.00%
EGP HoldCo 7 LLC Andover USA - USD Holding. Electricity generation Line-by-line Enel Kansas LLC 100.00% 100.00%
EGP HoldCo 8 LLC Andover USA - USD Holding. Electricity generation Line-by-line Enel Kansas LLC 100.00% 100.00%
EGP HoldCo 9 LLC Andover USA - USD Holding. Electricity generation Line-by-line Enel Kansas LLC 100.00% 100.00%
EGP Magdalena Solar SA de Cv Mexico City Mexico 691,771,740.00 MXN Renewable energy Line-by-line
Enel Rinnovabile SA de CvHidroelectricidad del Pacífico S de RL de Cv
99.00%
1.00%
100.00%
EGP Nevada Power LLC Wilmington USA - USD Renewable energy Line-by-line Enel Green Power
North America Inc. 100.00% 100.00%
EGP Salt Wells Solar LLC Wilmington USA - USD
Electricity generation from renewable resources
Line-by-line Enel Green Power North America Inc. 100.00% 100.00%
EGP San Leandro Microgrid I LLC Wilmington USA - USD
Electricity generation from renewable resources
Line-by-line Enel Green Power North America Inc. 100.00% 100.00%
EGP Solar 1 LLC Andover USA - USDElectricity generation from renewable resources
Line-by-line EGPNA REP Solar Holdings LLC 100.00% 100.00%
EGP Stillwater Solar LLC Wilmington USA - USD
Electricity generation from renewable resources
Line-by-line Enel Stillwater LLC 100.00% 100.00%
EGP Stillwater Solar PV II LLC Wilmington USA 1.00 USD
Electricity generation from renewable resources
Line-by-line Stillwater Woods Hill Holdings LLC 100.00% 100.00%
EGP Timber Hills Project LLC Los Angeles USA - USD
Electricity generation from renewable resources
Line-by-line Padoma Wind Power LLC 100.00% 100.00%
EGPNA Development Holdings LLC
Wilmington USA - USDElectricity generation from renewable resources
Line-by-lineEnel Green Power North America Development LLC
100.00% 100.00%
EGPNA Hydro Holdings LLC Wilmington USA - USD Holding Line-by-line Enel Green Power
North America Inc. 100.00% 100.00%
EGPNA Preferred Wind Holdings II LLC
Wilmington USA - USD Holding Line-by-line Enel Green Power North America Inc. 100.00% 100.00%
EGPNA Preferred Wind Holdings LLC Wilmington USA - USD Holding Line-by-line Enel Green Power
North America Inc. 100.00% 100.00%
EGPNA Project HoldCo 1 LLC Dover USA 100.00 USD Holding Line-by-line Enel Green Power
North America Inc. 100.00% 100.00%
EGPNA Project HoldCo 2 LLC Dover USA 100.00 USD Holding Line-by-line Enel Green Power
North America Inc. 100.00% 100.00%
EGPNA Project HoldCo 3 LLC Dover USA 100.00 USD Holding Line-by-line Enel Green Power
North America Inc. 100.00% 100.00%
EGPNA Project HoldCo 4 LLC Dover USA 100.00 USD Holding Line-by-line Enel Green Power
North America Inc. 100.00% 100.00%
EGPNA Project HoldCo 5 LLC Dover USA 100.00 USD Holding Line-by-line Enel Green Power
North America Inc. 100.00% 100.00%
EGPNA Project HoldCo 6 LLC Dover USA 100.00 USD Holding Line-by-line Enel Green Power
North America Inc. 100.00% 100.00%
EGPNA Project HoldCo 7 LLC Dover USA 100.00 USD Holding Line-by-line Enel Green Power
North America Inc. 100.00% 100.00%

185Attachments
Company name Headquarters Country Share capital Currency ActivityConsolidation method Held by % holding
Group % holding
EGPNA Renewable Energy Partners LLC
Wilmington USA - USD Joint Venture Equity EGPNA REP Holdings LLC 20.00% 20.00%
EGPNA REP Holdings LLC Wilmington USA - USD Holding Line-by-line Enel Green Power
North America Inc. 100.00% 100.00%
EGPNA REP Solar Holdings LLC Wilmington USA - USD Holding Line-by-line Enel Green Power
North America Inc. 100.00% 100.00%
EGPNA REP Wind Holdings LLC Wilmington USA - USD
Electricity generation from renewable resources
EquityEGPNA Renewable Energy Partners LLC
100.00% 20.00%
EGPNA Wind Holdings 1 LLC Wilmington USA - USD
Electricity generation from renewable resources
Equity EGPNA REP Wind Holdings LLC 100.00% 20.00%
Elcogas SA in liquidation
Puertollano (Ciudad Real) Spain 809,690.40 EUR Electricity generation Equity
Endesa Generación SAEnel SpA
40.99%4.32%
33.05%
Elcomex Solar Energy Srl Bucharest Romania 4,590,000.00 RON
Electricity generation from renewable resources
Line-by-line
Enel Green Power Romania SrlEnel Green Power SpA
100.00%
0.00%
100.00%
Elecgas SA Pego Portugal 50,000.00 EUR Electricity generation - combined cycle Equity
Endesa Generación Portugal SA
50.00% 35.05%
Electra Capital (RF) (Pty) Ltd Johannesburg South Africa 10,000,000.00 ZAR
Electricity generation from renewable resources
Line-by-line Enel Green Power RSA (Pty) Ltd 60.00% 60.00%
Eléctrica de Jafre SA Girona Spain 165,876.00 EUR Electricity distribution
and sale Line-by-line
Endesa Red SA (Sociedad Unipersonal)Hidroeléctrica de Catalunya SL
52.54%
47.46%
70.10%
Eléctrica de Lijar SL Cádiz Spain 1,081,821.79 EUR Electricity transmission and distribution Equity
Endesa Red SA (Sociedad Unipersonal)
50.00% 35.05%
Eléctrica del Ebro SA (Sociedad Unipersonal)
Tarragona Spain 500,000.00 EUR Electricity supply Line-by-lineEndesa Red SA (Sociedad Unipersonal)
100.00% 70.10%
Electricidad de Puerto Real SA Cádiz Spain 4,960,246.40 EUR Electricity distribution
and sale EquityEndesa Red SA (Sociedad Unipersonal)
50.00% 35.05%
Electrometalúrgica del Ebro SL Barcelona Spain 2,906,862.00 EUR
Electricity generation from renewable resources
- Enel Green Power España SL 0.18% 0.12%
Eletropaulo Metropolitana Eletricidade de São Paulo SA
Barueri Brazil 3,079,524,934.33 BRL Electricity distribution Line-by-line Enel Brasil SA 100.00% 64.14%
Elini Antwerp Belgium 31,855,683.05 EUR Insurance - Slovenské elektrárne AS 4.26% 1.41%
Elk Creek Hydro LLC Wilmington USA - USD
Electricity generation from renewable resources
AFS Enel Green Power North America Inc. 100.00% 100.00%
Emerging Networks El Salvador SA de Cv
- El Salvador 2,000.00 USD Telecommunications EquityLivister Guatemala SALivister Latam SLU
1.00%99.00%
20.60%
Emerging Networks Latam Inc.
Wilmington USA 100.00 USD - Equity Ifx Networks Ltd. 100.00% 20.60%
Emerging Networks Panama SA
Panama City Republic of Panama 1,000.00 USD - Equity Ifx/eni - Spc
Panama Inc. 100.00% 20.60%

186 Half-Year Financial Report at June 30, 2020
Company name Headquarters Country Share capital Currency ActivityConsolidation method Held by % holding
Group % holding
Emgesa SA ESP Bogotá Colombia 655,222,312,800.00 COP Electricity generation and sale Line-by-line Enel Américas SA 48.48% 31.10%
Emintegral Cycle SLU Seville Spain 3,000.00 EUR Photovoltaic systems Line-by-line Enel Green Power
España SL 100.00% 70.10%
Empresa Carbonífera del Sur SA
Madrid Spain 18,030,000.00 EUR Mining Line-by-line Endesa Generación SA 100.00% 70.10%
Empresa de Alumbrado Eléctrico de Ceuta Distribución SA (Sociedad Unipersonal)
Ceuta Spain 9,335,000.00 EUR Electricity distribution Line-by-line
Empresa de Alumbrado Eléctrico de Ceuta SA
100.00% 67.55%
Empresa de Alumbrado Eléctrico de Ceuta SA
Ceuta Spain 16,562,250.00 EUR Holding Line-by-lineEndesa Red SA (Sociedad Unipersonal)
96.37% 67.55%
Empresa de Generación Eléctrica Los Pinos SA
San Miguel Peru 7,928,044.00 SOL
Electricity generation, transmission, distribution purchase and sale
Line-by-line
Enel Green Power Perú SACEnergética Monzón SAC
100.00%
0.00%
100.00%
Empresa de Generación Eléctrica Marcona SAC
San Miguel Peru 3,368,424.00 SOL
Electricity generation, transmission, distribution purchase and sale
Line-by-line
Enel Green Power Perú SACEnergética Monzón SAC
100.00%
0.00%
100.00%
Empresa de Transmisión Chena SA
Santiago de Chile Chile 250,428,941.00 CLP Electricity, transmission Line-by-line
Enel Colina SAEnel Distribución Chile SA
0.10%
99.90%63.96%
Empresa Distribuidora Sur SA - Edesur
Buenos Aires Argentina 898,585,028.00 ARS Electricity distribution and sale Line-by-line
Distrilec Inversora SAEnel Argentina SA
56.36%43.10%
46.26%
Empresa Eléctrica Panguipulli SA Santiago de Chile Chile 49,195,959.84 USD
Electricity generation from renewable resources
Line-by-lineEnel Chile SAEnel Green Power Chile SA
0.03%
99.97%64.55%
Empresa Eléctrica Pehuenche SA Santiago de Chile Chile 175,774,920,733.00 CLP
Electricity generation, transmission and distribution
Line-by-line Enel Generación Chile SA 92.65% 55.94%
Empresa Energía SA Cádiz Spain 2,500,000.00 EUR Electricity supply Equity
Endesa Red SA (Sociedad Unipersonal)
50.00% 35.05%
Empresa Nacional de Geotermia SA Santiago de Chile Chile 12,647,789,439.24 CLP
Electricity generation from renewable resources
Line-by-line Enel Green Power Chile SA 51.00% 32.92%
Empresa Propietaria de La Red SA
Panama City Republic of Panama 58,500,000.00 USD Electricity transmission
and distribution - Enel SpA 11.11% 11.11%
Endesa Capital SA Madrid Spain 60,200.00 EUR Finance company Line-by-line Endesa SA 100.00% 70.10%
Endesa Comercialização de Energia SA
Porto Portugal 250,000.00 EUR Electricity generation and sale Line-by-line Endesa Energía SA 100.00% 70.10%
Endesa Energía Renovable SL (Sociedad Unipersonal)
Madrid Spain 100,000.00 EUR Electricity supply Line-by-line Endesa Energía SA 100.00% 70.10%
Endesa Energía SA Madrid Spain 14,919,195.32 EUR Marketing of energy products Line-by-line Endesa SA 100.00% 70.10%
Endesa Energía SAU y Clece SA UTE
Madrid Spain 6,000.00 EUR Services - Endesa Energía SA 50.00% 35.05%
Endesa Energía SAU - Automnibus Interurbanos SA Valdemoro UTE
Madrid Spain - EUR Plant development and construction Equity Endesa Energía SA 70.00% 49.07%

187Attachments
Company name Headquarters Country Share capital Currency ActivityConsolidation method Held by % holding
Group % holding
Endesa Energía SAU - Tecnocontrol Vitoria UTE
Madrid Spain - EUR Public lighting services - Endesa Energía SA 50.00% 35.05%
Endesa Financiación Filiales SA
Madrid Spain 4,621,003,006.00 EUR Finance company Line-by-line Endesa SA 100.00% 70.10%
Endesa Generación II SA Seville Spain 63,107.00 EUR Electricity generation Line-by-line Endesa SA 100.00% 70.10%
Endesa Generación Nuclear SA Seville Spain 60,000.00 EUR Subholding company
in the nuclear sector Line-by-line Endesa Generación SA 100.00% 70.10%
Endesa Generación Portugal SA Lisbon Portugal 50,000.00 EUR Electricity generation Line-by-line
Endesa Energía SAEndesa Generación SAEnel Green Power España SL
0.20%
99.20%
0.60%
70.10%
Endesa Generación SA Seville Spain 1,940,379,735.35 EUR Electricity generation
and sale Line-by-line Endesa SA 100.00% 70.10%
Endesa Ingeniería SLU Seville Spain 1,000,000.00 EUR
Consulting and engineering services Line-by-line
Endesa Red SA (Sociedad Unipersonal)
100.00% 70.10%
Endesa Ingeniería SLU - Enel Sole Srl UTE XIV
Seville Spain - EUR Public lighting services -Endesa Ingeniería SLUEnel Sole Srl
50.00%50.00%
85.05%
Endesa Medios y Sistemas SL (Sociedad Unipersonal)
Madrid Spain 89,999,790.00 EUR Services Line-by-line Endesa SA 100.00% 70.10%
Endesa Operaciones y Servicios Comerciales SL
Madrid Spain 10,138,580.00 EUR Services Line-by-line Endesa Energía SA 100.00% 70.10%
Endesa Power Trading Ltd London United Kingdom 2.00 GBP Trading Line-by-line Endesa SA 100.00% 70.10%
Endesa Red SA (Sociedad Unipersonal)
Madrid Spain 719,901,723.26 EUR Electricity distribution Line-by-line Endesa SA 100.00% 70.10%
Endesa SA Madrid Spain 1,270,502,540.40 EUR Holding Line-by-line Enel Iberia Srl 70.10% 70.10%
Endesa Soluciones SL Madrid Spain 2,874,621.80 EUR Marketing of energy
products Equity Endesa Energía SA 20.00% 14.02%
Endesa X SA (Sociedad Unipersonal)
Madrid Spain 60,000.00 EUR Services Line-by-line Endesa SA 100.00% 70.10%
Enel Alberta Wind Inc. Alberta Canada 16,251,021.00 CAD
Electricity generation from renewable resources
Line-by-line Enel Green Power Canada Inc. 100.00% 100.00%
Enel Américas SA Santiago de Chile Chile 9,783,875,314.43 USDHolding. Electricity generation and distribution
Line-by-line Enel SpA 64.14% 64.14%
Enel AMPCI Chile SpA Santiago de Chile Chile 1,000.00 USD E-mobility - Enel X Chile SpA 20.00% 12.91%
Enel AMPCI Ts1 Holdings SpA Santiago de Chile Chile 1,000.00 USD E-mobility - Enel AMPCI Chile
SpA 100.00% 12.91%
Enel AMPCI Ts1 SpA Santiago de Chile Chile 1,000.00 USD E-mobility - Enel AMPCI Ts1
Holdings SpA 100.00% 12.91%
Enel and Shikun & Binui Innovation Infralab Ltd
Airport City Israel 38,000.00 ILS Legal services EquityEnel Global Infrastructure and Networks Srl
50.00% 50.00%
Enel Argentina SA Buenos Aires Argentina 2,297,711,908.00 ARS Holding Line-by-lineEnel Américas SAEnel Generación Chile SA
99.92%
0.08%64.14%

188 Half-Year Financial Report at June 30, 2020
Company name Headquarters Country Share capital Currency ActivityConsolidation method Held by % holding
Group % holding
Enel Bella Energy Storage LLC Wilmington USA - USD Renewable energy Line-by-line
Enel Energy Storage Holdings LLC (formerly EGP Energy Storage Holdings LLC)
100.00% 100.00%
Enel Brasil SA Niterói Brazil 18,978,311,482.06 BRL Holding Line-by-line Enel Américas SAEnel Brasil SA
99.25%0.75% 64.14%
Enel Chile SA Santiago de Chile Chile 3,882,103,470,184.00 CLPHolding. Electricity generation and distribution
Line-by-line Enel SpA 64.55% 64.55%
Enel CIEN SA Niterói Brazil 285,044,682.00 BRLElectricity generation, transmission and distribution
Line-by-line Enel Brasil SA 100.00% 64.14%
Enel Colina SA Santiago de Chile Chile 82,222,000.00 CLP Electricity distribution Line-by-lineEnel Chile SAEnel Distribución Chile SA
0.00%
100.00%63.96%
Enel Cove Fort II LLC Wilmington USA - USD
Electricity generation from renewable resources
Line-by-line Enel Green Power North America Inc. 100.00% 100.00%
Enel Cove Fort LLC Beaver USA - USDElectricity generation from renewable resources
Line-by-line Enel Geothermal LLC 100.00% 100.00%
Enel Distribución Chile SA Santiago de Chile Chile 230,137,979,938.00 CLP Holding. Electricity
distribution Line-by-line Enel Chile SA 99.09% 63.96%
Enel Distribución Perú SAA San Miguel Peru 638,563,900.00 SOL Electricity distribution
and sale Line-by-line Enel Perú SAC 83.15% 53.34%
Enel Energia SpA Rome Italy 302,039.00 EUR Gas and electricity sale Line-by-line Enel Italia SpA 100.00% 100.00%
Enel Energía SA de Cv Mexico City Mexico 25,000,100.00 MXN
Electricity generation from renewable resources
Line-by-line
Enel Green Power México S de RL de CvEnergía Nueva de Iguu S de RL de Cv
100.00%
0.00%
100.00%
Enel Energie Muntenia SA Bucharest Romania 37,004,350.00 RON Electricity sale Line-by-line Enel SpA 78.00% 78.00%
Enel Energie SA Bucharest Romania 140,000,000.00 RON Electricity sale Line-by-line Enel SpA 51.00% 51.00%
Enel Energy Australia (Pty) Ltd Sydney Australia 100.00 AUD Electricity sale Line-by-line Enel Green Power
Australia (Pty) Ltd 100.00% 100.00%
Enel Energy South Africa Wilmington South Africa 100.00 ZAR
Electricity generation from renewable resources
Line-by-line Enel X International Srl 100.00% 100.00%
Enel Energy Storage Holdings LLC (formerly EGP Energy Storage Holdings LLC)
Andover USA 100.00 USDElectricity generation from renewable resources
Line-by-line Enel Green Power North America Inc. 100.00% 100.00%
Enel Finance America LLC Wilmington USA 200,000,000.00 USD Finance company Line-by-line Enel North
America Inc. 100.00% 100.00%
Enel Finance International NV Amsterdam Netherlands 1,478,810,371.00 EUR Finance company Line-by-line
Enel Holding Finance SrlEnel SpA
75.00%25.00%
100.00%
Enel Fortuna SA Panama City Republic of Panama 100,000,000.00 USD
Electricity generation from renewable resources
Line-by-line Enel Green Power Panamá Srl 50.06% 50.06%
Enel Generación Chile SA Santiago de Chile Chile 552,777,320,871.00 CLP
Electricity generation, transmission and distribution
Line-by-line Enel Chile SA 93.55% 60.38%
Enel Generación Costanera SA Buenos Aires Argentina 701,988,378.00 ARS Electricity generation
and sale Line-by-line Enel Argentina SA 75.68% 48.54%
Enel Generación El Chocón SA Buenos Aires Argentina 298,584,050.00 ARS Electricity generation
and sale Line-by-line Enel Argentina SAHidroinvest SA
8.67%59.00% 42.16%

189Attachments
Company name Headquarters Country Share capital Currency ActivityConsolidation method Held by % holding
Group % holding
Enel Generación Perú SAA San Miguel Peru 2,498,101,267.20 SOL Electricity generation Line-by-line Enel Perú SAC 83.60% 53.62%
Enel Generación Piura SA San Miguel Peru 73,982,594.00 SOL Electricity generation Line-by-line Enel Perú SAC 96.50% 61.90%
Enel Generación SA de Cv Mexico City Mexico 7,100,100.00 MXN Electricity generation Line-by-line
Enel Green Power México S de RL de CvEnergía Nueva de Iguu S de RL de Cv
100.00%
0.00%
100.00%
Enel Geothermal LLC Wilmington USA - USD
Electricity generation from renewable resources
Line-by-line Enel Green Power North America Inc. 100.00% 100.00%
Enel Global Infrastructure and Networks Srl
Rome Italy 10,100,000.00 EUR
Metering, remote control and connectivity services via power line communication
Line-by-line Enel SpA 100.00% 100.00%
Enel Global Services Srl Rome Italy 10,000.00 EUR Engineering and
consulting services Line-by-line Enel SpA 100.00% 100.00%
Enel Global Thermal Generation Srl
Rome Italy 11,000,000.00 EUR
Business consulting, administrative and management consulting and corporate planning
Line-by-line Enel SpA 100.00% 100.00%
Enel Global Trading SpA Rome Italy 90,885,000.00 EUR Fuel trading and
logistics Line-by-line Enel SpA 100.00% 100.00%
Enel Green Power Argentina SA Buenos Aires Argentina 82,534,295.00 ARS
Electricity generation from renewable resources
Line-by-line
Enel Green Power SpAEnergía y Servicios South America SpA
99.24%
0.76%
100.00%
Enel Green Power Australia (Pty) Ltd Sydney Australia 100.00 AUD
Electricity generation from renewable resources
Line-by-line Enel Green Power SpA 100.00% 100.00%
Enel Green Power Australia Trust Sydney Australia 100.00 AUD Renewable energy Line-by-line Enel Green Power
SpA 100.00% 100.00%
Enel Green Power Boa Vista Eólica SA Niterói Brazil 108,952,830.00 BRL Wind plants Line-by-line
Enel Green Power Brasil Participações Ltda
100.00% 100.00%
Enel Green Power Brasil Participações Ltda
Niterói Brazil 8,411,724,678.00 BRL Holding Line-by-line
Enel Green Power SpAEnergía y Servicios South America SpA
100.00%
0.00%
100.00%
Enel Green Power Brejolândia Solar SA
Rio de Janeiro Brazil 1,000.00 BRLElectricity generation from renewable resources
Line-by-line
Enel Green Power Brasil Participações LtdaEnel Green Power Desenvolvimento Ltda
99.90%
0.10%
100.00%
Enel Green Power Bulgaria EAD Sofia Bulgaria 35,231,000.00 BGN
Plant construction operation and maintenance
Line-by-line Enel Green Power SpA 100.00% 100.00%
Enel Green Power Bungala (Pty) Ltd Sydney Australia 100.00 AUD
Electricity generation from renewable resources
Line-by-line Enel Green Power Australia (Pty) Ltd 100.00% 100.00%
Enel Green Power Bungala Trust Sydney Australia - AUD Renewable energy Line-by-line Enel Green Power
Australia (Pty) Ltd 100.00% 100.00%
Enel Green Power Cabeça de Boi SA Niterói Brazil 270,114,539.00 BRL
Electricity generation and sale from renewable resources
Line-by-lineEnel Green Power Brasil Participações Ltda
100.00% 100.00%

190 Half-Year Financial Report at June 30, 2020
Company name Headquarters Country Share capital Currency ActivityConsolidation method Held by % holding
Group % holding
Enel Green Power Cachoeira Dourada SA
Cachoeira Dourada Brazil 64,339,835.85 BRL Electricity generation and sale Line-by-line
Enel Brasil SAEnel Green Power Cachoeira Dourada SA
99.61%
0.15%
63.99%
Enel Green Power Calabria Srl Rome Italy 10,000.00 EUR
Electricity generation from renewable resources
Line-by-line Enel Green Power Italia Srl 100.00% 100.00%
Enel Green Power Canada Inc. Montreal Canada 85,681,857.00 CAD
Electricity generation from renewable resources
Line-by-line Enel Green Power North America Inc. 100.00% 100.00%
Enel Green Power Cerrado Solar SA Rio de Janeiro Brazil 1,000.00 BRL
Electricity generation from renewable resources
Line-by-line
Enel Green Power Brasil Participações LtdaEnel Green Power Desenvolvimento Ltda
99.90%
0.10%
100.00%
Enel Green Power Chile SA Santiago de Chile Chile 1,197,691,313.37 USD
Electricity generation and sale from renewable resources
Line-by-line
Enel Chile SAEnel Green Power Chile SAEnel SpA
72.46%
27.54%0.01%
64.55%
Enel Green Power Cohuna Holdings (Pty) Ltd
Sydney Australia 3,419,700.00 AUD Holding Line-by-line Enel Green Power Australia (Pty) Ltd 100.00% 100.00%
Enel Green Power Cohuna Trust Sydney Australia - AUD Renewable energy Line-by-line Enel Green Power
Australia Trust 100.00% 100.00%
Enel Green Power Colombia SAS ESP Bogotá Colombia 3,878,946,000.00 COP
Electricity generation from renewable resources
Line-by-line Enel Green Power SpA 100.00% 100.00%
Enel Green Power Costa Rica SA San José Costa Rica 27,500,000.00 USD
Electricity generation from renewable resources
Line-by-lineEnergía y Servicios South America SpA
100.00% 100.00%
Enel Green Power Cove Fort Solar LLC
Wilmington USA 1.00 USD - Line-by-line Enel Kansas LLC 100.00% 100.00%
Enel Green Power Cremzow GmbH & Co. Kg
Schenkenberg Germany 1,000.00 EURPlant construction and operation Line-by-line Enel Green Power
Germany GmbH 90.00% 90.00%
Enel Green Power Cremzow Verwaltungs GmbH
Schenkenberg Germany 25,000.00 EUR Business services Line-by-line Enel Green Power Germany GmbH 90.00% 90.00%
Enel Green Power Cristal Eólica SA Niterói Brazil 144,784,899.00 BRL
Electricity generation and sale from renewable resources
Line-by-line
Enel Green Power Brasil Participações LtdaEnel Green Power Desenvolvimento Ltda
99.17%
0.83%
100.00%
Enel Green Power Cumaru 01 SA Niterói Brazil 100,001,000.00 BRL
Electricity generation and sale from renewable resources
Line-by-line
Enel Green Power Brasil Participações LtdaEnel Green Power Desenvolvimento Ltda
100.00%
0.00%
100.00%
Enel Green Power Cumaru 02 SA Niterói Brazil 100,001,000.00 BRL
Electricity generation and sale from renewable resources
Line-by-line
Enel Green Power Brasil Participações LtdaEnel Green Power Desenvolvimento Ltda
100.00%
0.00%
100.00%
Enel Green Power Cumaru 03 SA Niterói Brazil 100,001,000.00 BRL
Electricity generation and sale from renewable resources
Line-by-line
Enel Green Power Brasil Participações LtdaEnel Green Power Desenvolvimento Ltda
100.00%
0.00%
100.00%

191Attachments
Company name Headquarters Country Share capital Currency ActivityConsolidation method Held by % holding
Group % holding
Enel Green Power Cumaru 04 SA Niterói Brazil 100,001,000.00 BRL
Electricity generation and sale from renewable resources
Line-by-line
Enel Green Power Brasil Participações LtdaEnel Green Power Desenvolvimento Ltda
100.00%
0.00%
100.00%
Enel Green Power Cumaru 05 SA Niterói Brazil 100,001,000.00 BRL
Electricity generation and sale from renewable resources
Line-by-line
Enel Green Power Brasil Participações LtdaEnel Green Power Desenvolvimento Ltda
100.00%
0.00%
100.00%
Enel Green Power Cumaru Participações SA
Niterói Brazil 1,000.00 BRL Holding Line-by-line
Enel Green Power Brasil Participações LtdaEnel Green Power Desenvolvimento Ltda
99.90%
0.10%
100.00%
Enel Green Power Cumaru Solar 01 SA
Niterói Brazil 1,000.00 BRLElectricity generation and sale from renewable resources
Line-by-line
Enel Green Power Brasil Participações LtdaEnel Green Power Desenvolvimento Ltda
99.90%
0.10%
100.00%
Enel Green Power Cumaru Solar 02 SA
Niterói Brazil 1,000.00 BRLElectricity generation and sale from renewable resources
Line-by-line
Enel Green Power Brasil Participações LtdaEnel Green Power Desenvolvimento Ltda
99.90%
0.10%
100.00%
Enel Green Power Damascena Eólica SA
Niterói Brazil 83,709,003.00 BRLElectricity generation from renewable resources
Line-by-line
Enel Green Power Brasil Participações LtdaEnel Green Power Desenvolvimento Ltda
99.16%
0.84%
100.00%
Enel Green Power Delfina A Eólica SA Niterói Brazil 549,062,483.00 BRL
Electricity generation from renewable resources
Line-by-lineEnel Green Power Brasil Participações Ltda
100.00% 100.00%
Enel Green Power Delfina B Eólica SA Niterói Brazil 93,538,826.00 BRL
Electricity generation from renewable resources
Line-by-lineEnel Green Power Brasil Participações Ltda
100.00% 100.00%
Enel Green Power Delfina C Eólica SA Niterói Brazil 39,558,322.00 BRL
Electricity generation from renewable resources
Line-by-lineEnel Green Power Brasil Participações Ltda
100.00% 100.00%
Enel Green Power Delfina D Eólica SA Niterói Brazil 113,170,233.00 BRL
Electricity generation from renewable resources
Line-by-lineEnel Green Power Brasil Participações Ltda
100.00% 100.00%
Enel Green Power Delfina E Eólica SA Niterói Brazil 115,923,464.00 BRL
Electricity generation from renewable resources
Line-by-lineEnel Green Power Brasil Participações Ltda
100.00% 100.00%
Enel Green Power Desenvolvimento Ltda
Niterói Brazil 41,474,258.38 BRL
Plant construction and electricity generation from renewable sources
Line-by-line
Enel Green Power Brasil Participações LtdaEnergía y Servicios South America SpA
100.00%
0.00%
100.00%
Enel Green Power Development Srl Rome Italy 20,000.00 EUR
Electricity generation from renewable resources
Line-by-line Enel Green Power SpA 100.00% 100.00%
Enel Green Power Diamond Vista Wind Project LLC
Wilmington USA 1.00 USDElectricity generation from renewable resources
Line-by-line Diamond Vista Holdings LLC 100.00% 100.00%
Enel Green Power Dois Riachos Eólica SA
Niterói Brazil 130,354,009.00 BRLElectricity generation from renewable resources
Line-by-lineEnel Green Power Brasil Participações Ltda
100.00% 100.00%

192 Half-Year Financial Report at June 30, 2020
Company name Headquarters Country Share capital Currency ActivityConsolidation method Held by % holding
Group % holding
Enel Green Power Egypt SAE Cairo Egypt 250,000.00 EGP
Management, operation and maintenance of all types of generation plant and their distribution grids
Line-by-line Enel Green Power SpA 100.00% 100.00%
Enel Green Power El Salvador SA de Cv
- El Salvador 22,860.00 USDElectricity generation from renewable resources
Line-by-line
Enel Green Power SpAEnergía y Servicios South America SpA
99.96%
0.04%
100.00%
Enel Green Power Elkwater Wind Limited Partnership
Alberta Canada 1,000.00 CAD Holding Line-by-line
Enel Alberta Wind Inc.Enel Green Power Canada Inc.
1.00%
99.00%
100.00%
Enel Green Power Emiliana Eólica SA Niterói Brazil 150,191,530.00 BRL Wind plants Line-by-line
Enel Green Power Brasil Participações LtdaEnel Green Power Desenvolvimento Ltda
98.93%
1.07%
100.00%
Enel Green Power España SL Seville Spain 11,152.74 EUR
Electricity generation from renewable resources
Line-by-line Endesa Generación SA 100.00% 70.10%
Enel Green Power Esperança Eólica SA
Niterói Brazil 129,418,174.00 BRLElectricity generation from renewable resources
Line-by-line
Enel Green Power Brasil Participações LtdaEnel Green Power Desenvolvimento Ltda
99.14%
0.86%
100.00%
Enel Green Power Esperança Solar SA Rio de Janeiro Brazil 1,000.00 BRL
Electricity generation from renewable resources
Line-by-line
Enel Green Power Brasil Participações LtdaEnel Green Power Desenvolvimento Ltda
99.90%
0.10%
100.00%
Enel Green Power Fazenda SA Niterói Brazil 264,141,174.00 BRL
Electricity generation and sale from renewable resources
Line-by-lineEnel Green Power Brasil Participações Ltda
100.00% 100.00%
Enel Green Power Fontes dos Ventos 2 SA
Niterói Brazil 121,001,000.00 BRLElectricity generation and sale from renewable resources
Line-by-line
Enel Green Power Brasil Participações LtdaEnel Green Power Desenvolvimento Ltda
100.00%
0.00%
100.00%
Enel Green Power Fontes dos Ventos 3 SA
Niterói Brazil 121,001,000.00 BRLElectricity generation and sale from renewable resources
Line-by-line
Enel Green Power Brasil Participações LtdaEnel Green Power Desenvolvimento Ltda
100.00%
0.00%
100.00%
Enel Green Power Fontes Solar SA Rio de Janeiro Brazil 1,000.00 BRL
Electricity generation from renewable resources
Line-by-line
Enel Green Power Brasil Participações LtdaEnel Green Power Desenvolvimento Ltda
99.90%
0.10%
100.00%
Enel Green Power Germany GmbH München Germany 25,000.00 EUR Electricity generation
and sale Line-by-line Enel Green Power SpA 100.00% 100.00%
Enel Green Power Girgarre Holdings (Pty) Ltd
Sydney Australia 100.00 AUD Renewable energy Line-by-line Enel Green Power Australia (Pty) Ltd 100.00% 100.00%
Enel Green Power Global Investment BV
Amsterdam Netherlands 10,000.00 EUR Holding Line-by-line Enel Green Power SpA 100.00% 100.00%

193Attachments
Company name Headquarters Country Share capital Currency ActivityConsolidation method Held by % holding
Group % holding
Enel Green Power Guatemala SA Guatemala City Guatemala 10,000,000.00 GTQ Holding Line-by-line
Enel Green Power SpAEnergía y Servicios South America SpA
100.00%
0.00%
100.00%
Enel Green Power Hadros Wind Limited Partnership
- Canada 1,000.00 CAD Holding Line-by-line
Enel Alberta Wind Inc.Enel Green Power Canada Inc.
1.00%
99.00%
100.00%
Enel Green Power Hellas SA Maroussi Greece 8,180,350.00 EUR Holding. Energy
services Line-by-line Enel Green Power SpA 100.00% 100.00%
Enel Green Power Hellas Supply SA Maroussi Greece 600,000.00 EUR
Electricity generation, transport, sale and trading
Line-by-line Enel Green Power Hellas SA 100.00% 100.00%
Enel Green Power Hellas Wind Parks South Evia Single Member SA
Maroussi Greece 106,609,641.00 EURElectricity generation from renewable resources
Line-by-line Enel Green Power Hellas SA 100.00% 100.00%
Enel Green Power Hilltopper Wind LLC (formerly Hilltopper Wind Power LLC)
Dover USA 1.00 USD Wind Line-by-line Hilltopper Wind Holdings LLC 100.00% 100.00%
Enel Green Power Horizonte Mp Solar SA
Niterói Brazil 451,566,053.00 BRLElectricity generation from renewable resources
Line-by-line
Alba Energia LtdaEnel Green Power Brasil Participações Ltda
0.01%
99.99%
100.00%
Enel Green Power India Private Limited (formerly BLP Energy Private Limited)
New Delhi India 100,000,000.00 INR Holding Line-by-line Enel Green Power Development Srl 100.00% 100.00%
Enel Green Power Italia Srl Rome Italy 272,000,000.00 EUR
Electricity generation from renewable resources
Line-by-line Enel Italia SpA 100.00% 100.00%
Enel Green Power Ituverava Norte Solar SA
Niterói Brazil 199,552,644.00 BRLElectricity generation from renewable resources
Line-by-line
Bondia Energia LtdaEnel Green Power Brasil Participações Ltda
0.09%
99.91%
100.00%
Enel Green Power Ituverava Solar SA Niterói Brazil 219,235,933.00 BRL
Electricity generation from renewable resources
Line-by-line
Bondia Energia LtdaEnel Green Power Brasil Participações Ltda
0.00%
100.00%
100.00%
Enel Green Power Ituverava Sul Solar SA
Niterói Brazil 407,279,143.00 BRLElectricity generation from renewable resources
Line-by-line
Bondia Energia LtdaEnel Green Power Brasil Participações Ltda
0.00%
100.00%
100.00%
Enel Green Power Joana Eólica SA Niterói Brazil 135,459,530.00 BRL Wind plants Line-by-line
Enel Green Power Brasil Participações LtdaEnel Green Power Desenvolvimento Ltda
98.89%
1.11%
100.00%
Enel Green Power Kenya Limited Nairobi Kenya 100,000.00 KES
Plant construction - Electricity generation from renewable resources
Line-by-line
Enel Green Power RSA (Pty) LtdEnel Green Power SpA
1.00%
99.00%
100.00%
Enel Green Power Lagoa do Sol 01 SA Teresina Brazil 1,000.00 BRL
Electricity generation and sale from renewable resources
Line-by-line
Enel Green Power Brasil Participações LtdaEnel Green Power Desenvolvimento Ltda
99.90%
0.10%
100.00%

194 Half-Year Financial Report at June 30, 2020
Company name Headquarters Country Share capital Currency ActivityConsolidation method Held by % holding
Group % holding
Enel Green Power Lagoa do Sol 02 SA Teresina Brazil 1,000.00 BRL
Electricity generation and sale from renewable resources
Line-by-line
Enel Green Power Brasil Participações LtdaEnel Green Power Desenvolvimento Ltda
99.90%
0.10%
100.00%
Enel Green Power Lagoa do Sol 03 SA Teresina Brazil 1,000.00 BRL
Electricity generation and sale from renewable resources
Line-by-line
Enel Green Power Brasil Participações LtdaEnel Green Power Desenvolvimento Ltda
99.90%
0.10%
100.00%
Enel Green Power Lagoa do Sol 04 SA Teresina Brazil 1,000.00 BRL
Electricity generation and sale from renewable resources
Line-by-line
Enel Green Power Brasil Participações LtdaEnel Green Power Desenvolvimento Ltda
99.90%
0.10%
100.00%
Enel Green Power Lagoa II Participações SA
Niterói Brazil 1,000.00 BRL Holding Line-by-line
Enel Green Power Brasil Participações LtdaEnel Green Power Desenvolvimento Ltda
99.90%
0.10%
100.00%
Enel Green Power Lagoa Participações SA (formerly Enel Green Power Projetos 45 SA)
Niterói Brazil 1,000.00 BRL Holding Line-by-line
Enel Green Power Brasil Participações LtdaEnel Green Power Desenvolvimento Ltda
99.90%
0.10%
100.00%
Enel Green Power Maniçoba Eólica SA
Niterói Brazil 90,722,530.00 BRLElectricity generation from renewable resources
Line-by-line
Enel Green Power Brasil Participações LtdaEnel Green Power Desenvolvimento Ltda
99.20%
0.80%
100.00%
Enel Green Power Metehara Solar Private Limited Company
- Ethiopia 5,600,000.00 ETB Plant development, and construction Line-by-line
Enel Green Power Solar Metehara SpA
80.00% 80.00%
Enel Green Power México S de RL de Cv
Mexico City Mexico 2,399,774,165.00 MXN Holding Line-by-line
Enel Green Power SpAEnergía y Servicios South America SpA
100.00%
0.00%
100.00%
Enel Green Power Modelo I Eólica SA Niterói Brazil 132,642,000.00 BRL
Electricity generation from renewable resources
Line-by-lineEnel Green Power Brasil Participações Ltda
100.00% 100.00%
Enel Green Power Modelo II Eólica SA Niterói Brazil 117,142,000.00 BRL
Electricity generation from renewable resources
Line-by-lineEnel Green Power Brasil Participações Ltda
100.00% 100.00%
Enel Green Power Morocco SARLAU Casablanca Morocco 270,000,000.00 MAD
Development, design, construction and operation of plants
Line-by-line Enel Green Power SpA 100.00% 100.00%
Enel Green Power Morro do Chapéu I Eólica SA
Niterói Brazil 280,286,323.91 BRLElectricity generation from renewable resources
Line-by-lineEnel Green Power Brasil Participações Ltda
100.00% 100.00%
Enel Green Power Morro do Chapéu II Eólica SA
Niterói Brazil 235,992,413.25 BRLElectricity generation from renewable resources
Line-by-lineEnel Green Power Brasil Participações Ltda
100.00% 100.00%
Enel Green Power Mourão SA Niterói Brazil 25,600,100.00 BRL
Electricity generation from renewable resources
Line-by-lineEnel Green Power Brasil Participações Ltda
100.00% 100.00%
Enel Green Power Namibia (Pty) Ltd Windhoek Namibia 10,000.00 NAD
Electricity generation from renewable resources
Line-by-line Enel Green Power SpA 100.00% 100.00%

195Attachments
Company name Headquarters Country Share capital Currency ActivityConsolidation method Held by % holding
Group % holding
Enel Green Power North America Development LLC
Wilmington USA - USDElectricity generation from renewable resources
Line-by-line Enel North America Inc. 100.00% 100.00%
Enel Green Power North America Inc. Andover USA - USD
Electricity generation, transport, sale and trading
Line-by-line Enel North America Inc. 100.00% 100.00%
Enel Green Power O&M Solar LLC Andover USA - USD Plant operation Line-by-line Enel Kansas LLC 100.00% 100.00%
Enel Green Power Panamá Srl Panama City Republic of
Panama 3,001.00 USD Holding Line-by-line
Enel Green Power SpAEnergía y Servicios South America SpA
99.97%
0.03%
100.00%
Enel Green Power Paranapanema SA Niterói Brazil 123,350,100.00 BRL
Electricity generation from renewable resources
Line-by-lineEnel Green Power Brasil Participações Ltda
100.00% 100.00%
Enel Green Power Partecipazioni Speciali Srl
Rome Italy 10,000.00 EURElectricity generation from renewable resources
Line-by-line Enel Green Power SpA 100.00% 100.00%
Enel Green Power Pau Ferro Eólica SA Niterói Brazil 127,424,000.00 BRL Wind plants Line-by-line
Enel Green Power Brasil Participações LtdaEnel Green Power Desenvolvimento Ltda
98.79%
1.21%
100.00%
Enel Green Power Pedra do Gerônimo Eólica SA
Niterói Brazil 189,519,527.57 BRL Wind plants Line-by-line
Enel Green Power Brasil Participações LtdaEnel Green Power Desenvolvimento Ltda
98.90%
1.10%
100.00%
Enel Green Power Perú SAC San Miguel Peru 411,881,707.00 SOL
Electricity generation from renewable resources
Line-by-line
Enel Green Power SpAEnergía y Servicios South America SpA
100.00%
0.00%
100.00%
Enel Green Power Primavera Eólica SA
Niterói Brazil 143,674,900.01 BRL Wind plants Line-by-line
Enel Green Power Brasil Participações LtdaEnel Green Power Desenvolvimento Ltda
99.00%
1.00%
100.00%
Enel Green Power Puglia Srl Rome Italy 1,000,000.00 EUR
Electricity generation from renewable resources
Line-by-line Enel Green Power Italia Srl 100.00% 100.00%
Enel Green Power RA SAE in liquidation
Cairo Egypt 15,000,000.00 EGP
Design, decision, operation and maintenance of generation plants of all types and their distribution grids
Line-by-line Enel Green Power Egypt SAE 100.00% 100.00%
Enel Green Power Rattlesnake Creek Wind Project LLC (formerly Rattlesnake Creek Wind Project LLC)
Delaware USA 1.00 USDElectricity generation from renewable resources
Line-by-line Rattlesnake Creek Holdings LLC 100.00% 100.00%
Enel Green Power Roadrunner Solar Project Holdings II LLC
Andover USA - USD
Plant construction and generation of electricity from renewable sources
Line-by-line Enel Kansas LLC 100.00% 100.00%
Enel Green Power Roadrunner Solar Project Holdings LLC
Andover USA - USDHolding. Electricity generation and distribution
Line-by-line Enel Kansas LLC 100.00% 100.00%

196 Half-Year Financial Report at June 30, 2020
Company name Headquarters Country Share capital Currency ActivityConsolidation method Held by % holding
Group % holding
Enel Green Power Roadrunner Solar Project II LLC
Dover USA 100.00 USD Renewable energy Line-by-lineRoadrunner Solar Project Holdings LLC
100.00% 100.00%
Enel Green Power Romania Srl Bucharest Romania 2,430,631,000.00 RON
Electricity generation from renewable resources
Line-by-line Enel Green Power SpA 100.00% 100.00%
Enel Green Power RSA (Pty) Ltd Johannesburg South Africa 1,000.00 ZAR
Electricity generation from renewable resources
Line-by-line Enel Green Power Development Srl 100.00% 100.00%
Enel Green Power RSA 2 (RF) (Pty) Ltd
Johannesburg South Africa 120.00 ZARElectricity generation from renewable resources
Line-by-line Enel Green Power RSA (Pty) Ltd 100.00% 100.00%
Enel Green Power Rus Limited Liability Company
Moscow Russian Federation 60,500,000.00 RUB Renewable energy Line-by-line
Enel Green Power Partecipazioni Speciali SrlEnel Green Power SpA
1.00%
99.00%
100.00%
Enel Green Power SpA Rome Italy 272,000,000.00 EUR
Electricity generation from renewable resources
Line-by-line Enel SpA 100.00% 100.00%
Enel Green Power Salto Apiacás SA (formerly Enel Green Power Damascena Eólica SA)
Niterói Brazil 274,420,832.00 BRLElectricity generation and sale from renewable resources
Line-by-lineEnel Green Power Brasil Participações Ltda
100.00% 100.00%
Enel Green Power Sannio Rome Italy 750,000.00 EUR Electricity generation Line-by-line Enel Green Power
Italia Srl 100.00% 100.00%
Enel Green Power São Abraão Eólica SA
Niterói Brazil 99,513,587.00 BRLElectricity generation from renewable resources
Line-by-lineEnel Green Power Brasil Participações Ltda
100.00% 100.00%
Enel Green Power São Gonçalo 07 SA (formerly Enel Green Power Projetos 42 SA)
Teresina Brazil 30,001,000.00 BRLElectricity generation and sale from renewable resources
Line-by-line
Enel Green Power Brasil Participações LtdaEnel Green Power Desenvolvimento Ltda
100.00%
0.00%
100.00%
Enel Green Power São Gonçalo 08 SA (formerly Enel Green Power Projetos 43 SA)
Teresina Brazil 30,001,000.00 BRLElectricity generation and sale from renewable resources
Line-by-line
Enel Green Power Brasil Participações LtdaEnel Green Power Desenvolvimento Ltda
100.00%
0.00%
100.00%
Enel Green Power São Gonçalo 1 SA (formerly Enel Green Power Projetos 10)
Teresina Brazil 147,676,000.00 BRLElectricity generation and sale from renewable resources
Line-by-line
Alba Energia LtdaEnel Green Power Brasil Participações Ltda
0.00%
100.00%
100.00%
Enel Green Power São Gonçalo 10 SA (formerly Enel Green Power Projetos 15)
Teresina Brazil 162,000,000.00 BRLElectricity generation and sale from renewable resources
Line-by-line
Alba Energia LtdaEnel Green Power Brasil Participações Ltda
0.00%
100.00%
100.00%
Enel Green Power São Gonçalo 11 SA (formerly Enel Green Power Projetos 44 SA)
Teresina Brazil 30,001,000.00 BRLElectricity generation and sale from renewable resources
Line-by-line
Enel Green Power Brasil Participações LtdaEnel Green Power Desenvolvimento Ltda
100.00%
0.00%
100.00%
Enel Green Power São Gonçalo 12 SA (formerly Enel Green Power Projetos 22 SA)
Teresina Brazil 30,001,000.00 BRLElectricity generation and sale from renewable resources
Line-by-line
Enel Green Power Brasil Participações LtdaEnel Green Power Desenvolvimento Ltda
100.00%
0.00%
100.00%

197Attachments
Company name Headquarters Country Share capital Currency ActivityConsolidation method Held by % holding
Group % holding
Enel Green Power São Gonçalo 14 SA Teresina Brazil 110,001,000.00 BRL
Electricity generation and sale from renewable resources
Line-by-line
Enel Green Power Brasil Participações LtdaEnel Green Power Desenvolvimento Ltda
100.00%
0.00%
100.00%
Enel Green Power São Gonçalo 15 SA Teresina Brazil 110,001,000.00 BRL
Electricity generation and sale from renewable resources
Line-by-line
Enel Green Power Brasil Participações LtdaEnel Green Power Desenvolvimento Ltda
100.00%
0.00%
100.00%
Enel Green Power São Gonçalo 17 SA Teresina Brazil 110,001,000.00 BRL
Electricity generation and sale from renewable resources
Line-by-line
Enel Green Power Brasil Participações LtdaEnel Green Power Desenvolvimento Ltda
100.00%
0.00%
100.00%
Enel Green Power São Gonçalo 18 SA (formerly Enel Green Power Ventos de Santa Ângela 13 SA)
Teresina Brazil 110,001,000.00 BRLElectricity generation and sale from renewable resources
Line-by-line
Enel Green Power Brasil Participações LtdaEnel Green Power Desenvolvimento Ltda
100.00%
0.00%
100.00%
Enel Green Power São Gonçalo 19 SA Teresina Brazil 110,001,000.00 BRL
Electricity generation and sale from renewable resources
Line-by-line
Enel Green Power Brasil Participações LtdaEnel Green Power Desenvolvimento Ltda
100.00%
0.00%
100.00%
Enel Green Power São Gonçalo 2 SA (formerly Enel Green Power Projetos 11)
Teresina Brazil 162,676,000.00 BRLElectricity generation and sale from renewable resources
Line-by-line
Alba Energia LtdaEnel Green Power Brasil Participações Ltda
0.00%
100.00%
100.00%
Enel Green Power São Gonçalo 21 SA (formerly Enel Green Power Projetos 16)
Teresina Brazil 162,000,000.00 BRLElectricity generation and sale from renewable resources
Line-by-line
Alba Energia LtdaEnel Green Power Brasil Participações Ltda
0.00%
100.00%
100.00%
Enel Green Power Sao Gonçalo 22 SA (formerly Enel Green Power Projetos 30)
Teresina Brazil 162,000,000.00 BRLElectricity generation and sale from renewable resources
Line-by-line
Alba Energia LtdaEnel Green Power Brasil Participações Ltda
0.00%
100.00%
100.00%
Enel Green Power São Gonçalo 3 SA (formerly Enel Green Power Projetos 12)
Teresina Brazil 142,676,000.00 BRLElectricity generation and sale from renewable resources
Line-by-line
Alba Energia LtdaEnel Green Power Brasil Participações Ltda
0.00%
100.00%
100.00%
Enel Green Power São Gonçalo 4 SA (formerly Enel Green Power Projetos 13)
Teresina Brazil 162,676,000.00 BRLElectricity generation and sale from renewable resources
Line-by-line
Alba Energia LtdaEnel Green Power Brasil Participações Ltda
0.00%
100.00%
100.00%
Enel Green Power São Gonçalo 5 SA (formerly Enel Green Power Projetos 14)
Teresina Brazil 162,676,000.00 BRLElectricity generation and sale from renewable resources
Line-by-line
Alba Energia LtdaEnel Green Power Brasil Participações Ltda
0.00%
100.00%
100.00%
Enel Green Power São Gonçalo 6 SA (formerly Enel Green Power Projetos 19 SA)
Teresina Brazil 165,125,000.00 BRLElectricity generation and sale from renewable resources
Line-by-line
Alba Energia LtdaEnel Green Power Brasil Participações Ltda
0.00%
100.00%
100.00%

198 Half-Year Financial Report at June 30, 2020
Company name Headquarters Country Share capital Currency ActivityConsolidation method Held by % holding
Group % holding
Enel Green Power São Gonçalo 3 Participações SA
Niterói Brazil 1,000.00 BRL Holding Line-by-line
Enel Green Power Brasil Participações LtdaEnel Green Power Desenvolvimento Ltda
99.90%
0.10%
100.00%
Enel Green Power São Gonçalo Participações SA (formerly Enel Green Power Projetos 46 SA)
Niterói Brazil 1,000.00 BRL Holding Line-by-line
Enel Green Power Brasil Participações LtdaEnel Green Power Desenvolvimento Ltda
99.90%
0.10%
100.00%
Enel Green Power São Judas Eólica SA
Niterói Brazil 143,674,900.00 BRL Wind plants Line-by-line
Enel Green Power Brasil Participações LtdaEnel Green Power Desenvolvimento Ltda
99.00%
1.00%
100.00%
Enel Green Power São Micael 01 SA (formerly Enel Green Power São Gonçalo 9 SA)
Teresina Brazil 1,000.00 BRLElectricity generation and sale from renewable resources
Line-by-line
Alba Energia LtdaEnel Green Power Brasil Participações Ltda
0.10%
99.90%
100.00%
Enel Green Power São Micael 02 SA (formerly Enel Green Power São Gonçalo 13)
Teresina Brazil 1,000.00 BRLElectricity generation and sale from renewable resources
Line-by-line
Alba Energia LtdaEnel Green Power Brasil Participações Ltda
0.10%
99.90%
100.00%
Enel Green Power São Micael 03 SA (formerly Enel Green Power São Gonçalo 16 SA)
Teresina Brazil 1,000.00 BRLElectricity generation and sale from renewable resources
Line-by-line
Alba Energia LtdaEnel Green Power Brasil Participações Ltda
0.10%
99.90%
100.00%
Enel Green Power São Micael 04 SA (formerly Enel Green Power São Gonçalo 20 SA)
Teresina Brazil 1,000.00 BRLElectricity generation and sale from renewable resources
Line-by-line
Enel Green Power Brasil Participações LtdaEnel Green Power Desenvolvimento Ltda
99.90%
0.10%
100.00%
Enel Green Power São Micael 05 SA Teresina Brazil 1,000.00 BRL
Electricity generation from renewable resources
Line-by-line
Enel Green Power Brasil Participações LtdaEnel Green Power Desenvolvimento Ltda
99.90%
0.10%
100.00%
Enel Green Power Services LLC Wilmington USA 100.00 USD - Line-by-line Enel Green Power
North America Inc. 100.00% 100.00%
Enel Green Power Shu SAE in liquidation
Cairo Egypt 15,000,000.00 EGP
Design, decision, operation and maintenance of generation plants of all types and their distribution grids
Line-by-line Enel Green Power Egypt SAE 100.00% 100.00%
Enel Green Power Singapore Pte Ltd Singapore Singapore 1,300,000.00 SGD
Electricity generation from renewable resources
Line-by-line Enel Green Power SpA 100.00% 100.00%
Enel Green Power Solar Energy Srl Rome Italy 10,000.00 EUR
Development, design, construction and operation of plants
Line-by-line Enel Green Power Italia Srl 100.00% 100.00%
Enel Green Power Solar Metehara SpA
Rome Italy 50,000.00 EURElectricity generation from renewable resources
Line-by-line Enel Green Power SpA 100.00% 100.00%
Enel Green Power Solar Ngonye SpA (formerly Enel Green Power Africa Srl)
Rome Italy 50,000.00 EUR Electricity generation Line-by-line Enel Green Power SpA 100.00% 100.00%

199Attachments
Company name Headquarters Country Share capital Currency ActivityConsolidation method Held by % holding
Group % holding
Enel Green Power Tacaicó Eólica SA Niterói Brazil 91,634,360.00 BRL
Electricity generation from renewable resources
Line-by-line
Enel Green Power Brasil Participações LtdaEnel Green Power Desenvolvimento Ltda
98.84%
1.16%
100.00%
Enel Green Power Tefnut SAE in liquidation
Cairo Egypt 15,000,000.00 EGP
Design, decision, operation and maintenance of generation plants of all types and their distribution grids
Line-by-line Enel Green Power Egypt SAE 100.00% 100.00%
Enel Green Power Turkey Enerjí Yatirimlari Anoním čírketí
Istanbul Turkey 65,654,658.00 TRYElectricity generation from renewable resources
Line-by-line Enel Green Power SpA 100.00% 100.00%
Enel Green Power Ventos de Santa Ângela 1 SA
Teresina Brazil 132,001,000.00 BRLElectricity generation from renewable resources
Line-by-line
Enel Green Power Brasil Participações LtdaVentos de Santa Ângela Energias Renováveis SA
100.00%
0.00%
100.00%
Enel Green Power Ventos de Santa Ângela 10 SA (formerly Enel Green Power Projetos 21)
Teresina Brazil 171,001,000.00 BRLElectricity generation from renewable resources
Line-by-line
Enel Green Power Brasil Participações LtdaVentos de Santa Ângela Energias Renováveis SA
100.00%
0.00%
100.00%
Enel Green Power Ventos de Santa Ângela 11 SA (formerly Enel Green Power Projetos 23)
Teresina Brazil 185,001,000.00 BRLElectricity generation from renewable resources
Line-by-line
Enel Green Power Brasil Participações LtdaVentos de Santa Ângela Energias Renováveis SA
100.00%
0.00%
100.00%
Enel Green Power Ventos de Santa Ângela 14 SA (formerly Enel Green Power Projetos 24)
Teresina Brazil 178,001,000.00 BRLElectricity generation from renewable resources
Line-by-line
Enel Green Power Brasil Participações LtdaVentos de Santa Ângela Energias Renováveis SA
100.00%
0.00%
100.00%
Enel Green Power Ventos de Santa Ângela 15 SA (formerly Enel Green Power Projetos 25)
Teresina Brazil 182,001,000.00 BRLElectricity generation from renewable resources
Line-by-line
Enel Green Power Brasil Participações LtdaVentos de Santa Ângela Energias Renováveis SA
100.00%
0.00%
100.00%
Enel Green Power Ventos de Santa Ângela 17 SA (formerly Enel Green Power Projetos 26)
Teresina Brazil 198,001,000.00 BRLElectricity generation from renewable resources
Line-by-line
Enel Green Power Brasil Participações LtdaVentos de Santa Ângela Energias Renováveis SA
100.00%
0.00%
100.00%
Enel Green Power Ventos de Santa Ângela 19 SA (formerly Enel Green Power Projetos 27)
Teresina Brazil 126,001,000.00 BRLElectricity generation from renewable resources
Line-by-line
Enel Green Power Brasil Participações LtdaVentos de Santa Ângela Energias Renováveis SA
100.00%
0.00%
100.00%
Enel Green Power Ventos de Santa Ângela 2 SA
Teresina Brazil 249,650,000.00 BRLElectricity generation from renewable resources
Line-by-line
Enel Green Power Brasil Participações LtdaVentos de Santa Ângela Energias Renováveis SA
100.00%
0.00%
100.00%
Enel Green Power Ventos de Santa Ângela 20 SA (formerly Enel Green Power Projetos 28)
Teresina Brazil 126,001,000.00 BRLElectricity generation from renewable resources
Line-by-line
Enel Green Power Brasil Participações LtdaVentos de Santa Ângela Energias Renováveis SA
100.00%
0.00%
100.00%

200 Half-Year Financial Report at June 30, 2020
Company name Headquarters Country Share capital Currency ActivityConsolidation method Held by % holding
Group % holding
Enel Green Power Ventos de Santa Ângela 21 SA (formerly Enel Green Power Projetos 29)
Teresina Brazil 113,001,000.00 BRLElectricity generation from renewable resources
Line-by-line
Enel Green Power Brasil Participações LtdaVentos de Santa Ângela Energias Renováveis SA
100.00%
0.00%
100.00%
Enel Green Power Ventos de Santa Ângela 3 SA (formerly Enel Green Power Projetos 4)
Teresina Brazil 132,001,000.00 BRLElectricity generation from renewable resources
Line-by-line
Enel Green Power Brasil Participações LtdaVentos de Santa Ângela Energias Renováveis SA
100.00%
0.00%
100.00%
Enel Green Power Ventos de Santa Ângela 4 SA (formerly Enel Green Power Projetos 6)
Teresina Brazil 132,001,000.00 BRLElectricity generation from renewable resources
Line-by-line
Enel Green Power Brasil Participações LtdaVentos de Santa Ângela Energias Renováveis SA
100.00%
0.00%
100.00%
Enel Green Power Ventos de Santa Ângela 5 SA (formerly Enel Green Power Projetos 7)
Teresina Brazil 132,001,000.00 BRLElectricity generation from renewable resources
Line-by-line
Enel Green Power Brasil Participações LtdaVentos de Santa Ângela Energias Renováveis SA
100.00%
0.00%
100.00%
Enel Green Power Ventos de Santa Ângela 6 SA (formerly Enel Green Power Projetos 8)
Teresina Brazil 132,001,000.00 BRLElectricity generation from renewable resources
Line-by-line
Enel Green Power Brasil Participações LtdaVentos de Santa Ângela Energias Renováveis SA
100.00%
0.00%
100.00%
Enel Green Power Ventos de Santa Ângela 7 SA (formerly Enel Green Power Projetos 9)
Teresina Brazil 106,001,000.00 BRLElectricity generation from renewable resources
Line-by-line
Enel Green Power Brasil Participações LtdaVentos de Santa Esperança Energias Renováveis SA
100.00%
0.00%
100.00%
Enel Green Power Ventos de Santa Ângela 8 SA (formerly Enel Green Power Projetos 18)
Teresina Brazil 132,001,000.00 BRLElectricity generation from renewable resources
Line-by-line
Enel Green Power Brasil Participações LtdaVentos de Santa Ângela Energias Renováveis SA
100.00%
0.00%
100.00%
Enel Green Power Ventos de Santa Ângela 9 SA (formerly Enel Green Power Projetos 20)
Teresina Brazil 185,001,000.00 BRLElectricity generation from renewable resources
Line-by-line
Enel Green Power Brasil Participações LtdaVentos de Santa Ângela Energias Renováveis SA
100.00%
0.00%
100.00%
Enel Green Power Ventos de Santa Ângela ACL 12 (formerly Enel Green Power Projetos 36)
Teresina Brazil 105,001,000.00 BRLElectricity generation from renewable resources
Line-by-line
Enel Green Power Brasil Participações LtdaEnel Green Power Desenvolvimento Ltda
100.00%
0.00%
100.00%
Enel Green Power Ventos de Santa Ângela ACL 13 SA (formerly Enel Green Power Projetos 17 SA)
Teresina Brazil 105,001,000.00 BRLElectricity generation from renewable resources
Line-by-line
Enel Green Power Brasil Participações LtdaEnel Green Power Desenvolvimento Ltda
100.00%
0.00%
100.00%
Enel Green Power Ventos de Santa Ângela ACL 16 SA (formerly Enel Green Power Projetos 38 SA)
Teresina Brazil 105,001,000.00 BRLElectricity generation from renewable resources
Line-by-line
Enel Green Power Brasil Participações LtdaEnel Green Power Desenvolvimento Ltda
100.00%
0.00%
100.00%

201Attachments
Company name Headquarters Country Share capital Currency ActivityConsolidation method Held by % holding
Group % holding
Enel Green Power Ventos de Santa Ângela ACL 18 SA (formerly Enel Green Power Projetos 47 SA)
Teresina Brazil 105,001,000.00 BRLElectricity generation and sale from renewable resources
Line-by-line
Enel Green Power Brasil Participações LtdaEnel Green Power Desenvolvimento Ltda
100.00%
0.00%
100.00%
Enel Green Power Ventos de Santa Esperança 8 SA (formerly Enel Green Power Projetos 34 SA)
Niterói Brazil 110,200,000.00 BRLElectricity generation from renewable resources
Line-by-line
Enel Green Power Brasil Participações LtdaEnel Green Power Desenvolvimento Ltda
100.00%
0.00%
100.00%
Enel Green Power Ventos de Santa Esperança 1 SA (formerly Enel Green Power Fonte dos Ventos 1 SA)
Niterói Brazil 1,000.00 BRLElectricity generation and sale from renewable resources
Line-by-line
Enel Green Power Brasil Participações LtdaEnel Green Power Desenvolvimento Ltda
99.90%
0.10%
100.00%
Enel Green Power Ventos de Santa Esperança 13 (formerly Enel Green Power Projetos 33 SA)
Niterói Brazil 147,000,000.00 BRLElectricity generation from renewable resources
Line-by-line
Enel Green Power Brasil Participações LtdaEnel Green Power Desenvolvimento Ltda
100.00%
0.00%
100.00%
Enel Green Power Ventos de Santa Esperança 15 SA
Niterói Brazil 202,100,000.00 BRLElectricity generation from renewable resources
Line-by-line
Enel Green Power Brasil Participações LtdaEnel Green Power Desenvolvimento Ltda
100.00%
0.00%
100.00%
Enel Green Power Ventos de Santa Esperança 16 SA (formerly Enel Green Power Projetos 35 SA)
Niterói Brazil 183,700,000.00 BRLElectricity generation from renewable resources
Line-by-line
Enel Green Power Brasil Participações LtdaEnel Green Power Desenvolvimento Ltda
100.00%
0.00%
100.00%
Enel Green Power Ventos de Santa Esperança 17 SA (formerly Enel Green Power Projetos 31 SA)
Niterói Brazil 183,700,000.00 BRLElectricity generation from renewable resources
Line-by-line
Enel Green Power Brasil Participações LtdaEnel Green Power Desenvolvimento Ltda
100.00%
0.00%
100.00%
Enel Green Power Ventos de Santa Esperança 21 SA (formerly Enel Green Power Projetos 37 SA)
Niterói Brazil 202,100,000.00 BRLElectricity generation from renewable resources
Line-by-line
Enel Green Power Brasil Participações LtdaEnel Green Power Desenvolvimento Ltda
100.00%
0.00%
100.00%
Enel Green Power Ventos de Santa Esperança 22 SA (formerly Enel Green Power Projetos 39 SA)
Niterói Brazil 202,100,000.00 BRLElectricity generation from renewable resources
Line-by-line
Enel Green Power Brasil Participações LtdaEnel Green Power Desenvolvimento Ltda
100.00%
0.00%
100.00%
Enel Green Power Ventos de Santa Esperança 25 SA (formerly Enel Green Power Projetos 40 SA)
Salvador Brazil 110,200,000.00 BRLElectricity generation from renewable resources
Line-by-line
Enel Green Power Brasil Participações LtdaEnel Green Power Desenvolvimento Ltda
100.00%
0.00%
100.00%
Enel Green Power Ventos de Santa Esperança 26 SA (formerly Enel Green Power Projetos 41 SA)
Niterói Brazil 202,100,000.00 BRLElectricity generation from renewable resources
Line-by-lineEnel Green Power Brasil Participações Ltda
100.00% 100.00%

202 Half-Year Financial Report at June 30, 2020
Company name Headquarters Country Share capital Currency ActivityConsolidation method Held by % holding
Group % holding
Enel Green Power Ventos de Santa Esperança 3 SA
Niterói Brazil 1,000.00 BRLElectricity generation from renewable resources
Line-by-line
Enel Green Power Brasil Participações LtdaEnel Green Power Desenvolvimento Ltda
99.90%
0.10%
100.00%
Enel Green Power Ventos de Santa Esperança 7 SA (formerly Enel Green Power Lagedo Alto SA)
Niterói Brazil 1,000.00 BRLElectricity generation and sale from renewable resources
Line-by-line
Enel Green Power Brasil Participações LtdaEnel Green Power Desenvolvimento Ltda
99.90%
0.10%
100.00%
Enel Green Power Ventos de Santa Esperança Participações SA (formerly Enel Green Power Cumaru 06 SA)
Niterói Brazil 1,000.00 BRL Holding Line-by-line
Enel Green Power Brasil Participações LtdaEnel Green Power Desenvolvimento Ltda
99.90%
0.10%
100.00%
Enel Green Power Ventos de Santo Orestes 1 SA
Niterói Brazil 1,000.00 BRLElectricity generation and sale from renewable resources
Line-by-line
Enel Green Power Brasil Participações LtdaEnel Green Power Desenvolvimento Ltda
99.90%
0.10%
100.00%
Enel Green Power Ventos de Santo Orestes 2 SA
Niterói Brazil 1,000.00 BRLElectricity generation and sale from renewable resources
Line-by-line
Enel Green Power Brasil Participações LtdaEnel Green Power Desenvolvimento Ltda
99.90%
0.10%
100.00%
Enel Green Power Ventos de São Roque 01 SA
Teresina Brazil 138,001,000.00 BRLElectricity generation from renewable resources
Line-by-line
Enel Green Power Brasil Participações LtdaEnel Green Power Desenvolvimento Ltda
100.00%
0.00%
100.00%
Enel Green Power Ventos de São Roque 02 SA
Teresina Brazil 138,001,000.00 BRLElectricity generation from renewable resources
Line-by-line
Enel Green Power Brasil Participações LtdaEnel Green Power Desenvolvimento Ltda
100.00%
0.00%
100.00%
Enel Green Power Ventos de São Roque 03 SA
Teresina Brazil 1,000.00 BRLElectricity generation from renewable resources
Line-by-line
Enel Green Power Brasil Participações LtdaEnel Green Power Desenvolvimento Ltda
99.90%
0.10%
100.00%
Enel Green Power Ventos de São Roque 04 SA
Teresina Brazil 138,001,000.00 BRLElectricity generation from renewable resources
Line-by-line
Enel Green Power Brasil Participações LtdaEnel Green Power Desenvolvimento Ltda
100.00%
0.00%
100.00%
Enel Green Power Ventos de São Roque 05 SA
Teresina Brazil 1,000.00 BRLElectricity generation from renewable resources
Line-by-line
Enel Green Power Brasil Participações LtdaEnel Green Power Desenvolvimento Ltda
99.90%
0.10%
100.00%
Enel Green Power Ventos de São Roque 06 SA
Teresina Brazil 1,000.00 BRLElectricity generation from renewable resources
Line-by-line
Enel Green Power Brasil Participações LtdaEnel Green Power Desenvolvimento Ltda
99.90%
0.10%
100.00%

203Attachments
Company name Headquarters Country Share capital Currency ActivityConsolidation method Held by % holding
Group % holding
Enel Green Power Ventos de São Roque 07 SA
Teresina Brazil 1,000.00 BRLElectricity generation from renewable resources
Line-by-line
Enel Green Power Brasil Participações LtdaEnel Green Power Desenvolvimento Ltda
99.90%
0.10%
100.00%
Enel Green Power Ventos de São Roque 08 SA
Teresina Brazil 138,001,000.00 BRLElectricity generation from renewable resources
Line-by-line
Enel Green Power Brasil Participações LtdaEnel Green Power Desenvolvimento Ltda
100.00%
0.00%
100.00%
Enel Green Power Ventos de São Roque 11 SA
Teresina Brazil 138,001,000.00 BRLElectricity generation from renewable resources
Line-by-line
Enel Green Power Brasil Participações LtdaEnel Green Power Desenvolvimento Ltda
100.00%
0.00%
100.00%
Enel Green Power Ventos de São Roque 13 SA
Teresina Brazil 1,000.00 BRLElectricity generation from renewable resources
Line-by-line
Enel Green Power Brasil Participações LtdaEnel Green Power Desenvolvimento Ltda
99.90%
0.10%
100.00%
Enel Green Power Ventos de São Roque 16 SA
Teresina Brazil 138,001,000.00 BRLElectricity generation from renewable resources
Line-by-line
Enel Green Power Brasil Participações LtdaEnel Green Power Desenvolvimento Ltda
100.00%
0.00%
100.00%
Enel Green Power Ventos de São Roque 17 SA
Teresina Brazil 138,001,000.00 BRLElectricity generation from renewable resources
Line-by-line
Enel Green Power Brasil Participações LtdaEnel Green Power Desenvolvimento Ltda
100.00%
0.00%
100.00%
Enel Green Power Ventos de São Roque 18 SA
Teresina Brazil 138,001,000.00 BRLElectricity generation from renewable resources
Line-by-line
Enel Green Power Brasil Participações LtdaEnel Green Power Desenvolvimento Ltda
100.00%
0.00%
100.00%
Enel Green Power Ventos de São Roque 19 SA
Teresina Brazil 1,000.00 BRLElectricity generation from renewable resources
Line-by-line
Enel Green Power Brasil Participações LtdaEnel Green Power Desenvolvimento Ltda
99.90%
0.10%
100.00%
Enel Green Power Ventos de São Roque 22 SA
Teresina Brazil 1,000.00 BRLElectricity generation from renewable resources
Line-by-line
Enel Green Power Brasil Participações LtdaEnel Green Power Desenvolvimento Ltda
99.90%
0.10%
100.00%
Enel Green Power Ventos de São Roque 26 SA
Teresina Brazil 1,000.00 BRLElectricity generation from renewable resources
Line-by-line
Enel Green Power Brasil Participações LtdaEnel Green Power Desenvolvimento Ltda
99.90%
0.10%
100.00%
Enel Green Power Ventos de São Roque 29 SA
Teresina Brazil 1,000.00 BRLElectricity generation from renewable resources
Line-by-line
Enel Green Power Brasil Participações LtdaEnel Green Power Desenvolvimento Ltda
99.90%
0.10%
100.00%
Enel Green Power Villoresi Srl Rome Italy 1,200,000.00 EUR
Electricity generation from renewable resources
Line-by-line Enel Green Power Italia Srl 51.00% 51.00%

204 Half-Year Financial Report at June 30, 2020
Company name Headquarters Country Share capital Currency ActivityConsolidation method Held by % holding
Group % holding
Enel Green Power Volta Grande SA (formerly Enel Green Power Projetos 1 SA)
Niterói Brazil 565,756,528.00 BRLElectricity generation and sale from renewable resources
Line-by-line Enel Brasil SA 100.00% 64.14%
Enel Green Power Zambia Limited Lusaka Zambia 15,000.00 ZMW Electricity sale Line-by-line
Enel Green Power Development SrlEnel Green Power RSA (Pty) Ltd
1.00%
99.00%
100.00%
Enel Green Power Zeus II - Delfina 8 SA
Niterói Brazil 140,001,000.00 BRLElectricity generation from renewable resources
Line-by-lineEnel Green Power Brasil Participações Ltda
100.00% 100.00%
Enel Green Power Zeus Sul 1 Ltda Salvador Brazil 6,986,993.00 BRL
Electricity generation from renewable resources
Line-by-lineEnel Green Power Brasil Participações Ltda
100.00% 100.00%
Enel Green Power Zeus Sul 2 SA Niterói Brazil 1,000.00 BRL
Electricity generation and sale from renewable resources
Line-by-line
Enel Green Power Brasil Participações LtdaEnel Green Power Desenvolvimento Ltda
99.90%
0.10%
100.00%
Enel Holding Finance Srl Rome Italy 10,000.00 EUR Holding Line-by-line Enel SpA 100.00% 100.00%
Enel Iberia Srl Madrid Spain 336,142,500.00 EUR Holding Line-by-line Enel SpA 100.00% 100.00%
Enel Innovation Hubs Srl Rome Italy 1,100,000.00 EUR
Civil and mechanical engineering, water systems
Line-by-line Enel SpA 100.00% 100.00%
Enel Insurance NV Amsterdam Netherlands 60,000.00 EUR Reassurance Line-by-line Enel SpA 100.00% 100.00%
Enel Investment Holding BV Amsterdam Netherlands 1,000,000.00 EUR Holding Line-by-line Enel SpA 100.00% 100.00%
Enel Italia SpA Rome Italy 100,000,000.00 EUR
Personnel administration activities, information technology, real estate and business service
Line-by-line Enel SpA 100.00% 100.00%
Enel Kansas LLC Wilmington USA - USDElectricity generation from renewable resources
Line-by-line Enel Green Power North America Inc. 100.00% 100.00%
Enel Minnesota Holdings LLC Minneapolis USA - USD
Electricity generation from renewable resources
Line-by-lineEGP Geronimo Holding Company Inc.
100.00% 100.00%
Enel Nevkan Inc. Wilmington USA - USDElectricity generation from renewable resources
Line-by-line Enel Green Power North America Inc. 100.00% 100.00%
Enel North America Inc. Andover USA 50.00 USD
Electricity generation from renewable resources
Line-by-line Enel SpA 100.00% 100.00%
Enel Operations Canada Ltd Alberta Canada 1,000.00 CAD - Line-by-line Enel Green Power
Canada Inc. 100.00% 100.00%
Enel Perú SAC San Miguel Peru 5,361,789,105.00 SOL Holding Line-by-line Enel Américas SA 100.00% 64.14%
Enel Produzione SpA Rome Italy 1,800,000,000.00 EUR Electricity generation Line-by-line Enel Italia SpA 100.00% 100.00%
Enel Rinnovabile SA de Cv Mexico City Mexico 100.00 MXN Electricity generation Line-by-line
Enel Green Power Global Investment BVHidroelectricidad del Pacífico S de RL de Cv
99.00%
1.00%
100.00%
Enel Roadrunner Solar Project Holdings II LLC
Andover USA - USD
Plant construction and electricity generation from renewable sources
Line-by-line
Enel Green Power Roadrunner Solar Project Holdings II LLC
100.00% 100.00%

205Attachments
Company name Headquarters Country Share capital Currency ActivityConsolidation method Held by % holding
Group % holding
Enel Roadrunner Solar Project Holdings LLC
Dover USA 100.00 USD Renewable energy Line-by-line
Enel Green Power Roadrunner Solar Project Holdings LLC
100.00% 100.00%
Enel Romania SA Buftea Romania 200,000.00 RON Business services Line-by-line Enel SpA 100.00% 100.00%
Enel Rus Wind Azov LLC Moscow Russian
Federation 200,000,000.00 RUB Renewable energy Line-by-line Enel Russia PJSC 100.00% 56.43%
Enel Rus Wind Generation LLC Moscow Russian
Federation 350,000.00 RUB Energy services Line-by-line Enel Russia PJSC 100.00% 56.43%
Enel Rus Wind Kola LLC Murmansk City Russian
Federation 10,000.00 RUB Renewable energy Line-by-line Enel Russia PJSC 100.00% 56.43%
Enel Russia PJSC Yekaterinburg Russian Federation 35,371,898,370.00 RUB Electricity generation Line-by-line Enel SpA 56.43% 56.43%
Enel Salt Wells LLC Fallon USA - USDElectricity generation from renewable resources
Line-by-line Enel Geothermal LLC 100.00% 100.00%
Enel Saudi Arabia Limited Al Khobar Saudi Arabia 1,000,000.00 SAR
Management of activities associated with participation in tenders called by the SEC for the development of smart metering and grid automation
Line-by-line e-distribuzione SpA 60.00% 60.00%
Enel Servicii Comune SA Bucharest Romania 33,000,000.00 RON Energy services Line-by-line
E-Distribučie Banat SAE-Distribučie Dobrogea SA
50.00%
50.00%
51.00%
Enel Solar Srl Panama City Republic of Panama 10,100.00 USD
Electricity generation from renewable resources
Line-by-line
Enel Green Power Panamá SrlEnergía y Servicios South America SpA
99.01%
0.99%
100.00%
Enel Sole Srl Rome Italy 4,600,000.00 EUR Public lighting systems and services Line-by-line Enel Italia SpA 100.00% 100.00%
Enel Soluções Energéticas Ltda Niterói Brazil 42,863,000.00 BRL
Electricity generation from renewable resources
Line-by-line
Enel Green Power Brasil Participações LtdaEnel Green Power Desenvolvimento Ltda
100.00%
0.00%
100.00%
Enel Stillwater LLC Wilmington USA - USDElectricity generation from renewable resources
Line-by-line Enel Geothermal LLC 100.00% 100.00%
Enel Surprise Valley LLC Wilmington USA - USD
Electricity generation from renewable resources
Line-by-line Enel Green Power North America Inc. 100.00% 100.00%
Enel Tecnologia de Redes SA Niterói Brazil 10,000.00 BRL
Electricity generation, transmission, distribution, sale and purchase
Line-by-line Enel Brasil SA 100.00% 64.14%
Enel Texkan Inc. Wilmington USA 100.00 USDElectricity generation from renewable resources
Line-by-line Chi Power Inc. 100.00% 100.00%
Enel Trade doo in liquidation Zagreb Croatia 2,240,000.00 HRK Electricity trading Line-by-line Enel Global Trading
SpA 100.00% 100.00%
Enel Trade Serbia doo Beograd Serbia 300,000.00 EUR Electricity trading Line-by-line Enel Global Trading
SpA 100.00% 100.00%
Enel Trading Argentina Srl Buenos Aires Argentina 14,011,100.00 ARS Electricity trading Line-by-line Enel Américas SA
Enel Argentina SA55.00%45.00% 64.14%

206 Half-Year Financial Report at June 30, 2020
Company name Headquarters Country Share capital Currency ActivityConsolidation method Held by % holding
Group % holding
Enel Trading Brasil SA Niterói Brazil 1,000,000.00 BRL
Electricity generation, transmission, distribution, sale and purchase
Line-by-line Enel Brasil SA 100.00% 64.14%
Enel Trading North America LLC Wilmington USA 10,000,000.00 USD Trading Line-by-line Enel North
America Inc. 100.00% 100.00%
Enel Vayu (Project 2) Private Limited Gurugram India 45,000,000.00 INR
Electricity generation from renewable resources
Line-by-line
Enel Green Power India Private Limited (formerly BLP Energy Private Limited)
100.00% 100.00%
Enel Wind Project (Amberi) Private Limited
New Delhi India 5,000,000.00 INRElectricity generation from renewable resources
Line-by-line
Enel Green Power India Private Limited (formerly BLP Energy Private Limited)
100.00% 100.00%
Enel X Argentina SAU Buenos Aires Argentina 127,800,000.00 ARS Marketing and energy-
related services Line-by-line Enel X International Srl 100.00% 100.00%
Enel X Asputeck Ave. Project LLC Boston USA - USD Any legal activity Line-by-line Enel X Finance
Partner LLC 100.00% 100.00%
Enel X Australia Holding (Pty) Ltd Melbourne Australia 2,324,698.00 AUD Renewable energy Line-by-line Enel X International
Srl 100.00% 100.00%
Enel X Australia (Pty) Ltd Melbourne Australia 9,880.00 AUD Renewable energy Line-by-line Energy Response
Holdings (Pty) Ltd 100.00% 100.00%
Enel X Battery Storage Limited Partnership
Oakville Canada 10,000.00 CAD - Line-by-lineEnel X Canada Holding Inc.Enel X Canada Ltd
0.01%99.99%
100.00%
Enel X Brasil Gerenciamento de Energia Ltda
Sorocaba Brazil 117,240.00 BRL Energy services Line-by-line
Enel X Ireland LimitedEnerNOC Uk II Limited
0.00%
100.00%
100.00%
Enel X Brasil SA Niterói Brazil 115,313,600.00 BRL Electricity Line-by-line
Central Geradora Termelétrica Fortaleza SAEnel Brasil SA
0.00%100.00%
64.14%
Enel X Canada Holding Inc. Oakville Canada 1,000.00 CAD Holding Line-by-line Enel X Canada Ltd 100.00% 100.00%
Enel X Canada Ltd Mississauga Canada 1,000.00 CAD Renewable energy Line-by-line Enel North America Inc. 100.00% 100.00%
Enel X Chile SpA Santiago de Chile Chile 3,800,000,000.00 CLP Services Line-by-line Enel Chile SA 100.00% 64.55%
Enel X College Ave. Project LLC Boston USA - USD Holding Line-by-line Enel X MA
Holdings LLC 100.00% 100.00%
Enel X Colombia SAS Bogotá Colombia 5,000,000,000.00 COP
Installation, maintenance and repair of electronic plant
Line-by-line Codensa SA ESP 100.00% 30.98%
Enel X e-Buses SpA Santiago de Chile Chile 1,000,000.00 CLP E-mobility Line-by-line Enel X Chile SpA 100.00% 64.55%
Enel X Energy (Shanghai) Co. Ltd Shanghai China 3,500,000.00 USD E-mobility Line-by-line Enel X International
Srl 100.00% 100.00%
Enel X Federal LLC Boston USA 5,000.00 USD Renewable energy Line-by-line Enel X North America Inc. 100.00% 100.00%
Enel X Finance Partner LLC Boston USA 100.00 USD Holding Line-by-line Enel X North
America Inc. 100.00% 100.00%
Enel X Financial Services Srl Rome Italy 1,000,000.00 EUR Services Line-by-line Enel X Srl 100.00% 100.00%
Enel X France SAS Paris France 1,000.00 EUR - Line-by-line Enel X International Srl 100.00% 100.00%

207Attachments
Company name Headquarters Country Share capital Currency ActivityConsolidation method Held by % holding
Group % holding
Enel X Hayden Rowe St. Project LLC
Boston USA 100.00 USD Holding Line-by-line Enel X MA Holdings LLC 100.00% 100.00%
Enel X International Srl Rome Italy 100,000.00 EUR Holding Line-by-line Enel X Srl 100.00% 100.00%
Enel X Ireland Limited Dublin Ireland 100,000.00 EUR Renewable energy Line-by-line Enel X International
Srl 100.00% 100.00%
Enel X Italia Srl Rome Italy 200,000.00 EUR Energy services Line-by-line Enel Italia SpA 100.00% 100.00%
Enel X Japan K.K. Tokyo Japan 165,000,000.00 JPY Renewable energy Line-by-line Enel X International Srl 100.00% 100.00%
Enel X Korea Limited Seoul South Korea 1,200,000,000.00 KRW Renewable energy Line-by-line Enel X International
Srl 100.00% 100.00%
Enel X MA Holdings LLC Boston USA 100.00 USD Holding Line-by-line Enel X Finance
Partner LLC 100.00% 100.00%
Enel X Mobility Romania Srl Bucharest Romania 937,800.00 RON Energy services Line-by-line
Enel X International SrlEnel X Srl
99.00%1.00%
100.00%
Enel X Mobility Srl Rome Italy 100,000.00 EUR E-mobility Line-by-line Enel Italia SpA 100.00% 100.00%
Enel X Morrissey Blvd. Project LLC Boston USA 100.00 USD Holding Line-by-line Enel X Finance
Partner LLC 100.00% 100.00%
Enel X New Zealand Limited Wellington New Zealand 313,606.00 AUD Renewable energy Line-by-line Energy Response
Holdings (Pty) Ltd 100.00% 100.00%
Enel X North America Inc. Boston USA 1,000.00 USD Renewable energy Line-by-line Enel North
America Inc. 100.00% 100.00%
Enel X Norway AS Porsgrunn Norway 1,000,000.00 NOK Services Line-by-line Enel X International Srl 100.00% 100.00%
Enel X Perú SAC San Miguel Peru 3,005,000.00 SOL E-mobility Line-by-line Enel Perú SAC 100.00% 64.14%
Enel X Polska Sp. Zo.o. Warsaw Poland 3,863,450.00 PLN Renewable energy Line-by-line Enel X Ireland
Limited 100.00% 100.00%
Enel X Romania Srl Bucharest Romania 234,450.00 RON Energy services Line-by-lineEnel X International SrlEnel X Srl
99.00%1.00% 100.00%
Enel X Rus LLC Moscow Russian Federation 8,000,000.00 RUB - Line-by-line Enel X International
Srl 99.00% 99.00%
Enel X Srl Rome Italy 1,050,000.00 EUR Holding. Energy services Line-by-line Enel SpA 100.00% 100.00%
Enel X Services India Private Limited
Mumbai City India 45,000.00 INR Engineering and consulting services Line-by-line
Enel X International SrlEnel X North America Inc.
100.00%
0.00%
100.00%
Enel X Singapore Pte Ltd Singapore Singapore 1,212,000.00 SGD Energy services Line-by-line Enel X International
Srl 100.00% 100.00%
Enel X Sweden AB Stockholm Sweden 50,000.00 SEK Services Line-by-line Enel X International Srl 100.00% 100.00%
Enel X Taiwan Co. Ltd Taipei City Taiwan 65,000,000.00 TWD Renewable energy Line-by-line Enel X Ireland
Limited 100.00% 100.00%
Enel X Uk Limited London United Kingdom 32,626.00 GBP Renewable energy Line-by-line Enel X International Srl 100.00% 100.00%
Enel.si Srl Rome Italy 5,000,000.00 EUR Plant engineering and energy services Line-by-line Enel Italia SpA 100.00% 100.00%
Enelco SA Maroussi Greece 60,108.80 EURPlant construction, operation and maintenance
Line-by-line Enel Investment Holding BV 75.00% 75.00%
Enelpower Contractor and Development Saudi Arabia Ltd
Riyadh Saudi Arabia 5,000,000.00 SAR
Plant construction, operation and maintenance Line-by-line Enelpower SpA 51.00% 51.00%

208 Half-Year Financial Report at June 30, 2020
Company name Headquarters Country Share capital Currency ActivityConsolidation method Held by % holding
Group % holding
Enelpower do Brasil Ltda Niterói Brazil 5,068,000.00 BRL Electrical engineering Line-by-line
Enel Green Power Brasil Participações LtdaEnergía y Servicios South America SpA
100.00%
0.00%
100.00%
Enelpower SpA Milan Italy 2,000,000.00 EURDesign, development and maintenance of engineering plants
Line-by-line Enel SpA 100.00% 100.00%
Energética Monzón SAC San Miguel Peru 6,463,000.00 SOL
Electricity generation from renewable resources
Line-by-line
Enel Green Power Perú SACEnergía y Servicios South America SpA
100.00%
0.00%
100.00%
Energía Ceuta XXI Comercializadora de Referencia SA
Ceuta Spain 65,000.00 EUR Electricity supply Line-by-line
Empresa de Alumbrado Eléctrico de Ceuta SA
100.00% 67.55%
Energía Eólica Alto del Llano SLU Madrid Spain 3,300.00 EUR Renewable energy Line-by-line Enel Green Power
España SL 100.00% 70.10%
Energia Eolica Srl - EN.EO. Srl Rome Italy 4,840,000.00 EUR
Electricity generation from renewable resources
Line-by-line Enel Green Power Italia Srl 100.00% 100.00%
Energía Global de México (Enermex) SA de Cv
Mexico City Mexico 50,000.00 MXNElectricity generation from renewable resources
Line-by-line Enel Green Power SpA 99.00% 99.00%
Energía Global Operaciones Srl San José Costa Rica 10,000.00 CRC Marketing and energy-
related services Line-by-line Enel Green Power Costa Rica SA 100.00% 100.00%
Energía Limpia de Amistad SA de Cv Mexico City Mexico 33,452,769.00 MXN
Electricity generation from renewable resources
Equity
Tenedora de Energía Renovable Sol y Viento SAPI de Cv
60.80% 20.00%
Energía Limpia de Palo Alto SA de Cv Mexico City Mexico 673,583,489.00 MXN
Electricity generation from renewable resources
Equity
Tenedora de Energía Renovable Sol y Viento SAPI de Cv
60.80% 20.00%
Energía Limpia de Puerto Libertad S de RL de Cv
Mexico City Mexico 2,953,980.00 MXNElectricity generation from renewable resources
Line-by-line
Enel Green Power México S de RL de CvEnel Rinnovabile SA de Cv
0.01%
99.99%
100.00%
Energía Marina SpA Santiago de Chile Chile 2,404,240,000.00 CLP
Electricity generation from renewable resources
Equity Enel Green Power Chile SA 25.00% 16.14%
Energía Neta Sa Caseta Llucmajor SL (Sociedad Unipersonal)
Palma de Mallorca Spain 9,000.00 EURElectricity generation from renewable resources
Line-by-line Enel Green Power España SL 100.00% 70.10%
Energía Nueva de Iguu S de RL de Cv Mexico City Mexico 51,879,307.00 MXN
Electricity generation from renewable resources
Line-by-line
Enel Green Power México S de RL de CvEnergía Nueva Energía Limpia México S de RL de Cv
99.90%
0.01%
99.91%
Energía Nueva Energía Limpia México S de RL de Cv
Mexico City Mexico 5,339,650.00 MXNElectricity generation from renewable resources
Line-by-line
Enel Green Power Guatemala SAEnel Green Power SpA
0.04%
99.96%
100.00%
Energía XXI Comercializadora de Referencia SL
Madrid Spain 2,000,000.00 EUR Marketing and energy-related services Line-by-line Endesa Energía SA 100.00% 70.10%
Energía y Servicios South America SpA
Santiago de Chile Chile 143,290,951.73 USDElectricity generation from renewable resources
Line-by-line Enel Green Power SpA 100.00% 100.00%

209Attachments
Company name Headquarters Country Share capital Currency ActivityConsolidation method Held by % holding
Group % holding
Energías Alternativas del Sur SL
Las Palmas de Gran Canaria Spain 546,919.10 EUR
Electricity generation from renewable resources
Line-by-line Enel Green Power España SL 54.95% 38.52%
Energías de Aragón I SL Zaragoza Spain 3,200,000.00 EUR
Electricity transmission, distribution and sale
Line-by-lineEndesa Red SA (Sociedad Unipersonal)
100.00% 70.10%
Energías de Graus SL Barcelona Spain 1,298,160.00 EUR Hydroelectric plants Line-by-line Enel Green Power
España SL 66.67% 46.73%
Energías Especiales de Careón SA
Santiago de Compostela Spain 270,450.00 EUR
Electricity generation from renewable resources
Line-by-line Enel Green Power España SL 77.00% 53.98%
Energías Especiales de Peña Armada SA
Madrid Spain 963,300.00 EURElectricity generation from renewable resources
Line-by-line Enel Green Power España SL 80.00% 56.08%
Energías Especiales del Alto Ulla SA
Madrid Spain 19,594,860.00 EURElectricity generation from renewable resources
Line-by-line Enel Green Power España SL 100.00% 70.10%
Energías Especiales del Bierzo SA
Torre del Bierzo Spain 1,635,000.00 EURElectricity generation from renewable resources
Equity Enel Green Power España SL 50.00% 35.05%
Energías Renovables La Mata SA de Cv
Mexico City Mexico 656,615,400.00 MXNElectricity generation from renewable resources
Line-by-line
Enel Green Power México S de RL de CvEnergía Nueva de Iguu S de RL de Cv
99.00%
1.00%
100.00%
Energie Electrique de Tahaddart SA Marrakech Morocco 750,400,000.00 MAD Combined-cycle
generation plants Equity Endesa Generación SA 32.00% 22.43%
Energotel AS Bratislava Slovakia 2,191,200.00 EUR Operation of optical fiber network Equity Slovenské
elektrárne AS 20.00% 6.60%
Energy Hydro Piave Srl in liquidation Belluno Italy 800,000.00 EUR Electricity purchasing
and sale Line-by-line Enel Produzione SpA 51.00% 51.00%
Energy Response Holdings (Pty) Ltd Melbourne Australia 630,451.00 AUD Renewable energy Line-by-line Enel X Australia
Holding (Pty) Ltd 100.00% 100.00%
Enerlive Srl Rome Italy 6,520,000.00 EURElectricity generation from renewable resources
Line-by-line Maicor Wind Srl 100.00% 100.00%
EnerNOC GmbH Munich Germany 25,000.00 EUR Renewable energy Line-by-line Enel X North America Inc. 100.00% 100.00%
EnerNOC Ireland Limited Dublin Ireland 100,000.00 EUR Renewable energy Line-by-line Enel X Ireland
Limited 100.00% 100.00%
EnerNOC Uk II Limited London United Kingdom 21,000.00 GBP Renewable energy Line-by-line Enel X Uk Limited 100.00% 100.00%
Entech (China) Information Technology Co. Ltd
Shenzhen China 1,500.00 EUR Renewable energy Equity EnerNOC Uk II Limited 50.00% 50.00%
Entech Utility Service Bureau Inc. Lutherville USA 1,500.00 USD Renewable energy Line-by-line Enel X North
America Inc. 100.00% 100.00%
Envatios Promoción I SLU Seville Spain 3,000.00 EUR Photovoltaic plants Line-by-line Enel Green Power
España SL 100.00% 70.10%
Envatios Promoción II SLU Seville Spain 3,000.00 EUR Photovoltaic systems Line-by-line Enel Green Power
España SL 100.00% 70.10%
Envatios Promoción III SLU Seville Spain 3,000.00 EUR Photovoltaic systems Line-by-line Enel Green Power
España SL 100.00% 70.10%
Envatios Promoción XX SLU Seville Spain 3,000.00 EUR Photovoltaic plants Line-by-line Enel Green Power
España SL 100.00% 70.10%
Eólica del Cierzo SLU Zaragoza Spain 225,000.00 EUR Renewable energy Line-by-line Enel Green Power
España SL 100.00% 70.10%

210 Half-Year Financial Report at June 30, 2020
Company name Headquarters Country Share capital Currency ActivityConsolidation method Held by % holding
Group % holding
Eólica del Principado SAU Gijón - Asturias Spain 60,000.00 EUR
Electricity generation from renewable resources
Line-by-line Enel Green Power España SL 100.00% 70.10%
Eólica Valle del Ebro SA Zaragoza Spain 3,561,342.50 EUR
Electricity generation from renewable resources
Line-by-line Enel Green Power España SL 50.50% 35.40%
Eólica Zopiloapan SA de Cv Mexico City Mexico 1,877,201.54 MXN
Electricity generation from renewable resources
Line-by-line
Enel Green Power México S de RL de CvEnel Green Power Partecipazioni Speciali Srl
56.98%
39.50%
96.48%
Eólicas de Agaete SL
Las Palmas de Gran Canaria Spain 240,400.00 EUR
Electricity generation from renewable resources
Line-by-line Enel Green Power España SL 80.00% 56.08%
Eólicas de Fuencaliente SA
Las Palmas de Gran Canaria Spain 216,360.00 EUR
Electricity generation from renewable resources
Line-by-line Enel Green Power España SL 55.00% 38.56%
Eólicas de Fuerteventura AIE Puerto del Rosario Spain - EUR
Electricity generation from renewable resources
Equity Enel Green Power España SL 40.00% 28.04%
Eólicas de la Patagonia SA Buenos Aires Argentina 480,930.00 ARS
Electricity generation from renewable resources
Equity Enel Green Power España SL 50.00% 35.05%
Eólicas de Lanzarote SL
Las Palmas de Gran Canaria Spain 1,758,000.00 EUR Electricity generation
and distribution Equity Enel Green Power España SL 40.00% 28.04%
Eólicas de Tenerife AIE
Santa Cruz de Tenerife Spain 420,708.40 EUR
Electricity generation from renewable resources
Equity Enel Green Power España SL 50.00% 35.05%
Eólicas de Tirajana SL
Las Palmas de Gran Canaria Spain 3,000.00 EUR
Electricity generation from renewable resources
Line-by-line Enel Green Power España SL 60.00% 42.06%
European Energy Exchange AG Leipzig Germany 40,050,000.00 EUR Commodity trading - Enel Global Trading
SpA 2.33% 2.33%
Explotaciones Eólicas de Escucha SA
Zaragoza Spain 3,505,000.00 EURElectricity generation from renewable resources
Line-by-line Enel Green Power España SL 70.00% 49.07%
Explotaciones Eólicas El Puerto SA
Teruel Spain 3,230,000.00 EURElectricity generation from renewable resources
Line-by-line Enel Green Power España SL 73.60% 51.59%
Explotaciones Eólicas Santo Domingo de Luna SA
Zaragoza Spain 100,000.00 EURElectricity generation from renewable resources
Line-by-line Enel Green Power España SL 51.00% 35.75%
Explotaciones Eólicas Saso Plano SA
Zaragoza Spain 5,488,500.00 EURElectricity generation from renewable resources
Line-by-line Enel Green Power España SL 65.00% 45.57%
Explotaciones Eólicas Sierra Costera SA
Zaragoza Spain 8,046,800.00 EURElectricity generation from renewable resources
Line-by-line Enel Green Power España SL 90.00% 63.09%
Explotaciones Eólicas Sierra La Virgen SA
Zaragoza Spain 4,200,000.00 EURElectricity generation from renewable resources
Line-by-line Enel Green Power España SL 90.00% 63.09%
Fence Post Solar Project LLC Andover USA - USD
Electricity generation from renewable resources
Line-by-line Enel Kansas LLC 100.00% 100.00%
Fenner Wind Holdings LLC Dover USA 100.00 USD Holding Line-by-line Enel Kansas LLC 100.00% 100.00%
Finsec Lab Ltd Tel Aviv Israel 100.00 ILS Any legal activity Equity Enel X Srl 30.00% 30.00%
Flagpay Srl Milan Italy 10,000.00 EUR Services Line-by-line PayTipper SpA 100.00% 55.00%

211Attachments
Company name Headquarters Country Share capital Currency ActivityConsolidation method Held by % holding
Group % holding
Flat Rock Wind Project LLC Andover USA 1.00 USD
Electricity generation and sale from renewable resources
Line-by-line Tradewind Energy Inc. 100.00% 100.00%
Flat Top Solar Project LLC Andover USA - USD
Electricity generation, transmission, distribution, sale and purchase
Line-by-line Enel Kansas LLC 100.00% 100.00%
Flint Rock Solar Project LLC Andover USA - USD
Electricity generation from renewable resources
Line-by-line Enel Kansas LLC 100.00% 100.00%
Florence Hills LLC Minneapolis USA - USDElectricity generation from renewable resources
Line-by-line Chi Minnesota Wind LLC 51.00% 51.00%
Fótons de Santo Anchieta Energias Renováveis SA
Niterói Brazil 577,000.00 BRLElectricity generation from renewable resources
Line-by-lineEnel Green Power Brasil Participações Ltda
100.00% 100.00%
Fotovoltaica Yunclillos SLU Madrid Spain 3,000.00 EUR Photovoltaic systems Line-by-line Enel Green Power
España SL 100.00% 70.10%
Fourmile Wind Project LLC Andover USA 1.00 USD
Electricity generation and sale from renewable resources
Line-by-line Tradewind Energy Inc. 100.00% 100.00%
Fowler Hydro LLC Wilmington USA - USDElectricity generation from renewable resources
AFS Enel Green Power North America Inc. 100.00% 100.00%
Freedom Energy Storage LLC Andover USA - USD
Electricity generation from renewable resources
Line-by-line
Enel Energy Storage Holdings LLC (formerly EGP Energy Storage Holdings LLC)
100.00% 100.00%
Front Marítim delBesòs SL Barcelona Spain 9,000.00 EUR Real estate Equity Endesa
Generación SA 61.37% 43.02%
Furatena Solar 1 SLU Seville Spain 3,000.00 EUR
Electricity generation from renewable resources
Line-by-line Enel Green Power España SL 100.00% 70.10%
Galaxy Wind Project LLC Andover USA 1.00 USD
Electricity generation and sale from renewable resources
Line-by-line Tradewind Energy Inc. 100.00% 100.00%
Garob Wind Farm (RF) (Pty) Ltd Johannesburg South Africa 100.00 ZAR
Electricity generation and sale from renewable resources
Line-by-lineEnel Green Power RSA 2 (RF) (Pty) Ltd
60.00% 60.00%
Gas y Electricidad Generación SAU Palma de Mallorca Spain 213,775,700.00 EUR Electricity generation Line-by-line Endesa
Generación SA 100.00% 70.10%
Gauley Hydro LLC Wilmington USA - USDElectricity generation from renewable resources
Equity GRPP Holdings LLC 100.00% 50.00%
Gauley River Management LLC Willison USA 1.00 USD
Electricity generation from renewable resources
Line-by-line Enel Green Power North America Inc. 100.00% 100.00%
Genability Inc. San Francisco USA 6,010,074.72 USD Energy services Equity Enel X North America Inc. 50.00% 50.00%
Generadora de Occidente Ltda Guatemala City Guatemala 16,261,697.33 GTQ
Electricity generation from renewable resources
Line-by-line
Enel Green Power Guatemala SAEnel Green Power SpA
1.00%
99.00%
100.00%
Generadora Eólica Alto Pacora Srl Panama City Republic of
Panama 10,100.00 USDElectricity generation from renewable resources
Line-by-line
Enel Green Power Panamá SrlEnergía y Servicios South America SpA
99.01%
0.99%
100.00%
Generadora Montecristo SA Guatemala City Guatemala 3,820,000.00 GTQ
Electricity generation from renewable resources
Line-by-line
Enel Green Power Guatemala SAEnel Green Power SpA
0.01%
99.99%
100.00%

212 Half-Year Financial Report at June 30, 2020
Company name Headquarters Country Share capital Currency ActivityConsolidation method Held by % holding
Group % holding
Generadora Solar Tolé Srl Panama City Republic of
Panama 10,100.00 USDElectricity generation from renewable resources
Line-by-line
Enel Green Power Panamá SrlEnergía y Servicios South America SpA
99.01%
0.99%
100.00%
Geotérmica del Norte SA Santiago de Chile Chile 326,577,419,702.00 CLP
Electricity generation from renewable resources
Line-by-line Enel Green Power Chile SA 84.59% 54.60%
Gibson Bay Wind Farm (RF) (Pty) Ltd Johannesburg South Africa 1,000.00 ZAR
Electricity generation from renewable resources
Line-by-line Enel Green Power RSA (Pty) Ltd 60.00% 60.00%
Girgarre Solar Farm (Pty) Ltd Sydney Australia - AUD Renewable energy Line-by-line
Enel Green Power Girgarre Holdings (Pty) Ltd
100.00% 100.00%
Global Commodities Holdings Limited
London United Kingdom 4,042,375.00 GBPCoal trading and related activities - Enel Global Trading
SpA 4.68% 4.68%
Globyte SA San José Costa Rica 900,000.00 CRC Marketing and energy-related services - Enel Green Power
Costa Rica SA 10.00% 10.00%
Gnl Chile SA Santiago de Chile Chile 3,026,160.00 USD Design and LNG supply Equity Enel Generación
Chile SA 33.33% 20.13%
Goodwell Wind Project LLC Wilmington USA - USD
Electricity generation from renewable resources
Equity Origin Goodwell Holdings LLC 100.00% 20.00%
Goodyear Lake Hydro LLC Wilmington USA - USD
Electricity generation from renewable resources
AFS Enel Green Power North America Inc. 100.00% 100.00%
Gorona del Viento El Hierro SA
Santa Cruz de Tenerife Spain 30,936,736.00 EUR
Development and maintenance of El Hierro generation plant
EquityUnión Eléctrica de Canarias Generación SAU
23.21% 16.27%
Grand Prairie Solar Project LLC Andover USA - USD
Electricity generation from renewable resources
Line-by-line Tradewind Energy Inc. 100.00% 100.00%
GRPP Holdings LLC Andover USA 2.00 USD
Electricity generation from renewable resources
Equity EGPNA REP Holdings LLC 50.00% 50.00%
Guadarranque Solar 4 SLU Seville Spain 3,006.00 EUR
Electricity generation from renewable resources
Line-by-line Endesa Generación II SA 100.00% 70.10%
Gusty Hill Wind Project LLC Andover USA 1.00 USD
Electricity generation and sale from renewable resources
Line-by-line Tradewind Energy Inc. 100.00% 100.00%
GV Energie Rigenerabili ITAL-RO Srl
Bucharest Romania 1,145,400.00 RONElectricity generation from renewable resources
Line-by-line
Enel Green Power Romania SrlEnel Green Power SpA
100.00%
0.00%
100.00%
Hadley Ridge LLC Minneapolis USA - USDElectricity generation from renewable resources
Line-by-line Chi Minnesota Wind LLC 51.00% 51.00%
Hamilton County Solar Project LLC Andover USA 1.00 USD
Electricity generation and sale from renewable resources
Line-by-line Tradewind Energy Inc. 100.00% 100.00%
Hansborough Valley Solar Project LLC
- USA - USD
Plant construction and electricity generation from renewable sources
Line-by-line Enel Kansas LLC 100.00% 100.00%
Harvest Ridge Solar Project LLC Andover USA - USD
Electricity generation from renewable resources
Line-by-line Enel Kansas LLC 100.00% 100.00%
Harvest Ridge Wind Project LLC Andover USA 1.00 USD
Electricity generation and sale from renewable resources
Line-by-line Tradewind Energy Inc. 100.00% 100.00%

213Attachments
Company name Headquarters Country Share capital Currency ActivityConsolidation method Held by % holding
Group % holding
Hastings Solar LLC Wilmington USA - USDElectricity generation from renewable resources
Line-by-line Aurora Distributed Solar LLC 100.00% 73.51%
Hatch Data Inc. San Francisco USA 10,000.00 USD - Enel X North America Inc. 5.00% 5.00%
Haystack Wind Project LLC Andover USA 1.00 USD
Electricity generation and sale from renewable resources
Line-by-line Tradewind Energy Inc. 100.00% 100.00%
Heartland Farms Wind Project LLC Wilmington USA 1.00 USD - Line-by-line Enel Kansas LLC 100.00% 100.00%
Hidroeléctrica de Catalunya SL Barcelona Spain 126,210.00 EUR Electricity transmission
and distribution Line-by-lineEndesa Red SA (Sociedad Unipersonal)
100.00% 70.10%
Hidroeléctrica de Ourol SL Lugo Spain 1,608,200.00 EUR
Electricity generation from renewable resources
Equity Enel Green Power España SL 30.00% 21.03%
Hidroelectricidad del Pacífico S de RL de Cv
Colima Mexico 30,890,736.00 MXNElectricity generation from renewable resources
Line-by-lineEnel Green Power México S de RL de Cv
99.99% 99.99%
Hidroflamicell SL Barcelona Spain 78,120.00 EUR Electricity distribution and sale Line-by-line Hidroeléctrica de
Catalunya SL 75.00% 52.58%
Hidroinvest SA Buenos Aires Argentina 55,312,093.00 ARS Holding Line-by-line Enel Américas SAEnel Argentina SA
41.94%54.76% 62.03%
High Chaparral Solar Project LLC Andover USA - USD
Electricity generation from renewable resources
Line-by-line Enel Kansas LLC 100.00% 100.00%
High Lonesome Storage LLC Andover USA 1.00 USD Holding. Electricity
generation Line-by-line Enel Kansas LLC 100.00% 100.00%
High Lonesome Wind Holdings LLC Wilmington USA 100.00 USD Holding Line-by-line Enel Kansas LLC 99.09% 99.09%
High Lonesome Wind Power LLC Boston USA 100.00 USD Renewable energy Line-by-line
High Lonesome Wind Holdings LLC
100.00% 99.09%
High Noon Solar Project LLC Andover USA - USD
Electricity generation from renewable resources
Line-by-line Enel Kansas LLC 100.00% 100.00%
High Street Corporation (Pty) Ltd
Melbourne Australia 2.00 AUD Renewable energy Line-by-line Energy Response Holdings (Pty) Ltd 100.00% 100.00%
Highfalls Hydro Company Inc. Wilmington USA 3,000.00 USD
Electricity generation from renewable resources
Line-by-line Enel Green Power North America Inc. 100.00% 100.00%
Hilltopper Wind Holdings LLC Wilmington USA 1,000.00 USD Renewable energy Line-by-line Enel Kansas LLC 100.00% 100.00%
Hispano Generación de Energía Solar SL
Jerez de los Caballeros Spain 3,500.00 EUR
Electricity generation from renewable resources
Line-by-line Enel Green Power España SL 51.00% 35.75%
Hope Creek LLC Crestview USA - USDElectricity generation from renewable resources
Line-by-line Chi Minnesota Wind LLC 51.00% 51.00%
Hope Ridge Wind Project LLC Andover USA 1.00 USD
Electricity generation and sale from renewable resources
Line-by-line Tradewind Energy Inc. 100.00% 100.00%
Hubject GmbH Berlin Germany 65,943.00 EUR E-mobility - Enel X International Srl 12.50% 12.50%
Hydro Energies Corporation Willison USA 5,000.00 USD
Electricity generation from renewable resources
AFS Enel Green Power North America Inc. 100.00% 100.00%

214 Half-Year Financial Report at June 30, 2020
Company name Headquarters Country Share capital Currency ActivityConsolidation method Held by % holding
Group % holding
Idalia Park Solar Project LLC Andover USA - USD
Electricity generation from renewable resources
Line-by-line Enel Kansas LLC 100.00% 100.00%
Idrosicilia SpA Milan Italy 22,520,000.00 EUR Hydro-electric activities Equity Enel SpA 1.00% 1.00%
I-EM SAT Ltd Didcot, Oxfordshire United Kingdom 100.00 GBP ICT Equity I-EM Srl 100.00% 30.00%
I-EM Srl Turin Italy 28,571.43 EUR Design and development Equity Enel Italia SpA 30.00% 30.00%
Ifx Networks Argentina Srl Buenos Aires Argentina 2,260,551.00 ARS - Equity
Ifx/eni - Spc V Inc.Minority Stock Holding Corp.
99.85%
0.15%20.60%
Ifx Networks Chile SA Santiago de Chile Chile 5,761,374,444.00 CLP - Equity
Ifx/eni - Spc IV Inc.Servicios de Internet Eni Chile Ltda
41.00%
59.00%
20.59%
Ifx Networks Colombia SAS Bogotá Colombia 15,734,959,000.00 COP - Equity
Ifx Networks Panama SAIfx/eni - Spc III Inc.
58.33%41.67%
20.60%
Ifx Networks LLC Wilmington USA 80,848,653.00 USD - Equity Ufinet Latam SLU 100.00% 20.60%
Ifx Networks Ltd Tortola Virgin Islands 100,000.00 USD - Equity Ifx Networks LLC 100.00% 20.60%
Ifx Networks Panama SA Panama City Republic of
Panama 21,000.00 USD - Equity Ifx/eni - Spc Panama Inc. 100.00% 20.60%
Ifx/eni - Spc III Inc. Tortola Virgin Islands 50,000.00 USD - Equity Ifx Networks Ltd 100.00% 20.60%
Ifx/eni - Spc IV Inc. Tortola Virgin Islands 50,000.00 USD - Equity Ifx Networks Ltd 100.00% 20.60%
Ifx/eni - Spc Panama Inc. Tortola Virgin Islands 50,000.00 USD - Equity Ifx Networks Ltd 100.00% 20.60%
Ifx/eni - Spc V Inc. Tortola Virgin Islands 50,000.00 USD - Equity Ifx Networks Ltd 100.00% 20.60%
Inertia Solar Project LLC Andover USA - USD
Electricity generation from renewable resources
Line-by-line Enel Kansas LLC 100.00% 100.00%
Inertia Wind Project LLC Andover USA - USD
Electricity generation from renewable resources
Line-by-line Enel Kansas LLC 100.00% 100.00%
Inkolan Información y Coordinación de obras AIE
Bilbao Spain 84,141.68 EURInformation on infrastructure of Inkolan associates
Equity
Edistribución Redes Digitales SL (Sociedad Unipersonal)
14.29% 10.01%
International Endesa BV Amsterdam Netherlands 15,428,520.00 EUR Holding Line-by-line Endesa SA 100.00% 70.10%
International Multimedia University Srl in bankrupticy
Rome Italy 24,000.00 EUR Training - Enel Italia SpA 13.04% 13.04%
Inversora Codensa SAS Bogotá Colombia 5,000,000.00 COP Electricity transmission
and distribution Line-by-line Codensa SA ESP 100.00% 30.98%
Inversora Dock Sud SA Buenos Aires Argentina 828,941,660.00 ARS Holding Line-by-line Enel Américas SA 57.14% 36.65%
Isamu Ikeda Energia SA Niterói Brazil 45,474,475.77 BRL Electricity generation
and sale Line-by-lineEnel Green Power Brasil Participações Ltda
100.00% 100.00%
Italgest Energy (Pty) Ltd Johannesburg South Africa 1,000.00 ZAR
Electricity generation from renewable resources
Line-by-line Enel Green Power RSA (Pty) Ltd 100.00% 100.00%
Jack River LLC Minneapolis USA - USDElectricity generation from renewable resources
Line-by-line Chi Minnesota Wind LLC 51.00% 51.00%

215Attachments
Company name Headquarters Country Share capital Currency ActivityConsolidation method Held by % holding
Group % holding
Jade Energia Ltda Conceição do Jacuípe Brazil 4,107,097.00 BRL
Electricity generation from renewable resources
Line-by-lineEnel Green Power Brasil Participações Ltda
100.00% 100.00%
Jaguito Solar 10 MW SA Panama City Republic of
Panama 10,000.00 USDElectricity generation from renewable resources
Line-by-line Enel Green Power Panamá Srl 100.00% 100.00%
Jessica Mills LLC Minneapolis USA - USDElectricity generation from renewable resources
Line-by-line Chi Minnesota Wind LLC 51.00% 51.00%
Juicenet GmbH Berlin Germany 25,000.00 EUR Renewable energy Line-by-line Enel X International Srl 100.00% 100.00%
Juicenet Ltd London United Kingdom 1.00 GBP - Line-by-line Enel X International Srl 100.00% 100.00%
Julia Hills LLC Minneapolis USA - USDElectricity generation from renewable resources
Line-by-line Chi Minnesota Wind LLC 51.00% 51.00%
Kavacik EolíkoEnerjí ElektríkÜretím Ve Tícaret Anoním čírketí
Istanbul Turkey 9,000,000.00 TRYElectricity generation from renewable resources
Line-by-line
Enel Green Power Turkey Enerjí Yatirimlari Anoním čírketí
100.00% 100.00%
Kelley’s Falls LLC Wilmington USA - USDElectricity generation from renewable resources
AFS Enel Green Power North America Inc. 100.00% 100.00%
Kings River Hydro Company Inc. Wilmington USA 100.00 USD
Electricity generation from renewable resources
Line-by-line Enel Green Power North America Inc. 100.00% 100.00%
Kingston Energy Storage LLC Wilmington USA - USD Renewable energy Line-by-line
Enel Energy Storage Holdings LLC (formerly EGP Energy Storage Holdings LLC)
100.00% 100.00%
Kinneytown Hydro Company Inc. Wilmington USA 100.00 USD
Electricity generation from renewable resources
AFS Enel Green Power North America Inc. 100.00% 100.00%
Kino Contractor SA de Cv Mexico City Mexico 100.00 MXN
Electricity generation from renewable resources
Line-by-line
Enel Green Power México S de RL de CvHidroelectricidad del Pacífico S de RL de Cv
99.00%
1.00%
100.00%
Kino Facilities Manager SA de Cv Mexico City Mexico 100.00 MXN
Electricity generation from renewable resources
Line-by-line
Enel Green Power México S de RL de CvHidroelectricidad del Pacífico S de RL de Cv
99.00%
1.00%
100.00%
Kirklarelí EolíkoEnerjí ElektríkÜretím Ve Tícaret Anoním čírketí
Istanbul Turkey 5,250,000.00 TRY - Line-by-line
Enel Green Power Turkey Enerjí Yatirimlari Anoním čírketí
100.00% 100.00%
Kongul EnerjíSanayí Ve Tícaret Anoním čírketí
Istanbul Turkey 125,000,000.00 TRYElectricity generation from renewable resources
Line-by-line
Enel Green Power Turkey Enerjí Yatirimlari Anoním čírketí
100.00% 100.00%
Koporie WPS LLC - Russian Federation 21,000,000.00 RUB Renewable energy Line-by-line
Enel Green Power Rus Limited Liability Company
100.00% 100.00%
Korea Line Corporation Seoul South Korea 122,132,520,000.00 KRW Shipping - Enel Global Trading
SpA 0.25% 0.25%
Kromschroeder SA Barcelona Spain 627,126.00 EUR Services Equity
Endesa Medios y Sistemas SL (Sociedad Unipersonal)
29.26% 20.51%

216 Half-Year Financial Report at June 30, 2020
Company name Headquarters Country Share capital Currency ActivityConsolidation method Held by % holding
Group % holding
Lake Emily Solar LLC Wilmington USA - USD
Electricity generation from renewable resources
Line-by-line Aurora Distributed Solar LLC 100.00% 73.51%
Lake Pulaski Solar LLC Wilmington USA - USD
Electricity generation from renewable resources
Line-by-line Aurora Distributed Solar LLC 100.00% 73.51%
Land Run Wind Project LLC Dover USA 100.00 USD Renewable energy Line-by-line Sundance Wind
Project LLC 100.00% 100.00%
Lawrence Creek Solar LLC Minneapolis USA - USD - Line-by-line Aurora Distributed
Solar LLC 100.00% 73.51%
Liberty Energy Storage LLC Andover USA - USD
Electricity generation from renewable resources
Line-by-line
Enel Energy Storage Holdings LLC (formerly EGP Energy Storage Holdings LLC)
100.00% 100.00%
Libyan Italian Joint Company - Azienda Libico-Italiana (A.L.I.)
Tripoli Libya 1,350,000.00 EUR Electricity generation - Enelpower SpA 0.33% 0.33%
Lily Solar LLC Andover USA - USDElectricity generation from renewable resources
Line-by-line Enel Kansas LLC 100.00% 100.00%
Lindahl Wind Holdings LLC Wilmington USA - USD
Electricity generation from renewable resources
Line-by-lineEGPNA Preferred Wind Holdings LLC
100.00% 100.00%
Lindahl Wind Project LLC Wilmington USA - USD
Electricity generation from renewable resources
Line-by-line Lindahl Wind Holdings LLC 100.00% 100.00%
Little Elk Wind Holdings LLC Wilmington USA - USD
Electricity generation from renewable resources
Line-by-line Enel Kansas LLC 100.00% 100.00%
Little Elk Wind Project LLC Wilmington USA - USD
Electricity generation from renewable resources
Line-by-line Little Elk Wind Holdings LLC 100.00% 100.00%
Little Salt Solar Project LLC Andover USA - USD
Electricity generation from renewable resources
Line-by-line Enel Kansas LLC 100.00% 100.00%
Littleville Power Company Inc. Boston USA 100.00 USD
Electricity generation from renewable resources
AFS Enel Green Power North America Inc. 100.00% 100.00%
Litus Energy Storage LLC Andover USA - USD
Electricity generation from renewable resources
Line-by-line
Enel Energy Storage Holdings LLC (formerly EGP Energy Storage Holdings LLC)
100.00% 100.00%
Livister Guatemala SA Guatemala City Guatemala 1,299,900.00 GTQ - Equity
Ufinet Guatemala SAUfinet Latam SLU
2.00%98.00%
20.60%
Livister Honduras SA Tegucigalpa Honduras 2,500,000.00 HNL Holding Equity
Livister Guatemala SALivister Latam SLU
0.40%99.60%
20.60%
Livister Latam SLU Madrid Spain 3,000.00 EUR - Equity Ufinet Latam SLU 100.00% 20.60%
Llano Sánchez Solar Power One Srl
Panama City Republic of Panama 10,020.00 USD
Electricity generation from renewable resources
Line-by-line
Enel Green Power Panamá SrlEnergía y Servicios South America SpA
99.80%
0.20%
100.00%
Lone Pine Wind Inc. Alberta Canada - CAD Renewable energy - Enel Green Power
Canada Inc. 10.00% 10.00%
Lone Pine Wind Project LP Alberta Canada - CAD Renewable energy Equity Enel Green Power
Canada Inc. 10.00% 10.00%

217Attachments
Company name Headquarters Country Share capital Currency ActivityConsolidation method Held by % holding
Group % holding
Lower Saranac Hydro LLC Wilmington USA - USD
Electricity generation from renewable resources
AFS Enel Green Power North America Inc. 100.00% 100.00%
Lower Valley LLC Wilmington USA - USDElectricity generation from renewable resources
Line-by-line Enel Green Power North America Inc. 100.00% 100.00%
Luminary Highlands Solar Project LLC
Andover USA - USDElectricity generation from renewable resources
Line-by-line Enel Kansas LLC 100.00% 100.00%
Maicor Wind Srl Rome Italy 20,850,000.00 EURElectricity generation from renewable resources
Line-by-line Enel Green Power Italia Srl 100.00% 100.00%
Malaspina Energy Scarl in liquidation Bergamo Italy 100,000.00 EUR Electricity generation Line-by-line YouSave SpA 100.00% 100.00%
Marengo Solar LLC Wilmington USA 1.00 USD Photovoltaic Line-by-line Enel Kansas LLC 100.00% 100.00%
Marte Srl Rome Italy 6,100,000.00 EURElectricity generation from renewable resources
Line-by-line Enel Green Power Italia Srl 100.00% 100.00%
Marudhar Wind Energy Private Limited
Gurugram India 100,000.00 INRElectricity transmission, distribution and sale
Line-by-line
Enel Green Power India Private Limited (formerly BLP Energy Private Limited)
100.00% 100.00%
Más Energía S de RL de Cv Mexico City Mexico 61,872,926.00 MXN
Electricity generation from renewable resources
Line-by-line
Enel Green Power México S de RL de CvHidroelectricidad del Pacífico S de RL de Cv
99.99%
0.01%
100.00%
Mason Mountain Wind Project LLC Wilmington USA - USD
Electricity generation from renewable resources
Line-by-line Padoma Wind Power LLC 100.00% 100.00%
Matrigenix (Pty) Ltd Johannesburg South Africa 1,000.00 ZAR
Electricity generation from renewable resources
Line-by-line Enel Green Power RSA (Pty) Ltd 100.00% 100.00%
MC Solar I LLC Andover USA - USDElectricity generation from renewable resources
Line-by-line Enel Kansas LLC 100.00% 100.00%
McBride Wind Project LLC Wilmington USA 1.00 USD - Line-by-line Enel Kansas LLC 100.00% 100.00%
Medidas Ambientales SL Burgos Spain 60,100.00 EUR Environmental studies Equity Nuclenor SA 50.00% 17.53%
Merit Wind Project LLC Andover USA 1.00 USD
Electricity generation and sale from renewable resources
Line-by-line Tradewind Energy Inc. 100.00% 100.00%
Metro Wind LLC Minneapolis USA - USDElectricity generation from renewable resources
Line-by-line Chi Minnesota Wind LLC 51.00% 51.00%
Mexicana de Hidroelectricidad Mexhidro S de RL de Cv
Mexico City Mexico 181,728,901.00 MXNElectricity generation from renewable resources
Line-by-lineEnel Green Power México S de RL de Cv
99.99% 99.99%
Mibgas SA Madrid Spain 3,000,000.00 EUR Gas market operator - Endesa SA 1.35% 0.95%
Midelt Wind Farm SA Casablanca Morocco 145,000,000.00 MAD
Development, design, construction and operation of plants
EquityNareva Enel Green Power Morocco SA
70.00% 35.00%
Mill Shoals Hydro Company LLC Wilmington USA - USD
Electricity generation from renewable resources
AFS Enel Green Power North America Inc. 100.00% 100.00%
Minicentrales Acequia Cinco Villas AIE
Ejea de los Caballeros Spain 3,346,993.04 EUR
Electricity generation from renewable resources
- Enel Green Power España SL 5.39% 3.78%

218 Half-Year Financial Report at June 30, 2020
Company name Headquarters Country Share capital Currency ActivityConsolidation method Held by % holding
Group % holding
Minicentrales del Canal de las Bárdenas AIE
Zaragoza Spain 1,202,000.00 EUR Hydro-electric plants - Enel Green Power España SL 15.00% 10.52%
Minicentrales del Canal Imperial-Gallur SL
Zaragoza Spain 1,820,000.00 EUR Hydro-electric plants Equity Enel Green Power España SL 36.50% 25.59%
Minority Stock Holding Corp. Tortola Virgin Islands 50,000.00 USD - Equity Ifx Networks Ltd 100.00% 20.60%
Mira Energy (Pty) Ltd Johannesburg South Africa 100.00 ZAR
Electricity generation from renewable resources
Line-by-line Enel Green Power RSA (Pty) Ltd 100.00% 100.00%
Miranda Plataforma Logística SA Burgos Spain 1,800,000.00 EUR Regional development - Nuclenor SA 0.22% 0.08%
Montrose Solar LLC Wilmington USA - USD
Electricity generation from renewable resources
Line-by-line Aurora Distributed Solar LLC 100.00% 73.51%
Mountrail Wind Project LLC Andover USA 1.00 USD
Electricity generation and sale from renewable resources
Line-by-line Tradewind Energy Inc. 100.00% 100.00%
Mucho Viento Wind Project LLC Andover USA 1.00 USD
Electricity generation and sale from renewable resources
Line-by-line Tradewind Energy Inc. 100.00% 100.00%
Muskegon County Solar Project LLC Andover USA 1.00 USD
Electricity generation and sale from renewable resources
Line-by-line Tradewind Energy Inc. 100.00% 100.00%
Muskegon Green Wind Project LLC Andover USA 1.00 USD
Electricity generation and sale from renewable resources
Line-by-line Tradewind Energy Inc. 100.00% 100.00%
Mustang Run Wind Project LLC Andover USA 1.00 USD
Electricity generation and sale from renewable resources
Line-by-line Tradewind Energy Inc. 100.00% 100.00%
Napolean Wind Project LLC Andover USA 1.00 USD
Electricity generation and sale from renewable resources
Line-by-line Tradewind Energy Inc. 100.00% 100.00%
Nareva Enel Green Power Morocco SA Casablanca Morocco 98,750,000.00 MAD Holding. Electricity
generation Equity Enel Green Power Morocco SARLAU 50.00% 50.00%
Navalvillar Solar SL Madrid Spain 3,000.00 EUR Photovoltaic Line-by-line Enel Green Power España SL 100.00% 70.10%
Netell Telecomunicações SA
Barueri Brazil 29,800,000.00 BRL Telecommunications -Ufinet Brasil Telecomunicação Ltda
60.00% 12.36%
Nevkan Renewables LLC Wilmington USA - USD
Electricity generation from renewable resources
Line-by-line Enel Nevkan Inc. 100.00% 100.00%
Newbury Hydro Company LLC Andover USA - USD
Electricity generation from renewable resources
AFS Enel Green Power North America Inc. 100.00% 100.00%
Ngonye Power Company Limited Lusaka Zambia 10.00 ZMW Electricity sale Line-by-line
Enel Green Power Solar Ngonye SpA (formerly Enel Green Power Africa Srl)
80.00% 80.00%
Nojoli Wind Farm (RF) (Pty) Ltd Johannesburg South Africa 10,000,000.00 ZAR
Electricity generation from renewable resources
Line-by-line Enel Green Power RSA (Pty) Ltd 60.00% 60.00%
North Canal Waterworks Boston USA - USD
Electricity generation from renewable resources
Line-by-line Enel Green Power North America Inc. 100.00% 100.00%
North English Wind Project LLC Andover USA 1.00 USD
Electricity generation and sale from renewable resources
Line-by-line Tradewind Energy Inc. 100.00% 100.00%

219Attachments
Company name Headquarters Country Share capital Currency ActivityConsolidation method Held by % holding
Group % holding
North Rock Wind LLC Andover USA 1.00 USD
Electricity generation and sale from renewable resources
Line-by-line Tradewind Energy Inc. 100.00% 100.00%
Northland Wind Project LLC Andover USA 1.00 USD
Electricity generation and sale from renewable resources
Line-by-line Tradewind Energy Inc. 100.00% 100.00%
Northstar Wind Project LLC Andover USA - USD
Electricity generation from renewable resources
Line-by-line Tradewind Energy Inc. 100.00% 100.00%
Northumberland Solar Project I LLC Andover USA - USD
Electricity generation from renewable resources
Line-by-line Enel Kansas LLC 100.00% 100.00%
Northwest Hydro LLC Wilmington USA - USD
Electricity generation from renewable resources
Line-by-line Chi West LLC 100.00% 100.00%
Notch Butte Hydro Company Inc. Wilmington USA 100.00 USD
Electricity generation from renewable resources
Line-by-line Enel Green Power North America Inc. 100.00% 100.00%
Nuclenor SA Burgos Spain 102,000,000.00 EUR Nuclear plants Equity Endesa Generación SA 50.00% 35.05%
Nuove Energie Srl Porto Empedocle Italy 5,204,028.73 EUR
Construction and management of LNG regasification infrastructure
Line-by-line Enel Global Trading SpA 100.00% 100.00%
Nuxer Trading SA Montevideo Uruguay 80,000.00 UYU Electricity trading Line-by-line Enel Brasil SA 100.00% 64.14%
Nxuba Wind Farm (RF) (Pty) Ltd Johannesburg South Africa 1,000.00 ZAR
Electricity generation and sale from renewable resources
Line-by-lineEnel Green Power RSA 2 (RF) (Pty) Ltd
51.00% 51.00%
Nyc Storage (353 Chester) Spe LLC Wilmington USA 1.00 USD Holding Line-by-line Enel X North
America Inc. 100.00% 100.00%
Ochrana A Bezpecnost Se SRO
Kalná Nad Hronom Slovakia 33,193.92 EUR Security services Equity Slovenské elektrárne AS 100.00% 33.00%
Olivum PV Farm 01 SLU Madrid Spain 3,000.00 EUR Photovoltaic systems Line-by-line Enel Green Power
España SL 100.00% 70.10%
Omip - Operador do Mercado Ibérico (Portugal) Sgps SA
Lisbon Portugal 2,610,000.00 EUR Electricity market operator - Endesa SA 5.00% 3.51%
OpEn Fiber SpA Milan Italy 250,000,000.00 EUR
Installation, maintenance and repair of electronic plant
Equity Enel SpA 50.00% 50.00%
Open Range Wind Project LLC Andover USA 1.00 USD
Electricity generation and sale from renewable resources
Line-by-line Tradewind Energy Inc. 100.00% 100.00%
Operador del Mercado Ibérico de Energía - Polo Español SA
Madrid Spain 1,999,998.00 EUR Electricity market operator - Endesa SA 5.00% 3.51%
Orchid Acres Solar Project LLC Andover USA - USD
Electricity generation from renewable resources
Line-by-line Enel Kansas LLC 100.00% 100.00%
Origin Goodwell Holdings LLC Wilmington USA - USD
Electricity generation from renewable resources
Equity EGPNA Wind Holdings 1 LLC 100.00% 20.00%
Origin Wind Energy LLC Wilmington USA - USD
Electricity generation from renewable resources
Equity Origin Goodwell Holdings LLC 100.00% 20.00%
Osage Wind Holdings LLC Wilmington USA 100.00 USD
Electricity generation from renewable resources
Line-by-line Enel Kansas LLC 50.00% 50.00%
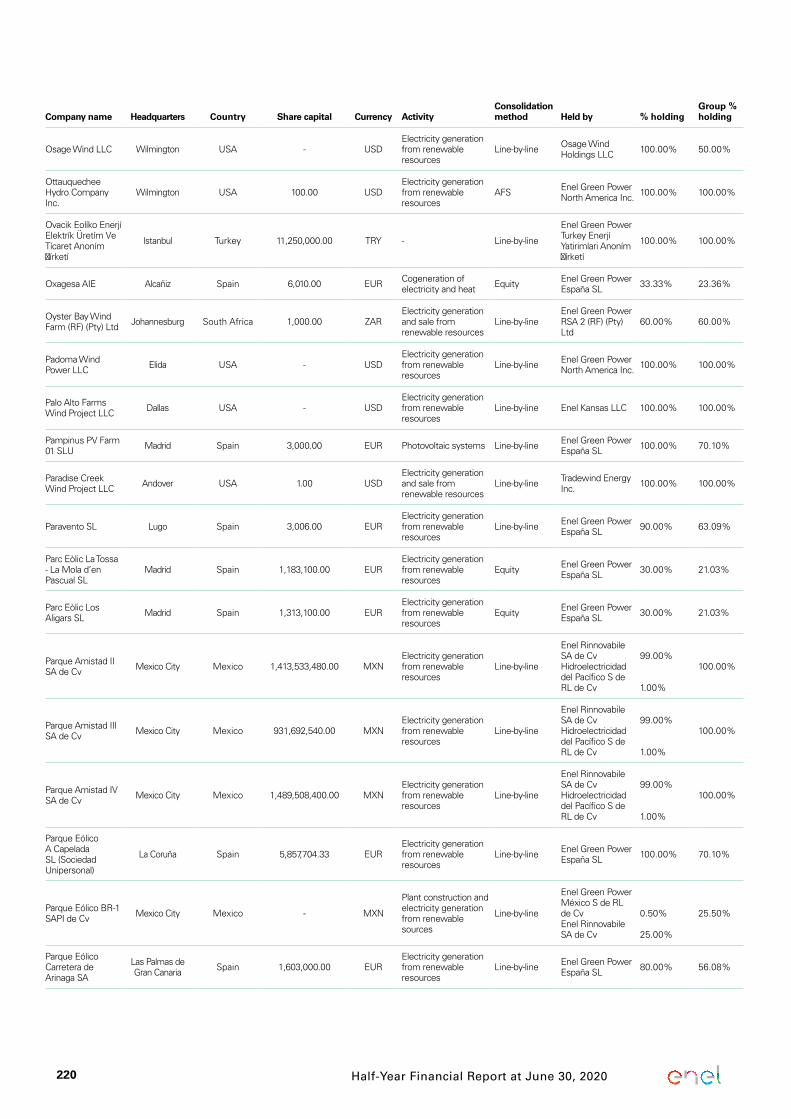
220 Half-Year Financial Report at June 30, 2020
Company name Headquarters Country Share capital Currency ActivityConsolidation method Held by % holding
Group % holding
Osage Wind LLC Wilmington USA - USDElectricity generation from renewable resources
Line-by-line Osage Wind Holdings LLC 100.00% 50.00%
Ottauquechee Hydro Company Inc.
Wilmington USA 100.00 USDElectricity generation from renewable resources
AFS Enel Green Power North America Inc. 100.00% 100.00%
Ovacik Eolíko Enerjí Elektrík Üretím Ve Tícaret Anoním čírketí
Istanbul Turkey 11,250,000.00 TRY - Line-by-line
Enel Green Power Turkey Enerjí Yatirimlari Anoním čírketí
100.00% 100.00%
Oxagesa AIE Alcañiz Spain 6,010.00 EUR Cogeneration of electricity and heat Equity Enel Green Power
España SL 33.33% 23.36%
Oyster Bay Wind Farm (RF) (Pty) Ltd Johannesburg South Africa 1,000.00 ZAR
Electricity generation and sale from renewable resources
Line-by-lineEnel Green Power RSA 2 (RF) (Pty) Ltd
60.00% 60.00%
Padoma Wind Power LLC Elida USA - USD
Electricity generation from renewable resources
Line-by-line Enel Green Power North America Inc. 100.00% 100.00%
Palo Alto Farms Wind Project LLC Dallas USA - USD
Electricity generation from renewable resources
Line-by-line Enel Kansas LLC 100.00% 100.00%
Pampinus PV Farm 01 SLU Madrid Spain 3,000.00 EUR Photovoltaic systems Line-by-line Enel Green Power
España SL 100.00% 70.10%
Paradise Creek Wind Project LLC Andover USA 1.00 USD
Electricity generation and sale from renewable resources
Line-by-line Tradewind Energy Inc. 100.00% 100.00%
Paravento SL Lugo Spain 3,006.00 EURElectricity generation from renewable resources
Line-by-line Enel Green Power España SL 90.00% 63.09%
Parc Eòlic La Tossa - La Mola d’en Pascual SL
Madrid Spain 1,183,100.00 EURElectricity generation from renewable resources
Equity Enel Green Power España SL 30.00% 21.03%
Parc Eòlic Los Aligars SL Madrid Spain 1,313,100.00 EUR
Electricity generation from renewable resources
Equity Enel Green Power España SL 30.00% 21.03%
Parque Amistad II SA de Cv Mexico City Mexico 1,413,533,480.00 MXN
Electricity generation from renewable resources
Line-by-line
Enel Rinnovabile SA de CvHidroelectricidad del Pacífico S de RL de Cv
99.00%
1.00%
100.00%
Parque Amistad III SA de Cv Mexico City Mexico 931,692,540.00 MXN
Electricity generation from renewable resources
Line-by-line
Enel Rinnovabile SA de CvHidroelectricidad del Pacífico S de RL de Cv
99.00%
1.00%
100.00%
Parque Amistad IV SA de Cv Mexico City Mexico 1,489,508,400.00 MXN
Electricity generation from renewable resources
Line-by-line
Enel Rinnovabile SA de CvHidroelectricidad del Pacífico S de RL de Cv
99.00%
1.00%
100.00%
Parque Eólico A Capelada SL (Sociedad Unipersonal)
La Coruña Spain 5,857,704.33 EURElectricity generation from renewable resources
Line-by-line Enel Green Power España SL 100.00% 70.10%
Parque Eólico BR-1 SAPI de Cv Mexico City Mexico - MXN
Plant construction and electricity generation from renewable sources
Line-by-line
Enel Green Power México S de RL de CvEnel Rinnovabile SA de Cv
0.50%
25.00%
25.50%
Parque Eólico Carretera de Arinaga SA
Las Palmas de Gran Canaria Spain 1,603,000.00 EUR
Electricity generation from renewable resources
Line-by-line Enel Green Power España SL 80.00% 56.08%

221Attachments
Company name Headquarters Country Share capital Currency ActivityConsolidation method Held by % holding
Group % holding
Parque Eólico de Barbanza SA La Coruña Spain 3,606,072.60 EUR
Electricity generation from renewable resources
Line-by-line
Enel Green Power España SLParque Eólico de Barbanza SA
75.00%
0.00%
52.58%
Parque Eólico de Belmonte SA Madrid Spain 120,400.00 EUR
Electricity generation from renewable resources
Line-by-line Enel Green Power España SL 50.17% 35.17%
Parque Eólico de Farlan SLU Madrid Spain 3,006.00 EUR Wind plants Line-by-line Enel Green Power
España SL 100.00% 70.10%
Parque Eólico de San Andrés SA La Coruña Spain 552,920.00 EUR
Electricity generation from renewable resources
Line-by-line Enel Green Power España SL 82.00% 57.48%
Parque Eólico de Santa Lucía SA
Las Palmas de Gran Canaria Spain 901,500.00 EUR
Electricity generation from renewable resources
Line-by-line
Enel Green Power España SLParque Eólico de Santa Lucía SA
65.67%
1.00%
46.50%
Parque Eólico Finca de Mogán SA
Santa Cruz de Tenerife Spain 3,810,340.00 EUR Plant construction and
maintenance Line-by-line Enel Green Power España SL 90.00% 63.09%
Parque Eólico Montes de Las Navas SA
Madrid Spain 6,540,000.00 EUR Plant construction and maintenance Line-by-line Enel Green Power
España SL 75.50% 52.93%
Parque Eólico Muniesa SL Madrid Spain 3,006.00 EUR Wind plants Line-by-line Enel Green Power
España SL 100.00% 70.10%
Parque Eólico Palmas dos Ventos Ltda
Salvador Brazil 4,096,626.00 BRLElectricity generation and sale from renewable resources
Line-by-line
Enel Green Power Brasil Participações LtdaEnel Green Power Desenvolvimento Ltda
100.00%
0.00%
100.00%
Parque Eólico Pampa SA Buenos Aires Argentina 6,500,000.00 ARS
Electricity generation from renewable resources
Line-by-line Enel Green Power Argentina SA 100.00% 100.00%
Parque Eólico Punta de Teno SA
Santa Cruz de Tenerife Spain 528,880.00 EUR
Electricity generation from renewable resources
Line-by-line Enel Green Power España SL 52.00% 36.45%
Parque Eólico Sierra del Madero SA
Madrid Spain 7,193,970.00 EURElectricity generation from renewable resources
Line-by-line Enel Green Power España SL 58.00% 40.66%
Parque Eólico Taltal SpA Santiago de Chile Chile 20,878,010,000.00 CLP
Electricity generation from renewable resources
Line-by-lineEnel Chile SAEnel Green Power Chile SA
0.01%
99.99%64.55%
Parque Eólico Ventos da Boa Vista Ltda
Salvador Brazil 1,946,507.00 BRL Renewable energy Line-by-lineEnel Green Power Brasil Participações Ltda
100.00% 100.00%
Parque Salitrillos SA de Cv Mexico City Mexico 100.00 MXN
Electricity generation from renewable resources
Equity
Tenedora de Energía Renovable Sol y Viento SAPI de Cv
60.80% 20.00%
Parque Solar Cauchari IV SA
San Salvador de Jujuy Argentina 500,000.00 ARS
Electricity generation from renewable resources
Line-by-line
Enel Green Power Argentina SAEnergía y Servicios South America SpA
95.00%
5.00%
100.00%
Parque Solar Don José SA de Cv Mexico City Mexico 100.00 MXN
Electricity generation from renewable resources
Equity
Tenedora de Energía Renovable Sol y Viento SAPI de Cv
60.80% 20.00%
Parque Solar Villanueva Tres SA de Cv
Mexico City Mexico 306,024,631.13 MXNElectricity generation from renewable resources
Equity
Tenedora de Energía Renovable Sol y Viento SAPI de Cv
60.80% 20.00%

222 Half-Year Financial Report at June 30, 2020
Company name Headquarters Country Share capital Currency ActivityConsolidation method Held by % holding
Group % holding
Parque Talinay Oriente SA Santiago de Chile Chile 66,092,165,170.93 CLP
Electricity generation from renewable resources
Line-by-line
Enel Green Power Chile SAEnel Green Power SpA
60.91%
34.56%
73.89%
Pastis - Centro Nazionale per la ricerca e lo sviluppo dei materiali SCPA in liquidation
Brindisi Italy 2,065,000.00 EUR Research and development - Enel Italia SpA 1.14% 1.14%
Paynesville Solar LLC Wilmington USA - USD
Electricity generation from renewable resources
Line-by-line Aurora Distributed Solar LLC 100.00% 73.51%
PayTipper Network Srl Cascina Italy 40,000.00 EUR Services Line-by-line PayTipper SpA 100.00% 55.00%
PayTipper SpA Milan Italy 3,000,000.00 EUR Services Line-by-line Enel X Srl 55.00% 55.00%
PDP Technologies Ltd Ashkelon Israel 1,129,252.00 ILS Research and
development -Enel Global Infrastructure and Networks Srl
5.72% 5.72%
Pegop - Energia Eléctrica SA Pego Portugal 50,000.00 EUR Electricity generation Equity
Endesa Generación Portugal SAEndesa Generación SA
0.02%
49.98%
35.05%
PH Chucás SA San José Costa Rica 100,000.00 CRCElectricity generation from renewable resources
Line-by-line
Enel Green Power Costa Rica SAEnergía y Servicios South America SpA
40.31%
24.69%
65.00%
PH Don Pedro SA San José Costa Rica 100,001.00 CRCElectricity generation from renewable resources
Line-by-line Enel Green Power Costa Rica SA 33.44% 33.44%
PH Guácimo SA San José Costa Rica 50,000.00 CRCElectricity generation from renewable resources
Line-by-line Enel Green Power Costa Rica SA 65.00% 65.00%
PH Río Volcán SA San José Costa Rica 100,001.00 CRCElectricity generation from renewable resources
Line-by-line Enel Green Power Costa Rica SA 34.32% 34.32%
Pincher Creek LP Alberta Canada - CAD Renewable energy Line-by-line
Enel Alberta Wind Inc.Enel Green Power Canada Inc.
99.00%
1.00%
100.00%
Pine Island Distributed Solar LLC
Wilmington USA - USDElectricity generation from renewable resources
Line-by-line Aurora Distributed Solar LLC 100.00% 73.51%
Planta Eólica Europea SA Seville Spain 1,198,532.32 EUR
Electricity generation from renewable resources
Line-by-line Enel Green Power España SL 56.12% 39.34%
Point Rider Solar Project LLC Andover USA - USD
Electricity generation from renewable resources
Line-by-line Enel Kansas LLC 100.00% 100.00%
Pomerado Energy Storage LLC Wilmington USA 1.00 USD
Electricity generation from renewable resources
Line-by-line
Enel Energy Storage Holdings LLC (formerly EGP Energy Storage Holdings LLC)
100.00% 100.00%
PowerCrop Macchiareddu Srl Bologna Italy 100,000.00 EUR
Electricity generation from renewable resources
EquityPowerCrop SpA (formerly PowerCrop Srl)
100.00% 50.00%
PowerCrop Russi Srl Bologna Italy 100,000.00 EUR
Electricity generation from renewable resources
EquityPowerCrop SpA (formerly PowerCrop Srl)
100.00% 50.00%

223Attachments
Company name Headquarters Country Share capital Currency ActivityConsolidation method Held by % holding
Group % holding
PowerCrop SpA (formerly PowerCrop Srl)
Bologna Italy 4,000,000.00 EURElectricity generation from renewable resources
Equity Enel Green Power Italia Srl 50.00% 50.00%
Prairie Rose Transmission LLC Minneapolis USA - USD
Electricity generation from renewable resources
Equity Prairie Rose Wind LLC 100.00% 20.00%
Prairie Rose Wind LLC Albany USA - USD
Electricity generation from renewable resources
Equity EGPNA REP Wind Holdings LLC 100.00% 20.00%
Primavera Energia SA Niterói Brazil 36,965,444.64 BRL Electricity generation
and sale Line-by-lineEnel Green Power Brasil Participações Ltda
100.00% 100.00%
Productora de Energías SA Barcelona Spain 60,101.22 EUR Hydro-electric plants Equity Enel Green Power
España SL 30.00% 21.03%
Productora Eléctrica Urgelense SA
Lérida Spain 8,400,000.00 EUR Electricity generation and distribution - Endesa SA 8.43% 5.91%
Progreso Solar 25 MW SA Panama City Republic of
Panama 10,000.00 USDElectricity generation from renewable resources
Line-by-line Enel Green Power Panamá Srl 100.00% 100.00%
Promociones Energéticas del Bierzo SL
Madrid Spain 12,020.00 EURElectricity generation from renewable resources
Line-by-line Enel Green Power España SL 100.00% 70.10%
Proveedora de Electricidad de Occidente S de RL de Cv
Mexico City Mexico 89,708,835.00 MXNElectricity generation from renewable resources
Line-by-lineEnel Green Power México S de RL de Cv
99.99% 99.99%
Proyecto Almería Mediterráneo SA Madrid Spain 601,000.00 EUR Desalinization and
water supply Equity Endesa SA 45.00% 31.55%
Proyectos Universitarios de Energías Renovables SL
Alicante Spain 27,000.00 EURElectricity generation from renewable resources
Equity Enel Green Power España SL 33.33% 23.37%
Proyectos y Soluciones Renovables SAC
San Miguel Peru 1,000.00 SOL Electricity generation Line-by-line
Enel Green Power Partecipazioni Speciali SrlEnergía y Servicios South America SpA
99.90%
0.10%
100.00%
PT Enel Green Power Optima Way Ratai
Jakarta Indonesia 10,001,500.00 USDElectricity generation from renewable resources
Line-by-line Enel Green Power SpA 90.00% 90.00%
Pulida Energy (RF) (Pty) Ltd Johannesburg South Africa 10,000,000.00 ZAR
Electricity generation from renewable resources
Line-by-line Enel Green Power RSA (Pty) Ltd 52.70% 52.70%
Quatiara Energia SA Niterói Brazil 13,766,118.96 BRL Electricity generation Line-by-line
Enel Green Power Brasil Participações Ltda
100.00% 100.00%
Queens Energy Storage LLC Andover USA - USD
Electricity generation from renewable resources
Line-by-line
Enel Energy Storage Holdings LLC (formerly EGP Energy Storage Holdings LLC)
100.00% 100.00%
Ranchland Solar Project LLC Andover USA 1.00 USD
Electricity generation and sale from renewable resources
Line-by-line Tradewind Energy Inc. 100.00% 100.00%
Ranchland Wind Holdings LLC Andover USA - USD
Electricity generation from renewable resources
Line-by-line Enel Kansas LLC 100.00% 100.00%
Ranchland Wind Project LLC Andover USA - USD
Electricity generation from renewable resources
Line-by-line Tradewind Energy Inc. 100.00% 100.00%

224 Half-Year Financial Report at June 30, 2020
Company name Headquarters Country Share capital Currency ActivityConsolidation method Held by % holding
Group % holding
Ranchland Wind Storage LLC Andover USA - USD
Electricity generation from renewable resources
Line-by-line Enel Kansas LLC 100.00% 100.00%
Rattlesnake Creek Holdings LLC Delaware USA 1.00 USD - Line-by-line Enel Kansas LLC 100.00% 100.00%
Rausch Creek Wind Project LLC Andover USA 1.00 USD
Electricity generation and sale from renewable resources
Line-by-line Tradewind Energy Inc. 100.00% 100.00%
RC Wind Srl Milan Italy 10,000.00 EUR
Plant construction and electricity generation from renewable sources
- Enel Green Power Italia Srl 0.50% 0.50%
Reaktortest SRO Trnava Slovakia 66,389.00 EUR Research and development Equity Slovenské
elektrárne AS 49.00% 16.17%
Red Centroamericana de Telecomunicaciones SA
Panama City Republic of Panama 2,700,000.00 USD Telecommunications - Enel SpA 11.11% 11.11%
Red Dirt Wind Holdings I LLC Dover USA 100.00 USD Holding Line-by-line Enel Green Power
North America Inc. 100.00% 100.00%
Red Dirt Wind Holdings LLC Wilmington USA - USD Renewable energy Line-by-line Enel Kansas LLC 100.00% 100.00%
Red Dirt Wind Project LLC Dover USA 1.00 USD
Electricity generation from renewable resources
Line-by-line Red Dirt Wind Holdings LLC 100.00% 100.00%
Red Fox Wind Project LLC Wilmington USA 1.00 USD - Line-by-line Enel Kansas LLC 100.00% 100.00%
Redes y Telecomunicaciones S de RL de Cv
San Pedro Sula Honduras 82,370,000.00 HNL Telecommunications - Livister Honduras SA 80.00% 16.48%
Reftinskaya GRES LLC Pgt Reftinskii Russian
Federation 10,000.00 RUB Electricity generation and sale Line-by-line Enel Russia PJSC 100.00% 56.43%
Renovables de Guatemala SA Guatemala City Guatemala 1,924,465,600.00 GTQ
Electricity generation from renewable resources
Line-by-line
Enel Green Power Guatemala SAEnel Green Power SpA
0.01%
99.99%
100.00%
Renovables La Pedrera SLU Zaragoza Spain 3,000.00 EUR Wind plants Line-by-line Enel Green Power
España SL 100.00% 70.10%
Renovables Mediavilla SLU Zaragoza Spain 3,000.00 EUR Photovoltaic systems Line-by-line Enel Green Power
España SL 100.00% 70.10%
Rihue SpA Santiago de Chile Chile 986,821.00 USDElectricity generation, transmission and trading
Line-by-line Enel Green Power Chile SA 100.00% 64.55%
Riverbend Farms Wind Project LLC Andover USA 1.00 USD
Electricity generation and sale from renewable resources
Line-by-line Tradewind Energy Inc. 100.00% 100.00%
Riverview LP Alberta Canada - CAD Renewable energy Line-by-line
Enel Alberta Wind Inc.Enel Green Power Canada Inc.
99.00%
1.00%
100.00%
Roadrunner Solar Project Holdings LLC
Andover USA - USD
Plant construction and electricity generation from renewable sources
Line-by-line Enel Kansas LLC 100.00% 100.00%
Roadrunner Solar Project LLC Andover USA 100.00 USD
Electricity generation and sale from renewable resources
Line-by-lineEnel Roadrunner Solar Project Holdings LLC
100.00% 100.00%
Roadrunner Storage LLC Andover USA - USD
Plant construction and electricity generation from renewable sources
Line-by-line Enel Kansas LLC 100.00% 100.00%

225Attachments
Company name Headquarters Country Share capital Currency ActivityConsolidation method Held by % holding
Group % holding
Rochelle Solar LLC Coral Springs USA 1.00 USD Photovoltaic Line-by-line Enel Kansas LLC 100.00% 100.00%
Rock Creek Hydro LLC Wilmington USA - USD
Electricity generation from renewable resources
AFS Enel Green Power North America Inc. 100.00% 100.00%
Rock Creek Wind Holdings I LLC Dover USA 100.00 USD Holding Line-by-line Enel Green Power
North America Inc. 100.00% 100.00%
Rock Creek Wind Holdings II LLC Dover USA 100.00 USD Holding Line-by-line Rock Creek Wind
Holdings LLC 100.00% 100.00%
Rock Creek Wind Holdings LLC Wilmington USA - USD
Electricity generation from renewable resources
Line-by-lineEGPNA Preferred Wind Holdings II LLC
100.00% 100.00%
Rock Creek Wind Project LLC Clayton USA 1.00 USD Holding Line-by-line Rock Creek Wind
Holdings LLC 100.00% 100.00%
Rockhaven Wind Project LLC Andover USA 1.00 USD
Electricity generation and sale from renewable resources
Line-by-line Tradewind Energy Inc. 100.00% 100.00%
Rocky Caney Holdings LLC Oklahoma City USA 1.00 USD Renewable energy Equity Enel Kansas LLC 20.00% 20.00%
Rocky Caney Wind LLC Albany USA - USD
Electricity generation from renewable resources
Equity Enel Kansas LLC 20.00% 20.00%
Rocky Ridge Wind Project LLC Oklahoma City USA - USD
Electricity generation from renewable resources
Equity Rocky Caney Wind LLC 100.00% 20.00%
Rodnikovskaya WPS Moscow Russian
Federation 6,010,000.00 RUB Renewable energy Line-by-lineEnel Green Power Rus Limited Liability Company
100.00% 100.00%
Rolling Farms Wind Project LLC Andover USA 1.00 USD
Electricity generation and sale from renewable resources
Line-by-line Tradewind Energy Inc. 100.00% 100.00%
RSL Telecom (Panama) SA Panama City Republic of
Panama 10,000.00 USD - Equity Ufinet Latam SLU 100.00% 20.60%
Rusenergosbyt LLC Moscow Russian
Federation 18,000,000.00 RUB Electricity trading Equity Enel SpA 49.50% 49.50%
Rusenergosbyt Siberia LLC Krasnoyarsk City Russian
Federation 4,600,000.00 RUB Electricity sale Equity Rusenergosbyt LLC 50.00% 24.75%
Rustler Wind Project LLC Andover USA 1.00 USD
Electricity generation and sale from renewable resources
Line-by-line Tradewind Energy Inc. 100.00% 100.00%
Ruthton Ridge LLC Minneapolis USA - USDElectricity generation from renewable resources
Line-by-line Chi Minnesota Wind LLC 51.00% 51.00%
Saburoy SA Montevideo Uruguay 400,000.00 UYU - Equity Ifx Networks LLC 100.00% 20.60%
Sacme SA Buenos Aires Argentina 12,000.00 ARS Monitoring of electricity system Equity
Empresa Distribuidora Sur SA - Edesur
50.00% 23.13%
Salmon Falls Hydro LLC Wilmington USA - USD
Electricity generation from renewable resources
AFS Enel Green Power North America Inc. 100.00% 100.00%
Salt Springs Wind Project LLC Andover USA - USD
Electricity generation from renewable resources
Line-by-line Enel Kansas LLC 100.00% 100.00%
Salto de San Rafael SL Seville Spain 462,185.98 EUR Hydro-electric plants Equity Enel Green Power
España SL 50.00% 35.05%
Samantha Solar SpA Santiago de Chile Chile 88,334,025.00 CLP
Electricity generation, transmission and trading
Line-by-line Enel Green Power Chile SA 100.00% 64.55%
San Francisco de Borja SA Zaragoza Spain 60,000.00 EUR Renewable energy Line-by-line Enel Green Power
España SL 66.67% 46.73%

226 Half-Year Financial Report at June 30, 2020
Company name Headquarters Country Share capital Currency ActivityConsolidation method Held by % holding
Group % holding
San Juan Mesa Wind Project II LLC Wilmington USA - USD
Electricity generation from renewable resources
Line-by-line Padoma Wind Power LLC 100.00% 100.00%
Sanatorium - preventorium Energetik LLC
Nevinnomyssk Russian Federation 10,571,300.00 RUB Energy services Line-by-line Enel Russia PJSC 100.00% 56.43%
Santo Rostro Cogeneración SA Seville Spain 207,340.00 EUR Cogeneration of
electricity and heat Equity Enel Green Power España SL 45.00% 31.55%
Saugus River Energy Storage LLC
Dover USA 100.00 USD Renewable energy Line-by-line
Enel Energy Storage Holdings LLC (formerly EGP Energy Storage Holdings LLC)
100.00% 100.00%
Se Služby Inžinierskych Stavieb SRO
Kalná Nad Hronom Slovakia 200,000.00 EUR Services Equity Slovenské elektrárne AS 100.00% 33.00%
Seguidores Solares Planta 2 SL (Sociedad Unipersonal)
Madrid Spain 3,010.00 EURElectricity generation from renewable resources
Line-by-line Enel Green Power España SL 100.00% 70.10%
Servicio de Operación y Mantenimiento para Energías Renovables S de RL de Cv
Mexico City Mexico 3,000.00 MXNElectricity generation from renewable resources
Line-by-line
Enel Green Power Guatemala SAEnergía Nueva Energía Limpia México S de RL de Cv
0.01%
99.99%
100.00%
Servicios de Internet Eni Chile Ltda
Santiago de Chile Chile 2,768,688,228.00 CLP - Equity Ifx Networks LtdIfx/eni - Spc IV Inc.
0.01%99.90% 20.58%
Servizio Elettrico Nazionale SpA Rome Italy 10,000,000.00 EUR Electricity sale Line-by-line Enel Italia SpA 100.00% 100.00%
Setyl Srl Bergamo Italy 100,000.00 EUR Electricity generation Equity YouSave SpA 27.50% 27.50%
Seven Cowboy Wind Project LLC Andover USA 1.00 USD
Electricity generation and sale from renewable resources
Line-by-line Tradewind Energy Inc. 100.00% 100.00%
Seven Cowboys Solar Project LLC Andover USA - USD
Electricity generation from renewable resources
Line-by-line Enel Kansas LLC 100.00% 100.00%
Shiawassee Wind Project LLC Wilmington USA 1.00 USD - Line-by-line Enel Kansas LLC 100.00% 100.00%
Shield Energy Storage Project LLC
Wilmington USA - USDElectricity generation from renewable resources
Line-by-line
Enel Energy Storage Holdings LLC (formerly EGP Energy Storage Holdings LLC)
100.00% 100.00%
SIET - Società Informazioni Esperienze Termoidrauliche SpA
Piacenza Italy 697,820.00 EURAnalysis, design and research in thermal technology
Equity Enel Innovation Hubs Srl 41.55% 41.55%
Sistema Eléctrico de Conexión Valcaire SL
Madrid Spain 175,200.00 EUR Electricity generation Equity Enel Green Power España SL 28.13% 19.72%
Sistemas Energéticos Alcohujate SA (Sociedad Unipersonal)
Zaragoza Spain 61,000.00 EURElectricity generation and sale from renewable resources
Line-by-line Enel Green Power España SL 100.00% 70.10%
Sistemas Energéticos Campoliva SA (Sociedad Unipersonal)
Zaragoza Spain 61,000.00 EUR Wind plants Line-by-line Enel Green Power España SL 100.00% 70.10%

227Attachments
Company name Headquarters Country Share capital Currency ActivityConsolidation method Held by % holding
Group % holding
Sistemas Energéticos Mañón Ortigueira SA
La Coruña Spain 2,007,750.00 EURElectricity generation from renewable resources
Line-by-line Enel Green Power España SL 96.00% 67.30%
Sistemas Energéticos Sierra del Carazo SL (Sociedad Unipersonal)
Derio Spain 3,006.00 EURElectricity generation from renewable resources
Line-by-line Enel Green Power España SL 100.00% 70.10%
Skyview Wind Project LLC Andover USA 1.00 USD
Electricity generation and sale from renewable resources
Line-by-line Tradewind Energy Inc. 100.00% 100.00%
Slovak Power Holding BV Amsterdam Netherlands 25,010,000.00 EUR Holding Equity Enel Produzione
SpA 50.00% 50.00%
Slovenské elektrárne - Energetické Služby SRO
Bratislava Slovakia 4,505,000.00 EUR Electricity supply Equity Slovenské elektrárne AS 100.00% 33.00%
Slovenské elektrárne AS Bratislava Slovakia 1,269,295,724.66 EUR Electricity generation Equity Slovak Power
Holding BV 66.00% 33.00%
Slovenské elektrárne česká Republika SRO
Moravská Ostrava Czech Republic 295,819.00 CZK Electricity supply Equity Slovenské elektrárne AS 100.00% 33.00%
Smart P@Per SpA Potenza Italy 2,184,000.00 EUR Services - Servizio Elettrico Nazionale SpA 10.00% 10.00%
Smoky Hill Holdings II LLC Wilmington USA - USD Renewable energy Line-by-line Enel Kansas LLC 100.00% 100.00%
Smoky Hills Wind Farm LLC Topeka USA - USD
Electricity generation from renewable resources
Line-by-line Texkan Wind LLC 100.00% 100.00%
Smoky Hills Wind Project II LLC Lenexa USA - USD
Electricity generation from renewable resources
Line-by-line Nevkan Renewables LLC 100.00% 100.00%
Snyder Wind Farm LLC Hermleigh USA - USD
Electricity generation from renewable resources
Line-by-line Texkan Wind LLC 100.00% 100.00%
Socibe Energia SA Niterói Brazil 12,969,032.25 BRL Electricity generation and sale Line-by-line
Enel Green Power Brasil Participações Ltda
100.00% 100.00%
Sociedad Agrícola de Cameros Ltda Santiago de Chile Chile 5,738,046,495.00 CLP Financial investment Line-by-line Enel Chile SA 57.50% 37.11%
Sociedad Bilbao Gas Hub SA Bilbao Spain 999,270.48 EUR Gas market operator - Endesa SA 1.66% 1.16%
Sociedad Eólica de Andalucía SA Seville Spain 4,507,590.78 EUR Electricity generation Line-by-line Enel Green Power
España SL 64.75% 45.39%
Sociedad Eólica El Puntal SL Seville Spain 1,643,000.00 EUR
Electricity generation from renewable resources
Equity Enel Green Power España SL 50.00% 35.05%
Sociedad Eólica Los Lances SA Seville Spain 2,404,048.42 EUR
Electricity generation from renewable resources
Line-by-line Enel Green Power España SL 60.00% 42.06%
Sociedad para el Desarrollo de Sierra Morena Cordobesa SA
Cordoba Spain 86,063.20 EUR Regional development - Endesa Generación SA 1.82% 1.27%
Sociedad Portuaria Central Cartagena SA
Bogotá Colombia 89,714,600.00 COP Port construction and management Line-by-line
Emgesa SA ESPInversora Codensa SASSociedad Portuaria Central Cartagena SA
94.94%
5.05%
0.00%
31.09%

228 Half-Year Financial Report at June 30, 2020
Company name Headquarters Country Share capital Currency ActivityConsolidation method Held by % holding
Group % holding
Società di sviluppo, realizzazione e gestione del gasdotto Algeria-Italia via Sardegna SpA - Galsi SpA
Milan Italy 37,419,179.00 EUREnergy and infrastructure engineering
- Enel Produzione SpA 17.65% 17.65%
Società Elettrica Trigno Srl Trivento Italy 100,000.00 EUR
Electricity generation from renewable resources
Line-by-line Enel Green Power Italia Srl 100.00% 100.00%
Soetwater Wind Farm (RF) (Pty) Ltd Johannesburg South Africa 1,000.00 ZAR
Electricity generation and sale from renewable resources
Line-by-lineEnel Green Power RSA 2 (RF) (Pty) Ltd
60.00% 60.00%
Soliloquoy Ridge LLC Minneapolis USA - USD
Electricity generation from renewable resources
Line-by-line Chi Minnesota Wind LLC 51.00% 51.00%
Somersworth Hydro Company Inc.
Wilmington USA 100.00 USDElectricity generation from renewable resources
AFS Enel Green Power North America Inc. 100.00% 100.00%
Sona Enerjí Üretím Anoním čírketí Istanbul Turkey 50,000.00 TRY
Electricity generation from renewable resources
Line-by-line
Enel Green Power Turkey Enerjí Yatirimlari Anoním čírketí
100.00% 100.00%
Sotavento Galicia SA
Santiago de Compostela Spain 601,000.00 EUR
Electricity generation from renewable resources
Equity Enel Green Power España SL 36.00% 25.24%
South Rock Wind Project LLC Andover USA 1.00 USD
Electricity generation and sale from renewable resources
Line-by-line Tradewind Energy Inc. 100.00% 100.00%
Southwest Transmission LLC Cedar Bluff USA - USD
Electricity generation from renewable resources
Line-by-line Chi Minnesota Wind LLC 100.00% 100.00%
Spartan Hills LLC Minneapolis USA - USDElectricity generation from renewable resources
Line-by-line Chi Minnesota Wind LLC 51.00% 51.00%
Stampede Solar Project LLC Andover USA - USD
Electricity generation from renewable resources
Line-by-line Enel Kansas LLC 100.00% 100.00%
Stillman Valley Solar LLC Wilmington USA - USD Renewable energy Line-by-line Enel Kansas LLC 100.00% 100.00%
Stillwater Woods Hill Holdings LLC Wilmington USA 1.00 USD Renewable energy Line-by-line Enel Kansas LLC 100.00% 100.00%
Stipa Nayaá SA de Cv Mexico City Mexico 1,811,016,348.00 MXN
Electricity generation from renewable resources
Line-by-line
Enel Green Power México S de RL de CvEnel Green Power Partecipazioni Speciali Srl
55.21%
40.16%
95.37%
Stockyard Solar Project LLC Andover USA - USD
Electricity generation from renewable resources
Line-by-line Enel Kansas LLC 100.00% 100.00%
Strinestown Solar I LLC Andover USA - USD
Electricity generation from renewable resources
Line-by-line Enel Kansas LLC 100.00% 100.00%
Suave Energía S de RL de Cv Mexico City Mexico 1,000,000,000,000.00 MXN
Plant construction and electricity generation from renewable sources
Line-by-line
Enel Rinnovabile SA de CvEnel Green Power México S de RL de Cv
99.99%
0.01%
100.00%
Sublunary Trading (RF) (Pty) Ltd Bryanston South Africa 13,750,000.00 ZAR
Electricity generation from renewable resources
Line-by-line Enel Green Power RSA (Pty) Ltd 57.00% 57.00%
Suministradora Eléctrica de Cádiz SA
Cádiz Spain 12,020,240.00 EUR Electricity distribution and sale Equity
Endesa Red SA (Sociedad Unipersonal)
33.50% 23.48%

229Attachments
Company name Headquarters Country Share capital Currency ActivityConsolidation method Held by % holding
Group % holding
Suministro de Luz y Fuerza SL Barcelona Spain 2,800,000.00 EUR Electricity distribution Line-by-line Hidroeléctrica de
Catalunya SL 60.00% 42.06%
Summit Energy Storage Inc. Wilmington USA 1,000.00 USD
Electricity generation from renewable resources
Line-by-line Enel Green Power North America Inc. 75.00% 75.00%
Sun River LLC Bend USA - USDElectricity generation from renewable resources
Line-by-line Chi Minnesota Wind LLC 51.00% 51.00%
Sundance Wind Project LLC Dover USA 100.00 USD Renewable energy Line-by-line Enel Kansas LLC 100.00% 100.00%
Sunflower Prairie Solar Project LLC Andover USA - USD
Electricity generation from renewable resources
Line-by-line Enel Kansas LLC 100.00% 100.00%
Tae Technologies Inc. Pauling USA 53,207,936.90 USD Electricity generation - Enel Produzione
SpA 1.13% 1.13%
Tauste Energía Distribuida SL Zaragoza Spain 60,508.00 EUR Renewable energy Line-by-line Enel Green Power
España SL 51.00% 35.75%
Tecnatom SA Madrid Spain 4,025,700.00 EUR Electricity generation and services Equity Endesa
Generación SA 45.00% 31.55%
Tecnoguat SA Guatemala City Guatemala 30,948,000.00 GTQElectricity generation from renewable resources
Line-by-line Enel Green Power SpA 75.00% 75.00%
Tejo Energia - Produção e Distribuição de Energia Elétrica SA
Lisbon Portugal 5,025,000.00 EURElectricity generation, transmission and distribution
Equity Endesa Generación SA 43.75% 30.67%
Tenedora de Energía Renovable Sol y Viento SAPI de Cv
Mexico City Mexico 2,892,643,576.00 MXN Renewable energy Equity Enel Green Power SpA 32.89% 32.90%
Teploprogress JSC Sredneuralsk Russian Federation 128,000,000.00 RUB Electricity sale Line-by-line Enel Russia PJSC 60.00% 33.86%
Termoeléctrica José de San Martín SA
Buenos Aires Argentina 500,006.00 ARS Plant construction and maintenance Equity
Central Dock Sud SAEnel Generación Costanera SAEnel Generación El Chocón SA
1.42%
5.33%
18.85%
10.90%
Termoeléctrica Manuel Belgrano SA
Buenos Aires Argentina 500,006.00 ARS Plant construction and maintenance Equity
Central Dock Sud SAEnel Generación Costanera SAEnel Generación El Chocón SA
1.42%
5.33%
18.85%
10.90%
Termotec Energía AIE in liquidation
La Pobla de Vallbona Spain 481,000.00 EUR Cogeneration of
electricity and heat Equity Enel Green Power España SL 45.00% 31.55%
Testing Stand of Ivanovskaya GRES JSC
Komsomolsk Russian Federation 118,213,473.45 RUB Studies, projects and
research - Enel Russia PJSC 1.65% 0.93%
Texkan Wind LLC Andover USA - USDElectricity generation from renewable resources
Line-by-line Enel Texkan Inc 100.00% 100.00%
Thar Surya 1 Private Limited Gurgaon India 100,000.00 INR
Electricity generation from renewable resources
Line-by-line
Enel Green Power India Private Limited (formerly BLP Energy Private Limited)
100.00% 100.00%
Thunder Ranch Wind Holdings I LLC
Dover USA 100.00 USD Holding Line-by-line Enel Green Power North America Inc. 100.00% 100.00%
Thunder Ranch Wind Holdings LLC Wilmington USA - USD Renewable energy Line-by-line Enel Kansas LLC 100.00% 100.00%

230 Half-Year Financial Report at June 30, 2020
Company name Headquarters Country Share capital Currency ActivityConsolidation method Held by % holding
Group % holding
Thunder Ranch Wind Project LLC Dover USA 1.00 USD
Electricity generation from renewable resources
Line-by-lineThunder Ranch Wind Holdings LLC
100.00% 100.00%
Tobivox (RF) (Pty) Ltd Johannesburg South Africa 10,000,000.00 ZAR
Electricity generation from renewable resources
Line-by-line Enel Green Power RSA (Pty) Ltd 60.00% 60.00%
Toledo PV AIE Madrid Spain 26,887.96 EUR Photovoltaic plants Equity Enel Green Power España SL 33.33% 23.36%
Torrepalma Energy 1 SLU Seville Spain 3,100.00 EUR Photovoltaic systems Line-by-line Enel Green Power
España SL 100.00% 70.10%
Tradewind Energy Inc. Wilmington USA 1,000.00 USD
Electricity generation from renewable resources
Line-by-line Enel Kansas LLC 100.00% 100.00%
Transmisora de Energía Renovable SA
Guatemala City Guatemala 233,561,800.00 GTQElectricity generation from renewable resources
Line-by-line
Enel Green Power Guatemala SAEnel Green Power SpAGeneradora Montecristo SA
0.00%
100.00%
0.00%
100.00%
Transmisora Eléctrica de Quillota Ltda
Santiago de Chile Chile 4,404,446,151.00 CLP Electricity transmission and distribution Equity Enel Generación
Chile SA 50.00% 30.19%
Transportadora de Energía SA - TESA Buenos Aires Argentina 100,000.00 ARS
Electricity generation, transmission and distribution
Line-by-line Enel Argentina SAEnel CIEN SA
0.00%100.00% 64.14%
Transportes y Distribuciones Eléctricas SA
Girona Spain 72,121.45 EUR Electricity transmission Line-by-line
Edistribución Redes Digitales SL (Sociedad Unipersonal)
73.33% 51.41%
Triton Power Company Andover USA - USD
Electricity generation from renewable resources
AFS
Enel Green Power North America Inc.Highfalls Hydro Company Inc.
2.00%
98.00%
100.00%
Tsar Nicholas LLC Minneapolis USA - USDElectricity generation from renewable resources
Line-by-line Chi Minnesota Wind LLC 51.00% 51.00%
Tula WPS LLC Tula Russian Federation - RUB Renewable energy Line-by-line
Enel Green Power Rus Limited Liability Company
100.00% 100.00%
TWE Franklin Solar Project LLC Andover USA - USD
Electricity generation from renewable resources
Line-by-line Tradewind Energy Inc. 100.00% 100.00%
TWE ROT DA LLC Andover USA 1.00 USDElectricity generation and sale from renewable resources
Line-by-line Tradewind Energy Inc. 100.00% 100.00%
Twin Lake Hills LLC Minneapolis USA - USDElectricity generation from renewable resources
Line-by-line Chi Minnesota Wind LLC 51.00% 51.00%
Twin Saranac Holdings LLC Wilmington USA - USD
Electricity generation from renewable resources
Line-by-line Enel Green Power North America Inc. 100.00% 100.00%
Tyme Srl Bergamo Italy 100,000.00 EUR Electricity generation Equity YouSave SpA 50.00% 50.00%
Tynemouth Energy Storage Limited London United Kingdom 2.00 GBP Services Line-by-line
Enel Global Thermal Generation Srl
100.00% 100.00%
Ufinet Argentina SA Buenos Aires Argentina 9,745,583.00 ARS - Equity Ufinet Latam SLU
Ufinet Panamá SA99.95%0.05% 20.60%
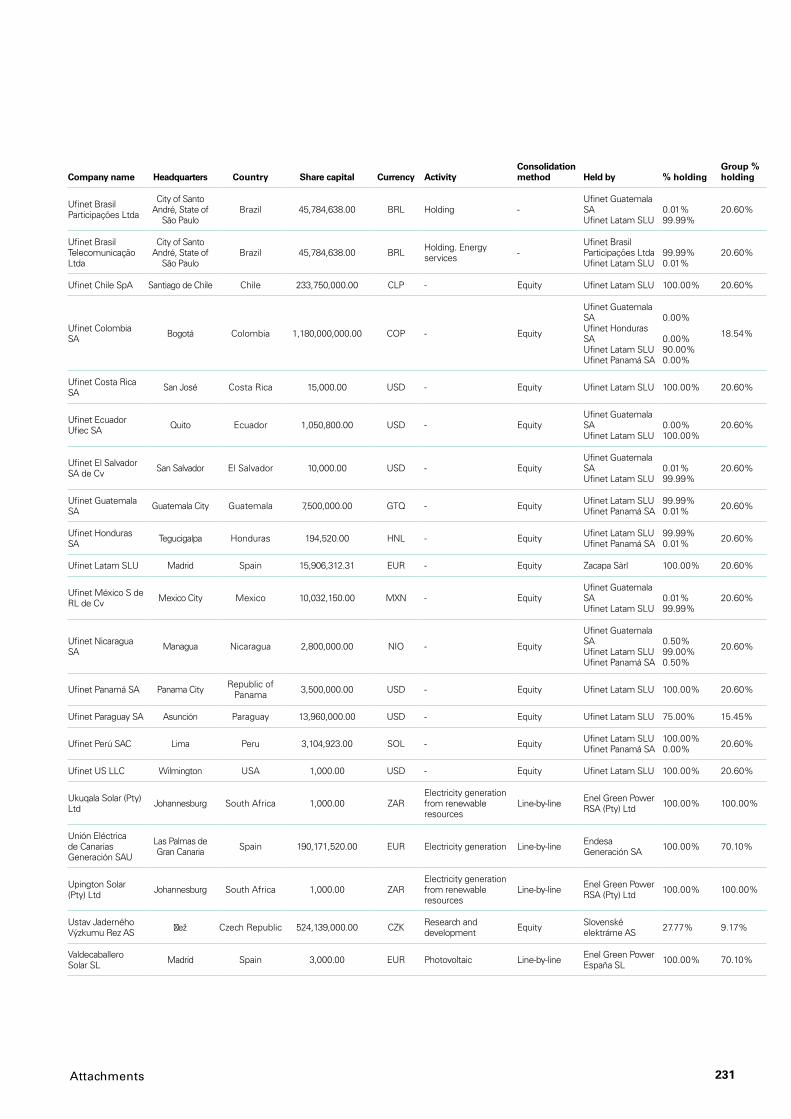
231Attachments
Company name Headquarters Country Share capital Currency ActivityConsolidation method Held by % holding
Group % holding
Ufinet Brasil Participações Ltda
City of Santo André, State of
São PauloBrazil 45,784,638.00 BRL Holding -
Ufinet Guatemala SAUfinet Latam SLU
0.01%99.99%
20.60%
Ufinet Brasil Telecomunicação Ltda
City of Santo André, State of
São PauloBrazil 45,784,638.00 BRL Holding. Energy
services -Ufinet Brasil Participações Ltda Ufinet Latam SLU
99.99%0.01%
20.60%
Ufinet Chile SpA Santiago de Chile Chile 233,750,000.00 CLP - Equity Ufinet Latam SLU 100.00% 20.60%
Ufinet Colombia SA Bogotá Colombia 1,180,000,000.00 COP - Equity
Ufinet Guatemala SAUfinet Honduras SAUfinet Latam SLUUfinet Panamá SA
0.00%
0.00%90.00%0.00%
18.54%
Ufinet Costa Rica SA San José Costa Rica 15,000.00 USD - Equity Ufinet Latam SLU 100.00% 20.60%
Ufinet Ecuador Ufiec SA Quito Ecuador 1,050,800.00 USD - Equity
Ufinet Guatemala SAUfinet Latam SLU
0.00%100.00%
20.60%
Ufinet El Salvador SA de Cv San Salvador El Salvador 10,000.00 USD - Equity
Ufinet Guatemala SAUfinet Latam SLU
0.01%99.99%
20.60%
Ufinet Guatemala SA Guatemala City Guatemala 7,500,000.00 GTQ - Equity Ufinet Latam SLU
Ufinet Panamá SA99.99%0.01% 20.60%
Ufinet Honduras SA Tegucigalpa Honduras 194,520.00 HNL - Equity Ufinet Latam SLU
Ufinet Panamá SA99.99%0.01% 20.60%
Ufinet Latam SLU Madrid Spain 15,906,312.31 EUR - Equity Zacapa Sàrl 100.00% 20.60%
Ufinet México S de RL de Cv Mexico City Mexico 10,032,150.00 MXN - Equity
Ufinet Guatemala SAUfinet Latam SLU
0.01%99.99%
20.60%
Ufinet Nicaragua SA Managua Nicaragua 2,800,000.00 NIO - Equity
Ufinet Guatemala SAUfinet Latam SLUUfinet Panamá SA
0.50%99.00%0.50%
20.60%
Ufinet Panamá SA Panama City Republic of Panama 3,500,000.00 USD - Equity Ufinet Latam SLU 100.00% 20.60%
Ufinet Paraguay SA Asunción Paraguay 13,960,000.00 USD - Equity Ufinet Latam SLU 75.00% 15.45%
Ufinet Perú SAC Lima Peru 3,104,923.00 SOL - Equity Ufinet Latam SLUUfinet Panamá SA
100.00%0.00% 20.60%
Ufinet US LLC Wilmington USA 1,000.00 USD - Equity Ufinet Latam SLU 100.00% 20.60%
Ukuqala Solar (Pty) Ltd Johannesburg South Africa 1,000.00 ZAR
Electricity generation from renewable resources
Line-by-line Enel Green Power RSA (Pty) Ltd 100.00% 100.00%
Unión Eléctrica de Canarias Generación SAU
Las Palmas de Gran Canaria Spain 190,171,520.00 EUR Electricity generation Line-by-line Endesa
Generación SA 100.00% 70.10%
Upington Solar (Pty) Ltd Johannesburg South Africa 1,000.00 ZAR
Electricity generation from renewable resources
Line-by-line Enel Green Power RSA (Pty) Ltd 100.00% 100.00%
Ustav Jaderného Výzkumu Rez AS čež Czech Republic 524,139,000.00 CZK Research and
development Equity Slovenské elektrárne AS 27.77% 9.17%
Valdecaballero Solar SL Madrid Spain 3,000.00 EUR Photovoltaic Line-by-line Enel Green Power
España SL 100.00% 70.10%

232 Half-Year Financial Report at June 30, 2020
Company name Headquarters Country Share capital Currency ActivityConsolidation method Held by % holding
Group % holding
Vayu (Project 1) Private Limited Gurugram India 10,000,000.00 INR
Electricity generation from renewable resources
Line-by-line
Enel Green Power India Private Limited (formerly BLP Energy Private Limited)
100.00% 100.00%
Vektör Enerjí Üretím Anoním čírketí
Istanbul Turkey 3,500,000.00 TRY
Plant construction and electricity generation from renewable sources
AFS Enel SpA 100.00% 100.00%
Ventos de Santa Ângela Energias Renováveis SA
Niterói Brazil 7,315,000.00 BRL Electricity generation Line-by-lineEnel Green Power Brasil Participações Ltda
100.00% 100.00%
Ventos de Santa Esperança Energias Renováveis SA
Niterói Brazil 4,727,414.00 BRLElectricity generation from renewable resources
Line-by-lineEnel Green Power Brasil Participações Ltda
100.00% 100.00%
Ventos de Santo Orestes Energias Renováveis SA
Maracanaú Brazil 1,754,031.00 BRLElectricity generation from renewable resources
Line-by-lineEnel Green Power Brasil Participações Ltda
100.00% 100.00%
Ventos de São Roque Energias Renováveis SA
Maracanaú Brazil 9,988,722.00 BRLElectricity generation from renewable resources
Line-by-lineEnel Green Power Brasil Participações Ltda
100.00% 100.00%
Vientos del Altiplano S de RL de Cv
Mexico City Mexico 1,455,854,094.00 MXNElectricity generation from renewable resources
Equity
Tenedora de Energía Renovable Sol y Viento SAPI de Cv
60.80% 20.00%
Villanueva Solar SA de Cv Mexico City Mexico 205,316,027.15 MXN
Electricity generation from renewable resources
Equity
Tenedora de Energía Renovable Sol y Viento SAPI de Cv
60.80% 20.00%
Viruleiros SL Santiago de Compostela Spain 160,000.00 EUR
Electricity generation from renewable resources
Line-by-line Enel Green Power España SL 67.00% 46.97%
Walden Hydro LLC Wilmington USA - USDElectricity generation from renewable resources
AFS Enel Green Power North America Inc. 100.00% 100.00%
Wapella Bluffs Wind Project LLC Andover USA 1.00 USD
Electricity generation and sale from renewable resources
Line-by-line Tradewind Energy Inc. 100.00% 100.00%
Waseca Solar LLC Waseca USA - USDElectricity generation from renewable resources
Line-by-line Aurora Distributed Solar LLC 100.00% 73.51%
Weber Energy Storage Project LLC
Wilmington USA - USDElectricity generation from renewable resources
Line-by-line
Enel Energy Storage Holdings LLC (formerly EGP Energy Storage Holdings LLC)
100.00% 100.00%
Wespire Inc. Boston USA 1,625,000.00 USD Energy services Equity Enel X North America Inc. 11.21% 11.21%
West Faribault Solar LLC Wilmington USA - USD
Electricity generation from renewable resources
Line-by-line Aurora Distributed Solar LLC 100.00% 73.51%
West Hopkinton Hydro LLC Wilmington USA - USD
Electricity generation from renewable resources
AFS Enel Green Power North America Inc. 100.00% 100.00%
West Waconia Solar LLC Wilmington USA - USD
Electricity generation from renewable resources
Line-by-line Aurora Distributed Solar LLC 100.00% 73.51%
Western New York Wind Corporation Albany USA 300.00 USD
Electricity generation from renewable resources
Line-by-line Enel Green Power North America Inc. 100.00% 100.00%

233Attachments
Company name Headquarters Country Share capital Currency ActivityConsolidation method Held by % holding
Group % holding
Wharton-El Campo Solar Project LLC Andover USA 1.00 USD
Electricity generation and sale from renewable resources
Line-by-line Tradewind Energy Inc. 100.00% 100.00%
White Cloud Wind Holdings LLC Andover USA - USD
Electricity generation from renewable resources
Line-by-line Enel Kansas LLC 100.00% 100.00%
White Cloud Wind Project LLC Andover USA 1.00 USD
Electricity generation and sale from renewable resources
Line-by-line Tradewind Energy Inc. 100.00% 100.00%
Whitney Hill Wind Power Holdings LLC
Andover USA 99.00 USDElectricity generation from renewable resources
Line-by-line Enel Kansas LLC 100.00% 100.00%
Whitney Hill Wind Power LLC Andover USA - USD
Electricity generation from renewable resources
Line-by-lineWhitney Hill Wind Power Holdings LLC
100.00% 100.00%
Wild Run LP Alberta Canada 10.00 CAD Holding Line-by-line
Enel Alberta Wind Inc.Enel Green Power Canada Inc.
0.10%
99.90%
100.00%
Wildcat Flats Wind Project LLC Andover USA 1.00 USD
Electricity generation and sale from renewable resources
Line-by-line Tradewind Energy Inc. 100.00% 100.00%
Wilderness Range Solar Project LLC Andover USA - USD
Electricity generation from renewable resources
Line-by-line Enel Kansas LLC 100.00% 100.00%
Willimantic Power Corporation Hartford USA 100.00 USD
Electricity generation from renewable resources
AFS Enel Green Power North America Inc. 100.00% 100.00%
Wind Belt Transco LLC Andover USA 1.00 USD
Electricity generation and sale from renewable resources
Line-by-line Tradewind Energy Inc. 100.00% 100.00%
Wind Parks Anatolis - Prinias Single Member SA
Maroussi Greece 1,218,188.00 EURElectricity generation from renewable resources
Line-by-line
Enel Green Power Hellas Wind Parks South Evia Single Member SA
100.00% 100.00%
Wind Parks Bolibas SA Maroussi Greece 551,500.00 EUR
Electricity generation from renewable resources
Equity Enel Green Power Hellas SA 30.00% 30.00%
Wind Parks Distomos SA Maroussi Greece 556,500.00 EUR
Electricity generation from renewable resources
Equity Enel Green Power Hellas SA 30.00% 30.00%
Wind Parks Folia SA Maroussi Greece 424,000.00 EUR
Electricity generation from renewable resources
Equity Enel Green Power Hellas SA 30.00% 30.00%
Wind Parks Gagari SA Maroussi Greece 389,000.00 EUR
Electricity generation from renewable resources
Equity Enel Green Power Hellas SA 30.00% 30.00%
Wind Parks Goraki SA Maroussi Greece 551,500.00 EUR
Electricity generation from renewable resources
Equity Enel Green Power Hellas SA 30.00% 30.00%
Wind Parks Gourles SA Maroussi Greece 555,000.00 EUR
Electricity generation from renewable resources
Equity Enel Green Power Hellas SA 30.00% 30.00%
Wind Parks Kafoutsi SA Maroussi Greece 551,500.00 EUR
Electricity generation from renewable resources
Equity Enel Green Power Hellas SA 30.00% 30.00%
Wind Parks Katharas Single Member SA
Maroussi Greece 778,648.00 EURElectricity generation from renewable resources
Line-by-line
Enel Green Power Hellas Wind Parks South Evia Single Member SA
100.00% 100.00%

234 Half-Year Financial Report at June 30, 2020
Company name Headquarters Country Share capital Currency ActivityConsolidation method Held by % holding
Group % holding
Wind Parks Kerasias Single Member SA
Maroussi Greece 945,990.00 EURElectricity generation from renewable resources
Line-by-line
Enel Green Power Hellas Wind Parks South Evia Single Member SA
100.00% 100.00%
Wind Parks Milias Single Member SA Maroussi Greece 1,034,774.00 EUR
Electricity generation from renewable resources
Line-by-line
Enel Green Power Hellas Wind Parks South Evia Single Member SA
100.00% 100.00%
Wind Parks Mitikas Single Member SA Maroussi Greece 772,639.00 EUR
Electricity generation from renewable resources
Line-by-line
Enel Green Power Hellas Wind Parks South Evia Single Member SA
100.00% 100.00%
Wind Parks Petalo SA Maroussi Greece 575,000.00 EUR
Electricity generation from renewable resources
Equity Enel Green Power Hellas SA 30.00% 30.00%
Wind Parks Platanos Single Member SA
Maroussi Greece 635,467.00 EURElectricity generation from renewable resources
Line-by-line
Enel Green Power Hellas Wind Parks South Evia Single Member SA
100.00% 100.00%
Wind Parks Skoubi SA Maroussi Greece 472,000.00 EUR
Electricity generation from renewable resources
Equity Enel Green Power Hellas SA 30.00% 30.00%
Wind Parks Spilias Single Member SA Maroussi Greece 857,490.00 EUR
Electricity generation from renewable resources
Line-by-line
Enel Green Power Hellas Wind Parks South Evia Single Member SA
100.00% 100.00%
Wind Parks Strouboulas SA Maroussi Greece 576,500.00 EUR
Electricity generation from renewable resources
Equity Enel Green Power Hellas SA 30.00% 30.00%
Wind Parks Vitalio SA Maroussi Greece 361,000.00 EUR
Electricity generation from renewable resources
Equity Enel Green Power Hellas SA 30.00% 30.00%
Wind Parks Vourlas SA Maroussi Greece 554,000.00 EUR
Electricity generation from renewable resources
Equity Enel Green Power Hellas SA 30.00% 30.00%
Winter’s Spawn LLC Minneapolis USA - USD
Electricity generation from renewable resources
Line-by-line Chi Minnesota Wind LLC 51.00% 51.00%
Wkn Basilicata Development Pe1 Srl
Rome Italy 10,000.00 EUR Renewable energy Line-by-line Enel Green Power Italia Srl 100.00% 100.00%
Woods Hill Solar LLC Wilmington USA - USD Renewable energy Line-by-line Stillwater Woods
Hill Holdings LLC 100.00% 100.00%
WP Bulgaria 1 EOOD Sofia Bulgaria 5,000.00 BGN
Plant construction, operation and maintenance
Line-by-line Enel Green Power Bulgaria EAD 100.00% 100.00%
WP Bulgaria 10 EOOD Sofia Bulgaria 5,000.00 BGN
Plant construction, operation and maintenance
Line-by-line Enel Green Power Bulgaria EAD 100.00% 100.00%
WP Bulgaria 11 EOOD Sofia Bulgaria 5,000.00 BGN
Plant construction, operation and maintenance
Line-by-line Enel Green Power Bulgaria EAD 100.00% 100.00%
WP Bulgaria 12 EOOD Sofia Bulgaria 5,000.00 BGN
Plant construction, operation and maintenance
Line-by-line Enel Green Power Bulgaria EAD 100.00% 100.00%
WP Bulgaria 13 EOOD Sofia Bulgaria 5,000.00 BGN
Plant construction, operation and maintenance
Line-by-line Enel Green Power Bulgaria EAD 100.00% 100.00%

235Attachments
Company name Headquarters Country Share capital Currency ActivityConsolidation method Held by % holding
Group % holding
WP Bulgaria 14 EOOD Sofia Bulgaria 5,000.00 BGN
Plant construction, operation and maintenance
Line-by-line Enel Green Power Bulgaria EAD 100.00% 100.00%
WP Bulgaria 15 EOOD Sofia Bulgaria 5,000.00 BGN
Plant construction, operation and maintenance
Line-by-line Enel Green Power Bulgaria EAD 100.00% 100.00%
WP Bulgaria 19 EOOD Sofia Bulgaria 5,000.00 BGN
Plant construction, operation and maintenance
Line-by-line Enel Green Power Bulgaria EAD 100.00% 100.00%
WP Bulgaria 21 EOOD Sofia Bulgaria 5,000.00 BGN
Plant construction, operation and maintenance
Line-by-line Enel Green Power Bulgaria EAD 100.00% 100.00%
WP Bulgaria 26 EOOD Sofia Bulgaria 5,000.00 BGN
Plant construction, operation and maintenance
Line-by-line Enel Green Power Bulgaria EAD 100.00% 100.00%
WP Bulgaria 3 EOOD Sofia Bulgaria 5,000.00 BGN
Plant construction, operation and maintenance
Line-by-line Enel Green Power Bulgaria EAD 100.00% 100.00%
WP Bulgaria 6 EOOD Sofia Bulgaria 5,000.00 BGN
Plant construction, operation and maintenance
Line-by-line Enel Green Power Bulgaria EAD 100.00% 100.00%
WP Bulgaria 8 EOOD Sofia Bulgaria 5,000.00 BGN
Plant construction, operation and maintenance
Line-by-line Enel Green Power Bulgaria EAD 100.00% 100.00%
WP Bulgaria 9 EOOD Sofia Bulgaria 5,000.00 BGN
Plant construction, operation and maintenance
Line-by-line Enel Green Power Bulgaria EAD 100.00% 100.00%
Xaloc Solar SLU Valencia Spain 3,000.00 EUR Photovoltaic systems Line-by-line Enel Green Power España SL 100.00% 70.10%
Yacylec SA Buenos Aires Argentina 20,000,000.00 ARS Electricity transmission Equity Enel Américas SA 33.33% 21.38%
Yedesa - Cogeneración SA Almería Spain 234,394.72 EUR Cogeneration of
electricity and heat Equity Enel Green Power España SL 40.00% 28.04%
YouSave SpA Bergamo Italy 500,000.00 EUR
Testing, inspection and certification services, engineering and consulting services
Line-by-line Enel X Italia Srl 100.00% 100.00%
Zacapa HoldCo Sàrl Luxembourg Luxembourg 300,000.00 USD - Equity Zacapa Topco Sàrl 100.00% 20.60%
Zacapa LLC Wilmington USA 1,000.00 USD - Equity Zacapa Sàrl 100.00% 20.60%
Zacapa Sàrl Luxembourg Luxembourg 300,000.00 USD - Equity Zacapa HoldCo Sàrl 100.00% 20.60%
Zacapa Topco Sàrl Luxembourg Luxembourg 30,000,000.00 USD - Equity Enel X International Srl 20.60% 20.60%
Zoo Solar Project LLC Andover USA - USD
Electricity generation from renewable resources
Line-by-line Tradewind Energy Inc. 100.00% 100.00%
Concept design and realizationHNTO - Gruppo HDRÀ
Copy editingpostScriptum di Paola Urbani
PrintingVarigrafica Alto Lazio
Print run: 5 copies
Published in September 2020
INSIDE PAGES
Paper
Fedrigoni Freelife Cento
Weight
120 g/m2
Number of pages
236
COVER
Paper
Fedrigoni Freelife Cento
Weight
300 g/m2
This publication is printed on FSC® certified 100% paper
Publication not for sale
By Enel Communications
DisclaimerThis Report issued in Italian has been translated into English solely for the convenienceof international readers
Enel
Società per azioni
Registered Office 00198 Rome - Italy
Viale Regina Margherita, 137
Stock Capital Euro 10,166,679,946 fully paid-in
Companies Register of Rome and Tax I.D. 00811720580
R.E.A. of Rome 756032 VAT Code 00934061003
© Enel SpA
00198 Rome, Viale Regina Margherita, 137


enel.com
Hal
f-Yea
r Fi
nanc
ial R
epor
t at
Jun
e 30
, 202
0