Half-Year Report 2014
165
Half-Year Report 2014 (A joint stock company incorporated in the People’s Republic of China with limited liability) Stock Code: 939 China Construction Bank Corporation
-
Upload
khangminh22 -
Category
Documents
-
view
0 -
download
0
Transcript of Half-Year Report 2014

Half-Year Report 2014
(A joint stock company incorporated in the People’s Republic of China with limited liability)
Stock Code: 939
China Construction Bank Corporation

Contents 2 Definitions
3 Financial Highlights
4 Corporate Information
6 Chairman’s Statement
8 President’s Report
10 Management Discussion and Analysis 10 Financial Review 27 Business Review 38 Risk Management 44 Capital Management 48 Prospects
49 Changes in Share Capital and Particulars of Shareholders
51 Profiles of Directors, Supervisors, and Senior Management
53 Major Issues
56 Independent Review Report
57 Half-Year Financial Statements
155 Unaudited Supplementary Financial Information
158 Appendix Composition of Capital
Definitions
2 China Construction Bank Corporation Half-Year Report 2014
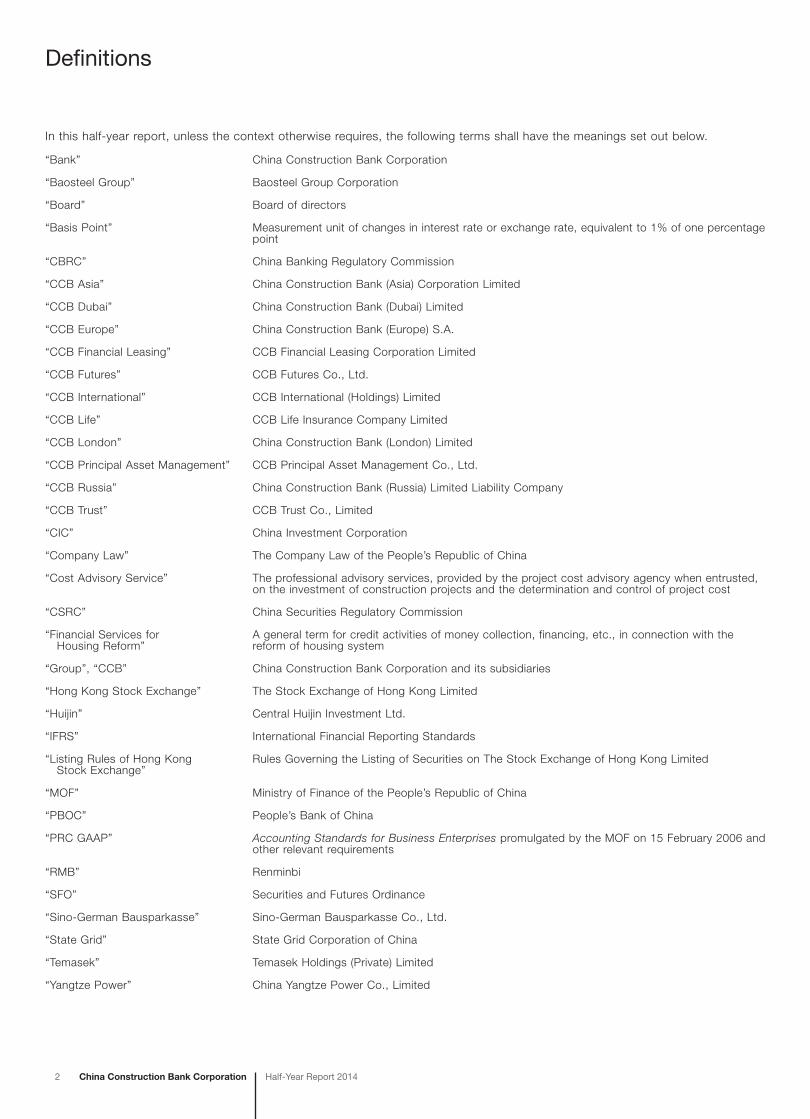
In this half-year report, unless the context otherwise requires, the following terms shall have the meanings set out below.
“Bank” China Construction Bank Corporation
“Baosteel Group” Baosteel Group Corporation
“Board” Board of directors
“Basis Point” Measurement unit of changes in interest rate or exchange rate, equivalent to 1% of one percentage point
“CBRC” China Banking Regulatory Commission
“CCB Asia” China Construction Bank (Asia) Corporation Limited
“CCB Dubai” China Construction Bank (Dubai) Limited
“CCB Europe” China Construction Bank (Europe) S.A.
“CCB Financial Leasing” CCB Financial Leasing Corporation Limited
“CCB Futures” CCB Futures Co., Ltd.
“CCB International” CCB International (Holdings) Limited
“CCB Life” CCB Life Insurance Company Limited
“CCB London” China Construction Bank (London) Limited
“CCB Principal Asset Management” CCB Principal Asset Management Co., Ltd.
“CCB Russia” China Construction Bank (Russia) Limited Liability Company
“CCB Trust” CCB Trust Co., Limited
“CIC” China Investment Corporation
“Company Law” The Company Law of the People’s Republic of China
“Cost Advisory Service” The professional advisory services, provided by the project cost advisory agency when entrusted, on the investment of construction projects and the determination and control of project cost
“CSRC” China Securities Regulatory Commission
“Financial Services for Housing Reform”
A general term for credit activities of money collection, financing, etc., in connection with the reform of housing system
“Group”, “CCB” China Construction Bank Corporation and its subsidiaries
“Hong Kong Stock Exchange” The Stock Exchange of Hong Kong Limited
“Huijin” Central Huijin Investment Ltd.
“IFRS” International Financial Reporting Standards
“Listing Rules of Hong Kong Stock Exchange”
Rules Governing the Listing of Securities on The Stock Exchange of Hong Kong Limited
“MOF” Ministry of Finance of the People’s Republic of China
“PBOC” People’s Bank of China
“PRC GAAP” Accounting Standards for Business Enterprises promulgated by the MOF on 15 February 2006 and other relevant requirements
“RMB” Renminbi
“SFO” Securities and Futures Ordinance
“Sino-German Bausparkasse” Sino-German Bausparkasse Co., Ltd.
“State Grid” State Grid Corporation of China
“Temasek” Temasek Holdings (Private) Limited
“Yangtze Power” China Yangtze Power Co., Limited

Financial Highlights
China Construction Bank CorporationHalf-Year Report 2014 3
The financial information set forth in this half-year report is prepared on a consolidated basis in accordance with the IFRS, and expressed in RMB unless otherwise stated.
(Expressed in millions of RMB unless otherwise stated)
Six months ended
30 June 2014
Six months ended
30 June 2013
Six months ended
30 June 2012
For the periodNet interest income 211,292 187,660 169,692Net fee and commission income 60,180 55,524 49,243Operating income 276,727 252,307 227,812Profit before tax 169,516 155,189 138,512Net profit 130,970 119,964 106,494Net profit attributable to equity shareholders of the Bank 130,662 119,711 106,283
Per share (in RMB)Basic and diluted earnings per share 0.52 0.48 0.43
Profitability indicators (%)Annualised return on average assets1 1.65 1.66 1.65Annualised return on average equity 22.97 23.90 24.56Net interest spread 2.62 2.54 2.53Net interest margin 2.80 2.71 2.71Net fee and commission income to operating income 21.75 22.01 21.62Cost-to-income ratio2 24.18 24.63 25.28Loan-to-deposit ratio 70.93 66.63 64.54
1. Calculated by dividing net profit by the average of total assets at the beginning and end of the period and then listed in annualised figures.
2. Operating expenses (after deductions of business taxes and surcharges) divided by operating income.
(Expressed in millions of RMB unless otherwise stated)
As at 30 June
2014
As at 31 December
2013
As at 31 December
2012
As at the end of the periodGross loans and advances to customers 9,190,601 8,590,057 7,512,312Allowances for impairment losses on loans (238,090) (228,696) (202,433)Total assets 16,399,790 15,363,210 13,972,828Deposits from customers 12,956,956 12,223,037 11,343,079Total liabilities 15,252,778 14,288,881 13,023,283Total equity attributable to equity shareholders of the Bank 1,137,914 1,065,951 941,668Qualifying common share capital 250,011 250,011 250,011Total capital after deductions1 1,404,637 1,316,724 1,093,365Risk-weighted assets1 10,109,495 9,872,790 7,637,705
Per share (in RMB)Net assets per share 4.59 4.30 3.80
Capital adequacy indicators (%)Common Equity Tier 1 ratio1,2 11.21 10.75 11.32Tier 1 ratio1 11.21 10.75 N/ATotal capital ratio1 13.89 13.34 14.32Total equity to total assets 6.99 6.99 6.80
Asset quality indicators (%)Non-performing loan ratio 1.04 0.99 0.99Allowances to non-performing loans 248.87 268.22 271.29Allowances to total loans 2.59 2.66 2.69
1. In accordance with the regulatory requirements, the advanced measurement approach for capital management has been adopted to calculate the ratios, and the regulations during the transition period have been applicable to the calculation of ratios since the second quarter of 2014. At the end of 2013, the ratios were calculated in accordance with the relevant regulations of the Measures for Capital Management of Commercial Banks (Trial). At the end of 2012, the ratios were calculated in accordance with the Measures for the Management of Capital Adequacy Ratios of Commercial Banks.
2. At the end of 2012, Common Equity Tier 1 ratio listed was calculated in accordance with the relevant regulations of the Measures for the Management of Capital Adequacy Ratios of Commercial Banks issued by the CBRC.

Corporate Information
4 China Construction Bank Corporation Half-Year Report 2014
Legal name and abbreviation in Chinese 中國建設銀行股份有限公司(abbreviated as “中國建設銀行”)
Legal name and abbreviation in English CHINA CONSTRUCTION BANK CORPORATION(abbreviated as “CCB”)
Legal representative Wang Hongzhang
Authorised representatives Note Zhang Jianguo
Cheng Pui Ling, Cathy
Secretary to the Board Chen Caihong
Representative of securities affairs Xu Manxia
Company secretary Note Cheng Pui Ling, Cathy
Qualified accountant Yuen Yiu Leung
Registered address, office address and postcode No. 25, Financial Street, Xicheng District, Beijing 100033
Internet website www.ccb.com
Email address [email protected]
Principal place of business in Hong Kong 28/F, CCB Tower, 3 Connaught Road Central, Central, Hong Kong
Newspapers for information disclosure China Securities Journal and Shanghai Securities News
Website of the Shanghai Stock Exchange for publishing the half-year report prepared in accordance with PRC GAAP
www.sse.com.cn
“HKExnews” website of Hong Kong Stock Exchange for publishing the half-year report prepared in accordance with IFRS
www.hkexnews.hk
Place where copies of this half-year report are kept Board of Directors Office of the Bank
Contact Information Address: No. 25, Financial Street, Xicheng District, BeijingTelephone: 86-10-66215533Facsimile: 86-10-66218888
Listing stock exchanges, stock abbreviations and stock codes
A-share: Shanghai Stock Exchange Stock abbreviation: 建設銀行 Stock code: 601939
H-share: The Stock Exchange of Hong Kong Limited Stock abbreviation: CCB Stock code: 939
Date and place of initial registration 17 September 2004State Administration for Industry & Commerce of the People’s Republic of China(Please refer to the H-share Global Offering Prospectus issued by the Bank on Hong Kong Stock Exchange on 14 October 2005 and the A-share Prospectus issued by the Bank on the Shanghai Stock Exchange on 11 September 2007 for more information.)
Note: Mr. Ma Chan-Chi has been appointed as the company secretary and authorised representative of the Bank with effect from 29 August 2014; from and on the even date, Ms. Cathy Pui Ling Cheng no longer performed her duty as the company secretary and authorised representative of the Bank. For details, please refer to the Bank’s announcement on the resolutions of the meeting of the board of directors and announcement on change of company secretary, authorised representative and agent for the service of process in Hong Kong dated 29 August 2014.

China Construction Bank CorporationHalf-Year Report 2014 5
Corporate Information
Date and place of registration change 8 May 2013State Administration for Industry & Commerce of the People’s Republic of China
Registration number of the corporate legal person business licence
100000000039122
Organisation code 10000444-7
Financial licence institution number B0004H111000001
Taxation registration number 京稅證字 110102100004447
Certified public accountants PricewaterhouseCoopers Zhong Tian LLPAddress: 11/F, PricewaterhouseCoopers Centre, 202 Hu Bin Road, ShanghaiSigning accountants: Zhu Yu and Wang WeiPricewaterhouseCoopersAddress: 22/F, Prince’s Building, Central, Hong Kong
Legal advisor as to PRC laws Haiwen & PartnersAddress: 20/F, Fortune Financial Centre, 5 Dong San Huan Central Road,
Chaoyang District, Beijing
Legal advisor as to Hong Kong laws Clifford ChanceAddress: 27/F, Jardine House, One Connaught Place, Central, Hong Kong
A-share registrar China Securities Depository and Clearing Corporation Limited, Shanghai BranchAddress: 36/F, China Insurance Building, 166 East Lujiazui Road,
Pudong New District, Shanghai
H-share registrar Computershare Hong Kong Investor Services LimitedAddress: Rooms 1712-1716, 17/F, Hopewell Centre,
183 Queen’s Road East, Wanchai, Hong Kong

Chairman’s Statement
6 China Construction Bank Corporation Half-Year Report 2014
Dear shareholders,
Faced with a complex external situation and fierce competition, the Group continued to serve the real economy, focusing on deepening reform, reinforcing fundamental management and promoting business transformation and development, and achieved favourable operating results: In the first half of 2014, the Group’s total assets exceeded RMB16 trillion. Net profit amounted to RMB130,970 million, an increase of 9.17% over the same period last year. The annualised return on average assets and the annualised return on average equity were 1.65% and 22.97%, respectively. Net interest margin (NIM) was 2.80%. Total capital ratio and common equity tier one ratio grew respectively to 13.89% and 11.21% after the implementation of the advanced measurement approach for capital management. Our key financial indicators continued to be in the leading position among peers.
We actively supported the real economy and strengthened credit structural adjustment. The Group allocated resources to promote economic development and industrial upgrading. Loans were primarily granted to support key areas and major projects for the national economic development. The loan increase in infrastructure sectors accounted for 47.26% of the increase of corporate loans. The Group actively supported the development of small and micro businesses, “agriculture, farmers and rural areas” and people’s livelihood sectors. In this regard, a total of RMB494,277 million was granted to 96.5 thousand small and micro businesses. Agriculture-related loans rose by RMB80,740 million. Loan balance in people’s livelihood sectors reached RMB238,776 million due to the promotion of the comprehensive financial services scheme branded as “Minben Tongda”, and loan balance for indemnificatory housing projects amounted to RMB81,161 million due to the expansion of financing channels. Meanwhile, the Group seized the opportunity of economic restructuring to promote the credit structural adjustment. The increase of domestic retail loans accounted for 53.88% of total incremental domestic loans. Of this amount, residential mortgages increased by RMB202,164 million to RMB2,082,383 million, ranking first among peers in terms of both the increase and balance of loans. Loans to the five industries with severe excess capacity, including iron and steel, cement, electrolytic aluminium, plate glass as well as shipbuilding sector, dropped by RMB6,126 million, and loans to local government financing vehicles fell by RMB9,274 million over the end of last year, contributing to the further optimisation of customer mix.
We achieved success in the risk and credit system reform, and maintained stable asset quality. After completing the reform and transformation in risk management system, credit mechanisms and approval processes last year, the credit processes were separated in accordance with different loan granting stages of pre-lending investigation, credit approval and post-lending management, contributing to clear segregation of duties and overall risk prevention and control. Credit approval capability was intensified through group credit granting, comprehensive credit granting and global credit granting to meet comprehensive financial needs of customers. As a result, the Group’s loan approval process is functioning efficiently, risk management has become more responsive to the market, and integrated credit approval cycle is greatly shortened, effectively improving customer experience. Confronted with many uncertainties in economic restructuring, the Group began a “Year of Credit Risk Prevention and Control”, to strengthen risk investigation and potential risk elimination in advance. The Group mitigated significant risks under the direct leadership of senior management and enhanced the disposal of NPLs. As a result, credit asset quality remained stable. As at 30 June 2014, the Group’s NPL ratio was 1.04%, and the ratio of allowances for impairment losses to NPLs was 248.87%.
We continuously reinforced business foundation with enhanced operating capability and development potential. Customer base was further consolidated. In the first half of the year, effective corporate customers and those with their basic settlement accounts in the bank increased by 71.8 thousand and 259.6 thousand, respectively; personal customers rose by 9.21 million. Focusing on management and services of customer’s total funds, the Group established working mechanism of circulating customer’s funds within the Bank to raise the fund receipt rate. The Group implemented effective product innovation, achieved faster response to customer needs, and completed 357 product innovation projects. The development of our “New Generation Core Banking System” further advanced. Phase I Projects were successfully accomplished, and Phase II projects were carried forward in batches. With further implementation of “three integrations” at outlets, integrated outlets totalled 13.1 thousand, the proportion of integrated tellers reached 73%, and the number of integrated marketing teams amounted to 13.5 thousand. Some branches began to explore the transformation from functional outlets to intelligent ones in an active manner. With the separation between the bank counters and back offices, the Group achieved centralised processing at the head office of 28 categories of over-the-counter real-time businesses for all outlets.

China Construction Bank CorporationHalf-Year Report 2014 7
Chairman’s Statement
We continued to promote integrated operation, and maintained good development momentum in strategic businesses. A new member, Shanghai Liangmao Futures Brokerage Co., Ltd. was admitted to the Group’s integrated operation platform in the first half of the year. The Group’s subsidiaries maintained strong development momentum with steadily expanding business. Key business indicators of CCB Life and CCB International ranked first respectively among Chinese bank-affiliated subsidiaries. The Group made considerable progress in multifunctional transformation, and rapid development in various strategic businesses. The number of credit card customers reached 50.20 million, and the number of credit cards issued exceeded 60 million, with the increase in customers and cards issued, and the number of transactions leading the market. The underwriting volume of debt securities recorded RMB202,833 million, ranking first among peers for the third consecutive year. The increase in pension assets under trusteeship enjoyed the largest market share among peers. The increase in the number of securities investments funds under custody ranked first among peers, and it became one of the first Chinese-funded custodial banks of RMB Qualified Foreign Institutional Investor (RQFII) from Singapore. The ratio of the number of accounting transactions through electronic banking and self-service channels to the total number of accounting transactions through various channels was 86.55%. The number of personal online banking customers and mobile phone banking customers reached 164 million and 131 million respectively.
We made steady progress in the expansion of overseas network and major breakthroughs in international business development. In the first half of this year, the Group made positive progress in the expansion of overseas network. Macau Branch officially opened; Toronto Branch and the subsidiary bank in New Zealand obtained licenses; active efforts were made for the establishment of Chile Branch, London Branch and four other branches affiliated to CCB Europe. International businesses developed rapidly with breakthroughs in key areas: Cross-border RMB settlement volume totalled RMB710,639 million, a year-on-year increase of 79.85%; the Bank was designated as the London RMB clearing bank, the first time to be nominated as an overseas RMB clearing bank. The Group actively supported financial reform and innovation in free trade zones and border areas. It took the lead in establishing a sub-branch in Khorgas, Xinjiang, became one of the first pilot banks in Shanghai Free Trade Zone, and set up cross-Strait RMB clearing centre in Xiamen and China-ASEAN cross-border RMB business centre in Guangxi respectively to pilot cross-border RMB financial services. RMB bonds totalling 1.5 billion were successfully issued in Frankfurt market.
In the first half of 2014, the Group’s strong performance won wide recognition from the market and community. We received over 40 accolades from renowned organisations at home and abroad, including second place in the “Top 1000 World Banks” published by The Banker in terms of total tier-one capital, advancing by three places over last year; the second place in “Global 2000” published by Forbes; and the 38th place in “Fortune Global 500” published by Fortune, advancing by 12 places over last year.
In the second half of 2014, the global economic recovery still has considerable uncertainties. The domestic economy is experiencing a “shifting period” of growth rate, intertwined cyclical and structural factors, and slack economic driving forces. In celebration of the forthcoming 60th anniversary of China Construction Bank, the Group will continue to deepen reform, accelerate business transformation and development, proactively adjust structure, and enhance business innovation and intelligent system, so as to improve integrated operation and multi-functional services. We are striving to reward the trust and support from shareholders, customers and the wide business community with good business performance, and make all efforts to build the Bank with the strongest value creation capacity.
Wang HongzhangChairman
29 August 2014

President’s Report
8 China Construction Bank Corporation Half-Year Report 2014
Dear shareholders,
In the first half of 2014, against the backdrop of complex economic situations at home and abroad, the Group persisted in stable development, and maintained a good development momentum for various businesses by continuously pushing forward structural adjustment, strengthening risk prevention and control and reinforcing operating foundation.
Good business performance
In the first half of 2014, the Group’s profit before tax reached RMB169,516 million, a year-on-year increase of 9.23%. Net profit rose by 9.17% year-on-year to RMB130,970 million. Operating income increased by 9.68% year-on-year to RMB276,727 million. In this amount, net interest income increased by 12.59%, and net interest margin (NIM) was 2.80%. Net fee and commission income increased by 8.39%, accounting for 21.75% of the operating income. Cost-to-income ratio fell by 0.45 percentage points to 24.18% over the same period last year. The total capital ratio and common equity tier one ratio were 13.89% and 11.21% respectively, maintaining a leading position among peers.
Steady development of various businesses
We kept steady growth in assets and liabilities. At the end of June, the Group’s total assets reached RMB16,399,790 million, an increase of 6.75% over the end of last year. In this amount, gross loans and advances to customers increased by 6.99% to RMB9,190,601 million. Total liabilities rose by 6.75% over the end of last year to RMB15,252,778 million. In this amount, total deposits from customers grew by 6.00% to RMB12,956,956 million.
We persisted in supporting the real economy and promoted credit structural adjustment. The Group supported key national projects under construction or expansion. Loans to infrastructure sectors increased by RMB147,818 million over the end of last year, accounting for 47.26% of the increase in corporate loans. The Group strived to meet the loan demands of small and micro enterprises. Loans to small and micro businesses increased by 8.02% over the end of 2013, 1.03 percentage points higher than the average growth rate of various loans. The Group supported housing demands in livelihood sectors, and residential mortgages increased by RMB202,164 million, or 10.75% over the end of last year.
We maintained fast development in strategic businesses. At the end of June, the number of private banking customers and the total amount of their financial assets increased by 10.48% and 11.18% respectively. Underwriting volume of debt securities recorded RMB202,833 million, ranking first among peers for three consecutive years. The personal pension accounts in operation totalled 3.58 million, with the increase of accounts leading the market. Insurance assets under custody grew by RMB144,567 million over the end of last year, with the increase ranking first in the market. Cross-border RMB settlement volume totalled RMB710,639 million, an increase of 79.85% year-on-year.
Solid and effective risk management and control
We proactively responded to challenges from external environment, centrally strategized risk identification, assessment, mitigation, disposal and system building at the Group level, and strengthened the overall risk management in terms of on and off-balance sheet businesses, domestic and overseas businesses, RMB and foreign currency businesses, and parent company and subsidiaries. The Group reinforced risk inspection for key industries, regions, customers and products, and both loans to industries with severe excess capacity and local government financing vehicle loans decreased over the end of 2013. At the end of June, the Group’s non-performing loan (NPL) ratio was 1.04%, up 0.05 percentage points over the end of last year. The ratio of allowances for impairment losses to NPLs was 248.87%, maintaining at a high level among its peers. Liquidity reserve was adequate, and reserve ratio was kept at a reasonable level.
We actively promoted the implementation and application of advanced measurement approach for capital management. In April, the Bank was officially approved by the CBRC to implement the advanced measurement approach for capital management, being among the first batch of banks to implement the advanced measurement approach. By taking this opportunity, the Group will further upgrade the advanced measurement approach to meet required standards by optimising capital model and parameters, and promote the use of measurement results in business management.

China Construction Bank CorporationHalf-Year Report 2014 9
President’s Report
Reinforced fundamental structure
We consolidated customer base. At the end of June, the number of the Bank’s corporate and institutional customers increased by 203.5 thousand, or 6.64%, to 3,268.9 thousand over the end of last year. The number of personal customers increased by 9.21 million, or 3.17%, to nearly 300 million. The number of online banking customers and mobile phone banking customers increased by 9.23% to 167 million and by 12.56% to 131 million respectively over the end of last year.
We upgraded the deployment of business channels. At the end of June, the Bank had a total of 14,707 operating outlets nationwide, with expanded service coverage. Self-service equipment totalled 72,128, an increase of 3,115 over the end of last year. The ratio of the number of accounting transactions through electronic banking and self-service channels to the total number of accounting transactions through various channels was 86.55%, an increase of 1.15 percentage points over the end of last year.
We made steady progress in the expansion of overseas network and collaboration between parent company and subsidiaries. In the first half of the year, Macau Branch officially opened and Toronto Branch obtained its license. A subsidiary bank was registered and established in New Zealand upon approval in July. In addition, active efforts were made for the establishment of Chile Branch, London Branch and four other branches affiliated to CCB Europe, and CCB London was designated as the London offshore RMB clearing bank. With vigorously enhanced business collaboration between parent company and subsidiaries in terms of customers, products and channels, business development of subsidiaries accelerated.
Business transformation driven by innovation and technology
We continuously improved the capability of product innovation. In the first half of the year, the Bank completed 357 product innovation projects, an increase of 60 over the same period last year. In this regard, intellectual property rights and shares of unlisted companies were regarded as acceptable collateral for development loans to technology enterprises for the first time. As the first comprehensive management product designed for supplementary medical fund among large state-owned commercial banks, “Yangyiwuyou” provided enterprise and institutional customers with value-added services such as consultancy under trusteeship, account information management and pension card.
The “New Generation Core Banking System” gradually produced the desirable effects. The 13 Phase I projects of the “New Generation Core Banking System” were all launched and put into operation, completing service and channel migration for 340 thousand corporate cash management customers, 190 thousand collection and payment entities under custody and 2.52 million corporate online banking customers. The 34 Phase II projects of the “New Generation Core Banking System” were launched in full swing, releasing 18 functions of nine projects such as customer channel and employee channel in advance, and providing strong support for business transformation.
Prospects
In the second half of 2014, the economic and financial situations both at home and abroad will remain complex. The banking industry will be faced with severe challenges brought by the “Overlap of Three Periods”, namely “the shifting period of economic growth rate, the suffering period of economic structural adjustment and the digesting period of previous economic stimulus policies”, and the accelerated reform process of interest rate and exchange rate liberalisation. Adhering to the development strategy featuring “integration, multifunction and intensiveness”, the Group will accelerate business transformation and strengthen risk prevention and control to ensure sound business development.
Lastly, I would like to sincerely thank the Board and the board of supervisors for their tremendous support, as well as our customers for their trust and our staff for their great dedication.
Zhang JianguoVice chairman, executive director and president
29 August 2014
Management Discussion and Analysis
10 China Construction Bank Corporation Half-Year Report 2014
Financial Review
In the first half of 2014, the global economy continued its moderate recovery. The US Federal Reserve accelerated exit from quantitative easing, the European Central Bank introduced a negative interest rate, the Bank of Japan (BOJ) continued its easy monetary policy, and emerging economies were faced with increasing capital inflow. China’s economy developed steadily as a whole, with improved economic structure. In the first half of the year, China’s GDP reached RMB26.9 trillion, a year-on-year growth of 7.4%, and the consumer price index increased by 2.3% over the same period last year.
The Group closely monitored the trend of national economy and changes in regulatory requirements, persisted in sound development, deepened strategic transformation and structural adjustment, and strengthened risk prevention and control, maintaining a good momentum in business development.
Statement of Comprehensive Income Analysis
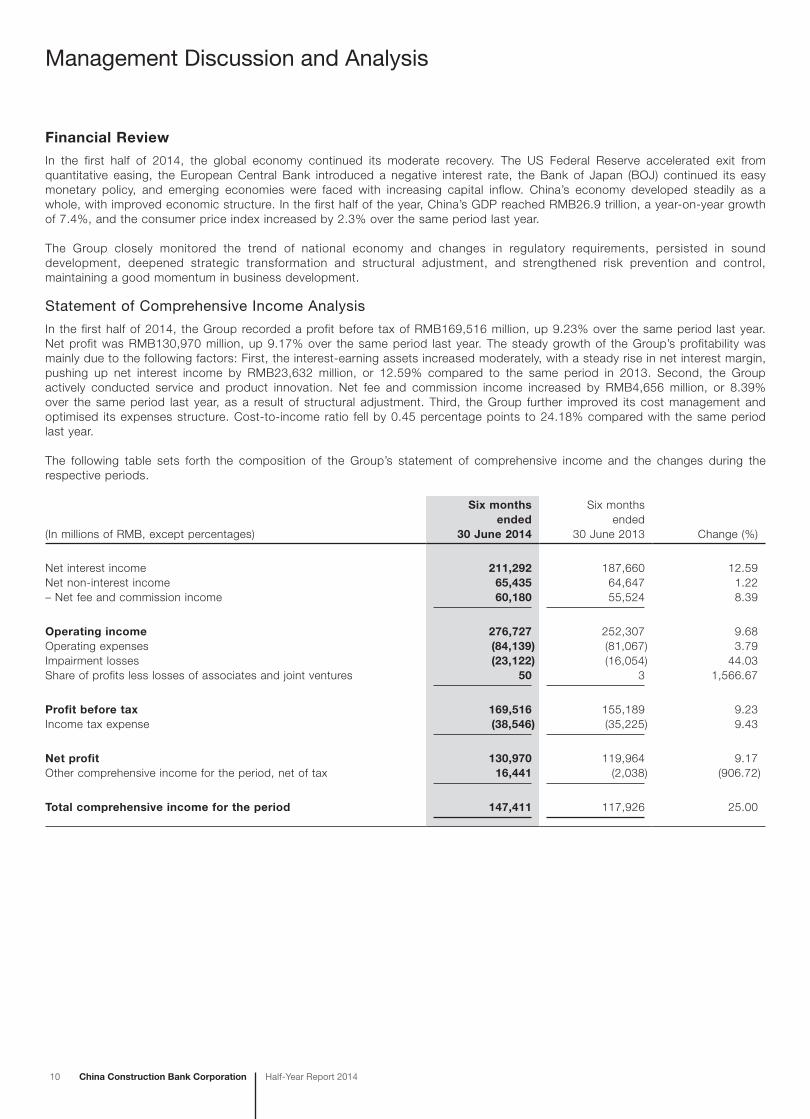
In the first half of 2014, the Group recorded a profit before tax of RMB169,516 million, up 9.23% over the same period last year. Net profit was RMB130,970 million, up 9.17% over the same period last year. The steady growth of the Group’s profitability was mainly due to the following factors: First, the interest-earning assets increased moderately, with a steady rise in net interest margin, pushing up net interest income by RMB23,632 million, or 12.59% compared to the same period in 2013. Second, the Group actively conducted service and product innovation. Net fee and commission income increased by RMB4,656 million, or 8.39% over the same period last year, as a result of structural adjustment. Third, the Group further improved its cost management and optimised its expenses structure. Cost-to-income ratio fell by 0.45 percentage points to 24.18% compared with the same period last year.
The following table sets forth the composition of the Group’s statement of comprehensive income and the changes during the respective periods.
(In millions of RMB, except percentages)
Six months ended
30 June 2014
Six monthsended
30 June 2013 Change (%)
Net interest income 211,292 187,660 12.59Net non-interest income 65,435 64,647 1.22– Net fee and commission income 60,180 55,524 8.39
Operating income 276,727 252,307 9.68Operating expenses (84,139) (81,067) 3.79Impairment losses (23,122) (16,054) 44.03Share of profits less losses of associates and joint ventures 50 3 1,566.67
Profit before tax 169,516 155,189 9.23Income tax expense (38,546) (35,225) 9.43
Net profit 130,970 119,964 9.17Other comprehensive income for the period, net of tax 16,441 (2,038) (906.72)
Total comprehensive income for the period 147,411 117,926 25.00

China Construction Bank CorporationHalf-Year Report 2014 11
Management Discussion and Analysis
Net interest incomeIn the first half of 2014, the Group’s net interest income was RMB211,292 million, an increase of RMB23,632 million, or 12.59%, over the same period last year. The net interest income accounted for 76.35% of the operating income.
The following table sets forth the Group’s average balances of assets and liabilities, related interest income or expense, and average yields or costs during the respective periods.
Six months ended 30 June 2014 Six months ended 30 June 2013
(In millions of RMB, except percentages)Average balance
Interest income/expense
Annualised average
yield/cost (%)Averagebalance
Interest income/expense
Annualised average
yield/cost (%)
AssetsGross loans and advances to customers 8,889,177 256,818 5.83 7,841,914 227,120 5.84Investments in debt securities 3,098,388 61,821 4.03 2,856,667 51,850 3.66Deposits with central banks 2,482,605 19,090 1.55 2,392,241 18,413 1.55Deposits and placements with banks and non-bank financial institutions 540,148 12,497 4.66 695,709 12,375 3.59Financial assets held under resale agreements 233,312 6,247 5.40 176,642 3,589 4.10
Total interest-earning assets 15,243,630 356,473 4.72 13,963,173 313,347 4.52Total allowances for impairment losses (242,119) (217,705)Non-interest-earning assets 523,820 427,384
Total assets 15,525,331 356,473 14,172,852 313,347
LiabilitiesDeposits from customers 12,086,081 113,942 1.90 11,537,567 109,018 1.91Deposits and placements from banks and non-bank financial institutions 1,422,684 24,976 3.55 892,167 10,632 2.40Financial assets sold under repurchase agreements 9,445 82 1.75 30,487 575 3.80Debt securities issued 385,045 5,801 3.05 283,301 4,958 3.53Other interest-bearing liabilities 28,745 380 2.67 33,705 504 3.01
Total interest-bearing liabilities 13,932,000 145,181 2.10 12,777,227 125,687 1.98Non-interest-bearing liabilities 932,879 382,652
Total liabilities 14,864,879 145,181 13,159,879 125,687
Net interest income 211,292 187,660
Net interest spread 2.62 2.54Net interest margin 2.80 2.71
In the first half of 2014, the Group actively responded to challenges and opportunities arising from interest rate liberalisation by constantly improving the pricing capability, optimising its asset and liability structure and adjusting credit structure and customer mix, which positively counteracted the negative impacts of interest rate liberalisation. As a result, the net interest margin rose to 2.80%.

12 China Construction Bank Corporation Half-Year Report 2014
Management Discussion and Analysis
The following table sets forth the effects of the movement of the average balances and average interest rates of the Group’s assets and liabilities on the change in interest income or expense for the first half of 2014 versus that of 2013.
(In millions of RMB) Volume factor1 Interest rate factor1
Change in interest income/expense
AssetsGross loans and advances to customers 30,170 (472) 29,698Investments in debt securities 4,522 5,449 9,971Deposits with central banks 646 31 677Deposits and placements with banks and non-bank financial institutions (3,110) 3,232 122Financial assets held under resale agreements 1,335 1,323 2,658
Change in interest income 33,563 9,563 43,126
LiabilitiesDeposits from customers 5,674 (750) 4,924Deposits and placements from banks and non-bank financial institutions 7,945 6,399 14,344Financial assets sold under repurchase agreements (277) (216) (493)Debt securities issued 1,595 (752) 843Other interest-bearing liabilities (69) (55) (124)
Change in interest expense 14,868 4,626 19,494
Change in net interest income 18,695 4,937 23,632
1. Change caused by both average balances and average interest rates was allocated to volume factor and interest rate factor respectively based on the respective proportions of the volume factor and interest rate factor in terms of absolute values.
Net interest income increased by RMB23,632 million over the same period last year. In this amount, an increase of RMB18,695 million was due to the movement of average balances of assets and liabilities, and an increase of RMB4,937 million was due to the movement of average yields or costs.

China Construction Bank CorporationHalf-Year Report 2014 13
Management Discussion and Analysis
Interest income
In the first half of 2014, the Group’s interest income was RMB356,473 million, an increase of RMB43,126 million, or 13.76%, over the same period of 2013. In this amount, the proportions of interest income from loans and advances to customers, investments in debt securities, deposits with central banks, deposits and placements with banks and non-bank financial institutions were 72.04%, 17.34%, 5.36% and 3.51% respectively.
Interest income from loans and advances to customers
The following table sets forth the average balance, interest income and average yield of each component of the Group’s loans and advances to customers.
Six months ended 30 June 2014 Six months ended 30 June 2013
(In millions of RMB, except percentages)Average balance
Interest income
Average yield (%)
Average balance
Interest income
Average yield (%)
Corporate loans and advances 5,575,330 169,807 6.14 5,057,334 154,853 6.17
Short-term loans 2,022,885 59,675 5.95 1,785,299 52,928 5.98Medium to long-term loans 3,552,445 110,132 6.25 3,272,035 101,925 6.28Personal loans and advances 2,561,433 74,237 5.80 2,127,044 61,169 5.75
Discounted bills 96,405 3,291 6.88 144,625 3,737 5.21
Overseas operations and subsidiaries 656,009 9,483 2.92 512,911 7,361 2.89
Gross loans and advances to customers 8,889,177 256,818 5.83 7,841,914 227,120 5.84
Interest income from loans and advances to customers rose by RMB29,698 million, or 13.08% year-on-year, to RMB256,818 million, mainly because the average balance of loans and advances to customers increased by 13.35% year-on-year. The Group actively adjusted credit structure by increasing loans to retail trade and enhanced pricing management. The interest rate for newly granted loans maintained at a good level, and the average yield of loans and advances to customers was roughly equal to that of the same period last year.
Interest income from investments in debt securities
Interest income from investments in debt securities grew by RMB9,971 million, or 19.23%, to RMB61,821 million over the same period last year. This was mainly because the average yield of investments in debt securities increased by 37 basis points over the same period last year, due to the optimisation of investment portfolios in RMB debt securities and increased investments in debt securities by seizing favourable market opportunities. In addition, the average balance of investments in debt securities increased by 8.46% year-on-year.
Interest income from deposits with central banks
Interest income from deposits with central banks amounted to RMB19,090 million, an increase of RMB677 million, or 3.68% over the same period last year. This was mainly because the average balance of deposits with central banks increased by 3.78% year-on-year. In addition, the amount of excess reserve was kept at a reasonable level, and the average yield roughly remained unchanged compared to that of the same period last year.
Interest income from deposits and placements with banks and non-bank financial institutions
Interest income from deposits and placements with banks and non-bank financial institutions grew by RMB122 million to RMB12,497 million, a year-on-year increase of 0.99%. This was primarily because the average yield of deposits and placements with banks and non-bank financial institutions increased by 107 basis points over the same period in 2013, which was partly offset by the decrease in average balance.
Interest income from financial assets held under resale agreements
Interest income from financial assets held under resale agreements increased by RMB2,658 million, or 74.06% year-on-year, to RMB6,247 million. This was mainly because the average balance of financial assets held under resale agreements increased by 32.08%, and the average yield increased by 130 basis points over the same period of 2013, due to enhanced centralised fund operation.

14 China Construction Bank Corporation Half-Year Report 2014
Management Discussion and Analysis
Interest expense
In the first half of 2014, the Group’s interest expense was RMB145,181 million, a year-on-year increase of RMB19,494 million, or 15.51%.
Interest expense on deposits from customers
The following table sets forth the average balance, interest expense and average cost of each component of the Group’s deposits from customers during the respective periods.
Six months ended 30 June 2014 Six months ended 30 June 2013
(In millions of RMB, except percentages)Average balance
Interest expense
Average cost (%)
Average balance
Interest expense
Average cost (%)
Corporate deposits 6,214,771 55,888 1.81 5,929,795 52,881 1.80
Demand deposits 3,676,242 13,601 0.75 3,507,945 12,365 0.71Time deposits 2,538,529 42,287 3.34 2,421,850 40,516 3.37Personal deposits 5,567,911 55,265 2.00 5,399,359 54,846 2.05
Demand deposits 2,422,319 4,456 0.36 2,237,182 3,971 0.36Time deposits 3,145,592 50,809 3.24 3,162,177 50,875 3.24Overseas operations and subsidiaries 303,399 2,789 1.86 208,413 1,291 1.25
Total deposits from customers 12,086,081 113,942 1.90 11,537,567 109,018 1.91
Interest expense on deposits from customers amounted to RMB113,942 million, representing an increase of RMB4,924 million, or 4.52%, over the same period of 2013, mainly because the average balance of deposits from customers rose by 4.75% year-on-year. From the second half of last year, the Bank designated the newly issued principal-guaranteed wealth management products as financial liabilities at fair value through profit or loss, which pushed down the growth rate and cost of deposit balance to some extent.
Interest expense on deposits and placements from banks and non-bank financial institutions
Interest expense on deposits and placements from banks and non-bank financial institutions reached RMB24,976 million, an increase of RMB14,344 million, or 134.91%, over the same period in 2013, largely because the average balance of deposits and placements from banks and non-bank financial institutions increased by 59.46% and the average cost increased by 115 basis points to 3.55% over the same period last year.
Interest expense on financial assets sold under repurchase agreements
Interest expense on financial assets sold under repurchase agreements decreased by RMB493 million or 85.74% year-on-year to RMB82 million. This was primarily because the average balance of financial assets sold under repurchase agreements decreased by 69.02% and the average cost decreased by 205 basis points to 1.75% over the same period last year.

China Construction Bank CorporationHalf-Year Report 2014 15
Management Discussion and Analysis
Net non-interest incomeThe following table sets forth the composition of the Group’s net non-interest income and the changes during the respective periods.
(In millions of RMB, except percentages)
Six months ended
30 June 2014
Six months ended
30 June 2013 Change (%)
Fee and commission income 61,854 56,995 8.53Less: fee and commission expense (1,674) (1,471) 13.80
Net fee and commission income 60,180 55,524 8.39Other net non-interest income 5,255 9,123 (42.40)
Total net non-interest income 65,435 64,647 1.22
In the first half of 2014, the Group’s net non-interest income reached RMB65,435 million, an increase of RMB788 million, or 1.22% over the same period in 2013.
Net fee and commission income
The following table sets forth the composition of the Group’s net fee and commission income and the changes during the respective periods.
(In millions of RMB, except percentages)
Six months ended
30 June 2014
Six months ended
30 June 2013 Change (%)
Fee and commission income 61,854 56,995 8.53
Bank card fees 14,662 11,947 22.73Consultancy and advisory fees 12,822 13,035 (1.63)Settlement and clearing fees 8,219 6,514 26.17Agency service fees 7,276 6,509 11.78Commission on trust and fiduciary activities 5,161 5,300 (2.62)Wealth management service fees 4,689 5,189 (9.64)Electronic banking service fees 3,281 2,807 16.89Credit commitment fees 1,736 1,518 14.36Guarantee fees 1,117 1,009 10.70Others 2,891 3,167 (8.71)Fee and commission expense (1,674) (1,471) 13.80
Net fee and commission income 60,180 55,524 8.39
In the first half of 2014, the Group’s net fee and commission income increased by RMB4,656 million, or 8.39%, over the same period of 2013 to RMB60,180 million. The ratio of net fee and commission income to operating income decreased by 0.26 percentage points to 21.75%.
Bank card fees grew by 22.73% to RMB14,662 million. In this amount, income from credit cards increased by over 30%, boosted by instalment transactions. Relying on strong customer base and service systems, debit cards maintained steady growth in terms of transaction volume and income.
Consultancy and advisory fees decreased by 1.63% to RMB12,822 million. It was mainly because income from routine financial advisory services dropped considerably as the regulations and management on fee collection of consultancy and advisory business were further strengthened, and the traditionally advantageous businesses such as cost advisory service grew steadily.

16 China Construction Bank Corporation Half-Year Report 2014
Management Discussion and Analysis
Settlement and clearing fees increased by 26.17% to RMB8,219 million. This was because the Bank proactively promoted new settlement products such as self-service of statement of corporate account, electronic bank acceptance bill and corporate settlement card. The relevant business volume and income increased rapidly.
Agency service fees increased by 11.78% to RMB7,276 million. This was mainly because businesses such as underwriting of debt securities, agency fund sales and bancassurance grew well.
Commission on trust and fiduciary activities decreased by 2.62% to RMB5,161 million. In this amount, traditionally advantageous businesses such as housing finance business gained steady growth.
Wealth management service fees dropped by 9.64% to RMB4,689 million. It was mainly because the newly allocated underlying assets had lower risks and shorter durations, as required by the cautious and prudent operation strategy, resulting in the decrease in the average yield of the assets. In addition, the product yield was improved compared to that of the same period last year to fulfil customers’ demands and respond to market competition.
Electronic banking service fees grew by 16.89% to RMB3,281 million. This was mainly due to the rapid growth of customer base and steady expansion in trading volume via electronic banking channels including online banking, mobile phone banking and SMS financial service.
Going forward, the Group will continue to expand customer base, increase business volume, make greater efforts in product innovation and service upgrade, and strive for improvement in customer experience to promote sustainable growth in fee and commission income.
Other net non-interest income
The following table sets forth the composition of the Group’s other net non-interest income and the changes during the respective periods.
(In millions of RMB, except percentages)
Six months ended
30 June 2014
Six months ended
30 June 2013 Change (%)
Net trading gain 1,593 1,270 25.43Dividend income 240 193 24.35Net gain arising from investment securities 1,138 302 276.82Other net operating income 2,284 7,358 (68.96)
Total other net non-interest income 5,255 9,123 (42.40)
Other net non-interest income of the Group was RMB5,255 million, a decrease of RMB3,868 million, or 42.40%, compared to the same period last year. It was mainly because of the decrease in other net operating income.

China Construction Bank CorporationHalf-Year Report 2014 17
Management Discussion and Analysis
Operating expensesThe following table sets forth the composition of the Group’s operating expenses during the respective periods.
(In millions of RMB, except percentages)
Six months ended
30 June 2014
Six months ended
30 June 2013
Staff costs 38,957 35,985Premises and equipment expenses 13,760 12,082Business taxes and surcharges 17,231 15,780Others 14,191 17,220
Total operating expenses 84,139 81,067
Cost-to-income ratio 24.18% 24.63%
In the first half of 2014, the Group enhanced cost management, and optimised expenses structure. Cost-to-income ratio fell by 0.45 percentage points to 24.18% year-on-year, as cost efficiency further improved. The Group’s operating expenses were RMB84,139 million, a year-on-year increase of RMB3,072 million, or 3.79%. In this amount, premises and equipment expenses were RMB13,760 million, a year-on-year increase of RMB1,678 million, or 13.89%. This was mainly because the expenses on rent and premises management and maintenance increased along with the rising prices and greater investments in outlets construction in recent years.
Impairment lossesThe following table sets forth the composition of the Group’s impairment losses during respective periods.
(In millions of RMB)
Six months ended
30 June 2014
Six months ended
30 June 2013
Loans and advances to customers 21,286 16,067
Investments 421 (652)
Available-for-sale financial assets 17 (1,120)Held-to-maturity investments 320 598Debt securities classified as receivables 84 (130)Others 1,415 639
Total impairment losses 23,122 16,054
In the first half of 2014, the Group’s impairment losses were RMB23,122 million, an increase of RMB7,068 million year-on-year. In this amount, impairment losses on loans and advances to customers were RMB21,286 million, an increase of RMB5,219 million year-on-year. Impairment losses on investments were RMB421 million, an increase of RMB1,073 million over the same period last year, which was mainly because part of the allowances for impairment losses on foreign currency bonds were reversed in the first half of 2013.
Income tax expenseIn the first half of 2014, the Group’s income tax expense reached RMB38,546 million, an increase of RMB3,321 million year-on-year. The Group’s effective income tax rate was 22.74%, lower than the 25% statutory rate, largely because the interest income from the PRC government bonds held by the Group was non-taxable in accordance with the tax regulations.

18 China Construction Bank Corporation Half-Year Report 2014
Management Discussion and Analysis
Statement of Financial Position Analysis
AssetsThe following table sets forth the composition of the Group’s total assets as at the dates indicated.
(In millions of RMB, except percentage)As at 30 June 2014 As at 31 December 2013Amount % of total Amount % of total
Gross loans and advances to customers 9,190,601 8,590,057Allowances for impairment losses on loans (238,090) (228,696)
Net loans and advances to customers 8,952,511 54.59 8,361,361 54.42Investments1 3,511,470 21.41 3,414,617 22.23Cash and deposits with central banks 2,578,036 15.72 2,475,001 16.11Deposits and placements with banks and non-bank financial institutions 606,757 3.70 473,351 3.08Financial assets held under resale agreements 351,660 2.14 281,447 1.83Interest receivable 101,551 0.62 80,731 0.53Other assets2 297,805 1.82 276,702 1.80
Total assets 16,399,790 100.00 15,363,210 100.00
1. These comprise financial assets at fair value through profit or loss, available-for-sale financial assets, held-to-maturity investments, and debt securities classified as receivables.
2. These comprise precious metals, positive fair value of derivatives, interests in associates and joint ventures, fixed assets, land use rights, intangible assets, goodwill, deferred tax assets and other assets.
As at 30 June 2014, the Group’s total assets stood at RMB16,399,790 million, an increase of RMB1,036,580 million, or 6.75%, over the end of last year. This was mainly due to the increases in loans and advances to customers, deposits and placements with banks and non-bank financial institutions, and financial assets held under resale agreements. With the Group’s active support for the development in the real economy and people’s livelihood sectors, net loans and advances to customers accounted for 54.59% of total assets, an increase of 0.17 percentage points over the end of 2013. The Group increased the amount of fund use as required by liquidity and profitability management, and the ratio of deposits and placements with banks and non-bank financial institutions and financial assets held under resale agreements to total assets increased by 0.62 and 0.31 percentage points respectively. The Group adjusted the amount of investments in debt securities in accordance with the interest rate trend and liquidity situation, and investments accounted for 21.41% of total assets, a decrease of 0.82 percentage points. Cash and deposits with central banks accounted for 15.72% of total assets, a decrease of 0.39 percentage points.

China Construction Bank CorporationHalf-Year Report 2014 19
Management Discussion and Analysis
Loans and advances to customers
The following table sets forth the composition of the Group’s loans and advances to customers as at the dates indicated.
(In millions of RMB, except percentages)As at 30 June 2014 As at 31 December 2013Amount % of total Amount % of total
Corporate loans and advances 5,712,418 62.16 5,399,631 62.86
Short-term loans 1,960,950 21.34 1,870,823 21.78Medium to long-term loans 3,751,468 40.82 3,528,808 41.08Personal loans and advances 2,673,830 29.09 2,464,654 28.69
Residential mortgages 2,082,383 22.66 1,880,219 21.89Credit card loans 281,401 3.06 268,663 3.13Personal consumer loans 62,902 0.68 71,490 0.83Personal business loans 82,368 0.90 91,655 1.07Other loans1 164,776 1.79 152,627 1.77Discounted bills 118,960 1.29 116,962 1.36
Overseas operations and subsidiaries 685,393 7.46 608,810 7.09
Gross loans and advances to customers 9,190,601 100.00 8,590,057 100.00
1. These comprise individual commercial property loans, home equity loans and educational loans.
As at 30 June 2014, the Group’s gross loans and advances to customers rose by RMB600,544 million, or 6.99% over the end of last year, to RMB9,190,601 million.
Domestic corporate loans and advances of the Bank reached RMB5,712,418 million, an increase of RMB312,787 million, or 5.79% over the end of last year, mainly extended to infrastructure sectors, small and micro businesses and agriculture-related loans. In this amount, short-term loans increased by RMB90,127 million, or 4.82%, and medium to long-term loans increased by RMB222,660 million, or 6.31%.
Domestic personal loans and advances of the Bank increased by RMB209,176 million, or 8.49% over the end of last year, to RMB2,673,830 million. In this amount, residential mortgages increased by RMB202,164 million, or 10.75%, mainly to support the financing needs for residential purpose. Personal consumer loans and personal business loans decreased as a result of the enhancement of loan risk control and adjustment to loan products mix.
Discounted bills increased by RMB1,998 million, or 1.71%, to RMB118,960 million over the end of last year, mainly used to meet the short-term financing needs of targeted prime customers.
Loans and advances to customers of overseas entities and subsidiaries increased by RMB76,583 million, or 12.58% over the end of last year, to RMB685,393 million, mainly attributable to the largely expanded cross-border business and strengthened domestic and overseas business collaboration.

20 China Construction Bank Corporation Half-Year Report 2014
Management Discussion and Analysis
Distribution of loans by type of collaterals
The following table sets forth the distribution of loans and advances by type of collateral as at the dates indicated.
(In millions of RMB, except percentages)As at 30 June 2014 As at 31 December 2013Amount % of total Amount % of total
Unsecured loans 2,462,443 26.79 2,336,298 27.20Guaranteed loans 1,788,460 19.46 1,652,755 19.24Loans secured by tangible assets other than monetary assets 4,019,898 43.74 3,734,986 43.48Loans secured by monetary assets 919,800 10.01 866,018 10.08
Gross loans and advances to customers 9,190,601 100.00 8,590,057 100.00
Allowances for impairment losses on loans and advances to customers
(In millions of RMB)
Six months ended 30 June 2014
Allowances for loans and
advances which are collectively
assessed
Allowances for impaired loans and advances
Total
Which are collectively
assessed
Which are individually
assessed
As at 1 January 171,027 5,532 52,137 228,696Charge for the period 6,608 2,422 17,335 26,365Release during the period – – (5,079) (5,079)Unwinding of discount – – (894) (894)Transfers out – (2) (2,772) (2,774)Write-offs – (1,575) (7,456) (9,031)Recoveries – 84 723 807
As at 30 June 177,635 6,461 53,994 238,090
The Group adhered to the prudent principle by fully considering the impact of changes in external environment including macro economy and government control policies on credit asset quality, and made full allowances for impairment losses on loans and advances to customers. As at 30 June 2014, the allowances for impairment losses on loans and advances to customers were RMB238,090 million, an increase of RMB9,394 million over the end of last year. The ratio of allowances to non-performing loans was 248.87%, a decrease of 19.35 percentage points over the end of last year. The ratio of allowances to total loans stood at 2.59%, 0.07 percentage points lower than that of the end of last year.

China Construction Bank CorporationHalf-Year Report 2014 21
Management Discussion and Analysis
Investments
The following table sets forth the composition of the Group’s investments by nature as at the dates indicated.
(In millions of RMB, except percentages)As at 30 June 2014 As at 31 December 2013Amount % of total Amount % of total
Debt securities investments 3,188,594 90.81 3,115,865 91.25Equity instruments 17,645 0.50 19,249 0.56Funds 1,850 0.05 937 0.03Other debt instruments 303,381 8.64 278,566 8.16
Total investments 3,511,470 100.00 3,414,617 100.00
In the first half of 2014, in accordance with its annual investment and trading strategy and risk policy requirements, the Group proactively dealt with regulatory and market changes to achieve the balance between risks and returns and continuously improved the yield of investment portfolios. As at 30 June 2014, the Group’s investments totalled RMB3,511,470 million, an increase of RMB96,853 million, or 2.84% over the end of last year. In this amount, debt securities investments accounted for 90.81% of total investments, a decrease of 0.44 percentage points over the end of last year. Other debt instruments accounted for 8.64% of total investments, an increase of 0.48 percentage points over the end of last year.
The following table sets forth the composition of the Group’s investments by holding intention as at the dates indicated.
(In millions of RMB, except percentages)As at 30 June 2014 As at 31 December 2013Amount % of total Amount % of total
Financial assets at fair value through profit or loss 324,072 9.23 364,050 10.66Available-for-sale financial assets 774,800 22.06 760,292 22.26Held-to-maturity investments 2,220,584 63.24 2,100,538 61.52Debt securities classified as receivables 192,014 5.47 189,737 5.56
Total investments 3,511,470 100.00 3,414,617 100.00
Debt securities investments
The following table sets forth the composition of the Group’s debt instruments by currency as at the dates indicated.
(In millions of RMB, except percentages)As at 30 June 2014 As at 31 December 2013Amount % of total Amount % of total
RMB 3,127,341 98.08 3,051,957 97.95USD 32,465 1.02 36,066 1.16HKD 13,126 0.41 15,604 0.50Other foreign currencies 15,662 0.49 12,238 0.39
Total debt securities investments 3,188,594 100.00 3,115,865 100.00
As at 30 June 2014, total investments in debt securities increased by RMB72,729 million, or 2.33% over the end of last year, to RMB3,188,594 million. In this amount, RMB debt securities increased by RMB75,384 million, or 2.47%, while the foreign currency debt securities decreased by RMB2,655 million, or 4.15% over the end of last year.

22 China Construction Bank Corporation Half-Year Report 2014
Management Discussion and Analysis
The following table sets forth the composition of the Group’s debt instruments by issuer as at the dates indicated.
(In millions of RMB, except percentages)As at 30 June 2014 As at 31 December 2013Amount % of total Amount % of total
Government 1,102,801 34.59 1,075,428 34.51Central banks 188,895 5.92 197,910 6.35Policy banks 493,502 15.48 445,850 14.31Banks and non-bank financial institutions 966,922 30.32 895,277 28.73Public sector entities 19 – 98 0.01Cinda 18,852 0.59 18,852 0.61Other enterprises 417,603 13.10 482,450 15.48
Total debt securities investments 3,188,594 100.00 3,115,865 100.00
Interest receivable
As at 30 June 2014, the Group’s interest receivable was RMB101,551 million, an increase of RMB20,820 million, or 25.79%, over the end of last year. This was mainly due to the growth in loans, debt securities investments and deposits with banks and non-bank financial institutions.
LiabilitiesThe following table sets forth the composition of the Group’s total liabilities as at the dates indicated.
(In millions of RMB, except percentages)As at 30 June 2014 As at 31 December 2013Amount % of total Amount % of total
Deposits from customers 12,956,956 84.95 12,223,037 85.54Deposits and placements from banks and non-bank financial institutions 1,054,488 6.91 848,012 5.94Financial assets sold under repurchase agreements 3,065 0.02 61,873 0.43Debt securities issued 428,524 2.81 357,540 2.50Other liabilities1 809,745 5.31 798,419 5.59
Total liabilities 15,252,778 100.00 14,288,881 100.00
1. These comprise borrowings from central banks, financial liabilities at fair value through profit or loss, negative fair value of derivatives, accrued staff costs, taxes payable, interest payable, provisions, deferred tax liabilities and other liabilities.
As at 30 June 2014, the Group’s total liabilities were RMB15,252,778 million, an increase of RMB963,897 million, or 6.75% over the end of 2013. In this amount, deposits from customers accounted for 84.95% of total liabilities, a decrease of 0.59 percentage points over the end of 2013. The Group moderately absorbed funds from other banks to increase liquidity reserve. Deposits and placements from banks and non-bank financial institutions accounted for 6.91% of total liabilities, an increase of 0.97 percentage points. Debt securities issued accounted for 2.81% of total liabilities, an increase of 0.31 percentage points, mainly because the overseas branches and CCB Asia issued more certificates of deposit.

China Construction Bank CorporationHalf-Year Report 2014 23
Management Discussion and Analysis
Deposits from customers
The following table sets forth the Group’s deposits from customers by product type as at the dates indicated.
(In millions of RMB, except percentages)As at 30 June 2014 As at 31 December 2013Amount % of total Amount % of total
Corporate deposits 6,741,994 52.03 6,443,255 52.71
Demand deposits 3,995,933 30.84 4,064,038 33.25Time deposits 2,746,061 21.19 2,379,217 19.46Personal deposits 5,866,415 45.28 5,514,647 45.12
Demand deposits 2,635,111 20.34 2,510,525 20.54Time deposits 3,231,304 24.94 3,004,122 24.58Overseas operations and subsidiaries 348,547 2.69 265,135 2.17
Total deposits from customers 12,956,956 100.00 12,223,037 100.00
As at 30 June 2014, the Group’s total deposits from customers reached RMB12,956,956 million, an increase of RMB733,919 million, or 6.00% over the end of 2013. In this amount, domestic time deposits of the Bank increased by RMB594,026 million, or 11.03%, higher than the 0.86% growth of demand deposits, and accounted for 46.13% of total deposits from customers, an increase of 2.09 percentage points over the end of 2013.
Shareholders’ equityThe following table sets forth the composition of the Group’s total equity as at the dates indicated.
(In millions of RMB)As at
30 June 2014As at
31 December 2013
Share capital 250,011 250,011Capital reserve 135,537 135,523Investment revaluation reserve (4,468) (19,290)Surplus reserve 107,970 107,970General reserve 169,039 153,835Retained earnings 484,539 444,084Exchange reserve (4,714) (6,182)
Total equity attributable to equity shareholders of the Bank 1,137,914 1,065,951Non-controlling interests 9,098 8,378
Total equity 1,147,012 1,074,329
As at 30 June 2014, the Group’s total equity reached RMB1,147,012 million, an increase of RMB72,683 million over the end of 2013. The ratio of total equity to total assets for the Group was 6.99%.
Analysis of off-balance sheet itemsThe Group’s off-balance sheet items include derivatives, commitments and contingent liabilities. Derivatives include interest rate contracts, exchange rate contracts, precious metal contracts, and equity instrument contracts. Please refer to Note “Derivatives” in the “Financial Statements” of this half-year report for details on the nominal amounts and fair value of derivatives. Commitments and contingent liabilities include credit commitments, operating lease commitments, capital commitments, underwriting obligations, redemption obligations, outstanding litigation and disputes. The Group enhanced the refined management over off-balance sheet activities and continued to advance the adjustments to off-balance sheet structure. Among these, credit commitments were the largest component, with a balance of RMB2,394,755 million as at 30 June 2014, an increase of RMB84,528 million over the end of 2013. Please refer to Note “Commitments and Contingent Liabilities” in the “Financial Statements” of this half-year report for details on commitments and contingent liabilities.

24 China Construction Bank Corporation Half-Year Report 2014
Management Discussion and Analysis
Loan Quality Analysis
Distribution of loans by the five-category classificationThe following table sets forth, as at the dates indicated, the distribution of the Group’s loans by the five-category loan classification under which NPLs include substandard, doubtful and loss categories.
(In millions of RMB, except percentages)As at 30 June 2014 As at 31 December 2013Amount % of total Amount % of total
Normal 8,874,606 96.56 8,300,113 96.63Special mention 220,327 2.40 204,680 2.38Substandard 41,435 0.45 32,100 0.37Doubtful 43,375 0.47 42,231 0.49Loss 10,858 0.12 10,933 0.13
Gross loans and advances to customers 9,190,601 100.00 8,590,057 100.00
Non-performing loans 95,668 85,264Non-performing loan ratio 1.04 0.99
In the first half of 2014, the Group stepped up credit structure adjustments, comprehensively strengthened post-lending management and risk prevention and mitigation, and expedited NPL disposal. As a result, credit asset quality remained stable. As at 30 June 2014, the Group’s NPLs were RMB95,668 million, an increase of RMB10,404 million from the end of 2013, while the NPL ratio stood at 1.04%, 0.05 percentage points higher from the end of 2013. The proportion of special mention loans was 2.40%, 0.02 percentage points higher from the end of 2013.
Distribution of loans and NPLs by product typeThe following table sets forth, as at the dates indicated, the Group’s loans and NPLs by product type.
(In millions of RMB, except percentages)
As at 30 June 2014 As at 31 December 2013
Loans NPLsNPL
ratio (%) Loans NPLsNPL
ratio (%)
Corporate loans and advances 5,712,418 85,189 1.49 5,399,631 76,481 1.42
Short-term loans 1,960,950 59,378 3.03 1,870,823 50,142 2.68Medium to long-term loans 3,751,468 25,811 0.69 3,528,808 26,339 0.75Personal loans and advances 2,673,830 9,510 0.36 2,464,654 8,002 0.32
Residential mortgages 2,082,383 3,980 0.19 1,880,219 3,203 0.17Credit card loans 281,401 2,226 0.79 268,663 1,772 0.66Personal consumer loans 62,902 836 1.33 71,490 780 1.09Personal business loans 82,368 1,557 1.89 91,655 1,449 1.58Other loans1 164,776 911 0.55 152,627 798 0.52Discounted bills 118,960 – – 116,962 – –
Overseas operations and subsidiaries 685,393 969 0.14 608,810 781 0.13
Gross loans and advances to customers 9,190,601 95,668 1.04 8,590,057 85,264 0.99
1. These comprise individual commercial property mortgage loans, home equity loans and educational loans.

China Construction Bank CorporationHalf-Year Report 2014 25
Management Discussion and Analysis
As at 30 June 2014, the NPL ratio for domestic corporate loans and advances was 1.49%, an increase of 0.07 percentage points over the end of 2013, and that for personal loans and advances was 0.36%, an increase of 0.04 percentage points over the end of 2013. The Group constantly strengthened overseas risk management and consolidated management at the Group level, and the asset quality of overseas entities and subsidiaries remained stable.
Distribution of loans and NPLs by industryThe following table sets forth, as at the dates indicated, the Group’s loans and NPLs by industry.
(In millions of RMB, except percentages)
As at 30 June 2014 As at 31 December 2013
Loans% of total NPLs
NPL ratio (%) Loans
% of total NPLs
NPL ratio (%)
Corporate loans and advances 5,712,418 62.16 85,189 1.49 5,399,631 62.86 76,481 1.42
Manufacturing 1,361,303 14.81 43,281 3.18 1,322,660 15.40 38,083 2.88Transportation, storage and postal services 1,005,412 10.94 6,504 0.65 956,597 11.14 5,297 0.55Production and supply of electric power, heat, gas and water 587,796 6.40 2,368 0.40 571,028 6.65 2,030 0.36Real estate 521,625 5.68 3,274 0.63 500,428 5.83 3,807 0.76Leasing and commercial services 539,101 5.87 566 0.10 473,877 5.52 982 0.21 – Commercial services 520,980 5.67 560 0.11 460,398 5.36 977 0.21Wholesale and retail trade 408,110 4.44 21,000 5.15 392,744 4.57 19,302 4.91Water, environment and public utility management 294,886 3.21 172 0.06 272,453 3.17 197 0.07Construction 274,679 2.99 2,781 1.01 238,601 2.78 2,049 0.86Mining 229,200 2.49 1,389 0.61 217,448 2.53 843 0.39 – Exploitation of petroleum and natural gas 6,693 0.07 – – 4,888 0.06 4 0.08Education 76,826 0.84 266 0.35 71,637 0.83 261 0.36Information transmission, software and information technology services 26,341 0.29 1,007 3.82 29,569 0.34 950 3.21 – Telecommunications, broadcast and television, and satellite transmission services 19,784 0.22 472 2.39 22,369 0.26 462 2.07Others 387,139 4.20 2,581 0.67 352,589 4.10 2,680 0.76Personal loans and advances 2,673,830 29.09 9,510 0.36 2,464,654 28.69 8,002 0.32
Discounted bills 118,960 1.29 – – 116,962 1.36 – –
Overseas operations and subsidiaries 685,393 7.46 969 0.14 608,810 7.09 781 0.13
Gross loans and advances to customers 9,190,601 100.00 95,668 1.04 8,590,057 100.00 85,264 0.99
In the first half of 2014, in line with the “12th Five-Year Plan” and changes in other external policies, the Group timely optimised credit policies, re-inspected credit systems, and refined criteria in customer risk selection. It adhered to the limit management for various industries, and steadily promoted credit structural adjustments. The quality of loans to infrastructure-related sectors remained stable while the new NPLs mainly arose from manufacturing, and wholesale and retail trade.

26 China Construction Bank Corporation Half-Year Report 2014
Management Discussion and Analysis
Restructured loans and advances to customersThe following table sets forth, as at the dates indicated, the Group’s restructured loans and advances to customers.
(In millions of RMB, except percentages)
As at 30 June 2014 As at 31 December 2013
Amount% of gross loans
and advances Amount% of gross loans
and advances
Restructured loans and advances to customers 1,602 0.02 1,009 0.01
As at 30 June 2014, restructured loans and advances to customers increased by RMB593 million over the end of 2013, to RMB1,602 million, accounting for 0.02% of gross loans and advances, an increase of 0.01 percentage points over the end of last year.
Overdue loans and advances to customersThe following table sets forth, as at the dates indicated, the Group’s overdue loans and advances to customers by overdue period.
(In millions of RMB, except percentages)
As at 30 June 2014 As at 31 December 2013
Amount% of gross loans
and advances Amount% of gross loans
and advances
Overdue for no more than 3 months 46,996 0.51 25,077 0.30Overdue for 3 months to 1 year 37,384 0.41 26,103 0.30Overdue for 1 to 3 years 27,882 0.30 26,552 0.31Overdue for over 3 years 8,159 0.09 8,972 0.10
Total overdue loans and advances to customers 120,421 1.31 86,704 1.01
As at 30 June 2014, overdue loans and advances to customers increased by RMB33,717 million to RMB120,421 million over the end of 2013, mainly because delinquencies increased as certain customers experienced difficulty in liquidity with the slowdown of domestic economy.
Differences between the Financial Statements Prepared under PRC GAAP and Those Prepared under IFRS
There is no difference in the net profit for the six months ended 30 June 2014 or total equity as at 30 June 2014 between the Group’s consolidated financial statements prepared under PRC GAAP and those prepared under IFRS.
China Construction Bank CorporationHalf-Year Report 2014 27
Management Discussion and Analysis
Business Review
The Group’s major business segments are corporate banking, personal banking, treasury business, and others including overseas businesses and subsidiaries.
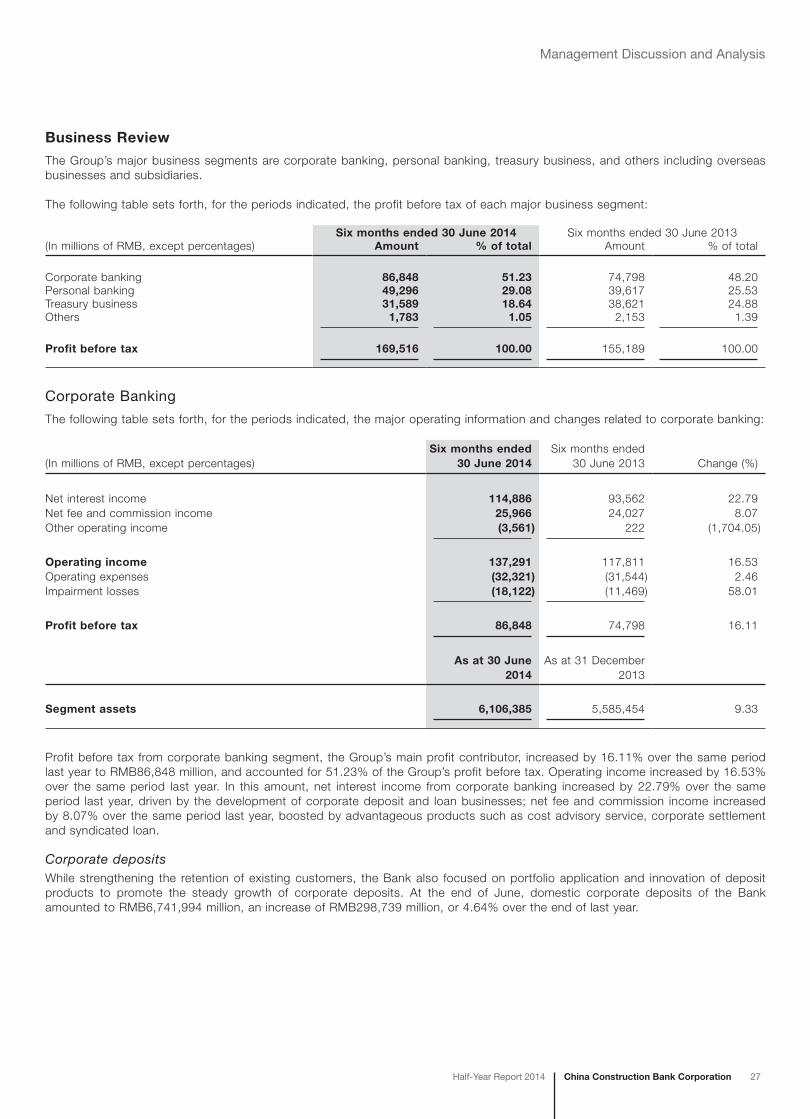
The following table sets forth, for the periods indicated, the profit before tax of each major business segment:
Six months ended 30 June 2014 Six months ended 30 June 2013(In millions of RMB, except percentages) Amount % of total Amount % of total
Corporate banking 86,848 51.23 74,798 48.20Personal banking 49,296 29.08 39,617 25.53Treasury business 31,589 18.64 38,621 24.88Others 1,783 1.05 2,153 1.39
Profit before tax 169,516 100.00 155,189 100.00
Corporate Banking
The following table sets forth, for the periods indicated, the major operating information and changes related to corporate banking:
(In millions of RMB, except percentages)Six months ended
30 June 2014Six months ended
30 June 2013 Change (%)
Net interest income 114,886 93,562 22.79Net fee and commission income 25,966 24,027 8.07Other operating income (3,561) 222 (1,704.05)
Operating income 137,291 117,811 16.53Operating expenses (32,321) (31,544) 2.46Impairment losses (18,122) (11,469) 58.01
Profit before tax 86,848 74,798 16.11
As at 30 June 2014
As at 31 December 2013
Segment assets 6,106,385 5,585,454 9.33
Profit before tax from corporate banking segment, the Group’s main profit contributor, increased by 16.11% over the same period last year to RMB86,848 million, and accounted for 51.23% of the Group’s profit before tax. Operating income increased by 16.53% over the same period last year. In this amount, net interest income from corporate banking increased by 22.79% over the same period last year, driven by the development of corporate deposit and loan businesses; net fee and commission income increased by 8.07% over the same period last year, boosted by advantageous products such as cost advisory service, corporate settlement and syndicated loan.
Corporate depositsWhile strengthening the retention of existing customers, the Bank also focused on portfolio application and innovation of deposit products to promote the steady growth of corporate deposits. At the end of June, domestic corporate deposits of the Bank amounted to RMB6,741,994 million, an increase of RMB298,739 million, or 4.64% over the end of last year.

28 China Construction Bank Corporation Half-Year Report 2014
Management Discussion and Analysis
Corporate loansThe Bank’s corporate loans were granted at a stable and balanced pace to mainly support the development of the real economy. At the end of June, domestic corporate loans and advances of the Bank amounted to RMB5,712,418 million, an increase of RMB312,787 million, or 5.79% over the end of 2013. Loans to infrastructure sectors totalled RMB2,435,551 million, an increase of RMB147,818 million over the end of last year, and accounted for 47.26% of the increase in corporate loans. Agriculture-related loans amounted to RMB1,679,898 million. In this amount, loans to new countryside construction reached RMB128,364 million. The accumulated amount of loans granted to internet merchant business since 2007 exceeded RMB120 billion, extending to over 16,000 customers in total.
The Bank strictly implemented list management. Loans to the five industries with severe excess capacity, including iron and steel, cement, electrolytic aluminium, plate glass as well as shipbuilding sector, decreased by RMB6,126 million over the end of last year to RMB139,567 million. The Bank strictly controlled the total amount of loans to government financing vehicles and continuously optimised cash flow structures. Those classified under the regulated category decreased by RMB9,274 million over the end of last year. Of this amount, loans fully covered by cash flows accounted for 96.76%. Property development loans were mainly in support of the high quality real estate customers and the general residential projects with high credit rating, good business performance and proper closed management of project funds. The outstanding balance of property development loans was RMB460,052 million, an increase of RMB15,401 million over the end of last year.
Small enterprise businessThe Bank regards small and micro enterprise business as its important strategic business in support of the real economy. The Bank gives priority to the development of small and micro enterprise business, sticks to retail and batch operation models, and constantly expands the coverage of financial services for small and micro enterprises by following the guidance of subdivided, standardised and intensified business transformation. In the first half of 2014, the Bank made active efforts to accommodate financial needs of small and micro enterprises, with continuously improved service model and quality. The Bank promoted cluster and batch service via products including credit cooperation loan and supply chain financing, through the platforms of business communities, industrial chains, enterprise clusters and relying on the third-party information and credit strength of governments and associations, so as to boost the availability of small and micro loans. By capitalising on outlets being familiar with and close to customers, the Bank strengthened the application and promotion of “big data” micro credit loan products to expand the coverage of small and micro finance. The Bank further consolidated and improved the operation model based on “Credit Factory” and scorecard, and enhanced the professionalism and intensiveness of business handling. At the end of June, according to the standards of SMEs jointly issued by four ministries and commissions including the Ministry of Industry and Information Technology in 2011 as well as the CBRC’s latest regulatory requirements, loans to small and micro business were RMB1,068,783 million, up 8.02% over the end of last year, and the number of credit customers for small and micro business reached 240,229, an increase of 8,268.
Cost advisory serviceCost advisory service is the Bank’s unique fee-based business product with a strong brand. It has had a history of 60 years since it emerged and developed along with the Bank’s long-term practices of investment in fixed assets and being the agency of the state financial functions. The Bank’s 36 tier-one branches had the grade-A qualification for engineering cost advisory service issued by the Ministry of Housing and Urban-Rural Development, and 157 tier-two branches set up specialised units for cost advisory service. In the first half of 2014, the Bank continued to reinforce the unique advantages of engineering cost advisory service and enhance its profitability and market influence, while strengthening standardised business management and ensuring compliance operation. Income from cost advisory service amounted to RMB6,284 million, a year-on-year increase of 12.23%.
Institutional businessThe Bank vigorously promoted its updated “Minben Tongda” comprehensive financial services brand. With a focus on high quality customers in areas of education, health, social security, culture and environmental protection, the Bank further expanded the range of comprehensive services. The Bank entered into a comprehensive strategic cooperation agreement with Zhejiang University, and initiated self-service equipment registration and payment service for Peking Union Medical College Hospital, West China Hospital of Sichuan University and other key customers. The application of financial social security card continuously expanded. The Bank ranked first in terms of the number of customers of the central finance authorised payment and non-tax revenue collection agency service. The Bank was approved to be the exclusive administering bank of the collection account of online sales for National Sports Lottery Centre. The Bank became one of the first five settlement banks by entering into a settlement bank cooperation agreement with International Gold Trade Centre Co., Ltd at Shanghai Free Trade Zone. The number of “Xincunguan” customers whose securities deposits were managed by the Bank as a third party totalled 22.89 million, maintaining the leading position among peers.

China Construction Bank CorporationHalf-Year Report 2014 29
Management Discussion and Analysis
International businessInternational business maintained rapid development momentum and achieved breakthroughs in various areas. In the first half of 2014, international settlement volume of the Bank reached US$559,244 million, a year-on-year increase of 2.24%; cross-border RMB settlement volume totalled RMB710,639 million, a year-on-year increase of 79.85%. The Bank was designated as the London RMB clearing bank, the first time such a title has been granted by the PBOC outside of Asia. It was also the first time for the Bank to be nominated as an overseas RMB clearing bank. The Bank created sub-brands of “trade finance” with over 40 products, offering various ways of settlement and covering all stages of the trading process, providing customers with integrated solutions for domestic and foreign currencies businesses and domestic and overseas businesses. The Bank actively engaged in business trials in special economic areas, took the lead in establishing a sub-branch in Khorgas, Xinjiang, became one of the first pilot banks in Shanghai Free Trade Zone, and set up cross-Strait RMB clearing centre in Xiamen and China-ASEAN cross-border RMB business centre in Guangxi respectively. The Bank steadily expanded agency bank network and established head office level agency bank relationship with a total of 1,449 commercial banks, covering 138 countries and regions.
Asset custodial businessThe Bank closely followed the asset custodial market, and comprehensively enhanced its competitiveness by seizing policy opportunities. At the end of June, the Bank’s assets under custody increased by 11.94% to RMB3.47 trillion over the end of last year. Securities investments funds under custody totalled RMB737,030 million, an increase of RMB123,302 million, commanding the second largest market share. The number of securities investments funds under custody increased by 31, ranking first in the market. Insurance assets under custody totalled RMB730,918 million, an increase of RMB144,567 million, with the increase ranking first in the market. The Bank became one of the first Chinese-funded custodial banks of RMB Qualified Foreign Institutional Investor (RQFII) from Singapore. The Bank was awarded “Best Custody Bank in China” by the UK magazine Global Custodian, a global custodial authority, for five consecutive years.
Pension businessPension business developed fast with positive progress in product innovation. The Bank innovatively launched “Yangyiwuyou” series products with CCB Life by leveraging on the comprehensiveness of the Group, and obtained 11 qualifications for enterprise annuity management of seven central enterprise-level customers and their subordinate enterprises. At the end of June, the pension assets under trusteeship amounted to RMB43,600 million, up 19.48% over the end of last year; the pension assets under custody in operation amounted to RMB97,633 million, up 15.82% over the end of last year; the personal pension accounts in operation amounted to 3.58 million, an increase of 11.26%.
Treasury management and settlement businessTreasury management and settlement business maintained steady development. At the end of June, the Bank had 4,520,300 corporate RMB settlement accounts, an increase of 341,000 over the end of last year. The Bank had 471,600 active cash management customers. The corporate cash management business developed rapidly. The advantages of products such as multi-model cash pool, all-in-one corporate account and “integrated collection solution” were further consolidated. The Bank took the lead in launching UnionPay corporate settlement card, introduced pilot application of bank notes pool and cross-border RMB two-way cash pool, and explored the application of self-service and intelligentised corporate business via corporate settlement card. The market influence of the Bank’s cash management service branded as “Yudao” further expanded.

30 China Construction Bank Corporation Half-Year Report 2014
Management Discussion and Analysis
Personal Banking
The following table sets forth, for the periods indicated, the major operating information and changes relating to personal banking:
(In millions of RMB, except percentages)Six months ended
30 June 2014Six months ended
30 June 2013 Change(%)
Net interest income 81,349 63,625 27.86Net fee and commission income 22,650 19,069 18.78Other operating income (3,824) 1,110 (444.50)
Operating income 100,175 83,804 19.53Operating expenses (45,422) (40,237) 12.89Impairment losses (5,457) (3,950) 38.15
Profit before tax 49,296 39,617 24.43
As at 30 June 2014
As at 31 December 2013
Segment assets 2,805,623 2,590,881 8.29
Personal banking segment achieved profit before tax of RMB49,296 million, a year-on-year increase of 24.43%, and accounted for 29.08% of the Group’s profit before tax, up 3.55 percentage points. Operating income increased by 19.53% over the same period last year. In this amount, net interest income increased by 27.86% over the same period last year as a result of the rapid growth of personal deposit and loan businesses; net fee and commission income increased by 18.78%, benefiting from the growth of income from fee-based businesses including credit card transactions, agency fund sales and insurance agency services.
Personal depositsThe Bank vigorously explored target markets in areas including income distribution, payment and settlement, investment and wealth management and county regions by actively carrying out peak season marketing and comprehensive marketing. Personal deposits continued to grow steadily. At the end of June, domestic personal deposits of the Bank increased by RMB351,768 million, or 6.38%, to RMB5,866,415 million over the end of last year. Of this amount, demand deposits picked up by 4.96% and time deposits increased by 7.56%.
Personal loansThe Bank’s personal loans proactively accommodated residents’ credit demands in necessities of life including clothing, food, housing and transportations. It strengthened product and service innovation, and improved customer service. At the end of June, domestic personal loans of the Bank increased by RMB209,176 million, or 8.49%, to RMB2,673,830 million. Of this amount, residential mortgages were primarily granted to support customers to buy ordinary apartments for residential purpose, with a loan balance of RMB2,082,383 million, maintaining the leading position in the market. Personal consumer loans actively catered for the financing needs of e-commerce. The Bank innovatively launched “ShanRong e-loans” personal micro-credit revolving loans and served citizens’ consumption financing needs through multiple channels. Personal business loans were mainly granted to support production and operation financing needs of individual industrial and commercial households and small and micro enterprises, amounting to RMB82,368 million. Personal agriculture-related loans were mainly granted to promote pilot agriculture-related loans in planting industry and livestock breeding industry, totalling RMB9,485 million.

China Construction Bank CorporationHalf-Year Report 2014 31
Management Discussion and Analysis
Bank cards business
Credit card business
Credit card business maintained sound and rapid development with core business indicators leading the market among peers. Its market influence, product competitiveness, risk control ability, profitability and customer satisfaction were further enhanced. At the end of June, the Bank accumulatively issued 60.23 million credit cards, an increase of 8.22 million over the end of last year. The spending amount through credit cards reached RMB757,892 million, a year-on-year increase of 33.62%; and the loan balance was RMB281,401 million and the asset quality remained sound. The Bank promoted credit card business via SMS, Weibo and WeChat, conducted sales promotion with selected merchants capable of delivering good consumer experience at restaurants, supermarkets and recreation venues, and improved customer card-using experience. It vigorously developed consumption revolving credit business such as instalment plans. It grasped market opportunities by cooperating with MasterCard to launch the first ‘Long card” electronic wallet among Asian peers, jointly launching the first traveling credit card among Chinese peers for tourists in the Mainland, Taiwan and Hong Kong with China UnionPay and UnionPay International, and issuing new products such as Olympics credit card and World Cup credit card during 2014 Winter Olympics in Sochi and 2014 FIFA World Cup in Brazil.
Debit card business
The Bank vigorously strengthened cooperation with key industries in social security, medical and health care, public transport, community finance and culture and education. It accelerated product innovation in mobile payment, launched innovative mobile financial products, carried out diversified marketing activities and continuously enhanced the development base of bank cards business. At the end of June, the number of debit cards issued increased by 45.38 million to 578 million over the end of last year. The spending amount through debit cards reached RMB2,489,328 million, a year-on-year increase of 57.44%. The Bank issued 136 million financial IC debit cards in total, an increase of 40.77 million. The Bank issued 9.20 million express settlement cards, an increase of 2.18 million, targeted at individual business proprietors for their payment and settlement demands.
Private bankingAccording to the operating principle of “high net worth customers, high standard service”, the Bank formed a full-function open architecture and comprehensive service platform by integrating marketing, service and trading, to satisfy the full-range and whole-life-cycle demands of customers and their families and enterprises. It effectively promoted customer-tailored “Fortune Guarantee” package service to increase the allocation of guaranteed assets for private banking customers, and comprehensively boosted “Private e.ccb.com” project to achieve success in business development together with the customers. It improved “Golden Housekeeper” personal customer (family) cash management services quality. The Bank provided financial consulting service for family trust in an organised way, and vigorously developed service for investment migration to Hong Kong and Australia to meet the great demands of private banking customers for overseas properties and overseas education of their children. At the end of June, private banking customers with financial assets above RMB10 million grew by 10.48% over the end of last year, and the amount of customers’ financial assets increased by 11.18%. The Bank issued 249,700 private banking cards and wealth management cards, an increase of 38,900.
Entrusted housing finance businessAdhering to the philosophy of “supporting housing reform and serving the citizens”, the Bank proactively responded to the needs of housing fund management departments by further strengthening system construction and promotion, so as to provide comprehensive and high quality housing finance services. At the end of June, housing fund deposits were RMB653,319 million, while personal provident housing fund loans amounted to RMB1,100,332 million. The Bank actively promoted financial services for the indemnificatory housing market by granting pilot provident fund loans to support indemnificatory housing projects, and has accumulatively granted project loans of RMB41,518 million since 2010.

32 China Construction Bank Corporation Half-Year Report 2014
Management Discussion and Analysis
Treasury Business
The following table sets forth, for the periods indicated, the major operating information and changes related to treasury business:
(In millions of RMB, except percentages)Six months ended
30 June 2014Six months ended
30 June 2013 Change (%)
Net interest income 12,565 26,995 (53.45)Net fee and commission income 10,101 11,300 (10.61)Net trading gain/(loss) 8,615 1,911 350.81Net gain arising from investment securities 609 322 89.13Other operating income/(loss), net 2,858 (93) (3,173.12)
Operating income 34,748 40,435 (14.06)
Operating expenses (2,632) (2,441) 7.82Impairment losses (527) 627 (184.05)
Profit before tax 31,589 38,621 (18.21)
As at 30 June 2014
As at 31 December 2013
Segment assets 6,484,974 6,505,051 (0.31)
Profit before tax arising from treasury business decreased by 18.21% over the same period last year, and accounted for 18.64% of the Group’s profit before tax. Operating income decreased by 14.06% over the same period last year. Net interest income decreased by 53.45% over the same period last year, due to the increase of internal treasury fund transfer debits. As a result of the decrease in income from financial advisory services and trading of precious metals, net fee and commission income decreased by 10.61% over the same period last year.
Financial markets businessUnder the premise of safety and liquidity, the Bank adhered to its annual investment and trading strategy and risk policies in its financial markets business. It sought a balance between risks and returns while proactively responding to the changes of regulations and market environment, thus maintaining sound operation of the business as a whole.
Money market business
With regard to the use of RMB fund, the Bank scientifically predicted the key timing of the change in fund, established liquidity reserve by conducting short-term rolling operation and reasonably arranged fund recycling to guarantee the Bank’s payment safety. At the same time, by tracking high positions of interest rates, the Bank strengthened medium and long-term lending, expanded fund use channels and improved income from money market business. With regard to the use of foreign currency fund, the Bank reasonably responded to short-term fund demand to ensure the Bank’s liquidity safety of foreign currency, and increased the yield of fund by expanding scale and extending term of inter-bank lending.
Investments in debt securities
With regard to the investment in RMB debt securities, the Bank mainly invested in policy financial bonds, treasury bonds and debentures with high rating and low capital occupation and optimised variety and term structure of debt securities by accurately tracking the interest rate movements. As a result, the yield of RMB debt securities investments portfolios rose significantly over the end of last year. The Bank substantially increased gains from price volatility by the swing trading for trading accounts compared with the same period last year, and realised a sharp lead in the yield of trading accounts over the total inter-bank bond index (full price). With regard to the investment in foreign currency debt securities, the Bank enhanced market research, attached great attention to credit changes of the issuers of foreign debt securities, reduced high-risk bonds as appropriate, and optimised portfolio structure of foreign currency debt securities.

China Construction Bank CorporationHalf-Year Report 2014 33
Management Discussion and Analysis
Customer-driven currency transactions
The Bank proactively responded to changes in the market and of regulatory policies, enhanced product innovation and marketing, and upgraded capabilities of market-making and quoting. In the first half of 2014, the transaction volume of customer-driven foreign exchange trading business reached US$220,931 million. In this amount, RMB foreign exchange swap business increased rapidly, up 156.86% year-on-year. The Bank improved its service capability on foreign exchange settlement and sales through electronic banking channel, successfully launched foreign exchange purchasing project and optimised foreign exchange settlement module for corporate online banking, so as to bring more convenience to corporate customers for foreign exchange settlement and sales.
Precious metals
The Bank proactively responded to negative market changes for precious metal business, constantly consolidated customer base and intensified product innovation and promotion. In the first half of 2014, the total trading volume of precious metals of the Bank reached 15,220.60 tonnes and the number of customers with the Account Precious Metals reached 14,648,700. The number of contracted customers of Individual Precious Metals Trading (Shanghai Gold Exchange) Agency business approached one million and the number of contracted customers of Two-Way Trading of Account Precious Metals reached almost 500,000 after its launch this year.
Investment bankingThe Bank enhanced the refined, standardised and comprehensive risk management of investment banking, in order to promote sound and sustainable development in the arena. Of the first half of 2014, income from financial advisory services was RMB5,349 million. In this amount, income from new financial advisory services was RMB4,146 million. The Bank underwrote various debt securities of RMB202,833 million, and the total underwriting amount of debt securities ranked first among peers for three consecutive years.
Wealth management business
The Bank achieved sound growth in wealth management business. In the first half of 2014, the Bank independently issued 4,016 batches of wealth management products with an amount of RMB3,832,500 million to effectively meet customers’ investment needs. At the end of June, the balance of wealth management products was RMB988,900 million, among which, the balances of non-principal-guaranteed and principal-guaranteed wealth management products were RMB659,400 million and RMB329,500 million, respectively.
Overseas Business and Domestic Subsidiaries
Overseas businessIn the first half of 2014, the Group made positive progress in laying-out of overseas outlets. Macau Branch opened successfully, Toronto Branch obtained its license, and a subsidiary bank was registered and established in New Zealand upon approval in July. In addition, active efforts were made for the establishment of Chile Branch, London Branch and four other branches affiliated to CCB Europe. At the end of June 2014, the Group had overseas branches in Hong Kong, Singapore, Frankfurt, Johannesburg, Tokyo, Osaka, Seoul, New York, Ho Chi Minh City, Sydney, Melbourne, Taipei, Luxembourg and Macau, and had the following wholly-owned operating subsidiaries including CCB Asia, CCB London, CCB Russia, CCB Dubai, CCB Europe and CCB International. Its overseas entities covered 15 countries and regions. The total assets of overseas entities were RMB920,152 million, and the profit before tax was RMB4,137 million.
Domestic subsidiariesThe Group has established a preliminary comprehensive operating framework, and progressively improved comprehensive financial services. The Group has several domestic subsidiaries in non-banking financial sectors, including CCB Principal Asset Management, CCB Financial Leasing, CCB Trust, and CCB Life, and has completed procedures such as business registration, renaming and equity settlement for the establishment of CCB Futures. The Group has set up several subsidiary banks providing professional and differentiated services in specific industries and regions, including Sino-German Bausparkasse and 27 rural banks.
The Group enhanced cross-selling and business collaboration between parent bank and subsidiaries, and promoted synergistic collaboration in channels, customers and products, resulting in further optimised business synergy mechanism between parent bank and subsidiaries. The overall business development of domestic subsidiaries was in a good shape with steady business expansion. At the end of June, the total assets of domestic subsidiaries were RMB152,709 million, up 26.41% over the end of last year, and the net profit reached RMB1,072 million, a year-on-year increase of 5.00%.

34 China Construction Bank Corporation Half-Year Report 2014
Management Discussion and Analysis
Analysed by Geographical Segment
The following table sets forth, for the periods indicated, the distribution of the Group’s profit before tax by geographical segment:
(In millions of RMB, except percentages)Six months ended 30 June 2014 Six months ended 30 June 2013
Amount % of total Amount % of total
Yangtze River Delta 22,704 13.39 19,392 12.50Pearl River Delta 22,407 13.22 22,214 14.31Bohai Rim 27,827 16.42 24,629 15.87Central 27,356 16.14 23,699 15.27Western 27,773 16.38 25,489 16.42Northeastern 9,004 5.31 8,077 5.21Head office 28,308 16.70 30,383 19.58Overseas 4,137 2.44 1,306 0.84
Profit before tax 169,516 100.00 155,189 100.00
The following table sets forth, as at the dates indicated, the distribution of the Group’s assets by geographical segment:
(In millions of RMB, except percentages)As at 30 June 2014 As at 31 December 2013Amount % of total Amount % of total
Yangtze River Delta 2,776,063 13.08 2,639,135 13.18Pearl River Delta 2,343,637 11.04 2,158,746 10.78Bohai Rim 2,996,848 14.12 2,737,198 13.67Central 2,554,732 12.04 2,411,147 12.04Western 2,604,801 12.27 2,500,348 12.49Northeastern 965,343 4.55 910,474 4.55Head office 6,061,762 28.56 5,934,221 29.63Overseas 920,152 4.34 731,878 3.66
Total assets1 21,223,338 100.00 20,023,147 100.00
1. Total assets excluded elimination and deferred tax assets.
The following table sets forth, as at the dates indicated, the distribution of the Group’s loans and NPLs by geographical segment:
As at 30 June 2014 As at 31 December 2013(In millions of RMB, except percentages)
Loans and advances
% of total NPLs
NPL ratio (%)
Loans and advances
% of total NPLs
NPL ratio (%)
Yangtze River Delta 1,859,048 20.23 41,963 2.26 1,781,649 20.74 40,844 2.29Pearl River Delta 1,278,833 13.91 14,722 1.15 1,220,420 14.21 10,680 0.88Bohai Rim 1,576,590 17.15 8,394 0.53 1,442,213 16.79 6,695 0.46Central 1,479,243 16.10 14,729 1.00 1,358,192 15.81 12,052 0.89Western 1,565,039 17.03 7,417 0.47 1,461,129 17.01 7,221 0.49Northeastern 537,999 5.85 4,670 0.87 507,751 5.91 4,551 0.90Head office 294,969 3.21 3,100 1.05 280,597 3.27 2,645 0.94Overseas 598,880 6.52 673 0.11 538,106 6.26 576 0.11
Gross loans and advances to customers 9,190,601 100.00 95,668 1.04 8,590,057 100.00 85,264 0.99

China Construction Bank CorporationHalf-Year Report 2014 35
Management Discussion and Analysis
The following table sets forth, as at the dates indicated, the distribution of the Group’s deposits by geographical segment:
(In millions of RMB, except percentages)As at 30 June 2014 As at 31 December 2013Amount % of total Amount % of total
Yangtze River Delta 2,397,406 18.50 2,310,251 18.90Pearl River Delta 1,958,601 15.12 1,878,995 15.37Bohai Rim 2,421,304 18.69 2,245,632 18.37Central 2,429,028 18.75 2,268,111 18.56Western 2,474,013 19.09 2,388,492 19.54Northeastern 902,504 6.96 855,591 7.00Head office 42,190 0.33 25,671 0.21Overseas 331,910 2.56 250,294 2.05
Deposits from customers 12,956,956 100.00 12,223,037 100.00
Distribution Channels
The Bank has an extensive distribution network. Through branches and sub-branches, self-service equipment, specialised service entities across the country and electronic banking service platform, the Bank provides its customers with convenient and high-quality banking services.
At the end of June, the Bank had a total of 14,707 domestic operating outlets, including the head office, 37 tier-one branches, 321 tier-two branches, 11,150 sub-branches, 3,197 entities under the sub-branches and one specialised credit card centre at the head office. The number of operating outlets increased by 57 over the end of last year. The operating outlets were mainly distributed in large cities, central cities, top counties and rich towns. In the first half of 2014, the Bank accumulatively started 959 renovation projects of outlets, further improving physical environment and customer experience at the outlets.
In the first half of 2014, the Bank’s total number of private banking centres and wealth management centres in operation reached 338. There were 286 small business operating centres in the form of “Credit Factory”, covering 236 cities at prefecture level. More than 1,400 personal loan centres were built, and customer service network gradually improved.
The Bank actively promoted the building of smart platform and full-channel deployment, and provided cross-industry services by relying on “e.ccb.com” while expanding its product range and developing high-quality products. By always keeping a balance between customer experience and safety precaution, the Bank stably expanded its customer base, significantly increased transaction volume and steadily improved application of electronic service channels. At the end of June, the ratio of the number of accounting transactions through electronic banking and self-service channels to the total number of accounting transactions through various channels was 86.55%, an increase of 1.15 percentage points over the end of last year.
Online bankingFor personal online banking, the Bank optimised the function of overseas foreign exchange remittance, realised the intelligent routing control over cross-bank transfer, and launched services such as fast transfer, application for adjusting credit card limit and change of billing address. For corporate online banking, the Bank completed the migration of existing customers to new generation corporate online banking, further promoted overseas online banking service, and launched overseas corporate online banking for branches in Dubai, London, Taipei and Sydney, and the standardised version for the subsidiary bank in Russia. At the end of June, the number of personal online banking customers increased by 9.25% to 163.87 million over the end of last year, and the transaction volume was RMB20 trillion, a year-on-year increase of 30.90%. The number of corporate online banking customers reached 3.04 million, an increase of 8.54% over the end of last year, and the transaction volume was RMB59.61 trillion, a year-on-year increase of 25.30%.

36 China Construction Bank Corporation Half-Year Report 2014
Management Discussion and Analysis
E.ccb.com e-commerce platformE.ccb.com e-commerce platform developed fast. The Bank finished redesigning the home page of retail mall, highlighting “elegant, exclusive, exquisite and excellent” products and high-quality merchants. The Bank launched “instalment preference” section, realising the comprehensive integration of Long Card mall and “e.ccb.com” retail mall. The corporate mall prioritised the development of high-quality merchants, further explored selected industries, released the function of enquiry for purchase, upgraded the comprehensive home page of specialised market, and launched “E.ccb.com” Assistant software. At the end of June, “e.ccb.com” developed 41.6 thousand merchants and 4,511.9 thousand members accumulatively. The transaction volume totalled RMB19,148 million in the first half of 2014, a year-on-year increase of 193.26%.
Telephone bankingThe Bank continued to accelerate the integration of customer service hotlines, and optimise business process and system functions to strengthen its service ability for improving customer satisfaction. At the end of June, the number of telephone banking customers was 161.14 million, an increase of 11.44 million, or 7.64% over the end of last year.
Mobile phone bankingThe Bank launched new mobile phone banking APP to provide service in five major sections, namely Mobile Phone Banking, Joy Life, My Favorites, Shake to Transfer and QR Code Scanning. The Bank launched SMS banking APP, by which customers can directly conduct account enquiry, transfer and remittance, payment and charging, and credit card related operations. At the end of June, the number of mobile banking customers was 131.16 million, up 12.56% over the end of last year; the transaction volume was RMB3 trillion, a year-on-year increase of 127.92%; the number of transactions was 1,059 million, a year-on-year increase of 131.98%. The number of SMS financial service customers reached 222.08 million, an increase of 11.34% over the end of last year. The number of WeChat banking customers was 7.04 million, of which 4.38 million customers added the Bank’s WeChat banking account and attached their bank cards.
Self-service bankingThe Bank continuously expanded the self-service channels, accelerated the deployment of self-service equipment in the counties, and optimised the layout of such equipment. The Bank refined the management over self-service equipment and optimised equipment functions, contributing to the further increasing trading volume. At the end of June, there were 72,128 ATMs with cash service in operation, an increase of 3,115 over the end of last year. The ratio of the number of accounting transactions through self-service equipment to the total number of accounting transactions through various channels reached 42.60%. There were 19,078 self-service banks in operation, an increase of 1,200.
Information Technology and Product Innovation
Information TechnologyThe Bank intensified its efforts in information technology with a focus on ensuring safe operation and the building of the “New Generation Core Banking System”, to support the development of various businesses. In the first half of 2014, the major part of branch deployment and customer migration of Phase I projects of the “New Generation Core Banking System” was completed as planned. Phase II projects were carried out in batches and were at the stage of development and testing. Planning for Phase III projects was carried out accordingly. Projects of human resources management, credit card application and agency of domestic banking subsidiaries were approved and at the analysis stage. In view of the constant increase in transaction volume of various key systems brought by business development, the Bank adopted measures in terms of systems, procedures, staff management and technical support to further enhance the standardisation of operating and maintenance system. In the first half of 2014, all systems operated securely. The availability rate of key systems stood at 99.99%, while that of critical systems such as online banking, international card, Long Card network, securities and the core system even reached 100%. The Bank became one of the first contracted banks in Shanghai Free Trade Zone and successfully accessed to the PBOC’s system. It launched products such as UnionPay corporate settlement card and Jucai deposit as well as functions like rapid issuance of virtual card in the credit card system. The Bank completed the setting-up of global RMB clearing network to support business development. In the first half of 2014, the Bank obtained four patents issued by the State Intellectual Property Office, accumulatively 51 in total.

China Construction Bank CorporationHalf-Year Report 2014 37
Management Discussion and Analysis
Product InnovationThe Bank continued to uphold the philosophy of “innovation drives development” and improve its capability in product innovation, striving to be an innovative bank. The Bank strengthened implementation of the three-year strategic plan for product innovation and strove to enhance the quality of product innovation. The Bank formulated project management policies for product innovation, and established management mechanism for product innovation, which involves hierarchy of responsibilities. The Bank adopted key project management policy and strengthened the management and implementation of strategic innovations. Meanwhile, the Bank attached equal importance to “financing” innovation and “smart” innovation, focusing on multi-generational product innovation and optimisation. The Bank set up an information platform for innovation rolling-out and transplantation to facilitate the quick sharing of innovation achievements. The Bank attached importance to the effect of innovation and began to establish the mechanism of input-output forecast before product launching and regular performance tracking mechanism after launching. In the first half of 2014, the Bank completed 357 product innovation projects, a year-on-year increase of 60.
Human Resources and Institutional Management
The following table sets forth, as at the date indicated, the geographical distribution of the Bank’s branches and staff:
As at 30 June 2014
Number of staff % of totalNumber of
branches % of total
Yangtze River Delta 56,536 15.53 2,451 16.64Pearl River Delta 46,374 12.74 1,864 12.66Bohai Rim 59,748 16.41 2,403 16.31Central 80,965 22.24 3,555 24.14Western 68,702 18.87 2,986 20.27Northeastern 36,968 10.16 1,445 9.81Head office 14,210 3.90 3 0.02Overseas 548 0.15 22 0.15
Total 364,051 100.00 14,729 100.00
At the end of June 2014, the Bank had 364,051 staff members (in addition, the Bank had 6,673 workers dispatched by labour leasing companies). The staff members with academic qualifications of bachelor’s degree or above were 210,945, or 57.94%, and the number of local employees in overseas entities was 407. In addition, the Bank assumed the expenses of 49,712 retired employees.
At the end of June 2014, the Bank had a total of 14,729 institutions, among which, there were 14,707 domestic institutions and 22 overseas institutions.
Profiles of institutions and staff in subsidiariesThe Bank had 39 subsidiaries with a total of 198 branches, among which, domestic branches reached 138 and overseas branches reached 60. The subsidiaries had 8,383 staff members (in addition, the subsidiaries had 317 workers dispatched by labour leasing companies). Of this amount, there were 5,573 domestic staff members and 2,810 overseas staff members. In addition, the subsidiaries assumed the expenses of 18 retired employees.

38 China Construction Bank Corporation Half-Year Report 2014
Management Discussion and Analysis
Risk Management
In the first half of 2014, the Bank further enhanced the overall risk management quality, strengthened risk management and control at the Group level, and supported the overall business development, innovation and risk management by taking the opportunity of pushing forward the implementation of advanced measurement approach over capital management.
Credit Risk Management
Credit risk represents the potential loss that may arise from the failure of a debtor or counterparty to meet its obligation or commitment to the Bank.
In the first half of 2014, the Bank adhered to the bottom line of risk management, and reinforced risk management and control by strengthening the fundamental management on pre-lending evaluations, credit approval and post-lending monitoring. The Bank timely adjusted and improved credit policies with foresight, improved and optimised system process, and promoted credit risk management capability and level. The asset quality remained stable.
Carrying out the event of “Year of Credit Risk Prevention and Control” to strengthen the fundamental management on credit. The Bank pushed forward the “looking back” work for the loans granted last year, with a focus on the inspection and rectification for key risk points of the credit business. By inspecting and assessing specific risks of high-risk industries, customer groups and products, the Bank eliminated potential risks in time. The Bank strengthened authenticity management of pre-lending evaluations, reinforced intensive management of credit approval, and optimised the post-lending and collateral management systems. The Bank stepped up credit risk management of overseas entities.
Timely adjusting and optimising credit policies to better play the “weather vane” role. The Bank actively responded to complex and volatile economic situations to improve credit policies with foresight, and worked out detailed criteria for credit access and exit. In compliance with national industrial policies, regulatory requirements, and its own development strategy and risk appetite, the Bank further identified its key areas of credit investments. The Bank adjusted its policies and criteria in areas with prominent risks and put forward corresponding requirements for risk management and control.
Accelerating the design and application of risk management tools to vigorously support business development and innovation. With respect to non-retail credit risk, the Bank optimised the rating model for customers from local governments and small enterprises, etc. and deepened the application of the tools in customer pricing and innovation of comprehensive financial service solutions. In respect of retail credit risk, the Bank further accelerated the development and application of scorecard tools for various kinds of personal loans, “e.ccb.com” and credit card instalment, and supported the innovation of personal consumer finance and internet finance, expanding the traditional advantages of retail banking.
Optimising portfolio management tools to actively guide the adjustment of credit structure. The Bank optimised economic capital models and parameters, and actively communicated the capital constraint requirements and the overall guiding risk appetites. The Bank pushed forward the application of measurement results in risk management, business management and capital management. The Bank strictly conducted stringent industry limit management by vigorously controlling the increment of credit balances in gradually shrinking industries and of customers in the to-be-tightened or exit category, so as to effectively promote the continuous optimisation of asset portfolio structure.
Reinforcing the disposal of non-performing loans to ensure the stability of asset quality. The Bank strengthened the management over key projects and key branches, and reinforced the market-oriented disposal by making full use of various measures. The Bank conducted compliance checks over the special assets resolution business, standardised business operation, and improved the fundamental management over non-performing assets, thus raising the level of professional management.
Concentration of credit risksIn the first half of 2014, in line with regulatory requirements, the Group proactively adopted a series of measures to prevent large exposure concentration risk, including further tightening lending criteria, adjusting business structure, controlling the credit granting pace, revitalising existing credit assets and innovating products.
At the end of June 2014, the Group’s gross loans to the largest single borrower accounted for 4.77% of the total capital after deductions, while those to the top ten customers accounted for 14.81% of the total capital after deductions.

China Construction Bank CorporationHalf-Year Report 2014 39
Management Discussion and Analysis
Concentration of loans
Concentration indicatorAs at
30 June 2014As at
31 December 2013As at
31 December 2012
Proportion of loans to the largest single customer (%) 4.77 4.51 3.86Proportion of loans to top ten customers (%) 14.81 14.80 14.76
The Group’s top ten single borrowers as at the date indicated are as follows:
(In millions of RMB, except percentages) Industry
As at 30 June 2014Amount % of total loans
Customer A Transportation, storage and postal services 66,941 0.73Customer B Manufacturing 28,036 0.30Customer C Transportation, storage and postal services 17,032 0.19Customer D Financial industry 15,231 0.17Customer E Transportation, storage and postal services 15,021 0.16Customer F Transportation, storage and postal services 13,586 0.15Customer G Transportation, storage and postal services 13,317 0.14Customer H Water, environment and public utility management 12,969 0.14Customer I Water, environment and public utility management 12,957 0.14Customer J Transportation, storage and postal services 12,916 0.14
Total 208,006 2.26
Liquidity Risk Management
Liquidity risk is the type of risk that occurs when, despite its debt servicing ability, the Bank cannot obtain sufficient funding in time, or at a reasonable cost, to meet the needs of asset growth or repay liabilities as they fall due. The Bank’s objective for liquidity risk management is to maintain a reasonable level of liquidity, and ensure the payment and settlement security in compliance with the regulatory requirements, while striving to enhance fund yields by deploying its funds in an effective and reasonable way.
In the first quarter of 2014, the liquidity of banking industry was adequate. However, market funds denominated in RMB experienced seasonal fluctuations due to increasing cash demand during the Spring Festival and other factors. In the second quarter, the PBOC directionally reduced the statutory deposit reserve ratio twice and strengthened the capital support for the development of “agriculture, farmers and rural areas” and small and micro businesses, contributing to the easy money supply in the market. The Bank responded to the liquidity situation with timely measures, conducted coordinated liquidity management at the Group level, enhanced deposit attraction capacity, adjusted the usage of products that largely affected liquidity such as debt securities investments, financial assets held under resale agreements, and deposits with banks and non-bank financial institutions, and strengthened large fund flow alert. The Bank maintained liquidity at a reasonable level and ensured normal payments and clearings.
The Bank conducted regular stress testing on its liquidity risk, in order to gauge its risk tolerance in extreme scenarios with low probability and other adverse circumstances. The results showed that under the stress scenarios, although liquidity risk increased, it stayed within a controllable range.

40 China Construction Bank Corporation Half-Year Report 2014
Management Discussion and Analysis
The following table sets forth the liquidity ratios of RMB and foreign currency of the Group:
(%)Regulatory
standardAs at
30 June 2014As at
31 December 2013As at
31 December 2012
Liquidity ratio1 RMB ≥25 47.72 46.57 56.73Foreign currency ≥25 56.70 55.20 58.81
1. Calculated by dividing current assets by current liabilities in accordance with the requirements of the CBRC.
The analysis of the remaining maturities of the Group’s assets and liabilities as at the balance sheet date is set out below:
(In millions of RMB) IndefiniteRepayable
on demandWithin
one month
Between one and
three months
Between three months and one year
Between one and
five yearsMore than five years Total
Long/(short) position as at 30 June 2014 2,639,740 (6,645,222) (736,435) (204,435) (609,029) 2,633,907 4,068,486 1,147,012
Long/(short) position as at 31 December 2013 2,531,094 (6,711,273) (610,116) (427,828) 3,773 2,493,591 3,795,088 1,074,329
The Group regularly monitors the gap between its assets and liabilities for various maturities in order to assess its liquidity risk for different maturity periods. As at 30 June 2014, the accumulated gap of various maturities of the Group was RMB1,147,012 million, an increase of RMB72,683 million over the end of 2013. Despite the negative gap for repayment on demand totalling RMB6,645,222 million, the Group is expected to enjoy a stable funding source and maintain stable liquidity in the future given its strong and expansive deposit customer base, relatively stable core demand deposits, and steady growth in deposits.
Market Risk Management
Market risk is the risk of loss in respect of the Bank’s on and off-balance sheet activities, arising from adverse movements in market rates, including but not limited to interest rates, foreign exchange rates, commodity prices and stock prices.
In the first half of 2014, the Bank further promoted the comprehensive market risk management, improved monitoring and reporting on market risk as well as the management of credit debts, optimised recognition and measurement of market risk, and effectively responded to new risk types, constantly enhancing its market risk management capability.
Refining the policy system of market risk management. The Bank formulated trading business and market risk policy limit schemes for 2014 and established market risk policies and limit systems covering trading business across the whole Group. The Bank worked out the provision scheme for estimated liabilities of precious metals leasing and made provisions at the end of June for the first time.
Enhancing promptness and effectiveness of monitoring report. The Bank traced and monitored the implementation of credit approval, authorisation and risk limits of the financial markets business, and released risk early warning and alerts in a timely manner. The Bank strengthened the analysis and prediction on market situations, and timely responded, analysed and reported changes and key risk points of policies, markets and businesses.
Promoting the development of measurement system and tools of market risk. The Bank independently researched and developed the market risk measurement engine, strengthened the stress testing and model verification of market risk, and extended the range of market risk limit management to the Group level. The Bank unified the counterparty access rules and created counterparty checklist for internal control so as to promote the counterparty risk management at the Group level.

China Construction Bank CorporationHalf-Year Report 2014 41
Management Discussion and Analysis
Value at Risk analysisThe Bank has separated on and off-balance sheet activities into two major categories, trading book and banking book. The Bank performs VaR analysis on its trading portfolio to measure and monitor the potential losses that could occur on risk positions taken, due to movements in market interest rates, foreign exchange rates and other market prices. The Bank calculates the VaR of RMB and foreign currency trading portfolios on a daily basis (at a confidence level of 99% and with a holding period of one-day).
The VaR analysis on the Bank’s trading portfolio as at the balance sheet date and during the respective years is as follows:
For the six months ended 30 June 2014 For the six months ended 30 June 2013
(In millions of RMB)As at
30 June Average Maximum MinimumAs at
30 June Average Maximum Minimum
Risk valuation of trading portfolio 47 84 137 47 75 34 75 14 – Interest rate risk 24 31 115 9 86 21 86 6 – Foreign exchange risk 39 75 119 38 15 26 57 12 – Commodity risk – 1 5 – 2 2 18 –
Interest rate risk managementInterest rate risk is the risk of loss in the overall income and economic value of the banking book as a result of adverse movements in interest rates, term structure and other interest-related factors. Repricing risk and basis risk arising from mismatch of term structure and pricing basis of assets and liabilities are the primary sources of interest rate risk for the Bank, while yield curve risk and option risk have relatively less impact. The overall objective of the Bank’s interest rate risk management is to maintain steady growth of net interest income, while keeping interest rate risk within a tolerable range in accordance with the risk appetite and risk management capability.
In the first half of 2014, the Bank actively responded to the challenge of interest rate liberalisation, continuously adopted the pricing strategy that combined the standardised and differentiated techniques, timely optimised the internal funds transfer price scheme and dynamically adjusted price and pricing authorisation based on the market and customers’ needs so as to enhance the long-term profitability of the Bank. The Bank conducted regular analysis by comprehensively using multiple tools such as interest rate sensitivity gap, net interest income sensitivity analysis, scenario simulation and stress testing. It strengthened analysis and prediction of net interest margin and promoted the reasonable layout of assets and liabilities of the Bank as a whole, thus achieving steady growth of net interest income while keeping the overall interest rate risk within the set tolerable level.
Interest rate sensitivity gap analysis
The analysis of the next expected repricing dates or maturity dates (whichever are earlier) of the Group’s assets and liabilities as at the balance sheet date is set out below:
(In millions of RMB)Non-interest-
bearingLess than
three months
Between three months and one year
Between one year and
five yearsMore than five years Total
Interest rate sensitivity gap as at 30 June 2014 17,982 (3,860,122) 3,706,083 228,908 1,054,161 1,147,012
Interest rate sensitivity gap as at 31 December 2013 59,802 (1,963,877) 1,761,438 241,112 975,854 1,074,329
As at 30 June 2014, the Group’s accumulated negative gap for a period less than one year was RMB154,039 million, which narrowed by RMB48,400 million compared to the end of last year, mainly due to the decrease in borrowings from central banks. The Group’s positive gap for a period more than one year was RMB1,283,069 million, which expanded by RMB66,103 million over the end of last year, mainly due to the increase of debt securities investments with maturities of more than one year.

42 China Construction Bank Corporation Half-Year Report 2014
Management Discussion and Analysis
Net interest income sensitivity analysis
Net interest income sensitivity analysis is based on two scenarios. The first is to assume that the interest rate for deposits with the PBOC stays constant, and all yield curves rise or fall by 100 basis points in a parallel way; the second is to assume that the interest rates for deposits with the PBOC and demand deposits stay constant, while the other yield curves rise or fall by 100 basis points in a parallel way.
The interest rate sensitivity of the Group’s net interest income as at the balance sheet date is set out below:
Change in net interest income
(In millions of RMB)Rise by
100 basis pointsFall by
100 basis points
Rise by 100 basis points (demand
deposit rates being constant)
Fall by 100 basis points (demand
deposit rates being constant)
As at 30 June 2014 (50,143) 50,143 20,653 (20,653)
As at 31 December 2013 (40,135) 40,135 31,468 (31,468)
Foreign exchange rate risk managementForeign exchange rate risk is the risk of impact of adverse movement in foreign exchange rates on a bank’s financial position. The Bank is exposed to foreign exchange rate risk primarily because of the currency mismatch of assets and liabilities held by the Bank that are denominated in currencies other than RMB and the position held by the Bank as a market maker in the financial markets. The Bank avoided exchange rate risk by matching its assets and liabilities, controlled exchange rate risk by setting limits, hedged exchange rate risk by using derivative financial instruments and transferred exchange rate risk by reasonable product pricing.
The Bank constantly strengthened centralised management of foreign exchange rate risk and further researched risk hedging strategies and tools under the new situation. The Bank controlled the overall foreign exchange rate risk-bearing ability through enhancing assets and liabilities currency matching as a whole. The Bank took the advantage of multi-region and multi-market operation, properly adopted derivative financial instruments and flexibly managed foreign exchange rate risks to maintain the foreign exchange rate risk exposure at a relatively low level.
Currency concentrations
The Group’s currency concentrations as at the balance sheet date are set out below:
As at 30 June 2014 As at 31 December 2013
(In millions of RMB)
USD (RMB
equivalent)
HKD (RMB
equivalent)
Others (RMB
equivalent) Total
USD (RMB
equivalent)
HKD (RMB
equivalent)
Others (RMB
equivalent) Total
Spot assets 885,931 162,579 89,964 1,138,474 731,627 141,255 71,352 944,234Spot liabilities (821,552) (207,265) (104,029) (1,132,846) (540,063) (174,454) (117,234) (831,751)Forward purchases 890,643 57,202 88,419 1,036,264 740,072 57,311 105,430 902,813Forward sales (934,374) (5,417) (62,091) (1,001,882) (924,064) (11,030) (55,931) (991,025)Net options position 372 – – 372 200 – – 200
Net long position 21,020 7,099 12,263 40,382 7,772 13,082 3,617 24,471
As at 30 June 2014, the net exposure of the Group’s foreign exchange rate risk was a positive value of RMB40,382 million, an increase of RMB15,911 million compared to the end of last year. The overall foreign exchange rate risk was controllable.

China Construction Bank CorporationHalf-Year Report 2014 43
Management Discussion and Analysis
Operational Risk Management
Operational risk is the risk of loss due to inadequate or flawed internal processes, people and systems, or external events.
In the first half of 2014, the Bank continued to standardise and strengthen its operational risk management, and continuously implemented risk monitoring, assessment and inspection on key businesses and important processes by comprehensively applying tools and methods such as operational risk self-assessment, key risk indicators, and key risk points monitoring and inspection, to strengthen the prevention and control of operational risks in key business areas and key positions. In view of changing risks in reality, the Bank constantly re-examined and improved the policies and management of incompatible positions (responsibilities) to bring out the rigid check and balance mechanism across positions. The Bank continuously optimised the operational risk management information system by expanding its functions to support scenario analysis, capital measurement and business continuity management. The Bank continued to improve business continuity management, conducted integrated self-assessment of business continuity management, and steadily pushed forward the establishment of emergency plan and emergency drill database and corresponding policy system.
Anti-money launderingIn the first half of 2014, the Bank continuously enhanced the management of anti-money laundering and anti-terrorism financing activities by accelerating the centralisation of anti-money laundering work and arranging anti-terrorism financing work throughout the Bank. It diligently conducted customer identity recognition, money laundering risk evaluation, transaction monitoring analysis and anti-money laundering system building, to actively prevent and control compliance risks. The Bank completed the group compliance registration on Foreign Account Tax Compliance Act (FATCA).
Reputation Risk Management
Reputation risk is mainly the risk of negative impacts or damages to the banks’ overall image, reputation and brand value, arising when commercial banks’ operational, managerial and other behaviours or contingencies are noticed or reported by the media.
In the first half of 2014, the Bank further enhanced reputation risk management and improved the evaluation system of reputation risk so as to continuously enhance the capability of reputation risk management. The preliminary framework of reputation risk management was established and the management mechanism operated effectively. The Bank comprehensively expanded the coverage of various media for public sentiment monitoring and further improved the efficiency of early warning of sensitive news. It encouraged quick and collaborative response to sensitive news, and adopted classified and categorised management over public sentiment issues. The Bank stepped up inspection and guidance over branches by conducting performance evaluation, and strengthened team building and staff training, improving the staff’s awareness of reputation risk prevention and response capabilities to sensitive news.
Consolidated Management
Consolidated management is the comprehensive and continuous management that the Bank imposes over the Group’s capital, finance and risks, based on the single legal person management, in order to identify, measure, monitor and assess the overall risk profile of the Group.
In the first half of 2014, the Bank continued to strengthen consolidated management planning, improved the management mechanism, tools, methods and systems, diligently implemented the regulatory requirements of consolidated management, and continuously enhanced the capability and quality of consolidated management so as to effectively prevent the cross-border and cross-industry operating risks of the Group.
Optimising the building of consolidated management mechanism. The Bank refined the framework of consolidated management, optimised the building of comprehensive risk management system, strengthened communication of the Group’s policies and systems, and improved firewall and the Group’s internal risk isolation mechanism. It refined the building of information system of consolidated management, and improved the information reporting and communication mechanism of the Group.
Reinforcing consolidated management for capital adequacy ratio. The Bank enhanced the prediction and planning of the Group’s capital and continuously monitored the capital adequacy ratio of the Group. The Bank implemented refined capital management and deepened intensive operation of the Group’s capital.
Enhancing the consolidated management of large risk exposure. The Bank constantly enhanced the unified credit management at the Group level, and reinforced the management and control of the same counterparty’s credit risk exposure. The Bank strengthened the monitoring of risk concentration at the Group level and optimised the industry limit management of subsidiaries.

44 China Construction Bank Corporation Half-Year Report 2014
Management Discussion and Analysis
Strengthening the consolidated management of internal transactions. The Bank improved the internal transaction management policies and conducted regular monitoring, analysis and reporting on the Group’s internal transactions, so as to enhance targeted and standardised management.
Enhancing risk management in other fields at the Group level. The Bank enhanced the liquidity management and regularly organised and implemented liquidity risk stress testing at the Group level. The Bank strengthened the consolidated management of overseas institutions, optimised country-specific risk management policies and systems, and standardised the compliance management of overseas institutions. The Bank strengthened legal guidance for subsidiaries and prevented legal risks at the Group level.
Internal Audit
The Bank adheres to a relatively independent and vertically managed internal audit system. In order to promote the establishment of a sound and effective risk management mechanism, internal control system and corporate governance procedures, the Bank’s internal audit department evaluates the effectiveness of the internal controls and risk management, the effect of corporate governance procedures, the efficiency of business operations, and the economic responsibilities of relevant personnel, and puts forward suggestions for improvement based on its internal audit results.
In the first half of 2014, the Bank’s internal audit department operated under the guidance of risk-oriented philosophy, and conducted a series of systemic audit projects across the Bank, including dynamic audit investigation for credit business, audits of domestic letter of credit business, connected relations of certain credit customers and related risks, private banking business, credit card business, and operation and management of the principal businesses of overseas entities. Audit offices conducted selected audit projects as they deemed appropriate based on actual situations of local branches to continuously improve audit effectiveness and ensure reasonable audit coverage. The internal audit department proactively adapted to new requirements and new situations, constantly optimised working mechanism, innovated project organisation, enhanced professionalism and research on audit techniques, and strove to enhance the ability to identify issues and disclose risks, so as to ensure the audit quality and effectiveness.
Capital Management
The Group has implemented a comprehensive capital management which covers regulatory capital, economic capital and accounting capital management, including but not limited to management of capital adequacy ratio, capital planning, capital raising and economic capital.
In the first half of 2014, the Group continuously strengthened the fundamental capability of capital management and proactively promoted its business transformation towards more intensive utilisation of capital. As a result, the guiding and restraint functions of capital on business development were further upgraded.
The Group promoted the implementation of the advanced capital measurement approach, and enhanced capital management capabilities. In April 2014, the Bank was officially approved by the CBRC to implement the advanced measurement approach for capital management, being one of the first batch of banks in China to implement the advanced measurement approach. The Bank will complete the parallel information disclosure for both the new and old capital management methods in accordance with the regulatory approval requirements during the transition period, and periodically push forward the application for the implementation of the advanced approach of internal rating of credit risk and the advanced measurement approach of operational risk, in order to achieve continuous regulatory compliance after the approval.
The Group reinforced restraints of capital on business and accelerated the business transformation towards more intensive utilisation of capital. The Group researched on the implementation impact of the advanced capital measurement approach, performed in-depth analysis on the items of capital occupation and risk-weighted assets, and actively promoted the implementation of the operation philosophy featuring intensive utilisation of capital throughout the whole process of business development. It pushed forward refined capital management to facilitate the improvement in business management process, reduced ineffective capital occupation, and constantly improved capital utilisation efficiency.
Analysis of Capital Adequacy Ratio
In accordance with the regulatory requirements, the Group has to calculate and disclose capital adequacy ratios simultaneously in accordance with the Measures for Capital Management of Commercial Banks (Trial) and the Measures for the Management of Capital Adequacy Ratios of Commercial Banks. The scope for calculating capital adequacy ratios includes both the Bank’s domestic and overseas branches and sub-branches, and financial subsidiaries (insurance companies excluded).
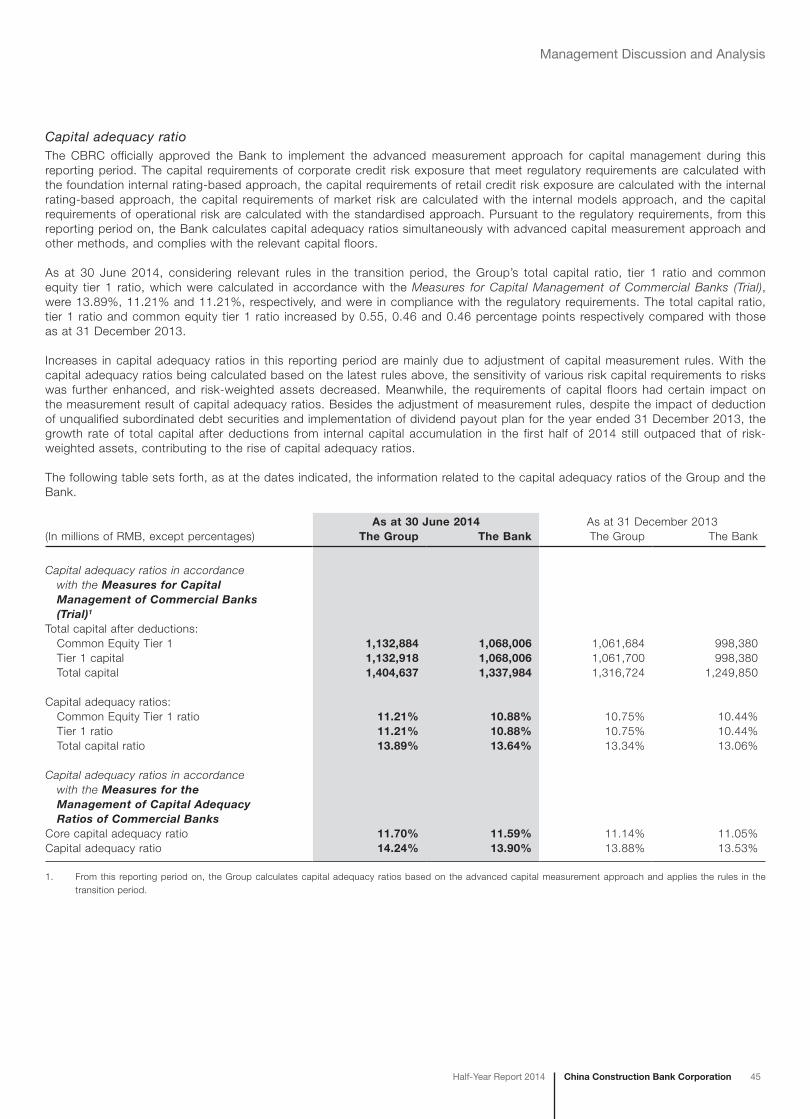
China Construction Bank CorporationHalf-Year Report 2014 45
Management Discussion and Analysis
Capital adequacy ratioThe CBRC officially approved the Bank to implement the advanced measurement approach for capital management during this reporting period. The capital requirements of corporate credit risk exposure that meet regulatory requirements are calculated with the foundation internal rating-based approach, the capital requirements of retail credit risk exposure are calculated with the internal rating-based approach, the capital requirements of market risk are calculated with the internal models approach, and the capital requirements of operational risk are calculated with the standardised approach. Pursuant to the regulatory requirements, from this reporting period on, the Bank calculates capital adequacy ratios simultaneously with advanced capital measurement approach and other methods, and complies with the relevant capital floors.
As at 30 June 2014, considering relevant rules in the transition period, the Group’s total capital ratio, tier 1 ratio and common equity tier 1 ratio, which were calculated in accordance with the Measures for Capital Management of Commercial Banks (Trial), were 13.89%, 11.21% and 11.21%, respectively, and were in compliance with the regulatory requirements. The total capital ratio, tier 1 ratio and common equity tier 1 ratio increased by 0.55, 0.46 and 0.46 percentage points respectively compared with those as at 31 December 2013.
Increases in capital adequacy ratios in this reporting period are mainly due to adjustment of capital measurement rules. With the capital adequacy ratios being calculated based on the latest rules above, the sensitivity of various risk capital requirements to risks was further enhanced, and risk-weighted assets decreased. Meanwhile, the requirements of capital floors had certain impact on the measurement result of capital adequacy ratios. Besides the adjustment of measurement rules, despite the impact of deduction of unqualified subordinated debt securities and implementation of dividend payout plan for the year ended 31 December 2013, the growth rate of total capital after deductions from internal capital accumulation in the first half of 2014 still outpaced that of risk-weighted assets, contributing to the rise of capital adequacy ratios.
The following table sets forth, as at the dates indicated, the information related to the capital adequacy ratios of the Group and the Bank.
(In millions of RMB, except percentages)As at 30 June 2014 As at 31 December 2013
The Group The Bank The Group The Bank
Capital adequacy ratios in accordance with the Measures for Capital Management of Commercial Banks (Trial)1
Total capital after deductions: Common Equity Tier 1 1,132,884 1,068,006 1,061,684 998,380 Tier 1 capital 1,132,918 1,068,006 1,061,700 998,380 Total capital 1,404,637 1,337,984 1,316,724 1,249,850
Capital adequacy ratios: Common Equity Tier 1 ratio 11.21% 10.88% 10.75% 10.44% Tier 1 ratio 11.21% 10.88% 10.75% 10.44% Total capital ratio 13.89% 13.64% 13.34% 13.06%
Capital adequacy ratios in accordance with the Measures for the Management of Capital Adequacy Ratios of Commercial BanksCore capital adequacy ratio 11.70% 11.59% 11.14% 11.05%Capital adequacy ratio 14.24% 13.90% 13.88% 13.53%
1. From this reporting period on, the Group calculates capital adequacy ratios based on the advanced capital measurement approach and applies the rules in the transition period.

46 China Construction Bank Corporation Half-Year Report 2014
Management Discussion and Analysis
Composition of capitalThe following table sets forth, as at the dates indicated, the information related to the composition of capital of the Group in accordance with the Measures for Capital Management of Commercial Banks (Trial).
(In millions of RMB)As at
30 June 2014As at
31 December 2013
Common Equity Tier 1 capital Qualifying common share capital 250,011 250,011 Capital reserve1 131,097 116,321 Surplus reserve 107,970 107,970 General reserve 169,029 153,825 Retained earnings 482,613 442,554 Minority interest given recognition in Common Equity Tier 1 capital 3,491 3,729 Others2 (4,489) (5,948)
Deductions for Common Equity Tier 1 capital Goodwill3 1,460 1,415 Other intangible assets (excluding land use right)3 1,456 1,609 Cash-flow hedge reserve 20 (148) Investments in common equity of financial institutions being controlled but outside the scope of regulatory consolidation 3,902 3,902
Additional Tier 1 capital Minority interest given recognition in Additional Tier 1 capital 34 16
Tier 2 capital Directly issued qualifying Tier 2 instruments including related stock surplus 127,868 144,000 Provisions in Tier 24 143,724 110,918 Minority interest given recognition in Tier 2 capital 127 106
Common Equity Tier 1 capital after deductions5 1,132,884 1,061,684Tier 1 capital after deductions5 1,132,918 1,061,700
Total capital after deductions5 1,404,637 1,316,724
1. The investment revaluation reserve is included in capital reserve.
2. Others mainly contain foreign exchange reserve.
3. Both balances of goodwill and other intangible assets (excluding land use right) are the net amounts after deducting relevant deferred tax liabilities.
4. From this reporting period on, excess allowances based on the latest regulatory rules are eligible for inclusion in Tier 2 capital.
5. Common Equity Tier 1 capital after deductions is calculated by netting off the corresponding deduction items from the Common Equity Tier 1 capital. Tier 1 capital after deductions is calculated by netting off the corresponding deduction items from the Tier 1 capital. Total capital after deductions is calculated by netting off the corresponding deduction items from the total capital.

China Construction Bank CorporationHalf-Year Report 2014 47
Management Discussion and Analysis
Risk-weighted assetsThe following table sets forth, as at the dates indicated, the information related to the risk-weighted assets of the Group in accordance with the Measures for Capital Management of Commercial Banks (Trial). Corporate credit risk-weighted assets that meet the regulatory requirements are calculated with the foundation internal rating-based approach, the retail credit risk-weighted assets are calculated with the internal rating-based approach, the market risk-weighted assets are calculated with the internal models approach and the operational risk-weighted assets are calculated with the standardised approach.
(In millions of RMB)As at
30 June 2014As at
31 December 20131
Credit risk-weighted assets 8,593,159 8,984,419Market risk-weighted assets 30,455 43,685Operational risk-weighted assets 829,575 844,686Additional risk-weighted assets arising due to the application of capital floors 656,306 N/A
Total risk-weighted assets 10,109,495 9,872,790
1. As at 31 December 2013, the Group’s credit risk-weighted assets were calculated with the regulatory weight approach, the market risk-weighted assets were calculated with the standardised approach, and the operational risk-weighted assets were calculated with the basic indicator approach.
Credit risk exposureThe following table sets forth, as at the date indicated, the information related to the credit risk exposure of the Group in accordance with the Measures for Capital Management of Commercial Banks (Trial).
(In millions of RMB)As at
30 June 2014
Exposure at defaultCovered by internal rating-based approach 9,258,537
Corporate risk exposure 6,581,644 Retail risk exposure 2,676,893
Risk exposureNot covered by internal rating-based approach 8,710,423
On-balance sheet credit risks exposure 8,494,607 Of which: Securitisation risk exposure 5,456 Off-balance sheet credit risk exposure 180,804 Counterparty credit risk exposure 35,012
Capital requirements of market risksThe following table sets forth, as at the date indicated, the information related to capital requirements of various market risks. The Group’s capital requirements of market risks are calculated with the internal models approach. Requirements not covered by the internal models approach are calculated with the standardised approach.
As at 30 June 2014
(In millions of RMB) Capital requirements
Covered by internal models approach 1,751
Not covered by internal models approach 685
Interest rate risk 115 Equity position risk 81 Foreign exchange risk 489 Commodity risk – Option risk –
Total 2,436

48 China Construction Bank Corporation Half-Year Report 2014
Management Discussion and Analysis
The following table sets forth, for the six months ended 30 June 2014, the information related to the value at risk (VaR) and stressed value at risk (stressed VaR) of market risks calculated with the internal models approach. The VaR and stressed VaR are calculated with historical simulation approach, whose historical observation periods are both one year with a holding period of ten days and at a confidence level of 99%. VaR and stressed VaR respectively reflect the maximum losses with probability calculated with the latest historical scenario and one-year historical scenario that exerts significant pressure on the Bank’s assets.
Six months ended 30 June 2014(In millions of RMB) Average Highest Lowest Period end
Value at risk (VaR) 25,495 58,107 13,483 13,483Stressed value at risk (Stressed VaR) 29,041 58,107 15,200 37,414
Equity risk exposure of banking bookThe following table sets forth, as at the dates indicated, the information related to the equity risk exposure of banking book and the unrealised potential risk gains or losses of the Group.
(In millions of RMB) As at 30 June 2014 As at 31 December 2013
Invested institution categories
Publicly traded
equity risk exposures1
Non-publicly traded
equity risk exposures1
Unrealised potential
risk gains or losses2
Publicly traded
equity risk exposures1
Non-publicly traded
equity risk exposures1
Unrealised potential
risk gains or losses2
Financial institutions 1,759 1,322 528 1,834 1,395 519Non-financial institutions 5,032 3,979 2,382 5,570 3,998 2,698
Total 6,791 5,301 2,910 7,404 5,393 3,217
1. Publicly traded equity risk exposures are the equity risk exposures of invested institutions that are listed companies. Non-publicly traded equity risk exposures are the equity risk exposures of invested institutions that are non-listed companies.
2. Unrealised potential risk gains or losses are the portion of gains or losses that have been recognised in the balance sheet but not in the income statement.
ProspectsIn the second half of 2014, from the perspective of external environment, despite the varying situations in different geographical areas, the global economy as a whole is still on the track of moderate recovery. The economic growth is expected to be better than that of last year and the overseas market demand is relatively stable.
The Chinese economy is now in the stage of growth rate changing and transformation of development model. As the throes of structural adjustments and the vitalities stimulated by adjustments and reforms are intertwined with each other, the economic development takes on characteristics of the specific stage and the new normal. With various positive elements and a supportive macroscopic policy environment, the Chinese economy is expected to maintain steady growth. Meanwhile, there are many risks and challenges in economic development, mainly because new and strong growth engines are yet to be formed while the existing growth engines such as external demands and real estate are weakening. Structural adjustments and reforms remain extremely arduous tasks.
Against the above-mentioned background, the Group will adhere to the development direction featuring “integration, multifunction, and intensiveness”, firmly push forward operation transformation, and further strengthen risk prevention and control, to maintain steady development of various businesses. Efforts will be made in the following areas. First, the Group will strive to promote comprehensive service transformation, electronic transformation, management model transformation at the Group level and innovation-driven transformation. Second, the Group will further support the real economy, continuously follow the national economic transformation and industrial adjustments, and enhance the supporting efforts of financial services. The Group will proactively support the development of weak links in economy including “agriculture, farmers and rural areas”, small and micro-enterprises, and people’s livelihood sectors. Third, the Group will positively respond to changes of customer requirements on funds under interest rate liberalisation, consolidate customer base, and improve products and services, to boost stable growth of deposits. Fourth, the Group will strengthen risk management and control, promote the event of “Year of Credit Risk Prevention and Control”, enhance authenticity investigation on pre-lending evaluations, improve post-lending management mechanism and optimise collateral management system. The Group will strengthen the examination and rectification in key areas, and re-inspect and optimise credit policies. The Group will strengthen overall risk management in liquidity risk, market risk, operational risk and reputation risk, and firmly hold the risk bottom line. Fifth, the Group will strive to increase revenue and reduce expenses to ensure stable increase in profit. The Group will increase “smart” product services and maintain standardised and sound development of fee-based businesses. The Group will enhance the capabilities of comprehensive pricing and differentiated pricing, strengthen cost management, and improve the intensive level of spending.

Changes in Share Capital and Particulars of Shareholders
China Construction Bank CorporationHalf-Year Report 2014 49
Changes in Shares
Unit: share
1 January 2014 Increase/(Decrease) during the reporting period 30 June 2014
Number of shares Percentage (%)
Issuance of
additional shares Bonus issue
Shares
converted from
capital reserve Others Sub-total Number of shares Percentage (%)
(I) Shares subject to selling restrictions – – – – – – – – –
(II) Shares not subject to selling restrictions
1. RMB ordinary shares 9,593,657,606 3.84 – – – – – 9,593,657,606 3.84
2. Overseas listed foreign investment shares 91,967,394,499 36.78 – – – 130,296,000 130,296,000 92,097,690,499 36.83
3. Others1 148,449,925,381 59.38 – – – (130,296,000) (130,296,000) 148,319,629,381 59.33
(III) Total number of shares 250,010,977,486 100.00 – – – – – 250,010,977,486 100.00
1. H-shares not subject to selling restrictions held by the promoters of the Bank, i.e. Huijin, Baosteel Group, State Grid, and Yangtze Power.
Number of Shareholders and Particulars of Shareholdings
At the end of the reporting period, based on the register of members as at 30 June 2014, the Bank had a total of 753,760 shareholders, of which 51,731 were holders of H-shares and 702,029 were holders of A-shares.
Unit: share
Total number of shareholders 753,760 (Total number of registered holders of A-shares and H-shares as at 30 June 2014)
Particulars of shareholdings of the top ten shareholders
Name of shareholder Nature of shareholder
Shareholding
percentage (%)
Total number of
shares held
Number of
shares subject to
selling restrictions
Number of
shares pledged
or frozen
Huijin State-owned 57.03 142,590,494,651 (H-shares) None None
0.23 570,941,976 (A-shares) None None
HKSCC Nominees Limited1 Foreign legal person 29.85 74,631,967,812 (H-shares) None Unknown
Temasek1 Foreign legal person 6.39 15,973,595,216 (H-shares) None None
State Grid1,2 State-owned legal person 1.09 2,713,521,730 (H-shares) None None
Baosteel Group State-owned legal person 0.80 2,000,000,000 (H-shares) None None
0.13 318,860,498 (A-shares) None None
China Ping An Life Insurance Company Limited -Traditional – Ordinary insurance products Domestic non-state-owned legal person 0.86 2,143,438,329 (A-shares) None None
Yangtze Power1 State-owned legal person 0.41 1,015,613,000 (H-shares) None None
Reca Investment Limited Foreign legal person 0.34 856,000,000 (H-shares) None None
China Ping An Life Insurance Company Limited -Traditional – High interest rate insurance policy products Domestic non-state-owned legal person 0.24 591,906,825 (A-shares) None None
China Securities Finance Corporation Limited State-owned legal person 0.12 303,607,933 (A-shares) None None
1. As at 30 June 2014, Temasek held 15,973,595,216 H-shares of the Bank through Temasek Holdings (Private) Limited and Fullerton Financial Holdings Pte Ltd.. State Grid and Yangtze Power held 2,713,521,730 H-shares and 1,015,613,000 H-shares of the Bank respectively, all of which were held under the name of HKSCC Nominees Limited. Besides the H-shares of the Bank held by Temasek, State Grid and Yangtze Power, another 74,631,967,812 H-shares of the Bank were held under the name of HKSCC Nominees Limited.
2. As at 30 June 2014, the holding of H-shares of the Bank by State Grid through its wholly-owned subsidiaries was as follows: State Grid Yingda International Holdings Group Co. Ltd. held 804,035,000 shares, State Grid International Development Limited held 1,315,282,730 shares, Luneng Group Co., Ltd. held 582,204,000 shares and Shenzhen Guoneng International Trading Co. Ltd. held 12,000,000 shares.
3. Some of the shareholders mentioned above are subject to management by the same entity. Apart from this, the Bank has not been aware of any connected relation or acting in concert among the shareholders.

50 China Construction Bank Corporation Half-Year Report 2014
Changes in Share Capital and Particulars of Shareholders
Changes in Controlling Shareholders and Actual Controlling Parties
During the reporting period, there had been no change in controlling shareholders and actual controlling parties.
Material Interests and Short Positions
As at 30 June 2014, the interests and short positions held by substantial shareholders and other persons in the shares and underlying shares of the Bank as recorded in the register required to be kept under section 336 of the SFO of Hong Kong were as follows:
NameType of shares
Interests and short positions
in shares Nature
% of issued A-shares
or H-shares% of total
issued shares
Huijin1 A-share 492,631,014 Long position 5.13 0.20Huijin2 H-share 133,262,144,534 Long position 59.31 57.03Temasek3 H-share 17,878,670,050 Long position 7.44 7.15
1. On 17 June 2013, Huijin declared interests on the website of Hong Kong Stock Exchange. It disclosed that it held the interests of 492,631,014 A-shares of the Bank, accounting for 5.13% of the A-shares issued then (9,593,657,606 shares) and 0.20% of total shares issued then (250,010,977,486 shares). As at 30 June 2014, according to the A-share register of members of the Bank, Huijin directly held 570,941,976 A-shares of the Bank, accounting for 5.95% of the A-shares issued (9,593,657,606 shares) and 0.23% of total shares issued (250,010,977,486 shares) at the end of the period.
2. On 26 May 2009, Huijin declared interests on the website of Hong Kong Stock Exchange. It disclosed that it held the interests of 133,262,144,534 H-shares of the Bank, accounting for 59.31% of the H-shares issued then (224,689,084,000 shares) and 57.03% of total shares issued then (233,689,084,000 shares). As at 30 June 2014, according to the H-share register of members of the Bank, Huijin held 142,590,494,651 H-shares of the Bank, accounting for 59.31% of the H-shares issued (240,417,319,880 shares) and 57.03% of total shares issued (250,010,977,486 shares) at the end of the period.
3. This is pursuant to the declaration of Temasek to Hong Kong Stock Exchange on 4 May 2012.

Profiles of Directors, Supervisors, and Senior Management
China Construction Bank CorporationHalf-Year Report 2014 51
Particulars of Directors, Supervisors and Senior Management
Directors of the Bank
Members of the Bank’s board of directors included executive directors: Mr. Wang Hongzhang, Mr. Zhang Jianguo, Mr. Zhu Hongbo and Mr. Hu Zheyi; non-executive directors: Mr. Qi Shouyin, Ms. Chen Yuanling, Mr. Xu Tie, Mr. Guo Yanpeng and Mr. Dong Shi; and independent non-executive directors: Mr. Zhang Long, Ms. Elaine La Roche, Mr. Chung Shui Ming Timpson, Mr. Wim Kok, Mr. Murray Horn and Ms. Margaret Leung Ko May Yee.
Supervisors of the Bank
Members of the Bank’s board of supervisors included shareholder representative supervisors: Mr. Guo You, Ms. Liu Jin and Ms. Li Xiaoling; employee representative supervisors: Mr. Jin Panshi, Mr. Zhang Huajian and Mr. Wang Lin; and external supervisors: Mr. Wang Xinmin and Mr. Bai Jianjun.
Senior Management of the Bank
Senior management of the Bank included Mr. Zhang Jianguo, Mr. Zhu Hongbo, Mr. Hu Zheyi, Mr. Pang Xiusheng, Mr. Zhang Gengsheng, Mr. Yang Wensheng, Mr. Huang Yi, Mr. Zeng Jianhua, Mr. Huang Zhiling, Mr. Yu Jingbo, Mr. Xu Yiming, Mr. Chen Caihong and Mr. Xu Huibin.
Changes in Directors, Supervisors and Senior Management
Directors of the Bank
Upon conclusion of the Board meeting of the Bank on 28 March 2014, Mr. Zhao Xijun ceased to serve as independent non-executive director of the Bank due to his personal working reason.
From 7 May 2014, Ms. Zhang Yanling ceased to serve as non-executive director of the Bank due to her change of work.
Supervisors of the Bank
In accordance with the resolution at the 2013 annual general meeting of the Bank, from June 2014, Mr. Guo You commenced his position as shareholder representative supervisor of the Bank. In accordance with the resolution at the fourth meeting of the board of supervisors in 2014, from June 2014, Mr. Guo You commenced his position as chairman of the board of supervisors of the Bank.
In accordance with the resolution at the third meeting of the third employee representatives meeting, from January 2014, Mr. Wang Lin commenced his position as employee representative supervisor of the Bank.
From June 2014, Mr. Zhang Furong resigned from his position as chairman of the board of supervisors and shareholder representative supervisor of the Bank in accordance with relevant regulations and due to his age.
From January 2014, Mr. Li Weiping resigned from his position as employee representative supervisor of the Bank due to work arrangement.
From April 2014, Ms. Huang Shuping resigned from her position as employee representative supervisor of the Bank due to her change of work.
Senior Management of the Bank
Upon appointment at the first meeting of the Board of the Bank in 2014 and approval of the CBRC, Mr. Huang Yi commenced his position as executive vice president of the Bank from April 2014.
From June 2014, Mr. Pang Xiusheng ceased to serve concurrently as the chief financial officer of the Bank. Upon appointment at the second meeting of the Board of the Bank in 2014 and approval of the CBRC, Mr. Xu Yiming commenced his position as chief financial officer of the Bank from June 2014.
From January 2014, Mr. Zhao Huan ceased to serve as executive vice president of the Bank.

52 China Construction Bank Corporation Half-Year Report 2014
Profiles of Directors, Supervisors, and Senior Management
Directors’ and Supervisors’ Interests and Short Positions in Shares, Underlying Shares and Debentures of the Bank
Mr. Zhang Long and Ms. Margaret Leung Ko May Yee, the directors of the Bank, held 235,400 A-shares and 100,000 H-shares of the Bank, respectively. Mr. Zhang Huajian and Mr. Wang Lin, the supervisors of the Bank, indirectly held 18,999 H-shares and 19,304 H-shares of the Bank, respectively, by participating in the employee stock incentive plan before they were appointed as supervisors. Apart from the above, as at 30 June 2014, none of the directors and supervisors of the Bank had any interests or short positions in the shares, underlying shares and debentures of the Bank or its associated corporations (within the meaning of Part XV of the SFO of Hong Kong) as recorded in the register required to be kept under Section 352 of the SFO of Hong Kong or as otherwise notified to the Bank and Hong Kong Stock Exchange pursuant to Model Code for Securities Transactions by Directors of Listed Issuers in Appendix 10 of the Listing Rules.
As at 30 June 2014, except for the employee stock incentive plan, the Bank had not granted its directors or supervisors, or their respective spouses or children below the age of 18, any other rights to subscribe for the shares or debentures of the Bank or any of its associated corporations.
Directors and Supervisors’ Securities Transactions
The Bank has adopted a code of practice in relation to securities transactions by directors and supervisors as set out in the Model Code for Securities Transactions by Directors of Listed Issuers in Appendix 10 of the Listing Rules of Hong Kong Stock Exchange. All directors and supervisors had complied with the provisions of this code during the six months ended 30 June 2014.
Shares of the Bank held by Directors, Supervisors and Senior Management
During the reporting period, Mr. Zhang Long, director of the Bank, held 235,400 A-shares of the Bank, and Ms. Margaret Leung Ko May Yee, director of the Bank, held 100,000 H-shares of the Bank. Some of the Bank’s supervisors and senior executives indirectly held H-shares of the Bank via employee stock incentive plan before they assumed duties of their current positions. Mr. Zhang Huajian held 18,999 H-shares, Mr. Wang Lin held 19,304 H-shares, Mr. Zhang Gengsheng held 19,304 H-shares, Mr. Yang Wensheng held 10,845 H-shares, Mr. Zeng Jianhua held 25,838 H-shares, Mr. Huang Zhiling held 18,751 H-shares, Mr. Yu Jingbo held 22,567 H-shares, Mr. Xu Yiming held 17,925 H-shares, Mr. Chen Caihong held 19,417 H-shares, and Mr. Xu Huibin held 20,004 H-shares. For the resigned ones, Mr. Li Weiping held 20,446 H-shares, Ms. Huang Shuping held 21,910 H-shares, and Mr. Zhao Huan held 18,292 H-shares. Apart from the above, none of the directors, supervisors or senior executives of the Bank held any shares of the Bank.

Major Issues
China Construction Bank CorporationHalf-Year Report 2014 53
Corporate Governance
The Bank continued to improve its corporate governance structure in strict compliance with the Company Law of the People’s Republic of China, the Law of the People’s Republic of China on Commercial Banks and other laws and regulations, as well as the listing rules of the relevant stock exchanges, based on its practical conditions, in order to enhance its corporate governance. During the reporting period, the general meeting of the Bank reviewed and approved the resolutions of electing new directors and supervisors.
In order to promote sustainable development and diversify the composition of the Board, the Bank formulated the Diversity Policy for the Board of Directors in August 2013. For nomination of directors, the Board should consider both professional capabilities and working ethics of the candidates, and at the same time, take into account the requirements under the diversity policy. The candidates should be selected as complementary to each other, with diversified backgrounds in terms of gender, age, cultural and educational background, professional experience, specialty, knowledge and term of service. The final decision should be based on candidates’ overall competence and possible contributions to the Board. Nomination and Remuneration Committee supervises the implementation of the Diversity Policy for the Board of Directors.
The Bank has complied with the code provisions of the Corporate Governance Code and Corporate Governance Report as set out in Appendix 14 of the Listing Rules of Hong Kong Stock Exchange. The Bank has also substantially complied with the recommended best practices therein.
Formulation and Implementation of Cash Dividend Policy
As approved by the 2013 annual general meeting of the Bank, the Bank distributed the 2013 cash dividend of RMB0.300 per share (including tax) on 10 July 2014 to all of its holders of A-shares whose names appeared on the register of members on 9 July 2014. It distributed the 2013 cash dividend of RMB0.300 per share (including tax) on 8 August 2014 to all of its holders of H-shares whose names appeared on the register of members on 9 July 2014.
The Bank will not distribute 2014 interim dividend nor did it propose any capitalisation of capital reserve into share capital during the reporting period.
Pursuant to the Articles of Association of the Bank, the after-tax profits of the Bank shall be distributed in accordance with the following order: making up for the losses of the previous years, allocating the statutory reserve fund, allocating general reserve fund, allocating discretionary reserve fund and paying for the dividend of the shareholders. The dividend may be distributed in the form of cash, shares or a combination of cash and shares.
The Bank has sound procedures and mechanism for the decision-making of profit distribution. During the process of drafting the profit distribution plan, the Board extensively collected the opinions and requests from the shareholders, protected the legal rights and interests of the small and medium investors, and submitted the profit distribution plan to the general meeting for approval. The independent directors conducted due diligence and played their due roles in the decision-making process of the profit distribution plan. The Bank attaches great importance to the return of shareholders, and constantly pays cash dividends to the shareholders.
Performance of Undertakings Given by the Bank or Shareholders Holding 5% or More of the Shares
In September 2004, Huijin made a commitment of “avoiding competition within the industry”, i.e., as long as Huijin continued to hold any shares of the Bank, or was defined as a controlling shareholder or a connected person of a controlling shareholder of the Bank in accordance with related laws of the People’s Republic of China or listing rules of the Bank’s listing venues, Huijin would not engage or participate in any competing commercial banking businesses, including but not limited to extending loans, taking deposits and providing settlement, and providing fund custody, bank card and currency exchange services. However, Huijin may still engage or participate in competing businesses through investing into other commercial banks. Accordingly, Huijin agreed to: (1) fairly weigh its investments in commercial banks, and not abuse its shareholder position in the Bank or the information it obtained through its shareholder position in the Bank to make decisions detrimental to the Bank but beneficial to others; (2) exercise its shareholder’s rights in the best interests of the Bank. As at 30 June 2014, Huijin had not acted in violation of the above undertakings.
During the reporting period, the Bank or shareholders holding 5% or more of the shares did not give new undertakings.

54 China Construction Bank Corporation Half-Year Report 2014
Major Issues
Progress of Implementation of Employee Stock Incentive Plan
During the reporting period, the Bank did not implement a new round of stock incentive plan pursuant to the requirements of relevant PRC policies.
Acquisition and Sale of Major Assets and Merger of Enterprises
In January 2014, the CSRC approved CCB Trust, a subsidiary of the Bank, to increase its capital in Shanghai Liangmao Futures Brokerage Co., Ltd. by RMB393 million, therefore increasing its shareholding of Shanghai Liangmao Futures Brokerage Co., Ltd. to 77.07%. CCB Trust increased its capital contribution in Shanghai Liangmao Futures Brokerage Co., Ltd. In February 2014, and Shanghai Liangmao Futures Brokerage Co. Ltd. completed the capital increase business registration change and renamed itself CCB Futures Co., Ltd. in April 2014.
Use of Proceeds
The proceeds raised from the rights issue are used for the purpose as disclosed in the prospectus, to strengthen the capital base of the Bank and support sustainable business development.
Material Investment with Funds other than Raised Proceeds
During the reporting period, there was no material investment with funds other than raised proceeds.
Material Litigations, Arbitrations and Matters Questioned by the Majority Media
During the reporting period, there was no material litigation or arbitration of the Bank, or matter in relation to the Bank that was questioned by the majority media.
Material Related Party Transactions
During the reporting period, there was no material related party transaction of the Bank.
Material Contracts and Their Performance
During the reporting period, the Bank did not enter into any material arrangement for custody, contracting or lease of other companies’ assets, or allow its assets to be subject to such arrangements by other companies. The guarantee business is an off-balance sheet service in the ordinary course of the Bank’s business, and the Bank did not have any material guarantee that should be disclosed except for the financial guarantee services within its business scope as approved by the regulators. The Bank did not entrust management of any material cash assets to others during the reporting period.
Purchase, Sale and Redemption of Shares
During the reporting period, there was no purchase, sale or redemption of the shares of the Bank by the Bank or any of its subsidiaries.
Penalties
During the reporting period, the Bank, the directors, the supervisors, the senior management, shareholders holding 5% or more of the shares and the actual controller had no record of being subject to investigations by relevant authorities, coercive measures by judicial or disciplinary departments, transfer to judicial organs or criminal investigation and punishment, investigation and administrative penalties as well as being banned entry into the market, being considered as inappropriate entities by the CSRC, penalties by other administrative authorities or public censures by the stock exchanges.
Review of Half-Year Report
The Group’s 2014 half-year financial statements prepared under PRC GAAP has been reviewed by PricewaterhouseCoopers Zhong Tian LLP and the Group’s 2014 half-year financial statements prepared under IFRS has been reviewed by PricewaterhouseCoopers.
The audit committee of the Bank has reviewed the Group’s half-year report.
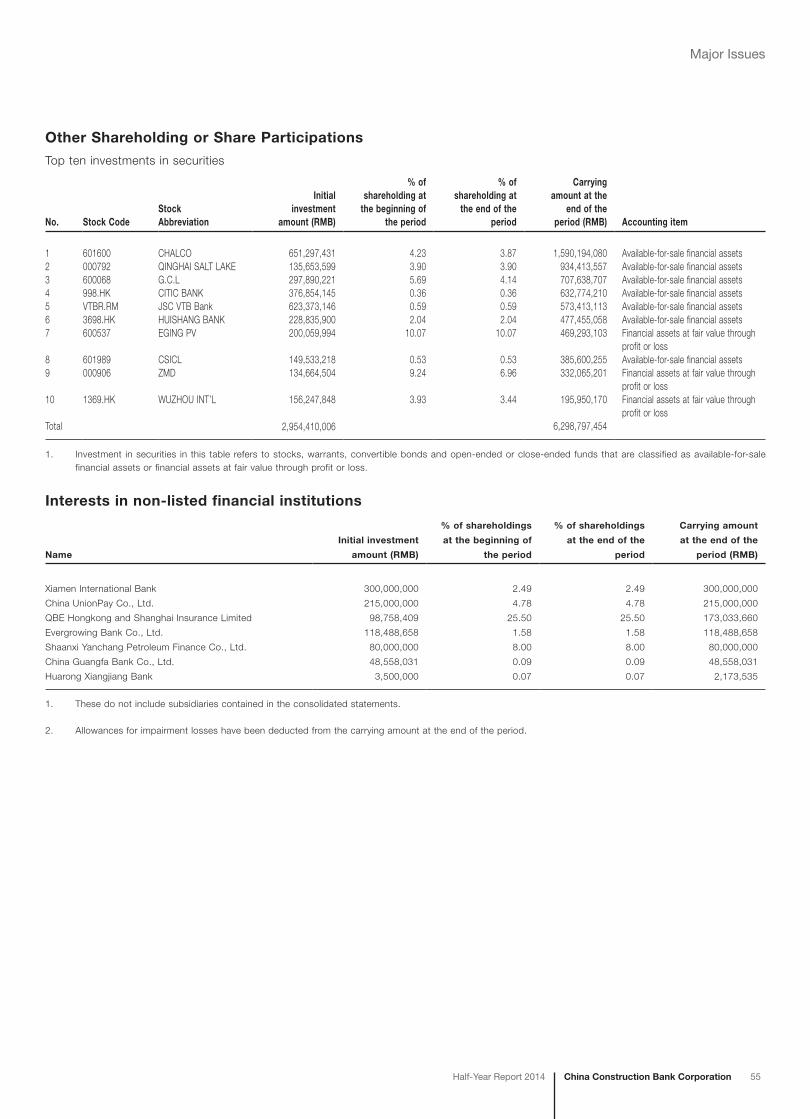
China Construction Bank CorporationHalf-Year Report 2014 55
Major Issues
Other Shareholding or Share Participations
Top ten investments in securities
No. Stock CodeStock Abbreviation
Initial investment
amount (RMB)
% of shareholding at
the beginning of the period
% of shareholding at
the end of the period
Carrying amount at the
end of the period (RMB) Accounting item
1 601600 CHALCO 651,297,431 4.23 3.87 1,590,194,080 Available-for-sale financial assets2 000792 QINGHAI SALT LAKE 135,653,599 3.90 3.90 934,413,557 Available-for-sale financial assets3 600068 G.C.L 297,890,221 5.69 4.14 707,638,707 Available-for-sale financial assets4 998.HK CITIC BANK 376,854,145 0.36 0.36 632,774,210 Available-for-sale financial assets5 VTBR.RM JSC VTB Bank 623,373,146 0.59 0.59 573,413,113 Available-for-sale financial assets6 3698.HK HUISHANG BANK 228,835,900 2.04 2.04 477,455,058 Available-for-sale financial assets7 600537 EGING PV 200,059,994 10.07 10.07 469,293,103 Financial assets at fair value through
profit or loss8 601989 CSICL 149,533,218 0.53 0.53 385,600,255 Available-for-sale financial assets9 000906 ZMD 134,664,504 9.24 6.96 332,065,201 Financial assets at fair value through
profit or loss10 1369.HK WUZHOU INT’L 156,247,848 3.93 3.44 195,950,170 Financial assets at fair value through
profit or lossTotal 2,954,410,006 6,298,797,454
1. Investment in securities in this table refers to stocks, warrants, convertible bonds and open-ended or close-ended funds that are classified as available-for-sale financial assets or financial assets at fair value through profit or loss.
Interests in non-listed financial institutions
Name
Initial investment
amount (RMB)
% of shareholdings
at the beginning of
the period
% of shareholdings
at the end of the
period
Carrying amount
at the end of the
period (RMB)
Xiamen International Bank 300,000,000 2.49 2.49 300,000,000
China UnionPay Co., Ltd. 215,000,000 4.78 4.78 215,000,000
QBE Hongkong and Shanghai Insurance Limited 98,758,409 25.50 25.50 173,033,660
Evergrowing Bank Co., Ltd. 118,488,658 1.58 1.58 118,488,658
Shaanxi Yanchang Petroleum Finance Co., Ltd. 80,000,000 8.00 8.00 80,000,000
China Guangfa Bank Co., Ltd. 48,558,031 0.09 0.09 48,558,031
Huarong Xiangjiang Bank 3,500,000 0.07 0.07 2,173,535
1. These do not include subsidiaries contained in the consolidated statements.
2. Allowances for impairment losses have been deducted from the carrying amount at the end of the period.

Report on Review of Interim Financial Statements
56 China Construction Bank Corporation Half-Year Report 2014
To the Board of Directors of China Construction Bank Corporation(a joint stock company incorporated in the People’s Republic of China with limited liability)
IntroductionWe have reviewed the interim financial information set out on pages 57 to 154, which comprises the consolidated and Bank’s statements of financial position of China Construction Bank Corporation (the “Bank”) and its subsidiaries (together, the “Group”) as at 30 June 2014 and the related consolidated statement of comprehensive income, the consolidated and the Bank’s statements of changes in equity and the consolidated statement of cash flows for the six-month period then ended, and a summary of significant accounting policies and other explanatory notes. The Rules Governing the Listing of Securities on The Stock Exchange of Hong Kong Limited require the preparation of a report on interim financial information to be in compliance with the relevant provisions thereof and International Accounting Standard 34“Interim Financial Reporting”. The directors of the Bank are responsible for the preparation and presentation of this interim financial information in accordance with International Accounting Standard 34 “Interim Financial Reporting”. Our responsibility is to express a conclusion on this interim financial information based on our review and to report our conclusion solely to you, as a body, in accordance with our agreed terms of engagement and for no other purpose. We do not assume responsibility towards or accept liability to any other person for the contents of this report.
Scope of ReviewWe conducted our review in accordance with Hong Kong Standard on Review Engagements 2410, “Review of Interim Financial Information Performed by the Independent Auditor of the Entity” issued by the Hong Kong Institute of Certified Public Accountants. A review of interim financial information consists of making inquiries, primarily of persons responsible for financial and accounting matters, and applying analytical and other review procedures. A review is substantially less in scope than an audit conducted in accordance with Hong Kong Standards on Auditing and consequently does not enable us to obtain assurance that we would become aware of all significant matters that might be identified in an audit. Accordingly, we do not express an audit opinion.
ConclusionBased on our review, nothing has come to our attention that causes us to believe that the interim financial information is not prepared, in all material respects, in accordance with International Accounting Standard 34 “Interim Financial Reporting”.
PricewaterhouseCoopersCertified Public Accountants
Hong Kong, 29 August 2014

Consolidated Statement of Comprehensive IncomeFor the six months ended 30 June 2014
(Expressed in millions of RMB, unless otherwise stated)
China Construction Bank CorporationHalf-Year Report 2014 57
Six months ended 30 June
Note 2014 2013(Unaudited) (Unaudited)
Interest income 356,473 313,347Interest expense (145,181) (125,687)
Net interest income 3 211,292 187,660
Fee and commission income 61,854 56,995Fee and commission expense (1,674) (1,471)
Net fee and commission income 4 60,180 55,524
Net trading gain 5 1,593 1,270Dividend income 6 240 193Net gain arising from investment securities 7 1,138 302
Other operating income net: – Other operating income 13,938 7,399 – Other operating expense (11,654) (41)
Other operating income, net 8 2,284 7,358
Operating income 276,727 252,307
Operating expenses 9 (84,139) (81,067)
192,588 171,240
Impairment losses on: – Loans and advances to customers (21,286) (16,067) – Others (1,836) 13
Impairment losses 10 (23,122) (16,054)
Share of profits less losses of associates and joint ventures 50 3
Profit before tax 169,516 155,189
Income tax expense 11 (38,546) (35,225)
Net profit 130,970 119,964
Other comprehensive income:
Items that will not be reclassified to profit or lossRemeasurements of post-employment benefit obligations (154) (57)
Subtotal (154) (57)
Items that may be reclassified subsequently to profit or lossGains/(losses) of available-for-sale financial assets arising during the period 20,643 (772)Less: Income tax relating to available-for-sale financial assets (5,147) 273Reclassification adjustments for losses included in profit or loss (537) (839)Net gains on cash flow hedges 168 193Exchange difference on translating foreign operations 1,468 (836)
Subtotal 16,595 (1,981)
Other comprehensive income for the period, net of tax 16,441 (2,038)
Total comprehensive income for the period 147,411 117,926
Net profit attributable to:Equity shareholders of the Bank 130,662 119,711Non-controlling interests 308 253
130,970 119,964
Total comprehensive income attributable to:Equity shareholders of the Bank 146,966 117,709Non-controlling interests 445 217
147,411 117,926
Basic and diluted earnings per share (in RMB Yuan) 12 0.52 0.48
The notes on pages 64 to 154 form part of these financial statements.

Consolidated Statement of Financial PositionAs at 30 June 2014(Expressed in millions of RMB, unless otherwise stated)
58 China Construction Bank Corporation Half-Year Report 2014
Note 30 June 2014 31 December 2013(Unaudited) (Audited)
Assets:
Cash and deposits with central banks 13 2,578,036 2,475,001Deposits with banks and non-bank financial institutions 14 349,098 321,286Precious metals 50,780 35,637Placements with banks and non-bank financial institutions 15 257,659 152,065Financial assets at fair value through profit or loss 16 324,072 364,050Positive fair value of derivatives 17 12,493 18,910Financial assets held under resale agreements 18 351,660 281,447Interest receivable 19 101,551 80,731Loans and advances to customers 20 8,952,511 8,361,361Available-for-sale financial assets 21 774,800 760,292Held-to-maturity investments 22 2,220,584 2,100,538Debt securities classified as receivables 23 192,014 189,737Interests in associates and jointly controlled entities 25 2,807 2,624Fixed assets 27 137,595 135,678Land use rights 28 15,874 15,731Intangible assets 29 1,895 2,053Goodwill 30 1,655 1,610Deferred tax assets 31 31,245 38,448Other assets 32 43,461 26,011
Total assets 16,399,790 15,363,210
Liabilities:
Borrowings from central banks 35 26,217 79,157Deposits from banks and non-bank financial institutions 36 795,594 692,095Placements from banks and non-bank financial institutions 37 258,894 155,917Financial liabilities at fair value through profit or loss 38 365,436 380,380Negative fair value of derivatives 17 11,796 19,872Financial assets sold under repurchase agreements 39 3,065 61,873Deposits from customers 40 12,956,956 12,223,037Accrued staff costs 41 31,852 34,080Taxes payable 42 36,985 60,209Interest payable 43 177,297 153,627Provisions 44 5,780 5,014Debt securities issued 45 428,524 357,540Deferred tax liabilities 31 145 138Other liabilities 46 154,237 65,942
Total liabilities 15,252,778 14,288,881
Equity:
Share capital 47 250,011 250,011Capital reserve 48 135,537 135,523Investment revaluation reserve 49 (4,468) (19,290)Surplus reserve 50 107,970 107,970General reserve 51 169,039 153,835Retained earnings 52 484,539 444,084Exchange reserve (4,714) (6,182)
Total equity attributable to equity shareholders of the Bank 1,137,914 1,065,951Non-controlling interests 9,098 8,378
Total equity 1,147,012 1,074,329
Total liabilities and equity 16,399,790 15,363,210
Approved and authorised for issue by the Board of Directors on 29 August 2014.
Zhang Jianguo Chung Shui Ming Timpson Murray HornVice chairman, executive director and president Independent non-executive director Independent non-executive director
The notes on pages 64 to 154 form part of these financial statements.

Statement of Financial PositionAs at 30 June 2014
(Expressed in millions of RMB, unless otherwise stated)
China Construction Bank CorporationHalf-Year Report 2014 59
Note 30 June 2014 31 December 2013(Unaudited) (Audited)
Assets:
Cash and deposits with central banks 13 2,565,021 2,469,497Deposits with banks and non-bank financial institutions 14 365,767 328,640Precious metals 50,780 35,637Placements with banks and non-bank financial institutions 15 288,610 233,574Financial assets at fair value through profit or loss 16 318,733 356,854Positive fair value of derivatives 17 10,285 16,503Financial assets held under resale agreements 18 350,812 280,959Interest receivable 19 99,597 79,025Loans and advances to customers 20 8,615,664 8,025,415Available-for-sale financial assets 21 724,515 714,745Held-to-maturity investments 22 2,215,237 2,095,741Debt securities classified as receivables 23 177,168 182,252Investments in subsidiaries 24 22,004 22,004Fixed assets 27 128,699 127,810Land use rights 28 15,456 15,682Intangible assets 29 1,397 1,549Deferred tax assets 31 32,144 39,093Other assets 32 72,266 58,417
Total assets 16,054,155 15,083,397
Liabilities:
Borrowings from central banks 35 25,695 78,733Deposits from banks and non-bank financial institutions 36 805,917 704,487Placements from banks and non-bank financial institutions 37 208,008 122,479Financial liabilities at fair value through profit or loss 38 362,781 377,731Negative fair value of derivatives 17 10,035 16,796Financial assets sold under repurchase agreements 39 373 55,457Deposits from customers 40 12,766,742 12,055,777Accrued staff costs 41 30,877 32,938Taxes payable 42 36,260 59,693Interest payable 43 176,391 152,946Provisions 44 5,780 5,014Debt securities issued 45 378,954 322,406Deferred tax liabilities 31 10 –Other liabilities 46 118,090 40,339
Total liabilities 14,925,913 14,024,796
Equity:
Share capital 47 250,011 250,011Capital reserve 48 135,522 135,508Investment revaluation reserve 49 (4,493) (19,275)Surplus reserve 50 107,970 107,970General reserve 51 165,934 150,675Retained earnings 52 474,170 434,877Exchange reserve (872) (1,165)
Total equity 1,128,242 1,058,601
Total liabilities and equity 16,054,155 15,083,397
Approved and authorised for issue by the Board of Directors on 29 August 2014.
Zhang Jianguo Chung Shui Ming Timpson Murray HornVice chairman, executive director and president Independent non-executive director Independent non-executive director
The notes on pages 64 to 154 form part of these financial statements.

Consolidated Statement of Changes in EquityFor the six months ended 30 June 2014(Expressed in millions of RMB, unless otherwise stated)
60 China Construction Bank Corporation Half-Year Report 2014
(Unaudited)
Attributable to equity shareholders of the Bank
Share capital
Capital reserve
Investment revaluation
reserveSurplus reserve
General reserve
Retained earnings
Exchange reserve
Non-controlling
interestsTotal
equity
As at 31 December 2013 250,011 135,523 (19,290) 107,970 153,835 444,084 (6,182) 8,378 1,074,329
Movements during the period – 14 14,822 – 15,204 40,455 1,468 720 72,683
(1) Total comprehensive income for the period – 14 14,822 – – 130,662 1,468 445 147,411
(2) Changes in share capital – – – – – – – 293 293i Non-controlling interests of
new subsidiaries – – – – – – – 117 117ii Change in shareholdings
in subsidiaries – – – – – – – 176 176
(3) Profit distribution – – – – 15,204 (90,207) – (18) (75,021)i Appropriation to general reserve – – – – 15,204 (15,204) – – –ii Appropriation to equity shareholders – – – – – (75,003) – (18) (75,021)
As at 30 June 2014 250,011 135,537 (4,468) 107,970 169,039 484,539 (4,714) 9,098 1,147,012
As at 31 December 2012 250,011 135,217 3,023 86,718 80,483 391,034 (4,818) 7,877 949,545
Movements during the period – 136 (1,301) – 71,855 (19,147) (837) 260 50,966
(1) Total comprehensive income for the period – 136 (1,301) – – 119,711 (837) 217 117,926
(2) Changes in share capital – – – – – – – 51 51i. Non-controlling interests of
new subsidiaries – – – – – – – 49 49ii. Change in shareholdings in
subsidiaries – – – – – – – 2 2
(3) Profit distribution – – – – 71,855 (138,858) – (8) (67,011)i. Appropriation to general reserve – – – – 71,855 (71,855) – – –ii. Appropriation to equity shareholders – – – – – (67,003) – (8) (67,011)
As at 30 June 2013 250,011 135,353 1,722 86,718 152,338 371,887 (5,655) 8,137 1,000,511
(Audited)
Attributable to equity shareholders of the Bank
Share capital
Capital reserve
Investment revaluation
reserveSurplus reserve
General reserve
Retained earnings
Exchange reserve
Non-controlling
interestsTotal
Equity
As at 31 December 2012 250,011 135,217 3,023 86,718 80,483 391,034 (4,818) 7,877 949,545
Movements during the year – 306 (22,313) 21,252 73,352 53,050 (1,364) 501 124,784
(1) Total comprehensive income for the year – 306 (22,313) – – 214,657 (1,364) 414 191,700
(2) Changes in share capital – – – – – – – 105 105i Non-controlling interests of
new subsidiaries – – – – – – – 51 51ii Change in shareholdings in
subsidiaries – – – – – – – 54 54
(3) Profit distribution – – – 21,252 73,352 (161,607) – (18) (67,021)i Appropriation to surplus reserve – – – 21,252 – (21,252) – – –ii Appropriation to general reserve – – – – 73,352 (73,352) – – –iii Appropriation to equity shareholders – – – – – (67,003) – (18) (67,021)
As at 31 December 2013 250,011 135,523 (19,290) 107,970 153,835 444,084 (6,182) 8,378 1,074,329
The notes on pages 64 to 154 form part of these financial statements.

Statement of Changes in EquityFor the six months ended 30 June 2014
(Expressed in millions of RMB, unless otherwise stated)
China Construction Bank CorporationHalf-Year Report 2014 61
(Unaudited)
Share capital
Capital reserve
Investment revaluation
reserveSurplus reserve
General reserve
Retained earnings
Exchange reserve
Total equity
As at 31 December 2013 250,011 135,508 (19,275) 107,970 150,675 434,877 (1,165) 1,058,601
Movements during the period – 14 14,782 – 15,259 39,293 293 69,641
(1) Total comprehensive income for the period – 14 14,782 – – 129,555 293 144,644
(2) Profit distribution – – – – 15,259 (90,262) – (75,003)i Appropriation to general reserve – – – – 15,259 (15,259) – –ii Appropriation to equity shareholders – – – – – (75,003) – (75,003)
As at 30 June 2014 250,011 135,522 (4,493) 107,970 165,934 474,170 (872) 1,128,242
As at 31 December 2012 250,011 135,140 3,078 86,718 79,444 381,844 (778) 935,457
Movements during the period – 198 (1,671) – 71,159 (19,562) (363) 49,761
(1) Total comprehensive income for the period – 136 (1,671) – – 118,600 (363) 116,702
(2) Changes in share capital – 62 – – – – – 62i Acquisition of subsidiaries – 62 – – – – – 62
(3) Profit distribution – – – – 71,159 (138,162) – (67,003)i Appropriation to general reserve – – – – 71,159 (71,159) – –ii Appropriation to equity shareholders – – – – – (67,003) – (67,003)
As at 30 June 2013 250,011 135,338 1,407 86,718 150,603 362,282 (1,141) 985,218
(Audited)
Share capital
Capital reserve
Investment revaluation
reserveSurplus reserve
General reserve
Retained earnings
Exchange reserve
Total equity
As at 31 December 2012 250,011 135,140 3,078 86,718 79,444 381,844 (778) 935,457
Movements during the year – 368 (22,353) 21,252 71,231 53,033 (387) 123,144
(1) Total comprehensive income for the year – 306 (22,353) – – 212,519 (387) 190,085
(2) Changes in share capital – 62 – – – – – 62i Acquisition of subsidiaries – 62 – – – – – 62
(3) Profit distribution – – – 21,252 71,231 (159,486) – (67,003)i Appropriation to surplus reserve – – – 21,252 – (21,252) – –ii Appropriation to general reserve – – – – 71,231 (71,231) – –iii Appropriation to equity shareholders – – – – – (67,003) – (67,003)
As at 31 December 2013 250,011 135,508 (19,275) 107,970 150,675 434,877 (1,165) 1,058,601
The notes on pages 64 to 154 form part of these financial statements.

Consolidated Statement of Cash FlowsFor the six months ended 30 June 2014(Expressed in millions of RMB, unless otherwise stated)
62 China Construction Bank Corporation Half-Year Report 2014
Six months ended 30 June
Note 2014 2013(Unaudited) (Unaudited)
Cash flows from operating activities
Profit before tax 169,516 155,189
Adjustments for: – Impairment losses 10 23,122 16,054 – Depreciation and amortisation 9 8,550 7,463 – Unwinding of discount (894) (721) – Revaluation (gain)/loss on financial instruments at fair value through profit or loss (420) 1,734 – Share of profit less losses of associates and joint ventures (50) (3) – Dividend income 6 (240) (193) – Unrealised foreign exchange (gain)/loss (1,745) 1,540 – Interest expense on bonds issued 3,744 3,783 – Net gain on disposal of investment securities 7 (1,138) (302) – Net gain on disposal of fixed assets and other long-term assets (11) (45)
200,434 184,499
Changes in operating assets:Net increase in deposits with central banks and with banks and non-bank financial institutions (242,245) (170,195)Net increase in placements with banks and non-bank financial institutions (22,882) (26,171)Net increase in loans and advances to customers (589,637) (599,502)Net increase in financial assets held under resale agreements (70,213) (18,757)Increase in other operating assets (13,052) (34,512)
(938,029) (849,137)
Changes in operating liabilities:Net (decrease)/increase in borrowings from central banks (53,351) 106,099Net increase in placements from banks and non-bank financial institutions 98,516 21,413Net increase in deposits from customers and from banks and non-bank financial institutions 818,580 585,915Net decrease in financial assets sold under repurchase agreements (58,900) (1,183)Net increase in certificates of deposit issued 63,718 54,879Income tax paid (58,911) (52,995)Increase in other operating liabilities 17,463 27,241
827,115 741,369
Net cash from operating activities 89,520 76,731
Cash flows from investing activities
Proceeds from sale and redemption of investments 257,862 301,617Dividends received 216 194Proceeds from disposal of fixed assets and other long-term assets 455 303Purchase of investment securities (371,807) (329,854)Purchase of fixed assets and other long-term assets (10,712) (13,083)Acquisition of subsidiaries, associates and joint ventures (106) (8)
Net cash used in investing activities (124,092) (40,831)
Cash flows from financing activities
Issue of bonds 13,830 –Capital contribution by non-controlling interests 293 49Dividends paid (8) (18)Repayment of borrowings (12,500) –Interest paid on bonds issued (1,568) (1,536)
Net cash from/(used) in financing activities 47 (1,505)
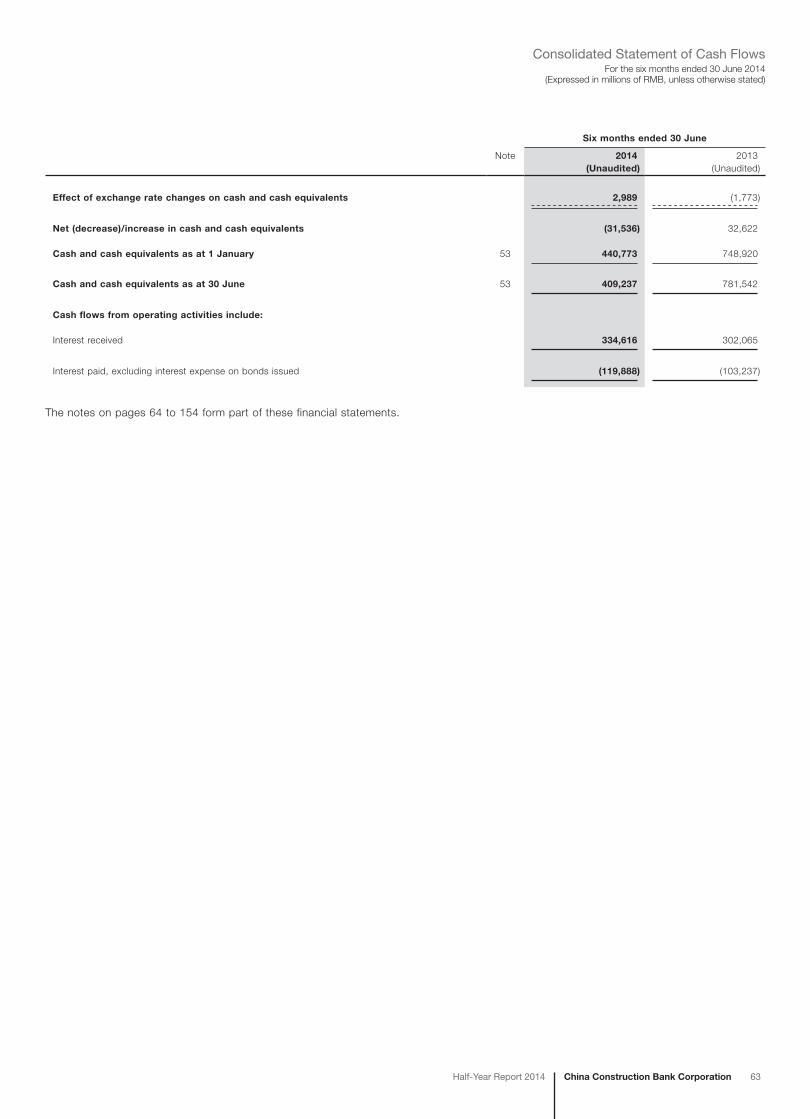
China Construction Bank CorporationHalf-Year Report 2014 63
For the six months ended 30 June 2014(Expressed in millions of RMB, unless otherwise stated)
Consolidated Statement of Cash Flows
Six months ended 30 June
Note 2014 2013(Unaudited) (Unaudited)
Effect of exchange rate changes on cash and cash equivalents 2,989 (1,773)
Net (decrease)/increase in cash and cash equivalents (31,536) 32,622
Cash and cash equivalents as at 1 January 53 440,773 748,920
Cash and cash equivalents as at 30 June 53 409,237 781,542
Cash flows from operating activities include:
Interest received 334,616 302,065
Interest paid, excluding interest expense on bonds issued (119,888) (103,237)
The notes on pages 64 to 154 form part of these financial statements.
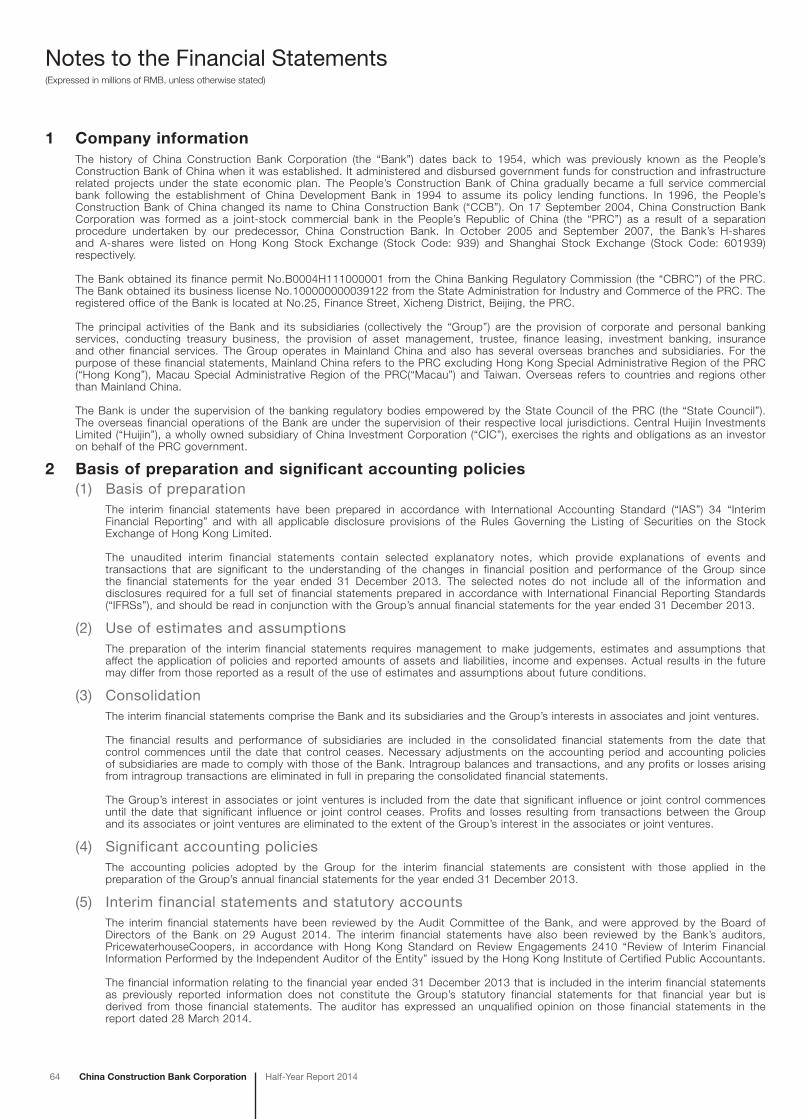
Notes to the Financial Statements(Expressed in millions of RMB, unless otherwise stated)
64 China Construction Bank Corporation Half-Year Report 2014
1 Company informationThe history of China Construction Bank Corporation (the “Bank”) dates back to 1954, which was previously known as the People’s Construction Bank of China when it was established. It administered and disbursed government funds for construction and infrastructure related projects under the state economic plan. The People’s Construction Bank of China gradually became a full service commercial bank following the establishment of China Development Bank in 1994 to assume its policy lending functions. In 1996, the People’s Construction Bank of China changed its name to China Construction Bank (“CCB”). On 17 September 2004, China Construction Bank Corporation was formed as a joint-stock commercial bank in the People’s Republic of China (the “PRC”) as a result of a separation procedure undertaken by our predecessor, China Construction Bank. In October 2005 and September 2007, the Bank’s H-shares and A-shares were listed on Hong Kong Stock Exchange (Stock Code: 939) and Shanghai Stock Exchange (Stock Code: 601939) respectively.
The Bank obtained its finance permit No.B0004H111000001 from the China Banking Regulatory Commission (the “CBRC”) of the PRC. The Bank obtained its business license No.100000000039122 from the State Administration for Industry and Commerce of the PRC. The registered office of the Bank is located at No.25, Finance Street, Xicheng District, Beijing, the PRC.
The principal activities of the Bank and its subsidiaries (collectively the “Group”) are the provision of corporate and personal banking services, conducting treasury business, the provision of asset management, trustee, finance leasing, investment banking, insurance and other financial services. The Group operates in Mainland China and also has several overseas branches and subsidiaries. For the purpose of these financial statements, Mainland China refers to the PRC excluding Hong Kong Special Administrative Region of the PRC (“Hong Kong”), Macau Special Administrative Region of the PRC(“Macau”) and Taiwan. Overseas refers to countries and regions other than Mainland China.
The Bank is under the supervision of the banking regulatory bodies empowered by the State Council of the PRC (the “State Council”). The overseas financial operations of the Bank are under the supervision of their respective local jurisdictions. Central Huijin Investments Limited (“Huijin”), a wholly owned subsidiary of China Investment Corporation (“CIC”), exercises the rights and obligations as an investor on behalf of the PRC government.
2 Basis of preparation and significant accounting policies(1) Basis of preparation
The interim financial statements have been prepared in accordance with International Accounting Standard (“IAS”) 34 “Interim Financial Reporting” and with all applicable disclosure provisions of the Rules Governing the Listing of Securities on the Stock Exchange of Hong Kong Limited.
The unaudited interim financial statements contain selected explanatory notes, which provide explanations of events and transactions that are significant to the understanding of the changes in financial position and performance of the Group since the financial statements for the year ended 31 December 2013. The selected notes do not include all of the information and disclosures required for a full set of financial statements prepared in accordance with International Financial Reporting Standards (“IFRSs”), and should be read in conjunction with the Group’s annual financial statements for the year ended 31 December 2013.
(2) Use of estimates and assumptionsThe preparation of the interim financial statements requires management to make judgements, estimates and assumptions that affect the application of policies and reported amounts of assets and liabilities, income and expenses. Actual results in the future may differ from those reported as a result of the use of estimates and assumptions about future conditions.
(3) ConsolidationThe interim financial statements comprise the Bank and its subsidiaries and the Group’s interests in associates and joint ventures.
The financial results and performance of subsidiaries are included in the consolidated financial statements from the date that control commences until the date that control ceases. Necessary adjustments on the accounting period and accounting policies of subsidiaries are made to comply with those of the Bank. Intragroup balances and transactions, and any profits or losses arising from intragroup transactions are eliminated in full in preparing the consolidated financial statements.
The Group’s interest in associates or joint ventures is included from the date that significant influence or joint control commences until the date that significant influence or joint control ceases. Profits and losses resulting from transactions between the Group and its associates or joint ventures are eliminated to the extent of the Group’s interest in the associates or joint ventures.
(4) Significant accounting policiesThe accounting policies adopted by the Group for the interim financial statements are consistent with those applied in the preparation of the Group’s annual financial statements for the year ended 31 December 2013.
(5) Interim financial statements and statutory accountsThe interim financial statements have been reviewed by the Audit Committee of the Bank, and were approved by the Board of Directors of the Bank on 29 August 2014. The interim financial statements have also been reviewed by the Bank’s auditors, PricewaterhouseCoopers, in accordance with Hong Kong Standard on Review Engagements 2410 “Review of Interim Financial Information Performed by the Independent Auditor of the Entity” issued by the Hong Kong Institute of Certified Public Accountants.
The financial information relating to the financial year ended 31 December 2013 that is included in the interim financial statements as previously reported information does not constitute the Group’s statutory financial statements for that financial year but is derived from those financial statements. The auditor has expressed an unqualified opinion on those financial statements in the report dated 28 March 2014.

China Construction Bank CorporationHalf-Year Report 2014 65
(Expressed in millions of RMB, unless otherwise stated)Notes to the Financial Statements
3 Net interest incomeSix months ended 30 June
2014 2013
Interest income arising from:Deposits with central banks 19,090 18,413Deposits with banks and non-bank financial institutions 8,051 9,990Placements with banks and non-bank financial institutions 4,446 2,385Financial assets at fair value through profit or loss 668 420Financial assets held under resale agreements 6,247 3,589Investment securities 61,153 51,430Loans and advances to customers – Corporate loans and advances 178,276 161,373 – Personal loans and advances 75,243 62,005 – Discounted bills 3,299 3,742
Total 356,473 313,347
Interest expense arising from:Borrowings from central banks (380) (504)Deposits from banks and non-bank financial institutions (22,671) (9,277)Placements from banks and non-bank financial institutions (2,305) (1,355)Financial assets sold under repurchase agreements (82) (575)Debt securities issued (5,801) (4,958)Deposits from customers – Corporate deposits (57,962) (53,847) – Personal deposits (55,980) (55,171)
Total (145,181) (125,687)
Net interest income 211,292 187,660
Notes:
(1) Interest income from impaired financial assets is listed as follows:
Six months ended 30 June
2014 2013
Impaired loans and advances 894 721Other impaired financial assets 58 110
Total 952 831
(2) Interest expense on financial liabilities with maturity over five years mainly represented the interest expense on debt securities issued.

66 China Construction Bank Corporation Half-Year Report 2014
(Expressed in millions of RMB, unless otherwise stated)Notes to the Financial Statements
4 Net fee and commission income
Six months ended 30 June
2014 2013
Fee and commission incomeBank card fees 14,662 11,947Consultancy and advisory fees 12,822 13,035Settlement and clearing fees 8,219 6,514Agency service fees 7,276 6,509Commission on trust and fiduciary activities 5,161 5,300Wealth management service fees 4,689 5,189Electronic banking service fees 3,281 2,807Credit commitment fees 1,736 1,518Guarantee fees 1,117 1,009Others 2,891 3,167
Total 61,854 56,995
Fee and commission expenseBank card transaction fees (1,094) (913)Inter-bank transaction fees (266) (224)Others (314) (334)
Total (1,674) (1,471)
Net fee and commission income 60,180 55,524
5 Net trading gainSix months ended 30 June
2014 2013
Debt securities 415 (26)Derivatives 563 808Equity investments 131 143Others 484 345
Total 1,593 1,270
For the six months ended 30 June 2014, the trading gain related to financial assets designated at fair value through profit or loss of the Group amounted to RMB14,593 million (for the six months ended 30 June 2013: RMB124 million loss). Trading loss related to financial liabilities designated at fair value through profit or loss of the Group amounted to RMB16,513 million (for the six months ended 30 June 2013: RMB980 million gain).
6 Dividend income
Six months ended 30 June
2014 2013
Dividend income from listed trading equity investments 26 17Dividend income from available-for-sale equity investments – Listed 23 34 – Unlisted 191 142
Total 240 193

China Construction Bank CorporationHalf-Year Report 2014 67
(Expressed in millions of RMB, unless otherwise stated)Notes to the Financial Statements
7 Net gain arising from investment securities
Six months ended 30 June
2014 2013
Net gain on sale of available-for-sale financial assets 190 131Net revaluation gain reclassified from other comprehensive income on disposal 733 76Net gain on sale of held-to-maturity investments 215 95
Total 1,138 302
8 Other operating income, netFor the six months ended 30 June 2014, other operating income and other operating expense of the Group mainly include insurance related income and insurance related expense.
9 Operating expenses
Six months ended 30 June
2014 2013
Staff costs – Salaries, bonuses, allowances and subsidies 25,718 24,704 – Defined contribution retirement schemes 5,360 4,419 – Other social insurance and welfare 4,020 3,389 – Housing funds 2,794 2,461 – Union operating costs and employee education costs 1,062 1,008 – Compensation to employees for termination of employment 3 4
38,957 35,985
Premises and equipment expenses – Depreciation charges 7,358 6,300 – Rent and property management expenses 3,691 3,270 – Maintenance 1,086 958 – Utilities 913 872 – Others 712 682
13,760 12,082
Business taxes and surcharges 17,231 15,780Amortisation expenses 1,192 1,163Audit fees 72 56Other general and administrative expenses 12,927 16,001
Total 84,139 81,067
10 Impairment losses
Six months ended 30 June
2014 2013
Loans and advances to customers 21,286 16,067 – Additions 26,365 21,935 – Releases (5,079) (5,868)Available-for-sale debt securities 22 (1,096)Held-to-maturity investments 320 598Debt securities classified as receivables 84 (130)Others 1,410 615
Total 23,122 16,054

68 China Construction Bank Corporation Half-Year Report 2014
(Expressed in millions of RMB, unless otherwise stated)Notes to the Financial Statements
11 Income tax expense(1) Income tax expense
Six months ended 30 June
2014 2013
Current tax 36,191 35,929 – Mainland China 35,970 35,600 – Hong Kong 93 246 – Other countries and regions 128 83Adjustments for prior years 113 (46)Deferred tax 2,242 (658)
Total 38,546 35,225
The provisions of income taxes for Mainland China and Hong Kong are calculated at 25% and 16.5% of the estimated taxable income from Mainland China and Hong Kong operations for the period respectively. Taxation for other overseas operations is charged at the appropriate current rates of taxation ruling in the relevant tax jurisdictions.
(2) Reconciliation between income tax expense and accounting profit
Six months ended 30 June
Note 2014 2013
Profit before tax 169,516 155,189
Income tax calculated at statutory tax rates 42,379 38,797
Non-deductible expenses (i) 1,048 755Non-taxable income (ii) (4,994) (4,281)Adjustments on income tax for prior years which affect profit or loss 113 (46)
Income tax expense 38,546 35,225
(i) Non-deductible expenses primarily include staff costs and entertainment expenses in excess of those deductible under the relevant PRC tax regulations.
(ii) Non-taxable income primarily includes interest income from PRC government bonds.
12 Earnings per shareBasic earnings per share for the six months ended 30 June 2014 and 2013 have been computed by dividing the net profit attributable to equity shareholders of the Bank by the weighted average number of ordinary shares outstanding during the period. There was no difference between basic and diluted earnings per share as there were no potentially dilutive shares outstanding during the six months ended 30 June 2014 and 2013.
Six months ended 30 June
2014 2013
Net profit attributable to shareholders of the Bank 130,662 119,711Weighted average number of shares (in million shares) 250,011 250,011Basic and diluted earnings per share attributable to shareholders of the Bank (in RMB Yuan) 0.52 0.48

China Construction Bank CorporationHalf-Year Report 2014 69
(Expressed in millions of RMB, unless otherwise stated)Notes to the Financial Statements
13 Cash and deposits with central banksGroup Bank
Note 30 June 2014 31 December 2013 30 June 2014 31 December 2013
Cash 61,135 71,756 60,887 71,457
Deposits with central banks – Statutory deposit reserves (1) 2,330,801 2,254,478 2,328,369 2,252,239 – Surplus deposit reserves (2) 154,551 129,443 144,216 126,477 – Fiscal deposits 31,549 19,324 31,549 19,324
Subtotal 2,516,901 2,403,245 2,504,134 2,398,040
Total 2,578,036 2,475,001 2,565,021 2,469,497
(1) The Group places statutory deposit reserves with the People’s Bank of China (“PBOC”) and overseas central banks where it has operations. The statutory deposit reserves are not available for use in the Group’s daily business.
As at the end of the reporting period, the statutory deposit reserve rates in Mainland China were as follows:
30 June 2014 31 December 2013
Reserve rate for RMB deposits 20.0% 20.0%Reserve rate for foreign currency deposits 5.0% 5.0%
The statutory RMB deposit reserve rates applicable to domestic subsidiaries of the Group are determined by the PBOC.
The amounts of statutory deposit reserves placed with the central banks of overseas countries are determined by local jurisdictions.
(2) The surplus deposit reserve maintained with the PBOC is mainly for the purpose of clearing.
14 Deposits with banks and non-bank financial institutions(1) Analysed by type of counterparties
Group Bank
30 June 2014 31 December 2013 30 June 2014 31 December 2013
Banks 345,041 317,864 361,714 325,353Non-bank financial institutions 4,064 3,429 4,057 3,291
Gross balances 349,105 321,293 365,771 328,644Allowances for impairment losses (Note 33) (7) (7) (4) (4)
Net balances 349,098 321,286 365,767 328,640
(2) Analysed by geographical sectorsGroup Bank
30 June 2014 31 December 2013 30 June 2014 31 December 2013
Mainland China 323,669 301,221 323,074 301,079Overseas 25,436 20,072 42,697 27,565
Gross balances 349,105 321,293 365,771 328,644Allowances for impairment losses (Note 33) (7) (7) (4) (4)
Net balances 349,098 321,286 365,767 328,640

70 China Construction Bank Corporation Half-Year Report 2014
(Expressed in millions of RMB, unless otherwise stated)Notes to the Financial Statements
15 Placements with banks and non-bank financial institutions(1) Analysed by type of counterparties
Group Bank
30 June 2014 31 December 2013 30 June 2014 31 December 2013
Banks 169,623 49,419 194,950 121,551Non-bank financial institutions 88,063 102,673 93,687 112,050
Gross balances 257,686 152,092 288,637 233,601Allowances for impairment losses (Note 33) (27) (27) (27) (27)
Net balances 257,659 152,065 288,610 233,574
(2) Analysed by geographical sectorsGroup Bank
30 June 2014 31 December 2013 30 June 2014 31 December 2013
Mainland China 157,329 120,157 124,419 116,641Overseas 100,357 31,935 164,218 116,960
Gross balances 257,686 152,092 288,637 233,601Allowances for impairment losses (Note 33) (27) (27) (27) (27)
Net balances 257,659 152,065 288,610 233,574
16 Financial assets at fair value through profit or lossAnalysed by nature
Group Bank
Note 30 June 2014 31 December 2013 30 June 2014 31 December 2013
Held for trading purposes (1) – Debt securities 13,639 76,532 13,352 76,288 – Equity instruments 455 355 – – – Funds 560 262 – –
14,654 77,149 13,352 76,288
Designated at fair value through profit or loss (2) – Debt securities 1,963 2,432 – – – Equity instruments 4,074 5,903 – – – Other debt instruments 303,381 278,566 305,381 280,566
309,418 286,901 305,381 280,566
Total 324,072 364,050 318,733 356,854

China Construction Bank CorporationHalf-Year Report 2014 71
(Expressed in millions of RMB, unless otherwise stated)Notes to the Financial Statements
16 Financial assets at fair value through profit or loss (continued)
Analysed by types of issuer(1) Held for trading purposes
(a) Debt securities
Group Bank
Note 30 June 2014 31 December 2013 30 June 2014 31 December 2013
Government 738 1,810 729 1,802Policy banks 877 3,153 877 3,153Banks and non-bank financial institutions 5,010 17,766 5,010 17,749Others 7,014 53,803 6,736 53,584
Total 13,639 76,532 13,352 76,288
Listed (i) 13,639 76,532 13,352 76,288 – of which in Hong Kong 37 68 – –
Total 13,639 76,532 13,352 76,288
(i) Debt securities traded on the China Domestic Interbank Bond Market are classified in the Listed Category.
(b) Equity instruments and funds
Group
30 June 2014 31 December 2013
Banks and non-bank financial institutions 554 206Others 461 411
Total 1,015 617
Listed 456 406 – of which in Hong Kong 443 270Unlisted 559 211
Total 1,015 617
(2) Designated at fair value through profit or loss(a) Debt securities
Group
30 June 2014 31 December 2013
Policy banks 243 241Banks and non-bank financial institutions 520 516Others 1,200 1,675
Total 1,963 2,432
Listed in Hong Kong 794 789Unlisted 1,169 1,643
Total 1,963 2,432

72 China Construction Bank Corporation Half-Year Report 2014
(Expressed in millions of RMB, unless otherwise stated)Notes to the Financial Statements
16 Financial assets at fair value through profit or loss (continued)
Analysed by types of issuer (continued)
(2) Designated at fair value through profit or loss (continued)(b) Equity instruments
Group
30 June 2014 31 December 2013
Banks and non-bank financial institutions 921 591Others 3,153 5,312
Total 4,074 5,903
Listed 2,084 1,958 – of which in Hong Kong 1,283 1,305Unlisted 1,990 3,945
Total 4,074 5,903
(c) Other debt instruments
Group Bank
30 June 2014 31 December 2013 30 June 2014 31 December 2013
Banks and non-bank financial institutions 303,321 278,506 305,321 280,506Other corporate entities 60 60 60 60
Total 303,381 278,566 305,381 280,566
Other debt instruments were mainly the deposits with banks invested by principal guaranteed wealth management products.
There was no significant limitation on the ability of the Group and the Bank to dispose of financial assets at fair value through profit or loss.
17 Derivatives and hedge accounting(1) Analysed by type of contract
Group30 June 2014 31 December 2013
Notional amounts Assets Liabilities
Notional amounts Assets Liabilities
Interest rate contracts 212,252 1,583 1,366 262,454 1,415 1,302Exchange rate contracts 1,890,736 10,164 10,026 1,739,985 16,272 16,890Other contracts 29,951 746 404 15,774 1,223 1,680
Total 2,132,939 12,493 11,796 2,018,213 18,910 19,872
Bank30 June 2014 31 December 2013
Notional amounts Assets Liabilities
Notional amounts Assets Liabilities
Interest rate contracts 207,441 1,571 1,349 254,779 1,402 1,284Exchange rate contracts 1,576,755 8,430 8,282 1,501,564 14,272 14,879Other contracts 28,696 284 404 13,659 829 633
Total 1,812,892 10,285 10,035 1,770,002 16,503 16,796

China Construction Bank CorporationHalf-Year Report 2014 73
(Expressed in millions of RMB, unless otherwise stated)Notes to the Financial Statements
17 Derivatives and hedge accounting (continued)
(2) Analysed by credit risk-weighted assetsGroup Bank
30 June 2014 31 December 2013 30 June 2014 31 December 2013
Counterparty credit default risk-weighted assetsInterest rate contracts 1,636 1,387 1,623 1,381Exchange rate contracts 16,981 17,739 14,178 15,276Other contracts 771 1,238 307 808
Subtotal 19,388 20,364 16,108 17,465
Credit value adjustment 8,101 8,688 6,904 7,962
Total 27,489 29,052 23,012 25,427
The notional amounts of derivatives only represent the unsettled transaction volumes as at the end of the reporting period, instead of the amounts of risk assets. Since 1 January 2013 the Group has adopted Administrative Measures for the Capital of Commercial Banks (for Trial Implementation) and other related policies. According to the new rules set out by the CBRC, the credit risk-weighted assets included credit valuation adjustments, with the considerations of the status of counterparties, maturity characteristics and back-to-back client-driven transactions.
(3) Hedge accountingThe following designated hedging instruments are included in the derivative financial instruments as disclosed above.
Group30 June 2014 31 December 2013
Notional amounts Assets Liabilities
Notional amounts Assets Liabilities
Fair value hedges Interest rate swaps 5,917 62 (85) 10,020 58 (100)
Cash flow hedges Foreign exchange forwards 10,731 128 (17) 51,093 – (1,862)
Total 16,648 190 (102) 61,113 58 (1,962)
Bank30 June 2014 31 December 2013
Notional amounts Assets Liabilities
Notional amounts Assets Liabilities
Fair value hedges Interest rate swaps 5,917 62 (85) 10,020 58 (100)
Cash flow hedges Foreign exchange forwards 10,428 125 (17) 50,805 – (1,860)
Total 16,345 187 (102) 60,825 58 (1,960)

74 China Construction Bank Corporation Half-Year Report 2014
(Expressed in millions of RMB, unless otherwise stated)Notes to the Financial Statements
17 Derivatives and hedge accounting (continued)
(3) Hedge accounting (continued)
(a) Fair value hedge
The Group uses interest rate swaps to hedge against changes in fair value of available-for-sale financial assets, certificates of deposit issued, placements with banks and non-bank financial institutions, loans and advances to customers arising from changes in interest rates.
Gains or losses on fair value hedges are as follows:
Six months ended 30 June
2014 2013
Net gains/(losses) on – hedging instruments 27 (13) – hedged items (27) 13
The gain and loss arising from ineffective portion of fair value hedge was immaterial for the six month ended 30 June 2013 and 2014.
(b) Cash flow hedge
The Group uses foreign exchange forwards to hedge against exposures to cash flow variability primarily from foreign exchange risks of loans and advances to customers. The maturities of hedging instruments and hedged items are both within one year.
For the six months ended 30 June 2014, a net gain from the cash flow hedge of RMB168 million was recognised in other comprehensive income and accumulated in “capital reserve” (six months ended 30 June 2013: RMB193 million), and the gain and loss arising from ineffective portion of cash flow hedge was immaterial for the six months ended 30 June 2014.
There were no transactions for which cash flow hedge accounting had to be ceased on 30 June 2014 and 31 December 2013 as a result of the highly probable cash flows no longer being expected to occur.
18 Financial assets held under resale agreementsFinancial assets held under resale agreements by underlying assets are shown as follows:
Group Bank
30 June 2014 31 December 2013 30 June 2014 31 December 2013
Securities – Government bonds 42,230 120,156 42,175 119,891 – Bills issued by the PBOC – 10,109 – 10,109 – Debt securities issued by banks and
non-bank financial institutions 84,066 129,706 84,066 129,483 – Other securities 793 – – –
Subtotal 127,089 259,971 126,241 259,483
Discounted bills 224,571 19,876 224,571 19,876Loans and advances to customers – 1,600 – 1,600
Total and net balances 351,660 281,447 350,812 280,959

China Construction Bank CorporationHalf-Year Report 2014 75
(Expressed in millions of RMB, unless otherwise stated)Notes to the Financial Statements
19 Interest receivableGroup Bank
30 June 2014 31 December 2013 30 June 2014 31 December 2013
Deposits with central banks 957 1,040 956 1,039Deposits with banks and non-bank financial institutions 9,049 5,035 8,797 4,879Financial assets held under resale agreements 3,510 153 3,509 150Loans and advances to customers 27,445 23,408 26,649 21,579Debt securities 59,493 50,551 58,874 50,234Others 1,098 545 813 1,145
Gross balances 101,552 80,732 99,598 79,026Allowances for impairment losses (Note 33) (1) (1) (1) (1)
Net balances 101,551 80,731 99,597 79,025
20 Loans and advances to customers(1) Analysed by nature
Group Bank
30 June 2014 31 December 2013 30 June 2014 31 December 2013
Corporate loans and advances – Loans 6,259,375 5,897,249 6,022,846 5,644,616 – Finance leases 61,856 44,956 – –
6,321,231 5,942,205 6,022,846 5,644,616
Personal loans and advances – Residential mortgages 2,099,607 1,896,203 2,084,115 1,880,227 – Personal business loans 86,475 95,342 82,368 91,655 – Personal consumer loans 67,802 76,174 62,909 71,490 – Credit cards 285,494 273,228 281,401 268,663 – Others 177,593 163,891 165,596 152,627
2,716,971 2,504,838 2,676,389 2,464,662
Discounted bills 152,399 143,014 152,164 142,842
Gross loans and advances to customers 9,190,601 8,590,057 8,851,399 8,252,120Allowances for impairment losses (Note 33) (238,090) (228,696) (235,735) (226,705) – Individual assessment (53,994) (52,137) (53,703) (51,885) – Collective assessment (184,096) (176,559) (182,032) (174,820)
Net loans and advances to customers 8,952,511 8,361,361 8,615,664 8,025,415

76 China Construction Bank Corporation Half-Year Report 2014
(Expressed in millions of RMB, unless otherwise stated)Notes to the Financial Statements
20 Loans and advances to customers (continued)
(2) Analysed by assessment method of allowances for impairment losses
Loans and advances for which
collectively assessed
Impaired loans and advances
Total
for which allowance are
collectively assessed
for which allowance are
individually assessed
Note (a) (b) (b)
Group
As at 30 June 2014Gross loans and advances to customers 9,094,933 9,642 86,026 9,190,601Allowances for impairment losses (177,635) (6,461) (53,994) (238,090)
Net loans and advances to customers 8,917,298 3,181 32,032 8,952,511
As at 31 December 2013Gross loans and advances to customers 8,504,793 8,112 77,152 8,590,057Allowances for impairment losses (171,027) (5,532) (52,137) (228,696)
Net loans and advances to customers 8,333,766 2,580 25,015 8,361,361
Bank
As at 30 June 2014Gross loans and advances to customers 8,756,394 9,510 85,495 8,851,399Allowances for impairment losses (175,606) (6,426) (53,703) (235,735)
Net loans and advances to customers 8,580,788 3,084 31,792 8,615,664
As at 31 December 2013Gross loans and advances to customers 8,167,339 8,002 76,779 8,252,120Allowances for impairment losses (169,308) (5,512) (51,885) (226,705)
Net loans and advances to customers 7,998,031 2,490 24,894 8,025,415
(a) Loans and advances assessed on a collective basis for impairment are those graded normal or special mention.
(b) Impaired loans and advances include loans for which objective evidence of impairment exists and assessed:
– individually (including corporate loans and advances which are graded substandard, doubtful or loss); or
– collectively; these are portfolios of homogeneous loans (including personal loans and advances which are graded substandard, doubtful or loss).
The proportion of impaired loans and advances of the Group to gross loans and advances as at 30 June 2014 is 1.04% (31 December 2013: 0.99%).
The proportion of impaired loans and advances of the Bank to gross loans and advances as at 30 June 2014 is 1.07% (31 December 2013: 1.03%).
(c) The definitions of the loan classifications stated in notes (a) and (b) above are set out in Note 60(1).

China Construction Bank CorporationHalf-Year Report 2014 77
(Expressed in millions of RMB, unless otherwise stated)Notes to the Financial Statements
20 Loans and advances to customers (continued)
(3) Movements of allowances for impairment lossesGroup
Six months ended 30 June 2014
Note
Allowances for loans
and advances which are
collectively assessed
Allowances for impaired loans and advances
Total
which are collectively
assessed
which are individually
assessed
As at 1 January 171,027 5,532 52,137 228,696Charge for the period 6,608 2,422 17,335 26,365Release during the period – – (5,079) (5,079)Unwinding of discount – – (894) (894)Transfers out (a) – (2) (2,772) (2,774)Write-offs – (1,575) (7,456) (9,031)Recoveries – 84 723 807
As at 30 June 177,635 6,461 53,994 238,090
2013
Note
Allowances for loans
and advances which are
collectively assessed
Allowances for impaired loans and advances
Total
which are collectively
assessed
which are individually
assessed
As at 1 January 152,710 3,909 45,814 202,433Charge for the year 18,317 2,941 32,240 53,498Release during the year – – (10,832) (10,832)Unwinding of discount – – (1,446) (1,446)Transfers out (a) – (3) (4,858) (4,861)Write-offs – (1,427) (10,441) (11,868)Recoveries – 112 1,660 1,772
As at 31 December 171,027 5,532 52,137 228,696

78 China Construction Bank Corporation Half-Year Report 2014
(Expressed in millions of RMB, unless otherwise stated)Notes to the Financial Statements
20 Loans and advances to customers (continued)
(3) Movements of allowances for impairment losses (continued)
BankSix months ended 30 June 2014
Note
Allowances for loans
and advances which are
collectively assessed
Allowances for impaired loans and advances
Total
which are collectively
assessed
which are individually
assessed
As at 1 January 169,308 5,512 51,885 226,705Charge for the period 6,250 2,366 17,290 25,906Release during the period – – (5,074) (5,074)Unwinding of discount – – (894) (894)Addition through acquisition 48 – – 48Transfers out (a) – (3) (2,786) (2,789)Write-offs – (1,519) (7,441) (8,960)Recoveries – 70 723 793
As at 30 June 175,606 6,426 53,703 235,735
2013
Note
Allowances for loans
and advances which are
collectively assessed
Allowances for impaired loans and advances
Total
which are collectively
assessed
which are individually
assessed
As at 1 January 151,510 3,899 45,678 201,087Charge for the year 17,848 2,846 32,086 52,780Release during the year – – (10,821) (10,821)Unwinding of discount – – (1,446) (1,446)Transfers out (a) (50) (1) (4,844) (4,895)Write-offs – (1,317) (10,424) (11,741)Recoveries – 85 1,656 1,741
As at 31 December 169,308 5,512 51,885 226,705
(a) Transfers out include the transfer of allowances for impairment losses upon disposal of non-performing loans and repossession of assets, and the relevant exchange gain or loss.
(4) Overdue loans analysed by overdue periodGroup
30 June 2014
Overdue within
three months
Overdue between
three months and one year
Overdue between
one year and three years
Overdue over
three years Total
Unsecured loans 8,583 3,298 1,215 1,097 14,193Guaranteed loans 12,027 15,618 12,233 2,217 42,095Loans secured by tangible assets other than monetary assets 23,961 16,348 12,356 4,555 57,220Loans secured by monetary assets 2,425 2,120 2,078 290 6,913
Total 46,996 37,384 27,882 8,159 120,421
As a percentage of gross loans and advances to customers 0.51% 0.41% 0.30% 0.09% 1.31%

China Construction Bank CorporationHalf-Year Report 2014 79
(Expressed in millions of RMB, unless otherwise stated)Notes to the Financial Statements
20 Loans and advances to customers (continued)
(4) Overdue loans analysed by overdue period (continued)
Group (continued)31 December 2013
Overdue within
three months
Overdue between
three months and one year
Overdue between
one year and three years
Overdue over
three years Total
Unsecured loans 5,521 2,684 1,316 984 10,505Guaranteed loans 6,873 11,769 10,544 2,478 31,664Loans secured by tangible assets other than monetary assets 12,274 9,849 12,471 5,138 39,732Loans secured by monetary assets 409 1,801 2,221 372 4,803
Total 25,077 26,103 26,552 8,972 86,704
As a percentage of gross loans and advances to customers 0.30% 0.30% 0.31% 0.10% 1.01%
Bank30 June 2014
Overdue within
three months
Overdue between
three months and one year
Overdue between
one year and three years
Overdue over
three years Total
Unsecured loans 8,496 3,188 1,215 1,061 13,960Guaranteed loans 11,807 15,508 12,004 2,217 41,536Loans secured by tangible assets other than monetary assets 23,433 16,267 12,348 4,554 56,602Loans secured by monetary assets 2,423 2,120 2,078 290 6,911
Total 46,159 37,083 27,645 8,122 119,009
As a percentage of gross loans and advances to customers 0.52% 0.42% 0.31% 0.09% 1.34%
31 December 2013
Overdue within
three months
Overdue between
three months and one year
Overdue between
one year and three years
Overdue over
three years Total
Unsecured loans 5,440 2,559 1,316 944 10,259Guaranteed loans 6,806 11,714 10,427 2,478 31,425Loans secured by tangible assets other than monetary assets 11,872 9,787 12,464 5,138 39,261Loans secured by monetary assets 402 1,801 2,221 372 4,796
Total 24,520 25,861 26,428 8,932 85,741
As a percentage of gross loans and advances to customers 0.30% 0.31% 0.32% 0.11% 1.04%
Overdue loans represent loans of which the whole or part of the principal or interest are overdue for 1 day or more.

80 China Construction Bank Corporation Half-Year Report 2014
(Expressed in millions of RMB, unless otherwise stated)Notes to the Financial Statements
21 Available-for-sale financial assetsAnalysed by nature
Group Bank
Note 30 June 2014 31 December 2013 30 June 2014 31 December 2013
Debt securities (1) 760,394 746,626 718,702 708,413Equity instruments (2) 13,116 12,991 5,813 6,332Funds (2) 1,290 675 – –
Total 774,800 760,292 724,515 714,745
(1) Debt securitiesAnalysed by type of issuers
Group Bank
Note 30 June 2014 31 December 2013 30 June 2014 31 December 2013
Government 154,696 157,824 136,754 139,426Central banks 8,195 9,690 5,514 6,059Policy banks 122,015 107,059 121,165 106,835Banks and non-bank financial institutions 267,223 236,105 253,738 224,925Public sector entities 19 98 – 79Other enterprises 208,246 235,850 201,531 231,089
Total 760,394 746,626 718,702 708,413
Listed (i) 694,282 696,600 683,837 687,769 – of which in Hong Kong 1,599 1,482 1,100 1,317Unlisted 66,112 50,026 34,865 20,644
Total 760,394 746,626 718,702 708,413
(i) Debt securities traded on the China Domestic Interbank Bond Market are classified as listed.
(2) Equity instruments and fundsGroup Bank
30 June 2014 31 December 2013 30 June 2014 31 December 2013
Debt equity swap (“DES”) investments 4,363 4,978 4,363 4,978Other equity instruments 8,753 8,013 1,450 1,354Funds 1,290 675 – –
Total 14,406 13,666 5,813 6,332
Listed 7,989 7,397 4,758 5,338 – of which in Hong Kong 633 554 633 554Unlisted 6,417 6,269 1,055 994
Total 14,406 13,666 5,813 6,332
Pursuant to the DES arrangement by the PRC government in 1999, the Group obtained equity interests of certain entities in lieu of repayments of loans granted to them. According to relevant requirements, the Group is prohibited from being involved in management of the operations of these entities. In substance, the Group does not have any control, joint control or significant influence over these entities.
(3) As at 30 June 2014, the Group’s and the Bank’s cost of available for sale debt securities was RMB771,180 million and RMB729,483 million respectively(2013: RMB778,733 million and RMB740,117 million respectively). The Group’s and the Bank’s cost of available for sale equity instruments and funds was RMB15,733 million and RMB7,319 million respectively(2013: RMB14,249 million and RMB7,343 million respectively).

China Construction Bank CorporationHalf-Year Report 2014 81
(Expressed in millions of RMB, unless otherwise stated)Notes to the Financial Statements
22 Held-to-maturity investmentsAnalysed by types of issuers
Group Bank
Note 30 June 2014 31 December 2013 30 June 2014 31 December 2013
Government 897,331 865,879 896,433 865,226Central banks 180,700 188,220 180,700 188,220Policy banks 370,368 335,397 370,368 335,397Banks and non-bank financial institutions 610,921 557,732 609,135 555,965Other enterprises 165,815 157,831 163,096 155,394
Gross balances 2,225,135 2,105,059 2,219,732 2,100,202
Allowances for impairment losses (Note 33) (4,551) (4,521) (4,495) (4,461)
Net balances 2,220,584 2,100,538 2,215,237 2,095,741
Listed (1) 2,206,871 2,087,353 2,204,156 2,084,990 – of which in Hong Kong 246 240 246 240Unlisted 13,713 13,185 11,081 10,751
Total 2,220,584 2,100,538 2,215,237 2,095,741
Market value of listed securities 2,178,782 1,985,172 2,176,055 1,982,856
(1) Debt securities traded on the China Domestic Interbank Bond Market are included in the Listed category.
23 Debt securities classified as receivablesGroup Bank
Note 30 June 2014 31 December 2013 30 June 2014 31 December 2013
Government – Special government bond (1) 49,200 49,200 49,200 49,200 – Others 840 768 840 530Banks and non-bank financial institutions 84,998 85,206 79,063 82,494China Cinda Assets Management Co., Ltd. (“Cinda”) (2) 18,852 18,852 18,852 18,852Other enterprises 38,992 36,495 30,070 31,949
Gross balances 192,882 190,521 178,025 183,025
Allowance for impairment losses (Note 33) (868) (784) (857) (773)
Net balances 192,014 189,737 177,168 182,252
Listed outside Hong Kong (3) 52,068 52,599 52,068 52,361Unlisted 139,946 137,138 125,100 129,891
Total 192,014 189,737 177,168 182,252
(1) This represents a non-negotiable bond with a nominal value of RMB49,200 million issued by the Ministry of Finance (“MOF”) in 1998 to strengthen the capital base of CCB. The bond matures in 2028 and bears a fixed interest rate of 2.25% per annum. The PBOC approved the Bank’s use of the special government bond as eligible assets equivalent to the surplus deposit reserve at PBOC for clearing purpose.
(2) China Cinda Assets Management Co., Ltd. (formerly known as China Cinda Asset Management Corporation) (“Cinda”) issued a bond (“Cinda Bond”) with a nominal value of RMB247 billion specifically to CCB in 1999 with a fixed coupon rate of 2.25%. Cinda Bond has been extended for 10 years upon its expiry and the interest rate remained unchanged from 2009. Cinda has already repaid RMB228.2 billion of the principal amount of the bond as at 30 June 2014.
(3) Debt securities traded on the China Domestic Interbank Bond Market are included in the Listed outside Hong Kong category.
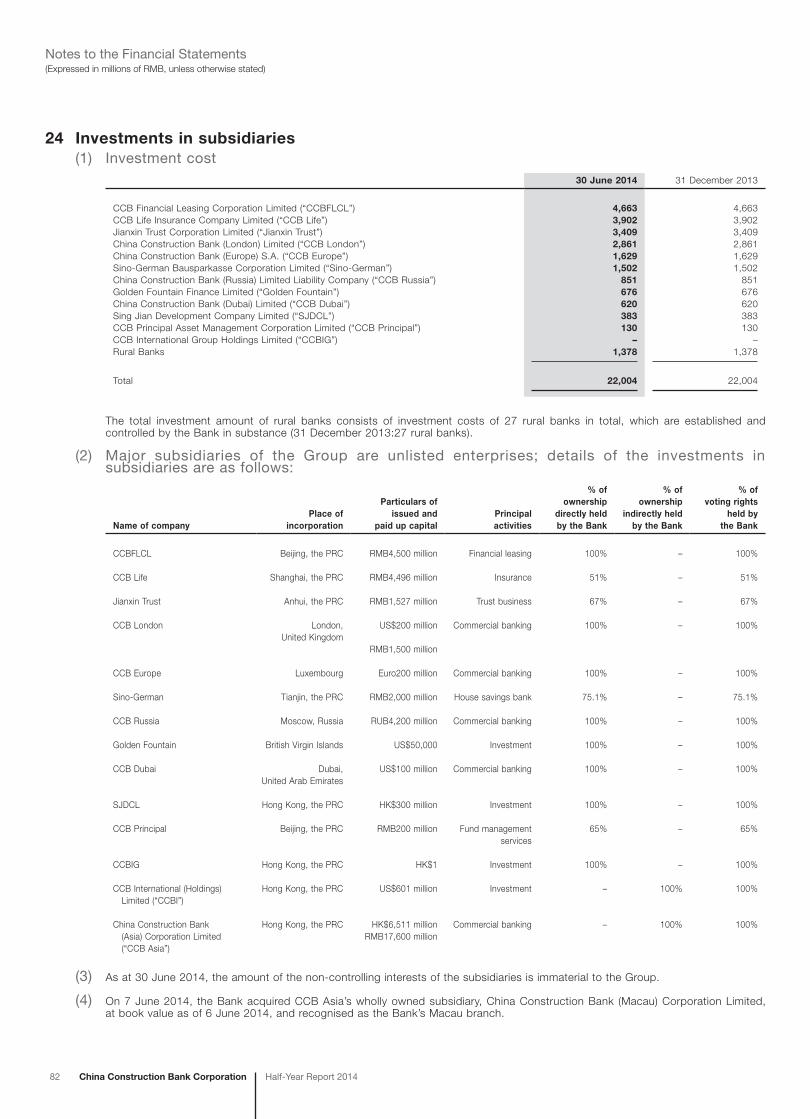
82 China Construction Bank Corporation Half-Year Report 2014
(Expressed in millions of RMB, unless otherwise stated)Notes to the Financial Statements
24 Investments in subsidiaries(1) Investment cost
30 June 2014 31 December 2013
CCB Financial Leasing Corporation Limited (“CCBFLCL”) 4,663 4,663CCB Life Insurance Company Limited (“CCB Life”) 3,902 3,902Jianxin Trust Corporation Limited (“Jianxin Trust”) 3,409 3,409China Construction Bank (London) Limited (“CCB London”) 2,861 2,861China Construction Bank (Europe) S.A. (“CCB Europe”) 1,629 1,629Sino-German Bausparkasse Corporation Limited (“Sino-German”) 1,502 1,502China Construction Bank (Russia) Limited Liability Company (“CCB Russia”) 851 851Golden Fountain Finance Limited (“Golden Fountain”) 676 676China Construction Bank (Dubai) Limited (“CCB Dubai”) 620 620Sing Jian Development Company Limited (“SJDCL”) 383 383CCB Principal Asset Management Corporation Limited (“CCB Principal”) 130 130CCB International Group Holdings Limited (“CCBIG”) – –Rural Banks 1,378 1,378
Total 22,004 22,004
The total investment amount of rural banks consists of investment costs of 27 rural banks in total, which are established and controlled by the Bank in substance (31 December 2013:27 rural banks).
(2) Major subsidiaries of the Group are unlisted enterprises; details of the investments in subsidiaries are as follows:
Name of companyPlace of
incorporation
Particulars of issued and
paid up capitalPrincipal activities
% of ownership
directly held by the Bank
% of ownership
indirectly held by the Bank
% of voting rights
held by the Bank
CCBFLCL Beijing, the PRC RMB4,500 million Financial leasing 100% – 100%
CCB Life Shanghai, the PRC RMB4,496 million Insurance 51% – 51%
Jianxin Trust Anhui, the PRC RMB1,527 million Trust business 67% – 67%
CCB London London, United Kingdom
US$200 million Commercial banking 100% – 100%
RMB1,500 million
CCB Europe Luxembourg Euro200 million Commercial banking 100% – 100%
Sino-German Tianjin, the PRC RMB2,000 million House savings bank 75.1% – 75.1%
CCB Russia Moscow, Russia RUB4,200 million Commercial banking 100% – 100%
Golden Fountain British Virgin Islands US$50,000 Investment 100% – 100%
CCB Dubai Dubai, United Arab Emirates
US$100 million Commercial banking 100% – 100%
SJDCL Hong Kong, the PRC HK$300 million Investment 100% – 100%
CCB Principal Beijing, the PRC RMB200 million Fund management services
65% – 65%
CCBIG Hong Kong, the PRC HK$1 Investment 100% – 100%
CCB International (Holdings) Limited (“CCBI”)
Hong Kong, the PRC US$601 million Investment – 100% 100%
China Construction Bank (Asia) Corporation Limited (“CCB Asia”)
Hong Kong, the PRC HK$6,511 millionRMB17,600 million
Commercial banking – 100% 100%
(3) As at 30 June 2014, the amount of the non-controlling interests of the subsidiaries is immaterial to the Group.
(4) On 7 June 2014, the Bank acquired CCB Asia’s wholly owned subsidiary, China Construction Bank (Macau) Corporation Limited, at book value as of 6 June 2014, and recognised as the Bank’s Macau branch.

China Construction Bank CorporationHalf-Year Report 2014 83
(Expressed in millions of RMB, unless otherwise stated)Notes to the Financial Statements
25 Interests in associates and joint ventures(1) The movement of the Group’s interests in associates and joint ventures is as follows:
Six months ended 30 June 2014 2013
As at 1 January 2,624 2,366Acquisition during the period/year 106 304Disposal during the period/year (26) (27)Share of profits less losses 50 60Cash dividend receivable (6) (10)Effect of exchange difference and others 59 (69)
As at 30 June/31 December 2,807 2,624
(2) Details of the interests in major associates and joint ventures are as follows:
Name of CompanyPlace of
incorporation
Particulars of issued and
paid up capitalPrincipal activities
% of ownership
held
% of voting
held
Total assets at year end
Total liabilities
at year end
Revenue for the
year
Net profit for the
year
QBE Hong Kong and Shanghai Insurance Limited
Hong Kong, the PRC
HK$78,192,220 Insurance 25.50% 25.50% 2,328 1,636 464 43
Diamond String Limited
Hong Kong, the PRC
HK$10,000 Property investment
50.00% 50.00% 1,662 1,621 90 33
CCBT Private Equity Fund
Beijing, the PRC
RMB565 million Investment management
and consultancy
45.70% 50.00% 543 20 – (8)
Shandong Peninsula Ocean Blue Economic Investment Company Limited
Cayman Islands US$110 million Investment Holding
27.18% 27.18% 789 10 21 14
CCBT Fortune Private Equity Fund
Beijing, the PRC
RMB430 million Investment management
and consultancy
32.83% 33.33% 485 37 29 20

84 China Construction Bank Corporation Half-Year Report 2014
(Expressed in millions of RMB, unless otherwise stated)Notes to the Financial Statements
26 Interests in unconsolidated structured entitiesUnconsolidated structured entities of the Group include trust investment, fund investment, asset-backed securities and wealth management products held for investment purpose, as well as non-principal guaranteed wealth management products, trust scheme and fund, etc. which were issued or established for providing a wide range of wealth management services and collecting management fees, handling fees and custodian fees.
As at 30 June 2014, the assets recognised for the Group’s interests in the unconsolidated structured entities above included related investment and management fee, handling fee and custodian fee receivables accrued. The related carrying amount and the maximum exposure were as follows:
30 June 2014 31 December 2013
Financial assets at fair value through profit or loss 1,531 880Interest receivables 58 66Available-for-sale financial assets 8,567 6,498Held-to-maturity investments 2,361 2,549Debt securities classified as receivables 16,135 7,247Interest in associates and joint ventures 1,059 1,026Other assets 2,528 1,893
Total 32,239 20,159
For the six months ended 30 June 2014 and 2013, the income from these unconsolidated structured entities held by the Group was as follows:
Six months ended 30 June
2014 2013
Interest income 696 150Fee and commission income 4,222 5,092Net trading gain 1 –Dividend income 189 116Net gain arising from investment securities 100 32Share of profits less losses of associates and joint ventures 19 14
Total 5,227 5,404
For the six months ended 30 June 2014, there was no related loss from these unconsolidated structured entities held by the Group.
As at 30 June 2014, the size of the non-principal guaranteed wealth management products set up by the Group amounted to RMB659,329 million(As at 31 December 2013: RMB718,829 million).
As at 30 June 2014, there was no plan of providing financial or other support by the Group to these unconsolidated structured entities.

China Construction Bank CorporationHalf-Year Report 2014 85
(Expressed in millions of RMB, unless otherwise stated)Notes to the Financial Statements
27 Fixed assetsGroup
Bank premisesConstruction
in progress Equipment Others Total
Cost/Deemed costAs at 1 January 2014 89,877 28,425 42,444 36,857 197,603Additions 2,088 4,857 1,671 1,068 9,684Transfer in/(out) 2,782 (3,615) 21 812 –Disposals (48) (360) (703) (673) (1,784)
As at 30 June 2014 94,699 29,307 43,433 38,064 205,503
Accumulated depreciationAs at 1 January 2014 (19,188) – (25,058) (17,191) (61,437)Charge for the period (1,653) – (3,053) (2,652) (7,358)Disposals 26 – 678 671 1,375
As at 30 June 2014 (20,815) – (27,433) (19,172) (67,420)
Allowances for impairment losses (Note 33)As at 1 January 2014 (425) – (1) (62) (488)
As at 30 June 2014 (425) – (1) (62) (488)
Net carrying valueAs at 1 January 2014 70,264 28,425 17,385 19,604 135,678
As at 30 June 2014 73,459 29,307 15,999 18,830 137,595
Bank premisesConstruction
in progress Equipment Others Total
Cost/Deemed costAs at 1 January 2013 79,525 22,891 35,985 27,752 166,153Additions 3,713 15,390 8,436 8,852 36,391Transfer in/(out) 6,970 (8,830) 81 1,779 –Disposals (331) (1,026) (2,058) (1,526) (4,941)
As at 31 December 2013 89,877 28,425 42,444 36,857 197,603
Accumulated depreciationAs at 1 January 2013 (16,296) – (21,842) (13,631) (51,769)Charge for the year (2,976) – (5,192) (4,859) (13,027)Disposals 84 – 1,976 1,299 3,359
As at 31 December 2013 (19,188) – (25,058) (17,191) (61,437)
Allowances for impairment losses (Note 33)As at 1 January 2013 (427) – (1) (10) (438)Charge for the year – – – (58) (58)Disposals 2 – – 6 8
As at 31 December 2013 (425) – (1) (62) (488)
Net carrying valueAs at 1 January 2013 62,802 22,891 14,142 14,111 113,946
As at 31 December 2013 70,264 28,425 17,385 19,604 135,678

86 China Construction Bank Corporation Half-Year Report 2014
(Expressed in millions of RMB, unless otherwise stated)Notes to the Financial Statements
27 Fixed assets (continued)
Bank
Bank premisesConstruction
in progress Equipment Others Total
Cost/Deemed costAs at 1 January 2014 86,581 28,260 41,965 31,954 188,760Additions 1,185 4,847 1,605 761 8,398Additions through acquisitions 10 – 2 30 42Transfer in/(out) 2,782 (3,615) 21 812 –Disposals (37) (356) (700) (673) (1,766)
As at 30 June 2014 90,521 29,136 42,893 32,884 195,434
Accumulated depreciationAs at 1 January 2014 (18,952) – (24,724) (16,845) (60,521)Charge for the period (1,604) – (3,018) (2,505) (7,127)Additions through acquisitions (4) – (2) (27) (33)Disposals 26 – 678 671 1,375
As at 30 June 2014 (20,534) – (27,066) (18,706) (66,306)
Allowances for impairment losses (Note 33)As at 1 January 2014 (425) – (1) (3) (429)
As at 30 June 2014 (425) – (1) (3) (429)
Net carrying valueAs at 1 January 2014 67,204 28,260 17,240 15,106 127,810
As at 30 June 2014 69,562 29,136 15,826 14,175 128,699
Bank premisesConstruction
in progress Equipment Others Total
Cost/Deemed costAs at 1 January 2013 76,226 22,819 35,574 27,242 161,861Additions 3,655 15,265 8,341 4,333 31,594Transfer in/(out) 6,952 (8,810) 81 1,777 –Disposals (252) (1,014) (2,031) (1,398) (4,695)
As at 31 December 2013 86,581 28,260 41,965 31,954 188,760
Accumulated depreciationAs at 1 January 2013 (16,150) – (21,555) (13,381) (51,086)Charge for the year (2,882) – (5,129) (4,788) (12,799)Disposals 80 – 1,960 1,324 3,364
As at 31 December 2013 (18,952) – (24,724) (16,845) (60,521)
Allowances for impairment losses (Note 33)As at 1 January 2013 (427) – (1) (4) (432)Disposals 2 – – 1 3
As at 31 December 2013 (425) – (1) (3) (429)
Net carrying valueAs at 1 January 2013 59,649 22,819 14,018 13,857 110,343
As at 31 December 2013 67,204 28,260 17,240 15,106 127,810

China Construction Bank CorporationHalf-Year Report 2014 87
(Expressed in millions of RMB, unless otherwise stated)Notes to the Financial Statements
27 Fixed assets (continued)Notes:
(1) As at 30 June 2014, the ownership documentation for the Group’s and the Bank’s bank premises with a net carrying value of RMB18,151 million (31 December 2013: RMB18,179 million) was still being finalised. However, management is of the view that the aforesaid matter would not affect the rights of the Group and the Bank to these assets nor have any significant impact on the business operation of the Group and the Bank.
(2) Analysed by remaining terms of the leases
The net carrying values of bank premises of the Group and the Bank as at the end of the reporting period are analysed by the remaining terms of the leases as follows:
Group Bank
30 June 2014 31 December 2013 30 June 2014 31 December 2013
Long term leases (over 50 years) held overseas 1,490 651 6 –Medium term leases (10-50 years) held overseas 2,141 1,944 255 77Short term leases (less than 10 years) held overseas 12 13 12 13Long term leases (over 50 years) held in Mainland China 4,166 4,046 4,165 4,046Medium term leases (10-50 years) held in Mainland China 63,307 60,907 62,812 60,365Short term leases (less than 10 years) held in Mainland China 2,343 2,703 2,312 2,703
Total 73,459 70,264 69,562 67,204
28 Land use rightsGroup
Six months ended 30 June 2014 2013
Cost/Deemed costAs at 1 January 20,752 20,758Additions 411 70Disposals (15) (76)
As at 30 June/31 December 21,148 20,752
AmortisationAs at 1 January (4,879) (4,384)Charge for the period/year (256) (513)Disposals 3 18
As at 30 June/31 December (5,132) (4,879)
Allowances for impairment losses (Note 33)As at 1 January (142) (142)
As at 30 June/31 December (142) (142)
Net carrying valueAs at 1 January 15,731 16,232
As at 30 June/31 December 15,874 15,731

88 China Construction Bank Corporation Half-Year Report 2014
(Expressed in millions of RMB, unless otherwise stated)Notes to the Financial Statements
28 Land use rights (continued)
BankSix months ended
30 June 2014 2013
Cost/Deemed costAs at 1 January 20,684 20,688Additions 41 70Disposals (15) (74)
As at 30 June/31 December 20,710 20,684
AmortisationAs at 1 January (4,860) (4,365)Charge for the period/year (255) (513)Disposals 3 18
As at 30 June/31 December (5,112) (4,860)
Allowances for impairment losses (Note 33)As at 1 January (142) (142)
As at 30 June/31 December (142) (142)
Net carrying valueAs at 1 January 15,682 16,181
As at 30 June/31 December 15,456 15,682
29 Intangible assetsGroup
Software Others Total
Cost/Deemed costAs at 1 January 2014 5,583 602 6,185Additions 155 23 178Disposals (29) – (29)
As at 30 June 2014 5,709 625 6,334
AmortisationAs at 1 January 2014 (3,981) (143) (4,124)Charge for the period (277) (36) (313)Disposals 6 – 6
As at 30 June 2014 (4,252) (179) (4,431)
Allowances for impairment losses (Note 33)As at 1 January 2014 (1) (7) (8)
As at 30 June 2014 (1) (7) (8)
Net carrying valueAs at 1 January 2014 1,601 452 2,053
As at 30 June 2014 1,456 439 1,895

China Construction Bank CorporationHalf-Year Report 2014 89
(Expressed in millions of RMB, unless otherwise stated)Notes to the Financial Statements
29 Intangible assets (continued)
Group (continued)Software Others Total
Cost/Deemed costAs at 1 January 2013 5,098 545 5,643Additions 575 73 648Disposals (90) (16) (106)
As at 31 December 2013 5,583 602 6,185
AmortisationAs at 1 January 2013 (3,483) (91) (3,574)Charge for the year (539) (67) (606)Disposals 41 15 56
As at 31 December 2013 (3,981) (143) (4,124)
Allowances for impairment losses (Note 33)As at 1 January 2013 (1) (7) (8)
As at 31 December 2013 (1) (7) (8)
Net carrying valueAs at 1 January 2013 1,614 447 2,061
As at 31 December 2013 1,601 452 2,053
BankSoftware Others Total
Cost/Deemed costAs at 1 January 2014 5,371 163 5,534Additions 135 23 158Disposals (29) – (29)
As at 30 June 2014 5,477 186 5,663
AmortisationAs at 1 January 2014 (3,878) (99) (3,977)Charge for the period (260) (27) (287)Disposals 6 – 6
As at 30 June 2014 (4,132) (126) (4,258)
Allowances for impairment losses (Note 33)As at 1 January 2014 (1) (7) (8)
As at 30 June 2014 (1) (7) (8)
Net carrying valueAs at 1 January 2014 1,492 57 1,549
As at 30 June 2014 1,344 53 1,397

90 China Construction Bank Corporation Half-Year Report 2014
(Expressed in millions of RMB, unless otherwise stated)Notes to the Financial Statements
29 Intangible assets (continued)
Bank (continued)Software Others Total
Cost/Deemed costAs at 1 January 2013 4,933 108 5,041Additions 527 71 598Disposals (89) (16) (105)
As at 31 December 2013 5,371 163 5,534
AmortisationAs at 1 January 2013 (3,403) (66) (3,469)Charge for the year (515) (48) (563)Disposals 40 15 55
As at 31 December 2013 (3,878) (99) (3,977)
Allowances for impairment losses (Note 33)As at 1 January 2013 (1) (7) (8)
As at 31 December 2013 (1) (7) (8)
Net carrying valueAs at 1 January 2013 1,529 35 1,564
As at 31 December 2013 1,492 57 1,549
30 Goodwill(1) The goodwill is attributable to the expected synergies arising from the acquisition of CCB Asia on 29 December 2006, Jianxin Trust
on 29 July 2009, CCB Life on 29 June 2011 and CCB Futures Co., Ltd by Jianxin Trust on 9 April 2014. Movement of the goodwill is as follows:
Six month ended 30 June 2014 2013
As at 1 January 1,610 1,651Additions through acquisitions 10 –Effect of exchange difference 35 (41)
As at 30 June/31 December 1,655 1,610
(2) Impairment test for CGU containing goodwillThe Group calculated the recoverable amount of the CGU using cash flow projections based on financial forecasts approved by management. The average growth rate used by the Group is consistent with the forecasts included in industry reports. The discount rate used reflects specific risks relating to the relevant segments.
Based on the result of the impairment test, no impairment losses on goodwill were recognised as at 30 June 2014 (31 December 2013: nil).

China Construction Bank CorporationHalf-Year Report 2014 91
(Expressed in millions of RMB, unless otherwise stated)Notes to the Financial Statements
31 Deferred taxGroup Bank
30 June 2014 31 December 2013 30 June 2014 31 December 2013
Deferred tax assets 31,245 38,448 32,144 39,093Deferred tax liabilities (145) (138) (10) –
Total 31,100 38,310 32,134 39,093
(1) Analysed by natureGroup
30 June 2014 31 December 2013
Deductible/(taxable)
temporary differences
Deferred tax assets/(liabilities)
Deductible/(taxable)
temporary differences
Deferred tax assets/
(liabilities)
Deferred tax assets – Fair value adjustments 4,942 1,280 24,698 6,168 – Allowances for impairment losses 119,930 29,924 121,540 30,329 – Early retirement benefits and accrued salaries 22,575 5,644 25,463 6,366 – Others (21,439) (5,603) (16,781) (4,415)
Total 126,008 31,245 154,920 38,448
Deferred tax liabilities – Fair value adjustments (447) (111) (569) (129) – Others (152) (34) (36) (9)
Total (599) (145) (605) (138)
Bank30 June 2014 31 December 2013
Deductible/(taxable)
temporary differences
Deferred tax assets/(liabilities)
Deductible/(taxable)
temporary differences
Deferred tax assets/
(liabilities)
Deferred tax assets – Fair value adjustments 5,254 1,345 24,887 6,212 – Allowances for impairment losses 119,050 29,737 120,714 30,151 – Early retirement benefits and accrued salaries 22,454 5,613 25,317 6,329 – Others (12,913) (4,551) (10,217) (3,599)
Total 133,845 32,144 160,701 39,093
Deferred tax liabilities – Others (28) (10) – –
Total (28) (10) – –

92 China Construction Bank Corporation Half-Year Report 2014
(Expressed in millions of RMB, unless otherwise stated)Notes to the Financial Statements
31 Deferred tax (continued)
(2) Movements of deferred taxGroup
Fair value adjustments
Allowances for impairment
losses
Early retirement
benefits and accrued
salaries Others Total
As at 1 January 2014 6,039 30,329 6,366 (4,424) 38,310Recognised in profit or loss 98 (405) (722) (1,213) (2,242)Recognised in other comprehensive income (4,968) – – – (4,968)
As at 30 June 2014 1,169 29,924 5,644 (5,637) 31,100
As at 1 January 2013 (1,785) 26,212 6,321 (4,029) 26,719Recognised in profit or loss 252 4,117 45 (395) 4,019Recognised in other comprehensive income 7,572 – – – 7,572
As at 31 December 2013 6,039 30,329 6,366 (4,424) 38,310
Bank
Fair value adjustments
Allowances for impairment
losses
Early retirement
benefits and accrued
salaries Others Total
As at 1 January 2014 6,212 30,151 6,329 (3,599) 39,093Recognised in profit or loss 89 (414) (716) (962) (2,003)Recognised in other comprehensive income (4,956) – – – (4,956)
As at 30 June 2014 1,345 29,737 5,613 (4,561) 32,134
As at 1 January 2013 (1,487) 26,093 6,267 (3,356) 27,517Recognised in profit or loss 240 4,058 62 (243) 4,117Recognised in other comprehensive income 7,459 – – – 7,459
As at 31 December 2013 6,212 30,151 6,329 (3,599) 39,093
The Group and the Bank did not have significant unrecognised deferred tax as at the end of the reporting period.

China Construction Bank CorporationHalf-Year Report 2014 93
(Expressed in millions of RMB, unless otherwise stated)Notes to the Financial Statements
32 Other assetsGroup Bank
Note 30 June 2014 31 December 2013 30 June 2014 31 December 2013
Repossessed assets (1) – Buildings 1,344 1,287 1,344 1,287 – Land use rights 311 312 311 312 – Others 92 89 90 87
1,747 1,688 1,745 1,686
Long-term deferred expenses 663 662 600 591Receivables from CCBIG (2) – – 36,180 35,717Other receivables 41,563 23,530 33,999 20,002Leasehold improvements 2,712 2,792 2,675 2,765
Gross balance 46,685 28,672 75,199 60,761
Allowances for impairment losses (Note 33) – Repossessed assets (254) (261) (253) (260) – Others (2,970) (2,400) (2,680) (2,084)
Total 43,461 26,011 72,266 58,417
(1) During the six months ended 30 June 2014, the original cost of repossessed assets disposed of by the Group amounted to RMB132 million (for the six months ended 30 June 2013: RMB288 million). The Group intends to dispose of repossessed assets through various methods including auction, competitive bidding and disposal.
(2) Receivables from CCBIG represent lending to CCBIG, a wholly owned subsidiary, for acquisition of equity investments and capital injection to other subsidiaries. The receivables are unsecured, non-interest bearing and without fixed repayment term.
33 Movements of allowances for impairment lossesGroup
Six months ended 30 June 2014
Note As at 1 January Charge Transfer in/(out) Write-offs As at 30 June
Deposits with banks and non-bank financial institutions 14 7 – – – 7Placements with banks and non-bank financial institutions 15 27 – – – 27Interest receivable 19 1 – – – 1Loans and advances to customers 20(3) 228,696 21,286 (2,861) (9,031) 238,090Available for sale debt securities 2,743 22 84 (852) 1,997Available for sale equity instrument 4,297 – 8 (42) 4,263Held-to-maturity investments 22 4,521 320 53 (343) 4,551Debt securities classified as receivables 23 784 84 – – 868Fixed assets 27 488 – – – 488Land use rights 28 142 – – – 142Intangible assets 29 8 – – – 8Other assets 32 2,661 652 – (89) 3,224
Total 244,375 22,364 (2,716) (10,357) 253,666

94 China Construction Bank Corporation Half-Year Report 2014
(Expressed in millions of RMB, unless otherwise stated)Notes to the Financial Statements
33 Movements of allowances for impairment losses (continued)
Group (continued)2013
Note As at 1 JanuaryCharge/
(Write-back) Transfer out Write-offs As at 31 December
Deposits with banks and non-bank financial institutions 14 7 – – – 7Placements with banks and non-bank financial institutions 15 49 (7) – (15) 27Interest receivable 19 1 – – – 1Loans and advances to customers 20(3) 202,433 42,666 (4,535) (11,868) 228,696Available for sale debt securities 4,398 (1,144) (71) (440) 2,743Available for sale equity instrument 4,882 195 (23) (757) 4,297Held-to-maturity investments 22 4,078 1,056 (63) (550) 4,521Debt securities classified as receivables 23 1,021 (237) – – 784Fixed assets 27 438 58 – (8) 488Land use rights 28 142 – – – 142Intangible assets 29 8 – – – 8Other assets 32 2,490 418 – (247) 2,661
Total 219,947 43,005 (4,692) (13,885) 244,375
BankSix months ended 30 June 2014
Note As at 1 January Charge Transfer in/(out) Write-offs As at 30 June
Deposits with banks and non-bank financial institutions 14 4 – – – 4Placements with banks and non-bank financial institutions 15 27 – – – 27Interest receivable 19 1 – – – 1Loans and advances to customers 20(3) 226,705 20,832 (2,842) (8,960) 235,735Available for sale debt securities 2,678 9 101 (852) 1,936Available for sale equity instrument 4,228 – 4 (41) 4,191Held-to-maturity investments 22 4,461 325 52 (343) 4,495Debt securities classified as receivables 23 773 84 – – 857Fixed assets 27 429 – – – 429Land use rights 28 142 – – – 142Intangible assets 29 8 – – – 8Other assets 32 2,344 687 – (98) 2,933
Total 241,800 21,937 (2,685) (10,294) 250,758
2013
Note As at 1 JanuaryCharge/
(Write-back) Transfer in/(out) Write-offs As at 31 December
Deposits with banks and non-bank financial institutions 14 7 (3) – – 4Placements with banks and non-bank financial institutions 15 49 (7) – (15) 27Interest receivable 19 1 – – – 1Loans and advances to customers 20(3) 201,087 41,959 (4,600) (11,741) 226,705Available for sale debt securities 4,367 (1,151) (98) (440) 2,678Available for sale equity instrument 4,821 136 5 (734) 4,228Held-to-maturity investments 22 4,078 995 (62) (550) 4,461Debt securities classified as receivables 23 1,021 (248) – – 773Fixed assets 27 432 – – (3) 429Land use rights 28 142 – – – 142Intangible assets 29 8 – – – 8Other assets 32 2,324 267 – (247) 2,344
Total 218,337 41,948 (4,755) (13,730) 241,800
Transfer in/(out) includes exchange differences.

China Construction Bank CorporationHalf-Year Report 2014 95
(Expressed in millions of RMB, unless otherwise stated)Notes to the Financial Statements
34 Amounts due from/to subsidiariesAmounts due from subsidiaries of the Bank are analysed by assets category as follows:
30 June 2014 31 December 2013
Deposits with banks and non-bank financial institutions 27,472 20,023Placements with banks and non-bank financial institutions 84,204 106,499Financial assets at fair value through profit or loss 2,000 2,000Interest receivable 261 787Loans and advances to customers 5,828 2,215Available-for-sale financial assets 842 822Other assets 36,838 34,688
Total 157,445 167,034
Amounts due to subsidiaries of the Bank are analysed by liabilities category as follows:
30 June 2014 31 December 2013
Deposits from banks and non-bank financial institutions 15,131 16,333Placements from banks and non-bank financial institutions 25,002 12,506Financial liabilities at fair value through profit or loss – 160Deposits from customers 5,772 5,069Interest payable 255 201Debt securities issued 1,124 –Other liabilities 278 170
Total 47,562 34,439
35 Borrowings from central banksGroup Bank
30 June 2014 31 December 2013 30 June 2014 31 December 2013
Mainland China 526 60,431 4 60,007Overseas 25,691 18,726 25,691 18,726
Total 26,217 79,157 25,695 78,733

96 China Construction Bank Corporation Half-Year Report 2014
(Expressed in millions of RMB, unless otherwise stated)Notes to the Financial Statements
36 Deposits from banks and non-bank financial institutions(1) Analysed by type of counterparties
Group Bank
30 June 2014 31 December 2013 30 June 2014 31 December 2013
Banks 133,253 202,810 142,521 213,447Non-bank financial institutions 662,341 489,285 663,396 491,040
Total 795,594 692,095 805,917 704,487
(2) Analysed by geographical sectorsGroup Bank
30 June 2014 31 December 2013 30 June 2014 31 December 2013
Mainland China 785,360 687,894 786,703 688,032Overseas 10,234 4,201 19,214 16,455
Total 795,594 692,095 805,917 704,487
37 Placements from banks and non-bank financial institutions(1) Analysed by type of counterparties
Group Bank
30 June 2014 31 December 2013 30 June 2014 31 December 2013
Banks 242,754 154,517 193,324 121,601Non-bank financial institutions 16,140 1,400 14,684 878
Total 258,894 155,917 208,008 122,479
(2) Analysed by geographical sectorsGroup Bank
30 June 2014 31 December 2013 30 June 2014 31 December 2013
Mainland China 84,793 38,137 30,624 6,398Overseas 174,101 117,780 177,384 116,081
Total 258,894 155,917 208,008 122,479
38 Financial liabilities at fair value through profit or lossGroup Bank
30 June 2014 31 December 2013 30 June 2014 31 December 2013
Principal guaranteed wealth management product 313,791 337,580 313,791 337,740Financial liabilities related to precious metals 39,533 37,956 39,533 37,956Structured financial instruments 12,112 4,844 9,457 2,035
Total 365,436 380,380 362,781 377,731
The Group’s and the Bank’s financial liabilities at fair value through profit or loss are those designated at fair value through profit or loss. As at the end of reporting period, the difference between the fair value of these financial liabilities and the contractual payables at maturity is not material. The amounts of changes in the fair value of these financial liabilities that are attributable to changes in credit risk are considered not significant during the period and year presented and cumulatively as at 30 June 2014 and 31 December 2013.

China Construction Bank CorporationHalf-Year Report 2014 97
(Expressed in millions of RMB, unless otherwise stated)Notes to the Financial Statements
39 Financial assets sold under repurchase agreementsFinancial assets sold under repurchase agreements by underlying assets are shown as follows:
Group Bank
30 June 2014 31 December 2013 30 June 2014 31 December 2013
Securities – Government bonds 2,648 48,773 – 42,405 – Debt securities issued by banks and non-bank financial institutions – 12,492 – 12,492
Subtotal 2,648 61,265 – 54,897
Discounted bills 417 608 373 560
Total 3,065 61,873 373 55,457
40 Deposits from customersGroup Bank
30 June 2014 31 December 2013 30 June 2014 31 December 2013
Demand deposits – Corporate customers 4,020,918 4,167,686 4,007,734 4,154,705 – Personal customers 2,651,648 2,525,115 2,636,624 2,510,530
Subtotal 6,672,566 6,692,801 6,644,358 6,665,235
Time deposits (including call deposits) – Corporate customers 2,976,517 2,457,076 2,890,073 2,386,417 – Personal customers 3,307,873 3,073,160 3,232,311 3,004,125
Subtotal 6,284,390 5,530,236 6,122,384 5,390,542
Total 12,956,956 12,223,037 12,766,742 12,055,777
Deposits from customers include:
Group Bank
30 June 2014 31 December 2013 30 June 2014 31 December 2013
(1) Pledged deposits – Deposits for acceptance 169,081 129,392 168,932 129,248 – Deposits for letter of credit 59,432 55,018 59,432 55,018 – Deposits for guarantee 37,480 36,308 37,480 36,308 – Others 282,891 199,256 284,305 201,426
Total 548,884 419,974 550,149 422,000
(2) Outward remittance and remittance payables 18,662 11,908 18,519 11,725

98 China Construction Bank Corporation Half-Year Report 2014
(Expressed in millions of RMB, unless otherwise stated)Notes to the Financial Statements
41 Accrued staff costsGroup
Six months ended 30 June 2014
Note As at 1 January Increased Decreased As at 30 June
Salaries, bonuses, allowances and subsidies 25,189 25,718 (28,330) 22,577Defined contribution retirement schemes 737 5,360 (5,493) 604Other social insurance and welfare 2,262 4,020 (3,755) 2,527Housing funds 148 2,794 (2,754) 188Union running costs and employee education costs 1,533 1,062 (620) 1,975Supplementary retirement benefits (1) 609 161 – 770Early retirement benefits 3,596 67 (457) 3,206Compensation to employees for termination of employment relationship 6 3 (4) 5
Total 34,080 39,185 (41,413) 31,852
2013
Note As at 1 January Increased Decreased As at 31 December
Salaries, bonuses, allowances and subsidies 23,488 58,154 (56,453) 25,189Defined contribution retirement schemes 606 11,552 (11,421) 737Other social insurance and welfare 1,975 8,853 (8,566) 2,262Housing funds 134 5,433 (5,419) 148Union running costs and employee education costs 1,269 2,391 (2,127) 1,533Supplementary retirement benefits (1) 699 353 (443) 609Early retirement benefits 4,596 217 (1,217) 3,596Compensation to employees for termination of employment relationship 5 8 (7) 6
Total 32,772 86,961 (85,653) 34,080
BankSix months ended 30 June 2014
Note As at 1 January Increased Decreased As at 30 June
Salaries, bonuses, allowances and subsidies 24,081 24,468 (26,896) 21,653Defined contribution retirement schemes 733 5,254 (5,387) 600Other social insurance and welfare 2,250 3,947 (3,689) 2,508Housing funds 148 2,762 (2,724) 186Union running costs and employee education costs 1,515 1,045 (611) 1,949Supplementary retirement benefits (1) 609 161 – 770Early retirement benefits 3,596 67 (457) 3,206Compensation to employees for termination of employment relationship 6 3 (4) 5
Total 32,938 37,707 (39,768) 30,877
2013
Note As at 1 January Increased Decreased As at 31 December
Salaries, bonuses, allowances and subsidies 22,728 55,694 (54,341) 24,081Defined contribution retirement schemes 603 11,376 (11,246) 733Other social insurance and welfare 1,866 8,693 (8,309) 2,250Housing funds 133 5,377 (5,362) 148Union running costs and employee education costs 1,256 2,358 (2,099) 1,515Supplementary retirement benefits (1) 699 353 (443) 609Early retirement benefits 4,596 217 (1,217) 3,596Compensation to employees for termination of employment relationship 5 8 (7) 6
Total 31,886 84,076 (83,024) 32,938

China Construction Bank CorporationHalf-Year Report 2014 99
(Expressed in millions of RMB, unless otherwise stated)Notes to the Financial Statements
41 Accrued staff costs (continued)
(1) Supplementary retirement benefitsThe Group’s obligations in respect of the supplementary retirement benefits as at the end of the reporting period were calculated using the projected unit credit actuarial cost method and reviewed by qualified staff (a member of Society of Actuaries of the United States of America) of an external independent actuary: Towers, Perrin, Forster & Crosby, Inc., Hong Kong.
(a) Breakdowns of supplementary retirement benefits obligations of the Group and the Bank are as follows:30 June 2014 31 December 2013
Fair value of plan assets 5,747 5,825Supplementary retirement benefits obligations 770 609
Present value of supplementary retirement benefit obligations 6,517 6,434
(b) Movements of supplementary retirement benefits of the Group and the Bank are as follows:(i) Movements of fair value of plan assets of the Group and the Bank are as follows:
Six months ended 30 June 2014 2013
As at 1 January 5,825 6,370
Interest income 138 219Remeasurements – Return on plan assets, excluding amounts included in interest income 117 (103)Benefit payments from plan assets (333) (661)
As at 30 June/31 December 5,747 5,825
(ii) Movements of present value of supplementary retirement benefit obligations of the Group and the Bank are as follows:
Six months ended 30 June 2014 2013
As at 1 January 6,434 7,069
Payments made (333) (661)Expenses recognised in profit or loss – Interest cost 145 233 – Past service costs – 339Remeasurements – Actuarial losses/(gains) 271 (546)
As at 30 June/31 December 6,517 6,434
Interest cost was recognised in other general and administrative expenses. Past service costs were recognised in staff costs.
(c) Principal actuarial assumptions of the Group and the Bank as at the balance sheet date are as follows:30 June 2014 31 December 2013
Discount rate 4.25% 4.75%Health care cost increase rate 7.00% 7.00%Average expected future lifetime of eligible employees 12.3 years 12.6 years
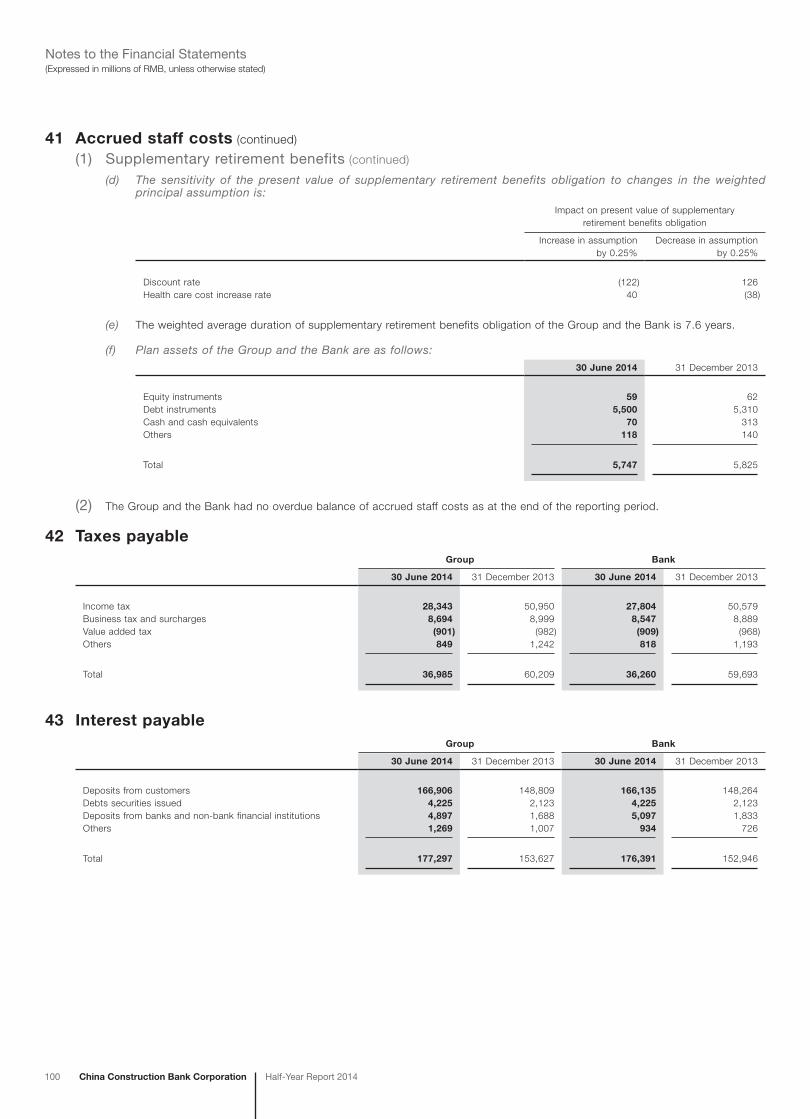
100 China Construction Bank Corporation Half-Year Report 2014
(Expressed in millions of RMB, unless otherwise stated)Notes to the Financial Statements
41 Accrued staff costs (continued)
(1) Supplementary retirement benefits (continued)
(d) The sensitivity of the present value of supplementary retirement benefits obligation to changes in the weighted principal assumption is:
Impact on present value of supplementary retirement benefits obligation
Increase in assumption by 0.25%
Decrease in assumption by 0.25%
Discount rate (122) 126Health care cost increase rate 40 (38)
(e) The weighted average duration of supplementary retirement benefits obligation of the Group and the Bank is 7.6 years.
(f) Plan assets of the Group and the Bank are as follows:30 June 2014 31 December 2013
Equity instruments 59 62Debt instruments 5,500 5,310Cash and cash equivalents 70 313Others 118 140
Total 5,747 5,825
(2) The Group and the Bank had no overdue balance of accrued staff costs as at the end of the reporting period.
42 Taxes payableGroup Bank
30 June 2014 31 December 2013 30 June 2014 31 December 2013
Income tax 28,343 50,950 27,804 50,579Business tax and surcharges 8,694 8,999 8,547 8,889Value added tax (901) (982) (909) (968)Others 849 1,242 818 1,193
Total 36,985 60,209 36,260 59,693
43 Interest payableGroup Bank
30 June 2014 31 December 2013 30 June 2014 31 December 2013
Deposits from customers 166,906 148,809 166,135 148,264Debts securities issued 4,225 2,123 4,225 2,123Deposits from banks and non-bank financial institutions 4,897 1,688 5,097 1,833Others 1,269 1,007 934 726
Total 177,297 153,627 176,391 152,946

China Construction Bank CorporationHalf-Year Report 2014 101
(Expressed in millions of RMB, unless otherwise stated)Notes to the Financial Statements
44 ProvisionsGroup Bank
30 June 2014 31 December 2013 30 June 2014 31 December 2013
Litigation provisions 536 543 536 543Others 5,244 4,471 5,244 4,471
Total 5,780 5,014 5,780 5,014
45 Debt securities issuedGroup Bank
Note 30 June 2014 31 December 2013 30 June 2014 31 December 2013
Certificates of deposit issued (1) 263,389 193,749 227,088 159,553Bonds issued (2) 17,266 3,933 3,997 2,995Subordinated bonds issued (3) 147,869 159,858 147,869 159,858
Total 428,524 357,540 378,954 322,406
(1) Certificates of deposit were mainly issued by head office, overseas branches and CCB Asia.
(2) Bonds issued
Group Bank
Note 30 June 2014 31 December 2013 30 June 2014 31 December 2013
3.20% fixed rate RMB bonds (a) 940 940 – –3.08% fixed rate RMB bonds (b) – 500 – 5003.25% fixed rate RMB bonds (c) 6,500 2,500 2,500 2,5002.375% fixed rate USD bonds (d) 1,861 – – –3.38% fixed rate RMB bonds (e) 1,500 – 1,500 –1.375% fixed rate CHF bonds (f) 2,063 – – –3.45% fixed rate RMB bonds (g) 1,250 – – –3.25% fixed rate USD bonds (h) 2,481 – – –Others 706 – – –
Total nominal value 17,301 3,940 4,000 3,000Less: unamortised issuance costs (35) (7) (3) (5)
Carrying value as at 30 June/31 December 17,266 3,933 3,997 2,995
(a) 3.20% fixed rate RMB bonds were issued in November 2012 in London, and will mature on 29 November 2015.
(b) 3.08% fixed rate RMB bonds were issued in June 2012 in Hong Kong, and matured on 28 June 2014.
(c) 3.25% fixed rate RMB bonds: 500 million were issued in June 2012 in Hong Kong, and will mature on 28 June 2015; 2,000 million were issued in December 2013 in Taiwan, and will mature on 12 December 2016; 4,000 million were issued in March 2014 in Hongkong, and will mature on 13 March 2016.
(d) 2.375% fixed rate USD bonds were issued in April 2014 in Hong Kong, and will mature on 1 April 2017.
(e) 3.38% fixed rate RMB bonds were issued in May 2014 in Frankfurt, and will mature on 30 May 2016.
(f) 1.375% fixed rate CHF bonds were issued in May 2014 in Switzerland, and will mature on 28 May 2019.
(g) 3.45% fixed rate RMB bonds were issued in June 2014 in Switzerland, and will mature on 27 June 2017.
(h) 3.25% fixed rate USD bonds were issued in June 2014 in Hongkong, and will mature on 2 July 2019.

102 China Construction Bank Corporation Half-Year Report 2014
(Expressed in millions of RMB, unless otherwise stated)Notes to the Financial Statements
45 Debt securities issued (continued)(3) Subordinated bonds issued
The carrying value of the Group and the Bank’s subordinated bonds issued upon the approval of the PBOC and the CBRC is as follows:
Group and Bank
Note 30 June 2014 31 December 2013
3.20% subordinated fixed rate bonds maturing in February 2019 (a) – 12,0004.00% subordinated fixed rate bonds maturing in February 2024 (b) 28,000 28,0003.32% subordinated fixed rate bonds maturing in August 2019 (c) 10,000 10,0004.04% subordinated fixed rate bonds maturing in August 2024 (d) 10,000 10,0004.80% subordinated fixed rate bonds maturing in December 2024 (e) 20,000 20,0005.70% subordinated fixed rate bonds maturing in November 2026 (f) 40,000 40,0004.99% subordinated fixed rate bonds maturing in November 2027 (g) 40,000 40,000
Total nominal value 148,000 160,000Less: Unamortised issuance cost (131) (142)
Carrying value as at 30 June/31 December 147,869 159,858
(a) The interest rate per annum on the subordinated fixed rate bonds issued in February 2009 is 3.20%. The Group has an option to redeem the bonds on 26 February 2014. If they are not redeemed by the Group, the interest rate will increase to 6.20% per annum from 26 February 2014 for the next five years. The Group exercised the option to redeem the bonds on 26 February 2014.
(b) The interest rate per annum on the subordinated fixed rate bonds issued in February 2009 is 4.00%. The Group has an option to redeem the bonds on 26 February 2019. If they are not redeemed by the Group, the interest rate will increase to 7.00% per annum from 26 February 2019 for the next five years.
(c) The interest rate per annum on the subordinated fixed rate bonds issued in August 2009 is 3.32%. The Group has an option to redeem the bonds on 11 August 2014. If they are not redeemed by the Group, the interest rate will increase to 6.32% per annum from 11 August 2014 for the next five years.
(d) The interest rate per annum on the subordinated fixed rate bonds issued in August 2009 is 4.04%. The Group has an option to redeem the bonds on 11 August 2019. If they are not redeemed by the Group, the interest rate will increase to 7.04% per annum from 11 August 2019 for the next five years.
(e) The interest rate per annum on the subordinated fixed rate bonds issued in December 2009 is 4.80%. The Group has an option to redeem the bonds on 22 December 2019. If they are not redeemed by the Group, the interest rate will increase to 7.80% per annum from 22 December 2019 for the next five years.
(f) The interest rate per annum on the subordinated fixed rate bonds issued in November 2011 is 5.70%, which will remain fixed in the duration. The Group has an option to redeem the bonds on 7 November 2021, subject to an approval from relevant authority.
(g) The interest rate per annum on the subordinated fixed rate bonds issued in November 2012 is 4.99%, which will remain fixed in the duration. The Group has an option to redeem the bonds on 21 November 2022, subject to an approval from relevant authority.
46 Other liabilitiesGroup Bank
30 June 2014 31 December 2013 30 June 2014 31 December 2013
Dividend payable 75,013 – 75,003 –Insurance reserve of CCB life 23,574 13,097 – –Deferred income 14,361 13,131 14,051 12,872Capital expenditure payable 7,106 8,365 7,104 8,363Dormant accounts 2,727 2,469 2,727 2,469Securities underwriting and redemption payable 1,494 1,226 1,494 1,226Settlement accounts 1,224 784 1,224 784Payment and collection clearance accounts 899 743 878 743Payables to China Jianyin Investment Limited 20 22 20 22Others 27,819 26,105 15,589 13,860
Total 154,237 65,942 118,090 40,339
47 Share capitalGroup and Bank
30 June 2014 31 December 2013
Listed in Hong Kong (H share) 240,417 240,417Listed in Mainland China (A share) 9,594 9,594
Total 250,011 250,011
All H and A shares are ordinary shares, have a par value of RMB1.00 per share and rank pari passu with the same rights and benefits.

China Construction Bank CorporationHalf-Year Report 2014 103
(Expressed in millions of RMB, unless otherwise stated)Notes to the Financial Statements
48 Capital reserveGroup Bank
30 June 2014 31 December 2013 30 June 2014 31 December 2013
Share premium 135,118 135,118 135,109 135,109Cash flow hedge reserve 20 (148) 20 (148)Others 399 553 393 547
Total 135,537 135,523 135,522 135,508
49 Investment revaluation reserveThe changes in fair value of available-for-sale financial assets were recognised in “investment revaluation reserve”. Movements of investment revaluation reserve are as follows:
GroupSix months ended 30 June 2014
Note Before-tax amount Tax benefit/(expense) Net-of-tax amount
As at 1 January (25,837) 6,547 (19,290)
Gains/(losses) during the period – Debt securities 20,867 (5,203) 15,664 – Equity instruments and funds (407) 102 (305)
20,460 (5,101) 15,359
Reclassification adjustments – Impairment 16 (4) 12 – Disposals (733) 183 (550) – Others (1) 1 – 1
(716) 179 (537)
As at 30 June (6,093) 1,625 (4,468)
2013
Note Before-tax amount Tax (expense)/benefit Net-of-tax amount
As at 1 January 4,030 (1,007) 3,023
Losses during the year – Debt securities (26,065) 6,603 (19,462) – Equity instruments and funds (2,217) 554 (1,663)
(28,282) 7,157 (21,125)
Reclassification adjustments – Impairment (1,047) 262 (785) – Disposals (595) 149 (446) – Others (1) 57 (14) 43
(1,585) 397 (1,188)
As at 31 December (25,837) 6,547 (19,290)

104 China Construction Bank Corporation Half-Year Report 2014
(Expressed in millions of RMB, unless otherwise stated)Notes to the Financial Statements
49 Investment revaluation reserve (continued)
BankSix months ended 30 June 2014
Note Before-tax amount Tax benefit/(expense) Net-of-tax amount
As at 1 January (25,740) 6,465 (19,275)
Gains/(losses) during the period – Debt securities 20,638 (5,182) 15,456 – Equity instruments (407) 102 (305)
20,231 (5,080) 15,151
Reclassification adjustments – Impairment 9 (2) 7 – Disposals (503) 126 (377) – Others (1) 1 – 1
(493) 124 (369)
As at 30 June (6,002) 1,509 (4,493)
2013
Note Before-tax amount Tax (expense)/benefit Net-of-tax amount
As at 1 January 4,072 (994) 3,078
Losses during the year – Debt securities (26,323) 6,587 (19,736) – Equity instruments (1,858) 464 (1,394)
(28,181) 7,051 (21,130)
Reclassification adjustments – Impairment (1,113) 278 (835) – Disposals (575) 144 (431) – Others (1) 57 (14) 43
(1,631) 408 (1,223)
As at 31 December (25,740) 6,465 (19,275)
Others refer to the amortisation of accumulated losses previously recognised in revaluation reserve for the period/year. These accumulated losses were related to certain debt securities reclassified from available-for-sale financial assets to held-to-maturity investments in prior period/years.
50 Surplus reserveSurplus reserves consist of statutory surplus reserve fund and discretionary surplus reserve fund.
The Bank is required to allocate 10% of its net profit, as determined under the Accounting Standards for Business Enterprises and other relevant requirements issued by the MOF on 15 February 2006 and since, to the statutory surplus reserve fund until the reserve fund balance reaches 50% of its registered capital. After making appropriations to the statutory surplus reserve fund, the Bank may also allocate its net profit to the discretionary surplus reserve fund upon approval by shareholders in annual general meetings.

China Construction Bank CorporationHalf-Year Report 2014 105
(Expressed in millions of RMB, unless otherwise stated)Notes to the Financial Statements
51 General reserveThe general reserve of the Group and the Bank is set up based upon the requirements of Ministry of Finance and other statutory and regulatory requirements:
Group Bank
Note 30 June 2014 31 December 2013 30 June 2014 31 December 2013
MOF (1) 165,439 150,249 165,439 150,249Hong Kong Banking Ordinance (2) 2,115 2,199 165 165Other regulatory bodies in Mainland China (3) 1,155 1,125 – –Other overseas regulatory bodies 330 262 330 261
Total 169,039 153,835 165,934 150,675
(1) Pursuant to relevant regulations issued by the MOF, the Bank has to appropriate a certain amount of its net profit as general reserve to cover potential losses against its assets. In accordance with the ‘Regulation on Management of Financial Institutions for Reserves’ (Cai Jin [2012] No. 20), issued by the Ministry of Finance on 30 March 2012, the general reserve balance for financial institutions should not be lower than 1.5% of the ending balance of gross risk-bearing assets.
(2) Pursuant to requirements of the Hong Kong Banking Ordinance, the Group’s banking operations in Hong Kong are required to set aside amounts in a regulatory reserve in respect of losses which it will, or may, incur on loans and advances to customers, in addition to impairment losses recognised in accordance with the accounting policies of the Group. Transfers to and from the regulatory reserve are made through retained earnings.
(3) Pursuant to the relevant regulatory requirements in Mainland China, the Bank’s subsidiaries are required to appropriate a certain amount of its net profit as general reserve.
52 Profit distributionThe Bank declared a cash dividend of RMB75,003 million for the year ended 31 December 2013 according to the profit distribution plan approved by the Annual General Meeting held on 26 June 2014.
53 Cash and cash equivalents30 June 2014 31 December 2013 30 June 2013
Cash 61,135 71,756 60,468Surplus deposit reserves with central banks 154,966 129,443 180,820Demand deposits with banks and non-bank financial institutions 38,843 26,527 26,264Deposits with banks and non-bank financial institutions with original maturity not over three months 22,031 162,097 479,554Placements with banks and non-bank financial institutions with original maturity not over three months 132,262 50,950 34,436
Total 409,237 440,773 781,542
54 Credit assets securitisation transactionsThe Group enters into securitisation transactions in the normal course of business by which it transfers credit assets to special purpose vehicles (“SPVs”) which issue asset-backed securities to investors. The Group may retain interests in the form of subordinated tranches which would give rise to the Group’s continuing involvement in the transferred assets. Those financial assets are recognised on the statement of financial position to the extent of the Group’s continuing involvement.
As at 30 June 2014, loans with an original carrying amount of RMB7,177 million (31 December 2013: RMB7,177 million) have been securitised by the Group under arrangements in which the Group retained a continuing involvement in such assets. As at 30 June 2014, the carrying amount of assets that the Group continued to recognise was RMB824 million (31 December 2013: RMB828 million), and liabilities was RMB501 million (31 December 2013: RMB502 million).

106 China Construction Bank Corporation Half-Year Report 2014
(Expressed in millions of RMB, unless otherwise stated)Notes to the Financial Statements
55 Operating segmentsThe Group has presented the operating segments in a manner consistent with the way in which information is reported internally to the Group’s chief operating decision makers for the purposes of resource allocation and performance assessment. Measurement of segment assets and liabilities and segment income and results is based on the Group’s accounting policies.
Transactions between segments are conducted under normal commercial terms and conditions. Internal charges and transfer prices are determined with reference to market rates and have been reflected in the performance of each segment. Net interest income and expense arising from internal charges and transfer pricing adjustments are referred to as “internal net interest income/expense”. Interest income and expense earned from third parties are referred to as “external net interest income/expense”.
Segment revenues, results, assets and liabilities include items directly attributable to a segment as well as those that can be allocated on a reasonable basis. Segment income and results are determined before intra-group transactions are eliminated as part of the consolidation process. Segment capital expenditure is the total cost incurred during the period to acquire fixed assets, intangible assets and other long-term assets.
(1) Geographical segmentsThe Group operates principally in Mainland China with branches covering all provinces, autonomous regions and municipalities directly under the central government, and several subsidiaries located in Mainland China. The Group also has bank branch operations in Hong Kong, Taiwan, Singapore, Frankfurt, Johannesburg, Tokyo, Seoul, New York, Sydney, Ho Chi Minh City, Luxembourg and Macau and certain subsidiaries operations in Hong Kong, London, Moscow, Dubai, Luxembourg, British Virgin Islands and New Zealand.
In presenting information on the basis of geographical segments, operating income is allocated based on the location of the branches and subsidiaries that generate the income. Segment assets, liabilities and capital expenditure are allocated based on their geographical location.
Geographical segments of the Group, as defined for management reporting purposes, are defined as follows:
– “Yangtze River Delta” refers to the following areas where the tier-1 branches and the subsidiaries of the Bank operate: Shanghai Municipality, Jiangsu Province, Zhejiang Province, City of Ningbo and City of Suzhou;
– “Pearl River Delta” refers to the following areas where the tier-1 branches of the Bank operate: Guangdong Province, City of Shenzhen, Fujian Province and City of Xiamen;
– “Bohai Rim” refers to the following areas where the tier-1 branches and the subsidiaries of the Bank operate: Beijing Municipality, Shandong Province, Tianjin Municipality, Hebei Province and City of Qingdao;
– the “Central” region refers to the following areas where the tier-1 branches and the subsidiaries of the Bank operate: Shanxi Province, Guangxi Autonomous Region, Hubei Province, Henan Province, Hunan Province, Jiangxi Province, Hainan Province and Anhui Province;
– the “Western” region refers to the following areas where the tier-1 branches and the subsidiaries of the Bank operate: Sichuan Province, Chongqing Municipality, Guizhou Province, Yunnan Province, Tibet Autonomous Region, Inner Mongolia Autonomous Region, Shaanxi Province, Gansu Province, Qinghai Province, Ningxia Autonomous Region and Xinjiang Autonomous Region; and
– the “Northeastern” region refers to the following areas where the tier-1 branches and the subsidiaries of the Bank operate: Liaoning Province, Jilin Province, Heilongjiang Province and City of Dalian.

China Construction Bank CorporationHalf-Year Report 2014 107
(Expressed in millions of RMB, unless otherwise stated)Notes to the Financial Statements
55 Operating segments (continued)
(1) Geographical segments (continued)
Six months ended 30 June 2014
Yangtze River Delta
Pearl River Delta Bohai Rim Central Western Northeastern Head Office Overseas Total
External net interest income 30,445 19,012 12,354 25,967 28,462 8,769 82,890 3,393 211,292Internal net interest income/(expense) 5,346 9,127 20,367 10,091 8,372 4,724 (58,386) 359 –
Net interest income 35,791 28,139 32,721 36,058 36,834 13,493 24,504 3,752 211,292
Net fee and commission income 10,807 9,279 9,912 10,138 7,652 3,108 8,312 972 60,180Net trading gain 113 52 126 5 76 – 691 530 1,593Dividend income 3 2 3 186 2 4 1 39 240Net gain arising from investment securities 227 – 2 – 12 – 732 165 1,138Other operating income/(loss), net 349 203 498 139 867 99 1,660 (1,531) 2,284
Operating income 47,290 37,675 43,262 46,526 45,443 16,704 35,900 3,927 276,727
Operating expenses (14,696) (11,613) (13,810) (15,952) (14,820) (6,246) (5,152) (1,850) (84,139)Impairment losses (9,890) (3,655) (1,625) (3,223) (2,850) (1,454) (2,440) 2,015 (23,122)Share of profits less gains of associates and joint ventures – – – 5 – – – 45 50
Profit before tax 22,704 22,407 27,827 27,356 27,773 9,004 28,308 4,137 169,516
Capital expenditure 1,068 766 1,199 1,954 1,816 800 1,222 1,537 10,362Depreciation and amortisation 1,380 887 1,271 1,566 1,371 740 1,220 115 8,550
30 June 2014
Segment assets 2,776,063 2,343,637 2,996,848 2,554,019 2,604,801 965,343 6,061,762 918,058 21,220,531Interests in associates and joint ventures – – – 713 – – – 2,094 2,807
2,776,063 2,343,637 2,996,848 2,554,732 2,604,801 965,343 6,061,762 920,152 21,223,338
Deferred tax assets 31,245Elimination (4,854,793)
Total assets 16,399,790
Segment liabilities 2,747,562 2,325,785 2,990,841 2,533,722 2,589,311 959,706 5,122,571 837,928 20,107,426
Deferred tax liabilities 145Elimination (4,854,793)
Total liabilities 15,252,778
Off-balance sheet credit commitments 608,975 393,672 625,474 288,868 286,218 118,913 7,500 65,135 2,394,755

108 China Construction Bank Corporation Half-Year Report 2014
(Expressed in millions of RMB, unless otherwise stated)Notes to the Financial Statements
55 Operating segments (continued)
(1) Geographical segments (continued)
Six months ended 30 June 2013
Yangtze River Delta
Pearl River Delta Bohai Rim Central Western Northeastern Head Office Overseas Total
External net interest income 28,866 17,436 17,322 20,279 23,317 6,961 71,520 1,959 187,660Internal net interest income/(expense) 3,769 6,356 10,174 9,398 7,706 4,619 (43,063) 1,041 –
Net interest income 32,635 23,792 27,496 29,677 31,023 11,580 28,457 3,000 187,660
Net fee and commission income 10,857 9,032 9,067 9,221 7,291 3,049 6,220 787 55,524Net trading gain/(loss) 304 338 238 146 232 66 1,320 (1,374) 1,270Dividend income – 1 2 116 47 – 27 – 193Net gain arising from investment securities 169 – – – – 10 83 40 302Other operating income, net 4,200 162 212 270 670 2 226 1,616 7,358
Operating income 48,165 33,325 37,015 39,430 39,263 14,707 36,333 4,069 252,307
Operating expenses (17,888) (10,600) (12,474) (14,041) (13,655) (5,908) (4,913) (1,588) (81,067)Impairment losses (10,885) (511) 88 (1,689) (119) (722) (1,037) (1,179) (16,054)Share of profits less gains of associates and joint ventures – – – (1) – – – 4 3
Profit before tax 19,392 22,214 24,629 23,699 25,489 8,077 30,383 1,306 155,189
Capital expenditure 1,315 1,006 4,185 2,525 1,950 678 1,262 151 13,072Depreciation and amortisation 1,284 833 1,044 1,395 1,220 651 945 91 7,463
31 December 2013
Segment assets 2,639,135 2,158,746 2,737,198 2,410,486 2,500,348 910,474 5,934,221 729,915 20,020,523Interests in associates and joint ventures – – – 661 – – – 1,963 2,624
2,639,135 2,158,746 2,737,198 2,411,147 2,500,348 910,474 5,934,221 731,878 20,023,147
Deferred tax assets 38,448Elimination (4,698,385)
Total assets 15,363,210
Segment liabilities 2,628,866 2,153,610 2,718,912 2,399,890 2,492,392 907,524 5,026,546 659,388 18,987,128
Deferred tax liabilities 138Elimination (4,698,385)
Total liabilities 14,288,881
Off-balance sheet credit commitments 555,843 422,332 569,194 283,736 282,660 110,931 13,000 72,531 2,310,227

China Construction Bank CorporationHalf-Year Report 2014 109
(Expressed in millions of RMB, unless otherwise stated)Notes to the Financial Statements
55 Operating segments (continued)
(2) Business segmentsBusiness segments, as defined for management reporting purposes, are as follows:
Corporate bankingThis segment represents the provision of a range of financial products and services to corporations, government agencies and financial institutions. The products and services include corporate loans, trade financing, deposit taking and wealth management services, agency services, financial consulting and advisory services, cash management services, remittance and settlement services, custody services and guarantee services, etc.
Personal bankingThis segment represents the provision of a range of financial products and services to individual customers. The products and services comprise personal loans, deposit taking and wealth management services, card business, remittance services and agency services, etc.
Treasury businessThis segment covers the Group’s treasury operations. The treasury enters into inter-bank money market transactions, repurchase and resale transactions, and invests in debt securities. It also trades in derivatives and foreign currency for its own account. The treasury carries out customer-driven derivatives, foreign currency and precious metal trading. Its function also includes the management of the Group’s overall liquidity position, including the issuance of debt securities.
OthersThese represent equity investments and the revenues, results, assets and liabilities of overseas branches and subsidiaries.
Six months ended 30 June 2014
Corporate banking
Personal banking
Treasury business Others Total
External net interest income 110,317 9,010 86,241 5,724 211,292Internal net interest income/(expenses) 4,569 72,339 (73,676) (3,232) –
Net interest income 114,886 81,349 12,565 2,492 211,292
Net fee and commission income 25,966 22,650 10,101 1,463 60,180Net trading (loss)/gain (3,708) (3,854) 8,615 540 1,593Dividend income – – – 240 240Net gain arising from investment securities – – 609 529 1,138Other operating income/(expense), net 147 30 2,858 (751) 2,284
Operating income 137,291 100,175 34,748 4,513 276,727
Operating expenses (32,321) (45,422) (2,632) (3,764) (84,139)Impairment losses (18,122) (5,457) (527) 984 (23,122)Share of profits less losses of associates and joint ventures – – – 50 50
Profit before tax 86,848 49,296 31,589 1,783 169,516
Capital expenditure 2,215 6,168 166 1,814 10,363Depreciation and amortisation 2,137 5,964 157 292 8,550
30 June 2014
Segment assets 6,106,385 2,805,623 6,484,974 1,024,288 16,421,270Interests in associates and joint ventures – – – 2,807 2,807
6,106,385 2,805,623 6,484,974 1,027,095 16,424,077
Deferred tax assets 31,245Elimination (55,532)
Total assets 16,399,790
Segment liabilities 7,121,547 6,796,136 217,721 1,172,761 15,308,165
Deferred tax liabilities 145Elimination (55,532)
Total liabilities 15,252,778
Off-balance sheet credit commitments 1,901,249 428,220 – 65,286 2,394,755

110 China Construction Bank Corporation Half-Year Report 2014
(Expressed in millions of RMB, unless otherwise stated)Notes to the Financial Statements
55 Operating segments (continued)
(2) Business segments (continued)
Six months ended 30 June 2013
Corporate banking
Personal banking
Treasury business Others Total
External net interest income 113,391 287 69,623 4,359 187,660Internal net interest (expenses)/income (19,829) 63,338 (42,628) (881) –
Net interest income 93,562 63,625 26,995 3,478 187,660
Net fee and commission income 24,027 19,069 11,300 1,128 55,524Net trading (loss)/gain (3) 721 1,911 (1,359) 1,270Dividend income – – – 193 193Net gain/(loss) arising from investment securities – – 322 (20) 302Other operating income/(expense), net 225 389 (93) 6,837 7,358
Operating income 117,811 83,804 40,435 10,257 252,307
Operating expenses (31,544) (40,237) (2,441) (6,845) (81,067)Impairment losses (11,469) (3,950) 627 (1,262) (16,054)Share of profits less losses of associates and joint ventures – – – 3 3
Profit before tax 74,798 39,617 38,621 2,153 155,189
Capital expenditure 2,884 6,471 346 3,371 13,072Depreciation and amortisation 2,167 4,863 260 173 7,463
31 December 2013
Segment assets 5,585,454 2,590,881 6,505,051 744,879 15,426,265Interests in associates and joint ventures – – – 2,624 2,624
5,585,454 2,590,881 6,505,051 747,503 15,428,889
Deferred tax assets 38,448Elimination (104,127)
Total assets 15,363,210
Segment liabilities 6,772,134 6,376,797 389,827 854,112 14,392,870
Deferred tax liabilities 138Elimination (104,127)
Total liabilities 14,288,881
Off-balance sheet credit commitments 1,828,104 409,316 – 72,807 2,310,227
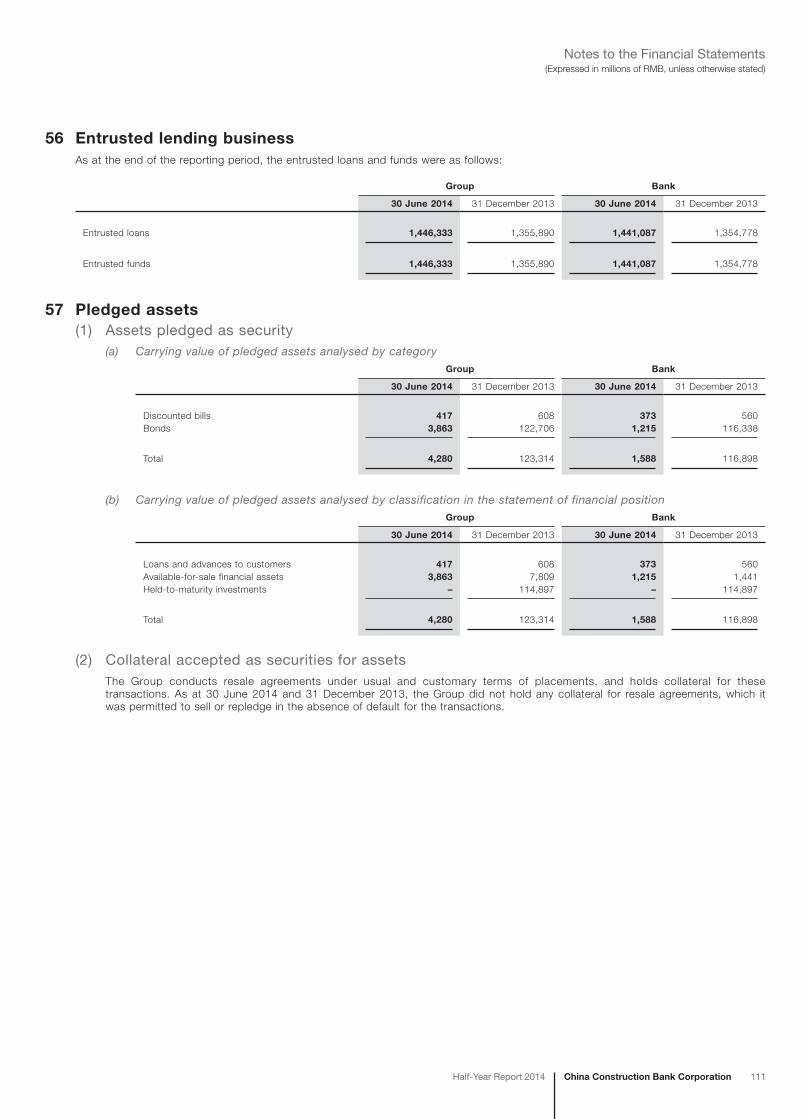
China Construction Bank CorporationHalf-Year Report 2014 111
(Expressed in millions of RMB, unless otherwise stated)Notes to the Financial Statements
56 Entrusted lending businessAs at the end of the reporting period, the entrusted loans and funds were as follows:
Group Bank
30 June 2014 31 December 2013 30 June 2014 31 December 2013
Entrusted loans 1,446,333 1,355,890 1,441,087 1,354,778
Entrusted funds 1,446,333 1,355,890 1,441,087 1,354,778
57 Pledged assets(1) Assets pledged as security
(a) Carrying value of pledged assets analysed by categoryGroup Bank
30 June 2014 31 December 2013 30 June 2014 31 December 2013
Discounted bills 417 608 373 560Bonds 3,863 122,706 1,215 116,338
Total 4,280 123,314 1,588 116,898
(b) Carrying value of pledged assets analysed by classification in the statement of financial positionGroup Bank
30 June 2014 31 December 2013 30 June 2014 31 December 2013
Loans and advances to customers 417 608 373 560Available-for-sale financial assets 3,863 7,809 1,215 1,441Held-to-maturity investments – 114,897 – 114,897
Total 4,280 123,314 1,588 116,898
(2) Collateral accepted as securities for assetsThe Group conducts resale agreements under usual and customary terms of placements, and holds collateral for these transactions. As at 30 June 2014 and 31 December 2013, the Group did not hold any collateral for resale agreements, which it was permitted to sell or repledge in the absence of default for the transactions.

112 China Construction Bank Corporation Half-Year Report 2014
(Expressed in millions of RMB, unless otherwise stated)Notes to the Financial Statements
58 Commitments and contingent liabilities(1) Credit commitments
Credit commitments take the form of undrawn loan facilities which are approved and contracted, unutilised credit card limits, financial guarantees, letters of credit etc. The Group assesses and makes allowance for any probable losses accordingly.
The contractual amounts of loans and credit card commitments represent the cash outflows should the contracts be fully drawn upon. The amounts of guarantees and letters of credit represent the maximum potential loss that would be recognised if counterparties failed completely to perform as contracted. Acceptances comprise undertakings by the Group to pay bills of exchange drawn on customers.
As credit commitments may expire without being drawn upon, the total of the contractual amounts set out in the following table do not represent the expected future cash outflows.
Group Bank
30 June 2014 31 December 2013 30 June 2014 31 December 2013
Loan commitments – with an original maturity under one year 145,964 179,790 142,766 176,494 – with an original maturity of one year or over 286,010 302,109 281,487 297,834Credit card commitments 458,347 437,431 428,220 409,316
890,321 919,330 852,473 883,644
Bank acceptances 432,850 360,499 432,662 360,230Financing guarantees 119,393 129,557 193,499 193,918Non-financing guarantees 535,562 484,370 535,220 483,828Sight letters of credit 24,491 29,243 24,491 29,243Usance letters of credit 346,661 351,543 360,401 367,774Others 45,477 35,685 45,472 35,595
Total 2,394,755 2,310,227 2,444,218 2,354,232
(2) Credit risk-weighted amountThe credit risk-weighted amount refers to the amount as computed in accordance with the rules set out by the CBRC and depends on the status of the counterparty and the maturity characteristics.
30 June 2014
Group Bank
Credit risk-weighted amount of contingent liabilities and commitments 928,574 957,145
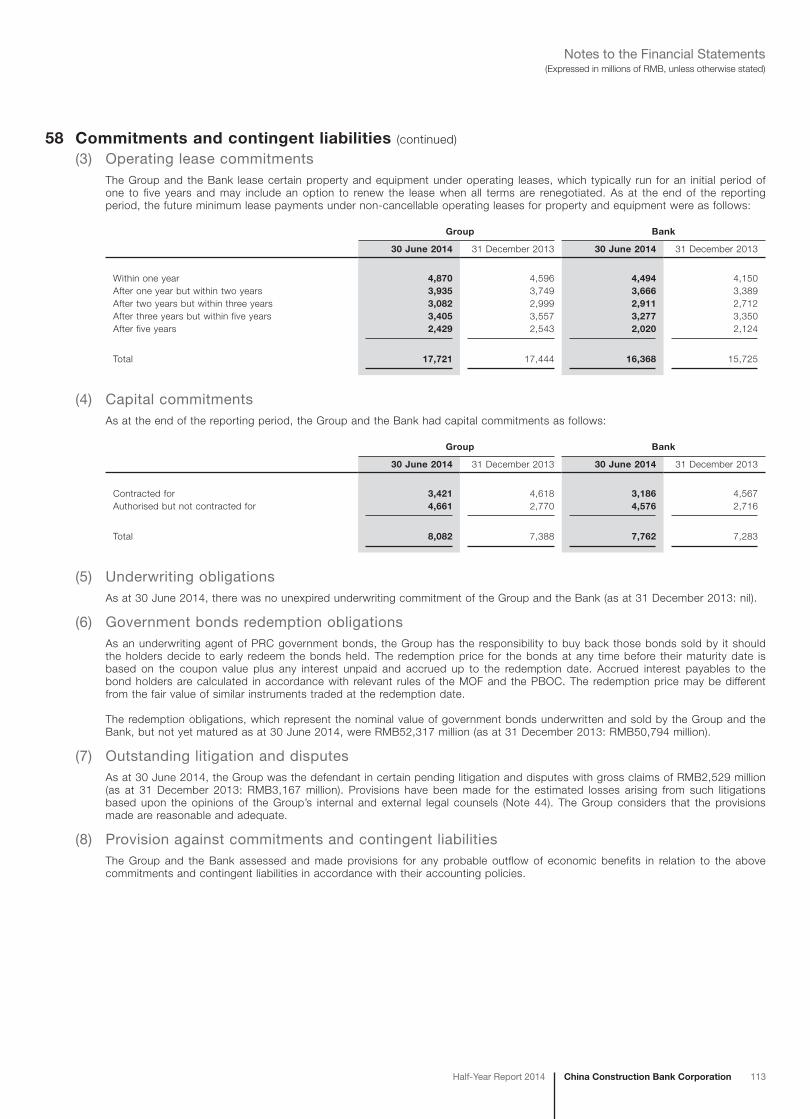
China Construction Bank CorporationHalf-Year Report 2014 113
(Expressed in millions of RMB, unless otherwise stated)Notes to the Financial Statements
58 Commitments and contingent liabilities (continued)
(3) Operating lease commitmentsThe Group and the Bank lease certain property and equipment under operating leases, which typically run for an initial period of one to five years and may include an option to renew the lease when all terms are renegotiated. As at the end of the reporting period, the future minimum lease payments under non-cancellable operating leases for property and equipment were as follows:
Group Bank
30 June 2014 31 December 2013 30 June 2014 31 December 2013
Within one year 4,870 4,596 4,494 4,150After one year but within two years 3,935 3,749 3,666 3,389After two years but within three years 3,082 2,999 2,911 2,712After three years but within five years 3,405 3,557 3,277 3,350After five years 2,429 2,543 2,020 2,124
Total 17,721 17,444 16,368 15,725
(4) Capital commitmentsAs at the end of the reporting period, the Group and the Bank had capital commitments as follows:
Group Bank
30 June 2014 31 December 2013 30 June 2014 31 December 2013
Contracted for 3,421 4,618 3,186 4,567Authorised but not contracted for 4,661 2,770 4,576 2,716
Total 8,082 7,388 7,762 7,283
(5) Underwriting obligationsAs at 30 June 2014, there was no unexpired underwriting commitment of the Group and the Bank (as at 31 December 2013: nil).
(6) Government bonds redemption obligationsAs an underwriting agent of PRC government bonds, the Group has the responsibility to buy back those bonds sold by it should the holders decide to early redeem the bonds held. The redemption price for the bonds at any time before their maturity date is based on the coupon value plus any interest unpaid and accrued up to the redemption date. Accrued interest payables to the bond holders are calculated in accordance with relevant rules of the MOF and the PBOC. The redemption price may be different from the fair value of similar instruments traded at the redemption date.
The redemption obligations, which represent the nominal value of government bonds underwritten and sold by the Group and the Bank, but not yet matured as at 30 June 2014, were RMB52,317 million (as at 31 December 2013: RMB50,794 million).
(7) Outstanding litigation and disputesAs at 30 June 2014, the Group was the defendant in certain pending litigation and disputes with gross claims of RMB2,529 million (as at 31 December 2013: RMB3,167 million). Provisions have been made for the estimated losses arising from such litigations based upon the opinions of the Group’s internal and external legal counsels (Note 44). The Group considers that the provisions made are reasonable and adequate.
(8) Provision against commitments and contingent liabilitiesThe Group and the Bank assessed and made provisions for any probable outflow of economic benefits in relation to the above commitments and contingent liabilities in accordance with their accounting policies.

114 China Construction Bank Corporation Half-Year Report 2014
(Expressed in millions of RMB, unless otherwise stated)Notes to the Financial Statements
59 Related party relationships and transactions(1) Transactions with parent companies and their affiliates
The parent companies of the Group are CIC and Huijin.
Approved by the State Council, CIC was established on 29 September 2007 with a registered capital of RMB1,550 billion. As a wholly owned subsidiary of CIC, Huijin exercises its rights and obligations as an investor on behalf of PRC government.
Huijin was incorporated on 16 December 2003 as a wholly state-owned investment company with the approval of the State Council. It was registered in Beijing with a registered capital of RMB828,209 million. Its principal activities are equity investments as authorised by the State Council, without engaging in other commercial operations. As at 30 June 2014, Huijin directly held 57.26% shares of the Bank.
The related companies under parent companies include the subsidiaries under parent companies and other associates and joint ventures.
The Group’s transactions with parent companies and their affiliates mainly include deposit taking, entrusted asset management, operating leases, lending, purchase and sale of debt securities, money market transactions and inter-bank clearing. These transactions are priced based on market prices and conducted under general commercial terms.
The Group has issued subordinated debts with a nominal value of RMB148 billion (as at 31 December 2013: RMB160 billion). These are bearer bonds and tradable in secondary market. Accordingly, the Group has no information in respect of the amount of the bonds held by the affiliates of parent companies as at the end of the reporting period.
(a) Transactions with parent companiesIn the ordinary course of the business, material transactions that the Group and the Bank entered into with parent companies are as follows:
Amounts
Six months ended 30 June
2014 2013
AmountRatio to similar
transactions AmountRatio to similar
transactions
Interest income 289 0.08% 289 0.09%Interest expense 61 0.04% 300 0.24%
Balances outstanding as at the end of the reporting period
30 June 2014 31 December 2013
Note BalanceRatio to similar
transactions BalanceRatio to similar
transactions
Interest receivable 471 0.46% 189 0.23%Held-to-maturity investments 16,680 0.75% 16,680 0.79%Available-for-sale financial assets – – 180 0.02%Deposits from customers 12,322 0.10% 13,063 0.11%Interest payable 28 0.02% 3 0.00%Other liabilities (i) 42,948 27.85% – –Credit commitments – – 288 0.01%
(i) Other liabilities as at 30 June 2014 represents cash dividends payable to Huijin approved by the 2013 Annual General Meeting.

China Construction Bank CorporationHalf-Year Report 2014 115
(Expressed in millions of RMB, unless otherwise stated)Notes to the Financial Statements
59 Related party relationships and transactions (continued)
(1) Transactions with parent companies and their affiliates (continued)
(b) Transactions with the affiliates of parent companiesIn the ordinary course of the business, material transactions that the Group and the Bank entered into with the affiliates of parent companies are as follows:
Amounts
Six months ended 30 June
2014 2013
Note AmountRatio to similar
transactions AmountRatio to similar
transactions
Interest income 20,884 5.86% 16,757 5.35%Interest expense 709 0.49% 612 0.49%Fee and commission income 164 0.27% 209 0.37%Operating expenses (i) 767 1.15% 590 0.97%
Balances outstanding as at the end of the reporting period
30 June 2014 31 December 2013
Note BalanceRatio to similar
transactions BalanceRatio to similar
transactions
Deposits with banks and non-bank financial institutions 24,578 7.04% 35,103 10.93%Placements with banks and non-bank financial institutions 99,881 38.76% 60,734 39.94%Financial assets at fair value through profit or loss 3,221 0.99% 13,856 3.81%Positive fair value of derivatives 858 6.87% 1,507 7.97%Financial assets held under resale agreements 12,743 3.62% 32,194 11.44%Interest receivable 17,086 16.83% 16,541 20.49%Loans and advances to customers 50,413 0.56% 43,790 0.52%Available for sale financial assets 237,044 30.59% 213,549 28.09%Held-to-maturity investments 567,837 25.57% 515,295 24.53%Debt securities classified as receivables 57,200 29.79% 64,700 34.10%Other assets (ii) 4 0.01% 2 0.01%Deposits from banks and non-bank financial institutions (iii) 52,144 6.55% 53,318 7.70%Placements from banks and non-bank financial institutions 51,591 19.93% 34,501 22.13%Negative fair value of derivatives 463 3.93% 1,187 5.97%Financial assets sold under repurchase agreements 1,420 46.33% 37,747 61.01%Deposits from customers 47,872 0.37% 42,397 0.35%Financial liabilities at fair value through profit or loss 27 0.01% 1,160 0.30%Interest payable 101 0.06% 80 0.05%Other liabilities 658 0.43% 658 1.00%Credit commitments 10,480 0.58% 23,762 1.09%
(i) Operating expenses mainly represent rental expenses paid by the Group for leased assets, including properties and motor vehicles, owned by parent companies and its affiliates, and fees for related services provided by parent companies and its affiliates.
(ii) Other assets mainly represent other receivables from the affiliates of parent companies.
(iii) Deposits from the affiliates of parent companies are unsecured and are repayable under general commercial terms.

116 China Construction Bank Corporation Half-Year Report 2014
(Expressed in millions of RMB, unless otherwise stated)Notes to the Financial Statements
59 Related party relationships and transactions (continued)
(2) Transactions with associates and joint ventures of the GroupTransactions between the Group and its associates and joint ventures are conducted in the normal and ordinary course of the business and under general commercial terms as those transactions conducted between the Group and non-related companies outside the Group. In the ordinary course of the business, material transactions that the Group entered into with associates and joint ventures are as follows:
Amounts
Six months ended 30 June
2014 2013
Interest income 10 12Fee and commission income – 37Interest expense 1 1
Balances outstanding as at the end of the reporting period
30 June 2014 31 December 2013
Loans and advances to customers 1,862 1,860Deposits from customers 461 694
(3) Transactions between the Bank and its subsidiariesTransactions between the Bank and its subsidiaries are conducted in the normal and ordinary course of the business and under normal commercial terms as those transactions conducted between the Group and non-related companies outside the Group. All the inter-group transactions and inter-group balances are eliminated when preparing the consolidated financial statements as mentioned in Note 2(3).
In the ordinary course of the business, material transactions that the Bank entered into with its subsidiaries are as follows:
Amounts
Six months ended 30 June
2014 2013
Interest income 1,031 304Interest expense 431 142Fee and commission income 398 318Fee and commission expense 16 4Net trading loss (13) –Dividend income 22 573Other operating income, net (163) (5)
Balances outstanding as at the end of the reporting period are presented in Note 34.
As at 30 June 2014, the total maximum guarantee limit of guarantee letters issued by the Bank with its subsidiaries as beneficiary is RMB2,929 million (as at 31 December 2013: RMB66,975 million).
For the six months ended 30 June 2014, the transactions between subsidiaries of the Group are mainly deposit taking and ordinary receivables and payables. As at 30 June 2014, the balances of the above transactions were RMB2,275 million (as at 31 December 2013: RMB2,646 million) and RMB1.63 million (as at 31 December 2013: RMB395 million) respectively.
(4) Transactions with other PRC state-owned entitiesState-owned entities refer to those entities directly or indirectly owned by the PRC government through its government authorities, agencies, affiliations and other organisations. Transactions with other state-owned entities include but are not limited to: lending and deposit taking; taking and placing of inter-bank balances; entrusted lending and other custody services; insurance and securities agency, and other intermediary services; purchase, sale, underwriting and redemption of bonds issued by other state-owned entities; purchase, sale and leases of property and other assets; and rendering and receiving of utilities and other services.
These transactions are conducted in the ordinary course of the Group’s banking business on terms similar to those that would have been entered into with non-state-owned entities. The Group’s pricing strategy and approval processes for major products and services, such as loans, deposits and commission income, do not depend on whether the customers are state-owned entities or not. Having due regard to the substance of the relationships, the Group is of the opinion that none of these transactions are material related party transactions that require separate disclosure.

China Construction Bank CorporationHalf-Year Report 2014 117
(Expressed in millions of RMB, unless otherwise stated)Notes to the Financial Statements
59 Related party relationships and transactions (continued)
(5) Transactions with the Annuity Scheme and Plan AssetsApart from the obligations for defined contributions to the Annuity Scheme and regular banking transactions, there were no other transactions between the Group and the Annuity Scheme for the six months ended 30 June 2014 and the year ended 31 December 2013.
As at 30 June 2014, RMB4,059 million of the Group’s supplementary retirement benefit plan assets (31 December 2013: RMB4,113 million) were managed by CCB Principal and management fees payable to CCB Principal was RMB4.82 million (31 December 2013: nil).
(6) Key management personnelKey management personnel are those persons having authorities and responsibilities for planning, directing and controlling the activities of the Group, directly or indirectly, including directors, supervisors and senior executives. The Group enters into banking transactions with key management personnel in the normal course of business. For the six months ended 30 June 2014 and for the year ended 31 December 2013, there were no material transactions and balances with key management personnel.
(7) Loans and advances to directors, supervisors and senior executivesThe Group had no material balance of loans and advances to directors, supervisors and senior executives as at the end of reporting period. Those loans and advances to directors, supervisors and senior executives were conducted in the normal and ordinary course of the business and under normal commercial terms or on the same terms and conditions with those which are available to other employees, based on terms and conditions granted to third parties adjusted for risk reduction.
60 Risk managementThe Group has exposures to the following risks from its use of financial instruments:
– credit risk– market risk– liquidity risk– operational risk
This note presents information about the Group’s exposures to each of the above risks, the Group’s objectives, policies and processes for measuring and managing risk, and the Group’s capital management.
Risk management frameworkThe Board of Directors carries out their responsibilities according to the articles of association and other related regulatory requirements. The Board of Directors of the Bank established the Risk Management Committee to be responsible for formulating risk management strategies and policies, monitoring the implementation, and evaluating the overall risk profile on a regular basis. The Board of Supervisors has overseen the establishment of the overall risk management system and the carrying out of risk management responsibilities by the Board of Directors and senior management. Senior management is responsible for carrying out the risk management strategies established by the Board of Directors and the implementation of the overall risk management of the Group. Senior management appoints the Chief Risk Officer who assists the president with the corresponding risk management work.
To identify, evaluate, monitor and manage risk, the Group has designed a comprehensive governance framework, internal control policies and procedures. Risk management policies and systems are reviewed regularly to reflect changes in market conditions, products and services offered. The Group, through its training system, standardised management and process management, aims at developing a disciplined and constructive control environment, in which all employees understand their roles and obligations.
Risk Management Department is in charge of the overall business risk management. Credit Management Department is in charge of the overall credit risk management. Credit Approval Department is in charge of the overall credit business approval. Internal Control and Compliance Department coordinates operating risk management, internal control and compliance. Other departments are responsible for managing various corresponding risks.
The Group Audit Committee is responsible for monitoring and evaluating internal controls, and monitoring the compliance of core business sectors and their management procedures. Internal Control Department assists the Audit Committee to execute the above mentioned responsibilities and reports to the Audit Committee.

118 China Construction Bank Corporation Half-Year Report 2014
(Expressed in millions of RMB, unless otherwise stated)Notes to the Financial Statements
60 Risk management (continued)
(1) Credit riskCredit risk managementCredit risk represents the financial loss that arises from the failure of a debtor or counterparty to discharge its contractual obligations or commitments to the Group.
Credit businessThe Risk Management Department takes the lead in the development and implementation of the credit risk measurement tools including customers rating and facilities grading and is responsible for the special assets resolutions. The Credit Management Department is responsible for establishing credit risk management policies and monitoring the quality of credit assets. The Credit Approval Department is responsible for the group’s comprehensive credit limits and credit approval of various credit businesses. While the Credit Management Department takes the lead, both the Credit Management Department and the Credit Approval Department will coordinate with the Corporate Banking Department, the SME Business Department, the Institutional Banking Department, the International Business Department, the Group Clients Department, the Housing Finance & Personal Lending Department, the Credit Card Center, and the Legal Affairs Department to implement the credit risk management policies and procedures.
With respect to the credit risk management of corporate and institutional business, the Group has accelerated the adjustment of its credit portfolio structure, enhanced post-lending monitoring, and refined the industry-specific guideline and policy baseline for credit approval. Management also fine-tuned the credit acceptance and exit policies, and optimised its economic capital and credit risk limit management. All these policies have been implemented to improve the overall asset quality. The Group manages credit risk throughout the entire credit process including pre-lending evaluations, credit approval and post-lending monitoring. The Group performs pre-lending evaluations by assessing the entity’s credit ratings based on internal rating criteria and assessing the risks and rewards with respect to the proposed project. Credit approvals are granted by designated Credit Approval Officers. The Group continually carries out post-lending monitoring, particularly those related to targeted industries, geographical segments, products and clients. Any adverse events that may significantly affect a borrower’s repayment ability are reported timely and measures are implemented to prevent and control risks.
With respect to the personal credit business, the Group relies on credit assessment of applicants as the basis for loan approval. Customer relationship managers are required to assess the income level, credit history, and repayment ability of the applicant. The customer relationship managers then forward the application and recommendations to the loan-approval departments for consent. The Group monitors borrowers’ repayment ability, the status of collateral and any changes to collateral value. Once a loan becomes overdue, the Group starts the recovery process according to standard personal loan recovery procedures.
To mitigate risks, the Group requests the customers to provide collateral and guarantees where appropriate. A fine management system and operating procedure for collateral have been developed, and there is a guideline to specify the suitability of accepting specific types of collateral. Collateral values, structures and legal covenants are regularly reviewed to ensure that they still serve their intended purposes and conform to market practices.
Credit grading classificationThe Group adopts a loan risk classification approach to manage the loan portfolio risk. Loans are generally classified as normal, special mention, substandard, doubtful and loss according to their level of risk. Substandard, doubtful and loss loans are considered as impaired loans and advances when one or more events demonstrate there is objective evidence of a loss event which triggers impairment. The allowance for impairment loss on impaired loans and advances is collectively or individually assessed as appropriate.
The core definitions of the five categories of loans and advances are set out below:
Normal: Borrowers can honour the terms of their loans. There is no reason to doubt their ability to repay principal and interest in full on a timely basis.
Special mention: Borrowers are able to service their loans currently, although repayment may be adversely affected by specific factors.
Substandard: Borrowers’ abilities to service their loans are apparently in question and they cannot rely entirely on normal business revenues to repay principal and interest. Certain losses may ensue even when collateral or guarantees are invoked.
Doubtful: Borrowers cannot repay principal and interest in full and significant losses will need to be recognised even when collateral or guarantees are invoked.
Loss: Principal and interest of loans cannot be recovered or only a small portion of them can be recovered after taking all possible measures or resorting to all necessary legal procedures.
The Group has also applied the same grading criteria and management approach in classifying the off-balance sheet credit-related operations.
Treasury businessFor risk management purposes, credit risk arising from debt securities and derivatives exposures is managed independently and information thereon is disclosed in notes (1)(h) and (1)(i) below. The Group sets credit limits for treasury activities and monitors them regularly with reference to the fair values of the relevant financial instruments.

China Construction Bank CorporationHalf-Year Report 2014 119
(Expressed in millions of RMB, unless otherwise stated)Notes to the Financial Statements
60 Risk management (continued)
(1) Credit risk (continued)
(a) Maximum credit risk exposureThe following table presents the maximum exposure to credit risk as at the end of the reporting period without taking into consideration any collateral held or other credit enhancement. In respect of the financial assets recognised in the statement of financial position, the maximum exposure to credit risk is represented by the carrying amount after deducting for any impairment allowance.
Group Bank
30 June 2014 31 December 2013 30 June 2014 31 December 2013
Deposits with central banks 2,516,901 2,403,245 2,504,134 2,398,040Deposits with banks and non-bank financial institutions 349,098 321,286 365,767 328,640Placements with banks and non-bank financial institutions 257,659 152,065 288,610 233,574Debt investments at fair value through profit or loss 318,983 357,530 318,733 356,854Positive fair value of derivatives 12,493 18,910 10,285 16,503Financial assets held under resale agreements 351,660 281,447 350,812 280,959Interest receivable 101,551 80,731 99,597 79,025Loans and advances to customers 8,952,511 8,361,361 8,615,664 8,025,415Available-for-sale debt securities 760,394 746,626 718,702 708,413Held-to-maturity investments 2,220,584 2,100,538 2,215,237 2,095,741Debt securities classified as receivables 192,014 189,737 177,168 182,252Other financial assets 38,593 21,130 67,499 53,635
Total 16,072,441 15,034,606 15,732,208 14,759,051Off-balance sheet credit commitments 2,394,755 2,310,227 2,444,218 2,354,232
Maximum credit risk exposure 18,467,196 17,344,833 18,176,426 17,113,283
(b) Distribution of loans and advances to customers in terms of credit quality is analysed as follows:Group Bank
Note 30 June 2014 31 December 2013 30 June 2014 31 December 2013
Individually assessed and impaired gross amount 86,026 77,152 85,495 76,779Allowances for impairment losses (53,994) (52,137) (53,703) (51,885)
Subtotal 32,032 25,015 31,792 24,894
Collectively assessed and impaired gross amount 9,642 8,112 9,510 8,002Allowances for impairment losses (6,461) (5,532) (6,426) (5,512)
Subtotal 3,181 2,580 3,084 2,490
Overdue but not impaired – not more than 90 days 32,212 14,517 31,398 13,969 – between 90 and 180 days – 3 – – – more than 180 days 149 472 149 472
Gross amount 32,361 14,992 31,547 14,441
Allowances for impairment losses (i) (4,564) (2,267) (4,547) (2,248)
Subtotal 27,797 12,725 27,000 12,193
Neither overdue nor impaired – Unsecured loans 2,446,859 2,322,572 2,267,987 2,125,833 – Guaranteed loans 1,743,428 1,615,091 1,666,454 1,564,696 – Loans secured by tangible assets
other than monetary assets 3,959,734 3,693,429 3,897,481 3,618,121 – Loans secured by monetary assets 912,551 858,709 892,925 844,248
Gross amount 9,062,572 8,489,801 8,724,847 8,152,898Allowances for impairment losses (i) (173,071) (168,760) (171,059) (167,060)
Subtotal 8,889,501 8,321,041 8,553,788 7,985,838
Total 8,952,511 8,361,361 8,615,664 8,025,415
(i) The balances represent collectively assessed allowances of impairment losses.

120 China Construction Bank Corporation Half-Year Report 2014
(Expressed in millions of RMB, unless otherwise stated)Notes to the Financial Statements
60 Risk management (continued)
(1) Credit risk (continued)
(b) Distribution of loans and advances to customers in terms of credit quality is analysed as follows (continued):Group
Within overdue but not impaired loans and advances and impaired loans and advances which are subject to individual assessment, the portion covered or not covered by collateral held are shown as follows:
30 June 2014
Overdue but not impaired loans and advances
Impaired loans and advances which are subject to individual
assessment
Corporate Personal Corporate
Portion covered 7,355 11,646 15,118Portion not covered 7,852 5,508 70,908
Total 15,207 17,154 86,026
31 December 2013
Overdue but not impaired loans and advances
Impaired loans and advances which aresubject to individual
assessment
Corporate Personal Corporate
Portion covered 330 8,256 12,048Portion not covered 1,049 5,357 65,104
Total 1,379 13,613 77,152
Bank
Within overdue but not impaired loans and advances and impaired loans and advances which are subject to individual assessment, the portion covered or not covered by collateral held are shown as follows:
30 June 2014
Overdue but not impaired loans and advances
Impaired loans and advances which are subject to individual
assessment
Corporate Personal Corporate
Portion covered 7,187 11,323 15,063Portion not covered 7,657 5,380 70,432
Total 14,844 16,703 85,495
31 December 2013
Overdue but not impaired loans and advances
Impaired loans and advances which are subject to individual
assessment
Corporate Personal Corporate
Portion covered 158 8,020 12,004Portion not covered 984 5,279 64,775
Total 1,142 13,299 76,779
The above collateral includes land use rights, buildings and equipment, etc. The fair value of collateral was estimated by the Group with reference to the latest available external valuations adjusted after taking into account the current realisation experience as well as the market situation.

China Construction Bank CorporationHalf-Year Report 2014 121
(Expressed in millions of RMB, unless otherwise stated)Notes to the Financial Statements
60 Risk management (continued)
(1) Credit risk (continued)
(c) Loans and advances to customers analysed by economic sector concentrationsGroup
30 June 2014 31 December 2013
Gross loan
balance Percentage
Balance secured by
collateral
Gross loan
balance Percentage
Balance secured by
collateral
Corporate loans and advances – Manufacturing 1,551,321 16.88% 562,991 1,432,219 16.67% 546,250 – Transportation, storage
and postal services 1,055,733 11.49% 402,548 993,243 11.56% 390,131 – Production and supply of electric
power, heat, gas and water 615,961 6.70% 177,900 594,603 6.92% 167,539 – Real estate 571,241 6.22% 471,907 541,252 6.30% 455,172 – Leasing and commercial services 558,144 6.07% 256,037 478,259 5.57% 220,972 – Wholesale and retail trade 488,742 5.32% 198,578 469,584 5.47% 186,592 – Water, environment and
public utility management 295,729 3.22% 161,609 273,513 3.19% 143,236 – Construction 285,051 3.10% 99,254 243,975 2.84% 93,032 – Mining 243,903 2.66% 33,510 234,837 2.74% 31,743 – Agriculture, forestry,
farming, fishing 122,660 1.33% 54,412 105,021 1.22% 46,000 – Public management, social
securities and social organisation 120,981 1.32% 56,317 117,599 1.37% 56,196 – Education 76,903 0.84% 22,078 71,714 0.83% 21,173 – Others 334,862 3.63% 71,218 386,386 4.50% 69,653
Total corporate loans and advances 6,321,231 68.78% 2,568,359 5,942,205 69.18% 2,427,689Personal loans and advances 2,716,971 29.56% 2,371,339 2,504,838 29.16% 2,173,315Discounted bills 152,399 1.66% – 143,014 1.66% –
Total loans and advances to customers 9,190,601 100.00% 4,939,698 8,590,057 100.00% 4,601,004
Details of impaired loans, impairment allowances, charges, and amounts written off in respect of economic sectors which constitute 10% or more of total gross loans and advances to customers are as follows:
30 June 2014
Gross impaired
loans
Individually assessed
impairment allowances
Collectively assessed
impairment allowances
Charged to profit or loss
during the period
Written off during
the period
Manufacturing 43,395 (26,522) (35,924) 9,223 2,138Transportation, storage and postal services 6,645 (3,926) (24,061) 601 291
31 December 2013
Gross impaired
loans
Individually assessed
impairment allowances
Collectively assessed
impairment allowances
Charged to profit or loss
during the year
Written off during
the year
Manufacturing 38,179 (24,308) (34,324) 13,402 4,028Transportation, storage and postal services 5,414 (3,816) (24,002) 3,515 11

122 China Construction Bank Corporation Half-Year Report 2014
(Expressed in millions of RMB, unless otherwise stated)Notes to the Financial Statements
60 Risk management (continued)
(1) Credit risk (continued)
(c) Loans and advances to customers analysed by economic sector concentrations (continued)Bank
30 June 2014 31 December 2013
Gross loan
balance Percentage
Balance secured by
collateral
Gross loan
balance Percentage
Balance secured by
collateral
Corporate loans and advances – Manufacturing 1,453,388 16.42% 558,562 1,388,973 16.82% 532,533 – Transportation, storage and
postal services 1,018,933 11.51% 390,928 967,057 11.72% 381,743 – Production and supply of electric
power, heat, gas and water 599,948 6.78% 175,768 583,007 7.06% 165,704 – Real estate 532,878 6.02% 446,124 507,855 6.15% 430,554 – Leasing and commercial services 554,774 6.27% 256,480 476,888 5.78% 221,452 – Wholesale and retail trade 449,058 5.07% 193,798 437,443 5.30% 178,123 – Water, environment and public
utility management 295,353 3.34% 161,550 273,072 3.32% 143,176 – Construction 279,955 3.16% 98,981 241,019 2.92% 92,752 – Mining 236,902 2.68% 33,093 230,507 2.80% 31,561 – Agriculture, forestry,
farming, fishing 121,133 1.37% 54,286 103,773 1.26% 45,869 – Public management, social
securities and social organisation 120,860 1.37% 56,195 117,461 1.42% 56,069 – Education 76,830 0.87% 22,032 71,638 0.87% 21,124 – Others 282,834 3.18% 68,459 245,923 2.98% 66,851
Total corporate loans and advances 6,022,846 68.04% 2,516,256 5,644,616 68.40% 2,367,511Personal loans and advances 2,676,389 30.24% 2,340,948 2,464,662 29.87% 2,143,251Discounted bills 152,164 1.72% – 142,842 1.73% –
Total loans and advances to customers 8,851,399 100.00% 4,857,204 8,252,120 100.00% 4,510,762
Details of impaired loans, impairment allowances, charges, and amounts written off in respect of economic sectors which constitute 10% or more of total gross loans and advances to customers are as follows:
30 June 2014
Gross impaired
loans
Individually assessed
impairment allowances
Collectively assessed
impairment allowances
Charged to profit or loss
during the period
Written off during
the period
Manufacturing 43,288 (26,450) (35,572) 9,070 2,126Transportation, storage and postal services 6,504 (3,824) (23,557) 470 291
31 December 2013
Gross impaired
loans
Individually assessed
impairment allowances
Collectively assessed
impairment allowances
Charged to profit or loss
during the year
Written off during
the year
Manufacturing 38,091 (24,252) (34,046) 13,341 4,023Transportation, storage and postal services 5,297 (3,715) (23,636) 3,312 11

China Construction Bank CorporationHalf-Year Report 2014 123
(Expressed in millions of RMB, unless otherwise stated)Notes to the Financial Statements
60 Risk management (continued)
(1) Credit risk (continued)
(d) Loans and advances to customers analysed by geographical sector concentrationsGroup
30 June 2014 31 December 2013
Gross loan
balance Percentage
Balance secured by
collateral
Gross loan
balance Percentage
Balance secured by
collateral
Yangtze River Delta 1,859,048 20.23% 1,200,059 1,781,649 20.74% 1,142,213Bohai Rim 1,576,590 17.15% 716,658 1,442,213 16.79% 642,830Western 1,565,039 17.03% 924,163 1,461,129 17.01% 859,316Central 1,479,243 16.10% 882,168 1,358,192 15.81% 798,619Pearl River Delta 1,278,833 13.91% 858,083 1,220,420 14.21% 811,547Northeastern 537,999 5.85% 289,267 507,751 5.91% 269,978Head office 294,969 3.21% 407 280,597 3.27% 407Overseas 598,880 6.52% 68,893 538,106 6.26% 76,094
Gross loans and advances to customers 9,190,601 100.00% 4,939,698 8,590,057 100.00% 4,601,004
Details of impaired loans and impairment allowances in respect of geographical sectors are as follows:
30 June 2014
Gross impaired loansIndividually assessed
impairment allowancesCollectively assessed
impairment allowances
Yangtze River Delta 41,963 (24,062) (40,387)Central 14,729 (7,850) (29,946)Pearl River Delta 14,722 (8,114) (28,434)Bohai Rim 8,394 (4,763) (31,095)Western 7,417 (5,004) (33,812)Northeastern 4,670 (3,099) (12,104)Head Office 3,100 (783) (7,051)Overseas 673 (319) (1,267)
Total 95,668 (53,994) (184,096)
31 December 2013
Gross impaired loansIndividually assessed
impairment allowancesCollectively assessed
impairment allowances
Yangtze River Delta 40,844 (25,356) (39,041)Central 12,052 (7,109) (28,126)Pearl River Delta 10,680 (6,045) (27,414)Bohai Rim 6,695 (4,339) (30,144)Western 7,221 (4,940) (31,375)Northeastern 4,551 (3,236) (11,094)Head Office 2,645 (785) (6,074)Overseas 576 (327) (3,291)
Total 85,264 (52,137) (176,559)
The definitions of geographical segments are set out in note 55(1).

124 China Construction Bank Corporation Half-Year Report 2014
(Expressed in millions of RMB, unless otherwise stated)Notes to the Financial Statements
60 Risk management (continued)
(1) Credit risk (continued)
(d) Loans and advances to customers analysed by geographical sector concentrations (continued)Bank
30 June 2014 31 December 2013
Gross loan
balance Percentage
Balance secured by
collateral
Gross loan
balance Percentage
Balance secured by
collateral
Yangtze River Delta 1,850,046 20.90% 1,196,252 1,773,136 21.49% 1,138,800Bohai Rim 1,500,463 16.95% 687,865 1,381,443 16.74% 619,733Western 1,564,754 17.68% 924,079 1,460,804 17.70% 859,222Central 1,478,267 16.70% 881,843 1,357,198 16.45% 798,306Pearl River Delta 1,278,833 14.45% 858,083 1,220,420 14.79% 811,547Northeastern 537,876 6.08% 289,171 507,649 6.15% 269,895Head office 294,969 3.33% 407 280,597 3.40% 407Overseas 346,191 3.91% 19,504 270,873 3.28% 12,852
Gross loans and advances to customers 8,851,399 100.00% 4,857,204 8,252,120 100.00% 4,510,762
Details of impaired loans and impairment allowances in respect of geographical sectors are as follows:
30 June 2014
Gross impaired loansIndividually assessed
impairment allowancesCollectively assessed
impairment allowances
Yangtze River Delta 41,818 (24,016) (40,136)Central 14,722 (7,847) (29,908)Pearl River Delta 14,722 (8,114) (28,434)Bohai Rim 8,250 (4,657) (29,848)Western 7,417 (5,004) (33,804)Northeastern 4,670 (3,099) (12,102)Head Office 3,100 (783) (7,051)Overseas 306 (183) (749)
Total 95,005 (53,703) (182,032)
31 December 2013
Gross impaired loansIndividually assessed
impairment allowancesCollectively assessed
impairment allowances
Yangtze River Delta 40,783 (25,342) (38,803)Central 12,046 (7,107) (28,093)Pearl River Delta 10,680 (6,045) (27,414)Bohai Rim 6,558 (4,236) (29,162)Western 7,221 (4,940) (31,368)Northeastern 4,551 (3,236) (11,092)Head Office 2,645 (785) (6,074)Overseas 297 (194) (2,814)
Total 84,781 (51,885) (174,820)
The definitions of geographical segments are set out in note 55(1).

China Construction Bank CorporationHalf-Year Report 2014 125
(Expressed in millions of RMB, unless otherwise stated)Notes to the Financial Statements
60 Risk management (continued)
(1) Credit risk (continued)
(e) Loans and advances to customers analysed by types of collateralGroup Bank
30 June 2014 31 December 2013 30 June 2014 31 December 2013
Unsecured loans 2,462,443 2,336,298 2,282,738 2,139,243Guaranteed loans 1,788,460 1,652,755 1,711,457 1,602,115Loans secured by tangible assets other than monetary assets 4,019,898 3,734,986 3,957,041 3,659,209Loans secured by monetary assets 919,800 866,018 900,163 851,553
Gross loans and advances to customers 9,190,601 8,590,057 8,851,399 8,252,120
(f) Rescheduled loans and advances to customersAs at 30 June 2014 and 31 December 2013, the balance of rescheduled loans and advances were not significant.
(g) Distribution of amounts due from banks and non-bank financial institutions in terms of credit quality is as follows:Amount due from banks and non-bank financial institutions includes deposits and placements with banks and non-bank financial institutions, and financial assets held under resale agreements of which counterparties are banks and non-bank financial institutions.
Group Bank
30 June 2014 31 December 2013 30 June 2014 31 December 2013
Individually assessed and impaired gross amount 38 38 35 35Allowances for impairment losses (34) (34) (31) (31)
Subtotal 4 4 4 4
Neither overdue nor impaired – grade A to AAA 878,136 656,824 933,200 745,727 – grade B to BBB 4,821 3,688 3,719 3,231 – unrated 75,456 94,282 68,266 94,211
Subtotal 958,413 754,794 1,005,185 843,169
Total 958,417 754,798 1,005,189 843,173
Amounts neither overdue nor impaired are analysed above according to the Group and the Bank’s internal credit rating. Unrated amounts due from banks and non-bank financial institutions include amounts due from a number of banks and non-bank financial institutions for which the Group and the Bank have not assigned internal credit ratings.

126 China Construction Bank Corporation Half-Year Report 2014
(Expressed in millions of RMB, unless otherwise stated)Notes to the Financial Statements
60 Risk management (continued)
(1) Credit risk (continued)
(h) Distribution of debt investments analysed by ratingThe Group adopts a credit rating approach to manage the credit risk of the debt investments portfolio held. The ratings are obtained from Bloomberg Composite, or major rating agencies where the issuers of the debt investments are located. The carrying amounts of the debt investments analysed by the rating agency designations as at the end of the reporting period are as follows:
Group
30 June 2014
Unrated AAA AA ALower than A Total
Individually assessed and impaired gross amount – Banks and non-bank
financial institutions 815 – – – 2,188 3,003 – Other enterprises 2,308 2,815 – – – 5,123
Total 3,123 2,815 – – 2,188 8,126
Allowances for impairment losses (2,756)
Subtotal 5,370
Neither overdue nor impaired – Government 1,078,026 1,547 22,323 1,008 – 1,102,904 – Central banks 183,588 920 2,561 – 2,342 189,411 – Policy banks 492,346 – 1,093 63 – 493,502 – Banks and non-bank
financial institutions 1,187,381 52,926 14,750 9,738 5,084 1,269,879 – Cinda 18,852 – – – – 18,852 – Public sector entities – 19 – – – 19 – Other enterprises 59,827 348,324 6,125 1,971 451 416,698
Total 3,020,020 403,736 46,852 12,780 7,877 3,491,265
Allowances for impairment losses (4,660)
Subtotal 3,486,605
Total 3,491,975

China Construction Bank CorporationHalf-Year Report 2014 127
(Expressed in millions of RMB, unless otherwise stated)Notes to the Financial Statements
60 Risk management (continued)
(1) Credit risk (continued)
(h) Distribution of debt investments analysed by rating (continued)Group (continued)
31 December 2013
Unrated AAA AA ALower than A Total
Individually assessed and impaired gross amount – Banks and non-bank
financial institutions 1,562 – – 397 3,472 5,431 – Other enterprises 812 2,677 – – – 3,489
Total 2,374 2,677 – 397 3,472 8,920
Allowances for impairment losses (3,947)
Subtotal 4,973
Neither overdue nor impaired – Government 1,052,672 2,583 20,061 218 – 1,075,534 – Central banks 189,460 3,989 2,600 – 2,332 198,381 – Policy banks 445,322 – 465 63 – 445,850 – Banks and non-bank
financial institutions 1,094,536 56,994 10,062 7,167 3,364 1,172,123 – Cinda 18,852 – – – – 18,852 – Public sector entities – 19 79 – – 98 – Other enterprises 71,413 392,075 16,290 2,117 826 482,721
Total 2,872,255 455,660 49,557 9,565 6,522 3,393,559
Allowances for impairment losses (4,101)
Subtotal 3,389,458
Total 3,394,431

128 China Construction Bank Corporation Half-Year Report 2014
(Expressed in millions of RMB, unless otherwise stated)Notes to the Financial Statements
60 Risk management (continued)
(1) Credit risk (continued)
(h) Distribution of debt investments analysed by rating (continued)Bank
30 June 2014
Unrated AAA AA ALower
than A Total
Individually assessed and impaired gross amount – Banks and non-bank
financial institutions 815 – – – 2,188 3,003 – Other enterprises 11 2,815 – – – 2,826
Total 826 2,815 – – 2,188 5,829
Allowances for impairment losses (2,628)
Subtotal 3,201
Neither overdue nor impaired – Government 1,076,346 1,539 5,542 629 – 1,084,056 – Central banks 181,868 920 1,600 – 2,342 186,730 – Policy banks 492,346 – – 63 – 492,409 – Banks and non-bank
financial institutions 1,183,241 49,579 5,144 7,623 4,567 1,250,154 – Cinda 18,852 – – – – 18,852 – Other enterprises 52,174 340,198 4,859 1,448 419 399,098
Total 3,004,827 392,236 17,145 9,763 7,328 3,431,299
Allowances for impairment losses (4,660)
Subtotal 3,426,639
Total 3,429,840
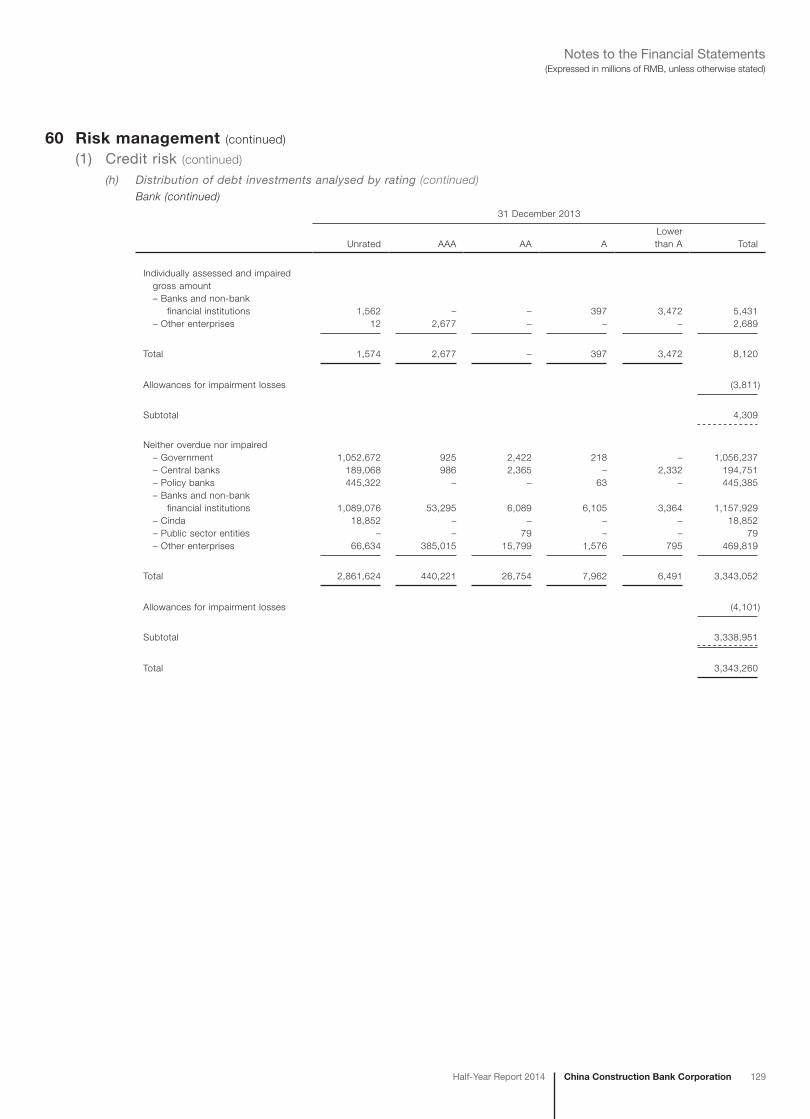
China Construction Bank CorporationHalf-Year Report 2014 129
(Expressed in millions of RMB, unless otherwise stated)Notes to the Financial Statements
60 Risk management (continued)
(1) Credit risk (continued)
(h) Distribution of debt investments analysed by rating (continued)Bank (continued)
31 December 2013
Unrated AAA AA ALower
than A Total
Individually assessed and impaired gross amount – Banks and non-bank
financial institutions 1,562 – – 397 3,472 5,431 – Other enterprises 12 2,677 – – – 2,689
Total 1,574 2,677 – 397 3,472 8,120
Allowances for impairment losses (3,811)
Subtotal 4,309
Neither overdue nor impaired – Government 1,052,672 925 2,422 218 – 1,056,237 – Central banks 189,068 986 2,365 – 2,332 194,751 – Policy banks 445,322 – – 63 – 445,385 – Banks and non-bank
financial institutions 1,089,076 53,295 6,089 6,105 3,364 1,157,929 – Cinda 18,852 – – – – 18,852 – Public sector entities – – 79 – – 79 – Other enterprises 66,634 385,015 15,799 1,576 795 469,819
Total 2,861,624 440,221 26,754 7,962 6,491 3,343,052
Allowances for impairment losses (4,101)
Subtotal 3,338,951
Total 3,343,260

130 China Construction Bank Corporation Half-Year Report 2014
(Expressed in millions of RMB, unless otherwise stated)Notes to the Financial Statements
60 Risk management (continued)
(1) Credit risk (continued)
(i) Credit risk arising from the Group’s derivatives exposuresThe majority of the Group’s derivatives transactions with domestic customers are hedged back-to-back with overseas banks and non-bank financial institutions. The Group is exposed to credit risk both in respect of the domestic customers and the overseas banks and non-bank financial institutions. The Group manages this risk by monitoring this exposure on a regular basis.
(j) Settlement riskThe Group’s activities may give rise to settlement risk at the time of the settlement of transactions and trades. Settlement risk is the risk of loss due to the failure of an entity to honour its obligations to deliver cash, securities or other assets as contractually agreed.
For certain types of transactions, the Group mitigates this risk by conducting settlements through a settlement or clearing agent to ensure that a trade is settled only when both parties have fulfilled their contractual settlement obligations.
(2) Market riskMarket risk is the risk of loss, in respect of the Group’s on and off balance sheet activities, arising from adverse movements in market rates including interest rates, foreign exchange rates, commodity prices and stock prices. Market risk arises from both the Group’s trading and non-trading business. A trading book consists of positions in financial instruments and commodities held either with trading intent or in order to hedge other elements of the trading book. Non-trading book records those financial instruments and commodities which are not included in the trading book.
The Risk Management Department is responsible for formulating standardised market risk management policies and rules and supervising their implementation in the Bank. The Asset and Liability Management Department (the “ALM”) and the International Business Department are responsible for managing the size and structure of the assets and liabilities in response to non-trading market risk. The Financial Market Department manages the Head Office’s RMB and foreign currency investment portfolios, conducts proprietary and customer-driven transactions, as well as implementing market risk management policies and rules. The Audit Department is responsible for regularly performing independent audits of the reliability and effectiveness of the processes constituting the risk management system.
The Group’s interest rate risk mainly comprises repricing risk and basis risk arising from mismatch of term structure and pricing basis of assets and liabilities. The Group uses multiple tools such as repricing gap analysis, sensitivity analysis on net interest income, scenario analysis and stress testing, etc. to monitor the interest rate risk periodically.
The Group’s foreign exchange exposure mainly comprises exposures from foreign currency portfolios within treasury proprietary investments in debt securities and money market placements, and currency exposures from its overseas business. The Group manages its foreign exchange exposure by spot foreign exchange transactions and by matching its foreign currency denominated assets with corresponding liabilities in the same currency, and also uses derivatives in the management of its own foreign currency asset and liability portfolios and structural positions.
The Group is also exposed to market risk in respect of its customer driven derivatives portfolio and manages this risk by entering into back-to-back hedging transactions on a trade-by-trade basis with overseas banks and non-bank financial institutions.
The Group considers that the market risk arising from stock prices in respect of its investment portfolios is minimal.
The Group monitors market risk separately in respect of trading portfolios and non-trading portfolios. Trading portfolios include exchange rate and interest rate derivatives as well as trading securities. The historical simulation model for the Value-at-risk (“VaR”) analysis is a major tool used by the Bank to measure and monitor the market risk of its trading portfolio. Net interest income sensitivity analysis, interest rate repricing gap analysis and foreign exchange risk concentration analysis are the major tools used by the Group to monitor the market risk of its overall businesses.
(a) VaR analysisVaR is a technique which estimates the potential losses that could occur on risk positions taken, due to movements in market interest rates, foreign exchange rates and other market prices over a specified time horizon and at a given level of confidence. The Risk Management Department calculates interest rates, foreign exchange rates and commodity prices VaR for the Bank’s trading portfolio. By reference to historical movements in interest rates, foreign exchange rates and commodity prices, the Risk Management Department calculates VaR on a daily basis for the trading portfolio and monitors it regularly. VaR is calculated at a confidence level of 99% and with a holding period of one day.

China Construction Bank CorporationHalf-Year Report 2014 131
(Expressed in millions of RMB, unless otherwise stated)Notes to the Financial Statements
60 Risk management (continued)
(2) Market risk (continued)
(a) VaR analysis (continued)A summary of the VaR of the Bank’s trading portfolio as at the end of the reporting period and during the respective periods is as follows:
Six months ended 30 June 2014
30 June Average Maximum Minimum
VaR of trading portfolio 47 84 137 47 – Interest rate risk 24 31 115 9 – Foreign exchange risk(i) 39 75 119 38 – Commodity risk – 1 5 –
Six months ended 30 June 2013
30 June Average Maximum Minimum
VaR of trading portfolio 75 34 75 14 – Interest rate risk 86 21 86 6 – Foreign exchange risk(i) 15 26 57 12 – Commodity risk 2 2 18 –
(i) The VaR in relation to bullion is included in foreign exchange risk above.
VaR for each risk factor is the independently derived largest potential loss in a specific holding period and within a certain confidence level due to fluctuations solely in that risk factor. The individual VaRs did not add up to the total VaR as there was diversification effect due to correlation amongst the risk factors.
Although VaR is an important tool for measuring market risk, the assumptions on which the model is based give rise to some limitations, including the following:
– A 1-day holding period assumes that it is possible to hedge or dispose of positions within that period. This is considered to be a realistic assumption in almost all cases but may not be the case in situations in which there is severe market illiquidity for a prolonged period;
– A 99 percent confidence level does not reflect losses that may occur beyond this level. Within the model used there is 1 percent probability that losses could exceed the VaR;
– VaR is calculated on an end-of-day basis and does not reflect exposures that may arise on positions during the trading day;
– The use of historical data as a basis for determining the possible range of future outcomes may not always cover all possible scenarios, especially those of an exceptional nature; and
– The VaR measure is dependent upon the Bank’s position and the volatility of market prices. The VaR of an unchanged position reduces if the market price volatility declines and vice versa.
(b) Net interest income sensitivity analysisIn monitoring interest rate risk on its overall non-derivative financial assets and liabilities, the Bank regularly measures its future net interest income sensitivity to an increase or decrease in market interest rates (assuming no asymmetrical movement in yield curves and a constant financial position). An incremental 100 basis points parallel fall or rise in all yield curves, other than that applicable to balances with central banks, would increase or decrease annualised net interest income of the Group by RMB50,143 million (as at 31 December 2013: RMB40,135 million). Had the impact of yield curves movement for demand deposits from customers been excluded, the annualised net interest income of the Group would decrease or increase by RMB20,653 million (as at 31 December 2013: RMB31,468 million).
The above interest rate sensitivity is for illustration purpose only and is assessed based on simplified assumptions. The figures here indicate estimated net interest income movements under various predicted yield curve scenarios and are subject to the Bank’s current interest rate exposures. However, the possible risk management measures that can be undertaken by the interest risk management department or related business departments to mitigate interest rate risk have not been taken into account. In practice, the departments that manage the interest rate risk strive to reduce loss arising from the risk while increasing the net income. These figures are estimated on the assumption that the interest rates on various maturities will move within similar ranges, and therefore do not reflect the potential net interest income changes in the event that interest rates on some maturities may change and others remain unchanged. Moreover, the above estimations are based on other simplified assumptions, including that all positions will be held to maturity and rolled over upon maturity.

132 China Construction Bank Corporation Half-Year Report 2014
(Expressed in millions of RMB, unless otherwise stated)Notes to the Financial Statements
60 Risk management (continued)
(2) Market risk (continued)
(c) Interest rate riskInterest rate risk refers to the risk where the market interest rates, term structure and other factors may experience unfavourable fluctuations which impact the overall profitability and fair value resulting in losses to the Bank. The key determinants of the Group’s interest rate risk arises from the mismatch between the maturity periods of the assets and liabilities, and inconsistent pricing basis, resulting in re-pricing risk and basis risk.
The ALM is responsible for regularly monitoring the interest rate risk positions and measuring the interest rate re-pricing gap. The main reason for measuring the interest rate re-pricing gap is to assist in analysing the impact of interest rate changes on net interest income.
The following tables indicate the effective interest rate (“EIR”) for the respective period, and the expected next repricing dates (or maturity dates whichever are earlier) for the assets and liabilities of the Group as at the end of the reporting period.
Group
30 June 2014
Note
Effective interest
rate (i)
Non-interest
bearing
Within three
months
Between three
months and one
year
Between one year and five
yearsMore than five years Total
AssetsCash and deposits with central banks 1.55% 130,592 2,447,444 – – – 2,578,036Deposits and placements with banks and non-bank financial institutions 4.66% – 445,214 155,455 6,088 – 606,757Financial assets held under resale agreements 5.40% – 293,594 58,066 – – 351,660Loans and advances to customers (ii) 5.83% – 2,426,023 6,382,229 68,306 75,953 8,952,511Investments (iii) 4.03% 22,302 504,339 483,202 1,405,768 1,098,666 3,514,277Other assets – 396,549 – – – – 396,549
Total assets 4.72% 549,443 6,116,614 7,078,952 1,480,162 1,174,619 16,399,790
LiabilitiesBorrowings from central banks 2.67% – 1,816 24,401 – – 26,217Deposits and placements from banks and non-bank financial institutions 3.55% – 831,756 217,230 5,502 – 1,054,488Financial liabilities at fair value through profit or loss 1.45% 17,420 271,688 76,328 – – 365,436Financial assets sold under repurchase agreements 1.75% – 3,031 34 – – 3,065Deposits from customers 1.90% 95,949 8,750,407 2,907,278 1,195,240 8,082 12,956,956Debt securities issued 3.05% – 118,038 147,598 50,512 112,376 428,524Other liabilities – 418,092 – – – – 418,092
Total liabilities 2.10% 531,461 9,976,736 3,372,869 1,251,254 120,458 15,252,778
Asset-liability gap 2.62% 17,982 (3,860,122) 3,706,083 228,908 1,054,161 1,147,012

China Construction Bank CorporationHalf-Year Report 2014 133
(Expressed in millions of RMB, unless otherwise stated)Notes to the Financial Statements
60 Risk management (continued)
(2) Market risk (continued)
(c) Interest rate risk (continued)Group (continued)
31 December 2013
Note
Effective interest
rate (i)
Non-interest bearing
Within three
months
Between three
months and one
year
Between one year
and five years
More than five years Total
AssetsCash and deposits with central banks 1.55% 120,044 2,354,957 – – – 2,475,001Deposits and placements with banks and non-bank financial institutions 3.85% – 320,488 146,374 6,489 – 473,351Financial assets held under resale agreements 4.22% – 279,292 2,155 – – 281,447Loans and advances to customers (ii) 5.79% – 4,432,346 3,800,494 58,818 69,703 8,361,361Investments (iii) 3.74% 22,811 522,349 542,287 1,277,382 1,052,412 3,417,241Other assets – 354,809 – – – – 354,809
Total assets 4.54% 497,664 7,909,432 4,491,310 1,342,689 1,122,115 15,363,210
LiabilitiesBorrowings from central banks 3.61% – 75,197 3,960 – – 79,157Deposits and placements from banks and non-bank financial institutions 2.45% – 770,665 71,116 6,231 – 848,012Financial liabilities at fair value through profit or loss 1.37% 24,186 267,224 88,970 – – 380,380Financial assets sold under repurchase agreements 3.70% – 61,807 66 – – 61,873Deposits from customers 1.89% 74,794 8,587,466 2,462,729 1,089,647 8,401 12,223,037Debt securities issued 3.29% – 110,950 103,031 5,699 137,860 357,540Other liabilities – 338,882 – – – – 338,882
Total liabilities 1.98% 437,862 9,873,309 2,729,872 1,101,577 146,261 14,288,881
Asset-liability gap 2.56% 59,802 (1,963,877) 1,761,438 241,112 975,854 1,074,329
(i) Effective interest rate represents the ratio of interest income/expense to average interest bearing assets/liabilities.
(ii) For loans and advances to customers, the “within three months” category includes overdue amounts (net of allowances for impairment losses) of RMB58,468 million as at 30 June 2014 (31 December 2013: RMB33,014 million).
(iii) Investments include financial assets at fair value through profit or loss, available-for-sale financial assets, held-to-maturity investment, debt securities classified as receivables and investments in associates and joint ventures.

134 China Construction Bank Corporation Half-Year Report 2014
(Expressed in millions of RMB, unless otherwise stated)Notes to the Financial Statements
60 Risk management (continued)
(2) Market risk (continued)
(c) Interest rate risk (continued)Bank
30 June 2014
Note
Effective interest
rate (i)
Non-interest bearing
Within three
months
Between three
monthsand one
year
Between one year and five
yearsMore than five years Total
AssetsCash and deposits with central banks 1.55% 121,570 2,443,451 – – – 2,565,021Deposits and placements with banks and non-bank financial institutions 4.10% – 483,298 170,279 800 – 654,377Financial assets held under resale agreements 5.39% – 292,746 58,066 – – 350,812Loans and advances to customers (ii) 5.92% – 2,255,207 6,224,460 60,776 75,221 8,615,664Investments (iii) 4.04% 27,818 491,936 465,824 1,382,746 1,089,333 3,457,657Other assets – 410,624 – – – – 410,624
Total assets 4.73% 560,012 5,966,638 6,918,629 1,444,322 1,164,554 16,054,155
LiabilitiesBorrowings from central banks 2.65% – 1,756 23,939 – – 25,695Deposits and placements from banks and non-bank financial institutions 3.47% – 825,003 184,641 4,281 – 1,013,925Financial liabilities at fair value through profit or loss 1.45% 15,979 271,539 75,263 – – 362,781Financial assets sold under repurchase agreements 3.20% – 339 34 – – 373Deposits from customers 1.91% 70,195 8,650,611 2,845,875 1,192,049 8,012 12,766,742Debt securities issued 3.13% – 109,191 120,049 39,819 109,895 378,954Other liabilities – 377,443 – – – – 377,443
Total liabilities 2.10% 463,617 9,858,439 3,249,801 1,236,149 117,907 14,925,913
Asset-liability gap 2.63% 96,395 (3,891,801) 3,668,828 208,173 1,046,647 1,128,242

China Construction Bank CorporationHalf-Year Report 2014 135
(Expressed in millions of RMB, unless otherwise stated)Notes to the Financial Statements
60 Risk management (continued)
(2) Market risk (continued)
(c) Interest rate risk (continued)Bank (continued)
31 December 2013
Note
Effective interest
rate (i)
Non-interest bearing
Within three
months
Between three
months and one
year
Between one year
and five years
More than five years Total
AssetsCash and deposits with central banks 1.56% 118,085 2,351,412 – – – 2,469,497Deposits and placements with banks and non-bank financial institutions 3.55% – 396,196 164,017 2,001 – 562,214Financial assets held under resale agreements 4.21% – 278,899 2,060 – – 280,959Loans and advances to customers (ii) 5.86% – 4,183,932 3,719,832 52,504 69,147 8,025,415Investments (iii) 3.76% 28,336 513,309 522,551 1,263,447 1,043,953 3,371,596Other assets – 373,716 – – – – 373,716
Total assets 4.56% 520,137 7,723,748 4,408,460 1,317,952 1,113,100 15,083,397
LiabilitiesBorrowings from central banks 3.62% – 74,913 3,820 – – 78,733Deposits and placements from banks and non-bank financial institutions 2.36% – 770,385 50,264 6,317 – 826,966Financial liabilities at fair value through profit or loss 1.37% 21,627 267,134 88,970 – – 377,731Financial assets sold under repurchase agreements 3.93% – 55,408 49 – – 55,457Deposits from customers 1.89% 52,003 8,485,968 2,422,140 1,087,339 8,327 12,055,777Debt securities issued 3.37% – 98,178 81,607 4,761 137,860 322,406Other liabilities – 307,726 – – – – 307,726
Total liabilities 1.98% 381,356 9,751,986 2,646,850 1,098,417 146,187 14,024,796
Asset-liability gap 2.58% 138,781 (2,028,238) 1,761,610 219,535 966,913 1,058,601
(i) Effective interest rate represents the ratio of interest income/expense to average interest bearing assets/liabilities.
(ii) For loans and advances to customers, the “within three months” category includes overdue amounts (net of allowances for impairment losses) of RMB57,375 million as at 30 June 2014 (31 December 2013: RMB32,281 million).
(iii) Investments include financial assets at fair value through profit or loss, available-for-sale financial assets, held-to-maturity investments, debt securities classified as receivables and investments in subsidiaries.

136 China Construction Bank Corporation Half-Year Report 2014
(Expressed in millions of RMB, unless otherwise stated)Notes to the Financial Statements
60 Risk management (continued)
(2) Market risk (continued)
(d) Currency riskThe Group’s foreign exchange exposure mainly comprises exposures that arise from the foreign currency portfolio within the Treasury Department’s proprietary investments, and currency exposures originated by the Group’s overseas businesses.
The Group manages currency risk by spot and forward foreign exchange transactions and by matching its foreign currency denominated assets with corresponding liabilities in the same currency, and also uses derivatives (principally foreign exchange swaps and cross currency swaps) in the management of its own foreign currency asset and liability portfolios and structural positions.
The currency exposures of the Group’s and the Bank’s assets and liabilities as at the end of the reporting period are as follows:
Group
30 June 2014
Note RMBUSD (RMB equivalent)
Others (RMB equivalent) Total
AssetsCash and deposits with central banks 2,501,258 55,139 21,639 2,578,036Deposits and placements with banks and non-bank financial institutions (i) 784,852 130,151 43,414 958,417Loans and advances to customers 8,151,113 645,460 155,938 8,952,511Investments 3,444,822 34,130 35,325 3,514,277Other assets 316,454 70,698 9,397 396,549
Total assets 15,198,499 935,578 265,713 16,399,790
LiabilitiesBorrowings from central banks 7,862 6,394 11,961 26,217Deposits and placements from banks and non-bank financial institutions (ii) 758,408 235,713 63,432 1,057,553Financial liabilities at fair value through profit or loss 318,299 45,472 1,665 365,436Deposits from customers 12,313,023 454,822 189,111 12,956,956Debt securities issued 253,317 130,313 44,894 428,524Other liabilities 405,083 4,730 8,279 418,092
Total liabilities 14,055,992 877,444 319,342 15,252,778
Net position 1,142,507 58,134 (53,629) 1,147,012
Net notional amount of derivatives (19,322) (5,140) 69,117 44,655

China Construction Bank CorporationHalf-Year Report 2014 137
(Expressed in millions of RMB, unless otherwise stated)Notes to the Financial Statements
60 Risk management (continued)
(2) Market risk (continued)
(d) Currency risk (continued)Group (continued)
As at 31 December 2013
Note RMBUSD (RMB equivalent)
Others (RMB equivalent) Total
AssetsCash and deposits with central banks 2,413,749 42,686 18,566 2,475,001Deposits and placements with banks and non-bank financial institutions (i) 690,739 41,085 22,974 754,798Loans and advances to customers 7,638,028 578,993 144,340 8,361,361Investments 3,347,244 37,588 32,409 3,417,241Other assets 274,723 25,181 54,905 354,809
Total assets 14,364,483 725,533 273,194 15,363,210
LiabilitiesBorrowings from central banks 64,036 12,204 2,917 79,157Deposits and placements from banks and non-bank financial institutions (ii) 673,603 159,230 77,052 909,885Financial liabilities at fair value through profit or loss 342,910 34,499 2,971 380,380Deposits from customers 11,796,856 262,112 164,069 12,223,037Debt securities issued 229,256 93,641 34,643 357,540Other liabilities 325,287 11,355 2,240 338,882
Total liabilities 13,431,948 573,041 283,892 14,288,881
Net position 932,535 152,492 (10,698) 1,074,329
Net notional amount of derivatives 63,418 (122,067) 99,519 40,870
(i) Including financial assets held under resale agreements.
(ii) Including financial assets sold under repurchase agreements.

138 China Construction Bank Corporation Half-Year Report 2014
(Expressed in millions of RMB, unless otherwise stated)Notes to the Financial Statements
60 Risk management (continued)
(2) Market risk (continued)
(d) Currency risk (continued)Bank
As at 30 June 2014
Note RMBUSD (RMB equivalent)
Others (RMB equivalent) Total
AssetsCash and deposits with central banks 2,497,183 55,131 12,707 2,565,021Deposits and placements with banks and non-bank financial institutions (i) 785,097 175,918 44,174 1,005,189Loans and advances to customers 7,985,857 551,269 78,538 8,615,664Investments 3,418,859 15,631 23,167 3,457,657Other assets 326,394 80,260 3,970 410,624
Total assets 15,013,390 878,209 162,556 16,054,155
LiabilitiesBorrowings from central banks 7,340 6,394 11,961 25,695Deposits and placements from banks and non-bank financial institutions (ii) 726,625 223,246 64,427 1,014,298Financial liabilities at fair value through profit or loss 317,174 45,449 158 362,781Deposits from customers 12,250,464 422,690 93,588 12,766,742Debt securities issued 231,077 108,753 39,124 378,954Other liabilities 368,175 7,388 1,880 377,443
Total liabilities 13,900,855 813,920 211,138 14,925,913
Net position 1,112,535 64,289 (48,582) 1,128,242
Net notional amount of derivatives (4,771) 249 49,503 44,981

China Construction Bank CorporationHalf-Year Report 2014 139
(Expressed in millions of RMB, unless otherwise stated)Notes to the Financial Statements
60 Risk management (continued)
(2) Market risk (continued)
(d) Currency risk (continued)Bank (continued)
31 December 2013
Note RMBUSD (RMB equivalent)
Others (RMB equivalent) Total
AssetsCash and deposits with central banks 2,410,124 42,676 16,697 2,469,497Deposits and placements with banks and non-bank financial institutions (i) 738,662 79,246 25,265 843,173Loans and advances to customers 7,474,265 473,228 77,922 8,025,415Investments 3,331,288 20,031 20,277 3,371,596Other assets 287,936 35,823 49,957 373,716
Total assets 14,242,275 651,004 190,118 15,083,397
LiabilitiesBorrowings from central banks 63,612 12,204 2,917 78,733Deposits and placements from banks and non-bank financial institutions (ii) 652,822 154,232 75,369 882,423Financial liabilities at fair value through profit or loss 342,994 34,473 264 377,731Deposits from customers 11,740,978 240,597 74,202 12,055,777Debt securities issued 209,022 81,192 32,192 322,406Other liabilities 298,675 8,403 648 307,726
Total liabilities 13,308,103 531,101 185,592 14,024,796
Net position 934,172 119,903 4,526 1,058,601
Net notional amount of derivatives 48,626 (76,668) 68,576 40,534
(i) Including financial assets held under resale agreements.
(ii) Including financial assets sold under repurchase agreements.
(3) Liquidity riskLiquidity risk is the type of risk that occurs when, despite its debt servicing ability, the Group cannot obtain sufficient funds in time, or obtain sufficient funds at a reasonable cost, to meet the needs of asset growth or repay liabilities when they are due. It is caused by mismatches of assets and liabilities in terms of their amounts and maturity dates. In accordance with liquidity policies, the Group monitors the future cash flows to ensure that an appropriate level of highly liquid assets is maintained.
At the Group level, liquidity is managed and coordinated through the ALM Department. The ALM Department is responsible for formulation of the liquidity policies in accordance with regulatory requirements and prudential principles. Such policies include:
– adopting a prudent strategy and ensuring sufficient funds are available at any moment to satisfy any payment request;
– optimising the Group’s asset and liability structure, diversifying and stabilising the source of funds, and reserving an appropriate proportion of highly credit-rated and liquid asset portfolio; and
– managing and utilising centrally the Bank’s liquid funds.
The Group uses a variety of methods including liquidity index analysis, analysis of remaining contractual maturities and undiscounted cash flow analysis to measure the liquidity risk. Gap analysis is used to predict the cash flow within one year. Various types of scenario analysis are then applied to assess the impact of liquidity risk.

140 China Construction Bank Corporation Half-Year Report 2014
(Expressed in millions of RMB, unless otherwise stated)Notes to the Financial Statements
60 Risk management (continued)
(3) Liquidity risk (continued)
(a) Maturity analysisThe following tables provide an analysis of the assets and liabilities of the Group and the Bank based on the remaining periods to repayment as at the end of the reporting period:
Group30 June 2014
IndefiniteRepayable
on demandWithin
one month
Between one to three
months
Betweenthree months
to one year
Between one to
five yearsMore than five years Total
AssetsCash and deposits with central banks 2,362,350 215,686 – – – – – 2,578,036Deposits and placements with banks and non-bank financial institutions – 38,982 137,700 264,172 153,457 12,185 261 606,757Financial assets held under resale agreements – – 130,406 163,188 58,066 – – 351,660Loans and advances to customers 58,029 293,952 310,416 682,838 2,265,862 2,305,100 3,036,314 8,952,511Investments – Financial assets at fair value
through profit or loss 5,089 – 112,204 97,962 103,118 4,928 771 324,072 – Available-for-sale financial assets 17,376 – 25,943 48,420 89,425 377,387 216,249 774,800 – Held-to-maturity investments 1,895 – 15,370 46,809 131,384 1,185,589 839,537 2,220,584 – Debt securities classified
as receivables 1,058 – 702 1,950 15,653 64,956 107,695 192,014 – Investments in associates and
joint ventures 2,807 – – – – – – 2,807Other assets 191,281 47,418 27,105 61,176 59,942 8,261 1,366 396,549
Total assets 2,639,885 596,038 759,846 1,366,515 2,876,907 3,958,406 4,202,193 16,399,790
LiabilitiesBorrowings from central banks – – 1,270 546 24,401 – – 26,217Deposits and placements from banks and non-bank financial institutions – 418,172 192,136 219,492 217,340 7,348 – 1,054,488Financial liabilities at fair value through profit or loss – 17,420 105,934 165,754 76,328 – – 365,436Financial assets sold under repurchase agreements – – 2,767 264 34 – – 3,065Deposits from customers – 6,717,469 1,042,597 1,083,011 2,883,395 1,214,330 16,154 12,956,956Debt securities issued – Certificates of deposit issued – – 41,924 50,597 150,851 19,378 639 263,389 – Bonds issued – – – – 1,080 13,705 2,481 17,266 – Subordinated bonds issued – – – 10,000 – 27,974 109,895 147,869Other liabilities 145 88,199 109,653 41,286 132,507 41,764 4,538 418,092
Total liabilities 145 7,241,260 1,496,281 1,570,950 3,485,936 1,324,499 133,707 15,252,778
Long/(short) position 2,639,740 (6,645,222) (736,435) (204,435) (609,029) 2,633,907 4,068,486 1,147,012
Notional amount of derivatives – Interest rate contracts – – 4,475 62,681 91,894 50,208 2,994 212,252 – Exchange rate contracts – – 364,731 447,941 1,036,924 34,932 6,208 1,890,736 – Other contracts – – 8,981 6,213 14,066 660 31 29,951
Total – – 378,187 516,835 1,142,884 85,800 9,233 2,132,939

China Construction Bank CorporationHalf-Year Report 2014 141
(Expressed in millions of RMB, unless otherwise stated)Notes to the Financial Statements
60 Risk management (continued)
(3) Liquidity risk (continued)
(a) Maturity analysis (continued)Group (continued)
31 December 2013
IndefiniteRepayable
on demandWithin
one month
Between one to three
months
Between three months to one year
Between one to
five yearsMore than five years Total
AssetsCash and deposits with central banks 2,273,802 201,199 – – – – – 2,475,001Deposits and placements with banks and non-bank financial institutions – 27,128 186,236 103,997 143,951 11,770 269 473,351Financial assets held under resale agreements – – 275,970 3,322 2,155 – – 281,447Loans and advances to customers 32,338 270,466 294,347 603,488 2,230,532 2,108,254 2,821,936 8,361,361Investments – Financial assets at fair value
through profit or loss 6,521 – 77,927 137,091 101,473 38,201 2,837 364,050 – Available-for-sale financial assets 17,355 – 13,207 36,722 139,628 341,617 211,763 760,292 – Held-to-maturity investments 544 – 10,462 35,385 176,412 1,073,751 803,984 2,100,538 – Debt securities classified as
receivables 1,058 – 2 7,100 5,322 70,432 105,823 189,737 – Investments in associates and
joint ventures 2,624 – – – – – – 2,624Other assets 196,990 33,127 23,729 41,044 53,038 5,466 1,415 354,809
Total assets 2,531,232 531,920 881,880 968,149 2,852,511 3,649,491 3,948,027 15,363,210
LiabilitiesBorrowings from central banks – – 70,311 4,886 3,960 – – 79,157Deposits and placements from banks and non-bank financial institutions – 458,703 239,605 71,784 71,689 6,231 – 848,012Financial liabilities at fair value through profit or loss – 24,186 107,428 159,796 88,970 – – 380,380Financial assets sold under repurchase agreements – – 60,356 1,451 66 – – 61,873Deposits from customers – 6,653,089 944,140 1,060,733 2,458,328 1,093,697 13,050 12,223,037Debt securities issued – Certificates of deposit issued – – 37,525 42,833 98,893 13,867 631 193,749 – Bonds issued – – – – 499 3,434 – 3,933 – Subordinated bonds issued – – – 12,000 9,998 – 137,860 159,858Other liabilities 138 107,215 32,631 42,494 116,335 38,671 1,398 338,882
Total liabilities 138 7,243,193 1,491,996 1,395,977 2,848,738 1,155,900 152,939 14,288,881
Long/(short) position 2,531,094 (6,711,273) (610,116) (427,828) 3,773 2,493,591 3,795,088 1,074,329
Notional amount of derivatives – Interest rate contracts – – 6,575 38,615 167,937 45,075 4,252 262,454 – Exchange rate contracts – – 470,675 363,364 873,156 26,844 5,946 1,739,985 – Other contracts – – 3,978 2,459 8,684 653 – 15,774
Total – – 481,228 404,438 1,049,777 72,572 10,198 2,018,213

142 China Construction Bank Corporation Half-Year Report 2014
(Expressed in millions of RMB, unless otherwise stated)Notes to the Financial Statements
60 Risk management (continued)
(3) Liquidity risk (continued)
(a) Maturity analysis (continued)Bank
30 June 2014
IndefiniteRepayable
on demandWithin
one month
Between one to three
months
Between three months
to one year
Between one to five
yearsMore than five years Total
AssetsCash and deposits with central banks 2,359,918 205,103 – – – – – 2,565,021Deposits and placements with banks and non-bank financial institutions – 56,214 150,854 269,929 170,223 6,896 261 654,377Financial assets held under resale agreements – – 129,558 163,188 58,066 – – 350,812Loans and advances to customers 55,744 290,822 278,200 633,104 2,134,534 2,202,722 3,020,538 8,615,664Investments – Financial assets at fair value
through profit or loss – – 111,950 97,946 104,136 3,993 708 318,733 – Available-for-sale financial assets 8,751 – 24,658 45,215 76,251 357,569 212,071 724,515 – Held-to-maturity investments 449 – 15,370 45,622 131,374 1,184,876 837,546 2,215,237 – Debt securities classified as
receivables 368 – 149 – 14,515 57,735 104,401 177,168 – Investments in subsidiaries 22,004 – – – – – – 22,004Other assets 216,794 42,685 26,436 60,127 57,795 5,420 1,367 410,624
Total assets 2,664,028 594,824 737,175 1,315,131 2,746,894 3,819,211 4,176,892 16,054,155
LiabilitiesBorrowings from central banks – – 1,260 496 23,939 – – 25,695Deposits and placements from banks and non-bank financial institutions – 423,371 186,054 215,525 184,694 4,281 – 1,013,925Financial liabilities at fair value through profit or loss – 15,979 105,846 165,693 75,263 – – 362,781Financial assets sold under repurchase agreements – – 82 257 34 – – 373Deposits from customers – 6,692,070 994,189 1,029,016 2,824,312 1,211,043 16,112 12,766,742Debt securities issued – Certificates of deposit issued – – 40,396 47,087 121,471 17,495 639 227,088 – Bonds issued – – – – 499 3,498 – 3,997 – Subordinated bonds issued – – – 10,000 – 27,974 109,895 147,869Other liabilities 10 86,086 106,192 34,920 104,169 41,536 4,530 377,443
Total liabilities 10 7,217,506 1,434,019 1,502,994 3,334,381 1,305,827 131,176 14,925,913
Long/(short) position 2,664,018 (6,622,682) (696,844) (187,863) (587,487) 2,513,384 4,045,716 1,128,242
Notional amount of derivatives – Interest rate contracts – – 4,665 60,930 90,885 47,967 2,994 207,441 – Exchange rate contracts – – 295,867 391,922 860,198 22,560 6,208 1,576,755 – Other contracts – – 8,981 6,031 13,684 – – 28,696
Total – – 309,513 458,883 964,767 70,527 9,202 1,812,892
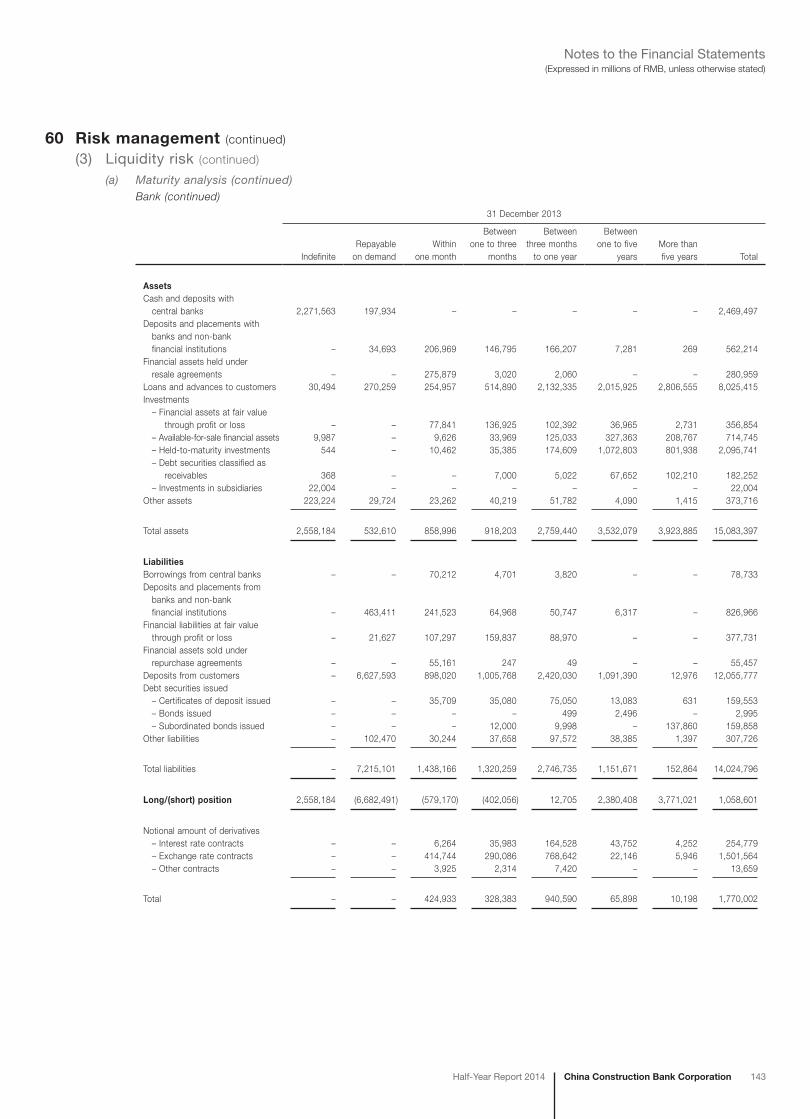
China Construction Bank CorporationHalf-Year Report 2014 143
(Expressed in millions of RMB, unless otherwise stated)Notes to the Financial Statements
60 Risk management (continued)
(3) Liquidity risk (continued)
(a) Maturity analysis (continued)Bank (continued)
31 December 2013
IndefiniteRepayable
on demandWithin
one month
Between one to three
months
Between three months to one year
Between one to five
yearsMore than five years Total
AssetsCash and deposits with central banks 2,271,563 197,934 – – – – – 2,469,497Deposits and placements with banks and non-bank financial institutions – 34,693 206,969 146,795 166,207 7,281 269 562,214Financial assets held under resale agreements – – 275,879 3,020 2,060 – – 280,959Loans and advances to customers 30,494 270,259 254,957 514,890 2,132,335 2,015,925 2,806,555 8,025,415Investments – Financial assets at fair value
through profit or loss – – 77,841 136,925 102,392 36,965 2,731 356,854 – Available-for-sale financial assets 9,987 – 9,626 33,969 125,033 327,363 208,767 714,745 – Held-to-maturity investments 544 – 10,462 35,385 174,609 1,072,803 801,938 2,095,741 – Debt securities classified as
receivables 368 – – 7,000 5,022 67,652 102,210 182,252 – Investments in subsidiaries 22,004 – – – – – – 22,004Other assets 223,224 29,724 23,262 40,219 51,782 4,090 1,415 373,716
Total assets 2,558,184 532,610 858,996 918,203 2,759,440 3,532,079 3,923,885 15,083,397
LiabilitiesBorrowings from central banks – – 70,212 4,701 3,820 – – 78,733Deposits and placements from banks and non-bank financial institutions – 463,411 241,523 64,968 50,747 6,317 – 826,966Financial liabilities at fair value through profit or loss – 21,627 107,297 159,837 88,970 – – 377,731Financial assets sold under repurchase agreements – – 55,161 247 49 – – 55,457Deposits from customers – 6,627,593 898,020 1,005,768 2,420,030 1,091,390 12,976 12,055,777Debt securities issued – Certificates of deposit issued – – 35,709 35,080 75,050 13,083 631 159,553 – Bonds issued – – – – 499 2,496 – 2,995 – Subordinated bonds issued – – – 12,000 9,998 – 137,860 159,858Other liabilities – 102,470 30,244 37,658 97,572 38,385 1,397 307,726
Total liabilities – 7,215,101 1,438,166 1,320,259 2,746,735 1,151,671 152,864 14,024,796
Long/(short) position 2,558,184 (6,682,491) (579,170) (402,056) 12,705 2,380,408 3,771,021 1,058,601
Notional amount of derivatives – Interest rate contracts – – 6,264 35,983 164,528 43,752 4,252 254,779 – Exchange rate contracts – – 414,744 290,086 768,642 22,146 5,946 1,501,564 – Other contracts – – 3,925 2,314 7,420 – – 13,659
Total – – 424,933 328,383 940,590 65,898 10,198 1,770,002

144 China Construction Bank Corporation Half-Year Report 2014
(Expressed in millions of RMB, unless otherwise stated)Notes to the Financial Statements
60 Risk management (continued)
(3) Liquidity risk (continued)
(b) Contractual undiscounted cash flowThe following tables provide an analysis of the contractual undiscounted cash flow of the non-derivative financial liabilities and off-balance sheet credit commitments of the Group and the Bank as at the end of the reporting period. The Group’s and the Bank’s expected cash flows on these instruments may vary significantly from this analysis.
Group30 June 2014
Carrying amount
Gross cash outflow
Repayable on demand
Within one month
Between one to three
months
Between three
months to one year
Between one to
five yearsMore than five years
Non-derivative financial liabilitiesBorrowings from central banks 26,217 26,785 – 1,281 551 24,953 – –Deposits and placements from banks and non-bank financial institutions 1,054,488 1,064,857 418,191 193,086 221,152 224,732 7,696 –Financial liabilities at fair value through profit or loss 365,436 372,638 17,420 106,720 169,133 79,365 – –Financial assets sold under repurchase agreements 3,065 3,067 – 2,767 266 34 – –Deposits from customers 12,956,956 13,312,911 6,718,842 1,058,231 1,112,770 3,011,582 1,392,991 18,495Debt securities issued – Certificates of deposit issued 263,389 271,143 – 41,998 50,927 153,492 24,126 600 – Bonds issued 17,266 18,750 – – 56 1,522 14,651 2,521 – Subordinated bonds issued 147,869 198,320 – – 10,736 6,356 55,040 126,188Other financial liabilities 157,449 157,449 80,480 75,201 239 1,028 – 501
Total 14,992,135 15,425,920 7,234,933 1,479,284 1,565,830 3,503,064 1,494,504 148,305
Off-balance sheet loan commitments and credit card commitments (Note) 890,321 728,389 27,515 23,660 63,680 38,024 9,053
Guarantees, acceptances and other credit commitments (Note) 1,504,434 – 451,890 269,078 479,266 255,986 48,214
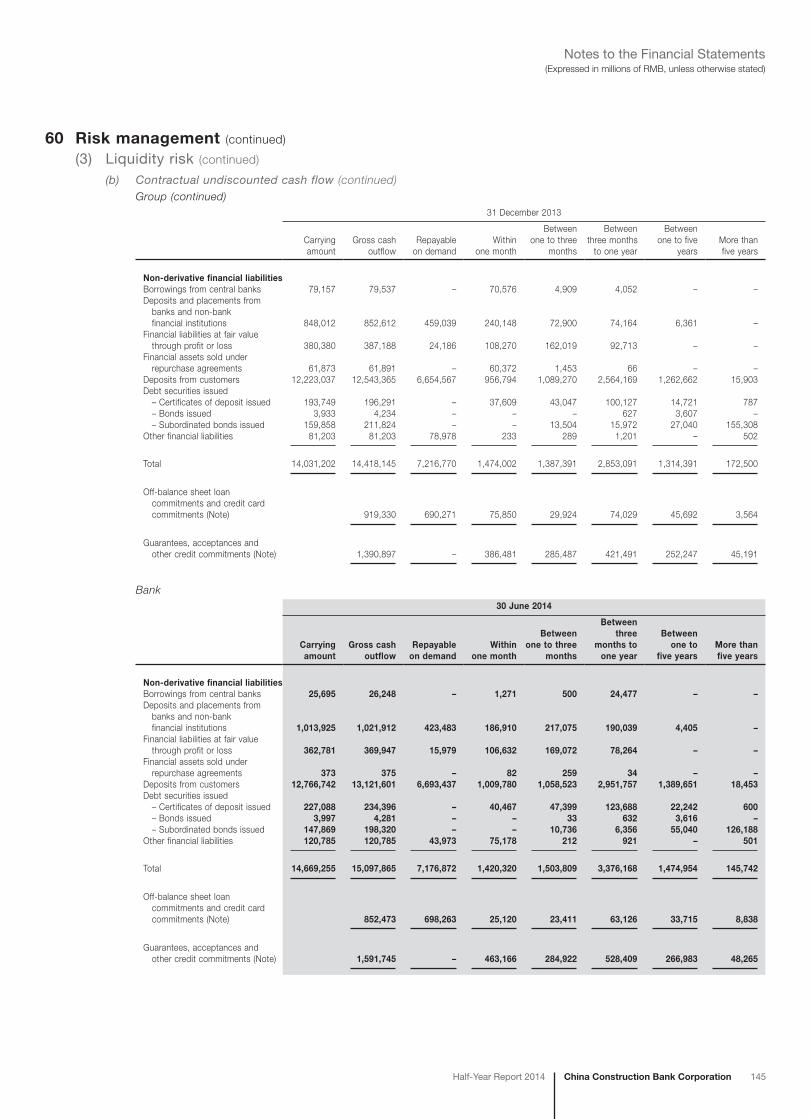
China Construction Bank CorporationHalf-Year Report 2014 145
(Expressed in millions of RMB, unless otherwise stated)Notes to the Financial Statements
60 Risk management (continued)
(3) Liquidity risk (continued)
(b) Contractual undiscounted cash flow (continued)Group (continued)
31 December 2013
Carrying amount
Gross cash outflow
Repayable on demand
Within one month
Between one to three
months
Between three months
to one year
Between one to five
yearsMore than five years
Non-derivative financial liabilitiesBorrowings from central banks 79,157 79,537 – 70,576 4,909 4,052 – –Deposits and placements from banks and non-bank financial institutions 848,012 852,612 459,039 240,148 72,900 74,164 6,361 –Financial liabilities at fair value through profit or loss 380,380 387,188 24,186 108,270 162,019 92,713 – –Financial assets sold under repurchase agreements 61,873 61,891 – 60,372 1,453 66 – –Deposits from customers 12,223,037 12,543,365 6,654,567 956,794 1,089,270 2,564,169 1,262,662 15,903Debt securities issued – Certificates of deposit issued 193,749 196,291 – 37,609 43,047 100,127 14,721 787 – Bonds issued 3,933 4,234 – – – 627 3,607 – – Subordinated bonds issued 159,858 211,824 – – 13,504 15,972 27,040 155,308Other financial liabilities 81,203 81,203 78,978 233 289 1,201 – 502
Total 14,031,202 14,418,145 7,216,770 1,474,002 1,387,391 2,853,091 1,314,391 172,500
Off-balance sheet loan commitments and credit card commitments (Note) 919,330 690,271 75,850 29,924 74,029 45,692 3,564
Guarantees, acceptances and other credit commitments (Note) 1,390,897 – 386,481 285,487 421,491 252,247 45,191
Bank30 June 2014
Carrying amount
Gross cash outflow
Repayable on demand
Within one month
Betweenone to three
months
Between three
months to one year
Between one to
five yearsMore than five years
Non-derivative financial liabilitiesBorrowings from central banks 25,695 26,248 – 1,271 500 24,477 – –Deposits and placements from banks and non-bank financial institutions 1,013,925 1,021,912 423,483 186,910 217,075 190,039 4,405 –Financial liabilities at fair value through profit or loss 362,781 369,947 15,979 106,632 169,072 78,264 – –Financial assets sold under repurchase agreements 373 375 – 82 259 34 – –Deposits from customers 12,766,742 13,121,601 6,693,437 1,009,780 1,058,523 2,951,757 1,389,651 18,453Debt securities issued – Certificates of deposit issued 227,088 234,396 – 40,467 47,399 123,688 22,242 600 – Bonds issued 3,997 4,281 – – 33 632 3,616 – – Subordinated bonds issued 147,869 198,320 – – 10,736 6,356 55,040 126,188Other financial liabilities 120,785 120,785 43,973 75,178 212 921 – 501
Total 14,669,255 15,097,865 7,176,872 1,420,320 1,503,809 3,376,168 1,474,954 145,742
Off-balance sheet loan commitments and credit card commitments (Note) 852,473 698,263 25,120 23,411 63,126 33,715 8,838
Guarantees, acceptances and other credit commitments (Note) 1,591,745 – 463,166 284,922 528,409 266,983 48,265

146 China Construction Bank Corporation Half-Year Report 2014
(Expressed in millions of RMB, unless otherwise stated)Notes to the Financial Statements
60 Risk management (continued)
(3) Liquidity risk (continued)
(b) Contractual undiscounted cash flow (continued)Bank (continued)
31 December 2013
Carrying amount
Gross cash outflow
Repayable on demand
Within one month
Between one to three
months
Between three months
to one year
Between one to five
yearsMore than five years
Non-derivative financial liabilitiesBorrowings from central banks 78,733 79,104 – 70,475 4,720 3,909 – –Deposits and placements from banks and non-bank financial institutions 826,966 829,855 463,560 242,119 65,737 51,932 6,507 –Financial liabilities at fair value through profit or loss 377,731 384,540 21,627 108,139 162,061 92,713 – –Financial assets sold under repurchase agreements 55,457 55,473 – 55,175 249 49 – –Deposits from customers 12,055,777 12,375,042 6,629,070 910,625 1,034,089 2,525,313 1,260,117 15,828Debt securities issued – Certificates of deposit issued 159,553 161,643 – 35,790 35,257 75,937 13,872 787 – Bonds issued 2,995 3,235 – – – 597 2,638 – – Subordinated bonds issued 159,858 211,824 – – 13,504 15,972 27,040 155,308Other financial liabilities 54,767 54,767 52,722 219 245 1,079 – 502
Total 13,771,837 14,155,483 7,166,979 1,422,542 1,315,862 2,767,501 1,310,174 172,425
Off-balance sheet loan commitments and credit card commitments (Note) 883,644 690,271 45,608 29,725 73,060 41,416 3,564
Guarantees, acceptances and other credit commitments (Note) 1,470,588 – 392,496 314,952 453,868 264,030 45,242
Note: The off-balance sheet loan commitments and credit card commitments may expire without being drawn upon. Guarantees, acceptances and other credit commitments do not represent the amount to be paid.
(4) Operational riskOperational risk refers to the risks that resulted from flawed or erroneous internal processes, people and systems, or external events.
In the first half of 2014, the Group continued to standardise and strengthen operational risk management. Through integrated application of tools and methods such as operational risk self-assessments, the key risk indicators and the assessments over key risk, the Group continued to establish risk monitoring, risk assessment and inspection over significant business lines and key areas. The Group also strengthened operational risk prevention and control over key business areas and key positions.
– For risk changes in practice, the Group continued to examine and improve the development and management of the system of incompatible positions (duties) and emphasised on the rigid mandatory restrictions over checks and balances.
– The Group continued to optimise the information system of operational risk management and further promote its support functions such as self-assessments for risk and control, events of internal and external losses, key risk indicators, scenario analysis, capital measurement and business continuity management.
– In order to guarantee the safety and stability of the operation in respective business lines, the Group continued to promote its business continuity management system, established overall self-assessment in the management of business continuity management system and steadily promoted the development of contingency plans and emergency drills.
– The Group continued to implement the anti-money laundering (AML) policies and improved the system mechanisms and internal controls, focusing on the establishment of AML guidance. The Group has further developed the specialised control for AML, researched on and improved suspicious transactions identification policies, established AML nature analysis, organised the implementation of measures such as AML risk assessments about products and services, etc. to improve the Group’s ability to prevent money laundering activities and terrorism financing activities.

China Construction Bank CorporationHalf-Year Report 2014 147
(Expressed in millions of RMB, unless otherwise stated)Notes to the Financial Statements
60 Risk management (continued)
(5) Fair value of financial instruments(a) Valuation technique, input and process
The Board is responsible for establishing a robust internal control policy of valuation, and takes the ultimate responsibility for the adequacy and effectiveness of internal control system. The Board of Supervisors is in charge of supervising the performance of the Board and Senior Management. According to the requirements of the Board and the Board of Supervisors, Senior Management’s responsibility is to organise and implement the internal control system over the valuation process to ensure the effectiveness of the internal control system of valuation.
The Group has established an independent valuation process for financial assets and financial liabilities. The relevant departments are responsible for performing valuation, verifying valuation model and accounting for valuation results.
For the six months ended 30 June 2014, there was no significant change in the valuation techniques or inputs used to determine fair value as compared to those used for the year ended 31 December 2013.
(b) Fair value hierarchyThe Group measures fair values using the following fair value hierarchy that reflects the significance of the inputs used in making the measurements:
– Level 1: Fair value based on quoted prices (unadjusted) in active markets for identical assets or liabilities.
– Level 2: Fair value based on inputs other than quoted prices included within level 1 that are observable for the asset or liability, either directly (that is, as prices) or indirectly (that is, derived from prices).
– Level 3: Fair value based on inputs for the asset or liability that are not based on observable market data (that is, unobservable inputs).
(c) Financial instruments not measured at fair value(i) Financial assets
The Group’s financial assets not measured at fair value mainly include cash and deposits with central banks, deposits and placements with banks and non-bank financial institutions, financial assets held under resale agreements, loans and advances to customers, held-to-maturity investments and debt securities classified as receivables.
Deposits with central banks, deposits and placements with banks and non-bank financial institutions and financial assets held under resale agreements
Deposits with central banks, deposits and placements with banks and non-bank financial institutions and financial assets held under resale agreements are mainly priced at market interest rates and mature within one year. Accordingly, the carrying values approximate the fair values.
Loans and advances to customers
Majority of the loans and advances to customers are repriced at least annually to the market rate. Accordingly, their carrying values approximate the fair values.
Investments
The following table shows the carrying values and the fair values of the debt securities classified as receivables and held-to-maturity investments which are not presented in the statement of financial position at their fair values. The Group measures the fair values of debt securities classified as receivables and held-to-maturity investments using the Level 2 or Level 3 of the fair value hierarchy.

148 China Construction Bank Corporation Half-Year Report 2014
(Expressed in millions of RMB, unless otherwise stated)Notes to the Financial Statements
60 Risk management (continued)
(5) Fair value of financial instruments (continued)
(c) Financial instruments not measured at fair value (continued)(i) Financial assets (continued)
Group
Carrying value Fair value
30 June 2014 31 December 2013 30 June 2014 31 December 2013
Debt securities classified as receivables 192,014 189,737 180,791 174,379Held-to-maturity investments 2,220,584 2,100,538 2,193,136 1,998,696
Total 2,412,598 2,290,275 2,373,927 2,173,075
Bank
Carrying value Fair value
30 June 2014 31 December 2013 30 June 2014 31 December 2013
Debt securities classified as receivables 177,168 182,252 166,634 166,587Held-to-maturity investments 2,215,237 2,095,741 2,187,777 1,993,931
Total 2,392,405 2,277,993 2,354,411 2,160,518
(ii) Financial liabilitiesThe Group’s financial liabilities not measured at fair value mainly include borrowings from central banks, deposits and placements from banks and non-bank financial institutions, financial assets sold under repurchase agreements, deposits from customers, and debt securities issued. The carrying values of financial liabilities approximated their fair values as at the end of the reporting period, except that the fair value of subordinated bonds issued as at 30 June 2014 was RMB143,552 million (31 December 2013: RMB146,810 million), which was lower than their carrying value of RMB147,869 million (31 December 2013: RMB159,858 million). The Group measures the fair values of subordinated bonds issued using the Level 2 of the fair value hierarchy.
(d) Financial instruments measured at fair valueThe table below analyses financial instruments, measured at fair value at the end of the reporting period, by the level in the fair value hierarchy into which the fair value measurement is categorised:
Group
30 June 2014
Level 1 Level 2 Level 3 Total
AssetsFinancial assets at fair value through profit or lossFinancial assets held for trading purpose – Debt securities 282 13,357 – 13,639 – Equity instruments and funds 1,010 5 – 1,015Financial assets designated as at fair value through profit or loss – Debt securities 794 – 1,169 1,963 – Equity instruments 1,839 – 2,235 4,074 – Other debt instruments – 303,381 – 303,381Positive fair value of derivatives – 11,326 1,167 12,493Available-for-sale financial assets – Debt securities 31,610 724,493 4,291 760,394 – Equity instruments and funds 7,266 1,465 4,217 12,948
Total 42,801 1,054,027 13,079 1,109,907
LiabilitiesFinancial liabilities at fair value through profit or lossFinancial liabilities designated as at fair value through profit or loss – 363,994 1,442 365,436Negative fair value of derivatives – 10,629 1,167 11,796
Total – 374,623 2,609 377,232

China Construction Bank CorporationHalf-Year Report 2014 149
(Expressed in millions of RMB, unless otherwise stated)Notes to the Financial Statements
60 Risk management (continued)
(5) Fair value of financial instruments (continued)
(d) Financial instruments measured at fair value (continued)Group (continued)
31 December 2013
Level 1 Level 2 Level 3 Total
AssetsFinancial assets at fair value through profit or lossFinancial assets held for trading purpose – Debt securities 236 76,296 – 76,532 – Equity instruments and funds 562 55 – 617Financial assets designated as at fair value through profit or loss – Debt securities 788 – 1,644 2,432 – Equity instruments 1,958 – 3,945 5,903 – Other debt instruments – 278,566 – 278,566Positive fair value of derivatives – 17,921 989 18,910Available-for-sale financial assets – Debt securities 33,912 708,501 4,213 746,626 – Equity instruments and funds 7,912 285 4,041 12,238
Total 45,368 1,081,624 14,832 1,141,824
LiabilitiesFinancial liabilities at fair value through profit or lossFinancial liabilities designated as at fair value through profit or loss – 377,820 2,560 380,380Negative fair value of derivatives – 18,883 989 19,872
Total – 396,703 3,549 400,252

150 China Construction Bank Corporation Half-Year Report 2014
(Expressed in millions of RMB, unless otherwise stated)Notes to the Financial Statements
60 Risk management (continued)
(5) Fair value of financial instruments (continued)
(d) Financial instruments measured at fair value (continued)Bank
30 June 2014
Level 1 Level 2 Level 3 Total
AssetsFinancial assets at fair value through profit or lossFinancial assets held for trading purpose – Debt securities – 13,352 – 13,352Financial assets designated as at fair value through profit or loss – Other debt instruments – 305,381 – 305,381Positive fair value of derivatives – 9,118 1,167 10,285Available-for-sale financial assets – Debt securities 12,770 703,806 2,126 718,702 – Equity instruments and funds 4,741 – 9 4,750
Total 17,511 1,031,657 3,302 1,052,470
LiabilitiesFinancial liabilities at fair value through profit or lossFinancial liabilities designated as at fair value through profit or loss – 362,781 – 362,781Negative fair value of derivatives – 8,868 1,167 10,035
Total – 371,649 1,167 372,816
31 December 2013
Level 1 Level 2 Level 3 Total
AssetsFinancial assets at fair value through profit or lossFinancial assets held for trading purpose – Debt securities – 76,288 – 76,288Financial assets designated as at fair value through profit or loss – Other debt instruments – 280,566 – 280,566Positive fair value of derivatives – 15,514 989 16,503Available-for-sale financial assets – Debt securities 9,795 695,864 2,754 708,413 – Equity instruments and funds 5,321 – 19 5,340
Total 15,116 1,068,232 3,762 1,087,110
LiabilitiesFinancial liabilities at fair value through profit or lossFinancial liabilities designated as at fair value through profit or loss – 377,731 – 377,731Negative fair value of derivatives – 15,807 989 16,796
Total – 393,538 989 394,527
For the six months ended 30 June 2014 and for the year ended 31 December 2013, there were no significant transfers between level 1 and level 2 of the fair value hierarchy.
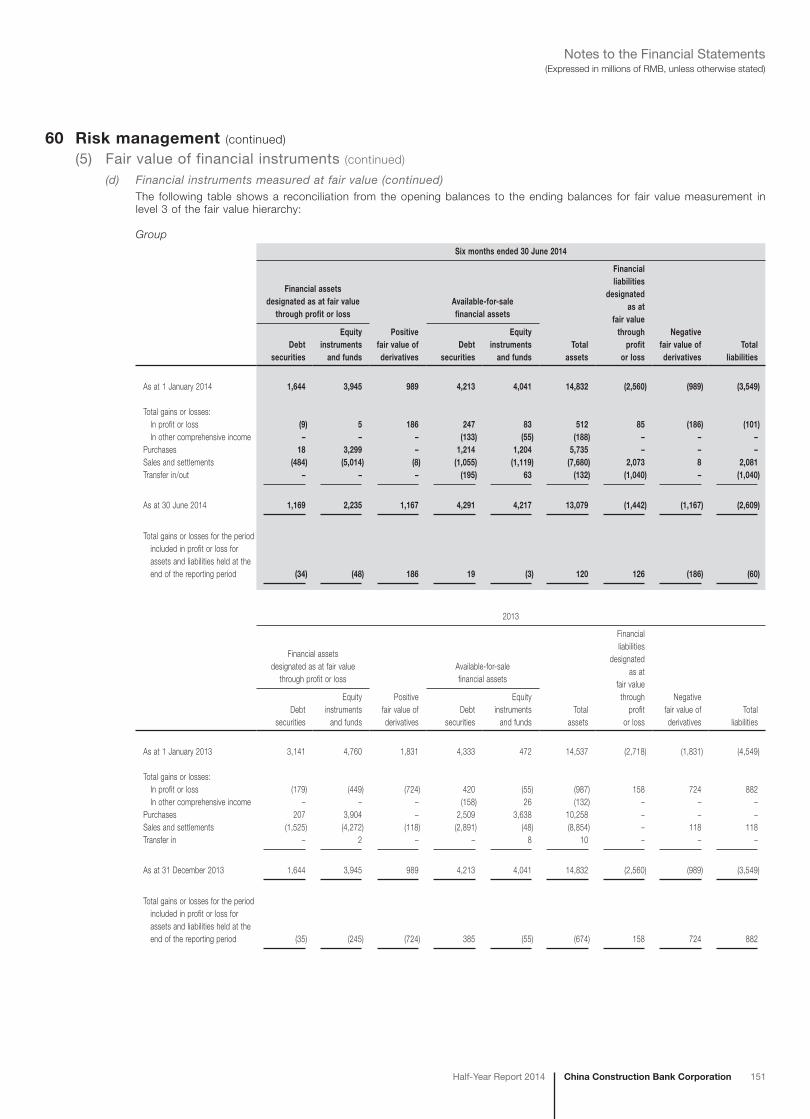
China Construction Bank CorporationHalf-Year Report 2014 151
(Expressed in millions of RMB, unless otherwise stated)Notes to the Financial Statements
60 Risk management (continued)
(5) Fair value of financial instruments (continued)
(d) Financial instruments measured at fair value (continued)The following table shows a reconciliation from the opening balances to the ending balances for fair value measurement in level 3 of the fair value hierarchy:
Group
Six months ended 30 June 2014
Financial assetsdesignated as at fair value
through profit or loss
Positivefair value ofderivatives
Available-for-salefinancial assets
Total assets
Financialliabilities
designatedas at
fair valuethrough
profitor loss
Negativefair value ofderivatives
Totalliabilities
Debtsecurities
Equityinstruments
and fundsDebt
securities
Equityinstruments
and funds
As at 1 January 2014 1,644 3,945 989 4,213 4,041 14,832 (2,560) (989) (3,549)
Total gains or losses: In profit or loss (9) 5 186 247 83 512 85 (186) (101) In other comprehensive income – – – (133) (55) (188) – – –Purchases 18 3,299 – 1,214 1,204 5,735 – – –Sales and settlements (484) (5,014) (8) (1,055) (1,119) (7,680) 2,073 8 2,081Transfer in/out – – – (195) 63 (132) (1,040) – (1,040)
As at 30 June 2014 1,169 2,235 1,167 4,291 4,217 13,079 (1,442) (1,167) (2,609)
To tal gains or losses for the period included in profit or loss for assets and liabilities held at the end of the reporting period (34) (48) 186 19 (3) 120 126 (186) (60)
2013
Financial assetsdesignated as at fair value
through profit or loss
Positivefair value ofderivatives
Available-for-salefinancial assets
Total assets
Financialliabilities
designatedas at
fair valuethrough
profitor loss
Negativefair value ofderivatives
Totalliabilities
Debtsecurities
Equityinstruments
and fundsDebt
securities
Equityinstruments
and funds
As at 1 January 2013 3,141 4,760 1,831 4,333 472 14,537 (2,718) (1,831) (4,549)
Total gains or losses: In profit or loss (179) (449) (724) 420 (55) (987) 158 724 882 In other comprehensive income – – – (158) 26 (132) – – –Purchases 207 3,904 – 2,509 3,638 10,258 – – –Sales and settlements (1,525) (4,272) (118) (2,891) (48) (8,854) – 118 118Transfer in – 2 – – 8 10 – – –
As at 31 December 2013 1,644 3,945 989 4,213 4,041 14,832 (2,560) (989) (3,549)
To tal gains or losses for the period included in profit or loss for assets and liabilities held at the end of the reporting period (35) (245) (724) 385 (55) (674) 158 724 882

152 China Construction Bank Corporation Half-Year Report 2014
(Expressed in millions of RMB, unless otherwise stated)Notes to the Financial Statements
60 Risk management (continued)
(5) Fair value of financial instruments (continued)
(d) Financial instruments measured at fair value (continued)Bank
Six months ended 30 June 2014
Available-for-sale financial assets
Positivefair value of derivatives
Debt securities
Equity instruments
and fundsTotal
assets
Negativefair value of derivatives
Total liabilities
As at 1 January 2014 989 2,754 19 3,762 (989) (989)
Total gains or losses: In profit or loss 186 242 (3) 425 (186) (186) In other comprehensive income – (247) (7) (254) – –Sales and settlements (8) (623) – (631) 8 8
As at 30 June 2014 1,167 2,126 9 3,302 (1,167) (1,167)
Total gains or losses for the period included in profit or loss for assets and liabilities held at the end of the reporting period 186 14 (3) 197 (186) (186)
2013
Available-for-sale financial assets
Positivefair value of derivatives
Debt securities
Equity instruments
and fundsTotal
assets
Negativefair value of derivatives
Total liabilities
As at 1 January 2013 1,831 1,608 67 3,506 (1,831) (1,831)
Total gains or losses: In profit or loss (724) 458 (38) (304) 724 724 In other comprehensive income – (182) (10) (192) – –Purchases – 1,301 – 1,301 – –Sales and settlements (118) (431) – (549) 118 118
As at 31 December 2013 989 2,754 19 3,762 (989) (989)
Total gains or losses for the period included in profit or loss for assets and liabilities held at the end of the reporting period (724) 423 (38) (339) 724 724
In Level 3 of the fair value hierarchy, total gains or losses included in profit or loss for the year in the above table are presented in net trading gain, net gain arising from investment securities and impairment losses of the statement of comprehensive income.
(6) Offsetting financial assets and financial liabilitiesCertain financial assets and financial liabilities of the Group are subject to enforceable master netting arrangements or similar agreements. The agreement between the Group and the counterparty generally allows for net settlement of the relevant financial assets and financial liabilities when both elect to settle on a net basis. In the absence of such an election, financial assets and financial liabilities will be settled on a gross basis. However, each party to the master netting arrangements or similar agreements will have the option to settle all such amounts on a net basis in the event of default of the other party. Certain financial assets and financial liabilities of the Group which are subject to enforceable master netting arrangements or similar agreements are not offset in accordance with IFRS.
As at 30 June 2014, the amount of the financial assets and financial liabilities subject to enforceable master netting arrangements or similar agreements are not material to the Group.

China Construction Bank CorporationHalf-Year Report 2014 153
(Expressed in millions of RMB, unless otherwise stated)Notes to the Financial Statements
60 Risk management (continued)
(7) Capital managementThe Group has implemented a comprehensive capital management policy, covering the management of regulatory capital, economic capital and accounting capital, including but not limited to management of capital adequacy ratio, capital planning, capital raising and economic capital.
Capital adequacy ratio is a reflection of the Group’s ability to maintain a stable operation and resist adverse risks. In accordance with CBRC’s “Measures for Capital Management of Commercial Banks (trial)” and relevant regulations, commercial banks should meet the minimum capital requirements from 1 January 2013. The Common Equity Tier 1 ratio should be at or above a minimum of 5%, Tier 1 ratio at or above a minimum of 6% and total capital ratio at or above a minimum of 8%. Systemically important domestic banks should also meet the 1% additional capital requirement, with their Common Equity Tier 1 capital. Meanwhile, in accordance with CBRC’s “Notice of relevant transitional arrangement for implementation of Measures for Capital Management of Commercial Banks (trial)”, a capital conservation buffer will be introduced progressively during the transitional period, which will be raised through Common Equity Tier 1 capital. If a countercyclical buffer is required or the Pillar 2 capital requirement is raised by the regulator to a specific commercial bank, the minimum requirements should be met within the transitional period.
The Group timely monitors, analyses and reports capital adequacy ratios, assesses if the capital management objectives have been met and exercises effective management of capital adequacy ratio. The Group adopts various measures such as controlling asset growth, adjusting the structure of risk assets, accumulating internal capital and raising capital through external channels, to ensure that the Common Equity Tier 1 ratio, Tier 1 ratio and total capital ratio of the Group and the Bank are in full compliance with regulatory requirements and meet internal management requirements. This helps to insulate against potential risks as well as support healthy business developments. The Group has fully been complying with all regulatory requirements in this respect.
The Group’s capital planning has taken the regulatory requirements, the Group’s development strategy and risk appetite into consideration, and based on those factors the Group projects the capital usage and need. The Group regularly compares its position with its capital adequacy ratio target to ensure capital will be adequate for future or otherwise to plan for supplementation of capital.
The capital raising management of the Group involves reasonable utilisation of various capital instruments to ensure that both external regulatory and internal capital management objectives are met, taking in account capital planning and operating environment. This helps to optimise the Group’s total capital amount and structure, as well as improve the competitiveness of the Group’s cost of capital.
In April 2014, CBRC has officially approved the implementation of the advanced approach of capital management by the Bank. In this approach, the Bank has elected to use foundation internal rating based (“IRB”) approach for corporate risk exposure, IRB approach for retail risk exposure, internal models approach for market risk and standardised approach for operational risk exposure.
The Group’s consolidated regulatory capital positions calculated in accordance with the “Measures for Capital Management of Commercial Banks (trial)” issued by the CBRC as at the end of the reporting period are as follows:
Note 30 June 2014 31 December 2013
Common Equity Tier 1 ratio (a)(b) 11.21% 10.75%Tier 1 ratio (a)(b) 11.21% 10.75%Total capital ratio (a)(b) 13.89% 13.34%
Common Equity Tier 1 capital – Qualifying common share capital 250,011 250,011 – Capital reserve and investment revaluation reserve 131,097 116,321 – Surplus reserve 107,970 107,970 – General reserve 169,029 153,825 – Retained earnings 482,613 442,554 – Non-controlling interest given recognition in Common Equity Tier 1 capital 3,491 3,729 – Foreign exchange reserve (4,489) (5,948)
Deductions for Common Equity Tier 1 capital – Goodwill (c) 1,460 1,415 – Other intangible assets (excluding land use right) (c) 1,456 1,609 – Cash-flow hedge reserve 20 (148) – Investments in common equity of financial institutions being
controlled but outside the scope of consolidation 3,902 3,902
Additional Tier 1 capital – Non-controlling interest given recognition in Additional Tier 1 capital 34 16
Tier 2 capital – Directly issued qualifying Tier 2 instruments including related stock surplus 127,868 144,000 – Provisions in Tier 2 (d) 143,724 110,918 – Non-controlling interest given recognition in Tier 2 capital 127 106
Common Equity Tier 1 capital after deduction (e) 1,132,884 1,061,684Tier 1 capital after deduction (e) 1,132,918 1,061,700Total capital after deduction (e) 1,404,637 1,316,724
Risk-weighted assets (f) 10,109,495 9,872,790

154 China Construction Bank Corporation Half-Year Report 2014
(Expressed in millions of RMB, unless otherwise stated)Notes to the Financial Statements
60 Risk management (continued)
(7) Capital management (continued)Notes:
(a) The Common Equity Tier 1 ratio is calculated by dividing the Common Equity Tier 1 Capital after deduction by risk-weighted assets. Tier 1 ratio is calculated by dividing the Tier 1 Capital after deduction by risk-weighted assets. Total Capital ratio is calculated by dividing the Total capital after deduction by risk-weighted assets.
(b) The scope for calculating capital adequacy ratio of the Group includes all the domestic branches and subsidiaries in the financial sector (excluding CCB Life).
(c) Both balances of goodwill and other intangible assets (excluding land use right) are the net amounts after deducting relevant deferred tax liabilities.
(d) Since 30 June 2014, eligible excessive loan provisions was measured based on new regulatory rules.
(e) Common Equity Tier 1 capital after deduction is calculated by netting off the corresponding deduction items from the Common Equity Tier 1 capital. Tier 1 capital after deduction is calculated by netting off the corresponding deduction items from the Tier 1 capital. Total capital after deduction is calculated by netting off the corresponding deduction items from the total capital.
(f) Risk-weighted assets include credit risk-weighted assets, market risk-weighted assets, operational risk-weighted assets and excessive risk-weighted assets due to the application of capital floor. As at 31 December 2013, the Group used risk-weighted approach for credit risk-weighted assets, standardised approach for market risk-weighted assets and standard index evaluating method for operational risk weighted assets.
61 Events after the reporting periodThere are no significant events after the reporting period.
62 Comparative figuresCertain comparative figures have been adjusted to conform with changes in disclosures in current year.
63 Ultimate parentAs stated in Note 1, the immediate and ultimate parent of the Group is Huijin and CIC respectively.
64 Possible impact of amendments, new standards and interpretations issued but not yet effectiveUp to the date of issue of the financial statements, the IASB has issued the following amendments, new standards and interpretations which are not yet effective for the six months ended 30 June 2014 and which have not been adopted in the financial statements.
StandardsEffective for annual period
beginning on or after
IFRS 9, “Financial instruments” 1 January 2018IFRS 15, “Revenue from Contracts with Customers” 1 January 2017
The Group is in the process of making an assessment on the impact of these new and revised IFRSs upon initial application.

Unaudited Supplementary Financial Information(Expressed in millions of RMB unless otherwise stated)
China Construction Bank CorporationHalf-Year Report 2014 155
The following information of the Group does not form part of the audited financial statements, and is included herein for information purposes only.
1 Difference between the financial statements prepared under IFRS and those prepared in accordance with PRC GAAPChina Construction Bank Corporation (the “Bank”) prepares consolidated financial statements, which include the financial statements of the Bank and its subsidiaries (collectively the “Group”), in accordance with International Financial Reporting Standards (“IFRS”) and its interpretations promulgated by the International Accounting Standards Board and the applicable disclosure provisions of the Rules Governing the Listing of Securities on The Stock Exchange of Hong Kong Limited.
As a financial institution incorporated in the People’s Republic of China (the “PRC”) and listed in the Shanghai Stock Exchange, the Group also prepares its consolidated financial statements for the six months ended 30 June 2014 in accordance with the Accounting Standards for Business Enterprises and other relevant regulations issued by the regulatory bodies of the PRC (collectively “PRC GAAP and regulations”).
There is no difference in the net profit for the six months ended 30 June 2014 or total equity as at 30 June 2014 between the Group’s consolidated financial statements prepared under IFRS and those prepared under PRC GAAP and regulations respectively.
2 Liquidity ratios
As at 30 June 2014
Average for the six months ended
30 June 2014As at
31 December 2013
Average for the year ended
31 December 2013
RMB current assets to RMB current liabilities 47.72% 47.15% 46.57% 49.25%
Foreign currency current assets to foreign currency current liabilities 56.70% 55.95% 55.20% 49.16%
The above liquidity ratios are calculated in accordance with the formula promulgated by the CBRC.
The Hong Kong Banking (Disclosure) Rules (the “Rules”) took effect on 1 January, 2007. It requires the disclosure of average liquidity ratio, which is the arithmetic mean of each calendar month’s liquidity ratio. The Group prepared the liquidity ratios on a semi-annual basis and the disclosed average liquidity ratio is the arithmetic mean of two consecutive liquidity ratios as at 30 June and 31 December.
3 Currency concentrations30 June 2014
USD (RMB equivalent)
HKD (RMB equivalent)
Others (RMB equivalent) Total
Spot assets 885,931 162,579 89,964 1,138,474Spot liabilities (821,552) (207,265) (104,029) (1,132,846)Forward purchases 890,643 57,202 88,419 1,036,264Forward sales (934,374) (5,417) (62,091) (1,001,882)Net options position 372 – – 372
Net long position 21,020 7,099 12,263 40,382
Net structural position 8,134 1,596 (1,628) 8,103
31 December 2013
USD (RMB equivalent)
HKD (RMB equivalent)
Others (RMB equivalent) Total
Spot assets 731,627 141,255 71,352 944,234Spot liabilities (540,063) (174,454) (117,234) (831,751)Forward purchases 740,072 57,311 105,430 902,813Forward sales (924,064) (11,030) (55,931) (991,025)Net options position 200 – – 200
Net long position 7,772 13,082 3,617 24,471
Net structural position 5,775 3,775 (1,645) 7,905
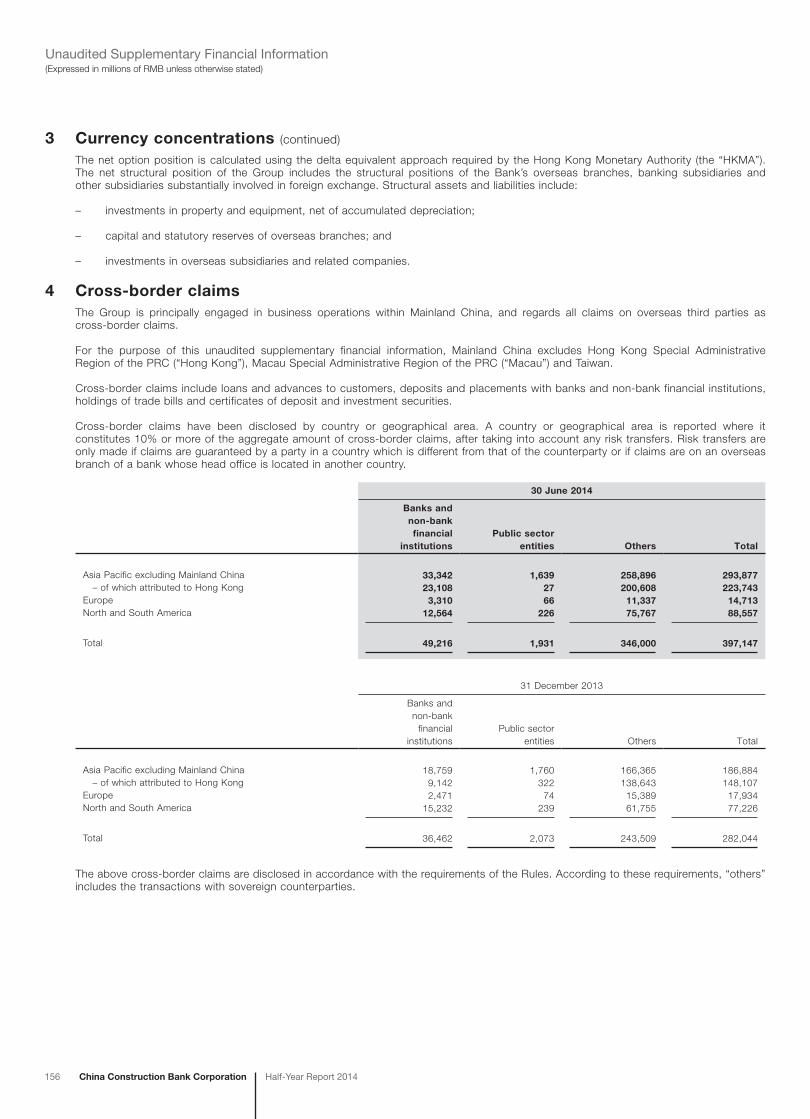
156 China Construction Bank Corporation Half-Year Report 2014
(Expressed in millions of RMB unless otherwise stated)Unaudited Supplementary Financial Information
3 Currency concentrations (continued)
The net option position is calculated using the delta equivalent approach required by the Hong Kong Monetary Authority (the “HKMA”). The net structural position of the Group includes the structural positions of the Bank’s overseas branches, banking subsidiaries and other subsidiaries substantially involved in foreign exchange. Structural assets and liabilities include:
– investments in property and equipment, net of accumulated depreciation;
– capital and statutory reserves of overseas branches; and
– investments in overseas subsidiaries and related companies.
4 Cross-border claimsThe Group is principally engaged in business operations within Mainland China, and regards all claims on overseas third parties as cross-border claims.
For the purpose of this unaudited supplementary financial information, Mainland China excludes Hong Kong Special Administrative Region of the PRC (“Hong Kong”), Macau Special Administrative Region of the PRC (“Macau”) and Taiwan.
Cross-border claims include loans and advances to customers, deposits and placements with banks and non-bank financial institutions, holdings of trade bills and certificates of deposit and investment securities.
Cross-border claims have been disclosed by country or geographical area. A country or geographical area is reported where it constitutes 10% or more of the aggregate amount of cross-border claims, after taking into account any risk transfers. Risk transfers are only made if claims are guaranteed by a party in a country which is different from that of the counterparty or if claims are on an overseas branch of a bank whose head office is located in another country.
30 June 2014
Banks and non-bank financial
institutionsPublic sector
entities Others Total
Asia Pacific excluding Mainland China 33,342 1,639 258,896 293,877 – of which attributed to Hong Kong 23,108 27 200,608 223,743Europe 3,310 66 11,337 14,713North and South America 12,564 226 75,767 88,557
Total 49,216 1,931 346,000 397,147
31 December 2013
Banks and non-bank
financial institutions
Public sector entities Others Total
Asia Pacific excluding Mainland China 18,759 1,760 166,365 186,884 – of which attributed to Hong Kong 9,142 322 138,643 148,107Europe 2,471 74 15,389 17,934North and South America 15,232 239 61,755 77,226
Total 36,462 2,073 243,509 282,044
The above cross-border claims are disclosed in accordance with the requirements of the Rules. According to these requirements, “others” includes the transactions with sovereign counterparties.

China Construction Bank CorporationHalf-Year Report 2014 157
(Expressed in millions of RMB unless otherwise stated)Unaudited Supplementary Financial Information
5 Overdue loans and advances to customers by geographical sector30 June 2014 31 December 2013
Yangtze River Delta 34,050 31,208Pearl River Delta 10,515 7,253Central 9,526 6,950Bohai Rim 6,218 4,139Western 5,634 4,702Northeastern 4,087 4,470Head office 3,099 2,642Overseas 296 263
Total 73,425 61,627
The above analysis represents the gross amount of loans and advances overdue for more than three months.
Loans and advances with a specific repayment date are classified as overdue when the principal or interest is overdue.
Loans and advances repayable on demand are classified as overdue when a demand for repayment has been served on the borrower but repayment has not been made in accordance with the instructions. If the loans and advances repayable on demand are outside the approved limit that was advised to the borrower, they are also considered as overdue.
6 Non-bank Mainland China exposureThe Bank is a commercial bank incorporated in Mainland China with its banking business primarily conducted in Mainland China. As at 30 June 2014, substantial amounts of the Bank’s exposures arose from businesses with Mainland China entities or individuals. Analyses of various types of exposures by counterparty have been disclosed in the respective notes to the financial statements.

Appendix: Composition of Capital
158 China Construction Bank Corporation Half-Year Report 2014
In accordance with the regulatory requirements for the disclosure of information on capital composition of commercial banks issued by CBRC, the following table shows the Group’s composition of capital, minimum regulatory capital requirements, as well as their connections with the balance sheets under the scope of regulatory consolidation as at 30 June 2014.
(In millions of RMB, except percentages) CodeAs at
30 June 2014As at
31 December 2013
Common Equity Tier 1 capital:1 Qualifying common share capital l 250,011 250,0112 Retained earnings 759,612 704,3492a Surplus reserve p 107,970 107,9702b General reserve q 169,029 153,8252c Undistributed profits r 482,613 442,5543 Accumulated other comprehensive income and undisclosed reserves 126,608 110,3733a Capital reserve m+o 131,097 116,3213b Others s (4,489) (5,948)4 Amount given recognition in Common Equity Tier 1 capital (Only applicable to unlisted companies,
while banks of joint-stock companies to be completed with “0”) – –5 Minority interest given recognition in Common Equity Tier 1 capital t 3,491 3,7296 Common Equity Tier 1 capital before regulatory adjustment 1,139,722 1,068,462Common Equity Tier 1 capital: Regulatory adjustment7 Prudent valuation adjustment – –8 Goodwill (excluding deferred tax liabilities) i 1,460 1,4159 Other intangible assets (excluding land use rights) (excluding deferred tax liabilities) h 1,456 1,60910 Net deferred tax assets relying on future profits and arising from operating losses – –11 Cash-flow hedge reserves n 20 (148)12 Gaps of loan loss provisions – –13 Gains from sales of asset securitisation – –14 Unrealised profit/loss arising from the changes in own credit risk on fair values of liability – –15 Net defined-benefit pension assets (excluding deferred tax liabilities) – –16 Directly or indirectly investments in own shares – –17 Reciprocal cross-holdings in common equity – –18 Non-significant investments in capital of financial institutions outside the scope of regulatory
consolidation(amount above 10% threshold) – –19 Significant investments in capital of financial institutions outside the scope of regulatory
consolidation(amount above 10% threshold) – –20 Mortgage-servicing rights N/A N/A N/A21 Other deferred tax assets relying on the Bank’s future profitability(amount above 10% threshold) – –22 Significant investments in the capital of financial institutions outside the scope of regulatory
consolidation and other deferred tax assets that rely on the Bank’s future profitability after all regulatory adjustment (amount exceeding the 15% threshold) – –
23 of which: significant investments in the capital of financial institutions – –24 of which: Mortgage-servicing rights N/A N/A25 of which: Other deferred tax assets that rely on the Bank’s future profitability – –26a Investments in common equity of financial institutions being controlled but outside the scope of
regulatory consolidation f 3,902 3,90226b Gaps of common equity of financial institutions being controlled but outside the scope of
regulatory consolidation – –26c Total regulatory adjustments to Common Equity Tier 1 capital – –27 Regulatory adjustments applied to Common Equity Tier 1 due to insufficient Additional Tier 1
and Tier 2 to cover deductions – –28 Total regulatory adjustment in Common Equity Tier 1 capital 6,838 6,77829 Common Equity Tier 1 capital after regulatory adjustment 1,132,884 1,061,684Additional Tier 1 capital:30 Directly issued qualifying Additional Tier 1 capital instruments including related stock surplus – –31 of which: classified as equity – –32 of which: classified as liabilities – –33 of which: Instruments not given recognition in Additional Tier 1 capital after the transition period – –34 Minority interest given recognition in Additional Tier 1 capital u 34 1635 of which: Portions not given recognition in Additional Tier 1 capital after the transition period – –36 Additional Tier 1 capital before regulatory adjustment 34 16

China Construction Bank CorporationHalf-Year Report 2014 159
Appendix: Composition of Capital
(In millions of RMB, except percentages) CodeAs at
30 June 2014As at
31 December 2013
Additional Tier 1 capital: regulatory adjustments37 Directly or indirectly investments in own Additional Tier 1 instruments – –38 Reciprocal cross-holdings in Additional Tier 1 instruments – –39 Non-significant investments in the capital of financial institutions outside the scope of regulatory
consolidation(amount above 10% threshold) – –40 Significant investments in the Additional Tier 1 capital of financial institutions outside the
scope of regulatory consolidation – –41a Investments in Additional Tier 1 capital of financial institutions being controlled but
outside the scope of regulatory consolidation – –41b Gaps of Additional Tier 1 capital of financial institutions being controlled but
outside the scope of regulatory consolidation – –41c Other deductions from Additional Tier 1 capital – –42 Regulatory adjustments applied to Additional Tier 1 due to insufficient Tier 2 to cover deductions – –43 Total regulatory adjustments to Additional Tier 1 capital – –44 Additional Tier 1 capital after regulatory adjustment 34 1645 Tier 1 capital after regulatory adjustment (Common Equity Tier 1 capital after regulatory
adjustment + Additional Tier 1 capital after regulatory adjustment) 1,132,918 1,061,700Tier 2 capital:46 Directly issued qualifying Tier 2 instruments plus stock surplus k×80% 127,868 144,00047 of which: Portions not given recognition in Tier 2 capital after the transition period k×80% 127,868 144,00048 Minority interest given recognition in Tier 2 capital v 127 10649 of which: Portions not given recognition after the transition period – –50 Provisions in Tier 2 –b 143,724 110,91851 Tier 2 capital before regulatory adjustments 271,719 255,024Tier 2 capital: regulatory adjustments52 Directly or indirectly investments in own Tier 2 instruments – –53 Reciprocal cross-holdings in Tier 2 instruments – –54 Non-significant investments in capital of financial institutions outside the scope of
regulatory consolidation (amount above 10% threshold) – –55 Significant investments in the Tier 2 capital of financial institutions outside the scope of
regulatory consolidation – –56a Investments in Tier 2 capital of financial institutions being controlled but outside the scope of
regulatory consolidation – –56b Gaps of Tier 2 capital of financial institutions being controlled but outside the scope of
regulatory consolidation – –56c Other deductions from Tier 2 capital – –57 Total regulatory adjustments in Tier 2 capital – –58 Tier 2 capital after regulatory adjustment 271,719 255,02459 Total capital after regulatory adjustment (Tier 1 capital after regulatory adjustment
+ Tier 2 capital after regulatory adjustment) 1,404,637 1,316,72460 Total risk-weighted assets 10,109,495 9,872,790Capital adequacy ratio and reserve capital requirements61 Common Equity Tier 1 ratio 11.21% 10.75%62 Tier 1 ratio 11.21% 10.75%63 Total Capital ratio 13.89% 13.34%64 Specific buffer requirements of regulators 0.50% 0.50%65 of which: capital conservation buffer requirements 0.50% 0.50%66 of which: countercyclical buffer requirements 0.00% 0.00%67 of which: Additional buffer requirements of global systemically important Banks 0.00% 0.00%68 Common Equity Tier 1 capital available to meet buffers as a percentage of risk-weighted assets 6.21% 5.75%Domestic minimum regulatory capital requirements69 Common Equity Tier 1 ratio 5.00% 5.00%70 Tier 1 ratio 6.00% 6.00%71 Total Capital ratio 8.00% 8.00%Amounts below the threshold deductions72 Non-significant investments in the capital of other financial institutions outside of the scope of
regulatory consolidation c+d+e 45,920 53,42573 Significant investments in the capital of other financial institutions outside of the scope of
regulatory consolidation g 173 15674 Mortgage-servicing rights (net of deferred tax liabilities) N/A N/A75 Other deferred tax assets relying on the Bank’s future profitability (net of deferred tax liabilities) j 31,144 38,331

160 China Construction Bank Corporation Half-Year Report 2014
Appendix: Composition of Capital
(In millions of RMB, except percentages) CodeAs at
30 June 2014As at
31 December 2013
Limit of provisions in Tier 2 capital76 Provisions eligible for inclusion in Tier 2 in respect of exposures subject to regulatory weight
approach (prior to the application of cap) N/A 155,94877 Provisions eligible for inclusion in Tier 2 capital under regulatory weight approach N/A 110,91878 Provisions eligible for inclusion in Tier 2 in respect of exposures subject to internal
ratings-based approach (prior to the application of cap) –a 143,724 N/A79 Provisions eligible for inclusion in Tier 2 capital under internal ratings-based approach –b 143,724 N/ACapital instruments subject to phase-out arrangements80 Amount given recognition in current-period Common Equity Tier 1 capital
due to transitional arrangements – –81 Amount not given recognition in current-period Common Equity Tier 1 capital
due to transitional arrangements – –82 Amount given recognition in current-period Additional Tier 1 capital
due to transitional arrangements – –83 Amount not given recognition in current-period Additional Tier 1 capital
due to transitional arrangements – –84 Amount given recognition in current-period Tier 2 capital due to transitional arrangements k×80% 127,867 144,00085 Amount not given recognition in current-period Tier 2 capital due to transitional arrangements k×20% 31,967 16,000

China Construction Bank CorporationHalf-Year Report 2014 161
Appendix: Composition of Capital
The following table shows the balance sheet of the accounting and regulatory consolidation as at 30 June 2014.
(In millions of RMB)
As at 30 June 2014Balance sheet of
the accounting consolidation
Balance sheet of the regulatory consolidation
AssetsCash and deposits with central banks 2,578,036 2,577,979Deposits with banks and non-bank financial institutions 349,098 342,679Precious metals 50,780 50,780Placements with banks and non-bank financial institutions 257,659 259,669Financial assets at fair value through profit or loss 324,072 319,671Positive fair value of derivatives 12,493 12,487Financial assets held under resale agreements 351,660 350,868Interest receivable 101,551 100,954Loans and advances to customers 8,952,511 8,951,484Available-for-sale financial assets 774,800 767,094Held-to-maturity investments 2,220,584 2,217,975Debt securities classified as receivables 192,014 177,858Investments to subsidiaries – 5,676Interests in associates and jointly controlled entities 2,807 867Fixed assets 137,595 136,660Land use rights 15,874 15,874Intangible assets 1,895 1,456Goodwill 1,655 1,460Deferred tax assets 31,245 31,144Other assets 43,461 45,054
Total assets 16,399,790 16,367,689
LiabilitiesBorrowings from central banks 26,217 26,217Deposits from banks and non-bank financial institutions 795,594 795,594Placements from banks and non-bank financial institutions 258,894 261,231Financial liabilities at fair value through profit or loss 365,436 365,437Negative fair value of derivatives 11,796 10,883Financial assets sold under repurchase agreements 3,065 1,645Deposits from customers 12,956,956 12,961,445Accrued staff costs 31,852 31,685Taxes payable 36,985 36,768Interest payable 177,297 177,536Provisions 5,780 5,777Debt securities issued 428,524 428,524Deferred tax liabilities 145 18Other liabilities 154,237 123,734
Total liabilities 15,252,778 15,226,494
EquityShare capital 250,011 250,011Capital reserve 135,537 135,511Investment revaluation reserve (4,468) (4,414)Surplus reserve 107,970 107,970General reserve 169,039 169,029Retained earnings 484,539 482,613Exchange reserve (4,714) (4,489)Total equity attributable to equity shareholders of the Bank 1,137,914 1,136,231Minority interests 9,098 4,964
Total equity 1,147,012 1,141,195

162 China Construction Bank Corporation Half-Year Report 2014
Appendix: Composition of Capital
The following table shows the information related to the expanded balance sheet under regulatory scope of consolidation as at 30 June 2014.
(In millions of RMB)
As at 30 June 2014Balance sheet of
the regulatory consolidation Code
AssetsCash and deposits with central banks 2,577,979Deposits with banks and non-bank financial institutions 342,679Precious metals 50,780Placements with banks and non-bank financial institutions 259,669Financial assets at fair value through profit or loss 319,671Positive fair value of derivatives 12,487Financial assets held under resale agreements 350,868Interest receivable 100,954Loans and advances to customers 8,951,484 of which: Provisions eligible for inclusion in Tier 2 in respect of exposures subject to internal ratings-based approach (prior to the application of cap) (143,724) a of which: Provisions eligible for inclusion in Tier 2 in respect of exposures subject to internal ratings-based approach (143,724) bAvailable-for-sale financial assets 767,094 of which: non-significant investments in the capitals of other financial institutions outside of the scope of regulatory consolidation 4,948 cHeld-to-maturity investments 2,217,975 of which: non-significant investments in the capitals of other financial institutions outside of the scope of regulatory consolidation 13,387 dDebt securities classified as receivables 177,858 of which: non-significant investments in the capitals of other financial institutions outside of the scope of regulatory consolidation 27,585 eInvestments to subsidiaries 5,676 of which: investments in common equity of financial institutions being controlled but outside the scope of regulatory consolidation 3,902 fInterests in associates and jointly controlled entities 867 of which: significant investments in the Common Equity Tier 1 capital of other financial institutions outside of the scope of regulatory consolidation 173 gFixed assets 136,660Land use rights 15,874Intangible assets 1,456 hGoodwill 1,460 iDeferred tax assets 31,144 jOther assets 45,054
Total assets 16,367,689
LiabilitiesBorrowings from central banks 26,217Deposits from banks and non-bank financial institutions 795,594Placements from banks and non-bank financial institutions 261,231Financial liabilities at fair value through profit or loss 365,437Negative fair value of derivatives 10,883Financial assets sold under repurchase agreements 1,645Deposits from customers 12,961,445Accrued staff costs 31,685Taxes payable 36,768Interest payable 177,536Provisions 5,777Debt securities issued 428,524 of which: subordinated bonds issued1 159,834 kDeferred tax liabilities 18Other liabilities 123,734
Total liabilities 15,226,494
EquityShare capital 250,011 lCapital reserve 135,511 m of which: deferred hedging reserves 20 nInvestment revaluation reserve (4,414) oSurplus reserve 107,970 pGeneral reserve 169,029 qRetained earnings 482,613 rExchange reserve (4,489) sTotal equity attributable to equity shareholders of the Bank 1,136,231Minority interests 4,964 of which: minority interest given recognition in common equity tier 1 capital 3,491 t of which: minority interest given recognition in other equity tier 1 capital 34 u of which: minority interest given recognition in tier 2 capital 127 v
Total equity 1,141,195
1. In accordance with the regulatory requirements for the disclosure of information on capital composition of commercial banks issued by CBRC, the base for reducing the recognition amount of Tier 2 capital on a yearly basis is the amount of the unqualified Tier 2 capital instruments outstanding on January 1, 2013. Therefore, the amount might be different from the book value of subordinated bonds issued as at the date indicated.

China Construction Bank CorporationHalf-Year Report 2014 163
Appendix: Composition of Capital
Main features of qualified regulatory capital instrumentsThe following table shows the information related to main features of various kinds of qualified regulatory capital instruments issued by the Group as at 30 June 2014.
No.Main features of qualified regulatory capital instruments H Share A Share Rights issues
1 Issuer CCB CCB CCB2 Unique identifier 0939.HK 601939.SH 0939.HK,601939.SH3 Governing law(s) the laws of Hong Kong, China the laws of People’s Republic of
Chinathe laws of People’s Republic of China/Hong Kong, China
Regulatory treatment4 of which:transitional rules under the
Measures for Capital Management of Commercial Banks (Trial)
Common Equity Tier 1 capital Common Equity Tier 1 capital Common Equity Tier 1 capital
5 of which: post-transitional rules under the Measures for Capital Management of Commercial Banks (Trial)
Common Equity Tier 1 capital Common Equity Tier 1 capital Common Equity Tier 1 capital
6 of which: eligible at solo/group/ group&solo
the Bank and the Group the Bank and the Group the Bank and the Group
7 Instrument type Equity instruments Equity instruments Equity instruments8 Amount recognised in regulatory
capital (In millions of RMB, as at the latest reporting date)
72,550 57,119 61,159
9 Par value of instrument RMB30,459 million RMB9,000 million RMB16,322 million10 Accounting classification RMB30,459 million is recognised
in share capital, and RMB42,091 million arising from stock surplus is recognised in capital reserve
RMB9,000 million is recognised in share capital, and RMB48,119 million arising from stock surplus is recognised in capital reserve
RMB16,322 million is recognised in share capital, and RMB44,837 million arising from stock surplus is recognised in capital reserve
11 Original date of issuance 27 October 2005 25 September 2007 19 November 2010,16 December 2010
12 Perpetual or dated Perpetual Perpetual Perpetual13 of which: original maturity date No maturity No maturity No maturity14 Issuer call subject to prior
supervisory approvalNo No No
15 of which: optional call date, contingent call dates and redemption amount
N/A N/A N/A
16 of which: subsequent call dates, if applicable
N/A N/A N/A
Coupons/dividends17 of which: fixed or floating
dividend/couponFloating Floating Floating
18 of which: coupon rate and any related index
N/A N/A N/A
19 of which: existence of a dividend stopper
N/A N/A N/A
20 of which: fully discretionary, partially discretionary or mandatory
Fully discretionary Fully discretionary Fully discretionary
21 of which: existence of step up or other incentive to redeem
No No No
22 of which: non-cumulative or cumulative
Non-cumulative Non-cumulative Non-cumulative
23 Convertible or non-convertible N/A N/A N/A24 of which: if convertible,
conversion trigger (s)N/A N/A N/A
25 of which: if convertible, fully or partially
N/A N/A N/A
26 of which: if convertible, conversion rate
N/A N/A N/A
27 of which: if convertible, mandatory or optional conversion
N/A N/A N/A
28 of which: if convertible, specify instrument type convertible into
N/A N/A N/A
29 of which: if convertible, specify issuer of instrument it converts into
N/A N/A N/A

164 China Construction Bank Corporation Half-Year Report 2014
Appendix: Composition of Capital
30 Write-down feature N/A N/A N/A31 of which: if write-down,
write-down trigger(s)N/A N/A N/A
32 of which: if write-down, full or partial
N/A N/A N/A
33 of which: if write-down, permanent or temporary
N/A N/A N/A
34 of which: if temporary write-down, description of write-up mechanism
N/A N/A N/A
35 Position in subordination hierarchy in liquidation (specify instrument type immediately senior to instrument)
the lowest priority of all claims the lowest priority of all claims the lowest priority of all claims
36 Non-compliant transitioned features No No No37 of which: if yes, specify
non-compliant featuresN/A N/A N/A
We have included in this report certain forward-looking statements with respect to our financial position, operating results and business development. We use words such as “will”, “may”, “expect”, “try”, “strive”, and similar expressions to identify forward-looking statements. These statements are based on current plans, estimates and projections. Although we believe that the expectations reflected in these forward-looking statements are reasonable, we can give no assurance that those expectations will prove to have been correct, and you are cautioned not to place undue reliance on such statements. Readers are cautioned that a number of factors could cause actual results to differ, in some instances materially, from those anticipated or implied in forward-looking statements. These factors include, among others: changes in general economic conditions in the markets in which the Group operates, changes in the government’s adjustments and control policies and in laws and regulations, and factors specific to the Group.
During the reporting period, we proactively took measures to effectively manage various risks. For more information, please refer to “Management Discussion and Analysis-Risk Management” in this half-year report.