Wärtsilä Corporation Half year financial report 2017
24
-
Upload
khangminh22 -
Category
Documents
-
view
0 -
download
0
Transcript of Wärtsilä Corporation Half year financial report 2017

Growth in orders and net sales in the firsthalf of 2017
Second quarter highlights
• Order intake increased 14% to EUR 1,363 million (1,194)
• Net sales increased 8% to EUR 1,292 million (1,196)
• Book-to-bill 1.05 (1.00)
• Comparable operating result increased to EUR 126 million (122), which represents 9.7% of net sales (10.2)
• Earnings per share increased to 0.38 euro (0.19)
• Cash flow from operating activities decreased to EUR 2 million (202)
Highlights of the review period January-June 2017
• Order intake increased 13% to EUR 2,776 million (2,465)
• Net sales increased 6% to EUR 2,299 million (2,163)
• Book-to-bill 1.21 (1.14)
• Comparable operating result increased to EUR 211 million (206), which represents 9.2% of net sales (9.5)
• Earnings per share increased to 0.66 euro (0.49)
• Cash flow from operating activities decreased to EUR 3 million (189)
• Order book at the end of the period amounted to EUR 5,065 million (5,083)
Wärtsilä's prospects for 2017
Wärtsilä's overall development in 2017 is expected to be relatively unchanged from the previous year.
Demand by business area is anticipated to be as follows:
• Solid in Services with growth opportunities in selected regions and segments.
• Good in Energy Solutions, thanks to increasing electricity demand in the emerging markets and the global shift
towards renewable energy sources, which will support the need for distributed, flexible, gas-fired power
generation.
• Solid in Marine Solutions (raised from soft), thanks to a favourable vessel contracting mix. The general marine
market environment remains challenging, as the merchant, gas carrier, and offshore segments continue to suffer
from overcapacity, slow trade growth, and the financial constraints of customers.
Wärtsilä’s current order book for 2017 deliveries is EUR 2,087 million (2,061). Wärtsilä will continue to focus
on improving efficiency, which is expected to partially offset lower volumes in the marine markets. The pricing
environment in Energy Solutions’ markets has stabilised, but the order book is still impacted by the
competitive pressure seen in previous years. The good performance in Services is expected to continue.
Wärtsilä Corporation Half year financial report 2017 2
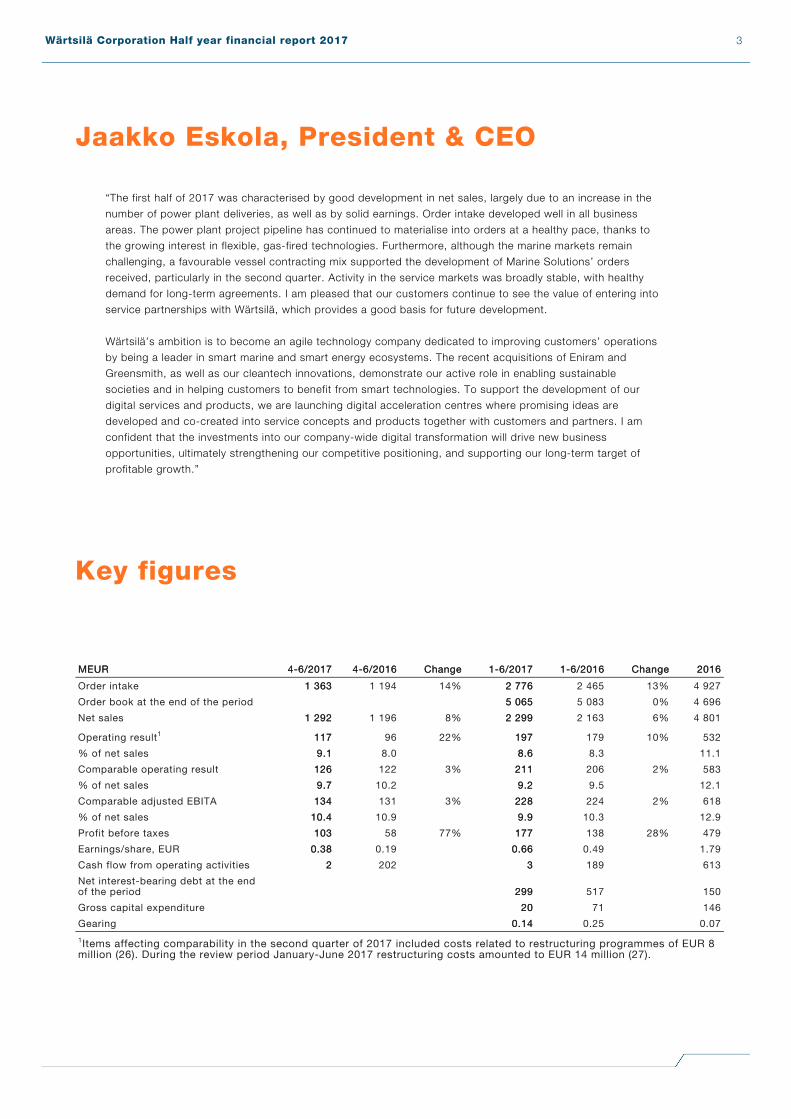
Jaakko Eskola, President & CEO
“The first half of 2017 was characterised by good development in net sales, largely due to an increase in the
number of power plant deliveries, as well as by solid earnings. Order intake developed well in all business
areas. The power plant project pipeline has continued to materialise into orders at a healthy pace, thanks to
the growing interest in flexible, gas-fired technologies. Furthermore, although the marine markets remain
challenging, a favourable vessel contracting mix supported the development of Marine Solutions’ orders
received, particularly in the second quarter. Activity in the service markets was broadly stable, with healthy
demand for long-term agreements. I am pleased that our customers continue to see the value of entering into
service partnerships with Wärtsilä, which provides a good basis for future development.
Wärtsilä’s ambition is to become an agile technology company dedicated to improving customers’ operations
by being a leader in smart marine and smart energy ecosystems. The recent acquisitions of Eniram and
Greensmith, as well as our cleantech innovations, demonstrate our active role in enabling sustainable
societies and in helping customers to benefit from smart technologies. To support the development of our
digital services and products, we are launching digital acceleration centres where promising ideas are
developed and co-created into service concepts and products together with customers and partners. I am
confident that the investments into our company-wide digital transformation will drive new business
opportunities, ultimately strengthening our competitive positioning, and supporting our long-term target of
profitable growth.”
Key figures
MEURMEUR 4-6/20174-6/2017 4-6/20164-6/2016 ChangeChange 1-6/20171-6/2017 1-6/20161-6/2016 ChangeChange 20162016
Order intake 1 3631 363 1 194 14% 2 7762 776 2 465 13% 4 927
Order book at the end of the period 5 0655 065 5 083 0% 4 696
Net sales 1 2921 292 1 196 8% 2 2992 299 2 163 6% 4 801
Operating result1 117117 96 22% 197197 179 10% 532
% of net sales 9.19.1 8.0 8.68.6 8.3 11.1
Comparable operating result 126126 122 3% 211211 206 2% 583
% of net sales 9.79.7 10.2 9.29.2 9.5 12.1
Comparable adjusted EBITA 134134 131 3% 228228 224 2% 618
% of net sales 10.410.4 10.9 9.99.9 10.3 12.9
Profit before taxes 103103 58 77% 177177 138 28% 479
Earnings/share, EUR 0.380.38 0.19 0.660.66 0.49 1.79
Cash flow from operating activities 22 202 33 189 613
Net interest-bearing debt at the endof the period 299299 517 150
Gross capital expenditure 2020 71 146
Gearing 0.140.14 0.25 0.07
1Items affecting comparability in the second quarter of 2017 included costs related to restructuring programmes of EUR 8million (26). During the review period January-June 2017 restructuring costs amounted to EUR 14 million (27).
Wärtsilä Corporation Half year financial report 2017 3

Market development
SERVICES
Steady development in the service markets
Service markets were stable during the first half of the year. Activity in the cruise and gas carrier segments
was on a healthy level, which compensated for continued challenges in the offshore and conventional
merchant markets. Demand for power plant related services was steady. Customers in both end markets
continued to show interest in long-term service agreements.
ENERGY SOLUTIONS
Power generation markets shifting towards flexible technologies
The demand for Wärtsilä’s power generation solutions was good in the first half of 2017. Electricity demand in
the emerging markets continued to increase, and the growing share of intermittent renewable sources in
several developed markets drove investments in flexible generation capacity. These encouraging
developments are counterbalanced with strong competition in the liquid and gas fuelled power generation
markets, as well as by the potential impacts of geopolitical and macroeconomic uncertainties.
Energy Solutions’ market share
For the twelve months ending in March, global orders for natural gas and liquid fuel power plants of up to 500
MW increased by 9% to 28.4 GW (26.1 GW at the end of the previous quarter). Wärtsilä's market share was
12% (13). Global orders include all gas turbine and Wärtsilä orders with prime movers over 5 MW in size.
MARINE SOLUTIONS
Marine market environment remains challenging
During the first half of 2017, 376 contracts for new vessels were registered (378). Despite some signs of a
gradual recovery in demand, the marine industry continues to be burdened by weak utilisation levels,
overcapacity, low freight rates, and low oil and gas prices. LNG carrier contracting improved somewhat
thanks to the positive sentiment in the FSRU market and project driven investments. Contracting activity
remained on a good level in niche vessel segments, such as cruise, ferry, special vessels and Ro-Ro, where
newbuild investments were supported by higher earnings, ageing fleets, planned regulatory developments,
and attractive newbuilding prices.
In terms of compensated gross tonnage, China and South Korea remained the largest shipbuilding nations
with 32% and 31% of all confirmed contracts respectively. Italy and Finland accounted for 8% and 7% of the
global total, thanks to the continued healthy activity in the cruise market.
Marine Solutions’ market shares
Wärtsilä’s share of the medium-speed main engine market was 40% (45% at the end of the previous quarter).
The market share in auxiliary engines decreased to 8% (20% at the end of the previous quarter). In the
comparison period, Wärtsilä’s auxiliary engine market share was boosted by large orders placed in the
containership and LNG carrier segments. Wärtsilä is well positioned in other key product and solution areas,
such as electrical and automation systems and gas systems.
Wärtsilä Corporation Half year financial report 2017 4

Order intake
Wärtsilä’s second quarter order intake totalled EUR 1,363 million (1,194), an increase of 14% over the
corresponding period last year. The second quarter book-to-bill ratio was 1.05 (1.00).
Order intake for the Services business increased by 14% to EUR 599 million (527) in the second quarter,
thanks to higher demand for long-term service agreements. Orders received included the renewal of a
performance-based service agreement with Norwegian Cruise Line Holdings, several operations &
management agreements for power plants in Asia, as well as an agreement with Eidesvik Offshore to install a
hybrid system with batteries on board the company’s Viking Princess vessel. Wärtsilä also signed its first
asset management agreement for a photovoltaic power plant, in which Wärtsilä will assume full responsibility
for the operation and maintenance of the Essakane solar plant in Burkina Faso.
Order intake for Energy Solutions totalled EUR 361 million (304) in the second quarter, which represents an
increase of 19% from the corresponding period last year. Ordering activity was strongest in Asia, where
significant orders included a 240 MW equipment delivery from Indonesia. In the developed markets, received
orders included equipment deliveries for two natural gas based power plants with a total gross capacity of
188 MW from the USA.
Marine Solutions’ second quarter order intake totalled EUR 403 million (362), an increase of 11% compared to
the corresponding period last year. Orders received included a contract to supply a recently launched Wärtsilä
HY hybrid power system, combining engines, an energy storage system, and power electronics, to the Italian
tug owner and operator Rimorchiatori Riuniti. Wärtsilä was also selected to provide its 31 main engine, the
propulsion machinery, and the auxiliary engines for Research Fishing Co’s new fuel-efficient fishing vessel; as
well as the waterjets, hydraulics and control system for a high-speed RoPax ferry being built for Molslinjen A/
S. The cruise and ferry segment represented 39% of order intake and the gas carrier segment 25%. The
conventional merchant segment’s share was 17%. The navy segment represented 9%, special vessels 6%
and offshore 2%. Other orders accounted for 2% of the total.
The total order intake for the review period January-June 2017 increased by 13% to EUR 2,776 million
(2,465). The book-to-bill ratio for the review period was 1.21 (1.14). Services’ order intake totalled EUR 1,285
million (1,107), an increase of 16%. Energy Solutions’ order intake increased by 24% to EUR 766 million (616).
Marine Solutions’ order intake decreased by 2% to EUR 725 million (741).
Order intake by business
MEURMEUR 4-6/20174-6/2017 4-6/20164-6/2016 ChangeChange 1-6/20171-6/2017 1-6/20161-6/2016 ChangeChange 20162016
Services 599599 527 14% 1 2851 285 1 107 16% 2 194
Energy Solutions 361361 304 19% 766766 616 24% 1 448
Marine Solutions 403403 362 11% 725725 741 -2% 1 285
Order intake, total 1 3631 363 1 194 14% 2 7762 776 2 465 13% 4 927
Order intake Energy Solutions
MWMW 4-6/20174-6/2017 4-6/20164-6/2016 ChangeChange 1-6/20171-6/2017 1-6/20161-6/2016 ChangeChange 20162016
Oil 478478 734 -35% 679679 1 298 -48% 1 929
Gas 505505 284 78% 1 1271 127 587 92% 1 584
Order intake, total 984984 1 018 -3% 1 8061 806 1 886 -4% 3 513
Wärtsilä Corporation Half year financial report 2017 5
Order intake in joint ventures
Order intake in the Wärtsilä Hyundai Engine Company Ltd joint venture company in South Korea, and in the
Wärtsilä Qiyao Diesel Company Ltd and CSSC Wärtsilä Engine Company Ltd. joint venture companies in
China totalled EUR 26 million (54) during the review period January-June 2017. These companies’ results are
reported as a share of the result of associates and joint ventures.
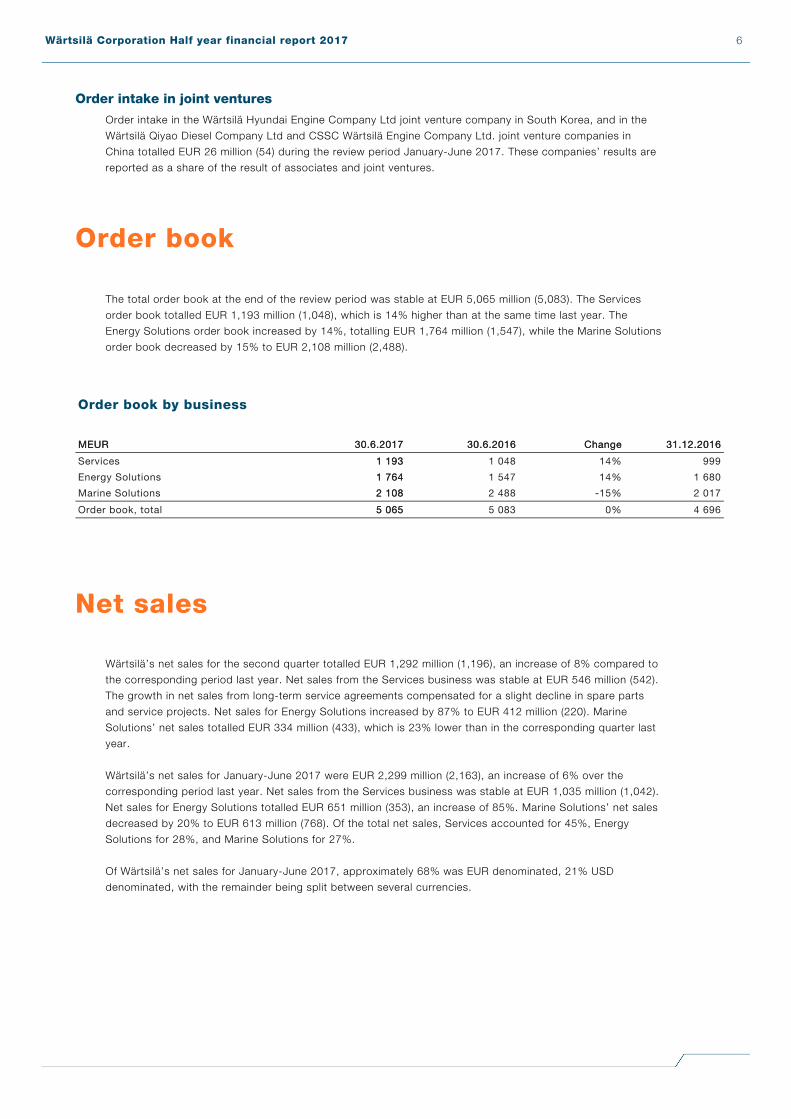
Order book
The total order book at the end of the review period was stable at EUR 5,065 million (5,083). The Services
order book totalled EUR 1,193 million (1,048), which is 14% higher than at the same time last year. The
Energy Solutions order book increased by 14%, totalling EUR 1,764 million (1,547), while the Marine Solutions
order book decreased by 15% to EUR 2,108 million (2,488).
Order book by business
MEURMEUR 30.6.201730.6.2017 30.6.201630.6.2016 ChangeChange 31.12.201631.12.2016
Services 1 1931 193 1 048 14% 999
Energy Solutions 1 7641 764 1 547 14% 1 680
Marine Solutions 2 1082 108 2 488 -15% 2 017
Order book, total 5 0655 065 5 083 0% 4 696
Net sales
Wärtsilä’s net sales for the second quarter totalled EUR 1,292 million (1,196), an increase of 8% compared to
the corresponding period last year. Net sales from the Services business was stable at EUR 546 million (542).
The growth in net sales from long-term service agreements compensated for a slight decline in spare parts
and service projects. Net sales for Energy Solutions increased by 87% to EUR 412 million (220). Marine
Solutions’ net sales totalled EUR 334 million (433), which is 23% lower than in the corresponding quarter last
year.
Wärtsilä’s net sales for January-June 2017 were EUR 2,299 million (2,163), an increase of 6% over the
corresponding period last year. Net sales from the Services business was stable at EUR 1,035 million (1,042).
Net sales for Energy Solutions totalled EUR 651 million (353), an increase of 85%. Marine Solutions’ net sales
decreased by 20% to EUR 613 million (768). Of the total net sales, Services accounted for 45%, Energy
Solutions for 28%, and Marine Solutions for 27%.
Of Wärtsilä’s net sales for January-June 2017, approximately 68% was EUR denominated, 21% USD
denominated, with the remainder being split between several currencies.
Wärtsilä Corporation Half year financial report 2017 6

Net sales by business
MEURMEUR 4-6/20174-6/2017 4-6/20164-6/2016 ChangeChange 1-6/20171-6/2017 1-6/20161-6/2016 ChangeChange 20162016
Services 546546 542 1% 1 0351 035 1 042 -1% 2 190
Energy Solutions 412412 220 87% 651651 353 85% 943
Marine Solutions 334334 433 -23% 613613 768 -20% 1 667
Net sales, total 1 2921 292 1 196 8% 2 2992 299 2 163 6% 4 801
Operating result and profitability
The second quarter operating result was EUR 117 million (96), or 9.1% of net sales (8.0). The comparable
operating result was EUR 126 million (122), or 9.7% of net sales (10.2). Items affecting comparability included
restructuring costs of EUR 8 million (26). The comparable adjusted EBITA was EUR 134 million (131), or
10.4% of net sales (10.9). Purchase price allocation amortisation amounted to EUR 9 million (9).
The operating result for the review period January-June 2017 was EUR 197 million (179), which represents
8.6% of net sales (8.3). The comparable operating result was EUR 211 million (206), or 9.2% of net sales
(9.5). Items affecting comparability included costs related to restructuring programmes of EUR 14 million (27).
The comparable adjusted EBITA was EUR 228 million (224), or 9.9% of net sales (10.3). Purchase price
allocation amortisation amounted to EUR 17 million (17).
Wärtsilä’s operating result was negatively affected by a provision related to long-term incentive schemes,
which amounted to EUR 16 million in the second quarter and EUR 27 million in the review period January-
June 2017. The provision covers all three ongoing programmes. Wärtsilä’s three-year long-term incentive
schemes are tied to the development of the company's share price, and they apply to approximately 100
directors.
Financial items for the review period January-June 2017 amounted to EUR -20 million (-41). Net interest
totalled EUR -4 million (-6). Profit before taxes amounted to EUR 177 million (138). Taxes amounted to EUR
45 million (37), implying an effective tax rate of 25.3% (26.9). Earnings per share were 0.66 euro (0.49) and
the equity per share was 10.79 euro (10.30). Return on investments (ROI) was 19.5% (17.5). Return on equity
(ROE) was 18.4% (17.4).
Measures of profit and items affecting comparability
MEURMEUR 4-6/20174-6/2017 4-6/20164-6/2016 1-6/20171-6/2017 1-6/20161-6/2016 20162016
Comparable adjusted EBITA 134134 131 228228 224 618
Purchase price allocationamortisation -9-9 -9 -17-17 -17 -35
Comparable operating result 126126 122 211211 206 583
Items affecting comparability -8-8 -26 -14-14 -27 -51
Operating result 117117 96 197197 179 532
Wärtsilä Corporation Half year financial report 2017 7
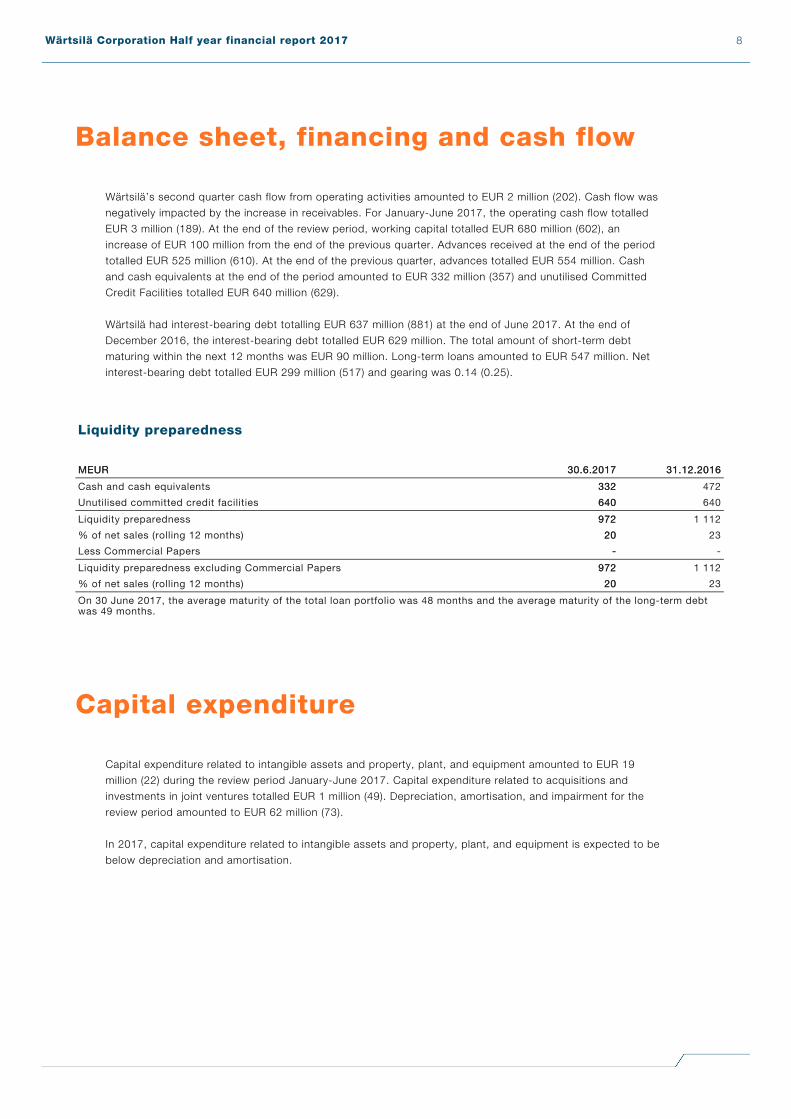
Balance sheet, financing and cash flow
Wärtsilä’s second quarter cash flow from operating activities amounted to EUR 2 million (202). Cash flow was
negatively impacted by the increase in receivables. For January-June 2017, the operating cash flow totalled
EUR 3 million (189). At the end of the review period, working capital totalled EUR 680 million (602), an
increase of EUR 100 million from the end of the previous quarter. Advances received at the end of the period
totalled EUR 525 million (610). At the end of the previous quarter, advances totalled EUR 554 million. Cash
and cash equivalents at the end of the period amounted to EUR 332 million (357) and unutilised Committed
Credit Facilities totalled EUR 640 million (629).
Wärtsilä had interest-bearing debt totalling EUR 637 million (881) at the end of June 2017. At the end of
December 2016, the interest-bearing debt totalled EUR 629 million. The total amount of short-term debt
maturing within the next 12 months was EUR 90 million. Long-term loans amounted to EUR 547 million. Net
interest-bearing debt totalled EUR 299 million (517) and gearing was 0.14 (0.25).
Liquidity preparedness
MEURMEUR 30.6.201730.6.2017 31.12.201631.12.2016
Cash and cash equivalents 332332 472
Unutilised committed credit facilities 640640 640
Liquidity preparedness 972972 1 112
% of net sales (rolling 12 months) 2020 23
Less Commercial Papers -- -
Liquidity preparedness excluding Commercial Papers 972972 1 112
% of net sales (rolling 12 months) 2020 23
On 30 June 2017, the average maturity of the total loan portfolio was 48 months and the average maturity of the long-term debtwas 49 months.
Capital expenditure
Capital expenditure related to intangible assets and property, plant, and equipment amounted to EUR 19
million (22) during the review period January-June 2017. Capital expenditure related to acquisitions and
investments in joint ventures totalled EUR 1 million (49). Depreciation, amortisation, and impairment for the
review period amounted to EUR 62 million (73).
In 2017, capital expenditure related to intangible assets and property, plant, and equipment is expected to be
below depreciation and amortisation.
Wärtsilä Corporation Half year financial report 2017 8

Strategic projects, acquisitions and jointventures
In May, Wärtsilä announced the acquisition of Greensmith Energy Management Systems Inc., a US-based
leader in intelligent energy storage technology and solutions. The acquisition of Greensmith will enable
Wärtsilä to expand its footprint in the energy storage market and position itself as a leading global energy
systems integrator. In 2016, Greensmith’s revenues were USD 32 million with over 40 employees. The
transaction is valued at USD 170 million (enterprise value). Ownership of the company was transferred to
Wärtsilä with effect from 3 July 2017.
The set-up of CSSC Wärtsilä Electrical & Automation Co Ltd, a joint venture between Wärtsilä and China State
Shipbuilding Corporation (CSSC) focusing on the growing Chinese electrical and automation market, is
proceeding. The business license is expected to be received during the fourth quarter of 2017.
Research and development, productlaunches
In May, Wärtsilä introduced a unique hybrid product, the Wärtsilä HY. By leveraging its technical strengths in
both engine design and electrical & automation systems, Wärtsilä’s fully integrated hybrid power module
combines engines, an energy storage system, and power electronics optimised to work together through a
newly developed energy management system.
Also in May, Eniram, a Wärtsilä company, introduced an update to its performance monitoring system
targeted at commercial shipping operators. The Eniram SkyLight 2.0 adds nautical maps, weather layers, and
route importation to make predictive analysis and proactive planning more available. The updated system can
visualise a vessel’s route from economic, environmental, and safety perspectives.
Restructuring programmes
Wärtsilä initiated restructuring measures in 2015 and 2016 to adapt to prevailing market conditions. These
measures target annual savings of approximately EUR 90 million, of which approximately EUR 60 million had
materialised by the end 2016. The total costs related to the restructuring programmes are estimated to be
approximately EUR 75-80 million, of which EUR 67 million had been recognised by the end of 2016.
Wärtsilä’s aim is to continuously pursue more cost efficient ways of operating and align its operations to
market conditions. In this context, local actions within Marine Solutions are expected to result in additional
annual savings of approximately EUR 45 million. These savings will start to materialise during 2017, and will
take full effect by the end of 2018. The related costs are estimated to be approximately EUR 35 million, of
which the majority is expected to be recognised during 2017.
For the full year 2017, incremental savings are estimated to be EUR 50-55 million and related restructuring
Wärtsilä Corporation Half year financial report 2017 9

costs approximately EUR 40 million. During January-June 2017, Wärtsilä recognised savings of approximately
EUR 25 million and costs of EUR 14 million related to all of the above restructuring measures.
Personnel
Wärtsilä had 17,783 (18,428) employees at the end of June 2017. On average, the number of personnel for
January-June 2017 totalled 17,806 (18,378). Services employed 10,455 (10,575) people, Energy Solutions
928 (945), and Marine Solutions 5,861 (6,443).
Of Wärtsilä’s total number of employees, 20% (19) were located in Finland and 38% (39) elsewhere in Europe.
Personnel employed in Asia represented 27% (28) of the total, personnel in the Americas 10% (11), and
personnel in other countries 4% (4).
Sustainable development
Thanks to its various technologies and specialised services, Wärtsilä is well positioned to reduce exhaust
emissions and the use of natural resources, and to support its customers in preparing for new regulatory
requirements. Wärtsilä’s R&D efforts continue to focus on the development of advanced environmental
technologies and solutions. The company is committed to supporting the UN Global Compact and its
principles with respect to human rights, labour, the environment and anti-corruption. Wärtsilä’s share is
included in several sustainability indices. During the second quarter, Wärtsilä was informed that it would
continue to be included in the Euronext Vigeo index Eurozone 120 (the 120 most advanced companies in the
Eurozone region).
In June, Wärtsilä and a group of environmentally conscious maritime industry players signed up to a new
Global Industry Alliance (GIA) to support transitioning shipping and its related industries towards a low carbon
future. Together, the thirteen GIA partners will collectively identify and develop innovative solutions to address
common barriers to the uptake and implementation of energy efficiency technologies and operational
measures.
The International Convention for the Control and Management of ships’ ballast water and sediments will enter
into force on 8 September 2017, with the intention of addressing the issue of invasive aquatic species being
carried in the ballast water of ships and then discharged into the sea where they can harm local species.
Wärtsilä is well placed to support its customers as they prepare to meet the upcoming regulatory
requirements. In July, the International Maritime Organisation's MEPC Committee approved a revised
implementation schedule for the installation of ballast water management systems based on an evaluation of
the vessels' International Oil Pollution Prevention Certificate (IOPP) renewal, whereby in certain cases the
deadline is postponed by up to two years. During the second quarter, Wärtsilä announced it is in the process
of signing agreements with a number of major shipyards to establish cooperation and communication between
the parties in relation to the Convention for Ballast Water Management. The shared goal of the parties is to
provide ship owners and operators with all necessary information and assistance concerning ballast water
management systems.
Wärtsilä Corporation Half year financial report 2017 10

Shares and shareholders
During January-June 2017, the volume of trades on Nasdaq Helsinki was 43,318,709 shares, equivalent to a
turnover of EUR 2,185 million. Wärtsilä's shares are also traded on alternative exchanges, such as Chi-X,
Turquoise and BATS. The total trading volume on these alternative exchanges was 35,455,711 shares.
Shares on Nasdaq Helsinki
Number ofNumber of Number ofNumber of
shares andshares and shares tradedshares traded
30.6.201730.6.2017 votesvotes 1-6/20171-6/2017
WRT1V 197 241 130 43 318 709
1.1. - 30.6.20171.1. - 30.6.2017 HighHigh LowLow AverageAverage 11 CloseClose
Share price 56.90 41.90 50.45 51.75
1 Trade-weighted average price
30.6.201730.6.2017 30.6.201630.6.2016
Market capitalisation, EUR million 10 207 7 209
Foreign shareholders, % 55.5 53.7
Decisions taken by the Annual GeneralMeeting
Wärtsilä’s Annual General Meeting held on 2 March 2017 approved the financial statements and discharged
the members of the Board of Directors and the company’s President & CEO from liability for the financial year
2016. The Meeting approved the Board of Directors’ proposal to pay a dividend of EUR 1.30 per share in two
instalments. The first instalment of EUR 0.65 per share was paid on 13 March 2017. The second instalment of
EUR 0.65 per share shall be paid in September 2017.
The Annual General Meeting decided that the Board of Directors shall have eight members. The following were
elected to the Board: Maarit Aarni-Sirviö, Kaj-Gustaf Bergh, Karin Falk, Johan Forssell, Tom Johnstone,
Mikael Lilius, Risto Murto and Markus Rauramo.
The audit firm PricewaterhouseCoopers Oy was elected as the auditor of the Company for the year 2017.
Authorisation to repurchase and distribute the Company’s own shares
The Board of Directors was authorised to resolve to repurchase a maximum of 19,000,000 of the Company’s
own shares. The authorisation to repurchase the Company’s own shares shall be valid until the close of the
next Annual General Meeting, however no longer than for 18 months from the authorisation of the
shareholders’ meeting.
Wärtsilä Corporation Half year financial report 2017 11
The Board of Directors was authorised to resolve to distribute a maximum of 19,000,000 of the Company’s
own shares. The authorisation for the Board of Directors to distribute the Company’s own shares shall be
valid for three years from the authorisation of the shareholders’ meeting and it cancels the authorisation given
by the General Meeting on 3 March 2016. The Board of Directors was authorised to resolve to whom and in
which order the own shares will be distributed. The Board of Directors was authorised to decide on the
distribution of the Company’s own shares otherwise than in proportion to the existing pre-emptive right of the
shareholders to purchase the Company’s own shares.
Organisation of the Board of Directors
The Board of Directors of Wärtsilä Corporation elected Mikael Lilius as its chairman and Tom Johnstone as
the deputy chairman. The Board decided to establish an Audit Committee, a Nomination Committee and a
Remuneration Committee. The Board appointed from among its members the following members to the
Committees:
Audit Committee: Chairman Markus Rauramo, Maarit Aarni-Sirviö, Risto Murto
Nomination Committee: Chairman Mikael Lilius, Kaj-Gustaf Bergh, Johan Forssell, Risto Murto
Remuneration Committee: Chairman Mikael Lilius, Maarit Aarni-Sirviö, Tom Johnstone
Risks and business uncertainties
In the Services business, slow economic growth and political instability in specific regions are the main risks
for demand development. The challenging conditions in specific marine market segments are also seen as a
potential risk.
In the power generation markets, the fragile economic growth and slow decision-making continue to be the
primary risks for demand development. Geopolitical tensions and significant currency fluctuations can result in
investment decisions being postponed in certain countries. Low oil prices have a similar impact in the oil and
gas producing countries. Price pressure resulting from the prevailing competitive environment remains a risk.
In the marine market, overcapacity in many vessel segments, and the low demand for cargo tonnage continue
to delay recovery in the conventional shipping segment. Economic and political uncertainty, as well as new
emerging technologies and innovations, will challenge current business models and trade patterns. Reduced
capital expenditure from oil companies continues to limit offshore investments, and offshore production is
facing increasing competition from low cost onshore and shale production. In addition, increasing energy
efficiency and the substitution of other energy sources, will challenge crude oil demand growth. While the risk
of cancellations exists, negotiations to extend existing delivery contracts appear to be a larger risk for
shipyard order books.
The Group is a defendant in a number of legal cases that have arisen out of, or are incidental to, the ordinary
course of its business. These lawsuits mainly concern issues such as contractual and other liability, labour
relations, property damage, and regulatory matters. The Group receives from time to time claims of different
amounts and with varying degrees of substantiation. There is currently one unusually sizeable claim. It is the
Group’s policy to provide for amounts related to the claims, as well as for litigation and arbitration matters,
when an unfavourable outcome is probable and the amount of the loss can be reasonably estimated.
The 2016 annual report contains a more detailed description of Wärtsilä’s risks and risk management.
Wärtsilä Corporation Half year financial report 2017 12

Wärtsilä Half year financial report 2017
This half year financial report is prepared in accordance with IAS 34 (Interim Financial Reporting) using the
same accounting policies and methods of computation as in the annual financial statements for 2016. All
figures in the accounts have been rounded and consequently the sum of individual figures can deviate from
the presented sum figure.
Use of estimates
The preparation of the financial statements in accordance with IFRS requires management to make estimates
and assumptions that affect the valuation of the reported assets and liabilities and other information, such as
contingent liabilities and the recognition of income and expenses in the statement of income. Although the
estimates are based on the management’s best knowledge of current events and actions, actual results may
differ from the estimates.
IFRS amendments
In 2017, the Group has adopted the following new standard issued by the IASB.
The Group has early adopted IFRS 9 Financial Instruments, which replaces IAS 39 Financial Instruments -
Recognition and Measurement. IFRS 9 includes revised guidance on the classification and measurement of
financial assets, new general hedge accounting requirements and a new expected credit loss model for
calculating impairment on financial assets. In its main aspects, it also carries forward the guidance on
recognition and derecognition of financial instruments from IAS 39. The impacts of IFRS 9 adoption are
described below.
The new hedge accounting guidance in IFRS 9 aligns the hedge accounting treatment better with risk
management activities and, among others, allows net position hedging. The Group applies the new hedge
accounting requirements prospectively. Usually the Group hedges received orders separately from the
committed purchases but in some projects or long term agreements the Group might apply cash flow hedging
also against the expected net cash flows, consisting of related sales proceeds and purchases in the same
currency. The result from net position hedges is presented on a separate line in the statement of income. The
adoption of the new hedge accounting requirements did not have any material impact on the reporting period
January-June 2017.
Under IFRS 9, financial assets are classified according to their cash flow characteristics and the business
model in which they are managed. The Group has categorised its financial assets to financial assets measured
at amortised cost, at fair value through the statement of income and at fair value through other comprehensive
income. The reclassification has not had any impact on equity.
Financial assets are classified under IFRS 9 as presented in the table below.
Classification underClassification underIAS 39IAS 39
Classification underClassification underIFRS 9IFRS 9
Trade and other receivables,investments in commercial papers Loans and receivables Amortised cost
Interest-bearing investments Loans and receivablesFair value through the statementof income
Other investments Available-for-sale financial assets
Fair value through the statementof income (or other comprehensiveincome)
Derivatives included in hedgeaccounting
Cash flow hedges (at fair valuethrough other comprehensiveincome)
Fair value through othercomprehensive income
Wärtsilä Corporation Half year financial report 2017 13

Derivatives, no hedge accounting
Financial assets at fair valuethrough the statement ofincome
Fair value through the statementof income
Applying IFRS 9 also changes the measurement of the loss allowance for financial assets by introducing an
expected credit loss model. At the adoption of IFRS 9, the Group has revised its impairment methodology.
The methodology applied depends on whether there has been a significant increase in credit risk. The Group
assesses possible increase in the credit risk for financial assets measured at amortised cost at the end of
each reporting period. The loss allowance is estimated at an amount equal to 12-month expected credit
losses at the current reporting date if there has not been a significant increase in credit risk.
For trade receivables and receivables from revenue recognition in accordance with the percentage of
completion method, a simplified approach is used and the loss allowance is measured at the estimate of the
lifetime expected credit losses. Receivables from revenue recognition in accordance with the percentage of
completion method are usually covered with advance payments collected from customers. Thus, recognising
credit losses based on the lifetime expected loss amounts mainly concerns trade receivables. For trade
receivables not due or a maximum of 359 days overdue, an impairment of 0.1% - 2.0% is made, depending
on the aging category and the origin of the receivable. In calculating the expected credit loss rates, the Group
considers historical loss rates for each category, and adjusts for forward looking macroeconomic data. In
addition to this, trade receivables that are more than 360 days old are assessed for impairment individually.
Considering this, the Group has made an adjustment of EUR -3 million in retained earnings and trade
receivables as of 1 January 2017. Figures in the comparison periods have not been restated.
This half year financial report is unaudited.
Wärtsilä Corporation Half year financial report 2017 14
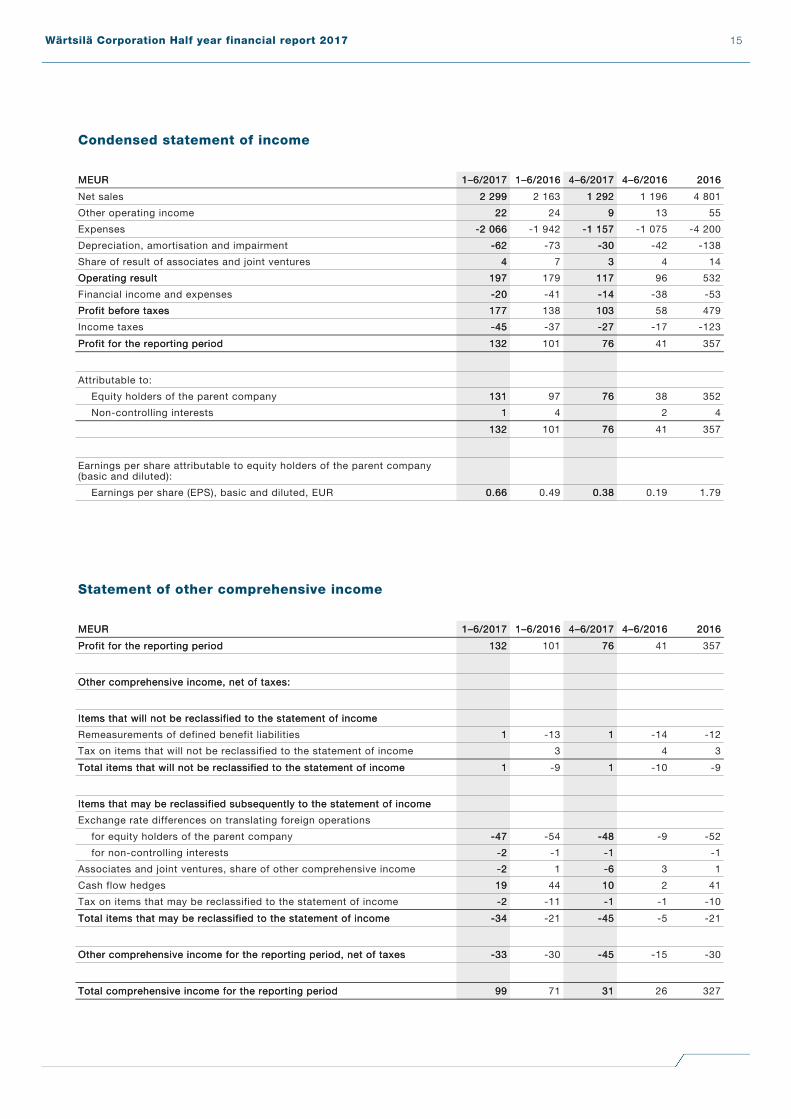
Condensed statement of income
MEURMEUR 1–6/20171–6/2017 1–6/20161–6/2016 4–6/20174–6/2017 4–6/20164–6/2016 20162016
Net sales 2 2992 299 2 163 1 2921 292 1 196 4 801
Other operating income 2222 24 99 13 55
Expenses -2 066-2 066 -1 942 -1 157-1 157 -1 075 -4 200
Depreciation, amortisation and impairment -62-62 -73 -30-30 -42 -138
Share of result of associates and joint ventures 44 7 33 4 14
Operating resultOperating result 197197 179 117117 96 532
Financial income and expenses -20-20 -41 -14-14 -38 -53
Profit before taxesProfit before taxes 177177 138 103103 58 479
Income taxes -45-45 -37 -27-27 -17 -123
Profit for the reporting periodProfit for the reporting period 132132 101 7676 41 357
Attributable to:
Equity holders of the parent company 131131 97 7676 38 352
Non-controlling interests 11 4 2 4
132132 101 7676 41 357
Earnings per share attributable to equity holders of the parent company(basic and diluted):
Earnings per share (EPS), basic and diluted, EUR 0.660.66 0.49 0.380.38 0.19 1.79
Statement of other comprehensive income
MEURMEUR 1–6/20171–6/2017 1–6/20161–6/2016 4–6/20174–6/2017 4–6/20164–6/2016 20162016
Profit for the reporting periodProfit for the reporting period 132132 101 7676 41 357
Other comprehensive income, net of taxes:Other comprehensive income, net of taxes:
Items that will not be reclassified to the statement of incomeItems that will not be reclassified to the statement of income
Remeasurements of defined benefit liabilities 11 -13 11 -14 -12
Tax on items that will not be reclassified to the statement of income 3 4 3
Total items that will not be reclassified to the statement of incomeTotal items that will not be reclassified to the statement of income 11 -9 11 -10 -9
Items that may be reclassified subsequently to the statement of incomeItems that may be reclassified subsequently to the statement of income
Exchange rate differences on translating foreign operations
for equity holders of the parent company -47-47 -54 -48-48 -9 -52
for non-controlling interests -2-2 -1 -1-1 -1
Associates and joint ventures, share of other comprehensive income -2-2 1 -6-6 3 1
Cash flow hedges 1919 44 1010 2 41
Tax on items that may be reclassified to the statement of income -2-2 -11 -1-1 -1 -10
Total items that may be reclassified to the statement of incomeTotal items that may be reclassified to the statement of income -34-34 -21 -45-45 -5 -21
Other comprehensive income for the reporting period, net of taxesOther comprehensive income for the reporting period, net of taxes -33-33 -30 -45-45 -15 -30
Total comprehensive income for the reporting periodTotal comprehensive income for the reporting period 9999 71 3131 26 327
Wärtsilä Corporation Half year financial report 2017 15
Total comprehensive income attributable to:
Equity holders of the parent company 9999 68 3333 23 323
Non-controlling interests 3 -1-1 3 3
9999 71 3131 26 327
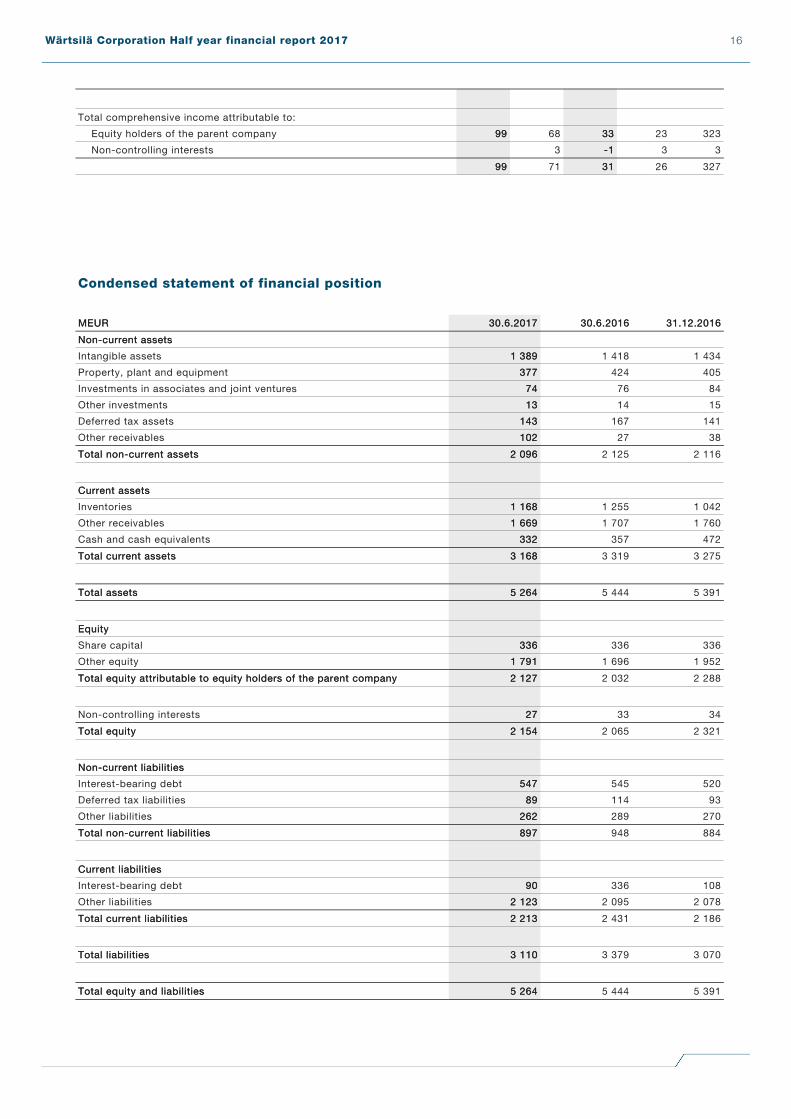
Condensed statement of financial position
MEURMEUR 30.6.201730.6.2017 30.6.201630.6.2016 31.12.201631.12.2016
Non-current assetsNon-current assets
Intangible assets 1 3891 389 1 418 1 434
Property, plant and equipment 377377 424 405
Investments in associates and joint ventures 7474 76 84
Other investments 1313 14 15
Deferred tax assets 143143 167 141
Other receivables 102102 27 38
Total non-current assetsTotal non-current assets 2 0962 096 2 125 2 116
Current assetsCurrent assets
Inventories 1 1681 168 1 255 1 042
Other receivables 1 6691 669 1 707 1 760
Cash and cash equivalents 332332 357 472
Total current assetsTotal current assets 3 1683 168 3 319 3 275
Total assetsTotal assets 5 2645 264 5 444 5 391
EquityEquity
Share capital 336336 336 336
Other equity 1 7911 791 1 696 1 952
Total equity attributable to equity holders of the parent companyTotal equity attributable to equity holders of the parent company 2 1272 127 2 032 2 288
Non-controlling interests 2727 33 34
Total equityTotal equity 2 1542 154 2 065 2 321
Non-current liabilitiesNon-current liabilities
Interest-bearing debt 547547 545 520
Deferred tax liabilities 8989 114 93
Other liabilities 262262 289 270
Total non-current liabilitiesTotal non-current liabilities 897897 948 884
Current liabilitiesCurrent liabilities
Interest-bearing debt 9090 336 108
Other liabilities 2 1232 123 2 095 2 078
Total current liabilitiesTotal current liabilities 2 2132 213 2 431 2 186
Total liabilitiesTotal liabilities 3 1103 110 3 379 3 070
Total equity and liabilitiesTotal equity and liabilities 5 2645 264 5 444 5 391
Wärtsilä Corporation Half year financial report 2017 16
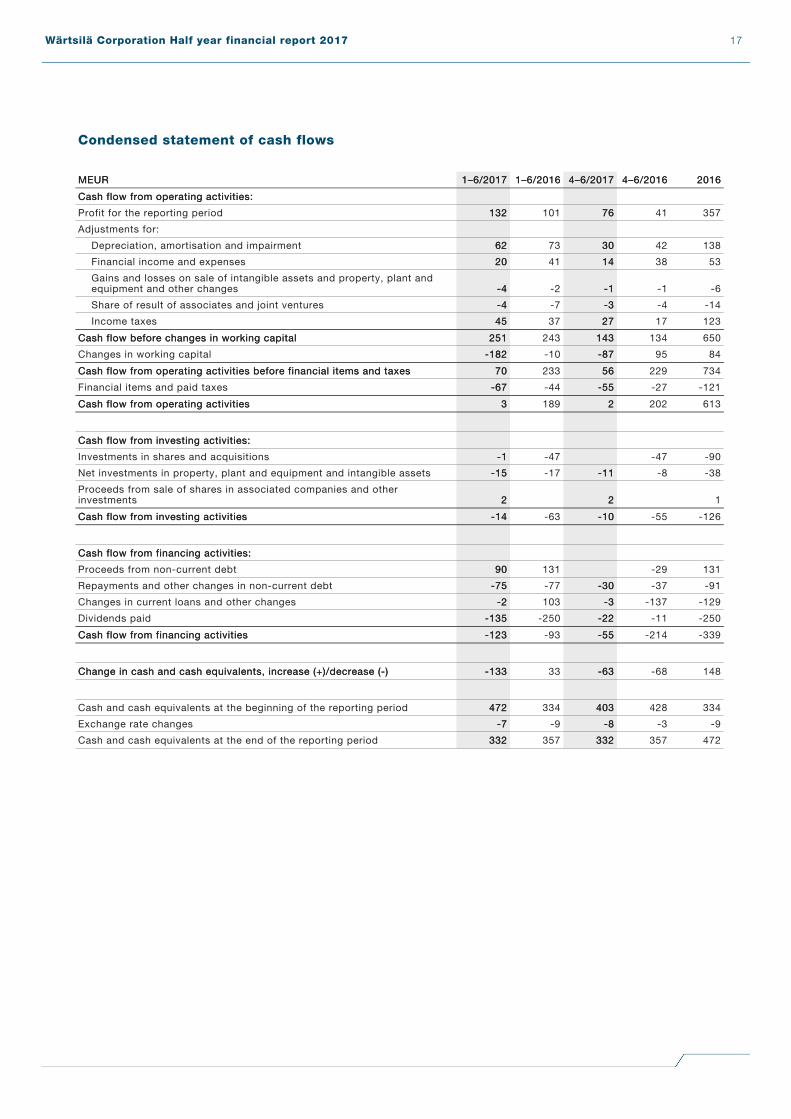
Condensed statement of cash flows
MEURMEUR 1–6/20171–6/2017 1–6/20161–6/2016 4–6/20174–6/2017 4–6/20164–6/2016 20162016
Cash flow from operating activities:Cash flow from operating activities:
Profit for the reporting period 132132 101 7676 41 357
Adjustments for:
Depreciation, amortisation and impairment 6262 73 3030 42 138
Financial income and expenses 2020 41 1414 38 53
Gains and losses on sale of intangible assets and property, plant andequipment and other changes -4-4 -2 -1-1 -1 -6
Share of result of associates and joint ventures -4-4 -7 -3-3 -4 -14
Income taxes 4545 37 2727 17 123
Cash flow before changes in working capitalCash flow before changes in working capital 251251 243 143143 134 650
Changes in working capital -182-182 -10 -87-87 95 84
Cash flow from operating activities before financial items and taxesCash flow from operating activities before financial items and taxes 7070 233 5656 229 734
Financial items and paid taxes -67-67 -44 -55-55 -27 -121
Cash flow from operating activitiesCash flow from operating activities 33 189 22 202 613
Cash flow from investing activities:Cash flow from investing activities:
Investments in shares and acquisitions -1-1 -47 -47 -90
Net investments in property, plant and equipment and intangible assets -15-15 -17 -11-11 -8 -38
Proceeds from sale of shares in associated companies and otherinvestments 22 22 1
Cash flow from investing activitiesCash flow from investing activities -14-14 -63 -10-10 -55 -126
Cash flow from financing activities:Cash flow from financing activities:
Proceeds from non-current debt 9090 131 -29 131
Repayments and other changes in non-current debt -75-75 -77 -30-30 -37 -91
Changes in current loans and other changes -2-2 103 -3-3 -137 -129
Dividends paid -135-135 -250 -22-22 -11 -250
Cash flow from financing activitiesCash flow from financing activities -123-123 -93 -55-55 -214 -339
Change in cash and cash equivalents, increase (+)/decrease (-)Change in cash and cash equivalents, increase (+)/decrease (-) -133-133 33 -63-63 -68 148
Cash and cash equivalents at the beginning of the reporting period 472472 334 403403 428 334
Exchange rate changes -7-7 -9 -8-8 -3 -9
Cash and cash equivalents at the end of the reporting period 332332 357 332332 357 472
Wärtsilä Corporation Half year financial report 2017 17
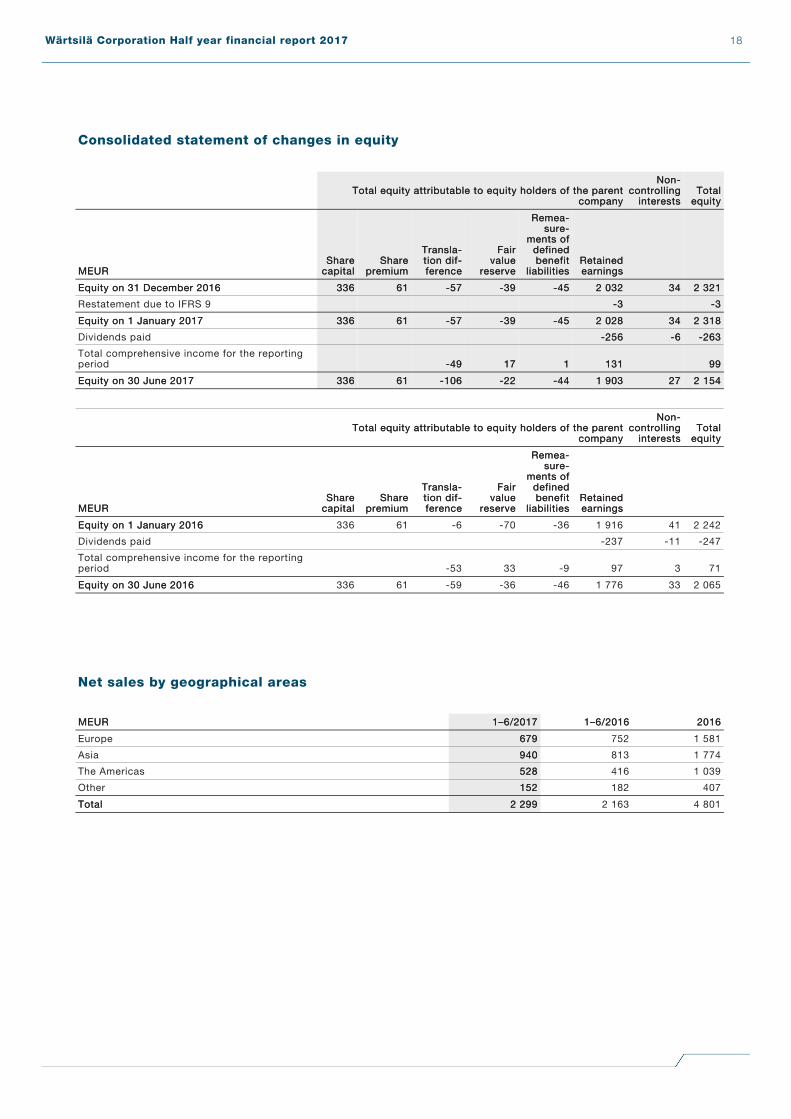
Consolidated statement of changes in equity
Total equity attributable to equity holders of the parentTotal equity attributable to equity holders of the parentcompanycompany
Non-Non-controllingcontrolling
interestsinterestsTotalTotal
equityequity
MEURMEURShareShare
capitalcapitalShareShare
premiumpremium
Transla-Transla-tion dif-tion dif-ferenceference
FairFairvaluevalue
reservereserve
Remea-Remea-sure-sure-
ments ofments ofdefineddefinedbenefitbenefit
liabilitiesliabilitiesRetainedRetainedearningsearnings
Equity on 31 December 2016Equity on 31 December 2016 336336 6161 -57-57 -39-39 -45-45 2 0322 032 3434 2 3212 321
Restatement due to IFRS 9 -3-3 -3-3
Equity on 1 January 2017Equity on 1 January 2017 336336 6161 -57-57 -39-39 -45-45 2 0282 028 3434 2 3182 318
Dividends paid -256-256 -6-6 -263-263
Total comprehensive income for the reportingperiod -49-49 1717 11 131131 9999
Equity on 30 June 2017Equity on 30 June 2017 336336 6161 -106-106 -22-22 -44-44 1 9031 903 2727 2 1542 154
Total equity attributable to equity holders of the parentTotal equity attributable to equity holders of the parentcompanycompany
Non-Non-controllingcontrolling
interestsinterestsTotalTotal
equityequity
MEURMEURShareShare
capitalcapitalShareShare
premiumpremium
Transla-Transla-tion dif-tion dif-ferenceference
FairFairvaluevalue
reservereserve
Remea-Remea-sure-sure-
ments ofments ofdefineddefinedbenefitbenefit
liabilitiesliabilitiesRetainedRetainedearningsearnings
Equity on 1 January 2016Equity on 1 January 2016 336 61 -6 -70 -36 1 916 41 2 242
Dividends paid -237 -11 -247
Total comprehensive income for the reportingperiod -53 33 -9 97 3 71
Equity on 30 June 2016Equity on 30 June 2016 336 61 -59 -36 -46 1 776 33 2 065
Net sales by geographical areas
MEURMEUR 1–6/20171–6/2017 1–6/20161–6/2016 20162016
Europe 679679 752 1 581
Asia 940940 813 1 774
The Americas 528528 416 1 039
Other 152152 182 407
TotalTotal 2 2992 299 2 163 4 801
Wärtsilä Corporation Half year financial report 2017 18
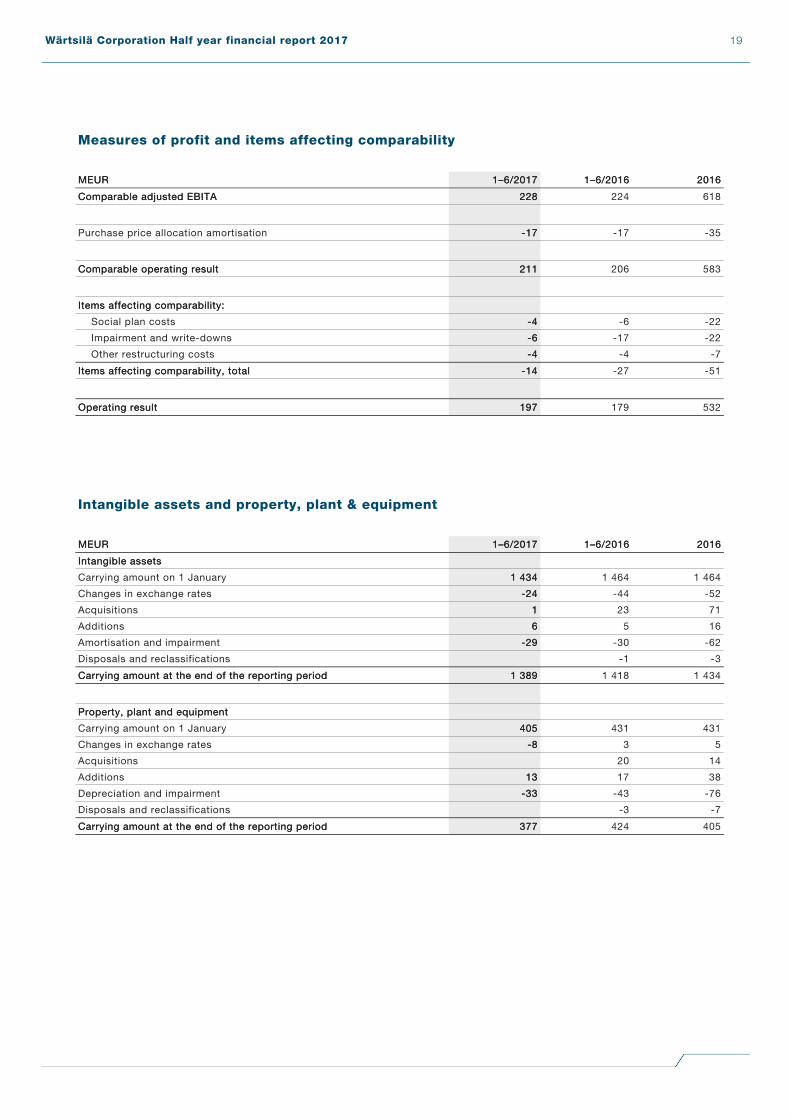
Measures of profit and items affecting comparability
MEURMEUR 1–6/20171–6/2017 1–6/20161–6/2016 20162016
Comparable adjusted EBITAComparable adjusted EBITA 228228 224 618
Purchase price allocation amortisation -17-17 -17 -35
Comparable operating resultComparable operating result 211211 206 583
Items affecting comparability:Items affecting comparability:
Social plan costs -4-4 -6 -22
Impairment and write-downs -6-6 -17 -22
Other restructuring costs -4-4 -4 -7
Items affecting comparability, totalItems affecting comparability, total -14-14 -27 -51
Operating resultOperating result 197197 179 532
Intangible assets and property, plant & equipment
MEURMEUR 1–6/20171–6/2017 1–6/20161–6/2016 20162016
Intangible assetsIntangible assets
Carrying amount on 1 January 1 4341 434 1 464 1 464
Changes in exchange rates -24-24 -44 -52
Acquisitions 11 23 71
Additions 66 5 16
Amortisation and impairment -29-29 -30 -62
Disposals and reclassifications -1 -3
Carrying amount at the end of the reporting periodCarrying amount at the end of the reporting period 1 3891 389 1 418 1 434
Property, plant and equipmentProperty, plant and equipment
Carrying amount on 1 January 405405 431 431
Changes in exchange rates -8-8 3 5
Acquisitions 20 14
Additions 1313 17 38
Depreciation and impairment -33-33 -43 -76
Disposals and reclassifications -3 -7
Carrying amount at the end of the reporting periodCarrying amount at the end of the reporting period 377377 424 405
Wärtsilä Corporation Half year financial report 2017 19

Gross capital expenditure
MEURMEUR 1–6/20171–6/2017 1–6/20161–6/2016 20162016
Investments in securities and acquisitions 11 49 91
Intangible assets and property, plant and equipment 1919 22 55
TotalTotal 2020 71 146
Net interest-bearing debt
MEURMEUR 1–6/20171–6/2017 1–6/20161–6/2016 20162016
Non-current liabilities 547547 545 520
Current liabilities 9090 336 108
Loan receivables -6-6 -6 -7
Cash and cash equivalents -332-332 -357 -472
TotalTotal 299299 517 150
Financial ratios
1–6/20171–6/2017 1–6/20161–6/2016 20162016
Earnings per share (EPS), basic and diluted, EUR 0.660.66 0.49 1.79
Equity per share, EUR 10.7910.79 10.30 11.60
Solvency ratio, % 45.545.5 42.7 47.6
Gearing 0.140.14 0.25 0.07
Return on investment (ROI), % 19.519.5 17.5 17.1
Return on equity (ROE), % 18.418.4 17.4 15.6
Personnel
1–6/20171–6/2017 1–6/20161–6/2016 20162016
On average 17 80617 806 18 378 18 332
At the end of the reporting period 17 78317 783 18 428 18 011
Wärtsilä Corporation Half year financial report 2017 20

Contingent liabilities
MEURMEUR 1–6/20171–6/2017 1–6/20161–6/2016 20162016
Mortgages 1010 10 10
Chattel mortgages and other pledges and securities 2424 26 26
TotalTotal 3434 36 36
Guarantees and contingent liabilities
on behalf of Group companies 791791 772 921
Nominal amount of rents according to leasing contracts
payable within one year 3131 28 34
payable between one and five years 7878 73 84
payable later 2525 27 30
TotalTotal 926926 900 1 069
Nominal values of derivative instruments
MEURMEUR Total amountTotal amount of which closedof which closed
Interest rate swaps 165165
Cross currency swaps 7878
Foreign exchange forward contracts 2 9952 995 932932
TotalTotal 3 2383 238 932932
In addition, the Group had copper futures and swaps amounting to 394 tons.
Fair values
Fair value measurements at the end of the reporting period:Fair value measurements at the end of the reporting period:
MEURMEUR
Carrying amountsCarrying amountsof the statementof the statement
of financialof financialposition itemsposition items
FairFairvaluevalue
Financial assetsFinancial assets
Other investments (level 3) 1313 1313
Interest-bearing investments, non-current (level 2) 66 66
Other receivables, non-current (level 2) 44 44
Derivatives (level 2) 2727 2727
Financial liabilitiesFinancial liabilities
Interest-bearing debt, non-current (level 2) 547547 555555
Derivatives (level 2) 3838 3838
Wärtsilä Corporation Half year financial report 2017 21

Events after the balance sheet date
Control of Greensmith Energy Management Systems Inc., a market leader in grid-scale energy storage software and integratedsolutions, has been transferred to Wärtsilä with effect from 3 July 2017. The companies announced the acquisition in Mayfollowing a year-long global cooperation on stand-alone energy storage and hybrid energy solutions. The acquisition ofGreensmith enables Wärtsilä to rapidly expand its footprint in the energy storage market globally and position as a premier energysystem integrator. Growth in the energy storage market is expanding from the United States to new regions including the UnitedKingdom, Asia and Australia.
Greensmith will operate as a business unit within Wärtsilä Energy Solutions providing both stand-alone energy storage as well ashybridized energy systems, control software, and integration expertise. In 2016, Greensmith’s revenue was USD 32 million withover 40 employees. The transaction is valued at USD 170 million (enterprise value). Purchase price allocation has not beenfinished yet.
Quarterly figures
MEURMEUR4–6/4–6/
201720171–3/1–3/
2017201710–12/10–12/
201620167–9/7–9/
201620164–6/4–6/
201620161–3/1–3/
2016201610–12/10–12/
201520157–9/7–9/
201520154–6/4–6/
20152015
Order intakeOrder intake
Services 599599 686686 565 522 527 580 572 511 579
Energy Solutions 361361 405405 501 330 304 312 366 167 188
Marine Solutions 403403 322322 258 287 362 379 465 407 392
TotalTotal 1 3631 363 1 4131 413 1 324 1 139 1 194 1 271 1 403 1 086 1 159
Order book at the end of the reporting periodOrder book at the end of the reporting period
Services 1 1931 193 1 1871 187 999 1 031 1 048 1 017 958 1 026 1 081
Energy Solutions 1 7641 764 1 8471 847 1 680 1 676 1 547 1 491 1 366 1 388 1 459
Marine Solutions 2 1082 108 2 0622 062 2 017 2 317 2 488 2 595 2 558 2 699 2 785
TotalTotal 5 0655 065 5 0965 096 4 696 5 024 5 083 5 103 4 882 5 112 5 325
Net salesNet sales
Services 546546 490490 636 512 542 500 619 531 548
Energy Solutions 412412 239239 414 177 220 132 374 243 327
Marine Solutions 334334 279279 509 390 433 335 598 448 354
TotalTotal 1 2921 292 1 0071 007 1 559 1 079 1 196 967 1 590 1 222 1 230
Share of result of associates and jointventures 33 11 5 2 4 3 6 5 5
Comparable adjusted EBITA 134134 9494 262 132 131 93 224 170 144
as a percentage of net sales 10.410.4 9.49.4 16.8 12.3 10.9 9.6 14.1 13.9 11.7
Depreciation, amortisation and impairment -30-30 -33-33 -34 -31 -42 -31 -33 -32 -30
Purchase price allocation amortisation -9-9 -9-9 -9 -9 -9 -9 -9 -9 -7
Comparable operating result 126126 8686 253 123 122 84 215 160 137
as a percentage of net sales 9.79.7 8.58.5 16.3 11.4 10.2 8.7 13.5 13.1 11.1
Items affecting comparability, total -8-8 -6-6 -22 -2 -26 -1 -13 -11
Operating result 117117 8080 231 122 96 83 202 149 137
as a percentage of net sales 9.19.1 7.97.9 14.8 11.3 8.0 8.6 12.7 12.2 11.1
Wärtsilä Corporation Half year financial report 2017 22

Financial income and expenses -14-14 -5-5 -5 -7 -38 -3 -2 -17 3
Profit before taxes 103103 7474 226 115 58 80 199 132 140
Income taxes -27-27 -17-17 -55 -31 -17 -20 -41 -35 -31
Profit for the reporting period 7676 5757 172 84 41 60 159 97 109
Earnings per share (EPS), basic and diluted,EUR 0.380.38 0.280.28 0.87 0.43 0.19 0.30 0.79 0.49 0.54
Gross capital expenditure 1111 99 20 55 60 11 32 17 279
Investments in securities and acquisitions 11 42 49 5 262
Cash flow from operating activities 22 22 235 189 202 -13 176 -5 47
Working capital (WCAP) at the end of thereporting period 680680 580580 490 540 602 709 543 522 404
Personnel at the end of the reporting periodPersonnel at the end of the reporting period
Services 10 45510 455 10 46410 464 10 567 10 648 10 575 10 331 10 592 10 714 10 785
Energy Solutions 928928 913913 903 920 945 958 959 966 974
Marine Solutions 5 8615 861 5 9205 920 6 074 6 305 6 443 6 681 6 847 7 101 7 217
Other 539539 533533 467 464 465 457 459 456 451
TotalTotal 17 78317 783 17 83217 832 18 011 18 337 18 428 18 427 18 856 19 237 19 427
Calculation of financial ratios
Earnings per share (EPS), basic and dilutedEarnings per share (EPS), basic and diluted
Profit for the reporting period attributable to equity holders of the parent company
Adjusted number of shares over the reporting period
Equity per shareEquity per share
Equity attributable to equity holders of the parent company
Adjusted number of shares at the end of the reporting period
Solvency ratioSolvency ratio
Equity
Total equity and liabilities – advances receivedx 100
GearingGearing
Interest-bearing liabilities – cash and cash equivalents
Equity
Return on investment (ROI)Return on investment (ROI)
Profit before taxes + interest and other financial expenses
Total equity and liabilities – non-interest-bearing liabilities – provisions, average over the reporting periodx 100
Return on equity (ROE)Return on equity (ROE)
Profit for the reporting period
Equity, average over the reporting periodx 100
Wärtsilä Corporation Half year financial report 2017 23
Working capital (WCAP)Working capital (WCAP)
(Inventories + trade receivables + income tax receivables + other non-interest-bearing receivables)– (trade payables + advances received + pension obligations + provisions + income tax liabilities + other non-interest-bearing liabilities – dividend payable)
Comparable adjusted EBITAComparable adjusted EBITA
Operating result – items affecting comparability – purchase price allocation amortisation
Comparable operating resultComparable operating result
Operating result – items affecting comparability
Items affecting comparabilityItems affecting comparability
Items affecting comparability are related to restructuring measures and one-time charges for events or activities,which are not part of the normal business operations
19 July 2017
Wärtsilä Corporation
Board of Directors
Wärtsilä Corporation Half year financial report 2017 24