Waters Corporation
95
Table of Contents UNITED STATES SECURITIES AND EXCHANGE COMMISSION Washington, D.C. 20549 Form 10-K For the fiscal year ended December 31, 2013 or Commission File Number: 01-14010 Waters Corporation (Exact name of registrant as specified in its charter) 34 Maple Street Milford, Massachusetts 01757 (Address, including zip code, of principal executive offices) ( 508) 478-2000 (Registrant’s telephone number, including area code) Indicate by check mark if the registrant is a well-known seasoned issuer, as defined in Rule 405 of the Securities Act. Yes No Indicate by check mark if the registrant is not required to file reports pursuant to Section 13 or Section 15(d) of the Act. Yes No Indicate by check mark whether the registrant (1) has filed all reports required to be filed by Section 13 or 15(d) of the Securities Exchange Act of 1934 during the preceding 12 months (or for such shorter period that the registrant was required to file such reports), and (2) has been subject to such filing requirements for the past 90 days. Yes No Indicate by check mark whether the registrant has submitted electronically and posted on its corporate website, if any, every Interactive Data File required to be submitted and posted pursuant to Rule 405 of Regulation S-T (§232.405 of this chapter) during the preceding 12 months (or for such shorter period that the registrant was required to submit and post such files). Yes No Indicate by check mark if disclosure of delinquent filers pursuant to Item 405 of Regulation S-K (§229.405 of this chapter) is not contained herein, and will not be contained, to the best of registrant’s knowledge, in definitive proxy or information statements incorporated by reference in Part III of this Form 10-K or any amendment to this Form 10-K. Indicate by check mark whether the registrant is a large accelerated filer, an accelerated filer, a non-accelerated filer, or smaller reporting company. See the definition of “large accelerated filer”, “accelerated filer” and “smaller reporting company” in Rule 12b-2 of the Exchange Act. (Check one): Indicate by check mark whether the registrant is a shell company (as defined in Rule 12b-2 of the Act). Yes No State the aggregate market value of the registrant’s common stock held by non-affiliates of the registrant as of June 29, 2013: $8,523,967,000. Indicate the number of shares outstanding of the registrant’s common stock as of February 21, 2014: 85,176,112 DOCUMENTS INCORPORATED BY REFERENCE Portions of the registrant’s definitive proxy statement for the 2014 Annual Meeting of Stockholders are incorporated by reference in Part III. ANNUAL REPORT PURSUANT TO SECTION 13 OR 15(d) OF THE SECURITIES EXCHANGE ACT OF 1934 TRANSITION REPORT PURSUANT TO SECTION 13 OR 15(d) OF THE SECURITIES EXCHANGE ACT OF 1934 Delaware 13-3668640 (State or other jurisdiction of incorporation or organization) (I.R.S. Employer Identification No.) Securities registered pursuant to Section 12(b) of the Act: Common Stock, par value $0.01 per share New York Stock Exchange, Inc. Series A Junior Participating Preferred Stock, par value $0.01 per share New York Stock Exchange, Inc. Securities registered pursuant to Section 12(g) of the Act: None Large accelerated filer Accelerated filer Non-accelerated filer Smaller reporting company (Do not check if a smaller reporting company)
-
Upload
khangminh22 -
Category
Documents
-
view
0 -
download
0
Transcript of Waters Corporation

Table of Contents
UNITED STATES SECURITIES AND EXCHANGE COMMISSION
Washington, D.C. 20549
Form 10-K
For the fiscal year ended December 31, 2013 or
Commission File Number: 01-14010
Waters Corporation (Exact name of registrant as specified in its charter)
34 Maple Street Milford, Massachusetts 01757
(Address, including zip code, of principal executive offices) ( 508) 478-2000
(Registrant’s telephone number, including area code)
Indicate by check mark if the registrant is a well-known seasoned issuer, as defined in Rule 405 of the Securities Act. Yes � No �
Indicate by check mark if the registrant is not required to file reports pursuant to Section 13 or Section 15(d) of the Act. Yes � No �
Indicate by check mark whether the registrant (1) has filed all reports required to be filed by Section 13 or 15(d) of the Securities Exchange Act of 1934 during the preceding 12 months (or for such shorter period that the registrant was required to file such reports), and (2) has been subject to such filing requirements for the past 90 days. Yes � No �
Indicate by check mark whether the registrant has submitted electronically and posted on its corporate website, if any, every Interactive Data File required to be submitted and posted pursuant to Rule 405 of Regulation S-T (§232.405 of this chapter) during the preceding 12 months (or for such shorter period that the registrant was required to submit and post such files). Yes � No �
Indicate by check mark if disclosure of delinquent filers pursuant to Item 405 of Regulation S-K (§229.405 of this chapter) is not contained herein, and will not be contained, to the best of registrant’s knowledge, in definitive proxy or information statements incorporated by reference in Part III of this Form 10-K or any amendment to this Form 10-K. �
Indicate by check mark whether the registrant is a large accelerated filer, an accelerated filer, a non-accelerated filer, or smaller reporting company. See the definition of “large accelerated filer”, “accelerated filer” and “smaller reporting company” in Rule 12b-2 of the Exchange Act. (Check one):
Indicate by check mark whether the registrant is a shell company (as defined in Rule 12b-2 of the Act). Yes � No � State the aggregate market value of the registrant’s common stock held by non-affiliates of the registrant as of June 29, 2013:
$8,523,967,000. Indicate the number of shares outstanding of the registrant’s common stock as of February 21, 2014: 85,176,112
DOCUMENTS INCORPORATED BY REFERENCE Portions of the registrant’s definitive proxy statement for the 2014 Annual Meeting of Stockholders are incorporated by reference in
Part III.
� ANNUAL REPORT PURSUANT TO SECTION 13 OR 15(d) OF THE SECURITIES EXCHANGE ACT OF 1934
� TRANSITION REPORT PURSUANT TO SECTION 13 OR 15(d) OF THE SECURITIES EXCHANGE ACT OF 1934
Delaware 13-3668640 (State or other jurisdiction of
incorporation or organization) (I.R.S. Employer
Identification No.)
Securities registered pursuant to Section 12(b) of the Act: Common Stock, par value $0.01 per share New York Stock Exchange, Inc. Series A Junior Participating Preferred Stock, par value $0.01 per share New York Stock Exchange, Inc.
Securities registered pursuant to Section 12(g) of the Act: None
Large accelerated filer � Accelerated filer � Non-accelerated filer � Smaller reporting company � (Do not check if a smaller reporting company)

Table of Contents
WATERS CORPORATION AND SUBSIDIARIES
ANNUAL REPORT ON FORM 10-K
INDEX Item No. Page
PART I
1. Business 1 1A. Risk Factors 11 1B. Unresolved Staff Comments 16 2. Properties 16 3. Legal Proceedings 17 4. Mine Safety Disclosures 17
Executive Officers of the Registrant 17
PART II
5. Market for Registrant’s Common Equity, Related Stockholder Matters and Issuer Purchases of Equity Securities 19 6. Selected Financial Data 21 7. Management’s Discussion and Analysis of Financial Condition and Results of Operations 21 7A. Quantitative and Qualitative Disclosures About Market Risk 37 8. Financial Statements and Supplementary Data 39 9. Changes in and Disagreements with Accountants on Accounting and Financial Disclosure 80 9A. Controls and Procedures 80 9B. Other Information 80
PART III
10. Directors, Executive Officers and Corporate Governance 81 11. Executive Compensation 81 12. Security Ownership of Certain Beneficial Owners and Management and Related Stockholder Matters 81 13. Certain Relationships and Related Transactions, and Director Independence 82 14. Principal Accountant Fees and Services 82
PART IV
15. Exhibits and Financial Statement Schedules 83 Signatures 87

Table of Contents
PART I
General
Waters Corporation (“Waters ” or the “Company”) is an analytical instrument manufacturer that primarily designs, manufactures, sells and services, through its Waters Division, high performance liquid chromatography (“HPLC”), ultra performance liquid chromatography (“UPLC ” and together with HPLC, referred to as “LC”) and mass spectrometry (“MS”) technology systems and support products, including chromatography columns, other consumable products and comprehensive post-warranty service plans. These systems are complementary products that are frequently employed together (“LC-MS”) and sold as integrated instrument systems using a common software platform. Through its TA Division (“TA ”), the Company primarily designs, manufactures, sells and services thermal analysis, rheometry and calorimetry instruments. The Company is also a developer and supplier of software-based products that interface with the Company’s instruments, as well as other manufacturers’ instruments, and are typically purchased by customers as part of the instrument system.
The Company’s products are used by pharmaceutical, life science, biochemical, industrial, nutritional safety, environmental, academic and governmental customers working in research and development, quality assurance and other laboratory applications. The Company’s LC and LC-MS instruments are utilized in this broad range of industries to detect, identify, monitor and measure the chemical, physical and biological composition of materials, as well as to purify a full range of compounds. These instruments are used in drug discovery and development, including clinical trial testing, the analysis of proteins in disease processes (known as “proteomics”), nutritional safety analysis and environmental testing. The Company’s thermal analysis, rheometry and calorimetry instruments are used in predicting the suitability of fine chemicals, pharmaceuticals, water, polymers and viscous liquids for uses in various industrial, consumer goods and healthcare products, as well as for life science research.
Waters, organized as a Delaware corporation in 1991, is a holding company that owns all of the outstanding common stock of Waters Technologies Corporation, its operating subsidiary. Waters became a publicly-traded company with its initial public offering (“IPO”) in November 1995. Since the IPO, the Company has added two significant and complementary technologies to its range of products with the acquisitions of TA Instruments in May 1996 and Micromass Limited (“Micromass ”) in September 1997.
Business Segments
The Company’s business activities, for which discrete financial information is available, are regularly reviewed and evaluated by chief operating decision maker. As a result of this evaluation, the Company determined that it has two operating segments: Waters Division and TA Division. The Company operates in the analytical instruments industry by designing, manufacturing, distributing and servicing instrument systems, columns and other chemistry consumables that can be integrated and used along with other analytical instruments. The Company’s two operating segments, Waters Division and TA Division, have similar economic characteristics; product processes; products and services; types and classes of customers; methods of distribution and regulatory environments. Because of these similarities, the two operating segments have been aggregated into one reporting segment for financial statement purposes.
Information concerning revenues and long-lived assets attributable to each of the Company’s products, services and geographic areas is set forth in Note 15 in the Notes to the Consolidated Financial Statements, which is incorporated herein by reference.
1
Item 1: Business
®
®
®
®

Table of Contents
Waters Division
High Performance and Ultra Performance Liquid Chromatography
HPLC is a standard technique used to identify and analyze the constituent components of a variety of chemicals and other materials. The Company believes that HPLC’s performance capabilities enable it to separate and identify approximately 80% of all known chemicals and materials. As a result, HPLC is used to analyze substances in a wide variety of industries for research and development purposes, quality control and process engineering applications.
The most significant end-use markets for HPLC are those served by the pharmaceutical and life science industries. In these markets, HPLC is used extensively to identify new drugs, develop manufacturing methods and assure the potency and purity of new pharmaceuticals. HPLC is also used in a variety of other applications, such as analyses of foods and beverages for nutritional labeling and compliance with safety regulations, the testing of water and air purity within the environmental testing industry, as well as applications in other industries, such as chemical and consumer products. HPLC is also used by universities, research institutions and governmental agencies, such as the United States Food and Drug Administration (“FDA”) and the United States Environmental Protection Agency (“EPA”) and their international counterparts that mandate testing requiring HPLC instrumentation.
Traditionally, a typical HPLC system has consisted of five basic components: solvent delivery system, sample injector, separation column, detector and data acquisition unit. The solvent delivery system pumps solvents through the HPLC system, while the sample injector introduces samples into the solvent flow. The chromatography column then separates the sample into its components for analysis by the detector, which measures the presence and amount of the constituents. The data acquisition unit, usually referred to as the instrument’s software or data system, then records and stores the information from the detector.
In 2004, Waters introduced a novel technology that the Company describes as ultra performance liquid chromatography that utilizes a packing material with small, uniform diameter particles and a specialized instrument, the ACQUITY UPLC , to accommodate the increased pressure and narrow chromatographic bands that are generated by these small particles. By using the ACQUITY UPLC, researchers and analysts are able to achieve more comprehensive chemical separations and faster analysis times in comparison with many analyses performed by HPLC. In addition, in using ACQUITY UPLC, researchers have the potential to extend the range of applications beyond that of HPLC, enabling them to uncover new levels of scientific information. While offering significant performance advantages, ACQUITY UPLC is also compatible with the Company’s software products and the general operating protocols of HPLC. For these reasons, the Company’s customers and field sales and support organizations are well positioned to utilize this new technology and instrument. In 2011, the Company introduced the ACQUITY UPLC I-Class instrument system. The ACQUITY UPLC I-Class provides a powerful solution to a critical need by successfully analyzing compounds that are limited in amount or availability amid a complex matrix. The ACQUITY UPLC I-Class system maximizes peak capacity to enhance MS sensitivity; it provides low sample carryover, complementing MS sensitivity and extending MS linear dynamic range; and it has been purposefully engineered for low dispersion. In 2012, the Company introduced UltraPerformance Convergence Chromatography (“UPC ”) with the release of the ACQUITY UPC2 system. This new technology marries the unrealized potential of supercritical fluid chromatography (“SFC”) with the proven UPLC technology, using carbon dioxide as the primary mobile phase. By varying mobile phase strength, pressure, temperature and stationary phase with UPC2, a user can separate, detect and quantify structural analogs, isomers, enantiomeric and diasteriomeric mixtures – all compounds or samples that challenge today’s laboratories. In 2013, the Company introduced the ACQUITY Advanced Polymer Chromatography (“APC ”) system. This system delivers improved polymer peak resolution, particularly for low molecular weight polymers and oligomers, up to 20 times faster than traditional gel permeation chromatography. In 2013, the Company also introduced the ACQUITY QDa Detector, which facilitates obtaining mass spectral measurements from chromatographic separations utilizing a compact and easy to operate detector module.
Waters manufactures LC instruments that are offered in configurations that allow for varying degrees of automation, from component configured systems for academic teaching and research applications to fully
2
®
®
TM 2 ® ® ®
® ® TM
® TM

Table of Contents
automated systems for regulated testing, and that have a variety of detection technologies, from ultra-violet (“UV”) absorbance to MS, optimized for certain analyses. The Company also manufactures tailored LC systems for the analysis of biologics, as well as an LC detector utilizing evaporative light scattering technology to expand the usage of LC to compounds that are not amenable to UV absorbance detection.
The primary consumable products for LC are chromatography columns. These columns are packed with separation media used in the LC testing process and are typically replaced at regular intervals. The chromatography column contains one of several types of packing material, typically stationary phase particles made from silica. As the sample flows through the column, it is separated into its constituent components.
Waters HPLC columns can be used on Waters-branded and competitors’ LC systems. The Company believes that it is one of the few suppliers in the world that processes silica, packs columns and distributes its own products. In doing so, the Company believes it can better ensure product consistency, a key attribute for its customers in quality control laboratories, and can react quickly to new customer requirements. The Company believes that its ACQUITY UPLC lines of columns are used primarily on its ACQUITY UPLC instrument systems and, furthermore, that its ACQUITY UPLC instruments primarily use ACQUITY UPLC columns. In 2013, the Company introduced the CORTECS family of 1.6 micron solid-core UPLC columns to further extend the application range and performance of its UPLC offerings.
The Company’s chemistry consumable products also include environmental and nutritional safety testing products. Environmental laboratories use these products for quality control and proficiency testing and also purchase product support services required to help with their federal and state mandated accreditation requirements or with quality control over critical pharmaceutical analysis. In addition, the Company provides tests to identify and quantify mycotoxins (biological contaminants) in various agricultural commodities. These test kits provide reliable, quantitative detection of particular mycotoxins through the choice of fluorimetry, HPLC or LC-MS.
Mass Spectrometry and Liquid Chromatography-Mass Spectrometry
MS is a powerful analytical technology that is used to identify unknown compounds, to quantify known materials and to elucidate the structural and chemical properties of molecules by measuring the masses of individual molecules that have been converted into ions.
The Company believes it is a technology and market leader in the development, manufacture, sale and distribution of MS instruments. These instruments are typically integrated and used along with other complementary analytical instruments and systems, such as LC, chemical electrophoresis, chemical electrophoresis chromatography and gas chromatography. A wide variety of instrumental designs fall within the overall category of MS instrumentation, including devices that incorporate quadrupole, ion trap, time-of-flight (“Tof”), magnetic sector and ion mobility technologies. Furthermore, these technologies are often used in tandem to maximize the efficacy of certain experiments.
Currently, the Company offers a wide range of MS instrument systems utilizing various combinations of quadrupole, Tof, ion mobility and magnetic sector designs. These instrument systems are used in drug discovery and development, as well as for environmental, clinical and nutritional safety testing. The majority of mass spectrometers sold by the Company are designed to utilize an LC system as the sample introduction device. These products supply a diverse market with a strong emphasis on the life science, pharmaceutical, biomedical, clinical, food and beverage and environmental market segments worldwide.
MS is an increasingly important detection technology for LC. The Company’s smaller-sized mass spectrometers, such as the single quadrupole detector (“SQD”) and the tandem quadrupole detector (“TQD”), are often referred to as LC “detectors” and are typically sold as part of an LC system or as an LC system upgrade. In 2013, the Company introduced the ACQUITY QDa Detector, a compact and easy to operate mass spectrometric module that further supports the broader usage of mass detection for routine LC applications. Larger quadrupole
3
TM

Table of Contents
systems, such as the Xevo TQ and Xevo TQ-S instruments, are used primarily for experiments performed for late-stage drug development, including clinical trial testing. Quadrupole time-of-flight (“Q-Tof ”) instruments, such as the Company’s SYNAPT G2-S, are often used to analyze the role of proteins in disease processes, an application sometimes referred to as “proteomics”. In 2011, the Company introduced the SYNAPT G2-S HDMS instrument system. The SYNAPT G2-S incorporates both high sensitivity Waters StepWave ion transfer optics and Triwave ion mobility technologies along with a suite of new informatics tools to enhance qualitative and quantitative high resolution performance. In 2012, the Company introduced the Xevo G2-S Q-Tof and Xevo G2-S Tof mass spectrometers, bringing StepWave ion technology to its bench-top time-of-flight mass spectrometers. In 2013, the Company introduced the SYNAPT G2-S i , which combines the unique power of travelling wave (“T-Wave ”) ion mobility separations with new data acquisition and informatics technologies, and collision cross-section measurements.
LC and MS are typically embodied within an analytical system tailored for either a dedicated class of analyses or as a general purpose analytical device. An increasing percentage of the Company’s customers are purchasing LC and MS components simultaneously and it has become common for LC and MS instrumentation to be used within the same laboratory and operated by the same user. The descriptions of LC and MS above reflect the historical segmentation of these analytical technologies and the historical categorization of their respective practitioners. Increasingly in today’s instrument market, this segmentation and categorization is becoming obsolete as a high percentage of instruments used in the laboratory embody both LC and MS technologies as part of a single device. In response to this development and to further promote the high utilization of these hybrid instruments, the Company has organized its Waters Division to develop, manufacture, sell and service integrated LC-MS systems.
Based upon reports from independent marketing research firms and publicly-disclosed sales figures from competitors, the Company believes that it is one of the world’s largest manufacturers and distributors of LC and LC-MS instrument systems, chromatography columns and other consumables and related services. The Company also believes that it has the leading combined LC and LC-MS market share in the United States, Europe and Asia (excluding Japan), and believes it may have a market share position in Japan that ranks second to an established domestic supplier.
The Company has been a developer and supplier of software-based products that interface with the Company’s instruments, as well as other manufacturers’ instruments. The Company recently introduced a new UNIFI software platform. The UNIFI Scientific Information System is the culmination of a multi-year effort to substantially bring all of Waters’ preexisting, disparate software systems under one operating system. UNIFI joins Waters’ suite of informatics products – Empower , Chromatography Data Software, MassLynx Mass Spectrometry Software and NuGenesis Scientific Data Management System, each of which is used daily to support innovations within world-leading institutions. UNIFI is the industry’s first comprehensive software that seamlessly integrates UPLC chromatography, mass spectrometry, and informatics data workflows.
In July 2012, the Company acquired Blue Reference, Inc. (“Blue Reference”), a U.S.-based developer and distributor of software products used for the real-time mining and analysis of multiple-application scientific databases, for $14 million in cash. The Company has integrated the Blue Reference technology into software product platforms to further differentiate its offerings by providing customers with a more efficient scientific information assessment process, where there is an ongoing need for immediacy and interactivity of multiple scientific databases.
In August 2013, the Company acquired Nonlinear Dynamics Ltd. (“Nonlinear Dynamics”), a developer of proteomics and metabolomics software, for approximately $23 million in cash. Waters and Nonlinear Dynamics collaborated on the development of the Company’s TransOmics™ Informatics, a scalable solution for proteomics, metabolomics, and lipidomics analysis, which was introduced in 2012. The Company will integrate the Nonlinear Dynamics technology into current and future software product platforms.
4
® ®
TM ®
® TM
®
® TM ®
TM
®
® ®
®

Table of Contents
Waters Division Service
Services provided by Waters enable customers to maximize technology productivity, support customer compliance activities and provide transparency into enterprise resource management efficiencies. The customer benefits from improved budget control, data-driven technology adoption and accelerated workflow at a site or on a global perspective. The Company considers its service offerings to be highly differentiated from our competition, as evidenced by the consistent increase in service revenues each year. Our principal competitors in the service market include PerkinElmer, Inc., Agilent Technologies, Inc., Thermo Fisher Scientific Inc. and General Electric Company. These competitors can provide services on Waters instruments to varying degrees and always present competitive risk.
The servicing and support of instruments, software and accessories is an important source of revenue and represents over 25% of sales for the Waters Division. These revenues are derived primarily through the sale of support plans, demand services, spare parts, customer training and performance validation services. Support plans typically involve scheduled instrument maintenance and an agreement to promptly repair a non-functioning instrument in return for a fee described in a contract that is priced according to the configuration of the instrument.
TA Division
Thermal Analysis, Rheometry and Calorimetry
Thermal analysis measures the physical characteristics of materials as a function of temperature. Changes in temperature affect several characteristics of materials, such as their physical state, weight, dimension and mechanical and electrical properties, which may be measured by one or more thermal analysis techniques, including calorimetry. Consequently, thermal analysis techniques are widely used in the development, production and characterization of materials in various industries, such as plastics, chemicals, automobiles, pharmaceuticals and electronics.
Rheometry instruments complement thermal analyzers in characterizing materials. Rheometry characterizes the flow properties of materials and measures their viscosity, elasticity and deformation under different types of “loading” or other conditions. The information obtained under such conditions provides insight into a material’s behavior during processing, packaging, transport, usage and storage.
Thermal analysis and rheometry instruments are heavily used in material testing laboratories and, in many cases, provide information useful in predicting the suitability of fine chemicals, polymers and viscous liquids for various industrial, consumer goods and healthcare products, as well as for life science research. As with systems offered through the Waters Division, a range of instrument configurations is available with increasing levels of sample handling and information processing automation. In addition, systems and accompanying software packages can be tailored for specific applications. For example, the Q-Series family of differential scanning calorimeters includes a range of instruments, from basic dedicated analyzers to more expensive systems that can accommodate robotic sample handlers and a variety of sample cells and temperature control features for analyzing a broad range of materials. In 2011, TA introduced the Discovery DSC, Discovery TGA and Discovery Hybrid Rheometer, which provide unmatched measurement performance in the fields of differential scanning calorimetry and rheometry.
In July 2011, the Company acquired the net assets of Anter Corporation (“Anter”), a manufacturer of thermal analyzers used to measure thermal expansion and shrinkage, thermal conductivity and resistivity, thermal diffusivity and specific heat capacity of a wide range of materials, especially materials used in high temperature applications, for $11 million in cash. Anter systems provide critical information to scientists that develop and characterize ceramics, metals and glasses for use in a wide range of industries, including electronics, energy and aerospace.
5
TM

Table of Contents
In January 2012, the Company acquired Baehr Thermoanalyse GmbH (“Baehr”), a German manufacturer of a wide range of thermal analyzers, for $12 million in cash, including the assumption of $1 million of debt. Key products developed by Baehr include horizontal, optical and quenching dilatometer systems that measure thermal expansion to high temperatures with high precision, high temperature viscometers, and high temperature TGA/DTA systems. Baehr systems provide critical information to researchers that develop materials for use in a wide range of industries, including electronics, energy, automotive, and aerospace.
In July 2013, the Company acquired Scarabaeus Mess-und Prodktionstechnik GmbH (“Scarabaeus”), a manufacturer of rheometers for the rubber and elastomer markets, for approximately $4 million in cash. Key products developed by Scarabaeus include a Mooney Viscometer, Moving Die Rheometer (MDR), Rubber Process Analyzer (RPA) and automated density and hardness testers. The RPA includes many test features and analysis functions that are being used in the latest research and development efforts for rubber and materials technology.
In December 2013, the Company acquired Expert Systems Solutions S.r.l. (“ESS”), a manufacturer of advanced thermal analysis instruments, for approximately $3 million in cash. ESS manufactures a variety of heating microscopes, optical dilatometers and optical fleximeters, with a particular focus on the ceramics industry.
In December 2013, the Company acquired the net assets of LaserComp Inc. (“LaserComp”), a manufacturer of thermal conductivity measurement instruments, for approximately $12 million in cash. LaserComp’s FOX line of durable thermal conductivity test instruments is used by many of the world’s leading insulation manufacturers.
In January 2014, the Company acquired ULSP B.V. (“ULSP”), a manufacturer of solutions for ultra low temperature applications, for approximately $3 million in cash. ULSP’s core business is the manufacturing and servicing of high quality low temperature coolers for thermal analysis and rheology applications.
TA Service
Similar to the Waters Division, the servicing and support of TA’s instruments is an important source of revenue and represents approximately 25% of sales for the TA Division. TA sells, supports and services TA’s product offerings through its headquarters in New Castle, Delaware. TA operates independently from the Waters Division, though most of its overseas offices are situated in Waters Division’s facilities to achieve operational efficiencies. TA has dedicated field sales and service operations. Service sales are primarily derived from the sale of support plans, replacement parts and billed labor fees associated with the repair, maintenance and upgrade of installed systems.
Customers
The Company typically has a broad and diversified customer base that includes pharmaceutical accounts, other industrial accounts, universities and governmental agencies. Purchase of the Company’s instrument systems is often dependent on its customers’ capital spending, or funding as in the cases of governmental, academic and research institutions, which often fluctuate from year to year. The pharmaceutical segment represents the Company’s largest sector and includes multinational pharmaceutical companies, generic drug manufacturers, contract research organizations (CROs) and biotechnology companies. The Company’s other industrial customers include chemical manufacturers, polymer manufacturers, food and beverage companies and environmental testing laboratories. The Company also sells to leading universities and governmental agencies worldwide. The Company’s technical support staff works closely with its customers in developing and implementing applications that meet their full range of analytical requirements. During 2013, 52% of the Company’s sales were to pharmaceutical accounts, 33% to other industrial accounts and 15% to governmental agencies and academic institutions.
6

Table of Contents
The Company typically experiences an increase in sales in the fourth quarter, as a result of purchasing habits for capital goods of many customers who tend to exhaust their spending budgets by calendar year end. The Company does not rely on any single customer for a material portion of its sales. During fiscal years 2013, 2012 and 2011, no single customer accounted for more than 2% of the Company’s net sales.
Sales and Service
The Company has one of the largest direct sales and service organizations focused exclusively on the technologies offered by the Company. Across these product technologies, using respective specialized sales and service forces, the Company serves its customer base with 93 sales offices throughout the world as of December 31, 2013 and approximately 3,000 field representatives in 2013, 2012 and 2011. This investment in sales and service personnel serves to maintain and expand the Company’s installed base of instruments. The Company’s sales representatives have direct responsibility for account relationships, while service representatives work in the field to install instruments, train customers and minimize instrument downtime. In-house, technical support representatives work directly with customers, providing them assistance with applications and procedures on Company products. The Company provides customers with comprehensive information through various corporate and regional internet websites and product literature, and also makes consumable products available through electronic ordering facilities and a dedicated catalog.
Manufacturing and Distribution
The Company provides high product quality by overseeing each stage of the production of its instruments, columns and chemical reagents.
The Company currently assembles a portion of its LC instruments at its facility in Milford, Massachusetts, where it performs machining, assembly and testing. The Milford facility maintains quality management and environmental management systems in accordance with the requirements of ISO 9001:2008, ISO 13485:2003 and ISO 14001:2004, and adheres to applicable regulatory requirements (including the FDA Quality System Regulation and the European In-Vitro Diagnostic Directive). The Company outsources manufacturing of certain electronic components, such as computers, monitors and circuit boards, to outside vendors that can meet the Company’s quality requirements. In addition, the Company outsources the manufacturing of certain LC instrument systems and components to well-established contract manufacturing firms in Singapore. The Company’s Singapore entity manages all Asian outsourced manufacturing as well as the distribution of all products from Asia. The Company continues to pursue outsourcing opportunities as they may arise but believes it maintains adequate supply chain and manufacturing capabilities in the event of disruption or natural disasters.
The Company manufactures certain SFC/SFE products in its facility in Pittsburgh, Pennsylvania. The Pittsburgh facility is aligned with the policies and procedures for product manufacturing and distribution as adhered to in the Milford, Massachusetts facility and is under the same structural leadership organization.
The Company primarily manufactures and distributes its LC columns at its facilities in Taunton, Massachusetts and Wexford, Ireland, where it processes, sizes and treats silica and polymeric media that are packed into columns, solid phase extraction cartridges and bulk shipping containers. The Wexford facility also manufactures and distributes certain data, instruments and software components for the Company’s LC, MS and TA product lines. The Company’s Taunton facility is certified to ISO 9001:2008. The Wexford facility is certified to ISO 9001:2008 and ISO 13485:2003. VICAM manufactures antibody resin and magnetic beads that are packed into columns and kits in Milford, Massachusetts and Nixa, Missouri. Environmental Resource Associates manufactures environmental proficiency kits in Golden, Colorado.
The Company manufactures and distributes its MS products at its facilities in Cheshire, England, Manchester, England, Wilmslow, England and Wexford, Ireland. In early 2014, the Company completed the construction of its new facility in Wilmslow, England and is in the process of consolidating and moving its Cheshire and Manchester facilities to this new location. Certain components or modules of the Company’s MS instruments are manufactured by long-standing outside contractors. Each stage of this supply chain is closely
7
®

Table of Contents
monitored by the Company to maintain high quality and performance standards. The instruments, components or modules are then returned to the Company’s facilities, where its engineers perform final assembly, calibrations to customer specifications and quality control procedures. The Company’s MS facilities are certified to ISO 9001:2008 and ISO 13485:2003.
TA’s thermal analysis, rheometry and calorimetry products are manufactured and distributed at the Company’s New Castle, Delaware, Saugus, MA, Lindon, Utah, Huellhorst, Germany, Wetzlar, Germany and Modena, Italy facilities. Similar to MS, elements of TA’s products are manufactured by outside contractors and are then returned to the Company’s facilities for final assembly, calibration and quality control. The Company’s New Castle facility is certified to ISO 9001:2008 standards.
Raw Materials
The Company purchases a variety of raw materials, primarily consisting of high temperature alloy sheet metal and castings, forgings, pre-plated metals and electrical components from various vendors. The materials used by the Company’s operations are generally available from a number of sources and in sufficient quantities to meet current requirements subject to normal lead times. The Company is subject to rules of the Securities and Exchange Commission (“SEC”) under the Dodd-Frank Wall Street Reform and Consumer Protection Act, requiring disclosure as to whether certain materials (tantalum, tin, gold and tungsten), known as conflict minerals, which may be contained in the Company’s products, are mined from the Democratic Republic of the Congo and adjoining countries. These rules are likely to impose additional costs and may introduce new risks related to the Company’s ability to verify the origin of any conflict minerals contained in its products.
Research and Development
The Company maintains an active research and development program focused on the development and commercialization of products that both complement and update its existing product offering. The Company’s research and development expenditures for 2013, 2012 and 2011 were $101 million, $96 million and $92 million, respectively. Nearly all of the Company’s current LC products are developed at the Company’s main research and development center located in Milford, Massachusetts, with input and feedback from the Company’s extensive field organizations and customers. The majority of the Company’s MS products are developed at facilities in England and most of the Company’s current materials characterization products are developed at the Company’s research and development center in New Castle, Delaware. At December 31, 2013, 2012 and 2011, there were 824, 777 and 741 employees, respectively, involved in the Company’s research and development efforts. The Company has increased research and development expenses from its continued commitment to invest significantly in new product development and existing product enhancements, and as a result of acquisitions. Despite the Company’s active research and development programs, there can be no assurances that the Company’s product development and commercialization efforts will be successful or that the products developed by the Company will be accepted by the marketplace.
Employees
The Company employed approximately 6,000, 5,900 and 5,700 employees at December 31, 2013, 2012 and 2011, respectively, with approximately 43% of the Company’s employees located in the United States. The Company believes its employee relations are generally good. The Company’s employees are not unionized or affiliated with any internal or external labor organizations. The Company firmly believes that its future success largely depends upon its continued ability to attract and retain highly skilled employees.
Competition
The analytical instrument systems, supplies and services market is highly competitive. The Company encounters competition from several worldwide manufacturers and other companies in both domestic and foreign markets for each of its three primary technologies. The Company competes in its markets primarily on the basis of
8

Table of Contents
product performance, reliability, service and, to a lesser extent, price. Competitors continuously introduce new products and have instrument businesses that are generally more diversified than the Company’s business. Some competitors have greater financial resources and broader distribution than the Company’s.
In the markets served by the Waters Division, the Company’s principal competitors include: Agilent Technologies, Inc., Shimadzu Corporation, Bruker Corporation, Danaher Corporation and Thermo Fisher Scientific Inc. In the markets served by the TA Division, the Company’s principal competitors include: PerkinElmer, Inc., Mettler-Toledo International Inc., NETZSCH-Geraetebau GmbH, Thermo Fisher Scientific Inc., Malvern Instruments Ltd., Anton-Paar and General Electric Company.
The market for consumable LC products, including separation columns, is highly competitive and generally more fragmented than the analytical instruments market. The Company encounters competition in the consumable columns market from chemical companies that produce column sorbents and small specialized companies that primarily pack purchased sorbents into columns and subsequently package and distribute columns. The Company believes that it is one of the few suppliers that processes silica, packs columns and distributes its own products. The Company competes in this market on the basis of reproducibility, reputation, performance and, to a lesser extent, price. The Company’s principal competitors for consumable products include: Phenomenex, Inc., Sigma Aldrich, Agilent Technologies, Inc., General Electric Company, Thermo Fisher Scientific Inc. and Merck and Co., Inc. The ACQUITY UPLC instrument is designed to offer a predictable level of performance when used with ACQUITY UPLC columns and the Company believes that the expansion of the ACQUITY UPLC instrument base will enhance its chromatographic column business because of the high level of synergy between ACQUITY UPLC columns and the ACQUITY UPLC instruments.
Patents, Trademarks and Licenses
The Company owns a number of United States and foreign patents and has patent applications pending in the United States and abroad. Certain technology and software has been acquired or is licensed from third parties. The Company also owns a number of trademarks. The Company’s patents, trademarks and licenses are viewed as valuable assets to its operations. However, the Company believes that no one patent or group of patents, trademark or license is, in and of itself, essential to the Company such that its loss would materially affect the Company’s business as a whole.
Environmental Matters and Climate Change
The Company is subject to federal, state and local laws, regulations and ordinances that (i) govern activities or operations that may have adverse environmental effects, such as discharges to air and water as well as handling and disposal practices for solid and hazardous wastes, and (ii) impose liability for the costs of cleaning up and certain damages resulting from sites of past spills, disposals or other releases of hazardous substances. The Company believes that it currently conducts its operations and has operated its business in the past in substantial compliance with applicable environmental laws. From time to time, Company operations have resulted or may result in noncompliance with environmental laws or liability for cleanup pursuant to environmental laws. The Company does not currently anticipate any material adverse effect on its operations, financial condition or competitive position as a result of its efforts to comply with environmental laws.
The Company is sensitive to the growing global debate with respect to climate change. An internal sustainability working group develops increasingly robust data with respect to the Company’s utilization of carbon producing substances in an effort to continuously reduce the Company’s carbon footprint. In 2012, the Company published a sustainability report identifying the various actions and behaviors the Company has adopted concerning its commitment to both the environment and the broader topic of social responsibility. See Item 1A, Risk Factors – The effects of climate change could harm the Company’s business , for more information on the potential significance of climate change legislation. See also Note 15 in the Notes to the Consolidated Financial Statements for financial information about geographic areas.
9

Table of Contents
Available Information
The Company files or furnishes all required reports with the SEC. The public may read and copy any materials the Company files or furnishes with the SEC at the SEC’s Public Reference Room at 100 F Street, N.E., Washington, DC 20549. The public may obtain information on the operation of the Public Reference Room by calling the SEC at 1-800-SEC-0330.
The Company is an electronic filer and the SEC maintains a website that contains reports, proxy and information statements and other information regarding issuers that file electronically with the SEC. The address of the SEC electronic filing website is http://www.sec.gov . The Company also makes available, free of charge on its website, its annual report on Form 10-K, quarterly reports on Form 10-Q, current reports on Form 8-K and any amendments to those reports as soon as reasonably practicable after such material is electronically filed with or furnished to the SEC. The website address for Waters Corporation is http://www.waters.com and SEC filings can be found under the caption “Investors”.
Forward-Looking Statements
Certain of the statements in this Form 10-K and the documents incorporated herein, may contain forward-looking statements within the meaning of Section 27A of the Securities Act of 1933, as amended, and Section 21E of the Securities Exchange Act of 1934, as amended (the “Exchange Act”), with respect to future results and events, including statements regarding, among other items, anticipated trends or growth in the Company’s business, including, but not limited to, development of products by acquired businesses; the growth rate of sales and research and development expenses; the impact of new product launches and the associated costs, such as the amortization expense related to UNIFI; geographic sales mix of business; anticipated expenses, including interest expense, capitalized software costs and effective tax rates; the impact of foreign currency translation on financial results; the impact and outcome of the Company’s various ongoing tax audit examinations; the achievement of contractual milestones to preserve foreign tax rates; the impact and outcome of litigation matters; the impact of the loss of intellectual property protection; the impact of new accounting standards and pronouncements; the adequacy of the Company’s supply chain and manufacturing capabilities and facilities; the impact of regulatory compliance; the Company’s expected cash flow, borrowing capacity, debt repayment and refinancing; the Company’s ability to fund working capital, capital expenditures, service debt, repay outstanding lines of credit, make authorized share repurchases, fund potential acquisitions and pay any adverse litigation or tax audit liabilities, particularly in the U.S.; future impairment charges; the Company’s contributions to defined benefit plans; the Company’s expectations regarding changes to its financial position; compliance with applicable environmental laws; and the impact of recent acquisitions on sales and earnings.
Many of these statements appear, in particular, under the heading “Management’s Discussion and Analysis of Financial Condition and Results of Operations” in Part II, Item 7 of this Form 10-K. Statements that are not statements of historical fact may be deemed forward-looking statements. You can identify these forward-looking statements by the use of the words “feels”, “believes”, “anticipates”, “plans”, “expects”, “may”, “will”, “would”, “intends”, “suggests”, “appears”, “estimates”, “projects”, “should” and similar expressions, whether in the negative or affirmative. These statements are subject to various risks and uncertainties, many of which are outside the control of the Company, including, and without limitation:
10
• The risks inherent in succession planning, as the Company’s chief executive officer has announced his intention to retire by the end of
2015 and the Company’s former chief financial officer has transitioned to a reduced workload and resigned as the Company’s chief financial officer as of February 1, 2014.
• Current global economic, sovereign and political conditions and uncertainties, particularly regarding the European debt crisis and the overall stability of the Euro and its suitability as a single currency; the Company’s ability to access capital and maintain liquidity in volatile market conditions of customers; changes in timing and demand by the Company’s customers and various market sectors, particularly if they should reduce capital expenditures or are unable to obtain funding, as in the cases of governmental, academic and research institutions; the effect of mergers and acquisitions on customer demand; and the Company’s ability to sustain and enhance service.

Table of Contents
Certain of these and other factors are further described below in Item 1A, Risk Factors, of this Form 10-K. Actual results or events could differ materially from the plans, intentions and expectations disclosed in the forward-looking statements, whether because of these factors or for other reasons. All forward-looking statements speak only as of the date of this annual report on Form 10-K and are expressly qualified in their entirety by the cautionary statements included in this report. The Company does not assume any obligation to update any forward-looking statements.
The Company is subject to risks common to companies in the analytical instrument industry, including, but not limited to, the following:
Global economic conditions may decrease demand for the Company’s products and harm the Company’s financial results. The Company is a global business that may be adversely affected by changes in global economic conditions. These changes in global economic conditions may affect the demand for the Company’s products and services and may result in a decline in sales in the future. There can be no assurance regarding demand for the Company’s products and services in the future.
The Company’s financial results are subject to changes in customer demand, which may decrease for a number of reasons, many beyond the Company’s control. The demand for the Company’s products is dependent upon the size of the markets for its LC, LC-MS, thermal analysis, rheometry and calorimetry products; the timing and level of capital spending and expenditures of the Company’s customers; changes in governmental regulations, particularly affecting drug, food and drinking water testing; funding available to governmental, academic and research institutions; general economic conditions and the rate of economic growth in the Company’s major markets; and competitive considerations. The Company typically experiences an increase in sales in its fourth quarter as a result of purchasing habits for capital goods by customers that tend to exhaust their spending budgets by calendar year end. There can be no assurance that the Company’s results of operations or financial condition will not be adversely impacted by a change in any of the factors listed above or the continuation of uncertain global economic conditions.
11
• Negative industry trends; introduction of competing products by other companies and loss of market share; pressures on prices from customers or resulting from competition; regulatory, economic and competitive obstacles to new product introductions; lack of acceptance of new products; expansion of our business in developing markets; spending by certain end-markets and ability to obtain alternative sources for components and modules.
• Foreign exchange rate fluctuations that could adversely affect translation of the Company’s future sales, financial operating results and
the condition of its non-U.S. operations, especially when a currency weakens against the U.S. dollar.
• Increased regulatory burdens as the Company’s business evolves, especially with respect to the FDA and EPA, among others, as well
as regulatory, environmental and logistical obstacles affecting the distribution of the Company’s products, completion of purchase order documentation by our customers and ability of customers to obtain letters of credit or other financing alternatives.
• Risks associated with lawsuits, particularly involving claims for infringement of patents and other intellectual property rights.
• The impact and costs incurred from changes in accounting principles and practices or tax rates; shifts in taxable income in jurisdictions
with different effective tax rates; and the outcome of and costs associated with ongoing and future tax audit examinations or changes in respective country legislation affecting the Company’s effective rates.
Item 1A: Risk Factors

Table of Contents
Additionally, the analytical instrument market may, from time to time, experience low sales growth. Approximately 52% and 53% of the Company’s net sales in 2013 and 2012, respectively, were to the worldwide pharmaceutical and biotechnology industries, which may be periodically subject to unfavorable market conditions and consolidations. Unfavorable industry conditions could have a material adverse effect on the Company’s results of operations or financial condition.
Disruption in worldwide financial markets could adversely impact the Company’s access to capital and financial condition. Financial markets in the U.S., Europe and Asia have experienced times of extreme disruption in recent years, including, among other things, sharp increases in the cost of new capital, credit rating downgrades and bailouts, severely diminished capital availability and severely reduced liquidity in money markets. Financial and banking institutions have also experienced disruptions, resulting in large asset write-downs, higher costs of capital, rating downgrades and reduced desire to lend money. There can be no assurance that there will not be future deterioration or prolonged disruption in financial markets or financial institutions. Any future deterioration or prolonged disruption in financial markets or financial institutions in which the Company participates may impair the Company’s ability to access its existing cash, utilize its existing syndicated bank credit facility funded by such financial institutions, and impair its ability to access sources of new capital. The Company’s cost of any new capital raised and interest expense would increase if this were to occur.
Competitors may introduce more effective or less expensive products than the Company’s, which could result in decreased sales. The analytical instrument market and, in particular, the portion related to the Company’s HPLC, UPLC, LC-MS, thermal analysis, rheometry and calorimetry product lines, is highly competitive and subject to rapid changes in technology. The Company encounters competition from several international instrument manufacturers and other companies in both domestic and foreign markets. Some competitors have instrument businesses that are generally more diversified than the Company’s business, but are typically less focused on the Company’s chosen markets. There can be no assurance that the Company’s competitors will not introduce more effective and less costly products than those of the Company or that the Company will be able to increase its sales and profitability from new product introductions. There can be no assurance that the Company’s sales and marketing forces will compete successfully against the Company’s competitors in the future.
The Company’s financial condition and results of operations could be adversely affected if the Company is unable to maintain a sufficient level of cash flow in the U.S. The Company had approximately $1,323 million in debt and $1,804 million in cash, cash equivalents and investments as of December 31, 2013. As of December 31, 2013, the Company also had the ability to borrow an additional $483 million from its existing, committed credit facilities. Most of the Company’s debt is in the U.S. There is a substantial cash requirement in the U.S. to fund operations and capital expenditures, service debt interest obligations, finance potential U.S. acquisitions and continue authorized stock repurchase programs in the U.S. A majority of the Company’s cash is generated from foreign operations, with $1,738 million of the Company’s cash held by foreign subsidiaries, and may be subject to material tax effects on distribution to U.S. legal entities. The Company’s financial condition and results of operations could be adversely impacted if the Company is unable to maintain a sufficient level of cash flow in the U.S. to address these requirements through (1) cash from U.S. operations, (2) efficient, cost-effective and timely distribution of cash from non-U.S. subsidiaries, (3) the Company’s ability to access its existing cash and revolving credit facility and (4) other sources of capital obtained at an acceptable cost.
Debt covenants, and the Company’s failure to comply with them, could negatively impact the Company’s capital and financial results. The Company’s debt is subject to restrictive debt covenants that limit the Company’s ability to engage in certain activities that could otherwise benefit the Company. These debt covenants include restrictions on the Company’s ability to enter into certain contracts or agreements that may limit the Company’s ability to make dividend or other payments, secure other indebtedness, enter into transactions with affiliates and consolidate, merge or
12

Table of Contents
transfer all or substantially all of the Company’s assets. The Company is also required to meet specified financial ratios under the terms of the Company’s debt agreements. The Company’s ability to comply with these financial restrictions and covenants is dependent on the Company’s future performance, which is subject to, but not limited to, prevailing economic conditions and other factors, including factors that are beyond the Company’s control, such as foreign exchange rates, interest rates, changes in technology and changes in the level of competition.
Disruption of operations at the Company’s manufacturing facilities could harm the Company’s financial condition. The Company manufactures LC instruments at facilities in Milford, Massachusetts and through a subcontractor in Singapore; chemistry separation columns at its facilities in Taunton, Massachusetts and Wexford, Ireland; MS products at its facilities in Cheshire, England, Manchester, England, Wilmslow, England and Wexford, Ireland; thermal analysis and rheometry products at its facilities in New Castle, Delaware and other instruments and consumables at various other locations as a result of the Company’s acquisitions. In early 2014, the Company completed the construction of its new facility in Wilmslow, England and is in the process of consolidating and moving its Cheshire and Manchester facilities to this new location. Any prolonged disruption to the operations at any of these facilities, whether due to labor difficulties, destruction of or damage to any facility or other reasons, could have a material adverse effect on the Company’s results of operations or financial condition.
The Company’s international operations may be negatively affected by foreign political and regulatory changes, related to either a specific country or a larger region. Currency and economic disruptions and foreign currency exchange rate fluctuations could have a material adverse effect on the Company’s results of operations or financial condition. Approximately 71% of the Company’s net sales in both 2013 and 2012 were outside of the United States and were primarily denominated in foreign currencies. In addition, the Company has considerable manufacturing operations in Ireland and the United Kingdom, as well as significant subcontractors located in Singapore. As a result, a significant portion of the Company’s sales and operations are subject to certain risks, including adverse developments in the foreign political, regulatory and economic environment, in particular, the financial difficulties and debt burden experienced by a number of European countries; the instability and possible dissolution of the Euro as a single currency; sudden movements in a country’s foreign exchange rates due to a change in a country’s sovereign risk profile or foreign exchange regulatory practices; tariffs and other trade barriers; difficulties in staffing and managing foreign operations; and associated adverse operational, contractual and tax consequences.
Additionally, the U.S. dollar value of the Company’s net sales, cost of sales, operating expenses, interest, taxes and net income varies with currency exchange rate fluctuations. Significant increases or decreases in the value of the U.S. dollar relative to certain foreign currencies, particularly the Euro, Japanese yen and British pound, could have a material adverse effect or benefit on the Company’s results of operations or financial condition.
The loss of key members of management and the risks inherent in succession planning could adversely affect the Company’s results of operations or financial condition. The operation of the Company requires managerial and operational expertise. None of the Company’s key management employees have an employment contract with the Company and there can be no assurance that such individuals will remain with the Company. In August 2013, the Company’s chief executive officer announced his intention to retire as chief executive officer of the Company by the end 2015. In addition, the Company’s former chief financial officer has transitioned to a reduced workload and resigned as the Company’s chief financial officer as of February 1, 2014. If, for any reason, other such key personnel do not continue to be active in management, the Company’s results of operations or financial condition could be adversely affected.
13

Table of Contents
Failure to adequately protect intellectual property could have materially adverse effects on the Company’s results of operations or financial condition. The Company vigorously protects its intellectual property rights and seeks patent coverage on all developments that it regards as material and patentable. However, there can be no assurance that any patents held by the Company will not be challenged, invalidated or circumvented or that the rights granted thereunder will provide competitive advantages to the Company. Conversely, there could be successful claims against the Company by third-party patent holders with respect to certain Company products that may infringe the intellectual property rights of such third parties. The Company’s patents, including those licensed from others, expire on various dates. If the Company is unable to protect its intellectual property rights, it could have an adverse and material effect on the Company’s results of operations or financial condition.
The Company’s business would suffer if the Company were unable to acquire adequate sources of supply. Most of the raw materials, components and supplies purchased by the Company are available from a number of different suppliers; however, a number of items are purchased from limited or single sources of supply and disruption of these sources could have, at a minimum, a temporary adverse effect on shipments and the financial results of the Company. A prolonged inability to obtain certain materials or components could have an adverse effect on the Company’s financial condition or results of operations and could result in damage to its relationships with its customers and, accordingly, adversely affect the Company’s business.
The Company’s sales would deteriorate if the Company’s outside contractors fail to provide necessary components or modules. Certain components or modules of the Company’s LC and MS instruments are manufactured by outside contractors, including the manufacturing of LC instrument systems and related components by contract manufacturing firms in Singapore. Disruptions of service by these outside contractors could have an adverse effect on the supply chain and the financial results of the Company. A prolonged inability to obtain these components or modules could have an adverse effect on the Company’s financial condition or results of operations.
The Company’s financial results are subject to unexpected shifts in pre-tax income between tax jurisdictions and changing application of tax law. The Company is subject to rates of income tax that range from 0% to in excess of 35% in various jurisdictions in which it conducts business. In addition, the Company typically generates a substantial portion of its income in the fourth quarter of each fiscal year. Geographical shifts in income from previous quarters’ projections caused by factors including, but not limited to, changes in volume and product mix and fluctuations in foreign currency translation rates, could therefore have potentially significant favorable or unfavorable effects on the Company’s income tax expense, effective tax rate and results of operations. In addition, governments in the jurisdictions in which the Company operates implement changes to tax laws and regulations from time to time. Any changes in corporate income tax rates or regulations regarding transfer pricing or repatriation of dividends or capital, as well as changes in the interpretation of existing tax laws and regulations, in the jurisdictions in which the Company operates could adversely affect the Company’s cash flow and lead to increases in its overall tax burden, which would negatively affect the Company’s profitability.
Disruption, cyber attack or unforeseen problems with the security, maintenance or upgrade of the Company’s information and web-based systems could have an adverse effect on the Company’s operations and financial condition. The Company relies on its technology infrastructure and that of its software and banking partners, among other functions, to interact with suppliers, sell products and services, fulfill contract obligations, ship products, collect and make electronic wire and check based payments and otherwise conduct business. The Company’s technology infrastructure may be vulnerable to damage or interruption from, but not limited to, natural disasters, power loss, telecommunication failures, terrorist attacks, computer viruses, unauthorized access to customer or employee
14

Table of Contents
data, unauthorized access to and funds transfers from Company bank accounts and other attempts to harm the Company’s systems. Any prolonged disruption to the Company’s technology infrastructure, at any of its facilities, could have a material adverse effect on the Company’s results of operations or financial condition.
The effects of climate change could harm the Company’s business. The Company’s manufacturing processes for certain of its products involve the use of chemicals and other substances that are regulated under various international, federal, state and local laws governing the environment. In the event that any future climate change legislation would require that stricter standards be imposed by domestic or international environmental regulatory authorities with respect to the use and/or levels of possible emissions from such chemicals and/or other substances, the Company may be required to make certain changes and adaptations to its manufacturing processes. Any such changes could have a material adverse effect on the financial statements of the Company.
Another potential effect of climate change is an increase in the severity of global weather conditions. The Company’s manufacturing facilities are located in the United States, United Kingdom and Ireland. In addition, the Company manufactures a growing percentage of its HPLC, UPLC and MS products in both Singapore and Ireland. Severe weather conditions, including earthquakes, hurricanes and/or tsunamis, could potentially cause significant damage to the Company’s manufacturing facilities in each of these countries. The effects of such damage and the resulting disruption of manufacturing operations could have a material adverse impact on the financial results of the Company.
Compliance failures could harm the Company’s business. The Company is subject to regulation by various federal, state and foreign governments and agencies in areas including, among others, health and safety, import/export, the Foreign Corrupt Practices Act and environmental laws and regulations. A portion of the Company’s operations are subject to regulation by the FDA and similar foreign regulatory agencies. These regulations are complex and govern an array of product activities, including design, development, labeling, manufacturing, promotion, sales and distribution. Any failure by the Company to comply with applicable governmental regulations could result in product recalls, the imposition of fines, restrictions on the Company’s ability to conduct or expand its operations or the cessation of all or a portion of its operations.
Some of the Company’s operations are subject to domestic and international laws and regulations with respect to the manufacturing, handling, use or sale of toxic or hazardous substances. This requires the Company to devote substantial resources to maintain compliance with those applicable laws and regulations. If the Company fails to comply with such requirements in the manufacturing or distribution of its products, it could face civil and/or criminal penalties and potentially be prohibited from distributing or selling such products until they are compliant.
Some of the Company’s products are also subject to the rules of certain industrial standards bodies, such as the International Standards Organization. The Company must comply with these rules, as well as those of other agencies, such as the United States Occupational Health and Safety Administration. Failure to comply with such rules could result in the loss of certification and/or the imposition of fines and penalties which could have a material adverse effect on the Company’s operations.
The Company is subject to the rules of the SEC under the Dodd-Frank Wall Street Reform and Consumer Protection Act, requiring disclosure as to whether certain materials (tantalum, tin, gold and tungsten), known as conflict minerals, which may be contained in the Company’s products, are mined from the Democratic Republic of the Congo and adjoining countries. These rules are likely to impose additional costs and may introduce new risks related to the Company’s ability to verify the origin of any conflict minerals contained in its products.
15

Table of Contents
None.
Waters operates 23 United States facilities and 78 international facilities, including field offices. In early 2014, the Company completed the construction of its new facility in Wilmslow, England and is in the process of consolidating and moving its Cheshire, England and Manchester, England facilities to this new location. This new facility will consolidate existing primary MS research, manufacturing and distribution locations and the Company believes that this new building and its other existing facilities are suitable and adequate for its current production level and for reasonable growth over the next several years. The Company’s primary facilities are summarized in the table below.
Primary Facility Locations
16
Item 1B: Unresolved Staff Comments
Item 2: Properties
Location Function (1) Owned/Leased Golden, CO M, R, S, D, A Leased New Castle, DE M, R, S, D, A Owned Milford, MA M, R, S, D, A Owned Saugus, MA M, R, S, D, A Leased Taunton, MA M, R Owned Nixa, MO M, S, D, A Leased Pittsburgh, PA M, R, S, D, A Leased Lindon, UT M, R, S, D, A Leased Cheshire, England M, R, D, A Leased Manchester, England M, R, S, A Leased Wilmslow, England M, R, S, D, A Owned St. Quentin, France S, A Leased Huellhorst, Germany M, R, S, D, A Owned Wetzlar, Germany M, R, S, D, A Leased Wexford, Ireland M, R, D, A Owned Modena, Italy M, R, S, D, A Leased Etten-Leur, Netherlands S, D, A Owned Brasov, Romania R, A Leased Singapore R, S, D, A Leased (1) M = Manufacturing; R = Research; S = Sales and Service; D = Distribution; A = Administration

Table of Contents
The Company operates and maintains 14 field offices in the United States and 64 field offices abroad in addition to sales offices in the primary facilities listed above. The Company’s field office locations are listed below.
Field Office Locations (2)
From time to time, the Company and its subsidiaries are involved in various litigation matters arising in the ordinary course of business. The Company believes it has meritorious arguments in its current litigation matters and believes any outcome, either individually or in the aggregate, will not be material to the Company’s financial position or results of operations.
The Company has been engaged in ongoing patent litigation with Agilent Technologies GmbH (“Agilent”) in Germany. In July 2005, Agilent brought an action against the Company alleging that certain features of the Alliance pump continued to infringe certain of its patents. In August 2006, following a trial in this action, the German court ruled that the Company did not infringe the patents. Agilent filed an appeal in this action. A hearing on this appeal was held in January 2008. The appeals court affirmed the finding of the trial court that the Company did not infringe and Agilent appealed this finding to the German Federal Court of Justice. In December 2012, Agilent won this appeal and the Company recorded a $4 million provision for damages and fees estimated to be incurred in connection with this litigation.
Not applicable.
EXECUTIVE OFFICERS OF THE REGISTRANT
Officers of the Company are elected annually by the Board of Directors and hold office at the discretion of the Board of Directors. The following persons serve as executive officers of the Company:
Douglas A. Berthiaume, 65, has served as Chairman of the Board of Directors of the Company since February 1996 and has served as Chief Executive Officer and a Director of the Company since August 1994. Mr. Berthiaume also served as President of the Company from August 1994 to January 2002. In March 2003,
17
United States International
Irvine, CA Australia Japan
Pleasanton, CA Austria Korea
Schaumburg, IL Belgium Mexico
Wood Dale, IL Brazil Netherlands
Columbia, MD Canada Norway
Beverly, MA Czech Republic People’s Republic of China Ann Arbor, MI Denmark Portugal
Durham, NC Finland Poland
Morrisville, NC France Puerto Rico
Parsippany, NJ Germany Spain Westlake, OH Hungary Sweden
Plymouth Meeting, PA India Switzerland
Bellaire, TX Ireland Taiwan
Spring, TX Israel United Kingdom
Italy (2) The Company operates more than one field office within certain states and foreign countries.
Item 3: Legal Proceedings
Item 4: Mine Safety Disclosures

Table of Contents
Mr. Berthiaume once again became President of the Company. From 1990 to 1994, Mr. Berthiaume served as President of the Waters Chromatography Division of Millipore. Mr. Berthiaume is the Chairman of the Children’s Hospital Trust Board and a Trustee of the Children’s Hospital Medical Center and The University of Massachusetts Amherst Foundation. In August 2013, Mr. Berthiaume communicated his intention to retire as Chief Executive Officer of the Company by the end of 2015.
Arthur G. Caputo, 62, has been Executive Vice President since March 2003 and President of the Waters Division since January 2002. Previously, he was the Senior Vice President, Worldwide Sales and Marketing of the Company since August 1994. He joined Millipore in October 1977 and held a number of positions in sales. Previous roles include Senior Vice President and General Manager of Millipore’s North American Business Operations responsible for establishing the Millipore North American Sales Subsidiary and General Manager of Waters’ North American field sales, support and marketing functions.
Mark T. Beaudouin, 59, has been Vice President, General Counsel and Secretary of the Company since April 2003. Prior to joining Waters, he served as Senior Vice President, General Counsel and Secretary of PAREXEL International Corporation, a bio/pharmaceutical services company, from January 2000 to April 2003. Previously, from May 1985 to January 2000, Mr. Beaudouin served in several senior legal management positions, including Vice President, General Counsel and Secretary of BC International, Inc., a development stage biotechnology company, First Senior Vice President, General Counsel and Secretary of J. Baker, Inc., a diversified retail company, and General Counsel and Secretary of GenRad, Inc., a high technology test equipment manufacturer.
Eugene G. Cassis, 57, was elected by the Board of Directors of the Company to serve as the interim Chief Financial Officer, effective February 1, 2014. Mr. Cassis most recently served as Corporate Vice President of Worldwide Business Development and Investor Relations and has been with the Company for 33 years. Mr. Cassis has an extensive background in many financial, operational and technical areas of the Company and has held several senior positions with Waters, including President of Nihon Waters K.K., Tokyo, Japan and Liquid Chromatography — Mass Spectrometry (LC-MS) Business Unit Manager.
Elizabeth B. Rae, 56, has been Vice President of Human Resources since October 2005 and Vice President of Worldwide Compensation and Benefits since January 2002. She joined Waters in January 1996 as Director of Worldwide Compensation. Prior to joining Waters she held senior human resources positions in retail, healthcare and financial services companies.
18

Table of Contents
PART II
The Company’s common stock is registered under the Exchange Act, and is listed on the New York Stock Exchange under the symbol WAT. As of February 22, 2014, the Company had 146 common stockholders of record. The Company has not declared or paid any dividends on its common stock in its past three fiscal years and does not plan to pay dividends in the immediate future. The Company has not made any sales of unregistered equity securities in the years ended December 31, 2013, 2012 or 2011.
Securities Authorized for Issuance under Equity Compensation Plans
Equity compensation plan information is incorporated by reference from Part III, Item 12, Security Ownership of Certain Beneficial Owners and Management and Related Stockholder Matters, of this document and should be considered an integral part of this Item 5.
Stock Price Performance Graph
The following performance graph and related information shall not be deemed to be “soliciting material” or to be “filed” with the SEC, nor shall such information be incorporated by reference into any future filing under the Securities Act of 1933, as amended, or the Exchange Act, except to the extent that the Company specifically incorporates it by reference into such filing.
The following graph compares the cumulative total return on $100 invested as of December 31, 2008 (the last day of public trading of the Company’s common stock in fiscal year 2008) through December 31, 2013 (the last day of public trading of the common stock in fiscal year 2013) in the Company’s common stock, the NYSE Market Index and the SIC Code 3826 Index. The return of the indices is calculated assuming reinvestment of dividends during the period presented. The Company has not paid any dividends since its IPO. The stock price performance shown on the graph below is not necessarily indicative of future price performance.
COMPARISON OF CUMULATIVE TOTAL RETURN SINCE DECEMBE R 31, 2008 AMONG WATERS CORPORATION, NYSE MARKET INDEX AND SIC CODE 3826 INDEX – LABORATORY ANALYTICAL
INSTRUMENTS
19
Item 5: Market for Registrant’s Common Equity, Related Stockholder Matters and Issuer Purchases of Equity Securities
2008 2009 2010 2011 2012 2013
WATERS CORPORATION 100.00 169.06 212.03 202.05 237.71 272.85 NYSE MARKET INDEX 100.00 128.28 145.46 139.87 162.23 204.87 SIC CODE INDEX 100.00 148.19 209.92 174.77 229.97 328.27

Table of Contents
Market for Registrant’s Common Equity
The quarterly range of high and low close prices for the Company’s common stock as reported by the New York Stock Exchange is as follows:
Purchases of Equity Securities by the Issuer
The following table provides information about purchases by the Company during the three months ended December 31, 2013 of equity securities registered by the Company under the Exchange Act (in thousands, except per share data):
20
Price Range For the Quarter Ended High Low
March 31, 2012 $ 94.03 $ 73.71 June 30, 2012 $ 93.99 $ 76.15 September 29, 2012 $ 85.24 $ 74.66 December 31, 2012 $ 89.33 $ 78.89 March 30, 2013 $ 94.96 $ 86.22 June 29, 2013 $ 101.90 $ 88.24 September 28, 2013 $ 107.73 $ 98.16 December 31, 2013 $ 106.48 $ 95.25
Period
Total Number of
Shares
Purchased
Average Price Paid
per Share
Total Number of Shares Purchased
as Part of Publicly
Announced Programs (1)
Maximum Dollar
Value of Shares that May Yet Be Purchased Under
the Programs
September 29 to October 26, 2013 — $ — — $ 423,166 October 27 to November 23, 2013 535 $ 100.81 535 $ 369,238 November 24 to December 31, 2013 220 $ 97.50 220 $ 347,788
Total 755 $ 99.85 755 $ 347,788
(1) The Company purchased an aggregate of 3.1 million shares of its outstanding common stock in 2013 in open market transactions
pursuant to a repurchase program that was announced in May 2012 (the “2012 Program”). The 2012 Program authorized the repurchase of up to $750 million of common stock in open market transactions over a two-year period.

Table of Contents
The following table sets forth selected historical consolidated financial and operating data for the periods indicated. The statement of operations and balance sheet data is derived from audited financial statements for the years 2013, 2012, 2011, 2010 and 2009. The Company’s financial statements as of December 31, 2013 and 2012, and for each of the three years in the period ended December 31, 2013 are included in Item 8, Financial Statements and Supplementary Data, in Part II of this Form 10-K.
Business and Financial Overview
The Company has two operating segments: the Waters Division and the TA Division (“TA ”). The Waters Division’s products and services primarily consist of high performance liquid chromatography (“HPLC”), ultra performance liquid chromatography (“UPLC ” and together with HPLC, referred to as “LC”), mass spectrometry (“MS”) and chemistry consumable products and related services. TA products and services primarily consist of thermal analysis, rheometry and calorimetry instrument systems and service sales. The Company’s products are used by pharmaceutical, life science, biochemical, industrial, nutritional safety, environmental, academic and governmental customers. These customers use the Company’s products to detect, identify, monitor and measure the chemical, physical and biological composition of materials and to predict the suitability of fine chemicals, pharmaceuticals, water, polymers and viscous liquids in various industrial, consumer goods and healthcare products.
21
Item 6: Selected
Financial Data
In thousands, except per share and employees data 2013 2012 2011 2010 2009
STATEMENT OF OPERATIONS DATA:
Net sales $ 1,904,218 $ 1,843,641 $ 1,851,184 $ 1,643,371 $ 1,498,700 Income from operations before income taxes $ 490,105 $ 487,625 $ 509,252 $ 437,863 $ 386,652 Net income $ 450,003 $ 461,443 $ 432,968 $ 381,763 $ 323,313 Net income per basic common share $ 5.27 $ 5.25 $ 4.77 $ 4.13 $ 3.37 Weighted-average number of basic common shares 85,426 87,841 90,833 92,385 95,797 Net income per diluted common share $ 5.20 $ 5.19 $ 4.69 $ 4.06 $ 3.34 Weighted-average number of diluted common shares and equivalents 86,546 88,979 92,325 94,057 96,862 BALANCE SHEET AND OTHER DATA:
Cash, cash equivalents and investments $ 1,803,670 $ 1,539,025 $ 1,281,351 $ 946,419 $ 630,257 Working capital, including current maturities of debt $ 2,068,723 $ 1,753,484 $ 1,340,241 $ 1,200,791 $ 777,808 Total assets $ 3,582,629 $ 3,168,150 $ 2,723,234 $ 2,327,670 $ 1,907,931 Long-term debt $ 1,190,000 $ 1,045,000 $ 700,000 $ 700,000 $ 500,000 Stockholders’ equity $ 1,763,173 $ 1,467,357 $ 1,226,578 $ 1,068,797 $ 848,949 Employees 5,965 5,860 5,672 5,381 5,216
Item 7: Management’s
Discussion and Analysis of Financial Condition and Results of Operations
®
®

Table of Contents
The Company’s operating results are as follows for the years ended December 31, 2013, 2012 and 2011:
Sales increased 3% in 2013 as compared to 2012, with combined sales of chemistry consumables and services growing 4% and instrument system sales growing 2%. Instrument systems sales grew in 2013, as compared to the decline in 2012, as a result of increased demand in high-end mass spectrometry, core chromatography and TA instrument systems. In addition, instrument system sales benefited in 2013 from the introduction of the new ACQUITY UPC system, ACQUITY Advanced Polymer Chromatography (“APC ”) system and ACQUITY QDa Detector. The effect of foreign currency translation negatively impacted 2013 sales by 2% across all products and services, primarily due to a 22% weakening of the Japanese yen as compared to the U.S. dollar during 2013 as compared to 2012. Acquisitions had an insignificant impact on both 2013 and 2012 sales.
Sales were flat in 2012 as compared to 2011, as a 4% increase in combined sales of chemistry consumables and services was offset by a 4% decrease in instrument system sales. The decline in instrument system sales in 2012 was generally attributable to timing of capital spending by our customers across all regions, except China. The effect of foreign currency translation negatively impacted sales by 2% in 2012 and increased sales 3% in 2011.
Sales to pharmaceutical customers grew 1% in both 2013 and 2012. Combined sales to industrial and environmental customers increased 6% in 2013 and decreased 2% in 2012. Combined global sales to governmental and academic customers increased 8% in 2013 and decreased 4% in 2012. The increases in sales in 2013 were primarily due to higher customer demand for instrument systems. The increase in sales to pharmaceutical customers in 2012 was primarily a result of increased spending on chemistry consumables and services, while the decreased sales to other customers in 2012 were primarily attributable to timing of capital spending by our customers as a result of uncertain global economic conditions and the weakening of the Euro and Indian rupee.
22
Year Ended December 31, % change
2013 2012 2011
2013 vs.
2012
2012 vs.
2011
Product sales $ 1,312,503 $ 1,280,507 $ 1,322,136 2 % (3 %) Service sales 591,715 563,134 529,048 5 % 6 %
Total net sales 1,904,218 1,843,641 1,851,184 3 % — Total cost of sales 783,456 737,614 730,493 6 % 1 %
Gross profit 1,120,762 1,106,027 1,120,691 1 % (1 %) Gross profit as a % of sales 58.9 % 60.0 % 60.5 %
Selling and administrative expenses 492,965 477,270 490,011 3 % (3 %) Research and development expenses 100,536 96,004 92,347 5 % 4 % Purchased intangibles amortization 9,918 13,829 9,733 (28 %) 42 % Litigation provisions — 7,434 — (100 %)
Operating income 517,343 511,490 528,600 1 % (3 %) Operating income as a % of sales 27.2 % 27.7 % 28.6 %
Other expense (1,575 ) — —
Interest expense, net (25,663 ) (23,865 ) (19,348 ) 8 % 23 %
Income from operations before income taxes 490,105 487,625 509,252 1 % (4 %) Provision for income taxes 40,102 26,182 76,284 53 % (66 %)
Net income $ 450,003 $ 461,443 $ 432,968 (2 %) 7 %
Net income per diluted common share $ 5.20 $ 5.19 $ 4.69 — 11 %
® 2 ® ® ® TM
® TM

Table of Contents
The 1% increase in operating income in 2013 as compared to 2012 was primarily due to the increase in sales volume offset by the negative effects of foreign currency translation, which decreased 2013 operating profit by approximately $27 million, and the increase in amortization expense from the UNIFI software. In addition, the comparability of 2013 operating income with 2012 operating income was impacted by the 2012 one-time litigation provisions and purchased intangible amortization expense related to the discontinuance of a product trade name intangible asset.
The decrease in operating income in 2012 as compared to 2011 was primarily due to one-time charges included in purchased intangibles amortization and litigation provisions, and the effects of foreign currency translation. Foreign currency translation decreased 2012 operating profit by approximately $14 million and increased 2011 operating profit by approximately $26 million.
Net income per diluted share was primarily impacted by the following factors in 2013, 2012 and 2011:
Net cash provided by operating activities was $485 million, $449 million and $497 million in 2013, 2012 and 2011, respectively. The $36 million increase in operating cash flow in 2013 when compared to 2012 was primarily a result of the timing of cash receipts from customers, which improved days-sales-outstanding (“DSO”) by 2 days at December 31, 2013 as compared to December 31, 2012, and the timing of payments to vendors. The $48 million decrease in operating cash flow in 2012 when compared to 2011 was primarily a result of the timing of cash receipts from customers, payments in 2012 of amounts earned under the Company’s 2011 management incentive plans, higher U.S. tax payments and a $3 million litigation payment.
Within cash flows used in investing activities, capital expenditures related to property, plant, equipment and software capitalization were $118 million, $105 million and $85 million in 2013, 2012 and 2011, respectively. Capital expenditures in 2013, 2012 and 2011 include multi-year construction projects to accommodate future growth. The construction of the new $78 million research, manufacturing and distribution facility in Wilmslow, England was completed in early 2014. The Company expects to incur moving costs, as well as duplicate facility costs for a period of time, in 2014 as the Company exits and sells the existing facilities. The Company believes it has planned this major relocation of its operations in the U.K. so that the Company’s operations will not be disrupted; however, there can be no assurances that the Company’s operations and financial results will not be impacted in the near future as a result of this move.
In January 2014, the Company acquired ULSP B.V. for approximately $3 million in cash. In 2013, the Company acquired Scarabaeus Mess-und Prodktionstechnik GmbH, Nonlinear Dynamics Ltd., Expert Systems Solutions S.r.l. and LaserComp Inc. for a total of $41 million, net of cash acquired. These acquisitions are expected to add approximately $14 million to the Company’s sales in 2014 and be accretive to earnings per
23
• Foreign currency translation decreased net income per diluted share by $0.27 in 2013 and $0.14 in 2012, and added $0.24 to net
income per diluted share in 2011.
• In 2013, the Company recorded a $31 million net tax benefit related to the completion of tax audit examinations. In addition, a $3
million benefit related to the research and development tax credit (“R&D Tax Credit”) for the 2012 tax year was recorded in the first quarter of 2013. These tax benefits added $0.39 per diluted share in 2013.
• In 2012, the Company refinanced certain of its inter-company debt arrangements, which enabled the Company to record a $36 million tax benefit related to the recognition of a deferred tax asset associated with a non-U.S. net operating loss carryforward. In 2012, the Company also recorded a $6 million tax benefit related to tax audit settlements in the U.S. These tax benefits added $0.48 per diluted share in 2012.
• The impact of lower weighted-average shares outstanding resulting from the Company’s share repurchase program, offset by the
incremental interest expense on borrowings to repurchase those shares, increased net income per diluted share $0.11, $0.14 and $0.01 in 2013, 2012 and 2011, respectively. The Company plans to continue the share repurchase program in 2014.
®

Table of Contents
share. In 2012, the Company acquired its Israeli sales and service distributor, Baehr Thermoanalyse GmbH and Blue Reference, Inc. for a total of $31 million, net of cash acquired and including the assumption of $1 million of debt. The Company acquired Anter Corporation for $11 million in cash in 2011. The Company continues to evaluate the acquisition of businesses, product lines and technologies to augment the Waters and TA operating divisions.
Within cash flows used in financing activities, the Company received $69 million, $29 million and $60 million of proceeds from stock plans in 2013, 2012 and 2011, respectively. Fluctuations in these amounts were primarily attributable to changes in the Company’s stock price and the expiration of stock option grants. In May 2012, the Company’s Board of Directors authorized the Company to repurchase up to $750 million of its outstanding common stock over a two-year period. During 2013, 2012 and 2011, the Company repurchased $295 million, $290 million and $364 million of the Company’s outstanding common stock, respectively, under the May 2012 authorization and other previously announced programs. The Company believes that it has the financial flexibility to fund these share repurchases given current cash and debt levels, as well as to invest in research, technology and business acquisitions to further grow the Company’s sales and profits. In June 2013, the Company entered into a new credit agreement (the “2013 Credit Agreement”) that provides for a $1.1 billion revolving facility and a $300 million term loan facility. The revolving facility and term loan facility both mature on June 25, 2018 and require no scheduled prepayments before that date. The Company used the proceeds from the 2013 Credit Agreement to repay the outstanding amounts under the Company’s existing multi-borrower credit agreement dated July 2011 (the “2011 Credit Agreement”), which was terminated early without penalty.
Results of Operations
Sales by Geography Geographic sales information is presented below for the years ended December 31, 2013, 2012 and 2011 (in thousands):
In 2013, sales increased in all major regions on stronger customer demand for instrument systems, except for Japan, where the effect of foreign currency translation decreased sales 18%. The increase in sales in the U.S. in 2013 was driven by industrial and environmental customers, while the increase in Europe was driven by governmental and academic customers. China’s 2013 sales growth was broad-based across all product and customer classes, while sales in the rest of Asia were flat. The increase in the rest of the world’s sales in 2013 was broad-based across all product and customer classes.
In 2012, sales were lower in all major regions on weak customer spending from weak economic conditions, except for the U.S., which remained flat, and Asia, where China’s sales grew 21% as compared to 2011. The decline in Europe’s sales in 2012 was due to a 6% negative effect of foreign currency translation. The decline in the rest of the world’s sales in 2012 was due to lower demand of instrument systems from pharmaceutical, governmental and academic customers.
24
Year Ended December 31, % change
2013 2012 2011
2013 vs.
2012
2012 vs.
2011
Net Sales:
United States $ 557,734 $ 531,912 $ 530,606 5 % — Europe 573,786 549,341 574,770 4 % (4 %) Asia:
China 240,535 212,701 175,409 13 % 21 % Japan 170,115 207,340 211,893 (18 %) (2 %) Asia Other 216,229 215,612 222,082 — (3 %)
Total Asia 626,879 635,653 609,384 (1 %) 4 % Other 145,819 126,735 136,424 15 % (7 %)
Total net sales $ 1,904,218 $ 1,843,641 $ 1,851,184 3 % —

Table of Contents
Waters Division Net Sales Net sales for the Waters Division’s products and services are as follows for the years ended December 31, 2013, 2012 and 2011 (in thousands):
Waters instrument system sales (LC and MS technology-based) increased in 2013, which was primarily attributable to higher sales of UPLC -mass spectrometry systems, driven by Xevo and SYNAPT instrument systems. In addition, instrument system sales benefited in 2013 from the introduction of the new ACQUITY UPC system, ACQUITY APC system and the recent introduction of the ACQUITY QDa Detector. The decrease in instrument systems sales in 2012 was primarily attributable to the timing of capital spending by our customers as a result of uncertain global economic conditions and the weakening of both the Euro, which impacted sales due to the effect of foreign currency translation, and Indian rupee, which effectively increased the price of the systems for certain customers. Chemistry consumables sales increased in both 2013 and 2012 on the uptake in ACQUITY columns, as well as the new CORTECS columns introduced in 2013. Waters Division service sales increased in both 2013 and 2012 due to increased sales of service plans and higher service demand billings to a higher installed base of customers. The effect of foreign currency translation decreased Waters Division sales across all products and services by 2% in both 2013 and 2012. The Nonlinear Dynamics acquisition had an insignificant impact on the Waters Division sales in 2013.
In 2013, Waters Division sales increased 4% in both the U.S. and Europe, while sales decreased 2% in Asia and increased 12% in the rest of the world. Waters Division sales in China increased 13% in 2013 across all product and customer classes. The 2013 growth in China was offset by an 18% decrease in sales in Japan, which was largely due to a 22% weakening of the Japanese yen as compared to the U.S. dollar. The increase in Waters Division sales in the rest of the world was broad-based across most product and customer classes.
In 2012, Waters Division sales increased 3% in Asia, while sales were flat in the U.S and decreased 5% in Europe and 6% in the rest of the world. Asia experienced double-digit sales growth rates in China in 2012, particularly in the pharmaceutical, governmental, industrial and chemical analysis markets. The 2012 growth in China was offset by a decline in capital expenditures by customers in India, mostly due to lower HPLC instrument systems sales as a weaker Indian rupee increased the price of these systems, which are priced in U.S. dollars. The decline in Europe’s sales was due to a 6% negative effect of foreign currency translation.
25
Year Ended December 31, % change
2013 % of Total 2012
% of Total 2011
% of Total
2013 vs.
2012
2012 vs.
2011
Waters instrument systems $ 840,608 50 % $ 828,458 51 % $ 878,367 53 % 1 % (6 %) Chemistry 304,130 18 % 294,787 18 % 292,506 18 % 3 % 1 %
Total Waters Division product sales 1,144,738 1,123,245 1,170,873 2 % (4 %) Waters service 532,323 32 % 509,412 31 % 480,553 29 % 4 % 6 %
Total Waters Division net sales $ 1,677,061 100 % $ 1,632,657 100 % $ 1,651,426 100 % 3 % (1 %)
® ® ®
2
TM

Table of Contents
TA Division Net Sales Net sales for the TA Division’s products and services are as follows for the years ended December 31, 2013, 2012 and 2011 (in thousands):
The increase in TA instrument system sales in both 2013 and 2012 was primarily a result of higher demand for instrument systems from TA’s industrial customers, as well as revenue associated with the shipment of the new Discovery instrument systems. TA service sales increased in both 2013 and 2012 due to sales of service plans and billings to a higher installed base of customers. The effect of foreign currency translation decreased TA’s sales by 1% in both 2013 and 2012. Recent acquisitions added approximately 1% to TA’s sales in 2013 and 4% in 2012. TA’s 2013 sales increased in each territory, except for Japan, where the effects of foreign currency translation negatively impacted sales due to the weakening of the Japanese yen as compared to the U.S. dollar. TA’s 2012 sales increased in the U.S., Europe and Asia, while sales to the rest of the world declined.
Gross Profit Gross profit increased 1% in 2013 as compared to 2012, primarily due to changes in the product mix of instrument systems and higher manufacturing leverage from higher sales volumes being offset by the negative effects of foreign currency translation and the increase in amortization expense from the UNIFI software. Gross profit decreased 1% in 2012 as compared to 2011, due to changes in the product mix of instrument systems and the negative effects of foreign currency translation. Gross profit as a percentage of sales was 58.9%, 60.0% and 60.5% for 2013, 2012 and 2011, respectively.
Gross profit as a percentage of sales is affected by many factors, including, but not limited to, product mix, foreign currency translation, price and product costs of instrument systems and associated software platforms. The cost and amortization of capitalized software development costs for the Company’s UNIFI product may continue to affect the Company’s product mix and associated gross profit in 2014. The Company also expects that the impact of foreign currency translation should have a minimal effect on gross profit in 2014, based on current exchange rates.
Selling and Administrative Expenses Selling and administrative expenses increased 3% in 2013 and decreased 3% in 2012. Selling and administrative expenses in 2013 were impacted by headcount additions and higher merit compensation, offset slightly by favorable foreign currency translation due to the weakness in the Japanese yen. The decrease in selling and administrative expenses in 2012 was a result of the favorable impact of foreign currency translation and lower incentive compensation in 2012 as compared to 2011. As a percentage of net sales, selling and administrative expenses were 25.9% for 2013 and 2012 compared to 26.5% for 2011.
Research and Development Expenses Research and development expenses increased 5% and 4% in 2013 and 2012, respectively, primarily due to additional headcount and timing of development costs incurred on new products.
Purchased Intangibles Amortization In 2012, the Company incurred a one-time $4 million charge to purchased intangibles amortization expense related to the discontinuance of a product trade name intangible asset.
26
Year Ended December 31, % change
2013 % of Total 2012
% of Total 2011
% of Total
2013 vs.
2012
2012 vs.
2011
TA instrument systems $ 167,765 74 % $ 157,262 75 % $ 151,263 76 % 7 % 4 % TA service 59,392 26 % 53,722 25 % 48,495 24 % 11 % 11 %
Total TA net sales $ 227,157 100 % $ 210,984 100 % $ 199,758 100 % 8 % 6 %

Table of Contents
Litigation Provision The Company recorded $7 million of litigation provisions in 2012 for damages and fees estimated to be incurred in connection with complaints filed against the Company relating to patent infringement lawsuits. The Company paid $3 million of these litigation provisions in 2012.
Interest Expense, Net The increases in net interest expense in 2013 and 2012 were primarily attributable to an increase in average borrowings.
Provision for Income Taxes The four principal jurisdictions in which the Company manufactures are the U.S., Ireland, the United Kingdom and Singapore, where the marginal effective tax rates were approximately 37.5%, 12.5%, 23.25% and 0%, respectively, as of December 31, 2013. The Company has a contractual tax rate in Singapore of 0% through March 2016, based upon achievement of contractual milestones that the Company expects to continue to meet. The current statutory tax rate in Singapore is 17%. The Company’s effective tax rate is influenced by many significant factors, including, but not limited to, the wide range of income tax rates in jurisdictions in which the Company operates; sales volumes and profit levels in each tax jurisdiction; changes in tax laws, tax rates and policies; the outcome of various ongoing tax audit examinations; and the impact of foreign currency transactions and translation. As a result of variability in these factors, the Company’s effective tax rates in the future may not be similar to the effective tax rates for the current or prior year.
The Company’s effective tax rates were 8.2%, 5.4% and 15.0% in 2013, 2012 and 2011, respectively. The income tax provision for 2013 included a $31 million net tax benefit related to the completion of tax audit examinations. In addition, the R&D Tax Credit was retroactively extended in January 2013 for the 2012 and 2013 tax years. The entire $3 million benefit related to the 2012 tax year was recorded in the first quarter of 2013, and the 2013 benefit is included in the annual effective tax rate. The net income tax benefits related to the completed tax audit examinations and the 2012 R&D Tax Credit decreased the Company’s effective tax rate by 6.9 percentage points in 2013. The income tax provision for 2012 included a $36 million tax benefit related to the Company’s refinancing of certain of its inter-company debt arrangements, which enabled the Company to recognize a deferred tax asset associated with a non-U.S. net operating loss carryforward. In 2012, the Company also recorded a $6 million tax benefit related to tax audit settlements in the U.S. These tax benefits decreased the Company’s effective tax rate by 8.6 percentage points in 2012. Included in the income tax provision for 2011 is a $2 million tax benefit related to the reversal of a reserve for interest related to a tax audit settlement in the United Kingdom. This tax benefit decreased the Company’s effective tax rate by 0.3 percentage points in 2011. The remaining differences between the effective tax rates for 2013, 2012 and 2011 were primarily attributable to differences in the proportionate amounts of pre-tax income recognized in jurisdictions with different effective tax rates.
27
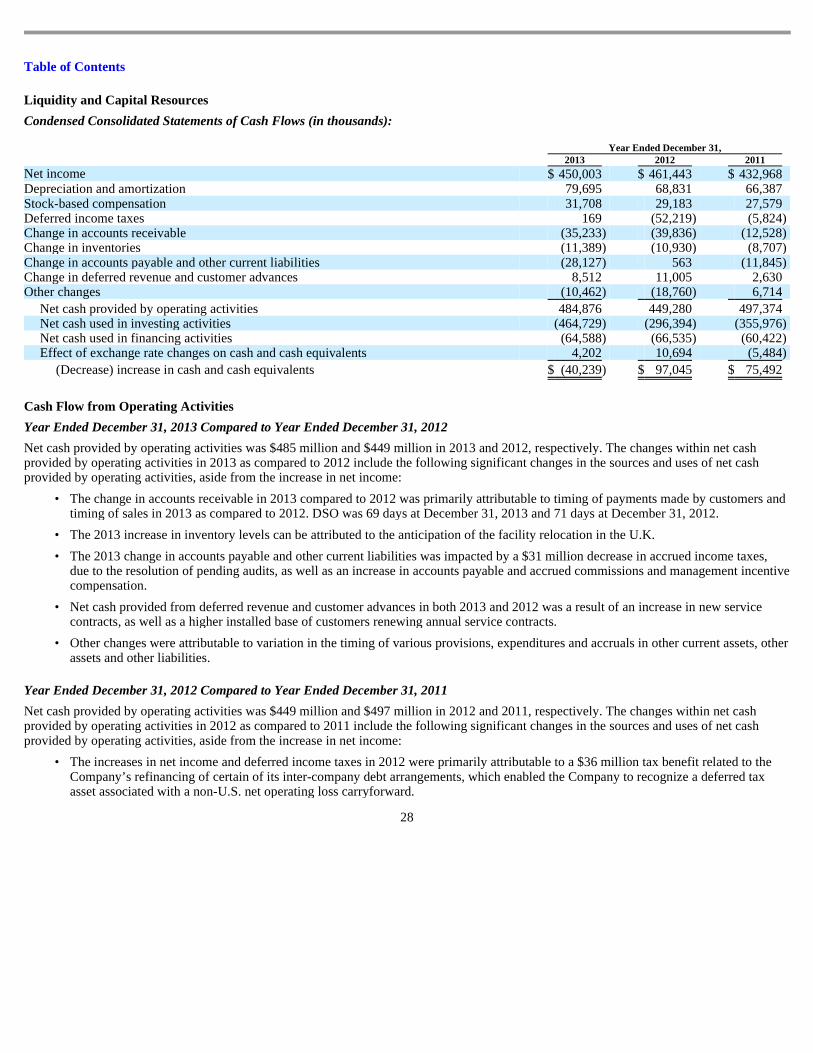
Table of Contents
Liquidity and Capital Resources
Condensed Consolidated Statements of Cash Flows (in thousands):
Cash Flow from Operating Activities
Year Ended December 31, 2013 Compared to Year Ended December 31, 2012
Net cash provided by operating activities was $485 million and $449 million in 2013 and 2012, respectively. The changes within net cash provided by operating activities in 2013 as compared to 2012 include the following significant changes in the sources and uses of net cash provided by operating activities, aside from the increase in net income:
Year Ended December 31, 2012 Compared to Year Ended December 31, 2011
Net cash provided by operating activities was $449 million and $497 million in 2012 and 2011, respectively. The changes within net cash provided by operating activities in 2012 as compared to 2011 include the following significant changes in the sources and uses of net cash provided by operating activities, aside from the increase in net income:
28
Year Ended December 31, 2013 2012 2011
Net income $ 450,003 $ 461,443 $ 432,968 Depreciation and amortization 79,695 68,831 66,387 Stock-based compensation 31,708 29,183 27,579 Deferred income taxes 169 (52,219 ) (5,824 ) Change in accounts receivable (35,233 ) (39,836 ) (12,528 ) Change in inventories (11,389 ) (10,930 ) (8,707 ) Change in accounts payable and other current liabilities (28,127 ) 563 (11,845 ) Change in deferred revenue and customer advances 8,512 11,005 2,630 Other changes (10,462 ) (18,760 ) 6,714
Net cash provided by operating activities 484,876 449,280 497,374 Net cash used in investing activities (464,729 ) (296,394 ) (355,976 ) Net cash used in financing activities (64,588 ) (66,535 ) (60,422 ) Effect of exchange rate changes on cash and cash equivalents 4,202 10,694 (5,484 )
(Decrease) increase in cash and cash equivalents $ (40,239 ) $ 97,045 $ 75,492
• The change in accounts receivable in 2013 compared to 2012 was primarily attributable to timing of payments made by customers and
timing of sales in 2013 as compared to 2012. DSO was 69 days at December 31, 2013 and 71 days at December 31, 2012. • The 2013 increase in inventory levels can be attributed to the anticipation of the facility relocation in the U.K.
• The 2013 change in accounts payable and other current liabilities was impacted by a $31 million decrease in accrued income taxes,
due to the resolution of pending audits, as well as an increase in accounts payable and accrued commissions and management incentive compensation.
• Net cash provided from deferred revenue and customer advances in both 2013 and 2012 was a result of an increase in new service
contracts, as well as a higher installed base of customers renewing annual service contracts.
• Other changes were attributable to variation in the timing of various provisions, expenditures and accruals in other current assets, other
assets and other liabilities.
• The increases in net income and deferred income taxes in 2012 were primarily attributable to a $36 million tax benefit related to the
Company’s refinancing of certain of its inter-company debt arrangements, which enabled the Company to recognize a deferred tax asset associated with a non-U.S. net operating loss carryforward.

Table of Contents
Cash Used in Investing Activities
Net cash used in investing activities totaled $465 million, $296 million and $356 million in 2013, 2012 and 2011, respectively. Additions to fixed assets and capitalized software were $118 million, $105 million and $85 million in 2013, 2012 and 2011, respectively. Capital expenditures in 2013, 2012 and 2011 included multi-year construction projects. The construction of the new research, manufacturing and distribution facility in Wilmslow, England was completed in early 2014 and the Company is in the process of consolidating and moving its Cheshire and Manchester facilities to this new location. As of December 31, 2013, the Company has spent a total of $78 million related to this project.
During 2013, 2012 and 2011, the Company purchased $3.0 billion, $1.8 billion and $1.7 billion of investments, respectively, while $2.7 billion, $1.7 billion and $1.5 billion of investments matured, respectively. Business acquisitions, net of cash acquired, were $41 million, $31 million and $11 million during 2013, 2012 and 2011, respectively.
Cash Used in Financing Activities
In June 2013, the Company entered into the 2013 Credit Agreement that provides for a $1.1 billion revolving facility and a $300 million term loan facility. The revolving facility and term loan facility both mature on June 25, 2018 and require no scheduled prepayments before that date. The Company used $860 million of the proceeds from the 2013 Credit Agreement to repay the outstanding amounts under the 2011 Credit Agreement, which was terminated early and without penalty.
The interest rates applicable to the 2013 Credit Agreement are, at the Company’s option, equal to either the alternate base rate calculated daily (which is a rate per annum equal to the greatest of (a) the prime rate in effect on such day, (b) the federal funds effective rate in effect on such day plus 1/2% per annum, or (c) the adjusted LIBO rate on such day (or if such day is not a business day, the immediately preceding business day) for a deposit in U.S. dollars with a maturity of one month plus 1% per annum) or the applicable 1, 2, 3 or 6 month adjusted LIBO rate, in each case, plus an interest rate margin based upon the Company’s leverage ratio, which can range between 0 to 12.5 basis points for alternate base rate loans and between 75 basis points and 112.5 basis points for adjusted LIBO rate loans. The facility fee on the 2013 Credit Agreement ranges between 12.5 basis points and 25 basis points. The 2013 Credit Agreement requires that the Company comply with an interest coverage ratio test of not less than 3.50:1 as of the end of any fiscal quarter for any period of four consecutive fiscal quarters and a leverage ratio test of not more than 3.50:1 as of the end of any fiscal quarter. In addition, the 2013 Credit Agreement includes negative covenants, affirmative covenants, representations and warranties and events of default that are customary for investment grade credit facilities. As of December 31, 2013, the Company was in compliance with all such covenants.
29
• The change in accounts receivable in 2012 compared to 2011 was primarily attributable to timing of payments made by customers and
timing of sales in 2012 as compared to 2011. DSO was 71 days at December 31, 2012 and 64 days at December 31, 2011.
• The 2012 change in inventories was primarily attributable to the increase in inventory related to new products expected to be launched
in 2013.
• The 2012 change in accounts payable and other current liabilities was impacted by an increase in accrued income taxes, which was offset by higher U.S. tax payments. In addition, accounts payable and other current liabilities was impacted by lower levels of incentive compensation earned in 2012 as compared to 2011, as well as the payment of the 2011 incentive compensation in 2012 and timing of payments to vendors.
• Net cash provided from deferred revenue and customer advances in both 2012 and 2011 was a result of an increase in new service
contracts, as well as a higher installed base of customers renewing annual service contracts.
• Other changes were attributable to variation in the timing of various provisions, expenditures and accruals in other current assets, other
assets and other liabilities.

Table of Contents
The Company issued and sold senior unsecured notes with a face value of $200 million in 2011. Interest on the senior unsecured notes is payable semi-annually each year. The Company may prepay all or some of the senior unsecured notes at any time in an amount not less than 10% of the aggregate principal amount outstanding, plus the applicable make-whole amount. These senior unsecured notes require that the Company comply with an interest coverage ratio test of not less than 3.50:1 for any period of four consecutive fiscal quarters and a leverage ratio test of not more than 3.50:1 as of the end of any fiscal quarter. In addition, these senior unsecured notes include customary negative covenants, affirmative covenants, representations and warranties and events of default. As of December 31, 2013, the Company was in compliance with all such covenants.
During 2013, 2012 and 2011, the Company’s net debt borrowings increased by $146 million, $186 million and $225 million, respectively. As of December 31, 2013, the Company had a total of $1,323 million in outstanding debt, which consisted of $400 million in outstanding senior unsecured notes, $300 million borrowed under a term loan facility under the 2013 Credit Agreement, $615 million borrowed under revolving credit facility under the 2013 Credit Agreement and $8 million borrowed under various other short-term lines of credit. At December 31, 2013, $125 million of the outstanding portions of the revolving facilities have been classified as short-term liabilities in the consolidated balance sheet due to the fact that the Company expects to utilize this portion of the revolving line of credit to fund its working capital needs within the next twelve months. It is the Company’s intention to repay the short-term portions of the outstanding revolving line of credit balance during the subsequent twelve months following the respective period end date. The remaining $490 million of the outstanding portions of the revolving facilities have been classified as long-term liabilities in the consolidated balance sheet, as no repayments are required prior to the maturity date in 2018 and this portion is not expected to be repaid within the next twelve months. As of December 31, 2013, the Company had a total amount available to borrow under existing credit agreements of $483 million after outstanding letters of credit.
In May 2012, the Company’s Board of Directors authorized the Company to repurchase up to $750 million of its outstanding common stock over a two-year period. During 2013, 2012 and 2011, the Company repurchased 3.1 million, 3.5 million and 4.5 million shares at a cost of $295 million, $290 million and $364 million, respectively, under the May 2012 authorization and other previously announced programs. As of December 31, 2013, the Company had purchased an aggregate of 4.3 million shares at a cost of $402 million under the May 2012 repurchase program, leaving $348 million authorized for future repurchases. In addition, the Company repurchased $6 million of common stock related to the vesting of restricted stock units during each of the years ended December 31, 2013, 2012 and 2011.
The Company received $69 million, $29 million and $60 million of proceeds from the exercise of stock options and the purchase of shares pursuant to the Company’s employee stock purchase plan in 2013, 2012 and 2011, respectively.
The Company had cash, cash equivalents and investments of $1,804 million as of December 31, 2013. The majority of the Company’s cash, cash equivalents and investments are generated from foreign operations, with $1,738 million held by foreign subsidiaries at December 31, 2013. Due to the fact that most of the Company’s cash, cash equivalents and investments are held outside of the U.S., the Company must manage and maintain sufficient levels of cash flow in the U.S. to fund operations and capital expenditures, service debt interest, finance potential U.S. acquisitions and continue the authorized stock repurchase program in the U.S. These U.S. cash requirements are managed by the Company’s cash flow from U.S. operations and the use of the Company’s revolving credit facilities.
Management believes, as of the date of this report, that its financial position, particularly in the U.S., along with expected future cash flows from earnings based on historical trends and the ability to raise funds from external sources and the borrowing capacity from existing, committed credit facilities, will be sufficient to service debt and fund working capital and capital spending requirements, authorized share repurchase amounts and potential acquisitions. In addition, there have been no recent significant changes to the Company’s financial position, nor are there any anticipated changes, to warrant a material adjustment related to indefinitely reinvested foreign earnings.
30

Table of Contents
Contractual Obligations and Commercial Commitments
The following is a summary of the Company’s known contractual obligations as of December 31, 2013 (in thousands):
The interest rates applicable to the 2013 Credit Agreement are, at the Company’s option, equal to either the alternate base rate calculated daily (which is a rate per annum equal to the greatest of (a) the prime rate in effect on such day, (b) the federal funds effective rate in effect on such day plus 1/2% per annum, or (c) the adjusted LIBO rate on such day (or if such day is not a business day, the immediately preceding business day) for a deposit in U.S. dollars with a maturity of one month plus 1% per annum) or the applicable 1, 2, 3 or 6 month adjusted LIBO rate, in each case, plus an interest rate margin based upon the Company’s leverage ratio, which can range between 0 to 12.5 basis points for alternate base rate loans and between 75 basis points and 112.5 basis points for adjusted LIBO rate loans. The facility fee on the 2013 Credit Agreement ranges between 12.5 basis points and 25 basis points. The 2013 Credit Agreement requires that the Company comply with an interest coverage ratio test of not less than 3.50:1 as of the end of any fiscal quarter for any period of four consecutive fiscal quarters and a leverage ratio test of not more than 3.50:1 as of the end of any fiscal quarter. In addition, the 2013 Credit Agreement includes negative covenants, affirmative covenants, representations and warranties and events of default that are customary for investment grade credit facilities. As of December 31, 2013, the Company was in compliance with all such covenants.
The following is a summary of the Company’s known commercial commitments as of December 31, 2013 (in thousands):
The Company licenses certain technology and software from third parties. Future minimum license fees payable under existing license agreements as of December 31, 2013 are immaterial.
From time to time, the Company and its subsidiaries are involved in various litigation matters arising in the ordinary course of business. The Company believes it has meritorious arguments in its current litigation matters and believes any outcome, either individually or in the aggregate, will not be material to the Company’s financial position or results of operations. See Item 3, Legal Proceedings, of Part I of this Form 10-K.
The Company has long-term liabilities for deferred employee compensation, including pension and supplemental executive retirement plans. The payments related to the supplemental retirement plan are not included above since they are dependent upon when the employee retires or leaves the Company and whether the employee elects lump-sum or annuity payments. During fiscal year 2014, the Company expects to contribute approximately $8 million to $10 million to the Company’s defined benefit plans.
31
Payments Due by Year (1) Total 2014 2015 2016 2017 2018 2019 After 2019 Notes payable and debt $ 133,346 $ 133,346 $ — $ — $ — $ — $ — $ — Interest on senior unsecured notes 65,516 15,205 11,768 10,465 10,205 7,656 6,985 3,232 Long-term debt 1,190,000 — 100,000 50,000 — 890,000 — 150,000 Operating leases 78,432 23,668 17,953 11,475 7,276 5,260 4,315 8,485
Total $ 1,467,294 $ 172,219 $ 129,721 $ 71,940 $ 17,481 $ 902,916 $ 11,300 $ 161,717
(1) Does not include normal purchases made in the ordinary course of business and uncertain tax positions discussed below.
Amount of Commitments Expiration Per Period Total 2014 2015 2016 2017 2018 2019 After 2019
Letters of credit $ 1,513 $ 1,513 $— $— $— $— $— $—

Table of Contents
The Company accounts for its uncertain tax return reporting positions in accordance with the accounting standards for income taxes, which require financial statement reporting of the expected future tax consequences of uncertain tax return reporting positions on the presumption that all concerned tax authorities possess full knowledge of those tax reporting positions, as well as all of the pertinent facts and circumstances, but prohibit any discounting of those unrecognized tax benefits associated with those reporting positions for the time value of money. If all of the Company’s unrecognized tax benefits accrued as of December 31, 2013 were to become recognizable in the future, the Company would record a total reduction of approximately $25 million in its income tax provision.
The Company’s uncertain tax positions are taken with respect to income tax return reporting periods beginning after December 31, 2007, which are the periods that generally remain open to income tax audit examination by income tax authorities. The Company continuously monitors the lapsing of statutes of limitations on potential tax assessments for related changes in the measurement of unrecognized tax benefits, related net interest and penalties, and deferred tax assets and liabilities.
During the year ended December 31, 2013, the Company concluded tax audit disputes with tax authorities in the U.S. and Japan that were related to matters for which the Company had previously recorded uncertain tax benefits of approximately $35 million. The resolution of these tax audit disputes also entailed net global assessments against the Company of approximately $4 million. Accordingly, the Company recorded a $35 million reduction in the measurement of its unrecognized tax benefits and a $4 million increase in its current tax liabilities in the year ended December 31, 2013, which reduced the provision for income taxes and increased net income for the year ended December 31, 2013 by $31 million. As of December 31, 2013, the Company expects to record additional reductions in the measurement of its unrecognized tax benefits and related net interest and penalties of approximately $6 million within the next twelve months due to the lapsing of statutes of limitations on potential tax assessments. The Company does not expect to record any other material reductions in the measurement of its unrecognized tax benefits within the next twelve months.
The Company has not paid any dividends and has no plans, at this time, to pay any dividends in the future.
Off-Balance Sheet Arrangements
The Company has not created, and is not party to, any special-purpose or off-balance sheet entities for the purpose of raising capital, incurring debt or operating parts of its business that are not consolidated (to the extent of the Company’s ownership interest therein) into the consolidated financial statements. The Company has not entered into any transactions with unconsolidated entities whereby it has subordinated retained interests, derivative instruments or other contingent arrangements that expose the Company to material continuing risks, contingent liabilities or any other obligation under a variable interest in an unconsolidated entity that provides financing, liquidity, market risk or credit risk support to the Company.
The Company enters into standard indemnification agreements in its ordinary course of business. Pursuant to these agreements, the Company indemnifies, holds harmless and agrees to reimburse the indemnified party for losses suffered or incurred by the indemnified party, generally the Company’s business partners or customers, in connection with patent, copyright or other intellectual property infringement claims by any third party with respect to its current products, as well as claims relating to property damage or personal injury resulting from the performance of services by the Company or its subcontractors. The maximum potential amount of future payments the Company could be required to make under these indemnification agreements is unlimited. Historically, the Company’s costs to defend lawsuits or settle claims relating to such indemnity agreements have been minimal and management accordingly believes the estimated fair value of these agreements is immaterial.
32

Table of Contents
Critical Accounting Policies and Estimates
Summary The preparation of consolidated financial statements requires the Company to make estimates and judgments that affect the reported amounts of assets, liabilities, revenues and expenses, and related disclosure of contingent liabilities. Critical accounting policies are those that are central to the presentation of the Company’s financial condition and results of operations that require management to make estimates about matters that are highly uncertain and that would have a material impact on the Company’s results of operations given changes in the estimate that are reasonably likely to occur from period to period or use of different estimates that reasonably could have been used in the current period. On an ongoing basis, the Company evaluates its policies and estimates. The Company bases its estimates on historical experience and on various other assumptions that are believed to be reasonable under the circumstances, the results of which form the basis for making judgments about the carrying values of assets and liabilities that are not readily apparent from other sources. Actual amounts may differ from these estimates under different assumptions or conditions. There are other items within the Company’s consolidated financial statements that require estimation, but are not deemed critical as defined above. Changes in estimates used in these and other items could potentially have a material impact on the Company’s consolidated financial statements.
Revenue Recognition Sales of products and services are generally recorded based on product shipment and performance of service, respectively. The Company’s deferred revenue on the consolidated balance sheets consists of the obligation on instrument service contracts and customer payments received in advance, prior to shipment of the instrument. At December 31, 2013, the Company had current and long-term deferred revenue liabilities of $128 million and $21 million, respectively. Revenue is recognized when all of the following revenue recognition criteria are met: persuasive evidence of an arrangement exists; delivery or performance has occurred; the vendor’s fee is fixed or determinable; collectibility is reasonably assured and, if applicable, upon acceptance when acceptance criteria with contractual cash holdback are specified. Shipping and handling costs are included in cost of sales, net of amounts invoiced to the customer per the order.
Product shipments, including those for demonstration or evaluation, and service contracts are not recorded as revenues until a valid purchase order or master agreement is received, specifying fixed terms and prices. The Company generally recognizes product revenue when legal title has transferred and risk of loss passes to the customer. The Company structures its sales arrangements as shipping point or international equivalent and, accordingly, recognizes revenue upon shipment. In some cases, destination-based shipping terms are included in sales arrangements, in which cases revenue is generally recognized when the products arrive at the customer site.
The Company’s method of revenue recognition for certain products requiring installation is accounted for in accordance with multiple-element revenue recognition accounting standards. With respect to the installation obligations, the larger of the contractual cash holdback or the best estimate of selling price of the installation service is deferred when the product is shipped and revenue is recognized as a multiple-element arrangement when installation is complete. The Company determines the best estimate of selling price of installation based upon a number of factors, including hourly service billing rates and estimated installation hours.
Instrument service contracts are typically billed at the beginning of the maintenance period. The amount of the service contract is amortized ratably to revenue over the instrument maintenance period. There are no deferred costs associated with the service contract, as the cost of the service is recorded when the service is performed. No revenue is recognized until all revenue recognition criteria have been met.
Sales of software are accounted for in accordance with the accounting standards for software revenue recognition. The Company’s software arrangements typically include software licenses and maintenance contracts. Software license revenue is recognized when persuasive evidence of an arrangement exists, delivery has occurred, the fee is fixed or determinable, collection is probable, and there are no significant post-delivery obligations remaining. The revenue associated with the software maintenance contract is recognized ratably over
33

Table of Contents
the maintenance term. Unspecified rights to software upgrades are typically sold as part of the maintenance contract on a when-and-if-available basis. The Company uses the residual method to allocate software revenue when a transaction includes multiple elements and vendor specific objective evidence of fair value of undelivered elements exists. Under the residual method, the fair value of the undelivered element (maintenance) is deferred and the remaining portion of the arrangement fee is allocated to the delivered element (software license) and is recognized as revenue.
Loss Provisions on Accounts Receivable and Inventory The Company maintains allowances for doubtful accounts for estimated losses resulting from the inability of its customers to make required payments. If the financial condition of the Company’s customers were to deteriorate, resulting in an impairment of their ability to make payments, additional allowances may be required. The Company does not request collateral from its customers, but collectibility is enhanced through the use of credit card payments and letters of credit. The Company assesses collectibility based on a number of factors, including, but not limited to, past transaction history with the customer, the credit-worthiness of the customer, industry trends and the macro-economic environment. Historically, the Company has not experienced significant bad debt losses. Sales returns and allowances are estimates of future product returns related to current period revenue. Material differences may result in the amount and timing of revenue for any period if management made different judgments or utilized different estimates for sales returns and allowances for doubtful accounts. The Company’s accounts receivable balance at December 31, 2013 was $431 million, net of allowances for doubtful accounts and sales returns of $7 million.
The Company values all of its inventories at the lower of cost or market on a first-in, first-out basis (“FIFO”). The Company estimates revisions to its inventory valuations based on technical obsolescence, historical demand, projections of future demand, including that in the Company’s current backlog of orders, and industry and market conditions. If actual future demand or market conditions are less favorable than those projected by management, additional write-downs may be required. The Company’s inventory balance at December 31, 2013 was recorded at its net realizable value of $243 million, which is net of write-downs of $18 million.
Long-Lived Assets, Intangible Assets and Goodwill The Company assesses the impairment of identifiable intangibles, long-lived assets and goodwill whenever events or changes in circumstances indicate that the carrying value may not be recoverable. Factors the Company considers important which could trigger impairment include, but are not limited to, the following:
When the Company determines that the carrying value of an individual intangible asset, long-lived asset or goodwill may not be recoverable based upon the existence of one or more of the above indicators, an estimate of undiscounted future cash flows produced by that intangible asset, long-lived asset or goodwill, including its eventual residual value, is compared to the carrying value to determine whether impairment exists. In the event that such cash flows are not expected to be sufficient to recover the carrying amount of the asset, the asset is written-down to its estimated fair value. Net intangible assets, long-lived assets and goodwill amounted to $239 million, $325 million and $350 million, respectively, as of December 31, 2013.
The Company performs annual impairment reviews of its goodwill on January 1 of each year. For goodwill impairment review purposes, the Company has two reporting units, the Waters Division and TA Division. The
34
• significant underperformance relative to historical or projected future operating results, particularly as it pertains to capitalized
software and patent costs; • significant negative industry or economic trends, competitive products and technologies; and
• significant changes or developments in strategic technological collaborations or legal matters which affect the Company’s capitalized
patents, purchased technology, trademarks and intellectual properties, such as licenses.

Table of Contents
Company currently does not expect to record an impairment charge in the foreseeable future; however, there can be no assurance that, at the time future reviews are completed, a material impairment charge will not be recorded. The factors that could cause a material goodwill impairment charge in the future include, but are not limited to, the following:
Warranty Product warranties are recorded at the time revenue is recognized for certain product shipments. While the Company engages in extensive product quality programs and processes, including actively monitoring and evaluating the quality of its component suppliers, the Company’s warranty obligation is affected by product failure rates, material usage and service delivery costs incurred in correcting a product failure. Should actual product failure rates, material usage or service delivery costs differ from the Company’s previous estimates, revisions to the estimated warranty liability would be required. At December 31, 2013, the Company’s warranty liability was $13 million.
Income Taxes As part of the process of preparing the consolidated financial statements, the Company is required to estimate its income taxes in each of the jurisdictions in which it operates. This process involves the Company estimating its actual current tax exposure together with assessing changes in temporary differences resulting from differing treatment of items, such as depreciation, amortization and inventory reserves, for tax and accounting purposes. These differences result in deferred tax assets and liabilities, which are included within the consolidated balance sheets. In the event that actual results differ from these estimates, or the Company adjusts these estimates in future periods, the Company may need to establish an additional valuation allowance, which could materially impact its financial position and results of operations.
The accounting standards for income taxes require that a company continually evaluate the necessity of establishing or changing a valuation allowance for deferred tax assets, depending on whether it is more likely than not that the actual benefit of those assets will be realized in future periods. In addition, the Company accounts for its uncertain tax return reporting positions in accordance with the accounting standards for income taxes, which require financial statement reporting of the expected future tax consequences of uncertain tax return reporting positions on the presumption that all concerned tax authorities possess full knowledge of those tax reporting positions, as well as all of the pertinent facts and circumstances, but prohibit any discounting of those unrecognized tax benefits associated with those tax reporting positions for the time value of money. At December 31, 2013, the Company had unrecognized tax benefits of $25 million.
Litigation As described in Item 3, Legal Proceedings, of Part I of this Form 10-K, the Company is a party to various pending litigation matters. With respect to each pending claim, management determines whether it can reasonably estimate whether a loss is probable and, if so, the probable range of that loss. If and when management has determined, with respect to a particular claim, both that a loss is probable and that it can reasonably estimate the range of that loss, the Company records a charge equal to either its best estimate of that loss or the lowest amount in that probable range of loss. The Company will disclose additional exposures when the range of loss is subject to considerable uncertainty.
35
• significant decline in the Company’s projected revenue, earnings or cash flows; • significant adverse change in legal factors or business climate; • significant decline in the Company’s stock price or the stock price of comparable companies; • adverse action or assessment by a regulator; and • unanticipated competition.

Table of Contents
With respect to the specific claims referenced in Item 3, Legal Proceedings, of Part I of this Form 10-K, management of the Company to date has been able to make this determination and thus has recorded charges with respect to those claims. As developments occur in these matters and additional information becomes available, management of the Company will reassess the probability of any losses and of their range, which may result in its recording additional charges, which could materially impact the Company’s results of operations or financial position.
Pension and Other Retirement Benefits Assumptions used in determining projected benefit obligations and the fair values of plan assets for the Company’s pension plans and other retirement benefits are evaluated periodically by management. Changes in assumptions are based on relevant Company data. Critical assumptions, such as the discount rate used to measure the benefit obligations and the expected long-term rate of return on plan assets, are evaluated and updated annually. The Company has assumed that the weighted-average expected long-term rate of return on plan assets will be 6.94% for its U.S. benefit plans and 2.40% for its non-U.S. benefit plans.
At the end of each year, the Company determines the discount rate that reflects the current rate at which the pension liabilities could be effectively settled. The Company determined the discount rate based on the analysis of the Mercer Pension Discount Curve for high quality investments as of December 31, 2013 that best matched the timing of the plan’s future cash flows for the period to maturity of the pension benefits. Once the interest rates were determined, the plan’s cash flow was discounted at the spot interest rate back to the measurement date. At December 31, 2013, the Company determined the weighted-average discount rate to be 4.82% for the U.S. benefit plans and 3.29% for the non-U.S. benefits plans.
A one-quarter percentage point increase in the assumed long-term rate of return would decrease the Company’s net periodic benefit cost for the Waters Retirement Plan by less than $1 million. A one-quarter percentage point increase in the discount rate would decrease the Company’s net periodic benefit cost for the Waters Retirement Plan by less than $1 million.
Stock-based Compensation The accounting standards for stock-based compensation require that all share-based payments to employees be recognized in the statements of operations based on their fair values. The Company has used the Black-Scholes option pricing model to determine the fair value of its stock option awards. Under the fair-value recognition provisions of this statement, share-based compensation cost is measured at the grant date based on the value of the award and is recognized as expense over the vesting period. Determining the fair value of share-based awards at the grant date requires judgment, including estimating stock price volatility and employee stock option exercise behaviors. If actual results differ significantly from these estimates, stock-based compensation expense and the Company’s results of operations could be materially impacted. As stock-based compensation expense recognized in the consolidated statements of operations is based on awards that ultimately are expected to vest, the amount of the expense has been reduced for estimated forfeitures. These accounting standards require forfeitures to be estimated at the time of grant and revised, if necessary, in subsequent periods if actual forfeitures differ from those estimates. Forfeitures are estimated based on historical experience. If factors change and the Company employs different assumptions in the application of these accounting standards, the compensation expense that the Company records in future periods may differ significantly from what the Company has recorded in the current period. The Company recognizes the expense using the straight-line attribution method.
36

Table of Contents
As of December 31, 2013, unrecognized compensation costs and related weighted-average lives over which the costs will be amortized were as follows (in millions):
Recent Accounting Standard Changes and Developments
Information regarding recent accounting standard changes and developments is incorporated by reference from Part II, Item 8, Financial Statements and Supplementary Data, of this document and should be considered an integral part of this Item 7. See Note 2 in the Notes to the Consolidated Financial Statements for recently adopted and issued accounting standards.
Item 7A: Quantitative and Qualitative Disclosures About Market Risk
The Company operates on a global basis and is exposed to the risk that its earnings, cash flows and stockholders’ equity could be adversely impacted by fluctuations in currency exchange rates. The Company attempts to minimize its exposures by using certain financial instruments, for purposes other than trading, in accordance with the Company’s overall risk management guidelines.
The Company is primarily exposed to currency exchange-rate risk with respect to certain inter-company balances, forecasted transactions and cash flow, and net assets denominated in Euros, Japanese yen, British pounds and Singapore dollars. The Company manages its foreign currency exposures on a consolidated basis, which allows the Company to analyze exposures globally and take into account offsetting exposures in certain balances. In addition, the Company utilizes derivative and non-derivative financial instruments to further reduce the net exposure to currency fluctuations.
Derivative Transactions The Company records its derivative transactions in accordance with the accounting standards for derivative instruments and hedging activities, which establish the accounting and reporting standards for derivative instruments, including certain derivative instruments embedded in other contracts, and for hedging activities. All derivatives, whether designated in hedging relationships or not, are required to be recorded on the consolidated balance sheets at fair value as either assets or liabilities. If the derivative is designated as a fair-value hedge, the changes in the fair value of the derivative and of the hedged item attributable to the hedged risk are recognized in earnings. If the derivative is designated as a cash flow hedge, the effective portions of changes in the fair value of the derivative are recorded in other comprehensive income and are recognized in earnings when the hedged item affects earnings; ineffective portions of changes in fair value are recognized in earnings. In addition, disclosures required for derivative instruments and hedging activities include the Company’s objectives for using derivative instruments, the level of derivative activity the Company engages in, as well as how derivative instruments and related hedged items affect the Company’s financial position and performance.
The Company currently uses derivative instruments to manage exposures to foreign currency risks. The Company’s objectives for holding derivatives are to minimize foreign currency risk using the most effective methods to eliminate or reduce the impact of foreign currency exposures. The Company documents all relationships between hedging instruments and hedged items and links all derivatives designated as fair value, cash flow or net investment hedges to specific assets and liabilities on the consolidated balance sheets or to specific forecasted transactions. In addition, the Company considers the impact of its counterparties’ credit risk
37
Unrecognized Compensation
Costs
Weighted-Average
Life in Years
Stock options $ 41 3.5 Restricted stock units 42 3.7 Restricted stock <1 0.9
Total $ 83 3.6

Table of Contents
on the fair value of the contracts as well as the ability of each party to execute under the contracts. The Company also assesses and documents, both at the hedges’ inception and on an ongoing basis, whether the derivatives that are used in hedging transactions are highly effective in offsetting changes in fair values or cash flows associated with the hedged items.
The Company enters into forward foreign exchange contracts, principally to hedge the impact of currency fluctuations on certain inter-company balances and short-term assets and liabilities. Principal hedged currencies include the Euro, Japanese yen, British pound and Singapore dollar. The periods of these forward contracts typically range from one to three months and have varying notional amounts, which are intended to be consistent with changes in the underlying exposures. Gains and losses on these forward contracts are recorded in cost of sales in the consolidated statements of operations. At December 31, 2013, 2012 and 2011, the Company held forward foreign exchange contracts with notional amounts totaling $104 million, $134 million and $161 million, respectively.
The Company’s foreign currency exchange contracts included in the consolidated balance sheets are classified as follows (in thousands):
The following is a summary of the activity in the statements of operations related to the forward foreign exchange contracts (in thousands):
Assuming a hypothetical adverse change of 10% in year-end exchange rates (a strengthening of the U.S. dollar), the fair market value of the forward contracts outstanding as of December 31, 2013 would decrease pre-tax earnings by approximately $10 million.
The Company is exposed to the risk of interest rate fluctuations from the investments of cash generated from operations. The Company’s cash equivalents represent highly liquid investments, with original maturities of 90 days or less, primarily in bank deposits, U.S. and U.K. treasury bill money market funds and commercial paper. Investments with longer maturities are classified as investments, and are held primarily in U.S. treasury bills, Canadian government U.S. dollar-denominated treasury bills and commercial paper, bank deposits and corporate debt securities. The Company maintains cash balances in various operating accounts in excess of federally insured limits, and in foreign subsidiary accounts in currencies other than U.S. dollars. As of December 31, 2013 and December 31, 2012, $1,738 million out of $1,804 million and $1,489 million out of $1,539 million, respectively, of the Company’s total cash, cash equivalents and investments were held by foreign subsidiaries and may be subject to material tax effects on distribution to U.S. legal entities. As of December 31, 2013, the Company has no holdings in auction rate securities or commercial paper issued by structured investment vehicles.
The Company’s cash, cash equivalents and investments are not subject to significant interest rate risk due to the short maturities of these instruments. As of December 31, 2013, the carrying value of the Company’s cash and cash equivalents approximated fair value.
38
December 31,
2013
December 31,
2012
Other current assets $ 929 $ 1,173 Other current liabilities $ 88 $ 693
Year Ended December 31, 2013 2012 2011
Realized gains (losses) on closed contracts $ 8,666 $ 4,186 $ (2,233 ) Unrealized gains (losses) on open contracts 361 1,716 (1,035 )
Cumulative net pre-tax gains (losses) $ 9,027 $ 5,902 $ (3,268 )

Table of Contents
Item 8: Financial Statements and Supplementary Data
Management’s Report on Internal Control Over Financial Reporting
Our management is responsible for establishing and maintaining adequate internal control over financial reporting, as such term is defined in Rules 13a-15(f) or 15d-15(f) under the Exchange Act. Because of its inherent limitations, internal control over financial reporting may not prevent or detect misstatements. Also, projections of any evaluation of effectiveness to future periods are subject to the risk that controls may become inadequate because of changes in conditions, or that the degree of compliance with the policies or procedures may deteriorate.
Under the supervision and with the participation of our management, including our chief executive officer and chief financial officer, we conducted an evaluation of the effectiveness of our internal control over financial reporting based on the framework in Internal Control — Integrated Framework 1992 issued by the Committee of Sponsoring Organizations of the Treadway Commission (COSO). Based on our evaluation under the framework in Internal Control — Integrated Framework 1992 , our management, including our chief executive officer and chief financial officer, concluded that our internal control over financial reporting was effective as of December 31, 2013.
The effectiveness of our internal control over financial reporting as of December 31, 2013 has been audited by PricewaterhouseCoopers LLP, an independent registered public accounting firm, as stated in their report which is included herein.
39

Table of Contents
Report of Independent Registered Public Accounting Firm
To the Board of Directors and Stockholders of Waters Corporation
In our opinion, the accompanying consolidated balance sheets and the related consolidated statements of operations, comprehensive income, stockholders’ equity, and cash flows present fairly, in all material respects, the financial position of Waters Corporation and its subsidiaries at December 31, 2013 and December 31, 2012 and the results of their operations and their cash flows for each of the three years in the period ended December 31, 2013 in conformity with accounting principles generally accepted in the United States of America. In addition, in our opinion, the financial statement schedule listed in the index appearing under Item 15(a)(2) presents fairly, in all material respects, the information set forth therein when read in conjunction with the related consolidated financial statements. Also in our opinion, the Company maintained, in all material respects, effective internal control over financial reporting as of December 31, 2013, based on criteria established in Internal Control — Integrated Framework 1992 issued by the Committee of Sponsoring Organizations of the Treadway Commission (COSO). The Company’s management is responsible for these financial statements and financial statement schedule, for maintaining effective internal control over financial reporting and for its assessment of the effectiveness of internal control over financial reporting, included in the accompanying Management’s Report on Internal Control over Financial Reporting. Our responsibility is to express opinions on these financial statements, on the financial statement schedule, and on the Company’s internal control over financial reporting based on our integrated audits. We conducted our audits in accordance with the standards of the Public Company Accounting Oversight Board (United States). Those standards require that we plan and perform the audits to obtain reasonable assurance about whether the financial statements are free of material misstatement and whether effective internal control over financial reporting was maintained in all material respects. Our audits of the financial statements included examining, on a test basis, evidence supporting the amounts and disclosures in the financial statements, assessing the accounting principles used and significant estimates made by management, and evaluating the overall financial statement presentation. Our audit of internal control over financial reporting included obtaining an understanding of internal control over financial reporting, assessing the risk that a material weakness exists, and testing and evaluating the design and operating effectiveness of internal control based on the assessed risk. Our audits also included performing such other procedures as we considered necessary in the circumstances. We believe that our audits provide a reasonable basis for our opinions.
A company’s internal control over financial reporting is a process designed to provide reasonable assurance regarding the reliability of financial reporting and the preparation of financial statements for external purposes in accordance with generally accepted accounting principles. A company’s internal control over financial reporting includes those policies and procedures that (i) pertain to the maintenance of records that, in reasonable detail, accurately and fairly reflect the transactions and dispositions of the assets of the company; (ii) provide reasonable assurance that transactions are recorded as necessary to permit preparation of financial statements in accordance with generally accepted accounting principles, and that receipts and expenditures of the company are being made only in accordance with authorizations of management and directors of the company; and (iii) provide reasonable assurance regarding prevention or timely detection of unauthorized acquisition, use, or disposition of the company’s assets that could have a material effect on the financial statements.
Because of its inherent limitations, internal control over financial reporting may not prevent or detect misstatements. Also, projections of any evaluation of effectiveness to future periods are subject to the risk that controls may become inadequate because of changes in conditions, or that the degree of compliance with the policies or procedures may deteriorate.
/s/ PricewaterhouseCoopers LLP
Boston, Massachusetts February 27, 2014
40

Table of Contents
WATERS CORPORATION AND SUBSIDIARIES
CONSOLIDATED BALANCE SHEETS
The accompanying notes are an integral part of the consolidated financial statements.
41
December 31, 2013 2012 (In thousands, except per share data)
ASSETS Current assets:
Cash and cash equivalents $ 440,796 $ 481,035 Investments 1,362,874 1,057,990 Accounts receivable, net 430,985 404,556 Inventories 242,800 229,565 Other current assets 78,800 84,580
Total current assets 2,556,255 2,257,726 Property, plant and equipment, net 324,932 273,279 Intangible assets, net 239,112 220,145 Goodwill 350,350 316,834 Other assets 111,980 100,166
Total assets $ 3,582,629 $ 3,168,150
LIABILITIES AND STOCKHOLDERS’ EQUITY Current liabilities:
Notes payable and debt $ 133,346 $ 132,781 Accounts payable 64,961 54,724 Accrued employee compensation 43,305 31,910 Deferred revenue and customer advances 128,056 121,470 Accrued income taxes 19,770 60,888 Accrued warranty 12,962 12,353 Other current liabilities 85,132 90,116
Total current liabilities 487,532 504,242 Long-term liabilities:
Long-term debt 1,190,000 1,045,000 Long-term portion of retirement benefits 74,723 101,225 Long-term income tax liabilities 25,436 24,772 Other long-term liabilities 41,765 25,554
Total long-term liabilities 1,331,924 1,196,551
Total liabilities 1,819,456 1,700,793 Commitments and contingencies (Notes 8, 9, 10, 11 and 14)
Stockholders’ equity:
Preferred stock, par value $0.01 per share, 5,000 shares authorized, none issued at December 31, 2013 and December 31, 2012 — —
Common stock, par value $0.01 per share, 400,000 shares authorized,
155,246 and 153,696 shares issued, 84,819 and 86,390 shares outstanding at December 31, 2013 and December 31, 2012, respectively 1,552 1,537
Additional paid-in capital 1,270,608 1,155,504 Retained earnings 3,962,893 3,512,890 Treasury stock, at cost, 70,427 and 67,306 shares at December 31, 2013 and December 31, 2012,
respectively (3,477,759 ) (3,176,179 ) Accumulated other comprehensive income (loss) 5,879 (26,395 )
Total stockholders’ equity 1,763,173 1,467,357
Total liabilities and stockholders’ equity $ 3,582,629 $ 3,168,150

Table of Contents
WATERS CORPORATION AND SUBSIDIARIES
CONSOLIDATED STATEMENTS OF OPERATIONS
The accompanying notes are an integral part of the consolidated financial statements.
42
Year Ended December 31, 2013 2012 2011 (In thousands, except per share data)
Product sales $ 1,312,503 $ 1,280,507 $ 1,322,136 Service sales 591,715 563,134 529,048
Total net sales 1,904,218 1,843,641 1,851,184 Cost of product sales 526,721 501,660 506,073 Cost of service sales 256,735 235,954 224,420
Total cost of sales 783,456 737,614 730,493
Gross profit 1,120,762 1,106,027 1,120,691 Selling and administrative expenses 492,965 477,270 490,011 Research and development expenses 100,536 96,004 92,347 Purchased intangibles amortization 9,918 13,829 9,733 Litigation provisions (Note 10) — 7,434 —
Operating income 517,343 511,490 528,600 Other expense (Note 3) (1,575 ) — — Interest expense (30,050 ) (28,073 ) (21,971 ) Interest income 4,387 4,208 2,623
Income from operations before income taxes 490,105 487,625 509,252 Provision for income taxes 40,102 26,182 76,284
Net income $ 450,003 $ 461,443 $ 432,968
Net income per basic common share $ 5.27 $ 5.25 $ 4.77 Weighted-average number of basic common shares 85,426 87,841 90,833 Net income per diluted common share $ 5.20 $ 5.19 $ 4.69 Weighted-average number of diluted common shares and equivalents 86,546 88,979 92,325

Table of Contents
WATERS CORPORATION AND SUBSIDIARIES
CONSOLIDATED STATEMENTS OF COMPREHENSIVE INCOME
The accompanying notes are an integral part of the consolidated financial statements.
43
Year Ended December 31, 2013 2012 2011 (In thousands)
Net income $ 450,003 $ 461,443 $ 432,968 Other comprehensive income (loss):
Foreign currency translation 11,843 17,279 (12,644 ) Unrealized gains (losses) on investments before reclassifications 134 (27 ) (1,604 ) Amounts reclassified to other expense 1,575 — — Amounts reclassified to selling and administrative expenses — (968 ) 2,570
Unrealized gains (losses) on investments before income taxes 1,709 (995 ) 966 Income tax (expense) benefit (639 ) 348 (339 )
Unrealized gains (losses) on investments, net of tax 1,070 (647 ) 627 Retirement liability adjustment before reclassifications 27,888 (14,147 ) (20,511 ) Amounts reclassified to selling and administrative expenses 3,678 3,055 1,676
Retirement liability adjustment 31,566 (11,092 ) (18,835 ) Income tax (expense) benefit (12,205 ) 4,120 6,592
Retirement liability adjustment, net of tax 19,361 (6,972 ) (12,243 ) Other comprehensive income (loss) 32,274 9,660 (24,260 )
Comprehensive income $ 482,277 $ 471,103 $ 408,708

Table of Contents
WATERS CORPORATION AND SUBSIDIARIES
CONSOLIDATED STATEMENTS OF CASH FLOWS
The accompanying notes are an integral part of the consolidated financial statements.
44
Year Ended December 31, 2013 2012 2011 (In thousands)
Cash flows from operating activities: Net income $ 450,003 $ 461,443 $ 432,968 Adjustments to reconcile net income to net cash provided by operating
activities:
Provisions for doubtful accounts on accounts receivable 3,656 2,256 3,265 Stock-based compensation 31,708 29,183 27,579 Deferred income taxes 169 (52,219 ) (5,824 ) Depreciation 38,165 37,422 36,531 Amortization of intangibles 41,530 31,409 29,856
Change in operating assets and liabilities, net of acquisitions:
Increase in accounts receivable (35,233 ) (39,836 ) (12,528 ) Increase in inventories (11,389 ) (10,930 ) (8,707 ) Decrease (increase) in other current assets 5,033 (7,136 ) 4,309 (Increase) decrease in other assets (11,467 ) 1,473 (12,071 ) (Decrease) increase in accounts payable and other current liabilities (28,127 ) 563 (11,845 ) Increase in deferred revenue and customer advances 8,512 11,005 2,630 (Decrease) increase in other liabilities (7,684 ) (15,353 ) 11,211
Net cash provided by operating activities 484,876 449,280 497,374 Cash flows from investing activities:
Additions to property, plant, equipment and software capitalization (118,450 ) (104,749 ) (85,436 ) Business acquisitions, net of cash acquired (41,395 ) (31,016 ) (11,100 ) Purchase of investments (2,972,116 ) (1,815,988 ) (1,749,161 ) Maturities and sales of investments 2,667,232 1,655,359 1,489,721
Net cash used in investing activities (464,729 ) (296,394 ) (355,976 ) Cash flows from financing activities:
Proceeds from debt issuances 1,032,209 218,324 598,528 Payments on debt (886,644 ) (32,107 ) (373,751 ) Payments of debt issuance costs (2,039 ) (497 ) (4,523 ) Proceeds from stock plans 68,958 28,869 60,153 Purchase of treasury shares (301,580 ) (295,878 ) (370,835 ) Excess tax benefit related to stock option plans 15,842 10,568 32,239 Proceeds from (payments for) derivative contracts 8,666 4,186 (2,233 )
Net cash used in financing activities (64,588 ) (66,535 ) (60,422 ) Effect of exchange rate changes on cash and cash equivalents 4,202 10,694 (5,484 )
(Decrease) increase in cash and cash equivalents (40,239 ) 97,045 75,492 Cash and cash equivalents at beginning of period 481,035 383,990 308,498
Cash and cash equivalents at end of period $ 440,796 $ 481,035 $ 383,990
Supplemental cash flow information: Income taxes paid $ 55,928 $ 59,446 $ 50,313 Interest paid $ 29,563 $ 28,305 $ 19,658

Table of Contents
WATERS CORPORATION AND SUBSIDIARIES
CONSOLIDATED STATEMENTS OF STOCKHOLDERS’ EQUITY
The accompanying notes are an integral part of the consolidated financial statements.
45
Number of
Common Shares
Common
Stock
Additional
Paid-In Capital
Retained Earnings
Treasury Stock
Accumulated Other
Comprehensive
Income (Loss)
Total Stockholders’
Equity
(In thousands) Balance December 31, 2010 151,054 $ 1,511 $ 970,068 $ 2,618,479 $ (2,509,466 ) $ (11,795 ) $ 1,068,797 Net income — — — 432,968 — — 432,968 Other comprehensive loss — — — — — (24,260 ) (24,260 ) Issuance of common stock for employees:
Employee Stock Purchase Plan 58 1 4,149 — — — 4,150 Stock options exercised 1,381 14 55,989 — — — 56,003
Tax benefit related to stock option plans — — 32,239 — — — 32,239 Release of valuation allowance — — 176 — — — 176 Treasury stock — — — — (370,835 ) — (370,835 ) Stock-based compensation 264 2 27,338 — — — 27,340
Balance December 31, 2011 152,757 $ 1,528 $ 1,089,959 $ 3,051,447 $ (2,880,301 ) $ (36,055 ) $ 1,226,578
Net income — — — 461,443 — — 461,443 Other comprehensive income — — — — — 9,660 9,660 Issuance of common stock for employees:
Employee Stock Purchase Plan 66 1 4,660 — — — 4,661 Stock options exercised 630 6 24,202 — — — 24,208
Tax benefit related to stock option plans — — 10,568 — — — 10,568 Increase in valuation allowance — — (2,354 ) — — — (2,354 ) Treasury stock — — — — (295,878 ) — (295,878 ) Stock-based compensation 243 2 28,469 — — — 28,471
Balance December 31, 2012 153,696 $ 1,537 $ 1,155,504 $ 3,512,890 $ (3,176,179 ) $ (26,395 ) $ 1,467,357
Net income — — — 450,003 — — 450,003 Other comprehensive income — — — — — 32,274 32,274 Issuance of common stock for employees:
Employee Stock Purchase Plan 58 1 4,816 — — — 4,817 Stock options exercised 1,281 13 64,128 — — — 64,141
Tax benefit related to stock option plans — — 15,842 — — — 15,842 Increase in valuation allowance — — (892 ) — — — (892 ) Treasury stock — — — — (301,580 ) — (301,580 ) Stock-based compensation 211 1 31,210 — — — 31,211
Balance December 31, 2013 155,246 $ 1,552 $ 1,270,608 $ 3,962,893 $ (3,477,759 ) $ 5,879 $ 1,763,173

Table of Contents
NOTES TO CONSOLIDATED FINANCIAL STATEMENTS
1 Description of Business and Organization
Waters Corporation (“Waters ” or the “Company”) is an analytical instrument manufacturer that primarily designs, manufactures, sells and services, through its Waters Division, high performance liquid chromatography (“HPLC”), ultra performance liquid chromatography (“UPLC ” and together with HPLC, referred to as “LC”) and mass spectrometry (“MS”) technology systems and support products, including chromatography columns, other consumable products and comprehensive post-warranty service plans. These systems are complementary products that are frequently employed together (“LC-MS”) and sold as integrated instrument systems using a common software platform. LC is a standard technique and is utilized in a broad range of industries to detect, identify, monitor and measure the chemical, physical and biological composition of materials, and to purify a full range of compounds. MS instruments are used in drug discovery and development, including clinical trial testing, the analysis of proteins in disease processes (known as “proteomics”), nutritional safety analysis and environmental testing. LC-MS instruments combine a liquid phase sample introduction and separation system with mass spectrometric compound identification and quantification. Through its TA Division (“TA ”), the Company primarily designs, manufactures, sells and services thermal analysis, rheometry and calorimetry instruments, which are used in predicting the suitability of fine chemicals, pharmaceuticals, water, polymers and viscous liquids for various industrial, consumer goods and healthcare products, as well as for life science research. The Company is also a developer and supplier of software-based products that interface with the Company’s instruments, as well as other manufacturers’ instruments, and are typically purchased by customers as part of the instrument system.
2 Basis of Presentation and Summary of Significant Accounting Policies
Use of Estimates
The preparation of consolidated financial statements in conformity with generally accepted accounting principles (“GAAP”) requires the Company to make estimates and judgments that affect the reported amounts of assets, liabilities, revenues and expenses, and related disclosure of contingent liabilities. On an ongoing basis, the Company evaluates its estimates, including those related to revenue recognition, product returns and allowances, bad debts, inventory valuation, equity investments, goodwill and intangible assets, warranty and installation provisions, income taxes, contingencies, litigation, retirement plan obligations and stock-based compensation. The Company bases its estimates on historical experience and on various other assumptions that are believed to be reasonable under the circumstances, the results of which form the basis for making judgments about the carrying values of assets and liabilities that are not readily apparent from other sources. Actual amounts may differ from these estimates under different assumptions or conditions.
Risks and Uncertainties
The Company is subject to risks common to companies in the analytical instrument industry, including, but not limited to, global economic and financial market conditions, fluctuations in customer demand, development by its competitors of new technological innovations, levels of debt and debt service requirements, risk of disruption, fluctuations in foreign currency exchange rates, dependence on key personnel, protection and litigation of proprietary technology, shifts in taxable income between tax jurisdictions and compliance with regulations of the U.S. Food and Drug Administration and similar foreign regulatory authorities and agencies.
Principles of Consolidation
The consolidated financial statements include the accounts of the Company and its subsidiaries, most of which are wholly owned. The Company consolidates entities in which it owns or controls fifty percent or more of the voting shares. All material inter-company balances and transactions have been eliminated.
46
®
®
®

Table of Contents
NOTES TO CONSOLIDATED FINANCIAL STATEMENTS — (Conti nued) Translation of Foreign Currencies
For most of the Company’s foreign operations, assets and liabilities are translated into U.S. dollars at exchange rates prevailing on the balance sheet date, while revenues and expenses are translated at average exchange rates prevailing during the period. Any resulting translation gains or losses are included in accumulated other comprehensive income in the consolidated balance sheets. The Company’s net sales derived from operations outside the United States were 71% in 2013, 2012 and 2011. Gains and losses from foreign currency transactions are included in net income in the consolidated statements of operations and were not material for the years presented.
Seasonality of Business
The Company typically experiences an increase in sales in the fourth quarter, as a result of purchasing habits for capital goods of customers that tend to exhaust their spending budgets by calendar year end.
Cash, Cash Equivalents and Investments
Cash equivalents represent highly liquid investments, with original maturities of 90 days or less, primarily in bank deposits, U.S. and U.K. treasury bill money market funds and commercial paper. Investments with longer maturities are classified as investments, and are held primarily in U.S. treasury bills, Canadian government U.S. dollar-denominated treasury bills and commercial paper, bank deposits and corporate debt securities.
Investments are classified as available-for-sale in accordance with the accounting standards for investments in debt and equity securities. All available-for-sale securities are recorded at fair market value and any unrealized holding gains and losses, to the extent deemed temporary, are included in accumulated other comprehensive income in stockholders’ equity, net of the related tax effects. If any adjustment to fair value reflects a decline in the value of the investment, the Company considers all available evidence to evaluate the extent to which the decline is “other than temporary” and marks the investment to market through a charge to the statement of operations. The Company classifies its investments exclusive of those categorized as cash equivalents.
The Company maintains cash balances in various operating accounts in excess of federally insured limits, and in foreign subsidiary accounts in currencies other than U.S. dollars. As of December 31, 2013 and 2012, $1,738 million out of $1,804 million and $1,489 million out of $1,539 million, respectively, of the Company’s total cash, cash equivalents and investments were held by foreign subsidiaries and may be subject to material tax effects on distribution to U.S. legal entities.
Accounts Receivable and Allowance for Doubtful Accounts
Trade accounts receivable are recorded at the invoiced amount and do not bear interest. The allowance for doubtful accounts is the best estimate of the amount of probable credit losses in the existing accounts receivable. The allowance is based on a number of factors, including historical experience and the customer’s credit-worthiness. The allowance for doubtful accounts is reviewed on at least a quarterly basis. Past due balances over 90 days and over a specified amount are reviewed individually for collectibility. Account balances are charged against the allowance when the Company determines it is probable that the receivable will not be recovered. The Company does not have any off-balance sheet credit exposure related to its customers. The allowance for sales returns is the best estimate of the amount of future product returns related to current period revenue and is based on historical experience.
47

Table of Contents
NOTES TO CONSOLIDATED FINANCIAL STATEMENTS — (Conti nued)
The following is a summary of the activity of the Company’s allowance for doubtful accounts and sales returns for the years ended December 31, 2013, 2012 and 2011 (in thousands):
Concentration of Credit Risk
The Company sells its products and services to a significant number of large and small customers throughout the world, with net sales to the pharmaceutical industry of approximately 52% in 2013, 53% in 2012 and 52% in 2011. None of the Company’s individual customers accounted for more than 2% of annual Company sales in 2013, 2012 or 2011. The Company performs continuing credit evaluations of its customers and generally does not require collateral, but in certain circumstances may require letters of credit or deposits. Historically, the Company has not experienced significant bad debt losses.
Inventory
The Company values all of its inventories at the lower of cost or market on a first-in, first-out basis (“FIFO”).
Income Taxes
Deferred income taxes are recognized for temporary differences between the financial statement and income tax basis of assets and liabilities using tax rates in effect for the years in which the differences are expected to reverse. A valuation allowance is provided to offset any net deferred tax assets if, based upon the available evidence, it is more likely than not that some or all of the deferred tax assets will not be realized. Appropriate short-term and long-term liabilities have also been recorded to recognize uncertain tax return reporting positions.
Property, Plant and Equipment
Property, plant and equipment are recorded at cost. Expenditures for maintenance and repairs are charged to expense, while the costs of significant improvements are capitalized. Depreciation is provided using the straight-line method over the following estimated useful lives: buildings — fifteen to thirty years; building improvements — five to ten years; leasehold improvements — the shorter of the economic useful life or life of lease; and production and other equipment — three to ten years. Upon retirement or sale, the cost of the assets disposed of and the related accumulated depreciation are eliminated from the consolidated balance sheets and related gains or losses are reflected in the consolidated statements of operations. There were no material gains or losses from retirement or sale of assets in 2013, 2012 and 2011.
Asset Impairments
The Company reviews its long-lived assets for impairment in accordance with the accounting standards for property, plant and equipment. Whenever events or circumstances indicate that the carrying amount of an asset may not be recoverable, the Company evaluates the fair value of the asset, relying on a number of factors, including, but not limited to, operating results, business plans, economic projections and anticipated future cash flows. Any change in the carrying amount of an asset as a result of the Company’s evaluation is separately identified in the consolidated statements of operations.
48
Balance at
Beginning of Period Additions Deductions Balance at
End of Period Allowance for Doubtful Accounts and Sales Returns:
2013 $ 8,240 $ 4,386 $ (5,569 ) $ 7,057 2012 $ 8,584 $ 7,298 $ (7,642 ) $ 8,240 2011 $ 6,196 $ 9,932 $ (7,544 ) $ 8,584

Table of Contents
NOTES TO CONSOLIDATED FINANCIAL STATEMENTS — (Conti nued) Goodwill and Other Intangible Assets
The Company tests for goodwill impairment using a fair-value approach at the reporting unit level annually, or earlier, if an event occurs or circumstances change that would more likely than not reduce the fair value of a reporting unit below its carrying amount. Additionally, the Company performs an annual goodwill impairment assessment for its reporting units as of January 1 each year. The goodwill and other intangible assets accounting standards define a reporting unit as an operating segment, or one level below an operating segment, if discrete financial information is prepared and reviewed by management. For goodwill impairment review purposes, the Company has two reporting units, the Waters Division and TA Division. Goodwill is allocated to the reporting units at the time of acquisition. Under the impairment test, if a reporting unit’s carrying amount exceeds its estimated fair value, goodwill impairment is recognized to the extent that the carrying amount of goodwill exceeds the implied fair value of the goodwill. The fair value of reporting units was estimated using a discounted cash flows technique, which includes certain management assumptions, such as estimated future cash flows, estimated growth rates and discount rates.
The Company’s intangible assets include purchased technology; capitalized software development costs; costs associated with acquiring Company patents, trademarks and intellectual properties, such as licenses; debt issuance costs and acquired in-process research and development (“IPR&D”). Purchased intangibles are recorded at their fair market values as of the acquisition date and amortized over their estimated useful lives, ranging from one to fifteen years. Other intangibles are amortized over a period ranging from one to thirteen years. Debt issuance costs are amortized over the life of the related debt. Acquired IPR&D is amortized from the date of completion over its estimated useful life. In addition, acquired IPR&D will be tested for impairment until completion of the acquired programs.
Software Development Costs
The Company capitalizes internal and external software development costs for products offered for sale in accordance with the accounting standards for the costs of software to be sold, leased, or otherwise marketed. Capitalized costs are amortized to cost of sales over the period of economic benefit, which approximates a straight-line basis over the estimated useful lives of the related software products, generally three to ten years. The Company capitalized $35 million and $34 million of direct expenses that were related to the development of software in 2013 and 2012, respectively. Net capitalized software included in intangible assets totaled $151 million and $138 million at December 31, 2013 and 2012, respectively. See Note 7, “Goodwill and Other Intangibles”.
The Company capitalizes internal software development costs for internal use in accordance with the accounting standards for goodwill and other intangible assets. Capitalized internal software development costs are amortized over the period of economic benefit, which approximates a straight-line basis over ten years. Net capitalized internal software included in property, plant and equipment totaled $3 million at both December 31, 2013 and 2012.
Other Investments
The Company accounts for its investments that represent less than twenty percent ownership, and for which the Company does not have significant influence, using the accounting standards for investments in debt and equity securities. Investments for which the Company does not have the ability to exercise significant influence, and for which there is not a readily determinable market value, are accounted for under the cost method of accounting. The Company periodically evaluates the carrying value of its investments accounted for under the cost method of accounting and carries them at the lower of cost or estimated net realizable value. For investments in which the Company owns or controls between twenty and forty-nine percent of the voting shares, or over which it exerts significant influence over operating and financial policies, the equity method of accounting is used. The Company’s share of net income or losses of equity investments is included in the consolidated statements of operations and was not material in any period presented. All long-term investments at December 31, 2013 and 2012 are included in other assets and amounted to $3 million for both periods.
49

Table of Contents
NOTES TO CONSOLIDATED FINANCIAL STATEMENTS — (Conti nued) Fair Value Measurements
In accordance with the accounting standards for fair value measurements and disclosures, certain of the Company’s assets and liabilities are measured at fair value on a recurring basis as of December 31, 2013 and 2012. Fair values determined by Level 1 inputs utilize observable data, such as quoted prices in active markets. Fair values determined by Level 2 inputs utilize data points other than quoted prices in active markets that are observable either directly or indirectly. Fair values determined by Level 3 inputs utilize unobservable data points for which there is little or no market data, which require the reporting entity to develop its own assumptions.
The following table represents the Company’s assets and liabilities measured at fair value on a recurring basis at December 31, 2013 (in thousands):
50
Total at December 31,
2013
Quoted Prices
in Active Markets
for Identical Assets
(Level 1)
Significant Other
Observable Inputs
(Level 2)
Significant Unobservable
Inputs
(Level 3)
Assets:
U.S. Treasury securities $ 556,539 $ — $ 556,539 $ — Foreign government securities 139,670 — 139,670 — Corporate debt securities 629,434 — 629,434 — Time deposits 74,050 — 74,050 — Equity securities 147 — 147 — Other cash equivalents 62,851 — 62,851 — Waters 401(k) Restoration Plan assets 31,203 — 31,203 — Foreign currency exchange contract agreements 929 — 929 —
Total $ 1,494,823 $ — $ 1,494,823 $ —
Liabilities:
Foreign currency exchange contract agreements $ 88 $ — $ 88 $ —
Total $ 88 $ — $ 88 $ —

Table of Contents
NOTES TO CONSOLIDATED FINANCIAL STATEMENTS — (Conti nued)
The following table represents the Company’s assets and liabilities measured at fair value on a recurring basis at December 31, 2012 (in thousands):
The fair values of the Company’s cash equivalents, investments, 401(k) restoration plan assets and foreign currency exchange contracts are determined through market and observable sources and have been classified as Level 2. These assets and liabilities have been initially valued at the transaction price and subsequently valued, typically utilizing third-party pricing services. The pricing services use many inputs to determine value, including reportable trades, benchmark yields, credit spreads, broker/dealer quotes, current spot rates and other industry and economic events. The Company validates the prices provided by third-party pricing services by reviewing their pricing methods and obtaining market values from other pricing sources. After completing these validation procedures, the Company did not adjust or override any fair value measurements provided by third-party pricing services as of December 31, 2013 and 2012.
Fair Value of Other Financial Instruments
The Company’s cash, accounts receivable, accounts payable and variable interest rate debt are recorded at cost, which approximates fair value. The carrying value of the Company’s fixed interest rate debt was $400 million at both December 31, 2013 and 2012. The fair value of the Company’s fixed rate debt is estimated using discounted cash flow models, based on estimated current rates offered for similar debt under current market conditions for the Company. The fair value of the Company’s fixed interest rate debt was estimated to be $398 million and $413 million at December 31, 2013 and 2012, respectively, using Level 2 inputs.
Derivative Transactions
The Company operates on a global basis and is exposed to the risk that its earnings, cash flows and stockholders’ equity could be adversely impacted by fluctuations in currency exchange rates.
The Company records its derivative transactions in accordance with the accounting standards for derivative instruments and hedging activities, which establish the accounting and reporting standards for derivative instruments, including certain derivative instruments embedded in other contracts, and for hedging activities. All derivatives, whether designated in hedging relationships or not, are required to be recorded on the consolidated
51
Total at December 31,
2012
Quoted Prices
in Active Markets
for Identical Assets
(Level 1)
Significant Other
Observable Inputs
(Level 2)
Significant Unobservable
Inputs
(Level 3)
Assets:
U.S. Treasury securities $ 470,421 $ — $ 470,421 $ — Foreign government securities 313,237 — 313,237 — Corporate debt securities 311,607 — 311,607 — Time deposits 64,037 — 64,037 — Equity securities 70 — 70 — Other cash equivalents 44,850 — 44,850 — Waters 401(k) Restoration Plan assets 24,827 — 24,827 — Foreign currency exchange contract agreements 1,173 — 1,173 —
Total $ 1,230,222 $ — $ 1,230,222 $ —
Liabilities:
Foreign currency exchange contract agreements $ 693 $ — $ 693 $ —
Total $ 693 $ — $ 693 $ —

Table of Contents
NOTES TO CONSOLIDATED FINANCIAL STATEMENTS — (Conti nued) balance sheets at fair value as either assets or liabilities. If the derivative is designated as a fair-value hedge, the changes in the fair value of the derivative and of the hedged item attributable to the hedged risk are recognized in earnings. If the derivative is designated as a cash flow hedge, the effective portions of changes in the fair value of the derivative are recorded in other comprehensive income and are recognized in earnings when the hedged item affects earnings; ineffective portions of changes in fair value are recognized in earnings. In addition, disclosures required for derivative instruments and hedging activities include the Company’s objectives for using derivative instruments, the level of derivative activity the Company engages in, as well as how derivative instruments and related hedged items affect the Company’s financial position and performance.
The Company currently uses derivative instruments to manage exposures to foreign currency risks. The Company’s objectives for holding derivatives are to minimize foreign currency risk using the most effective methods to eliminate or reduce the impact of foreign currency exposures. The Company documents all relationships between hedging instruments and hedged items and links all derivatives designated as fair-value, cash flow or net investment hedges to specific assets and liabilities on the consolidated balance sheets or to specific forecasted transactions. In addition, the Company considers the impact of its counterparties’ credit risk on the fair value of the contracts as well as the ability of each party to execute under the contracts. The Company also assesses and documents, both at the hedges’ inception and on an ongoing basis, whether the derivatives that are used in hedging transactions are highly effective in offsetting changes in fair values or cash flows associated with the hedged items.
The Company enters into forward foreign exchange contracts, principally to hedge the impact of currency fluctuations on certain inter-company balances and short-term assets and liabilities. Principal hedged currencies include the Euro, Japanese yen, British pound and Singapore dollar. The periods of these forward contracts typically range from one to three months and have varying notional amounts, which are intended to be consistent with changes in the underlying exposures. Gains and losses on these forward contracts are recorded in cost of sales in the consolidated statements of operations. At December 31, 2013, 2012 and 2011, the Company held forward foreign exchange contracts with notional amounts totaling $104 million, $134 million and $161 million, respectively.
The Company’s foreign currency exchange contracts included in the consolidated balance sheets are classified as follows (in thousands):
The following is a summary of the activity in the statements of operations related to the forward foreign exchange contracts (in thousands):
Stockholders’ Equity
In May 2012, the Company’s Board of Directors authorized the Company to repurchase up to $750 million of its outstanding common stock over a two-year period. During 2013, 2012 and 2011, the Company repurchased 3.1 million, 3.5 million and 4.5 million shares at a cost of $295 million, $290 million and $364 million,
52
December 31, 2013 December 31, 2012 Other current assets $ 929 $ 1,173 Other current liabilities $ 88 $ 693
Year Ended December 31, 2013 2012 2011
Realized gains (losses) on closed contracts $ 8,666 $ 4,186 $ (2,233 ) Unrealized gains (losses) on open contracts 361 1,716 (1,035 )
Cumulative net pre-tax gains (losses) $ 9,027 $ 5,902 (3,268 )

Table of Contents
NOTES TO CONSOLIDATED FINANCIAL STATEMENTS — (Conti nued) respectively, under the May 2012 authorization and other previously announced programs. As of December 31, 2013, the Company repurchased 4.3 million shares at a cost of $402 million under the May 2012 repurchase program, leaving $348 million authorized for future purchases. In addition, the Company repurchased $6 million of common stock related to the vesting of restricted stock units during each of the years ended December 31, 2013, 2012 and 2011. The Company believes that it has the financial flexibility to fund these share repurchases given current cash and debt levels, as well as to invest in research, technology and business acquisitions to further grow the Company’s sales and profits.
Revenue Recognition
Sales of products and services are generally recorded based on product shipment and performance of service, respectively. The Company’s deferred revenue on the consolidated balance sheets consists of the obligation on instrument service contracts and customer payments received in advance, prior to shipment of the instrument. Revenue is recognized when all of the following revenue recognition criteria are met: persuasive evidence of an arrangement exists; delivery or performance has occurred; the vendor’s fee is fixed or determinable; collectibility is reasonably assured and, if applicable, upon acceptance when acceptance criteria with contractual cash holdback are specified. Shipping and handling costs are included in cost of sales, net of amounts invoiced to the customer per the order.
Product shipments, including those for demonstration or evaluation, and service contracts are not recorded as revenue until a valid purchase order or master agreement is received, specifying fixed terms and prices. The Company generally recognizes product revenue when legal title has transferred and risk of loss passes to the customer. The Company structures its sales arrangements as shipping point or international equivalent and, accordingly, recognizes revenue upon shipment. In some cases, destination-based shipping terms are included in sales arrangements, in which cases revenue is generally recognized when the products arrive at the customer site.
The Company’s method of revenue recognition for certain products requiring installation is accounted for in accordance with the multiple-element revenue recognition accounting standards. With respect to the installation obligations, the larger of the contractual cash holdback or the best estimate of selling price of the installation service is deferred when the product is shipped and revenue is recognized as a multiple-element arrangement when installation is complete. The Company determines the best estimate of selling price of installation based upon a number of factors, including hourly service billing rates and estimated installation hours.
Instrument service contracts are typically billed at the beginning of the maintenance period. The amount of the service contract is amortized ratably to revenue over the instrument maintenance period. There are no deferred costs associated with the service contract, as the cost of the service is recorded when the service is performed. No revenue is recognized until all revenue recognition criteria have been met.
Sales of software are accounted for in accordance with the accounting standards for software revenue recognition. The Company’s software arrangements typically include software licenses and maintenance contracts. Software license revenue is recognized when persuasive evidence of an arrangement exists, delivery has occurred, the fee is fixed or determinable, collection is probable, and there are no significant post-delivery obligations remaining. The revenue associated with the software maintenance contract is recognized ratably over the maintenance term. Unspecified rights to software upgrades are typically sold as part of the maintenance contract on a when-and-if-available basis. The Company uses the residual method to allocate software revenue when a transaction includes multiple elements and vendor specific objective evidence of fair value of undelivered elements exists. Under the residual method, the fair value of the undelivered element (maintenance) is deferred and the remaining portion of the arrangement fee is allocated to the delivered element (software license) and recognized as revenue.
53

Table of Contents
NOTES TO CONSOLIDATED FINANCIAL STATEMENTS — (Conti nued)
Returns and customer credits are infrequent and are recorded as a reduction to sales. Rights of return are not included in sales arrangements. Revenue associated with products that contain specific customer acceptance criteria is not recognized before the customer acceptance criteria are satisfied. Discounts from list prices are recorded as a reduction to sales.
Product Warranty Costs
The Company accrues estimated product warranty costs at the time of sale, which are included in cost of sales in the consolidated statements of operations. While the Company engages in extensive product quality programs and processes, including actively monitoring and evaluating the quality of its component suppliers, the Company’s warranty obligation is affected by product failure rates, material usage and service delivery costs incurred in correcting a product failure. The amount of the accrued warranty liability is based on historical information, such as past experience, product failure rates, number of units repaired and estimated costs of material and labor. The liability is reviewed for reasonableness at least quarterly.
The following is a summary of the activity of the Company’s accrued warranty liability for the years ended December 31, 2013, 2012 and 2011 (in thousands):
Advertising Costs
All advertising costs are expensed as incurred and are included in selling and administrative expenses in the consolidated statements of operations. Advertising expenses for 2013, 2012 and 2011 were $11 million, $13 million and $11 million, respectively.
Research and Development Expenses
Research and development expenses are comprised of costs incurred in performing research and development activities, including salaries and benefits, facilities costs, overhead costs, contract services and other outside costs. Research and development expenses are expensed as incurred.
Stock-Based Compensation
The Company has two stock-based compensation plans, which are described in Note 12, “Stock-Based Compensation”.
Earnings Per Share
In accordance with the earnings per share accounting standards, the Company presents two earnings per share (“EPS”) amounts. Income per basic common share is based on income available to common shareholders and the weighted-average number of common shares outstanding during the periods presented. Income per diluted common share includes additional dilution from potential common stock, such as stock issuable pursuant to the exercise of stock options outstanding.
54
Balance at
Beginning of Period
Accruals for
Warranties
Settlements
Made Balance at
End of Period Accrued warranty liability:
2013 $ 12,353 $ 8,466 $ (7,857 ) $ 12,962 2012 $ 13,258 $ 7,212 $ (8,117 ) $ 12,353 2011 $ 11,272 $ 10,175 $ (8,189 ) $ 13,258

Table of Contents
NOTES TO CONSOLIDATED FINANCIAL STATEMENTS — (Conti nued) Retirement Plans
The Company sponsors various retirement plans, which are described in Note 14, “Retirement Plans”.
Comprehensive Income
The Company accounts for comprehensive income in accordance with the accounting standards for comprehensive income, which establish the accounting rules for reporting and displaying comprehensive income. These standards require that all components of comprehensive income be reported in a financial statement that is displayed with the same prominence as other financial statements.
Subsequent Events
The Company did not have any material subsequent events, except for the recent acquisition discussed in Note 6, “Acquisitions”.
Recently Adopted Accounting Standards
In July 2012, amended accounting guidance was issued for indefinite-lived intangible assets other than goodwill in order to simplify how companies test indefinite-lived intangible assets for impairment. The adoption of this standard in 2013 did not have a material effect on the Company’s financial position, results of operations or cash flows.
In February 2013, accounting guidance was issued to improve the reporting of reclassifications out of accumulated other comprehensive income. The adoption of this standard in 2013 did not have a material effect on the Company’s financial position, results of operations or cash flows.
Recently Issued Accounting Standards
In July 2013, amended accounting guidance was issued regarding the financial statement presentation of an unrecognized tax benefit when a net operating loss carryforward, a similar tax loss or a tax credit carryforward exists. This guidance is effective prospectively for annual and interim reporting periods beginning after December 15, 2013. The adoption of this standard is not expected to have a material effect on the Company’s financial position, results of operations or cash flows.
55

Table of Contents
NOTES TO CONSOLIDATED FINANCIAL STATEMENTS — (Conti nued) 3 Marketable Securities
The Company’s marketable securities within cash equivalents and investments included in the consolidated balance sheets are detailed as follows (in thousands):
The estimated fair value of marketable debt securities by maturity date is as follows (in thousands):
In the year ended December 31, 2013, the Company recorded a $1.6 million charge for an other-than-temporary impairment to an investment. Realized gains and losses on sales of investments were not material in 2013, 2012 and 2011.
56
December 31, 2013
Amortized
Cost
Unrealized
Gain
Unrealized
Loss
Fair Value
U.S. Treasury securities $ 556,438 $ 111 $ (10 ) $ 556,539 Foreign government securities 139,670 — — 139,670 Corporate debt securities 629,477 190 (233 ) 629,434 Time deposits 74,050 — — 74,050 Equity securities 77 70 — 147
Total $ 1,399,712 $ 371 $ (243 ) $ 1,399,840
Amounts included in: Cash equivalents $ 36,966 $ — $ — $ 36,966 Investments 1,362,746 371 (243 ) 1,362,874
Total $ 1,399,712 $ 371 $ (243 ) $ 1,399,840
December 31, 2012 Amortized Unrealized Unrealized Fair Cost Gain Loss Value U.S. Treasury securities $ 470,421 $ — $ — $ 470,421 Foreign government securities 313,237 — — 313,237 Corporate debt securities 311,607 — — 311,607 Time deposits 64,037 — — 64,037 Equity securities 1,653 — (1,583 ) 70
Total $ 1,160,955 $ — $ (1,583 ) $ 1,159,372
Amounts included in:
Cash equivalents $ 101,382 $ — $ — $ 101,382 Investments 1,059,573 — (1,583 ) 1,057,990
Total $ 1,160,955 $ — $ (1,583 ) $ 1,159,372
December 31, 2013 December 31, 2012
Due in one year or less $ 1,011,459 $ 1,057,990 Due after one year through two years 314,184 —
Total $ 1,325,643 $ 1,057,990

Table of Contents
NOTES TO CONSOLIDATED FINANCIAL STATEMENTS — (Conti nued) 4 Inventories
Inventories are classified as follows (in thousands):
5 Property, Plant and Equipment
Property, plant and equipment consist of the following (in thousands):
During 2013, 2012 and 2011, the Company retired and disposed of approximately $19 million, $6 million and $6 million of property, plant and equipment, respectively, most of which was fully depreciated and no longer in use. Gains and losses on disposal were immaterial.
6 Acquisitions
The Company accounts for business acquisitions under the accounting standards for business combinations and the results of each acquisition have been included in the Company’s consolidated results from the respective acquisition dates.
In January 2014, the Company acquired all of the outstanding stock of ULSP B.V., a manufacturer of solutions for ultra low temperature applications, for approximately $3 million in cash.
In December 2013, the Company acquired the net assets of LaserComp Inc. (“LaserComp”), a manufacturer of thermal conductivity measurement instruments, for approximately $12 million in cash. LaserComp was acquired to expand TA’s thermal analysis instrument product offering and to leverage the Company’s distribution channels. The purchase price of the acquisition was allocated to tangible and intangible assets and assumed liabilities based on their estimated fair values. The Company has allocated $5 million of the purchase price to intangible assets comprised of technology, customer relationships and trade name. The Company is amortizing the technology and customer relationships over ten years and seven years, respectively. The remaining purchase price of $6 million has been accounted for as goodwill. The goodwill is deductible for tax purposes.
In December 2013, the Company acquired all of the outstanding capital stock of Expert Systems Solutions S.r.l. (“ESS”), a manufacturer of advanced thermal analysis instruments, for approximately $3 million in cash. ESS was acquired to expand TA’s thermal analysis instrument product offering and to leverage the Company’s
57
December 31, 2013 2012
Raw materials $ 76,930 $ 73,280 Work in progress 19,656 16,133 Finished goods 146,214 140,152
Total inventories $ 242,800 $ 229,565
December 31, 2013 2012 Land and land improvements $ 37,156 $ 35,734 Buildings and leasehold improvements 205,638 196,554 Production and other equipment 336,135 317,285 Construction in progress 80,420 37,750
Total property, plant and equipment 659,349 587,323 Less: accumulated depreciation and amortization (334,417 ) (314,044 )
Property, plant and equipment, net $ 324,932 $ 273,279

Table of Contents
NOTES TO CONSOLIDATED FINANCIAL STATEMENTS — (Conti nued) distribution channels. The purchase price of the acquisition was allocated to tangible and intangible assets and assumed liabilities based on their estimated fair values. The Company has allocated $1 million of the purchase price to an intangible asset comprised of technology, which will be amortized over ten years. The remaining purchase price of $2 million has been accounted for as goodwill. The goodwill is not deductible for tax purposes.
In August 2013, the Company acquired all of the outstanding capital stock of Nonlinear Dynamics Ltd. (“Nonlinear Dynamics”), a developer of proteomics and metabolomics software, for approximately $23 million in cash. Waters and Nonlinear Dynamics collaborated on the development of the Company’s TransOmics™ Informatics, a scalable solution for proteomics, metabolomics, and lipidomics analysis, which was introduced in 2012. Nonlinear Dynamics will develop the next-generation software that will be a key component of the Company’s future high-end MS instruments. The purchase price of the acquisition was allocated to tangible and intangible assets and assumed liabilities based on their estimated fair values. The Company has allocated $3 million of the purchase price to intangible assets comprised of software, customer relationships and trade name. The Company is amortizing the software and customer relationships over five years. The remaining purchase price of $20 million has been accounted for as goodwill. The goodwill is not deductible for tax purposes.
In July 2013, the Company acquired all of the outstanding capital stock of Scarabaeus Mess-und Prodktionstechnik GmbH (“Scarabaeus”), a manufacturer of rheometers for the rubber and elastomer markets, for approximately $4 million in cash. Scarabaeus was acquired to expand TA’s thermal analysis instrument product offering and to leverage the Company’s distribution channels. The purchase price of the acquisition was allocated to tangible and intangible assets and assumed liabilities based on their estimated fair values. The Company has allocated $2 million of the purchase price to intangible assets comprised of completed technology, software and customer relationships. The Company is amortizing acquired technology over ten years and the software and customer relationships over seven years. The remaining purchase price of $3 million has been accounted for as goodwill. The goodwill is not deductible for tax purposes.
The fair values of the assets and liabilities acquired in each business acquisition were determined using various income-approach valuation techniques, which use Level 3 inputs. The following table presents the fair values as of the respective acquisition dates, as determined by the Company, of 100% of the assets and liabilities owned and recorded in connection with the acquisitions of LaserComp, ESS, Nonlinear Dynamics and Scarabaeus (in thousands):
In July 2012, the Company acquired all of the outstanding capital stock of Blue Reference, Inc. (“Blue Reference”), a U.S.-based developer and distributor of software products used for the real-time mining and analysis of multiple-application scientific databases, for $14 million in cash. The Company has integrated the Blue Reference technology into software product platforms to further differentiate its offerings by providing customers with a more efficient scientific information assessment process, where there is an ongoing need for immediacy and interactivity of multiple scientific databases.
58
Cash $ 295 Accounts receivable 1,616 Inventory 975 Intangible assets 10,844 Goodwill 31,231 Other assets 377
Total assets acquired 45,338 Accrued expenses and other liabilities 2,013 Deferred tax liability 1,635
Cash consideration paid $ 41,690

Table of Contents
NOTES TO CONSOLIDATED FINANCIAL STATEMENTS — (Conti nued)
In February 2012, the Company acquired the net assets of its Israeli sales and service distributor for $6 million in cash.
In January 2012, the Company acquired all of the outstanding capital stock of Baehr Thermoanalyse GmbH (“Baehr”), a German manufacturer of a wide range of thermal analyzers, for $12 million in cash, including the assumption of $1 million of debt. Baehr was acquired to expand TA’s thermal analysis instrument product offering and to leverage the Company’s distribution channels.
In July 2011, the Company acquired the net assets of Anter Corporation (“Anter”), a manufacturer of thermal analyzers used to measure thermal expansion and shrinkage, thermal conductivity and resistivity, thermal diffusivity and specific heat capacity of a wide range of materials, for $11 million in cash. Anter was acquired to expand TA’s thermal analysis instrument product offering and to leverage the Company’s distribution channels.
The principal factor that resulted in recognition of goodwill in these acquisitions is that the purchase price was based, in part, on cash flow projections assuming the integration of any acquired technology, distribution channels and products with the Company’s products, which is of considerably greater value than utilizing each of the acquired companies’ technology, customer access or products on a stand-alone basis. The goodwill also includes value assigned to assembled workforce, which cannot be recognized as an intangible asset. Specifically, the goodwill acquired with Nonlinear Dynamics consists of the value assigned to the workforce and the future incremental sales synergies anticipated when Nonlinear Dynamics develops the future next-generation software. This new software, which will be a key component of the Company’s future high-end MS instruments, has not yet been developed.
In each acquisition, the sellers provided the Company with customary representations, warranties and indemnification, which would be settled in the future if and when a breach of the contractual representation or warranty condition occurs. The pro forma effect of the ongoing operations for Waters, LaserComp, ESS, Nonlinear Dynamics, Scarabaeus, Blue Reference, the Israeli sales and service distributor, Baehr and Anter, either individually or in the aggregate, as though these acquisitions had occurred at the beginning of the periods covered by this report was not significant.
7 Goodwill and Other Intangibles
The carrying amount of goodwill was $350 million and $317 million at December 31, 2013 and 2012, respectively. The Company’s acquisitions increased goodwill by $31 million (see Note 6) and the effect of foreign currency translation increased goodwill by $2 million in 2013.
The Company’s intangible assets included in the consolidated balance sheets are detailed as follows (in thousands):
59
December 31, 2013 December 31, 2012
Gross Carrying Amount
Accumulated
Amortization
Weighted- Average
Amortization
Period
Gross Carrying Amount
Accumulated
Amortization
Weighted- Average
Amortization
Period
Purchased intangibles $ 167,604 $ 105,347 10 years $ 154,749 $ 94,498 11 years Capitalized software 340,070 189,415 7 years 293,589 155,394 5 years Licenses 3,909 3,390 7 years 7,112 6,361 6 years Patents and other intangibles 49,902 24,221 8 years 40,290 19,342 8 years
Total $ 561,485 $ 322,373 8 years $ 495,740 $ 275,595 7 years

Table of Contents
NOTES TO CONSOLIDATED FINANCIAL STATEMENTS — (Conti nued)
During the year ended December 31, 2013, the Company acquired $11 million of purchased intangibles as a result of the acquisitions of Nonlinear Dynamics, Scarabaeus, LaserComp and ESS (see Note 6). In addition, the gross carrying value of intangible assets and accumulated amortization for intangible assets increased by $14 million and $9 million, respectively, in the year ended December 31, 2013 due to the effects of foreign currency translation. Amortization expense for intangible assets was $42 million, $31 million and $30 million for the years ended December 31, 2013, 2012 and 2011, respectively. Included in amortization expense for the year ended December 31, 2012 is a one-time $4 million charge to purchased intangibles amortization expense related to the discontinuance of a product trade name intangible asset. Amortization expense for intangible assets is estimated to be between $44 million and $49 million per year for each of the next five years. The increase in amortization expense in 2013 and for the next five years is primarily due to amortization associated with capitalized software costs related to the launch of new software product platforms in the first quarter of 2013. The carrying value of the new software platform was approximately $112 million as of December 31, 2013 and will be amortized over ten years.
8 Debt
In June 2013, the Company entered into a new credit agreement (the “2013 Credit Agreement”) that provides for a $1.1 billion revolving facility and a $300 million term loan facility. The revolving facility and term loan facility both mature on June 25, 2018 and require no scheduled prepayments before that date. The Company used $860 million of the proceeds from the 2013 Credit Agreement to repay the outstanding amounts under the Company’s existing multi-borrower credit agreement dated July 2011 (the “2011 Credit Agreement”). Waters terminated the 2011 Credit Agreement early without penalty.
The interest rates applicable to the 2013 Credit Agreement are, at the Company’s option, equal to either the alternate base rate calculated daily (which is a rate per annum equal to the greatest of (a) the prime rate in effect on such day, (b) the federal funds effective rate in effect on such day plus 1/2% per annum, or (c) the adjusted LIBO rate on such day (or if such day is not a business day, the immediately preceding business day) for a deposit in U.S. dollars with a maturity of one month plus 1% per annum) or the applicable 1, 2, 3 or 6 month adjusted LIBO rate, in each case, plus an interest rate margin based upon the Company’s leverage ratio, which can range between 0 to 12.5 basis points for alternate base rate loans and between 75 basis points and 112.5 basis points for adjusted LIBO rate loans. The facility fee on the 2013 Credit Agreement ranges between 12.5 basis points and 25 basis points. The 2013 Credit Agreement requires that the Company comply with an interest coverage ratio test of not less than 3.50:1 as of the end of any fiscal quarter for any period of four consecutive fiscal quarters and a leverage ratio test of not more than 3.50:1 as of the end of any fiscal quarter. In addition, the 2013 Credit Agreement includes negative covenants, affirmative covenants, representations and warranties and events of default that are customary for investment grade credit facilities.
At December 31, 2013, $125 million of the outstanding portions of the revolving facilities have been classified as short-term liabilities in the consolidated balance sheet due to the fact that the Company expects to utilize this portion of the revolving line of credit to fund its working capital needs within the next twelve months and can repay and re-borrow from the facility without penalty. The remaining $490 million of the outstanding portions of the revolving facilities have been classified as long-term liabilities in the consolidated balance sheet, as no repayments are required prior to the maturity date in 2018 and this portion is not expected to be repaid within the next twelve months.
During the year ended December 31, 2011, the Company issued and sold senior unsecured notes with a face value of $200 million. At both December 31, 2013 and 2012, the Company had a total of $400 million of outstanding senior unsecured notes. Interest on the senior unsecured notes is payable semi-annually each year. The Company may prepay all or some of the senior unsecured notes at any time in an amount not less than 10% of the aggregate principal amount outstanding, plus the applicable make-whole amount. In the event of a change in control (as defined in the note purchase agreement) of the Company, the Company may be required to prepay
60

Table of Contents
NOTES TO CONSOLIDATED FINANCIAL STATEMENTS — (Conti nued) the senior unsecured notes at a price equal to 100% of the principal amount thereof, plus accrued and unpaid interest. These senior unsecured notes require that the Company comply with an interest coverage ratio test of not less than 3.50:1 for any period of four consecutive fiscal quarters and a leverage ratio test of not more than 3.50:1 as of the end of any fiscal quarter. In addition, these senior unsecured notes include customary negative covenants, affirmative covenants, representations and warranties and events of default.
As of December 31, 2013, the Company was in compliance with all debt covenants.
The Company had the following outstanding debt at December 31, 2013 and 2012 (in thousands):
As of December 31, 2013 and 2012, the Company had a total amount available to borrow under the existing credit agreements of $483 million and $428 million, respectively, after outstanding letters of credit. The weighted-average interest rates applicable to the senior unsecured notes and credit agreement borrowings collectively were 1.94% and 2.11% at December 31, 2013 and 2012, respectively.
The Company and its foreign subsidiaries also had available short-term lines of credit totaling $87 million and $107 million at December 31, 2013 and 2012, respectively, for the purpose of short-term borrowing and issuance of commercial guarantees. The weighted-average interest rates applicable to the short-term borrowings were 2.00% at both December 31, 2013 and 2012.
9 Income Taxes
Income tax data for the years ended December 31, 2013, 2012 and 2011 is as follows (in thousands):
61
December 31, 2013 2012 Foreign subsidiary lines of credit $ 8,346 $ 7,781 Credit agreements 125,000 125,000
Total notes payable and debt 133,346 132,781
Senior unsecured notes — Series A — 3.75%, due February 2015 100,000 100,000 Senior unsecured notes — Series B — 5.00%, due February 2020 100,000 100,000 Senior unsecured notes — Series C — 2.50%, due March 2016 50,000 50,000 Senior unsecured notes — Series D — 3.22%, due March 2018 100,000 100,000 Senior unsecured notes — Series E — 3.97%, due March 2021 50,000 50,000 Credit agreements 790,000 645,000
Total long-term debt 1,190,000 1,045,000
Total debt $ 1,323,346 $ 1,177,781
Year Ended December 31, 2013 2012 2011
The components of income from operations before income taxes are as follows:
Domestic $ 116,067 $ 116,071 $ 102,998 Foreign 374,038 371,554 406,254
Total $ 490,105 $ 487,625 $ 509,252

Table of Contents
NOTES TO CONSOLIDATED FINANCIAL STATEMENTS — (Conti nued)
The four principal jurisdictions in which the Company manufactures are the U.S., Ireland, the United Kingdom and Singapore, where the marginal effective tax rates were approximately 37.5%, 12.5%, 23.25% and 0%, respectively, as of December 31, 2013. The Company has a contractual tax rate in Singapore of 0% through March 2016, based upon achievement of contractual milestones that the Company expects to continue to meet. The current statutory tax rate in Singapore is 17%.
The Company’s effective tax rates for the years ended December 31, 2013, 2012 and 2011 were 8.2%, 5.4% and 15.0%, respectively. The income tax provision for 2013 included a $31 million net tax benefit related to the completion of tax audit examinations. In addition, the research and development tax credit (“R&D Tax Credit”) was retroactively extended in January 2013 for the 2012 and 2013 tax years. The entire $3 million benefit related to the 2012 tax year was recorded in the first quarter of 2013, and the 2013 benefit is included in the annual effective tax rate. The net income tax benefits related to the completed tax audit examinations and the 2012 R&D Tax Credit decreased the Company’s effective tax rate by 6.9 percentage points in 2013. The income tax provision for the year ended December 31, 2012 included a $36 million tax benefit related to the Company’s refinancing of certain of its inter-company debt arrangements, which enabled the Company to recognize a deferred tax asset associated with a non-U.S. net operating loss carryforward. During the year ended December 31, 2012, the Company also recorded a $6 million tax benefit related to tax audit settlements in the U.S. These tax benefits decreased the Company’s effective tax rate by 8.6 percentage points in the year ended December 31, 2012. Included in the income tax provision for the year ended December 31, 2011 is $2 million of tax benefit related to the reversal of a reserve for interest related to a tax audit settlement in the United Kingdom. This tax benefit decreased the Company’s effective tax rate by 0.3 percentage points in the year ended December 31, 2012. The remaining differences between the effective tax rates for 2013, 2012 and 2011 were primarily attributable to differences in the proportionate amounts of pre-tax income recognized in jurisdictions with different effective tax rates.
62
Year Ended December 31, 2013 2012 2011
The current and deferred components of the provision for income taxes on operations are as follows:
Current $ 39,933 $ 78,401 $ 82,108 Deferred 169 (52,219 ) (5,824 )
Total $ 40,102 $ 26,182 $ 76,284
The jurisdictional components of the provision for income taxes on operations are as follows:
Federal $ (702 ) $ 39,840 $ 33,242 State 5,142 5,599 5,661 Foreign 35,662 (19,257 ) 37,381
Total $ 40,102 $ 26,182 $ 76,284
The differences between income taxes computed at the United States statutory rate and the provision for income taxes are summarized as follows:
Federal tax computed at U.S. statutory income tax rate $ 171,537 $ 170,669 $ 178,238 Settlement of tax audits (30,552 ) (6,035 ) (1,617 ) State income tax, net of federal income tax benefit 3,342 3,639 3,679 Net effect of foreign operations (96,461 ) (102,858 ) (100,911 ) Recognition of deferred tax asset associated with a non-U.S. net operating loss — (36,410 ) — Other, net (7,764 ) (2,823 ) (3,105 )
Provision for income taxes $ 40,102 $ 26,182 $ 76,284

Table of Contents
NOTES TO CONSOLIDATED FINANCIAL STATEMENTS — (Conti nued)
The tax effects of temporary differences and carryforwards which give rise to deferred tax assets and deferred tax (liabilities) are summarized as follows (in thousands):
Net deferred tax assets of $32 million and $51 million are included in other current assets at December 31, 2013 and 2012, respectively, and net deferred tax assets of $69 million are included in other assets for both periods. Net deferred tax liabilities of $1 million and $18 million are included in other current liabilities and other long-term liabilities, respectively, at December 31, 2013. During the year ended December 31, 2012, the deferred tax assets associated with net operating losses and tax credit carryforwards and the related valuation allowance increased due to the aforementioned tax benefit related to the Company’s refinancing of inter-company debt arrangements. This deferred tax asset was established for $111 million, for which a $75 million valuation allowance was established and a $36 million tax benefit was recorded in the income tax provision. The Company’s net deferred tax assets associated with net operating losses and tax credit carryforwards are approximately $32 million as of December 31, 2013, which represent the future tax benefit of foreign net operating loss carryforwards that do not expire under current law.
The income tax benefits associated with non-qualified stock option compensation expense recognized for tax purposes and credited to additional paid-in capital were $16 million, $11 million and $32 million for the years ended December 31, 2013, 2012 and 2011, respectively.
At December 31, 2013, there were unremitted earnings of foreign subsidiaries of approximately $3 billion. The Company has not provided for U.S. income taxes or foreign withholding taxes on these earnings as it is the Company’s current intention to permanently reinvest these earnings outside the U.S. Because of the complexity of U.S. and foreign tax rules applicable to the distribution of earnings from foreign subsidiaries to U.S. legal entities, the determination of the unrecognized deferred tax liability on these earnings is not practicable. Events that could trigger a tax might include U.S. acquisitions or other investments funded by cash distributions or loans from a foreign subsidiary.
63
December 31, 2013 2012 Deferred tax assets:
Net operating losses and credits $ 116,567 $ 119,405 Depreciation 7,163 14,555 Stock-based compensation 22,684 25,024 Deferred compensation 25,391 29,666 Revaluation of equity investments 3,832 3,919 Inventory 3,651 3,658 Accrued liabilities and reserves 23,268 36,711 Other 15,289 19,038
Total deferred tax assets 217,845 251,976 Valuation allowance (94,952 ) (93,576 )
Deferred tax assets, net of valuation allowance 122,893 158,400 Deferred tax liabilities:
Capitalized software (18,012 ) (15,726 ) Amortization (3,798 ) (3,980 ) Indefinite-lived intangibles (18,840 ) (18,252 ) Other — (4 )
Total deferred tax liabilities (40,650 ) (37,962 )
Net deferred tax assets $ 82,243 $ 120,438

Table of Contents
NOTES TO CONSOLIDATED FINANCIAL STATEMENTS — (Conti nued)
The Company accounts for its uncertain tax return reporting positions in accordance with the accounting standards for income taxes, which require financial statement reporting of the expected future tax consequences of uncertain tax reporting positions on the presumption that all concerned tax authorities possess full knowledge of those tax reporting positions, as well as all of the pertinent facts and circumstances, but prohibit any discounting of those unrecognized tax benefits associated with those reporting positions for the time value of money.
The following is a summary of the activity of the Company’s unrecognized tax benefits for the years ended December 31, 2013, 2012 and 2011 (in thousands):
The Company’s uncertain tax positions are taken with respect to income tax return reporting periods beginning after December 31, 2007, which are the periods that generally remain open to income tax audit examination by income tax authorities. The Company continuously monitors the lapsing of statutes of limitations on potential tax assessments for related changes in the measurement of unrecognized tax benefits, related net interest and penalties, and deferred tax assets and liabilities.
During the year ended December 31, 2013, the Company concluded tax audit disputes with tax authorities in the U.S. and Japan that were related to matters for which the Company had previously recorded uncertain tax benefits of approximately $35 million. The resolution of these tax audit disputes also entailed net global assessments against the Company of approximately $4 million. Accordingly, the Company recorded a $35 million reduction in the measurement of its unrecognized tax benefits and a $4 million increase in its current tax liabilities in the year ended December 31, 2013, which reduced the provision for income taxes and increased net income for the year ended December 31, 2013 by $31 million. As of December 31, 2013, the Company expects to record additional reductions in the measurement of its unrecognized tax benefits and related net interest and penalties of approximately $6 million within the next twelve months due to the lapsing of statutes of limitations on potential tax assessments. The Company does not expect to record any other material reductions in the measurement of its unrecognized tax benefits within the next twelve months.
10 Litigation
From time to time, the Company and its subsidiaries are involved in various litigation matters arising in the ordinary course of business. The Company believes it has meritorious arguments in its current litigation matters and believes any outcome, either individually or in the aggregate, will not be material to the Company’s financial position, results of operations or cash flows. In June 2012, a $3 million payment was made to settle a complaint that was filed against the Company alleging patent infringement.
The Company has been engaged in ongoing patent litigation with Agilent Technologies GmbH (“Agilent”) in Germany. In July 2005, Agilent brought an action against the Company alleging that certain features of the Alliance pump continued to infringe certain of its patents. In August 2006, following a trial in this action, the German court ruled that the Company did not infringe the patents. Agilent filed an appeal in this action. A hearing on this appeal was held in January 2008. The appeals court affirmed the finding of the trial court that the Company did not infringe and Agilent appealed this finding to the German Federal Court of Justice. In December
64
2013 2012 2011 Balance at the beginning of the period $ 64,390 $ 73,199 $ 71,523
Realization of uncertain U.S. tax benefits — (5,625 ) — Changes resulting from completion of tax examinations (35,279 ) — — Other changes in uncertain tax benefits (4,395 ) (3,184 ) 1,676
Balance at the end of the period $ 24,716 $ 64,390 $ 73,199

Table of Contents
NOTES TO CONSOLIDATED FINANCIAL STATEMENTS — (Conti nued) 2012, Agilent won this appeal and the Company recorded a $4 million provision for damages and fees estimated to be incurred in connection with this litigation. The accrued patent litigation expense is in other current liabilities in the consolidated balance sheets at December 31, 2013 and 2012.
11 Other Commitments and Contingencies
Lease agreements, expiring at various dates through 2026, cover buildings, office equipment and automobiles. Rental expense was $30 million, $30 million and $28 million during the years ended December 31, 2013, 2012 and 2011, respectively. Future minimum rents payable as of December 31, 2013 under non-cancelable leases with initial terms exceeding one year are as follows (in thousands):
The Company licenses certain technology and software from third parties. Future minimum license fees payable under existing license agreements as of December 31, 2013 are immaterial for the years ended December 31, 2014 and thereafter.
The Company enters into standard indemnification agreements in its ordinary course of business. Pursuant to these agreements, the Company indemnifies, holds harmless and agrees to reimburse the indemnified party for losses suffered or incurred by the indemnified party, generally the Company’s business partners or customers, in connection with patent, copyright or other intellectual property infringement claims by any third party with respect to its current products, as well as claims relating to property damage or personal injury resulting from the performance of services by the Company or its subcontractors. The maximum potential amount of future payments the Company could be required to make under these indemnification agreements is unlimited. Historically, the Company’s costs to defend lawsuits or settle claims relating to such indemnity agreements have been minimal and management accordingly believes the estimated fair value of these agreements is immaterial.
12 Stock-Based Compensation
In May 2012, the Company’s shareholders approved the Company’s 2012 Equity Incentive Plan (“2012 Plan”). As of December 31, 2013, the 2012 Plan has 4.9 million shares available for grant in the form of incentive or non-qualified stock options, stock appreciation rights (“SARs”), restricted stock, restricted stock units or other types of awards. The Company issues new shares of common stock upon exercise of stock options or restricted stock unit conversion. Under the 2012 Plan, the exercise price for stock options may not be less than the fair market value of the underlying stock at the date of grant. The 2012 Plan is scheduled to terminate on May 9, 2022. Options generally will expire no later than ten years after the date on which they are granted and will become exercisable as directed by the Compensation Committee of the Board of Directors and generally vest in equal annual installments over a five-year period. A SAR may be granted alone or in conjunction with an option or other award. Shares of restricted stock and restricted stock units may be issued under the 2012 Plan for such consideration as is determined by the Compensation Committee of the Board of Directors. As of December 31, 2013, the Company had stock options, restricted stock and restricted stock unit awards outstanding.
In May 2009, the Company’s shareholders approved the 2009 Employee Stock Purchase Plan under which eligible employees may contribute up to 15% of their earnings toward the quarterly purchase of the Company’s common stock. The plan makes available 0.9 million shares of the Company’s common stock, which includes the remaining shares available under the 1996 Employee Stock Purchase Plan. As of December 31, 2013, 1.2 million shares have been issued under both the 2009 and 1996 Employee Stock Purchase Plans. Each plan period lasts
65
2014 $ 23,668 2015 17,953 2016 11,475 2017 7,276 2018 and thereafter 18,060

Table of Contents
NOTES TO CONSOLIDATED FINANCIAL STATEMENTS — (Conti nued) three months beginning on January 1, April 1, July 1 and October 1 of each year. The purchase price for each share of stock is the lesser of 90% of the market price on the first day of the plan period or 100% of the market price on the last day of the plan period. Stock-based compensation expense related to this plan was $1 million for each of the years ended December 31, 2013, 2012 and 2011, respectively.
The Company accounts for stock-based compensation costs in accordance with the accounting standards for stock-based compensation, which require that all share-based payments to employees be recognized in the statements of operations based on their fair values. The Company recognizes the expense using the straight-line attribution method. The stock-based compensation expense recognized in the consolidated statements of operations is based on awards that ultimately are expected to vest; therefore, the amount of expense has been reduced for estimated forfeitures. The stock-based compensation accounting standards require forfeitures to be estimated at the time of grant and revised, if necessary, in subsequent periods if actual forfeitures differ from those estimates. Forfeitures are estimated based on historical experience. If actual results differ significantly from these estimates, stock-based compensation expense and the Company’s results of operations could be materially impacted. In addition, if the Company employs different assumptions in the application of these standards, the compensation expense that the Company records in the future periods may differ significantly from what the Company has recorded in the current period.
The consolidated statements of operations for the years ended December 31, 2013, 2012 and 2011 include the following stock-based compensation expense related to stock option awards, restricted stock, restricted stock unit awards and the employee stock purchase plan (in thousands):
Stock Options
In determining the fair value of the stock options, the Company makes a variety of assumptions and estimates, including volatility measures, expected yields and expected stock option lives. The fair value of each option grant was estimated on the date of grant using the Black-Scholes option pricing model. The Company uses implied volatility on its publicly-traded options as the basis for its estimate of expected volatility. The Company believes that implied volatility is the most appropriate indicator of expected volatility because it is generally reflective of historical volatility and expectations of how future volatility will differ from historical volatility. The expected life assumption for grants is based on historical experience for the population of non-qualified stock optionees. The risk-free interest rate is the yield currently available on U.S. Treasury zero-coupon issues with a remaining term approximating the expected term used as the input to the Black-Scholes model. The relevant data used to determine the value of the stock options granted during 2013, 2012 and 2011 are as follows:
66
2013 2012 2011
Cost of sales $ 2,523 $ 2,694 $ 2,566 Selling and administrative expenses 25,252 22,679 21,891 Research and development expenses 3,933 3,810 3,122
Total stock-based compensation $ 31,708 $ 29,183 $ 27,579
Options Issued and Significant Assumptions Used to Estimate Option Fair Values 2013 2012 2011 Options issued in thousands 428 699 658 Risk-free interest rate 1.7 % 1.0 % 1.1 % Expected life in years 5 6 6 Expected volatility 0.248 0.265 0.376 Expected dividends — — —

Table of Contents
NOTES TO CONSOLIDATED FINANCIAL STATEMENTS — (Conti nued)
The following table summarizes stock option activity for the plans for the year ended December 31, 2013 (in thousands, except per share data):
The following table details the weighted-average remaining contractual life of options outstanding at December 31, 2013 by range of exercise prices (in thousands, except per share data):
During 2013, 2012 and 2011, the total intrinsic value of the stock options exercised (i.e., the difference between the market price at exercise and the price paid by the employee to exercise the options) was $64 million, $31 million and $67 million, respectively. The total cash received from the exercise of these stock options was $64 million, $24 million and $56 million for the years ended December 31, 2013, 2012 and 2011, respectively.
The aggregate intrinsic value of the outstanding stock options at December 31, 2013 was $113 million. Options exercisable at December 31, 2013, 2012 and 2011 were 2.2 million, 2.9 million and 2.9 million, respectively. The weighted-average exercise prices of options exercisable at December 31, 2013, 2012 and 2011 were $60.88, $54.00 and $47.95, respectively. The weighted-average remaining contractual life of the exercisable outstanding stock options at December 31, 2013 was 4.5 years.
At December 31, 2013, the Company had 3.9 million stock options which are vested and expected to vest. The intrinsic value, weighted-average price and remaining contractual life of the vested and expected to vest stock options were $113 million, $70.89 and 6.1 years, respectively, at December 31, 2013.
As of December 31, 2013, 2012 and 2011, there were $40 million, $45 million and $45 million of total unrecognized compensation costs related to unvested stock option awards that are expected to vest. These costs are expected to be recognized over a weighted-average period of 3.4 years.
Restricted Stock
During each of the years ended December 31, 2013, 2012 and 2011, the Company granted 12 thousand shares of restricted stock. The weighted-average fair value per share on the grant date of the restricted stock granted in 2013, 2012 and 2011 was $88.71, $78.10 and $61.63, respectively. The Company has recorded $2 million, $1
67
Weighted-Average Exercise Price and Fair Value of Options on the Date of Grant 2013 2012 2011
Exercise price $ 97.74 $ 86.55 $ 79.10 Fair value $ 27.37 $ 23.97 $ 29.67
Number of Shares Exercise Price per
Share
Weighted-Average
Exercise Price
Outstanding at December 31, 2012 4,809 $ 23.19 to $ 87.06 $ 63.34 Granted 428 $ 88.71 to $103.47 $ 97.74 Exercised (1,281 ) $ 23.19 to $ 79.15 $ 50.89 Canceled (39 ) $ 36.25 to $ 79.15 $ 72.42
Outstanding at December 31, 2013 3,917 $ 33.12 to $103.47 $ 71.08
Exercise Price Range
Number of Shares
Outstanding
Weighted- Average
Exercise Price
Remaining Contractual Life of
Options Outstanding
Number of Shares
Exercisable
Weighted- Average
Exercise Price $33.12 to $48.99 901 $ 43.85 2.4 898 $ 43.88 $49.00 to $78.99 840 $ 64.59 5.0 707 $ 64.68 $79.00 to $103.47 2,176 $ 84.86 8.4 637 $ 80.63
Total 3,917 $ 71.08 6.3 2,242 $ 60.88

Table of Contents
NOTES TO CONSOLIDATED FINANCIAL STATEMENTS — (Conti nued) million and $1 million of compensation expense in each of the years ended December 31, 2013, 2012 and 2011, respectively, related to the restricted stock grants. As of December 31, 2013, the Company had 36 thousand unvested shares of restricted stock outstanding with a total of less than $1 million of unrecognized compensation costs. These costs are expected to be recognized over a weighted-average period of 0.9 years.
Restricted Stock Units
The following table summarizes the unvested restricted stock unit award activity for the year ended December 31, 2013 (in thousands, except for per share amounts):
Restricted stock units are generally issued annually in February and vest in equal annual installments over a five-year period. The amount of compensation costs recognized for the years ended December 31, 2013, 2012 and 2011 on the restricted stock units expected to vest were $12 million, $13 million and $13 million, respectively. As of December 31, 2013, there were $37 million of total unrecognized compensation costs related to the restricted stock unit awards that are expected to vest. These costs are expected to be recognized over a weighted-average period of 3.7 years.
13 Earnings Per Share
Basic and diluted EPS calculations are detailed as follows (in thousands, except per share data):
68
Shares
Weighted-Average
Price
Unvested at December 31, 2012 574 $ 67.28 Granted 303 $ 94.74 Vested (207 ) $ 60.65 Forfeited (28 ) $ 72.27
Unvested at December 31, 2013 642 $ 82.16
Year Ended December 31, 2013
Net Income
Weighted-Average
Shares Per Share (Numerator) (Denominator) Amount
Net income per basic common share $ 450,003 85,426 $ 5.27 Effect of dilutive stock option, restricted stock and restricted stock unit securities 1,120
Net income per diluted common share $ 450,003 86,546 $ 5.20
Year Ended December 31, 2012
Net Income
Weighted-Average
Shares Per Share (Numerator) (Denominator) Amount
Net income per basic common share $ 461,443 87,841 $ 5.25 Effect of dilutive stock option, restricted stock and restricted stock unit securities 1,138
Net income per diluted common share $ 461,443 88,979 $ 5.19

Table of Contents
NOTES TO CONSOLIDATED FINANCIAL STATEMENTS — (Conti nued)
For the years ended December 31, 2013, 2012 and 2011, the Company had 1.1 million, 2.0 million and 1.3 million stock options that were antidilutive, respectively, due to having higher exercise prices than the Company’s average stock price during the period. These securities were not included in the computation of diluted EPS. The effect of dilutive securities was calculated using the treasury stock method.
14 Retirement Plans
U.S. employees are eligible to participate in the Waters Employee Investment Plan, a 401(k) defined contribution plan, immediately upon hire. Employees may contribute from 1% to 30% of eligible pay on a pre-tax basis and the Company makes matching contributions of 100% for contributions up to 6% of eligible pay. Employees are 100% vested in employee and Company matching contributions. For the years ended December 31, 2013, 2012 and 2011, the Company’s matching contributions amounted to $13 million, $12 million and $12 million, respectively.
The Company maintains two defined benefit plans in the U.S. for which the pay credit accruals have been frozen, the Waters Retirement Plan and the Waters Retirement Restoration Plan (collectively, the “U.S. Pension Plans”). The Company also sponsors other employee benefit plans in the U.S., including a retiree healthcare plan, which provides reimbursement for medical expenses and is contributory. There are various employee benefit plans outside the United States (both defined benefit and defined contribution plans). Certain non-U.S. defined benefit plans (“Non-U.S. Pension Plans”) are included in the disclosures below, which are required under the accounting standards for retirement benefits.
The Company contributed $12 million, $11 million and $10 million in the years ended December 31, 2013, 2012 and 2011, respectively, to the non-U.S. plans (primarily defined contribution plans) which are currently outside of the scope of the required disclosures. The eligibility and vesting of non-U.S. plans are generally consistent with local laws and regulations.
The net periodic pension cost is made up of several components that reflect different aspects of the Company’s financial arrangements as well as the cost of benefits earned by employees. These components are determined using the projected unit credit actuarial cost method and are based on certain actuarial assumptions. The Company’s accounting policy is to reflect in the projected benefit obligation all benefit changes to which the Company is committed as of the current valuation date; use a market-related value of assets to determine pension expense; amortize increases in prior service costs on a straight-line basis over the expected future service of active participants as of the date such costs are first recognized; and amortize cumulative actuarial gains and losses in excess of 10% of the larger of the market-related value of plan assets and the projected benefit obligation over the expected future service of active participants.
Summary data for the U.S. Pension Plans, U.S. retiree healthcare plan and Non-U.S. Pension Plans are presented in the following tables, using the measurement dates of December 31, 2013 and 2012, respectively.
69
Year Ended December 31, 2011
Net Income
Weighted-Average
Shares Per Share (Numerator) (Denominator) Amount
Net income per basic common share $ 432,968 90,833 $ 4.77 Effect of dilutive stock option, restricted stock and restricted stock unit securities 1,492
Net income per diluted common share $ 432,968 92,325 $ 4.69

Table of Contents
NOTES TO CONSOLIDATED FINANCIAL STATEMENTS — (Conti nued)
The reconciliation of the projected benefit obligations at December 31, 2013 and 2012 is as follows (in thousands):
The accumulated benefit obligations at December 31, 2013 and 2012 are as follows (in thousands):
The reconciliation of the fair value of the plan assets at December 31, 2013 and 2012 is as follows (in thousands):
70
2013 2012
U.S. Pension Plans
U.S. Retiree
Healthcare
Plan
Non-U.S. Pension Plans
U.S. Pension Plans
U.S. Retiree
Healthcare
Plan
Non-U.S. Pension Plans
Projected benefit obligation, January 1 $ 145,047 $ 10,788 $ 64,857 $ 136,256 $ 9,146 $ 29,195 Service cost — 1,733 5,079 9 1,447 4,318 Interest cost 5,505 333 1,966 5,806 350 1,988 Actuarial (gains) losses (13,328 ) (1,292 ) (925 ) 6,184 325 5,790 Benefits paid (2,631 ) (542 ) (1,743 ) (3,208 ) (480 ) (1,011 ) Plan amendments — — 232 — — — Other plans — — 227 — — 25,041 Currency impact — — (577 ) — — (464 )
Projected benefit obligation, December 31 $ 134,593 $ 11,020 $ 69,116 $ 145,047 $ 10,788 $ 64,857
2013 2012
U.S. Pension Plans
U.S. Retiree
Healthcare
Plan
Non-U.S. Pension Plans
U.S. Pension Plans
U.S. Retiree
Healthcare
Plan
Non-U.S. Pension Plans
Accumulated benefit obligation $ 134,592 * * $ 58,471 $ 145,045 * * $ 55,937 ** Not applicable.
2013 2012
U.S. Pension Plans
U.S. Retiree
Healthcare
Plan
Non-U.S. Pension Plans
U.S. Pension Plans
U.S. Retiree
Healthcare
Plan
Non-U.S. Pension Plans
Fair value of plan assets, January 1 $ 106,572 $ 5,357 $ 35,859 $ 91,610 $ 4,319 $ 12,798 Actual return on plan assets 19,755 693 1,948 11,761 516 1,007 Company contributions 4,820 290 4,104 6,409 275 4,243 Employee contributions — 818 612 — 727 566 Benefits paid (2,631 ) (542 ) (1,743 ) (3,208 ) (480 ) (1,011 ) Other plans — — — — — 18,382 Currency impact — — 40 — — (126 )
Fair value of plan assets, December 31 $ 128,516 $ 6,616 $ 40,820 $ 106,572 $ 5,357 $ 35,859

Table of Contents
NOTES TO CONSOLIDATED FINANCIAL STATEMENTS — (Conti nued)
The summary of the funded status of the plans at December 31, 2013 and 2012 is as follows (in thousands):
The summary of the amounts recognized in the consolidated balance sheets for the plans at December 31, 2013 and 2012 is as follows (in thousands):
The summary of the components of net periodic pension costs for the plans for the years ended December 31, 2013, 2012 and 2011 is as follows (in thousands):
71
2013 2012
U.S. Pension Plans
U.S. Retiree
Healthcare
Plan
Non-U.S. Pension Plans
U.S. Pension Plans
U.S. Retiree
Healthcare
Plan
Non-U.S. Pension Plans
Projected benefit obligation $ (134,593 ) $ (11,020 ) $ (69,116 ) $ (145,047 ) $ (10,788 ) $ (64,857 ) Fair value of plan assets 128,516 6,616 40,820 106,572 5,357 35,859
Projected benefit obligation in excess of fair value of plan assets $ (6,077 ) $ (4,404 ) $ (28,296 ) $ (38,475 ) $ (5,431 ) $ (28,998 )
2013 2012
U.S. Pension Plans
U.S. Retiree
Healthcare
Plan
Non-U.S. Pension Plans
U.S. Pension Plans
U.S. Retiree
Healthcare
Plan
Non-U.S. Pension Plans
Long-term assets $ — $ — $ 1,370 $ — $ — $ 1,407 Current liabilities — (262 ) (193 ) (140 ) (283 ) (175 ) Long-term liabilities (6,077 ) (4,142 ) (29,473 ) (38,335 ) (5,148 ) (30,230 )
Net amount recognized at December 31 $ (6,077 ) $ (4,404 ) $ (28,296 ) $ (38,475 ) $ (5,431 ) $ (28,998 )
2013 2012 2011
U.S. Pension Plans
U.S. Retiree
Healthcare
Plan
Non-U.S.
Pension Plans
U.S. Pension Plans
U.S. Retiree
Healthcare
Plan
Non-U.S.
Pension Plans
U.S. Pension Plans
U.S. Retiree
Healthcare
Plan
Non-U.S.
Pension Plans
Service cost $ — $ 915 $ 4,467 $ 9 $ 720 $ 3,752 $ 7 $ 545 $ 1,872 Interest cost 5,505 333 1,966 5,806 350 1,988 6,166 364 1,079 Expected return on plan assets (8,034 ) (355 ) (901 ) (7,619 ) (287 ) (838 ) (7,443 ) (277 ) (313 ) Net amortization:
Prior service credit — (54 ) (216 ) — (54 ) (267 ) — (53 ) (89 ) Net actuarial loss 3,432 — 516 3,009 — 367 1,782 — 37
Net periodic pension cost $ 903 $ 839 $ 5,832 $ 1,205 $ 729 $ 5,002 $ 512 $ 579 $ 2,586

Table of Contents
NOTES TO CONSOLIDATED FINANCIAL STATEMENTS — (Conti nued)
The summary of the changes in plan assets and benefit obligations recognized in other comprehensive income (loss) for the years ended December 31, 2013, 2012 and 2011 is as follows (in thousands):
The summary of the amounts included in accumulated other comprehensive (loss) income in stockholders’ equity for the plans at December 31, 2013 and 2012 is as follows (in thousands):
The summary of the amounts included in accumulated other comprehensive income (loss) expected to be included in next year’s net periodic benefit cost for the plans at December 31, 2013 is as follows (in thousands):
72
2013 2012 2011
U.S. Pension Plans
U.S. Retiree
Healthcare
Plan
Non-U.S.
Pension Plans
U.S. Pension Plans
U.S. Retiree
Healthcare
Plan
Non-U.S. Pension Plans
U.S. Pension Plans
U.S. Retiree
Healthcare
Plan
Non-U.S.
Pension Plans
Prior service cost $ — $ — $ 232 $ — $ — $ — $ — $ — $ (3,619 ) Net (loss) gain arising during the
year (25,048 ) (1,629 ) (1,940 ) 2,042 96 5,622 23,170 546 481 Amortization:
Prior service credit — 54 216 — 54 267 — 53 89 Net loss (3,432 ) — (516 ) (3,009 ) — (367 ) (1,782 ) — (37 )
Other Plans — — — — — 5,970 — — — Currency impact — — 497 — — 424 — — 55
Total recognized in other comprehensive income (loss) $ (28,480 ) $ (1,575 ) $ (1,511 ) $ (967 ) $ 150 $ 11,916 $ 21,388 $ 599 $ (3,031 )
2013 2012
U.S. Pension Plans
U.S. Retiree
Healthcare
Plan
Non-U.S. Pension Plans
U.S. Pension Plans
U.S. Retiree
Healthcare
Plan
Non-U.S. Pension Plans
Net actuarial (loss) gain $ (27,999 ) $ 1,233 $ (11,190 ) $ (56,479 ) $ (395 ) $ (13,674 ) Prior service credit — 52 1,933 — 105 2,938
Total $ (27,999 ) $ 1,285 $ (9,257 ) $ (56,479 ) $ (290 ) $ (10,736 )
2013
U.S. Pension Plans
U.S. Retiree
Healthcare
Plan
Non-U.S.
Pension
Plans Net actuarial (loss) gain $ (1,941 ) $ 16 $ (373 ) Prior service credit — 52 187
Total $ (1,941 ) $ 68 $ (186 )

Table of Contents
NOTES TO CONSOLIDATED FINANCIAL STATEMENTS — (Conti nued)
The plans’ investment asset mix is as follow at December 31, 2013 and 2012:
The plans’ investment policies include the following asset allocation guidelines:
The asset allocation policy for the U.S. Pension Plans and U.S. retiree healthcare plan was developed in consideration of the following long-term investment objectives: achieving a return on assets consistent with the investment policy, achieving portfolio returns which exceed the average return for similarly invested funds and maximizing portfolio returns with at least a return of 2.5% above the one-year constant maturity Treasury bond yield over reasonable measurement periods and based on reasonable market cycles.
Within the equity portfolio of the U.S. retirement plans, investments are diversified among market capitalization and investment strategy. The Company targets a 20% allocation of its U.S. retirement plans’ equity portfolio to be invested in financial markets outside of the United States. The Company does not invest in its own stock within the U.S. retirement plans’ assets.
73
2013 2012
U.S. Pension
Plans
U.S. Retiree
Healthcare
Plan
Non-U.S.
Pension
Plans
U.S. Pension
Plans
U.S. Retiree
Healthcare
Plan
Non-U.S.
Pension
Plans Equity securities 75 % 59 % 0 % 65 % 57 % 0 % Debt securities 24 % 25 % 0 % 33 % 22 % 0 % Cash and cash equivalents 1 % 16 % 16 % 2 % 21 % 17 % Insurance contracts and other 0 % 0 % 84 % 0 % 0 % 83 %
Total 100 % 100 % 100 % 100 % 100 % 100 %
U.S. Pension and U.S. Retiree
Healthcare Plans
Non-U.S.
Pension Plans Policy Target Policy Target Range
Equity securities 60 % 40% - 80% 0 % Debt securities 25 % 20% - 60% 0 % Cash and cash equivalents 5 % 0% - 20% 20 % Other 10 % 0% - 20% 80 %

Table of Contents
NOTES TO CONSOLIDATED FINANCIAL STATEMENTS — (Conti nued)
The fair value of the Company’s retirement plan assets are as follows at December 31, 2013 (in thousands):
The fair value of the Company’s retirement plan assets are as follows at December 31, 2012 (in thousands):
74
Total at December 31,
2013
Quoted Prices
in Active Markets
for Identical Assets
(Level 1)
Significant Other
Observable
Inputs (Level 2)
Significant Unobservable
Inputs
(Level 3) U.S. Pension Plans:
Mutual funds $ 117,718 $ 117,718 $ — $ — Common stocks 3,123 3,123 — — Cash equivalents 650 — 650 — Hedge funds 7,025 — — 7,025
Total U.S. Pension Plans 128,516 120,841 650 7,025 U.S. Retiree Healthcare Plan:
Mutual funds 5,589 5,589 — — Cash equivalents 1,027 — 1,027 —
Total U.S. Retiree Healthcare Plan 6,616 5,589 1,027 — Non-U.S. Pension Plans:
Cash equivalents 6,400 6,400 — — Bank and insurance investment contracts 34,420 — — 34,420
Total Non-U.S. Pension Plans 40,820 6,400 — 34,420
Total fair value of retirement plan assets $ 175,952 $ 132,830 $ 1,677 $ 41,445
Total at December 31,
2012
Quoted Prices
in Active Markets
for Identical Assets
(Level 1)
Significant Other
Observable
Inputs (Level 2)
Significant Unobservable
Inputs
(Level 3)
U.S. Pension Plans: Mutual funds $ 93,061 $ 92,830 $ 231 $ — Common stocks 4,886 4,886 — — Cash equivalents 2,359 — 2,359 — Hedge funds 6,266 — — 6,266
Total U.S. Pension Plans 106,572 97,716 2,590 6,266 U.S. Retiree Healthcare Plan:
Mutual funds 4,236 4,236 — — Cash equivalents 1,121 — 1,121 —
Total U.S. Retiree Healthcare Plan 5,357 4,236 1,121 — Non-U.S. Pension Plans:
Cash equivalents 6,162 6,162 — — Bank and insurance investment contracts 29,697 — — 29,697
Total Non-U.S. Pension Plans 35,859 6,162 — 29,697
Total fair value of retirement plan assets $ 147,788 $ 108,114 $ 3,711 $ 35,963
(a) The mutual fund balance in the U.S. Pension Plans are invested in the following categories: 41% in the common stock of large-cap U.S. companies, 33% in the common stock of international growth companies, and 26% in fixed income bonds issued by U.S. companies and by the U.S. government and its agencies.
(a)
(b)
(c)
(d)
(e)
(c)
(c)
(f)
(g)
(b)
(c)
(d)
(h)
(c)
(c)
(f)

Table of Contents
NOTES TO CONSOLIDATED FINANCIAL STATEMENTS — (Conti nued)
The following table summarizes the changes in fair value of the Level 3 retirement plan assets for the years ended December 31, 2013 and 2012 (in thousands):
The weighted-average assumptions used to determine the benefit obligation in the consolidated balance sheets at December 31, 2013, 2012 and 2011 are as follows:
The weighted-average assumptions used to determine the net periodic pension cost at December 31, 2013, 2012 and 2011 are as follows:
To develop the expected long-term rate of return on assets assumption, the Company considered historical returns and future expectations for returns for each asset class, as well as the target asset allocation of the pension portfolio and historical expenses paid by the plan. A one-quarter percentage point increase in the assumed
75
(b) Represents primarily amounts invested in common stock of technology, healthcare, financial, energy and consumer staples and discretionary U.S. companies.
(c) Primarily represents money market funds held with various financial institutions. (d) Hedge fund invests in both short and long term U.S. common stocks. Management of the hedge funds has the ability to shift investments
from value to growth strategies, from large to small capitalization stocks and from a net long position to a net short position. (e) The mutual fund balance in the U.S. Retiree Healthcare Plan is invested in the following categories: 58% in the common stock of large-
cap U.S. companies, 12% in the common stock of international growth companies and 30% in fixed income bonds of U.S. companies and U.S. government.
(f) Amount represents bank and insurance guaranteed investment contracts. (g) The mutual fund balance in the U.S. Pension Plans are invested in the following categories: 34% in the common stock of large-cap U.S.
companies, 27% in the common stock of international growth companies, and 39% in fixed income bonds issued by U.S. companies and by the U.S. government and its agencies.
(h) The mutual fund balance in the U.S. Retiree Healthcare Plan is invested in the following categories: 63% in the common stock of large-cap U.S. companies, 9% in the common stock of international growth companies and 28% in fixed income bonds of U.S. companies and U.S. government.
Total Hedge Funds
Insurance Guaranteed
Investment Contracts
Fair value of assets, December 31, 2011 $ 13,057 $ 6,018 $ 7,039 Net purchases (sales) and appreciation (depreciation) 4,524 248 4,276 Other Plans 18,382 — 18,382
Fair value of assets, December 31, 2012 35,963 6,266 29,697 Net purchases (sales) and appreciation (depreciation) 5,482 759 4,723
Fair value of assets, December 31, 2013 $ 41,445 $ 7,025 $ 34,420
2013 2012 2011
U.S. Non-U.S. U.S.
Non-U.S. U.S.
Non-U.S.
Discount rate 4.82 % 3.29 % 3.90 % 3.10 % 4.33 % 3.29 % Increases in compensation levels 4.75 % 2.54 % 4.75 % 2.59 % 4.75 % 2.91 %
2013 2012 2011
U.S. Non-U.S. U.S.
Non-U.S. U.S.
Non-U.S.
Discount rate 3.61 % 3.10 % 4.26 % 3.29 % 5.10 % 3.63 % Return on plan assets 6.94 % 2.40 % 7.12 % 1.88 % 7.20 % 2.50 % Increases in compensation levels 4.75 % 2.59 % 4.75 % 2.91 % 4.75 % 2.90 %

Table of Contents
NOTES TO CONSOLIDATED FINANCIAL STATEMENTS — (Conti nued) long-term rate of return on assets would decrease the Company’s net periodic benefit cost for the Waters Retirement Plan by less than $1 million. A one-quarter percentage point increase in the discount rate would decrease the Company’s net periodic benefit cost for the Waters Retirement Plan by less than $1 million.
During fiscal year 2014, the Company expects to contribute a total of approximately $8 million to $10 million to the Company’s defined benefit plans. Estimated future benefit payments as of December 31, 2013 are as follows (in thousands):
15 Business Segment Information
The accounting standards for segment reporting establish standards for reporting information about operating segments in annual financial statements and require selected information for those segments to be presented in interim financial reports of public business enterprises. They also establish standards for related disclosures about products and services, geographic areas and major customers. The Company’s business activities, for which discrete financial information is available, are regularly reviewed and evaluated by the chief operating decision maker. As a result of this evaluation, the Company determined that it has two operating segments: Waters Division and TA Division.
Waters Division is primarily in the business of designing, manufacturing, distributing and servicing LC and MS instruments, columns and other chemistry consumables that can be integrated and used along with other analytical instruments. TA Division is primarily in the business of designing, manufacturing, distributing and servicing thermal analysis, rheometry and calorimetry instruments. The Company’s two divisions are its operating segments and each has similar economic characteristics; product processes; products and services; types and classes of customers; methods of distribution and regulatory environments. Because of these similarities, the two segments have been aggregated into one reporting segment for financial statement purposes. Please refer to the consolidated financial statements for financial information regarding the one reportable segment of the Company.
Net sales for the Company’s products and services are as follows for the years ended December 31, 2013, 2012 and 2011 (in thousands):
76
U.S. Pension and
Retiree Healthcare Plans
Non-U.S. Pension Plans Total
2014 $ 7,162 $ 982 $ 8,144 2015 7,191 1,176 8,367 2016 7,516 3,236 10,752 2017 8,097 1,844 9,941 2018 8,654 1,841 10,495 2019 - 2023 55,140 14,750 69,890
2013 2012 2011
Product net sales:
Waters instrument systems $ 840,608 $ 828,458 $ 878,367 Chemistry 304,130 294,787 292,506 TA instrument systems 167,765 157,262 151,263
Total product sales 1,312,503 1,280,507 1,322,136 Service net sales:
Waters service 532,323 509,412 480,553 TA service 59,392 53,722 48,495
Total service sales 591,715 563,134 529,048
Total net sales $ 1,904,218 $ 1,843,641 $ 1,851,184

Table of Contents
NOTES TO CONSOLIDATED FINANCIAL STATEMENTS — (Conti nued)
Geographic sales information is presented below for the years ended December 31, 2013, 2012 and 2011 (in thousands):
The Other category includes Canada, Latin America and Puerto Rico. Net sales are attributable to geographic areas based on the region of destination. None of the Company’s individual customers accounts for more than 2% of annual Company sales.
Long-lived assets information at December 31, 2013 and 2012 is presented below (in thousands):
The Other category includes Canada, Latin America and Puerto Rico. Long-lived assets exclude goodwill, other intangible assets and other assets.
77
2013 2012 2011
Net Sales: United States $ 557,734 $ 531,912 $ 530,606 Europe 573,786 549,341 574,770 Asia:
China 240,535 212,701 175,409 Japan 170,115 207,340 211,893 Asia Other 216,229 215,612 222,082
Total Asia 626,879 635,653 609,384 Other 145,819 126,735 136,424
Total net sales $ 1,904,218 $ 1,843,641 $ 1,851,184
2013 2012
Long-lived assets:
United States $ 174,143 $ 173,932 Europe 138,962 89,389 Asia 10,412 8,467 Other 1,415 1,491
Total long-lived assets $ 324,932 $ 273,279

Table of Contents
NOTES TO CONSOLIDATED FINANCIAL STATEMENTS — (Conti nued) 16 Unaudited Quarterly Results
The Company’s unaudited quarterly results are summarized below (in thousands, except per share data):
78
2013 First
Quarter Second Quarter
Third Quarter
Fourth Quarter Total
Net sales $ 430,338 $ 451,115 $ 457,317 $ 565,448 $ 1,904,218 Cost of sales 174,568 188,329 191,568 228,991 783,456
Gross profit 255,770 262,786 265,749 336,457 1,120,762 Selling and administrative expenses 118,660 123,062 120,563 130,680 492,965 Research and development expenses 25,312 24,650 23,599 26,975 100,536 Purchased intangibles amortization 2,393 2,382 2,518 2,625 9,918
Operating income 109,405 112,692 119,069 176,177 517,343 Other expense (Note 3) — (1,575 ) — — (1,575 ) Interest expense (7,185 ) (7,580 ) (7,358 ) (7,927 ) (30,050 ) Interest income 1,187 1,179 946 1,075 4,387
Income from operations before income taxes 103,407 104,716 112,657 169,325 490,105 Provision for income tax (benefit) expense (17,652 ) 15,402 14,609 27,743 40,102
Net income $ 121,059 $ 89,314 $ 98,048 $ 141,582 $ 450,003
Net income per basic common share 1.41 1.04 1.15 1.67 5.27 Weighted-average number of basic common shares 86,049 85,482 85,185 85,006 85,426 Net income per diluted common share 1.39 1.03 1.14 1.65 5.20 Weighted-average number of diluted common shares and
equivalents 87,215 86,576 86,364 86,017 86,546
2012 First
Quarter Second Quarter
Third Quarter
Fourth Quarter Total
Net sales $ 420,458 $ 451,465 $ 449,952 $ 521,766 $ 1,843,641 Cost of sales 167,290 179,259 182,702 208,363 737,614
Gross profit 253,168 272,206 267,250 313,403 1,106,027 Selling and administrative expenses 117,119 122,682 115,322 122,147 477,270 Research and development expenses 23,347 23,943 23,756 24,958 96,004 Purchased intangibles amortization 2,485 2,458 6,427 2,459 13,829 Litigation provisions — 3,000 — 4,434 7,434
Operating income 110,217 120,123 121,745 159,405 511,490 Interest expense (6,491 ) (6,878 ) (7,107 ) (7,597 ) (28,073 ) Interest income 769 1,031 1,184 1,224 4,208
Income from operations before income taxes 104,495 114,276 115,822 153,032 487,625 Provision for income tax expense (benefit) 15,829 16,552 16,713 (22,912 ) 26,182
Net income $ 88,666 $ 97,724 $ 99,109 $ 175,944 $ 461,443
Net income per basic common share 1.00 1.11 1.13 2.03 5.25 Weighted-average number of basic common shares 88,992 88,317 87,411 86,712 87,841 Net income per diluted common share 0.98 1.09 1.12 2.00 5.19 Weighted-average number of diluted common shares and
equivalents 90,269 89,381 88,451 87,851 88,979

Table of Contents
NOTES TO CONSOLIDATED FINANCIAL STATEMENTS — (Conti nued)
The Company typically experiences an increase in sales in the fourth quarter, as a result of purchasing habits for capital goods of customers that tend to exhaust their spending budgets by calendar year end. Selling and administrative expenses are typically higher in the second and third quarters over the first quarter in each year as the Company’s annual payroll merit increases take effect. Selling and administrative expenses will vary in the fourth quarter in relation to performance in the quarter and for the year.
In the first quarter of 2013, the Company recorded a $31 million net tax benefit related to the completion of tax audit examinations. In addition, the R&D Tax Credit was retroactively extended in January 2013 for the 2012 and 2013 tax years. The entire $3 million benefit related to the 2012 tax year was recorded in the first quarter of 2013, and the 2013 benefit is included in the annual effective tax rate (see Note 9). The Company recorded litigation provisions in the second and fourth quarters of 2012 for damages and fees estimated to be incurred in connection with complaints filed against the Company relating to patent infringement lawsuits (see Note 10). In the third quarter of 2012, the Company incurred a one-time $4 million charge to purchased intangibles amortization expense related to the discontinuance of a product trade name intangible asset (see Note 7). In the fourth quarter of 2012, the Company recorded a $36 million tax benefit related to the reduction in a deferred tax asset valuation reserve associated with the Company’s refinancing of certain of its inter-company debt arrangements, which enabled the Company to recognize a deferred tax asset associated with a non-U.S. net operating loss carryforward (see Note 9). In the fourth quarter of 2012, the Company also recorded a $6 million tax benefit related to tax audit settlements in the U.S.
79

Table of Contents
Item 9: Changes in and Disagreements with Accountants on Accounting and Financial Disclosure
None.
Item 9A: Controls and Procedures
Evaluation of Disclosure Controls and Procedures
The Company’s chief executive officer and chief financial officer (principal executive and principal financial officer), with the participation of management, evaluated the effectiveness of the Company’s disclosure controls and procedures (as defined in Rules 13a-15(e) and 15d-15(e) under the Exchange Act) as of the end of the period covered by this annual report on Form 10-K. Based on this evaluation, the Company’s chief executive officer and chief financial officer concluded that the Company’s disclosure controls and procedures were effective as of December 31, 2013 (1) to ensure that information required to be disclosed by the Company, including its consolidated subsidiaries, in the reports that it files or submits under the Exchange Act is accumulated and communicated to the Company’s management, including its chief executive officer and chief financial officer, to allow timely decisions regarding the required disclosure and (2) to provide reasonable assurance that information required to be disclosed by the Company in the reports that it files or submits under the Exchange Act is recorded, processed, summarized and reported within the time periods specified in the SEC’s rules and forms.
Management’s Annual Report on Internal Control Over Financial Reporting
See Management’s Report on Internal Control Over Financial Reporting in Item 8 on page 39 of this Form 10-K.
Report of the Independent Registered Public Accounting Firm
See the report of PricewaterhouseCoopers LLP in Item 8 on page 40 of this Form 10-K.
Changes in Internal Controls Over Financial Reporting
No change was identified in the Company’s internal control over financial reporting (as defined in Rules 13a-15(f) and 15d-15(f) under the Exchange Act) during the quarter ended December 31, 2013 that has materially affected, or is reasonably likely to materially affect, the Company’s internal control over financial reporting.
Item 9B: Other Information
None.
80

Table of Contents
PART III
Information regarding the Company’s directors is contained in the definitive proxy statement for the 2014 Annual Meeting of Stockholders under the headings “Election of Directors”, “Directors Meetings and Board Committees”, “Corporate Governance”, “Report of the Audit Committee of the Board of Directors” and “Compensation of Directors and Executive Officers”. Information regarding compliance with Section 16(a) of the Exchange Act is contained in the Company’s definitive proxy statement for the 2014 Annual Meeting of Stockholders under the heading “Section 16(A) Beneficial Ownership Reporting Compliance.” Information regarding the Company’s Audit Committee and Audit Committee Financial Expert is contained in the definitive proxy statement for the 2014 Annual Meeting of Stockholders under the headings “Report of the Audit Committee of the Board of Directors” and “Directors Meetings and Board Committees”. Such information is incorporated herein by reference. Information regarding the Company’s executive officers is contained in Part I of this Form 10-K.
The Company has adopted a Code of Business Conduct and Ethics (the “Code”) that applies to all of the Company’s employees (including its executive officers) and directors and that is in compliance with Item 406 of Regulation S-K. The Code has been distributed to all employees of the Company. In addition, the Code is available on the Company’s website, www.waters.com , under the caption “Governance”. The Company intends to satisfy the disclosure requirement regarding any amendment to, or waiver of a provision of, the Code applicable to any executive officer or director by posting such information on its website. The Company shall also provide to any person without charge, upon request, a copy of the Code. Any such request must be made in writing to the Secretary of the Company, c/o Waters Corporation, 34 Maple Street, Milford, MA 01757.
The Company’s corporate governance guidelines and the charters of the audit committee, compensation committee, and nominating and corporate governance committee of the Board of Directors are available on the Company’s website, www.waters.com , under the caption “Governance”. The Company shall provide to any person without charge, upon request, a copy of any of the foregoing materials. Any such request must be made in writing to the Secretary of the Company, c/o Waters Corporation, 34 Maple Street, Milford, MA 01757.
The Company has not made any material changes to the procedures by which security holders may recommend nominees to the Company’s Board of Directors.
This information is contained in the Company’s definitive proxy statement for the 2014 Annual Meeting of Stockholders under the headings “Compensation of Directors and Executive Officers”, “Compensation Committee Interlocks and Insider Participation” and “Compensation Committee Report”. Such information is incorporated herein by reference.
Except for the Equity Compensation Plan information set forth below, this information is contained in the Company’s definitive proxy statement for the 2014 Annual Meeting of Stockholders under the heading “Security Ownership of Certain Beneficial Owners and Management”. Such information is incorporated herein by reference.
81
Item 10: Directors, Executive Officers and Corporate Governance
Item 11: Executive Compensation
Item 12: Security Ownership of Certain Beneficial Owners and Management and Related Stockholder Matters

Table of Contents
Equity Compensation Plan Information
The following table provides information as of December 31, 2013 about the Company’s common stock that may be issued upon the exercise of options, warrants, and rights under its existing equity compensation plans (in thousands):
See Note 12, Stock-Based Compensation, in the Notes to Consolidated Financial Statements for a description of the material features of the Company’s equity compensation plans.
This information is contained in the Company’s definitive proxy statement for the 2014 Annual Meeting of Stockholders under the headings “Directors Meetings and Board Committees”, “Corporate Governance” and “Compensation of Directors and Executive Officers”. Such information is incorporated herein by reference.
This information is contained in the Company’s definitive proxy statement for the 2014 Annual Meeting of Stockholders under the headings “Ratification of Selection of Independent Registered Public Accounting Firm” and “Report of the Audit Committee of the Board of Directors”. Such information is incorporated herein by reference.
82
A B C
Number of Securities to be Issued Upon Exercise
of Outstanding
Options, Warrants and Rights
Weighted-Average Exercise Price of
Outstanding Options,
Warrants and Rights
Number of Securities Remaining Available for
Future Issuance Under Equity Compensation
Plans (excluding securities reflected in
column (A))
Equity compensation plans approved by security holders 3,917 $ 71.08 5,857
Equity compensation plans not approved by security holders — — —
Total 3,917 $ 71.08 5,857
Item 13: Certain Relationships and Related Transactions and Director Independence
Item 14: Principal Accountant Fees and Services

Table of Contents
PART IV
(a) Documents filed as part of this report:
The consolidated financial statements of the Company and its subsidiaries are filed as part of this Form 10-K and are set forth on pages 41 to 79. The report of PricewaterhouseCoopers LLP, an independent registered public accounting firm, dated February 27, 2014, is set forth on page 40 of this Form 10-K.
See (c) below.
83
Item 15: Exhibits, Financial Statement Schedules
(1) Financial Statements:
(2) Financial Statement Schedule:
(3) Exhibits:
Exhibit Number Description of Document
3.1 Second Amended and Restated Certificate of Incorporation of Waters Corporation.(1)
3.2
Certificate of Amendment of Second Amended and Restated Certificate of Incorporation of Waters Corporation, dated as of May 12, 1999.(3)
3.3
Certificate of Amendment of Second Amended and Restated Certificate of Incorporation of Waters Corporation, dated as of July 27, 2000.(4)
3.4
Certificate of Amendment of Second Amended and Restated Certificate of Incorporation of Waters Corporation, dated as of May 25, 2001.(5)
3.5 Amended and Restated Bylaws of Waters Corporation, dated as of October 16, 2013.(20)
10.1 Waters Corporation Retirement Plan.(2)(*)
10.2 Waters Corporation 2003 Equity Incentive Plan.(6)(*)
10.3 First Amendment to the Waters Corporation 2003 Equity Incentive Plan.(7)(*)
10.4 Form of Director Stock Option Agreement under the Waters Corporation 2003 Equity Incentive Plan, as amended.(8)(*)
10.5 Form of Director Restricted Stock Agreement under the Waters Corporation 2003 Equity Incentive Plan, as amended.(8)(*)
10.6
Form of Executive Officer Stock Option Agreement under the Waters Corporation 2003 Equity Incentive Plan, as amended.(8)(*)
10.7 Second Amendment to the Waters Corporation 2003 Equity Incentive Plan.(9)(*)
10.8 Third Amendment to the Waters Corporation 2003 Equity Incentive Plan.(10)(*)
10.9 Amended and Restated Waters 401(k) Restoration Plan, effective January 1, 2008.(11)(*)
10.10
Change of Control/Severance Agreement, dated as of February 27, 2008, between Waters Corporation and Mark T. Beaudouin.(12)(*)
10.11
Change of Control/Severance Agreement, dated as of February 27, 2008, between Waters Corporation and Douglas A. Berthiaume.(12)(*)
10.12
Change of Control/Severance Agreement, dated as of February 27, 2008, between Waters Corporation and Arthur G. Caputo.(12)(*)

Table of Contents
84
Exhibit Number Description of Document
10.13 Change of Control/Severance Agreement, dated as of February 27, 2008, between Waters Corporation and John Ornell.(12)(*)
10.14
Change of Control/Severance Agreement, dated as of February 27, 2008, between Waters Corporation and Elizabeth B. Rae.(12)(*)
10.15 Amended and Restated Waters Retirement Restoration Plan, effective January 1, 2008.(13)(*)
10.16
Amended and Restated Waters Corporation 1996 Non-Employee Director Deferred Compensation Plan, Effective January 1, 2008.(13)(*)
10.17 2008 Waters Corporation Management Incentive Plan.(13)(*)
10.18 Waters Corporation 2009 Employee Stock Purchase Plan (14)(*)
10.19 Note Purchase Agreement, dated as of February 1, 2010, between Waters Corporation and the purchases named therein.(15)
10.20 First Amendment to the Note Purchase Agreement, dated as of February 1, 2010.(16)
10.21 Note Purchase Agreement, dated March 15, 2011, between Waters Corporation and the purchases named therein.(16)
10.22 Waters Corporation 2012 Equity Incentive Plan.(17)(*)
10.23 Form of Waters 2012 Stock Option Agreement—Executive Officers.(18)(*)
10.24 Form of Waters 2012 Stock Option Agreement—Directors.(18)(*)
10.25 Form of Waters 2012 Restricted Stock Agreement—Directors.(18)(*)
10.26
Credit Agreement, dated as of June 25, 2013, among Waters Corporation, JPMorgan Chase Bank, N.A., JP Morgan Europe Limited and other Lenders party thereto.(19)
10.27 Form of Waters 2012 Restricted Stock Unit Agreement for Executive Officers—Five Year Vesting.(21)(*)
10.28 Form of Waters 2012 Restricted Stock Unit Agreement for Executive Officers—One Year Vesting.(21)(*)
21.1 Subsidiaries of Waters Corporation.
23.1 Consent of PricewaterhouseCoopers LLP, an independent registered public accounting firm.
31.1 Chief Executive Officer Certification Pursuant to Section 302 of the Sarbanes-Oxley Act of 2002.
31.2 Chief Financial Officer Certification Pursuant to Section 302 of the Sarbanes-Oxley Act of 2002.
32.1
Chief Executive Officer Certification Pursuant to 18 U.S.C. Section 1350, as Adopted Pursuant to Section 906 of the Sarbanes-Oxley Act of 2002.(**)
32.2
Chief Financial Officer Certification Pursuant to 18 U.S.C. Section 1350, as Adopted Pursuant to Section 906 of the Sarbanes-Oxley Act of 2002.(**)
101
The following materials from Waters Corporation’s Annual Report on Form 10-K for the year ended December 31, 2013, formatted in XBRL (Extensible Business Reporting Language): (i) the Consolidated Balance Sheets, (ii) the Consolidated Statements of Operations, (iii) the Consolidated Statements of Comprehensive Income (iv) the Consolidated Statements of Cash Flows, (v) the Consolidated Statements of Stockholders’ Equity and (vi) Notes to Consolidated Financial Statements.
(1) Incorporated by reference to the Registrant’s Report on Form 10-K dated March 29, 1996 (File No. 001-14010).

Table of Contents
(b) See Item 15 (a) (3) above.
(c) Financial Statement Schedule:
85
(2) Incorporated by reference to the Registrant’s Registration Statement on Form S-1 (File No. 333-96934).
(3) Incorporated by reference to the Registrant’s Report on Form 10-Q dated August 11, 1999 (File No. 001-14010).
(4) Incorporated by reference to the Registrant’s Report on Form 10-Q dated August 8, 2000 (File No. 001-14010).
(5) Incorporated by reference to the Registrant’s Report on Form 10-K dated March 28, 2002 (File No. 001-14010).
(6) Incorporated by reference to the Registrant’s Report on Form S-8 dated November 20, 2003 (File No. 333-110613).
(7) Incorporated by reference to the Registrant’s Report on Form 10-K dated March 12, 2004 (File No. 001-14010).
(8) Incorporated by reference to the Registrant’s Report on Form 10-Q dated November 10, 2004 (File No. 001-14010).
(9) Incorporated by reference to the Registrant’s Report on Form 10-Q dated August 5, 2005 (File No. 001-14010).
(10) Incorporated by reference to the Registrant’s Report on Form 10-K dated March 1, 2007 (File No. 001-14010).
(11) Incorporated by reference to the Registrant’s Report on Form 10-Q dated November 2, 2007 (File No. 001-14010).
(12) Incorporated by reference to the Registrant’s Report on Form 10-K dated February 29, 2008 (File No. 001-14010).
(13) Incorporated by reference to the Registrant’s Report on Form 10-K dated February 27, 2009 (File No. 001-14010).
(14) Incorporated by reference to the Registrant’s Report on Form S-8 dated July 10, 2009 (File No. 333-160507).
(15) Incorporated by reference to the Registrant’s Report on Form 10-K dated February 26, 2010 (File No. 001-14010).
(16) Incorporated by reference to the Registrant’s Report on Form 10-Q dated May 6, 2011 (File No. 001-14010).
(17) Incorporated by reference to the Registrant’s Report on Form S-8 dated September 5, 2012 (File No. 333-183721).
(18) Incorporated by reference to the Registrant’s Report on Form 8-K dated December 11, 2012 (File No. 001-14010).
(19) Incorporated by reference to the Registrant’s Report on Form 10-Q dated August 1, 2013 (File No. 001-14010).
(20) Incorporated by reference to the Registrant’s Report on Form 10-Q dated November 1, 2013 (File No. 001-14010).
(21) Incorporated by reference to the Registrant’s Report on Form 8-K dated December 11, 2013 (File No. 001-14010).
(*) Management contract or compensatory plan required to be filed as an Exhibit to this Form 10-K.
(**) This exhibit shall not be deemed “filed” for purposes of Section 18 of the Exchange Act, or otherwise subject to the liability of that section, nor shall it be deemed incorporated by reference into any filing under the Securities Act of 1933, as amended, or the Exchange Act, whether made before or after the date hereof and irrespective of any general incorporation language in any filing, except to the extent the Company specifically incorporates it by reference.

Table of Contents
WATERS CORPORATION AND SUBSIDIARIES SCHEDULE II—VALUATION AND QUALIFYING ACCOUNTS For each of the three years in the period ended December 31, 2013
86
Balance at
Beginning
of Period
Charged to Provision for
Income Taxes*
Amounts Recorded in
Additional Paid-
In Capital**
Balance at
End of Period
Valuation allowance for deferred tax assets:
2013 $ 93,576 $ 484 $ 892 $ 94,952 2012 $ 10,248 $ 80,974 $ 2,354 $ 93,576 2011 $ 10,361 $ 63 $ (176 ) $ 10,248
* These amounts have been recorded as part of the income statement provision for income taxes. The income statement effects of these
amounts have largely been offset by amounts related to changes in other deferred tax balance sheet accounts. ** During the years ended December 31, 2013 and 2012, the Company recorded amounts associated with the tax benefit related to stock
option plans in additional paid-in capital. During the year ended December 31, 2011, the Company released valuation allowances on a portion of the deferred tax assets created by the tax benefit related to stock option plans that had been previously established in additional paid-in capital.

Table of Contents
SIGN ATURES
Pursuant to the requirements of Section 13 or 15(d) of the Securities Exchange Act of 1934, the registrant has duly caused this report to be signed on its behalf by the undersigned, thereunto duly authorized.
Date: February 27, 2014
Pursuant to the requirements of the Securities Exchange Act of 1934, this report has been signed by the following persons on behalf of the registrant and in the capacities indicated on February 27, 2014.
87
W ATERS C ORPORATION
/ S / E UGENE G. C ASSIS
Eugene G. Cassis Corporate Vice President and
Chief Financial Officer
/ S / D OUGLAS A. B ERTHIAUME Douglas A. Berthiaume
Chairman of the Board of Directors, President and Chief Executive Officer (principal executive officer)
/ S / E UGENE G. C ASSIS Eugene G. Cassis
Corporate Vice President and Chief Financial Officer (principal financial officer)
/ S / J OSHUA B EKENSTEIN Joshua Bekenstein
Director
/ S / D R . M ICHAEL J. B ERENDT Dr. Michael J. Berendt
Director
/ S / E DWARD C ONARD Edward Conard
Director
/ S / D R . L AURIE H. G LIMCHER Dr. Laurie H. Glimcher
Director
/ S / C HRISTOPHER A. K UEBLER Christopher A. Kuebler
Director
/ S / W ILLIAM J. M ILLER William J. Miller
Director
/ S / J O A NN A. R EED JoAnn A. Reed
Director
/ S / T HOMAS P. S ALICE Thomas P. Salice
Director

Exhibit 21.1
* All subsidiaries are 100% owned unless otherwise indicated.
Waters Corporation and Subsidiaries 12/31/2013 Waters Corporation (Delaware)
Waters Technologies Corporation (Delaware) Waters Australia PTY LTD. Waters A/S (Denmark) Waters AG (Switzerland) Waters NV (Belgium) Waters Cromatografia SA (Spain) Waters SA de CV (Mexico) Waters Technologies do Brasil Ltda (Brazil) Waters Ges.MBH (Austria)
Waters Kft (Hungary) Waters Sp.Zo.o (Poland) Waters OOO (Russia)
Waters SAS (France) Waters SpA (Italy) Waters Sverige AB (Sweden) Waters Limited (Canada) TA Instruments-Waters LLC (Delaware) Environmental Resource Assoc., Inc. (Colorado) Waters India Pvt. Ltd.
Esbee Wire Pvt. Ltd. (India) Waters Asia Limited (Delaware)
Waters Korea Limited (Korea) Waters China Ltd. (Hong Kong) Waters Technologies (Shanghai) Ltd (China) Waters Pacific Pte Ltd (Singapore)
Nihon Waters Limited (Delaware) Nihon Waters K.K. (Japan) TA Instruments Japan, Inc. (Japan)
Waters Finance V LLC Microsep Proprietary Ltd (So. Africa) (24.5%)
Waters Technologies Corporation (continued) MM European Holdings LLP
Milford International Limited Manchester International Limited Waters Realty Holdings Limited Melborne International Limited Waters Finance III LLC Waters Tech. Holdings Ltd (Ireland) Waters Celtic Holdings Ltd (Ireland)
Waters Technologies Ireland Ltd (Ireland) Waters Chromatography Ireland Ltd (Ireland)
Waters GmbH (Germany) Waters Srl (Romania) Expert Systems Solutions Srl (Italy)
Waters (TC) Israel Limited (Israel) Waters Luxembourg SARL (Luxembourg)
Subsidiaries of Waters Luxembourg SARL
Micromass Holdings Ltd. (UK)
Waters Chromatography BV (Netherlands) Waters Chromatography Europe BV (Netherlands) Waters Tech. LC-MS (Portugal) Unapessol Lda
(Portugal) Micromass Ltd. (UK)
Waters Limited (UK) Micromass UK Ltd. (UK) Non-Linear Dynamics Limited (UK) PRA Europe Limited (UK)

Exhibit 23.1
CONSENT OF INDEPENDENT REGISTERED PUBLIC ACCOUNTING FIRM
We hereby consent to the incorporation by reference in the Registration Statements on Forms S-3 (No. 333-134492) and S-8 (Nos. 333-183721, 333-160507, 333-137990, 333-110613, 333-92332, 333-60054, 333-81723, 333-18371) of Waters Corporation of our report dated February 27, 2014 relating to the financial statements, financial statement schedule and the effectiveness of internal control over financial reporting, which appears in this Form 10-K.
/s/ PricewaterhouseCoopers LLP Boston, Massachusetts February 27, 2014

Exhibit 31.1
CHIEF EXECUTIVE OFFICER CERTIFICATION PURSUANT TO S ECTION 302 OF THE SARBANES-OXLEY ACT OF 2002
I, Douglas A. Berthiaume, certify that:
1. I have reviewed this annual report on Form 10-K of Waters Corporation;
2. Based on my knowledge, this report does not contain any untrue statement of a material fact or omit to state a material fact necessary to make the statements made, in light of the circumstances under which such statements were made, not misleading with respect to the period covered by this report;
3. Based on my knowledge, the financial statements, and other financial information included in this report, fairly present in all material respects the financial condition, results of operations and cash flows of the registrant as of, and for, the periods presented in this report;
4. The registrant’s other certifying officer(s) and I are responsible for establishing and maintaining disclosure controls and procedures (as defined in Exchange Act Rules 13a-15(e) and 15d-15(e)) and internal control over financial reporting (as defined in Exchange Act Rules 13a-15(f) and 15d-15(f)) for the registrant and have:
a) designed such disclosure controls and procedures, or caused such disclosure controls and procedures to be designed under
our supervision, to ensure that material information relating to the registrant, including its consolidated subsidiaries, is made known to us by others within those entities, particularly during the period in which this report is being prepared;
b) designed such internal control over financial reporting, or caused such internal control over financial reporting to be
designed under our supervision, to provide reasonable assurance regarding the reliability of financial reporting and the preparation of financial statements for external purposes in accordance with generally accepted accounting principles;
c) evaluated the effectiveness of the registrant’s disclosure controls and procedures and presented in this report our conclusions
about the effectiveness of the disclosure controls and procedures, as of the end of the period covered by this report based on such evaluation; and
d) disclosed in this report any change in the registrant’s internal control over financial reporting that occurred during the
registrant’s most recent fiscal quarter (the registrant’s fourth fiscal quarter in the case of an annual report) that has materially affected, or is reasonably likely to materially affect, the registrant’s internal control over financial reporting; and
5. The registrant’s other certifying officer(s) and I have disclosed, based on our most recent evaluation of internal control over financial reporting, to the registrant’s auditors and the audit committee of the registrant’s board of directors (or persons performing the equivalent functions):
a) all significant deficiencies and material weaknesses in the design or operation of internal control over financial reporting
which are reasonably likely to adversely affect the registrant’s ability to record, process, summarize and report financial information; and
b) any fraud, whether or not material, that involves management or other employees who have a significant role in the registrant’s internal control over financial reporting.
Date: February 27, 2014 /s/ Douglas A. Berthiaume Douglas A. Berthiaume Chief Executive Officer

Exhibit 31.2
CHIEF FINANCIAL OFFICER CERTIFICATION PURSUANT TO S ECTION 302 OF THE SARBANES-OXLEY ACT OF 2002
I, Eugene G. Cassis, certify that:
1. I have reviewed this annual report on Form 10-K of Waters Corporation;
2. Based on my knowledge, this report does not contain any untrue statement of a material fact or omit to state a material fact necessary to make the statements made, in light of the circumstances under which such statements were made, not misleading with respect to the period covered by this report;
3. Based on my knowledge, the financial statements, and other financial information included in this report, fairly present in all material respects the financial condition, results of operations and cash flows of the registrant as of, and for, the periods presented in this report;
4. The registrant’s other certifying officer(s) and I are responsible for establishing and maintaining disclosure controls and procedures (as defined in Exchange Act Rules 13a-15(e) and 15d-15(e)) and internal control over financial reporting (as defined in Exchange Act Rules 13a-15(f) and 15d-15(f)) for the registrant and have:
a) designed such disclosure controls and procedures, or caused such disclosure controls and procedures to be designed under
our supervision, to ensure that material information relating to the registrant, including its consolidated subsidiaries, is made known to us by others within those entities, particularly during the period in which this report is being prepared;
b) designed such internal control over financial reporting, or caused such internal control over financial reporting to be
designed under our supervision, to provide reasonable assurance regarding the reliability of financial reporting and the preparation of financial statements for external purposes in accordance with generally accepted accounting principles;
c) evaluated the effectiveness of the registrant’s disclosure controls and procedures and presented in this report our conclusions
about the effectiveness of the disclosure controls and procedures, as of the end of the period covered by this report based on such evaluation; and
d) disclosed in this report any change in the registrant’s internal control over financial reporting that occurred during the
registrant’s most recent fiscal quarter (the registrant’s fourth fiscal quarter in the case of an annual report) that has materially affected, or is reasonably likely to materially affect, the registrant’s internal control over financial reporting; and
5. The registrant’s other certifying officer(s) and I have disclosed, based on our most recent evaluation of internal control over financial reporting, to the registrant’s auditors and the audit committee of the registrant’s board of directors (or persons performing the equivalent functions):
a) all significant deficiencies and material weaknesses in the design or operation of internal control over financial reporting
which are reasonably likely to adversely affect the registrant’s ability to record, process, summarize and report financial information; and
b) any fraud, whether or not material, that involves management or other employees who have a significant role in the registrant’s internal control over financial reporting.
Date: February 27, 2014 /s/ Eugene G. Cassis Eugene G. Cassis Chief Financial Officer

Exhibit 32.1
CHIEF EXECUTIVE OFFICER CERTIFICATION PURSUANT TO 1 8 U.S.C. SECTION 1350, AS ADOPTED PURSUANT TO SECTION 906
OF THE SARBANES-OXLEY ACT OF 2002
The certification set forth below is hereby made solely for the purpose of satisfying the requirements of Section 906 of the Sarbanes-Oxley Act of 2002 and may not be relied upon or used for any other purposes.
In connection with the Annual Report of Waters Corporation (the “Company”) on Form 10-K for the period ended December 31, 2013, as filed with the Securities and Exchange Commission on the date hereof (the “Report”), I, Douglas A. Berthiaume, Chief Executive Officer of the Company, certify, pursuant to 18 U.S.C. Section 1350, as adopted pursuant to Section 906 of the Sarbanes-Oxley Act of 2002, that to my knowledge: (1) the Report fully complies with the requirements of Section 13(a) or 15(d) of the Securities Exchange Act of 1934; and (2) the information contained in the Report fairly presents, in all material respects, the financial condition and results of operations of the Company.
A signed original of this written statement required by Section 906 or other document authenticating, acknowledging or otherwise adopting the signature that appears in typed form within the electronic version of this written statement required by Section 906 has been provided to the Company and will be retained by the Company and furnished to the Securities and Exchange Commission or its staff upon request. Date: February 27, 2014
By: /s/ Douglas A. Berthiaume Douglas A. Berthiaume Chief Executive Officer

Exhibit 32.2
CHIEF FINANCIAL OFFICER CERTIFICATION PURSUANT TO 1 8 U.S.C. SECTION 1350, AS ADOPTED PURSUANT TO SECTION 906
OF THE SARBANES-OXLEY ACT OF 2002
The certification set forth below is hereby made solely for the purpose of satisfying the requirements of Section 906 of the Sarbanes-Oxley Act of 2002 and may not be relied upon or used for any other purposes.
In connection with the Annual Report of Waters Corporation (the “Company”) on Form 10-K for the period ended December 31, 2013, as filed with the Securities and Exchange Commission on the date hereof (the “Report”), I, Eugene G. Cassis, Chief Financial Officer of the Company, certify, pursuant to 18 U.S.C. Section 1350, as adopted pursuant to Section 906 of the Sarbanes-Oxley Act of 2002, that to my knowledge: (1) the Report fully complies with the requirements of Section 13(a) or 15(d) of the Securities Exchange Act of 1934; and (2) the information contained in the Report fairly presents, in all material respects, the financial condition and results of operations of the Company.
A signed original of this written statement required by Section 906 or other document authenticating, acknowledging or otherwise adopting the signature that appears in typed form within the electronic version of this written statement required by Section 906 has been provided to the Company and will be retained by the Company and furnished to the Securities and Exchange Commission or its staff upon request. Date: February 27, 2014
By: /s/ Eugene G. Cassis Eugene G. Cassis Chief Financial Officer