
LTSBERGEN WATERS - JScholarship
146
f^mfmm GC '401 .N 18 1915 Q 3""l151 02749 8702 LTSBERGEN WATERS OCEANOGRAPHIC OBSERVATIONS DURING THE CRUISE OF THE "VESLEMOY" TO SPITSBERGEN IN 1912 BY FRIDTJOF NANSEN (ViDEHSKAPSSELSKAPKTS SKRIFTKR. I. MAT.-NATURV. KLASSE. I9I5. No. SI UTGIT FOR FRIDTJOF NANSENS FOND CHRISTIANIA IN COMMISSION AT JACOB DYBWAD 19x5
-
Upload
khangminh22 -
Category
Documents
-
view
0 -
download
0
Transcript of LTSBERGEN WATERS - JScholarship

f^mfmm
GC '401
.N 18 1915 Q 3""l151 02749 8702
LTSBERGEN WATERS OCEANOGRAPHIC OBSERVATIONS DURING
THE CRUISE OF THE "VESLEMOY" TO SPITSBERGEN IN 1912
BY
F R I D T J O F NANSEN
(ViDEHSKAPSSELSKAPKTS S K R I F T K R . I. M A T . - N A T U R V . K L A S S E . I 9 I 5 . No . SI
UTGIT FOR FRIDTJOF NANSENS FOND
CHRISTIANIA IN COMMISSION AT JACOB DYBWAD
19x5


SPITSBERGEN WATERS OCEANOGRAPHIC OBSERVATIONS DURING
THE CRUISE^ OF THE "VESLEMOY" TO SPITSBERGEN IN 1912
BY
FRIDTJOF NANSEN
(VTDENSKAPSSELSKAPKTS SKRIFTER. I. MAT. -NATURV. KLASSE. 1915. No, 2)
UTGIT FOR FRIDTJOF NANSENS FOND
C H R I S T I A N I A
IN COMMISSION AT JACOB DYBWAD
1915

Fremlagt i den mat.-naturv. klasses mote den l a t e mars f g r -
A . W . BRaGGERS BOKTRYKKEKI A-S

To his Old Friend
PROFESSOR H. MOHN
the Pioneer of Mechanical Oceanography,
on his Eightieth Birthday
from
the Author.


CONTENTS. Page
Introduction i
Bank -Wate r . . . . . . . . 9
The Spitsbergen Atlantic Current . . 10
The W a t e r of the Spitsbergen Fjords, and the Coast W a t e r . 21
The D e e p - W a t e r of the North Polar Basin . . . 37
The D e e p - W a t e r of the Norwegian Sea 39
Current Measurements . . . . . 41
Current Measurements at Stat. 41 , on August i8 th and igth , r g i a . . . 49
Computation of the Velocities of the Currents in the Region between Stats.
41 and 40, by means of Dynamic Sections . . . . . . . 66
Current Measurements on August 4th and 5th 69
Computation of the Velocities of the Currents at Stats. 18 to 22 . . . . 73
Dynamic Current Charts . . . 76
Vertical Oscillations of the W a t e r Strata 80
The Tidal W a v e in the North Polar Basin 83
Ice-Pressures and the Tidal W a v e 86
The Extension and Shape of the North Polar Basin . . 92
Investigations on the Amount of Oxygen in the Spitsbergen W a t e r s . . . . • gg
.Some Observations of the Hydrogen Ion Concentration in the Northern S e a - W a t e r . 105
Table I. Temperature , Salinity, and Density of the Sea -Wate r 107
Table II. Current-Measurements . . . 118
Table III, Measurements of the Oxygen in the Sea -Wate r 127
Table IV. Measurements of the Hydrogen Ion Concentration of the Sea -Wate r . 129
Literature . . . 131

Introduction.
D. 'uring the Fram-Expedition 1893—1896 the deep North Polar Basin
was discovered. This basin was found to be filled with water of Atlantic
origin below a depth of 200 or 300 metres. According to our obser
vations the salinity of this deep-water and bottom-water should be con
siderably higher than that of the deep-water of the Norwegian Sea, and
its temperature was also higher. Our determinations of the salinity, or
rather the specific gravity, of the sea-water were, however, made chiefly
with the floating hydrometer, and this method is not sufficiendy accurate.
As the knowledge of the accurate salinity of the deep-waters of the North
Polar Basin is of great importance in several interesting questions connected
with the configuration of the bottom and the circulation of the Northern
Seas, I had attempted to obtain new samples of the deep-water of the sea
north of Spitsbergen, in order to control our observations made during
the Fram-expedition. Three different expeditions had promised to do their
best to collect such samples, but had failed. I therefore decided to make
an attempt to go with my yacht »Veslemoy« to the sea north of Spits
bergen in order to fetch some samples of the deep-water.
It was my plan at the same time to try the practicability of making
exact measurements of the currents and movements of the water at the
different depths of the sea from a ship moored to the drifting ice. This
was a method of investigating the currents of the deep sea, which I had
recommended years ago, but had never yet had an opportunity of trying,
nor had anybody else done so. I also wished to investigate the waters
of some of the Spitsbergen fjords, and to examine other problems connected
with the Spitsbergen waters, which Professor HELLAND-HANSEN and I had
discussed in our paper, »On the Sea Wes t of Spitsbergen* [1912].
The crew of the »Veslem6y« consisted of four men; vis. two sailors
on deck, an engineer for the paraffine motor, and a steward. And then
Vid.-Selsk. Skrifter. I. M.-N. KI. 1915. No. 2. 1
FRIDTJOF NANSEN. M.-N. Kl.
there were Cand. Mag. ILLIT GRONDAHL and my son K.ARF, (nearly 15
years old), as passengers, besides myself who was master of the ship. W e
were thus seven men
all told.
W e sailed fromHam-
merfest on July 8th 1912,
reached Bear Island on
July loth, and took some
few oceanographic stations
on the Bear Island Plat
form south and north of
the island. Some few days
later we reached Spits
bergen, and came to Green
Harbour on July i6th.
During the following days,
from July i8th to 21st,
two oceanographic sta
tions were taken at the
mouth of Ice Fjord. W e
then sailed northwards
along the west coast of
Spitsbergen, in very
stormy weather. W e went
into Cross Bay, where
two oceanographic sta
tions were taken, on July
29th. W e tried to take a
section with stations sea
wards from the mouth of
Kings Bay, but after having
taken only a few stations
we were hindered by
storm. Our forestay was
broken, and as there was
danger of losing our rig
ging we had to return to
Kings Bay for repair. W e then sailed north-wards along the coast, and
a few days later, on August 3rd, we sailed north-north-westwards from
Norway Islands, near the north-western corner of Spitsbergen, to the edge
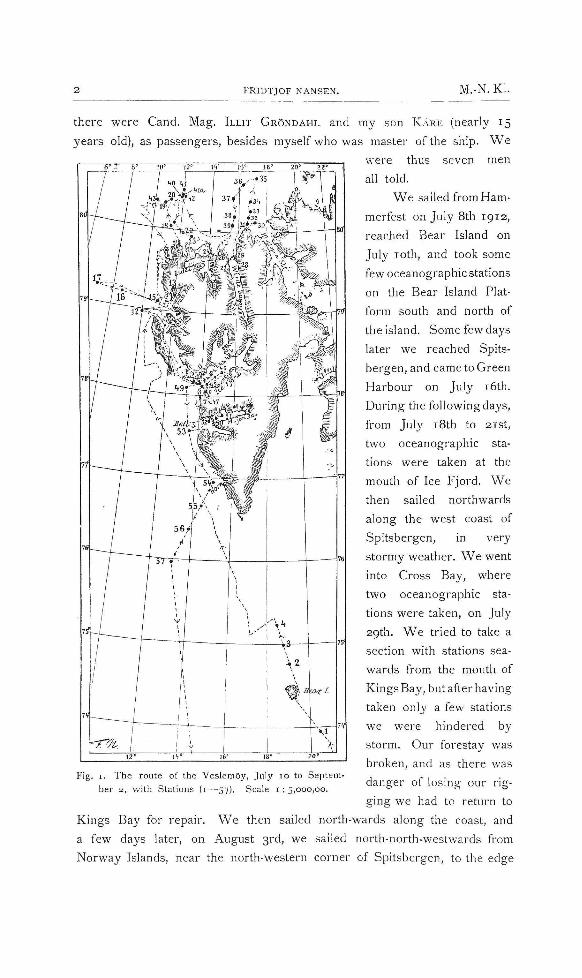
Fig. 1. The route of the Veslemoy, July 10 to Septem
ber 2, with Stations ( i—57). Scale 1:5,000,00.

1915- No. 2. SPITSBERGEN WATERS.
of the ice-pack, taking two oceanographic stations (Stats. i-8 and 19). W e
went as far into the ice as we could get, moored the ship to the biggest
ice-floe we could find, and remained there for some time, making obser
vations. This was at Stat. 19; but in the evening of August 4th the ice
tightened, the wind increased, and there was so much swell coming from
the open sea outside, that there was no little danger in remaining there
between the heavy floes, and we therefore moved a few miles towards north-
Fig. 2, The Veslemoy at the mouth of Ice Fjord, Aug. 34tl], igT2.
north-east, where the ice was more open, and here the ship was moored to
another floe. There we remained during the following day, continuing our
current-measurements and other observations. After midnight, in the early
morning of August 6th, the wind and swell had increased much, and it
was necessary to go out of the ice again. Three oceanographic stations
(Stats. 21—23) were taken on our way towards the north coast of Spits
bergen.
On August gth a section was taken across the mouth of Wood Bay
(and Liefde Bay), with 3 stations. On the following day a similar sec
tion, with 3 stations, was taken across Wijde Bay.

FRIDTJOF NANSEN. M.-N. Kl .
During the following days researches were made at the mouth of
Hinlopen Strait and in the sea to the north of it.
On August 13th we sailed northwards, hoping to reach the deep water
to the north of Spitsbergen, but unfortunately we were stopped by the
ice in about 80° 39' N. and 17° 14' E. (Stat, 35). East of this place,
however, at Stat. 36, we found a depth of 620 metres, being obviously
in a submarine channel passing from Hinlopen Strait across the submarine
platform into the North Polar Basin; and the water near the bottom of
this channel was evidently of the same kind as the deep-water of the
North Polar Basin. j
W e now had to return, there being no prospect of getting farther
north, as the ice was drifting rapidly southwards. W e went again west
wards, and made a new attempt to penetrate northwards, north of the
north-western corner of Spitsbergen; but in 80° 29 ' N. and abou* 12° E.
we were stopped by tight ice at Stat. 41 . The ship was moored to an
ice-floe on August 17th in the evening, and during the following two days,
current-measurements and other observations were continuously taken. In
the afternoon of August-19th, at 6.20 p.m., the tightening of the ice-floes
round the ship, and the heavy swell coming from the sea outside, made
it necessary to leave the ice; and heavy gales during the following days
prevented us from going into the ice again.
On August 24th we returned to Green Harbour. During the next
few days we took several stations at the mouth of Ice Fjord, and as far
in as off Advent Bay.
On August 29th we sailed southwards from Ice Fjord along the west
coast of Spitsbergen. On the following day we paid a visit into Bell Sound,
and took a few oceanographic stations there during August 30th and 31st.
W e then sailed southwards, taking a few oceanographic stations, till we
were off the mouth of Horn Sound. From that place we took a section
with 4 oceanographic stations (Stat. 54—57) towards S S W . W e then got
a gale and shaped our course for Norway. After a stormy passage we
reached Harstad in northern Norway on September 5th.
57 oceanographic stations, with vertical series of temperatures and
water-samples were taken during the cruise, chiefly on the west coast and
to the north of Spitsbergen. Investigations were also made in the following
fjords: Ice Fjord, Cross Bay and Kings Bay, Wood Bay and Liefde Bay,
Wijde Bay, Hinlopen Strait, and Bell Sound. It was mentioned above that
the ice prevented us from coming sufficiently far north to reach the deep
sea, but at the deepest stations water-samples were taken, which seem to
be of the same kind as the deep water of the North Polar Basin.

1915- No . 2. SPITSBERGEN WATERS.
On two occasions we went into the ice, and remained there for some
time making current-measurements while the ship was moored to the ice
floes, and the practicability of this method was proved.
The quantity and o x y g e n of the sea water was examined by the
WINKLER method at various depths at a number of stations. The i o n i c
c o n c e n t r a t i o n of h y d r o g e n of the sea-water was examined by the
Palitzsch method. Samples were also taken for the determination of the ni
trogen compounds of the sea-water, the samples being sterilized by subli
mate; but as no sufficiently accurate method has yet been found for these
investigations, the results obtained are of no value.
During the cruise, all observations and readings were taken by myself,
with the exception of the surface-observations which in most cases were
taken by Mr. GRONDAHL.
W a t e r - B o t t l e s . The water-samples were taken with the following
w a t e r - b o t t l e s :
An A u t o m a t i c I n s u l a t i n g W a t e r - b o t t l e (marked A in the Tab
les) used at the first 5 stations. This water-bottle, which was also used
on the cruise of the »Frithjof« in 1910 [1913, p. 7], works very well, and
gives reliable samples. The instrument has not yet been described.
The PETTERSSON-NANSEN I n s u l a t i n g W a t e r - b o t t l e (marked PN
in the Tables) was used on several occasions.
An EKMAN R e v e r s i n g W a t e r - b o t t l e (marked E in the Tables)
was also used. In order to avoid the possibility of this bottle not closing
properly when reversed, the end of the reversing cylinder had been given
an extra weight of lead, which made the bottle close more safely; but on
a few occasions the samples taken with this bottle seem none the less some
what doubtful.
Two s t o p - c o c k w a t e r - b o t t l e s of my construction (marked I and
II in the Tables) with an arrangement for reversing thermometers were
used at most stations, and were attached to the side of the same line at
different depths. They were the same bottles that were used during the
cruise of the "Fri thjof in 1910 [1913, p. ^]. They always worked well.
I had now had the reversing tube fitted with an extra tube, so that two
reversing thermometers could be used simultaneously in each instrument.
The R e v e r s i n g S t o p - c o c k W a t e r - b o t t l e of my construction
(marked RB in the Tables), mentioned in my paper on the cruise of the
Frithjof [1913, p. 7] was also used at a number of stations. It was attached
to the side of the line.

FRIDTJOF NANSEN. M.-N. Kl .
Except at the first few stations, several water-bottles were always used
on one line attached at different depths. By using the PETTERSSON-NANSEN
water-bottle at the end of the line, and the EKMAN reversing water-bottle,
the two stop-cock water-bottles, and the reversing stop-cock water-bottle
attached to the side of the line, we were able to take the temperatures
and water samples from as many as 5 different depths in the same haul.
T h e T e m p e r a t u r e s . The temperature of the sea-surface was taken
with a water bucket (marked B in the Tables) and an ordinary thermo
meter, and water-samples were taken simultaneously.
The temperature of the sea-water at the different depths was as a
rule determined by the RICHTER reversing thermometer, and two thermo
meters were often used simultaneously at the same depth. Sometimes the
temperature was also taken by the PETTERSSON-NANSEN insulating water-
bottle, and the NANSEN deep-sea thermometer; but the readings of the
latter were as a rule checked by the RICHTER reversing thermometer. At
the first five stations where the depth did not exceed 150 metres, the
temperatures were taken with the new automatic, insulating water-bottle and
an ordinary thermometer.
All thermometers were old instruments, which had been carefully tested.
Most of them were the same thermometers that had been used during the
cruise with the "Frithjof" in 1910. All readings of the thermometers, except
those of the sea-surface, were taken by myself, with a reading lense. The
readings of the reversing thermometers have been corrected for the instru
mental error, the error of freezing-point, and the error caused by the
temperature at which the thermometer was read off. The thermometer-
readings of the insulating water-bottles have been corrected for the instru
mental error of the thermometer, as well as the error caused by the
adiabatic cooling.
The a c c u r a c y of t h e v a l u e s of t e m p e r a t u r e obtained b}' the
reversing thermometers may be expected to lie within + o.of 0 C.
On some occasions the second thermometer (No. P.T. R. 375 47) of the
Ekman Reversing Water-bottle {E) suddenly registered irregularly. During
the first part of the cruise its readings agreed very well with those of the
other thermometer (No. P.T.R. 375 46) of the same water-bottle, except once,
on August 4th (Stat. 19 d, at 80 metres), when it gave — 0 .6400 . instead
of— 0.82 "C . But suddenly on August loth (Stat. 27) it gave — 0.61 " C .
and—^ 0.86" C. instead of 1.71" C. ando .780C . During August loth, n t h ,
and 13th, the thermometer continued to give too low readings (between
— 0.52"C. and — 1.7200.) except at 100 metres, at Stat. 29, where its
value of temperature (— 0.12" C.) agreed perfectly with that of the first ther-

1915- N o . 2 . SPITSBERGEN W A T E R S . 7
mometer. On the afternoons of August 13th the second thermometer again
registered correctly, and after that time it showed no such appreciable
irregularities except on August 26th (Stat. 46, 100 metres) and 31st (Stat.
52, 20 metres) when it gave — 1.09" C. and 0,20" C. instead of— 0.40 0 C.
and 0.36 0 C. If only the one thermometer had been used on these occa
sions there would hardly have been any reason to doubt the trustworthy-
ness of the readings, and the result would have been quite erroneous values
of temperature. It proves the great desirability of always using two ther
mometers at each depth.
Another peculiarity with this thermometer. No. P.T. R. 375 47, is that
it now and then seems to alter its correction about 0,03 " C . In most cases
there was either no difference or a difference of about o.oi " C. between
the temperature-values of this instrument and those of the first thermometer
of the same water-bottle, while frequently the former were about 0.03" C.
higher than the latter. The cause of this variation is probably slight va
riations in the manner in which the mercury thread is broken off.
The observations taken with the two s t o p - c o c k w a t e r - b o t t l e s I
and II show an almost permanent difference of o.oi " C. between the tem
perature-values obtained by the first and the second thermometer of each
bottle. This must be due to slight changes in the errors of freezing-point
of at least two of these thermometers which, however, were all of them
very trustworthy instrument as is also proved by the agreement between
their readings.
T h e S a l i n i t i e s . All water-samples were preserved in glass-bottles
with porcelain stoppers, fitted with rubber washers and lever fastenings.
The bottles would hold about 200 c.cm. The salinities of the water-samples
have been- determined with the interferometer, constructed by Dr. LOWE
(CARL ZEISS, Jena). The double chambers of the interferometer used for
these investigations had been especiallj' constructed for me b3' ZEISS, and
were made of glass. They had lengths of i and 2 cm., and gave very
satisfactory results. The readings of the interferometer were checked by
the ordinary standard water supplied by the Bureau of the International
Council at Copenhagen, and also by some other sets of water-samples with
various salinities, which had been carefully determined by several series of
titrations (MOHR'S method), carried out by Professor HELLAND-HANSEN and
his assistant, Mr. TORBJORN GAARDER. I wish to express here my sincere
gratitude for their valuable assistance. The determinations with the inter
ferometer were made with great care and accuracy by my assistant, Cand.
Real. JACOB HELLAND, in the winter of 1912—1913. Now and then some
determinations were also made by myself as a control, but we nearly al-

8 FRIDTJOF NANSEN. M.-N. KL
ways arrived at the same results. Two or three determinations were made
of most samples with different glass-chambers, and they nearly always
agreed very well. In all cases where there could be the least doubt as
to the values of salinity obtained, new determinations were made.
A great number of water-samples have been re-examined with the
interferometer by my assistant, Mr. A. OYAN, this autumn and winter (1914—
1915), two years after they were taken. The values of salinity found differed,
however^ only very slightly from those found by the original examination.
As a rule, or at least in the case of all important samples, the accuracy
of the salinity given in Table I may be expected to lie within + o.oi %o-
This method would easily allow of a much higher degree of accuracy;
the difficulty is, however, to acquire the seits of standard water for the
control, sufficiently accurately determined for the purpose. Exact deter
minations of the specific gravity of the standard waters would naturally be
preferable to the determination of their chlorine.
, At Stat. 17, i i o o metres, Stat. 30, 400 and 440 metres, Stat. 36,
400, 500, and 580 metres, and at Stat. 57, 900 metres, two separate
water-samples were collected from the water-bottle for each of the men
tioned depths. Examined with the interferometer these double sets of
samples gave values of salinity which agreed within a few thousandths of
one per mille for each depth. At Stat. 19 two water-samples were taken
in the same manner from 610 metres, but their salinities were found to be
34.916 O/QO an'^ 34-90 OJQQ. The samples were first examined by Mr. J.
Helland, and a year later by Mr. A. Oyan, but with very nearly the same
results. It seemed at first dificult to understand the reason of this diffe
rence. The explanation must be, however, that the samples were taken
with the Reversing Stop-cock Water-bottle, where the reversing thermo
meter was placed inside the bottle, which therefore had to be opened at
the upper end (when reversed) and the thermometer had to be lifted be
fore the temperature could be read off. During this operation a drop or
two of water may have fallen into the water-bottle from outside its upper
part when removed, or from the sounding-line; and as this water would
have been from the sea-surface, a drop or two of it might reduce the
salinity of the upper layers of the water inside the water-botde appreciably
when added to it. Thus the last water-sample collected from the water-
bottle, and containing these uppermost layers, would get a lower salinity
than the first sample. This incident shows how very careful one ought to
be, when collecting the water-samples, in order to avoid that any drop of
foreign water be added to the sample. On the other hand it also bears
testimony to the accuracy of our determinations with the interferometer.
1915- No. 2. SPITSBERGEN WATERS.
Bank-Water. During our northward course we took several vertical series of obser
vations (Stations i—4) on the Bear Island Bank. They demonstrate the
tendency of the bank-water towards vertical uniformity over the shallow
parts of the banks of the Ocean. I have previously [see especially 1913,
p. 24, et seq^^ pointed out that this must be so, owing to the vertical
circulation caused by the cooling of the sea-surface during winter and
spring. In these northern regions it is also of importance for the vertical
circulation during the winter that the salinity of the surface-layer is much
increased by the formation of ice during the winter [see 1906, p. 31]. In
the course of the winter the shallow banks of the ocean are thus gradually
covered with comparatively cold layers of water, which have nearly uniform
12.VII12 3
Ml VII. 12
2 a. viLiz
Om, 08 3't-'f2 e'-93'.-3S 22 3t»-59
1 JO. VII. d2
3-3 3h-5t
lOO -
200
3 ^ 5 0 • - - J ^
^ « r 7 0 o'^'' .Tt-ao
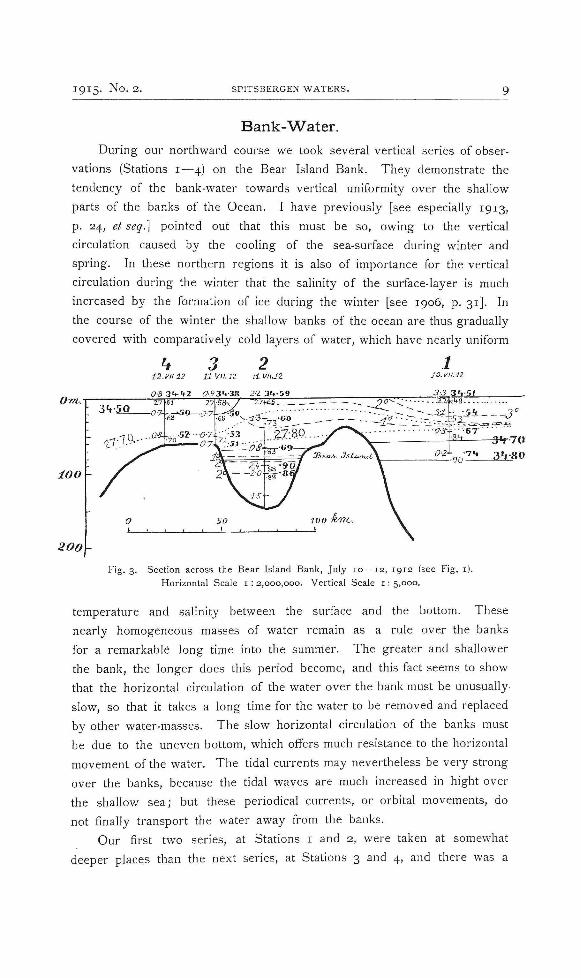
Fig. 3. Section across the Bear Island Bank, July 10 — 12, 1912 (see Fig. i) .
Horizontal Scale i : 2,000,000. Vertical Scale i : 5,000.
temperature and salinity between the surface and the bottom. These
nearly homogeneous masses of water remain as a rule over the banks
for a remarkable long time into the summer. The greater and shallower
the bank, the longer does this period become, and this fact seems to show
that the horizontal circulation of the water over the bank must be unusually-
slow, so that it takes a long time for the water to be removed and replaced
by other water-masses. The slow horizontal circulation of the banks must
be due to the uneven bottom, which offers much resistance to the horizontal
movement of the water. The tidal currents may nevertheless be very strong
over the banks, because the tidal waves are much increased in hight over
the shallow sea; but these periodical currents, or orbital movements, do
not finally transport the water away from the banks.
Our first two series, at Stations i and 2, were taken at somewhat
deeper places than the next series, at Stations 3 and 4, and there was a

lO FRIDTJOF NANSEN. M.-N. Kl .
much greater variation in the temperature and salinity vertically at the
former localities than at the latter, showing a more active horizontal
circulation. At Stat. 2, over a submarine channel in the bank north of
Bear Island, we found a layer of comparatively warm Atlantic water below
a depth of 100 metres. At .Stat. 3, where the depth was 60 metres, and
at Stat. 4 with a similar depth, the water was practically homogeneous in all
layers except near the surface, with a temperature of about 0.7° C , and
a salinity of 3451 °/oo- This water seems to have been fairly stationary,
and is what we may call the winter-water of the bank. The vertical di
stribution of temperature and salinity differs from that of the upper layers
of the Polar Current, where there is not, as a rule, such uniformity; the
temperature has generally a minimum at about 60 or 70 metres, and the
salinity increases downwards from the uppermost layer.
It was evidently also due to the slow circulation of this bank-water,
that a little north of Stat. 4 we met with much ice extending south-west
wards to a short distance beyond the edge of the shallow bank. It is
evidently a general feature of the Arctic seas that the drifting ice has a
tendency to remain for a long time over the shallow banks, while it is
swept away by the currents outside the edge of the banks, where they
run with comparatively great velocity [cf. HELLAND-HANSEN and KOEFOED,
1909].
The Spitsbergen Atlantic Current.
Our Stations 56 and 57 (Fig. 11), Stat. 17 (Fig. 12), Stat. 19 (Fig. 13),
and 20 (Fig. 14) are all of them (see Fig. i) situated in the Spits
bergen Atlantic Current running northwards along the shelf west and
north-west of Spitsbergen. In our paper on the Spitsbergen Sea,
HELLAND-HANSEN and I pointed out [1912, pp. 14 et seq. and 20 et seq.\
that the maximum salinity of this current south-west and west of Spits
bergen cannot rise much above 35.00 °/QQ. The correctness of this view
is also proved by the observations of 1912, the maximum salinity observed
being 35.04 %o found at 100 metres at Stat. 57, south-west of Spitsbergen.
The other high salinities were between 35.00 and 35.02 °/oo at Stations
56 and 57. At Stations 19 and 20, north-west of Spitsbergen, the salinity
of the Atlantic water had decreased to between 34.91 and 34.93 %o-
Our observations of 1912 show great similarity to those taken in this
region during the ISACHSEN Expedition of 1910. Our Stations 56 and 57
are nearly in the same localities as the Stations 10 and 11 of the
ISACHSEN expediton (76° 16' N., 12° 30' E., and 76° 20' N., 13° 45 ' E.) taken
on June 27tb, 1910. At these stations the following observations were taken:

1915- No. 2. SPITSBERGEN WATERS.
Depth in
Metres
0
2 0
5 0
1 0 0
2 0 0
3 0 0
4 0 0
5 0 0
6 0 0
7 0 0
S t a t . 1 0 . 27, VI, i g i o
7 6 ° i 6 ' N , , 12° 30' E.
4.32° C. 34.7g »/oo
4.29 .86
4.40 .gg
3-86 [.96]?
3.23 35,06
3,60 34-99
2 , 0 9 , 9 6
0.45 .99
Stat.
75° 58'
5.1 " C
5-26
3-92
3 . 0 6
2 . 2 8
1,69
1,22
0 . 0 8
57 . I, IX, 1 9 1 2
N., 13° 6 ' E .
• 34-94 %0
.96
3 5 0 4
. 0 2
. 0 0
3 4 - 9 2
. 9 1
Stat,
76° 20
4-63°
5-35
3-9°
4-55
3-86
3-37
2 ,62
J.84
1 1 . 27, VI, r g ro
' N . , i 3 ° 4 5 ' E ,
C. 3 4 . 7 0 0/00
. 0 6
.88
35-04
- 0 5
- 0 5
•04
34-97
Stat
76° 25
2.8 "
4-30
5-46
4-47
3:38
2-73
1,63
5 6 . i . I X , 1 9 1 2
N,, I 3 ° 4 2 ' E .
-- 33-76 0/00
34-43
go
3 5 - 0 2
. 0 1
34-97
. 9 1
There is a great similarity both in temperature and in salinity at these
stations of different years (cf. Figs. 15 & 16). It looks as if the salinities of
1910 have a tendency to be a little too high, on the whole, at the two
stations 10 and 11, considering that at 600 metres there were found sali
nities of 34.97 and 34.99 °/oo with temperatures of 1.84° and 0.45° C.
At a temperature of 0.45 " C . the salinies hardly can have been much above
34.91, or 34.92 0/00 at most.
Our Stat. 17 (79° 13'N., 7° o 'E.) , with a depth of i 210 metres, was
20 miles north of Stat. 17 of the ISACHSEN Expedition (78° 53'N., 7° 20' E.)
with the same depth of i 210 metres, and 20 miles south of the Isachsen,
Stat. 37 (79°33'N., 8 ° i o ' E . ) . Owing to bad weather we had to stop be
fore the observations between the surface and 300 metres had been taken.
Below 300 metres the following observations were taken at the three stations:
Depth in
Metres
0
3 0 0
5 0 0
6 0 0
7 0 0
8 0 0
I IOO
1 2 0 0
S t a t . 17 . 17, VII, 1 9 1 0
78° 53' N.. 7" 20' E.
6.03° C. 34.17 ",'00
2-59 -95
2 . I I .97
1-79 -97
0,51 .96
- r.14 -gt
Stat. 17 19
7 9 ° I 3 ' N . ,
3,2 °C .
1.69
1.00
— 0 . 1 6
— 1.07
30, VII, 2 7° 0 0 ' E .
34.06 0/00
•95
. 9 0 6
-895
-895
S t a t , 3 7 . 19, VIII, 1 9 1 0
79°33 'N . , 8 ° i o ' E .
3,04° C. 33-560/00
2.56 35-00
34-96
-97
.89
At 300 metres the temperature was lower in 1912 than in 1910; at
500 and 700 metres both temperatures and salinities were considerably

1 2 FRIDTJOF NANSEN. M.-N.Kl.
Figs. 4 & 5. Tempera tures and Salinities at the Sea-Surface and at the Depths of 50 Metres,
July 27 —September i, 1912. Scale 1:5,000,000.
lower in 1912 than in 1910, and it is obvious that the upper boundary
of the cold deep-water with temperature below 0° C. was lying considerably
higher on July 30th 1912 than on July 17th 1910 (see Fig. 17 & 18). It
seems, however, as if the sahnities found in 1910 for the depths between
400 and 800 metres (see Fig. 17) are sometimes too high; for it is hardly
probable that at 800 metres, with a temperature of 0.51° C , the salinity
could be as high as 34.960/00; it has probably been not much above
34.92 or 34.91 o/oo-
The temperatures at 300 and 500 metres are lower at our Stat. 17
than at the same depths at our Stat. 56, to the south, which has an
exactly similar position just outside the edge of the continental shelf west
of South Cape, at a depth of i 020 metres. The salinity of the water is also
decreased on its way northward, as might be expected (see Figs. 8, 9, n , 12).
The mean temperature of the water between 50 and 450 metres
computed from the temperatures at 100, 200, 300 and 400 metres was
I 9 I 5 ' No. 2. SPITSBERGEN WATERS. 13
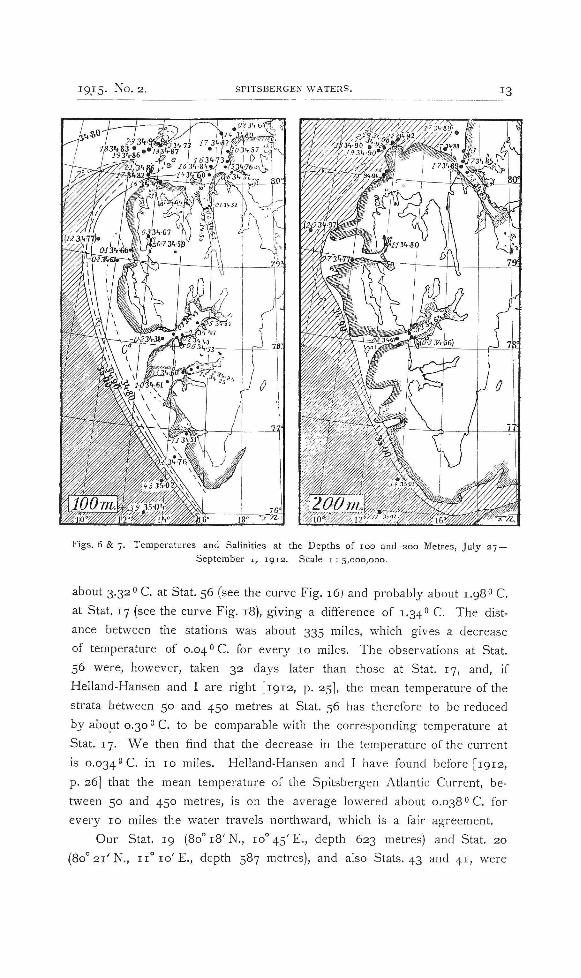
Figs. 6 & 7. Temperatures and Salinities at the Depths of 100 and-200 Metres, July 27 -
September 1, 1912. Scale i : 5,000,000.
about 3.320 C. at Stat. 56 (see the curve Fig. 16) and probably about 1.98° C.
at Stat. 17 (see the curve Fig. 18), giving a difference of 1.34° C. The dist
ance between the stations was about 335 miles, which gives a decrease
of temperature of 0 .0400 . for every 10 miles. The observations at Stat.
56 were, however, taken 32 days later than those at Stat. 17, and, if
Helland-Hansen and I are right [1912, p. 25], the mean temperature of the
strata between 50 and 450 metres at Stat. 56 has therefore to be reduced
by about 0.30" C. to be comparable with the corresponding temperature at
Stat. 17. W e then find that the decrease in the temperature of the current
is 0.034 " C . in 10 miles. Helland-Hansen and I have found before [1912,
p. 26] that the mean temperature of the Spitsbergen Atlantic Current, be
tween 50 and 450 metres, is on the average lowered about 0.038" C for
every 10 miles the water travels northward, which is a fair agreement.
Our Stat. 19 (8o° i8 'N. , i o ° 4 5 ' E . , depth 623 metres) and Stat. 20
(8o°2 i 'N . , i i ° i o ' E . , depth 587 metres), and also Stats. 43 and 41, were

H FRIDTJOF NANSEN. M.-N. Kl.
Figs. 8 & 9- Temperatures and Sahnities at the Depths of 300 and 400 Metres, Scale I : 5,000,000.
situated north-east and east of the Belgica Stat. 11 A (79° 52 'N. , 9° 42 'E . ,
depth 310 metres), Stat. 12 (8o°o5'N., 9° 40 'E . , depth about 550 metres?)
and Stat. 13 (80° 14'N., 7 °42 'E . ' depth 560 metres). The Belgica stadons
were taken on July 7th and 8th, 1905. The temperatures of our stations
are on the whole similar to those of the Belgica Stations 12 and 13. Our
salinities are on the whole somewhat lower, except at depths of 500, 540
and 630 metres at the Belgica Stats. 13 and 11 B, where the salinities of
34.92 and 34.91 %o are nearly the same as the salinity found at similar
depths at our stations.
On the whole, our observations seem to indicate as a general law
that when the temperatures of the deep layers of the sea in this region
west or north-west of Spitsbergen decreases towards i ° C . or lower, the
salinity has a tendency to approach 34.92 O/QQ, or even 34.90 "/'oo-
At the Belgica Stat, 11 A the temperatures and salinities are consider
ably higher than at our above-mentioned stations, and the water-laj'ers at
depths between 100 and 500 metres have a considerably more Atlantic
character, with salinities as high as 35.01 VQQ.

i g t S - No. 2. SPITSBERGEN WATERS.
„ ., i Belff ica •^^P*'Stat. 13. 8, VII, , , I Q 0 5
| 8 o 14 N . , 7 4 2 E .
0 • o . 3 7 ° C . 33.20O/00
2 0 10.19 -39
5 0 , 1 .79 3 4 . 7 5
1 0 0
1 5 0
2 . 0 1 . 92
1.90 . 9 5
2 0 0 ; i . 8 o . 9 6
3 0 0 ' 1 . 2 9 . 9 5
3 1 0
4 0 0 -0 .80 . 9 6
4 1 0
5 0 0 I0.27 . 9 2
1 5 1 0 1
5 4 0 10.23 •g2
6 1 0
6 3 0 i
Belgica Stat. 12. 7, VII,
1 9 0 5 8 0 ° 5 ' N . . 9 ° 4 0 ' E
- o . 4 6 ° C . 3 3 . 6 8 » / „
1.62 3 4 . 7 2
2 . 1 6 . 9 4
1.64 . 94
1.82 3 5 . 0 1
1.49 . 01
1.2 [ 3 4 - 9 8
0 . 8 6 . 96
0.24^ . g i ^
Stat. 4 3
1 „ '9 8 o ° 2 o ' N
- o . 6 ° C .
. — ° - 3 9
; 1-79
1-83
• 1.36
20 ,VI11 , 12
, i o ° 4 ' E .
3 !• 13" 110
3 4 - 4 3
•83
•90
•91
Stat. 19. 3,V11I, 1 9 1 2
8 o ° i 8 ' i N . , i o ° 4 5 ' E .
0 .8° C. 3 3 . 0 6 " „ „
1.17 . 56
0-75 3-1-57
1.91 . 8 6
I . g o . 8 9 5
1,80 . 92
1-55 -93
1.29
o . g o . g t
Stat .41. ig.VIlI,
1 0 1 3 8 o ° 2 6 ' N . , i 2 ° o o ' E .
0 -3° C. 32.22O/00
1-54 3 3 - 9 9
0 . 8 3 3.1,65
2 .87 . 9 5
2.T9 , 93
1,89 ,94
J , 4 8 . 9 3
1,08- . 9 1 2
Belgica Stat. 1 1 A, 7, V I I , 1 5 9 0 . ,
7 9 ° 5 2 ' N , i o ° 4 2 ' E .
2 . 8 8 ° C . 3 4 . 5 9 % o
2 . 9 0 . 6 0
3.8 r . 98
3 . 6 6 3 5 , 0 1
3 15 .01
2-73 .01
2 . 42 .01
' These observations were taken at ihe Belgica Station 11B, in 80° 4 'N. , i o ° 5 ' E . , depth to the bottom 650 metres, on July 7, 1905.
2 These observations were taken at 530 metres, on August 38, i g i 2 .
Stat. I I A was, however, about 26 and 28 geographical miles to the
south of our Stats. 19 and 43 ; but it was only 12 miles and 15 miles to
the south-west of our Stats, 18 and 21, nevertheless there is a remarkable
difference between the salinities of these stations as the following table shows :
D e p t h in
M e t r e s
0
1 0
2 0
3 0
5 0
6 0
1 0 0
n o
1 4 0
1 5 0
2 0 0
2 1 0
2 4 0
3 0 0
Belgica
Stat. 11 A. 7, VII, igo5
7 9 " 5 2 ' N . , i o < ' 4 2 ' E .
2.88 o c . 34.59 °/oo
2 . 8 6 . 6 0
3 , 9 0 , 60
3 .81 . 98
3 . 6 6 3 5 0 1
3-15 -OI
2-73 -or
2 . 4 2 .01
Stat. 18.
8 0 0 2 ' N .
1 . 8 O C
X.56
1.69
1.82
1-83
3 , V I I I , 1 9 1 2
I I 0 2 0 ' E .
3 4 - 3 3 % 0
•7g
. 8 2
•91
.91
Stat. 2 1 .
8 0 " 4 ' N . ,
1 . 7 O C
1.8
1-7
1.70
2 . 1
1.86
1.64
6, V I I I , 1 9 1 2
1 1 " 3 0 ' E .
• 33-97 °/'oo
3 4 . 0 8
•72
. 8 0
. 8 6
. 8 6

i 6 FRIDTJOF NANSEN. M.-N. KL
Fig. lo . The Distribution
of Temperature and Sali
nity at the Sea-Surface,
Sept. 1 — 5, 1912.
Scale 1: 12,000,000.
A comparison
between the observa
tions at our stations
and the corresponding
stations of the Isach
sen Expeditionof 1910
(see above) shows that
the waters of the Spits
bergen Atlantic Cur
rent had a much less
Atlantic character {i. e.
much lower salinities)
At Stat. 18 the depth of the sea was 247
metres, at Stat. 21 242 metres, while at the Bel
gica Stat, n A it was 310 metres. The former
stations were thus in a somewhat shallower sea,
and may have had a little more coastal water than
the latter, though they were not nearer to the
coast. Iheir more north-easterly situation may
also tend to give them lower salinities and lower
temperatures; but this is hardly sufficient to ex
plain the striking difference between them and
the Belgica station in these respects. It seems as
if in this region the water of the Spitsbergen At
lantic Current, had a much more Atlantic character
in the summer of 1905, than in the summer of 1912.
Fig. 11. Section from the mouth of Horn Sound to
Stat. 57, Sept. X, 1913 (see Fig. i) . Horizontal Scale
1:200,000. Vertical Scale 1:10,000.

1915- No. 2. SPITSBERGEN WATERS. 17
Om.
100-
200-
300-
1,00-
500
600-
700
800
900
1000
noo
1200
ft, J3 in the sum-23. Vll.ll
mer of 1912
than in the
summer of
1910. This
is perhaps
still better seen if our
charts giving the hori
zontal distribution of sali
nity and temperature in
the summer of 1912, at the depths of 50, 100, 200,
300, and 400 metres (Figs. 5—9) be compared with
the corresponding charts drawn by HELLAND-HAUSEN
and myself for the summer of 1910 [1912, Pis. II &
III]. The differences are striking, and it is easily
seen that the Atlantic Current must have been much
more developed near the Spitsbergen coast in 1910
than in 1912. E. g. at 300 and 400 metres all water
near the Spitsbergen shelf, examined in 1910, had '
salinities above 35.00 "/QO, while in 1912 all salini
ties observed at these depths were below and even
m u c h below this value, except at the southernmost
station, Stat. 57, at 300 metres. There are also similar
striking differences at the other depths, of 200, 100, , and 50 metres, indicat-
100 knn.
Fig. 13. Section from Station 13, at the Lilliehook Glacier,
along Cross Bay (Stat. 14) to Stat. 17 west of the Spits
bergen coast (see Fig. i) . Scales same as in Fig. 11.
ing that the Spitsbergen
Atlantic Current must
have been compara
tively Httle developed
in 1912.
If the chart Fig. lo, showing the distribution of Temperature and Sali
nity at the Sea-Surface during our homeward voyage, September is t to
5th, 1912, is compared with the corresponding chart for September 6th to
gth, 1910, in HELLAND-HANSEN'S and my paper on the Spitsbergen Sea
[1912, PI. I], it is seen that the Atlantic surface-water with salinities above
35.00 °/oO) and also above 34.90 %o had probably a wider distribution to
wards the north-east in September 1912 than in September 1910, at least
between 7 6 " and 74" N. where our route was near that of the Isachsen
Expedition. But the surface-temperature was considerable lower during
Vid.-Selsk. Skrifter. I. M.-N. KI. 1915. No. w. 2

i 8 FRIDTJOF NANSEN. M.-N.K1.
eptember i 5, ig-^a, than during September 6 - 9 , 1910, and still lower
than durmg September 6 - 9 , xgog. The isotherms of 6° C. was in the latter
year about two degrees farther north (in 76° N., 14° E) than in September
12 (\n 74 N., 14OE.). and about one degree farther north than in Sep
tember 1910 (in 75ON., 14OE.). The isotherm of S^C. showed similar differences.
T h e T e m p e r a t u r e of t h e A t l a n t i c C u r r e n t . Our observations
in the Atlantic Current are not sufficiently numerous to enable us to say
much about its average temperature in
1912 west of Spitsbergen; but the com
parisons given above seem to show that
the current west and south-west of Spits-
18 3 VIII. 11
21 22 23 6!/lll.l2 6.1/lll.n
jr 33.97 SOSHZS J-3 3',-32 TTiB
•-V?;'
'«• 13. Section from Norway Islands Fig. 14. Section from the north coast of Spits-to Station 19. Aug. 3, j g ^ ^ ^^^^ ^.^^ . 1^^^^^^ ^^ g ^ ^ ^^ ^^^^^_ ^ ^ g ^^^2, Horf.
cales same as in Fig. n . ^oma, Sca\e i : 200,000. Vertical Scale 1:4,000.
«.„ .u ^^^ ° " ^^^ '^^°^^ colder in 1912 than in 1910, as we also have seen^ha t its salinities were lower.
400 metres would'be^'b " ^ ^ " ' ' ' ' " ^ "^ ^^^ temperatures at 100, 200,300, and Stat. 17 -3 10 o r " " ° " ' 2 ° 6 0C. (see the curve Fig. 18), at the Isachsen
/ o ' J j ^., and at th(=> T i a y situated very nearly m' i '^^^'^''^^ Stat. 37 2 .79oQ Our Stat. 17 was
^-1-n . 3 days later in t h T ' ' ' ' ' " " " ' ' " ' " ° ' ^ ^ * ^ ^ " stations, and was
'he other. If, therefore w e ' c r ' V ''' ° " ' ' "^^ ^ ^^^s earlier than
-ble to the mean v a l u e ' ( . . ^ e o c ; ? ; ^ ' ' ""^"^ ' - ^Pera tu re - to be compar-
- - i o n s combined, we «nd that ^ e w l r 7 : : ^ ' ' ^ ^ ' ^ ^ - ^ ^ -the Atlantic Current, between

ig iS- No. a. SPITSBERGEN WATERS. 19
50 and 450 metres, in this region was 0.90" C. colder in the summer of
1912 than in the summer of 1910.
The mean value of the temperatures at 100, 200, 300, and 400 metres,
was 2.74O C. at our Stat. 57, and 2 .95"C. at the Isachsen Stat. 10, giving
a difference of 0.210 C. As Stat. 57 was situated 20 miles south-south
west of Stat. 10, and was taken 66 days later in the season, this difference
would have to be increased by about 0,08° C. and 0.66" C.i, and we find
that the current was about 0.95° C. colder in 1912 than in 1910.
If the mean temperatures at our Stat. 56 (3.19OC,) and the Isachsen
Stat. 11 (3.60 0 C.) be compared in the same manner, we find that the
100
200
300
wo
500
600
700
Figs. 15 & 16. Curves
showing the vertical
istribution of Salinity
(Fig. 15 to the left)
and Temperature (to
the right) at the Isach
sen Stations 10 and I I
(of June 27, 1910) and
our Stations 57 and 56
o fSep tember i , i g i2 ) .
Atiantic Current was in that locality about 1.07 " C . colder in 1912 than
in 1910.
It is not possible to draw any certain conclusions as to changes in
the temperatures of the current from the comparison of the observations
at such a small number of stations, especially considering how wery much
the conditions may alter at each station in very short time, both by verti
cal and by horizontal movements of the water. Nevertheles there is a
fair agreement between the differences 0,90° C , 0.95 " C , and 1.07 " C ,
found independentiy in three different localities, and it seems to indicate
1 HELLAND-HANSEN and I found [ i g i s , pp. 24—25] that the mean temperature of the water ,
be tween 50 and 450 metres, of the Spitsbergen Atlantic Current was on the average
raised o . ioOC. in 10 days during the summer, from June and July to September.

2 0
FRIDTJOF NANSEN. M.-N.Kl.
.3H70
100
1000-
liOO -
IZOO
that the water
of the Spits
bergen Atlan
tic Current re
ally was consi
derably colder
in the summer
of 1912 than
in the summer
of 1910 .
Helland-Hansen andl found
[1912, pp. 42 et seq.] there was
probably a certain similarity
between the variations in the
temperature of the Atlantic Cur
rent west of northern Spits
bergen and the variations in the
mean winter-temperature {i. e.
for the six months December i igs. 17 & 18. Curves showing the vertical distri
bution of Sahnity (Fig. 17 to the left) and Tempera- ' " • " ' - ^ ^ "
ure (to the right) at the Isachsen Stations 17 and tO M a y 3 1 ) o f t h e five nor thern
37 (of .luly 17 and Aug. 19, . g ^ ) ^„d our Stat. 17 . , • , , ,„-nn= nf Nor
(°f July 30, 1912). meteorological stations ot iNor--tr , way, Andenes, Tromso, Alten, vardo, and Svd V JI > Tj^g ^ .y"-varanger, during the winter a year and a half earlier.
was, h o T e v e T T r e o c ' ' " " " ' ' ' ' ^ ^°' December ist 1900 to May 31st 19" in the win ter 'TO'°« ' ^ ' ''"^^'^ ^'"^ Nations, while it was only o.68»C.
J. 9 0 0 t o 1QOQ Th ic ; ought t o have bp^,. '® consequently contrary to what it
"Current in the region soutl °"^ ' " "'"^ temperature of the* Adantic
similarity to the variations in Ih/'"""''"" Spitsbergen might have more
Norwegian stations during th p " " " ' ^ ^ P ^ ^ ' " - at the five northern
n the means of the two p r e c e d i n H h ! " " " ' °'" '^''^ * ^ - " - ^ ^

1915- N o . 2. SPITSBERGEN WATERS.
The mean temperature-anomaly for December ist 1911 to May 31st
1912 was — 0.43 " C . at the five Norwegian stations, while for December
ist 1909 to May 31st 1910 it was 1.61° C. The mean anomaly for the
two winters 1910 to 1911 and 1911 to 1912 was 0.32° C , and for the two
winters 1908 to 1909 and 1909 to 1910 was 1.15° C. [see 1912, pp. 42
and 43]. The differences between these mean temperatures are conse
quently in better harmony with the difference of temperature (about 1.0° C.)
which the Spitsbergen Atiantic Current T -i„ mo 1900 1905 1908 1910 1912
was colder in 1912 than in 1910, accor
ding to our observations.
Helland-Hansen and I also pointed
out [1912, pp. 44 et seq.] that the anual
variations in the distribution of ice in the
Barents Sea in May seem to agree with
the anual variations in the temperature of the S p i t s b e r g e n At lant ic C u r r e n t in the Fig. 19. Curve I, Temperature-Anomaly
of the Spitsbergen Atiantic Current same years. , , , . „
• (scale to the left). Curve II, The Area,
T h e a r ea of o p e n wa te r in the Ba- in hundred-thausands of square kilo-
rents Sea east of 200 E. Long, was about "^""^^ °^ °P^" '^^'^•' '" '^^ Barents. Sea in May (scale to the right).
237000 square kilometres in May 1912
(according to the charts published by the Danish Meteorological Institute)
and 492 000 square kilometres in May 1910. There was in fact an excep
tionally small area of open water in the Barents Sea in May 1912, and this
is in good agreement with the low temperature of the Spitsbergen At
lantic Current that summer.
The curves in Fig. 19 demonstrate the variations in the temperature-
anomaly of the Spitsbergen Atlantic Current and in the open water in the
Barents Sea in May for the years when there are observations. It ought,
however, to be remembered that the assumed anomalies of the Spitsbergen
Current are based on an imperfect observation-material, and the obtained
results cannot therefore be considered as very trustworthy.
The Wate r of the Spitsbergen Fjords, and the Coast Water .
In our paper "On the Sea West of Spitsbergen" HELLAND-HANSEN and
I [1912, pp. 54 et seq.] have discussed the nature and origin of the water of
the Spitsbergen fjords, especially Ice Fjord. The observations of 1912 confirm
on the whole the correctness of the views which we then held in this
respect, though they may have to be slightly modified as regards the

2 2
FRIDTJOF NANSEN. M.-N.Kl.
Fig. 20. The Stations in Ice Fjord, in July and August 1912. Stat. 7 of July 18, 1912,15 in about the same place as Stat. 47 of Aug. 29, 1912. Stat. 8 of July 18, 1912, is in about the same place as Stat. 10 of July 21, igi2, Stat. 44 of Aug. 24, igi2, and Stat. 48 of Aug. 28
1912. Scale I : 1,000,000.
nature of the intermediate layers with a minimum temperature, observed
in the summer, especially in Ice Fjord. Our view was that they were
due to the vertical circulation of the upper water-strata of the ijord during
the winter. The observations of 1912 in Ice Fjord, as well as in other
Spitsbergen ijords, seem, however, to prove that these cold intermediate
layers cannot be quite so local as we were then inclined to believe; to
some.extent they seem to have some connection with the water over the
shelf outside the mouth of the fjord.
n very nearly the same localities, at the mouth of Ice Fjord, I took
I7ltus7'^'^^ ' " " ' " ' °^ observations on different dates: July 16, 18
in'th^T^l ^^ ^"'^ ^^' '^^^^ ^''°^^ " ' ' " 'here are considerable variations
s e e L ^ T l T ° ' ' ' ^ ^ ° ' - ' ^ ' ^ ^ - - ^ ' l - ^hort intervals of time. We
exter;::\;rer:;::irm""T."'-'-' -^ -- ° --same time, (cf. the w l " ' t « \ ' ""^ '' ^ ' ° ' " ' "'^'^"^^^ ^' *^ -July .8th,';.,o ^.z:: . z r "" ' ""- ^ -^ - -
i g i S - No. 2. SPITSBERGEN WATERS. 2 3
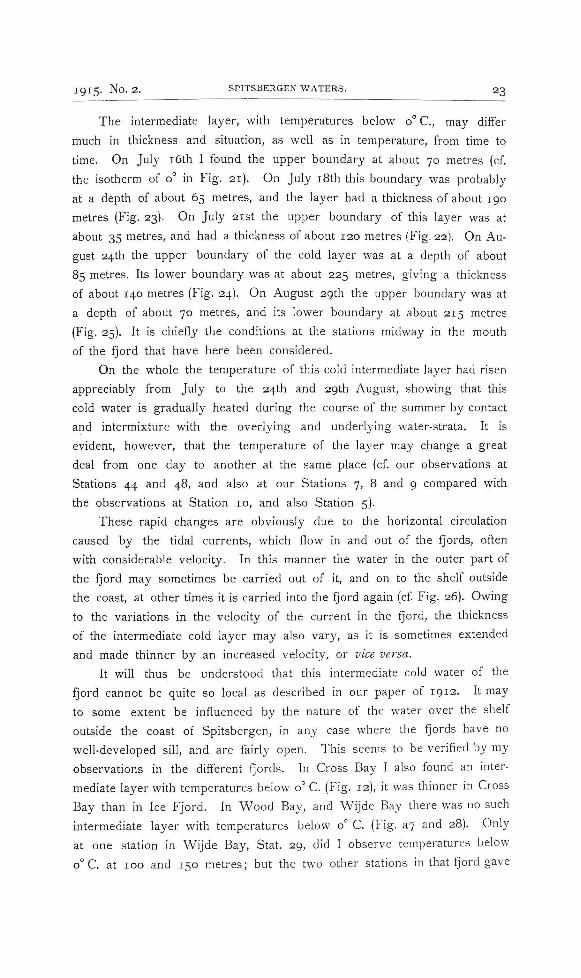
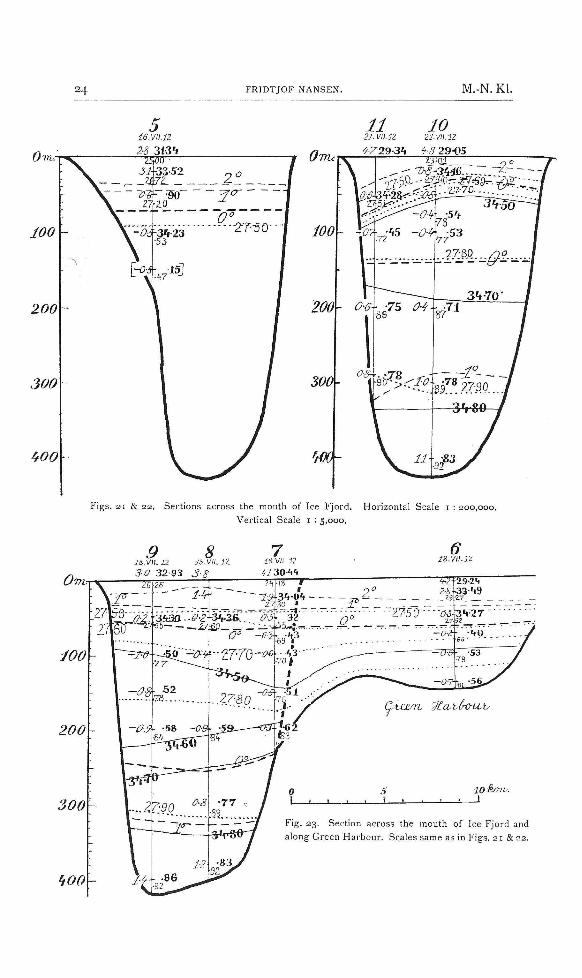
The intermediate layer, with temperatures below o° C , may differ
much in thickness and situation, as well as in temperature, from time to
time. On July i6th I found the upper boundary at about 70 metres (cf.
the isotherm of 0° in Fig. 21). On July i8th this boundary was probably
at a depth of about 65 metres, and the layer had a thickness of about 190
metres (Fig. 23). On July 21st the upper boundary of this layer was at
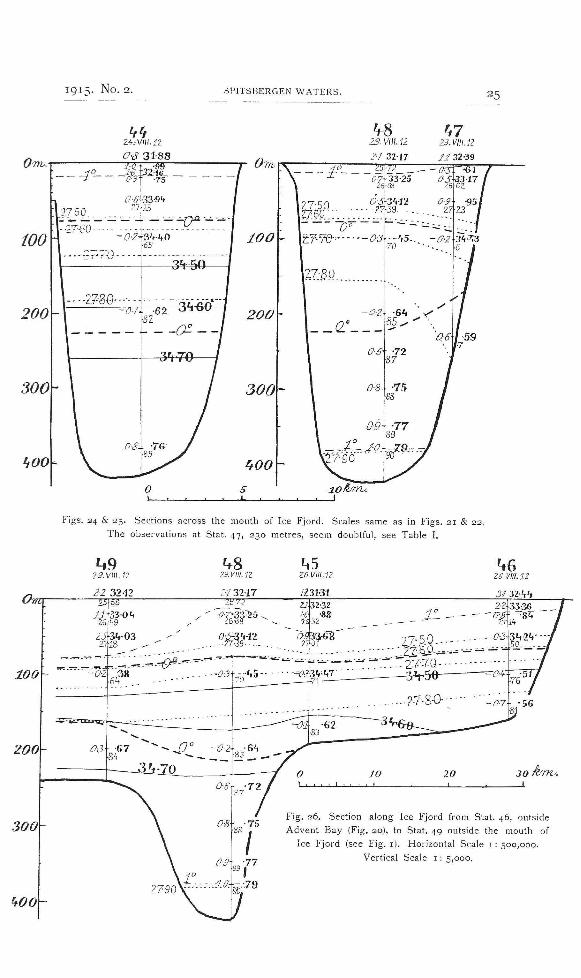
about 35 metres, and had a thickness of about 120 metres (Fig. 22). On Au
gust 24th the upper boundary of the cold layer was at a depth of about
85 metres. Its lower boundary was at about 225 metres, giving a thickness
of about 140 metres (Fig. 24). On August 29th the upper boundary was at
a depth of about 70 metres, and its lower boundary at about 215 metres
(Fig. 25). It is chiefly the conditions at the stations midway in the mouth
of the fjord that have here been considered.
On the whole the temperature of this cold intermediate layer had risen
appreciably from July to the 24th and 29th August, showing that this
cold water is gradually heated during the course of the summer by contact
and intermixture with the overlying and underlying water-strata. It is
evident, however, that the temperature of the layer may change a great
deal from one day to another at the same place (cf. our observations at
Stations 44 and 48, and also at our Stations 7, 8 and 9 compared with
the observations at Station 10, and also Station 5).
These rapid changes are obviously due to the horizontal circulation
caused by the tidal currents, which flow in and out of the fjords, often
with considerable velocity. In this manner the water in the outer part of
the fjord may sometimes be carried out of it, and on to the shelf outside
the coast, at other times it is carried into the fjord again (cf Fig. 26). Owing
to the variations in the velocity of the current in the fjord, the thickness
of the intermediate cold layer may also vary, as it is sometimes extended
and made thinner by an increased velocity, or vice versa.
It will thus be understood that this intermediate cold water of the
fjord cannot be quite so local as described in our paper of 1912. It may
to some extent be influenced by the nature of the water over the shelf
outside the coast of Spitsbergen, in any case where the fjords have no
well-developed sill, and are fairly open. This seems to be verified by my
observations in the different fjords. In Cross Bay I also found an inter
mediate layer with temperatures below 0° C. (Fig. 12), it was thinner in Cross
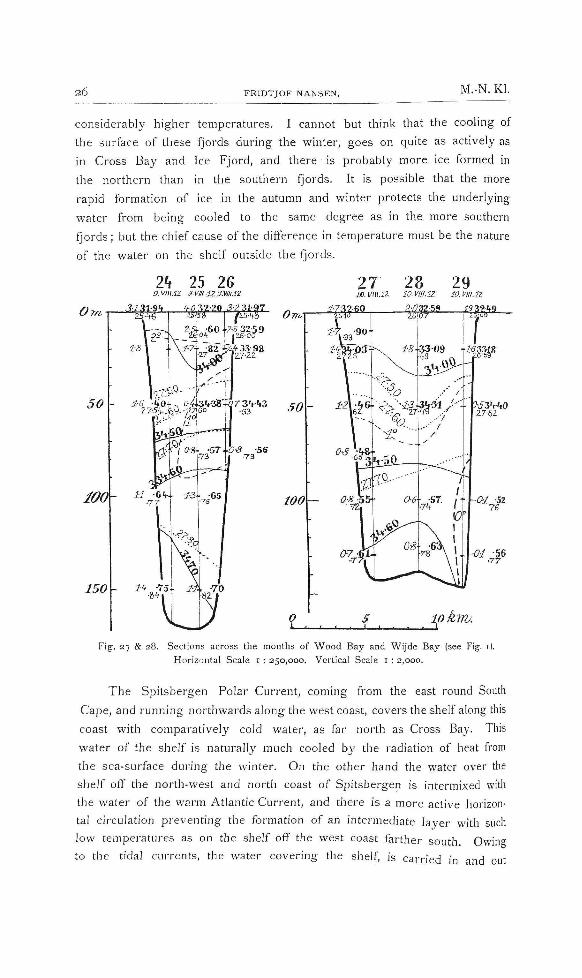
Bay than in Ice Fjord. In Wood Bay, and Wijde Bay there was no such
intermediate layer with temperatures below 0° C. (Fig. 37 and 28). Only
at one station in Wijde Bay, Stat. 29, did I observe temperatures below
o°C. at 100 and 150 metres; but the two other stations in that fjord gave
24 FRIDTJOF NANSEN. M.-N. Kl.
OTIV:
100 -
200
300-
WO
11 10 31. villi zj.vim ^Z29-3' i ^-3 29-05
Figs. 21 & 32. Sections across the mouth of Ice Fjord. Horizontal Scale i : 200,000. Vertical Scale i : 5,000.
OTW
9 8 M.VII. 12 iS.VII. IZ 30 3293 S-8
• Ti
iOO
200
300
hOO
7 is.vn. n
iliO-h'i
6 ji.vii.n
29-2'i
•lokmu J
Fig. 23. Section across the mouth of Ice Fjord and along Green Harbour. Scales same as in F'igs. 21 & 22.
1915- No. 2. SPITSBERGEN WATERS. 25
V8 2S. VIII. 12
Orrv.
100
200-
300-
hOO-
23. VIII.]2
iJ 32-39
Figs. 24 & 25. Sections across the mouth of Ice Fjord. Scales same as in Figs. 21 & 22,
The observations at Stat. 47, 230 metres, seem doubtful, see Table I.
OT)
1*9 2S.VMI.fZ
zz yi-n
l9.VIII.il
:i 32-17
^5 Z6.I/III.1Z
/.?31-31
^6 ze.viii.iz 3J 32-'r'»
100
200-
300
hOO
OS- -75 Fig. 36. Section along Ice Fjord from Stat. 46, outside
Advent Bay (Fig. 20), to Stat. 4g outside the mouth of
Ice Fjord (see Fig. i) . Horizontal Scale i : 500,000.
Vertical Scale i : 5,000.
26 FRIDTJOF NANSEN. M.-N. Kl.
considerably higher temperatures. I cannot but think that the cooling of
the surface of these fjords during the winter, goes on quite as actively as
in Cross Bay and Ice Fjord, and there is probably more ice formed in
the northern than in the southern fjords. It is possible that the more
rapid formation of ice in the autumn and winter protects the underlying
water from being cooled to the same degree as in the more southern
fjords; but the chief cause of the difference in temperature must be the nature
of the water on the shelf outside the fjords.
07
50
100
150-
Ih 25 26 9.VIII.J2 s.vm•izxm.ii
JJ31-9'i ?.n 3ZZl-97
60-[-2-5 32-59
28 m viii.iz
29 MVIII.1Z
Om
SO
100
a -56 •77
5 — I i _
10 km/.
Fig. 37 & 28. Sections across the mouths of Wood Bay and Wijde Bay (see Fig. i).
Horizontal Scale i : 250,000. Vertical Scale i : 2,000.
The Spitsbergen Polar Current, coming from the east round South
Cape, and running northwards along the west coast, covers the shelf along this
coast with comparatively cold water, as far north as Cross Bay. This
water of the shelf is naturally much cooled by the radiation of heat from
the sea-surface during the winter. On the other hand the water over the
shelf off the north-west and north coast of Spitsbergen is intermixed with
the water of the warm Atlantic Current, and there is a more active horizon
tal circulation preventing the formation of an intermediate layer with such
low temperatures as on the shelf off the west coast farther south Owine
to the tidal currents, the water covering the shelf, is carried in and out

I9I5- No. 2. SPITSBERGEN WATERS. 27
of the fjords inside, and will thus have an influence upon the nature of
the water filling the fjords, or in any case their outer part. The inter
mediate layers in the fjords and on the shelf will .thus acquire a somewhat
higher salinity in the north, than at the corresponding levels in the fjords
and on the shelf farther south. The sea over the shelf in the north will be
covered by a thin layer of Arctic water with low salinities, and by ice,
and the vertical circulation caused by the cooling during the winter will
thus not be so effective there as in the south. There will consequently
not be the same conditions for the formation of an intermediate layer with
low temperatures at 60 and 100 metres.
In the following table are given the vertical series of observations
taken at several stations on the shelf along the west coast of Spitsbergen.
Stat. 54 (Sept. i) is taken outside the mouth of Horn Sound, Stat. 53 (Aug.
31) outside Bell Sound, Stat. 49 (Aug. 29) outside the mouth of Ice Fjord,
Stat. 12 (Jul}' 27) on the shelf far outside Kings Bay, and Stat. 15 (July 29)
outside Cross Bay (see Fig. i).
Depth
Metres
0
2 0
5 0
75
85
1 0 0
n o
1 3 0
135
2 0 0
2 4 0
Stat, 54. Outside Horn
Sound Depth 125 m.
—o-S
— 0 ,24
— 1 . 0 7
- i . i g
33-07
- 2 7
34-25
.46
— o.gB .54
Stat. 53. Outside Bell
Sound Depth 146 m.
-° -3 1.65
o.og
1.04
0 . 6 7
3 2 17
34.16
. 6 1
.68
Stat. 49. Outside Ice
Fjord Depth 242 m.
2 . 2
I I I
2.47
— 0 2 2
Q.30
3 2 . 1 2
33-04
3 4 0 3
•38
67
Stat. 12. Northwest of
Prince Charles Foreland
Depth 250 m
3-1
— O.IO
— 0 . 2 0
0 . 7 2
1.23
33-92
34-50
•63
•77
.84
Stat 15. Outside Cross
Bay Depth 135 m.
2 - 5
— 0 . 0 3
- 0 . 5 3
0-37
0 .07
0 . 0 5
32.75
34-44
• 5 2
.66
-
On the whole, the intermediate layer with minimum temperatures is
much colder in the south than farther north, in spite of the later season.
At the southernmost station, 54, the temperatures are below zero at all
depths between the surface and the bottom, and the minimum temperature
at 85 metres is —1.19° C. Farther north, at Station 53, off Bell Sound,
the water is very much warmer. It was only at the surface that I happened
to observe a temperature below zero in the one vertical series taken at

M.-N.Kl. 2 8 FRIDTJOF NANSEN. ^ _
this station. The intermediate water-layer seems, however, to c lang ^ y
rapidly on the shelf; for only half an hour later a new vertical series of
observations taken at the same station, 53, gave appreciably lower tem
peratures at 20 and 50 metres, the temperature at the latter depth being
even below zero (see Table I). The layer may have been lifted about
10 metres. There are also great differences between the temperatures of
the intermediate layer at Stations 12 and 15, and we may also mention
Station 16, situated on the same shelf outside Kings Bay and Cross Bay,
with no great distance between them. The changes in the intermediate
layer are probably due, to a great extent, to the tidal currents carrying
the waters to and fro.
But the changes at the same stations in short intervals of time are
evidentiy due to vertical oscillations of the strata, and they occur on the
shelf, e. g. at Stat. 53, as well as in the fjords. At Stat. 50, on August 30th,
1912, 2.00 p . m . , — 1.06" C. was observed at 90 metres; half an hour
later — 0.54 " C . was observed -at the same depth indicating a vertical dis
placement of the water strata. But as there was just at this level evidently
a sharply defined boundary between the cold bottom-layer and the warmer
and much lighter overlying strata, no great vertical movement would be
required to cause a difference in temperature of 0.5" C. At Stat. 44, on
August 24th, 1912, 9.50 a. m. 1.45 " C . and 32.77 "/oo were observed at 20
metres, half an hour later, at 10.20 a. m., 0.89" C. and 32.75 "/oo were
observed at the same depth. As the densities would not differ much
(ff = 26.25 " d 26.28) it is, however, possible that there has been a hori
zontal movement of the water in this case.
On the whole it may, however, be said that there is a certain rela
tion between the temperatures and the salinities of the intermediate layer;
temperatures below zero, for instance, being as a rule combined with
salinities of between 34.35 and 34.65 %o; while the underlying layer with
temperatures above zero has salinities above 34.65 "/oo and increasing with
rising temperature. This fact seems to prove that it is the same intermediate
cold layer we find at the different stations, but sometimes situated nearer
the surface, at other times deeper; and on the other hand, the cold layer
may sometimes be thinner, sometimes thicker, a condition which probably
depends on the currents. The reason why at the southernmost station
(Stat. 54), the water-layers are so much colder than at the stations farther
north, is obviously that we here meet the water of the Spitsbergen Polar
Current less intermixed with summer waters, and the conditions are more
like those of the winter, and very much like those we find in the Polar
Current east of Spitsbergen.

ig iS- -No. 2. SPITSBERGEN WATERS. 2 9
Ovu:
too
53 31 vm.i2
-033217
50 51 52 - g j 32-77 ai 32-1,5 M ZlKI
A comparison between the vertical series of observations at the sta
tions on the shelf and those • at the stations at the mouth of the fjords
within, shows that the intermediate layer with minimum temperatures is
considerably thicker, and also colder, at the mouth of the fjords than on
the shelf outside. As an example compare Stations 53 and 52 at the
mouth of Bell Sound (Fig. 29), Stations 49 and 48 at the mouth of Ice Fjord
(Fig. 26), and Stations 16,
15, and 14 outside and
in Cross Bay (Fig. 12).
This seems to prove that,
although the cold water
of the intermediate layer
is carried out and in by
the tidal currents, at any
rate in the outer part of Fig. 2g. Section along Van Mijen Bay and Bell Sound (see
t h e f j o r d s , i t r e m a i n s f o r pig, ^ j . Horizontal Scale I : 1,000,000. Vertical Scale i : 5,000.
a l o n o ' t i m e d u r i n g t h e The intermediate isotherm of oOC. at Stat. 52, ought to have , passed wes twards beyond Stat. 53 in about 60 metres, indi-
summer, in the fiords, . . . ., , * n, t t ^• ' -' eating a thin layer with temperatures below zero at that station.
and is carried away only
very slowly, and is gradually heated, chiefly by intermixture with the water
of the overlying and underlying layers.
The Swedish oceanographers (cf. Svenska Hydrografisk-biologiska
Komraissionen 1911, pp. 13 et seq.) maintain that the melting of the sur
face ice and the glacier ice during the spring and summer has a consider
able cooling effect upon the water-strata of the Spitsbergen Qords; and they
believe that the cold intermediate strata, as well as the strata of somewhat
warmer water near the bottom, are formed by a vertical circulation caused
by this cooling.
In the summer of 1912 I got, however, a convincing illustration of
how very littie cooling effect the melting of the ice on the sea-surface has
on the underlying strata. After having taken several vertical series of
observations in the mouth of Ice Fjord between July i6th and 21st we
went north and did not return to Ice Fjord until August 24th. The fjord
was then full of ice, which some time before had been carried into it by
the current along the coast from the south (see Fig. 2). There was so
much ice that it was difficult to navigate between the floes, and several
ships had not been able to reach Green Harbour.
The ice remained in the fjord, and outside for a long time, and was
melting there. The water at 50 metres and the intermediate cold layer, with
a minimum temperature, were much warmer in August than we had found

3 0 FRIDTJOF NANSEN. M.-N. Kl.
them to be in July, when there was no ice in the fjord, an
for a long time. This was clearly proved by the vertical sen
vations taken at the mouth of the fjord between August 24th and 29th,
very nearly at the same places as the vertical series taken in July (see
Figs. 21—25). The intermediate layer had obviously been heated during
Fig. 30. The Stations 13 and 14 in Cross Bay and Stat. 15 on the shelf outside. Bathy-
metrical curves are drawn for 100, 300, and 300 metres, based on Capt. G. Isachsen's chart,
Scale I ; 400,000.
the month which had passed, and the melting of the ice on the surface
during the week previous to August 24th, had evidently had no effect
upon the temperature of the cold intermediate strata, and of course still
less on the deeper strata.
At Station 13 at the inner end of Cross Bay, we took a vertical
series of observations (Fig. 12), which is very interesting in this corinection,

I9I5- No. 2. SPITSBERGEN WATERS. 31
showing how very littie effect the melting of ice even when it reaches
deeper, has on the temperature of the water-strata. The series of obser
vations was taken first at a distance of about 200 metres, and then at
100 metres from the perpendicular ice-wall of the Lilliehook Glacier des
cending to the bottom of the sea (Figs. 30 and 81). The depth of the fjord,
200 metres from the ice-wall, was about 114 metres, and 100 metres from
the glacier about 140 metres. The strange fact is that the cold inter
mediate layer at this station, near the glacier, was considerably thinner and
Fig. 31. The ice-wall of the Lilliehaak Glacier, seen from the Veslemoy at Stat. i3,July igth, igi2.
warmer than at Stat. 14 farther out in the fjord, and even the minimum
temperature was higher than at the latter station (see.Fig. 12). At Stat. 13
the minimum temperature was — 0.25° C. at 50 metres, whUe at Stat. 14
it was — i . o i ° C . at the same depth; and strange to say, the salinity was
somewhat higher at Stat. 13 than at Stat. 14. Though the sea-water should
be cooled to its freezing-point by contact with fresh-water ice (glacier ice)
still these observations might almost seem to indicate that in this case
the mass of glacier ice may, in some way or other, have helped to raise
the temperature of the cold intermediate layer of the fjord. It is also
remarkable that at 100 metres near the wall of the glacier I observed

32 FRIDTJOF NANSEN. M.-N. K l .
a temperature of 0.32 ° C , and at 130 metres near the foot of the
glacier the temperature of the sea-water was 1.05° C. These observations
demonstrate clearly, how very littie cooling effect the glacier ice has
upon the sea-water. If this effect had been appreciable, it was to be ex
pected that the heavy water created by the cooling would have accu
mulated at the bottom of the glacier; but on the contrary we find here
a comparatively high temperature, even higher than at the same level
farther out in the Qord. The salinity, 34.76 "/QQ, seems to be the same
as would be found in the corresponding water-layer with a similar tempe
rature farther out in the fjord; but at Station 14 this water-layer was
situated somewhat deeper. A temperature of 1.12° C. and a salinity of
34.80 "/oo were there observed at 200 metres, and only a short distance
above this level both temperature and salinity must have been approxim
ately the same as at 130 metres at Stat. 13. At Stat. 16 on the edge of
the shelf, far outside the fjord, 1.07° C. and 34-74 "/oo were observed at
90 metres. This is evidently the corresponding layer. At Stat. 12, on the
shelf farther south, two days before, this layer must have been situated
much deeper, somewhere between 200 and 240 metres.
These observations show that there is much difference in the levels
of this and other layers in this region. On the other hand the obser
vations indicate a fairly active horizontal circulation between the water-
layers of Cross Bay and-those on the shelf outside; and in the inner end
of the fjord the deep water-layers are somewhat lifted along the rising
bottom towards the Lilliehook Glacier.
The surface observations at our Station 13 are also noteworthy.
Although a great quantity of pieces of ice, fallen down from the glacier,
were floating about in all directions on the sea-surface, the surface-tem
perature was 0.3" C , and what is still more remarkable, the salinity was
unusually high, 34.20 %o. At Station 14 farther out in the fjord, the
surface-salinity was 33.71 °/oo- and at Station 15 it was 32.75 "/oo with a
temperature of 2.5° C. The salinity of the surface-water thus rapidly
increased towards the inner end of the fjord and towards the glacier,
which is contrary to what it ought to be, if much ice were melting there.
It proves that the glacier-ice cannot melt very rapidly at the inner end of
the fjord; while there are better conditions for melting farther out where
the temperature of the surface-layers is higher, and where the low surface-
salinity may also be due to the waters with lower salinities carried in by
the horizontal circulation from the surface-layers outside (cf Stat. 15, Fig. 12).
The waters with comparatively high salinities at the inner end of the
fjord, must be remnants from the spring and winter when much ice was

I 9 I 5 - N o . 2 . SPITSBERGEN WATERS. 3 3
formed on the sea-surface, by which process the salinity of the fjord-water
had been much increased.
The nature of the water near the bottom of the fjords varies with
the configuration of the Qord. In Van Mijen Bay, inside Bell Sound, where
there is a high sill, and the entrance is much blocked by Axel Island,
the coldest water, with temperatures about —1.2° C , is found near the bottom
at 95 and 100 metres (Fig. 29). The salinity at this depth is 34.25 "/oo-
No such water was found in Bell Sound outside the sill, but at Station 54,
outside Horn Sound, a similar water-layer with a temperature of —1.075° C.
and salinity 34.25 "/QO was found at 50 metres below the surface. The very
cold bottom water in Van Mijen Bay might be a remnant of the cold
water formed in the Bay during the cooling of the surface and the forma
tion of ice during the winter, but more probably it has come in over the
sill from the water outside, which has certainly been much colder
during the winter and the spring, than that found in Bell Sound on August
31st, 1912.
In Ice Fjord (and Cross Bay) there is, however, considerable differences
in the temperature and the salinity of the water even near the bottom, which
proves that these fjords cannot be closed by any sill of importance, but
that there must be comparatively free communication with the water-layers
of the sea outside, from which the deep waters of the fjords have obviously
been carried in, as they cannot possibly have been formed in the fjords
themselves. In the deep hollow at the mouth of Ice Fjord, the temperature
and salinity of the water near the bottom varied from one day to another,
and there were even variations at stations not for apart and taken with
intervals of a few hours only; but the densities did not vary much. Thus
even these deep layers show less uniformity than might be expected, which
indicates that there must be a fairly active horizontal circulation, even near
the bottom.
On t h e s h e l f to t h e n o r t h of S p i t s b e r g e n , vertical series of
observations were taken at Stations 18, 22, 23, 31—35, 38, and 39. As a
rule there is no indication of a cold intermediate layer at these stations. On
the whole the temperatures are fairly uniform between the surface and the
bottom on the shelf north of Spitsbergen, especially in its western part near
Stations 22 and 23, while the salinities are gradually increasing towards
the bottom (Fig. 14). These conditions are very similar to those observed at
the ISACHSEN Stations 38, 39, and 40 north of Spitsbergen in August 1910
(see HELLAND-HANSEN and NANSEN, 1912, Section IX, PL VI.) The uni
formity in the vertical distribution of the temperature is very conspicuous
Vid.-Selsk. Skrifter. I. M.-N. Kl. 1915. No. 2. 3

34 FRIDTJOF NANSEN. M.-N. KL
35
100
200
300
jycn 0/-33-97 -05 87
2770' • • • " ' ' ' > -
3'f 33 3231 n villi? 33 ml Iz 13 VIII.12
ojp-i', fs^ms a9 329:1 nnyim ( 26V,!> I Vil i t„ZtM^.-2>
at Stations 22 and 23, which were not far from the ISACHSEN stations just
mentioned; but while the temperature on August 26th, 1910, was between
2.87 and 3.13° C , on August 6th, 1912, it was about 1.58° C. at all depths
below the surface. The difference may to . some extent be due to the
fact that the observations in 1912 were taken nearly 3 weeks earher in the
season, but nevertheless the sea to the north of Spitsbergen was obvi
ously somewhat colder in the summer of 1912 than in the summer of 1910
(see above p. 19). The vertical uniformity of the water-layers over the shelf
in this region may possibly to some extent be due to the orbital motion
of the water, caused by the tidal currents over the shallow bank.
At the more eastern stations on the shelf north of Spitsbergen there
is somewhat less uniformity in the vertical distribution of temperature which
may on the whole have a tendency to increase slightly towards the bottom
(cf. Stations 31—33, and 38, 39, Figs.
32—34). At Station 34 there was
found a cold intermediate layer, with
a minimum temperature of —0.45° C.
at 50 metres. The same layer was
also observed at Stat. 35, but not so
cold (minimum = 0.07° C. at 50 me
tres). This was evidently the typical
cold intermediate layer of the ice-Fig. 32. Section across the shelf and the submerged channel north-north-east of Hin- c o v e r e d N o r t h P o l a r s e a S . A t S t a t . 3 0 ,
lopen Strait, from Verlegen Hook to Stat. 35, outside Hinlopen Strait, the top layers Aug. 13, i g i 2 (see Fig. i) . Scales same as 1 j j 1 - j i . „. were cold, and they were evidently
in t i g s . I I —13. •'
the same kind of cold water, but there
the minimum temperature (—1.0°C.) was at the surface (Fig. 33). At Stat.
20 (Fig. 14) there was also a cold intermediate layer, with a minimum of
0.59° C. at 50 metres, but this station was on the edge of the shelf and
nearer the region of the North Polar Current; it was in the drifting ice.
At other times much lower temperatures were observed at this station
and Station 19 only a short distance oft' (see Table I).
The vertical distribution of temperature and salinity in the northern fjords,
Wood Bay and Wijde Bay (Figs. 27 & 28), is, on the whole, very different
from what was observed on the shelf to the north, outside these ijords.
The upper layers, at the surface and at 20 metres, sometimes even at
50 metres, are much warmer in the fjords than over the shelf outside,
while the deeper layers, below 50 metres, are very much colder in the
fjords than outside (see Figs. 4 —6). On the whole, the temperature of the
fjords decreases rapidly from the surface downwards towards the bottom.

I9I5- No. 2. SPITSBERGEN WATERS. 35
and at a few stations only, especially at Stat. 25 in the middle of Wood
Bay, there are indications of an intermediate layer with a minimum tempe
rature at about 50 metres. At some stations there is a slight minimum at
100 metres.
It seems probable that the cold deep-water of these fjords, especially
of Wijde Bay, must be a local formation of the inner Qord, as a corre
sponding cold water was not observed on the shelf outside the fjord. It
may be cold water that has been formed by vertical circulation during the
cooling of the sea-surface in the inner fjord in the winter and spring; and
J 4 33 30 izvnin iivnin Jim a Oiv,!', mzo'i-Miyn
too
300
itOO
500-
38 39 liviim uvni.n
^^S- 33- -Section from Stat. 30 at the mouth of
Hinlopen Strait to Stat. 36, Aug. 11—14, i g i 2
(see Fig. i) . Scales same as in Figs. 11 —13.
Fig. 34. Section from Stat. 36 across the
shelf to Stat. 39 and the Spitsbergen coast,
Aug. 14 — 15, i g i 2 (see Fig. i ) . Scales
same in Figs. 11 — 13.
these layers of cold water, filling the deep parts of the fjords, had not,
even in August, been v/ashed out by the horizontal circulation.
It is a striking feature that in both our sections across Wood Bay and
Wijde Bay the lowest temperature^- especially of the deeper layers, was
found at the easternmost stations, near the eastern coast of the fjords. This
was especially conspicuous in Wijde Bay, where, at Station 29, at depths
of 100 and 130 metres, the temperature sank even below zero. It is
difficult to say what the reason of this strange distribution of the waters
may be.
If the cold water observed at 100 and 130 metres, at Stat. 29 in Wijde
Bay, originated from the inner part of the fjord, and was flowing outwards,

36 FRIDTJOF NANSEN. M.-N. Kl.
it should be driven towards the eastern side of the fjord by the Earth's
rotation, as we found it. If we assume that the velocities of this outward
motion were greatest near the bottom, it would also explain the inclination
of the isopycnals, at the higher levels between Stat. 29 and Stat. 28
(Fig. 28), but the distribution of density near the bottom does not indicate
any such rapid motion in the deep layers. If we assume that there was
lateral equilibrium in our section (Fig. 28), and we compute the velocities
by the simple method described by me [1913, p. 49], we find the following
differences of velocity (along the components perpendicular to the section):
between 130 metres and
the Surface 18.9 cm. per second
20 metres 23.0 » » »
50 » 8.3 » ? »
100 » 0.4 » » »
The components of these relative movements were directed south-
eastwards. As the component at 100 metres, though small, also was direc
ted south-eastwards, according to these computations, it does not indicate
that there could have been any rapid northward movement at that depth.
If there really was lateral equilibrium in the section, the vertical di
stribution of density would rather indicate that between Stats. 29 and 28
the water was running southwards with a velocity at the surface of about
19 cm. per second, and at 20 metres with a velocity of about 23 cm. per
second, while along the western side of the fjord, between Stats. 27 and
28 it was chiefly running in the opposite direction with the following velo
cities, provided that the motion at 130 metres was negligible:
At the Surface 46.4 cm. per second
» 20 metres 25.0 » » »
» 50 » 4.4 » » »
» 80 » —2.5 » » »
» 1 0 0 >' — 1.4 » » »
These values do not seem probable, especially not the high velocity
of the outward flowing current at the surface, although at that hour (Aug.
lOi 3-50 P- m.) the tidal current was probably running out of the fjord.
If we assume that the difference between high-water at this place and the
transit of the moon across the Greenwich meridian, is about i hour and 30
minutes, there should have been high-water about 12.14 a. m. (central
European time) on August 10th, and the water would be running out at
3.50 p. m. But this would not explain that the water was running in at
Stat. 29, at 6.10 p. m., as low-water would not occur before about 6.30 p. m.

1915- N o . 2 . SPITSBERGEN WATERS. 37
The peculiar vertical distribution of density in the section across
Wood Bay (Fig. 27) would also be difficult to explain by tidal currents.
The inclinations of the isopycnals might seem to indicate an inward run
ning current between noon and 1.50 p. m., on August 9th, but high-water
probably occurred at about 11 a .m .
It seems also doubtful whether the steep inclinations of the isopycnals
in our sections Figs. 22 and 25, across Ice Fjord, are due to horizontal
motion of the water. The inclinations of the isopycnals of 27.70 and 27.80
between Stats. 48 and 47 are probably much to steep in Fig. 25, as the
low density at 230 metres, at Stat. 47, is hardly correct (se note Table I);
but at Stat. 11, Fig. 22, there seems really to have been a considerable
depression of the strata at about 50 and 100 metres.
It is, however, hardly probable tat there has been lateral equilibrium
in these sections. As vas pointed out above (p. 28),.several observations
indicate appreciable vertical changes in the situation of the water-strata in
short time, in the fjords as well as in the sea outside. The series of
observation from Wijde Bay and Wood Bay may also indicate such verti
cal oscillations. E. g. at 75 metres at Stats. 27 and 25 observations were
taken 25 and 20 minutes later than the observations at the levels above and
below. The densities found at 75 metres lie, however, outside the regular
"vertical" curves formed by the densities at the other levels, indicating
that the water-layer at 75 metres may have been depressed about 10 metres
at Stat. 27 and lifted about 10 metres at Stat. 25 in the 25 and 20 minutes.
In seems, therefore, probable that the peculiar vertical distribution of
density in some of our sections across the Spitsbergen fjords, is not so
much due to the horizontal motion of the water, as to vertical oscillations
of the strata.
The Deep-Water of the North Polar Basin.
I had hoped to be able to penetrate so far north of Spitsbergen that
we could reach depths greater than 1000 metres, and thus obtain samples
of the cold deep-water of the North Polar Basin; but unfortunately in-
penetrable ice prevented us everywhere from getting so far, the ice being
distributed comparatively far south in the summer and autunm of 1912.
North of Hinlopen Strait I found, however, a submarine channel extending
towards north-north-west. At Stat. 36 (Figs. 32 and 33) it had a depth of
620 metres, and the channel evidently communicates with the North Polar
Basin. At a depth of 580 metres the temperature was 0-43° C , and the
salinity was. 43.905 "/po- Two water-samples were taken from this depth.

3 8 FRIDTJOF NANSEN. _ M.-N. Kl.^
and they both gave the same salinity, differing only 0.002 %o- -" t 500
metres the temperature was 1.41° C. and the sahnity 34.93 %o- ^^ 4°°
metres the salinity was 34.91 °/oo, and the temperature was 1.68° C. Two
water-samples were taken from each of these depths. The water observed
at 400 and 500 metres must be chiefly Atlantic water that is carried north
wards with the Atlantic Current west of Spitsbergen, and which we also
observed at the Stations 19 and 41 to the north of western Spitsbergen.
The cold water at 580 metres is evidently of the same kind as the
deep-water filling the North Polar Basin. W e thus come to the con
clusion that the salinity of the latter cannot be much above 34.90 °/oo, or
exactly the same as the salinity of the cold deep-water of the Norwegian
Sea. I found a somewhat higher salinity 34.916 "/QO^ with a somewhat
higher temperature, 0.90° C , at 610 metres at Station 19, north of Spits
bergen farther west. At Stat. 41 , north-east of Stat. 19, 34.91 "/oo was
found, with a still higher temperature of 1.08° C , at 530 metres.
These salinities obtained by very accurate determinations are much
lower than the values given by the many determinations of the deep-water
of the North Polar Basin during the Fram expedition in 1893—96. By a
revision of our determinations, made with the hydrometer during that ex
pedition, I came to the conclusion [1906, p. 100] that the salinity of the
deep water of the North Polar Basin should have been about 35.10 "/QO,
a value which, however, seemed to me to be higher than was probable;
and at the same time I pointed out that the determinations of the water-
samples brought home by Doctor BLESSING, and taken at 800 and 850
metres in the North Polar Basin, gave salinities of 34.99 "/QQ and 35.01 "/oo,
which seem to be nearer the value that might be probable: I also pointed out
that if these water-samples had been exposed to any evaporation, especially
while placed for sterilization in boiling water for half an hour, before being
finally closed and soldered with paraffin wax, the salinity of the samples
may originally have been somewhat lower, and we then approach the
value of the deep-water of the Norwegian Sea. This has evidently been
the case.
The salinity of the deep-water of the North Polar Basin should con
sequently be about 34.905 "/QQ. Perhaps it is sligthly lower, because this
salinity was found with a temperature of 0.43° C. at 580 metres, at Station
36, while at greater depths in the North Polar Basin the temperature is
lower, below zero, and in the Norwegian Sea we find that as a rule the
1 See ray remarks on the values of salinity of the two water-samples from this depth, above p. 8.

1915- N o . 2. SPITSBERGEN WATERS. 3 9
deeper strata of the deep-water, with temperatures below zero, have a
slightiy lower salinity than the strata at higher levels, with temperatures
above zero.
W e thus see that the salinity of the deep-water of the North Polar
Basin is exactly the same as that of the deep-water of the Norwegian Sea.
It seems then probable that it is the same kind of water that is originally
formed during the winter at the surface of the Norwegian Sea in the
limited area between Jan Mayen and Spitsbergen, as I have described on
a previous occasion [1906, p. 75 et seq.; see also HELLAND-HANSEN and
NANSEN 1912]. The fact that the deep water, of the North Polar Basin has
a higher temperatur — with a minimum of about —o.8°C. or —0.9° C. —
than the deep-water of the Norwegian Sea, where the temperature is about
— i .2°C. or — i . i ° C . , might be.due to its becoming heated (by intermixture)
in its circulation from the Norwegian Sea northwards into the North Polar
Basin. If this explanation were accepted, it would not be necessary to
assume that there is a continuous submarine ridge between Spitsbergen
and the northern part of Greenland, the existense of which I previously
thought was proved by the assumed difference of salinity between the
deep-water of the North Polar Basin and that of the Norwegian Sea.
It is, however, possible that the difference of temperature in the two
basins might be explained by a low continous ridge between Spitsbergen
and Greenland, which prevents the coldest deep-water near the bottom of
the Norwegian Sea from running into the North Polar Basin. It would
then be only the deep-water at some higher level, where the temperature
is higher, that could flow over this ridge and form the deep-water of the
North Polar Basin. A submarine ridge rising to levels of between 1500
and 1200 metres below the sea-surface, and extending continuously from
Spitsbergen to Greenland, might be sufficient to prevent the coldest deep-
water of the Norwegian Sea, with temperatures below —0.9° C , from
running into the North Polar Basin (cf. the Belgica Stations 15—18, north
west of Spitsbergen [see Due D^'ORLEANS, 1907, PL LXVI]).
The Deep-Water of the Norwegian Sea.
At Stations 17 and 57 we collected some samples of the cold deep-
water of the Norwegian Sea. At Station 57, cold water was observed at
900 metres with a temperature of —0.84" C. and a salinity of 34.896 "/QO-
At 700 metres, at the same station, the salinity was 34.91 "/oo, and the
temperature was slightly above zero.

40 FRIDTJOF NANSEN. M.-N. Kl.
At Station 17 still colder deep-water was observed. At 700 metres
the temperature was —0.16° C , and the sahnity 34.895 "/00, At 1100
metres the temperature was —i.o7°C. , and the salinity 34.895 "/oo- The
values obtained by these very accurate determinations thus agree fairly
well with the values obtained by previous expeditions, especially the Bel
gica expedition 1905 [HELLAND-HANSEN and KOEFOED 1909]; the AMUNDSEN
expedition 1901 [NANSEN 1906]; the ISACHSEN expedition 1910 [HELLAND-
HANSEN and NANSEN 1912]. See also HELLAND-HANSEN'S and my work on
the Norwegian Sea [HELLAND-HANSEN and NANSEN 1909].
On the whole the value of 34.895 %o seems slightly lower than the
majority of the salinities of the cold deep-water, obtained by the most
accurate determinations of earlier years, e. g. those of the Belgica Expedi
tion 1905 (between 34.90 and 34.93 "/oo), .and those of the Michal Sars
expeditions 1900 and 1904 [HELLAND-HANSEN and NANSEN, 1909, pp. 332
—333, 336—337] which were between 34.905 and 34.945 when obtained
by determinations of specific gravity, but on the average 0,008 "/oo lower
when opbtained by titrations. As our determinations with the Interfero
meter are based upon standard waters, determined by titration only, this
may possibly be the explanation of our comparetively low values.
Current Measurements.
In I905 [1906, pp. 27 et seq?\ I recommended a method of mteasuring
the currents of the open sea from a steiadily drifting ship — held by drift-
anchors or by the drifting ice — by using simultaneously two current-
meters, one lowered to the quiet water near the bottom of the sea, in order
to determine the movement of the ship or the drifting ice, and the other
instrument lowered to the depth where observations were desired. This
method was, however, not tried, by myself or others, until 1910, when Pro
fessor BJORN HELLAND-HANSEN made several measurements of this kind
from the "Michael Sars" in the Atlantic, while the ship was drifting slowly,
held by the biggest tow-nets. In 1911 I made some experiments with the
"Veslemoy", drifting with a big drift-anchor made of canvas. These experi
ments fully proved the possibility of making useful current-measurements
in this manner.
In 1912 I had, however, a better opportunity of trying the method
during the days from August 4th to 6th and August 18th and 19th. The
ship was then moored to the biggest and heaviest floe that could be found
among the ice-floes. A thick, heavy piece of ice such as this, of great extent,
has naturally a very steady movement. During August 4th to 6th, at
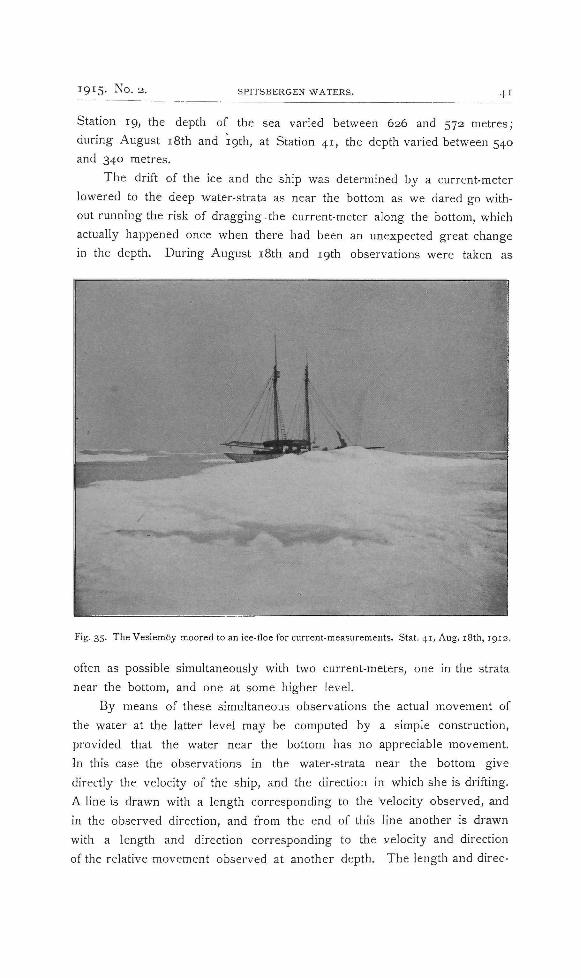
1915- No. 2. SPITSBERGEN WATERS. 4 1
Station 19, the depth of the sea varied between 626 and 572 metres;
during August i8th and 19th, at Station 41, the depth varied between 540
and 340 metres.
The drift of the ice and the ship was determined by a current-meter
lowered to the deep water-strata as near the bottom as we dared go with
out running the risk of dragging-the current-meter along the bottom, which
actually happened once when there had been an unexpected great change
in the depth. During August i8th and 19th observations were taken as
Fig- 35. The VeslemOy moored to an ice-floe for current-measurements. Stat. 41 , Aug. i8th, 1912.
often as possible simultaneously with two current-meters, one in the strata
near the bottom, and one at some higher level.
By means of these simultaneous observations the actual movement of
the water at the latter level may be computed by a simple construction,
provided that the water near the bottom has no appreciable movement.
In this case the observations in the water-strata near the bottom give
directly the velocity of the ship, and the direction in which she is drifting.
A line is drawn with a length corresponding to the velocity observed, and
in the observed direction, and from the end of this line another is drawn
with a length and direction corresponding to the velocity and direction
of the relative movement observed at another depth. The length and direc-

4 2 ^ ^ ^ FRIDTJOF NANSEN. M.-N. Kl.
tion of a line connecting the ends of these two lines will then give the
actual movement of the water at the last-mentioned depth [for this method
see NANSEN, 1906, pp. 29 & 30]. Let us take an example. At station 41,
on August 18, between 3.04 and 3.14 a.m. a velocity was observed, at 450
metres, of 23.5 cm. per second coming from S 7 o " E (magnetic); and at
100 metres a velocity of 13 cm. per second from S 4 9 ' ' E . The depth of
the sea was about 490 metres. If we assume that the water had no move
ment at 450 metres, the ship has consequentiy, during those 10 minutes,
been drifting towards S 70" E with a velocity of 23.5 cm. p'er second, while
at the same time the water at 100 metres has been moving towards
N 49" W with a velocity of 13 cm. per second in relation to the ship. If
therefore we draw on paper a line 23.5 cm. long, at an angle of S 7 o " E
with the magnetic meridian, and from the end of this line draw another
line 13 cm. long towards N 4 9 ° W , the actual current at 100 metres will
be represented by a line drawn from the starting-point of the first-line
to the termination of the latter line. The current is thus found to be 12.2
cm. per second towards N 8 8 " E magnetic or N 7 6 " E (true).
The values obtained in this manner cannot be expected to be very
accurate, because on the one hand the directions of the movements
are not measured with a sufficiently high accuracy, it being only within
± 10", as the compass-box is divided into chambers of 10" each. On the
other hand it is assumed that the water at 450 metres, near the bottom,
has practically no movement. If this assumption is not correct, the velo
cities and directions found for the currents at the higher levels and at the
surface will obviously be inaccurate; and the greater the movement of the
water near the bottom, the more will this be the case. As will be pointed
out later, it is, however, hardly probable that the movements of the water
of the deep strata were, as a rule, considerable, and at any rate not at
Station 41. ,
Another method of measuring the drift of the ship was also attempted.
The sounding-lead was sent down into the bottom-mud with as much speed
as possible, in order to make it go deep in and stick well. While the
sounding-line was then continuously kept as tight as possible without run
ning too great risk of dragging the lead along the bottom, as much line
was gradually paid out as was made necessary by the movement of the
ship. This was at first done by hand, later by putting a moderate break
on to the sounding-winch, so that line was run out when its strain be
came sufficiently great.
By noting how many metres had to be paid out for every 10 minutes,
it should thus be possible to compute the velocity with which the ship was

1915- N o . 2 . SPITSBERGEN WATERS. 4 3
drifting, and the direction of the drift was indicated by the direction of
the vertical plane of the sloping sounding-fine. Theoretically this method
should give fairly accurate results., but practically this is hardly the case.
Owing to its weight, the sounding-line wiU form a curve, and the greater
its angle with the verticaL the greater does the curve, become. It will
consequently be necessary to pay out more line than would have been
the case if the line could have been kept straight; and it is hardly pos
sible to calculate how much. Owing to this circumstance the method will
therefore give too great values for the drift of the ship. On the other
hand there is naturally a risk that the lead may be dragged along the
bottom, and if so this will naturally tend to make the mearurements of the
drift too small. Another drawback with this method is the difficulty of
measuring the direction of drift with sufficient accuracy, and it is especially
difficult to measure the changes in the direction of the drift during the
time of the observations, because the direction {i. e. the azimuth) indicated
by the line will change much more slowely than the direction of the drift,
especially if the fine forms a great angle with the vertical, and there is a
great distance between the ship and the lead on the bottom. If the line
is kept tight it will point the whole time towards the lead, and even though
the direction of the drift may change a great deal, it can cause only a
very slow alteration in the direction of the line. The currents at inter
mediate depths may also have appreciable effect upon the direction of the
sloping line. This kind of observation is not therefore of much value for
computing the actual current at higher levels from observations made simul
taneously with a current-meter from the drifting ship.
The method might, however, have been useful for controfiing the
observations of the drift of the ship made by a current-meter lowered to
the water-strata near the bottom. But unfortunately this was not done
regularly, as we had too few winches with sounding-line, and too few men
for the observations. After having made several attempts with the above
method at Stations 19 and 20, on August 4th and 5th, and after having
found by computation that it did not give satisfactory results, I gave up this
method, and decided instead to work with two current-meters, one lowered
to a water-stratum near the bottom, and the other used simultaneously at
higher levels. Some few observations were, however, made simultaneously
with the two methods.
On August 5th, from 4.11 to 4.21 p. m. an observation vas made with
a current-meter at 540 metres. The depth of the sea was then 575 metres.
The observation gave no movement, and at that time and during the pre
vious hour the observations also gave no movements at higher levels. It

44 FRIDTJOF NANSEN. M.-N. Kl.
was just one of those periods which, according to our observations, occurred
at certain intervals, when there was no relative movement of the water,
at all levels between the surface and the water strata near the bottom.
During the same time observations of the drift of the ship were made with
a sounding-fine and the lead lying on the bottom, between 3.10 and 4.20
p. m., giving an average drift of the ship of 25.6 cm. per second towards
S 34° W (magn.). Between 4.10 and 4.20 p. m. the drift of the ship should have
had a velocity of 23.4 cm. per second in the same direction, according to
these observations with the sounding-line. At this last hour the sounding-
line formed, however, a very great angle with the vertical, and it is impos
sible to calculate the curve of the line; it is possible that the strain of the line
would cause more to be paid out, even if the ship were not moving. The
observations must therefore be considered as very unreliable. They might,
however, indicate that the ship was actually drifting, approximately towards
S 3 4 " W , between 3.10 and 4.20 p .m. , while the observations with the
current-meter gave no relative movement of the water between the surface
and 540 metres. If this be correct the whole volume of water, from the
surface down to this depth, should consequently have been moving with a
perfectly uniform velocity south-westwards, and in that case the observa
tions with the deepest current-meter did not give the drift of the ship
correctly.
That the values of the drift, obtained by these observations with the
lead and the sounding-line, are not trustworthy, however, also appears prob
able from the fact that when a heavier sounding-lead was used, so that the
line could be kept tigther, then much smaller velocities of the drift were
obtained. At first an ordinary lead, weighing less than 10 kilograms, was
used, but then on August 5th, between 6.40 and 7.50 p. m. a lead of 20
kilograms was used, and the line was kept much tighter. The result was
an average velocity of 12.1 cm. per second only, though at that time the
drift was comparatively rapid, as was shown by the observations at the
depths of 50 and 100 metres; while earlier on the same day, between 3.10
and 4.20 p. m., the observations with the lighter lead gave an average
velocity of 25.6 cm. per second when the current-meter showed no motion
between the surface and 540 metres. It is, however, probable that after
the tightening of the line at 7.05 p. m., the heavy lead has got loosened,
and has been dragged along the bottom. The observation between 6.40
and 7.05 p. m. gave 20.1 cm. per second, which agrees fairly well with
the observation with the current-meter at 520 metres between 6.19 and
6.29V4 p. m-, giving a velocity of 15.3 cm. per second, considering that
the value of the velocity obtained by the sounding-line has to be reduced

1915- N o . 2 . SPITSBERGEN WATERS. 45
owing to the curve of the latter, caused by its weight. The directions of
the movements obtained by the two observations also agree fairly well.
According to our curves Figs. 58 & 59, the velocity and direction of the
drift at 6.50 p. m. should have been about 17.5 cm. per second and to
wards S 3 3 ° W , while the sounding-line gave S 3 9 " W as an average be
tween 6.40 and 8.45 p. m.
On August 18th, at 4.30 p. m., a sounding was made and gave 510
metres. The sounding-line was then hanging vertically, and remained so
tiU it was hauled up. Some minutes later an observation was made with
a current-meter at 450 metres, and gave no movement of the water, thus
indicating that there was no drift of the ship, if it may be assumed that
the water at 450 metres had no movement. In this case the observations
with the sounding-line and the lead on the bottom, and with the current-
meter at 450 metres, thus agree perfectly. An observation taken simul
taneously at 20 metres gave a considerable movement at that depth.
On August 19th, at 1.15 a. m., a sounding gave 502 metres, and the
sounding-line remained vertical till it was hauled up. A few minutes later
an observation with the current-meter at 450 metres gave a relative move
ment of the water of only 1.5 cm. per second, which consequently meant
a very slow surface drift, if the water at 450 metres can be assumed to
have had no movement. This drift of 1.5 cm. per second is so slow that
it could not be expected to be observed by the sounding-line; and in this
case the observations with both methods consequently also agree.
At other times the sounding-line showed a great deflection which indi
cated a rapid surface-drift, and this was then found to agree with the
apparent surface-drift given by the observations with the current-meter in
the deep water-strata. On August i8th, at 8.30 p. m., a sounding gave
520 metres, and it is noted in the journal that the sounding-hne was much
deflected towards NE, indicating a rapid surface-drift- towards S W . Simul
taneously an observation with the current-meter at 450 metres gave a
surface-drift with a velocity of 13.7 cm. per second towards S 70" W (magn.),
provided that the water at 450 metres had no movement. The disagree
ment between the directions of the two observations might to some extent
be explained by the fact that the deflection of the sounding-line was not
measured accurately, but was only given according to the general impres
sion; it is not therefore altogether improbable that it may have been a
point or two wrong.
On August 19th, at i .oo p. m., a sounding gave 436 metres, and the
sounding-line was deflected towards E b y N . Ten minutes later, an observa
tion with the current-meter at 400 metres, gave a surface-drift of 17 cm.

4 6 FRIDTJOF NANSEN. M.-N. Kl.
per second towards S 70" W (magn.), assuming that the water at 400 metres
had no movement. Thus the observations with the two methods agree
fairly well in this case.
On the whole, it would naturally have been desirable to have had a
greater number of observations at smaller intervals at all depths, but this
was difficult to attain as I had to read all the instruments myself, and some
rest proved necessary during the many consecutive hours, day and night,
that the observations lasted.
In addition to the current-measurements I also repeatedly took the
temperature and water-saples at different depths during the same time, in
order to follow the vertical oscillations of the strata, and compare them
with the changes in the current. There was altogether so much work for
one man that it would have been difficult to do more.
The current-observations were made with 3 Ekman current-meters.
No. 49, 52, and 53. No. 52 got out of working-order on August 4th, in
the evening, and No. 53 was used instead after that time. The formulae
for computing the velocity, directly observed with the different instruments,
were the fofiowing:
For current-meter No. 49, if the velocity be between 3.5 and lo i
cm./sec.: V = 0.9 - j - 26.0 X n
The current-meter No. 52, if the velocity be between 3.3 and 100.5
cm./sec.: V = 0.7 -\- 26.7 X n
For current-meter No. 53, if the velocity be between 3.3 and 30.7
cm./sec. (or less than 1.3 revolutions of the propeller per second):
•zi = 1.3 -(- 26.6 X n
If the velocity be between 30.7 and l o i cm./sec. the formula is:
v = o.i + 27.5 X n
n is the number of revolutions of the propeller of the instrument per
second.
The original observations and the velocities thus computed are given
in the six first columns of Table II. The latter values with the true direc
tion of these observed movements are collected in special tables for each
depth, pp. 47 and 48.
These observations give directiy the differences between the move
ments of the .ship and at the depth where the observations were taken.

I9I5- No. 2. SPITSBERGEN WATERS. 47
'
Date & Hour
Movement relative to the Ship
Velocity cm./sec.
1 0 M e t r e s . Aug. 4. Station 1 9 .
3,18 p. m. 4.36 » 7.13 »
2 3 15 17.7
Aug. 5. Station 2 0 .
1.01 p . m. 3.07 )> 7.50 »
Aug. 6.
U.44 a. m.
I I . 2 0
15
30.6
Aug. 18. Station 4 1 .
4.03 a. m. 7.26 » g . i i » 2.56 p . m. 5.02 J 8-33 » g-54 '•
Aug. ig .
2.05 a. m.
2-55 ' 6.55 •' 7.04 » g.24 » 2.00 p . m.
18
15-5? 4 3 12-5 2 0
5-7 2 8
16.5 16.5 3 2
3 3 2 3
5-6
2 0 Metres. Aug. 4. Station 1 9 .
1.47 a. m. 3.46 » 7.14 »
13.8 14.7 12
Aug. 5. Station 2 0 .
i - ig J 3-ai » 6-00 » 7-30 » 8-19 » 8-52 »
10-36 »
14-3 0
23-8 14.7 14.6
7.2 24.2
Aug. 18. Station 4 1
1,50 a. m. 3.42 » 7.05 i> g.25 i> 0.23 p . m. 3.07 » 4.44 » 5-32 "
10.23 »
Aug. 19-
2.02 a. m.
2.45 ' 6.29 » g.13 >' 1.28 1
3 1 27-5 48.5 42 30 14 28
34-5 3 5
12.5 ig-5 35 37
1 0
True Direction (towards)
N N 5 " W S 8 3 » W
N 9 0 U W 0
S 4 g " E
N 8 1 O W
N 9 " W S 3 6 " E • N 8 8 O E S g " E N 3 3 " E N 7 8 " E N 6 8 " E
N 3 8 " E N 5 8 O E
?
N 4 7 " E N 7 7 ' ' E N 6 2 » W ?
S 16" W N 4 3 " E NggO w
S 6 o " W 0
N 2 o " E N 87 " E S 9 " E S 2 2 O W S 36" W
S 3 6 " W N 4 i " W N 2 " E N 5 8 " E S 5 5 " E S 2 " E N N 2 " W N 8 7 " E
S 6 8 " W N 5 g " W N 2 3 " E N 6 6 " E
0
Actual Current
Velocity cm./sec.
8-5
5-3 12.5
iS-6 i;i-3 14 28
True Direction (towards)
S 4 5 " W
S 5 2 " W N 4O W
N i 2 " E S 32" E S 58 W N
1

48 FRIDTJOF NANSEN. M.-N. Kl.
Date & Hour
M o v e m e n t r e l a t i v e t o t h e Sh ip
Velocity cm./sec.
True Direction (towards)
A c t u a l C u r r e n t
Velocity cm./sec.
True Direction (towards)
5 0 M e t r e s .
Aug. 4. Station 2.40 a. m.
11.30 » 0.29 p . m. 2.15 » 3.18 » 3.46 » 4.36 » 6.30 » 9 2 5 »
1 9 .
12 .g
13-9 g.2 6.3 2-5 4
Aug. 5. Station 2 0 .
0.33 p. m. 1.52 » 3-34 » 7.30 »
9 39 >' Aug 6.
0.44 a. m.
Aug. 18
2.36 a. m. 4.19 » 7-53 " 1-35 P- m-3-19 " 5-15 » 5-45 » 9-38 »
Aug. 19. 1.25 ». m. 6-14 » 8.59 >' 1.13 p . m. 6.18 »
10.4 5-6 o
23-2 17.7
24.8
Station 4 1
10
12
27 35-5 14-5 14 [6
43
5-5 27 37 23 19-5
0 0 0
N 2 6 ' ' E N i 3 ' ' E N i 5 ' ' E N s e O E N 13OW S 8 7 O W
14
5-1
1.6 7.8
N T ^ W
N 3 g < ' W
N s a O W S i g O W
S 7 6 ' * E S 5 i » E
o N 6 5 O E S 5 g « E
N 6 0 0 W
S 8 0 " w N 8 8 ' ' W N 3 8 O E S 61OE S 42OE N 1 3 O E N l O E N 6 0 O E
N 7 8 ( ' E N 5 O W N 6 9 O E N 6 1 O E N l o O W
(15.4 S 6OE)
16.7 S 20OE
I I
15-5 1 3 8 10.5
6.1
14 7
2 6
4 10.4 12.9
6.1 6.7
N 7 6 ' ' E S 4 8 O W S 8 4 O W S 64OE S i S ^ E N 1 3 O E N i g O W N 7 2 ( ' E
N 7 2 ' ' E
Nseow N 8 8 ' ' E N 7 0 O E N 2 2 ' ' W
1 0 0 Metres .
Aug. 4. Station 1 9 .
0.50 p. m. 5-32 »
Aug. 5.
3.50 p . m. 7.50 »
Aug. 18.
3.og a. m. 8-55 » 2.38 p. m. 6.02 » 0.08 »
Aug. 19
2,15 a. m. 6-39 » 9-34 " 1.42 p. m.
4 8.7
Station 2 0 .
! 0
18.6
Station 41
J3 36 20 18.5 31
0 26.5 35 13
N 47"E(V N 4 6 ' ' W
0 N 57OE
N 6 1 O W N s i O E S 4 7 ° E , N 3 6 O E N e T l E
0 N i i O E N 6 9 O E N 6 8 ( ' E
12.2 10.6
7.0
13
3-5 5 2.2
9-4
N 7 6 O E N ^ O W S 2 7 ' ' E
N 6 1 O E
S l o O W ? N 4 8 O W N 7 g O E N 6 o » E

I 9 I 5 - N o . 2 . SPITSBERGEN WATERS. 49
Date & Hour
M o v e m e n t r e l a t i v e t o t h e Sh ip
Velocity cm./sec.
True Direction (towards)
2 0 0 M e t r e s .
Aug. 5. Station 2 0 .
5-14 P-m-8.51 »
I I . 1 8 I
17-5 6.4
10 .2
N 4( 'E N 3 0 O E N 5 9 O W
Aug. 18. 6.15 p . m.
10.37 '
Aug. 19.
2.30 a. m.
Station 4 1 .
14 22.7
A c t u a l Current
Velocity cm./sec.
N i o O E N B i O E
7-2
2-5 8.4
True Direction (towards)
S 6 7 O W
S 6 7 O W N 3 1 O E
Where simultaneous observations were taken in the deep strata near the bottom, the computed actual current at the different depths have been added in the 4th and 5th column.
During August 4th to 6th, at Stations 19 and 20, few simultaneous observations were taken with two current-meters, and only a few observations were taken in the deep strata near the bottom. Instead of this, attempts were made to measure the drift of the ship by means of the sounding-hne and the lead lying on the bottom; and the current measurements made during these days give therefore less complete results.
It is therefore preferable to discuss first the series of observations at Stat. 41, during August i8th and 19th.
Current Measurements at Stat. 41, on August iSth and igth, ic)i2.
By means of the direct observations at Stat. 41, curves of relative
velocity and direction have been constructed in Figures 36 and 37, for
depths of 10, 20, 50, and 100 metres and for the strata near the bottom
(depths between 470 and 300 metres). In these figures the hours are marked
along the axis of abscissas, the direction (magnetic) and velocity (in cm. per
second) along the axis of ordinates. The curves for the depth of 10 metres
show great irregularity, which must obviously be due to the fact that the
movements of the water at this level are much influenced by the movements
of the ice which descended much deeper at its thickest parts. Thus the
free movement of the water was probably much hindered at this level, and
sudden irregularities might be caused by vortices, etc. Only three observa
tions were taken at 200 metres, and these are not sufficient for the con
struction of curves for this depth; but an attempt has been made to draw
Vid.-Selsk. Skrifter. I. M.-N.Kl. 1915. No. 2. 4

50 FRIDTJOF NANSEN. M.-N. Kl.
probable curves for a short distance (between Aug. i8th 6 p- m- and Aug.
19th 2.30 a, m.).
The curves show, on the whole, a well-defined period of about tvelve
hours, during which the velocities vary greatiy from values of more than
'[ [ --
£
~ ---
N -
c .
•J/
Sf w
1 f
1 1
Ct '
T 1
1 1/ ,' 1 fe 1 / l)f-l\
/ V / 1 1
•' V /\ ' f\i/' c
1 1/ ir 1 \ 1/ -•'
•$ '"1 / , < * 1
Ir U ••
*jY' r' I •"
/ rJ
•• i*' /^ 1 1 i '/ i
7 ' J
f I J
1 4-
11
f
Ql V'
•
i 6
1 3
1 0
1
M ^
•
• ] • \
1 \
[••m 1 '
•fp
lr\
e 1
1
^ 1
• /Xi'
s A
al rt - I'lf ' \ll
^f/v'
— \n flM 1 iK 1
V \ \ M 4'^
i J . 8
1
1 0 f
,
•1 2
- - xyi m
1 I
\ \
1 3
1
\ J i
1
0 f
' [^ "p
/
n-
1
M .
1
/
0 u-
)
JT'^
i i I
-L
I'-H
c
I8.VI1I.I2. I9.VIII-I2.
'8-VIII. 12. 19 VIII. 12. » • • • • • • • • • f u m v WTTzstuis , . ft^mt 20meius X If—/tern SOrmtiis . - _ . . _ _ fu,m,/OOmetus x -x fi.or^Z00-m£tUs o o—fumt. 30C-"lyO mdus
Figs. 36 & 37. Curves of Direction (Fig. 36 above) and Velocity (cm./sec. Fig. 37 below) of
tlie Relative Movements at different Depths at Stat. 41 , Aug. 1 8 - 1 9 , 1912- The directions
are magnetic and are those towards which the water moved in relation to the ship.
M means Midnight and N Noon.

1915- No . 2. SPITSBERGEN WATERS. 51
40 cm. per second, to less than could be registered by the current-meters,
and during the same period the directions shift as a rule continuously
towards the right, on the whole about 360°. This continuous turning
towards the right of the direction of the observed movements at all depths,
is obviously due to the effect of the tidal wave, and the chief period
observed seems also to coincide, approximately with the tidal period, though
possibly somewhat shorter.
Our curves show, however, many irregularities. Some of them may
naturally be due to irregular movements of the ship moored to the ice
floe, e. g. caused bj ' turning of the floe, or by pressure against other
floes, though on the whole the ice seemed to be very quiet. On account
of such sudden irregular changes in the movements it may be difficult
to draw the curves correctly where the intervals between the observa
tions are not sufficiently short; and in many parts they cannot be consi
dered as more than rough approximations.
But even if the movements observed had not been influenced by irre
gular, accidental movements of the ice-floe, and if the curves were cor
rectly drawn, we must expect them to show many apparent irregularities;
for the currents observed are obviously influenced by several factors.
The permanent or average currents would naturally have a certain perma
nent direction at each depth, if not influencd by other agents; but the direc
tion and velocity are, on the one hand, continuously being altered by the effect
of the tidal wave coming from the Atlantic, which evidentiy causes the chief
periodicity of the curves, of about twelve hours. On the other hand there
must be a local tidal wave of the circumpolar North Polar Basin which also
has a periodical effect upon the current, naturally much smaller, but still
complicating the phenomena. Besides these more or less regular influences
there may be apparantly quite irregular effects caused by incidental vortex-
movements in the different strata. It is also possible that stationary sub
marine waves of different kinds, and pulsations of the prevailing currents
may occur. The result must be very complicated movements giving appar-
antiy very irregular curves of velocity and direction.
Amongst our curves those for the deepest strata, giving the drift of
the ship moored to the ice-floe (see later), are the most accurate, as they
are based on the greatest number of observations (31 in 40 hours). They
also show most irregularities, probably because the details are better
known; and if still more observations had been taken the number of ir
regularities would probably have been increased. As it is, the curve of
velocity in particular shows a slight tendency towards a division of the
great period of about twelve hours. In the first great wave of this curve

52 FRIDTJOF NANSEN. M.-N. KI.
there is a maximum at 8 a. m.
(Aug. 18th) and a secondary
maximum between i and 2
p. m. In the second great
wave there is a secondary
maximum at 6 p. m. and a w
greater maximum at about
l o p. m. In the third big
wave there is also a tendency
towards a simular develop-
nient of a secondary maxi
mum at about 6 or 7 a m.
(Aug. 19th), besides the chief
maximum at 10 a. m.
This might be due to
the effect of the local tidal
wave of the North Polar
Fig. 38. Central Vector Diagram of the Relative Move
ment at 1 0 M e t r e s , at Stat. 41, from Aug. i8th 2 a. m.
to Aug. igth 2 p. m. N means Noon, M Midnight.
2 a/.iiu
Basin in addition to the great tidal wave of the Atiantic; but without more
complete material in the form of observations, nothing can be said with
certainty in this respect.
One remarkable and con
spicuous effect of the
great tidal period is that
at intervals of about
twelve hours, the move
ment at all depths, be-
twen the surface and the
deepest layers, have a
marked tendency to ap
proach zero.
By taking the direc
tions and velocities for
each hour from our cur
ves Figs. 36 & 37, the
vector-diagrams. Figs. 38
—43, have been con
structed. The marks, with
the numbers of the hours,
along the curves indicate
the direction and velo-
50 ovysec:
Fig- 39. Central Vector Diagram of the Relative: Movement at 2 0 M e t r e s , at Stat. 41 , from Aug. i8th 1.50 a. m. to
Aug. 19th i . s8 p. m.

1915- N o . 2 . SPITSBERGEN WATERS. 53
city (distance of mark from the centre of co-ordinates) of the relative movements. N means noon, and M midnigth; the direction given mean those from which the water at the depth in question moved in relation to the ship (or ice-floe), or rather the direction t o w a r d s which the ice-floe moved in relation to the water at the depth in question. The black discs along
N 50 TfV. WOwv,
AE W-
^70-300 Tn,. Ict.Tn,
200Tn^
50 C TCi/StQ,
Figs. 4 0 - 4 3 . Central Vector Diagrams of the Relative Movements at 50 ,100 , and 2 0 0 Metres, and at the depths of between 3 0 0 and 4 7 0 Metres, at State 41. The last mentioned diagram, Fig. 43 probably gives approximately the velocities of the vessel and the surface lay> rs,
and the direction towards which they drifted.
the curves indicate the actual observations, a ring instead of a black disc
indicates that the observation was doubtful.
These central vector-diagrams cannot be considered as more than very
rough estimates, as they are based upon far too few observations. At 20 me
tres there are only 14 observations in 36 hours, at 50 metres 13 observations
in about 40 hours, and at 100 metres 9 observations in 34V2 hours. The
curves of the diagrams for these depths seem, however, fairly probable on

5.4 FRIDTJOF NANSEN. M.-N. Kl.
P 'i
c!
i > D
o c;
rfl 'd
U i
o\
""" fin
< c
^
j j
^ Siup
^ S
M 0)
1- •tt o u fi s V
<u O
> »-
rogr
ess
O,
50,
CL, N
4 "*
Fig.
m
ent
"rt t/J
,
tre
u
o t^ 1 "
anc
O O
"ni
& ,J=
hie
^
tow
ards
o
dire
c
< c OJ OJ
mea
ns
is Z X I
—
ach
hoi
u u o
ship
,
p
u 0
b
fl

i g i S - N o . 2. SPITSBERGEN WATERS. 55
the whole. At the greatest depths, between 300 and 470 metres, 31 ob
servations were taken in 40 hours; and the curve for these depths should
consequently be the most trustworthy. At 10 metres there are 12 obser
vations in 34 hours, but they show great irregularities, and the curve of
the vector-diagram has a very improbable shape. The vector-diagram for
200 metres, based on only 3 observations, is naturally very uncertain, but
may give an idea.
On the whole, the curves of these vector-diagrams show a tendency
towards forming more or less irregular ellipses, which, e. g. at 20 metres,
approach circles. The directions of the long axes of the ellipses may shift,
but seem to have a tendency towards N W and SE or W N W and ESE..
By means of the directions and velocities of the relative movements
for each hour, given by our curves in Figs. 36 & 37, the progressive vector-
diagrams, Fig. 44, have been constructed. They show the directions
t o w a r d s which the water at each depth of observation was moving in
relation to the ship or the ice-floe.
If we were to assume that the actual movements of the water at the
greatest depths of observation were so insignificant, that they might be
left out of consideration, the indications of the current-meter at these depths
give the direction and velocity of the drift of the ice-floe and the ship.
The progressive vector-diagram representing the movement of the deepest
water in relation to the ship, consequently gives the drift of the ship
of the ice-floe, if we turn it round so that North becomes South and
East West.
During the period of observation the ship should thus have drifted
from the end of the progressive vector-diagram to the right to its starting
point to the left, i.e. towards S 6 6 ° W ( S 7 8 O W magnetic) with an aver
age velocity of about 12.7 cm. per second (taking the observations between
Aug. i8th 2 a. m. and Aug. 19th noon).
But during the same time the water at the other depths would have
moved along their progressive vector-diagrams in relation to the ship.
If, therefore, we draw lines from any point of the first vector-diagram to
the corresponding points [i. e. corresponding to the same hours) of the
others, these lines give the distance and direction of the active movement
at the different depths during the period that has elapsed from the be
ginning of the observations till the moment chosen.
W e thus find that from August i8th 2 a. m. till August 19th at noon,
the water at 20 met res should have moved towards N 6 O W ( N 6 ° E mag
netic) with an average velocity of about 7.8 cm. per second.

56 FRIDTJOF NANSEN. M.-N. Kl.
At 50 metres the water should have moved during the same period
towards. N 55 0 E (N67OE magnetic) with an average velocity of 3.6 cm.
per second.
At 100 metres during the same period the water should have moved
towards N 3 8 " E (N50OE magnetic) with an average velocity of 3.4 cm.
per second.
As the observations of the relative movements at 10 metres give such
very irregular values a progressive vector-diagram for this depth is not
constructed for the whole time of observation (see later).
It seems astonishing that while the ice was moving with such a velo
city towards S 66 ° W , the water at 20 metres was moving northwards at
an angle of 108° with the movement of the ice, and at 50 metres the
water was moving almost in the opposite direction of that of the ice (at
an angle of 169°), while at 100 metres the water was moving in a direc
tion between that at 20 metres and that at 50 metres.
If we are wrong in our supposition that the movements of the deepest
water (near the bottom) are so insignificant that they can be left out of
consideration, the above results would not be trustworthy. If, for instance,
the water of the deepest layers had been moving with a considerable velo
city in the same direction as the ice-floe, the actual movement of the latter
would consequently be so much more rapid, and our progressive vector
diagram in Fig. 44 would have to be lengthened towards the right; the
direction and velocity of the movements at 20. 50, and 100 metres would
also have to be altered. But even then the movements at these depths
would be very much smaller than the movement of the ice-floe, and would
be directed, at great angles, towards the right.
There seems, however, to be no reason -why the movement of the
water at great depths — greater than 300 metres — should be considerable
in any south-westerly direction, considering that the water at 100 and at
50 metres, according to our observations, had such slow movements, and
those in north-easterly directions. The water at depths greater than 300
metres is comparatively warm water which must come from the south, and
evidently with very slow movement. W e might thus expect that our re
sults would give an approximate idea of the real movements of the water
at the different depths.
A remarkable result of our observations is the great difference be
tween the movement of the ice and the movement of the water at a depth
of 20 metres, considering that the ice had a great thickness, and conse
quently its movement does not represent only the surface drift, but rather
the movement of the whole top layer of the sea, down to a certain depth

1915- No . 2 . SPITSBERGEN WATERS. 57
equal to that ot the ice. If we assume that the ice-floe, to which the ship
was moored (see Fig. 35), had an average thickness of about 4 or 5 metres,
it seems probable that its movement should represent the average move
ment of the upper layer — about 5 metres thick — of the sea; and there
was no wind during the period of observation, which could influ.nce the
drift of the ice appreciably.
As some parts of the ice may descend deeper, it may also be in
fluenced by the movement of the water at this greater depth; but this
must be of much less importance than the effect of the current of the top
layer of the water upon the main body of the ice. On the other hand it
must, however, be remembered that a heavy ice-floe, such as that to which
the ship was moored, represents a great mass which has a considerable
vis inerttce, and cannot therefore be expectd to follow at once all changes
in the movements of the water of the top layer of the sea. It seems there
fore possible that the effect of the tidal wave may often turn the direction
of the water somewhat more rapidly than that of the ice. Thus the direc
tion of the movement of the ice and the top layer of the sea may not
coincide at all moments, especially when there are rapid changes in the
direction.
W e may nevertheless expect, however, that the movement of the ice
floe represents on the whole the average movement of the top layer of
the sea, although irregularities may, now and then, arise, especially, per
haps, from the pushing of the ice-floes against each other during the drift,
as was mentioned before.
It would have been of much importance to the study of the above
question, if our observations at 10 metres could have given fairly trust
worthy information about the movement of the water at that depth; but
unfornately the observations indicate that the movements often change so
suddenly and so irregularly that we should want a much larger number
of observations, taken at short intervals, in order to be able to trace the
movements at this depth in their details.
Our curves of velocity and direction, Figs. 36 & 37, and our central
vector diagram. Fig. 38, representing the movement at 10 metres, give an
idea of the great irregularities. But even these curves had to be construc
ted hypothetically for long intervals; and if there had been more obser
vations the curves would certainly have been much more irregular. An ex
ample of the irregularity of the movement at this depth is given, for in
stance, by the observations between 7.21 and 7.31 a. m. on August i8h,
when, during the ten minutes the observation lasted, the direction of the
movement at 10 metres changed 160°, from N 40° W to S 60° E, and this

58 FRIDTJOF NANSEN. M.-N. Kl.
changing direction shows a striking disagreement with the directions obser
ved both before and after that hour. It is obvious that under such circum
stances it is impossible to construct the probable curve of movement with
out having numerous and frequent observations. Our curve in Fig. 33 must
thus be considered as quite unrealiable, and it this therefore difficult to
discuss the motion at this depth.
200 cm./SCO.
Fig. 45. Progressive Vector Diagrams of the Relative Movements at 1 0 Metres and the other
depths of Fig. 44, between Aug. i8th 3 p. m. and ig th 2 p. m. Stat. 41.
By using those parts of the curves of velocity and direction which
should be most reliable, owing to a greater number of observations, I have
attempted to construct a progressive vector diagram for the relative move
ments at 10 metres, between August i8th 3.00 p. m., and August 19th 2.00
p. m., and have compared it with the progressive vector diagram for the
deepest water-layers (/. e. presumably representing the drift of the ship)
during the same period (see Fig. 45).
The progressive vector diagrams of the relative movements give us
(in the same manner as described above p. 55) the following values of the
real currents between August i8th 3 p. m. and August 19th 2 p. m.:

i g i S - N o . 2 . SPITSBERGEN WATERS. 59
At the Surface i s .6 cm/sec . towards S 62" W
„ 10 metres i.g „ „ N 4 4 O E
20 „ 5.6 „ „ N 8 0 E
» 50 „ 4.8 „ „ N 5 7 O E
» 100 „ 2 6 „ „ N 6 7 ' ' E
It is noticed that the values for 20, 50, and 100 metres differ some
what from the values found above (pp. 55 and 56) at the same depths for
the whole time of observation.
A. remarkable result of this construction would be that while the ship
drifted, with the ice and the surface-layer, towards S 62" W with an aver
age velocity of about 12.6 cm. per second, the water at 10 metres would
have moved in almost the opposite direction, towards N 44 ° E, with a mean
velocity of 1.9 cm. per second.
This result may seem absurd, especially considering that the move
ments at 20, 50, and 100 metres were so very different.
It was pointet out above that the observations at 10 metres are not
numerous enough for the construction of trustworthy curves, and there
might have been many irregularities which our curves do not show. On the
other hand, if we look at the central vector diagram for 10 metres (Fig.
38), we are struck by the fact that the majority of observations lie in the
quadrant between south and west, which should indicate that the relative
movement at this depth has, to a very great extent, had a north-easterly
direction, and it seems somewhat difficult to believe that this should only
have been quite accidental. It would consequently indicate that the actual
movement of the water at 10 metres was very different from that of the
drifting ice and the top layer of the sea.
Even at 5 metres the movement of the water seemed to - be very
different from that of the surface-water and the ice, as could often be seen
if one watched the movements of the fan of the current-meter when it was
lowered through the clear water; but only one regular observation was
taken at this depth, namely, on August 5th, 8.15V2—22 p. m.
The explanation of the great difference between the movement of the
water at 10 metres and that of the ice and of the top layer of the sea
may be that at 10 metres there was a reaction-current running in a direc
tion more or less opposite to that of the surface-current. At Station 41,
at 10 metres, there was water of very nearly the same kind as that of the
surface/ with a salinity of a littie more than 32 "/oo and a temperature of
about 0.1 OC. The density (at) was about 25.90. This water-layer, some
times more than 10 metres thick, and sometimes less (cf Aug. 19th, 3.20
p. m-), seems to be approximately homogeneous, being composed of water

M-N Kl 6 0 FRIDTJOF NANSEN. _
that was very different from the water at 20 metres, where a temperature
of I . I I 0 C. and a salinity of 34.11 "/oo were observed, giving a density of 27.34.
It seems probable that in the upper homogeneous layer, about 10
metres thick, the ice and the uppermost water-strata, with a thickness of
some few metres, were moving in one direction, while the water in the
lower part of the layer, about 10 metres below the surface, moved ap
proximately in the opposite direction, in order to compensate the surface-
movement.
While the central vector-diagrams for 20, 50, and 100 metres (Figs.
39—41) represent only the relative movements of the water at these depths,
the diagram for the greatest depths, between 300 and 470 metres (Fig. 43)
represents the actual movement of the ice-floe, provided that the move
ments of the water at these depths were negligible. If this be correct,
it is simple, by a combination of this diagram with the other diagrams, to
construct the vector-diagrams for the actual movements at the other depths.
The simplest method is to take the diagram^ e. g. for 20 metres, and place
it on the diagram giving the drift of the ice. If the mark for any certain
hour of the one diagram be placed exactly over the corresponding mark
for the same hour of the other diagram, and both diagrams are placed
in their correct position with their north-south co-ordinates parallel to each
other, then the line between the centre of the diagram for 20 metres, and
the centre of the other diagram, give the velocity and direction of the
actual movement at 20 metres at that moment. By doing this for all hours
during the period of observation, we obtain a vector-diagram showing the
velocity and direction of the actual movement at 20 metres during that
time. The directions are those f rom which the water was moving. If,
however, it is desired to have the direction t o w a r d s which the water
was moving, all that is necessary is to turn the vector-diagram upside down,
so that North takes the place of South. In this manner our vector-diagrams.
Figs. 46—50, showing the actual movement at 20, 50, and 100 metres,
have been constructed. The black discs in these figures indicate the results
obtained by the observations at those depths.
By taking the values of velocity and direction from these vector-
diagrams, the curves of velocity and direction. Figs. 5 1 & 5 2 , have been
constructed, and also the progressive vector-diagrams. Fig. 53, showing the
actual movements at the depths of 20, 50, and 100 metres.
As might be expected the total movements at these depths, given by
the latter diagrams, agree fairly well with the mean velocity and direction
of the actual movements at the different depths, obtained by the combina-

1915- No. 2. SPITSBERGEN WATERS. 61
tion of the progressive vector-diagrams of the relative movements (see PP- 55 and 56). According to the progressive vector-diagrams. Fig. 53, we find that from August i8th 2 a. m. to August 19th at noon, the water should have moved,
at a depth of 20 metres, towards N i ° W (N 11" E magnetic) with a mean velocity of 7.6 cm. per second;
at 50 metres, N 58° E (N 70° E magnetic) with a mean velocity of 3.6 cm. per second;
207rt.
£• W
200Tn-.
JL. 50 orni/itcv.
Fig. 46—50. Central Vector Diagrams of the Real Movements at 20 , 50, 100, and 2 0 0 Metres as they probably were according to the measurements at Stat. 41.
at 100 metres, towards N 42" E (N 54° E magnetic) with a mean velo
city of 3.3 cm. per second.
The shifting of the direction of the water-movement towards the right
with increasing depth, simultaneously with a decrease of the velocity, might
appear to agree with what it theoretically ought to be (cf. NANSEN, 1902,
p. 369 et seq.). While the average drift of the ice at the surface was
about 13 cm. per second towards S 66" W, the current at 20 metres
moved with an average velocity of about 8 cm. per second at an angle
of about n o " towards the right of the direction of the surface movement.

6 2 FRIDTJOF NANSEN. M.-N. Kl.
and at 50 metres the current moved with an average velocity of 3.6. cm.
per second at an angle of about 170° towards the right from the direc
tion of the surface-drift. The decrease of the velocity is, however, not so
2 4 6 8 10 N 2 5 6 8 10 M 2 k 6 8 10 N 2 h 6 18.VIII.12 19.VIII.12.
yaCu)£t . 207ne/ics x-
19. VIII. 12. -SO-me-ite^ •—m—fOO-melles
Fig. 51 & 52. Curves of Direction (magnetic) and Velocity (cm./sec.) of the Real Movements
at different Depths, according to the measurements at Stat. 41 . The Directions are those
t o w a r d s which the water moved, excepting that the curve for o m e t r e s (i e. the drift of the ship) by a mistake gives the directions f r o m which the water moved.
great as it ought to be with the observed deviation of the direction of the
movement according to Professor V. WALFRID EKMAN'S theoretical calcula
tions [1902, 1906, NANSEN 1902, p. 371].

1915- No. 2. SPITSBERGEN WATERS. 63
" s
At 100 metres we find that the
direction of the current was towards
the left of the current at 50 metres,
the direction forming an angle of only
about 154° with the direction of the
surface-drift. This agrees with the
observations made by Professor Hel
land-Hansen to the south of the
Azores, during the cruise of the
"Michael Sa r s " in 1910. He found
that the direction of the current tur
ned continuously towards the right
with increasing depht down to a cer
tain level at more than 50 metres,
below which the shifting was reversed, so that the direction was
more and more towards the left with increasing depth. In our
case the level where the shifting was reversed, may have been
somewhere between 50 and 100 metres, which may also have
been similar to that observed by Professor Helland-Hansen.
The cause of this phenomenon may be that in the upper
layer of the sea the greatest velocity of the current is generally
found near the surface and gradually decreases downwards, and
in that case we should naturally expect a gradual deflection of
the direction of the current towards the right with increasing
depth. But if there be another current in a deeper layer with
a secondary maximum of velocity the direction of the water-
<u
s 0 0
c
0 10
0 C
h d, vn
0
01
o\ " W) :3
<; TJ
1-1
•5 J3
tn ^
C CJ
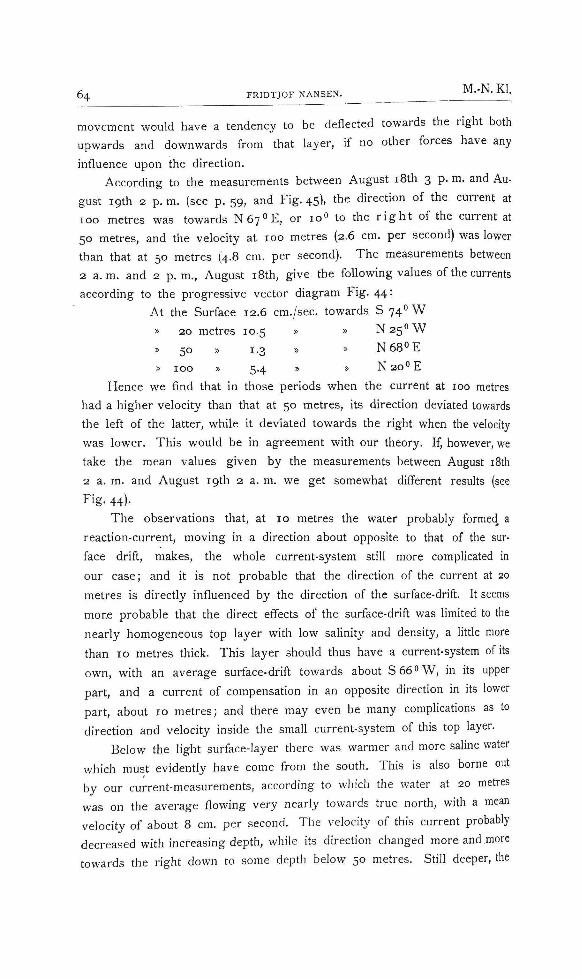
6 4 FRIDTJOF NANSEN. M.-N. Kl.
movement would have a tendency to be deflected towards the right both
upwards and downwards from that layer, if no other forces have any
influence upon the direction.
According to the measurements between August i8th 3 p. m. and Au
gust 19th 2 p. m. (see p. 59, and Fig. 45), the direction of the current at
100 metres was towards N67OE, or 10" to the r i g h t of the current at
50 metres, and the velocity at 100 metres (2.6 cm. per second) was lower
than that at 50 metres (4.8 cm. per second). The measurements between
2 a.m. and 2 p.m., August i8th, give the following values of the currents
according to the progressive vector diagram Fig. 44:
At the Surface 12.6 cm./sec. towards S 74" W
» 20 metres 10.5 » » N25OW
» 50 ^ 1.3 » » N68°E
» 100 » 5.4 T> » N2o°E
Hence we find that in those periods when the current at 100 metres
had a higher velocity than that at 50 metres, its direction deviated towards
the left of the latter, while it deviated towards the right when the velocity
was lower. This would be in agreement with our theory. If, however, we
take the mean values given by the measurements between August i8th
2 a. m. and August 19th 2 a. m. we get somewhat different results (see
Fig. 44).
The observations that, at 10 metres the water probably formed a
reaction-current, moving in a direction about opposite to that of the sur
face drift, makes, the whole current-system still more complicated in
our case; and it is not probable that the direction of the current at 20
metres is directly influenced by the direction of the surface-drift. It seems
more probable that the direct effects of the surface-drift was limited to the
nearly homogeneous top layer with low sahnity and density, a littie more
than 10 metres thick. This layer should thus have a current-system of its
own, with an average surface-drift towards about S66OW, in its upper
part, and a current of compensation in an opposite direction in its lower
part, about 10 metres; and there may even be many complications as to
direction and velocity inside the small current-system of this top layer.
Below the light surface-layer there was warmer and more saline water
which must evidently have come from the south. This is also borne out
by our current-measurements, according to which the water at 20 metres
was on the average flowing very nearly towards true north, with a mean
velocity of about 8 cm. per second. The velocity of this current probably
decreased with increasing depth, while its direction changed more and more
towards the right down to some depth below 50 metres. Still deeper, the

1915- N o . 2. SPITSBERGEN WATERS. 65
direction may, at least during some periods, have changed more and more
towards the left with increasing depth, while the velocity may perhaps have
increased somewhat down to a certain level. Our observations at 50 me
tres, at Stats. 41 a—42 (Table I), indicate great variations in temperature and
salinity at this level. On August i8th, at 1.15 a. m., there was observed
at 50 metres 0.85" C. and 34.600/00 (density = 27.76); at 10.00 a. m. on
the following day, at the same depth, there was found 2.21" C. and 34.815 "/QQ
(density = 27.83), at 3.20 p . m . 0 .8300. and 34.650/00 (density = 27.80),
and at 5.30 p. m. the temperature was —0.09 0 C. At 7.40 p. m. at Stat. 42,
a few hundred yards outside the ice-edge, we found at 50 metres 2.82° C.
and 34.71 0/00 (density = 27.69). Water of different types was consequently
at intervals observed at this depth: a cold water (0.85" C.) with lower
salinity (about 34.60 O/OQ) at 1.15 a. m. on August i8th, and at 3.20 p .m.
on the following day (at 5.30 p. m. it was still colder) and a much warmer
water (2.21" C.) with a higher salinity (34-815 °/oo) at 10.00 a .m. on Au
gust 19th.
The cold and less saline water may come, more or less, from the ice-
regions of the sea to the north or north-west, while the warmer and more
saline water must come from the south. It is, however, noteworthy that
when the cold water was observed at 50 metres, the water was moving
in north-easterly directions, at that level relatively to the ship, while the
water was moving westwards, relatively to the ship, when the warmer and
more saline'water was observed. The changes in the water cannot, there
fore, be adequately explained simply by horizontal movements of the water
at this depth; they are more probably due to vertical osciUations of the
water-strata, chiefly caused by the changing tidal currents, as will be dis
cussed later.
W e must then assume that between the layer at twenty metres with
1.11° C. and 3 4 . 1 1 % , and the layer observed at 50 metres with 2.21° C.
and 34.815 0/00, there was a colder layer with 0.85« C. and 34.60 %o, which
was sometimes lowered to 50 metres, while at other times the underlying
warmer stratum was lifted to that level.
At 100 metres the water had a more uniform temperature of about
2.9«C. and a salinity of about 34-96 % « ; being the typical waters of the
Atiantic Current running towards the north-east in this region.
Our observations show that the currents at all depths are greatly in
fluenced by the tidal waves, as was already proved by Helland-Hansen's
important observations some years ago [1906]. Thus the phenomena be
come very complicated, and in order to follow the variations of the direc-5
Vid.-Selsk. Skrifter. I. M.-N. Kl. igi5- No. 2.

66 FRIDTJOF NANSEN. M.-N. Kl
tion and velocity of the currents in their details, it would be necessary to
have observations at a great many depths, with much shorter intervals
vertically, than is the case in our series of observations.
Though our observations are not sufficient to give in detail the changes
in the currents at the different depths, they prove at any rate that the
movements of the water in the currents of the sea are much more com
plicated than was generally assumed.
Computation of the Velocities of the Currents in the Region between
Stats. 41 and 40, by means of Dynamic Sections.
It would be of much interest to examine to what extent the velocities
of the currents at different depths found by our measurements, may agree
with the corresponding values of velocity computed by means of dynamic
sections. It has, however, to be considered, on the one hand, that the
computations by sections should give the average velocity of the water at
each depth in the whole region between every two stations, while the
current-measurements give the velocities at one particular station, and there
may be many local variations in the velocities, owing to vortex move
ments, etc.
On the other hand, our current-measurements prove that the velocities
and directions of the currents change very quickly from hour to hour,
while the sections will not, as a rule be representative for any special
moment, because of the intervals of at least some hours, that generally
will exist between the observations taken at two different stations af a
section.
Moreover the computation of the velocities by means of dynamic
sections is based upon the supposition that there is perfect lateral equihb-
rium in the sections; but with such rapidly changing currents it is not
probable that such an equilibrium can ever be attained.
In addition to this, there may also be other agents producing tempo
rary oscillations of the layers at the stations. Hence it follows that we
cannot, even under favourable circumstances, expect to find a very close
agreemeent between the values of velocity found by measurements and
those found by dynamic computation.
In our case we have the two Stations 40 and 41 a, the latter situated
perhaps a little more than 3.5 miles, or about 7 kilometres, towards the
north from the former. The observations at the two stations were taken
at an interval of 3 hours and 30 minutes. At Stat. 40 no observations

1915- No. 2. SPITSBERGEN WATERS. 67
Om
300
kl kO 17-J8VIII12 IT.VlILiZ
~OT
were taken deeper than at 150 metres, and at Stat. 41 a no observations
deeper than at 100 metres. The series of the latter station may, however
be combined with the deeper series taken at Stat. 41 i hour and 45 mi
nutes earher, and only a short distance offi.
Fig. 54 represents the section through these stations. The inclination
of the isopycnals indicate that the currents should have had westward di
rected components (perpendicular to the section) between the surface and
10 metres (see the isopycnal of 27.00), and east
ward directed components between 20 and 200
metres (see the isopycnals of 27.50 to 27.90).
Let us assume that at depths of 300 metres
there was no appreciable difference between the
densities at the Stations (40, 41 and 41 a), and
that the movements of the water at that depth ^^^1
were negligible. If we draw the curves of the
vertical distribution of density at Stat. 40 and
41 a (and 41), Fig. 55, we can compute the velo
cities of the currents by means of the simple
method that I have described [1913, p.49]. W e 200-
then find the following values of velocity for
the components of the currents, directed east
wards at an angle of 90° with our section:
2.^./ .91,
At the Surface —11.6 cm. per second
At 10 metres 0.6 „ „
20 „ 7.2
» 50 » 3-6 „ 1 0 0 „ 2 . 3
According to our current-measurements the
average velocities and directions of the currents ^ i 1912.
should havebeenaboutthefollowing(seepp.55,59).
At the Surface 12.7 cm. pr. second towards S 6 6 0 W
„ 10 metres i.g „ „ „ N 4 4 O E
„ 20 „ 7.8 „ „ „ N 6 0 W
„ 50 „ 3-6 .. .. » N s s O E „ 100 „ 3.4 ., » ,, N 3 8 O E
If our section was directed along the meridian, and these angles are
introduced our computations will give the following values for the currents:
Fig. 54. Sections through Stats.
40 and 41 (and 41 a) Aug. 17 —
Horizontal Scale
1 : 1,000,000. Vertical Scale
1:4,000. Stat. 41 a [i.e. the ob
servations between o and 100
at 41) were taken about 2 kilo
metres nearer to Stat. 40 than
given in this figure.
1 Two later series of observations, taken at the same station (41 b and 41 c), gave higher
densities than the series at 41 a. But they were taken more than a day later, and so
long time after the observations at Stat. 40, that they cannot be used for computations
such as these, even if we take into consideration the distance that the ship may have
drifted in the mean time.
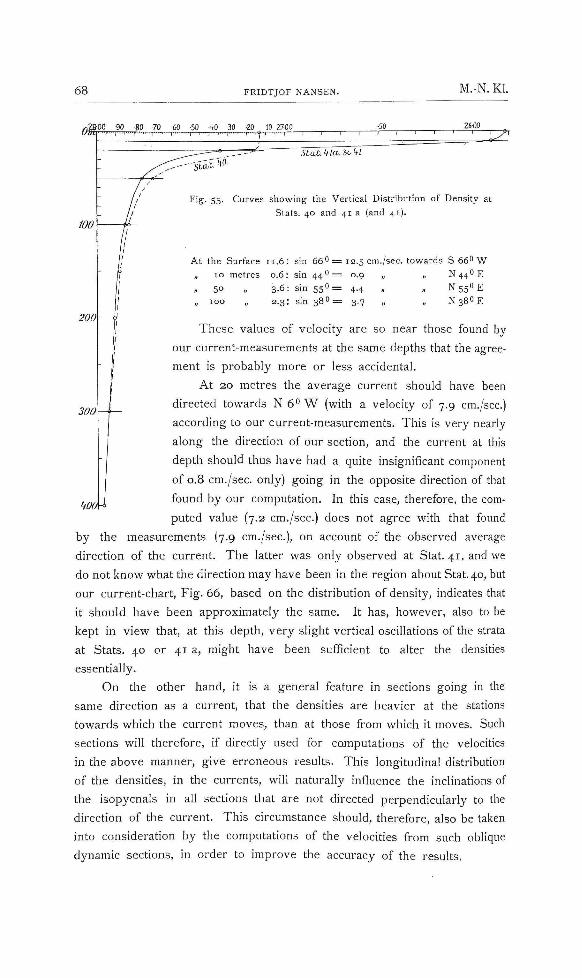
68 FRIDTJOF NANSEN. M.-N. Kk
kO 30 -20 10 Z7-00
^ ^ StcLb.'ila.lokl
Fig. 55. Curves showing the Vertical Distribution of Density at
Slats. 40 and 41 a (and 41).
At the Surface 11.6: sin 6 6 " = 12.5 cm./sec. towards S 66" W
„ 10 metres 0 .6: sin 4 4 " = o.g „ „ N 4 4 ' ' E
50 „ 3.6: sin 5 5 ° = 4-4 .. .. N 55" E
2 .3 : sin 38 3-7 N 3 8 O E
These values of velocity are so near those found by
our current-measurements at the same depths that the agree
ment is probably more or less accidental.
At 20 metres the average current should have been
directed towards N 6° W (with a velocity of 7.9 cm./sec.)
according to our current-measurements. This is very nearly
along the direction of our section, and the current at this
depth should thus have had a quite insignificant component
of 0.8 cm./sec. only) going in the opposite direction of that
found by our computation. In this case, therefore, the com
puted value (7.2 cm./sec.) does not agree with that found
by the measurements (7.9 cm./sec), on account of the observed average
direction of the current. The latter was only observed at Stat .41, and we
do not know what the direction may have been in the region about Stat. 40, but
our current-chart. Fig. 66, based on the distribution of density, indicates that
it should have been approximately the same. It has, however, also to be
kept in view that, at this depth, very slight vertical oscillations of the strata
at Stats. 40 or 41 a, might have been sufficient to alter the densities
essentially.
On the other hand, it is a general feature in sections going in the
same direction as a current, that the densities are heavier at the stations
towards which the current moves, than at those from which it moves. Such
sections will therefore, if directiy used for computations of the velocities
in the above manner, give erroneous results. This longitudinal distribution
of the densities, in the currents, will naturally influence the inclinations of
the isopycnals in all sections that are not directed perpendicularly to the
direction of the current. This circumstance should, therefore, also be taken
into consideration by the computations of the velocities from such oblique
dynamic sections, in order to improve the accuracy of the results.
1 9 1 5 - N o . 2 . SPITSBERGEN WATERS. 69
As was pointed out above, the currents at all depths vary so much
from hour to hour as to velocity and direction, that it is doubtful whether
the inclinations of the strata may correspond chiefly to the average velo
city and direction of the current, or whether these inclinations may change
so rapidly that they are more in accordance with the actual current at
every moment. The latter possibility seems, however, less probable, especi
ally if the current is broad, because it would necessitate so considerable
a transport of water that there would hardly be time for it.
By taking only the current-measurements made between August i8th
3 p . m . and August 19th 2 p . m . we found above (p..59) the following
average values for the currents:
At the Surface 12.6 cm./sec. towards S 6 2 " W
„ 10 metres i.g „ „ N 4 4 l ' E
20 „ 5.6 „ „ N 80 E
" 50 „ 4.8 „ , N 5 7 O E
« 100 n 2-6 „ „ N 67 0 E
If these angles are introduced, our computations will giwe the fol
lowing values:
At the Surface 13.i cm./sec. towards S 6 2 " W
„ 10 metres o.g „ „ N 4 4 O E
» 20 „ [51.9] „ „ N 8 0 E
" 50 „ 4.3 „ „ N 5 7 O E
•> 100 „ 2.5 „ „ N 6 7 » E
This agreement is also remarkably good, except of course at 20 metres.
Current Measurements on August 4th and jth.
As was mentioned above, the current measurements made at Stations
19 and 20, on August 4th and 5th, were very incomplete, chiefly on ac
count of the very small number of observations made in the deep layers
near the bottom, by which the drift of the ship, moored to the ice, could
be determined. During this time there were also many difficulties with the
ice, which made it necessary to look after the ship; and the number of
observations were thus reduced. As was also mentioned above, several
attempts were made to determine the drift of the ship by means of the
sounding-line and the lead lying on the bottom; but this method proved
unsatisfactory.
Figs. 56 to 59 represent the curves of velocity and direction of the
relative movements at the different depths, as far as it was possible to
construct them with the incomplete observation material. Some of them
are rather hypothetical, as there were too few observations. This is especi-

70 FRIDTJOF NANSEN. M.-N. Kl.
cmi.
ally the case with the curve for the deepest layer (520—600 metres) near
the bottom, giving the drift of the ship.
The curves of velocity show that the relative movements were much
smaUer at Stats. 19 and 20 than at Stat. 41. They also seem to indicate an
cm interval of little more than
6 hours only between
each time that the rela
tive movement was redu
ced to o or to a mini
mum. The cause of the
slow movement at Stats.
19 and 20 may to some
extent have been the
contrary wind, which
probably reduced the
south-westerly surface-
drift. On the morning
of August 5th the wind
was about W b y S (mag
netic); in the course of
the day the wind changed
to about S S W and in
the afternoon its velocity
increased to between 5
and 6 metres per second.
A wind of such a velo
city has naturally an
appreciable effect upon
the drift of the ice. At
Stat. 41, on the other
hand, there was very littie
wind, and it was as a
rule approximately in the
same direction as the
average drift of the ice.
During the night and
morning of August i8th
the wind was NE by N and was not strong. In the afternoon and the
evening it was northerly or north-north-easterly; after mignight and in the
morning of August 19th there was no wind.
N
v-.-W TneAjis » • — 2 0 - m e A e S f t--100mdUs X y.-Z0OmeAes c
-SOine/us -520-600?ne&es
Fig. 56—5g. Curves of Velocity (Figs. 56 & 58 above) and
Direction (Figs. 57 & sg below) of the Relative Movements at
different depths at Stats, i g and 29, Aug. 4 & 5, i g i a . The
directions are magnetic and are those towards which the
water moved at the different depths relatively to the ship.

1 9 1 5 - N o . 2 . SPITSBERGEN WATERS. 71
Figs. 60 to 63 give the central vector-diagrams of the relative movements
at the various depths, as far as they could be constructed. They differ
greati}' from the vector-diagrams of the relative movements at Stat. 41
(Figs. 38 to 43).
I have also made an attempt. Fig. 64, to construct progressive vector-
diagrams for the relative movements at the various depths, between r.oo
W-m..
E iw-
50 Tn..
O-H'I a. nt.
50 CTn,./5ec<
Fig. 60 — 63. Central Vector Diagrams of the Relative IMoveraents at depths of 5 2 0 and 5 4 0 metres (indicating the Surface Drift), at 1 0 , 2 0 , and 5 0 M e t r e s . The directions are those
f r o m which the w a t e r moved at the different depths relatively to the ship, or t o w a r d s
which the s h i p moved relatively to the water at the different depths. Hence Fig- 6o gives
the directions (with velocities) t o w a r d s which the ship or the surface layers moved, pro
vided that the movements at 520 and 540 metres were negligible.
p . m . and midnight on August 5th; but the observations are not sufficientiy
numerous to give trustworthy curves, and our figure may therefore only
be considered as an approximate experiment. It shows, however, that there
must have ben a striking difference between the movements at this place
(Stat. 20) and those at Stat. 41 . This difference may to some extent be
explained by the different situation, Stat. 20 being to the south-west of

72 FRIDTJOF NANSEN. M.-N. Kl.
w
100 c-m-./sec.
Stat. 41 . This may be the reason why the surface-drift at Stat. 20 had a
more southerly direction than at Stat. 41 .
The most striking difference is, however, that according to our dia
grams. Fig. 64, the average real movements at 10 metres and 20 metres
do not seem to have differed very much from the drift of the ship, and
there cannot have been any reaction-current at 10 metres similar to that
found at Stat. 41 . The explanation is obviously that at Stations 19 and 20
there was no such well-marked surface-layer with low salinity and low
density as was observed at Stat. 41.
The salinity at the surface was in most
cases above 33 %oi and at 10 metres
it was even, as a rule, about 33.50 °/oo
or more. The salinity and density
gradually increased downwards without
any sharp boundary between a light top
layer and the heavier underlying water.
Thus a special system of currents could
not be developed in the top layer.
Fig. 64. Progressive Vector Diagrams of By means of our progressive dia-the relative movements at 10, 20, 50, and grams of the relative movements. Fig. 5 2 0 (and 5 4 0 ) M e t r e s , at Stat. 20. T i e i- . , , r n • 1
u V. .1, .iv<.„f„„ 64, we find the fofiowing average velo-curves give, for each hour, the direction ^' b a
(with velocity) towards which the water cities and directions of the real move-moved relatively to the ship, between ^^^^ between noon and midnight on
Aug. 5 I p. m. and Aug. 6 i a. m. August 5th:
At the Surface 7.8 cm. per second towards S s i ^ W ( S 4 4 " W magn.)
10 metres 8.4 „ „ „ S 3 i < ! W ( S 4 4 0 W „ )
„ 20 „ g.2 „ „ „ S 3 5 O W ( S 4 8 ' ' W „ )
„ 50 .. 7.5 „ „ ., S 2 5 O E ( S 1 2 O E „ )
The average direction of the current at 50 metres would consequently
have been deflected about 56° towards the lef t of the average surface drift
and the current at 10 metres, and 60" towards the left of the average
direction of the current at 20 metres. This is quite different from our
experiences at Stat. 41 . It is an interesting fact that at the latter station
the great deflection of the current towards the right from 20 metres to
50 metres, coincides with a great decrease in its velocity; while at Stat.
20 there seems to have been no great difference between the velocities of
the currents at the surface, at 10, 20, and 50 metres. There is also no
deflection towards the right (except the doubtful 4 " from 10 to 20 metres),
the deflection being in the opposite direction, towards the left, from 20
to 50 metres.

I 9 I 5 ' N o . 2 . SPITSBERGEN WATERS. 73
This might seem to be in fair harmony with our theory. If the velo
city of the current decreases downwards, its direction should be more and
more deflected towards the right with increasing depth; but if, for some
reason or other {e. g. by contrary winds), the velocities in the upper layers
of the current are reduced, its deflection with increasing depth is dimin
ished accordingly; and if the surface-velocities be reduced to values below
the velocities of the deeper layers, the deflection with increasing depth may be
reversed. Our observations, especially in the upper layers between the
surface and 20 metres, seem thus to verify the correctness of our theory,
as well as could be expected with the imperfect methods.
The water at 50 metres was on the whole colder at Stats. 20 and
19 than at S t a t . 4 1 ; at Stat. 19 its temperature even sank to —1.51° C.
and its salinity was then as low as 34.38 "/OQ- This water must naturally
have come from the north or north-west.
Computation of the Velocities of the Currents at Stats. 18 to 22.
The sections through Stations 18 and 19 (Fig. 13) and through Sta
tions 20 and 21 (Fig. 14) may be used for computation of the velocities
of the currents in this region. The direction of the former section is about
S i 8 ° E , and of*the latter section about S i 5 ' ' E . The average direction
of the surface-current at Stat. 20 was towards S 3 1 O W according to the
current-measurements (Fig. 64).
In the section through Stats. 18 and 19, all isopycnals at depths be
tween the surface and about 90 metres, slope from Stat. 18 towards Stat.
19 (see the isopycnals of 27.70 and 27.80, Fig. 13) indicating that the cur
rents at these depths had a component directed transversally to the section,
i.e. towards S 7 0 O W . This agrees weU with the results of our current-
measurements. At depths greater than 90 metres the isopycnals were
sloping gently from Stat. 19 towards Stat. 18 (see the isopycnal of 27.90,
Fig. 13) indicating that the current at the these depths had a very small
component directed transversally to the section in the opposite direction
of that of the current at higher levels.
At Stat. 19 several vertical series of observations vere taken, giving
somewhat different densities; but all of them were taken a long time after
the observations at Stat. 18. The two most complete series are those
called 19 (taken on Aug. 3rd, 6.30 to 7.50 p. m.) and 19 c (taken on Aug.
4th, I I a .m. to 0.40 p.m.) . The former series was taken about 8 hours
after the observations at Stat. 18, and the latter series about 24 hours
after these observations.

7 4 FRIDTJOF NANSEN. M . - N . K l .
By using these two different series at Stat. 19 and the observations
at Stat. 18 for our computation of the velocities of the current-coupon ents
directed perpendicularly to the section, we find the following values:
Vertical Series of Stat. ig. Vertical Series of Stat. 19 c.
At the Surface 7.5 cm./sec. 8.6 cm./sec.
„ 10 metres 5-4 „ 6,5 „
„ 20 „ 3.7 „ 4.8
„ 50 „ 0.2 „ 1.3 „
„ go „ —0.2 „
„ 135 ,. °-° „ 180 „ 0.0 „
According to the progressive vector diagram of the relative move
ment, Fig. 64, the average velocities and directions of the current at Stat.
20 should have been the following:
At the Surface 7.8 cm./sec. towards S 31*^ W
„ 10 metres 8.4 „ „ S 3 i ' ' W
20 „ g.2 „ „ S 3 5 O W
„ 50 „ 7-5 ,, ,, Sas^E
If the angles which these currents would form with our section be
introduced in our computation, we find the following values of velocity:
Vertical Series of Stat. 19. Vertical Series of Stat, ig c.
At the Surface 9.8 cm./sec. r i . 2 cm./sec.
„ 10 metres 7.1 „ 8.5 „
„ 20 „ 4.8 „ 6.2 „
At 50 metres the current should have had a smaU eastward compo
nent in our section, according to the current-measurements, while our com
putations give small westward components. The dynamic current chart,
Fig. 67, might seem to indicate a direction of the current at 50 metres, at
Stat. 20, very different from the average direction found by the current-
measurements.
On the whole, there is not a very good agreement between the velo
cities obtained by our com.putations and the results of the current-measure
ments. But it could hardly by expected to be better, considering the
deficiency of the current-measurements, and that they were taken at another
station a long time after the observations of the section. It has also to be
considered that there was a great difference of time between the observa
tions at the two stations of the section.
In the section through Stats. 20 and 21 the isopycnals between the
surface and 80 metres are sloping from Stat. 21 towards Stat. 20 (see the
isopycnals of 27.50, 27.70 and 27.80, Fig. 14) indicating a current with
some westerly direction, while the isopycnals at depths greater than 80

i g i S - N o . 2 . SPITSBERGEN WATERS. 75
metres are sloping in the opposite direction (see the isopycnal of 27.90)
indicating a slow movement in some easterly direction.
Two vertical series of observations were taken at Stat. 20, one on
August 5th 10.40 a. m. (called Stat. 20, see Table I) and another on the
same day between 3.30 and 6.20 p. m. (called Stat. 20 a). These two series
give somewhat different densities. By computation in the same manner
as before, we find the following values of velocity for the current-compo
nents perpendicular to our section, /. e. directed towards S 75 " W :
Observations at Stat. 20. Observatios at Stat. 20 a.
At
» » » „
the
1 0
2 0
5 0
8 0
2 0 0
Surface
metres
— — — —
Aug. 5,
3-3 I . g
0 .9
—0.32
—0-54 0 . 0
10 4 0 a.
cm./sec.
„ „ „ » „
m. Aug. 5. 6.20
2.6 cm
»-4
1 .2
-0 .3
- 0 . 5 4 0 . 0
— 3.30 p. m.
./sec.
,, n
„ „ „
If we introduce into the computation.^ the angles which the currents
formed with our section at the different depths, we find that the above
values of the components, would correspond to the following velocities of
of the currents:
At the Surface 4.6 cm./sec. or 3.6 cm./sec.
„ 10 metres 2.6 „ „ i-g „
„ 20 „ 1-8 „ „ i . r „
„ 50 „ 1-8 » „ 1-7
These values agree still less, than those of the section through Stats.
18 and 19, with the results of the current-measurements at Stat. 20. It
may indicate great local differences in the currents in the region between
Stats. 20 and 21. On the other hand it has also to be considered that the
observations at Stat. 21 were taken many hours after those at Stat. 20
(and 20 a).
The vertical distribution of density at Stats. 21 and 22 (Fig. 14) Indi
cates a comparatively rapid current running in some north-easterly direction
between these stations. The distance between the stations was 18 kilo
metres. Computed in the same manner as above, and provided that the
motion of the water at 200 metres was negligible, we find the fofiowing
values of velocity for the current-components perpendicular to the section:
At the surface 15.5 cm. per second
„ 15 metres 16 „ „
„ 150 „ 1-8 „ ,, 200 „ 0.0 „ „

76 FRIDTJOF NANSEN. M.-N. Kl.
Dynamic Current Charts.
The following table gives the mean densities {at) of the water between
the depth of 200 metres and different levels, at all stations north of Spits
bergen (and Stat. 16 west of northern Spitsbergen) that are deeper than
150 metres, or in a few cases than 100 metres (see Figs, i and 6). These
mean values were computed graphically, by means of the planimeter, from
the curves of density drawn for each station similarly to those of Fig. 55.
Where the greatest depths of observation were less than 200 metres,
the curve of density had to be drawn hypothetically down to 200 metres,
and thus the values of density were estimated for the deepest layers.
Where there were several vertical series of observations at the same
stations, the mean values of the most complete series were taken.
Stations
16
18
19
20
21
22
25
30
32
33
34
35
36
37
38
39
4 0
41 a
43
IWax A
Between o
and 200 Metres
27.798
0
8si
678
754
8 1 1
585
5 2 0
550
633
613
sn 539
566
638
6 2 1
586
724
686
625
334
Between 20
and 200 Metres
27.844
•sn
•19i
.850
.868
.607
.700
.624
.761
.726
.60J
.658
-719
.792
-754
.679
.791
-838
.814
0.272
Between 50 Betwe
and 200 and
Metres Me
27.875 27
.8S8
.867
.887
.885
.6jfo
.784
.691
.851
.823
.723
.782
850
.872
.875
-748
.846
.880.
.870
0.258 0
en 100 2 0 0
tres
go6
8g8
903
SloS
895
6jp
823
808
8go
868
841
868
go I
8g8
g o 2
8 1 8
878
g o 2
g 0 4
2 4 9
The horizontal distribution of density at 200 metres and greater depths,
indicates that there is very little current at these levels. Assuming the
motion of the vater at the depth of 200 metres to be practically neghgible,
Prof Helland-Hansen and I have constructed the dynamic current charts

I 9 I 5 - N o . 3 . SPITSBERGEN WATERS. 77
23.2 cm. per second
20.2 » » —
13 » » —
Figs. 65 to 69 for the surface, and depths of 20, 50, and 100 metres, by
introducing the above values at each station, and drawing the probable
isopycnals for every 0.05 of C7 These charts give the probable circulation
of the water at the mentioned depths according to the densities computed
from the observations of temperature and salinity. The direction of the
isopycnals should at each place give approximately the direction of the cur
rent, and its velocity is inversely proportional to the distances between
the isopycnals.
In the chart of the S u r f a c e a distance between the isopycnals of
I mm. corresponds to a velocity of 26 cm. der second (hence a distance
between them of, for istance, 3 mm. would correspond to a velocity of
26 :3 = 8.7 cm. per second, and a distance of 4 mm. to 26 : 4 = 6.5 cm. pe r '
second, etc.). In the same manner a distance of i mm. between the iso
pycnals corresponds to the following velocities in
the chart for 20 metres :
» — » 50 —
» — » 100 —
The arrows drawn in the charts give the direction and velocity of the
currents at different places. The length of the arrows give the velocity
I mm. = I cm. per second.
On the whole the currents given by these charts at the different depths
agree fairly well with the results of our current-measurements at Stats. 20
and 41, especially at the latter station. It is noticed that while the sur
face current runs towards the north-east near the Spitsbergen coast, it runs
approximately in the opposite direction farther seawards, near the ice-
edge, and more westerly at our Stats. 40 and 41, than at our Stats. 20
and 19, which is in full accordance with our current-measurements.
It is also interesting to notice how the currents at 20, 50, and 100
metres seem to follow approximately the slope of the bottom, as indicated
by the bathymetrical curve for 200 metres (the dotted line). This curve
is, however, only a rough estimation, as there are much too few and too
uncertain soundings in this region.
The remarkable bend of the current north-west of Hinlopen Strait is
noteworthy. It seems as if the current follows the slope of the shelf, north
of Spitsbergen, towards the mouth of Hinlopen Strait, but here it is forced
towards the north by the bank north-west of North East Land, with depths
of between 15 and 30 metres only, and the current must follow the edge
of this bank. This is obviously the reason why, especially in this region,
there was much open water extending north-wards, and why we there came
farthest north.

78 FRIDTJOF NANSEN. M.-N. Kl,
Figs. 65 & 66. Charts of the Sea north of Spitsbergen, giving the Mean Density of the
water between the Surface and 200 Metres, Fig. 65, and between 20 and 200 Metres, Fig. 66.
August 1912. Scale i : 2,500,000. The dotted line is the bathymetrical curve for 200 Metres.
The figures give the decimals of the densities («. «. w^—27). The arrows give the direction
and velocity of the currents (i mm. = i cm. per second).
In the region of Stats. 40 and 41 (12° E Long, see Fig. i) the ice-
edge also formed a bight extending comparatively far north, and the ex
planation may likewise be the northward current in the sea to the south
(Fig. 65).

I9I5- No. 2. SPITSBERGEN WATERS. 79
Figs. 67 & 68. Charts of the Sea north of Spitsbergen, giving the Mean Density of the wa te r
between 50 and 200 Metres, Fig. 67, and be tween 100 and 200 Metres, Fig. 68.
August i g i 2 . Scale i : 2,500,000.
The chart for 20 metres shows less agreement with the current-
measurements. At Stat. 41 (12'' E Long.) it indicates a current towards
NNE with a velocity of about 11 cm. per second, whfie according to the
measurements the average current should have gone towards N 6° W with
about 7.8 cm. per second. At Stat. 20 the current of the chart is running
in an easterly direction with about 12 cm. per second, while according to

8o FRIDTJOF NANSEN. M.-N. Kl.
the measurements the average current was directed toward S 3 5 ° W with
9.2 cm. per second; but the latter measurements were especiallj^ very
imperfect.
At Stat. 20, at 50 metres the measurements gave also an average cur
rent that differed much from that of the chart (Fig. 67). At Stat. 41 there
is better agreement between the chart and measurements, and at 100 metres
there is also good agreement.
The shapes of the curves in the region of Stat. 16, west of Cross
Bay, are naturally quite hypothetical, as we do not know what the vertical
distribution of density may have been over the edge of the shelf just east of
Stat. 16. It is possible that in our section. Fig. 12, through Stats. 15 and
16, the layers may have been much depressed over the slope from the
edge of the shelf to Stat. 16, indicating a rapid current along this slope
(as indicated in our charts Figs. 65 to 68); but in that case the isotherms,
isohalines, and isopycnals ought to have been drawn accordingly in Fig. 12.
Vertical Oscillations of the Water Strata.
At Stations 19, 20, and 41 a number of vertical series of observa
tions were taken at different times, showing that, especially at the depths
between the surface and 100 or 150 metres, there were considerable changes
in the water strata at the same station, both as to temperature and salinity,
often in comparatively short intervals of time. E. g. at 50 metres, at
Stat. 19, comparatively high temperatures, of 0.75° C , were sometimes ob
served, and at other times temperatures as low a s — 1 . 4 8 " C a n d — i . s i ^ C .
In these cases, however, the salinities also differed so much that the den-
city was very nearly the same, about 27.71, and thus the observed changes
could not be due to vertical oscillations of strata with different densities,
but were rather due to horizontal movements by which heterogeneous
waters, of approximately the same density, came into our vertical series
of observations.
In other cases appreciable differences in the densities of the water
occurred at the same depths, and the changes were evidently more or less
due to vertical oscillations of the water strata, fifting the same stratum
sometimes to higher levels than at other times.
On previous occasions it was pointed out that great vertical oscilla
tions of the strata may probably occur at intermediate depths in the sea
[cf. NANSEN, 1902, pp. 346 et seq., HELLAND-HANSEN and NANSEN 1909,
pp. 89 et seq.].

i g i n - N o . 2 . SPITSBERGEN WATERS.
The great periodical changes in the velocities and directions of the
currents, shown by our current-measurements, must inevitably cause vertical
oscillations of the water strata. If there is lateral equilibrium in a current
(/. e. if the inclinations of the strata exactly compensate the deflecting effect
of the Earth's rotation, produced at the given velocities of the current),
and then, for instance, the velocities in its upper layers, are much increased
relatively to those of its lower layers, the lateral equilibrium is dis
turbed, and the strata will be depressed on the right hand side of the
current, and lifted on its left hand side, in order to re-establish the lateral
equilibrium. And vice versa, if the velocities in the upper layers are de
creased relatively to those of its lower layers. Changes in the directions
of the current in the different layers will naturally also alter the inclina
tions of the strata in a section, either the one way or the other. It is not
probable that the lateral equilibrium is ever attained, because the changes
both of velocity and direction are continuous.
Periodical vertical oscillations of the water-strata must consequently
arrise in this manner; their magnitude will depend on the rate and mag
nitude of the changes in the differences of velocity, vertically, also on the
changes in direction.
The effect of the periodical changes, as to these vertical oscillations,
at any certain locality, will depend on the situation of this locality, whether
it is near the left hand side or the right hand side of the current, or near
the middle of it. On the left hand side the strata will be lifted when they
are depressed on the right hand side, and vice versa.
At our Stations 19, 20, and 41 there are not sufficiently numerous
measurements of the movement at different depths to ascertain the exact
relation between the vertical oscillations of the strata and the changes in
the currents at different depths.
Let us look at the observations at Stat. 41 , where there are the greatest
number of current-measurements, though even there the observations are
far from numerous enough for the determination of the real movements at
the different depths, at the moments desired.
As was mentioned above (p. 67), several vertical series of observations
were taken at Stat. 41 which give different densities, especiafiy at 20, 50,
and 100 metres. On Aug. 19, at 10 a. m., a density of 27.83 was found
at 50 metres. This is so much higher than the densities of the other
series at the same depth, that the water stratum observed at 50 metres
on Aug. 19, at 10 a. m., may have been about 10 metres lower at 3.20
p. m. on the same day, and nearly 30 metres lower at 1.15 a. m. on
Aug. i8th.
Vid.-Selsk. Skrifter. I. M.-N. Kl. igi5. No. :.. 6
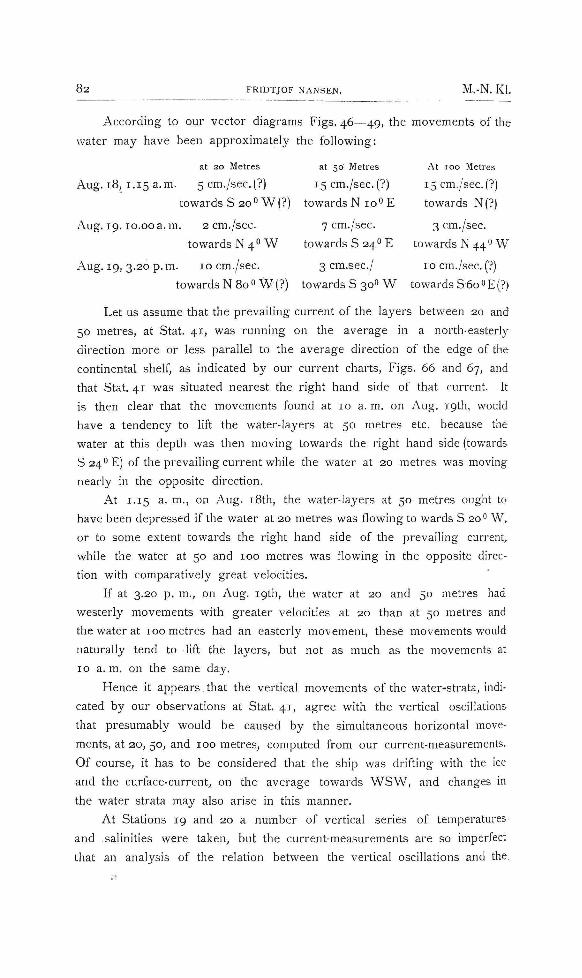
82 FRIDTJOF NANSEN. M.-N. KL
According to our vector diagrams Figs. 46—49, the movements of the
water may have been approximately the following:
at 20 Metres at 56 Metres At 100 Metres
Aug. 18, 1.15 a.m. 5cm./sec.(?) 15 cm./sec.(?) 15 cm./sec.(?)
towards S 20 <> W (?) towards N i o " E to wards N (?)
Aug. 19.10.00a.m. 2 cm./sec. 7 cm./sec. 3 cm./sec.
towards N 4" W towards S 24" E towards N 44" W
Aug. 19, 3.20 p.m. 10 cm./sec. 3 cm.sec./ 10 cm./sec.(?)
towards N 80 « W (?) towards S 30" W towards S 60»E (?)
Let us assume that the prevailing current of the layers between 20 and
50 metres, at Stat. 41 , was running on the average in a north-easterly
direction more or less parallel to the average direction of the edge of the
continental shelf, as indicated by our current charts. Figs. 66 and 67, and
that Stat. 41 was situated nearest the right hand side of that current. It
is then clear that the movements found at 10 a. m. on Aug. 19th, would
have a tendency to lift the water-layers at 50 metres etc. because the
water at this depth was then moving towards the right hand side (towards
S 2 4 ' ' E ) of the prevailing current while the water at 20 metres was moving
nearly in the opposite direction.
At 1.15 a. m., on Aug. i8th, the water-layers at 50 metres ought to-
have been depressed if the water at 20 metres was flowing to wards S 20" W,
or to some extent towards the right hand side of the prevailing current,
while the water at 50 and 100 metres was flowing in the opposite direc
tion with comparatively great velocities.
If at 3.20 p. m., on Aug. 19th, the water at 20 and 50 metres had
westerly movements with greater velocities at 20 than at 50 metres and
the water at 100 metres had an easterly movement, these movements would
naturally tend to lift the layers, but not as much as the movements at
10 a. m. on the same day.
Hence it appears.that the vertical movements of the water-strata, indi
cated by our observations at Stat. 41, agree with the vertical oscillations
that presumably would be caused by the simultaneous horizontal move
ments, at 20, 50, and 100 metres, computed from our current-measurements.
Of course, it has to be considered that the ship was drifting with the ice
and the curface-current, on the average towards W S W , and changes in
the water strata may also arise in this manner.
At Stations 19 and 20 a number of vertical series of temperatures
and salinities were taken, but the current-measurements are so imperfect
that an analysis of the relation between the vertical oscillations and the.
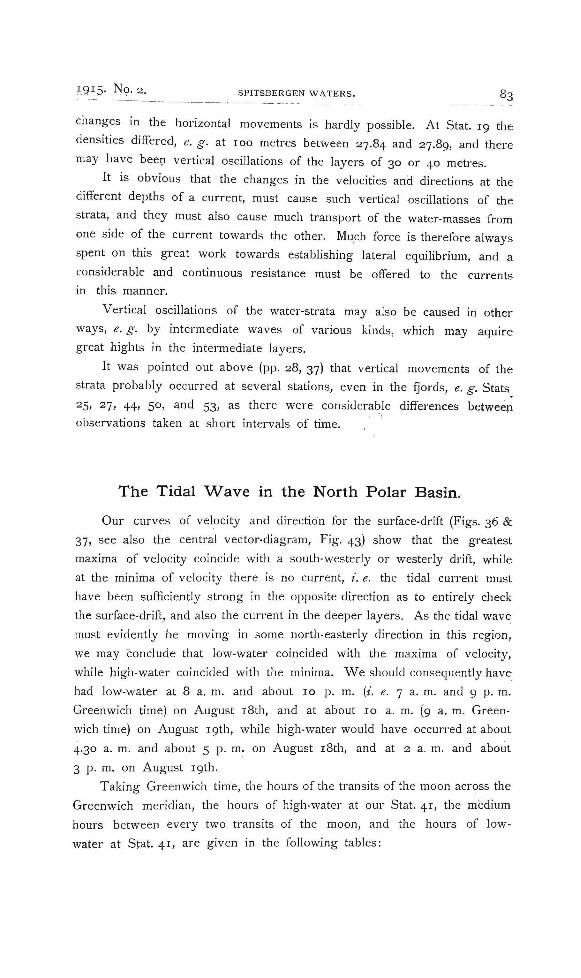
.^ .9ID- N O . 2 . SPITSBERGEN WATERS. 83
changes in the horizontal movements is hardly possible. At Stat. 19 the
densities differed, e. g. at 100 metres between 27.84 and 27.89, and there
may have been vertical oscillations of the layers of 30 or 40 metres.
It IS obvious that the changes in the velocities and directions at the
different depths of a current, must cause such vertical oscillations of the
strata, and they must also cause much transport of the water-masses from
one side of the current towards the other. Much force is therefore always
spent on this great work towards establishing lateral equilibrium, and a
considerable and continuous resistance must be offered to the currents
in this manner.
Vertical oscillations of the water-strata may also be caused in other
ways, e. g. by intermediate waves of various kinds, which may aquire
great hights in the intermediate layers.
It was pointed out above (pp. 28, 37) that vertical movements of the
strata probably occurred at several stations, even in the Qords, e. g. Stats
25) 27, 44, 50, and 53, as there were considerable differences betweep
observations taken at short intervals of time.
The Tidal W a v e in the North Polar Basin.
Our curves of velocity and direction for the surface-drift (Figs. 36 &
37, see also the central vector-diagram. Fig. 43) show that the greatest
maxima of velocity coincide with a south-westerly or westerly drift, while
at the minima of velocity there is no current, i. e. the tidal current must
have been sufficiently strong in the opposite direction as to entirely check
the surface-drift, and also the current in the deeper layers. As the tidal wave
must evidentiy be moving in some north-easterly direction in this region,
we may conclude that low-water coincided with the maxima of velocity,
while high-water coincided with the minima. W e should consequently have
had low-water at 8 a. m. and about 10 p. m. [i. e. 7 a. m. and 9 p. m.
Greenwich time) on August i8th, and at about 10 a. m. (9 a. m. Green
wich time) on August 19th, whfie high-water would have occurred at about
4.30 a. m. and about 5 p. m. on August i8th, and at 2 a. m. and about
3 p. m. on August 19th.
Taking Greenwich time, the hours of the transits of the moon across the
Greenwich meridian, the hours of high-water at our Stat. 41, the medium
hours between every two transits of the moon, and the hours of low-
water at Stat. 41 , are given in the following tables:

84 FRIDTJOF NANSEN. M.-N. Kl.
Transits of the Moon Greenwich Meridian
High-water at Stat. 41
Aug. 17, 4.06 p. m. (visible) ! Aug. 18, 3.30 a.m.
Aug. 18,4.30 a. m. (invisible) 1 — - 4 p. m.
— 4.54 p. m. (visible) Aug. ig , i a.m.
Aug. ig, 5.18 a.m. (invisible) | — - 2 p . m .
Medium Hours between Transits of Moon Greenwich Meridian
Aug. 17, 10.18 p. m.
Aug. 18, 10.42 a. m.
— T 1.06 p. m.
Low-water at Stat. 41
Aug. 18, 7 a. m.
- g p . m.
— g a. m.
Difference
I I h. 24 m.
I I 30 -
8 6
8 4a -
Difference
8 h. 42 m.
10 - 18
9 54
Mean Difference g h. 48 m.
The mean difference between the hours of the transits (and the me
dium hours between them.) of the moon across the Greenwich meridian and
the hours of high-water (and low-water) at Stat. 41, according to our current-
measurements, is thus 9 hours and 48 minutes.
The current-measurements at Stats. 19 and 20, on August 4th and 5th,
are on the whole not so complete as to allow of a determination of the
hours of high- and low-water. The only observations that may seem to
give informations of some value in this respect were taken about 4 p. m.
(3 p. m. Greenwich time) on August 5th, when there was a distinct mini
mum of movement, all layers being apparently at rest, and this should
indicate high-water. The transit of the moon across the Greenwich meridian
occurred at 4.59 a. m. (Greenwich time) and the difference will be 10
hours and i minute, which agrees fairly well with our above-mentioned
result.
According to Mr. Rollin Harris's studies on "Arctic Tides" [1911] the
mean semidiurnal tidal hour for Port Virgo, on the north-western coast
of Spitsbergen (79° 43 ' N. Lat., 10 " 44' E. Long) is XII.56 lunar hours, or
just 13 solar hours. ^
This is abuot 3 hours and 12 minutes longer than our observations
gave for our stations in the sea only some 40 naut. miles, or 80 kilometres,
to the north of Port Virgo. It has to be considered that Harris's tidal hour
is referred to the occurrence of mean high water, and "is generally about
twenty minutes less, than the tidal hour at full and change" of the moon.
On the other hand our observations on August 17th to 19th were taken
1 For Mosel Bay, farther east on the north coast of Spitsbergen (7g0 53' N. Lat., 16" E. Long.) it was about 1.4, or about 13 solar hours and 52 minutes.

I 9 I 5 - No. 2. SPITSBERGEN WATERS. 8 D
just before the first quarter of the moon, which occurred on August 19th.
This may also make some difference but hardly of great importance.
As the distance to Port Virgo from the edge of the continental shelf
outside (to the west) is short, only about 12 miles (22 kilometres), it is
hardly probable that the tidal wave should reach this place much later
than the station of our obervations to the north. If we assume the average
depth to be 50 metres between the edge of the shelf and Port Virgo, and
450 metres between the sea west of Port Virgo and the station of our
observations, about 80 kilometres to the north, the tidal wave should reach
this station and Port Virgo nearly simultaneously.
The difference of a little more than three hours, found between high-
water at Port Virgo and high-water at our station to the north, is conse
quently noteworthy. It is striking that this difference seems to be very
nearly equal to a quarter (3 hours and 6 minutes) of a semidiurnal tidal
period.
The series of current-measurements which Helland-Hansen took on
Storeggen (outside Aalesund in Norway), on July 12th and 13th, 1906,
shows, however, similar peculiarities when compared with the time of high-
vi'ater at Christiansund. As Mr. W E R N E R WERENSKIOLD points out in a
paper on the subject he is now writing, high-water occurred at Helland-
Hansen's station on Storeggen, about 4 hours 48 minutes earlier than at
Christiansund, the distance between the two places is 176 kilometres, and
the tidal wave may travel this distance in about ih 42™ if the average
depth be about 85 metres. This leaves a period of about 3h 6^, which
high-water came comparatively earlier on Storeggen than at Christiansund.
Mr. Werenskiold's explanation of this apparent discrepancy is that high-
water at the two places occurs at two different phases of the tidal wave.
Over the deep sea, high-water occurs when the crest of the tidal wave
passes the place, with maximum surface velocity in the direction of the
propagation of the wave, while on a coast, with shaUow water outside,
high-water occurs at a later phase of the wave, midway between crest and
trough, at the change of the tidal current, when it is slack. Hence it follows
that the difference in time between the two high-waters should be a quarter
of the semidiurnal tidal period, or about 3 hours and 6 minutes.
Though our current-measurements are not sufficiently complete to give
exact results in the above respect, they prove, however, that by methodic
researches of this kind, carried out from a steadily drifting ship, moored
to the drifting ice (or kept by drift anchors), the tidal currents may be con
veniently studied over the deep ocean.

8 6 FRIDTIOF NANSEN. M . - N . K l .
Ice-Pressures and the Tidal Wave.
According to our observations the ice was comparatively tight at the
minima of movement, when the water was at rest, i. e. at high-water, while
the ice was comparatively slack, with much open water between the floes,
when there was a maximum of movement in the water, i. e. at low-water.
This is in accordance with what might be expected to be the case
owing to the horizontal movements of the surface-layers, caused by the
tidal wave during its progress across the sea. Let us try to examine what
the horizontal distribution of the tidal movements over a sea-surface may
be at a certain moment, if we do not take the movements due to other
causes (prevailing sea-current, wind, etc.) into consideration. This distri
bution of the movements might then be something similar to what is indi
cated in Fig. 69.
Maximum of movement, going in the same direction as the tidal wave,
will be found where there is high-water at any given moment, /. e. along
the crest of the tidal wave (Fig. ^ > ^
69, b); while maximum 01 move- .,— ^ 1 i \ ^^—'>y / T \ N « —
ment going in the opposite direc- ^ ^ j x \ Si >^ ' / t \ "Si—-
tion will be found where there is « ^ I i \ s »/' / t ^ V*— , . . . u <- • " — ' ^ J ^ \ ^ ' ^ ^ 1 " ' ^ ' ^ ^ — •
low-water at the same moment, i. e. a. b a < ^ » V '
along the trough of the tidal wave -^^^^ ^^'^ Fig. 6g.
(Fig. 69, aa).
In the regions between the crest and the trough of the wave, the
velocities will be decreasing towards a minimum midway between them, or
midway between high-water and low-water. Owing to the effect of the
Earth's rotation (or under certain circumstances also owing to other causes)
the directions of the movements might change as indicated in Fig. 69.
As our figure clearly demonstrates, the movements will be converging in
the region between the trough and the crest on the front side of the advan
cing wave, but they wOl be dispersing between the crest and the trough
on the back side of the wave. The converging movements wUl naturally
tighten the ice, and may produce ice-pressures, that wifi reach their maxi
mum near high-water (or near the crest of the wave). The dispersing
movements will produce a slackening of the ice, that begins as soon as the
crest of the wave has passed, and will reach its maximum near the trough
of the wave (near low-water). As, however, the ice-masses are big and
heavy, there may be a lag in their movements; for instance, ice-pressures
caused by the tidal currents might also occur some short time after high-
water.

1915- No. 2. SPITSBERGEN WATERS. 87
During the drift of the Fram across the North Polar Basin, from 1893
to 1896, we had much opportunity of studying the ice-pressures. W e found
that in the sea north of the New Siberian Islands, where we were near
the edge of the deep Nortii Polar Basin, and in the sea north of Spits
bergen, ice-pressures occurred more or less regularly twice in 24 hours at
spring-tide, about new moon or full moon, and a few days after. During
the same days the ice also regularly opened up much twice in 24 hours,
in the time between the pressures.
Provided that the heaviest ice-pressures occur at high-water, and the
ice is most open at low-water, it would thus be possible to determine the
progress of the tidal wave across the North Polar Basin by studying the
movements of the ice.
I have tried to use our observations during the Fram-expedition for
this purpose. It was, however, very difficult to decide at what moment
the tidal pressures reached their maximum, or when they ceased, as they
often proceeded somewhat irregula-rJy.
In the sea north of Spitsbergen some few accurate observations of the
time of the ice-pressures were taken by Captain S. Scott-Hansen in June
1896; but they give very different results, as will be seen from the fol
lowing table:
Transit of Moon Greenwich Meridian, Green
wich Time, 1896
June 8, 9 29 H. m.
„ 9, 10. i8 it. m.
„ 10 , I I . 1 0 a. m.
„ 11, 0.06 p. m.
Ice
June 9.
„ 10 ,
w I I ,
H I I ,
„ I I ,
pressures in about 83° i ' N , l a ^ i s ' E Greenwich time
O.IO a .m. The ship lifted highest by the pressures which began in the evening.
0.20 ii. m. Pressures ceased after having began in the evening.
1.00 a ra. Pressures ceased after a few hours movement.
4.10 a .m. Sudden heavy pressures.
To-55 P- n * Pressures began, hfted the ship, and lasted for 5 minutes.
Diiference
14 h. 41 m.
14 „ 2 „
13 .; 50 „
[17 « 0 „] [10 , , 4 9 „ J
On June 8th and 9th, 1896, the ship was in 83° i ' N and 12° 1 2 ' E .
On June n t h , at 9.32 a. m. there was a new moon. According to the
first three observations above, the difference between the transit of the
moon across the Greenwich meridian and high-water at this place should
have been about 14 hours and 11 minutes. This value is uncertain, but
if correct, high-water should consequently occur here 4 hours and 23
minutes later than at our station of August i8th and 19th, 1912, 154 naut.
miles (285 kilometres) to the south, although in this region, where the sea

88 FRIDTJOF NANSEN. M.-N. Kl.
has probably an average depth of more than 1500 metres, at least, the
tidal wave may be expected to travel with a velocity of more than 240
miles an hour. As was mentioned above, it is possible that the ice-pressures
reach their maximum, or cease, some time after high-water, in which case
our value of the difference between the transit of the moon and high-water
will be too high. Whether the correction thus needed, would be sufficient
to make up for the above discrepancy seems, however, doubtful. The above
value (14'' iii») of the tidal hour would agree better with the time of
high-water of Port Virgo (tidal hour = i;^^) and Mosel Bay (tidal hour =
13*^ 50"*) on the north coast of Spitsbergen.
The sea where these observations were made in June 1896, was 3200
metres deep. It is interesting to note that regular heavy ice-pressures are
caused by the tidal currents over such a deep sea. And there were many
more such regular pressures, occurring twice (or sometimes only once) in
24 hours, than are mentioned above. This fact seems to indicate that the
tidal wave was greater in this region than it is generally assumed that it
should be over the deep Ocean.
During October, November, and December, 1893, when we were over
the continental shelf north of Siberia, or near its edge, ice-pressures occur
red in the days about every spring-tide, as a rule very regularly twice
in 24 hours. I find the following observations in my diary. For the sake
of convenience I give the notes in their original form with local time, but
have then transformed the hours of the transit of the moon across the
Greenwich meridian to this Ipcal time as well.
Latitude and Longitude
78° 23 ' N. Lat. 136° 5' E. Long.
78° 14' N. Lat. ' 3 5 ' ' 5 7 ' E . Long.
Transit of the M o o n (Greenwich Meridian)
Local Time iBgs
Oct. 8, 7.53 p. m.
9, 8.14 a. m.
10, g . ig p. m.
I I , 1 0 . 0 2 p. m .
12, 10 .24 **• ^•
10.47 p. m.
I c e -
Oct. 9,
10
r i .
( I t ,
12.
12 ,
13. {13. (13.
13.
P r e s s u r e s (and Much O p e n W a t e r ) Local Time
2 to 3 p. m. and later in the afternoon. Heavy pressures. Perfectly open water in the evening.
4 to 5 a. m. Heavy pressures. Quite open water in the evening. Much pressure in the afternoon, the ice opened in the evening. I I to 12 p. m. Much open sea).
Before noon great open sea. 6.30 p. m. Heavy pressure. Open water in the evening.
6 cl. m. Violent pressures. Noon. Much open waler) . 1.30 p . m . The ice began to lighten). 8 p. m. Pressures.
Difference
h. m.
[19 ]
2 0 16
2 0
2 0 28
19 36 ig 24
21 13

I9 I5- No. 2. SPITSBERGEN WATERS. 89
Latitude and Longitude
Transit of the M o o n (Greenwich Meridian)
Local Time i8g3
I c e - P r e s s u r e s (and Much O p e n W a t e r) Local Time
78° 17' N. Lat. 135° 27' E. Long.
78" 32 ' N. Lat. 136° 12' E. Long,
77° 57' N. Lat. 137° 4g' E. Long.
Oct. 13, 11.33 P-
12.24
r.41
23, 6.52 a.
24<
7.16 p . m.
7.3g a, m.
78° 38' N. Lat. I3g° o' E. Long.
78° 58 ' N. Lat. 137° 3 2 ' E . L o n g .
Nov. 7, 7.44 a. m.
8, 8.50 p. m.
9, g.13 a. m.
g 36 P- m-
I I , 10.50 a. m.
15. 1-52 a. m.
24, 9-47 P- m-
25, 10.20 cl. m.
26, 11.28 a. m. 12.0 p . m.
Dec. 6, 7.09
7, 7.55 a .m.
8.19 p. m.
Oct. 14, Much open water in the day. 14, 8 p . m. Pressures, that ceased
at 8.30 p. m. 10 to 11 p . m . The ice opens. 7 p . m. A little pressure. 10.30 to 11.30 a. m. Heavy pressures.
Indications of pressure in the afternoon.
4 to 5 a. m. Heavy pressures. Much open water in the morning. 9.30 a. m. The ice tightened. 11 a .m . Heavy pressures. 4 104.30 p. m. Violent pressures.
25, I to 2 a. m. Some pressure. 25, 3-45 to 5 a. m. Violent pressures.
' 4 ,
15.
17.
23 .
24,
Mean :
i Nov. 8, 5 a. m. Pressures .
9. A little pressure in the morning. 9, 8 p. m. Pressures,
10, 8 a. m. and later. Pressures . Open ice in the afternoon. 7.30to 8 p .m. Heavy pressures.
12, 3 to 3.30a. m. Heavy pressures.
15, 7 p m. A spell of pressures, i [17 8J
Mean:
Difference
h. m.
20 26
[18 36]
[21 19]
21 38
20 43
20 36
21 16
[23 loj
23 47
22 9
[16 40]
23. In the afternoon pressures heard far away.
25, 4 p. m. Pressures heard far away.
26, 4 to 5 a. m. Heavy pressures heard.
27, 7 to 9 a. m. Pressures. 7.30 to 8.30 p. m. Pressures.
Dec.
Mean:
6, 8 p. m. A crack was formed in the ice.
12 p. m. The crack very open.
7, 5 to 6 a. m. Pressures . I I a. m. T h e ice opened a little. In the afternoon alittle pressure.
8, 7 to 8 a. m. Heavy pressures. 2.30 p. m. A loud crack, and movement in the ice.
6 to 6.30 p. m. Heavy pressures.
Mean :
Mean of all observat ions:
18 13
18 10
20 32 20
19 14
[23 35]
21 .s6
22 g
20 38
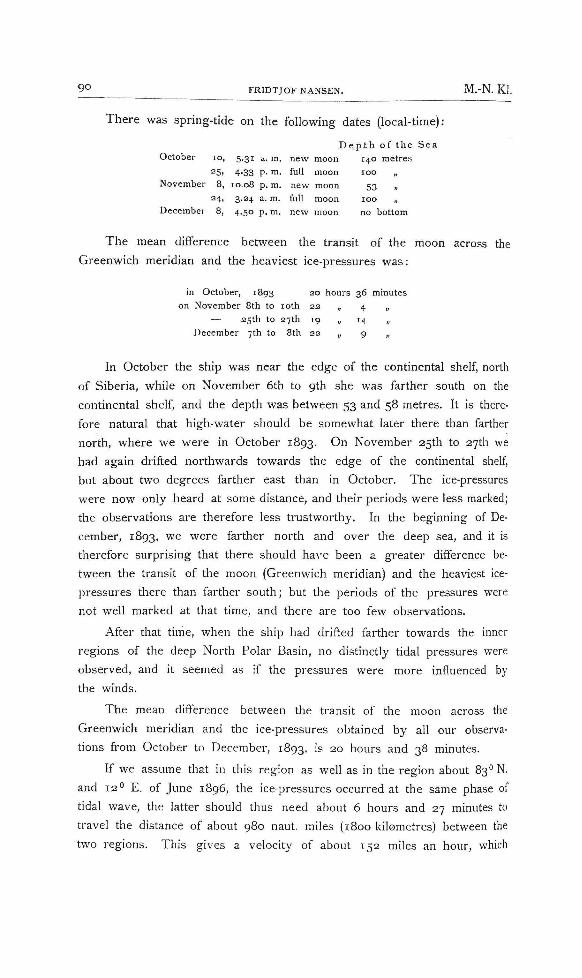
9 0 FRIDTJOF NANSEN. M.-N. Kl.
There was spring-tide on the following dates (local-time):
D e p t h o f t h e S e a October lo , 5.31 a. m. new moon 140 metres
25. 4-33 P- m- full moon 100 „ November 8, 10.08 p . m. new moon 53 „
24, 3.24 a. m. full moon 100 „ December 8, 4.50 p . m. new moon no bottom
The mean difference between the transit of the moon across the
Greenwich meridian and the heaviest ice-pressures was:
in October, 1893 20 hours 36 minutes
on November 8th to loth 22 „ 4 „
— 25th to 27th 19 „ 14 „
December 7th to 8th 22 „ 9 „
In October the ship was near the edge of the continental shelf, north
of Siberia, while on November 6th to 9th she was farther south on the
continental shelf, and the depth was between 53 and 58 metres. It is there
fore natural that high-water should be somewhat later there than farther
north, where we were in October 1893. On November 25th to 27th we
had again drifted northwards towards the edge of the continental shelf,
but about two degrees farther east than in October. The ice-pressures
were now only heard at some distance, and their periods were less marked;
the observations are therefore less trustworthy. In the beginning of De
cember, 1893, we were farther north and over the deep sea, and it is
therefore surprising that there should hare been a greater difference be
tween the transit of the moon (Greenwich meridian) and the heaviest ice-
pressures there than farther south; but the periods of the pressures were
not well marked at that time, and there are too few observations.
After that time, when the ship had drifted farther towards the inner
regions of the deep North Polar Basin, no distinctly tidal pressures were
observed, and it seemed as if the pressures were more influenced by
the winds.
The mean difference between the transit of the moon across the
Greenwich meridian and the ice-pressures obtained by all our observa
tions from October to December, 1893, is 20 hours and 38 minutes.
If we assume that in this region as wefi as in the region about 83" N.
and 12" E. of June 1896, the ice-pressures occurred at the same phase of
tidal wave, the latter should thus need about 6 hours and 27 minutes to
travel the distance of about 980 naut. miles (1800 kilometres) between the
two regions. This gives a velocity of about 152 miles an hour, vs'hich
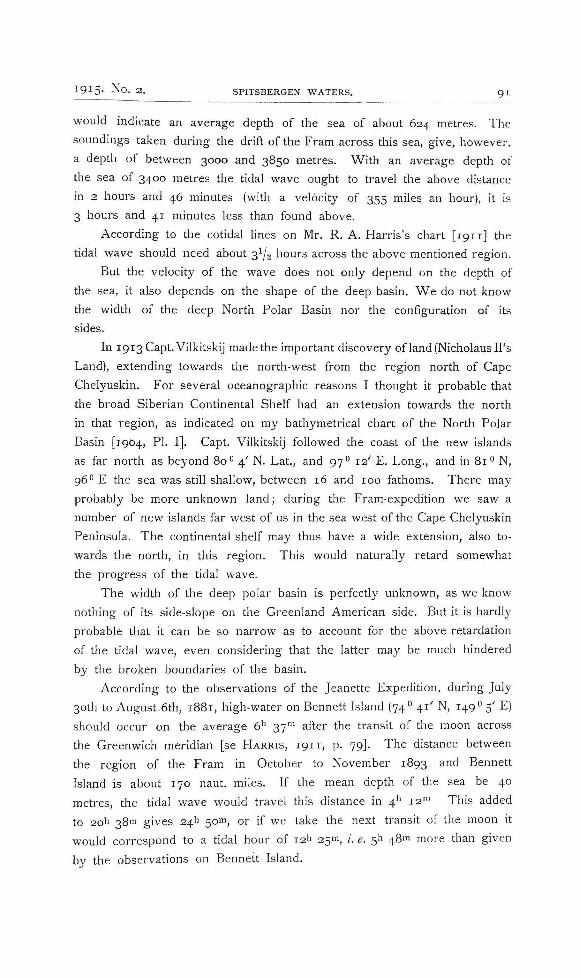
I9-t5- N o . 2 . SPITSBERGEN WATERS. 9 1
wovfid indicate an average depth of the sea of about 624 metres. The
soundings taken during the drift of the Fram across this sea, give, however,
a depth of between 3000 and 3850 metres. With an average depth of
the sea of 3400 metres the tidal wave ought to travel the above distance
in 2 hours and 46 minutes (with a velocity of 355 miles an hour), it is
3 hours and 41 minutes less than found above.
According to the cotidal fines on Mr. R. A. Harris's chart [1911] the
tidal wave should need about 3^2 hours across the above mentioned region.
But the velocity of the wave does not only depend on the depth of
the sea, it also depends on the shape of the deep basin. W e do not know
the width of the deep North Polar Basin nor the configuration of its
sides.
In i9i3Capt.Vilkitskij made the important discovery of land(Nicholausirs
Land), extending towards the north-west from the region north of Cape
Chelyuskin. For several oceanographic reasons I thought it probable that
the broad Siberian Continental Shelf had an extension towards the north
in that region, as indicated on my bathymetrical chart of the North Polar
Basin [1904, PL I]. Capt. Vilkitskij followed the coast of the new islands
as far north as beyond 80" 4 ' N. Lat., and 97° 12' E. Long., and in 81° N,
96" E the sea was still shallow, between 16 and 100 fathoms. There may
probably be more unknown land; during the Fram-expedition we saw a
number of new islands far west of us in the sea west of the Cape Chelyuskin
Peninsula. The continental shelf may thus have a wide extension, also to
wards the north, in this region. This would naturally retard somewhat
the progress of the tidal wave.
The width of the deep polar basin is perfectly unknown, as we know
nothing of its side-slope on the Greenland American side. But it is hardly
probable that it can be so narrow as to account for the above retardation
of the tidal wave, even considering that the latter may be much hindered
by the broken boundaries of the basin.
According to the observations of the Jeanette Expedition, during July
30th to August 6th, 1881, high-water on Bennett Island (74° 4 1 ' N, 149° 5' E)
should occur on the average 6 ^ 37"^' after the transit of the moon across
the Greenwich meridian [se HARRIS , 191 I , p. 79]. The distance between
the region of the Fram in October to November 1893 and Bennett
Island is about 170 naut. miles. If the mean depth of the sea be 40
metres, the tidal wave would travel this distance in 4'' 12™ This added
to 2oh 38m gives 24h 50m, or if we take the next transit of the moon it
would correspond to a tidal hour of I2h 25m, /. e. ^ 48m more than given
by the observations on Bennett Island.

9 2 FRIDTJOF NANSEN. M.-N. Kl.
If the shortest distance between Bennett Island and the edge of the con
tinental shelf to the north of it, is much shorter than the distance between
the island and the region of the Fram in the autumn of 1893, t h t'dal
wave may spend less time e. g. 2 hours less in reaching the island. Its
tidal hour might then be 22h 5010, or loh 25m. But this would be about
3h 48m later than found by the observations of 1881 on the island, —
or also would it be 8h 37m earlier, but in that case we would have to
assume that the tidal wave reaches Bennett Island one semidiurnal period
later than given by Harris's chart, and that seems hardly possible.
At present it seems difficult to find a feasible explanation of these
great discrepancies.
The Extension and Shape of the North Polar Basin.
As the results of the investigations described in this paper, especially
the salinity of the deep-water of the North Polar Basin, may have som?
modifying effect upon the views previously held by the writer, as to the
extension and shape of the deep North Polar Basin, it might be appropriate
to take up this subject for new discussion here.
In 1902 and 1904 the writer held the view that the deep North Polar
Basin had a wide extension, and probably covered the greater part of the
still unknown North Polar region [1902, pp. 399 el seq.; 1904 pp. 227 etseq\.
This view was chiefly based upon the nature of the cold deep-water or
bottom-water of this basin. As, according to the investigations during the
Fram-Expedition, this water should differ entirely from the deep-water of
the Norwegian Sea, it was thought to be formed in the North Polar Basin
itself; but if so, this formation seemed impossible to account for unless the
basin had a wide extension.
After having found by new investigations that, by a special process,
cold bottom-water with a comparatively very high salinity may be formed
in the Barents Sea [1906], the writers views as to the extension of the
North Polar Basin were much modified [1907], and he no more considered
it necessary to assume that the North Polar Basin had such a wide exten
sion as he had thought before. His view was now, "that the known geo
graphical and geomorphological features of the Arctic regions do not
exclude the possibility of a wide extension of the continental shelf beyond
the northernmost known islands of the American Arctic archipelago and
Greenland, and there may be lands on this shelf in the Unknown North. It
is also possible that the Siberian continental shelf may have northward exten,-
sions with land in the region between the New Siberian islands and Alaska".

1915- No. 3. SPITSBERGEN WATERS. 93
Later explorations have not disproved the correctness of this view,
neither the one way nor the other. Mikkelsen and Leffingwell found
comparatively deep water (620 metres (339 fathoms) with no bottom) to the
north of Alaska (north of 7 1 0 2 0 ' N ) , indicating a narrow continental shelf
in that region, as assumed by the writer, and they saw no indications of
land. The Stephanson Expedition to Bank Land, and the drift of his ship
have given no indication of extensive unknown land in that region. Peary
found no land north of Grant Land (Ellesmere Land) and Greenland. The
continental shelf was observed as far north as Latitude 8 3 0 5 3 ' . He found
a deep sea near the North Pole, the soundings of his party giving no
bottom at 1260 fathoms (2304 metres) in 8 7 < ' i 5 ' N , and no bottom at
1500 fathoms (2743 metres) about five miles from the Pole. The existence
of Crocker Land, that Peary thought he had seen to the north of Axel
Heiberg Land, has not been verified.
All this does not prove, however, that there may not be a wide con
tinental shelf, with unknown lands to the north of the American Arctic
archipelago, on the contrary I consider this probable.
As was mentioned before, new islands have been found in the region
north-west of Cape Chelyuskin, and the continental shelf is there extending
far north, beyond 8 1 " N. As to the vast regions between the New Siberian
Islands (or Bennett Island), Parry Islands and Alaska we know nothing, but
the possibility that there may be a wide extension of the continental
shelves, also with unknown lands, is not excluded.
According to the investigations described above we have arrived at
the conclusion that the salinity of the deep-water of the North Polar Basin
is about 34.91 %o. This also agrees well with the salinities of the water-
samples (from 300 and 350 metres) collected by Admiral Makaroff in the
sea east and south-east of Franz Joseph Land [NANSEN, 1906, p. 51].
According to the determinations in the writers laboratory, MakarofTs
observations and samples gave the following values:
N. Lat.
7 8 ° 2 1 '
79° 45 '
E. Long.
6 i » i 5 '
6 5 " 9'
Depth
300 Metres
3 0 ° ./
350 „
Temp.
— o.iOC.
0.7 „
o-S »
Salinitv i ot
34.88 0/00
•92 „
.92 .,
28.04
.025
•035
It seems probable that the depths where these samples were taken
communicate directiy with the deep North Polar Basin, and this water at
Makaroff's stations was evidently very simular to that which the writer

9 4 FRIDTJOF NANSEN. M.-N, Kl.
found in 1912 at Stat. 36, at 580 metres (0.4° C. and 34.91 °/oo)> in 80 <>
36' N, north of Spitsbergen.
If it be thus correct that the deep-water of the North Polar Basin is of
the same kind as that of the Norwegian Sea and has come from the latter,,
as assumed above (p. 39), this deep-water cannot prove anything as to the
extension of the deep NcJsth Polar Basin because it, might then just as
well be carried over the low threshold into a narrow basin, like a big
and very deep fjord, as into a wide basin. Thus far there is still less
necessity of assuming that the North Polar Basin has a wide extension,
than the writer thougt in 1907.
The one reason which especially seems to the writer to idicate that
the deep basin may not have such a wide extension into the unknown
north as he at first thought probable, is the drift of the Fram 1893 to 1896.
Although the drift of the ice was chiefly caused by the winds, we
would expect that, owing to the deflecting effect of the Earth's rotation,
the moving ice would be deflected towards the right until it met with
resistance from a coast or continental shelf, and would then follow along
this coast or shelf, keeping it on its right hand side. This would be in
full accordance with what is always the case with currents and drifting ice
everywhere else in the Northern hemisphere.
The writer has shown [1902. pp. 365 et seq^ that during the Fram-
Expedition (1893 to 1896) the directions of the drift of the ice for shorter
periods, only with few exceptions, deviated to the right of the directions of
the shifting winds, and generally the angle of deviation was considerable.
But nevertheless the direction of the resultant of the whole drift of the
Fram nearly coincided with the direction of the wind-resultant for the same
period, or it even deviated a littie (i "1 to the left of the latter.
This proves that the ice, drifting before the wind, must have met
with more resistance whenever it was carried towards the right — i. e.
towards the north and north-east — of the average direction of the drifting
of the Fram, than when it was carried towards the left of the latter. Two
explanations are then possible: there may either have been land (or a
shallow sea) to the right of the Fram's track, which offered resistance to
the drift of the ice, — or there may have been a permanent surface-
current, directed west- and south-westwards towards the left of the Fram's
track, and sufficientiy strong to counterbalance the deviation of the ice
towards the right of the resultant of the winds during the whole drift.
Let us first consider the latter possibility. As the writer has pointed,
out before [1907, p. 483], such a directon of a surface-current would be
difficult to explain. Whatever the cause and origin of the current might

I 9 0 5 - N o . 2 . SPITSBERGEN WATERS. 95
be, we would expect it to be deflected towards the right till it met with
resistance near the edge of the continental shelf or against land, and then
it would follow along the shelf or the land. In a wide North Polar Basin
we wold thus get a cyclonic movement of the currents.
A current deviating much to the left, of the average direction of the
Fram's drift, as our observations might seem to indicate [see 1902, pp. 358
et seq\ cannot, however, follow the direction of any land or of any edge
of a continental shelf to the north, for if the edge of the shelf (or land)
had such a direction, the Fram would have approached it rapidly, and
must have met with it at last; but she was the whole time drifting in a
deep sea. Moreover a current with such a direction would be directed
towards the edge of the continental shelf on the other side of the basin,
north of Franz Joseph Land and Spitsbergen, and that is not probable.
It seems therefore hardly possible that the permanent surface-current
of the North Polar Basin along the track of the Fram, may have had
such a direction as the writer previously [1902] thought was proved by the
observations of the expedition.
The fact that the average direction of the whole drift of the Fram
did not deviate to the right of the resultant of the wind, but instead slightly
to the left, might therefore more simply be explained by the existence of
land, or at least shallow sea, with the edge of the continental shelf, to
the north of the Fram's track. In this namer there might have been
offered resistance to the drift of the ice in that direction. As has elsewhere
been pointed out, even a continental shelf which does not rise to the sea-
surface, offers resistance to sea-currents and to the drift of the ice. Not
considering the periodical tidal currents, there is comparatively littie motion
of the water and ice over the shelves and the banks of the sea, the cur
rents wifi greatly follow their edges and side-slopes.
The existence of a shallow sea, perhaps even with land, somewhere
to the north of the Fram's track, might thus seem probable. If the drift
of the Jeanette be also taken into consideration, the probability of such
land or shallow sea to the north might seem to be strengthened; for if we
assume the deep North Polar Basin to have a wide or roundish shape,
bounded by the Siberian coast and the known American Arctic archipelago,
it would indeed be difficult to explain why the ice is carried in an anti-
cyclonic direction westwards along the Siberian side of this basin. The
effect of the Earth's rotation would then seem to make it necessary that
the ice should be carried, by wind as well as by current, along the American
side of the basin.

9 6 FRIDTJOF NANSEN. M.-N. Kl.
During his sledge-expedition from Greenland to the North Pole, Peary
found, however, no land in that region, and near the Pole he found a
deep sea. Unless we assume that there may be land somewhere between
the tracks of Peary and the Fram, there cannot be any land (or shallow
sea) in this region north of the Fram's track so near that it could have
had an appreciable effect upon the direction of the drift of the ice. It is
then a question whether land or shallow sea might exist to the north of
the Fram's track farther east.
Mr. Rofiin A. Harris has by a careful study of the tidal observations
on the coasts of the North Polar Sea [1911] come to the conclusion that,
there must be an extensive land or a shallow sea in the stifi unknown
region of the North Polar Sea, north of Alaska and the American Arctic
archipelago.
The writer does not feel competent to decide whether Mr. Harri's
arguments are based upon perfectly sound principles; Mr. Harris operates,
however, with many quantities, that owing to the meagerness of observa
tions could not be exactly computed, and may therefor be considered as
more or less uncertain, as Mr. Harris himself states. The writer does not
therefore think that too much faith ougth to be placed in his conclusions.
Although the observations of the latest expeditions do not actually disprove
the . correctries of Mr. Harris views as to a hypothetical land north of Alaska,
west of Bank Land, and North of Axel Heiberg Land (Crocker Land?),
they show at any rate that such lands cannot be so near the known coasts
as originally assumed by Mr. Harris.
What we learn as to the tidal wave in the North Polar Basin from
our current-measurements and the occurrence of ice-pressures during the
Fram-Expedition (see above pp. 83 et seq.) may warn us that there are
possibly irregularities in the high-waters etc., and these would have to be
studied before any reliable conclusions as to unknown land in the north
could be based upon the tidal observations.
The other arguments, outside his tidal speculations, advanced by
Mr. Harris in favour of his hypothetical land in the north, can hardly be
said to carry much weight.
He says: "The decided westward drift observed by Mikkelsen and
Leffingwell off the northern coast of Alaska is alone strong evidence
against Nansen's hypothesis of an unobstructed polar basin''. ^ Why so is
1 Mr. Harris is mistaken in his views of what is "Nansen's hypothesis". The writer's paper of 1907, which Harris quotes, shows that the writer does not believe in the probability of an "unobstructed polar basin" in the sense Mr. Harris mentions. On the contrary the writer thought "the possibility of a wide extension of the continental shelf from the American side, etc., into the Unknown North, was not excluded, and he thought that "there may be unknown lands on this shelf, etc.
1915- N o . 2. SPITSBERGEN WATERS. 91
not stated. It seems difficult to understand that the strength of this evidence
should be much greater than that of Mr. Harris 's evidence on an earlier
occasion [1904] when he thought that the current north of Alaska runs
in the opposite direction, eastwards, and that this proved land to the north.
There are several observations of the drift of the ice to the north of
Alaska, by ships that have been enclosed in it, but none of them seem to
prove anything with regard to unknown land to the north, neither in the
negative nor in the affirmative. They chiefly prove that the drift of the
ice in this region much depends on the local winds.
Mr. Harris also says : "The time required by casks deposited off Point
Barrow and- off Cape Bathurst to reach their destinations on the north
eastern coast of Iceland and the northern coast of Norway, viz., about five
and one-half and eight and one-fourth years, respectively, while not dis
proving, certainly do not favour the hypothesis in question" [i. e. of an unob
structed polar basin). The observed time required by the casks to drift
across the North Polar Basin is, however, not longer than might be expec
ted if this basin were unobstructed. W e do not know what time was
actually required for this drift, as it is impossible to say how long time has
elapsed before the casks were found, after they had left the North Polar
Basin, between Spitsbergen and Greenland. They may have had a very-
complicated drift in the Norwegian Sea, where there are several systems
of vortex-movements [cf. HELLAND-HANSEN and NANSEN, 1909], and they
may have spent a long time there before they were thrown ashore. This
may especially have been the case with the cask found on the northern
coast of Norway. And then we do not know how long the casks may
have been lying on the shore before they were found.
W e know, however, that at least the one cask cannot have required
more than five years to drift across the polar basin from Alaska to the
opening between Spitsbergen and Greenland, for it cannot have spent less
than half a year on its way from this region and till it was found in
Iceland.
But now a drift of five years across the North Polar Basin from
Alaska to the opening between Greenland and Spitsbergen is remarkably
short for such a cask. Judging from the drift of the Jeanette and the
Fram, the writer had calculated that a ship, that worked its way as far as
possible into the ice north-east, of Bering Strait, would require five years
to drift across an unobstructed polar basin, before it could work its way
out of the ice again on the Spitsbergen and Greenland side, like the Fram
in 1906 .
Vid.-Selsk. Skrifter. I. M.-N. KI. 1915. No. 2. 7

9 ^ FRIDTJOF NANSEN. M.-N. Kl.
The above-mentioned drift of the cask, in five years, is much shorter,
considering that the cask was deposited on a floe off Point Barrow, and
that its drift Could not be shortened, like that of a ship, by working its
way out of the ice on the Greenland side. The cask had consequently a
longer and more time-wasting distance to travel. If anything, the drift of
this cask would thus rather favour the existence of an unobstructed polar
basin. But of course we do not know by which way the casks may have
travefied, whether near to the routes of the Jeanette and the Fram, or
much farther north. These casks cannot therefore tefi us anything as to
the possible existence of land or shallow sea in the unknown north.
Mr. Harris also mentions that "the westerly direction taken^ by the
Jeanette^ especially during the last five months of her drifting, does not
suggest unobstructed deep water to the northward of eastern Siberia". In
accoi"dance with what has already been said before (pp. 94 et seq.), this
evidence seems to the writer to be of somewhat more value than the
others stated by Mr. Harris. But before any conclusions of weight could
be drawn from it, it would be necessary to know the velocities and direc
tions of the winds during the drifting of the Jeanette, in order to see
whether the drifting ice met with any special resistance towards the north
which prevented its course from being deflected towards the right of the
wind. As far as I know, however, there is not sufficient observation-
material for such an investigation. W e cannot therefore conclude anything
of much importance in the above respect from the drifting of the Jeanette.
It may perhaps only be pointed out that the cask that required less
than five years to drift across the North Polar Basin from Alaska, cannot
possibly have come by the same way as the Jeanette and the relics from
the Jeanette, found off the south-west coast of Greenland; for if so the
cask would necessarily have required a rnuch longer time for its drifting;
it would require a very long time to reach the starting point of the
Jeanette-drift from the place where it was deposited off Point Barrow.
Hence it follows that the cask must have travelled along a much
quicker route across the unknown sea, somewhere far to the north of the
track of the Jeanette, where the ice drifted more freely. This circumstance
may just indicate the probability of more unobstructed and deeper water
there than along the track of the Jeanette.

i g i S - N o . 2. SPITSBERGEN WATERS. 99
Investigations on the Amount of Oxygen in the Spitsbergen Waters ;
Some determinations of the quantity of oxygen in the sea-water at
different depths were, made at a number of stations. The results are
given in Table III.
The ordinary Winkler method was used for the determinations in the
following manner: the glass-botties containing about 300 c c , and pro
vided with carefully ground glass-stoppers, were fified by means of a
narrow rubber tube passing from the outiet of the water-bottle to the
•bottom of the glass-bottle; The water is let in gentiy and not allowed
to form air-bubbles, and when the bottle is full an ample quantity of water
is allowed to flow out over the top of the bottle, in order that afi water
is washed out, which first ran in and came in contact with the air in the
bottie. Now solutions of sodium hydrate (with potassium iodide) and man-
ganous chloride are added with pipettes with long stems in the ordinary
way. Then the glass-stopper is gently pressed down into the neck of
the bottle, while the remaining of any air-bubble is carefully avoided.
After the bottle had been inverted several times, the stopper was tied
down tightly by string round the neck of the bottle and over the stopper;
and after the bottle had been numbered, it was carefully stowed away in
a drawer on board. After our return to Bergen in September the final
titrations of the water-samples and the exact determinations of the volumes
of the bottles were kindly made by Mr. THORBJ0RN GAARDER.
The botties with the samples were not kept in boxes or bigger
bottles filled with sea-water, in order to avoid the absorption of air, as
recommended by Bjerrum [1904] and Palitzsch [1912]. It might therefore
seem possible that the results are not quite trustworthy. But the same
method of keeping the samples in glass-botties with ground glass-stoppers,
simply secured by string tied over them, have also been used by Prof.
B. Helland-Hansen [1907, p. 13, Note 3] and by Mr. Gaarder for years,
and if the stoppers closed tightiy, they have never noticed that oxygen
was absorbed from the air, although the botties were not kept in water.
The degrees of saturation of the absorbed oxygen, given in the fifth
column of Table III, indicates the relation, expressed in per cent, between
the observed quantity of oxygen and the quantity which sea-water with
the same salinity and ^temperature could absorb at the pressure of one
atmosphere, if fully saturated. If the former value be called O^ and the
latter value O^ the percentage of saturation wfil be —^.^ ^' The values
are computed by means of Prof. Chas. J. J. Fox's table [1907].
FRIDTJOF NANSEN. M.-N. Kl.
The observations are not sufficiently numerous to give a general
view of the distribution of oxygen in the different depths of the sea in
the Spitsbergen region; but some general features are demonstrated.
The greatest quantities of oxygen always occurred in the upper
layers of the sea, at depths of lo and 20 metres, with amounts mostly
between 8.19 and 8.34 cc. of oxygen per liter of sea-water, and there
was a supersaturation of 104 and ' 0 5 % or even as much as 109%.
This supersaturation with oxygen in the uppermost layers of the sea
was already distinctly observed by Mr. H. TORNOE [1880, p. 19] "in the
surface-vvater of the northern tracts of the sea" investigated during the
Norwegian North-Atiantic Expedition 1876 to 1878, and he throught that
it must be the effect "of one or more causes as yet unknown". Similar
observations were also made by DITTMAR during the Challenger-Expedition
but he suspected that they might be due to observational errors.
As was first pointed out by Prof. MARTIN KNUDSEN [1899, pp. 155
et seq.], the supersaturation is the result of the action of phyto-plankton,
that occurs in greatest quantities in the layers near the surface of the sea
and, below a certain level, rapidly decreases with increasing depth.
Our observations give supersaturation with oxygen at 20 (and 10)
metres both in the fjords (Stats. 10, 45, and 50), in July and August, and
in the sea outside the coast, even where it was covered by drifting ice
as at Stat. 41c ; but the water at 20 metres at this station with a com
paratively high temperature (2.11 ° C.) had evidentiy come from the region
south of the ice.
At the depth of 20 metres at Stat. 53, outside Bell Sound, the quan
tity of oxygen (7.98 cc.) and the super-saturation ( I O I . 7 ' ' / Q ) were less than
at the same depth at the other stations farther north. This difference
may chiefly be due to the phyto-plankton.
The fact that the water at the surface at Stat. 50, and at 5 metres
at Stat. 41 c was not saturated with oxygen (showing only 98 "/o of satu
ration) was probably due to cooling of the water. Mr. Gaarder has
always found similar conditions in the fjords of western Norway in the
autumn and winter. There is, however, a characteristic difference in this
respect between the surface-waters at Stat. 50, in the sheltered, quiet Bay,
where the surface was not stirred by wind and was much cooled, and at
Stat. 53 outside Befi Sound where the surface has evidentiy been stirred
by wind and waves, that would have effect here where the sea was not
sheltered by land or ice; the surface-water was therefore just saturated
with oxygen (100.4%) in spite of the cooling.

1915- N o . 2 . SPITSBERGEN WATERS. l O I
On the whole the quantity of oxygen seems to be considerably
greater, or at least somewhat greater, in water with salinities less than
34-3 7oo than in water with salinities higher than 34.3 "/QQ.
At 50 metres there was as a rule considerably less oxygen (between
6.99 and 7 49 cc. per liter) than at 20 metres, and the percentage of
saturation was comparatively low, between 89.6 and 92.7 °/Q. The amount
of oxygen at 50 metres was on the whole less at the more northern
stations, both in the fjord (Cross Bay, Stat. 13) and in the sea to the
north (Stats. 37, 4 1 c and 43), than farther south in Ice Fjord, Bell Sound
etc. (Stats. 45, 50, 53, 56). The lowest amount of oxygen at 50 metres
(6.99 cc. and 90 °/o) was observed at our northernmost station, Stat. 37,
north of Spitsbergen. The temperature was there comparatively high
(1.50" C ) . At the Stations 41 c and 43, north of western Spitsbergen,
the lowest amount of oxygen at 50 metres was found in the water with
the lowest temperature and salinity, at Stat. 43.
At Stat. 45, in Ice Fjord, the quantity of oxygen at 50 metres
(8.13 cc.) was considerably higher than at the same depth at the stations
farther north. But the water observed at 50 metres at Stat. 45, with a
low salinity of 33.68 %o and a comparatively high temperature of 0.85 ° C ,
evidently originated from some higher water-layer that had been depressed
to this lower level at Stat. 45 (see Fig. 26, p. 25). If compared with
Stat. 10 of July 21 St, in the mouth of Ice Fjord, it is noticed that the
water at 75 metres, at the latter station, is of the same type, as to tempe
rature and salinity, as the water at loo metres at Stat. 45, and contains
also very nearly the same quantity of oxygen, while the water at 50 metres
at Stat. 45 has even a lower salinity than the water at 20 metres at
Stat. 10.
It has also to be considered that the observations at Stat. 45 were
taken much later in the season (Aug. 26th), when more oxygen may have
been produced by the action of phyto-plankton in the deeper layers, whose
salinity may also have been somewhat raduced by admixture of fresh
water. But this increase of oxygen in the end of August is uncertain,
as the light penetrating to the deeper layers has already been much
reduced at this time, owing to the lower situation of the sun.
On the other hand it is noteworthy that the cold water at 50 metres
in Cross Bay, at Stat. 13. had a considerably smaller amount of oxygen
(7.42 cc. and 91 °/o). This cold water, with a temperature of —0.25° C ,
is probably winter-water, originated by the vertical circulation during the
coofing, when there was very fittle phyto-plankton, and into which the
sun could not penetrate, even in the spring, as the sea was covered by

FRIDTJOF NANSEN. M.-N. Kl-
ice and snow. In this water there may moreover have been a slow oxi
dation by the animal plankton.
It seems to be the same type of cold water, with temperatures below
o " C , salinities between 34.35 and 34.65 "/QQ, quantities of oxygen between
7.3 and 7.5 c c , and saturation between 90 and 92 °/o, that forms the inter
mediate cold layer in Ice Fjord (se above pp. 23 et seq.) as well as in
Cross Bay. It was this, water with the above mentioned amount of
oxygen that was observed at 75 metres at Stat. 10, at 100 and 170 metres
at Stat. 45, and at 140 metres at Stat. 46, in Ice Fjord. It was evidently
also the same type of water, with simfiar amounts of oxygen, that was
observed in the intermediate cold layers, at 50 metres, in the sea north
of western Spitsbergen, at Stats. 41c and 43.
At 50 metres at Stat. 50, in Van Mijen Bay, and at Stat. 53, outside
Bell Sound, where the temperatures were above 0 ° C , the quantities of
oxygen (7.99 and 7.77 c c , 98.4 and 96.3 VQ) were considerably greater
than in the cold intermediate layer just mentioned, though not as great
as at 50 metres at Stat. 45, in Ice Fjord, where the water evidently
belonged to higher levels.
At Stat. 50 our observations gave more oxygen at 70 metres (8.08 cc.)
than at 50 metres (7.99 cc). i f this is not the result of some obser
vational error it seems somewhat difficrult to account for.
At Stat. 56, in the Atiantic Current south-west of Spitsbergen, there
was supersaturation of oxygen at 50 metres (102.8%), evidently due to
the action of phyto-plankton, but as the temperature was comparatively
high (5.45" C.) the actual quantity of oxygen (7.26 cc) was smaller than
at the same depth at the stations farther north.
At depths greater than 50 metres, the amount of oxygen decreases
as a rule fairly regularly with increasing depth, as far as our observations
go, and so does also as a rule the percentage of saturation. There are,
however, exceptions. £. g. at Stat. 43 the amount of oxygen decreases
very regularly with increasing depth from 100 metres downwards. The
decrease is at first 0.09 cc. for hundred metres (between 100 and
200 metres), and then, between 200 and 400 metres, 0.09 cc. for 200 metres,
and between 400 and 540 metres about 0.036 cc. per 100 metres. But
at 50 metres the cold water contained less oxygen than the warmer water
at 100 metres, and the percentage of saturation (89 .6%) was lower than
at any greater depth where observations of the oxygen were taken.
This cold water at 50 metres evidently differs in its origin from the
warmer waters of the underlying strata. It belongs to the cold inter
mediate layer mentioned above, and is polar water that has taken part in

1915- N o . 2 . SPITSBERGEN WATERS. I 0 3
the vertical circulation during the winter and has been cooled by the
radiation of heat from the surface, and by contact with ice. This cold
polar water cannot therefore be expected to contain comparatively much
oxygen, because in the winter, when this water was near the surface,
there is little light, and where the sea is covered by ice (and snow) the
sun is hindered from penetrating into the underlying water-layers and
consequently very little phyto-plankton can be developed, even in the
summer, as was proved during the Fram-Expedition 1893 'o 1896. Where
the water-layers receive admixture of water formed by the melting of ice
we must also expect that their amounts of oxygen are somewhat reduced,
because ice, and consequently also its melting-water, contain comparatively
little oxygen.
At Stats. 56 and 57 the percentage of saturation was decreasing with
increasing depth as far as our observations go, but the actual amount of
oxygen in the sea-water was greater at 500 and 700 metres at Stat. 57
than at 100 metres at Stat. 56, although, to judge from the temperatures
and salinities, there seemed to be approximately the same kind of water
at the different levels at both stations (see Fig. 11). It seems therefore
probable that in this region the actual amount of oxygen was distinctly
greater at 500 metres, and even somewhat greater at 700 metres, than at
100 metres. But the temperature (4.47° C.) was much higher at the latter
depth, and the water there (with salinity 35.02 %o) had evidently been
carried from the south by the Atlantic Current, while the water at 700
metres belonged to the upper layers of the regular deep-water of the
Norwegian Sea, having the usual salinity of 34.91 %o and a temperature
of 0.08 0 C.
The water at 500 meters, with a temperature of 1.22" C , might be
expected to have been formed to some extent by an intermixture of the
overlying Atiantic water with the underlying deep-water; but this is hardly
possible, because its amount of oxygen (7.23 cc.) is considerably greater
than those found both at 100 metres (6.75 cc.) and at 700 metres (6.96 cc).
It must evidentiy have come from some other part of the sea where it
has been more or less intermixed with the upper layers, nearer the sea-
surface.
The correctness of this view seems to be supported by the obser
vations at Stat. 43 (8o0 2o 'N. ) north-west of Spitsbergen, where waters
of much the same type, with temperatures between 1.36° C. and 1.83° C.
and salinities between 34.83 %o and 34.93 %o, were found at all depths
between 100 and 540 metres, with amounts of oxygen decreasing from
7-35 to 7.12 cc. per fiter. It is evidently also the same type of water

I 0 4 FRIDTJOF NANSEN. M.-N. Kl.
that was observed at Stat. i8 (80° 2' N.) at 210 metres (with 18.2° C ,
39-9' %0; and 7.14 cc), and at Stat. 42 (80° 26' N.) at 300 metres (1.87° C ,
34.92 %o. and 7.22 cc).
This kind .of water may probably be carried down to considerable
depths by the vertical circulation during the winter in regions of the sea
where conditions similar to those observed between 100 and 540 metres,
a t Stat. 43, also exist in the upper layers near the sea-surface, and the
sea is not covered by ice, but has surface-temperatures above 1.5° C. in
the winter. This water sinks to form extensive intermediate layers, with
temperatures between i " und 2° C. and sahnities about 34-9 %o, and is
also carried in under the warmer water of the Atlantic Current (containing
less oxygen) by the slant convection currents, that occur so universally in
the sea [cf. Nansen, 1913, p. 19]. It is thus formed in the same manner
as the underlying cold deep-water with much the same salinity, but with
lower temperatures, mostly below o" C.
As it was winter and little phyto-plankton when this water was near
the sea-surface, its amount of oxygen was probably not very great, though
it may certainly have been a good deal more than 7.35 cc. per liter, given
by our observation at 100 metres, at Stat. 43. In the course of time the
amount of oxygen is, however, gradually reduced by the animal plankton,
and also by the oxidation occurring during the decomposition of the
dead plankton sinking from above. In the same manner the amount of
oxygen of the underlying colder deep-water is evidently also gradually
diminished, and therefore we find that the amount of oxygen is decreasing
very regularly with increasing depth in these intermediate and deep layers;
and we found that the water of the typical deep-water, observed at Stat. 57
at 700 metres, had only 6.96 cc. of oxygen per liter.
According to our Table III, the minimum of oxygen .given by our
observations was 6.23 c c , found at Stat. 19 at 510 metres, where the
degree of saturation was 80.0 "/o. It seems strange that the amount of
oxygen should be so much smaller here than at 540 metres at Stat. 43
only a very short distance off, where it was 7.12 cc. (and 91 .8%) , although
the water seems to have been of the same kind at both places, with the
same salinity (34.92 %o) and similar temperatures (1.29° C. and 1.5 i°C.) .
At Stat. 57, at 500 metres, the water was also of exactly the, same nature,
with 1.22° C. and 3(4.92 "/oo, but the amount of oxygen found was still
greater, 7.23 ce. (92.6 % ) . These discrepancies may be due to errors
in our results, and Mr. Gaarder, who made the determinations of oxygen,
thinks it possible that 6.23 cc. for Stat. 19 (510 metres) is a slip of the
pen for 7.23 cc. But unfortunately he cannot find the original journal

1915- No . 2. SPITSBERGEN WATERS. 105
of these titrations, and thus we cannot arrive a t .any certainty on this point.
Otherwise the lowest amounts of oxygen found by our observations
were 6.79 cc. at Stat. 14 in Cross Bay, at 250 metres (1.35° C , 34.84 %o);
6.93 cc. at Stat. 37 at 200 metres (1.71" C- 34.88 %o), far north of Spits
bergen, and 6.96 cc. in the deep-water at Stat. 57 at 700 metres, besides
6.75 cc. in the warm water of the Atlantic Current at Stat. 56, at loo
metres (4.47 « C , 35.02 %„).
It seems a striking feature that the most north-eastern station is the
one that gives, on the whole, the lowest amounts of oxygen (6.99 cc. at
50 metres, and 6.93 cc. at 200 metres). The explanation may possibly
be that the water of these layers, examined at this station, has not for a
long time been near the surface, which is covered by lighter water, and
'during a great part of the year also by ice. The water has probably
come from the west and south, it may to some extent be intermixed with
the warmer water of the Atlantic Current, and its oxygen may gradually
have been reduced by the action of animal plankton and by oxidation due
to the decomposition of sinking dead plankton.
Some Observations of the Hydrogen Ion Concentration in the Northern Sea-W^ater.
During the cruise with the Veslemoy in 1912, a number of measure
ments of the Hydrogen Ion concentration were also made at different
stations by the colorimetric method of S0RENSEN and PALITZSCH [see
Palitzsch, 1911]. In most cases a-naphtolphtalein was used as indicator,
giving blue reactions. When the value of the hydrogen ion exponent pu
was above 8.07, phenolphtalein was also used as indicator, giving red
reaction.
The results of the observations are given in Table IV. The values
of die hydrogen ion exponent, pu, given in the 4th column, were found
in the manner described by Mr. S. Palitzsch, and have been corrected for
what he calls "the salt error".
As Mr. Gaarder has suggested, and Mr. Palitzsch has accepted, it would,
however, be preferable in Oceanography to introduce, as expression for
the reaction of the sea-water, not the value of pu but the value of the
concentration of hydroxyl ions, that increases with the alkafinity of the
sea-water.

I o 6 FRIDTJOF NANSEN. M.-N. Kl.
The values of COH', i. e. the number of gram-equivalents of hydroxyl
ions (OH') per liter of sea-water, corresponding to the values found for
ps, are therefore given in the 5th column of Table III; but for the sake
of convenience the real values have been multipfied by lo"*.
As the writer had no experience in this colorimetric method before
the cruise, and as some accidents happened to the apparatus during the
cruise, the results ought not to be considered as very trustworthy,
especially as the method in itself is not very accurate.
Mr. PALITZSCH found [1912 a, p. 252] that the condition at some of
the stations of the Danish expeditions 1908 —1910 suggested a relation
between the quantity of oxygen in the sea-water and its hydroxyl ion con
centration {i. e. alkalinity), in this manner that a greater quantity of oxygen
is accompanied by a higher hydroxyl ion concentration (or a lower hydro
gen ion concentration). Similar conditions have been found by Mr. GAARDER
by his numerous investigations in Norwegian fjords near Bergen, and by
Prof. B. HELLAND-HANSEN in the northern Atlantic in 1913 [1914].
Our observations may seem to agree with these results, in so far that
the hydroxyl ion concentration found shows, on the whole, a tendency to
decrease with increasing depth from the surface downwards; but this does
not seem always to coincide with the variations in the relative amount of
oxygen. The latter was found to be specially great, with supersaturation,
at 20 metres, and less near the surface. Our observations gave, however,
in most cases a distinctiy higher value of the hydroxyl ion concentration
at the surface than at 20 metres.
It seems also strange that at Stat. 19 the hydroxyl ion concentration
decreases graduafiy from the surface and down to 310 metres, but below
that level it again increases with increasing depth.
The much lower values of the hydroxyl ion concentration given by
our observations in the inner end of Cross Bay, at the Lilliehook Glacier
(in Porte Signe and at Stat. 13), as compared with those obtained at
Stat. 14 half way out the Qord, are somewhat puzzling, and seem diffi
cult to account for, if the differences may not be due to some obser
vational error; but they are rather big for such a possibfiity.

i g i S - N o . 2 . SPITSBERGEN WATERS. 1 0 7
TABLE I gives the observations of the Temperature, Salinity, and Density, taken on board the Veslemoy, between July loth and September 4th, igia.
The heading for each Station gives the Number of the Station, the Date, the Latitude and Longitude, or in some cases a description of the locality.
ist Column. The Hour of the Observation, Central European Time. 2nd Column. Depth in Metres. A line under the number indicates bottom. jrd Column. Instrument used. B = Bucket used for Surface-Water. A = The Auto
matic Insulating Water-Bottle. I = Stop-Cock Water-Bottle with the Richter reversing thermometers No. P.T.R. 37552 and No. 316 (where two temperatures are given the second one was taken with the latter thermometer). II = Stop.Cock Water-Bottle with the Richter reversing thermometers No. P.T.R. 37551 and P.T.R. 37544 (where two temperatures are given the second one was taken with the latter thermometer). E. An Ekman Reversing Water-Bottle with the Richter reversing thermometers No. P.T.R. 37546 and P.T.R 37548. Where two temperatures are given the second one was taken with the latter thermometer till July agth, and later with, the Richter reversing thermometer No. P.T.R. 37547. R B ^ The Reversing Stop-Cock Water-Bottle with the Richter reversing thermometer No. P.T.R. 3754g. PN = The Pettersson Nansen Insulating Water-Bottle with the Nansen thermometer No. P.T.R. 37554 and the Richter reversing thermometer No. P.T.R. 37547 till July 2gth, and later the Richter reversing thermometer No. P.T.R. 37548. When two temperatures are given with this water-bottle the second one was taken with the Richter thermometers, otherwise the temperatures were taken with the Nansen thermometer.
4th Column, t° C. The corrected Temperature (Centigrade) of the Sea-Water in situ, referred to the hygrogen thermometer.
Jth Column, S ^/oo- Salinity in per miJle. An a s t e r i s k after the number indicates that the salinity of the sample was determined (with the Interferometer) both by Mr. J. HELLAND, and by Mr. A. 0YAN.
6th Column, u^ Density (». e. 1000 (5-^—i)) of the Sea-Water at the temperature ill situ when the pressure is reduced to one atmosphere.

i o 8 FRIDTJOF NANSEN. M.-N. Kl.
Hour Depth
in Metres
Instrument
Corr. t^C. s^k Ot Hour
Depth in
Metres
Instrument
Corr. t°C. S^lm Ot
Sta t . 1. July ID, i g i 2 . 73° 5 7 ' N , 20° 2 6 ' E .
2 . 3 0 p . m .
2 . I S » 2 . 0 0 »
2 . a o »
0 - 5 2 0
47 75
A 9
» It
3-25 3 - 1
0 - 3 0 . 2
34-51 •54 ' .67*
. 7 4 *
27.4g
•53 .84 .go
Sta t . 2 . July I I , i g i 2 . 74° 46 ' N, 19° 3 ' E.
5.4s p .m.
5-30 » 5-35 ' 6.55 » 6.45 )> 6-35 » 6 . 0 0 I
0 - 5 2 6 . 5
66 ca. go? ca . 100?
[130I 145
A » » » » »
2 . 2
1 - 3 0 . 8
2 . 4
2 . 0
I1-5]
34-59* . 6 0 *
.6g*
.go*
.86* [ .69*1
2 7 .
.
[ .
65 Ti 83 88 88 78]
Sta t . 3 . July I I , i g i 2 . 7 4 ° 5 g ' N , i 8 ° 4 7 ' E .
g . i S p . m, 9.0 » g-05 » o. io »
5° 60
0.9 0.7 0.7 0.7
34-38* •50* •53* -51*
27.58 .68
•71 .69
Stat. 4. July 12, 1912. 75° 13' N, 18° 31' E.
0 . 3 0 a. m . 0 .0 » 0 . 0 5 J
I
2 0
5 0
A
)) '
0.8 0 . 7
0 . 7 5
34'42 •50* .52*
27.61 .68 .70
Stat . 5 . July 16, 1912. At the mouth of the Ice Fjord, between Dodmanden and Cape Staratchin, much nearer the former. Depth, first 175 metres, later 150 metres.
25.00 27.30 26.72
-53? •47
Stat . 6 . July 18, 1912. Green Harbour, midw a y between the Telegraph Station and the western shore.
6 . 3 0 p . m .
5.55 » 6.0 » 6 . 0 5 » 6 .20 »
o-S 2 0
5 0 1 0 0
1 5 0
A
» » » »
2 . 8
3 - 1 0 . 6
- 0 . 5 — 0 . 4 5
3 I . 3 4 3 3 - 5 2
. g o *
3 4 . 2 2 * ?
' - 1 5 *
12 .35 p . m . 1 2 . 4 5 »
12.00 noon
» » D Ji
» »
°-5 2 0
5 0
75 1 0 0 1 4 0
1 4 6
E RB
E
II I
R B
4 . 2 0 2 . 8 1
/ 0 . 2 8 \ 0 . 2 8 — 0 . 2 4 — 0 . 5 6 - 0 . 7 3
29.24 33.49
34-27 '
. 4 0 ' - 5 3 ' . 5 6 '
2 3 2 3
26.27
27.52
.66
.78
Stat. 7. July 18, 1912. The mouth of Ice Fjord; near its southern side, just north of "Fes tn ingen" .
24.18 3 . 4 0 p . m .
» B
T> H
» -» 3 . 0 0 »
» > H »
0 5
2 5
5 0
75
1 0 0
1 5 0 2 0 0 2 4 0
E
II I
R B
E
II I
f 4 . 0 9
I 4.09 1-85 0.48
— 0 . 3 2
f — 0 . 5 0
1—0-59 —0-53 — 0 . 2 5
30-44
34-04' • 3 2 '
•43 '
• 43 '
• 5 1 ' . 62*
27.30 •55 .69
.70
.76
•83
Sta t . 8 . July 18, 1812. The mouth of Ice Fjord; about midway between "Festningen" and the shore between Alk Point and Dodmanden.
5-35 P-m.
3) »
» » 4 . 5 0 t,
yi »
T> 7)
0.5
2 0
5 0
1 0 0
2 0 0
3 0 0
3 8 0 4 0 0
II I
II I
RB
3-76 3-75 I-.37 0 . 1 8
0.35 0.35 0.93 0.78 1.22
34-36*
•59' .76* •83
Stat. 9.
7.30 p . m,
July 18, 1912. The mouth of Ice near the northern side (near Alk
1.40
0 - 5
5 0
I O O
1 5 0
2 0 0
4 0 0
4 2 0
I RB
E
II I
R B
2.98 0 . 2 4
f-o.g6 \ — 0 . 9 6
— 0 . 8 5 — 0 . 9 3
1.43
32 -g3* 34-30*
.50*
• 5 2
. 5 8 *
.86*
Sta t . 1 0 . July 21 , 1912. The mouth of Ice midway between northern and ern side.
3 . 1 5 p . m .
» »
» » fl ;)
1.50 »
» » » 1)
4 2 5 »
0
2 0
5 0
75
1 0 0
2 0 0
3 0 0
4 0 0
4 2 5
B
E
II I
E
I II
PN
4.8 / 0.74 \ 0.76
—0.55 — 0 . 4 1
/ — 0 . 4 2
1—0.43 0.37 1.03
/ 1.08
t i og
2 g . o 5
34-16
» •54
•53
. 7 1 -
.78*
•83
27.60
•92
Fjord; Point).
26.26 27^55
•77 .78 .84 .92
Fjord; south-
23.01
27.40
27.78
•77
.8?
* Lever stopper of glass-bottle broken.

i9i5^ No. 2. SPITSBERGEN WATERS. 1 0 9
Hour Depth
in Metres
Instrument
Corr. t° C. -SO/tx Ot Hoiir
Depth in
Metres
InstrU' ment
Corr. t° C. -SO/oo Oi
\ Stat. 1 1 . July 2 1 , 1912. Near the northern side
of the mouth of Ice Fjord.
2 3 . 2 5
2 7 - 5 1
5.40 p. m
» » » » B »
J) »
0
5 0
I O O
2 0 0
2 9 0
3 2 0
B
E
II I
PN
4-7 0 . 6 3
0 . 6 4
0 . 7 0
0 . 6 1
0 . 8 2
2 9 - 3 4
3 4 . 2 8
.45 -75 •78
•72 .89 •go
Stat. 1 2 . July 27, 1912. 78° 58 ' N, 10° o' E.
9,45 p . m,
9.30 » 50
IOO 2 0 0 2 4 0 2 5 0
B
E
II I
PN
3 ^ 1 — O.IO — O.IO —o.ao
0 . 7 2
1.23
3 3 - 9 2
3 4 5 0
•63 •77 .84
27.04
•73 .84 . 9 0
. 9 2
Stat. 1 3 . July 29, 1912. Inner end of Cross Bay (Lilliehook Bay). About 200 metres, and at last only 100 metres, from the vertical ice-wall of the Lilliehook Glacier. Depth, first 114 metres, and nearer the glacier wall 140 metres.
27.46
• 70
3.30 p . m .
i »
1 »
1.30 »
0
2 0
5 0
75 IOO
1 3 0
1 4 0
B
E
II I
PN
PN
0 . 3 — 0 . 0 4 — 0 . 0 4 — 0 .25 — 0 . 2 0
0 . 3 2
1.03
1.05
34^2o
34^475
•55 •59 .67
.76
.78
.81
.84
.87
Stat. 1 4 . July 29, 1913. Cross Bay, just south of King Haakon Peninsula.
27-04
.78
•83 .go
•91
•95
4 . 0 0 p . m .
» J)
» J
> » » »
0
5 0
1 0 0 2 0 0 2 5 0
3 0 0
3 1 4
B
E
II I
R B
PN
{
{
0 . 9
I .OI 1.02 0 . 6 8 1.12
1-35 1.52
1-54
33-71
34^51
•59 . 8 0
.84
.go
S t a t . 1 5 . July 29, 1912. 79° s ' N , 10° 56 ' E. Outside Cross Bay, off Cape Mitra.
26.16 27.68
.77
7 . 3 0 p . m .
» » y »
» B
» »
0
2 0
5 0
75 1 0 0
1 3 5
B R B
E
II I
PN
2 . 5 — 0 . 0 3 — 0 . 5 2
- 0 - 5 5 0 3 7 0 . 0 7 0 . 05
3 2 . 7 5
34^44
• 5 2
[ •eg]! .66
2
•85 •85
^ The India-rubber washer was broken. 2 Bottle was broken.
S t a t . 1 6 . July 30, 1912. 7 g ° i o ' N , 8° 3 4 ' B .
0.45 a. m. o 15 2.9 33.gy 27.11 •73 •85
•92
Sta t . 1 7. July 30, i g i 2 . 79° 13 N, 7° T' E .
0
4 0
9 0
1 7 5
185
B II I
PN
2 . 9
- 0 . 0 3 1.07
1.65 1^66
33-g8 34^51
•74
.88
4 , 4 0 a . m . » J
» » 1 B
> B
0
3 0 0
5 0 0
7 0 0
I I O O
T 2 I O
B II I E
PN
3 . 2
1 . 6 9
I . O O
0 . 1 6
0 . 9 1 ]
1 . 0 7
3 4 . 0 6 *
• 9 5 ' . 906*
•895* / .895 \ .895
27.14 •97 -99
28-05 [ .085]
09
S t a t . 1 8 . Aug. 3, 1912. 8 0 ° 2 ' N , i i ° 2 o ' E .
1 1 . 5 0 a. m » s
» » TI S
> B
0
6 0
n o 2 1 0
2 4 0 2 4 7
B II I E
R B
27.52 .86 .87 •93 •93
Sta t . 1 9 . Aug. 3, 1912. 80° 18' N, i o ° 4 5 ' E .
1 . 8
1.56 1.69 1.82
1.83
34^33 •79 . 8 2
• 9 1 . 9 1
In the ice.
6 . 3 0 p . m . 7 . 5 0 B
B »
6 . 3 0 »
» » » B
» B
0
0
2 0
5 0
I O O
3 0 0
3 1 0
4 1 0
5 1 0
6 1 0
6 2 3
B B II I
E R B
II
I
E
RB
1 The bottle was cracked.
0 . 8
0 . 7 5 1.17
0 . 7 5 I 9 1 1.90 1.80
^•55 1.29
1.30
o.go
33-o6 3 3 0 6
-56* 34-57*
.86* .8g5 '
3 4 - g 2 *
-93*
[ .98] '
f -gi6* \ . 9 0 *
26.52 26.52
.89 27.74
.89
.92
27.94 •97
28.006 27.99

n o FRIDTJOF NANSEN. M.-N. Kl.
Hour Depth
in Metres
Instru- Corr. ment t° C. S°loo Ot Hour
Depth in
Metres
Instrument
Corr. t° C. S% Ot
S t a t . 1 9 a . Aug. 3, 1912. Same place as Stat. 19. The ship was moored to an ice-floe.
10.45 p.m.
11.00 »
10.45 ' B B
B »
0
10
20
50
75
B
E
II I
E
0.8
/ -X5
\ 1.17 1.28
1.27
/ 0^99 \ 0.99
33^09
•50
. 6 6 ' 34^S8"
.72 '
26.55
.96 2 7 . 7 1
.84
Sta t . 1 9 b. Aug. 4, 1912. Moored to the same ice-floe^
1.10 a. m .
1.00 B
0 . 4 0 B
0 . 5 0 «
3 3 0 »
2 . 0 0 »
10
20
50
75
50
626
E!
E
E
E
E
{ i \ {-. { {•
1.16
1.17
r.i6
1.18 -0.4T
-0.41
0.48
0.49
-o.8g
-0.87
33^48
.61*
34.48*
.65*
•43*
26.83
•94
27-73
.82
•71
Stat. 19 c.
1 1 . 5 0 a . m . » B
B B
» B
0 . 1 5 p . m .
1 1 . 0 0 a . m .
0 . 1 5 p . m .
> B
0 . 4 0 B
B B
» B
1.45 »
Aug. 4, 1912. ice-floe.
10 2 0
3 0
4 0
5 0
6 0
8 0
1 0 0
1 2 0
1 5 0
6 2 0
B II I
E
II
E
I
E
II I
Mored to the same
2 6 . 1 9
.76 •99
2 7 . 2 7
•35
•71
-71
-79
.84
.86
.91
0.1
1.02
I.4I
1.17
1.18
0.06
1.48
1-47 1-56 0.27
0.28 1.14
1.81
2.03
3.05
32.59 33-38
.70*
34.02*
•05*
•38'
•375*
.60'
.73'
.82*
.90*
S t a t . 1 9 d. Aug. 4, 1912. ice-floe.
5 3 5 P-m-
•55 »
6 . 0 5 B
5-35 » 6 . 0 5 B
5^35 "
6.05 »
5-35 »
30 40 50 60 2
70
80 2
B
E
II II I I
E
E
Moored to the same
26.03
27.14
•38 •63 • 7 '
•73
1.66]
— O.I
1.42
1.44
1^54
-1^45 -I-5I — 1.04?
o.ig
0.21
— 0.82?
— 0.64]
32.39
33-88*
34-19^ .2g
•38* [.12*] 2
•52*
1.36'] 2
1 Mr. Oyan got 34.45 O/oo and later 34.50 "/oo, but the glass-bottle was then (February 1915) cracked.
2 There has evidently been something wrong with these observations at 60 and 80 metres, taken by the same haul, at 5.35 p. m. The water-bottles may probably not have been released and closed in the proper depths but during the hauling up. In that case the temperatures at these two depths are also doubtful, and this may be the explanation of the considerable disagreement between the readings of the two thermometers of the Ekman Water-bott le at 80 metres, the thermometers did not get time to take the temperature at the depth where they happened to be reversed during the hauling up.
S t a t . 1 9 e. Aug. 4, i g i 2 . Moored to the same ice-floe.
1 0 . 0 5 P - m .
1 0 . 5 0
Stat. 20.
4 0 6 0
80
4 0 6 0
80 •
II I
II I
—1.25
—0.74
0.78
0.79 —1.25
—0.85 0.73
0.74
34.26*
•49*
.6g*
•15* .48*
•6g*
27.60
,76
.83
•50
•75
•83
Aug. 5, 1912. Moored to another ice-floe, after having had to move about 5 miles towards ENE (magn.) from Stat. 19 e. W e should then be in 80° 2 1 ' N, n '^ 10' E, if we had not drifted in a south-westerly direction while a Stat. 19.
26.40
27^73 .82
11.30 a.m.
10.40 > B B
B B
B »
0.18 p.m.
0
40
60
80
IOO
572
B II I
E
R. B.
0.2
0.36
0.52
1.43
1.44 1.83
32.87
34.53* .66*
•79*
.87*
-87
.90

1915- No. 2. SPITSBERGEN WATERS.
Hour Depth
in Metres
Instrument
Corr. t°C. •so/a Ot Hour
Depth in
Metres
Instrument
Corr. t°C. S% Ot
Stat. 2 0 a. Aug. 5, 1912. Moored to the same ice-floe.
27.76
.87
.go
. 9 1 2 6 . 6 0
. 7 0 2 7 . 0 4
•32
•73 .84 . 9 2
i 1 The journal gives 0.86° C , but' that is p ro . [ bably a mistake for 1.86°.
Stat. 2 1 . Aug. 6, 1912. 80° 4 ' N , 11° 3 0 ' E .
27.19 .27 •79 .86 .87 .89
3.30 p. m. B B
B B
» B
4.30 B
6.20 » B B
» B
B B
B B
5.40 » 5-55 " 3.10 B
6.40 i)
4 0 6 0
8 0
I O O
1 5 0 0
5 1 0
2 0
30 50
2 0 0
575
587
II I
E
R . B . I B II I
E
R. B . R . B . R . B .
{
{
0 . 7 2
0.88
1.65 1.861 2 . 1 6 0 . 8
0.86 i^34 T.6T
1.62 1.06
o^59 2 . 1 2
34.60 •71
.82
.88
. 9 1 33.16
. 2 2
.76
34^i3
•58 .69 •92
11.30 a. m . 0.20 »
11.50 B 11.25 B
" •55 " 0.11 B
0.20 B
0
1 0
3 0 5 0
I O O
1 4 0
2 0 0
2 4 2
B A B
R. B. A II
E
1^7 1.8
1-7 1.70 2 . 1
1.86 1.63 1.66
33-97 34.08
. 7 2
. 8 0
.86
.86
[•75]
Stat. 2 2 . Aug. 6, 1912. 79° 58 ' N, 12° 13' E
5.00 p. m.
4-45
0
5 0
I O O
1 5 0
1 6 0
B
E
11
E
2 . 0
1.58 1.60 1.56 1.57 1.57
34-25
•39
•47
•54
2 7 . 2 9
•54
. 6 0
.66
Stat. 2 3 . Aug. 6, 1912. 79° 56' N, 12° 45 ' E.
.30 p. m.
•25 »
.20 B
.15 B
0
1 0
2 0
CO
CO
B
0
B
E
E
E
1.9 / 1.58 I 1-59 r - 5 7 I 1^59 / 1.58
34^32
.34
•35
•35
27.46
•50
S t a t . 2 4 . Aug. g, 1912. The mouth of W o o d B a y ; near the western side (Reindeer Land) 79° 44' N, 14° 8' E.
12.0 noon B B
0.20 p . m . 2 0
50
1 5 0 1 6 8
B II II
E
R. B .
3.1 1.77 1.62
1.13 I . I 3 i^35
3i^g4 [34^5o] 1 34^40
• 6 4
.75
25.46
27-54
.77
.84
1 The bottle was cracked.
Stat . 2 5 . Aug. 9, 1912. The mouth of W o o d Bay; midway between western and eastern side. 79° 43 ' N, 14° 13' E.
1.05 p .m. i .15 »
0.55 I . I 5
0-55
Stat. 26.
1.45 p .m. 1.50 B
0 10
2 0
5 0
75
I O O
1 5 0 1 7 0
B II
E
II R. B.
E
R . B .
4.0 2.47 1.74 1.75 0.38 0.85 i .31 1.33 1.12
3 2 . 2 0 . 6 0
. 8 2
34.38 •57
•65
. 7 0
25.58 26.04
.27
27.60
•73
.76
.82
Aug. 9, 1912. The mouth of W o o d B a y ; near the eastern side.
25.48 2 6 . 0 0 2 7 . 2 2
•63
•73
Sta t . 2 7 . Aug. 10, 1912. Wijde Bay : near western shore ; outside Lake Valley. 7 9 ° 3 9 ^ ' N , I 5 ° 2 5 ' E .
1^7
0
1 0
2 0
5 0
75 9 0
B II I
E
R. B.
3-2 2.78 i^39 0.65 0.65 0 . 8 0
31.97 32.59 33.98
34^43
•56
3.50 p . m .
4^15 •»
3^50 '
B B
4^15 »
3^50 »
B B
0
1 0
2 0
5 0
75
I O O
1 3 0
1 4 3
B
E <
II
I
R. B.
E
R . B .
/ 1.71 U - 0 . 6 I ]
1.36 ( 1.14 I ^•I5
0.76 / 0.78 \ [ -o.86]
0.73
32.60
.90
34.03
.46
.48
•55
. 6 1
2 6 . 1 0
•33
2 7 . 2 6
.62
.66
.72
•77
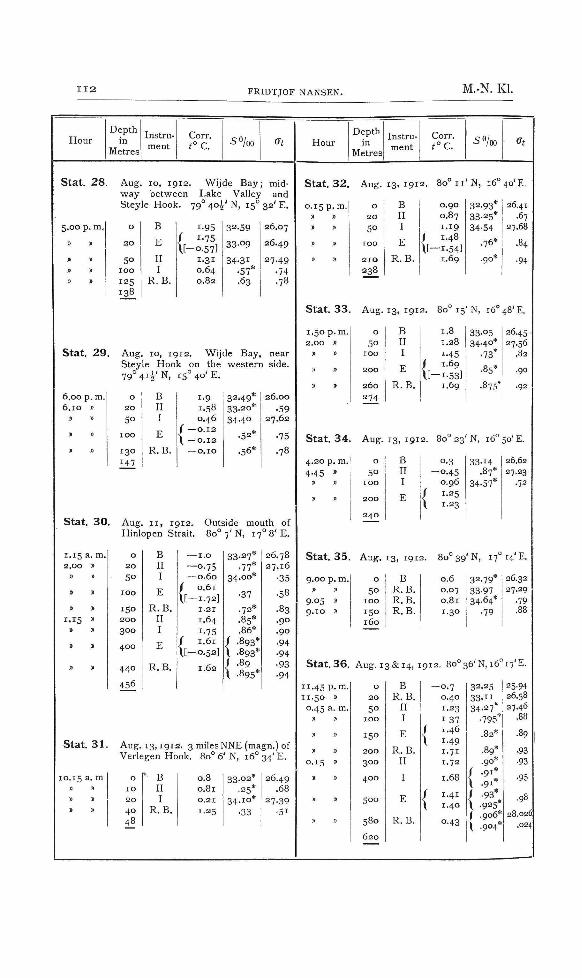
1 1 2 FRIDTJOF NANSEN. M.-N. Kl.
Hour Depth
in Metres
Instrument
Corr. t° C. S% Ot Hour
Depth in
Metres
Instrument'
Corr. t°C. S% Ot
S t a t . 2 8 . Aug. l o , 1912. Wijde B a y ; midw a y between Lake Valley and Steyle Hook. 79° 40^ ' N, 15° 32 ' E.
.00 p . m.
B B
B B
B B
B B
0
2 0
5 0
I O O
125 138
B
E
II I
R.B.
i-gs / 1-75 \t-o^57]
i^3i 0.64 0 . 8 2
32.5g
3 3 0 9
34^3i .57* •63
26.07
26.4g
27.49 .74 .78
S t a t . 2 9 . Aug. 10, 1912. Wijde Bay, near Steyle Hook on the western side. 7 g ° 4 4 ' N , i 5 ° 4 o ' E .
26.00
•59 27.62
6.00 p . m. 6 . 1 0 »
j> »
B B
B B
0
2 0
5 0
I O O
1 3 0
1 4 7
B II I
E
R.B.
1.9
1.58 0.46
— 0 . 1 2
— 0 . 1 2
— O . I O
32.49* 33.20* 34^40
•52*
•56*
•75
•78
Sta t . 3 0 . Aug. I I , 1912. Outside mouth of Hinlopen Strait. 80° 7 'N, 17° 8 ' E .
26.78 27.16
•35
•58
.83
.90
.go •94 •94 •93 •94
Stat . 3 1 . Aug. 13,1912. 3 miles NNE (magn.) of Verlegen Hook. 80° 6 ' N , 16° 3 4 ' E .
1.15 a. m. 2 . 0 0 B
M »
B B
B »
I . I 5 ' B B
B B
B B
0
2 0
5 0
I O O
1 5 0
2 0 0
3 0 0
4 0 0
440
456
B II I E
R.B. II I E
R.B.
{
{
— I . O
—-0.75 — 0 . 6 0
0 . 6 1 [—1.72]
1 . 2 1 1.64 1.75 1 . 6 1
[ - 0 . 5 2 ]
1 . 6 2
33^27* • 77*
3 4 . 0 0 *
•37
. 7 2 *
• 85* .86*
/ •893* I •8g3* / •Sg \ •8g5*
10.15 a. m B B
B B
B B
0
1 0
2 0
4 0 48
r B II I
R. B.
0.8 0.81 0.21 1.25
33.02'-.25*
34.IO*
•33
26.49 .68
27.39 •51
Sta t . 3 2 . Aug. 13, 1912. 8 o ' ' i r ' N , I 6 ° 4 D ' E .
0.15 p .m. o B 0.90 32.93* 26.41 - .67
27.68
0
2 0
5 0
I O O
2 1 0
2 3 8
B II I E
R.B.
0 . 9 0
0.87 1 . 1 9
1.48 -1.54] 1.69
32.g3* 33^25* 34^54
•76*
.go* -94
1.50 p . m . 2 . 0 0 B
)» B
» B
» B
0
5 0
I O O
2 0 0
2 6 0
274
B II I E
R. B.
1.8
1 . 2 8
.•45 1.69
[ -1-53] i.6g
33^05 34^40*
•73*
.85*
-875'
4.20 p . m.
4-45 • i J)
j> »
0
5 0
I O O
2 0 0
2 4 0
B II I E
0-3
—0.4s 0.96
f 1.25 I 1^23
33^i4 .87*
34^57'
S t a t . 3 3 . Aug. 13, 1912. 80° 15 'N, 16° 48'E.
26.45 • 27.56
.82
.90
.92
S t a t . 3 4 . Aug. 13, 1912. 80" 2 3 ' N , 16° 50'E.
26.62 27.23
.72
Sta t . 3 5 . Aug. 13, 1912. 8 o ° 3 9 ' N , i 7 ° i 4 ' E .
26.32 27.29
•79
S t a t . 3 6 . Aug. 13&14, 1912. 80°36 'N, 16° 17'E.
25.94 26.58 27.46
'93 •93
•95
28.026
.024
9.00 p . m. » B
9 . 0 5 B 9 . 1 0 B
0
5 0
I O O
1 5 0 1 6 0
B R.B. R.B. R.B.
0 .6
0 . 0 7
0 . 8 1 1 . 3 0
32.79* 33.97 34^64*
•79
11.45 p .m. 1 1 . 5 0 B
0.45 a. m. B B
B B
B B
0 . 1 5 B
B B
B B
B B
0
2 0
5 0
I O O
1 5 0
2 0 0
3 0 0
4 0 0
5 0 0
580
6 2 0
B R.B.
II I E
R. B. II I
E
R.B.
{
{
0 . 7
0 . 4 0
1 . 2 3
I 37 1.46 1.49 1 . 7 1 1 . 7 2
1.68
1 . 4 1 1 . 4 0
0-43
32.25 i 33.11 34-27* ,
.795*
bo
bo
.90* / •gi* I •gi* 1 .93* I •925* ( .906*
I .904*
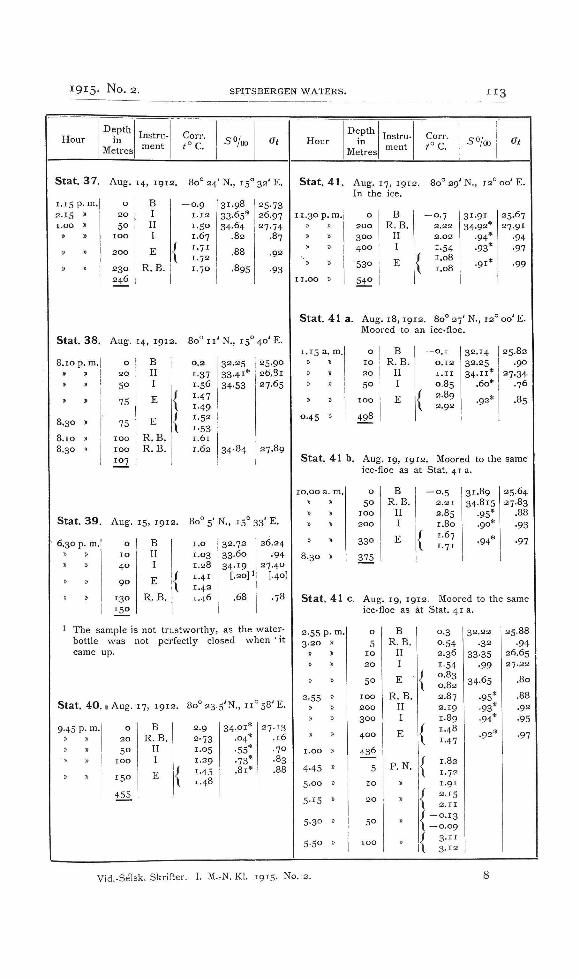
,1915- No. 2. S P I T S B E R G E N W A T E R S . " 3
H o u r D e p t h
in M e t r e s
I n s t r u m e n t
C o r r . t°C. S% Ot H o u r
D e p t h in
M e t r e s
I n s t r u m e n t
C o r r . t°C. 5 0 / 0 0 Ot
S t a t . 3 7 . A u g . 14 , 1 9 1 2 . 8 0 ° 2 4 ' N . , 1 5 ° 3 2 ' E .
1.15 p . m .
2 . 1 5 » 1 . 0 0 B
B B
B B
B B
0
2 0
5 0 I O O
2 0 0
2 3 0 2 4 6
B I II I
E
R . B .
- 0 . 9 1 . 1 2
1-50 1.67
r . 7 1
1.72 1.70
31.98 33.65* 34.64
. 8 2
.88
•895
2 5 - 7 3 2 6 . 9 7 2 7 . 7 4
.87
•92
-93
S t a t . 3 8 . A u g . 14 , i g i 2 . 8 0 ° 1 1 ' N . , 1 5 ° 4 0 ' E .
8.10 p. m. . B
» B
> B
8 .30 B
8 .10 »
8 .30 J
0
2 0
5 0
75
75
I O O
I O O
107
B II I
E
E
R . B . R . B .
0 .2
1-37 1.56 1-47 1.49 1.52
1-53 1.61 1.62
3 2 . 2 5
3 3 . 4 1 * 34^53
34-84
2 5 . 9 0 2 6 . 8 1 2 7 . 6 5
2 7 . 8 9
S t a t . 3 9 . A u g . 1 5 , 1 9 1 2 . 8 0 ° 5 ' N . , 1 5 ° 3 3 ' E .
6 , 30 p . m . o B 1.0 3 2 . 7 2 2 6 . 2 4
•94 2 7 . 4 0
[.40]
.78
1 T h e s a m p l e is n o t t r u s t w o r t h y , a s t h e w a t e r -b o t t l e w a s n o t p e r f e c t l y c l o s e d w h e n ' it c a m e u p .
0
1 0
4 0
go
1 3 0 1 5 0
B II I
E
R . B .
i . o
1.03 1.28
i . 4 1 1.42 1.46
3 2 . 7 2
3 3 - 6 0
3 4 - 1 9 [.20] 1
.68
S t a t . 4 0 . 1 A u g . 17 , 1 9 1 2 .
9 .45 p . m- 0
2 0
5 0 I O O
1 5 0
455
B R . B .
II I
E
B o ° 2 3 . 5 ' N . , i i ° 5 8 ' E .
2 7 . 1 3 . 1 6 . 7 0 •83 . 8 8
2 . 9
2 - 7 3 1-05 1.29
1-45 . .48
3 4 . 0 1 * . 0 4 *
•55* •73* . 8 1 *
S t a t . 4 1 . A u g . 17 , 1 9 1 2 . 8 0 " 2 g ' N . , 12° 0 0 ' E . I n t h e i c e .
2 5 . 6 7 2 7 . 9 1
•94
•97
1 1 . 3 0 p . m . » B
» »
» » I I . O O »
0
2 0 0
3 0 0
4 0 0
•530
5 4 0
B R . B .
II I
E
— 0.7 2 . 2 2
2 . 0 2
1^54 1.08 1.08
3 1 . 9 1 34.92*
•94* •93*
. 9 1 * •99
S t a t . 4 1 a . A u g . 1 8 , 1 9 1 2 . 8 0 ° 2 7 ' N . , 12° 0 0 ' E . M o o r e d t o a n i ce - f loe .
.15 a .m. B B
» B
» » B B
•45 »
0
1 0
2 0
5 0
I O O
498
B R . B .
II I
E
— 0 . 1 0 . 1 2 .1.11
0 . 8 5
2 . 8 9 2 . 9 2
3 2 . 1 4 3 2 . 2 5
3 4 . I I * . 6 0 *
. 9 2 *
2 5 . 8 2 . g o
27^34 . 7 6
•85
S t a t . 4 1 b . A u g . 19 , 1 9 1 2 . M o o r e d t o t h e s a m e
ice-f loe a s a t S t a t . 4 1 a .
2 5 . 6 4 2 7 . 8 3
1 0 . 0 0 a. m . B B
» B
B B
» 5>
8 . 3 0 >
0
SO I O O
2 0 0
330
375
B R . B .
II I
E
0 .5 2 . 2 1
2.85 1.80 1.67 1.71
3i .8g 34-815
-95* . 9 0 *
• 9 4 *
•93
•97
S t a t . 4 1 c . A u g . 19 , i g i 2 . M o o r e d t o t h e s a m e i c e . floe a s a t S t a t . 4 1 a .
2 . 5 5 P- m-3 . 2 0 B
2 . 5 5
I.OO »
4 - 4 5 »
5 . 0 0 B
5 -15 "
5-30
5 . 5 0
2 0
5 0
IOO
200 300
400
4 3 6
5
10
2 0
5 0
t o o
B
R . B . I I I
R . B . I I I
P . N .
0 .3 0 . 5 4 2 . 3 6
1-54 0 . 8 3 0 . 8 2
2.87 a.19 1.89 1.48
1.47
r.82 1.72 i . g i 2 . 1 5
2 . 1 1
— 0 . 1 3
— o.og 3 ^ i r 3 . 1 2
3 2 . 2 2
•32
33^35 •99
34-65
•95* •93* •94*
, 9 2 *
2 5 . 8 8
•94 2 6 . 6 5 2 7 . 2 2
.80
. 88
•92
•95
•97
V i d . - S e l s k . S k r i f t e r . I. M.-N. K l . 1 9 1 5 . N o . 2 .

1 1 4 FRIDTJOF NANSEN. M.-N. Kl.
Hour Depth
Metres
Instru. ment
Corr. t°C. s% Ot Hour
Depth
Metres
Instrument
Corr. t°C. S% Ot
Sta t . 4 2 . Aug. 19, i g i 2 . In the open sea a few hundred metres outside the ice-edge where the observations at Stat. 4 1 c were taken.
7.40 p . m.
7.00
2 0
50
75
1 0 0 1
300
R. B. II 1
P . N .
P . N .
3 . 8 0 2 . 8 2
3 . 1 4 2 . 2 7 ? 2 . 2 8 ? 2 . 1 7 ?
2 . 4 7 ? 1.87 1.87
3 4 . 0 8
•71 .89
[•57]
.89*?
%
2 7 . 1 0 .69 .80
•94
The messenger-lead was not heard to strike deeper than .at 75 metres. The line was then several times hauled up a few metres and let down again, but the striking of the messenger at 100 and 200 metres was not heard. Thus it is possible that the water-bottles at 100 and 200 metres may have been closed at some higher level during the hauling up.
Stat. 43 I.oo p . m .
Aug. 20, i g i 2 . 80° 20' N., 10° 4' E.
25.03 27.6g
.87
0
5 0 IOO 2 0 0
4 0 0
5 4 0
56.
B R.B.
II I E
P.N.
- 0 . 6
~ o - 3 9 1-79 1.83
1.35 1.38
1 . 5 1 I
3 1 . 1 3 3 4 - 4 3
- 8 3 * .90
• 9 1 *
. g i 6 *
•g3
•97
•96
1 The reversing thermometer did not register, and 'this temperature, given by the Nansen thermometer, is evidently too high, giving too low density. The hauling up of the water, bottle may have lasted so long that its insulation was spoilt, or it may have been closed at some higher level, but this seems less probable.
Stat . 4 4 . Aug. 24, i g r 2 . The mouth of the Ice-Fjord; about midway between northern and southern side. The fjord full of ice, the vessel was lying between the floes.
9.50 a. m. 1 0 . 2 0 ,, 5
10
2 0
5 0 IOO
2 0 0
380
418
B II I
P . N .
R. B. II . I E
P. N.
0 .8 1.02
1-59 [0 .79] 0 . 8 9
1-45 0 .62
- 0 . 1 6 - 0 . 1 2
0 . 7 4 0 . 7 6
3 i ^ 8 8
•99 3 2 . 1 6
-75
•77
3 3 . 9 4 * 3 4 . 4 0
. 6 2
.76*
2 5 . 5 8 • . 7 0
•75
2 6 . 2 8
. 2 5 2 7 . 2 3
.65
. 8 2
Stat. 45. Aug. 26, 1912 In Ice Fjord; near the southern side, just east of Green Harbour.
26.32 27 .01
0 . 4 5 p . m .
(f »
„ „
0
10
2 0
SO
I O O
1 7 0
194
B R.B.
II I
E
P.N. { !
1 . 2
2 . 0 7 1.64 0 . 8 5 0 . 2 6 0 . 2 6 0 . 1 2 0 . 1 2
3 I . 3 I 3 2 . 3 2 *
. 8 8 *
33^68
34^47
.62
Sta t . 4 6 . Aug. 26, 1912. In Ice-Fjord; outside the mouth of Advent Bay.
25.85 26.67 27.14
•50
.76
.81
3.50 p.m. w w
» n
It »
H W
II »
0
1 0
2 0
5 0
I O O
1 4 0
I.59
B R. B.
II I
E
P.N. { {
3^i 2 . 22
0 8 1 0 2 5
— 0 . 4 6 [ - 1 . 0 9 ] - 0 . 7 4
— 0 . 7 4
3 2 . 4 4 * 3 3 . 3 6
.84
3 4 . 2 4
•51
-56
Stat . 4 7 . Aug. 29, i g i 2 . The mouth of Ice Fjord, near its southern side, just north of „Festningen" (cf. Stat. 7).
. 1 5 a. m .
w n
1,
»
1,
M W
0
1 0
2 0
SO
1 0 0
2 3 0 1
2 5 6
B R. B.
II
I
E
P.N.
I . I
0 . 5 1 0.53 0.52
/ 0.85 \ 0.84 / —0.24 \ - 0 . 2 5 / [0.97J' I 0.571
32.39 .61
33-17*
•95*
34^43
•59*
25.97 26.17
.62
27.23
27.68
.76'
1 The observations at this depth seem doubtful- It is strange that the readings of the Nansen thermometer and the reversing thermometer do not agree, which might indicate that the water-bottle has not been closed properly at 230 metres, but during the hauling up. The salinity (and density) is also remarkably low.

1915- N o . 2 . SPITSBERGEN WATERS. " 5
Hour Depth
in metres
Instru- Corr. ment t° C. 5«/a Ot Hour
Depth in
metres
Instrument
Corr. t°C. -SO/ao Ot
Stat . 4 8 . Aug. 29, 1912. The mouth of Ice Fjord, about midway between „Fest-ningen" and Dadmanden, somewhat nearer the latter.
g.30 a. m. o t5 2.1 32.17 25.72 ~ ~ 26.68
9.45 " 50 J!- 0.49 34.12 27.39 i —O.QQ
. 7 0
•85
,87
.88
.89
.90
9-45 » 4 0 0 ' f.ss. -if ^ ; i L.05-J [.85]
10.30
a. m.
„ t>
II
W
1.
w
„ V
0
2 0
5 0
I O O
2 0 0
2 5 0
3 0 0
3 5 0
3 8 0
4 0 0 ^
4 2 6
B R . B .
E
II
I
E
I I
I
P . N .
P . N .
^ O .
— O.
— O.
f [ -o ,
. 1
. 1 0
4 9 . 3 3 3 4
. 2 3
•23 . 5 8 . 6 2 .8a . 8 1 . 8 8
•87 . 0 0
• 19I .11]
3 2 . 1 7
33^25 3 4 . 1 2
. 4 5 *
. 6 4 *
. 7 2 *
•75*
. 7 7 *
• 7 9 *
[•65*]
' Temperature and salinity prove that this depth must be wrong . It was not heard that the water-bottle was closed when the messenger was sent down. The bottle may either have been lying on the bottom, or there may have been some other irregularity, and the bottle has been closed during the hauling up, probably somewhere near 200 metres.
Stat. 4 9 . Aug. 29, 1912. Outside the mouth of Ice Fjord. 78° 5 ' N., 13° 12' E.
2.40 p . m .
2-45 1,
II »
» II
n II
0
2 0
5 0
IOO
2 0 0 2 4 2
B
E
II
I
R.B.
\
{ {
2 . 2
I . I O 1.12
2 . 4 7 2 . 4 6
— 0 . 2 2 - 0 . 2 3
0 . 3 0
3 2 . 1 2
3 3 . 0 4
3 4 . 0 3 *
. 3 8
.67
2 5 . 6 8
2 6 . 4 9
2 7 . 1 8
. 6 4
•84
Stat . 5 0 . Aug. 30, 1912. Bell Sound {Van Mijen Bay), inside Axel Island, a little north of midway between northern and southern side. 74° 44 'N . , 15° E.
2.00 p . m,
2.30 ,,
2.00 „
2.30 „
2.00 „
1/ II
2.30 ,
10
2 0
5 0
7 0
9 0
go
IOO I I O
B
II
E
E
I
R . B .
I
R . B .
0 . 2
0 . 3 8
0 .37 0 . 6 2 0 . 1 9 0 . 1 9 0 . 0 4 0 . 0 3
1.06
o^53 0-54 1.24
3 2 . 4 5
•53
•85
33^2S
. 4 2
34^25
•25
26.06
. 12
.37
•71
•85
27.58
.59
Stat . 5 1 . Aug. 31 , i g i 2 . Bell Sound (VanMijen Bay), midway between northern and southern side, farther in than Stat. 50. 7 7 % 6 ' N . , i 5 ° 2 5 ' E .
25-45
2 6 . 3 0
2 . 5 0 p . m .
n n
H »
II II
II II
0
2 0
SO
7 0
9 5 1 0 5
B
E
II
I
R.B.
o . i 0 . 0 3 0 . 0 3 0 . 1 8 0 .17
— 0 . 2 2 — 0 . 2 2 — 1 . 2 0
3 1 . 6 7
3 2 . 7 3
33^2 i
•67
3 4 . 2 4
•67
27.06
•58
Sta t . 5 2 . Aug. 31 , i g i 2 . Bell Sound, outside Axel Island. 7 7 ° 4 i ' N . , 14° 3 4 ' E .
. 3 0 p . m .
.,
II
J) w
1, ,1
0
2 0
5 0
7 0
I I O 1 2 0
B
E -
I I
I
R . B .
- 0 . 1 i.36 1.20] .18 16
—o.og 39
0 . 2 1
/ 0.0 \ [0.2 / o.iE \ o.ie ( —o.og \ —0 .09
32-77
33^38
34^25
•43
•64
26.33
27^5i
.67
. 82

i i 6 FRIDTJOF NANSEN. M.-N. KI.
Hour Depth
in Metres
Instrument
Corr. i '°C. -SO/oo Ot Hour
Depth in
Metres
Instru-1 ment 1
Corr. t°C. SO/oo Ot
S t a t . 5 3 . A u g . 3 1 , 1912. Outside Bell Sound, wes t o fCapeLye l l . 77°33 'N. , i 3 ° 2 8 ' E .
25.86
27.44
•75
•83
Sept. I, 1912. 77° 18' N., 13° 5 1 ' E.
0.00 a.m. ' o j B j 0.2 I 33.51 I 26.92
S t a t . 5 4 . Sept. I, 1912. Outside Horn Sound. 76° 57' N., 15° E.
9 . 0 0
"
9.30
9 . 0 0
9.30
9 . 0 0
9 3 0 9 . 0 0
). m .
11
»
II
II
II
„ II
0
2 0
2 0
5 0
5 0
I O O
I O O
1 3 0
1 4 6
B
E
II
II
I
I
R. B. R. B.
— 0 . 3 / 1.65 I 1.64 / I . I I
\ 1 .03? / o.og I 0.07 i — 0 , 0 2
\ — 0 . 0 3
/ 1.04
\ ^•03 1.03 0 . 6 7
3 2 . 1 7
[34^38]
34.16
.61
.68
.35 a. m.
„
II »
II II
II II
0
2 0
5 0
85
I I O
125
B
E
II
I
R . B .
- 0 . 5 / - 0 . 2 4 \ - 0 . 2 3 / — 1 . 0 7 \ — 1 . 0 8 / — 1 . 1 9 \ - I . I 8
-0.98
33-07
.27
34^25
.46
•54
26.59
•74
27.58
-75
. 81
6 . 0 0 a. m .
76° 52 ' N., 14" 50 ' E.
o I B I —0.3 I 32.52 I 26.14
S t a t . 5 5 . Sept. 1, i g i 2 . 76° 40 'N. , 14^25 'E .
8 . 1 0 a. m. 0
2 0
5 0
I O O
1 3 0
1 4 6
B
E
II
I
R. B.
{::: 0 . 6
0.54 0.55 1.25 r.26 0.57 0.57 0.54
32.g6
-99
34-36
.76
. 8 0
1 0 . 0 0 a. m.]
7 6 ° 3 i ' N , 14° 7 ' E .
o I B I - 0 . 3 I
2 6 . 5 1
.53
27.68
• g o
•94
32.88 I 26.43
Sta t . 5 6 . Sept. I , i g i 2 . 76° 22 ' N., 13° 25' E.
0.15 p .m.
I.OO „
1.40
0 . 1 5
1.40
0 .15
2 0
5 0
1 0 0
2 0 0
3 0 0
5 0 0
[700]
[700]
[900] 1 0 2 0
B
E
II
I
E
E
II
I
II
R . B .
2 . 8
4 . 2 8
4 . 3 1 5-45 5^46 4.48 4.46 3.37 3.38 2 . 7 2
2 . 7 3 1.63 1.61
[5^38] [5.37] [2.86] [2.86] [3^43]
33-76
34-43
. 9 0
3 5 - 0 2
. 0 1
34-97*
•91*
[•953
[35^oo]
[o.r*]
26.g4
27.32
•56
•77
.88
.91
•95
4.20 p.m.I
6.10 p . m.[
7 6 ° i 2 ' N . . i 3 ° 3 i ' E . .
o I B I 5 o t 34.93 127.64
76° 3 ' N., 13° 14' E.
o I B j 4-4 I 34-62 127.46
^ These observations are wrong. The messenger was not heard striking at these depths, and the water-bottles have evidently been released during the hauling up at depths between 50 and 300 metres as is proved by the temperatures and salinities.
Stat . 5 7 . Sept. i , i g i 2 . 75° 58' N., 13° 5' E.
27-64
•64
.85
.91
•97
. 0 0 p . m .
,1 1,
II
II II
„
•45 ,1
II „
1, „
„ 1,
0
50
I O O
2 0 0
3 0 0
4 0 0
5 0 0
7 0 0
goo
B
E
II
I
R . B .
E
II
I
R . B .
S-i 5^24 5.28 3 9 2 3.92 3.06 3.06 2 . 2 8 1.68
1.71 1.22 1.21
o.og 0 .07
0 .84
34-94
.g6
35-04*
. 02*
. 0 0
[.18] 1
34.92*
. 9 1 *
/ .896* \ .8g4*
1 The glass-bottle was cracked.

I9I5- No. 2. SPITSBERGEN -WATERS. 117
SURFACE OBSERVATIONS
Date and Hour
Sept. I
g.30 p . m. 1 1 . 0 0 „
Sept. 2
4.30 a. m. 8.00 „ 1.00 p . m .
4-00 „ 1 0 . 0 0 „
Sept. 3
6 . 0 0 a . m . 1.00 p . m .
3 0 0 „
8.30 „
Sept. 4
0 . 0 0 a. m . 5 0 0 „ 8.00 „ 0 . 0 0 p . m . 4.00 „ 8.00 „
Sept. 5
8 . 0 0 a. m .
Lat. N
75° 5 1 ' N 4 1 '
75° g' 74° 49 '
2 0 '
T '
73° 27 '
- 72° 43 ' 1 4 '
71=59' 36 '
71° i g ' 70° 58'
44' 2 4 '
4' 69° 48 '
69° 28 '
Long. E
13° g ' E 14'
0 ^l
13 36 47 '
14° 3 ' 1 2 '
28 '
14° 50' 15° 4'
1 1 '
2 1 '
15° 28' 36 ' 4 1 ' 49 ' 57 '
16° 3 '
16° 20' E
t°C.
4.8 5.3
5.6 5.3 5.9 6.0 6.0
6.8 8.0 7.9 7.2
7.6 8.5 8^9. 9.0 8.8 8.8
8.0
SO/oo
34-93 ' .g8*
3 5 0 2 * . 0 2 *
. 0 1 *
. 0 1 *
. 0 2 *
34-99* .85* •89 .70
. . 34^89* -85* .80* •45 .89* .56
34-32
Ot
27.66 •64
27.64 .68 .60 .58 •59
27.46 .18 . 2 2
• 17
27.27 . 1 0
. 0 0
26.71 27.08 26.83
26.76

" 8 FRIDTJOF NANSEN. M . - N . K l .
TABLE II gives the Ctirrent-MeaSttrementS, taken on board the Veslemay, in August, 1912.
1st Column. Date, Hour, and Duration of the measurements. Central European Time.
2nd Column. Depth in Metres. A line under the number indicates bottom.
}rd Column. Number of Current-meter used.
4th Column. Number of Revolutions of the Propellor registered.
Jth Column. Velocity, in cm. per second, of the Relative Movement, computed from
the reading of the instrument.
6th Column. Number of Balls fallen in the Compass Box, and Directions (magnetic)
registered, from which the water moved relatively to the ship.
yth Column. Depth in Metres of the Real Current (or Drift) observed.
Sth Column. Velocity, in cm. per second, of the Real Current, computed from the
measurements.
pth Column. Direction (true) towards, which the Real Current moved, as computed
from the measurements.

1915. No- 2. SPITSBERGEN WATERS. 1 1 9
Date and Hour 1912
4 August
1.42 —1.52 a. m.
2 00 J
2 . 3 0 - 2 . 5 0 »
» 0 ;>
11.25—11.35a.m.
» » » 0.19 — 0.39 p. m. 0.46 — 1.06 *
1.45 ' 2-00—2.30 »
» »
3.13 — 3.23 .
,
3 . 4 1 - 3.51 »
1 . »
4.06—5.06 3
)) /. *
5-27 -5 -37 '>
6.20 — 6.40 > w J »
7 . 0 9 - 7 . 1 9 »
Depth in
Metres
2 0 ^
6 2 6
5 6 0
5 0 5 0 5 0 5 0
IOO
620^
6 0 0
Instrument
4 9
4 9
5 2
4 9 5 2 4 9 4 9
4 9
' 50 ' 52
5 0 4 9
20' ' ; 52 !
50 : 49
2 0
5 0
5 2
4 9
10 52
IOO 49
5 6 0
5 0 4 g 5 2
20 49
Revolutions
2 9 5
6 a o
10
0 0 0
1 3 4
8 1 6
8 1 9
3 0 0
5 0 1
192
3 1 4
7 4 0
1920
180^
10
74 2 5 6
cm./sec.
13.8
14-3
I 0 0 0
4
12.7
12.g
13.9
2 3
9 .2
14.7
6-3
15
8.7
I . I
2 5 12
Number of Balls, and Direction
I N 20° E 7 N 30° E
2 N i o ° W 2 N 3 N i o ° E 2 N 20° E 0
0 0
- 0 3 S 60° W i N 8 o ° W - 2 2 N 6 o ° W 3
I S 20° W 3 S 3 o ° W 3 S 7 0 ° W 7 S 80° W 4 S 30° W 6 S 40° W
3Sso°W i S 5 o ° E ? 4 S 2 0 ° W 5 S 3 o ° W 9 S i o ° W 3 S 2 0 ° W 3 S 20° W I S 30° W I S 50° W 3 S 5 o ° W 5 S 6 o ° W I S 20° W 2 S 3 o ° W i S 4 o ° W 6 S 50° W 2 S 60° W 2 S 70° W i S
I 2 S 2 0 ° W 2 S 30° E I S 20° E i S i o ° E I S 30° W i S
4 S 30° E
Current
Depth in
Metres
0
5 0
0
SO
0
SO
3 S 20° E
Velocity cm./sec.
14
14
12.7
5-1
I . I
1.6 .
True Direction (towards)
N 7 ° W
N 7 ° W
S 5 o ° W
N 3 g ° W
S i 7 ° W N 3 2 ° W
1 This depth may possibly have been 50 metres instead of 20 metres. 3 These balls may be doubtful as by an accident the propellor was turned by the
wind about 60 revolutions after the instrument came on deck. 3 The sounding-line w a s deflected towards NE by E (magnetic). 4 This depth may possibly have been 10 metres instead of 20 metres. 5 The instrument registei-ed 920 revolutions, giving a velocity of 40.9 cm. per second,
which is evidently much too high and does not agree with the four balls fallen m the compass box. It had probably been forgotten to adjust the registration of the instrument after the previous observation (at 4.06—5.06 p. m.), and 740 has therefore to be substracted, giving 180 revolutions, which also agrees wi th the number of balls (4) fallen in the compass box.

FRIDTJOF NANSEN. M.-N. Kl.
Date and Hour 1 9 1 2
4 August
7 . 0 9 — 7 . 1 9 p . m .
g . 2 o - g . 3 0 ».
" 5 August
0 . 1 8 p . m.
0 . 2 8 » 0 . 3 8 »
0 , 4 8 >i 0 . 5 8 » 1.08 » 1.18 »
0 . 2 8 — 0 . 3 8 11
0 . 5 6 — 1.06 »
1.13 — 1 . 2 5 >
1 .31.^—2.12 »
3 . 0 2 — 3 . 1 2 » 3 . 1 6 — 3 . 2 6 »
3 . 2 g — 3 . 3 9 » 3 . 4 5 - 3 . 5 5 » 4 . I I — 4 . 2 1 »
4 . 5 8 - 5 . 3 0 »
3 . 1 0 »
3 . 2 0 .1
3 . 3 0 » 3 . 4 0 >
3 . 5 0 » 4 . 0 0 » 4 . 1 0 » 4 . 2 0 >
5 . 5 7 - 6 . 0 2 ^ » 1
6 . i g — 6 . 2 g } »
1 The wind it in the day.
Depth in
Metres
1 0
5 6 0
S O
5 7 2
Instrument
5 2
49
5 2
613 m. line 658 » . 7 2 3 » » 7 8 2 1 >v 9 0 5 > »
lOOI » »
5 0
1 0
2 0
5 0
1 0
2 0
so I O O
5 4 0 2 0 0
575
49
49
49
49
49 49 49 49 49 49
591 m. line •700 » »
785 » » 8 8 0 » »
1 0 2 5 > J I IOO » » 1 2 2 0 » »
2 0
5 2 0
49
49
icreased and b It increased p
Revol. utions
386
1 4 6
73
cm./sec.
17.7
7-3
Number of Balls, and Direction
5 S 90° E 7 S 80° E
ss i S i o ° W
4 ! I S 80° E
i paid out^
» » » » . » » 3 S
H »
sounding-line . deflected towards
N 3 9 ° E
2 2 1 10 .4
2 4 0
3 7 0
4 2 8
I I . 2
2 S 8 0 ° W I S 9 0 ° w I N 7 0 ° W
I N 6 0 ° W 2 N i o ° W 2 S Qo° E 3 S 80° E
14.3
5.6
0
0
0
u
0
1 2 2 6
0
0
0
0
0
17 .5
paid ou t ' » » » I
» » » J
» » » J
2 9 0
3 4 2
2 S 6 0 ° E 2 N 4 o ° E I N 5 0 ° E I N 6 0 ° E 2 N 7 o ° E
I N 8 0 ° E 3 S 9 0 ° E I S 6 0 ° E 3 N 9 0 ° W 6 N 8 0 ° W I N 5 0 ° E I N 6 0 ° E 2 N 7 0 ° E
0
0
0
0
0
4 S i o ° W 6 S 20° W I S 30° W
sounding-line • deflected towards
N 3 4 ° E
2 3 . 8
1 5 . 3
5 S 3 0 ° W 2 S 40° W 6 S 20° W 4 S 30° w
ecame S S W after having bee robably to about 5 or 6 metres
Current
Depth in
Metres
0
S O
0
0
0
0
0
0
Mean
5 0
0
0
0
0
0
0
0
0
Mean
0
n W b y per se
Velocity cm./sec.
7.3
7.8
True Direction (towards)
S i i ° E
S i g ° W
36.7 17 .2
19 .5 15 .0 2 7 . 2 2 0 . 1 7
2 2 . 6
15 .4
S 2 6 ° W s
» * > n
S 6 ' ' E
i
i
0
2 1 . 3
4 4 . 9 2 2 2 . 5 2 1 . 7 30 .4 15 .0
23 -4
2 5 . 6
1 5 . 3
0
S 2 I ° W 1
t
» > 9
>
S i i ° W
S (magn.) earlier cond.

i9i5^ No. 2. S P I T S B E R G E N W A T E R S .
Date and Hour 1 9 1 2
Depth in
Metres
Instrument
Revolutions cm./sec.
Number of Balls, and Direction
Current
Depth in
Metres
Velocity cm./sec.
True Direction (towards)
5 August
6.40 p. m.
6 . 5 0 J
7 . 0 5 » 7 . 1 0 » 7 . 2 0 » 7 . 3 0 » 7 . 4 0 i>
7 -50 ' 8 . 0 0 » 8 . 1 0 » 8 . 2 0 1
7 . 2 5 - . 7 3 5 »
7 . 4 7 - 7 - 5 2 »
8 . 1 5 ^ - 8 . 2 2 >•
JO « J ^
8.46—8.56 -
8 . 4 7 - 8 . 5 7 •>
9 . 1 6 — 1 0 . 0 1 »
1 0 . 3 1 — 1 0 . 4 1
11 .01 — 1 1 . 3 4 ^ »
587 ' [682] m. line paid out,
but too much therefore hauled in again till tight.
661 m. line paid out 6 7 2 H » S 5)
7 0 3 > " 7 3 2 . » » » 767 . . « " 783 \ The lead has 783 \ evidently been 783 f dragged along 783 J the bottom 2
50
20
100
10
20
5
300
20
520
SO
20
20
520
49
53 49 53
49
53
49
53
49
53
49
53
49
515
300
204
153
206
265
126
130
1060
1662
545
510
732
Sounding-line deflected towards
N 3 g ° E
23.2
14 .7
18 .6
1 5
14 .6
19 .3
6.4
17 .7
24.4
24
10.4
S70°W S8o°W N 8 o ° W S 7 0 ° W N 4 o ' ' W N 3 o ° W N N i o ° E S 40° W ? N N 3 0 ° E N 4 0 ° E S3o°W S40°W S 6 o ° W N i o ° W N 4 o ° E N 5 Q ° E N 6 o ° E S6o°W S 7 o ° W S8o°W N 5 o ° W N 4 0 ° W N 3 o ° W N 2 o ° W N 4 o ° E N 5 0 ° E N 6 o ° E N 4 o ° E N 5 o ° E S 3 o ° E S 2 o ° E S i o ° E S S3o°W S 4 0 ° W
20. r
7-7 10.0
8.8 8.8 3.0?
S26°W D
» » » :»
5 0 16 .7
10.4
S 5 5 ° W
S 2 0 ° E
S i 8 ° E
1 This sounding and measurement of surface-drift was made with a lead of 20 kilogram and single steel-wire (piano-wire).
2 During the hauling up, the steel-wire snapped, and the lead was lost. 3 The ice became closer by this time. * The ice was fairly open.

1 2 2 FRIDTJOF NANSEN. M.-N. Kl.
Date and Hour 1912
5 August
i r .01 -11 ,34^ p .m.
Depth
in Metres
2 0 0
Instrument
53
Revolutions
674
6 August
0.41 —0.46 a. m.
> H I )
18 August
0.45 a. m.
^.45 — 1.55 »
50
1 0
498I
470
1 » , » 1 2 0
2.31 — 2.41 » 470 » = 1,
3.04 — 3.14 >
3 . 3 7 - 3 . 4 7 »
,
3.58 — 4.08 »
4.14 — 4.24 » ^
50
450 I O O
450
2 0
1 0
450
SO
49
53
•
275
330
49 , 582 -
53 664
49 1 480 53 189
4g 53
49
53
53
49
53
522 25s
430
586
380
301
232
cm./sec.
10.2
24.8
30.6
26
31
2 1
1 0
23.5 13
19.5
27.5
18
14
1 2
"Number of Balls, and Direction
4 S 60° E 4 S 50° E 2 S 4 o ° E I S 30° E i S I N 60° W
6 S 50° E I S 30° E I S 80° E 4 S 70° E 3 S 60° E
I N 40° E
I N 50° E 3 N 4 0 ° E
I 2 N 5 0 ° E 14 N go° E
4 S go° E I S 80° E
13 S 70° E 6 S 50° E I S 40° E 6 S 60° E 4 S 50° E I S 10° E
i 3 S 3 o ° E I S 20° E 7 S 3 s 10° v\r I S 60° E 1 S 30° E 2 S 10" E 2 S l O ° W I S ao^ W I S 30° W I S 40° W I N 80° W 4 S 80° E 3 S 70° E
Current
Depth in
Metres
2 0 0
0
2 0
0
50
0
I O O
0
2 0
1 0
0
50
Velocity cm./sec.
7.2
26
5-3
2 1
I I
23.5 12 .2
i g
12.5
7 5
I I
15.5
True Direction (towards)
S 5 o ° W
N 3 3 ° E
S 5 2 ° W
N 7 8 ° E N 7 6 ° E
S 8 2 ° E N 7 6 ° E
S 6 4 ° E
N 4 ° W
N 2 4 ° E
S 3 ° E
S 4 8 ° W
1 During the following 10 minutes 37 metres line more had to be paid out (so that 535 metres line was out). This would correspond to a drift of about 35 cm. per second, provided that the line was kept perfectly straight be tween the ship and the lead lying on the bottom, which, however, could not be the case. The direction of the deflection of the line could not be seen for the ice.
2 This high number of revolutions does not agree with the fact that two balls only had fallen in the compass box, which correspond to about 82 revolutions. If we assume that something has unduely increased the registered number of revolutions, and that the number given by the balls is more correct, w e would obtain a velocity of 4.7 cm. per second. It might, however, seem more probable that something has happened to the balls, preventing more balls from falling.
• The ice now became slacker.

igis- No. 2. SPITSBERGEN WATERS. 1 2 3
Date and Hour 1912
18 August
7.00 — 7.103. m.
7.15 7.21 —7.31
7.48-758 »
i . 5 2 - 8 . 5 7
9 0 9 - 9 . 1 3 + » 9.22—9.27 > 3
» » s
12 noon
0.20—0.25 p. m.
1.33 —1.38
2.35 — 2.40
2 .51—301
Depth in
Metres
340
20
3 4 0
300
50 300 IOO
10 300
20 400
350
20
Instrument
49 53
S3
49
53 49 53
53 49 53
49
53
Revolutions
350
50
350
1 0 0
49
S3
49
53
53
340 (?) 1054
710
852
578 364 392
420 370 460
322
280
388
145*
214
250
cm./sec.
i6 (? ) 48.5
28.5
38
27
32.5 36
43 33 42
3 0
35.5
13.4
12.5
Number of Balls, and Direction
[ i N 2 0 ° W ]
2 S 5 S i o ° V \ ^ 7 S 20' ' W
I N 40° W I N 30° E I N 80° E I S 60° E 6 S 60° W 7 S 7 o ° W 4 S 50'' W
i o S 8 o ° W I S i o ° W ' I S 20° W 5 1 S 60° W 2 S 70° W 5 S 80° W
10 N 80° W 11 S 90° W 13 S 70° W
4 N 60° W 3 N 50° W 3 N 50° W 4 N 40° W I N 30° W 7 N 50° W I N 30° W 1 N 60° W 9 N 50° W 2 N 40° W 2 N 50° W 2 N 4 o ° W 4 N 40° W I N 30° W I N 20° W I N 10° W 6 N I N 30° E
Current
Depth in
Metres
Velocity cm./sec.
i6(?)
32
38
50
True Direction (towards)
S 3 3 ° W ( ? )
N 2 8 ° W
S 5 3 ° W
13.8 32.5 10.6
S 8 4 ° W S 68° W N i 7 ° W
13.7 33 15.6
19.9
11.3
24.g
10.5
13.4
7.0
S 5 4 ° E S 78° W N i 2 ° E
N 6 8 ° W
S 3 2 ° E
N 6 o ° W
S 6 4 E
N 5 7 ° W
S 2 7 ° E
S 6 4 ° W
450 metres of line were run out, but the line was much deflected towards NE (magn.) and a sounding taken afterwards at 7.15 a. m. gave a depth of 340 metres only. Hence the current-meter had been dragged along the bottom, and the registered direction is erroneous as the deflection of the line indicated a rapid drift of the ship towards S W (magn.) that also agrees well, with the observations taken at 4.14 — 24 a .m. and a t 7.48 — 58 a. m. The registered number of revolutions of the propellor is probally also too low. After the first messenger had released the propellor, the current-meter was hauled up some 20 metres, by a mistake, and then lowered to 100 metres again. It is therefore possible that the first registered directions are not trustworthy. At this time and also earlier in the morning and night the wind was NE by N (magn.). The registered number of revolutions was 425 (giving a velocity of 38 cm./sec.) that is too high as compared with the number of balls fallen in the compass box. It seems probable that the registration of the instrument had not been adjusted after the previous observation, and 280 would then have to be substracted from 425 giving 145 revolutions, that agrees well with four balls fallen.

1 3 4
Date and Hour 1 9 1 2
18 August
3 . 0 4 — 3 . o g p . m . l
» 3 . 2 6 — 3 .31 »
» n »
4 . 3 0 »
4 . 4 1 - 4 . 4 6 » » )» v>
4 . 5 7 - 5 . 0 7 '
5 . 1 2 - 5 . 1 7 »
5 . 2 7 - 5 - 3 7 " 5 . 4 2 - 5 . 4 7 •
» J D
5 . 5 g - 6 . 0 4 »
6 . 1 2 — 6.17 »
8 . 3 0 »
8 . 3 0 - 8 . 3 5 .
» .. » g . 3 5 - 9 . 4 0 » ^
» » ))
9 . 5 1 - 9 . 5 6 • 1 0 . 0 5 — 1 0 . 1 0 *
> t n
10 .20 — 1 0 . 2 5 »
1 0 . 3 4 — 1 0 . 3 9 » ">
» » »
19 August 1.15 a. m .
1.22 — 1 . 2 8 1 » 11 »
Depth
in Metres
3 5 0 2 0
3 5 0
5 0 5 i o 2
4 5 0 2 0
1 0
4 3 0 5 0
2 0
4 0 0
5 0
I O O
4 2 0 2 0 0
5 2 0 8
4 5 0 1 0
4 0 0
5 0
1 0
4 0 0
I O O
2 0
4 0 0
2 0 0
5 0 2 '
4 5 0 5 0
Instrument
4 9 ' 5 3 4 9
5 3
4 9 5 3
'53
4 9 5 3
5 3 4 9
5 3
5 3
4 9 .53
4 9 S 3 4 9
5 3
5 3 4 9
5 3
S 3
4 9
5 3
4 9 5 3
F R I D T J O F N A N S E N .
Revolutions
152
1 4 3 r o o
1 4 6
0
3 3 4
4 1 8
0
1 4 1
7 5 0 I O O
164
1 9 6
1 6 8
1 4 5
147 4 8
2 0 0
4 6 8
2 9 6 2 0 2
3 3 5
3 8 5
2 0 1
2 4 2
6 55
cm./sec.
14 14
9-5
1 4 . 5
0
2 8
2 0
0
14
3 4 - 5 9 .5
16
18 .5
I S S 14
13.7 5.7
18 .5
4 3
2 8 18 .4
3 1
3 5
18 .4
22 .7
i . 5 5-5
N u m b e r of B a l l s , a n d D i r e c t i o n
4 N 5 0 ° W 4 N i o ° E
2 N 5 0 ° W I N 4 0 ° W 4 N 3 0 ° W
8 S i o ° W 2 S 2 0 ° W 5 S 4 0 ° w 8 S 5 0 ° W
2 S 2 0 ° W 2 S 3 0 ° W
i 5 S i o ° W
1 S 2 0 ° W 2 S 3 0 ° W
2 S 10° W I S 2 0 ° W I S 4 0 ° W 4 S 5 0 ° W
[ i N 5 o ° E ? ]
5 S 3 0 ° W 1 S i o ° V \ r 2 S 2 0 ° W 2 S 3 0 ° TO
S S 7 0 ° W I S 9 0 ° W 3 S 5 0 ° W
3 S 6 o ° W 12 S 7 0 ° W
I S 8 o ' ' - W I S g o ° W
8 S 80"^ W 3 S 8 0 ° W 2 S 9 0 ° W I S 7 0 ° W
' 9 S 8 0 ° W 3 N 9 0 ° W 7 N 8 0 ° W 2 N 7 0 ° W
4 N 7 0 ^ W 2 N 6 0 ° W 5 N 9 0 ° W 2 N 8 0 ° W
I N 7 0 ° W I S g o " W
M.-N. Kl.
Current
Depth in
Metres
0
2 0
0
5 0
0
2 0
1 0
0
5 0
2 0
0
5 0
I O O
0
2 0 0
0
1 0
0
5 0
1 0
0
TOO
2 0
0
2 0 0
0
5 0
Velocity' cm./sec.
14 14
9 .4
6 .1
0
2 8
2 0
0
14
3 2 . 8
9-5
7
6.7
15 .5 2-5
13.7 8.5
18
2 6
10.2 1 8 . 2
13
16 .4
18.2
8.4
J-S 4
True Direction (towards)
N 6 2 ° W
S 58° M? N 5 g ° W
S i 5 ° E
N
N 3 4 ° E
N i 3 ° E
N i ° W S i 5 ° W
N i g ° W
N 77° E
S 18° W S 6 7 ° W
S 5 8 ° W S 4 5 ° W S 4 3 ° W
N 7 2 ° E
N 8 2 ° E S 72° W
N 6 i ° E
N 8 3 ° E
N 7 g ° W
N 3 i ° E
N 8 2 ° W N 72° E
1 At this time the ice was moderately tight. ^ The sounding-line was hanging vertically till it was hauled up. The ice was very tight. ' The sounding-line w a s much deflected towards NE indicating a rapid drift of the
ship towards S W (magn). The ice was very open. * The ice was unusually open, with big open lanes. •'' The ice was still open. 8 The sounding-line remained vertical. No wind ; earlier there had been a northerly
and north-noi'th-easterly wind.

1 9 1 5 - N o . 2 . SPITSBERGEN WATERS. I 2 ~
Date and Hour 1 9 1 2
Depth in
Metres
Instrument
Revolutions
i./sec. Number of Balls, and Direction
Current
Depth in
Metres
Velocity cm./sec.
True Direction (towards)
19 August
1.59 — 2.04 a. m.
2.03 — 2.08 2.13 —2.18
2.28 — 3.33 2.42 — 2.47
2.52 — 2.57
6 .11
6 . 0 0
-6.16
6.26 — 6.31
6.36 — 6.41
6 . 5 1 - 6 . 5 6 7 . 0 1 ^ - 7 . 0 6
8.30
8.56 —g.01
9 . 1 0 - 9 . 1 5
g.2i —9.26
9.31—9.36
0
I
.04-
.10-
-10.09
1.00
-1 .15
10 400 IOO 200
20
424
350
50
20
350
IOO
10
10
375 320
50
320
320
4 3 ^ ' 400
50
53
53 49 53 53 53
53
49
53
53
49
53
53 53
49
53
53
53
49
53
49
49 53
126
172 29
205
170
245
288
383
258
286
344 325
400
400
243
365-
379
396
186 246
12.5
16.5 3-5 o o
I9.S
16.5
27
35
23
26,5
32 33
25
37
37
23
33
35
35
17 23
1 N 70° E 2 N 80° E I N 90° E 5 S 50° W o
4 S 50° E 2 S 40° E 4 S 70° W 1 S 2 0 ° E ( ? )
2 S 20° W 6 S 30° W
6 S 10° W I S 3 o ° W 2 I S 40° W 6 S 30" W 2 , S 4 o ° W I S I S 10° W I S 20° W 5 S 30° W
3
I S 50° w 7 S 60° W
7 S 70° W I S 80° W
10 S 80° W I S go° W 7 8 70° W 3 S 80° W I S go° W 1 N 70° W 3 S 80° W 3 S 90° W 2 N 8 o ° W 2 S 70° W 7 S 80° W 2 S go° W g S 80° W 1 S go" W 5 N go° W 7 N 80° W
5 S 70° W 5 S 70° W 2 S 80° W
1
20
10
0
IOO
200
20
10
0
5 0
20
0
IOO
10
14
15.2
3.5 3-5 4 17.6
11.9
21.g
10.4
12.7
22.g
5
13.2
50
20
50
25
12 .g
10.5
32.8
34.8
n 6.1
S 6 5 ° W
N 4 2 ° E ?
S i o ° W ? S ? N 7 g ° W
N 68° E
S ^ i 6 ° W
N 5 6 ° W
N 3 i ° E
S 2 I ° W
N 4 8 ° W
N 8 2 ° E
S 5 9 ° W
N 8 8 ° E
N 7 g ° E
S4o°W
S 6 8 ° W
N 7 g ° E
S 8 4 ° W
S 5 8 ° W N 7 o ° E
1 The ice fairly open. W e have approached the open sea at the ice-edge. 2 W h y only two balls had fallen is uncertain, it may either be some mistake in the
journal, or there may have been some fault in the registration of the balls. 3 The magnetic needle of the compass-box was out of place. 4 The registered number of revolutions was 647, but that is evidently erroneous as
only I I balls had fallen. It had probably been forgotten to adjust the registration of the instrument after the previous observation and 282 has to be substracted. W e then obtain 365, which is a probable value.
5 The sounding-line was deflected towards E by N. The wind was W .

1 2 6 FRIDTJOF NANSEN. M.-N. Kl.
Date and Hour 1912
Depth
Metres
2 0
4 0 0
l o o 1 0
3 3 0
SO
Instrument
53 49 53 53
49
53
Revolutions
0
37 1 2 8
48
1401
2 0 3
cm./sec. Number of Balls, and Direction
Current
Depth
Metres
Velocity cm./sec.
True Direction (towards)
ig August 1 .25- 1.30 p .m. 1 .39-1 .44 :>
1.57—2.02 »
6.15 — 6.20 »
4 13 5.6
13
19.5
I N 80° W 3 S 80° W i S 90° E(?) I S 10° E 2 S I S 10° W I S 20° W 4S I S i o ° W
50
9.5 4 9-4
13
6.7
S 7 3 ° W S 8 8 ° W N6o°E
S 4 ° E
N 2 2 ° W
1 This observation was made just as the ice-floes began to tighten round the vessel, and in order to avoid being nipped, w e had to make our way out of the ice as soon as w e got our instruments hauled up. In the hurry the current-meter No. 49 was then placed on deck before read off, and unfortunately its propellor was turned backward by the wind, and the registration was spoilt. But according to the number of balls (4) fallen, it ought to have been about 140, giving a velocity of about 13 cm./sec.

i g i S - N o . 2 . SPITSBERGEN WATERS. 1 2 7
TABLE III
gives the measurements of the O x y g e n in the Sea-Water , taken during the cruise with the
Veslemoy, in July to September 1912.
1st Column, Depth in Metres.
2nd Column, t" C. Temperature (Centigrade) of the Sea -Wate r in situ.
jrd Column, S'^joa. Salinity (in per mille) of the Sea -Wate r .
4th Column, Og cc. Quantity of Oxygen observed, expressed in cc. per liter of
Sea-Water .
Jth Column, O2 "/Q. Percentage of Saturation, i. e. the relation, expressed in per cents,
between the observed quantity of Oxygen and the quantity which the same sea-water could
absorb at the same temperature and at the pressure of one atmosphere, if fully saturated,
according to Chas. J. J. Fox's Table.

1 2 8 FRIDTJOF NANSEN. M.-N. Kl.
Depth in
Metres
t° c. in situ -S»/oo
Og cc. per
1000 cc. of Sea-W a t e r
O3 "/o of
Saturation
Sta t , 1 0 . July 21 , i g i 2 . At the mouth of Ice Fjord.
2 0
75 3 0 0
0 . 7 5 — 0 . 4 1
1.03
3 4 . 1 6
•54 .78
8.34 7-47 7.17
1 0 5 . 0
g i . 6 g i . 2
Sta t . 1 3 . July 29, 1912. Inner end of Cross Bay, at LilliehOSk Glacier.
50 —0.25 134.551 7.42 1 91.4 100 1 0.321 .67 I 7.29 1 go.8
Sta t . 1 4 . July 14, 1912, Midway in Cross Bay.
250 i 1.35 1 34-84 1 6.79 i 87.3
Stat . 1 8 . Aug. 3 , i g i 2 . 8 0 " 2 ' N., 0 , T-
I I 2 0 E .
210 I 1.82 1 34.91 1 7.14 j g2.8
Sta t . 1 9 . Aug. 3 , 1912. 8 0 " 1 8 ' N., 10° 45 ' E.
510 1 i .29 | (34.g2) | 6.23(?)| 8o.o(?)
Stat . 3 7 . Aug. 14, i g i 2 . 8 0 ° 2 4 ' N., 15° 32' E.
50 1 (1.50)1(34.64)1 6,gg 1 90.0 200 1 ( i .7 i ) | ( .88)1 6.93 1 Sg.g
Stat . 4 1 c. Aug. ig , 1912. 8 0 ° 2 6 ' N., 12° 0 0 ' E .
5 2 0
5 0
I O O
1.72 2 . I I
— 0 . 0 9 3 . 1 2
(32^32)l 7^71 (33.g9)l 8.37 (34^65) 7-49 ( •95n 7.13
g8. i 108.7 92.7 95.7
Stat . 4 2 . Aug. 19, 1912. Near Stat. 41 c.
200? j 2.47 j 34.891 7.03 1 92.8
300 1 1.87 1 .92 1 7.22 1 91.8
Depth in
Metres
t° C. in situ •SO/oo
O2 cc. per
1000 cc. of Sea-W a t e r
O2 % of
Saturation
S t a t . 4 3 . Aug 20, 1912. 80 ° 20 • N.,
50 I O O
2 0 0
4 0 0
540
10° 4 ' E .
- 0 . 3 9 1.79 1.83 1.36
1 .51?
3 4 - 4 3 • 8 3 . 9 0
• 9 1 . 9 2
7^3i 7-35 7 . 2 6 7 .17 7 .12
8g.6 95^5 94^4 9 2 . 2
gi .8
Stat . 4 5 . Aug. 26, 1912. In Ice Fjord.
2 0
5 0
I O O
1 7 0
1.64 0 . 8 5
— 0 . 2 6 — 0 .12
32.aa 33^68 34-41
. 6 2
B.ig 8.13 7^4g 7 . 2 6
1 0 4 . 3 1 0 2 . 3
9 2 . 2
89.8
Sta t . 4 6 . Aug. 26, i g i 2 . In Ice Fjord.
1 4 0 - 0 . 7 4 j 34.561 7.51 1 91.2
Stat . 5 0 . Aug. 30, 1912. Van Mijen Bay
0
1 0
5 0
7 0
Sta t . 5
0
2 0
5 0 I O O
1 3 0
Stat . 5
5 0
I O O
Sta t . 5
5 0 0
7 0 0
(Bell Sound).
0 . 2
0 . 3 8 0 . 1 9 0.04
3 2 . 4 5
•S3 33^25
. 4 2
8 .04
8 . 2 5 7^g9 8 . 0 8
98.4 1 0 1 . 6
9 8 . 4 9 9 . 3
3 . Aug. 31 , i g i 2 . Outside Bell Sound. 77° 33 ' N., 13° 28' E.
- 0 . 3 1.65 0 . 0 8 1.03
0.67
3 2 . 1 7
3 4 . 1 6 . 6 1
. 6 8
8 .32
7 .98
1-11 7 .41
7-23
100 . 4 101 .7
9 6 - 3 94^3 9 1 . 3
6 . Sept. I, 1912. 7 6 ° 22" N., 13° 52 ' E .
5.45 4^47
3 4 . 9 0 3 5 . 0 2
7 . 2 6
6 . 7 5
102 .8
9.3.5
7. Sept. I , 1912. 75 " 5 8 ' N., 13° S' E.
1.22 0 . 0 8
' 3 4 . 9 2 . 9 1
7^23 6 . 9 6
9 2 . 6 86.7

1 9 1 5 . N o . 2 . SPITSBERGEN WATERS. 1 2 9
TABLE IV
gives the measurements of the H y d r o g e n Ion C o n c e n t r a t i o n (and the H y d r o x y l Ion Concentra t ion) of the Sea -Wate r , taken during the cruise of the VeslemOy, in July and
August 1912.
ist Column. Depth in Metres.
2nd Column, t° C. Temperature (Centigrade) of the Sea -Wate r in si/u.
jrd Column, S "/oo- Salinity (in per mille) of the Sea-Wate r .
4th Column, p„. The Hydrogen Ion Exponent, p„^ given by the observations.
jth Column, CQJJ' ' ^^ . The Hydroxyl Ion Concentration, expressed in gram-equivalents
of hydroxyl ions per liter of sea-water, multiplied by 10''.
6th Column, O^ cc. Cc. of Oxygen per liter of Sea-Water .
yth Column, O2 "^Q. Percentage of Saturation of Oxygen.
Vid.-Selsk. Skrifter. I. M.-N. Kl. 1915. No.

I 3 0 FRlDTjOF NA.N'SEN. M.-N. Kl.
Depth in
Metres
t" C. in situ S% CoE' 0-2 O , 0/p
Depth in
Metres
/= C. /;/ siht 5%o COH'' 0.5 cc. 0 3 %
Green Harbour, at our anchorage. July 20, 1912.
o I [ 1 8.25 I 12.9 !
Stat . 1 0 . July 21 , 1912. In the mouth of Ice Fjord.
0
2 0
5 0
75 too 2 0 0
3 0 0 4 0 0
4 8 0.75
- 0 . 5 5 —0.41 —0.42
0.37 1.03 1.09
29.05 34.16
.54
.53 •71 •78 •83
8.08 . 04
7.92 •gs .93 •93
8.01 7.92
8.7 . 1
6.0
•5 . 0
. 0
7.0 6 .0
8.34
7^47
7.17
105
91.6
91.2
Poole Point, Foreland Sound. July 23, 1912.
o 1 j I 8.05 I 8.1 [
Port Signe, LilliehOOk Bay. July 29, 1912.
o I I I 7 '93 I 6.0 ! I
Stat , 1 3 . At Lilliehook Glacier. July 29^ 1912.
2 0
75 I O O
— 0.04 — 0 .20
0.32
34^48 •sg .67
7^94 •95 •95 7-29 go.!
Stat . 1 4 . Cross Bay. July sg, i g i 2 .
50 1 0 0 2 0 0 2 5 0
— I .OI
—0.68 1 .12 j
1-35
34.51 -sgl . 80
.841
8.04 •05 . 1 0
. 0 1 7.0 I 6.7g , 87.3
Stat. 15. July 2g, 1912. 7.00 p. in. 79° 5' N., 10° 56' E.
o 1 (2.5) 1(32.75)1 8.07 i 8.7 ! I
Stat.
0
60 I to 210 240
1 8 . Aug. 3,
1,8 1.56 1.69
CO
M
34-33 •79 .82
.gi
.91
912.
8.07 •03 .06 .04 .04
80° c,'
8-7 7.6 8.1 7.6
.6
N., 11° 20' E,
7 . f4 92.8
S t a t . 1 9 . Aug. 3, 1912. 6.30 to 7.50 p. m. 80° i 8 ' N., 10= 45 ' E.
12 .7 I I . o
0 . 8
1.17 0.75 I .9I 1.90 r.8o
33.06 .56
34^57 .86 •go . g 2
^•55 -93 1.29 ( .921
8.24
•19 .07
•OS .05 . 0 2
•05 . 08
1 0 0 2 0 0 3 1 0 4 1 0 .=;io
Sta t . 1 9 a. Aug. 3, Stat. ig .
. 1
7.6
] g i i
6.23? 80.0
Same place as
1 0
2 0
5 0
i . iS 1.28 1.27
33.50 .66
34^58
8.24 . 2 2
. i g
12.7 . 1
11.6
V e r l e g e n Hook . Aug. 12, i g i 2 . 1.30 p. m.
o I 1.3 I ! 8.241 12.7 I 1
Sta t . 3 7 . Aug.. 14, i g i 2 . 80° 24' N., 15° 32' E.
50 230
1.50 I 34.64 I 8.10 j 1.70 j .90 I .07 I
9.2 6.99 90.0 8.7 I (6.g3) I (8g.9)
Stat . 3 9 . Aug. 15, i g i 2 . 80° 5' N., 15° 3 3 ' £ •
0
1 0
4 0
9 0 1 3 0
1.0
1.03 1.28 1.41 1.46
32.72 33.60 34.19
.68
8.19 . 1 1
. 0 4
. 0 4
.OT
11.6 g .2
• 8.1 . 1
7.0

tgiS- N o . 2 . SPITSBERGEN WATERS. 1 3 1
Literature. igo4. BJERRUM, Niels: On the Determination of Oxygen in Sea-water. Meddelclser fra Kom-
missionen for Havimdersogelser. Seric: Nydrografi, Bd. I, No. 5. Kobenhavn,
igo4.
1902. EKMAN, V. Walfrid: Om jordrotationens inveikan pa vindstrOmmar i hafvet. Nyi
Magazin for Naiurvidenskab. Bd. XL, H. 1, Christiania, 1902.
1905. EKMAN, V. Walfrid: On the Influence of the Earth 's Rotation on Ocean-Currents.
Arkiv for Matp.matik, Ashonomi och Fysik. Bd. II, No. 11. Stockholm, 1905.
igo6. EKMAN, V. Walfr id: Beitrage zur Theorie der Meeresstromungen. Ann. d. Bydr.
u. Marit. Miteorol. Bd. XXXIV. Hamburg, igo6.
1907. Fox, Chas. J. J . : On the Coefficients of Absorption of the Atmospheric Gases in
Distilled W a t e r and Sea Wate r . Par t I : Nitrogen and Oxygen. Publications de
Circonstancc, No. 4 1 . Cons. Perm. Intern, pour I'Expl. de la Mer. Copenhague,
1907.
1904. H A R R I S , Rollin A.; .Some Indications of Land in the Vicinity of the North Pole.
The National Geographic Magazine. Vol. XV, 1904. Washington D. C.
1904. H.<vRRis, R. A . : Evidence of Land near the North Pole. The Eight International
Geographic Congress, Washington 1^04.
1911. H A R R I S , R . A.; Arctic Tides. Department of Commerce and Labor. Coast and
Geodetic Survey. Washington, 1911.
1906. HELLAND-HANSEN, Bjorn: Current Measurements in Norwegian Fiords, the Nor
wegian Sea and the North Sea in igo6 . Bergens Museums Aarbog igo7 . No. 15.
Bergen.
igo7. HELLAND-HANSEN, Bjern : De vestlandske asters-basiners naturforhold. Published by
Selskapet for de Norske Fiskeriers Fremme. Bergen, 1907.
1914. HELLAND-HANSEN, Bje rn : Eine Untersuchungsfahrt im Atlantischen Ozean mit dem
Molorschiff „Armauer Hansen" im Sommer 1913. Internationale Revue der ge-
samten Hydrobiologie und Hydrographie. Bd. VII. Leipzig, 1914.
igo7. HELLAND.HANSEN, B . and KOEFOED, E . . Hydrographie . In Due d'Orleans, Croisi'ere
oceanographique dans la Mer du Gronland, 190J. Bruxelles, igo7.
igog. HELLAND-HANSEN, B . and NANSEN, F . . The Norvegian Sea. Report on Norwegian
Fishery and Marine Investigations, Vol. II, No. 2. Bergen, 1909.
1912. HELLAND-HANSEN, B . , and NANSEN, F . : The Sea west of Spitsbergen. The Oceano
graphic Observations of the Isachsen Spitsbergen Expedition in i g i o . Videnskaps-
Selskapets Skrifter. I Math-naturv. Klasse, i g i 2 . No. 12. Christiania.
i8gg. KNUDSEN, Martin: Hydrography. The Danish Ingolf-E.xpedition. Vol. I, No. 2.
Copenhagen, 1899.
1902. NANSEN, F . : The Oceanography of the North Polar Basin. The Norwegian North
Polar Expedition iSgj—i8p6. Scientific Results. Vol. III. No. 9. Christiania,
igo2.
igo4. NANSEN, F . . The Bathymetrical Features of the North Polar Seas . Norwegian N.
Polar Exp. i8g} — p6. Scient. Res Vol. IV, No. 13. Christiania, 1904.
1906. NANSEN, F . : Methods for Measuring Direction and Velocity of Currents in the Sea.
Publications de Circonstancc. No. 34. Conseil Permanent International pour I'Ex-
ploration de la Mer. Copenhague, 1906.
igo6. NANSEN, F . : Northern Wate r s . Captain Amundsen's Oceanographic Observations in the Arctic Seas in 1901. V\denskaps-Selskapets Skrifter. I Math.-naturv. Klasse, 1906- No. 3. Christiania. ipo6.

1 3 3 FRIDTJOF NANSEN. SPITSBERGEN WATERS. M . - N . K I . T Q I 5 . N o . 2 .
1907. NANSEN, F . ; On North Polar Problems. Tlte Geographical Journal, London, 1907.
1913. NANSEN, F . : The Wate r s of the North.eastern North Atlantic. Investigations made
during the Cruise of the Frithjof, of the Norwegian Royal Navy, in July i g i o .
Internatiovmlii Revue der gesaniten Hydrobiologie und Hydrographie. Leipzig, 1913.
1907. D ' O R L E A N S , Due: Croisiere Oceanographique dans la Mer du GrSnIand 1905. Bruxelles,
igo7.
i g i i . PALITZSCH, Sven: Ueber die Messung der Wasserstoffionenkonzentration des Meer-
wassers . Puhlicatione de Circonstancc. No. 60. Conseil Perman. Intern, pour
I'Explor. de la Mer. Copenhague, 1911.
1912. PALITZSCH, Sven: Determination of the Quantity of Oxygen in Seawater (Methods
used). Report on the Danish Oceanographical Expeditions it^oS — ic^io to the Medi
terranean and Adjacent Seas. Edit, by Jobs. Schmidt. Vol. I. No. 4. Copenhagen,
i g i 2 .
i g i 2 a. PALITZSCH, Sven : Measurement of the Hydrogen Ion Concentration in Sea water.
Rep. on the Danish Ocean. Exp. ipoS — ipio etc. Vol. I, No. 6. Copenhagen,
i g i 2 .
1911. S v e n s k a H y d r o g r a f i s k - B i o l o g i s k a K o m m i s s i o n e n : Hydrographische Be-
obachtungen. Zoolog'sche Ergebnisse der schwedischen Expedition nach Spitz-
bergen igo8 unter Leitung von Prof. G. De Geer. Par t I, No. i . Kungl. Svenska
Vetenskaps-Akademiens Handlingar. Bd. XLV, No. g. Stockholm, 1911.
1880. TORN0E, Hercules: Chemistry. The Norwegian North-Atlantic Expedition i8y6 — j8.
Christiania, 1880.
Printed 30 Nov. 1915.