Enhancing the Matrix Transpose Operation Using Intel Avx Instruction Set Extension
Upload
khangminh22Category
view
0download
0

2
TA B L E O F C O N T E N T S
SelectedFinancial Data Page 3
Letter to Shareholders Page 5
Global Alliances Page 8
Diverse Markets Page 10
Technology Leader Page 12
Innovations That Change Lives Page 14
Product & Glossary Page 16
Financial Report Page 22
ShareholderInformation Page 41
Board of Directors & Corporate Officers Page 41
AYear ThatExceededExpectations
TargetOn
Millions of times each day, AVX Corporation meets the needsof our customers by producing the highest quality, most innova-tive electronic passive components and connectors in the world.Our products store, filter, regulate and connect the energy flow inelectronic circuits.
Hundreds of these components are found in every cell phone,laptop computer and desktop workstation. Our parts also makepossible computerized functions in automobiles, pacemakers,
hearing aid devices and rockets bound for outer space. As we move into and through the 21st Century, AVX is
“On Target”. We are improving shareholder value; leveraging ourglobal alliances and resources; finding truly innovative solutions,as our components and connectors simultaneously grow smallerand more complex. And we are maintaining the most reliableand cost-efficient manufacturing processes in the industry.
Our industry, built on technology, is awash in acronyms andjargon. To help you better understand the language that is usedin our business, we’ve included a glossary of common termsfound in this report. We hope the glossary and the report helpyou better understand why AVX is “On Target”.
This document contains forward-looking statements that are subject to risks and uncertainties that could cause results to differ materiallyfrom the performance indicated or implied by such statements. Risk factors relating to such statements are described in the Company’sAnnual Report on Form 10-K for the fiscal year ended March 31, 2000.
TargetOn
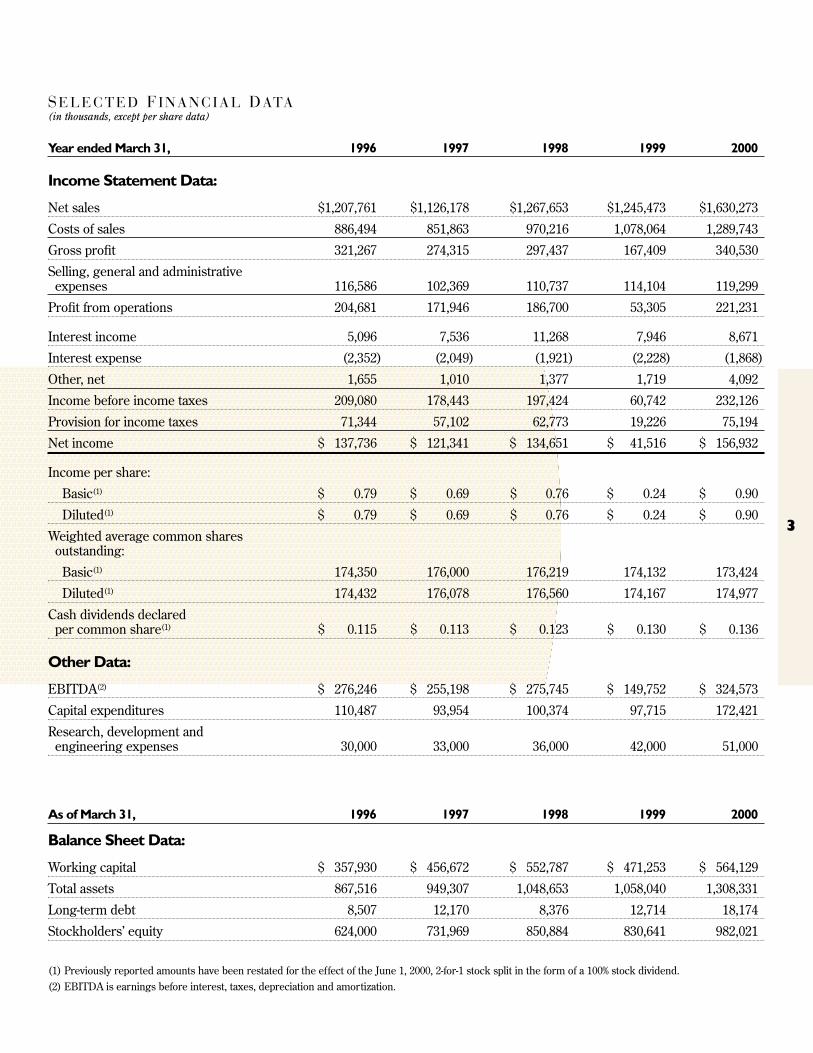
Year ended March 31, 1996 1997 1998 1999 2000
Income Statement Data:
Net sales $1,207,761 $1,126,178 $1,267,653 $1,245,473 $1,630,273
Costs of sales 886,494 851,863 970,216 1,078,064 1,289,743
Gross profit 321,267 274,315 297,437 167,409 340,530
Selling, general and administrative expenses 116,586 102,369 110,737 114,104 119,299
Profit from operations 204,681 171,946 186,700 53,305 221,231
Interest income 5,096 7,536 11,268 7,946 8,671
Interest expense (2,352) (2,049) (1,921) (2,228) (1,868)
Other, net 1,655 1,010 1,377 1,719 4,092
Income before income taxes 209,080 178,443 197,424 60,742 232,126
Provision for income taxes 71,344 57,102 62,773 19,226 75,194
Net income $ 137,736 $ 121,341 $ 134,651 $ 41,516 $ 156,932
Income per share:
Basic(1) $ 0.79 $ 0.69 $ 0.76 $ 0.24 $ 0.90
Diluted(1) $ 0.79 $ 0.69 $ 0.76 $ 0.24 $ 0.90
Weighted average common sharesoutstanding:
Basic(1) 174,350 176,000 176,219 174,132 173,424
Diluted(1) 174,432 176,078 176,560 174,167 174,977
Cash dividends declared per common share(1) $ 0.115 $ 0.113 $ 0.123 $ 0.130 $ 0.136
Other Data:
EBITDA(2) $ 276,246 $ 255,198 $ 275,745 $ 149,752 $ 324,573
Capital expenditures 110,487 93,954 100,374 97,715 172,421
Research, development andengineering expenses 30,000 33,000 36,000 42,000 51,000
As of March 31, 1996 1997 1998 1999 2000
Balance Sheet Data:
Working capital $ 357,930 $ 456,672 $ 552,787 $ 471,253 $ 564,129
Total assets 867,516 949,307 1,048,653 1,058,040 1,308,331
Long-term debt 8,507 12,170 8,376 12,714 18,174
Stockholders’ equity 624,000 731,969 850,884 830,641 982,021
(1) Previously reported amounts have been restated for the effect of the June 1, 2000, 2-for-1 stock split in the form of a 100% stock dividend.(2) EBITDA is earnings before interest, taxes, depreciation and amortization.
SELECTED FINANCIAL DATA(in thousands, except per share data)
3

4
AVX
SHAREHOLDERS
BENEFITED FROM
EFFECTIVE
STRATEGY
IMPLEMENTATION
AND OPERATING
PERFORMANCE.

Benedict P. Rosen, Chairman and CEO, AVX Corporation, leftJohn S. Gilbertson, President, COO, AVX Corporation, right
5
LETTER TO SHAREHOLDERS
This past year AVX posted record sales of $1.6 billion, comparedwith $1.2 billion a year earlier. Net income for fiscal year 2000 was$156.9 million or $0.90 per share, compared with $41.5 million or$0.24 per share the previous year. This common share data has beenadjusted to reflect the June 1, 2000, 2-for-1 stock split.
Demand for all our products remains strong. Drivers for this marketinclude continued innovation in communications, wireless and consumerentertainment electronics, as well as advances in Internet connections andincreasingly sophisticated electronic packages in cars. Technology break-throughs are creating brisk sales of consumer-based electronic equipmentmanufactured by our customers. These drivers, coupled with additionalcapacity we put into place, propelled AVX to record sales in fiscal 2000.
CAPACITY EXPANSION ➔ CATALYST FOR RECORDSALES ➔ A YEAR THAT EXCEEDED EXPECTATIONS
Our strategy of building production capacity ahead of demandpositions us well to serve increased customer requirements. Forexample, worldwide capacity for tantalum capacitors has experiencedcompound annual growth of 20% over the last three years, withconsumption in 2000 estimated at 27 billion units. Anticipating andresponding to this surge, AVX invested more than $100 million in fiscal 2000 to expand tantalum facilities in England, the CzechRepublic and El Salvador. These expansions have made AVX one of the largest manufacturers of tantalum capacitors in the world.Accelerating our independence from rare metals, such as palladium, wealso opened in fiscal 1999 our new nickel-ceramic plant in Myrtle
Strong ConsumerMarkets Have Driven
Robust Demand.

6
Beach, South Carolina (USA).Our shareholders benefited from this strong
strategic implementation and operatingperformance. AVX’s common stock price rosefrom $8.00 at the start of our fiscal year, to$37.90 at the close March 31, 2000, an increaseof nearly 473% in shareholder value.*
P E R F O R M A N C E D R I V E R SThe growth across broad market segments
that powered our business in fiscal 2000 isexpected to continue.
Globally in 1999, more than 110 million
personal computers were shipped, an increase ofnearly 23% from the year before. PC sales areexpected to grow at similar rates in 2000.Wireless telephone growth is even more dynamic.The forecast for 2000 is for more than 400million phones to be shipped, up nearly 40%from 1999. Small handheld devices, such aspersonal digital assistants (PDAs), represent arelatively new area of future growth. Forecastsfor 2000 predict nearly 13 million PDAs will beshipped, an annual increase of more than 44%.
S T R AT E G I C A D VA N TA G E SAVX’s growth is built on more than simple
market growth. Worthy of mention are ouruniquely close relationships with customers andsuppliers, implementation of e-commerceinitiatives and the benefits of our relationship withJapanese electronics giant Kyocera.
We work closely with our customersthroughout the entire business process. Theyshare their product planning information withus. From that point we jointly design productsand delivery solutions. In many cases, ourpremier Research and Development effortscreate new products to meet our customers’specific requirements. In other cases, we jointly
monitor supply-demand activities. This sharedinformation helps ensure that our worldwidemanufacturing facilities generate timely,uninterrupted product supply for our customers.
AVX was one of the first passive componentmanufacturers to create a Web presence. Ourcustom interactive modeling program for systemdesigners was a key differentiator. We continueto invest in the Internet with a major update ofour Web site released in March 2000.
Our alliance with Kyocera was a precursorto our many global capabilities and partner-ships, a topic covered later in this report.Kyocera is our most valuable partner. The
“AGGR ESSI VEG R O W I N G M A R K
T O G R EAT E RR EV E N U E

7
*Figures reflect the effect of the June 1, 2000,2-for-1 stock split.
SALES(IN MILLIONS)
*QUARTERLY EPS*(EARNINGS PER SHARE)
FY 2000
QUARTERLY*STOCK PRICE*
alliance opens the Japanese market to AVX products and, with AVX handling global sales responsibility for Kyocera’s electroniccomponent products, the partnership expands our worldwide product portfolio.
L O O K I N G A H E A DWe expect continued growth throughout the coming year.
Obviously, the solid economic growth most of the world is experienc-ing contributes to our optimism. Beyond this, our focus remains onexpanding low-cost, high-quality manufacturing facilities and creatinginnovative, unique products and manufacturing processes.
Let me close by once again thanking our customers, whosecontinued support powers our success and our 18,000 employees –
our most valuable asset. It is their dedication to excellence andcustomer service that continues to differentiate AVX from ourcompetitors. It is this very dedication to excellence that keeps AVX on target.
Finally, I want to thank our shareholders for their interest andsupport; giving us the resources to stay “On Target”. We look forwardto meeting with you at our Shareholders’ Meeting at the Crown ReefResort and Conference Center in Myrtle Beach, South Carolina, at10:00 a.m. on Tuesday, July 25, 2000.
Benedict P. RosenChairman and Chief Executive OfficerAVX Corporation
P U R S U I T O FE T S H A S L E DO V E R A L LR E T U R N. ”
FY FY

8
AVX PRODUCES
COMPONENTS IN
27 FACILITIES
LOCATED IN 12
COUNTRIES AROUND
THE WORLD.

GL O B A L AL L I A N C E S – CO O R D I N AT E DMA R K E T S & MA N U FA C T U R I N G
AVX is ready with a worldwide manufacturing presence, a comprehensiveproduct line and a marketing organization ready to respond simultaneously toglobal and local market trends.
In fiscal 2000, almost 60% of our net sales were outside North America, with Asia accounting for 32% and Europe for 26%. The capability to moveproduction to the most appropriate locations – thereby reducing cost and time-to-market while increasing flexibility – has been a key to our success.
AVX has developed a key strategic sales network which includes AVX salesand marketing representatives, plus the world’s premier component distributors.The network’s ability to provide expert logistics, added-value services and localsupport has resulted in the further growth in customer usage of AVX products.
Our global alliances have grown dramatically in the last ten years. Our major
The world’s smallest tantalum capacitor is manufactured by AVX.
Our Global Alliances And
Facilities Make AVX an “A” List Supplier.
alliance with Kyocera opened the important Japanese market to AVX products.The acquisition of TPC, formerly the Passive Component Division of the Frenchconglomerate Thomson-CSF, gave us facilities in France as well as in a number of important fast-growing markets, including Brazil, Malaysia and Taiwan.
Other emerging markets are playing a key role. In the Czech Republic, ourLanskroun plant recently shifted from assembly to full production of tantalumcapacitors, cutting costs and production time. Additionally, the changes have made Lanskroun the largest AVX plant in the world. Planned expansion of our El Salvador facilities will also increase tantalum production.
AVX Israel is dedicated to SMD Thin-Film electronic components, widelyused in the new generation cell phones, miniaturized computers and digitalcameras. Planning is under way for a 100% expansion in production capacity atthe Jerusalem operation.
Wherever marketing or manufacturing opportunities arise, AVX is preparedto deploy the appropriate resources to capitalize on them. Our global strategy is ontarget, ready to propel AVX growth into shareholder value.
9

DYNAMIC & DIVERSE MARKETSPROPEL GROWTH
Scanning prices,measuring temper-atures,monitoring production --gauges,dials and displays haveshrunk in size as fast as their pres-ence has proliferated. AVX’s cost-efficient manufacturing along withongoing research and developmenthave enabled people to increasetheir professional productivity andpersonal enjoyment.
From personal digital assistants(PDAs) to personal computers,from photocopiers to fax machines,and modems to monitors,peopleuse AVX components nearly everytime they sit down at their desk orperform their daily tasks. This istrue of both the office and thehome.
On any given day,the majority ofthe world’s telephone users couldbe using an AVX component. Voiceand digital telecommunicationproducts use our devices in hand-sets,switching systems,cell phonesand both wired and wirelessnetworks.When people talk,ourcomponents are part of theirconversations.
Television sets,videocassetterecorders,remote controls,microwaves,and even washingmachines all use componentsthat are produced by AVX. Some of the newest and increasinglypopular consumer electronics --such as MP3 audio players anddigital still and video cameras --employ sophisticated,miniatureAVX components.
Sales PercentagesBy Category
■ Telecommunications 36%
■ Information TechnologyHardware 18%
■ Instrumentation 13%
■ Contract EquipmentManufacturers (CEMs) 19%
■ Consumer 4%
■ Military/Government 4%
■ Automotive 3%
■ Medical 3%
As cars have become morecomputerized,extra attention isrequired to isolate the technologyfrom electrical transmissionscreated by the car’s engine andother mechanical components.AVX components help safelyactivate brake systems and air bagsin wildly fluctuating temperatures,ranging from –55 degrees centi-grade to +150 degrees centigrade.
Military / Government
Increasingly,electronics companiesare finding it more efficient andcost-effective to outsource theirmanufacturing and assembly to “contract equipment manu-facturers” (CEMs). AVX is amajor supplier to these CEMswhose highly efficient manufactur-ing operations build units that willbe sold under major computerand phone brand names.
Radar systems,space rockets andeven trains are kept on track and oncourse with AVX components.Some,like the glass dielectric capaci-tors,are built for extreme stabilityunder temperatures as high as 200degrees centigrade,the kind of heatfound in jet engines. Other compo-nents are built to withstand the coldvacuum of space or the wear andtear of daily rail travel.
Using AVX microminiature passivecomponents,our customers designelectronic devices that change lives.These products include one of theworld’s smallest hearing aids,as wellas implantable devices that bringhearing to the profoundly deaf,reduce tremors associated withParkinson’s disease,inhibit convulsivemovements of epilepsy,or regain use to patients whose hands areparalyzed.
Consumer
Sub-Contractor (CEM)
Automotive
MedicalInstrumentation
Information Technology
Telecommunications

12
AVX WAS NAMED
“THE INDUSTRY
LEADER” IN A RECENT
MAJOR MARKET
SURVEY, SURPASSING
COMPETITORS BY A
WIDE MARGIN.

Our Manufacturing and Service Edge Makes
AVX an InternationalLeader in Quality.
New high temperature kilns used for nickel-based capacitor production.
13
A R E C O G N I Z E D T E C H N O L O G Y L E A D E R
In a survey by the respected trade publications Electronics BusinessNews and Electronic Engineering Times, more than twice as many industryobservers named AVX “the industry leader” over all other competitors.This recognition led to AVX being awarded the coveted Frost & SullivanMarket Engineering Product Quality Award. Frost & Sullivan, an inde-pendent international marketing consulting firm, presents this award tocompanies that “excel in the increasingly competitive global marketplace.”
At AVX, customer communication, manufacturing excellence andsuperior service are the keys to quality.
“Customers and suppliers are sharing a lot more data,” observes WillieKing, AVX Director of Product Marketing.
“Communication with design engineers is the key to being on target inmeeting the demands of tomorrow’s market. Business is all about partnershipsand working together to meet a need. If our customers are successful, we are
successful,” notes Craig Hunter, AVX Strategic Marketing Manager.On the manufacturing side, delivering quality while controlling cost
has been an AVX trademark. We are the only U.S. passive componentproducer to manufacture our own ceramic raw materials. This capabilityenables precise quality control while providing significant cost andflexibility advantages over our competitors.
For more than 20 years, AVX has directed labor-intensive manufac-turing processes to El Salvador, Northern Ireland, Mexico and the CzechRepublic. Additionally, we are reducing or replacing expensive materials,such as palladium, a rare metal found only in Russia and South Africa.Most recently, we’ve built two facilities designed to produce capacitors inwhich the base metal nickel replaces the need for palladium. One plant isin Coleraine, Northern Ireland and another 100,000-square-foot plant is in Myrtle Beach, South Carolina (USA).

14
AVX HOLDS
THE POSITION OF
A BOLD INNOVATOR
IN A WORLD
OF INCREASED
MINIATURIZATION
AND SHRINKING
ELECTRONICS
REAL ESTATE.

15
I N N O VAT I O N S T H AT C H A N G E L I V E S
At AVX, we pride ourselves on leading the technological advances of our industry.
While many AVX innovations are empowering the growth of consumerand communication electronics, others truly enhance people’s lives. Forinstance, our devices are key components of hearing aids using cochlearimplants that are considered the only medical treatment for certain types and levels of profound hearing loss. In special circumstances, children asyoung as 18 months, as well as adults, with hearing loss of 90 decibels inboth ears may benefit from this device. The implanted technology is usedwith external components to capture, process, and focus more sound on thehearing nerve, resulting in better quality hearing than ever before.
AVX breakthroughs in performance and miniaturization are not limitedto tantalum capacitors but also include connectors and integrated passivedevices (IPDs) as well.
In 1999, AVX introduced one of the smallest connectors in the world.“These low profile connectors position us as a leader in today’s space-constrained designs,” says Carl Eggerding, Vice President of Technology.“Their small size gives our customers clear system design advantages.”
IPDs combine several functions in one smaller package. For example,one of our capacitor arrays combines four capacitors in one package,reducing required board space by 50%. “Integration of passive devices is thesolution to miniaturization,” says Robert Heistand, Manager of AVX IPDResearch and Development.
By continually improving our products and processes, AVX remains anindustry leader committed to the best quality for our customers and a betterquality of life for their customers.
Innovative Manufacturing
Processes And Products Are Creating
ShareholderValue.
An implanted medical device using AVX components allows people withquadriplegia to regain the use of a paralyzed hand.

More Than 400 AVX Parts Could Be Used In A Cell Phone.
*Components shown are commonly used in the manufacture of cell phones and are for illustrative purposes only.
StaticGuardI/OConnector
ChipResistor
MLCCapacitor
Arrays
MLC ChipCapacitors
TantalumChip
Capacitors
SoloStackerConnector
Inductor DirectionalCoupler
TCXO ResistorArrays
MicrophoneConnector
BatteryConnector
SAW Filter VCO


22

2 0 0 0 F I N A N C I A L R E P O R T
TABLE OF CON TENTS
Management’s Discussion and Analysis of Results of Operations and Financial Condition Page 24
Report of IndependentAccountants Page 28
ConsolidatedBalance Sheets Page 29
ConsolidatedStatements of Income Page 30
Consolidated Statements of Stockholders’ Equity Page 31
ConsolidatedStatements of Cash Flows Page 32
Notes to ConsolidatedFinancial Statements Page 33
Shareholder Information Page 41
23

Management’s Discussion and Analysisof Results of Operations and FinancialCondition
GeneralThe growth in sales during this fiscal year is due to the
expansion of the worldwide demand for electroniccomponents and to AVX’s commitment over the pastseveral years to (i) put plant and equipment in placearound the world to increase production capacity inadvance of our customers’ requirements, and (ii) continueto invest in research, development and engineering inorder to provide our customers with new generations ofpassive component and connector product solutions.
The expansion of the worldwide demand for electroniccomponents has been led primarily by strong growth inthe telecommunications and information technologyhardware industries, as the use of electronics in all walksof life has become more widespread and sophisticated.
The following table sets forth the percentagerelationships to net sales of certain income statementitems for the periods presented.
Year Ended March 31, 1998 1999 2000
Net Sales 100.0% 100.0% 100.0%
Cost of sales 76.5 86.6 79.1
Gross profit 23.5 13.4 20.9
Selling, general andadministrative expenses 8.7 9.2 7.3
Income before income taxes 15.6 4.9 14.2
Net income 10.6 3.3 9.6
OutlookOur customers are forecasting an increase in demand
for electronic components in order to meet expecteddemand for their end use products. The increase inworldwide demand for passive components has led toincreased prices. As reflected in this year’s sales results,we have significantly increased our production capacity inrecent years through continued investment in plant andequipment. We believe that in addition to increasedworldwide demand for electronic components, there areseveral other factors that provide opportunities forcontinued profitability, including (a) the continueddecrease in the amount of precious metal used and thesubstitution of base metals for precious metals in ourmanufacture of multi-layer ceramic capacitors, (b) capacityexpansion programs and continuous improvements in ourproduction processes, (c) cost control measures and (d)the growth of advanced products and connector productsthrough innovation and component design in conjunctionwith our customers.
Results of Operations
Year Ended March 31, 2000 Compared to Year Ended March 31, 1999
Net sales for the year ended March 31, 2000 increased30.9% to $1,630.3 million from $1,245.5 million for the yearended March 31, 1999. The increase in revenue wasattributable to the increased demand across all markets,particularly the telecommunications and informationtechnology hardware industries. As a result of demandoutpacing capacity, selling prices have stabilized and inmany cases increased. Although sales of all productgroups increased, surface mount and advanced productscontributed heavily to the growth.
Gross profit for the year ended March 31, 2000increased 103.4% to $340.5 million (20.9% of net sales)from $167.4 million (13.4% of net sales) for the year endedMarch 31, 1999. The improvement in gross profit in dollarterms and as a percentage of sales can be attributed to thefavorable pricing environment, improvements in ourmanufacturing processes and higher throughput in ourfactories. Gross profit continues to be negatively impactedby the cost of palladium, currently a raw material used inthe manufacture of certain multi-layer ceramic capacitors.The price we paid for palladium purchased during the yearexceeded the price we paid for an equivalent amountpurchased last year by approximately $36.7 million. OnJune 2, 1998, we acquired the passive component businessof Thomson-CSF (TPC). The TPC passive componentbusiness is not yet profitable, but efforts to stimulatemore sales growth and reduce costs are ongoing.
Selling, general and administrative expenses for the yearended March 31, 2000 were $119.3 million (7.3% of netsales), compared with $114.1 million (9.2% of net sales) inthe year ended March 31, 1999. The decline in selling,general and administrative expenses, as a percentage ofsales, is a result of higher sales, offset in part by higherresearch and development costs.
Research, development and engineering expenditures,which encompass the personnel and related expensesdevoted to developing new products, processes andtechnical innovations, were approximately $51 million and$42 million in fiscal 2000 and 1999, respectively. Thesecosts were incurred as we continued to enhance existingproduct lines and develop new products.
As a result of the above factors, profit from operationsfor the year ended March 31, 2000 increased to $221.2million from $53.3 million for the year ended March 31,1999.
The results for the year ended March 31, 2000 includein other income a benefit of $3.0 million as a result of asettlement for defective materials from a supplier and a$2.4 million gain from the sale of a non-operating asset.
For the reasons set forth above, and higher interestincome on invested cash offset in part by foreign currency
24

exchange losses, net income in the year ended March 31,2000 increased to $156.9 million (9.6% of net sales) from$41.5 million (3.3% of net sales) for the year ended March31, 1999.
Year Ended March 31, 1999 Compared to Year Ended March 31, 1998
Net sales for the year ended March 31, 1999 decreased1.7% to $1,245.5 million from $1,267.7 million for the yearended March 31, 1998. Sales for the year ended March 31,1999 include approximately $85 million of sales from TPC.Exclusive of the acquisition of TPC, sales declined 8.5%,although global unit sales increased year over year. Thedecrease in revenue was attributable to a combination offactors, including, the negative impact of the Asianeconomic crisis on worldwide demand and prices, asoftening of demand in the electronic components industryas customers reduced their level of inventory andsuppliers reduced their lead times and the continued trendtoward smaller part sizes, all of which contributed to loweraverage selling prices. Partially offsetting these overalleffects was a 6.8% increase in sales of advanced productswithin the passive components group and an 8% increase insales of connector products.
Gross profit as a percentage of net sales for the yearended March 31, 1999 decreased 10.1% to $167.4 million(13.4% of net sales) from $297.4 million (23.5% of net sales)for the year ended March 31, 1998. As indicated above,overall sales prices in fiscal 1999 were lower compared tofiscal 1998. Gross profit was also negatively impacted bythe rising cost of palladium, a precious metal used in themanufacture of ceramic capacitors. Compared to fiscal1998, the average market price for palladium during fiscal1999 increased 152% to $315 per troy ounce. The overallimpact of rising palladium prices is estimated to havereduced gross profit for fiscal 1999 by $16.7 million.Slightly lower throughput, which negatively impacts costabsorption, reflects soft demand and the intentionalreduction in our inventory levels, also contributed to thedecline in gross profit. Partially offsetting these factorswere continued production efficiencies and improvementsin production processes, as well as the impact of relativelyhigher sales of better margin advanced and connectorproducts. Gross profit was also negatively impacted bycosts associated with the integration of the TPC operationinto our organization. Cost cutting measures andorganizational changes initiated since the TPC acquisitionare ongoing.
Selling, general and administrative expenses for the yearended March 31, 1999 were $114.1 million (9.2% of netsales), compared with $110.7 million (8.7% of net sales) inthe year ended March 31, 1998. The increase is primarilyattributable to the integration of the TPC operations andthe amortization of goodwill related to the acquisition.
Research, development and engineering expenditures,
which encompass the personnel and related expensesdevoted to developing new products, processes andtechnical innovations, were approximately $42 million and$36 million in fiscal 1999 and 1998, respectively. Thesecosts were incurred as we continued to enhance existingproduct lines and develop new products.
As a result of the above factors, profit from operations forthe year ended March 31, 1999, decreased to $53.3 millionfrom $186.7 million for the year ended March 31, 1998.
For the reasons set forth above and lower interestincome on invested cash, net income in the year endedMarch 31, 1999 decreased to $41.5 million (3.3% of netsales) from $134.6 million (10.6% of net sales) for the yearended March 31, 1998.
Financial Condition
Liquidity and Capital ResourcesOur liquidity needs arise primarily from working capital
requirements, dividends, capital expenditures andacquisitions. Historically, we have satisfied our liquidityrequirements through internally generated funds. As ofMarch 31, 2000, we had a current ratio of 3.0 to 1, $175.7million of cash and cash equivalents, $982.0 million ofstockholders’ equity and an insignificant amount of long-term debt.
Net cash from operating activities was $136.8 million forthe year ended March 31, 1998, $184.4 million for the yearended March 31, 1999 and $178.2 million for the yearended March 31, 2000.
Purchases of property and equipment were $100.4million in fiscal 1998, $97.7 million in fiscal 1999 and$172.4 million for the year ended March 31, 2000. Theseexpenditures related to expanding the productioncapabilities of the passive component and connectorproduct lines. The carrying value for our equipmentreflects the fact that depreciation expense for machineryand equipment is generally computed using theaccelerated double-declining balance method. Wecontinue to add additional capacity. We expect to purchaseequipment totaling from $200 million to $230 millionduring the next fiscal year.
On June 2, 1998, we purchased the TPC passivecomponent business for $74.0 million, including theassumption of debt. Our net cash outlay was $58.0 million.
During fiscal 1998, we invested $5.3 million for a 41%interest in the research and development company,Electro-Chemical Research Ltd. (ECR). ECR hasdeveloped and patented a technology for high capacityelectrical storage devices. We made an additionalinvestment of $2.7 million in May 2000 for an additional10% interest in ECR.
Although the majority of our funding is internallygenerated, certain of our European subsidiaries have fromtime to time borrowed German deutsche marks, French
25

francs and Euros under various bank agreements. AtMarch 31, 2000, outstanding balances under suchagreements totaled $30.3 million. These borrowings havebeen used for working capital requirements and to repayother outstanding obligations.
In fiscal 1998, 1999, and 2000 dividends of $21.1 million,$22.7 million and $23.0 million, respectively, were paid tostockholders.
Pursuant to a previously authorized stock repurchaseprogram, we are authorized to purchase up to 4.4 millionshares of our common stock. We purchased 3,858,200shares at a cost of $31.7 million during fiscal 1999 butpurchased no shares in fiscal 2000. The repurchasedshares are held as treasury stock and are used to satisfystock option exercises.
We have established reserves for our projected share ofcosts associated with the remediation of, and compliancewith, environmental matters at various sites. Adjustmentsto such provisions and related expenditures have not beenmaterial in any of these periods.
Based on our financial condition as of March 31, 2000,we believe that cash on hand and expected to begenerated from operating activities will be sufficient tosatisfy our anticipated financing needs for working capital,capital expenditures, environmental clean-up costs,research, development and engineering expenses and anydividends to be paid for the foreseeable future.
Year 2000 IssuesWe have not experienced any significant Year 2000
related system failures nor, to our knowledge, have any ofour suppliers. We intend to monitor and test our ownsystems for ongoing Year 2000 compliance; and althoughwe do not anticipate any significant disruptions as a result of Year 2000 related problems, because of theuncertainties inherent with the Year 2000 computer issuewe cannot guarantee that Year 2000 problems will nothave a material adverse effect on our operating results,financial position or cash flows.
Our Year 2000 project total cost was approximately $5.3million, which was funded through operating cash flows.We do not anticipate any additional material cost.
Recent Accounting PronouncementsThe Financial Accounting Standards Board has issued
and amended Statement of Financial AccountingStandards No. 133, Accounting for Derivative Instrumentsand Hedging Activities (“SFAS No. 133”). This statementestablishes accounting and reporting standards forderivative instruments, including certain derivativeinstruments embedded in other contracts, and forhedging activities. We will be required to adopt SFAS No.133 for the quarter ended June 30, 2001. Currently, we areevaluating this standard and the impact it will have on ourconsolidated financial statements.
In December 1999, the Securities and ExchangeCommission issued Staff Accounting Bulletin No. 101,which provides guidance on revenue recognition andcertain lease arrangements. This statement is effectivefor the quarter ended June 2000. The company believes itis in compliance with the statement.
Quantitative and QualitativeDisclosure About Market Risk
Foreign Currency Our European sales, which accounted for approximately
26% of fiscal 2000 revenues, generally are denominated inlocal currencies while those in North America and Asiagenerally are denominated in U.S. dollars. Also, certainmanufacturing and operating costs denominated in localcurrencies are incurred in Europe, Asia, Mexico andCentral and South America. As a result, fluctuations incurrency exchange rates affect our operating results andcash flow. In order to minimize the effect of movements incurrency exchange rates, we periodically enter intoforward exchange contracts to hedge external andintercompany foreign currency transactions. We do nothold or issue derivative financial instruments forspeculative purposes. Currency exchange gains andlosses have been immaterial during the periods presented.
Assuming a 10% hypothetical adverse change in allforeign currencies, with the resulting functional currencygains and losses translated into U.S. dollars at the spotrate, the resulting net loss in fair value of exchangecontracts held would not be material to our results ofoperations, financial position or cash flows.
EuroOn January 1, 1999, certain member countries of the
European Union established fixed conversion ratesbetween their existing currencies and the EuropeanUnion’s common currency, the Euro. We havesuccessfully completed all the necessary enhancements toour sales order, banking arrangements and operationalprocedures to ensure Euro compliance. We are able toprocess orders, invoice customers and accept payment inEuros throughout Europe. The introduction of the Eurohas not had any material adverse impact upon us. Wecontinue to monitor the risk of price erosion that couldresult from increased price transparency among countriesusing the Euro.
Precious MetalsWe are at risk to fluctuations in prices for commodities
used to manufacture our products, primarily palladiumand tantalum.
Palladium, a precious metal used in the manufacture ofa portion of our multi-layer ceramic capacitors, isprimarily purchased from various companies in the form
26

of palladium sponge and ingot. The main areas of miningof palladium are in Russia and South Africa. Palladium isconsidered a commodity and is subject to price volatilityand has fluctuated in a range of approximately $145 to$815 per troy ounce during the past three years. We havemanaged, through the use of forward purchaseagreements and strategic spot buying, to purchasepalladium at a cost below the average market cost foreach of the past three years. We are addressing thevolatility in the price of palladium by (i) adjusting themanufacturing process for the parts made with palladiumto reduce the amount of the precious metal used in eachpart, and (ii) substituting base metals, such as nickel, inthe production of multi-layer ceramic capacitors. We haveconstructed a new 100,000-square-foot production facilityin Myrtle Beach, which began production during 1999 andis focusing on nickel-based products. We have alsoincreased the square footage of our Northern Irelandproduction facility and purchased additional equipment toproduce nickel-based products. Because of robust demandfor ceramic parts, both palladium and nickel basedproduction capacity is currently needed to satisfy ourcustomers’ needs.
Assuming a 10% hypothetical increase in the averagecost of palladium purchased by AVX, gross profit for theyear ended March 31, 2000 would have been negativelyimpacted by approximately $8.9 million.
Tantalum powder is a principal material used in themanufacture of solid tantalum capacitors. This product ispurchased under annual contracts through suppliers fromvarious parts of the world at prices that are subject toperiodic adjustment. We are a major consumer of theworld’s annual tantalum production. Although we believethat there is currently no problem with the procurementof tantalum powder and that the tantalum required by ushas generally been available in sufficient quantity to meetrequirements, the limited number of tantalum powdersuppliers could lead to higher prices.
Assuming a 10% hypothetical increase in the averagecost of tantalum purchased by AVX, gross profit for theyear ended March 31, 2000 would have been negativelyimpacted by approximately $8.8 million.
Interest Rate ExposureInterest rate exposure is centrally managed by
offsetting surplus cash and deposits against borrowingson a currency-by-currency basis. We maintain aninsignificant amount of foreign currency denominatedlong-term and short-term debt. The terms of theseborrowings range from 4 months to 36 months, with bothfixed and variable interest rates. A 10% adverse movementin interest rates would not have a material impact on ouroperating results, financial position or cash flows.
27

Market for the Registrant’s CommonEquity and Related StockholderMatters
Market for Common StockOur common stock is listed on the New York Stock
Exchange and trades under the symbol “AVX.” Thefollowing presents the high and low sale prices for ourcommon stock for each quarter since the quarter endedJune 30, 1998, as reported on the New York StockExchange Composite Tape.
On April 20, 2000, the Board of Directors approved a 2-for-1 stock split of our common stock effected in theform of a 100% stock dividend. The additional commonstock was distributed on June 1, 2000 to holders of recordon May 15, 2000. All references in this report to thenumber of shares, per share amounts, and market pricesof the Company’s common stock have been restated toreflect the increased number of shares outstanding.
Year Ended March 31,
1999 2000
High Low High LowFirst Quarter $1021⁄32 $713⁄16 $141⁄2 $79⁄16
Second Quarter 831⁄32 613⁄16 20 121⁄4Third Quarter 103⁄8 63⁄4 257⁄32 169⁄32
Fourth Quarter 831⁄32 69⁄32 4121⁄32 217⁄32
Holders of RecordAt June 1, 2000, there were approximately 372 holders
of record of the Company’s Common Stock. In addition,there were numerous beneficial holders of the CommonStock, representing persons whose stock is in nominee or“street name” accounts through brokers.
DividendsThe Company has declared and paid cash dividends of
$.035 per share of Common Stock for the quarters endedDecember 31, 1999 and March 31, 2000. The Companydeclared and paid cash dividends for the quarters endedJune 30, 1998, September 30, 1998, December 31, 1998,March 31, 1999, June 30, 1999 and September 30, 1999 of$.033 per share of Common Stock. Future dividends, ifany, will depend on the Company’s future profitability andanticipated operating cash requirements.
Report of Independent Accountants
To the Board of Directors and Stockholders of AVX Corporation
In our opinion, the accompanying consolidated balancesheets and the related consolidated statements of income,of stockholders’ equity and of cash flows present fairly, inall material respects, the financial position of AVXCorporation and its subsidiaries at March 31, 1999 and2000, and the results of their operations and their cashflows for each of the three years in the period endedMarch 31, 2000, in conformity with accounting principlesgenerally accepted in the United States. These financialstatements are the responsibility of the Company’smanagement; our responsibility is to express an opinionon these financial statements based on our audits. Weconducted our audits of these statements in accordancewith auditing standards generally accepted in the UnitedStates, which require that we plan and perform the auditto obtain reasonable assurance about whether thefinancial statements are free of material misstatement. Anaudit includes examining, on a test basis, evidencesupporting the amounts and disclosures in the financialstatements, assessing the accounting principles used andsignificant estimates made by management, andevaluating the overall financial statement presentation.We believe that our audits provide a reasonable basis forthe opinion expressed above.
Atlanta, GeorgiaJune 1, 2000
28

AVX Corporation and SubsidiariesConsolidated Balance Sheets
(in thousands, except per share data)
March 31, 1999 2000
AssetsCurrent assets:
Cash and cash equivalents $ 173,106 $ 175,654Accounts receivable, net 157,331 249,224Inventories 277,393 356,406Deferred income taxes 21,895 21,406Other receivables 2,738 5,655Prepaid and other 31,072 38,471
Total current assets 663,535 846,816Property and equipment:
Land 12,287 12,801Buildings and improvements 142,661 173,370Machinery and equipment 730,574 748,792Construction in progress 58,692 77,224
944,214 1,012,187Accumulated depreciation (639,966) (639,380)
304,248 372,807Goodwill, net 78,790 72,495Other assets 11,467 16,213
Total Assets $1,058,040 $1,308,331
Liabilities and Stockholders’ EquityCurrent liabilities:
Short-term bank debt $ 20,944 $ 12,116Current maturities of long-term debt 148 –Accounts payable:
Trade 46,737 83,921Affiliates 32,311 65,096
Income taxes payable 11,995 37,815Accrued payroll and benefits 41,055 44,855Accrued expenses 39,092 38,884
Total current liabilities 192,282 282,687Long-term debt 12,714 18,174Deferred income taxes 6,115 4,894Other liabilities 16,288 20,555
Total Liabilities 227,399 326,310Commitments and contingencies (Notes 10 and 13)Stockholders’ Equity
Preferred stock, par value $.01 per share:Authorized, 20,000 shares; None issued and outstanding – –
Common stock, par value $.01 per share:Authorized, 300,000 shares; issued and outstanding,176,368 shares for 1999 and 2000 1,764 1,764
Additional paid-in capital 324,146 335,481Retained earnings 541,267 675,234Accumulated other comprehensive income (loss) (4,789) (14,778)Common stock in treasury, at cost, 3,858 and 1,875 shares
for 1999 and 2000, respectively (31,747) (15,680)Total Stockholders’ Equity 830,641 982,021Total Liabilities and Stockholders’ Equity $1,058,040 $1,308,331
See accompanying notes to consolidated financial statements.
29

AVX Corporation and SubsidiariesConsolidated Statements of Income
(in thousands, except per share data)
Years Ended March 31, 1998 1999 2000
Net sales $ 1,267,653 $ 1,245,473 $ 1,630,273Cost of sales 970,216 1,078,064 1,289,743
Gross profit 297,437 167,409 340,530Selling, general and administrative expenses 110,737 114,104 119,299Profit from operations 186,700 53,305 221,231Other income (expense):
Interest income 11,268 7,946 8,671Interest expense (1,921) (2,228) (1,868)Other, net 1,377 1,719 4,092
Income before income taxes 197,424 60,742 232,126Provision for income taxes 62,773 19,226 75,194Net income $ 134,651 $ 41,516 $ 156,932
Income per share:Basic $ 0.76 $ 0.24 $ 0.90Diluted $ 0.76 $ 0.24 $ 0.90
Weighted average common shares outstanding:Basic 176,219.3 174,132.1 173,423.8Diluted 176,559.7 174,167.0 174,976.8
See accompanying notes to consolidated financial statements.
30

AVX Corporation and SubsidiariesConsolidated Statements of Stockholders’ Equity
(in thousands)
Common Stock AccumulatedAdditional Other Current Year’s
Number Treasury Paid-In Retained Comprehensive Comprehensiveof Shares Amount Stock Capital Earnings Income (Loss) Total Income
Balance, March 31, 1997 176,000 $1,760 $ - $319,029 $408,904 $2,276 $731,969 Net income 134,651 134,651 $134,651Other comprehensive
income 299 299 299Dividends (21,145) (21,145)Exercise of stock options 367 4 4,480 4,484Tax benefit of stock
option exercises 626 626Balance, March 31, 1998 176,367 1,764 - 324,135 522,410 2,575 850,884 $134,950
Net income 41,516 41,516 $ 41,516Other comprehensive
income (loss) (7,364) (7,364) (7,364)Dividends (22,659) (22,659)Exercise of stock options 1 11 11Treasury stock purchased (3,858) (31,747) (31,747)Balance, March 31, 1999 172,510 1,764 (31,747) 324,146 541,267 (4,789) 830,641 $ 34,152
Net income 156,932 156,932 $156,932Other comprehensive
income (loss) (9,989) (9,989) (9,989)Dividends (22,965) (22,965)Exercise of stock options 1,983 16,067 6,208 22,275Tax benefit of stock
option exercises 5,127 5,127Balance, March 31, 2000 174,493 $1,764 $(15,680) $335,481 $675,234 $(14,778) $982,021 $146,943
See accompanying notes to consolidated financial statements.
31

AVX Corporation and SubsidiariesConsolidated Statements of Cash Flows
(dollars in thousands)
Years Ended March 31, 1998 1999 2000
Operating Activities:Net income $ 134,651 $ 41,516 $ 156,932Adjustment to reconcile net income to net cash fromoperating activities:
Depreciation and amortization 87,668 94,728 99,250Deferred income taxes (2,520) (4,305) (395)Changes in operating assets and liabilities,
net of effects of business acquired:Accounts receivable 11,621 2,269 (95,790)Inventories (77,053) 70,256 (83,627)Accounts payable and accrued expenses (3,772) (20,804) 70,955Income taxes payable (9,507) (3,318) 30,743Other assets and liabilities (4,327) 4,061 112
Net cash from operating activities 136,761 184,403 178,180
Investing Activities:Purchases of property and equipment (100,374) (97,715) (172,421)Equity investments (5,300) – –Business acquired, net of cash – (58,027) –Other 142 65 (1,154)Loan to investee – – (2,055)
Net cash used in investing activities (105,532) (155,677) (175,630)
Financing Activities:Proceeds from issuance of debt 2,197 19,596 17,513Repayment of debt (3,464) (22,675) (16,239)Dividends paid (21,145) (22,659) (22,965)Purchase of treasury stock – (31,747) –Exercise of stock options 4,482 11 22,275
Net cash used in financing activities (17,930) (57,474) 584Effect of exchange rate on cash 14 (33) (586)Increase (decrease) in cash and cash equivalents 13,313 (28,781) 2,548Cash and cash equivalents at beginning of period 188,574 201,887 173,106Cash and cash equivalents at end of period $ 201,887 $ 173,106 $ 175,654
See accompanying notes to consolidated financial statements.
32

1. Summary of Significant AccountingPolicies:
General:AVX Corporation is a leading worldwide manufacturer and
supplier of a broad line of passive electronic componentsand interconnect products. Components sold by theCompany are used in virtually all types of electronicproducts for industries such as telecommunications,computers, automotive, medical and consumer electronics.The consolidated financial statements of AVX Corporationand its subsidiaries (the “Company” or “AVX”) include theaccounts of the Company and its subsidiaries. All significantintercompany transactions and accounts have beeneliminated.
Certain prior year amounts have been reclassified toconform to the current year presentation.
Other investments for which the Company does notcontrol the financial and operational direction, are eitheraccounted for using the equity method or are recorded at cost.
From January 1990 through August 15, 1995, theCompany was wholly-owned by Kyocera Corporation(“Kyocera”). On August 15, 1995, Kyocera sold 22.9%, or39,300,000 of the Company’s common shares, and theCompany sold an additional 4,400,000 common shares, ina public offering. In February 2000, Kyocera sold an additional 10,500,000 of AVX common shares. Kyoceracurrently owns approximately 70% of the Company’s outstanding common shares.
Stock Split:On April 20, 2000, the Board of Directors approved a
2-for-1 stock split of our common stock effected in theform of a 100% stock dividend. The additional commonstock was distributed on June 1, 2000 to holders of recordon May 15, 2000. All references in this report to the number of shares, per share amounts, and market pricesof the Company’s common stock have been restated toreflect the stock split and the resulting increased numberof shares outstanding.
Cash Equivalents:The Company considers all highly liquid investments
purchased with an original maturity of three months orless to be cash equivalents.
Inventories:Inventories are valued at the lower of cost (first-in, first-
out method) or market. Inventory costs include material,labor and manufacturing overhead.
Property and Equipment:Property and equipment are recorded at cost.
Machinery and equipment are generally depreciated onthe double-declining balance method. Buildings aredepreciated on the straight-line method. The estimateduseful lives used for computing depreciation are as fol-lows: buildings and improvements - 10 to 31.5 years, andmachinery and equipment - 3 to 10 years. Depreciationexpense was $85,858, $90,858, and $94,972 for the yearsended March 31, 1998, 1999 and 2000, respectively.
The cost of maintenance and repairs is charged toexpense as incurred. Upon disposal or retirement, the costand accumulated depreciation of assets are eliminatedfrom the respective accounts. Any gain or loss is reflectedin income.
Goodwill:Assets and liabilities related to business combinations
accounted for as purchase transactions were recorded attheir respective fair values on the dates of acquisition.Any excess of purchase price over such fair value(“Goodwill”) is amortized on a straight-line basis overperiods ranging from 20 to 40 years. The accumulatedamortization as of March 31, 1999 and 2000 was $22,972and $27,250, respectively. The carrying value of Goodwillis evaluated quarterly in relation to the operating perfor-mance and estimated future undiscounted cash flows ofthe related operating unit. Adjustments are made if thesum of expected future net cash flows is less than carry-ing value.
Income Taxes:Deferred tax liabilities and assets are determined based
on temporary differences between the bases of certainassets and liabilities for income tax and financial reportingpurposes. The deferred tax assets and liabilities are classi-fied according to the financial statement classification ofthe assets and liabilities generating the differences.Valuation allowances are established when necessary toreduce deferred tax assets to the amount expected to berealized. The Company does not provide for U.S. taxes onthe undistributed earnings of foreign subsidiaries whichare considered to be reinvested indefinitely. As of March31, 2000, the amount of U.S. taxes on such undistributedearnings would have been approximately $37,634.
Foreign Currency Activity:Assets and liabilities of foreign subsidiaries are
translated into U.S. dollars at the exchange rate in effect at the balance sheet date. Operating accounts aretranslated at an average rate of exchange for the respective accounting periods. Translation adjustmentsresult from the process of translating foreign currency
AVX Corporation and SubsidiariesNotes to Consolidated Financial Statements
(dollars in thousands, except share data)
33

financial statements into U.S. dollars and are reportedseparately as a component of accumulated comprehensiveincome.
The Company enters into foreign currency exchangecontracts and swaps to manage exposure to currency ratefluctuations on anticipated sales, purchases andintercompany transactions. These exchange agreementsgenerally qualify for accounting as designated hedges. Therealized and unrealized gains and losses on these contractsare deferred and included as a component of the relatedtransaction. Any contracts that do not qualify as hedges foraccounting purposes are marked to market with the resultinggains and losses recognized in other income or expense.
Revenue Recognition:The Company delivers products to customers based
upon firm orders. Revenue is recognized after thedelivery of the product and assessment of collectability.Certain sales to distributors are under terms which allowfor the affected distributors to receive price protectionfrom the Company for actual sales at prices belowanticipated sales prices. A portion of sales is made todistributors under agreements allowing limited rights of return. The Company provides an allowance for distributor adjustments based on historical experience.
Grants:The Company receives employment and research grants
from various non-U.S. governmental agencies which are recognized in earnings in the period in which the relatedexpenditures are incurred. Capital grants for theacquisition of equipment are recorded as reductions of therelated equipment cost and reduce future depreciationexpense.
Use of Estimates:The consolidated financial statements are prepared on
the basis of generally accepted accounting principles. Thepreparation of financial statements in conformity with general accepted accounting principles requiresmanagement to make estimates and assumptions thataffect the reported amounts of assets and liabilities atMarch 31, 1999 and 2000 and reported amounts ofrevenues and expenses for each of the three years in theperiod ended March 31, 2000. Actual results could differfrom those estimates and assumptions.
Research, Development and Engineering:Research, development and engineering expenses
totaled approximately $36,000, $42,000, and $51,000 forthe years ended March 31, 1998, 1999 and 2000,respectively, while research and development expensesincluded in these amounts totaled approximately $21,001,$20,622, and $22,926 for the years ended March 31, 1998,1999 and 2000, respectively. Research and developmentexpenditures are expensed when incurred.
Stock-Based Compensation:Statement of Financial Accounting Standards No. 123,
Accounting for Stock-Based Compensation, allows
companies to record compensation cost for stock-basedcompensation plans at fair value or provide pro formadisclosures. The Company has chosen to continue toaccount for stock-based compensation using the methodwhereby compensation cost for stock options is measuredas the excess, if any, of the quoted market price of theCompany’s stock at the date of grant over the amount anemployee must pay to acquire the stock.
Treasury Stock:In January 1998, the Company’s Board of Directors
approved a stock repurchase program whereby up to 4.4million shares of common stock may be purchased fromtime to time at the discretion of management. As of March31, 2000, the Company had in treasury 1,874,754 commonshares at a cost of $15,680. The repurchased shares areheld as treasury stock and are available for generalcorporate purposes.
New Accounting Standards:In June 1998, the Financial Accounting Standards Board
issued and amended Statement of Financial AccountingStandards No. 133, Accounting for Derivative Instrumentsand Hedging Activities (“SFAS No. 133”). This statementestablishes accounting and reporting standards forderivative instruments, including certain derivativeinstruments embedded in other contracts, and for hedgingactivities. The Company will be required to adopt SFASNo. 133 for the quarter ended June 30, 2001. Currently,the Company is evaluating this standard and the impact it will have on the Company’s consolidated financialstatements.
In December 1999, the Securities and ExchangeCommission issued Staff Accounting Bulletin No. 101,which provides guidance on revenue recognition andcertain lease arrangements. This statement is effectivefor the quarter ended June 2000. The company believes itis in compliance with the statement.
2. Earnings Per Share:Basic earnings per share are computed by dividing net
earnings by the weighted average number of shares ofcommon stock outstanding during the period. Dilutedearnings per share are computed by dividing net earningsby the sum of (a) the weighted average number of sharesof common stock outstanding during the period and (b)the dilutive effect of potential common stock equivalentsduring the period.
The basic weighted average number of shares ofcommon stock outstanding for the period were176,219,286, 174,132,056, and 173,423,754 for the yearsended March 31, 1998, 1999 and 2000, respectively.
The diluted weighted average number of shares ofcommon stock and potential common stock equivalentsoutstanding for the period were 176,559,692, 174,167,000,and 174,976,840 for the years ended March 31, 1998, 1999and 2000, respectively. Stock options are the only commonstock equivalents and are therefore considered in thediluted earnings per share calculations. Common stock
34

equivalents are computed using the treasury stock method.Common stock equivalents not included in the comput-
ation of diluted earnings per share because the options’exercise prices were greater than the average marketprice of the common stock were 15,329, 544,336 and 0 forthe fiscal years ended 1998, 1999 and 2000, respectively.
3. Comprehensive Income:The Company has adopted Statement of Financial
Accounting Standards No. 130, Reporting ComprehensiveIncome (“SFAS No. 130”). The statement requires disclosure of total non-shareowner changes in equity.Total non-shareowner changes in equity include allchanges in equity during a period except those resultingfrom investments by and distributions to shareowners.
The Company’s total comprehensive income was$134,950, $34,152, and $146,943 for the years endedMarch 31, 1998, 1999 and 2000, respectively. The onlyadjustment to net income in the periods was for foreigncurrency translation adjustments.
4. Accounts Receivable:Accounts receivable at March 31 consisted of:
1999 2000Trade $183,033 $273,052Less: allowances for doubtful
accounts, sales returns,distributor adjustments anddiscounts (25,702) (23,828)
$157,331 $249,224
Charges to expense related to such allowances wereapproximately $93,059, $111,813, and $82,323, and applica-tions to such allowances were approximately $87,746,$109,558, and $84,135 for the years ended March 31, 1998,1999 and 2000, respectively.
5. Inventories:Inventories at March 31 consisted of:
1999 2000Finished goods $ 91,551 $110,180Work in process 96,604 119,640Raw materials and supplies 89,238 126,586
$277,393 $356,406
6. Debt:Long-term debt at March 31 consisted of:
1999 2000Deutsche mark and Euro loans at 3.76-4.39%
due through 2003 $ 12,862 $ 18,174Less: current maturities (148) –
$ 12,714 $ 18,174
As of March 31, 2000, $4.4 of long-term deutsche markdenominated debt and $2.1 million of Euro denominated debtoriginally scheduled to mature on January 1, 2001 has beenexcluded from current maturities of long-term debt based on
the Company’s intent and ability to extend the facilities. The aggregate annual maturities of long-term debt are as
follows:
2001 $ – 2002 7,9682003 10,206
$ 18,174
Long-term debt includes 24.0 million of deutsche markloans and a 2.25 million Euro loan, all of which havevariable rates of interest based on a market rate plus .25%.At March 31, 2000, these loans had a rate of 3.83% and3.76%, respectively. The remaining loans of 6.0 million and3.0 million deutsche marks carry fixed rates of 3.9% and4.39%, respectively.
Short-term bank debt at March 31, 2000, consistsprimarily of borrowings incurred by the Company’sEuropean subsidiaries under 7.0 million and 2.0 milliondeutsche mark short-term working capital bank facilitiesbearing interest at market rates (between 3.9% and 4.39%at March 31, 2000) which extend through July 2000 andSeptember 2000, respectively. In addition, the Companyhas two 50.0 million French franc working capital bankfacilities bearing interest at market rates (3.42% as ofMarch 31, 2000) which extend through September 2000.
Interest paid totaled $1,426, $1,575, and $1,322 duringthe years ended March 31, 1998, 1999 and 2000,respectively.
7. Income Taxes:For financial reporting purposes, after adjustments for
certain corporate items, income before income taxesincludes the following components:
Years Ended March 31,
1998 1999 2000Domestic $126,236 $24,089 $ 82,253Foreign 71,188 36,653 149,873
$197,424 $60,742 $232,126
The provision (benefit) for income taxes consisted of:
Years Ended March 31,
1998 1999 2000Current:
Federal/State $ 49,075 $13,573 $34,259Foreign 17,487 13,096 42,623
66,562 26,669 76,882Deferred:
Federal/State (4,362) (7,709) (1,036)Foreign 573 266 (652)
(3,789) (7,443) (1,688)$ 62,773 $19,226 $75,194
Deferred taxes reflect the net tax effects of temporarydifferences between the carrying amounts of assets andliabilities for financial reporting purposes and theamounts used for income tax purposes. Significant com-ponents of the Company’s deferred tax assets and liabili-ties are as follows:
35

March 31, 1999 2000Assets Liabilities Assets Liabilities
Current:Sales and receivable
reserves $ 9,489 $ -- $ 8,282 $ --Inventory reserves 3,441 -- 2,776 --Accrued expenses 8,965 -- 10,348 --
$21,895 $ -- $21,406 $ --
Non-current:Property and equipment
depreciation $ 690 $ 2,002 $ 1,398 $ 1,650Accrued expenses 2,422 1,252 1,022 1,652Other -- 7,934 -- 4,198Foreign income tax
loss carryforwards 18,412 -- 27,644 --21,524 11,188 30,064 7,500
Valuation allowance (16,451) -- (27,458) --$ 5,073 $11,188 $ 2,606 $ 7,500
A reconciliation between the U.S. Federal statutoryincome tax rate and the Company’s effective rate forincome tax is as follows:
Years Ended March 31,
1998 1999 2000U.S. Federal statutory rate 35.0% 35.0% 35.0%Increase (decrease) in tax
rate resulting from:State income taxes,
net of federal benefit 1.7 1.0 1.5Taxes at different tax rates
on foreign earnings (3.6) (9.5) (9.5)Change in valuation allowance – 10.4 4.7Other, net (1.3) (5.2) 0.7
Effective tax rate 31.8% 31.7% 32.4%
At March 31, 2000, certain of the Company’s foreignsubsidiaries in Europe had tax net operating loss carry-forwards totaling approximately $75,569, most with noexpiration date. Accordingly, the Company’s valuationallowances relate to deferred tax assets which are theresult of the loss carryforwards in these jurisdictions.The valuation allowance increased $16,076 during the yearended March 31, 1999, and increased $11,007 during theyear ended March 31, 2000.
Income taxes paid totaled $76,013, $26,084, and $44,785during the years ended March 31, 1998, 1999 and 2000,respectively.
8. Employee Retirement Plans:
Pension Plans:The Company sponsors various defined benefit pension
plans covering certain employees. Pension benefits pro-vided to certain U.S. employees covered under collectivebargaining agreements are based on a flat benefit formula.Effective December 31, 1995, the Company froze benefitaccruals under its domestic non-contributory defined benefit pension plan for a significant portion of theemployees covered under collective bargaining agree-ments. The Company’s pension plans for certain Europeanemployees provide for benefits based on a percentage of
final pay. The Company’s funding policy is to contributethe statutory required amount to the appropriate trust orgovernment funds.
The change in the benefit obligation and plan assets of theU.S. and non-U.S. defined benefit plans for 1999 and 2000were as follows:
U.S. Plans International Plans
Years ended March 31, 1999 2000 1999 2000Change in benefit obligation:Benefit obligation at
beginning of year $23,187 $23,103 $50,471 $57,767Service cost 306 316 1,495 1,605Interest cost 1,538 1,448 3,517 3,478Plan participants’
contributions – – 942 811Actuarial loss (gain) (854) (1,866) 3,246 (677)Benefits paid (1,074) (1,530) (1,904) (1,508)Benefit obligation
at end of year 23,103 21,471 57,767 61,476
Change in plan assets:Fair value of plan assets
at beginning of year 23,813 25,391 53,330 57,814Actual return on assets 2,652 1,194 4,331 6,997Employer contributions – – 1,485 1,374Plan participants’
contributions – – 942 811Benefits paid (1,074) (1,530) (1,904) (1,508)Other expenses – – (370) (165)Fair value of plan assets
at end of year 25,391 25,055 57,814 65,323
Funded status 2,288 3,584 47 3,847Unrecognized
actuary loss (gain) (3,613) (4,672) (2,093) (5,293)Unrecognized prior
service cost 174 152 426 373Unrecognized
transition obligation 65 44 54 34Prepaid (accrued)
benefit cost $ (1,086) $ (892) $ (1,566) $ (1,039)
The Company’s assumptions used in determining thepension assets (liabilities) shown were as follows:
March 31, 1998 1999 2000Assumptions:Discount rates 6.75-7.0% 6.0-7.0% 6.25-7.5%Increase in compensation 3.0-4.0% 2.5-3.5% 2.5-4.0%Expected long-term rate
of return on plan assets 8.0-9.0% 7.5-9.0% 8.0-9.0%
Net pension cost related to these pension plans includethe following components:
Years ended March 31, 1998 1999 2000Service cost $ 1,613 $ 1,802 $ 1,921Interest cost 4,613 5,055 4,926Expected return on plan assets (7,816) (6,748) (6,493)Amortization of prior service cost 73 51 75Amortization of transition obligation 43 43 42Recognized actuarial loss (gain) 2,342 364 (144)Net periodic pension cost $ 868 $ 567 $ 327
36

Savings Plans:The Company sponsors retirement savings plans which
allow eligible employees to defer part of their annualcompensation. Certain contributions by the Company arediscretionary and are determined by the Company’sBoard of Directors each year. The Company’scontributions to the savings plans in the United States andEurope for the years ended March 31, 1998, 1999 and2000, were approximately $6,302, $6,272, and $6,268,respectively.
The Company sponsors non-qualified deferredcompensation programs which permit key employees toannually elect to defer a portion of their compensationuntil retirement. A portion of the deferral is subject to amatching contribution by the Company. The employeesselect among various investment alternatives, with theinvestments held in separate trusts. The value of theparticipant’s balance fluctuates based on the performanceof the investments. At March 31, 2000, the market valueof the trusts, $5,013, is included as an asset and a liabilityof the Company in the accompanying balance sheetbecause the trusts’ assets are available to AVX’s generalcreditors in the event of the Company’s insolvency.
9. Stock Based Compensation:The Company has two fixed option plans. Under the
1995 Stock Option Plan, as amended, the Company maygrant options to employees for the purchase of up to anaggregate of 6,300,000 shares of common stock. Under theNon-Employee Directors’ Stock Option Plan, as amended,the Company may grant options for the purchase of up toan aggregate of 500,000 shares of common stock. Underboth plans, the exercise price of each option equals themarket price of the Company’s stock on the date of grantand an option’s maximum term is 10 years. Optionsgranted under the 1995 Stock Option Plan vest as to 25%annually and options granted under the Non-EmployeeDirectors’ Stock Option Plan vest as to one-third annually.
The following table summarizes the transactions of theCompany’s stock option plans for the three-year periodended March 31, 2000:
Number of Weighted Average
Shares Exercise PriceUnexercised options outstanding –
March 31, 1997 3,277,000 $11.56Options granted 1,266,000 $11.05Options exercised (367,000) $12.21Options forfeited (28,650) $11.27Unexercised options outstanding –
March 31, 1998 4,147,350 $11.35Options granted 916,600 $ 8.05Options exercised (1,250) $ 9.06Options forfeited (406,550) $10.13Unexercised options outstanding –
March 31, 1999 4,656,150 $10.60Options granted 928,200 $ 8.24Options exercised (1,996,722) $11.33Options forfeited (83,100) $ 8.57Unexercised options outstanding –
March 31, 2000 3,504,528 $ 9.61Price Range $12.75-$15.91
(weighted averagecontractual life 5.7 years) 743,328 $13.15
Price Range $7.50-$9.97(weighted averagecontractual life 8.1 years) 2,761,200 $ 8.66
Exercisable options:March 31, 1998 1,068,500 $12.04March 31, 1999 2,103,762 $11.60March 31, 2000 1,289,628 $11.07
The calculated fair value at date of grant for each optiongranted during the years ended March 31, 1998, 1999 and2000 was $4.30 to $7.24, $3.18 to $4.30, and $3.39 to $7.39,respectively. The fair value of options at date of grant wasestimated using the Black-Scholes model with thefollowing weighted average assumptions:
Years Ended March 31
1998 1999 2000Expected life (years) 5 5 5Interest rate 6.6% 6.6% 6.26-6.6%Volatility 45% 45% 45-50%Dividend yield 0.75-1.23% 1.23-1.63% 0.84-1.63%
If the estimated fair value of the options had beenrecognized as compensation expense over the vestingperiods, income before income taxes would have beenreduced by $4,127 ($3,408 after income taxes, or $.02 pershare), $4,839 ($3,980 after income taxes or $.02 pershare), and $3,177 ($2,616 after income taxes or $.02 pershare), for the years ended March 31, 1998, 1999 and2000, respectively.
37

10. Commitments and Financial Instruments:
Commitments:At March 31, 2000, the Company had contractual obligations for the acquisition or construction of plant and
equipment aggregating approximately $75,427. The Company is a lessee under long-term operating leases primarily for office space, plant and equipment. Future
minimum lease commitments under non-cancelable operating leases as of March 31, 2000, were as follows:
Years Ending March 31,2001 $ 7,9452002 6,0392003 5,9692004 5,8602005 4,236Thereafter 11,223
Rental expense for operating leases was $6,440, $9,634, and $9,184 for the years ended March 31, 1998, 1999 and 2000,respectively.
Financial Instruments:At March 31, 2000, $6,000 of the Company’s intercompany borrowings by a European subsidiary were denominated in
U.S. dollars. To reduce the exposure to foreign currency fluctuations, the subsidiary entered into foreign currencyswaps which at March 31, 2000 fixed principal balance of the intercompany borrowings in U.K. sterling. In addition tothe U.S. dollar, the Company conducts business in most European currencies and the Japanese yen. The Company’sforeign currency contracts related to anticipated sales and purchases generally have maturities that do not exceed six months.
The Company enters into forward delivery contracts with certain suppliers for certain precious metals used in itsproduction processes.
The Company’s financial instruments that are exposed to concentrations of credit risk consist primarily of cash andcash equivalents and trade accounts receivable. The Company places its cash and cash equivalents with high creditquality institutions. At times, such investments may be in excess of the Federal Deposit Insurance Corporationinsurance limit. Concentrations of credit risk with respect to trade accounts receivable are limited due to the largenumber of entities comprising the Company’s customer base and their dispersion across many different industries andcountries. As of March 31, 2000, the Company believes that its credit risk exposure is not significant.
The following disclosure of the estimated fair value of financial instruments has been determined by the Company,using available market information and appropriate valuation methodologies. The fair value of financial instrumentsclassified as current assets or liabilities including cash and cash equivalents, receivables and accounts payableapproximate carrying value due to the short-term maturity of the instruments. The fair value of short-term and long-term debt approximate carrying value based on their effective interest rates compared to current market rates.
March 31, 1999 March 31, 2000Contract Carrying Unrealized Contract Carrying UnrealizedAmount Amount Gain (Loss) Amount Amount Gain (Loss)
Off-Balance Sheet Financial Instruments:Foreign currency contracts $46,968 $ - $ (266) $104,453 $ - $ (549)Foreign currency swaps 11,000 (570) (570) 6,000 (203) (203)Metal delivery contracts - - - 5,853 - (471)
11.Transactions With Affiliate:The Company’s businesses include the sale and distribution of electronic products manufactured by Kyocera.The Company entered into transactions with Kyocera as follows:
Years Ended March 31,
1998 1999 2000Sales:
Product and equipment sales to affiliates $ 25,725 $ 14,247 $ 20,743Subcontracting activities 1,679 2,103 2,093Commissions received 438 78 23
Purchases:Purchases of resale inventories, raw materialssupplies, equipment and services 266,568 245,504 368,703
Commissions paid 87 72 325Rent paid 1,137 1,141 1,192
Other:Dividends paid 15,883 17,200 17,529
38

12. Segment and Geographic Information:The Company has three reportable operating segments: Passive Components, Connectors and Research and
Development. The Company is organized, exclusive of research and development, on the basis of products beingseparated into six units. Five of the units which manufacture or distribute ceramic, tantalum, film and power capacitors,ferrites and other passive devices have been aggregated into the segment “Passive Components”.
The Company evaluates performance of its segments based upon sales and operating profit. There are nointersegment revenues. For determining segment assets, cash and accounts receivable, which are centrally managed,are not readily allocable to operating segments.
The tables below present information about reported segments for the years ended March 31,
1998 1999 2000Net sales:
Passive components $1,160,428 $1,129,714 $1,499,580Connectors 107,225 115,759 130,693
Total $1,267,653 $1,245,473 $1,630,273
Operating profit:Passive components $ 211,416 $ 67,257 $ 234,686Connectors 10,950 18,806 26,833Research & development (21,001) (20,622) (22,926)Corporate administration (14,665) (12,136) (17,362)
Total $ 186,700 $ 53,305 $ 221,231
Depreciation:Passive components $ 74,938 $ 79,493 $ 87,302Connectors 7,329 7,545 4,890Research & development 2,401 2,435 2,253Corporate administration 1,190 1,385 527
Total $ 85,858 $ 90,858 $ 94,972
Assets:Passive components $ 570,335 $ 560,982 $ 722,592Connectors 45,799 33,809 32,960Research & development 17,252 19,475 14,198Cash and accounts receivable 341,699 330,438 424,878Goodwill 33,479 78,790 72,495Corporate administration 40,089 34,546 41,208
Total $1,048,653 $1,058,040 $ 1,308,331
Capital expenditures:Passive components $ 89,790 $ 90,952 $ 163,669Connectors 5,971 3,244 4,529Research & development 4,613 3,519 4,223
Total $ 100,374 $ 97,715 $ 172,421
The following geographic data is based upon net sales generated by operations located within that geographic areaand long lived assets based upon physical location. The Other category consists of Latin America and Israel.
For the year ended March 31, 1998 1999 2000Net sales:
United States $ 607,064 $ 520,195 $ 660,993Europe 291,709 345,055 431,743Asia 364,300 369,974 517,910Other 4,580 10,249 19,627
Total $1,267,653 $1,245,473 $1,630,273
Property, plant and equipment, net:United States $ 127,360 $ 129,937 $ 136,041Europe 119,869 129,016 184,034Asia 2,818 10,384 12,092Other 32,207 34,911 40,640
Total $ 282,254 $ 304,248 $ 372,807
No one customer has accounted for more than 10% of net sales in the past three years.
39

13. Environmental Matters andContingencies:
The Company has been named as a potentiallyresponsible party in state and federal administrativeproceedings seeking contribution for costs associated with the correction and remediation of environmentalconditions at various hazardous waste disposal sites. The Company continues to monitor these actions andproceedings and to vigorously defend its interests. The Company’s ultimate liability in connection withenvironmental claims will depend on many factors,including its volumetric share of waste, the total cost ofremediation and the financial viability of other companiesthat also sent waste to a given site. Once it becomesprobable that the Company will incur costs in connectionwith remediation of a site and such costs can bereasonably estimated, the Company establishes or adjustsits reserves for its projected share of these costs. Thesereserves do not reflect any possible future insurancerecoveries, which are not expected to be significant, butdo reflect a reasonable estimate of cost sharing at multipleparty sites. Based upon information known to theCompany concerning the size of these sites, their years ofoperations and the number of past users, managementbelieves that it has adequate reserves with respect tothese matters. Such reserves for remediation, complianceand legal costs totaled $2,729 at March 31, 2000. Actualcosts may vary from these estimated reserves, but suchcosts are not expected to have a material adverse effect onthe Company’s financial condition or results of operations.
14. Acquisition:On June 2, 1998, the Company purchased the passive
component business of Thomson-CSF (“TPC”) for $74,000($58,000 in cash and $16,000 of assumed debt). Theacquisition was accounted for as a purchase and fundedthrough the use of working capital. Based upon marketvaluations of the fair values of the assets acquired andliabilities assumed the purchase price exceeded the fairvalue of net assets acquired by $47,800, which is beingamortized on a straight-line basis over 20 years. Theresults of operations of TPC are included in theaccompanying financial statements from the date ofacquisition.
15. Summary of Quarterly FinancialInformation (Unaudited):
Quarterly financial information for the years endedMarch 31, 1999 and 2000 is as follows:
First Quarter Second Quarter
1999 2000 1999 2000
Net sales $292,000 $343,150 $324,144 $371,573
Gross profit 51,460 53,859 42,604 67,421
Net income 17,402 17,446 10,514 26,107
Basic earnings per share .10 .10 .06 .15
Diluted earnings per share .10 .10 .06 .15
Third Quarter Fourth Quarter
1999 2000 1999 2000
Net sales $310,718 $416,412 $318,611 $499,138
Gross profit 36,914 87,792 36,431 131,458
Net income 6,052 42,507 7,548 70,872
Basic earnings per share .03 .24 .04 .41
Diluted earnings per share .03 .24 .04 .40
16. Subsequent Event:On April 20, 2000, the Board of Directors approved a
2-for-1 stock split of our common stock effected in theform of a 100% stock dividend. The additional commonstock was distributed on June 1, 2000 to holders of recordon May 15, 2000. All references in this report to thenumber of shares, per share amounts, and market pricesof the Company’s common stock have been restated toreflect the stock split and the resulting increased numberof common shares outstanding.
40

S H A R E H O L D E RI N F O R M AT I O N
Annual MeetingAVX’s Annual Meeting of share-
holders will be held at the Crown ReefResort and Conference Center, 2913South Ocean Boulevard, Myrtle Beach,South Carolina 29577 on Tuesday,July 25, 2000, at 10:00 a.m.
Stock ExchangeAVX’s common stock is traded
on the New York Stock Exchange(symbol: AVX)
Stock Transfer Agent andRegistrarThe American Stock Transfer and Trust Company1-800-937-5449
Written shareholder correspondenceand requests for transfers should besent to:
The American Stock Transfer and Trust Company40 Wall StreetNew York, New York 10005
Investor QuestionsInvestment questions from security
analysts, portfolio managers andshareholders about AVX and requestsfor a copy of AVX’s Annual Report onform 10-K for the fiscal year endedMarch 31, 2000, filed with theSecurities and Exchange Commission,should be directed to:
Investor Relations AVX CorporationP.O. Box 867Myrtle Beach, South Carolina 29578Telephone (843) 946-0466FAX (843) 448-6091www.avxcorp.com
Independent AccountantsPricewaterhouseCoopers LLP1100 Campanile Building1155 Peachtree StreetAtlanta, Georgia 30309-3630
B O A R D O F D I R E C T O R S
Benedict P. RosenChairman of the BoardAVX Corporation 4
Kazuo InamoriChairman EmeritusKyocera Corporation 2, 4
Kensuke ItohVice Chairman of the BoardKyocera Corporation 2, 4
Yasuo NishiguchiKyocera Corporation
John S. GilbertsonAVX Corporation
Donald B. ChristiansenAVX Corporation
Carroll A. Campbell, Jr.American Council of Life Insurers 1, 2, 3, 5
Rodney N. LanthorneKyocera Corporation 4
Henry C. LucasNew York University 1, 3, 5
Richard TresslerPennsylvania State University 1, 2, 3, 5
Michihisa YamamotoKyocera Corporation
Masahiro UmemuraKyocera Corporation 4
Yuzo YamamuraKyocera Corporation
C O R P O R AT E O F F I C E R S
Benedict P. RosenChief Executive Officer
John S. GilbertsonPresident, Chief Operating Officer
Donald B. ChristiansenChief Financial Officer,Senior Vice President of Finance and Treasurer
C. Marshall JacksonSenior Vice President of Sales and Marketing
Ernie ChiltonSenior Vice President of Tantalum
Allan ColeVice President of Sales
S.M. ChanVice President of Sales and Marketing - Asia
Alan GordonVice President of Sales and Marketing - Europe
Carl EggerdingVice President of Technology
John MannVice President of Quality
Roberto SalazarVice President of Latin American Operations
Kurt CummingsCorporate Controller and Secretary
1 Audit Committee2 Compensation Committee3 Equity Compensation Committee4 Executive Committee5 Special Advisory Committee
41

AccuGuard AVX product name for thin-filmfuses, which are commonly used inportable devices to protect againstcurrent surges.
Advanced ProductsSpecialty AVX devices that areusually designed to meet specificcustomer requirements. AVXAdvanced Products are often used inthe latest technology, enabling ourcustomers to stay ahead of theirmarket competitors.
Array (see Integrated Passive Devices)
Base Metals Metals, such as copper and nickel,are less expensive than preciousmetals, such as palladium, which israre and more expensive than gold.AVX is increasing the production ofparts using base metals in place ofthe more expensive metals.
CapacitanceThe measure of the capacitor’s abilityto store electrical energy.
Capacitors Energy storage devices made fromtwo or more conducting platesseparated by a nonconducting layer.Capacitor requirements vary fromproduct to product for instance, cellphone needs are vastly differentfrom those of computers.
Ceramics Clay and other minerals, some metaland nonmetal, are mixed and thenheated in high-oxygen environmentovens, known as kilns. The result is a brittle, heat-resistant substance thatconducts electricity in controlledamounts.
Chip Surface mount component.
Circuit Board Flat surface used in most electronicequipment, which carries a configu-ration of electronically or electro-magnetically connected components.
CochleaInner ear, snail shaped withthousands of tiny hair cells whichconvert vibrations of sound intoelectrical impulses and send thesesignals to the hearing nerve.
Connector Device used to join an appliance to an energy source. AVX’s connectordivision (formerly ELCO) has experi-enced above-average market growthin the last three years.
Directional Coupler Samples output of cell phone toensure proper power level.
Film Capacitor Capacitor using plastic films, such aspolyester or polypropylene, for thenonconducting dielectric layer.
Fiscal YearTwelve months ended March 31.
Glass Dielectric Capacitors A capacitor that uses layers ofceramic and glass to control the flowof electrical energy. Glass dielectriccapacitors can withstand very hightemperatures, such as thoseproduced in a jet engine.
I/O Connector (Input/Output Connector)Used for signals and battery charging.
InductorDevice which resists a change incurrent, used in cell phones to selectand filter high frequencies.
Integrated Passive Devices (IPD)Multiple components fabricated and interconnected on a ceramicsubstrate.
Kiln An oven that can reach up to 1300degrees centigrade used in theprocess of manufacturing ceramiccapacitors.
Low Profile Components that, when mounted on
a board, offer a low height dimension.
The AVX 6250/6252 ultralow profile
connector features a profile of only 0.9 mm, roughly the thickness of acredit card.
Motherboard In personal computers, the mother-board usually contains the primarycircuitry and processing chips. Otherdevices -- such as disk drives,modems, and monitors -- plug intothe primary circuit board. As the sizeof electronics has shrunk, so has thesize of motherboards, thus driving therequirement for small components,such as capacitors to be used.
Multilayer CeramicCapacitors (MLC)Widely used capacitors, made fromceramic material with up to 200layers. Each layer is as thin as ahuman hair.
PalladiumA precious metal with very highconductance qualities. Its desirability isoffset by the fact that it is availableonly in Russia and South Africa, andthe price has risen dramatically in thelast two years.
Passive ComponentsDevices that simply store, filter orconduct energy but do not generate asignal or energy. Common “passives”are capacitors, inductors and resistors.
Personal Digital Assistant (PDA)Small, increasingly popular handheldcomputers that can keep personalcalendars and address books, inaddition to performing otherfunctions. Many can synchronizeinformation with a personal computer.
ResistorDevice which provides resistance tocurrent flow, providing protectionagainst surges.
SAW FilterSurface Acoustic Wave filter.
Solostacker Connector™One piece connector used to join twoboards together.
SpinGuardAVX product name for axial leadedceramic capacitor. This product is mostcommonly used in smoke detectors.AVX is the world’s largest manufactur-er of axial-leaded ceramic capacitors.
Stacking HeightThe height required by componentsmounted on printed circuit boards toavoid contact. In desktop computersthis height might be nearly one-halfinch. In the smaller handheld devicesand cell phones used today, theheight may be as small as 0.6 mm orthe thickness of a thin coin.
StaticGuardAVX product name for low-energy-rated transient voltage suppressors.The devices primarily prevent staticelectricity from damaging equipmentand are commonly used in portableproducts, such as cell phones.
Surface Mount Device (SMD)Devices attached directly to a circuitboard, unlike leaded capacitors,which are attached to the board usingwire leads. In recent years, there hasbeen significant industry-wide growthin the use of SMDs.
TantalumA very hard, heavy gray metal that isextremely resistant to chemical andtemperature attacks. This naturallyoccurring element is found in SouthAfrica, Australia and parts of Asia. AVX imports tantalum in a powderform, and then presses it into shapeto begin the process that createscapacitors. When tantalum iscompressed 60%, it has a porousquality, which provides more surfacearea to store energy. It is a very stablematerial that can be pressed intocapacitors as small as 0.9 mm. AVX’stantalum capacitors are used in manydifferent types of electronics, includingpersonal computers, aerospaceelectronics, communications andinformation systems.
TCXO (TemperatureControlled Clock Oscillator)Provides precision and frequencyused in wireless communicationdevices.
Thin-Film CapacitorsCapacitor manufactured using highlyaccurate “state-of-the-art” clean-roomequipment with extremely tighttolerances.
VCO (Voltage ControlledOscillator)Controls system frequency used inwireless communication devices.
|Z|-ChipMiniature resistor-capacitor combina-tions manufactured as a single chip.
GLOSSARY OFCOMMONLYUSED TERMS

P o s t O f f i c e B o x 8 6 7 M y r t l e B e a c h S o u t h C a r o l i n a 2 9 5 7 8
w w w . a v x c o r p . c o m
A KYOCERA GROUP COMPANY
Copyright © 2022 FDOKUMEN