Digital Microwave Corporation
44
Digital Microwave Corporation 2000 Annual Report (DMC Stratex Networks, Inc.) evolution 2000
-
Upload
khangminh22 -
Category
Documents
-
view
0 -
download
0
Transcript of Digital Microwave Corporation

Digital Microwave Corporation 2000 Annual Report
(DMC Stratex Networks, Inc.)
evolu t i o n 2000

Worldwide, the demand for data is driving networks to higher and
higher capacity services. The systems transporting data and voice are
changing. T1/E1 lines are yielding to DS-3/E3; DS-3/E3 services are
migrating to the fiber-optics-level services of OC-3/STM-1.
As of Fiscal 2000, the Company is leveraging its extensive expertise in
network interconnection and is already delivering wireless technologies
that augment, complement or take the place of fiber in networks
throughout the world. And, higher capacity wireless solutions are on
the horizon.
Digital Microwave Corporation is leading
the advance of wireless solutions into a new
generation of broadband transport.
Altium
Millennium*
DART1 .5Mbps
1 55Mbps
3 11Mbps
6 22Mbps
DXR
SPECTRUM II
XP4
* under development
45Mbps
4XOC-3/4XSTM-1
OC-12/STM-4
2XOC-3/2XSTM-1
OC-3/STM-1
DS-3/E3
T1/E1

Digital Microwave Corporation 2000 Annual Report 1
In our prior year ’s report to our Stockholders, we detailed the preparation
and starting-line plans for Digital Microwave Corporation’s recovery and
growth following 1998’s world economic crises. A year later, we now report
our successes and the momentum of the activities triggered by those plans.
Compelled and propelled to action, we moved in rapid succession through
evolutionary events. We strengthened our Knancials; streamlined operations;
rolled out new products; expanded the range and reach of our solutions;
enabled faster deployment of higher capacity networks; became the leader
in broadband wireless access.
“ rea dy… s e t … g o.”after
The momentum, the driving energy, and the
milestones of the effort are our Fiscal 2000
countdown to new beginnings.

2
10 Return to proKtability in the fy 2000 Krst quarter spurs momentum for growth
throughout the year.
9 Quarter-by-quarter increases in new orders conKrm global market recoveries and
acceptance of our extensive solutions-based product line.
te n
n ine9
10

Digital Microwave Corporation 2000 Annual Report 3
8 Heightened demands for data serving voice, Internet, and private network require-
ments drive the need for broadband communications in buildings not connected
to Kber optic networks—especially in the U.S. and Europe.
e i g h t 8

4
7 Exceptional year-to-year growth in our broadband access product orders
conKrms acceptance of our wireless solutions as complements and alternatives
to Kber optics in this burgeoning new market.
6 Our rapid rollout of the Altium™ radio product line makes it the most available
and popular 155 Mbps broadband access radio in the world—and the most
successful product launch in the Company’s history.
six
s even7
6

Digital Microwave Corporation 2000 Annual Report 5
5 New transmission technology patents and the development of our proprietary
Ve l o c i t y chipset mark break-through technical innovations enabling future
product developments.
4 Focused on ultra-high-capacity access solutions, we launch Project Millennium—
a synergistic, total company program for development of wireless solutions
matching higher Kber speeds.
five
fou r
5
4

6
3 With North America revenues nearly doubling year-to-year, the company takes
a leadership position in the growing U.S. broadband wireless access market.
2 Careful Knancial management, a solid cash position, and appropriate asset
utilization prepare the company Knancially for future investments and developments.
two
t hree 3
2

Digital Microwave Corporation 2000 Annual Report 7
1 Working as a strategic partner to customers developing networks
worldwide, the Company outgrows its product-focused Digital Microwave
name. A new name for the new Company is recommended to the Stockholders:
DMC Stratex Networks, Inc.
o n e 1

These are dynamics that push e v o l u t i o n into r e v o l u t i o n. For DMC Stratex Networks, the
countdown of evolutionary events has launched a revolutionary company—one that is new
and yet well grounded in a powerful heritage and history; a company positioned to meet the
revolutionary needs of communications networks into the future.
Because of Internet access and high-speed data communications, the global need for speed
and network capacity is unprecedented and growing exponentially. DMC Stratex Networks
is leading the development of the high- and ultra-high-capacity wireless access solutions that
implement quickly, complement Kber optics where it exists, and take the place of Kber where
it cannot be installed easily or economically.
In mobile communications, where the Company has a long history as a transmission systems
supplier, the industry is moving toward more and more data services over digital cellular net-
works. DMC Stratex Networks is the ready solutions provider meeting the higher capacity
needs of these networks as they expand services to growing numbers of subscribers.
Broadband. Access. Fixed Wireless. Mobile Networks. The terms connote the industry
revolution guaranteeing that future requirements will be different from those of the past.
DMC Stratex Networks. The name identiKes a company that is revolutionized and ready—
equipped by the past and poised for the future—to innovate, develop, deliver, partner, and
otherwise participate in this communications revolution.
Embracing the beneKts of change.
Understanding the dangers of delay.
Seizing opportunities.
Taking risks. Working hard.
Creating alliances.
revol u tion2001

Digital Microwave Corporation 2000 Annual Report 9
net income ($ millions)
altium net sales growth ($ millions)
FY 2000
year-to-year
increase: 99%
year-to-year
increase: 27%
net sales growth ($ millions)
North America W o r l d w i d e
year-to-year
increase: 813%
net sales by geography ($ millions)
year-to-year
increase: 75%
backlog ($ millions)
FY 2000

10
to our stockholders,
We are extremely pleased to report that Fiscal Year 2000 was a very positive time for your
Company. When we wrote to you a year ago at the end of the 1999 Fiscal Year, we outlined
our plans to rebound from a tough year caused by the dramatic and sudden downturn in
economies in some of our major world markets. In writing to you now—reporting the results
of Fiscal Year 2000—we are pleased to be able to tell you that we not only have rebounded;
but that we have emerged as a leader in some of the most dynamic and growing areas of the
world communications marketplace.
Our preparation and focus coming into the year created positive results almost immediately.
Our own improvements showed progress at about the same time that we began to see positive
business indicators, including the increased liquidity that allowed our customers once again
to implement their network development plans. We regained proKtability in the Krst quarter,
and rapid growth in demand—especially for our new products—followed, providing solid, quar-
ter-to-quarter improvements in top and bottom line results. In addition to our new Altium™
,
DART™
, XP4, and DXR™
700 radios, we launched ProVision™
, a new network management
system built on an enterprise-based system serving data networking. Advances in our strength-
ened product position, coupled with improvements in the balance sheet, set the pace for rapid
progress throughout the year.
By the end of the second quarter of Fiscal 2000, our Altium broadband radio was shipping in
most of its planned radio frequencies—making it the most successful and fastest product line
rollout in the Company’s history. Initial shipments of the 38 GHz Altium radio in the fourth
quarter, as planned, completed the product rollout. Intensive demands for bandwidth, driven
by data and enhanced voice offerings, have propelled Altium to become a high-visibility, indus-
try-leading product line.
During the year, while we continued to receive repeat business from existing customers as they
enhanced their networks, we gained new customers at a rapid rate. We also moved into more
strategic roles with our customers. We forged partnerships with major network developers, and
the Company emerged as a total solutions provider—meeting needs from initial network

Digital Microwave Corporation 2000 Annual Report 11
planning requirements through support of installed networks. We also opened a new regional
service center in the Philippines, complementing existing service and support centers in
California, New Zealand, and Scotland.
We strengthened the business infrastructures underlying the operational foundation of the
Company to accelerate our growth. We began implementing major new internal systems for
manufacturing, services, quality, engineering, and sales.
An important part of our building strength was the enhancement of our management group at
both the executive and operations levels during the year. The addition of Harvey Scheingold,
Vice President of Quality, to the corporate executive staff underscored our emphasis on quality
throughout the Company. We brought in strong general managers at our key manufacturing
sites. And, as our signatures on this letter conKrm, Sam Smookler moved into expanded respon-
sibilities as President and Chief Executive OfKcer, allowing Chuck Kissner, as Chairman,
to focus more fully on new, strategic areas of business development for the Company.
Now, the Company enjoys a signiKcant position as a premier provider of high-capacity
wireless access solutions. Our product offerings in the Kber-level OC-3/STM-1 Altium radio
family are augmented by our multiple products at DS-3 and E3 capacities in our XP4, DXR
and SPECTRUM II products.
The trend toward higher capacity networks is undeniable, and your Company is at the forefront
in providing the best wireless solutions to meet those needs. For example, the Altium radio
product family is a vanguard wireless solution for delivery of capacities previously transported
only by Kber optics. It is our intention to drive the technology of wireless—as a high-capacity
solution—to higher speeds and capacities.
We have now launched a major product development program termed Millennium that aims to
create these higher capacity wireless transmission systems to meet future needs. Development
this year of a chipset, which we have called Velocity, a proprietary technology, enables and
speeds our product developments in this area.

12
Executive Staff (from left to right):
Charles D. Kissner, C h a i r m a n
Sam Smookler, President and CEO
Carl A. Thomsen, Senior Vice President,
CFO, and Corporate Secretary
John Brandt, Vice President and
Corporate Controller
Paul A. Kennard, Chief Technical Officer
Carol A. Goudey, Corporate Treasurer
and Assistant Secretary
Frank Carretta, Jr., Senior Vice President,
Worldwide Sales
Harvey E. Scheingold, Vice President,
Corporate Quality
John P. O’Neil, Vice President, Personnel

Digital Microwave Corporation 2000 Annual Report 13
Charles D. KissnerChairman of the Board
Sam SmooklerPresident and CEO
The advances during Fiscal 2000 provided strong indicators that we needed to re-identify the
Company for our many audiences. Digital Microwave Corporation has enjoyed a recognized
position as a provider of microwave radios. The Company now has also earned a signiKcant and
sustainable market position as a provider of broadband wireless access solutions. This position
is grounded in the heritage of Digital Microwave Corporation’s product expertise, yet it goes
beyond the product focus of the historical company both in strategic involvement and in the
higher aim of its broadband emphasis.
Access to higher capacity, data-intensive communication services such as the Internet and
worldwide private networks is required for survival in today’s businesses and in education.
While most buildings, even in countries with established communication infrastructures, do
not have the Kber-speed access required, we are now equipping networks with just such capacity
in cost-effective wireless solutions. And, we expect our leadership in doing so will continue.
The advances, the momentum, and the energy of this year have been revolutionary in their
effect. As a result, coincident with this report, we are recommending that our Stockholders
approve a new company name: DMC Stratex Networks, Inc. “DMC” recognizes our heritage.
“Stratex,” based in the meanings of “strategic” and “high” (as in “stratospheric”), is a powerful
new name identifying the Company’s advances into ultra-high-capacity solutions. “Networks”
allies us with our customers, with whom we are playing an increasing role in providing complete
network solutions that promise to unite the world with communications.
In conclusion, we thank our many employees for their dedication and accomplishments, and
our stockholders and customers who continued to work with us during both the difKcult times
as well as the more gratifying times that we now are experiencing. We share our conKdence that
with ongoing focus, dedication, and attentive hard work, the new DMC Stratex Networks, Inc.,
will continue to lead the advance of communications worldwide.

14
years ended march 31,
2000 1999 1998 1997 1996
(in thousands, except per share data and number of employees)
Net sales $ 300,503 $ 236,499 $ 345,116 $ 213,441 $ 174,380
Net income (loss) $ 12,136 $ (96,729) $ 18,818 $ 6,461 $ (13,533)
Diluted earnings (loss) per share $ 0.17 $ (1.57) $ 0.35 $ 0.13 $ (0.35)
Total assets $ 337,441 $ 202,164 $ 297,196 $ 200,504 $ 113,597
Working capital $ 209,161 $ 85,247 $ 167,623 $ 105,233 $ 43,684
Stockholders’ equity $ 264,392 $ 131,213 $ 226,600 $ 87,947 $ 24,802
Total employees at year end 974 873 1,324 939 670
Diluted weighted average shares outstanding 71,642 61,601 54,459 50,464 38,604
Knancial highlights and stock information

The following Management’s Discussion and Analysis of
Financial Condition and Results of Operations contains forward-
looking statements that involve risks and uncertainties. The
Company’s actual results could differ materially from those anti-
cipated in these forward-looking statements as a result of certain
factors, including those set forth under “Factors That May Affect
Future Financial Results” and elsewhere in this Annual Report.
Overview
Digital Microwave Corporation designs, manufactures, and
markets advanced wireless solutions for worldwide communica-
tion network interconnection and access. The Company
was founded in 1984 and has shipped over 163,000 microwave
radios worldwide.
The Company has equipment installed in over 90 countries, and
a signiKcant portion of the Company’s revenue is derived from
sales outside the United States. The Company’s revenues from
sales for equipment and services outside the United States were
79% in Fiscal 2000, 87% in Fiscal 1999, and 93% in Fiscal 1998.
Results of Operations
The following table sets forth the percentage relationships of
certain items from the Company’s Consolidated Statements of
Operations as a percentage of net sales for the periods indicated:
years ended march 31,
2000 1999 1998
Net sales 100.0% 100.0% 100.0%
Cost of sales 69.8 78.4 64.0
Inventory valuation charges — 16.0 1.7
Gross proKt 30.2 5.6 34.3
Research and development 8.1 10.2 7.1
Selling, general, and
administrative 17.3 23.4 18.9
Merger and restructuring — 12.7 2.5
Operating income (loss) 4.8 (40.7) 5.8
Other income, net 0.2 0.1 0.8
Income (loss) before provision
for income taxes 5.0 (40.6) 6.6
Provision for income taxes 1.0 0.3 1.1
Net income (loss) 4.0% (40.9)% 5.5%
Year Ended March 31, 2000 Compared to the Year Ended
March 31, 1999
Net Sales. Net sales for Fiscal 2000 were $300.5 million, a 27%
increase compared to net sales of $236.5 million in Fiscal 1999.
The increase in net sales occurred across all the Company’s
major product families, which includes SPECTRUM™ II, XP4,
DXR™ and the Altium™ product lines. Net sales of the Altium
product lines, which began volume shipments in January 1999,
increased to $47.5 million in Fiscal 2000 from $5.3 million in
Fiscal 1999. Net sales of the XP4 product lines increased to $61.7
million in Fiscal 2000 from $32.2 million in Fiscal 1999. Net sales
for other products, including older product lines that have been
phased out, amounted to $13.6 million in Fiscal 2000 compared
to $33.7 million in Fiscal 1999. Service revenue declined to $15.1
million in Fiscal 2000 from $21.0 million in Fiscal 1999. The
decline in service revenue was primarily attributable to the sale of
the Granger, Inc., operation in the last quarter of Fiscal 1999.
The increase in net sales for Fiscal 2000 compared to Fiscal 1999
occurred across all the Company’s geographic regions, except
for the Europe/Middle East region. Sales to the Europe/Middle
East region customers decreased slightly to $81.8 million in
Fiscal 2000, compared to $83.2 million in Fiscal 1999. Net sales
increased in the Americas to $119.3 million in Fiscal 2000 from
$84.0 million in Fiscal 1999. Net sales to U.S. customers, includ-
ed in the Americas region, increased to $63.0 million in Fiscal
2000 from $31.8 million in Fiscal 1999. Net sales to customers in
Mexico, which also is included in the Americas region, increased
to $32.1 million in Fiscal 2000 from $14.6 million in Fiscal 1999.
Net sales in the Asia/PaciKc region increased to $80.4 million in
Fiscal 2000 from $50.3 million in Fiscal 1999. Net sales to China,
included in the Asia/PaciKc region, increased to $48.3 million in
Fiscal 2000 from $18.1 million in Fiscal 1999. See Note 6 of the
Notes to Consolidated Financial Statements.
New orders for Fiscal 2000 were $351.1 million, an increase of
49% compared to orders during Fiscal 1999 of $234.9 million.
The backlog at March 31, 2000, was $111.8 million compared to
$63.9 million at March 31, 1999.
The Company includes in its backlog purchase orders with
respect to which a delivery schedule has been speciKed for prod-
uct shipment within one year. Orders in the Company’s current
backlog are subject to changes in delivery schedules, or to cancel-
lation at the option of the purchaser without signiKcant penalty.
Accordingly, although useful for scheduling production, backlog
as of any particular date may not be a reliable measure of sales for
any future period.
Digital Microwave Corporation 2000 Annual Report 15
management’s discussion and analysis of Knancial condition and results of operations
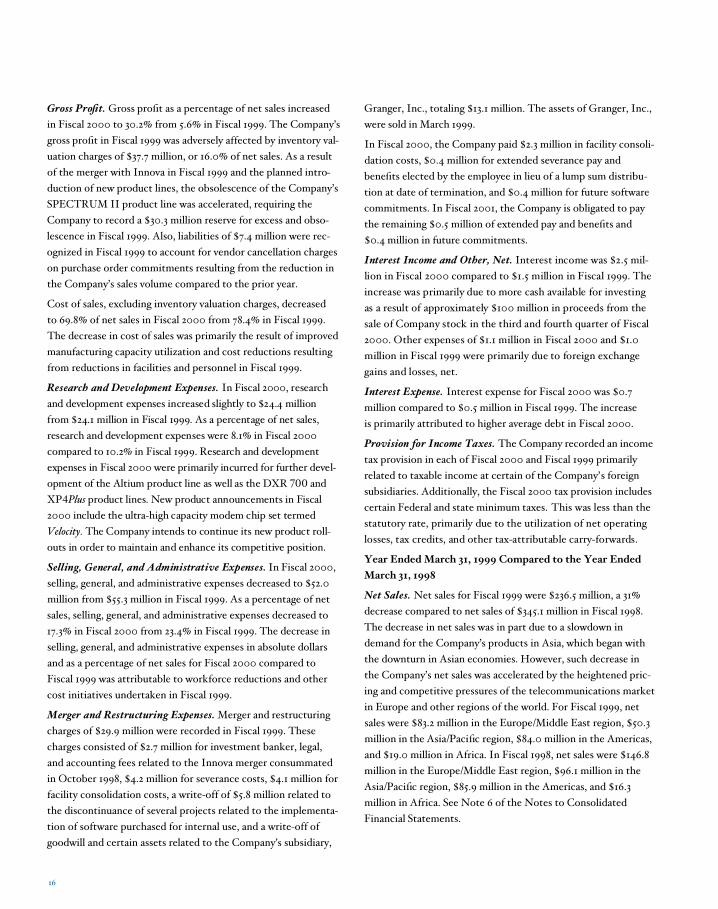
Gross ProKt . Gross proKt as a percentage of net sales increased
in Fiscal 2000 to 30.2% from 5.6% in Fiscal 1999. The Company’s
gross proKt in Fiscal 1999 was adversely affected by inventory val-
uation charges of $37.7 million, or 16.0% of net sales. As a result
of the merger with Innova in Fiscal 1999 and the planned intro-
duction of new product lines, the obsolescence of the Company’s
SPECTRUM II product line was accelerated, requiring the
Company to record a $30.3 million reserve for excess and obso-
lescence in Fiscal 1999. Also, liabilities of $7.4 million were rec-
ognized in Fiscal 1999 to account for vendor cancellation charges
on purchase order commitments resulting from the reduction in
the Company’s sales volume compared to the prior year.
Cost of sales, excluding inventory valuation charges, decreased
to 69.8% of net sales in Fiscal 2000 from 78.4% in Fiscal 1999.
The decrease in cost of sales was primarily the result of improved
manufacturing capacity utilization and cost reductions resulting
from reductions in facilities and personnel in Fiscal 1999.
Research and Development Expenses. In Fiscal 2000, research
and development expenses increased slightly to $24.4 million
from $24.1 million in Fiscal 1999. As a percentage of net sales,
research and development expenses were 8.1% in Fiscal 2000
compared to 10.2% in Fiscal 1999. Research and development
expenses in Fiscal 2000 were primarily incurred for further devel-
opment of the Altium product line as well as the DXR 7 0 0 a n d
X P4P l u s product lines. New product announcements in Fiscal
2000 include the ultra-high capacity modem chip set termed
V e l o c i t y . The Company intends to continue its new product roll-
outs in order to maintain and enhance its competitive position.
Selling, General, and Administrative Expenses. In Fiscal 2000,
selling, general, and administrative expenses decreased to $52.0
million from $55.3 million in Fiscal 1999. As a percentage of net
sales, selling, general, and administrative expenses decreased to
17.3% in Fiscal 2000 from 23.4% in Fiscal 1999. The decrease in
selling, general, and administrative expenses in absolute dollars
and as a percentage of net sales for Fiscal 2000 compared to
Fiscal 1999 was attributable to workforce reductions and other
cost initiatives undertaken in Fiscal 1999.
Merger and Restructuring Expenses. Merger and restructuring
charges of $29.9 million were recorded in Fiscal 1999. These
charges consisted of $2.7 million for investment banker, legal,
and accounting fees related to the Innova merger consummated
in October 1998, $4.2 million for severance costs, $4.1 million for
facility consolidation costs, a write-off of $5.8 million related to
the discontinuance of several projects related to the implementa-
tion of software purchased for internal use, and a write-off of
goodwill and certain assets related to the Company’s subsidiary,
Granger, Inc., totaling $13.1 million. The assets of Granger, Inc.,
were sold in March 1999.
In Fiscal 2000, the Company paid $2.3 million in facility consoli-
dation costs, $0.4 million for extended severance pay and
beneKts elected by the employee in lieu of a lump sum distribu-
tion at date of termination, and $0.4 million for future software
commitments. In Fiscal 2001, the Company is obligated to pay
the remaining $0.5 million of extended pay and beneKts and
$0.4 million in future commitments.
Interest Income and Other, Net. Interest income was $2.5 mil-
lion in Fiscal 2000 compared to $1.5 million in Fiscal 1999. The
increase was primarily due to more cash available for investing
as a result of approximately $100 million in proceeds from the
sale of Company stock in the third and fourth quarter of Fiscal
2000. Other expenses of $1.1 million in Fiscal 2000 and $1.0
million in Fiscal 1999 were primarily due to foreign exchange
gains and losses, net.
Interest Expense. Interest expense for Fiscal 2000 was $0.7
million compared to $0.5 million in Fiscal 1999. The increase
is primarily attributed to higher average debt in Fiscal 2000.
Provision for Income Taxes. The Company recorded an income
tax provision in each of Fiscal 2000 and Fiscal 1999 primarily
related to taxable income at certain of the Company’s foreign
subsidiaries. Additionally, the Fiscal 2000 tax provision includes
certain Federal and state minimum taxes. This was less than the
statutory rate, primarily due to the utilization of net operating
losses, tax credits, and other tax-attributable carry-forwards.
Year Ended March 31, 1999 Compared to the Year Ended
March 31, 1998
Net Sales. Net sales for Fiscal 1999 were $236.5 million, a 31%
decrease compared to net sales of $345.1 million in Fiscal 1998.
The decrease in net sales was in part due to a slowdown in
demand for the Company’s products in Asia, which began with
the downturn in Asian economies. However, such decrease in
the Company’s net sales was accelerated by the heightened pric-
ing and competitive pressures of the telecommunications market
in Europe and other regions of the world. For Fiscal 1999, net
sales were $83.2 million in the Europe/Middle East region, $50.3
million in the Asia/PaciKc region, $84.0 million in the Americas,
and $19.0 million in Africa. In Fiscal 1998, net sales were $146.8
million in the Europe/Middle East region, $96.1 million in the
Asia/PaciKc region, $85.9 million in the Americas, and $16.3
million in Africa. See Note 6 of the Notes to Consolidated
Financial Statements.
16

Net sales for Fiscal 1999 of SPECTRUM II decreased to $111.8
million from $175.3 million in Fiscal 1998. Net sales of the
DXR product line increased to $32.5 million in Fiscal 1999 from
$30.6 million in Fiscal 1998. Net sales of the XP4 product line
decreased to $32.2 million in Fiscal 1999 from $36.1 million in
Fiscal 1998. Net sales of the new Altium product line, which
started shipping in Fiscal 1999, were $5.3 million. Net sales for
other products and services, including older product lines that
have been phased out, amounted to $54.7 million in Fiscal 1999
compared to $103.1 million in Fiscal 1998.
Gross ProKt . Inventory valuation charges, included in cost
of sales, totaled $37.7 million in Fiscal 1999 and $5.9 million in
Fiscal 1998. In Fiscal 1999, these inventory valuation charges
consisted primarily of two main components: an excess and
obsolescence adjustment, and cancellation charges to vendors
for purchase commitments. The merger with Innova and planned
introduction of new product lines accelerated the obsolescence
of the SPECTRUM II product line. Accordingly, inventory-
related charges of $30.3 million were recorded. The reduction
in the Company’s sales volume compared to the prior year had
an adverse effect on purchase order commitments to vendors.
Accordingly, liabilities of $7.4 million were recognized to
account for vendor cancellation and related charges on purchase
order commitments. In Fiscal 1998, the inventory valuation
charges were for the phase-out of older product lines. Gross
proKt margin percentage in Fiscal 1999, excluding inventory
valuation charges, was lower than in Fiscal 1998 primarily due
to underutilization of manufacturing capacity and lower average
selling prices of the SPECTRUM II product line. The Company
reduced its workforce at the end of the Krst quarter of Fiscal
1999 and in the third quarter of Fiscal 1999 to minimize the
impact of unfavorable capacity utilization and lower sales.
Research and Development Expenses. Research and develop-
ment expenses for Fiscal 1999 of $24.1 million were slightly lower
than the $24.5 million reported in Fiscal 1998. However, as a per-
centage of sales, research and development expenses increased
from 7.1% for Fiscal 1998 to 10.2% for Fiscal 1999. This increase
was due primarily to the decrease in net sales over the compara-
ble period. Research and development expenses for Fiscal 1999
were primarily attributable to the Company’s development and
improvements of its XP4, DART, and DXR 700 product offer-
ings and its new Altium high-capacity wireless product platform.
Selling, General, and Administrative Expenses. Selling, general,
and administrative expenses for Fiscal 1999 decreased by $10.0
million to $55.3 million from $65.3 million in Fiscal 1998. As
a percentage of net sales, selling, general, and administrative
expenses were 23.4% in Fiscal 1999 compared to 18.9% in
Fiscal 1998. This increase in percentage was due primarily to the
decrease in net sales over the comparable period. The decrease
in selling, general, and administrative expenses in absolute dollars
was mostly attributable to the workforce reductions in the Kr s t
and third quarters of Fiscal 1999. Partially offsetting this decrease
is an increase in the provision for bad debts for speciKc customers,
which was included in selling, general, and administrative expens-
es. The provision for bad debts included in Fiscal 1999 was $4.6
million compared to $0.4 million in Fiscal 1998. The increase
in the provision for bad debts from Fiscal 1998 was the result
of write-offs taken relating to two customer accounts which
totaled $4.3 million.
Merger and Restructuring Expenses. Merger and restructuring
charges of $29.9 million were recorded in Fiscal 1999. As a result
of the slowdown in the demand for the Company’s products,
which began with the downturn in various Asian economies in
which the Company sells its products, which was accelerated by
the heightened pricing and competitive pressures of the telecom-
munications market in Europe and other regions of the world in
Fiscal 1998 and Fiscal 1999, the Company undertook strategic
cost savings measures to reflect reduced sales levels and to make
the Company more competitive. The Company consolidated
its facilities in San Jose, California, and reduced its occupancy,
primarily for manufacturing, from approximately 230,000 square
feet to 132,000 square feet. Also, the Company discontinued its
manufacturing operation in Scotland and subsequently established
a regional service and repair center. Additionally, the Company
closed various worldwide sales ofKces, some of which, as a result
of the merger with MAS Technology in March 1998, were duplica-
tions of regional coverage. The closing of the facilities discussed
above was completed in Fiscal 1999. Facility consolidation costs
totaled $4.1 million, of which $1.8 million was paid in Fiscal 1999,
and $2.3 million was paid in Fiscal 2000.
Concurrent with the facilities closures, the Company reduced
its workforce by 312 employees, or 27% of its average Fiscal 1998
workforce of 1,147. Of the 312 employees affected, 71% were manu-
facturing-related positions, 7% were research and development
positions and 22% were in sales, marketing, and administration.
The workforce reductions were completed by March 31, 1999.
Severance costs totaled $4.2 million in Fiscal 1999, of which $3.3
million was paid in Fiscal 1999, $0.4 million was paid in Fiscal
2000, and $0.5 million remains to be paid during Fiscal 2001.
Future severance payments are for extended severance pay and
b e n eKts elected by the employee in lieu of a lump sum distribution
at date of termination.
Digital Microwave Corporation 2000 Annual Report 17

The Company also discontinued projects related to the imple-
mentation of enterprise-wide software purchased for internal
use totaling $5.8 million, of which $0.6 million was paid in Fiscal
1998, $4.4 million was paid in Fiscal 1999, and $0.4 million was
paid in Fiscal 2000, and the remaining $0.4 million will be paid
during Fiscal 2001 and consists of software commitments.
Merger costs expensed in Fiscal 1999, related to the merger of
Innova consummated in October 1998, totaled $2.7 million and
consisted of $1.6 million to investment bankers, $0.7 million for
legal and accounting services, and $0.4 million for other direct
merger-related expenses. All expenses were paid in Fiscal 1999.
As part of the restructuring in the third quarter of Fiscal 1999,
the Company concluded that the carrying value of the
Company’s investment in Granger, Inc., a wholly owned sub-
sidiary, was impaired due to changes in business conditions,
including the slowdown in demand for its products in the U.S.
PCS market. Accordingly, the Company wrote-off $9.6 million
of goodwill related to the Granger acquisition. In addition, the
Company wrote-off other assets, primarily assets of Granger,
Inc., totaling $3.5 million. No facilities were closed or employees
terminated as part of the write-down of assets. In March 1999,
Granger was subsequently sold at net book value for $3.2 million
with extended payment terms to Granger’s former managers.
Interest and Other Income, Net. Interest income was $1.5 mil -
lion in Fiscal 1999 compared to $3.1 million in Fiscal 1998. This
decrease resulted primarily from lower average cash balances.
Other Income, Net is primarily due to foreign exchange gains
and losses and the cost of foreign currency hedge contracts.
Interest Expense. Interest expense for Fiscal 1999 was $0.5
million compared to $0.9 million in Fiscal 1998. The decrease
in interest expense was primarily attributable to lower average
lease obligations and debt in Fiscal 1999.
Provision for Income Taxes. The Company recorded an
income tax provision in Fiscal 1999 related to taxable income
at certain of the Company’s foreign subsidiaries. In Fiscal 1998,
the Company recorded an income tax provision at an effective
rate of 17%. This was less than the statutory rate, primarily due
to the utilization of net operating losses, tax credits, and other
tax-attributable carry-forwards.
Liquidity and Capital Resources
Net cash provided by operating activities in Fiscal 2000 was $5.9
million, compared to net cash used for operating activities of
$10.7 million in Fiscal 1999. The improvement in cash flows from
operating activities was primarily the result of a substantial loss
for Fiscal 1999 of $96.7 million, compared to net income of
$12.1 million for Fiscal 2000. Accounts receivable in Fiscal 2000
increased $41.4 million, or 65%, from Fiscal 1999. The increase
in accounts receivable is primarily due to the increase in sales
volume in the fourth quarter of Fiscal 2000, to $88.6 million
from $59.7 million in the fourth quarter of Fiscal 1999, and to
the timing of shipments, as approximately 60% of the Company’s
fourth quarter shipments occurred in the last month of the quar-
ter compared to 43% in the same quarter a year ago. Accounts
payable increased $15.1 million in support of the increase in pur-
chase volume in Fiscal 2000. Other accrued liabilities in Fiscal
2000 decreased $17.3 million from Fiscal 1999 primarily as a
result of the Company’s payment of the accrued purchase order
cancellation and other costs, $10.2 million, set up as part of
merger and restructuring expenses in Fiscal 1999.
Purchases of property and equipment decreased to $23.9 million
in Fiscal 2000 from $24.7 million in Fiscal 1999. Purchases in
Fiscal 2000 were primarily for new test equipment and the
installation of new enterprise-wide business and manufacturing
systems. In Fiscal 2000 the Company invested $7.3 million for
a minority interest in Ensemble Communications, a supplier of
broadband wireless access equipment. The Company also placed
in escrow an additional $3.0 million for a subsequent investment
in August 2000. The subsequent investment is at the option and
sole discretion of Ensemble Communications.
On October 1, 1999, the Securities and Exchange Commission
declared the Company’s registration statement on Form S-3
effective. Under the registration statement, the Company could
sell up to $100 million in debt securities, common stock, debt
warrants and common stock warrants. During Fiscal 2000 the
Company used its shelf registration statement to sell 4,797,368
shares of its common stock and received approximately $99.8
million, net of costs of $0.2 million. The Company currently
intends to use the net proceeds for general corporate purposes,
including working capital and strategic investments and acquisi-
tions. Additionally, the Company received $22.4 million from
the exercise of employee stock options and warrants in Fiscal
2000 compared to $1.2 million in Fiscal 1999.
In December 1999, the Company elected not to renew its $40.0
million asset-based borrowing facility with a U.S. lender and
repaid $2.6 million outstanding under the facility.
At March 31, 2000, the Company’s principal sources of liquidity
consisted of $123.9 million in cash, cash equivalents and short-
term investments. In the future, the Company may require addi-
tional Knancing; however, there can be no assurance that the
18

Company will be able to obtain such additional Knancing in the
required time frame on commercially reasonable terms, or at all.
However, the Company believes that it has the Kn a n c i a l
resources needed to meet its business requirements for the
foreseeable future.
Many currently installed computer systems and software products
are coded to accept only two digit entries in the date code Keld.
As a result, software that records only the last two digits of the
calendar year may not be able to distinguish whether “00” means
1900 or 2000. Residual Year 2000 problems may result in miscal-
culations, data corruption, system failures or disruption of opera-
tions. To date the Company has not experienced any signiKc a n t
Year 2000 problems in its internal technology systems or with
vendors of systems the Company believes to be critical to its busi-
ness. In addition, the Company believes that it is unlikely it will
experience any signiKcant Year 2000 problems in the future.
However, the Company’s applications operate in complex net-
work environments and directly and indirectly interact with a
number of other hardware and software systems. The Company
cannot predict whether Year 2000 unknown errors or defects
that affect the operation of software and systems that it uses in
operating its businesses will arise in the future. If residual Year
2000 problems cause the failure of any of the technology, soft-
ware, or systems necessary to operate its business, the Company
could lose customers, suffer signiKcant disruptions in its business,
lose revenues, and incur substantial liabilities and expenses. The
Company could also become involved in costly litigation resulting
from Year 2000 problems. This could seriously harm the Com-
pany’s business, Knancial condition and results of operations.
The Company spent approximately $0.8 million investigating
and remedying issues related to Year 2000 readiness involving
internal operations, including purchases of software test tools,
software upgrades, and upgrading a security system related to
Year 2000 readiness. In addition, the Company estimates that
$0.5 million of internal personnel costs were incurred to support
the Company’s Year 2000 readiness plan.
Recent Accounting Standards
In June 1998, the FASB issued Statement of Financial Accounting
Standards No. 133 (“SFAS No. 133”), “Accounting for Derivative
Instruments and Hedging Activities.” SFAS No. 133 is effective
for companies with Kscal years beginning after June 15, 2000,
and requires the Company to recognize all derivatives on the
balance sheet at fair value. Derivatives that are not hedges must
be adjusted to fair value through income. If the derivative is a
hedge, depending on the nature of the hedge, changes in the
fair value of derivatives will either be offset against the change
in fair value of the hedged assets, liabilities or Krm commitments
through earnings, or recognized in other comprehensive income
until the hedged item is recognized in earnings. The Company
believes that the adoption of this new pronouncement will not
have a material effect on the Company’s Knancial statements.
In December 1999, the Securities and Exchange Commission
issued Staff Accounting Bulletin No. 101 (“SAB 101”), “Revenue
Recognition in Financial Statements.” SAB 101 provides guidance
on applying generally accepted accounting principles to revenue
recognition issues in Knancial statements. The Company will
adopt SAB 101 as required in the Krst quarter of 2001 and is
evaluating the effect that such adoption may have on its
consolidated results of operations and Knancial position.
European Monetary Union. In January 1999, a new currency
called the “euro” was introduced in certain Economic and
Monetary Union (“EMU”) countries. During 2002, all EMU
countries are expected to be operating with the euro as their
single currency. Uncertainty exists as to the effect the euro cur-
rency will have on the marketplace. Additionally, all of the rules
and regulations have not yet been deKned and Knalized by the
European Commission with regard to the euro currency. The
Company has assessed the effect the euro formation will have on
its internal systems and the sale of its products. The Company’s
European sales and operating transactions are based primarily in
U.S. dollars or U.K. pounds sterling, neither of which are subject
to the euro conversion. While the Company does have some sales
denominated in the European Currency Unit, this currency is
successfully being converted in the market to the new European
Monetary Unit at parity. In addition, the Company upgraded its
internal computer systems to convert the European currency to
the euro. The cost of upgrading the Company’s systems in con-
nection with the euro conversion was not material and no materi-
al adverse effect on the Company’s business, Knancial condition,
and results of operations is expected due to the upgrade.
Quantitative and Qualitative Disclosures About Market Risk
Interest Rate Risk. It is Digital Microwave’s policy not to enter
into derivative Knancial instruments except for hedging of foreign
currency exposures. The Company hedges certain portions of
its exposure to foreign currency fluctuations through the use of
forward foreign exchange contracts. The Company enters into
forward foreign exchange contracts for purposes other than
trading; however, the Company does not engage in any foreign
Digital Microwave Corporation 2000 Annual Report 19

20
currency speculation. Forward foreign exchange contracts repre-
sent agreements to buy or sell a speciKed amount of foreign cur-
rency at a speciKed price in the future. These contracts generally
have maturities that do not exceed one month. At March 31,
2000, the Company had forward foreign exchange contracts to
exchange various foreign currencies for U.S. dollars in the aggre-
gate amount of $45.8 million, primarily in New Zealand dollars,
British pounds, and European Monetary Units. Gains and
losses associated with currency rate changes on forward foreign
exchange contracts are recorded currently in income, as they
offset corresponding gains and losses on the foreign currency-
denominated assets and liabilities being hedged. Therefore, the
carrying value of forward foreign exchange contracts approxi-
mates their fair value. The Company believes that the credit
risk with respect to its forward foreign exchange contracts is
minimal because the Company enters into contracts with major
Knancial institutions. Market risk with respect to forward foreign
exchange contracts is offset by the corresponding exposure
related to the underlying assets and liabilities.
Foreign Currency Rate Risk. Although substantially all of
Digital Microwave’s sales and expenses are denominated in
U.S. dollars, Digital Microwave has experienced some foreign
exchange gains and losses to date, and expects to incur additional
gains and losses in Fiscal 2001. Digital Microwave did engage in
foreign currency hedging activities during Fiscal 2000, as
explained above, and intends to continue doing so as needed.
Factors That May Affect Future Financial Results
The Stockholders’ Letter and discussions in this Annual Report
concerning the Company’s future products, expenses, revenues,
gross margins, liquidity, and cash needs, as well as the Company’s
plans and strategies, contain forward-looking statements con-
cerning the Company’s future operations and Knancial results.
These forward-looking statements are based on current expecta-
tions, and the Company assumes no obligation to update this
information. Numerous factors— such as economic and competi-
tive conditions, timing and volume of incoming orders, shipment
volumes, product margins, and foreign exchange rates— could
cause actual results to differ materially from those described in
these statements, and prospective investors and stockholders
should carefully consider the factors set forth below in evaluating
these forward-looking statements. The Company’s backlog may
not be representative of actual sales for any succeeding period
because of timing of orders, delivery intervals, customer and
product mix, the possibility of changes in delivery schedules,
and additions or cancellation of orders.
The quarterly operating results of the Company can vary
signiKcantly depending on several factors, any of which could
have a material adverse effect on the Company’s business,
financial condition, or results of operations. In particular, the
Company’s quarterly results of operation can vary due to the
volume and timing of product orders received and delivered
during the quarter, the ability of the Company and its key
suppliers to respond to changes made by customers in their
orders, and the timing of new product introductions by the
Company and its competitors. The quarterly operating results
also may vary significantly depending upon other factors, includ-
ing the mix of product sold, the cost and availability of compo-
nents and subsystems, relative prices of the Company’s products,
adoption of new technologies and industry standards, competi-
tion, fluctuations in foreign currency exchange rates, regulatory
developments, and general economic conditions.
Manufacturers of digital microwave telecommunications equip-
ment and other wireless networking equipment are experiencing,
and are likely to continue to experience, intense pricing pressure
that has resulted, and is expected to continue to result, in down-
ward pricing pressure on the Company’s products. As a result, the
Company has experienced, and expects to continue to experience,
declining average sales prices for its products. The Company’s
future proKtability is dependent upon its ability to continue to
improve manufacturing efKciencies, reduce material costs of prod-
ucts, and introduce new products and product enhancements.
The markets for the Company’s products are extremely competi-
tive, and the Company expects that competition will increase.
The Company’s existing and potential competitors include estab-
lished and emerging companies, such as L.M. Ericsson, Siemens
AG, Sagem, Microwave Communications Division of Harris
Corporation, Alcatel, Nokia, Nera, NEC, and SIAE, many of
which have more extensive engineering, manufacturing, and
marketing capabilities and signiKcantly greater Knancial, techni-
cal, and personnel resources than the Company. The Company
believes that its ability to compete successfully will depend on a
number of factors both within and outside its control, including
price, quality, availability, customer service and support, breadth
of product line, product performance and features, rapid delivery,
reliability, timing of new product introductions by the Company,
its customers and its competitors, and the ability of its customers
to obtain Knancing. The Company continues to experience
customer demands for shorter delivery cycles.
The Company expects that international sales will continue to
account for the majority of its net product sales for the foresee-

Digital Microwave Corporation 2000 Annual Report 21
able future. As a result, the Company is subject to the risks of
doing business internationally, including unexpected changes in
regulatory requirements, fluctuations in foreign currency ex-
change rates, imposition of tariffs and other barriers and restric-
tions, the burdens of complying with a variety of foreign laws, and
general economic and geopolitical conditions, including inflation
and trade relationships. There can be no assurance that currency
fluctuations, changes in the rate of inflation, or any of the afore-
mentioned factors will not have a material adverse effect on the
Company’s business, Knancial conditions, or results of operations.
The Company’s manufacturing operations are highly dependent
upon the delivery of materials by outside suppliers in a timely
manner. In addition, the Company depends in part upon subcon-
tractors to assemble major components and subsystems used in
its products in a timely and satisfactory manner. The Company
does not generally enter into long-term or volume purchase
agreements with any of its suppliers, and no assurance can be
given that such materials, components, and subsystems will be
available in the quantities required by the Company, if at all.
The inability of the Company to develop alternative sources
of supply quickly and on a cost-effective basis could materially
impair the Company’s ability to manufacture and deliver its
products in a timely manner. There can be no assurance that
the Company will not experience material supply problems or
component or subsystem delays in the future.
The Company has pursued, and will continue to pursue, growth
opportunities through internal development and acquisitions of
complementary businesses and technologies. Acquisitions may
involve difKculties in the retention of personnel, diversion of
management’s attention, unexpected legal liabilities, and tax
and accounting issues. There can be no assurance that the
Company will be able to successfully identify suitable acquisition
candidates, complete acquisitions, integrate acquired businesses
into its operations, or expand into new markets. Once integrated,
acquired businesses may not achieve comparable levels of rev-
enues, proKtability, or productivity as the existing business of
the Company, or otherwise perform as expected. The Company’s
failure to manage its growth effectively could have a material
adverse impact on the Company’s business, Knancial condition,
and results of operations.
During any given quarter, a small number of customers may
account for a signiKcant portion of the Company’s net sales. In
Fiscal 2000, one customer (Beijing Telecommunications
Equipment Factory) accounted for 16% of the Company’s net
sales and three customers accounted for 59% of the Company’s
March 31, 2000, backlog. The Company’s customers typically are
not contractually obligated to purchase any quantity of products
in any particular period, and product sales to major customers
have varied widely from period to period. The loss of any existing
customer, a significant reduction in the level of sales to any exist-
ing customer, or the failure of the Company to gain additional
customers could have a material adverse effect on the Company’s
business, financial condition, and results of operations.
years ended march 31,
2000 1999 1998 1997 1996
(in thousands, except per share amounts)
Consolidated Statements of Operations Data:
Net sales $ 300,503 $ 236,499 $ 345,116 $ 213,441 $ 174,380
Net income (loss) 12,136 (96,729) 18,818 6,461 (13,533)
Diluted earnings (loss) per share 0.17 (1.57) 0.35 0.13 (0.35)
Consolidated Balance Sheets Data:
Total assets $ 337,441 $ 202,164 $ 297,196 $ 200,504 $ 113,597
Long-term liabilities — 2,236 1,174 700 10,097
selected consolidated Knancial data

22
march 31,
2000 1999
(in thousands,
except share and per share amounts)
assets
Current Assets:
Cash and cash equivalents $ 58,339 $ 21,518
Short-term investments 65,603 5,745
Accounts receivable, net of allowances of $4,652 in 2000 and $3,261 in 1999 98,520 60,253
Inventories 48,547 50,610
Deferred tax asset 1,285 3,009
Other current assets 9,916 12,827
Total current assets 282,210 153,962
Property and Equipment:
Machinery and equipment 94,533 77,236
Land and buildings 6,484 6,090
Furniture and Kxtures 11,252 10,327
Leasehold improvements 4,774 4,597
117,043 98,250
Accumulated depreciation and amortization (73,242) (55,225)
Net property and equipment 43,801 43,025
Other assets 11,430 5,177
$ 337,441 $ 202,164
liabilities and stockholders’ equity
Current Liabilities:
Current portion of long-term debt $ — $ 725
Current maturities of capital lease obligations 167 862
Accounts payable 39,582 25,116
Income taxes payable 2,330 1,399
Accrued liabilities 30,970 40,613
Total current liabilities 73,049 68,715
Long-Term Liabilities:
Long-term debt — 1,896
Capital lease obligations, net of current maturities — 340
Total liabilities 73,049 70,951
Commitments and Contingencies (Note 3)
Stockholders’ Equity:
Preferred stock, $.01 per value; 5,000,000 shares authorized; none outstanding — —
Common Stock, $.01 per value; 95,000,000 shares authorized;
72,691,668 shares in 2000 and 62,144,171 shares in 1999 issued and outstanding 727 621
Additional paid-in capital 372,762 250,602
Deferred stock compensation expense (12) (88)
Accumulated deKcit (103,288) (115,424)
Accumulated other comprehensive loss (5,797) (4,498)
Total stockholders’ equity 264,392 131,213
$ 337,441 $ 202,164
consolidated balance sheets
The accompanying notes are an integral part of these consolidated Knancial statements.

Digital Microwave Corporation 2000 Annual Report 23
years ended march 31,
2000 1999 1998
(in thousands, except per share amounts)
Net Sales $ 300,503 $ 236,499 $ 345,116
Cost of sales 209,653 185,493 221,021
Inventory valuation charges — 37,739 5,850
Gross proKt 90,850 13,267 118,245
Operating Expenses:
Research and development 24,372 24,131 24,482
Selling, general, and administrative 51,953 55,342 65,280
Merger and restructuring — 29,941 8,752
Total operating expenses 76,325 109,414 98,514
Income (loss) from operations 14,525 (96,147) 19,731
Other Income (Expense):
Interest income 2,510 1,474 3,080
Interest expense (729) (479) (856)
Other income, net (1,136) (970) 720
Total other income, net 645 25 2,944
Income (loss) before provision for
income taxes 15,170 (96,122) 22,675
Provision for income taxes 3,034 607 3,857
Net Income (Loss) $ 12,136 $ (96,729) $ 18,818
Basic earnings (loss) per share $ 0.18 $ (1.57) $ 0.37
Diluted earnings (loss) per share $ 0.17 $ (1.57) $ 0.35
Basic weighted average shares outstanding 65,922 61,601 51,285
Impact of dilutive stock options and warrants 5,720 N/A 3,174
Diluted weighted average shares outstanding 71,642 61,601 54,459
consolidated statements of operations
The accompanying notes are an integral part of these consolidated Knancial statements.

24
years ended march 31, 2000, 1999 and 1998
Common Additional Deferred Accumulated Total
Stock Paid-In Stock Accumulated Other Com- Stockholders’
Shares Amount Capital Compensation DeKcit prehensive Loss Equity
(in thousands)
Balance March 31, 1997 38,010 $ 380 $ 126,871 $ — $ (39,317) $ 13 $ 87,947
Components of comprehensive income:
Net income — — — — 18,818 — 18,818
Unrealized holding gain on
available-for-sale securities — — — — — 46 46
Translation adjustment — — — — — (1,620) (1,620)
Total comprehensive income 17,244
Proceeds from sale of stock 11,649 117 62,054 — — — 62,171
Conversion of preferred stock 9,116 91 47,678 — — — 47,769
Stock issued for options & warrants 2,252 22 9,652 (1,590) — — 8,084
Amortization of deferred stock
compensation — — — 1,193 — — 1,193
Tax beneKt related to employee stock
transactions — — 2,192 — — — 2,192
Balance March 31, 1998 61,027 610 248,447 (397) (20,499) (1,561) 226,600
Components of comprehensive income:
Net loss — — — — (96,729) — (96,729)
Unrealized holding loss on
available-for-sale securities — — — — — (1,613) (1,613)
Translation adjustment — — — — — (1,324) (1,324)
Total comprehensive loss (99,666)
Proceeds from sale of stock 372 4 904 — — — 908
Stock issued for options & warrants 745 7 1,187 — — — 1,194
Amortization of deferred stock
compensation — — — 309 — — 309
Tax beneKt related to employee stock
transactions — — 64 — — — 64
Adjustment to conform year-end of
pooled company — — — — 1,804 — 1,804
Balance March 31, 1999 62,144 621 250,602 (88) (115,424) (4,498) 131,213
Components of comprehensive income:
Net income — — — — 12,136 — 12,136
Unrealized holding gain on
available-for-sale securities — — — — — 1,841 1,841
Translation adjustment — — — — — (3,140) (3,140)
Total comprehensive income — — — — — — 10,837
Proceeds from sale of stock,
net of expense 4,797 48 99,823 — — — 99,871
Stock issued for options & warrants 5,751 58 22,337 — — — 22,395
Amortization of deferred stock
compensation — — — 76 — — 76
Balance March 31, 2000 72,692 $ 727 $ 372,762 $ (12) $(103,288) $ (5,797) $264,392
The accompanying notes are an integral part of these consolidated Knancial statements.
consolidated statements of stockholders’ equity

Digital Microwave Corporation 2000 Annual Report 25
years ended march 31,
2000 1999 1998
(in thousands)
Cash Flows From Operating Activities:
Net income (loss) $ 12,136 $ (96,729) $ 18,818
Adjustments to reconcile net income (loss) to net cash
provided by (used for) operating activities:
Adjustment to conform year-end of pooled company — 1,804 —
Depreciation and amortization 16,594 25,912 13,411
Provision for uncollectable accounts 853 4,608 356
Provision for inventory reserves 3,262 20,305 12,862
Provision for warranty reserves 8,146 7,023 5,310
Tax beneKt of disqualifying dispositions — 64 2,192
Changes in assets and liabilities:
Decrease (increase) in accounts receivable (41,391) 20,620 (27,744)
Decrease (increase) in inventories (2,185) 1,503 (33,024)
Decrease (increase) in deferred taxes 1,701 3,639 (6,496)
Decrease (increase) in tax refund receivable 4,001 (4,553) —
Decrease (increase) in other current assets (1,287) 786 (3,864)
Decrease in other assets 5,292 11,624 6
Increase (decrease) in accounts payable 15,120 (14,283) 9,890
Increase (decrease) in income tax payable 931 102 (1,065)
Increase (decrease) in other accrued liabilities (17,279) 6,841 (5,810)
Net cash provided by (used for) operating activities 5,894 (10,734) (15,158)
Cash Flows From Investing Activities:
Purchase of available-for-sale securities (118,029) (16,621) (27,990)
Maturity/sale of available-for-sale securities 58,171 45,374 11,327
Purchase of property and equipment (23,928) (24,711) (30,471)
Investments in Ensemble Communications (7,256) — —
Acquisition of business, net of cash received — (2,286) (11,491)
Investment in Granger Associates, Ltd. — — (4,000)
Proceeds from the sale of other assets 2,082 610 —
Proceeds from disposal of Kxed assets — 1,194 —
Net cash provided by (used for) investing activities (88,960) 3,560 (62,625)
Cash Flows From Financing Activities:
Borrowing from banks — 2,600 —
Repayments to banks (2,600) — (6,665)
Payment of assumed Granger, Inc., debt — — (3,286)
Payments of capital lease obligations (1,035) (1,314) (1,951)
Proceeds from sale of Common Stock 122,266 2,166 77,143
Net cash provided by Knancing activities 118,631 3,452 65,241
Effect of exchange rate changes on cash 1,256 (2,345) (420)
Net increase (decrease) in cash and cash equivalents 36,821 (6,067) (12,962)
Cash and cash equivalents at beginning of year 21,518 27,585 40,547
Cash and cash equivalents at end of year $ 58,339 $ 21,518 $ 27,585
The accompanying notes are an integral part of these consolidated Knancial statements.
consolidated statements of cash flows

26
Note 1. Description of Business
Digital Microwave Corporation (the “Company”) designs, manu-
factures, and markets advanced wireless solutions for worldwide
communications network interconnection and access. The
Company’s high-performance digital wireless systems carry high-
speed data and voice across a full spectrum of frequencies and
capacities. The Company has sold more than 163,000 radios
that operate in nearly every kind of environment around the
world. The Company was founded in January 1984 and is traded
under the symbol DMIC on the Nasdaq National Market.
Note 2. Summary of Significant Accounting Policies
Basis of Presentation. The consolidated Knancial statements
include the accounts of Digital Microwave Corporation and its
wholly owned subsidiaries. Intercompany accounts and transac-
tions have been eliminated. Certain prior-year amounts have
been reclassiKed to conform to the current-year presentation.
Estimates. The preparation of Knancial statements in conformity
with generally accepted accounting principles requires manage-
ment to make estimates and assumptions that affect the reported
amounts of assets and liabilities, the disclosure of contingent
assets and liabilities at the date of the Knancial statement,
and the reported amounts of revenues and expenses during the
reported period. Actual results could differ from those estimates.
Cash and Cash Equivalents. For purposes of the Consolidated
Statements of Cash Flows, the Company considers all highly li-
quid debt instruments with an original maturity of three months
or less to be cash equivalents. Cash and cash equivalents consist-
ed of cash, money market funds, and short-term securities as
of March 31, 2000 and 1999.
Short-Term Investments. The Company invests its excess cash
in high-quality and easily marketable instruments to ensure cash
is readily available for use in its current operations. Accordingly,
all of the Company’s marketable securities are classiKed as “avail-
able-for-sale” in accordance with the provisions of the Statement
of Financial Accounting Standards (“SFAS”) No. 115. At March
31, 2000, the Company’s available-for-sale securities had contrac-
tual maturities ranging from 1 month to 21 months, with a
weighted average maturity of 5 months.
All investments are reported at fair market value with the related
unrealized holding gains and losses reported as a component of
stockholders’ equity. Unrealized holding gains on the portfolio
of approximately $176,000 were recorded as of March 31, 2000,
and $1,665,000 of unrealized holding losses were recorded as of
March 31, 1999. There were realized gains of approximately
$397,000 on the sale of securities during Fiscal 2000 and realized
losses of $6,000 in each of Fiscal 1999 and Fiscal 1998.
The following is a summary of short-term and long-term invest-
ments as of March 31:
2 0 0 0
Cost at Market Value Unrealized
Each Issue at Balance Holding
Sheet Date Gain (Loss)
(in thousands)
Corporate notes $ 53,280 $ 53,103 $ (177)
Auction rate preferred notes 12,500 12,500 —
Investment in
Granger Associates, Ltd.( 1 ) 1,796 2,149 353
Total $ 67,576 $ 67,752 $ 176
1 9 9 9
Cost at Market Value Unrealized
Each Issue at Balance Holding
Sheet Date Gain (Loss)
(in thousands)
Corporate notes $ 5,753 $ 5,745 $ (8)
Investment in
Granger Associates, Ltd.( 1 ) 3,399 1,742 (1,657)
Total $ 9,152 $ 7,487 $ (1,665)
(1)ClassiKed as other assets
Supplemental Statements of Cash Flows Disclosures. Cash paid
for interest and income taxes for each of the three Kscal years
presented in the consolidated statements of cash flows was
as follows:
years ended march 31,
2000 1999 1998
(in thousands)
Interest expense $ 702 $ 762 $ 856
Income taxes $ 559 $ 2,003 $ 8,885
notes to consolidated Knancial statements

Digital Microwave Corporation 2000 Annual Report 27
The following non-cash transactions occurred during the Kscal
years ended:
march 31,
2000 1999 1998
(in thousands)
Notes payable to stock-
holders converted into
redeemable preferred
stock $ — $ — $ 1,500
Estimated fair value of
warrant issued in
connection with
notes payable $ — $ — $ 67
Capital lease obligations
incurred to acquire
equipment $ — $ — $ 1,922
Conversion of redeemable
preferred stock into
common stock $ — $ — $ 47,769
Inventories. Inventories are stated at the lower of cost (Krst-in,
Krst-out) or market, where cost includes material, labor, and
manufacturing overhead. Inventories consisted of:
march 31,
2000 1999
(in thousands)
Raw materials $ 22,558 $ 25,616
Work-in-process 13,833 9,537
Finished goods 12,156 15,457
$ 48,547 $ 50,610
Inventories contained components and assemblies in excess of the
Company’s current estimated requirements and were, therefore,
reserved at March 31, 2000 and 1999. The Company charged $3.3
million in Fiscal 2000 and $20.3 million in Fiscal 1999 to cost of
sales due to ongoing inventory valuation analysis for excess and
obsolete inventories as a result of product transitions.
Property and Equipment. Property and equipment is stated at
cost. Depreciation and amortization are calculated using the
straight-line method over the shorter of the estimated useful lives
of the assets (ranging from three to Kve years for equipment and
furniture, and forty years for buildings) or the lease term. Included
in property and equipment are assets held under capital leases with
a cost of $721,000 as of March 31, 2000, and $2,517,000 as of
March 31, 1999. Accumulated amortization on leased assets was
$320,000 as of March 31, 2000, and $974,000 as of March 31, 1999.
Other Assets. Other assets include goodwill and other intangible
assets that are being amortized on a straight line basis over their
estimated useful lives, ranging from Kve to ten years, as well as
minority investments accounted for using the cost method of
accounting. Goodwill is the excess of the purchase price over
the fair value of net assets acquired. Goodwill, gross of accumu-
lated amortization, amounted to $2,778,000 as of March 31,
2000 and March 31, 1999. Accumulated amortization of good-
will amounted to $1,721,000 at March 31, 2000 and $959,000 at
March 31, 1999. The Company continually reviews goodwill and
other intangible assets to evaluate whether events or changes
have occurred that would suggest an impairment of carrying
value. An impairment would be recognized when expected
future operating cash flows are lower than the carrying value. In
accordance with SFAS No. 121, “Accounting for the Impairment
of Long-Lived Assets and for Long-Lived Assets to be Disposed
of,” goodwill of $9.7 million, net of accumulated amortization
related to the purchase of Granger, Inc., was written off in the
third quarter of Fiscal 1999. This write-off is included in Merger
and Restructuring expenses in the Consolidated Statements of
Operations. In March 1999, the assets of Granger, Inc., were
sold at net book value of $3.2 million with extended payment
terms to Granger’s former managers.
Accrued Liabilities. Accrued liabilities included the following:
march 31,
2000 1999
(in thousands)
Customer deposits $ 770 $ 3,170
Accrued payroll and beneKts 4,703 2,628
Accrued commissions 1,929 4,986
Accrued warranty 5,533 3,033
Accrued restructuring 892 3,998
Accrued purchase order
cancellation and other costs 5,296 15,482
Other 11,847 7,316
$30,970 $ 40,613

28
Accumulated Other Comprehensive Income. SFAS No. 130,
“Reporting Comprehensive Income,” establishes standards for
reporting and display of comprehensive income (loss) and its
components. SFAS No. 130 requires companies to report a “com-
prehensive income (loss)” that includes unrealized holding gains
and losses and other items that have previously been excluded
from net income (loss) and reflected instead in stockholders’
equity. Comprehensive income (loss) for the Company consists
of net income (loss) plus the effect of unrealized holding gains or
losses on investments classiKed as available-for-sale and foreign
currency translation adjustments.
The accumulated balances for each component of accumulated
other comprehensive income (loss) are as follows:
march 31,
2000 1999
(in thousands)
Unrealized holding gain (loss) on
available-for-sale securities $ 176 $ (1,665)
Foreign exchange translation
adjustments (5,973) (2,833)
$ (5,797) $ (4,498)
Foreign Currency Translation. The functional currency of the
Company’s subsidiaries located in the United Kingdom and
Latin America is the U.S. dollar. Accordingly, all of the monetary
assets and liabilities of these subsidiaries are remeasured into
U.S. dollars at the current exchange rate as of the applicable
balance sheet date, and all non-monetary assets and liabilities are
remeasured at historical rates. Sales and expenses are remeasured
at the average exchange rate prevailing during the period. Gains
and losses resulting from the remeasurement of the subsidiaries’
Knancial statements are included in the Consolidated Statements
of Operations. The Company’s other international subsidiaries
use their local currency as their functional currency. Assets and
liabilities of these subsidiaries are translated at the exchange
rates in effect at the balance sheet date, and income and expense
accounts are translated at the average exchange rates during the
year. The resulting translation adjustments are recorded directly
to a separate component of stockholders’ equity.
Gains and losses resulting from foreign exchange transactions
are included in other income (expense) in the accompanying
Consolidated Statements of Operations. The net foreign
exchange loss was $930,000 in Fiscal 2000, a gain of $799,000
in Fiscal 1999, and a loss of $1,070,000 in Fiscal 1998.
Off-Balance Sheet Financial Instruments. The Company
hedges certain portions of its exposure to foreign currency fluc-
tuations through the use of forward foreign exchange contracts.
The Company enters into forward foreign exchange contracts for
purposes other than trading, but the Company does not engage
in foreign currency speculation. Forward foreign exchange con-
tracts represent agreements to buy or sell a speciKed amount of
foreign currency at a speciKed price in the future. These con-
tracts generally have maturities that do not exceed one month.
At March 31, 2000, the Company had forward foreign exchange
contracts to exchange various foreign currencies for U.S. dollars
in the aggregate amount of $45.8 million, primarily in New
Zealand dollars, British pounds, and European Currency Units.
Gains and losses associated with currency rate changes on for-
ward foreign exchange contracts are recorded in income if they
offset corresponding gains and losses on the foreign currency-
denominated assets, liabilities, and shipment of product hedged,
or deferred if the foreign currency order has not shipped.
Therefore, the carrying value of forward foreign exchange con-
tracts approximates their fair value. The Company believes that
the credit risk with respect to its forward foreign exchange con-
tracts is minimal because the Company enters into contracts
with major Knancial institutions. Market risk with respect to for-
ward foreign exchange contracts is offset by the corresponding
exposure related to the underlying assets, liabilities, and ship-
ments of product.
Concentration of Credit Risk. Financial instruments that
potentially subject the Company to concentrations of credit
risk consist principally of temporary cash investments and trade
receivables. The Company has cash investment policies that limit
the amount of credit exposure to any one Knancial institution
and restrict placement of investments to Knancial institutions
evaluated as highly creditworthy. Trade receivables concentrated
with certain customers primarily in the telecommunications
industry and in certain geographic locations potentially subject
the Company to concentration of credit risk. The Company
actively markets and sells products in North America, Europe,
China, the Asia/PaciKc region, Africa, and Latin America. The
Company performs ongoing credit evaluations of its customers’
Knancial conditions and generally requires no collateral, although
certain sales to China, the Asia/PaciKc region, Europe, Latin
America, and Africa are paid through letters of credit.

Digital Microwave Corporation 2000 Annual Report 29
Revenue Recognition. Revenue from product sales is recognized
upon shipment, except when product sales are combined with
signiKcant post-shipment installation services provided over an
extended period of time. Under this exception, revenue is
deferred until such services have been performed. Revenue from
product sales is net of third-party commissions, freight, and duty
charges. Service revenue, which is less than 10% of net sales for
each of the three Kscal years presented, is recognized when the
related services are performed.
Product Warranty. The Company provides, at the time of sale,
for the estimated cost to repair or replace products under war-
ranty, which is generally for a two-year period.
Research and Development. All research and development costs
are expensed as incurred.
Earnings (Loss) Per Share. Basic earnings per share are comput-
ed by dividing net income by the weighted average number of
common shares outstanding during the period. Diluted earnings
per share are computed by dividing net income by the weighted
average number of common shares and potentially dilutive secu-
rities outstanding during the period. Net loss per share is com-
puted using only the weighted average number of common shares
outstanding during the period, as the inclusion of potentially
dilutive securities would be anti-dilutive.
As of March 31, 2000, there were 192,000 weighted-average
options outstanding to purchase shares of Common Stock that
were not included in the computation of diluted earnings per
share, as the options exercise prices were greater than the average
market price of the shares of Common Stock. As of March 31,
1999, there were 4,344,000 weighted-average options outstand-
ing and 1,983,000 warrants to purchase shares of Common Stock
that were not included in the computation of diluted earnings
per share because they were anti-dilutive as a result of the net
loss incurred in Fiscal 1999. Additionally, there were 1,998,000
weighted-average options outstanding as of March 31, 1998, to
purchase shares of Common Stock that were not included in the
computation of diluted earnings per share, as the options’ exer-
cise prices were greater than the average market price of the
shares of Common Stock. Also excluded from the computation
of diluted earnings per share were warrants to acquire 2,259,000
shares of Common Stock in Fiscal 1998, as the warrants’ exercise
prices were greater than the average market price of the shares
of Common Stock.
Stock Compensation. The Company adopted the disclosure
provisions of SFAS No. 123, “Accounting for Stock-Based
Compensation.” In accordance with the provisions of SFAS No.
123, the Company applies APB Opinion 25 and related interpreta-
tions in accounting for its stock option plans. Note 5 of the
Notes to Consolidated Financial Statements contains a summary
of the pro forma effects on reported net income (loss) and earn-
ings per share information for Fiscal 2000, 1999, and 1998, based
on the fair market value of the options granted at the grant date
as prescribed by SFAS No. 123.
Recent Accounting Pronouncements. In June 1998, the FASB
issued SFAS No. 133, “Accounting for Derivative Instruments
and Hedging Activities.” SFAS No. 133 is effective for companies
with Kscal years beginning after June 15, 2000, and requires the
Company to recognize all derivatives on the balance sheet at fair
value. Derivatives that are not hedges must be adjusted to fair
value through income. If the derivative is a hedge, depending on
the nature of the hedge, changes in the fair value of derivatives
will either be offset against the change in fair value of the hedged
assets, liabilities or Krm commitments through earnings, or rec -
ognized in other comprehensive income until the hedged item is
recognized in earnings. The Company believes that the adoption
of this new pronouncement will not have a material effect on the
Company’s Knancial statements.
In December 1999, the Securities and Exchange Commission
issued Staff Accounting Bulletin No. 101 (“SAB 101”), “Revenue
Recognition in Financial Statements.” SAB 101 provides guidance
on applying generally accepted accounting principles to revenue
recognition in Knancial statements. The Company will adopt SAB
101 as required in the Krst quarter of Fiscal 2001 and is evaluating
the effect that such adoption may have on its consolidated results
of operations and Knancial position.

30
Note 3. Commitments and Contingencies
The Company leases certain property and equipment, as well as
its headquarters and manufacturing facilities, under noncance-
lable operating and capital leases that expire at various periods
through 2018. At March 31, 2000, future minimum payment
obligations under these leases were as follows:
years ending march 31,
Capital Operating
(in thousands)
2001 $ 180 $ 3,731
2002 — 4,640
2003 — 4,267
2004 — 4,231
2005 — 4,281
2006 and beyond — 29,258
Future minimum lease payments 180 $ 50,408
Less amount representing interest
(averaging 15%) (13)
Present value of future minimum
lease payments 167
Less current maturities (167)
Long-term lease obligations $ —
Rent expense under operating leases was approximately
$3,897,000 for the year ended March 31, 2000, $5,255,000 for
the year ended March 31, 1999, and $6,083,000 for the year
ended March 31, 1998.
Legal Contingencies. The Company is a party to various legal
proceedings that arise in the normal course of business. In
the opinion of management, the ultimate disposition of these
proceedings will not have a material adverse effect on the consoli-
dated Knancial position, liquidity, or results of operations of
the Company.
Contingencies in Manufacturing and Suppliers. The Company’s
manufacturing operations are highly dependent upon the timely
delivery of materials and components by outside suppliers. In
addition, the Company depends in part upon subcontractors to
assemble major components and subsystems used in its products
in a timely and satisfactory manner. The Company does not gen-
erally enter into long-term or volume-purchase agreements with
any of its suppliers, and no assurance can be given that such
materials, components, and subsystems will be available in the
quantities required by the Company, if at all. The inability of the
Company to develop alternative sources of supply quickly and on
a cost-effective basis could materially impair the Company’s abili-
ty to manufacture and deliver its products in a timely manner.
There can be no assurance that the Company will not experience
component delays or other supply problems in the future.
Note 4. Income Taxes
The Company provides for income taxes using an asset and liabil-
ity approach, under which deferred income taxes are provided,
based upon enacted tax laws and rates applicable to periods in
which the taxes become payable.
The domestic and foreign components of income (loss) before
provision for income taxes were as follows:
years ended march 31,
2000 1999 1998
(in thousands)
Domestic $14,006 $ (91,230) $ 19,861
Foreign 1,164 (4,892) 2,814
$ 15,170 $ (96,122) $ 22,675
The provision for income taxes consisted of the following:
years ended march 31,
2000 1999 1998
(in thousands)
Current:
Federal $ 38 $ — $ 6,770
State 37 — 365
Foreign 2,434 321 3,047
Total current 2,509 321 10,182
Deferred 525 286 (6,325)
$ 3,034 $ 607 $ 3,857

Digital Microwave Corporation 2000 Annual Report 31
The provision for income taxes differs from the amount comput-
ed by applying the statutory Federal income tax rate as follows:
years ended march 31,
2000 1999 1998
(in thousands)
Expected tax provision
(beneKt) $ 5,310 $ (32,681) $ 7,709
State taxes net of
Federal beneKt 348 (2,403) 565
Change in valuation
allowance (2,873) 32,385 (4,474)
Non-deductible
acquisition costs — 443 2,333
Non-deductible goodwill — 3,863 371
FSC commission — — (1,657)
Other 249 (1,000) (990)
$ 3,034 $ 607 $ 3,857
The major components of the net deferred tax asset consisted of
the following:
years ending march 31,
2000 1999
(in thousands)
Inventory reserves $ 10,058 $ 11,652
Restructuring reserves 2,472 7,591
Warranty reserves 1,980 1,055
Bad debt reserves 1,376 1,067
Accrued commissions 598 747
Net operating loss carryforwards 20,667 21,841
Tax credits 9,476 9,328
Other 5,261 3,204
51,888 56,485
Less: Valuation allowance (50,603) (53,476)
Net deferred tax asset $ 1,285 $ 3,009
The valuation allowance provides a reserve against deferred tax
assets that may expire or go unutilized by the Company. In
accordance with SFAS No. 109, “Accounting for Income Taxes,”
the Company believes it is more likely than not that the
Company will not fully realize these beneKts and, accordingly,
has continued to provide a valuation allowance for them.
At March 31, 2000, the Company had U.S. federal and state net
operating loss carryforwards available to offset future taxable
income, if any, of approximately $58,000,000 and $966,000,
respectively. The net operating losses expire in various years
through 2019. In addition, foreign net operating loss carryfor-
wards at March 31, 2000 total $3,200,000. Tax credits include
approximately $4,800,000 of federal minimum tax and state
research credits that carryforward indeKnitely. The remaining
tax credits of $4,600,000 are federal and state credits that expire
in various years through 2019. The Internal Revenue Code con-
tains provisions which may limit the net operating loss carryfor-
wards to be used in any given year upon the occurrence of certain
events, including a signiKcant change in ownership interest.
Note 5. Common Stock
Stock Option Plans. The Company’s 1984 Stock Option Plan
(the “1984 Plan”) provides for the grant of both incentive and
nonqualiKed stock options to key employees and certain inde-
pendent contractors of the Company. At March 31, 2000,
options to purchase 91,376 shares of Common Stock were out-
standing under the 1984 Plan, of which 91,376 shares were exer-
cisable at an average exercise price of $8.43 per share. Upon
the adoption of the Company’s 1994 Stock Incentive Plan
(“the 1994 Plan”), the Company terminated future grants
under the 1984 Plan.
In July 1994, the stockholders approved 2,366,660 shares of
Common Stock to be reserved for issuance under the 1994 Plan
over a ten-year term. In August 1996, the stockholders approved
the reservation for issuance of 2,000,000 additional shares of
Common Stock under the 1994 Plan. In March 1998, the stock-
holders approved the reservation for issuance of 2,500,000 addi-
tional shares of Common Stock under the 1994 Plan. The terms
of the 1994 Plan also provide for an automatic increase on the
Krst trading day of each calendar year for Kve years after the
adoption of the 1994 Plan, beginning January 1995, of an amount
equal to one percent (1%) of the number of shares of Common
Stock outstanding, but in no event is such annual increase to
exceed 300,000 shares. The total number of shares of Common
Stock reserved for issuance under the 1994 Plan is 7,766,660. At
March 31, 2000, options to purchase 4,596,471 shares were out-
standing, of which 1,315,900 were exercisable at an average exer-
cise price of $9.64 per share. At March 31, 2000, the number of
shares available for future grant was 328,778.
32
The 1994 Plan contains: (i) a discretionary grant program for key
employees and consultants whereby options generally vest over
Kve years and expire after 10 years, (ii) an automatic grant pro-
gram for non-employee Board members, whereby options vest
over three years and expire after 10 years, (iii) a salary reduction
grant program under which key employees may elect to have a
portion of their base salary reduced each year in return for stock
options, (iv) a stock fee program under which the non-employee
Board members may elect to apply all or a portion of their annual
retainer fee to the acquisition of shares of Common Stock, and
(v) a stock issuance program under which eligible individuals may
be issued shares of Common Stock as a bonus tied to their per-
formance of services or the Company’s attainment of Knancial
milestones, or pursuant to their individual elections to receive
such shares in lieu of base salary. The implementation and use of
any of these equity incentive programs (other than the automatic
grant program and the stock fee program) is within the sole dis-
cretion of the Compensation Committee of the Board of
Directors of the Company.
In April 1996, the Company adopted the 1996 Non-OfKcer
Employee Stock Option Plan (the “1996 Plan”). The 1996 Plan
authorizes 1,000,000 shares of Common Stock to be reserved for
issuance to non-ofKcer key employees as an incentive to continue
in the service of the Company. The 1996 Plan will terminate on
the date on which all shares available have been issued. At March
31, 2000, 598,182 shares were outstanding, of which 129,528 were
exercisable at an average exercise price of $6.36 per share, and
48,730 shares were available for future grants.
In November 1997, the Company adopted the 1998 Non-OfKc e r
Employee Stock Option Plan (the “1998 Plan”), which became
effective on January 2, 1998. The 1998 Plan authorizes 500,000
shares of Common Stock to be reserved for issuance to non-
o fKcer key employees as an incentive to continue in the service
of the Company. The 1998 Plan will terminate on the date on
which all shares available have been issued. At March 31, 2000,
there were 371,836 options outstanding, of which 42,716 were
exercisable at an average price of $3.13, and 84,160 were available
for future grants.
The 1999 Stock Incentive Plan (the “1999 Incentive Plan”),
approved by the Company’s stockholders in August 1999, pro-
vides for the issuance of stock options covering up to 2,500,000
shares of Common Stock of the Company. The 1999 Incentive
Plan enables the Company to grant options as needed to retain
and attract talented employees. At March 31, 2000, there were
379,525 options outstanding, of which no options were exercis-
able and 2,120,475 were available for future grant.
In connection with the Company’s merger with MAS Tech-
nology (see Note 7), the Company assumed the MAS Technology
1997 Stock Option Plan (the “1997 MAS Plan”) under the same
terms and conditions as were applicable under the 1997 MAS
Plan prior to the merger. Each outstanding option to purchase
MAS ordinary shares, whether vested or unvested, was assumed
and converted into an option to receive 1.20 shares of the Com-
pany’s Common Stock. The 1997 MAS Plan provided for the
grant of stock options to employees and certain independent
contractors of MAS. Options granted under the 1997 MAS Plan
vest from one to three years from the date of grant. Additionally,
options granted under the 1997 MAS Plan automatically vest
upon the involuntary termination of the employment of an
option holder within 18 months of the change in ownership of
the Company. At March 31, 2000, options to purchase 227,088
shares of Common Stock were outstanding under the 1997 MAS
Plan, of which 4,000 were exercisable at an average exercise price
of $12.91 per share. The 1997 MAS Plan has been terminated as
to future grants.
In connection with the Company’s merger with Innova
Corporation (see Note 7), the Company assumed the 1990
Innova Stock Option Plan and the 1997 Director Stock Option
Plan (the “Innova Plans”) under the same terms and conditions
as were applicable under the Innova Plans prior to the merger.
Each outstanding option to purchase Innova common shares
was assumed and converted into an option to receive 1.05 shares
of the Company’s Common Stock. The Innova Plans provided
for the grant of stock options to employees, directors, and cer-
tain vendors of Innova. At March 31, 2000, options to purchase
104,731 shares of Common Stock were outstanding under the
1990 Innova Stock Option Plan, and 42,000 shares of Common
Stock were outstanding under the 1997 Innova Director Stock
Option Plan, of which all stock options under both plans were
exercisable at an average exercise price of $5.66 per share. The
Innova Plans have been terminated as to future grants.
At March 31, 2000, the Company had reserved 8,993,352 shares for
future issuance under all stock options plans for which there were
options outstanding or available for grant as of March 31, 2000.

Digital Microwave Corporation 2000 Annual Report 33
The following table summarizes the Company’s stock option activity under all of its stock option plans:
fiscal years ended march 31,
2000 1999 1998
Shares Weighted Avg Shares Weighted Avg Shares Weighted Avg
Exercise Price Exercise Price Exercise Price
(shares in thousands)
Options outstanding at beginning of year 8,871 $ 7.51 7,055 $ 8.86 5,633 $ 6.12
Granted 1,790 18.03 3,768 6.69 3,778 10.56
Exercised (3,726) 5.52 (441) 2.99 (1,424) 5.63
Expired or canceled (523) 9.45 (1,511) 12.64 (932) 4.77
Options outstanding at end of year 6,412 $ 10.72 8,871 $ 7.51 7,055 $ 8.86
Exercisable at end of year 1,730 3,928 1,882
Weighted average fair value of
options granted $ 11.05 $ 2.86 $ 5.62
The following summarizes the stock options outstanding at March 31, 2000:
Options Outstanding Options Exercisable
Actual Range Number Weighted Avg Weighted Avg Number Weighted Avg
of Exercise Outstanding Remaining Exercise Price Exercisable Exercise Price
Prices 3/31/00 Contractual Life 3/31/00
(shares in thousands)
$ 0.23 – 4.69 1,385 7.90 $ 3.45 302 $ 3.14
$ 4.69 – 9.00 1,597 7.84 7.25 656 6.78
$ 9.06 – 12.13 1,397 7.79 11.30 321 10.30
$ 12.19 – 14.75 1,324 7.83 13.43 350 13.20
$ 15.00 – 41.81 709 8.84 26.53 101 19.62
$ 0.23 – 41.81 6,412 7.95 $ 10.72 1,730 $ 8.84
In accordance with the disclosure requirements of SFAS No.123, if the Company had elected to recognize compensation cost based on
the fair market value of the options granted at grant date as prescribed, income and earnings per share would have been reduced to the
pro forma amounts indicated in the table below. The pro forma effect on net income for Fiscal 2000, 1999, and 1998 is not representa-
tive of the pro forma effect on net income in future years because it does not take into consideration pro forma compensation expense
related to grants made prior to Fiscal 1996.
2000 1999 1998
(in thousands, except per share amounts)
Net income (loss) — as reported $ 12,136 $ (96,729) $ 18,818
Net income (loss) — pro forma $ 4,120 $ (107,515) $ 9,746
Basic earnings per share — as reported $ 0.18 $ (1.57) $ 0.37
Basic earnings per share — pro forma $ 0.06 $ (1.75) $ 0.19
Diluted earnings per share — as reported $ 0.17 $ (1.57) $ 0.35
Diluted earnings per share — pro forma $ 0.06 $ (1.75) $ 0.18

34
The fair value of each option grant is estimated on the date of grant using the Black-Scholes option-pricing model with the following
assumptions:
2000 1999 1998
Expected dividend yield 0.0% 0.0% 0.0%
Expected stock volatility 79.7% 78.6% 74.7%
Risk-free interest rate 4.8 - 7.5% 4.8 - 5.6% 5.5% - 6.4%
Expected life of options from vest date 1.4 years 0.9 years 0.8 years
Forfeiture rate actual actual actual
W a r r a n t s. In connection with the Innova merger, the Company
assumed the outstanding warrants of Innova to purchase com-
mon stock of Innova. The Innova warrants were issued in con-
junction with various Knancing rounds. No separate values were
assigned to the warrants as the values were not signiKcant at the
date of issuance, other than warrants for 21,500 shares of Innova
common stock with an exercise price of $6.96 per share issued in
connection with debt Knancing in April 1997. There were 21,500
warrants outstanding at March 31, 2000; 1,889,000 outstanding
at March 31, 1999; and 2,152,000 outstanding at March 31, 1998.
The warrants expire May 31, 1999, through April 30, 2002. Upon
exercise of these warrants, each warrant is converted to 1.05
shares of the Company’s Common Stock.
Employee Stock Purchase Plans. In August 1996, the Company
adopted an Employee Stock Purchase Plan (the “1996 Purchase
Plan”) and reserved 600,000 shares of Common Stock for
issuance under the 1996 Purchase Plan. Employees, subject to
certain restrictions, were able to purchase Common Stock under
the 1996 Purchase Plan through payroll withholding at a price
per share of 85% of the fair market value at the beginning or end
of the purchase period, as deKned under the terms of the 1996
Purchase Plan. The Company sold 372,345 shares in Fiscal 1999,
and 166,597 shares in Fiscal 1998 under the Purchase Plan. At
March 31, 1999, no shares remained available for future issuance
under the 1996 Purchase Plan. Accordingly, in June 1999, the
Company adopted the 1999 Employee Stock Purchase Plan (the
“1999 Purchase Plan”) and reserved 900,000 shares of Common
Stock for issuance under the 1999 Purchase Plan. Employees,
subject to certain restrictions, may purchase Common Stock
under the 1999 Purchase Plan through payroll withholding at a
price per share of 85% of the fair market value at the beginning
or end of the purchase period, as deKned under the terms of the
1999 Purchase Plan. The Company sold 93,189 shares in Fiscal
2000 under the 1999 Purchase Plan.
Stockholders’ Rights Agreement. In October 1991, the Company
adopted a Stockholders’ Rights Agreement pursuant to which
one Preferred Share Purchase Right (a “Right”) was distributed
for each outstanding share of Common Stock. Each Right, as
adjusted to give effect to a stock dividend, which effected a
two-for-one stock split in November 1997, entitles stockholders
to buy one two-hundredth of a share of Series A Junior Partic-
ipating Preferred Stock at an exercise price of $50.00 upon cer-
tain events. The Rights expire on October 23, 2001, unless
earlier redeemed by the Company.
The Rights become exercisable if a person acquires 15% or more
of the Company’s Common Stock or announces a tender offer
that would result in such person owning 15% or more of the
Company’s Common Stock, other than a person who has report-
ed or is required to report beneKcial ownership of the Company’s
Common Stock on Schedule 13G under the Securities Exchange
Act of 1934, as amended, with respect to whom the threshold is
20%. If the Rights become exercisable, the holder of each Right
(other than the person whose acquisition triggered the exercis-
ability of the Rights) will be entitled to purchase, at the Right’s
then-current exercise price, a number of shares of the Company’s
Common Stock having a market value of twice the exercise price.
In addition, if the Company were to be acquired in a merger or
business combination after the Rights became exercisable, each
Right will entitle its holder to purchase, at the Right’s then-cur-
rent exercise price, stock of the acquiring company having a mar-
ket value of twice the exercise price. The Rights, as adjusted to
give effect to a stock dividend, which effected a two-for-one
stock split in November 1997, are redeemable by the Company
at a price of $0.005 per Right at any time within ten days after
a person has acquired 15% (or 20% in the case of a Schedule G
Kler) or more of the Company’s Common Stock.

Digital Microwave Corporation 2000 Annual Report 35
Note 6. Operating Segment and Geographic Information
The Company adopted SFAS No. 131, “Disclosures about
Segments of an Enterprise and Related Information,” as of
March 31, 1999. SFAS No. 131 establishes annual and interim
reporting standards for an enterprise’s operating segments and
related disclosures about products, geographic information,
and major customers. Operating segment information for Fiscal
2000, Fiscal 1999, and 1998 is also presented in accordance
with SFAS No. 131. See Note 1 for a brief description of the
Company’s business.
The Company is organized into two operating segments:
Products and Services. The Chief Executive OfKcer (“CEO”)
has been identiKed as the Chief Operating Decision-Maker as
deKned by SFAS 131. Resources are allocated to each of these
groups using information on their revenues and operating proKts
before interest and taxes.
The Products operating segment includes the SPECTRUM II,
XP4, DART, Altium, and DXR digital microwave systems for
digital transmission markets, and designs, develops, and manufac-
tures these products in Seattle, Washington; San Jose, California;
and Wellington, New Zealand. The Services operating segment
includes, but is not limited to, installation, repair, network
design, path surveys, integration, and other services. The Com-
pany maintains regional service centers in San Jose, California;
and Lanarkshire, Scotland; and Clark Field, Pampanga,
Philippines.
The Company does not identify or allocate assets or depreciation
by operating segment, nor does the C E O evaluate these groups on
these criteria. Operating segments generally do not sell products
to each other, and accordingly, there are no signiKcant inter-seg-
ment revenues to be reported. The Company does not allocate
interest and taxes to operating segments. The accounting policies
for segment reporting are the same as for the Company as a whole.
2000 1999 1998
(in thousands)
Products
Revenues $285,449 $ 215,545 $ 320,688
Operating proKt (loss) 15,924 (94,186) 16,572
Services
Revenues 15,054 20,954 24,428
Operating proKt (loss) (1,399) (1,961) 3,159
Total
Revenues $300,503 $ 236,499 $ 345,116
Operating proKt (loss) 14,525 (96,147) 19,731
One customer accounted for 16% of net sales for Fiscal 2000.
No other customers accounted for more than 10% of net sales
during Fiscal 2000, 1999, or 1998. At March 31, 2000, three
customers accounted for 59% of the backlog. There can be no
assurance that the Company’s current customers will continue
to place orders with the Company, that orders by existing
customers will continue to be at levels of previous periods,
or that the Company will be able to obtain orders from new cus-
tomers. The Company’s customers typically are not contractually
obligated to purchase any quantity of products in any particular
period and product sales to major customers have varied widely
from period to period.
Revenues by product from unafKliated customers for Fiscal
2000, 1999, and 1998 are as follows:
2000 1999 1998
(in thousands)
SPECTRUM II $ 122,349 $ 111,823 $ 175,326
XP4 61,700 32,247 36,100
DXR 40,302 32,513 30,589
Altium 47,534 5,259 —
Quantum* — 7,227 23,936
M-Series* — 3,581 13,596
Other Products 13,564 22,895 41,141
Total Products 285,449 $ 215,545 $ 320,688
Total Services 15,054 20,954 24,428
Total Revenue $300,503 $ 236,499 $ 345,116
*Included in Other Products in Fiscal 2000.

36
Revenues by geographic region from unaf Kliated customers for
Fiscal 2000, 1999, and 1998 are as follows:
2000 1999 1998
(in thousands)
United States $ 62,990 $ 31,753 $ 25,800
Mexico* 32,106 14,619 —
Other Americas 24,201 37,592 60,146
Europe/Middle East 81,761 83,242 146,812
Africa 19,087 19,036 16,283
China** 48,325 18,100 —
Other Asia/PaciKc 32,033 32,157 96,075
Total revenues $300,503 $ 236,499 $ 345,116
*Included in Other Americas in 1998.
**Included in Other Asia/PaciKc in 1998.
Long-lived assets consisted primarily of property and equipment
during Fiscal 2000 and 1999. Net property and equipment by
country was as follows:
2000 1999
(in thousands)
United States $ 29,423 $ 28,043
United Kingdom 9,719 11,621
Other foreign countries 4,659 3,361
Net property and
equipment $ 43,801 $ 43,025
Note 7. Mergers and Acquisitions
In May 1997, the Company acquired all of the outstanding shares
of Granger, Inc., a U.S. manufacturer of wireless products and
provider of installation services. The purchase price of Granger,
Inc., including the assumption of debt and the purchase of certain
product rights, totaled $14.7 million. A portion of the purchase
price was allocated to the net assets acquired based on their esti-
mated fair values. The fair value of the tangible assets acquired
was $5.8 million and liabilities assumed was $1.9 million. The pur-
chase price in excess of the net assets acquired of $10.8 million
was recorded as goodwill on the balance sheet. (See Note 2 above).
The acquisition was accounted for using the purchase method of
accounting. Accordingly, the accompanying Knancial statements
include the results of Granger, Inc., since the date of acquisition.
No pro forma Knancial statements for the periods presented have
been provided due to the amounts being immaterial.
In addition, concurrent with the acquisition of Granger, Inc.,
the Company made a minority investment in Granger Associates,
Ltd., a privately held company based in the United Kingdom, for
$4.0 million. This minority investment has been accounted for
using the cost method of accounting. In Fiscal 1999, the Com-
pany sold approximately 10% of this investment for $470,000.
Also in Fiscal 2000, the Company sold approximately 40% of its
remaining investment for proceeds of $2.1 million and realized a
gain of $480,000 which is reflected in other income in the
accompanying consolidated statement of operation.
In March 1998, the stockholders approved the issuance of Com-
mon Stock of the Company pursuant to an agreement to merge
with MAS Technology Limited (“MAS Technology”), a New
Zealand company, which designs, manufactures, markets, and
supports digital microwave radio links for the worldwide
telecommunications market. Under the terms of the agreement,
the Company exchanged 1.2 shares of its Common Stock for each
outstanding share of MAS Technology stock and stock options.
The Company issued approximately 8.2 million shares to MAS
Technology share and option holders. The combination was
qualiKed as a tax-free reorganization accounted for as a pooling-
of-interests transaction. Accordingly, the historical Knancial
statements of the Company have been restated to reflect the
results of MAS Technology for all periods presented.
In October 1998, the stockholders approved the issuance of
Common Stock of the Company pursuant to an agreement to
merge with Innova Corporation (“Innova”), a Washington cor-
poration, which designs, manufactures, markets, and supports
digital microwave radio links for the worldwide telecommunica-
tions market. Under the terms of the agreement, the Company
exchanged 1.05 shares of its Common Stock for each outstanding
share of Innova stock, stock options, and warrants. The
Company issued approximately 14.7 million shares to Innova
shareholders upon consummation of the merger. The combina-
tion qualiKed as a tax-free reorganization accounted for as a pool-
ing-of-interests transaction. Accordingly, the historical Knancial
statements of the Company have been restated to reflect the
results of Innova for all periods presented.

Digital Microwave Corporation 2000 Annual Report 37
The following table shows the reconciliation of the historical
results of the Company to the results presented in the accom-
panying Statements of Operations for Fiscal 1998 for the
Innova merger:
year ended march 31
1998
Revenue:
Digital Microwave $ 310,490
Innova 36,100
Intercompany sales (1,474)
Total $ 345,116
Net Income:
Digital Microwave $ 19,878
Innova (1,060)
Intercompany proKt eliminations —
Total $ 18,818
Merger and restructuring expenses of $8.8 million for Fiscal 1998
included payments of $4.3 million for investment banker, legal,
and accounting fees; asset valuation reserves for inventory,
receivables, and warranty totaling $1.3 million; as well as various
other costs of $3.2 million, which included ofKce closures and
contract terminations. As of March 31, 1999, there was no
remaining restructuring reserve related to the Fiscal 1998 merger
and restructuring.
Merger and restructuring charges of $29.9 million were recorded
in Fiscal 1999. As a result of the slowdown in the demand for the
Company’s products, which began with the downturn in various
Asian economies in which the Company sells its products, which
was accelerated by the heightened pricing and competitive pres-
sures of the telecommunications market in Europe and other
regions of the world in Fiscal 1998 and Fiscal 1999, the Company
undertook strategic cost savings measures to reflect reduced sales
levels and to make the Company more competitive in the future.
The Company consolidated its facilities in San Jose, California
and reduced its occupancy, primarily for manufacturing, from
approximately 230,000 square feet to 132,000 square feet.
Also, the Company discontinued its manufacturing operation
in Scotland and subsequently established a regional service and
repair center in Scotland. Additionally, the Company closed
various worldwide sales ofKces, some of which, as a result of the
merger with MAS Technology in March 1998, were duplications
of regional coverage. The closing of the facilities discussed above
were completed in Fiscal 1999. Facility consolidation costs
totaled $4.1 million, of which $1.8 million was paid in Fiscal
1999 and $2.3 million was paid in Fiscal 2000.
Concurrent with the facilities closures, the Company reduced
its workforce by 312 employees, or 27% of its average Fiscal 1998
workforce of 1,147. Of the 312 employees affected, 71% were
manufacturing related positions, 7% were research and develop-
ment positions and 22% were in sales, marketing and administra-
tion. The workforce reductions were completed by March 31,
1999. Severance costs totaled $4.2 million in Fiscal 1999, of
which $3.3 million was paid in Fiscal 1999, $0.4 million was paid
in Fiscal 2000 and $0.5 remains to be paid during Fiscal 2001.
Payments in Fiscal 2001 are for extended severance pay and
b e n eKts elected by the employee in lieu of a lump sum distribu-
tion at date of termination.
The Company also discontinued projects related to the imple-
mentation of enterprise-wide software purchased for internal
use totaling $5.8 million of which $0.6 million was paid in Fiscal
1998, $4.4 million was paid in Fiscal 1999, $0.4 million was paid
in Fiscal 2000, and the remaining $0.4 million will be paid during
Fiscal 2001, consisting of software commitments.
Merger costs expensed in Fiscal 1999, related to the merger of
Innova consummated in October 1998, totaled $2.7 million and
consisted of $1.6 million to investment bankers, $0.7 million for
legal and accounting services, and $0.4 million for other direct
merger related expenses. All expenses were paid in Fiscal 1999.
As part of the restructuring in the third quarter of Fiscal 1999,
the Company concluded that the carrying value of the
Company’s investment in Granger, Inc., a wholly owned sub-
sidiary, was impaired due to changes in business conditions
including the slowdown in demand for its products in the U.S.
PCS market. Accordingly, the Company wrote-off $9.6 million
of goodwill related to the Granger acquisition. In addition, the
Company wrote-off other assets, primarily assets of Granger,
Inc., totaling $3.5 million. No facilities were closed or employees
terminated as part of the write-down of assets. In March 1999,
Granger was subsequently sold at net book value for $3.2 million
with extended payment terms to Granger’s former managers.

38
report of independent public accountants
To Digital Microwave Corporation:
We have audited the accompanying consolidated balance sheets
of Digital Microwave Corporation (a Delaware corporation) and
subsidiaries as of March 31, 2000 and 1999, and the related Con-
solidated Statements of Operations, Stockholders’ Equity and
Cash Flows for each of the three years in the period ended March
31, 2000. These Knancial statements are the responsibility of the
Company’s management. Our responsibility is to express an
opinion on these Knancial statements based on our audits.
We conducted our audits in accordance with auditing stan-
dards generally accepted in the United States. Those standards
require that we plan and perform the audit to obtain reasonable
assurance about whether the Knancial statements are free of
material misstatement. An audit includes examining, on a test
basis, evidence supporting the amounts and disclosures in the
Knancial statements. An audit also includes assessing the
accounting principles used and signiKcant estimates made by
management, as well as evaluating the overall Knancial state-
ment presentation. We believe that our audits provide a rea-
sonable basis for our opinion.
In our opinion, the Knancial statements referred to above present
fairly, in all material respects, the Knancial position of Digital
Microwave Corporation and subsidiaries as of March 31, 2000
and 1999, and the results of their operations and their cash flows
for each of the three years in the period ended March 31, 2000, in
conformity with accounting principles generally accepted in the
United States.
San Jose, California
April 21, 2000

Digital Microwave Corporation 2000 Annual Report 39
stock information
The Company’s Common Stock is traded on the Nasdaq National Market under the symbol DMIC. The following table sets forth the
high and low closing sales prices of the Company’s Common Stock as reported by Nasdaq for the periods indicated:
fiscal year ended march 31,
2000 1999
high low high low
1st Quarter $ 15.13 $ 7.56 $ 14.50 $ 7.00
2nd Quarter 16.06 10.84 7.63 2.88
3rd Quarter 25.00 12.81 6.84 2.38
4th Quarter 48.50 21.09 10.50 6.50
The Company has not paid cash dividends on its Common Stock and does not intend to pay cash dividends in the foreseeable future in
order to retain earnings for use in its business. At March 31, 2000, there were approximately 339 stockholders of record.

40
OfKcers
Charles D. Kissner
Chairman of the Board
Sam Smookler
President and
Chief Executive OfKcer
Frank Carretta, Jr.
Senior Vice President
Worldwide Sales
Carl A. Thomsen
Senior Vice President
Chief Financial OfKcer and
Secretary
John C. Brandt
Vice President and
Corporate Controller
Carol A. Goudey
Corporate Treasurer and
Assistant Secretary
Paul A. Kennard
Chief Technical OfKcer
John P. O’Neil
Vice President, Personnel
Directors
Richard C. Alberding
Executive Vice President (Retired)
Hewlett-Packard Company
Paul S. Bachow
President of the Corporate
General Partners
Bachow Investment Partners III, L.P.
Paul S. Bachow Co-Investment Fund, L.P.
John W. Combs
Chief Executive OfKcer
InternetConnect
Charles D. Kissner
Chairman of the Board
Dr. James D. Meindl, Ph.D.
Director
Microelectronics Research Center
Joseph M. Pettit Chair
Professor of Microelectronics
Georgia Institute of Technology
V. Frank Mendicino
General Partner
Access Venture Partners
Howard Oringer
Managing Director
Communications Capital Group
Sam Smookler
President and
Chief Executive OfKcer
Independent Public Accounts
Arthur Andersen LLP
San Jose, California
General Legal Counsel
Morrison & Foerster LLP
San Francisco, California
Registrar and Transfer Agent
ChaseMellon
Shareholder Services LLC
San Francisco, California
corporate directory

Principal Subsidiaries
DMC Telecom UK, Limited
Lanarkshire, Scotland
DMC Telecom Canada, Inc.
Etobicoke, Ontario, Canada
DMC do Brazil Ltda.
Campinas, Brazil
DMC de Mexico, S.A. de C.V.
Mexico D.F., Mexico
Digital Microwave India
Private Limited
New Delhi, India
DMC Telecom Philippines, Inc.
Metro Manila, Philippines
Digital Microwave Corporation Limited
Wellington, New Zealand
Digital Microwave (Proprietary) Limited
South Pretoria, Republic of South Africa
Digital Microwave
Asia Pacific (S) Pte. Limited
Singapore
Digital Microwave NW, Inc.
Seattle, Washington, USA
Corporate Headquarters
Digital Microwave Corporation
170 Rose Orchard Way
San Jose, CA95134
United States of America
Sales and Service Offices
North Am e r i ca :
San Jose, California
Plantation, Florida
Lawrenceville, Georgia
Amesbury, Massachusetts
Seattle, Washington
Etobicoke, Ontario, Canada
C e n t ral and South Am e r i ca :
Mexico City, Mexico
Santa Fe de Bogota, Colombia
Buenos Aires, Argentina
Campinas, Sao Paulo, Brazil
E u r o p e:
Coventry, England
Lanarkshire, Scotland
Freising, Germany
Athens, Greece
Middle East:
Dubai, United Arab Emirates
Af r i ca :
South Pretoria, South Africa
Francistown, Botswana
As i a / Pa c i f i c :
Singapore
Wellington, New Zealand
Beijing, China
Clark Special Economic Zone, Philippines
Manila (Makati City), Philippines
New Delhi, India
Colombo, Sri Lanka
Victoria, Australia
Bangkok, Thailand
Kuala Lumpur, Malaysia
SEC Form 10-K
A copy of the Company’s Annual Report
on Form 10-Kfiled with the Securities
and Exchange Commission is available
without charge by writing to:
Digital Microwave Corporation
Attn: Investor Relations
170 Rose Orchard Way
San Jose, CA95134

Digital Microwave Corporation170 Rose Orchard WaySan Jose, California 95134