HTC CORPORATION
19
HTC CORPORATION HTC CORPORATION 2 d Q BUSINESS REVIEW 2 nd Q BUSINESS REVIEW CHENG, HUI-MING CFO & S k CFO & Spokesman CHENG, JOEY Director of Investor Relations July 31, 09’
-
Upload
khangminh22 -
Category
Documents
-
view
4 -
download
0
Transcript of HTC CORPORATION

HTC CORPORATIONHTC CORPORATION
2 d Q BUSINESS REVIEW2nd Q BUSINESS REVIEW
CHENG, HUI-MING CFO & S kCFO & Spokesman
CHENG, JOEY,Director of Investor Relations July 31, 09’

DISCLAIMER STATEMENT
This presentation and release contains “forward-looking statements” which may include our future results of operations financial condition or business prospectsinclude our future results of operations, financial condition or business prospects, are based on our own information and from other sources.
Our actual results of operations, financial condition or business prospects may p p p ydiffer from those expressed or implied in these forward looking statements for a variety of reasons, including risks of market condition, supply chain, market demand and our ability to maintain a high quality products deliverydemand, and our ability to maintain a high quality products delivery.
The forward-looking statements in this release reflect the current belief of HTC as of the date of this release and HTC undertakes no obligation to update theseof the date of this release and HTC undertakes no obligation to update these forward-looking statements for events or circumstances that occur subsequent to such date.
22

PRESENTATION OUTLINE
2Q09 BUSINESS REVIEWBUSINESS ENVIRONMENTBUSINESS ENVIRONMENTMANAGEMENT INITIATIVES2Q09 P&L (UNCONSOLIDATED)2Q09 P&L (UNCONSOLIDATED)2Q09 P&L (CONSOLIDATED)2Q09 KEY FINANCIALS (UNCONSOLIDATED)2Q09 KEY FINANCIALS (UNCONSOLIDATED)2Q09 KEY FINANCIALS (CONSOLIDATED)FACT SHEET UPDATE – BUSINESS STATUSFACT SHEET UPDATE BUSINESS STATUS3Q09 BUSINESS OUTLOOK2009 BUSINESS OUTLOOKFAQs
33
2Q09 BUSINESS REVIEW
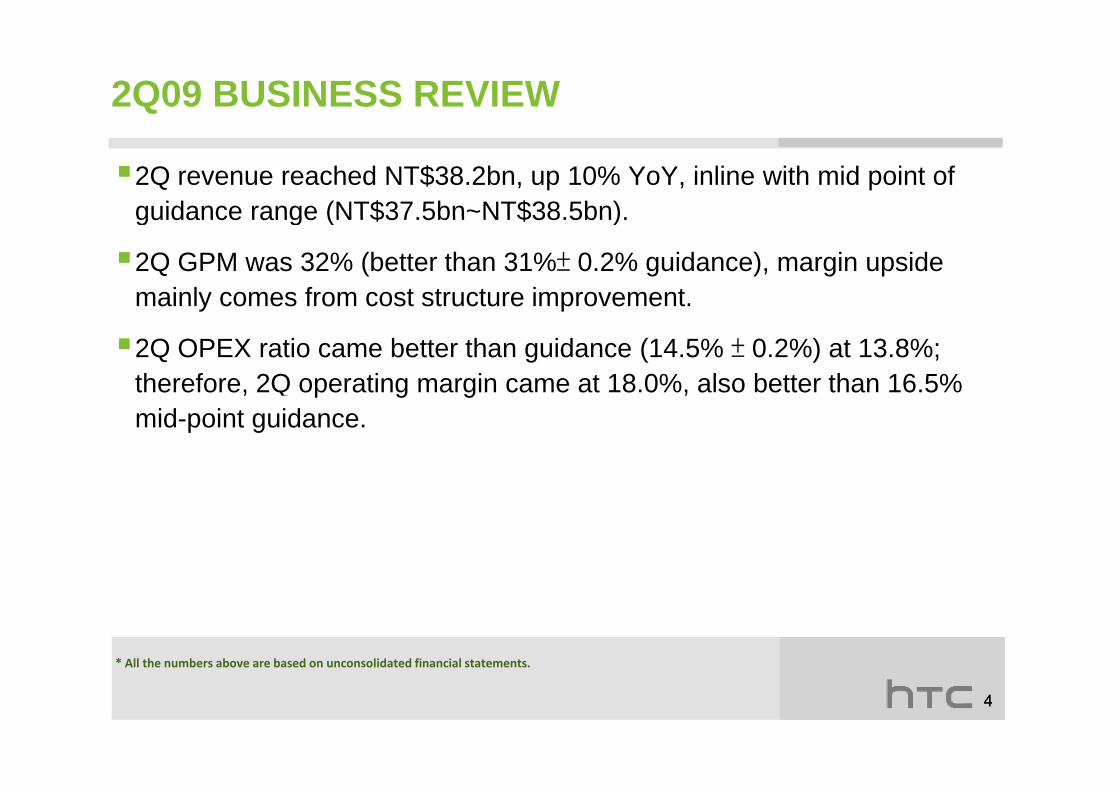
2Q revenue reached NT$38.2bn, up 10% YoY, inline with mid point of guidance range (NT$37 5bn~NT$38 5bn)guidance range (NT$37.5bn NT$38.5bn).
2Q GPM was 32% (better than 31%± 0.2% guidance), margin upside mainly comes from cost structure improvement.mainly comes from cost structure improvement.
2Q OPEX ratio came better than guidance (14.5% ± 0.2%) at 13.8%; therefore, 2Q operating margin came at 18.0%, also better than 16.5% , p g g ,mid-point guidance.
* All the numbers above are based on unconsolidated financial statements
44
All the numbers above are based on unconsolidated financial statements.

BUSINESS ENVIRONMENT
Mid-tier converged devices started emerging, attractive price/performance will further drive smart phone penetrationprice/performance will further drive smart phone penetration.
Next generation mobile broadband user experience would be benchmarked by user-friendly interface, social-network embeddedbenchmarked by user friendly interface, social network embedded communication, intuitive touch-panel based navigation and efficient multi-task operating system.
Mobile broadband trend continues to grow wireless industry and dominates the growth opportunity. Competition in converged innovation b iti l i bil d i i d t d ld l d t dbecomes critical in mobile device industry and could lead to vendor landscape reshuffle.
US market is relatively healthier while European market weakerUS market is relatively healthier while European market weaker.
55

MANAGEMENT INITIATIVES
Phase I branding process was more than successful amid a learning and uncertain stage. Meaningful brand awareness has been built as a leading Smartphone innovator and organization /talent has also been established toward brand focus.
A ti h II b di h b f th H l h dA proactive phase II branding process has begun from the Hero launch and HTC cycling team sponsorship at Tour De France . Management aims to further drive growth at phase II by delivering the best customer experience. A holistic product launch approach on brand, channel, sales and marketing is expected to be boosted at this phase.
Th HTC “S ” d li HTC b d it t t id t iThe HTC “Sense” delivers HTC brand commitment to provide user centric experience and receives global media recognition in the three key themes, Make it Mine, Stay Close and Discover the Unexpected. HTC ‘Sense” further raises the bar of competition and demonstrates our leadership in the Android platform.
66

MANAGEMENT INITIATIVES
Management adjusts product mix to expand into the mid-tier ASP product segment; percentage of revenue contribution begins fromproduct segment; percentage of revenue contribution begins from 2H09.
Management aims to maintain a balance between profitability & volumeManagement aims to maintain a balance between profitability & volume in the transition (entering mid tier price product segment ) to drive volume growth and market share.
Management sees China as key growth driver within 3 years when 3G infrastructure and operating environment become mature; initial
t ll t h l t d d f j i h bengagement on all technology standards from major carriers has begun.
Invited one new board director - Mr. Hochen Tan, the ex-Chairman of Ch H T l i ti C i t HTC B dChung Hua Telecommunication Co., into HTC Board.
77
MANAGEMENT INITIATIVES
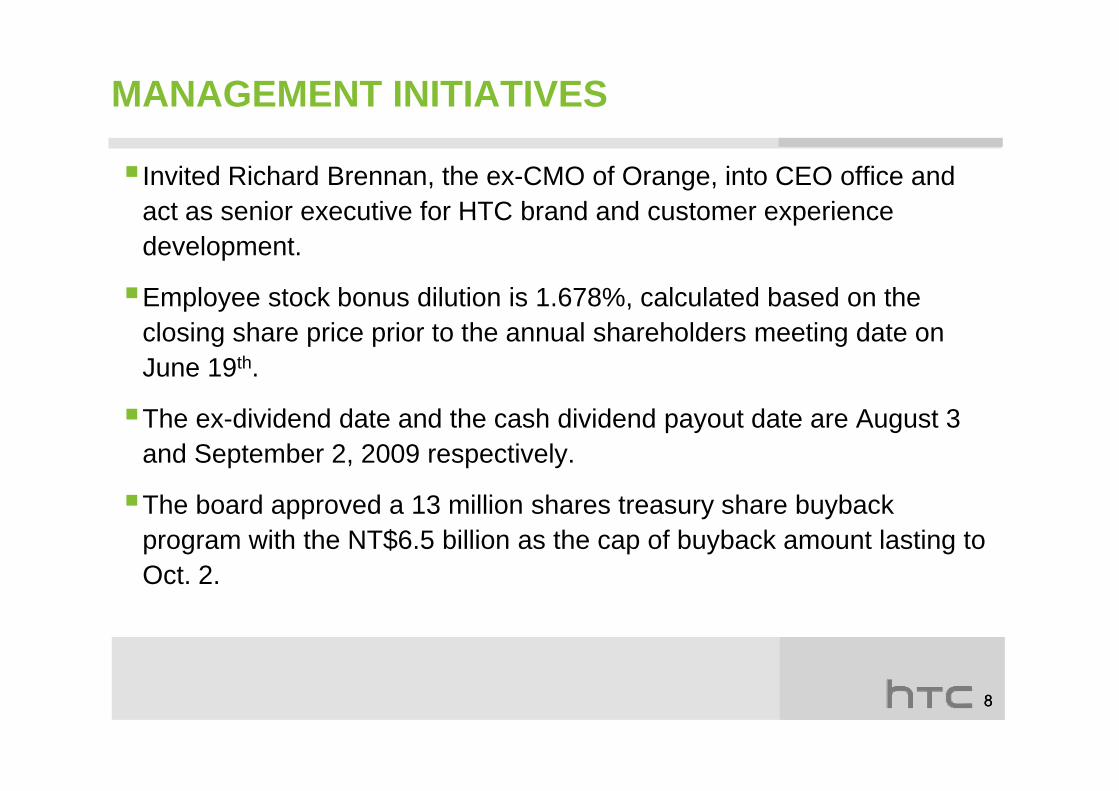
Invited Richard Brennan, the ex-CMO of Orange, into CEO office and act as senior executive for HTC brand and customer experienceact as senior executive for HTC brand and customer experience development.
Employee stock bonus dilution is 1.678%, calculated based on theEmployee stock bonus dilution is 1.678%, calculated based on the closing share price prior to the annual shareholders meeting date on June 19th.
The ex-dividend date and the cash dividend payout date are August 3 and September 2, 2009 respectively.
The board approved a 13 million shares treasury share buyback program with the NT$6.5 billion as the cap of buyback amount lasting to Oct 2Oct. 2.
88

2Q09 P&L (UNCONSOLIDATED)
(NT$ Billion) 2Q 08 1Q 09 2Q 09 QOQ YOY
REVENUES 34.62 31.59 38.20 20.9% 10.3%
GROSS PROFIT 11.96 9.50 12.24 28.8% 2.3%
RSGA EXPENSE 5.05 4.64 5.28 13.9% 4.6%
NOP 6.91 4.85 6.89 42.3% -0.3%
NPBT 7.30 5.39 7.11 31.9% -2.5%
NPAT 6.62 4.87 6.50 33.4% -1.7%
GPM 34.5% 30.1% 32.0%
RSGA RATIO 14.6% 14.7% 13.8%
*The EPS was calculated based on the outstanding shares at the time.
EPS*(NT$) 11.54 6.54 8.73(before ex-rights)
99

2Q09 P&L (CONSOLIDATED)
(NT$ Billion) 2Q 08 1Q 09 2Q 09 QOQ YOY
REVENUES 34.97 31.41 38.14 21.4% 9.1%
GROSS PROFIT 12.13 9.61 12.05 25.3% -0.7%
RSGA EXPENSE 5.21 4.59 5.17 12.8% -0.8%
NOP 6.92 5.03 6.88 36.8% -0.6%
NPBT 7.39 5.44 7.13 31.2% -3.4%
NPAT*1 6.62 4.87 6.50 33.4% -1.7%
GPM 34.7% 30.6% 31.6%
RSGA RATIO 14.9% 14.6% 13.6%
*1Attributable to stockholders of parent company, excluding minority interest.*2Th EPS l l t d b d th t t di h t th ti
EPS*2(NT$) 11.54 6.54 8.73(before ex-rights)
1010
*2The EPS was calculated based on the outstanding shares at the time.

2Q09 KEY FINANCIALS (UNCONSOLIDATED)
(NT$ Billion) June 30, 08 Mar 31, 09 June 30, 09 QOQ YOY
CASH*1CASH*173.24 71.72 68.50 -4.5% -6.5%
AR 19.28 17.56 29.83 69.9% 54.7%
INVENTORY 5.53 4.64 4.46 -4.0% -19.4%
NET WORTH 48 86 65 64 56 93*2 13 3% 16 5%NET WORTH 48.86 65.64 56.93*2 -13.3% 16.5%INVENTORY PROVISON 1.18 2.35 2.79 19.0% 135.6%
AR PROVISION 0.32 0.75 0.75 0.0% 134.4%WARRANTY
4 60 4 84 5 28 8 9% 14 7%PROVISION 4.60 4.84 5.28 8.9% 14.7%
*1Includes cash equivalents.
1111
*2After the deduction of cash dividend NT$20.125bn (NT$27/per share)
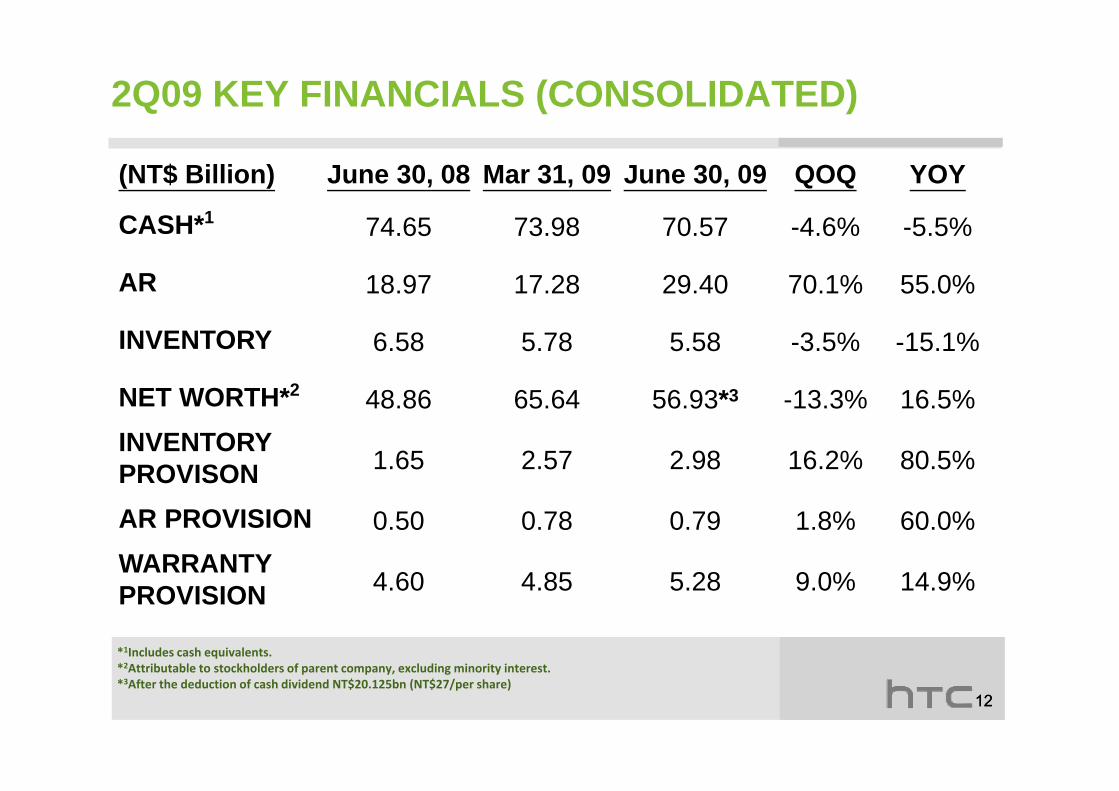
2Q09 KEY FINANCIALS (CONSOLIDATED)
(NT$ Billion) June 30, 08 Mar 31, 09 June 30, 09 QOQ YOY
CASH*1CASH*1 74.65 73.98 70.57 -4.6% -5.5%
AR 18.97 17.28 29.40 70.1% 55.0%
INVENTORY 6.58 5.78 5.58 -3.5% -15.1%
NET WORTH*2 48 86 65 64 56 93*3 13 3% 16 5%NET WORTH*2 48.86 65.64 56.93*3 -13.3% 16.5%INVENTORY PROVISON 1.65 2.57 2.98 16.2% 80.5%
AR PROVISION 0.50 0.78 0.79 1.8% 60.0%WARRANTY
4 60 4 85 5 28 9 0% 14 9%PROVISION 4.60 4.85 5.28 9.0% 14.9%
*1Includes cash equivalents.*2Att ib t bl t t kh ld f t l di i it i t t
1212
*2Attributable to stockholders of parent company, excluding minority interest.*3After the deduction of cash dividend NT$20.125bn (NT$27/per share)

FACT SHEET UPDATES – BUSINESS STATUS
GPM(%) OPEX Ratio(%) OPM(%)Revenue YoY
REVENUE MARGINNT$B
34.5 34.2
29.8 30.1 32.0
29% 30%30%
40%
50
60
20.0 19.1 18 3 18 0
21%
20%40
14.6 15.0
11.5
14.7 13.8
18.3 15.3
18.0
10%10%20
30
34.62 37.86 47.38 31.59 38.20
-3% 0%10
08Q2 08Q3 08Q4 09Q1 09Q2-10%-
08Q2 08Q3 08Q4 09Q1 09Q2
*Excluded 2 adjustments of NT$0.24 billion for accounting adjustment and PSP expenses in 3Q 08, the adjusted NOP post‐bonus is NT$7 47bil in 3Q whereas OPM post‐bonus is 19 7% in 3Q 08
*
post‐bonus is NT$7.47bil in 3Q whereas OPM post‐bonus is 19.7% in 3Q 08.
1313

FACT SHEET UPDATES – BUSINESS STATUS
Unit: Million
SHIPMENT AVERAGE SELLING PRICEASP(NT$) ASP(US$)* US$NT$
3.5
4.0
2 9
3.7
3.0 381
400 367 364 358
400
450
14,000
16,000 ASP(NT$) ASP(US$) US$
2.5
3.0 2.8 2.9
2.4 11,591 12,466 12,059 12,313 11,846
250
300
350
10,000
12,000
1.5
2.0
150
200
250
6,000
8,000
0.5
1.0
50
100
2,000
4,000
-08Q2 08Q3 08Q4 09Q1 09Q2
*The ASP(US$) is translated to the US dollar at average exchange rate for each quarters. The exchange rates for 2Q08 to 2Q09 are 30 43 31 16 32 84 33 85 and 33 08 respectively
--08Q2 08Q3 08Q4 09Q1 09Q2
1414
2Q08 to 2Q09 are 30.43, 31.16, 32.84, 33.85 and 33.08 respectively.

3Q09 BUSINESS OUTLOOK
3Q revenue expects to decline mid to high single digit YoY or from NT$34bn to NT$36bnNT$34bn to NT$36bn.
Non ODM unit shipment expects to grow mid single digit YoY while the Non ODM ASP will decline more than 10% YoY. ODM revenue expectsNon ODM ASP will decline more than 10% YoY. ODM revenue expects to drop QoQ.
GPM expects to be around 32.5%± 0.5%.p
OPEX ratio expects to be around 15%± 0.5%.
* All the numbers above are based on unconsolidated numbers.
1515

2009 BUSINESS OUTLOOK
Revenue expects to decline low to mid single digit from the 2008 level, lower than original guided 10% growthlower than original guided 10% growth.
Gross margin comes in at upper level of guided range (30%~32%).
OPEX ratio increased from 13.5% to slightly above 15%, in order to expand marketing campaign on brand awareness.
Management is taking necessary actions to lift the business momentum in the 4th Q.
* All the numbers above are based on unconsolidated numbers.
1616

FAQs
Q: Please comment why HTC lowers 2009 revenue guidance?
A: The main reason for us to revise down our 2H revenue is OS platform transitional/ramping issues; and also three other reasons : (1). A couple products being delayed from 2H to next year. (2). ODM unit drops faster than expected. (3). Slower than expected China ramp due to lack of 3G infrastructure and operating environment.
Management targets to strengthen HTC brand a areness and plan to increase marketing spendingManagement targets to strengthen HTC brand awareness and plan to increase marketing spending in 4Q to launch our phase II brand development with focus on a holistic product rollout strategy which covers sales, marketing, channel and store front.
Q: How should we foresee margin trend after better than expected 2Q number and 3Q guidance?Q: How should we foresee margin trend after better than expected 2Q number and 3Q guidance?
A: Better than expected YTD gross margin not only clarifies overly concerned pricing pressure but also show our competitiveness on operation efficiency. As mid‐tier price smart phone market emerges, we will continue making efforts to improve overall efficiency on engineering, man fact ring sales/marketing as ell as strategic s ppl chain managementmanufacturing, sales/marketing as well as strategic supply chain management.
Q: Please comment HTC’s products strategy as mid‐tier price converged device emerging?
A: HTC has pioneered smart phone industry and will be leading the trend to drive mid‐tier price d i i d l h i i d b i dadoption as industry cycle approaches to ramping stage. We are committed to bring down current converged architecture cost to mid‐tier price level, yet maintaining device performance and attractive user experiences.
1717

FAQs
Q: Please comment impact to HTC when late comers start competing against Android platform?
A: We are happy to see more adoption on Android platform from peers because it not only proves our vision, but also likely to reshape the mobile OS landscape to favor HTC positioning. We aim to maintain our leadership position on Android platform by delivering the best system performance, proprietary smooth HTC user experience and operator‐friendly customization servicesservices.
Q: What do you expect the shipment volume of Hero, the 3rd Android model?
A: Primary purpose of “Hero” launch is to unveil HTC experience “Sense”, we expect present A d id tf li (M i & H ) t d i t t l l b t t H l W i t d liAndroid portfolio (Magic & Hero) to drive total volume but not Hero along. We aim to deliver HTC “Sense” into our Android portfolio with different IDs and price segments going forward.
Q: Please comment importance of owning proprietary mobile OS?
A: There is certain advantage to vertically owned OS to design converged device, like Apple, but it could be damaging to the smart phone design if proprietary OS can not compete against open OS in scale. We believe WM and Android OS are well positioned and highly ranked in the smart phone industry that it is our best interest to partner/leverage the two OS to oursmart phone industry that it is our best interest to partner/leverage the two OS to our converged device development at this stage.
1818

FAQs
Q: Please comment upcoming OPEX trend impacted from increasing branding campaign?
A: HTC experience has come to another milestone when we launched HTC “Sense”. In order to strengthen our brand awareness beyond global operators, we need to increase marketing budget to channel promotion programs as well as end consumer level advertisement. That is why we raised our 2009 OPEX ratio to slightly above 15% from previous 13.5%.
Q: Please explain why AR jumped significantly in 2Q09’s result?
A: It mainly comes from impact of customer mix shifted toward those who have relatively longer payment term requirements. The AR quality remains healthy and we keep strict credit management policy and take risk mitigation actions such as credit insurance to enhance ARmanagement policy and take risk mitigation actions such as credit insurance to enhance AR quality.
1919