Starbucks Corporation - cloudfront.net
103
Table of Contents UNITED STATES SECURITIES AND EXCHANGE COMMISSION Washington, DC 20549 Form 10-K ☒ ANNUAL REPORT PURSUANT TO SECTION 13 OR 15(d) OF THE SECURITIES EXCHANGE ACT OF 1934 For the Fiscal Year Ended October 3, 2021 or ☐ TRANSITION REPORT PURSUANT TO SECTION 13 OR 15(d) OF THE SECURITIES EXCHANGE ACT OF 1934 For the transition period from to . Commission File Number: 0-20322 Starbucks Corporation (Exact Name of Registrant as Specified in its Charter) Washington 91-1325671 (State of Incorporation) (IRS Employer ID) 2401 Utah Avenue South, Seattle, Washington 98134 (206) 447-1575 (Address of principal executive office, zip code, telephone number) Securities Registered Pursuant to Section 12(b) of the Act: Title of Each Class Trading Symbol Name of Each Exchange on Which Registered Common Stock, $0.001 par value per share SBUX Nasdaq Global Select Market Securities Registered Pursuant to Section 12(g) of the Act: None Indicate by check mark if the registrant is a well-known seasoned issuer, as defined in Rule 405 of the Securities Act. Yes x No ¨ Indicate by check mark if the registrant is not required to file reports pursuant to Section 13 or Section 15(d) of the Act. Yes ¨ No x Indicate by check mark whether the registrant: (1) has filed all reports required to be filed by Section 13 or 15(d) of the Securities Exchange Act of 1934 during the preceding 12 months (or for such shorter period that the registrant was required to file such reports), and (2) has been subject to such filing requirements for the past 90 days. Yes x No ¨ Indicate by check mark whether the registrant has submitted electronically every Interactive Data File required to be submitted pursuant to Rule 405 of Regulation S-T (§ 232.405 of this chapter) during the preceding 12 months (or for such shorter period that the registrant was required to submit such files). Yes x No ¨ Indicate by check mark whether the registrant is a large accelerated filer, an accelerated filer, a non-accelerated filer, a smaller reporting company, or an emerging growth company. See the definitions of “large accelerated filer,” “accelerated filer,” “smaller reporting company” and “emerging growth company” in Rule 12b-2 of the Exchange Act. Large accelerated filer x Accelerated filer ¨ Non-accelerated filer ¨ Smaller reporting company ☐ Emerging growth company ☐ If an emerging growth company, indicate by check mark if the registrant has elected not to use the extended transition period for complying with any new or revised financial accounting standards provided pursuant to Section 13(a) of the Exchange Act. ¨ Indicate by check mark whether the registrant has filed a report on and attestation to its management's assessment of the effectiveness of its internal control over financial reporting under Section 404(b) of the Sarbanes-Oxley Act (15 U.S.C. 7262(b)) by the registered public accounting firm that prepared or issued its audit report. x Indicate by check mark whether the registrant is a shell company (as defined in Rule 12b-2 of the Act). Yes ☐ No x The aggregate market value of the voting stock held by non-affiliates of the registrant as of the last business day of the registrant’s most recently completed second fiscal quarter, based upon the closing sale price of the registrant’s common stock on March 28, 2021 as reported on the Nasdaq Global Select Market was $129.3 billion. As of November 12, 2021, there were 1,173.2 million shares of the registrant’s Common Stock outstanding.
-
Upload
khangminh22 -
Category
Documents
-
view
3 -
download
0
Transcript of Starbucks Corporation - cloudfront.net

Table of Contents
UNITED STATES SECURITIES AND EXCHANGE COMMISSIONWashington, DC 20549
Form 10-K☒ ANNUAL REPORT PURSUANT TO SECTION 13 OR 15(d) OF THE SECURITIES EXCHANGE ACT OF 1934
For the Fiscal Year Ended October 3, 2021or
☐ TRANSITION REPORT PURSUANT TO SECTION 13 OR 15(d) OF THE SECURITIES EXCHANGE ACT OF 1934For the transition period from to .
Commission File Number: 0-20322
Starbucks Corporation(Exact Name of Registrant as Specified in its Charter)
Washington 91-1325671
(State of Incorporation) (IRS Employer ID)
2401 Utah Avenue South, Seattle, Washington 98134(206) 447-1575
(Address of principal executive office, zip code, telephone number)Securities Registered Pursuant to Section 12(b) of the Act:
Title of Each Class Trading Symbol Name of Each Exchange on Which RegisteredCommon Stock, $0.001 par value per share SBUX Nasdaq Global Select Market
Securities Registered Pursuant to Section 12(g) of the Act: NoneIndicate by check mark if the registrant is a well-known seasoned issuer, as defined in Rule 405 of the Securities Act. Yes x No ¨Indicate by check mark if the registrant is not required to file reports pursuant to Section 13 or Section 15(d) of the Act. Yes ¨ No xIndicate by check mark whether the registrant: (1) has filed all reports required to be filed by Section 13 or 15(d) of the Securities Exchange Act of 1934 during thepreceding 12 months (or for such shorter period that the registrant was required to file such reports), and (2) has been subject to such filing requirements for thepast 90 days. Yes x No ¨Indicate by check mark whether the registrant has submitted electronically every Interactive Data File required to be submitted pursuant to Rule 405 ofRegulation S-T (§ 232.405 of this chapter) during the preceding 12 months (or for such shorter period that the registrant was required to submit suchfiles). Yes x No ¨Indicate by check mark whether the registrant is a large accelerated filer, an accelerated filer, a non-accelerated filer, a smaller reporting company, or an emerginggrowth company. See the definitions of “large accelerated filer,” “accelerated filer,” “smaller reporting company” and “emerging growth company” in Rule 12b-2of the Exchange Act.
Large accelerated filer x Accelerated filer¨
Non-accelerated filer¨
Smaller reporting company ☐
Emerging growth company ☐
If an emerging growth company, indicate by check mark if the registrant has elected not to use the extended transition period for complying with any new orrevised financial accounting standards provided pursuant to Section 13(a) of the Exchange Act. ¨
Indicate by check mark whether the registrant has filed a report on and attestation to its management's assessment of the effectiveness of its internal control overfinancial reporting under Section 404(b) of the Sarbanes-Oxley Act (15 U.S.C. 7262(b)) by the registered public accounting firm that prepared or issued its auditreport. x
Indicate by check mark whether the registrant is a shell company (as defined in Rule 12b-2 of the Act). Yes ☐ No x
The aggregate market value of the voting stock held by non-affiliates of the registrant as of the last business day of the registrant’s most recently completed secondfiscal quarter, based upon the closing sale price of the registrant’s common stock on March 28, 2021 as reported on the Nasdaq Global Select Market was $129.3billion. As of November 12, 2021, there were 1,173.2 million shares of the registrant’s Common Stock outstanding.

Table of Contents
DOCUMENTS INCORPORATED BY REFERENCE
Portions of the definitive Proxy Statement for the registrant’s Annual Meeting of Shareholders to be held on March 16, 2022 have been incorporated by referenceinto Part III of this Annual Report on Form 10-K.

Table of Contents
STARBUCKS CORPORATIONForm 10-K
For the Fiscal Year Ended October 3, 2021TABLE OF CONTENTS
PART IItem 1 Business 2Item 1A Risk Factors 11Item 1B Unresolved Staff Comments 22Item 2 Properties 22Item 3 Legal Proceedings 22Item 4 Mine Safety Disclosures 22
PART IIItem 5 Market for the Registrant’s Common Equity, Related Shareholder Matters and Issuer Purchases of Equity Securities 23Item 6 Reserved 25Item 7 Management’s Discussion and Analysis of Financial Condition and Results of Operations 26Item 7A Quantitative and Qualitative Disclosures About Market Risk 40Item 8 Financial Statements and Supplementary Data 41
Index for Notes to Consolidated Financial Statements 46Report of Independent Registered Public Accounting Firm 81
Item 9 Changes in and Disagreements with Accountants on Accounting and Financial Disclosure 83Item 9A Controls and Procedures 83Item 9B Other Information 85Item 9C Disclosure Regarding Foreign Jurisdictions that Prevent Inspections 85
PART IIIItem 10 Directors, Executive Officers and Corporate Governance 86Item 11 Executive Compensation 86Item 12 Security Ownership of Certain Beneficial Owners and Management and Related Shareholder Matters 86Item 13 Certain Relationships and Related Transactions and Director Independence 86Item 14 Principal Accountant Fees and Services 86
PART IVItem 15 Exhibits and Financial Statement Schedules 87Item 16 Form 10-K Summary 92SIGNATURES 93

Table of Contents
CAUTIONARY NOTE REGARDING FORWARD-LOOKING STATEMENTS
This Annual Report on Form 10-K includes “forward-looking” statements within the meaning of the Private Securities Litigation Reform Act of 1995. Forward-looking statements can be identified by the fact that they do not relate strictly to historical or current facts. They often include words such as “believes,” “expects,”“anticipates,” “estimates,” “intends,” “plans,” “seeks” or words of similar meaning, or future or conditional verbs, such as “will,” “should,” “could,” “may,”“aims,” “intends,” or “projects.” A forward-looking statement is neither a prediction nor a guarantee of future events or circumstances, and those future events orcircumstances may not occur. You should not place undue reliance on forward-looking statements, which speak only as of the date of this Annual Report on Form10-K. These forward-looking statements are all based on currently available operating, financial and competitive information and are subject to various risks anduncertainties. Our actual future results and trends may differ materially depending on a variety of factors, including, but not limited to, the risks and uncertaintiesdiscussed under “Risk Factors” and “Management’s Discussion and Analysis of Financial Condition and Results of Operations.” Given these risks anduncertainties, you should not rely on forward-looking statements as a prediction of actual results. Any or all of the forward-looking statements contained in thisAnnual Report on Form 10-K and any other public statement made by us, including by our management, may turn out to be incorrect. We are including thiscautionary note to make applicable and take advantage of the safe harbor provisions of the Private Securities Litigation Reform Act of 1995 for forward-lookingstatements. We expressly disclaim any obligation to update or revise any forward-looking statements, whether as a result of new information, future events orotherwise.
1

Table of Contents
PART I
Item 1. Business
General
In this Annual Report on Form 10-K (“10-K” or “Report”) for the fiscal year ended October 3, 2021 (“fiscal 2021”), Starbucks Corporation (together with itssubsidiaries) is referred to as “Starbucks,” the “Company,” “we,” “us” or “our.”
Starbucks is the premier roaster, marketer and retailer of specialty coffee in the world, operating in 84 markets. Formed in 1985, Starbucks Corporation’s commonstock trades on the Nasdaq Global Select Market (“Nasdaq”) under the symbol “SBUX.” We purchase and roast high-quality coffees that we sell, along withhandcrafted coffee, tea and other beverages and a variety of high-quality food items through company-operated stores. We also sell a variety of coffee and teaproducts and license our trademarks through other channels, such as licensed stores as well as grocery and foodservice through our Global Coffee Alliance withNestlé S.A. (“Nestlé”). In addition to our flagship Starbucks Coffee brand, we sell goods and services under the following brands: Teavana, Seattle’s Best Coffee,Evolution Fresh, Ethos, Starbucks Reserve and Princi.
Our primary objective is to maintain Starbucks standing as one of the most recognized and respected brands in the world. We believe our work to create a companythat is profit-, people- and planet-positive, along with our ability to successfully execute strategies that support this work, contribute to our primary objective.
Profit-Positive
Our profit-positive efforts are aligned with our global long-term “Growth at Scale” agenda to deliver consistent revenue and income growth, through focus anddiscipline. We believe incremental investments in our brand, principally to support our people- and planet-positive work, will deliver long-term targeted revenueand income growth. This includes expansion of our global store base, adding stores in both existing, developed markets such as the U.S. and in newer, highergrowth markets such as China, as well as optimizing the mix of company-operated and licensed stores around the world. In addition, by leveraging experiencesgained through our stores and elsewhere, we continue to drive beverage, equipment, process and technology innovation. We strive to regularly offer consumersnew, innovative coffee and other products in a variety of forms, across new categories, diverse channels and alternative store formats. We are committed to furtherinvestments in our partners (employees) and our industry-leading digital platform as well as environmental, social and governance issues underscoring our missionand values. Our disciplined capital allocation methodology, which prioritizes high-return investments as well as share repurchases and competitive dividends,rounds out our “Growth at Scale” agenda and our profit-positive vision.
People-Positive
Our people-positive vision is to cultivate an inclusive environment where everyone belongs. This includes empowering our partners with opportunities to pursuetheir aspirations while living our mission and values, acting with empathy and compassion and sharing in our success. This enables our partners to deliver anelevated Starbucks Experience to our customers every day. We also strive to develop long-lasting trust and make tangible differences in the communities where weserve by investing in humanity and the well-being of everyone we connect with, advancing initiatives that support diversity, equity and inclusion througheducation, pay equity, hiring commitments and meaningful community involvement, including donations.
Planet-Positive
Our planet-positive vision is to give back more than we take from the planet. This includes reducing our environmental impacts, such as expanding reusablepackaging, conserving water, shifting to renewable energy and eliminating landfill waste, and committing to the sustainability of high-quality coffee and other rawmaterials. Sustainability of our raw materials, especially coffee, is paramount to our business operations. We are committed to ethically sourcing coffee, tea andcocoa, donating disease-resistant coffee trees to farmers, providing farmers access to low-interest loans and sharing the expertise of our agronomists with all coffeefarmers, among other things.
Human Capital Management
As a company, Starbucks mission is not only to deliver outstanding financial results by offering exceptional and unique products and services, but to also create astrong connection with the communities where we operate. We believe the strength of our workforce is one of the significant contributors to our success as a globalbrand that leads with purpose as part of our people-positive vision. This is largely attributed to our partners who strive every day to create a welcoming andinclusive environment. Therefore, one of our core strategies is to invest in and support our partners to differentiate our brand, products and services in thecompetitive specialty coffee market, including the following areas of focus:
Oversight and Management
We recognize the diversity of customers, partners and communities, and believe in creating an inclusive and equitable environment that represents a broadspectrum of backgrounds and cultures. Working under these principles, our Partner
2

Table of Contents
Resources Organization is tasked with managing employment-related matters, including recruiting and hiring, onboarding and training, compensation planning,performance management and professional development. Our Board of Directors and Board committees provide oversight on certain human capital matters,including our Inclusion and Diversity programs and initiatives. As noted in its charter, our Compensation and Management Development Committee is responsiblefor periodically reviewing Starbucks partner resource programs and initiatives, including healthcare and other benefits, as well as our management developmentand succession planning practices and strategies. Our Audit and Compliance Committee works closely with the Risk Management Committee, led by Starbucks cfoand general counsel, to monitor and mitigate current and emerging labor and human capital management risks. Furthermore, our Nominating and CorporateGovernance Committee, in consultation with management, including our chief partner officer and chief inclusion and diversity officer, annually evaluates theeffectiveness of our social responsibility policies, goals and programs, which also include partner-related issues. These reports and recommendations to the Boardand its committees are part of the broader framework that guides how Starbucks should attract, retain and develop a skilled workforce that aligns with our valuesand strategies.
We regularly conduct anonymous surveys to seek feedback from our partners on a variety of topics, including confidence in company leadership, competitivenessof our compensation and benefits package, career growth opportunities and recommendations on how we can remain an employer of choice. The results are sharedwith our partners and reviewed by senior leadership, who analyze areas of progress or deterioration and prioritize actions and activities in response to this feedbackto drive meaningful improvements in partner engagement. Our management and cross-functional teams also work closely to evaluate human capital managementissues such as partner retention, workplace safety, harassment and bullying, as well as to implement measures to mitigate these risks.
Diversity, Equity and Inclusion
We are committed to creating a welcoming and inclusive environment. We believe it is our responsibility to advance racial and social equity, and we arecommitted to furthering that work with intention, transparency and accountability. In 2021, we published our third Civil Rights Assessment that evaluated ourongoing efforts related to diversity, equity and inclusion and how they support our mission and values. The report addressed our progress over time and providesrecommendations for how we can better advance diversity, equity and inclusion on behalf of our partners, customers and communities.
We continue to welcome our partners, customers, civil rights and community leaders, along with our chief inclusion and diversity officer, to advise us along thisjourney.
Starbucks has made specific racial equity commitments based on our principles of being intentional, transparent and accountable at all levels:
• Being intentional in cultivating a culture of inclusion, with a focus on partner retention and development.
◦ Launching a mentorship program connecting black, indigenous and people of color (“BIPOC”) partners to senior leaders, beginning with acohort of leaders, senior vice president and above, as well as BIPOC directors in corporate and retail roles.
◦ Investing in strategic partnerships with professional organizations that focus on the development of BIPOC talent, providing additionaldevelopment opportunities for our BIPOC partners.
• Being transparent in our approach to Inclusion and Diversity goal setting and progress.
◦ Publicly sharing workforce diversity data.
◦ Setting annual Inclusion and Diversity goals based on retention rates and progress towards achieving BIPOC representation. Our goal is for atleast 30% of all corporate roles and at least 40% of all retail and manufacturing roles to be held by BIPOC partners by 2025.
• Holding ourselves accountable at the highest levels of the organization.
◦ Incorporating metrics focused on building inclusive and diverse teams into our executive compensation programs beginning in fiscal 2021.
◦ Joining the Board Diversity Action Alliance to act alongside other companies similarly committed to increasing racially and ethnically diverserepresentation on corporate boards of directors.
◦ Publicizing self-identified race/ethnicity of each member of our board of directors.
Total Rewards
We have demonstrated a history of investing in our workforce by offering competitive salaries and wages by continuously assessing the current businessenvironment and labor market. We have consistently made enhancements in wages in order to attract talent to support our growth strategy and to elevate thecustomer experience. To foster a stronger sense of ownership and
3

Table of Contents
align the interests of partners with shareholders, restricted stock units are provided to eligible non-executive partners under our broad-based stock incentiveprograms. Furthermore, we offer comprehensive, locally relevant and innovative benefits to all eligible partners. In the U.S., our largest and most mature market,these include:
• Comprehensive health insurance coverage is offered to partners working an average of 20 hours or more each week.
• 100% upfront tuition coverage is offered through the Starbucks College Achievement Plan for partners to earn a first-time bachelor's degree online atArizona State University.
• 100% paid parental leave is available to new parents that welcome a child through birth, adoption or foster placement and work an average of 20 hours ormore each week.
• A Partner and Family Sick Time program is provided and allows partners to accrue paid sick time based on hours worked and use that time for themselvesor family members in need of care.
• Care@Work benefit provides partners with backup care benefits for children and adults at a small cost to partners, as well as free unlimited senior careplanning services. This benefit includes up to 30 days of backup care services through the end of fiscal 2022, in light of the COVID-19 pandemic.
• We view mental health as a fundamental part of our humanity and provide a comprehensive suite of related programs and benefits. These include a freesubscription to Headspace, an online application that enables guided mediation, and 20 free mental health therapy or coaching sessions annually withLyra.
Outside of the U.S., we have provided other innovative benefits to help address market-specific needs, such as providing interest-free loans to our U.K. partners tohelp cover rental deposits, mental health services in Canada, and in China, a monthly housing subsidy for full-time Starbucks baristas and shift supervisors, as wellas comprehensive health insurance coverage for parents of partners.
Role-based Support
To help our partners succeed in their roles, we emphasize continuous training and development opportunities. These include, but are not limited to, safety andsecurity protocols, updates on new products and service offerings and deployment of technologies. Training provided through our Pour Over sessions, which are aseries of inspiring talks with thought leaders to help partners understand how to bring the Starbucks Experience to life, include a wide variety of topics such asachievable goal setting, giving and receiving constructive feedback and effective engagement with customers and communities. To help further promote aninclusive culture and to better serve our customers, we encourage U.S.-based partners to enroll in the To Be Welcoming courses we created in partnership withArizona State University to address different forms of bias and discrimination.
Pay Equity
To be an employer of choice and maintain the strength of our workforce, we consistently assess the current business environment and labor market to refine ourcompensation and benefits programs and other resources available to our partners.
We previously achieved and currently maintain 100 percent pay equity in the U.S. for women and men and people of all races for partners performing similarwork. We have also achieved gender pay equity in China and Canada, two of our largest markets outside of the U.S., and we made a commitment to achievegender pay equity in all company-operated markets. Further, we have formulated pay-equity principles which provide equal footing, transparency andaccountability as best practices that help address known, systemic barriers to global pay equity.
As of October 3, 2021, Starbucks employed approximately 383,000 people worldwide. In the U.S., Starbucks employed approximately 245,000 people, withapproximately 235,000 in company-operated stores and the remainder in corporate support, store development, roasting, manufacturing, warehousing anddistribution operations. Approximately 138,000 employees were employed outside of the U.S., with approximately 135,000 in company-operated stores and theremainder in regional support operations. The number of Starbucks partners represented by unions is not significant. We believe our efforts in managing ourworkforce have been effective, evidenced by a strong Starbucks culture and a good relationship between the company and our partners.
4
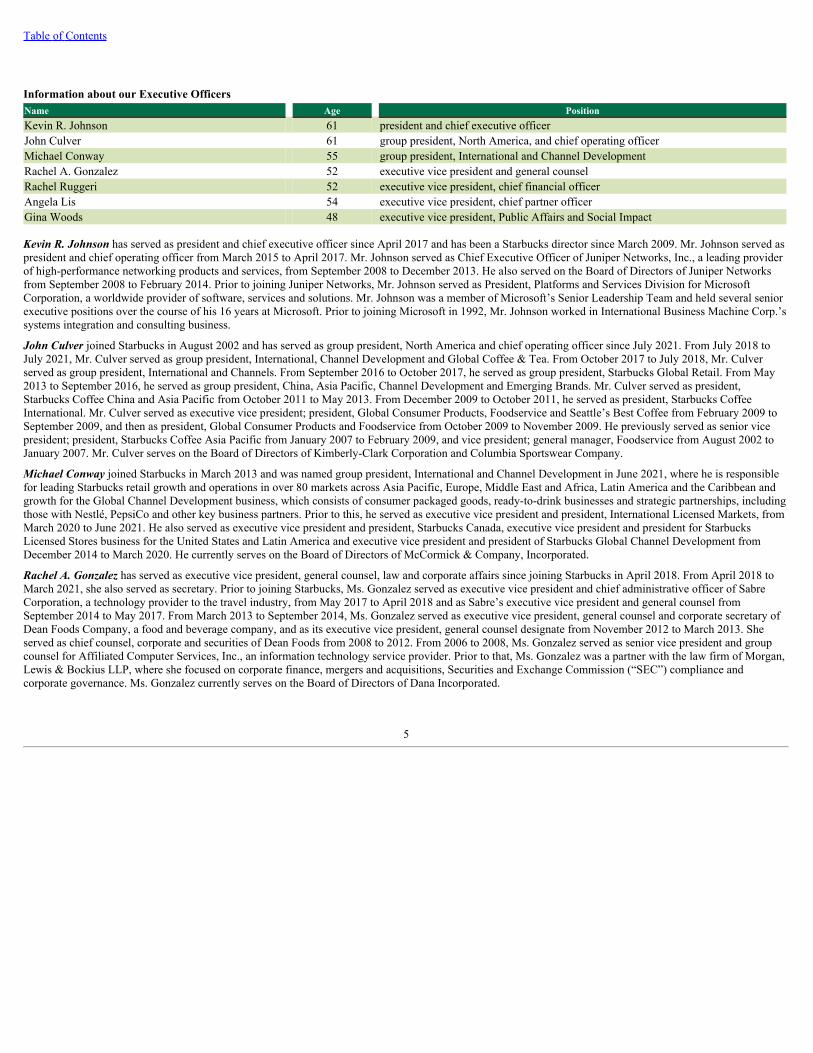
Table of Contents
Information about our Executive Officers Name Age PositionKevin R. Johnson 61 president and chief executive officerJohn Culver 61 group president, North America, and chief operating officerMichael Conway 55 group president, International and Channel DevelopmentRachel A. Gonzalez 52 executive vice president and general counselRachel Ruggeri 52 executive vice president, chief financial officerAngela Lis 54 executive vice president, chief partner officerGina Woods 48 executive vice president, Public Affairs and Social Impact
Kevin R. Johnson has served as president and chief executive officer since April 2017 and has been a Starbucks director since March 2009. Mr. Johnson served aspresident and chief operating officer from March 2015 to April 2017. Mr. Johnson served as Chief Executive Officer of Juniper Networks, Inc., a leading providerof high-performance networking products and services, from September 2008 to December 2013. He also served on the Board of Directors of Juniper Networksfrom September 2008 to February 2014. Prior to joining Juniper Networks, Mr. Johnson served as President, Platforms and Services Division for MicrosoftCorporation, a worldwide provider of software, services and solutions. Mr. Johnson was a member of Microsoft’s Senior Leadership Team and held several seniorexecutive positions over the course of his 16 years at Microsoft. Prior to joining Microsoft in 1992, Mr. Johnson worked in International Business Machine Corp.’ssystems integration and consulting business.
John Culver joined Starbucks in August 2002 and has served as group president, North America and chief operating officer since July 2021. From July 2018 toJuly 2021, Mr. Culver served as group president, International, Channel Development and Global Coffee & Tea. From October 2017 to July 2018, Mr. Culverserved as group president, International and Channels. From September 2016 to October 2017, he served as group president, Starbucks Global Retail. From May2013 to September 2016, he served as group president, China, Asia Pacific, Channel Development and Emerging Brands. Mr. Culver served as president,Starbucks Coffee China and Asia Pacific from October 2011 to May 2013. From December 2009 to October 2011, he served as president, Starbucks CoffeeInternational. Mr. Culver served as executive vice president; president, Global Consumer Products, Foodservice and Seattle’s Best Coffee from February 2009 toSeptember 2009, and then as president, Global Consumer Products and Foodservice from October 2009 to November 2009. He previously served as senior vicepresident; president, Starbucks Coffee Asia Pacific from January 2007 to February 2009, and vice president; general manager, Foodservice from August 2002 toJanuary 2007. Mr. Culver serves on the Board of Directors of Kimberly-Clark Corporation and Columbia Sportswear Company.
Michael Conway joined Starbucks in March 2013 and was named group president, International and Channel Development in June 2021, where he is responsiblefor leading Starbucks retail growth and operations in over 80 markets across Asia Pacific, Europe, Middle East and Africa, Latin America and the Caribbean andgrowth for the Global Channel Development business, which consists of consumer packaged goods, ready-to-drink businesses and strategic partnerships, includingthose with Nestlé, PepsiCo and other key business partners. Prior to this, he served as executive vice president and president, International Licensed Markets, fromMarch 2020 to June 2021. He also served as executive vice president and president, Starbucks Canada, executive vice president and president for StarbucksLicensed Stores business for the United States and Latin America and executive vice president and president of Starbucks Global Channel Development fromDecember 2014 to March 2020. He currently serves on the Board of Directors of McCormick & Company, Incorporated.
Rachel A. Gonzalez has served as executive vice president, general counsel, law and corporate affairs since joining Starbucks in April 2018. From April 2018 toMarch 2021, she also served as secretary. Prior to joining Starbucks, Ms. Gonzalez served as executive vice president and chief administrative officer of SabreCorporation, a technology provider to the travel industry, from May 2017 to April 2018 and as Sabre’s executive vice president and general counsel fromSeptember 2014 to May 2017. From March 2013 to September 2014, Ms. Gonzalez served as executive vice president, general counsel and corporate secretary ofDean Foods Company, a food and beverage company, and as its executive vice president, general counsel designate from November 2012 to March 2013. Sheserved as chief counsel, corporate and securities of Dean Foods from 2008 to 2012. From 2006 to 2008, Ms. Gonzalez served as senior vice president and groupcounsel for Affiliated Computer Services, Inc., an information technology service provider. Prior to that, Ms. Gonzalez was a partner with the law firm of Morgan,Lewis & Bockius LLP, where she focused on corporate finance, mergers and acquisitions, Securities and Exchange Commission (“SEC”) compliance andcorporate governance. Ms. Gonzalez currently serves on the Board of Directors of Dana Incorporated.
5

Table of Contents
Rachel Ruggeri joined Starbucks in 2001 as a member of the accounting team and was named executive vice president and chief financial officer in February2021. In this leadership role, Rachel is responsible for the global finance function for Starbucks, which includes developing and executing the financial strategiesthat enable the long-term growth of the Company. Prior to her promotion in 2021, she served as senior vice president of Americas with responsibility for the retailportfolio across the segment, including company-operated and licensed stores from June 2020 to January 2021. From September 2016 to June 2020, she heldvarious leadership roles in finance both internal and external to Starbucks, including Chief Financial Officer of Continental Mills from July 2018 to May 2020 andprior to that she was senior vice president of Finance at Starbucks in support of the Americas and Global Retail from September 2016 to June 2018. She was also avice president of Finance from December 2010 to September 2016 supporting Corporate Financial Planning & Analysis and the U.S. Retail business.
Angela Lis joined Starbucks in 1992 as a part-time barista and has served as executive vice president, chief partner officer since November 2020. From September2016 to October 2020, Ms. Lis served as senior vice president, partner resources. In this role she was responsible for talent and partner strategies that drive ourglobal retail operations business. Prior to this role, she served as a vice president of partner resources for corporate business functions and global supply chain fromDecember 2012 to September 2016. During her tenure at Starbucks, Ms. Lis has led partner resources business partners across the globe. She has supported bothretail and all non-retail business units and was instrumental in the startup of our Channel Development business.
Gina Woods joined Starbucks in 2005 and was named executive vice president of Public Affairs and Social Impact in January 2021. In this role, she leads globalcommunications, partner (employee) communications and events, government affairs and public policy, community impact, people-positive, integrated reputationcommunications, storytelling and content creation, Seattle’s hometown strategy and entertainment partnerships. From July 2018 to January 2021, she served assenior vice president, Reputation Marketing for Public Affairs, and she previously served as vice president, Entertainment & Executive Communications fromSeptember 2013 to July 2018.
Segment Financial Information
Segment information is prepared on the same basis that our management reviews financial information for operational decision-making purposes. In the fourthquarter of fiscal 2021, certain changes were made to our management team, and our operating segment reporting structure was re-aligned as a result. Specifically,we realigned our fully licensed Latin America and Caribbean markets from our Americas operating segment to our International operating segment. Additionally,we renamed the Americas operating segment to the North America operating segment, comprised of our company-operated and licensed stores in the U.S. andCanada.We also made certain other immaterial changes between our International operating segment and Corporate and Other.
We have three reportable operating segments: 1) North America, which is inclusive of the U.S. and Canada; 2) International, which is inclusive of China, Japan,Asia Pacific, Europe, Middle East, Africa, Latin America and Caribbean; and 3) Channel Development. Non-reportable operating segments such as EvolutionFresh and unallocated corporate expenses are reported within Corporate and Other. Revenues from our reportable operating segments as a percentage of total netrevenues for fiscal 2021 were as follows: North America (70%), International (24%) and Channel Development (6%).
Our North America and International segments include both company-operated and licensed stores. Our North America segment is our most mature business andhas achieved significant scale. Certain markets within our International operations are in various stages of development and may require more extensive support,relative to their current levels of revenue and operating income, than our North America operations.
Our Channel Development segment includes roasted whole bean and ground coffees, Seattle’s Best Coffee , Starbucks- and Teavana-branded single-serveproducts, a variety of ready-to-drink beverages, such as Frappuccino and Starbucks Doubleshot , foodservice products and other branded products soldworldwide outside of our company-operated and licensed stores. A large portion of our Channel Development business operates under a licensed model of theGlobal Coffee Alliance with Nestlé, while our global ready-to-drink businesses operate under collaborative relationships with PepsiCo, Inc., Tingyi-AshiBeverages Holding Co., Ltd., Arla Foods amba and others.
®
® ®
6

Table of Contents
Revenue Components
We generate the majority of our revenues through company-operated stores and licensed stores.
Company-operated and Licensed Store Summary as of October 3, 2021
North America
As a% of Total
North AmericaStores International
As a% of Total
International Stores Total
As a% ofTotal Stores
Company-operated stores 9,861 59 % 7,272 43 % 17,133 51 %Licensed stores 6,965 41 % 9,735 57 % 16,700 49 %Total 16,826 100 % 17,007 100 % 33,833 100 %
The mix of company-operated versus licensed stores in a given market generally varies based on several factors, including our ability to access desirable localretail space, the complexity, profitability and expected ultimate size of the market for Starbucks and our ability to leverage the support infrastructure within ageographic region.
Company-operated Stores
Revenue from company-operated stores accounted for 85% of total net revenues during fiscal 2021. Our retail objective is to be the leading retailer and brand ofcoffee and tea in each of our target markets by selling the finest quality coffee, tea and related products, as well as complementary food offerings, and by providingeach customer with a unique Starbucks Experience. The Starbucks Experience is built upon superior customer service, convenience and a seamless digitalexperience as well as safe, clean and well-maintained stores that reflect the personalities of the communities in which they operate, thereby building a high degreeof customer loyalty.
Our strategy for expanding our global retail business is to increase our category share in a disciplined manner, by selectively opening additional stores in new andexisting markets, as well as increasing sales in existing stores, to support our long-term strategic objective to maintain Starbucks standing as one of the mostrecognized and respected brands in the world. Store growth in specific existing markets will vary due to many factors, including expected financial returns, thematurity of the market, economic conditions, consumer behavior and local business practices.
Company-operated store data for the fiscal year-ended October 3, 2021:
Stores Open
as ofStores Open
as of Sep 27, 2020 Opened Closed Transfers Net Oct 3, 2021North America:
U.S. 8,941 449 (424) (19) 6 8,947 Canada 1,159 30 (277) (4) (251) 908 Siren Retail 9 1 (4) — (3) 6
Total North America 10,109 480 (705) (23) (248) 9,861 International:
China 4,704 697 (43) — 654 5,358 Japan 1,464 95 (13) — 82 1,546 U.K. 288 15 (5) — 10 298 All Other 67 — — (2) (2) 65 Siren Retail 5 — — — — 5
Total International 6,528 807 (61) (2) 744 7,272 Total company-operated 16,637 1,287 (766) (25) 496 17,133
Starbucks company-operated stores are typically located in high-traffic, high-visibility locations. Our ability to vary the size and format of our stores allows us tolocate them in or near a variety of settings, including downtown and suburban retail centers, office buildings, university campuses and rural and off-highwaylocations. We are continuing the expansion of our stores, particularly drive-thru formats that provide a higher degree of access and convenience, and alternativestore formats, which are designed to provide a more streamlined customer experience in dense metropolitan areas.
Prior to the global COVID-19 pandemic, approximately 80% of Starbucks transactions in U.S. company-operated stores were “on-the-go” occasions. This hasprompted us to reexamine our U.S. store footprint and evolve our retail presence over time
®
7

Table of Contents
through targeted store renovations, relocations and new stores. We have since introduced new store formats, such as Starbucks Pickup, Starbucks Now stores andcurbside pickup, to enhance the “on-the-go” customer experience and improve operating efficiency across Starbucks stores in certain major metropolitan areas inthe United States. New store formats are suitable for customers who prefer to order ahead and pay through the Starbucks Mobile App for pick-up. In our majorinternational markets, we continue to invest in technology and establish partnerships with third parties with relevant expertise to increase digital adoption toprovide convenience and elevate the customer experience. In China, the introduction of Starbucks Now stores is intended to enable a seamless integration ofphysical and digital customer touchpoints. Orders may be placed in advance through the Starbucks Mobile App or Starbucks Delivers and can be convenientlypicked up by customers and delivery providers in these express retail format locations. These strategies align closely with rapidly evolving customer preferences,including higher levels of mobile ordering, more contactless pick-up experiences and reduced in-store congestion, all of which naturally allow for greater physicaldistancing. We believe our continued efforts to transform our store portfolio and elevate technology will enhance the customer experience and position Starbucksfor long-term growth.
Retail sales mix by product type for company-operated stores:
Fiscal Year EndedOct 3, 2021
Sep 27, 2020
Sep 29, 2019
Beverages 74 % 75 % 74 %Food 21 % 20 % 20 %Other 5 % 5 % 6 %Total 100 % 100 % 100 %
“Other” primarily consists of sales of packaged and single-serve coffees and teas, serveware and ready-to-drink beverages, among other items.
Stored Value Cards and Loyalty Program
The Starbucks Card, our branded stored value card program, is designed to provide customers with a convenient payment method, support gifting and increase thefrequency of store visits by cardholders, in part through the related Starbucks Rewards loyalty program where available, as discussed below. Stored value cardsare issued to customers when they initially load them with an account balance. They can be obtained in our company-operated and most licensed stores in NorthAmerica, China, Japan and many of our markets in our International segment. Stored value cards can also be obtained online, via the Starbucks Mobile App andthrough other U.S. and international retailers. Customers may access their card balances by utilizing their stored value card or the Starbucks Mobile App inparticipating stores. In nearly all markets, including the U.S. and Canada, customers who register their Starbucks Cards are automatically enrolled in the StarbucksRewards program. Registered members can receive various benefits depending on factors such as the number of reward points (“Stars”) earned. In addition tousing their Starbucks Cards, Starbucks Rewards members can earn Stars by paying with cash, credit or debit cards, or selected mobile wallets at company-operated stores in the U.S. and Canada. Using the Mobile Order and Pay functionality of the Starbucks Mobile App, customers can also place orders in advancefor pick-up at certain participating locations in several markets. Refer to Note 1, Summary of Significant Accounting Policies and Estimates, included in Item 8 ofPart II of this 10-K, for further discussion of our stored value cards and loyalty program.
Licensed Stores
Revenues from our licensed stores accounted for 9% of total net revenues in fiscal 2021. Licensed stores generally have a lower gross margin and a higheroperating margin than company-operated stores. Under the licensed model, Starbucks receives a margin on branded products and supplies sold to the licensed storeoperator along with a royalty on retail sales. Licensees are responsible for operating costs and capital investments, which more than offset the lower revenues wereceive under the licensed store model.
In our licensed store operations, we seek to leverage the expertise of our local partners and share our operating and store development experience. Licenseesprovide improved, and at times the only, access to desirable retail space. Most licensees are prominent retailers with in-depth market knowledge and access. Aspart of these arrangements, we sell coffee, tea, food and related products to licensees for resale to customers and receive royalties and license fees from thelicensees. We also sell certain equipment, such as coffee brewers and espresso machines, to our licensees for use in their operations. Licensee employees workingin licensed retail locations are required to follow our detailed store operating procedures and attend training classes similar to those given to employees incompany-operated stores. In a limited number of international markets, we also use traditional franchising and include these stores in the results of operations fromour other licensed stores.
®
®
®
TM
TM
(1)
(1)
®
®
®
®
®
8

Table of Contents
Licensed store data for the fiscal year-ended October 3, 2021:
Stores Open
as ofStores Open
as of Sep 27, 2020 Opened Closed Transfers Net Oct 3, 2021North America:
U.S. 6,387 191 (100) 19 110 6,497 Canada 444 48 (28) 4 24 468
Total North America 6,831 239 (128) 23 134 6,965 International:
Korea 1,468 166 (23) — 143 1,611 Mexico 752 7 (13) — (6) 746 U.K. 737 68 (14) — 54 791 Latin America 662 35 (6) — 29 691 Turkey 530 36 (7) — 29 559 Taiwan 501 28 (6) — 22 523 Indonesia 458 29 — — 29 487 Thailand 405 26 (6) — 20 425 Philippines 396 5 — — 5 401 All Other 3,283 313 (97) 2 218 3,501
Total International 9,192 713 (172) 2 543 9,735 Total licensed 16,023 952 (300) 25 677 16,700
North America and International licensed stores as of September 27, 2020, have been recast as a result of our fiscal 2021 operating segment reportingstructure realignment.
Other Revenues
Other revenues primarily are recorded in our Channel Development segment and include sales of packaged coffee, tea and ready-to-drink beverages to customersoutside of our company-operated and licensed stores, as well as royalties received from Nestlé under the Global Coffee Alliance and other collaborativepartnerships.
Product Supply
Starbucks is committed to selling the finest whole bean coffees and coffee beverages. To help ensure compliance with our rigorous coffee standards, we generallycontrol substantially all coffee purchasing, roasting and packaging and the global distribution of coffee used in our operations. Nestlé controls distribution ofcertain finished goods through the Global Coffee Alliance. We purchase green coffee beans from multiple coffee-producing regions around the world and customroast them to our exacting standards for our many blends and single origin coffees.
The price of coffee is subject to significant volatility. Although most coffee trades in the commodity market, high-altitude arabica coffee of the quality sought byStarbucks tends to trade on a negotiated basis at a premium above the “C” coffee commodity price. Both the premium and the commodity price depend upon thesupply and demand at the time of purchase. Supply and price can be affected by multiple factors in the producing countries, including weather, water supplyquality and availability throughout the coffee production chain, natural disasters, crop disease and pests, general increase in farm inputs and costs of production,inventory levels and political and economic conditions. Climate change may further exacerbate many of these factors. Price is also impacted by trading activities inthe arabica coffee futures market, including hedge funds and commodity index funds. In addition, green coffee prices have been affected in the past, and may beaffected in the future, by the actions of certain organizations and associations that have historically attempted to influence prices of green coffee throughagreements establishing export quotas or by restricting coffee supplies.
We buy coffee using fixed-price and price-to-be-fixed purchase commitments, depending on market conditions, to secure an adequate supply of quality greencoffee. We also utilize forward contracts, futures contracts and collars to hedge "C" price exposure under our price-to-be-fixed green coffee contracts and our long-term forecasted coffee demand where underlying fixed price and price-to-be-fixed contracts are not yet available. Total purchase commitments, together withexisting inventory, are expected to provide an adequate supply of green coffee through fiscal 2022.
(1)
(1)
(1)
9

Table of Contents
We depend upon our relationships with coffee producers, outside trading companies and exporters for our supply of green coffee. We believe, based onrelationships established with our suppliers, the risk of non-delivery on such purchase commitments is remote.
To help ensure the future supply of high-quality green coffee and to reinforce our leadership role in the coffee industry, Starbucks operates ten farmer supportcenters, including our China Farmer Support Center located in the Yunnan Province of this high-growth market. Farmer support centers are staffed withagronomists and sustainability experts who work with coffee farming communities to promote best practices in coffee production designed to improve both coffeequality and yields and agronomy support to address climate change and other impacts.
In addition to coffee, we also purchase significant amounts of dairy and plant-based dairy-free alternative products, particularly fluid milk, oat milk and almondmilk, to support the needs of our company-operated stores. We believe, based on relationships established with our dairy and plant-based dairy-free suppliers, thatthe risk of non-delivery of sufficient fluid milk and plant-based dairy-free alternatives to support our stores generally is remote.
Products other than whole bean coffees and coffee beverages sold in Starbucks stores include tea and a number of ready-to-drink beverages that are purchasedfrom several specialty suppliers, usually under long-term supply contracts. Food products, such as pastries, breakfast sandwiches and lunch items, are purchasedfrom national, regional and local sources. We also purchase a broad range of paper and plastic products, such as cups and cutlery, from several companies tosupport the needs of our retail stores as well as our manufacturing and distribution operations. Consistent with our planet-positive vision, we are also expanding ouruse of reusable packaging to reduce landfill waste. We believe, based on relationships established with these suppliers and manufacturers, that the risk of non-delivery of sufficient amounts of these items generally is remote.
During fiscal 2021, we began to experience certain supply shortages and transportation delays largely attributable to impacts of the COVID-19 pandemic as well aschanges in customer demand and behaviors. While we expect these shortages and delays may continue into fiscal 2022, we view them to be temporary and do notbelieve they will have a material impact to our long-term growth and profitability.
Competition
Our primary competitors for coffee beverage sales are specialty coffee retailers and shops. We believe that our customers choose among specialty coffee retailersand shops primarily on the basis of product quality, brand reputation, service and convenience, as well as price. We continue to experience direct competition fromlarge competitors in the quick-service restaurant sector and the ready-to-drink coffee beverage market, in addition to both well-established and start-up companiesin many international markets. We also compete with restaurants and other specialty retailers for prime retail locations and qualified personnel to operate both newand existing stores.
Our coffee and tea products sold through our Channel Development segment compete directly against specialty coffees and teas sold through grocery stores,warehouse clubs, specialty retailers, convenience stores and foodservice accounts and compete indirectly against all other coffees and teas on the market.
Trademarks, Copyrights, Patents and Domain Names
Starbucks owns and has applied to register numerous trademarks and service marks in the U.S. and in other countries throughout the world. Some of ourtrademarks, including Starbucks, the Starbucks logo, Starbucks Reserve, Seattle’s Best Coffee, Teavana and Frappuccino are of material importance. The durationof trademark registrations varies from country to country. However, trademarks are generally valid and may be renewed indefinitely as long as they are in useand/or their registrations are properly maintained.
We own numerous copyrights for items such as product packaging, promotional materials, in-store graphics and training materials. We also hold patents on certainproducts, systems and designs which have an average remaining useful life of approximately two years. In addition, Starbucks has registered and maintainsnumerous Internet domain names, including “Starbucks.com,” “Starbucks.net,” “Starbucksreserve.com,” “Seattlesbest.com” and “Teavana.com.”
Seasonality and Quarterly Results
Our business is subject to moderate seasonal fluctuations, of which our fiscal second quarter typically experiences lower revenues and operating income. TheCOVID-19 pandemic has had an impact on consumer behaviors and customer traffic; however, it is not yet certain that these changes will sustain and cause otherthan temporary changes in the seasonal fluctuations of our business. Additionally, as Starbucks Cards are issued to and loaded by customers during the holidayseason, we tend to have higher cash flows from operations during the first quarter of the fiscal year. However, since revenues from Starbucks Cards are recognizedupon redemption and not when cash is loaded onto the Card, the impact of seasonal fluctuations on the consolidated statements of earnings is much lesspronounced. As a result of moderate seasonal fluctuations, results for any quarter are not necessarily indicative of the results that may be achieved for the full fiscalyear.
®
10

Table of Contents
Government Regulation
As a company with global operations, we are subject to the laws and regulations of the United States and the multiple foreign jurisdictions in which we operate aswell as the rules, reporting obligations and interpretations of all such requirements and obligations by various governing bodies, which may differ amongjurisdictions. In addition, changes to such laws, regulations, rules, reporting obligations and related compliance obligations could result in significant costs but arenot expected to have a material effect on our capital expenditures, results of operations and competitive position as compared to prior periods.
Available Information
Starbucks Annual Report on Form 10-K reports, along with all other reports and amendments filed with or furnished to the SEC, are publicly available free ofcharge on the Investor Relations section of our website at investor.starbucks.com or at www.sec.gov as soon as reasonably practicable after these materials arefiled with or furnished to the SEC. We also use our website as a tool to disclose important information about the company and comply with our disclosureobligations under Regulation Fair Disclosure. Our corporate governance policies, code of ethics and Board committee charters and policies are also posted on theInvestor Relations section of Starbucks website. The information on our website (or any webpages referenced in this Annual Report on Form 10-K) is not part ofthis or any other report Starbucks files with, or furnishes to, the SEC.
Item 1A. Risk Factors
You should carefully consider the risks described below in addition to the other information set forth in this Annual Report on Form 10-K, including theManagement’s Discussion and Analysis of Financial Conditions and Results of Operations section, the Quantitative and Qualitative Disclosures About MarketRisk section, and the consolidated financial statements and related notes. If any of the risks and uncertainties described in the cautionary factors described belowactually occur or continue to occur, our business, financial condition and results of operations and the trading price of our common stock could be materially andadversely affected. The considerations and risks that follow are organized within relevant headings but may be relevant to other headings as well. Moreover, therisks below are not the only risks we face and additional risks not currently known to us or that we presently deem immaterial may emerge or become material atany time and may negatively impact our business, reputation, financial condition, results of operations or the trading price of our common stock.
Risks Related to Macroeconomic Conditions
• Our financial condition and results of operations have been and are expected to continue to be adversely affected by the COVID-19 pandemic.
The COVID-19 pandemic has had, and is continuing to have, a significant impact on our business and results of operations. At the peak of the COVID-19outbreak, many of our company-operated and licensed stores were closed. For stores that remained open, same-store sales declined due to modified operating hoursand reduced customer traffic. While nearly all of our company-operated and licensed stores have reopened, we expect that our operations will continue to beimpacted by the continuing effects of COVID-19, including resurgences and variants of the virus. It remains difficult to predict the full impact of the COVID-19pandemic on the broader economy and how consumer behavior may change, and whether such change is temporary or permanent. Social distancing,telecommunicating and reductions in travel may become the new normal. In addition, the COVID-19 pandemic has required and may continue to require us tomake controversial decisions about precautionary measures, such as vaccinations, showing proof of vaccinations and face coverings, that could impact our results,including by impacting our brand, our employee retention and satisfaction, and the willingness of customers to buy our products. All of these conditions couldfundamentally impact the way we work and the services we provide, and could have continuing adverse effects on our results of operations, cash flows andfinancial condition. As a result, we may incur additional impairment charges to our inventory, store and corporate assets—and our ability to realize the benefitsfrom deferred tax assets may become limited—any of which may have a significant or material impact on our financial results.
Prolonged volatility or significant disruption of global financial markets due in part to the COVID-19 pandemic could have a negative impact on our ability toaccess capital markets and other funding sources, on acceptable terms or at all and impede our ability to comply with debt covenants.
• Our financial condition and results of operations are subject to, and may be adversely affected by, a number of other factors, many of which are also largelyoutside our control.
In addition to the COVID-19 pandemic, our operating results have been in the past and will continue to be subject to a number of other factors, many of which arelargely outside our control. Any one or more of the factors listed below or described elsewhere in this risk factors section could have a material adverse impact onour business, financial condition and/or results of operations:
• increases in real estate costs in certain domestic and international markets;
11

Table of Contents
• inflationary pressures;
• disruptions to our supply chain;
• changes in governmental rules and approaches to taxation;
• fluctuations in foreign currency exchange rates;
• adverse outcomes of litigation;
• severe weather or other natural or man-made disasters affecting a large market or several closely located markets that may temporarily but significantlyaffect our retail business in such markets;
• changes in climate, including changes to the frequency of severe weather events, that impact the price and availability or cost of goods and services,energy and other materials throughout our supply chain; and
• especially in our largest markets, including the U.S. and China, labor discord or disruption, geopolitical events, war, terrorism (including incidentstargeting us), political instability, acts of public violence, boycotts, increasing anti-American sentiment in certain markets, hostilities and social unrest andother health pandemics that lead to avoidance of public places or restrictions on public gatherings such as in our stores.
• Economic conditions in the U.S. and international markets could adversely affect our business and financial results.
As a retailer that is dependent upon consumer discretionary spending, our results of operations are sensitive to changes in or uncertainty about macro-economicconditions. Our customers may have or in the future have less money for discretionary purchases and may stop or reduce their purchases of our products or switchto Starbucks or competitors’ lower-priced products as a result of various factors, including job losses, inflation, higher taxes, reduced access to credit, changes infederal economic policy, the COVID-19 pandemic and recent international trade disputes. Due to the COVID-19 pandemic or other global health events, we mayexperience a reduction and/or increased volatility in demand for our products, which may be caused by, among other things: store closures or modified operatinghours and business model, reduced customer traffic due to illness, quarantine or government or self-imposed restrictions placed on our stores’ operations, impactscaused by precautionary measures such as those related to face coverings and vaccinations, and changes in consumer spending behaviors (e.g. continued practice ofsocial distancing, decrease in consumer confidence in general macroeconomic conditions and a decrease in consumer discretionary spending). Decreases incustomer traffic and/or average value per transaction without a corresponding decrease in costs would put downward pressure on margins and would negativelyimpact our financial results. There is also a risk that if negative economic conditions or uncertainty, as a result of the COVID-19 pandemic or otherwise, persist fora long period of time or worsen, consumers may make long-lasting changes to their discretionary purchasing behavior, including less frequent discretionarypurchases on a more permanent basis or there may be a general downturn in the restaurant industry. These and other macroeconomic factors could have an adverseeffect on our sales, profitability or development plans, which could harm our results of operations and financial condition.
• Failure to meet market expectations for our financial performance and fluctuations in the stock market as a whole will likely adversely affect the marketprice and volatility of our stock.
Failure to meet market expectations going forward, particularly with respect to our operational and financial results and related guidance, environmentalperformance and shareholder returns, will likely result in a decline and/or increased volatility in the market price of our stock. In addition, price and volumefluctuations in the stock market as a whole may affect the market price of our stock in ways that may be unrelated to our financial performance.
Risks Related to Brand Relevance and Brand Execution
• Our success depends substantially on the value of our brands and failure to preserve their value could have a negative impact on our financial results.
We believe we have built an excellent reputation globally for the quality of our products, for delivery of a consistently positive consumer experience and for ourglobal social and environmental impact programs. The Starbucks brand is recognized throughout most of the world, and we have received high ratings in globalbrand value studies. To be successful in the future, particularly outside of the U.S. where the Starbucks brand and our other brands are less well-known, we believewe must preserve, grow and leverage the value of our brands across all sales channels. Brand value is based in part on consumer perceptions on a variety ofsubjective qualities.
Business incidents, whether isolated or recurring and whether originating from us or our business partners, that erode consumer trust can significantly reduce brandvalue, potentially trigger boycotts of our stores or result in civil or criminal liability and can have a negative impact on our financial results. Such incidents includeactual or perceived breaches of privacy or violations of domestic or international privacy laws, contaminated food, product recalls, store employees or other foodhandlers infected with communicable diseases, such as COVID-19, or other potential incidents discussed in this risk factors section. The impact of
12

Table of Contents
such incidents may be exacerbated if they receive considerable publicity, including rapidly through social or digital media (including for malicious reasons) orresult in litigation. Consumer demand for our products and our brand equity could diminish significantly if we, our employees, licensees or other business partnersfail to preserve the quality of our products, act or are perceived to act in an unethical, illegal, racially-biased, unequal or socially irresponsible manner, includingwith respect to the sourcing, content or sale of our products, service and treatment of customers at Starbucks stores, treatment of employees, or the use of customerdata for general or direct marketing or other purposes. Furthermore, if we are not effective in addressing our social and environmental program goals, including ourpeople- and planet-positive work, or achieving relevant sustainability goals, consumer trust in our brand may suffer. Additionally, if we fail to comply with lawsand regulations, take controversial positions or actions or fail to deliver a consistently positive consumer experience in each of our markets, including by failing toinvest in the right balance of wages and benefits to attract and retain employees that represent the brand well or to foster an inclusive and diverse environment, ourbrand value may be diminished.
The ongoing relevance of our brand may depend on the success of our people- and planet-positive initiatives, which require company-wide coordination andalignment. We are working to manage risks and costs to us, our licensees and our supply chain of any effects of climate change as well as diminishing energy andwater resources. These risks include any increased public focus, including by governmental and nongovernmental organizations, on these and other environmentalsustainability matters, including packaging and waste, animal health and welfare, deforestation and land use. These risks may also include any increased pressureto make commitments, set targets or establish additional goals and take actions to meet them, which could expose us to market, operational and execution costs orrisks.
• If our business partners and third-party providers do not satisfactorily fulfill their responsibilities and commitments, it could damage our brand and ourfinancial results could suffer.
Our global business strategy, including our plans for new stores, branded products and other initiatives, relies significantly on a variety of business partners,including licensee and joint venture relationships, third-party manufacturers, distributors and retailers, particularly for our entire global Channel Developmentbusiness. Licensees, retailers and foodservice operators are often authorized to use our logos and provide branded food, beverage and other products directly tocustomers. We believe our customers expect the same quality of service regardless of whether they visit a licensed or company-operated store, so we providetraining and support to, and monitor the operations of, certain of these licensees and other business partners. However, the product quality and service they delivermay still be diminished by any number of factors beyond our control, including financial constraints caused by the COVID-19 pandemic and other factors. We donot have direct control over our business partners, including in their adherence to additional sanitation protocols and guidelines as a result of the COVID-19pandemic, and may not have visibility into their practices.
We also source our food, beverage and other products from a wide variety of domestic and international business partners, and in certain cases such products areproduced or sourced by our licensees directly. And although foodservice operators are authorized to use our logos and provide branded products as part of theirfoodservice business, we do not monitor the quality of non-Starbucks products served in those locations. Additionally, inconsistent uses of our brand and other ofour intellectual property assets, as well as failure to protect our intellectual property, can erode consumer trust and our brand value and have a material negativeimpact on our financial results.
• Incidents involving food or beverage-borne illnesses, tampering, adulteration, contamination or mislabeling, whether or not accurate, as well as adversepublic or medical opinions about the health effects of consuming our products, could harm our business.
Instances or reports, whether true or not, of unclean water supply or food-safety issues, such as food or beverage-borne illnesses, tampering, adulteration,contamination or mislabeling, either during growing, manufacturing, packaging, storing or preparation, have in the past severely injured the reputations ofcompanies in the food and beverage processing, grocery and quick-service restaurant sectors. Any report linking us to such instances could severely hurt our salesand could possibly lead to product liability claims, litigation (including class actions) and/or temporary store closures. Clean water is critical to the preparation ofcoffee, tea and other beverages, as well as ice for our cold beverages, and our ability to ensure adequate supplies of clean water and ice to our stores can be limited,particularly in some international locations. We are also continuing to incorporate more products in our food and beverage lineup that require freezing orrefrigeration, which increases the risk of food safety related incidents if correct temperatures are not maintained due to mechanical malfunction or human error.
We also face risk by relying on third-party food suppliers to provide and transport ingredients and finished products to our stores. While we monitor the operationsof certain of these business partners, the product quality and service they deliver may be diminished by any number of factors beyond our control and it may bedifficult to detect contamination or other defects in these products. There is greater risk from those we do not monitor, or do not monitor as closely. Furthermore,due to the COVID-19 pandemic, there are stricter health regulations and guidelines and increased public concern over food safety standards and controls. Potentialfood safety incidents, whether at our stores or involving our business partners, could lead to wide public exposure, which could materially harm our business.
13

Table of Contents
Additionally, we are evolving our product lineup to include more local or smaller suppliers for some of our products who may not have as rigorous quality andsafety systems and protocols as larger or more national suppliers, especially in light of the heightened safety protocols as a result of the COVID-19 pandemic. Inaddition, instances of food or beverage-safety issues, even those involving solely the restaurants or stores of competitors or of suppliers or distributors (regardlessof whether we use or have used those suppliers or distributors), could adversely affect our sales on a regional or global basis by resulting in negative publicityabout us or the foodservice industry in general. A decrease in customer traffic as a result of food-safety concerns or negative publicity, or as a result of a temporaryclosure of any of our stores, product recalls, viral-contaminated food or beverage claims or other food or beverage-safety claims or litigation, could materiallyharm our business and results of operations.
• We may not be successful in implementing important strategic initiatives or effectively managing growth, which may have an adverse impact on our businessand financial results.
There is no assurance that we will be able to implement important strategic initiatives in accordance with our expectations or that they will generate expectedreturns, which may result in an adverse impact on our business and financial results. These strategic initiatives, which include our profit-, people- and planet-positive visions, are designed to create growth, improve our results of operations and drive long-term shareholder value, and include:
• being an employer of choice and investing in employees to deliver a superior customer experience;
• building our leadership position around coffee;
• driving convenience, brand engagement and digital relationships through our mobile, loyalty, delivery and digital capabilities both domestically andinternationally;
• simplifying store administrative tasks to allow store partners to better engage with customers;
• increasing the scale of the Starbucks store footprint with disciplined global expansion and introducing flexible and unique store formats, including theaccelerated development of alternative store formats (such as Starbucks Pickup stores, Starbucks Now stores and curbside pickup) especially in light ofthe COVID-19 pandemic;
• adjusting rapidly to changing customer preferences and behaviors in light of the COVID-19 pandemic;
• moving to a more licensed store model in some markets and a more company-owned model in other markets;
• creating new occasions in stores across all dayparts with new product offerings, including our growing lunch food and beverage product lineup;
• continuing the global growth of our Channel Development business through our supply, distribution and licensing agreements with Nestlé and otherChannel Development business partners;
• delivering continued growth in our cold beverage business;
• working to address the potential effects of climate change and the sustainability of our business; and
• reducing our operating costs, particularly general and administrative expenses.
In addition to other factors listed in this risk factors section, factors that may adversely affect the successful implementation of these initiatives, which could have amaterial adverse impact on our business and financial results, include the following:
• imposition of additional taxes by jurisdictions, such as on certain types of beverages or based on number of employees;
• construction cost increases associated with new store openings and remodeling of existing stores; delays in store openings for reasons beyond our control,such as potential shortages of materials and labor and delays in permits, or a lack of desirable real estate locations available for lease at reasonable rates,either of which could keep us from meeting annual store opening targets in the U.S. and internationally;
• governmental regulations or other health guidelines concerning operations of stores, including due to the COVID-19 pandemic or other public healthemergencies;
• not successfully scaling our supply chain infrastructure as our product offerings increase and as we continue to expand, including our emphasis on a broadrange of high-quality food offerings;
• not successfully adapting to customer or market factors affecting our supply chain as we work to address sustainability and climate change; and
• the deterioration in our credit ratings, which could limit the availability of additional financing and increase the cost of obtaining financing to fund ourinitiatives.
®
14

Table of Contents
Effectively managing growth can be challenging, particularly as we expand in international markets where we must balance the need for flexibility and a degree ofautonomy for local management against the need for consistency with our goals, policies and standards. If we are not successful in implementing our strategicinitiatives, or, in the event we undertake large acquisitions, integrations and divestitures, we may be required to evaluate whether certain assets, including goodwilland other intangibles, have become impaired. In the event we record an impairment charge, it could have a material impact on our financial results.
• Evolving consumer preferences and tastes may adversely affect our business.
Our continued success depends on our ability to attract and retain customers. Our financial results could be adversely affected by a shift in consumer spendingaway from outside-the-home food and beverages (such as the disruption caused by online commerce that results in reduced foot traffic to “brick & mortar” retailstores); lack of customer acceptance of new products (including due to price increases necessary to cover the costs of new products or higher input costs), brands(such as the global expansion of the Starbucks brand) and platforms (such as features of our mobile technology, changes in our loyalty rewards programs and ourdelivery services initiatives); or customers reducing their demand for our current offerings as new products are introduced. In addition, some of our productscontain caffeine, dairy products, sugar and other compounds and allergens, the health effects of which are the subject of public and regulatory scrutiny, includingthe suggestion of linkages to a variety of adverse health effects. Particularly in the U.S., there is increasing consumer awareness of health risks, including obesity,as well as increased consumer litigation based on alleged adverse health impacts of consumption of various food and beverage products. While we have a varietyof beverage and food items, including items that are coffee-free and have reduced calories, an unfavorable report on the health effects of caffeine or othercompounds present in our products, whether accurate or not, imposition of additional taxes on certain types of food and beverage components, or negative publicityor litigation arising from certain health risks could significantly reduce the demand for our beverages and food products and could materially harm our businessand results of operations. Furthermore, our financial results have been and could continue to be adversely affected by the impact of the COVID-19 pandemic,which has resulted in a disruption of customer routines, changes to employer “work-from-home” policies, reduced business and recreational travel and changes inconsumer behavior and the ability or willingness to spend discretionary income on our products.
• We may not be successful in our marketing, promotional and advertising plans and pricing strategies
Our continued success depends in part on our ability to adjust our marketing, promotional and advertising plans and pricing strategy to respond quickly andeffectively to shifting economic and competitive conditions as well as evolving customer preferences. We operate in a complex and costly marketing, promotionaland advertising environment. Our marketing, promotional and advertising programs may not be successful in reaching our customers in the way we intend. Oursuccess depends in part on whether the allocation of our advertising, promotional and marketing resources across different channels, including digital marketing,allows us to reach our customers effectively and efficiently, and in ways that are meaningful to them. If the advertising, promotional and marketing programs orour pricing strategies are not successful, or are not as successful as those of our competitors, our sales and market share could decrease.
Finally, customers are focusing more on sustainability and the environmental impacts of operations. An inability to meet customer expectations with respect tothese issues could adversely affect our financial results.
Risks Related to Cybersecurity and Data Privacy
• Failure to maintain satisfactory compliance with certain privacy and data protections laws and regulations may subject us to substantial negative financialconsequences and civil or criminal penalties.
Complex local, state, national, foreign and international laws and regulations apply to the collection, use, retention, protection, disclosure, transfer and otherprocessing of personal data. These privacy and data protection laws and regulations are quickly evolving, with new or modified laws and regulations proposed andimplemented frequently and existing laws and regulations subject to new or different interpretations and enforcement. In addition, our legal and regulatoryobligations in jurisdictions outside the U.S. are subject to unexpected changes, including the potential for regulatory or other governmental entities to enact new oradditional laws or regulations, to issue rulings that invalidate prior laws or regulations or to increase penalties significantly. Complying with these laws andregulations can be costly and can impede the development and offering of new products and services.
For example, Europe’s General Data Protection Regulation (“GDPR”) and the U.K. General Data Protection Regulation (which implements the GDPR into U.K.law), impose stringent data protection requirements and provide for significant penalties for noncompliance. Additionally, California enacted legislation, theCalifornia Consumer Privacy Act (“CCPA”). The CCPA requires, among other things, covered companies to provide new disclosures to California consumers andallows such consumers new abilities to opt-out of certain sales of personal data. The CCPA also provides for civil penalties for violations as well as a private rightof action for data breaches that may increase data breach litigation. Further, the California Privacy Rights Act, which was passed in November 2020 and is fullyeffective in January 2023, significantly modifies the CCPA. These modifications will require us to incur additional costs and expenses in our effort to comply.Virginia and Colorado recently
15

Table of Contents
enacted similar data privacy legislation that will take effect in 2023, and several other states and countries are considering expanding or passing privacy laws in thenear term.
In June 2021, the European Commission finalized recommendations in relation to cross border data transfers and published new versions of the StandardContractual Clauses. The new requirements will require us to incur costs and expenses in order to comply and may impact the transfer of personal data throughoutour organization and to third parties.
Our failure to comply with applicable laws and regulations or other obligations to which we may be subject relating to personal data, or to protect personal datafrom unauthorized access, use or other processing, could result in enforcement actions and regulatory investigations against us, claims for damages by customersand other affected individuals, fines, damage to our brand reputation, any of which could have a material adverse effect on our operations, financial performanceand business.
• The unauthorized access, use, theft or destruction of customer or employee personal, financial or other data or of Starbucks proprietary or confidentialinformation that is stored in our information systems or by third parties on our behalf could impact our reputation and brand and expose us to potentialliability and loss of revenues.
Many of our information technology systems (whether cloud-based or hosted in proprietary servers), including those used for our point-of-sale, web and mobileplatforms, online and mobile payment systems, delivery services and rewards programs and administrative functions, contain personal, financial or otherinformation that is entrusted to us by our customers and employees. Many of our information technology systems also contain Starbucks proprietary and otherconfidential information related to our business, such as business plans and product development initiatives and designs, and confidential information about thirdparties, such as licensees and business partners. Similar to many other retail companies and because of the prominence of our brand, we are consistently subject toattempts to compromise our information technology systems from both internal and external sources. The number and frequency of these attempts varies from yearto year but could be exacerbated to some extent by an increase in our digital operations, including our efforts to comply with state and local mandates in responseto COVID‑19. In addition, we provide some customer and employee data, as well as Starbucks proprietary information and other confidential informationimportant to our business, to third parties where necessary to conduct our business, including licensees and business partners. Individuals performing work forStarbucks and such third parties also may possess some of this data, including on personally-owned digital devices. To the extent we, a third party or such anindividual were to experience a breach of our or their information technology systems that results in the unauthorized access, theft, use, destruction or othercompromises of customers’ or employees’ data or confidential information of the Company stored in or transmitted through such systems, including through cyber-attacks or other external or internal methods, it could result in a material loss of revenues from the potential adverse impact to our reputation and brand, a decreasein our ability to retain customers or attract new ones, the imposition of potentially significant costs (including loss of data or payment for recovery of data) andliabilities, loss of business, loss of business partners and licensees and the disruption to our supply chain, business and plans. Unauthorized access, theft, use,destruction or other compromises may occur through a variety of methods, including attacks using malicious code, those taking advantage of vulnerabilities insoftware, hardware or other infrastructure (including systems used by our supply chain), those using techniques aimed at convincing those with access to such dataor information to share passwords or otherwise allow access through deceit or otherwise and those taking advance of inadequate account security practices.
Such security breaches also could result in a violation of applicable U.S. and international privacy, cyber and other laws or trigger U.S. state data breachnotification laws, and subject us to private consumer, business partner or licensee or securities litigation and governmental investigations and proceedings, any ofwhich could result in our exposure to material civil or criminal liability.
Significant capital investments and other expenditures could also be required to investigate security incidents, remedy cybersecurity problems, recuperate lost data,prevent future compromises and adapt systems and practices to react to the changing threat environment. These include costs associated with notifying affectedindividuals and other agencies, additional security technologies, trainings, personnel, experts and credit monitoring services for those whose data has beenbreached. These costs, which could be material, could adversely impact our results of operations in the period in which they are incurred, including by interferingwith the pursuit of other important business strategies and initiatives, and may not meaningfully limit the success of future attempts to breach our informationtechnology systems.
Media or other reports of existing or perceived security vulnerabilities in our systems or those of our third-party business partners or service providers can alsoadversely impact our brand and reputation and materially impact our business. Additionally, the techniques and sophistication used to conduct cyber-attacks andcompromise information technology systems, as well as the sources and targets of these attacks, change frequently and are often not recognized until such attacksare launched or have been in place for a period of time. We continue to make significant investments in technology, third-party services and personnel to developand implement systems and processes that are designed to anticipate cyber-attacks and to prevent or minimize breaches of our information technology systems ordata loss, but these security measures cannot provide assurance that we will be successful in preventing such breaches or data loss.
16

Table of Contents
• We rely heavily on information technology in our operations and growth initiatives, and any material failure, inadequacy, interruption or security failure ofthat technology could harm our ability to effectively operate and grow our business and could adversely affect our financial results.
We rely heavily on information technology systems across our operations for numerous purposes including for administrative functions, point-of-sale processingand payment in our stores and online, management of our supply chain, Starbucks Cards, online business, delivery services, mobile technology, including mobilepayments and ordering apps, reloads and loyalty functionality and various other processes and transactions, and many of these systems are interdependent on oneanother for their functionality. Additionally, the success of several of our initiatives to drive growth, including our ability to increase digital relationships with ourcustomers to drive incremental traffic and spend, is highly dependent on our technology systems. Furthermore, due to the social distancing measures put in place asa result of the COVID-19 pandemic, we accelerated the transformation of our store portfolio by expanding convenience-led formats, which depend heavily on ourmobile ordering capabilities. We also rely on third-party providers and platforms for some of these information technology systems and support. Additionally, oursystems hardware, software and services provided by third-party service providers are not fully redundant within a market or across our markets. Although we haveoperational safeguards in place, they may not be effective in preventing the failure of these systems or platforms to operate effectively and be available. Suchfailures may be caused by various factors, including power outages, climate change-related impacts, catastrophic events, physical theft, computer and networkfailures, inadequate or ineffective redundancy, problems with transitioning to upgraded or replacement systems or platforms, flaws in third-party software orservices, errors or improper use by our employees or third party service providers, or a breach in the security of these systems or platforms, including throughcyber-attacks such as those that result in the blockage of our or our third-party business partners’ or service providers’ systems and platforms and those discussedin more detail in this risk factors section. If our incident response, disaster recovery and business continuity plans do not resolve these issues in an effective andtimely manner they could result in an interruption in our operations and could cause material negative impacts to our product availability and sales, the efficiencyof our operations and our financial results. In addition, remediation of any problems with our systems could result in significant, unplanned expenses.
Risks Related to Intellectual Property
• We may not be able to adequately protect our intellectual property or adequately ensure that we are not infringing the intellectual property of others, whichcould harm the value of our brand and our business.
The success of our business depends on our continued ability to use our existing trademarks and service marks in order to increase brand awareness and furtherdevelop our branded products in both domestic and international markets. We rely on a combination of trademarks, copyrights, service marks, trade secrets, patentsand other intellectual property rights to protect our brand and branded products.
We have registered certain trademarks and have other trademark registrations pending in the U.S. and certain foreign jurisdictions. The trademarks that wecurrently use have not been registered in all of the countries outside of the U.S. in which we do business or may do business in the future and may never beregistered in all of these countries. It may be costly and time consuming to protect our intellectual property, and the steps we have taken to protect our intellectualproperty in the U.S. and foreign countries may not be adequate. In addition, the steps we have taken may not adequately ensure that we do not infringe theintellectual property of others, and third parties may claim infringement by us in the future. Any claim of infringement, whether or not it has merit, could be time-consuming, result in costly litigation and harm our business. In addition, we cannot ensure that licensees will not take actions that hurt the value of our intellectualproperty.
Risks Related to Labor and Supply Chain
• Our reliance on key business partners may adversely affect our business and operations.
The growth of our business relies on the ability of our licensee partners to implement our growth platforms and product innovations as well as on the degree towhich we are able to enter into, maintain, develop and negotiate appropriate terms and conditions of, and enforce, commercial and other agreements and theperformance of our business partners under such agreements. Our international licensees may face capital constraints or other factors that may limit the speed atwhich they are able to expand and develop in a certain market. Our Channel Development business is heavily reliant on Nestlé, which has the right to sell anddistribute our packaged goods and foodservice products to retailers and operators, with few exceptions. If Nestlé fails to perform its distribution and marketingcommitments under our agreements and/or fails to support, protect and grow our brand in Channel Development, our Channel Development business could beadversely impacted for a period of time, present long-term challenges to our brand, limit our ability to grow our Channel Development business and have amaterial adverse impact on our business and financial results. Additionally, the growth of our Channel Development business is in part dependent on the level ofdiscretionary support provided by our retail and licensed store businesses.
There are generally a relatively small number of licensee partners operating in specific markets. If they are not able to access sufficient funds or financing, or areotherwise unable or unwilling to successfully operate and grow their businesses it could
17

Table of Contents
have a material adverse effect on our results in the markets. Our business partners may be materially adversely impacted by the COVID-19 pandemic and may nothave sufficient financial support and capital to remain financially solvent and may not have the ability to meet their development goals and targets.
Due to the COVID-19 pandemic, our financial results have been and could continue in the future to be adversely affected by the disruption to the operations of ourbusiness partners, including licensee relationships, third-party manufacturers, distributors and retailers, through the effects of business and facilities closures,reductions in operating hours, social, economic, political or labor instability in affected areas, transportation delays, travel restrictions and changes in operatingprocedures, including for additional cleaning and safety protocols.
• Increases in the cost of high-quality arabica coffee beans or other commodities or decreases in the availability of high-quality arabica coffee beans or othercommodities could have an adverse impact on our business and financial results.
The availability and prices of coffee beans and other commodities are subject to significant volatility. We purchase, roast and sell high-quality whole bean arabicacoffee beans and related coffee products. The high-quality arabica coffee of the quality we seek tends to trade on a negotiated basis at a premium above the “C”price. This premium depends upon the supply and demand at the time of purchase and the amount of the premium can vary significantly. Increases in the “C”coffee commodity price increase the price of high-quality arabica coffee and also impact our ability to enter into fixed-price purchase commitments. We frequentlyenter into supply contracts whereby the quality, quantity, delivery period and other negotiated terms are agreed upon, but the date, and therefore price, at which thebase “C” coffee commodity price component will be fixed has not yet been established.
The supply and price of coffee we purchase can also be affected by multiple factors in the producing countries, such as weather, climate change, water supplyquality and availability throughout the coffee production chain, natural disasters, crop disease and pests, general increase in farm inputs and costs of production,inventory levels, political and economic conditions and the actions of certain organizations and associations that have historically attempted to influence prices ofgreen coffee through agreements establishing export quotas or by restricting coffee supplies. Speculative trading in coffee commodities can also influence coffeeprices. For example, drought conditions in Brazil have and, given continued drought conditions, are predicted to continue to impact coffee prices. Because of thesignificance of coffee beans to our operations, combined with our ability to only partially mitigate future price risk through purchasing practices and hedgingactivities, increases in the cost of high-quality arabica coffee beans could have a material adverse impact on our profitability. In addition, if we are not able topurchase sufficient quantities of green coffee due to any of the above factors or due to a worldwide or regional shortage, we may not be able to fulfill the demandfor our coffee, which could have a material adverse impact on our business operations and financial performance.
We also purchase significant amounts of dairy products, particularly fluid milk, to support the needs of our company-operated retail stores. Additionally, andalthough less significant to our operations than coffee or dairy, other commodities, including tea and those related to food and beverage inputs, such as cocoa,produce, baking ingredients, meats, eggs and energy, as well as the processing of these inputs, are important to our operations. Increases in the cost of dairyproducts and other commodities, or lack of availability, whether due to supply shortages, delays or interruptions in processing, or otherwise, especially ininternational markets, could have a material adverse impact on our profitability. Similarly, increases in the cost of, or lack of availability, whether due to supplyshortages, delays or interruptions in the processing of plant-based alternatives could have a material adverse impact on our profitability.
• Interruption of our supply chain could affect our ability to produce or deliver our products and could negatively impact our business and profitability.
Any material interruption in our supply chain, such as material interruption of roasted coffee supply due to the casualty loss of any of our roasting plants,interruptions in service by our third-party logistic service providers or common carriers that ship goods within our distribution channels, trade restrictions, such asincreased tariffs or quotas, embargoes or customs restrictions, pandemics, social or labor unrest, labor shortages, natural disasters or political disputes and militaryconflicts that cause a material disruption in our supply chain could have a negative material impact on our business and our profitability. Additionally, our food,beverage and other products are sourced from a wide variety of domestic and international business partners in our supply chain operations, and in certain cases areproduced or sourced by our licensees directly. We rely on these suppliers to provide high quality products and to comply with applicable laws. Our ability to findqualified suppliers who meet our standards and supply products in a timely and efficient manner is a significant challenge as we increase our fresh and preparedfood offerings, especially with respect to goods sourced from outside the U.S. and from countries or regions with diminished infrastructure, developing or failingeconomies or which are experiencing political instability or social unrest. For certain products, we may rely on one or very few suppliers. A supplier's failure tomeet our standards, provide products in a timely and efficient manner, or comply with applicable laws is beyond our control. These issues could have a materialnegative impact on our business and profitability.
18

Table of Contents
• Changes in the availability of and the cost of labor could adversely affect our business.Our business could be adversely impacted by increases in labor costs, including wages and benefits, which, in a retail business such as ours, are two of our mostsignificant costs, both domestically and internationally, including those increases triggered by regulatory actions regarding wages, scheduling and benefits;increased health care and workers’ compensation insurance costs; increased wages and costs of other benefits necessary to attract and retain high quality employeeswith the right skill sets and increased wages, benefits and costs related to the COVID-19 pandemic. The growth of our business can make it increasingly difficult tolocate and hire sufficient numbers of employees, to maintain an effective system of internal controls for a globally dispersed enterprise and to train employeesworldwide to deliver a consistently high-quality product and customer experience, which could materially harm our business and results of operations.Furthermore, we have experienced, and could continue to experience, a shortage of labor for store positions, including due to concerns around COVID-19 andother factors, which could decrease the pool of available qualified talent for key functions. Such labor shortages could be further exacerbated by expanded COVID-19 vaccination requirements. In addition, our wages and benefits programs may be insufficient to attract and retain the best talent. Additionally, while the numberof partners represented by unions is not significant, if a significant portion of our employees were to become unionized, our labor costs could increase and ourbusiness could be negatively affected by other requirements and expectations that could increase our costs, change our employee culture, decrease our flexibilityand disrupt our business. Further, our responses to any union organizing efforts could negatively impact how our brand is perceived and have adverse effects onour business, including on our financial results.
• The loss of key personnel or difficulties recruiting and retaining qualified personnel could adversely impact our business and financial results.
Much of our future success depends on the continued availability and service of senior management personnel. The loss of any of our executive officers or otherkey senior management personnel could harm our business. Our success also depends substantially on the contributions and abilities of our retail store employeeson whom we rely to give customers a superior in-store experience and elevate our brand. Accordingly, our performance depends on our ability to recruit and retainhigh quality management personnel and other employees to work in and manage our stores, both domestically and internationally. Our ability to attract and retaincorporate, retail and other personnel is also acutely impacted in certain international and domestic markets where the competition for a relatively small number ofqualified employees is intense or in markets where large high-tech companies are able to offer more competitive salaries and benefits. Additionally, there is intensecompetition for qualified technology systems developers necessary to develop and implement new technologies for our growth initiatives, including increasing ourdigital relationships with customers. If we are unable to recruit, retain and motivate employees sufficiently to maintain our current business and support ourprojected growth, our business and financial performance may be adversely affected.
19

Table of Contents
Risks Related to Competition
• We face intense competition in each of our channels and markets, which could lead to reduced profitability.
The specialty coffee market is intensely competitive, including with respect to product quality, innovation, service, convenience, such as delivery service andmobile ordering, and price, and we face significant and increasing competition in all of these areas in each of our channels and markets. Accordingly, we do nothave leadership positions in all channels and markets. In the U.S., the ongoing focus by large competitors in the quick-service restaurant sector on selling high-quality specialty coffee beverages could lead to decreases in customer traffic to Starbucks stores and/or average value per transaction adversely affecting our salesand results of operations. Similarly, continued competition from well-established competitors, or competition from large new entrants or well-funded smallercompanies, in our domestic and international markets could hinder growth and adversely affect our sales and results of operations in those markets. Many smallcompetitors also continue to open coffee specialty stores in many of our markets across the world, which in the aggregate may also lead to significant decreases ofcustomer traffic to our stores in those markets. Increased competition globally in packaged coffee and tea and single-serve and ready-to-drink coffee beveragemarkets, including from new and large entrants to this market, could adversely affect the profitability of the Channel Development segment. In addition, not all ofour competitors may seek to establish environmental or sustainability goals at a comparable level to ours, which could result in lower supply chain or operatingcosts for our competitors. We may incur increased costs associated with reducing carbon dioxide and other greenhouse gas emissions, reducing the use of plastic orimposing performance obligations on our suppliers that could increase financial obligations for us and our business partners and could affect our profitability.Additionally, if we are unable to respond to consumer demand for healthy beverages and foods, or our competitors respond more effectively, this could have anegative effect on our business. Furthermore, declines in general consumer demand for specialty coffee products for any reason, including due to consumerpreference for other products, flattening demand for our products, changed customer daily routines or traffic to stores as a result of the COVID-19 pandemic, orchanged customer spending behaviors due to challenging economic conditions, could have a negative effect on our business.
Risks Related to Operating a Global Business
• We are highly dependent on the financial performance of our North America operating segment.
Our financial performance is highly dependent on our North America operating segment, which comprised approximately 70% of consolidated total net revenuesin fiscal 2021. If the North America operating segment revenue trends slow or decline, or does not successfully recover in the post COVID-19 environment,especially in our U.S. market, our other segments may be unable to make up any significant shortfall and our business and financial results could be adverselyaffected. And because the North America segment is relatively mature and produces the large majority of our operating cash flows, such a slowdown or declinecould result in reduced cash flows for funding the expansion of our international businesses and other initiatives and for returning cash to shareholders.
• We are increasingly dependent on the success of certain international markets in order to achieve our growth targets.
Our future growth increasingly depends on the growth and sustained profitability of certain international markets. Some or all of our international market businessunits (“MBUs”), which we generally define by the countries in which they operate, may not be successful in their operations or in achieving expected growth,which ultimately requires achieving consistent, stable net revenues and earnings. The performance of these international operations may be adversely affected byeconomic downturns in one or more of the countries in which our large MBUs operate. A decline in performance of one or more of our significant internationalMBUs could have a material adverse impact on our consolidated results.
The International segment is a significant profit center driving our global returns, along with our North America segment. In particular, our China MBU contributesmeaningfully to both consolidated and International net revenues and operating income. China is currently our fastest growing market, our second largest marketoverall and 100% company-owned. Due to the significance of our China market for our profit and growth, we are exposed to risks in China, including the risksmentioned elsewhere and the following:
• the effects of current U.S.-China relations, including rounds of tariff increases and retaliations and increasing restrictive regulations, potential boycottsand increasing anti-Americanism;
• escalating U.S.-China tension and increasing political sensitivities in China;
• the effects of the COVID-19 pandemic and related governmental regulations and restrictions on our operations in China;
• entry of new competitors to the specialty coffee market in China;
• changes in economic conditions in China and potential negative effects to the growth of its middle class, wages, labor, inflation, discretionary spendingand real estate and supply chain costs;
®
20

Table of Contents
• ongoing government regulatory reform, including relating to public health, food safety, tariffs and tax, sustainability and responses to climate change,which result in regulatory uncertainty as well as potential significant increases in compliance costs; and
• food-safety related matters, including compliance with food-safety regulations and ability to ensure product quality and safety.
Additionally, some factors that will be critical to the success of our international operations overall are different than those affecting our U.S. stores and licensees.Tastes naturally vary by region, and consumers in some MBUs may not embrace our products to the same extent as consumers in the U.S. or other internationalmarkets. Occupancy costs and store operating expenses can be higher internationally than in the U.S. due to higher rents for prime store locations or costs ofcompliance with country-specific regulatory requirements. Because many of our international operations are in an early phase of development, operating expensesas a percentage of related revenues are often higher compared to more developed operations.
• We face risks as a global business that could adversely affect our financial performance.
We operate in 84 markets globally. Our international operations are also subject to additional inherent risks of conducting business abroad, such as:
• foreign currency exchange rate fluctuations, or requirements to transact in specific currencies;
• changes or uncertainties in economic, legal, regulatory, social and political conditions in our markets, as well as negative effects on U.S. businesses due toincreasing anti-American sentiment in certain markets;
• interpretation and application of laws and regulations, including tax, tariffs, labor, merchandise, anti-bribery and privacy laws and regulations;
• restrictive actions of foreign or U.S. governmental authorities affecting trade and foreign investment, especially during periods of heightened tensionbetween the U.S. and such foreign governmental authorities, including protective measures such as export and customs duties and tariffs, governmentintervention favoring local competitors and restrictions on the level of foreign ownership;
• import or other business licensing requirements;
• the enforceability of intellectual property and contract rights;
• limitations on the repatriation of funds and foreign currency exchange restrictions due to current or new U.S. and international regulations;
• in developing economies, the growth rate in the portion of the population achieving sufficient levels of disposable income may not be as fast as weforecast;
• difficulty in staffing, developing and managing foreign operations and supply chain logistics, including ensuring the consistency of product quality andservice, due to governmental actions affecting supply chain logistics, distance, language and cultural differences, as well as challenges in recruiting andretaining high quality employees in local markets;
• local laws that make it more expensive and complex to negotiate with, retain or terminate employees;
• local regulations, health guidelines and safety protocols related to the COVID-19 pandemic affecting our operations; and
• delays in store openings for reasons beyond our control, competition with locally relevant competitors or a lack of desirable real estate locations availablefor lease at reasonable rates, any of which could keep us from meeting annual store opening targets and, in turn, negatively impact net revenues, operatingincome and earnings per share.
Moreover, many of the foregoing risks are particularly acute in developing countries, which are important to our long-term growth prospects.
Risks Related to Governmental and Regulatory Changes
• Failure to comply with applicable laws and changing legal and regulatory requirements could harm our business and financial results.
Our policies and procedures are designed to comply with all applicable laws, accounting and reporting requirements, tax rules and other regulations andrequirements, including those imposed by the SEC, Nasdaq and foreign countries, as well as applicable trade, labor, healthcare, food and beverage, sanitation,safety, environmental, labeling, anti-bribery and corruption and merchandise laws. Such laws and regulations are complex and often subject to differinginterpretations, which can lead to unintentional or unknown instances of non-compliance. Changes in applicable environmental laws and regulations, including
21

Table of Contents
increased or additional regulations and associated costs to limit carbon dioxide and other greenhouse gas emissions, to discourage the use of plastic or to limit orimpose additional costs on commercial water use, may result in increased compliance costs, capital expenditures, incremental investments and other financialobligations for us and our business partners, which could affect our profitability. Furthermore, due to the COVID‑19 pandemic, we are subject to additionaldomestic and foreign governmental regulations and health guidelines, as well as any other voluntary safety protocols.
In addition, our business is subject to complex and rapidly evolving U.S. and international laws and regulations regarding data privacy and data protection, andcompanies are under increased regulatory scrutiny relating to these matters. The Federal Trade Commission and many state attorneys general are also interpretingfederal and state consumer protection laws to impose standards for the online collection, use, dissemination and security of data. The interpretation and applicationof existing laws and regulations regarding data privacy and data protection are in flux and authorities around the world are considering a number of additionallegislative and regulatory proposals in this area. Current and future data privacy and data protection laws and regulations (including the GDPR and the CCPA,discussed in more detail in this risk factors section, and other applicable international and U.S. privacy laws), or new interpretations of existing laws andregulations, may limit our ability to collect and use data, require us to otherwise modify our data processing practices and policies or result in the possibility offines, litigation or orders, which may have an adverse effect on our business and results of operations. The burdens imposed by these and other laws andregulations that may be enacted, or new interpretations of existing and future laws and regulations, may also require us to incur substantial costs in reachingcompliance in a manner adverse to our business.
The complexity of the regulatory environment in which we operate and the related costs of compliance are both increasing due to additional or changing legal andregulatory requirements, our ongoing expansion into new markets and new channels and the fact that foreign laws occasionally conflict with domestic laws. Inaddition to potential damage to our reputation and brand, failure by us or our business partners to comply with the various applicable laws and regulations, as wellas changes in laws and regulations or the manner in which they are interpreted or applied, may result in litigation, civil and criminal liability, damages, fines andpenalties, increased cost of regulatory compliance and restatements of our financial statements and have an adverse impact on our business and financial results.
Item 1B. Unresolved Staff Comments
None.
Item 2. Properties
The material properties used by Starbucks in connection with its roasting, manufacturing, warehousing, distribution and corporate administrative operations,serving all segments, are as follows:Location Approximate Size in Square Feet PurposeYork, PA 1,957,000 Roasting, warehousing and distributionSeattle, WA 1,288,000 Corporate administrativeMinden, NV (Carson Valley) 1,080,000 Roasting, warehousing and distributionLebanon, TN 680,000 Warehousing and distributionKent, WA 510,000 Roasting and distributionAuburn, WA 491,000 Warehousing and distributionShanghai, China 175,000 Corporate administrative
We own most of our roasting facilities and lease the majority of our warehousing and distribution locations. As of October 3, 2021, Starbucks had 17,133company-operated stores, almost all of which are leased. We also lease space in various locations worldwide for regional, district and other administrative offices,training facilities and storage. In addition to the locations listed above, we hold inventory at various locations managed by third-party warehouses. We believe ourexisting facilities, both owned and leased, are in good condition and suitable for the conduct of our business.
Item 3. Legal Proceedings
See Note 16, Commitments and Contingencies, to the consolidated financial statements included in Item 8 of Part II of this 10-K for information regarding certainlegal proceedings in which we are involved.
Item 4. Mine Safety Disclosures
Not applicable.
22

Table of Contents
PART II
Item 5. Market for the Registrant’s Common Equity, Related Shareholder Matters and Issuer Purchases of Equity Securities
SHAREHOLDER INFORMATION
MARKET INFORMATION AND DIVIDEND POLICY
Starbucks common stock is traded on Nasdaq, under the symbol “SBUX.”
As of November 12, 2021, we had approximately 18,000 shareholders of record. This does not include persons whose stock is in nominee or “street name”accounts through brokers.
Future decisions to pay comparable cash dividends continue to be at the discretion of the Board of Directors and will be dependent on our operating performance,financial condition, capital expenditure requirements and other factors that the Board of Directors considers relevant.
ISSUER PURCHASES OF EQUITY SECURITIES
Shares under our ongoing share repurchase program may be repurchased in open market transactions, including pursuant to a trading plan adopted in accordancewith Rule 10b5-1 of the Securities Exchange Act of 1934 (the “Exchange Act”), as amended, or through privately negotiated transactions. The timing, manner,price and amount of repurchases will be determined at our discretion, and the share repurchase program may be suspended, terminated or modified at any time forany reason. During the fiscal year ended October 3, 2021, there was no share repurchase activity. As of October 3, 2021, 48.9 million shares remained available forrepurchase under current authorizations. Due to our business recovery and restoration of certain leverage metrics, we have resumed our share repurchase programin the first quarter of fiscal 2022.
23

Table of Contents
Performance Comparison Graph
The following graph depicts the total return to shareholders from October 2, 2016, through October 3, 2021, relative to the performance of the Standard & Poor’s500 Index, the NASDAQ Composite Index and the Standard & Poor’s 500 Consumer Discretionary Sector, a peer group that includes Starbucks. All indices shownin the graph have been reset to a base of 100 as of October 2, 2016, and assume an investment of $100 on that date and the reinvestment of dividends paid sincethat date. The stock price performance shown in the graph is not necessarily indicative of future price performance.
Oct 2, 2016 Oct 1, 2017 Sep 30, 2018 Sep 29, 2019 Sep 27, 2020 Oct 3, 2021Starbucks Corporation $ 100.00 $ 100.98 $ 109.35 $ 173.26 $ 168.68 $ 229.83 S&P 500 100.00 118.61 139.85 145.80 167.89 218.27 NASDAQ Composite 100.00 123.68 154.82 155.63 219.37 285.75 S&P Consumer Discretionary 100.00 114.52 151.78 155.36 200.25 238.59
24

Table of Contents
Item 6. [Reserved]
25
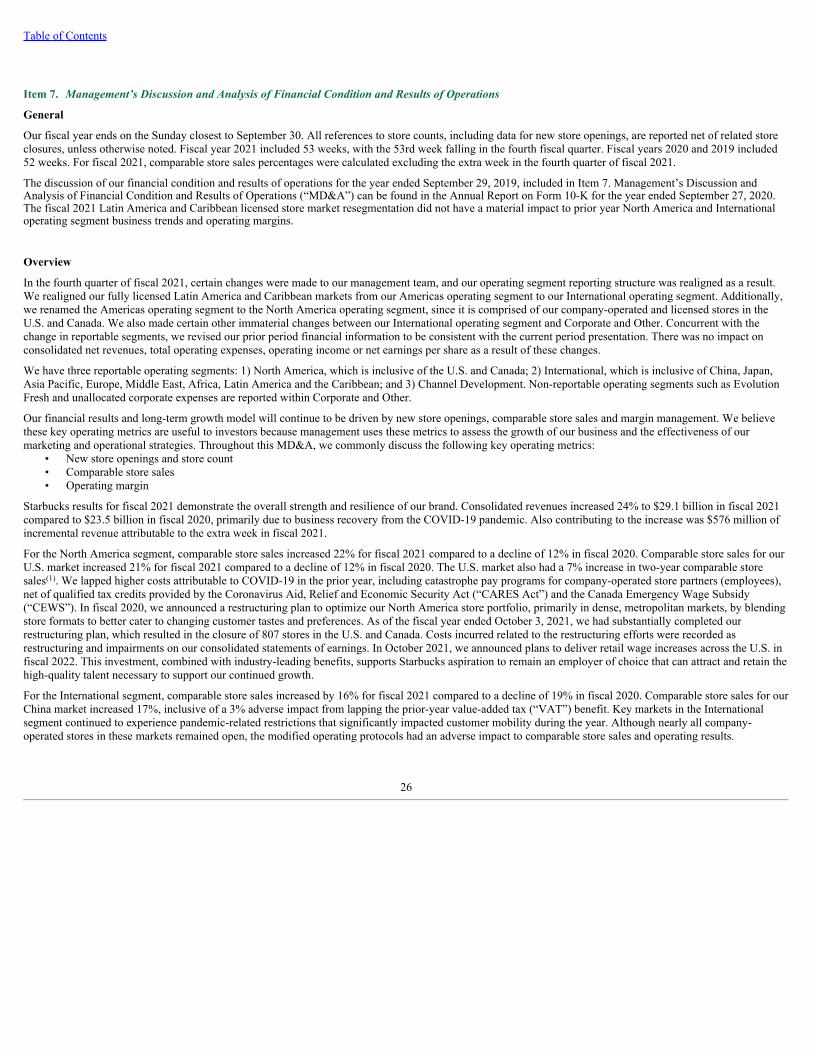
Table of Contents
Item 7. Management’s Discussion and Analysis of Financial Condition and Results of Operations
General
Our fiscal year ends on the Sunday closest to September 30. All references to store counts, including data for new store openings, are reported net of related storeclosures, unless otherwise noted. Fiscal year 2021 included 53 weeks, with the 53rd week falling in the fourth fiscal quarter. Fiscal years 2020 and 2019 included52 weeks. For fiscal 2021, comparable store sales percentages were calculated excluding the extra week in the fourth quarter of fiscal 2021.
The discussion of our financial condition and results of operations for the year ended September 29, 2019, included in Item 7. Management’s Discussion andAnalysis of Financial Condition and Results of Operations (“MD&A”) can be found in the Annual Report on Form 10-K for the year ended September 27, 2020.The fiscal 2021 Latin America and Caribbean licensed store market resegmentation did not have a material impact to prior year North America and Internationaloperating segment business trends and operating margins.
Overview
In the fourth quarter of fiscal 2021, certain changes were made to our management team, and our operating segment reporting structure was realigned as a result.We realigned our fully licensed Latin America and Caribbean markets from our Americas operating segment to our International operating segment. Additionally,we renamed the Americas operating segment to the North America operating segment, since it is comprised of our company-operated and licensed stores in theU.S. and Canada. We also made certain other immaterial changes between our International operating segment and Corporate and Other. Concurrent with thechange in reportable segments, we revised our prior period financial information to be consistent with the current period presentation. There was no impact onconsolidated net revenues, total operating expenses, operating income or net earnings per share as a result of these changes.
We have three reportable operating segments: 1) North America, which is inclusive of the U.S. and Canada; 2) International, which is inclusive of China, Japan,Asia Pacific, Europe, Middle East, Africa, Latin America and the Caribbean; and 3) Channel Development. Non-reportable operating segments such as EvolutionFresh and unallocated corporate expenses are reported within Corporate and Other.
Our financial results and long-term growth model will continue to be driven by new store openings, comparable store sales and margin management. We believethese key operating metrics are useful to investors because management uses these metrics to assess the growth of our business and the effectiveness of ourmarketing and operational strategies. Throughout this MD&A, we commonly discuss the following key operating metrics:
• New store openings and store count• Comparable store sales• Operating margin
Starbucks results for fiscal 2021 demonstrate the overall strength and resilience of our brand. Consolidated revenues increased 24% to $29.1 billion in fiscal 2021compared to $23.5 billion in fiscal 2020, primarily due to business recovery from the COVID-19 pandemic. Also contributing to the increase was $576 million ofincremental revenue attributable to the extra week in fiscal 2021.
For the North America segment, comparable store sales increased 22% for fiscal 2021 compared to a decline of 12% in fiscal 2020. Comparable store sales for ourU.S. market increased 21% for fiscal 2021 compared to a decline of 12% in fiscal 2020. The U.S. market also had a 7% increase in two-year comparable storesales . We lapped higher costs attributable to COVID-19 in the prior year, including catastrophe pay programs for company-operated store partners (employees),net of qualified tax credits provided by the Coronavirus Aid, Relief and Economic Security Act (“CARES Act”) and the Canada Emergency Wage Subsidy(“CEWS”). In fiscal 2020, we announced a restructuring plan to optimize our North America store portfolio, primarily in dense, metropolitan markets, by blendingstore formats to better cater to changing customer tastes and preferences. As of the fiscal year ended October 3, 2021, we had substantially completed ourrestructuring plan, which resulted in the closure of 807 stores in the U.S. and Canada. Costs incurred related to the restructuring efforts were recorded asrestructuring and impairments on our consolidated statements of earnings. In October 2021, we announced plans to deliver retail wage increases across the U.S. infiscal 2022. This investment, combined with industry-leading benefits, supports Starbucks aspiration to remain an employer of choice that can attract and retain thehigh-quality talent necessary to support our continued growth.
For the International segment, comparable store sales increased by 16% for fiscal 2021 compared to a decline of 19% in fiscal 2020. Comparable store sales for ourChina market increased 17%, inclusive of a 3% adverse impact from lapping the prior-year value-added tax (“VAT”) benefit. Key markets in the Internationalsegment continued to experience pandemic-related restrictions that significantly impacted customer mobility during the year. Although nearly all company-operated stores in these markets remained open, the modified operating protocols had an adverse impact to comparable store sales and operating results.
(1)
26

Table of Contents
Revenue for our Channel Development segment decreased $331 million, or 17%, when compared with fiscal 2020. This was largely due to the transition of certainsingle-serve product activities to Nestlé beginning in the fourth quarter of fiscal 2020. This was partially offset by growth in our ready-to-drink business. Weexpect Channel Development to return to more normalized reported revenue growth levels in fiscal 2022, as the fourth quarter of fiscal 2021 is the last quarterlapping these transition related activities.
During fiscal 2021, we began to experience certain supply shortages and transportation delays largely attributable to impacts of the COVID-19 pandemic as well aschanges in customer demand and behaviors. While we expect these shortages and delays may continue into fiscal 2022, we view them to be temporary and do notbelieve they will have a material impact to our long-term growth and profitability. Absent significant and prolonged COVID-19 relapses or global economicdisruptions, and based on the current trend of our business operations and our focused efforts to elevate customer experiences, enhance digital capabilities anddrive beverage innovation, we are confident in the strength of our brand and the durability of long-term “Growth at Scale” strategy to deliver consistent revenueand income growth. We anticipate the planned wage investment in the U.S., along with increased supply chain costs primarily related to inflationary pressures thatbegan in the latter half of the fiscal year, will have an impact to operating margin in fiscal 2022. However, these should be meaningfully offset by benefits frompricing decisions and leverage from revenue growth and productivity efficiency.
Two-year comparable store sales metric is calculated as ((1 + % change in comparable store sales in FY20) * (1 + % change in comparable store sales inFY21)) - 1. Two-year comparable store sales for the U.S. of 7% = ((1 + (-12%)) * (1 + 21%)) - 1.
Financial Highlights
• Total net revenues increased 24% to $29.1 billion in fiscal 2021 compared to $23.5 billion in fiscal 2020, including $576 million attributable to the extraweek in fiscal 2021.
• Consolidated operating income increased to $4.9 billion in fiscal 2021 compared to $1.6 billion in fiscal 2020. Fiscal 2021 operating margin was 16.8%compared to 6.6% in fiscal 2020. Operating margin expansion was primarily due to sales leverage from business recovery and lapping higher COVID-19related costs in the prior year, mainly catastrophe and service pay for store partners, net of temporary subsidies from the U.S. and certain foreigngovernments, as well as pricing in North America in the current year. These increases were partially offset by enhancements in retail store partner wagesand benefits and, to a lesser extent, increased supply chain costs due to accelerated inflationary pressures in the latter half of fiscal 2021.
• Diluted earnings per share (“EPS”) for fiscal 2021 increased to $3.54, compared to EPS of $0.79 in fiscal 2020. The increase was primarily driven bylapping the adverse impacts of COVID-19 in prior year. Also contributing to the increase was a $0.56 gain net of estimated taxes on the divestiture of ourSouth Korea joint venture and $0.10 related to the extra week in fiscal 2021.
• Capital expenditures were $1.5 billion for both fiscal 2021 and fiscal 2020.
• We returned $2.1 billion to our shareholders in fiscal 2021 through dividends. We returned $3.6 billion in fiscal 2020 through share repurchases anddividends. We temporarily suspended our share repurchase program in March 2020. Due to our business recovery and restoration of certain leveragemetrics, we have resumed our share repurchase program in the first quarter of fiscal 2022.
Acquisitions and Divestitures
See Note 2, Acquisitions, Divestitures and Strategic Alliance, to the consolidated financial statements included in Item 8 of Part II of this 10-K for informationregarding acquisitions and divestitures.
(1)
27
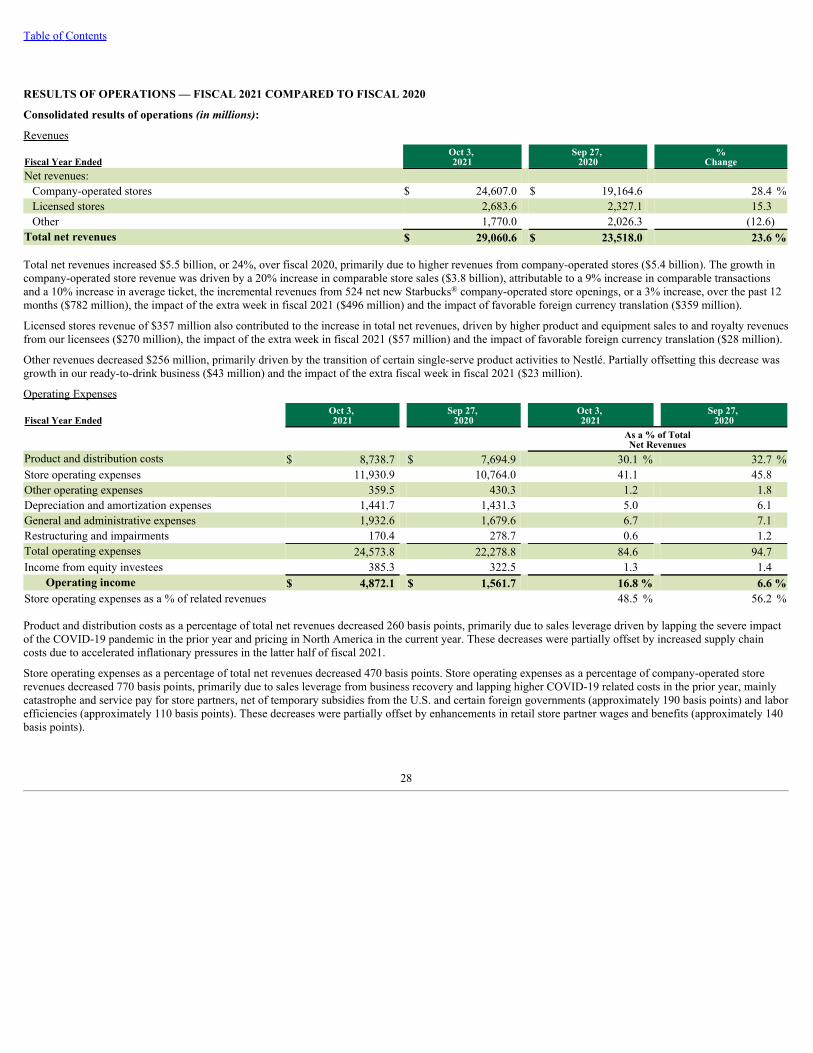
Table of Contents
RESULTS OF OPERATIONS — FISCAL 2021 COMPARED TO FISCAL 2020
Consolidated results of operations (in millions):
Revenues
Fiscal Year EndedOct 3, 2021
Sep 27, 2020
%Change
Net revenues:Company-operated stores $ 24,607.0 $ 19,164.6 28.4 %Licensed stores 2,683.6 2,327.1 15.3 Other 1,770.0 2,026.3 (12.6)
Total net revenues $ 29,060.6 $ 23,518.0 23.6 %
Total net revenues increased $5.5 billion, or 24%, over fiscal 2020, primarily due to higher revenues from company-operated stores ($5.4 billion). The growth incompany-operated store revenue was driven by a 20% increase in comparable store sales ($3.8 billion), attributable to a 9% increase in comparable transactionsand a 10% increase in average ticket, the incremental revenues from 524 net new Starbucks company-operated store openings, or a 3% increase, over the past 12months ($782 million), the impact of the extra week in fiscal 2021 ($496 million) and the impact of favorable foreign currency translation ($359 million).
Licensed stores revenue of $357 million also contributed to the increase in total net revenues, driven by higher product and equipment sales to and royalty revenuesfrom our licensees ($270 million), the impact of the extra week in fiscal 2021 ($57 million) and the impact of favorable foreign currency translation ($28 million).
Other revenues decreased $256 million, primarily driven by the transition of certain single-serve product activities to Nestlé. Partially offsetting this decrease wasgrowth in our ready-to-drink business ($43 million) and the impact of the extra fiscal week in fiscal 2021 ($23 million).
Operating Expenses
Fiscal Year EndedOct 3, 2021
Sep 27, 2020
Oct 3, 2021
Sep 27, 2020
As a % of TotalNet Revenues
Product and distribution costs $ 8,738.7 $ 7,694.9 30.1 % 32.7 %Store operating expenses 11,930.9 10,764.0 41.1 45.8 Other operating expenses 359.5 430.3 1.2 1.8 Depreciation and amortization expenses 1,441.7 1,431.3 5.0 6.1 General and administrative expenses 1,932.6 1,679.6 6.7 7.1 Restructuring and impairments 170.4 278.7 0.6 1.2 Total operating expenses 24,573.8 22,278.8 84.6 94.7 Income from equity investees 385.3 322.5 1.3 1.4
Operating income $ 4,872.1 $ 1,561.7 16.8 % 6.6 %Store operating expenses as a % of related revenues 48.5 % 56.2 %
Product and distribution costs as a percentage of total net revenues decreased 260 basis points, primarily due to sales leverage driven by lapping the severe impactof the COVID-19 pandemic in the prior year and pricing in North America in the current year. These decreases were partially offset by increased supply chaincosts due to accelerated inflationary pressures in the latter half of fiscal 2021.
Store operating expenses as a percentage of total net revenues decreased 470 basis points. Store operating expenses as a percentage of company-operated storerevenues decreased 770 basis points, primarily due to sales leverage from business recovery and lapping higher COVID-19 related costs in the prior year, mainlycatastrophe and service pay for store partners, net of temporary subsidies from the U.S. and certain foreign governments (approximately 190 basis points) and laborefficiencies (approximately 110 basis points). These decreases were partially offset by enhancements in retail store partner wages and benefits (approximately 140basis points).
®
28

Table of Contents
Other operating expenses decreased $71 million, primarily due to lower Global Coffee Alliance transaction costs, inclusive of lapping integration costs for theGlobal Coffee Alliance and a change of a related accrual estimate in fiscal 2021.
Depreciation and amortization expenses as a percentage of total net revenues decreased 110 basis points, primarily due to sales leverage.
General and administrative expenses increased $253 million, primarily due to higher performance-based compensation, recognizing the strength of the Company'soverall recovery from pandemic-related business impacts ($111 million), incremental strategic investments in technology ($89 million), increased partner wagesand benefits ($26 million) and the impact of the extra week in fiscal 2021 ($22 million).
Restructuring and impairment expenses decreased $108 million, primarily due to lower asset impairment related to our North America store portfolio optimization($65 million), lapping the intangible asset impairment from the prior year ($22 million) and lower severance costs.
Income from equity investees increased $63 million, primarily due to higher income from our North American Coffee Partnership joint venture ($30 million) andgrowth in our South Korea joint venture prior to divestiture ($22 million). We expect lower income from equity method investments in the future as a result of thesale of our South Korea joint venture (see Note 2); however, we do not expect this transaction to have a material impact on future revenue and operating margintrends.
The combination of these changes resulted in an overall increase in operating margin of 1,020 basis points in fiscal 2021 when compared to fiscal 2020.
Other Income and Expenses
Fiscal Year EndedOct 3, 2021
Sep 27, 2020
Oct 3, 2021
Sep 27, 2020
As a % of TotalNet Revenues
Operating income $ 4,872.1 $ 1,561.7 16.8 % 6.6 %Net gain resulting from divestiture of certain operations 864.5 — 3.0 — Interest income and other, net 90.1 39.7 0.3 0.2 Interest expense (469.8) (437.0) (1.6) (1.9)
Earnings before income taxes 5,356.9 1,164.4 18.4 5.0 Income tax expense 1,156.6 239.7 4.0 1.0
Net earnings including noncontrolling interests 4,200.3 924.7 14.5 3.9 Net earnings/(loss) attributable to noncontrollinginterests 1.0 (3.6) — — Net earnings attributable to Starbucks $ 4,199.3 $ 928.3 14.5 % 3.9 %
Effective tax rate including noncontrolling interests 21.6 % 20.6 %
Net gain resulting from divestiture of certain operations increased $865 million due to the sale of our ownership interest in our South Korea joint venture.
Interest income and other, net increased $50 million, primarily due to additional income from certain investments and net favorable fair value adjustments fromderivatives used to manage our commodity price fluctuation risk.
Interest expense increased $33 million primarily due to additional interest incurred on long-term debt issued in March 2020 and May 2020.
The effective tax rate for fiscal 2021 was 21.6% compared to 20.6% for fiscal 2020. The increase was due to the foreign rate differential on our jurisdictional mixof earnings (approximately 380 basis points) as well as higher pre-tax income in fiscal 2021, which resulted in lower rate benefits from several discrete items,including stock-based compensation excess tax benefits (approximately 380 basis points), the release of income tax reserves upon expiration of statute oflimitations (approximately 150 basis points) and the remeasurement of deferred tax assets due to an enacted foreign corporate rate change (approximately 80 basispoints). These unfavorable drivers were partially offset by lapping valuation allowances recorded against deferred tax assets of certain international jurisdictions inthe prior year (approximately 990 basis points). See Note 14, Income Taxes, for further discussion.
29

Table of Contents
Segment Information
Results of operations by segment (in millions):
North America
Fiscal Year EndedOct 3, 2021
Sep 27, 2020
Oct 3, 2021
Sep 27, 2020
As a % of North America Total Net Revenues
Net revenues:Company-operated stores $ 18,737.3 $ 14,778.8 91.6 % 90.7 %Licensed stores 1,702.2 1,509.9 8.3 9.3 Other 8.4 7.5 — —
Total net revenues 20,447.9 16,296.2 100.0 100.0 Product and distribution costs 5,453.8 4,564.4 26.7 28.0 Store operating expenses 9,359.5 8,488.0 45.8 52.1 Other operating expenses 166.0 154.6 0.8 0.9 Depreciation and amortization expenses 753.9 762.0 3.7 4.7 General and administrative expenses 300.0 268.0 1.5 1.6 Restructuring and impairments 155.4 257.5 0.8 1.6 Total operating expenses 16,188.6 14,494.5 79.2 88.9 Operating income $ 4,259.3 $ 1,801.7 20.8 % 11.1 %
North America licensed store revenues, total net revenues, product and distribution costs, other operating expenses, total operating expenses and operatingincome for the fiscal year ended September 27, 2020, have been restated to conform with current period presentation.
Revenues
North America total net revenues for fiscal 2021 increased $4.2 billion, or 25%, primarily due to a 22% increase in comparable store sales ($3.1 billion) driven bya 13% increase in average ticket and a 7% increase in transactions and the impact of the extra week in fiscal 2021 ($427 million). Also contributing to theseincreases were the performance of new stores compared to the closure of underperforming stores, including stores related to our restructuring plan ($394 million),higher product and equipment sales to and royalty revenues from our licensees ($151 million) primarily due to lapping the severe impact of the COVID-19pandemic in the prior year and favorable foreign currency translation ($76 million).
Operating Margin
North America operating income for fiscal 2021 increased 136% to $4.3 billion, compared to $1.8 billion in fiscal 2020. Operating margin increased 970 basispoints to 20.8%, primarily due to sales leverage from business recovery and lapping higher COVID-19 related costs in the prior year, mainly catastrophe andservice pay for store partners, net of temporary subsidies provided by the CARES Act and CEWS (approximately 180 basis points). Also contributing to themargin improvements were pricing (approximately 130 basis points), lower restructuring expenses (approximately 80 basis points) and benefits from the closure oflower-performing stores (approximately 60 basis points). These increases were partially offset by enhancements in retail store partner wages and benefits(approximately 150 basis points) and, to a lesser extent, increased supply chain costs due to accelerated inflationary pressures in the latter half of fiscal 2021.
(1)
(1)
30

Table of Contents
International
Fiscal Year EndedOct 3, 2021
Sep 27, 2020
Oct 3, 2021
Sep 27, 2020
As a % of InternationalTotal Net Revenues
Net revenues:Company-operated stores $ 5,869.7 $ 4,385.8 84.8 % 83.8 %Licensed stores 981.4 817.2 14.2 15.6 Other 70.5 27.6 1.0 0.5
Total net revenues 6,921.6 5,230.6 100.0 100.0 Product and distribution costs 2,187.3 1,729.1 31.6 33.1 Store operating expenses 2,571.4 2,276.0 37.2 43.5 Other operating expenses 147.3 153.6 2.1 2.9 Depreciation and amortization expenses 544.7 518.4 7.9 9.9 General and administrative expenses 360.5 286.4 5.2 5.5 Restructuring and impairments — (1.2) — — Total operating expenses 5,811.2 4,962.3 84.0 94.9 Income from equity investees 135.3 102.3 2.0 2.0 Operating income $ 1,245.7 $ 370.6 18.0 % 7.1 %
International licensed store revenues, total net revenues, product and distribution costs, other operating expenses, general and administrative expenses, totaloperating expenses and operating income for the fiscal year ended September 27, 2020, have been restated to conform with current period presentation.
Revenues
International total net revenues for fiscal 2021 increased $1.7 billion, or 32%, primarily due to a 16% increase in comparable store sales ($697 million), driven by a14% increase in transactions and a 1% increase in average ticket. Also contributing to this increase were 746 net new Starbucks company-operated stores, or an11% increase, over the past 12 months ($388 million). Additionally, there was favorable foreign currency translation ($310 million), the impact of the extra weekin fiscal 2021 ($127 million) and higher product sales to and royalty revenues from our licensees ($121 million) primarily due to lapping the impact of the COVID-19 pandemic in the prior year.
Operating Margin
International operating income for fiscal 2021 increased 236% to $1.2 billion, compared to $371 million in fiscal 2020. Operating margin increased 1,090 basispoints to 18.0%, primarily due to sales leverage driven by lapping the severe impact of the COVID-19 pandemic in the prior year as well as higher temporarygovernment subsidies (approximately 170 basis points) and labor efficiencies (approximately 110 basis points). Also contributing to this increase was lappingtemporary royalty relief provided to licensees in the prior year (approximately 60 basis points).
(1)
(1)
®
31

Table of Contents
Channel Development
Fiscal Year EndedOct 3, 2021
Sep 27, 2020
Oct 3, 2021
Sep 27, 2020
As a % of Channel Development Total Net Revenues
Net revenues $ 1,593.6 $ 1,925.0 Product and distribution costs 1,011.2 1,338.1 63.5 69.5 Other operating expenses 31.3 108.2 2.0 5.6 Depreciation and amortization expenses 1.2 1.2 0.1 0.1 General and administrative expenses 10.8 10.5 0.7 0.5 Total operating expenses 1,054.5 1,458.0 66.2 75.7 Income from equity investees 250.0 220.2 15.7 11.4 Operating income $ 789.1 $ 687.2 49.5 % 35.7 %
Revenues
Channel Development total net revenues for fiscal 2021 decreased $331 million, or 17%, compared to fiscal 2020, primarily due to the transition of certain single-serve product activities to Nestlé ($348 million) and the lapping of higher transition activities related to the Global Coffee Alliance in the prior year ($85 million).These were partially offset by growth in our ready-to-drink business ($52 million) and the impact of the extra week in fiscal 2021 ($21 million).
Operating Margin
Channel Development operating income for fiscal 2021 increased 15% to $789 million, compared to $687 million in fiscal 2020. Operating margin increased 1,380basis points to 49.5%, primarily due to the transfer of certain single-serve product activities to Nestlé as part of the Global Coffee Alliance (approximately 730basis points) and lapping higher transition costs for the Global Coffee Alliance and a change in estimate relating to a transaction cost accrual in fiscal 2021(approximately 380 basis points). Strong performance from our North American Coffee Partnership joint venture (approximately 120 basis points) alsocontributed.
32

Table of Contents
Corporate and Other
Fiscal Year EndedOct 3, 2021
Sep 27, 2020
% Change
Net revenues:Other $ 97.5 $ 66.2 47.3 %
Total net revenues 97.5 66.2 47.3 Product and distribution costs 86.4 63.3 36.5 Other operating expenses 14.9 13.9 7.2 Depreciation and amortization expenses 141.9 149.7 (5.2)General and administrative expenses 1,261.3 1,114.7 13.2 Restructuring and impairments 15.0 22.4 (33.0)Total operating expenses 1,519.5 1,364.0 11.4 Operating loss $ (1,422.0) $ (1,297.8) 9.6 %
Corporate and other general and administrative expenses and operating loss for the fiscal year ended September 27, 2020, have been restated to conform withcurrent period presentation.
Corporate and Other primarily consists of our unallocated corporate expenses and Evolution Fresh. Unallocated corporate expenses include corporateadministrative functions that support the operating segments but are not specifically attributable to or managed by any segment and are not included in the reportedfinancial results of the operating segments.
Corporate and Other operating loss increased to $1.4 billion for fiscal 2021, or 10%, compared to $1.3 billion in fiscal 2020. This increase was primarily driven byincremental investments in technology ($81 million) and higher performance-based compensation, due to better than expected business recovery ($57 million).
FINANCIAL CONDITION, LIQUIDITY AND CAPITAL RESOURCES
Cash and Investment Overview
Our cash and investments were $6.9 billion and $4.8 billion as of October 3, 2021 and September 27, 2020, respectively. We actively manage our cash andinvestments in order to internally fund operating needs, make scheduled interest and principal payments on our borrowings, make acquisitions and return cash toshareholders through common stock cash dividend payments and share repurchases. Our investment portfolio primarily includes highly liquid available-for-salesecurities, including corporate debt securities, government treasury securities (domestic and foreign) and commercial paper. As of October 3, 2021, approximately$2.9 billion of cash was held in foreign subsidiaries.
Borrowing capacity
Credit Facilities and Commercial Paper
Our total contractual borrowing capacity for general corporate purposes was $3.0 billion as of the end of fiscal 2021.
Revolving Lines of Credit
During the fourth quarter of fiscal 2021, we replaced our $2.0 billion unsecured 5-year revolving credit facility (the “2018 credit facility”) and our $1.0 billionunsecured 364-Day credit facility (the “364-day credit facility”) with a new $3.0 billion unsecured 5-year revolving credit facility (the “2021 credit facility”).
Our 2021 credit facility, of which $150 million may be used for issuances of letters of credit, is currently set to mature on September 16, 2026. We have the option,subject to negotiation and agreement with the related banks, to increase the maximum commitment amount by an additional $1.0 billion. Borrowings under thecredit facility will bear interest at a variable rate based on LIBOR, and, for U.S. dollar-denominated loans under certain circumstances, a Base Rate (as defined inthe credit facility), in each case plus an applicable margin. The applicable margin is based on the Company’s long-term credit ratings assigned by Moody’s andStandard & Poor’s rating agencies. The 2021 credit facility contains alternative interest rate provisions specifying rate calculations to be used at such time LIBORceases to be available as a benchmark due to reference rate reform. The “Base Rate” of interest is the highest of (i) the Federal Funds Rate plus 0.025%, (ii) Bankof America’s prime rate, and (iii) the Eurocurrency Rate (as defined in the credit facility) plus 1.025%. The 2021 credit facility is available for general corporatepurposes. As of October 3, 2021, we had no borrowings under the 2021 credit facility.
Commercial Paper
(1)
(1)
33

Table of Contents
Under our commercial paper program, we may issue unsecured commercial paper notes up to a maximum aggregate amount outstanding at any time of $3.0billion, with individual maturities that may vary but not exceed 397 days from the date of issue. Amounts outstanding under the commercial paper program arerequired to be backstopped by available commitments under the 2021 credit facility discussed above. The proceeds from borrowings under our commercial paperprogram may be used for working capital needs, capital expenditures and other corporate purposes, including, but not limited to, business expansion, payment ofcash dividends on our common stock and share repurchases. As of October 3, 2021, we had no amounts outstanding under our commercial paper program.
Credit Facilities in Japan
Additionally, we hold Japanese yen-denominated credit facilities which are available for working capital needs and capital expenditures within our Japanesemarket.
• A ¥5 billion, or $44.9 million, facility is currently set to mature on December 30, 2021. Borrowings under the credit facility are subject to terms definedwithin the facility and will bear interest at a variable rate based on TIBOR plus an applicable margin of 0.400%.
• A ¥10 billion, or $89.9 million, facility is currently set to mature on March 26, 2022. Borrowings under the credit facility are subject to terms definedwithin the facility and will bear interest at a variable rate based on TIBOR plus 0.350%.
As of October 3, 2021, we had no borrowings outstanding under these credit facilities.
See Note 9, Debt, to the consolidated financial statements included in Item 8 of Part II of this 10-K for details of the components of our long-term debt.
Our ability to incur new liens and conduct sale and leaseback transactions on certain material properties is subject to compliance with terms of the indentures underwhich the long-term notes were issued. As of October 3, 2021, we were in compliance with all applicable covenants.
Use of Cash
We expect to use our available cash and investments, including, but not limited to, additional potential future borrowings under the credit facilities, commercialpaper program and the issuance of debt to support and invest in our core businesses, including investing in new ways to serve our customers and supporting ourstore partners, repaying maturing debts, as well as returning cash to shareholders through common stock cash dividend payments and discretionary sharerepurchases and investing in new business opportunities related to our core and developing businesses. Further, we may use our available cash resources to makeproportionate capital contributions to our investees. We may also seek strategic acquisitions to leverage existing capabilities and further build our business insupport of our “Growth at Scale” agenda. Acquisitions may include increasing our ownership interests in our investees. Any decisions to increase such ownershipinterests will be driven by valuation and fit with our ownership strategy.
We believe that net future cash flows generated from operations and existing cash and investments both domestically and internationally combined with our abilityto leverage our balance sheet through the issuance of debt will be sufficient to finance capital requirements for our core businesses as well as shareholderdistributions for the foreseeable future. However, significant new joint ventures, acquisitions and/or other new business opportunities may require additionaloutside funding. We have borrowed funds and continue to believe we have the ability to do so at reasonable interest rates; however, additional borrowings wouldresult in increased interest expense in the future. In this regard, we may incur additional debt, within targeted levels, as part of our plans to fund our capitalprograms, including cash returns to shareholders through future dividends and discretionary share repurchases. If necessary, we may pursue additional sources offinancing, including both short-term and long-term borrowings and debt issuances.
We regularly review our cash positions and our determination of partial indefinite reinvestment of foreign earnings. In the event we determine that all or anotherportion of such foreign earnings are no longer indefinitely reinvested, we may be subject to additional foreign withholding taxes and U.S. state income taxes, whichcould be material. We currently do not anticipate the need for repatriated funds to the U.S. to satisfy domestic liquidity needs. See Note 14, Income Taxes, forfurther discussion.
During the fourth quarter of fiscal 2021, we replaced our $2.0 billion 2018 credit facility and our $1.0 billion 364-day credit facility with a new $3.0 billion 2021credit facility. The 2021 credit facility was not drawn on in fiscal 2021 and is currently set to mature on September 16, 2026.
During each of the first three quarters of fiscal 2020, we declared a cash dividend to shareholders of $0.41 per share. On September 30, 2020, and for each of thefirst three quarters of fiscal 2021, we declared a cash dividend of $0.45 per share. Dividends are generally paid in the quarter following the declaration date. Cashreturned to shareholders through dividends in
34

Table of Contents
fiscal 2021 and 2020 totaled $2.1 billion and $1.9 billion, respectively. During the fourth quarter of fiscal 2021, we declared a cash dividend of $0.49 per share tobe paid on November 26, 2021, with an expected payout of approximately $578.1 million.
In March 2019, we entered into accelerated share repurchase agreements (“ASR agreements”) with third-party financial institutions totaling $2.0 billion, effectiveMarch 22, 2019. We made a $2.0 billion up-front payment to the financial institutions and received an initial delivery of 22.2 million shares of our common stock.In June 2019, we received an additional 3.9 million shares upon the completion of the program based on a volume-weighted average share price (less discount) of$76.50.
Outside of the ASR agreements noted above, we repurchased 36.6 million shares of common stock for $3.1 billion on the open market during the fiscal year endedSeptember 29, 2019. In total, we repurchased 139.6 million shares at a total cost of $10.1 billion for the fiscal year ended September 29, 2019.
Our Board of Directors approved an increase of 120 million and 40 million shares to our ongoing share repurchase program during the fiscal first quarter of 2019and fiscal second quarter of 2020, respectively. We temporarily suspended our share repurchase program in March 2020. Prior to the suspension, we repurchased20.3 million shares of common stock for $1.7 billion on the open market during the year ended September 27, 2020. As of October 3, 2021, 48.9 million sharesremained available for repurchase under current authorizations. Due to our business recovery and restoration of certain leverage metrics, we have resumed ourshare repurchase program in the first quarter of fiscal 2022.
Other than operating expenses, cash requirements for fiscal 2022 are expected to consist primarily of capital expenditures for investments in our new and existingstores, our supply chain and corporate facilities. Total capital expenditures for fiscal 2022 are expected to be approximately $2 billion.
The following table summarizes current and long-term material cash requirements as of October 3, 2021, which we expect to fund primarily with operating cashflows (in millions): Material Cash Requirements
TotalLess than 1
Year1 - 3
Years3 - 5
YearsMore than
5 YearsOperating lease obligations $ 10,129.9 $ 1,504.6 $ 2,751.5 $ 2,169.1 $ 3,704.7 Debt obligations
Principal payments 14,713.8 1,000.0 2,513.8 1,750.0 9,450.0 Interest payments 6,639.0 457.1 840.7 730.1 4,611.1
Purchase obligations 1,800.2 1,202.6 533.9 63.7 — Other obligations 368.4 54.6 92.6 136.5 84.7 Total $ 33,651.3 $ 4,218.9 $ 6,732.5 $ 4,849.4 $ 17,850.5
Amounts include direct lease obligations, excluding any taxes, insurance and other related expenses.Purchase obligations include agreements to purchase goods or services that are enforceable and legally binding on Starbucks and that specify all significantterms. Green coffee purchase commitments comprise 96% of total purchase obligations.Other obligations include other long-term liabilities primarily consisting of long-term income taxes payable, asset retirement obligations and equityinvestment capital commitments.
Cash Flows
Cash provided by operating activities was $6.0 billion for fiscal 2021, compared to $1.6 billion for fiscal 2020. The change was primarily due to higher netearnings and lapping the U.S. federal tax payment related to the Nestlé transaction in fiscal 2020.
Cash used in investing activities totaled $0.3 billion for fiscal 2021, compared to $1.7 billion for fiscal 2020. The change was primarily driven by net proceedsfrom the divestiture of our ownership interest in our South Korea joint venture and higher maturities and calls of investments. This was partially offset by adecrease in sales of investments and higher capital contributions to equity method investments.
Cash used in financing activities for fiscal 2021 totaled $3.7 billion, compared to cash provided by financing activities of $1.7 billion for fiscal 2020. The changewas primarily due to lower net proceeds from borrowing activities and higher debt repayments, partially offset by the temporary suspension of our share repurchaseprogram.
(1)
(2)
(3)
(1)
(2)
(3)
35

Table of Contents
COMMODITY PRICES, AVAILABILITY AND GENERAL RISK CONDITIONS
Commodity price risk represents Starbucks primary market risk, generated by our purchases of green coffee and dairy products, among other items. We purchase,roast and sell high-quality arabica coffee and related products and risk arises from the price volatility of green coffee. In addition to coffee, we also purchasesignificant amounts of dairy products to support the needs of our company-operated stores. The price and availability of these commodities directly impacts ourresults of operations, and we expect commodity prices, particularly coffee, to impact future results of operations. For additional details see Product Supply inItem 1, as well as Risk Factors in Item 1A of this 10-K.
FINANCIAL RISK MANAGEMENT
Market risk is defined as the risk of losses due to changes in commodity prices, foreign currency exchange rates, equity security prices and interest rates. Wemanage our exposure to various market-based risks according to a market price risk management policy. Under this policy, market-based risks are quantified andevaluated for potential mitigation strategies, such as entering into hedging transactions. The market price risk management policy governs how hedginginstruments may be used to mitigate risk. Risk limits are set annually and prohibit speculative trading activity. We also monitor and limit the amount of associatedcounterparty credit risk, which we consider to be low. We use interest rate swap agreements and treasury locks to primarily hedge against changes in benchmarkinterest rates related to anticipated debt issuances. We also use cross-currency swaps and foreign exchange debt instruments to hedge against changes in the fairvalue of our fixed-rate debt and foreign exchange exposure of net investments in Japan. Excluding interest rate hedging instruments, cross currency swaps andforeign currency debt, hedging instruments generally do not have maturities in excess of three years. Refer to Note 1, Summary of Significant Accounting Policies,and Note 3, Derivative Financial Instruments, to the consolidated financial statements included in Item 8 of Part II of this 10-K for further discussion of ourhedging instruments.
The sensitivity analyses disclosed below provide only a limited, point-in-time view of the market risk of the financial instruments discussed. The actual impact ofthe respective underlying rates and price changes on the financial instruments may differ significantly from those shown in the sensitivity analyses.
Commodity Price Risk
We purchase commodity inputs, primarily coffee, dairy products, diesel, cocoa, sugar and other commodities, that are used in our operations and are subject toprice fluctuations that impact our financial results. We use a combination of pricing features embedded within supply contracts, such as fixed-price and price-to-be-fixed contracts for coffee purchases, and financial derivatives to manage our commodity price risk exposure.
The following table summarizes the potential impact as of October 3, 2021 to Starbucks future net earnings and other comprehensive income (“OCI”) fromchanges in commodity prices. The information provided below relates only to the hedging instruments and does not represent the corresponding changes in theunderlying hedged items (in millions): Increase/(Decrease) to Net Earnings Increase/(Decrease) to OCI
10% Increase inUnderlying Rate
10% Decrease in Underlying Rate
10% Increase in Underlying Rate
10% Decrease in Underlying Rate
Commodity hedges $ — $ — $ 53 $ (53)
Foreign Currency Exchange Risk
The majority of our revenue, expense and capital purchasing activities are transacted in U.S. dollars. However, because a portion of our operations consists ofactivities outside of the U.S., we have transactions in other currencies, primarily the Chinese renminbi, Japanese yen, Canadian dollar, British pound, South Koreanwon and euro. To reduce cash flow volatility from foreign currency fluctuations, we enter into derivative instruments to hedge portions of cash flows of anticipatedintercompany royalty payments, inventory purchases, intercompany borrowing and lending activities and certain other transactions in currencies other than thefunctional currency of the entity that enters into the arrangements, as well as the translation risk of certain balance sheet items. The volatility in the foreignexchange market may lead to significant fluctuation in foreign currency exchange rates and adversely impact our financial results in the case of weakening foreigncurrencies relative to the U.S. dollar.
36

Table of Contents
The following table summarizes the potential impact as of October 3, 2021 to Starbucks future net earnings and other comprehensive income from changes in thefair value of these derivative financial instruments due to a change in the value of the U.S. dollar as compared to foreign exchange rates. The information providedbelow relates only to the hedging instruments and does not represent the corresponding changes in the underlying hedged items (in millions): Increase/(Decrease) to Net Earnings Increase/(Decrease) to OCI
10% Increase in Underlying Rate
10% Decrease in Underlying Rate
10% Increase in Underlying Rate
10% Decrease in Underlying Rate
Foreign currency hedges $ 43 $ (43) $ 139 $ (139)
Equity Security Price Risk
We have minimal exposure to price fluctuations on equity mutual funds and equity exchange-traded funds within our marketable equity securities portfolio.Marketable equity securities are recorded at fair value and approximates a portion of our liability under our Management Deferred Compensation Plan (“MDCP”).Gains and losses from the portfolio and the change in our MDCP liability are recorded in our consolidated statements of earnings.
We performed a sensitivity analysis based on a 10% change in the underlying equity prices of our investments as of October 3, 2021 and determined that such achange would not have a significant impact on the fair value of these instruments.
Interest Rate Risk
Long-term Debt
We utilize short-term and long-term financing and may use interest rate hedges to manage our overall interest expense related to our existing fixed-rate debt, aswell as to hedge the variability in cash flows due to changes in benchmark interest rates related to anticipated debt issuances. See Note 3, Derivative FinancialInstruments and Note 9, Debt, to the consolidated financial statements included in Item 8 of Part II of this 10-K for further discussion of our interest rate hedgeagreements and details of the components of our long-term debt, respectively, as of October 3, 2021.
The following table summarizes the impact of a change in interest rates as of October 3, 2021 on the fair value of Starbucks debt (in millions):Change in Fair Value
Fair Value100 Basis Point Increase in
Underlying Rate100 Basis Point Decrease in
Underlying RateLong-term debt $ 16,014 $ 1,216 $ (1,216)
Amount disclosed is net of $13 million change in the fair value of our designated interest rate swap. Refer to Note 3, Derivative Financial Instruments, foradditional information on our interest rate swap designated as a fair value hedge.
Available-for-Sale Debt Securities
Our available-for-sale securities comprise a diversified portfolio consisting mainly of investment-grade debt securities. The primary objective of these investmentsis to preserve capital and liquidity. Available-for-sale securities are recorded on the consolidated balance sheets at fair value with unrealized gains and lossesreported as a component of accumulated other comprehensive income. We do not hedge the interest rate exposure on our investments. We performed a sensitivityanalysis based on a 100 basis point change in the underlying interest rate of our available-for-sale securities as of October 3, 2021 and determined that such achange would not have a significant impact on the fair value of these instruments.
CRITICAL ACCOUNTING ESTIMATES
Critical accounting estimates are those that management believes are the most important to the portrayal of our financial condition and results and require the mostdifficult, subjective or complex judgments, often as a result of the need to make estimates about the effect of matters that are inherently uncertain, especially inlight of the current economic environment due to the COVID-19 pandemic. Judgments and uncertainties may result in materially different amounts being reportedunder different conditions or using different assumptions.
Our significant accounting estimates are discussed in additional detail in Note 1, Summary of Significant Accounting Policies and Estimates, to the consolidatedfinancial statements included in Item 8 of Part II of this 10-K. We consider financial reporting and disclosure practices and accounting policies quarterly to ensurethat they provide accurate and transparent information relative to the current economic and business environment. During the past five fiscal years, we have notmade any material changes to the accounting methodologies used to assess the areas discussed below, unless noted otherwise. We believe that our significantaccounting estimates involve a higher degree of judgment and/or complexity for the reasons discussed below:
(1)
(1)
37
Table of Contents
Property, Plant and Equipment and Other Finite-Lived Assets
We evaluate property, plant and equipment, operating lease right-of-use (“ROU”) assets and other finite-lived assets for impairment when facts and circumstancesindicate that the carrying values of such assets may not be recoverable. When evaluating for impairment, we first compare the carrying value of the asset to theasset’s estimated future undiscounted cash flows. If the estimated undiscounted future cash flows are less than the carrying value of the asset, we determine if wehave an impairment loss by comparing the carrying value of the asset to the asset's estimated fair value and recognize an impairment charge when the asset’scarrying value exceeds its estimated fair value. The adjusted carrying amount of the asset becomes its new cost basis and is depreciated over the asset's remaininguseful life.
Long-lived assets are grouped with other assets and liabilities at the lowest level for which identifiable cash flows are largely independent of the cash flows ofother assets and liabilities. For company-operated store assets, the impairment test is performed at the individual store asset group level, which is inclusive ofproperty, plant and equipment and lease ROU assets. The fair value of a store’s assets is estimated using a discounted cash flow model. For other long-lived assets,fair value is determined using an approach that is appropriate based on the relevant facts and circumstances, which may include discounted cash flows, comparabletransactions or comparable company analyses.
Our impairment calculations contain uncertainties because they require management to make assumptions and to apply judgment to estimate future cash flows andasset fair values. Key assumptions used in estimating future cash flows and asset fair values include projected revenue growth and operating expenses, as well asforecasting asset useful lives and selecting an appropriate discount rate. For company-operated stores, estimates of revenue growth and operating expenses arebased on internal projections and consider the store’s historical performance, the local market economics and the business environment impacting the store’sperformance. The discount rate is selected based on what we believe a buyer would assume when determining a purchase price for the store. The fair value of astore’s ROU asset is estimated considering what a market participant would pay to lease the asset for its highest and best use. These estimates are subjective andour ability to realize future cash flows and asset fair values is affected by factors such as ongoing maintenance and improvement of the assets, changes in economicconditions and changes in operating performance.
In fiscal 2020, we announced a restructuring plan to optimize our North America store portfolio, primarily in dense metropolitan markets, by developing new storeformats to better cater to changing customer tastes and preferences. As of October 3, 2021, 807 stores in the U.S. and Canada were identified for closure, andsubstantially all were closed under the plan. During fiscal years 2021 and 2020, we recorded approximately $155.4 million and $254.7 million, respectively, torestructuring and impairments on our consolidated statements of earnings. These totals included $53.1 million and $151.0 million, respectively, related toimpairment and disposition of company-operated store assets and $89.5 million and $87.7 million, respectively, primarily associated with accelerated amortizationof ROU lease assets and other lease costs due to store closures prior to the end of contractual lease terms. We expect total future restructuring costs under this plan,which are attributable to our North America segment, to be immaterial.
Asset impairment charges are discussed in Note 1, Summary of Significant Accounting Policies, to the consolidated financial statements included in Item 8 of PartII of this 10-K.
Goodwill and Indefinite-Lived Intangible Assets
We evaluate goodwill and indefinite-lived intangible assets for impairment annually during our third fiscal quarter, or more frequently if an event occurs orcircumstances change that would indicate impairment may exist. When evaluating these assets for impairment, we may first perform a qualitative assessment todetermine whether it is more likely than not that a reporting unit is impaired. If we do not perform a qualitative assessment, or if we determine that it is not morelikely than not that the fair value of the reporting unit exceeds its carrying amount, we calculate the estimated fair value of the reporting unit using discounted cashflows or a combination of discounted cash flow and market approaches.
When assessing goodwill for impairment, our decision to perform a qualitative impairment assessment for an individual reporting unit is influenced by a number offactors, inclusive of the carrying value of the reporting unit’s goodwill, the significance of the excess of the reporting unit’s estimated fair value over carryingvalue at the last quantitative assessment date, the amount of time in between quantitative fair value assessments and the date of acquisition. If we perform aquantitative assessment of an individual reporting unit’s goodwill, our impairment calculations contain uncertainties because they require management to makeassumptions and to apply judgment when estimating future cash flows and asset fair values, including projected revenue growth and operating expenses related toexisting businesses, product innovation and new store concepts, as well as utilizing valuation multiples of similar publicly traded companies and selecting anappropriate discount rate. Estimates of revenue growth and operating expenses are based on internal projections considering the reporting unit’s past performanceand forecasted growth, including assumptions regarding business recovery post COVID-19, strategic initiatives, local market economics and the local businessenvironment impacting the reporting unit’s performance. The discount rate is selected based
38

Table of Contents
on the estimated cost of capital for a market participant to operate the reporting unit in the region. These estimates, as well as the selection of comparablecompanies and valuation multiples used in the market approaches are highly subjective, and our ability to realize the future cash flows used in our fair valuecalculations is affected by factors such as the success of strategic initiatives, changes in economic conditions, changes in our operating performance and changes inour business strategies, including retail initiatives and international expansion. Our goodwill impairment assessments were not significantly altered as a result ofthe COVID-19 pandemic. We continue to believe the fair value of each of our reporting units is significantly in excess of its carrying value, and absent a sustainedmulti-year global decline in our business in key markets such as the U.S. and China, we do not anticipate incurring significant goodwill impairment in the next 12months. Our fiscal 2021 annual goodwill impairment testing, which was completed in the third fiscal quarter, resulted in an estimated fair value of our reportingunits where a quantitative assessment was performed, was in excess of carrying value of approximately $74 billion. When assessing indefinite-lived intangibleassets for impairment, where we perform a qualitative assessment, we evaluate if changes in events or circumstances have occurred that indicate that impairmentmay exist. If we do not perform a qualitative impairment assessment or if changes in events and circumstances indicate that a quantitative assessment should beperformed, management is required to calculate the fair value of the intangible asset group. The fair value calculation includes estimates of revenue growth, whichare based on past performance and internal projections for the intangible asset group’s forecasted growth, including assumptions regarding business recovery postCOVID-19, and royalty rates, which are adjusted for our particular facts and circumstances. The discount rate is selected based on the estimated cost of capital thatreflects the risk profile of the related business. These estimates are highly subjective, and our ability to achieve the forecasted cash flows used in our fair valuecalculations is affected by factors such as the success of strategic initiatives, changes in economic conditions, changes in our operating performance and changes inour business strategies, including retail initiatives and international expansion. We do not anticipate recording significant impairment charges in the next 12months.
Definite-lived intangible asset impairment charges are discussed in Note 8, Other Intangible Assets and Goodwill, to the consolidated financial statements includedin Item 8 of Part II of this 10-K.
Income Taxes
We recognize deferred tax assets and liabilities based on the differences between the financial statement carrying amounts and the respective tax bases of our assetsand liabilities. Deferred tax assets and liabilities are measured using current enacted tax rates expected to apply to taxable income in the years in which we expectthe temporary differences to reverse. We routinely evaluate the likelihood of realizing the benefit of our deferred tax assets and may record a valuation allowanceif, based on all available evidence, we determine that some portion of the tax benefit will not be realized.
In evaluating our ability to recover our deferred tax assets within the jurisdiction from which they arise, we consider all available positive and negative evidence,including scheduled reversals of deferred tax liabilities, projected future taxable income, tax-planning strategies and results of operations. In projecting futuretaxable income, we consider historical results and incorporate assumptions about the amount of future state, federal and foreign pre-tax operating income adjustedfor items that do not have tax consequences. Our assumptions regarding future taxable income are consistent with the plans and estimates we use to manage ourunderlying businesses. In evaluating the objective evidence that historical results provide, we consider three years of cumulative operating income/(loss).
In addition, our income tax returns are periodically audited by domestic and foreign tax authorities. These audits include review of our tax filing positions, such asthe timing and amount of deductions taken and the allocation of income between tax jurisdictions. We evaluate our exposures associated with our various tax filingpositions and recognize a tax benefit only if it is more likely than not that the tax position will be sustained upon examination by the relevant taxing authorities,including resolutions of any related appeals or litigation processes, based on the technical merits of our position. The tax benefits recognized in the financialstatements from such a position are measured based on the largest benefit that has a greater than 50% likelihood of being realized upon ultimate settlement. Foruncertain tax positions that do not meet this threshold, we record a related liability. We adjust our unrecognized tax benefit liability and income tax expense in theperiod in which the uncertain tax position is effectively settled, the statute of limitations expires for the relevant taxing authority to examine the tax position orwhen new information becomes available. As discussed in Note 14, Income Taxes, to the consolidated financial statements included in Item 8 of Part II of this 10-K, we do not expect a significant amount of the Company’s gross unrecognized tax benefits to be recognized by the end of fiscal 2022 for reasons such as a lapseof the statute of limitations or resolution of examinations with tax authorities.
We have generated income in certain foreign jurisdictions that may be subject to additional foreign withholding taxes and U.S. state income taxes. We regularlyreview our plans for reinvestment or repatriation of unremitted foreign earnings. The possibility exists that foreign earnings declared as indefinitely reinvested maybe repatriated as our plans are based on our estimated working and other capital needs in jurisdictions where our earnings are generated. While we do not expect torepatriate cash to the U.S. to satisfy domestic liquidity needs, if these amounts were distributed to the U.S., in the form of dividends or otherwise, we may besubject to additional foreign withholding taxes and U.S. state income taxes, which could be material.
39

Table of Contents
Our income tax expense, deferred tax assets and liabilities and liabilities for unrecognized tax benefits reflect management’s best assessment of estimated currentand future taxes to be paid. Deferred tax asset valuation allowances and our liabilities for unrecognized tax benefits require significant management judgmentregarding applicable statutes and their related interpretation, the status of various income tax audits and our particular facts and circumstances. Although webelieve that the judgments and estimates discussed herein are reasonable, actual results, including forecasted business performance could differ, and we may beexposed to losses or gains that could be material. To the extent we prevail in matters for which a liability has been established or are required to pay amounts inexcess of our established liability, our effective income tax rate in a given financial statement period could be materially affected.
RECENT ACCOUNTING PRONOUNCEMENTS
See Note 1, Summary of Significant Accounting Policies, to the consolidated financial statements included in Item 8 of Part II of this 10-K for a detaileddescription of recent accounting pronouncements.
Item 7A. Quantitative and Qualitative Disclosures About Market Risk
The information required by this item is incorporated by reference to the section entitled “Management’s Discussion and Analysis of Financial Condition andResults of Operations — Commodity Prices, Availability and General Risk Conditions” and “Management’s Discussion and Analysis of Financial Condition andResults of Operations — Financial Risk Management” in Item 7 of this Report.
40

Table of Contents
Item 8. Financial Statements and Supplementary Data
STARBUCKS CORPORATIONCONSOLIDATED STATEMENTS OF EARNINGS
(in millions, except per share data)
Fiscal Year EndedOct 3, 2021
Sep 27, 2020
Sep 29, 2019
Net revenues:Company-operated stores $ 24,607.0 $ 19,164.6 $ 21,544.4 Licensed stores 2,683.6 2,327.1 2,875.0 Other 1,770.0 2,026.3 2,089.2
Total net revenues 29,060.6 23,518.0 26,508.6 Product and distribution costs 8,738.7 7,694.9 8,526.9 Store operating expenses 11,930.9 10,764.0 10,493.6 Other operating expenses 359.5 430.3 371.0 Depreciation and amortization expenses 1,441.7 1,431.3 1,377.3 General and administrative expenses 1,932.6 1,679.6 1,824.1 Restructuring and impairments 170.4 278.7 135.8
Total operating expenses 24,573.8 22,278.8 22,728.7 Income from equity investees 385.3 322.5 298.0
Operating income 4,872.1 1,561.7 4,077.9 Net gain resulting from divestiture of certain operations 864.5 — 622.8 Interest income and other, net 90.1 39.7 96.5 Interest expense (469.8) (437.0) (331.0)
Earnings before income taxes 5,356.9 1,164.4 4,466.2 Income tax expense 1,156.6 239.7 871.6
Net earnings including noncontrolling interests 4,200.3 924.7 3,594.6 Net earnings/(loss) attributable to noncontrolling interests 1.0 (3.6) (4.6)Net earnings attributable to Starbucks $ 4,199.3 $ 928.3 $ 3,599.2
Earnings per share — basic $ 3.57 $ 0.79 $ 2.95 Earnings per share — diluted $ 3.54 $ 0.79 $ 2.92 Weighted average shares outstanding:
Basic 1,177.6 1,172.8 1,221.2 Diluted 1,185.5 1,181.8 1,233.2
See Notes to Consolidated Financial Statements.
41
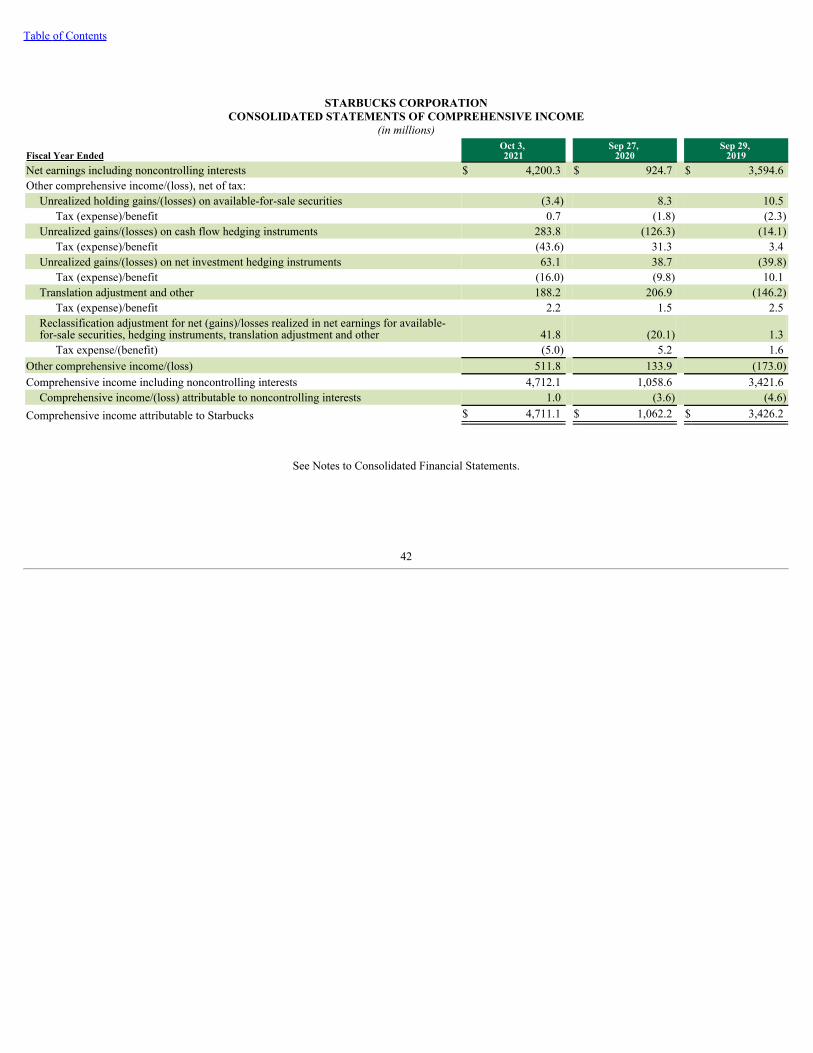
Table of Contents
STARBUCKS CORPORATIONCONSOLIDATED STATEMENTS OF COMPREHENSIVE INCOME
(in millions)
Fiscal Year EndedOct 3, 2021
Sep 27, 2020
Sep 29, 2019
Net earnings including noncontrolling interests $ 4,200.3 $ 924.7 $ 3,594.6 Other comprehensive income/(loss), net of tax:
Unrealized holding gains/(losses) on available-for-sale securities (3.4) 8.3 10.5 Tax (expense)/benefit 0.7 (1.8) (2.3)
Unrealized gains/(losses) on cash flow hedging instruments 283.8 (126.3) (14.1)Tax (expense)/benefit (43.6) 31.3 3.4
Unrealized gains/(losses) on net investment hedging instruments 63.1 38.7 (39.8)Tax (expense)/benefit (16.0) (9.8) 10.1
Translation adjustment and other 188.2 206.9 (146.2)Tax (expense)/benefit 2.2 1.5 2.5
Reclassification adjustment for net (gains)/losses realized in net earnings for available-for-sale securities, hedging instruments, translation adjustment and other 41.8 (20.1) 1.3
Tax expense/(benefit) (5.0) 5.2 1.6 Other comprehensive income/(loss) 511.8 133.9 (173.0)Comprehensive income including noncontrolling interests 4,712.1 1,058.6 3,421.6
Comprehensive income/(loss) attributable to noncontrolling interests 1.0 (3.6) (4.6)Comprehensive income attributable to Starbucks $ 4,711.1 $ 1,062.2 $ 3,426.2
See Notes to Consolidated Financial Statements.
42

Table of Contents
STARBUCKS CORPORATIONCONSOLIDATED BALANCE SHEETS
(in millions, except per share data)
Oct 3, 2021
Sep 27, 2020
ASSETSCurrent assets:
Cash and cash equivalents $ 6,455.7 $ 4,350.9 Short-term investments 162.2 281.2 Accounts receivable, net 940.0 883.4 Inventories 1,603.9 1,551.4 Prepaid expenses and other current assets 594.6 739.5
Total current assets 9,756.4 7,806.4 Long-term investments 281.7 206.1 Equity investments 268.5 478.7 Property, plant and equipment, net 6,369.5 6,241.4 Operating lease, right-of-use asset 8,236.0 8,134.1 Deferred income taxes, net 1,874.8 1,789.9 Other long-term assets 578.5 568.6 Other intangible assets 349.9 552.1 Goodwill 3,677.3 3,597.2 TOTAL ASSETS $ 31,392.6 $ 29,374.5
LIABILITIES AND SHAREHOLDERS' EQUITY/(DEFICIT)Current liabilities:
Accounts payable $ 1,211.6 $ 997.9 Accrued liabilities 1,973.2 1,160.7 Accrued payroll and benefits 772.3 696.0 Income taxes payable 348.0 98.2 Current portion of operating lease liability 1,251.3 1,248.8 Stored value card liability and current portion of deferred revenue 1,596.1 1,456.5 Short-term debt — 438.8 Current portion of long-term debt 998.9 1,249.9
Total current liabilities 8,151.4 7,346.8 Long-term debt 13,616.9 14,659.6 Operating lease liability 7,738.0 7,661.7 Deferred revenue 6,463.0 6,598.5 Other long-term liabilities 737.8 907.3
Total liabilities 36,707.1 37,173.9 Shareholders’ deficit:
Common stock ($0.001 par value) — authorized, 2,400.0 shares; issued and outstanding, 1,180.0 and1,173.3 shares, respectively 1.2 1.2 Additional paid-in capital 846.1 373.9 Retained deficit (6,315.7) (7,815.6)Accumulated other comprehensive income/(loss) 147.2 (364.6)
Total shareholders’ deficit (5,321.2) (7,805.1)Noncontrolling interests 6.7 5.7
Total deficit (5,314.5) (7,799.4)TOTAL LIABILITIES AND SHAREHOLDERS’ EQUITY/(DEFICIT) $ 31,392.6 $ 29,374.5
See Notes to Consolidated Financial Statements.
43

Table of Contents
STARBUCKS CORPORATIONCONSOLIDATED STATEMENTS OF CASH FLOWS
(in millions)
Fiscal Year EndedOct 3, 2021
Sep 27, 2020
Sep 29, 2019
OPERATING ACTIVITIES:Net earnings including noncontrolling interests $ 4,200.3 $ 924.7 $ 3,594.6 Adjustments to reconcile net earnings to net cash provided by operating activities:
Depreciation and amortization 1,524.1 1,503.2 1,449.3 Deferred income taxes, net (146.2) (25.8) (1,495.4)Income earned from equity method investees (347.3) (280.7) (250.6)Distributions received from equity method investees 336.0 227.7 216.8 Net gain resulting from divestiture of certain operations (864.5) — (622.8)Stock-based compensation 319.1 248.6 308.0 Goodwill impairments — — 10.5 Non-cash lease cost 1,248.6 1,197.6 — Loss on retirement and impairment of assets 226.2 454.4 142.6 Other (6.0) 24.5 45.3 Cash provided by/(used in) changes in operating assets and liabilities:
Accounts receivable (43.0) (2.7) (197.7)Inventories (49.8) (10.9) (173.0)Prepaid expenses and other current assets 251.1 (317.5) 922.0 Income taxes payable 286.1 (1,214.6) 1,237.1 Accounts payable 189.9 (210.8) 31.9 Deferred revenue (6.1) 31.0 (30.5)Operating lease liability (1,488.1) (1,231.4) — Other operating assets and liabilities 358.7 280.5 (141.1)
Net cash provided by operating activities 5,989.1 1,597.8 5,047.0 INVESTING ACTIVITIES:Purchases of investments (432.0) (443.9) (190.4)Sales of investments 143.2 186.7 298.3 Maturities and calls of investments 345.5 73.7 59.8 Additions to property, plant and equipment (1,470.0) (1,483.6) (1,806.6)Net proceeds from the divestiture of certain operations 1,175.0 — 684.3 Other (81.2) (44.4) (56.2)Net cash used in investing activities (319.5) (1,711.5) (1,010.8)FINANCING ACTIVITIES:Repayments of commercial paper (296.5) — — Proceeds from issuance of short-term debt 215.1 1,406.6 — Repayments of short-term debt (349.8) (967.7) — Proceeds from issuance of long-term debt — 4,727.6 1,996.0 Repayments of long-term debt (1,250.0) — (350.0)Proceeds from issuance of common stock 246.2 298.8 409.8 Cash dividends paid (2,119.0) (1,923.5) (1,761.3)Repurchase of common stock — (1,698.9) (10,222.3)Minimum tax withholdings on share-based awards (97.0) (91.9) (111.6)Other — (37.7) (17.5)Net cash provided by/(used in) financing activities (3,651.0) 1,713.3 (10,056.9)Effect of exchange rate changes on cash and cash equivalents 86.2 64.7 (49.0)Net increase/(decrease) in cash and cash equivalents 2,104.8 1,664.3 (6,069.7)CASH AND CASH EQUIVALENTS:Beginning of period 4,350.9 2,686.6 8,756.3 End of period $ 6,455.7 $ 4,350.9 $ 2,686.6 SUPPLEMENTAL DISCLOSURE OF CASH FLOW INFORMATION:Cash paid during the period for:Interest, net of capitalized interest $ 501.1 $ 396.9 $ 299.5 Income taxes $ 756.3 $ 1,699.1 $ 470.1
See Notes to Consolidated Financial Statements.
44
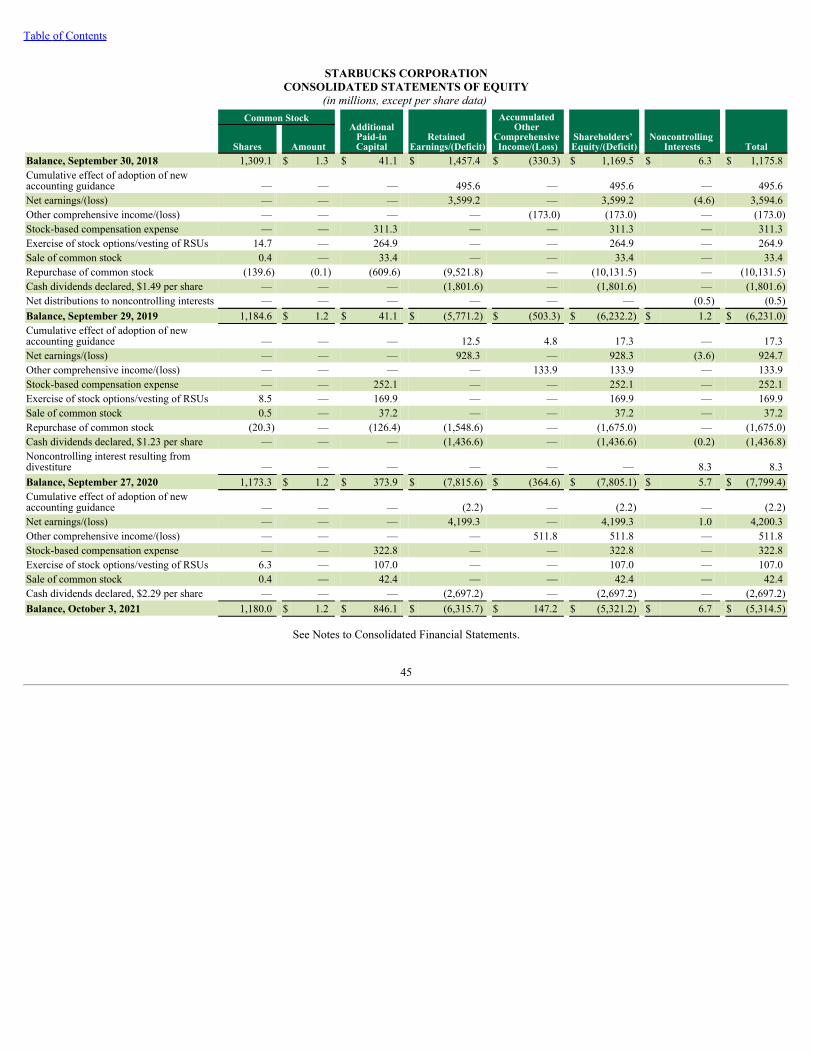
Table of Contents
STARBUCKS CORPORATIONCONSOLIDATED STATEMENTS OF EQUITY
(in millions, except per share data) Common Stock
AdditionalPaid-inCapital
Retained Earnings/(Deficit)
Accumulated Other
Comprehensive Income/(Loss)
Shareholders’ Equity/(Deficit)
Noncontrolling Interests Total Shares Amount
Balance, September 30, 2018 1,309.1 $ 1.3 $ 41.1 $ 1,457.4 $ (330.3) $ 1,169.5 $ 6.3 $ 1,175.8 Cumulative effect of adoption of newaccounting guidance — — — 495.6 — 495.6 — 495.6 Net earnings/(loss) — — — 3,599.2 — 3,599.2 (4.6) 3,594.6 Other comprehensive income/(loss) — — — — (173.0) (173.0) — (173.0)Stock-based compensation expense — — 311.3 — — 311.3 — 311.3 Exercise of stock options/vesting of RSUs 14.7 — 264.9 — — 264.9 — 264.9 Sale of common stock 0.4 — 33.4 — — 33.4 — 33.4 Repurchase of common stock (139.6) (0.1) (609.6) (9,521.8) — (10,131.5) — (10,131.5)Cash dividends declared, $1.49 per share — — — (1,801.6) — (1,801.6) — (1,801.6)Net distributions to noncontrolling interests — — — — — — (0.5) (0.5)Balance, September 29, 2019 1,184.6 $ 1.2 $ 41.1 $ (5,771.2) $ (503.3) $ (6,232.2) $ 1.2 $ (6,231.0)Cumulative effect of adoption of newaccounting guidance — — — 12.5 4.8 17.3 — 17.3 Net earnings/(loss) — — — 928.3 — 928.3 (3.6) 924.7 Other comprehensive income/(loss) — — — — 133.9 133.9 — 133.9 Stock-based compensation expense — — 252.1 — — 252.1 — 252.1 Exercise of stock options/vesting of RSUs 8.5 — 169.9 — — 169.9 — 169.9 Sale of common stock 0.5 — 37.2 — — 37.2 — 37.2 Repurchase of common stock (20.3) — (126.4) (1,548.6) — (1,675.0) — (1,675.0)Cash dividends declared, $1.23 per share — — — (1,436.6) — (1,436.6) (0.2) (1,436.8)Noncontrolling interest resulting fromdivestiture — — — — — — 8.3 8.3 Balance, September 27, 2020 1,173.3 $ 1.2 $ 373.9 $ (7,815.6) $ (364.6) $ (7,805.1) $ 5.7 $ (7,799.4)Cumulative effect of adoption of newaccounting guidance — — — (2.2) — (2.2) — (2.2)Net earnings/(loss) — — — 4,199.3 — 4,199.3 1.0 4,200.3 Other comprehensive income/(loss) — — — — 511.8 511.8 — 511.8 Stock-based compensation expense — — 322.8 — — 322.8 — 322.8 Exercise of stock options/vesting of RSUs 6.3 — 107.0 — — 107.0 — 107.0 Sale of common stock 0.4 — 42.4 — — 42.4 — 42.4 Cash dividends declared, $2.29 per share — — — (2,697.2) — (2,697.2) — (2,697.2)Balance, October 3, 2021 1,180.0 $ 1.2 $ 846.1 $ (6,315.7) $ 147.2 $ (5,321.2) $ 6.7 $ (5,314.5)
See Notes to Consolidated Financial Statements.
45

Table of Contents
STARBUCKS CORPORATIONINDEX FOR NOTES TO CONSOLIDATED FINANCIAL STATEMENTS
Note 1 Summary of Significant Accounting Policies and Estimates 47Note 2 Acquisitions, Divestitures and Strategic Alliance 57Note 3 Derivative Financial Instruments 57Note 4 Fair Value Measurements 61Note 5 Inventories 63Note 6 Equity Investments 64Note 7 Supplemental Balance Sheet and Statement of Earnings Information 65Note 8 Other Intangible Assets and Goodwill 66Note 9 Debt 67Note 10 Leases 69Note 11 Deferred Revenue 71Note 12 Equity 71Note 13 Employee Stock and Benefit Plans 73Note 14 Income Taxes 75Note 15 Earnings per Share 78Note 16 Commitments and Contingencies 78Note 17 Segment Reporting 79
46

Table of Contents
STARBUCKS CORPORATIONNOTES TO CONSOLIDATED FINANCIAL STATEMENTS
Fiscal Years ended October 3, 2021, September 27, 2020 and September 29, 2019
Note 1: Summary of Significant Accounting Policies and Estimates
Description of Business
We purchase and roast high-quality coffees that we sell, along with handcrafted coffee and tea beverages and a variety of fresh and prepared food items, throughour company-operated stores. We also sell a variety of coffee and tea products and license our trademarks through other channels such as licensed stores, groceryand foodservice. The grocery and foodservice business is primarily through our Global Coffee Alliance with Nestlé established in August 2018.
In this 10-K, Starbucks Corporation (together with its subsidiaries) is referred to as “Starbucks,” the “Company,” “we,” “us” or “our.”
Segment information is prepared on the same basis that our management reviews financial information for operational decision-making purposes. In the fourthquarter of fiscal 2021, certain changes were made to our management team, and our operating segment reporting structure was realigned as a result. We realignedour fully licensed Latin America and Caribbean markets from our Americas operating segment to our International operating segment. We renamed the Americasoperating segment to the North America operating segment, since it is comprised of our company-operated and licensed stores in the U.S. and Canada. We alsomade certain other immaterial changes between our International operating segment and Corporate and Other. Certain prior period information for our NorthAmerica and International operating segments and our Corporate and Other reportable segment has been reclassified to conform to the current year presentation.There was no impact on consolidated net revenues, total operating expenses, operating income or net earnings per share as a result of these changes.
We have three reportable operating segments: 1) North America, which is inclusive of the U.S. and Canada; 2) International, which is inclusive of China, Japan,Asia Pacific, Europe, Middle East and Africa, Latin America and the Caribbean; and 3) Channel Development. Non-reportable operating segments such asEvolution Fresh and unallocated corporate expenses are reported within Corporate and Other.
Additional details on the nature of our business and our reportable operating segments are included in Note 17, Segment Reporting.
Principles of Consolidation
Our consolidated financial statements reflect the financial position and operating results of Starbucks, including wholly-owned subsidiaries and investees that wecontrol. Intercompany transactions and balances have been eliminated.
Fiscal Year End
Our fiscal year ends on the Sunday closest to September 30. Fiscal year 2021 included 53 weeks, with the 53rd week falling in the fourth fiscal quarter. Fiscalyears 2020 and 2019 included 52 weeks.
Estimates and Assumptions
Preparing financial statements in conformity with accounting principles generally accepted in the United States of America requires management to makeestimates and assumptions that affect the reported amounts of assets, liabilities, revenues and expenses. Examples include, but are not limited to, estimates forinventory reserves, asset and goodwill impairments, assumptions underlying self-insurance reserves, income from unredeemed stored value cards, stock-basedcompensation forfeiture rates, future asset retirement obligations and the potential outcome of future tax consequences of events that have been recognized in thefinancial statements. Actual results and outcomes may differ from these estimates and assumptions due to risks and uncertainties, including uncertainty in thecurrent economic environment due to the global COVID-19 pandemic.
Restructuring
In fiscal 2020, we announced a restructuring plan to optimize our North America store portfolio, primarily in dense metropolitan markets by developing new storeformats to better cater to changing customer tastes and preferences. As of October 3, 2021, 807 stores in the U.S. and Canada had been identified for closure, andsubstantially all were closed under the plan. During fiscal years 2021 and 2020, we recorded approximately $155.4 million and $254.7 million, respectively, torestructuring and impairments on our consolidated statements of earnings. These totals included $53.1 million and $151.0 million, respectively, related to disposaland impairment of company-operated store assets and $89.5 million and $87.7 million, respectively, primarily associated with accelerated amortization of ROUlease assets and other lease costs due to store closures prior to the end of contractual lease terms. Company-operated store asset impairments were the result ofeither a triggering event that occurred where the assets were determined not to be recoverable or the store was permanently closed. For impaired store asset groups,we estimated the fair values using an income approach incorporating internal projections of
47

Table of Contents
revenue growth and operating expenses that are considered Level 3 fair value measurements as well as applicable discount rates and market lease rates. Theapplication of these projections and fair value measurements did not have a significant impact on our final impairment charges given that we have closedsubstantially all of these identified stores. As of October 3, 2021, we expect total future restructuring costs under this plan, which are attributable to our NorthAmerica segment, to be immaterial.
Restructuring-related accrued employee termination costs included in accrued payroll and benefits on the consolidated balance sheets were immaterial as ofOctober 3, 2021 and September 27, 2020. Additionally on the consolidated balance sheets, other accrued restructuring costs included in accrued liabilities wereimmaterial as of October 3, 2021 and there were no other accrued restructuring costs outstanding as of September 27, 2020. Cash payments relating to theseliabilities were immaterial for the fiscal years ended October 3, 2021 and September 27, 2020.
Cash and Cash Equivalents
We consider all highly liquid instruments with maturities of three months or less at the time of purchase, as well as credit card receivables for sales to customers inour company-operated stores that generally settle within two to five business days, to be cash equivalents. We maintain cash and cash equivalent balances withfinancial institutions that exceed federally-insured limits. We have not experienced any losses related to these balances, and we believe credit risk to be minimal.
Our cash management system provides for the funding of all major bank disbursement accounts on a daily basis as checks are presented for payment. Under thissystem, outstanding checks are in excess of the cash balances at certain banks, which creates book overdrafts. Book overdrafts are presented as a current liability inaccrued liabilities on our consolidated balance sheets.
Investments
Available-for-sale Debt Securities
Our short-term and long-term investments consist primarily of investment-grade debt securities, all of which are classified as available-for-sale. Available-for-saledebt securities are recorded at fair value, and unrealized holding gains and losses are recorded, net of tax, as a component of accumulated other comprehensiveincome. Available-for-sale securities with remaining maturities of less than one year and those identified by management at the time of purchase to be used to fundoperations within one year are classified as short-term. All other available-for-sale securities are classified as long-term. We evaluate our available-for-salesecurities for other-than-temporary impairment on a quarterly basis. Unrealized losses are charged against net earnings when a decline in fair value is determinedto be other than temporary. We review several factors to determine whether a loss is other than temporary, such as the length and extent of the fair value decline,the financial condition and near-term prospects of the issuer and whether we have the intent to sell or will more likely than not be required to sell before thesecurities' anticipated recovery, which may be at maturity. Realized gains and losses are accounted for using the specific identification method. Purchases and salesare recorded on a trade date basis.
Marketable Equity Securities
We also have a marketable equity securities portfolio, which is comprised of marketable equity mutual funds and equity exchange-traded funds. Marketable equitysecurities are recorded at fair value and approximates a portion of our liability under our Management Deferred Compensation Plan (“MDCP”). Gains or lossesfrom the portfolio and the change in our MDCP liability are recorded in our consolidated statements of earnings.
Equity Investments
Equity investments are accounted for under the equity method if we are able to exercise significant influence, but not control, over an investee. Our share of theearnings or losses as reported by the investees is classified as income from equity investees on our consolidated statements of earnings. The investments areevaluated for impairment annually and when facts and circumstances indicate that the carrying value may not be recoverable. If a decline in fair value isdetermined to be other-than-temporary, an impairment charge is recorded in interest income and other, net on our consolidated statements of earnings.
We account for equity investments for which we do not have significant influence and without readily determinable fair values at cost with adjustments forobservable changes in price or impairments as permitted by the measurement alternative. Investments for which the measurement alternative has been elected areassessed for impairment quarterly, or if a triggering event indicates impairment may be present. Any adjustments as a result of price changes or impairments arerecorded in interest income and other, net on our consolidated statements of earnings.
Fair Value
Fair value is the price we would receive to sell an asset or pay to transfer a liability (exit price) in an orderly transaction between market participants. For assetsand liabilities recorded or disclosed at fair value on a recurring basis, we determine fair value based on the following:
48

Table of Contents
Level 1: The carrying value of cash and cash equivalents approximates fair value because of the short-term nature of these instruments. For equity and U.S.government treasury securities and commodity futures contracts, we use quoted prices in active markets for identical assets to determine fair value.
Level 2: When quoted prices in active markets for identical assets are not available, we determine the fair value of our available-for-sale securities and our over-the-counter forward contracts, collars and swaps based upon factors such as the quoted market price of similar assets or a discounted cash flow model using readilyobservable market data, which may include interest rate curves and forward and spot prices for currencies and commodities, depending on the nature of theinvestment. The fair value of our long-term debt is estimated based on the quoted market prices for the same or similar issues or on the current rates offered to usfor debt of the same remaining maturities.
Level 3: We determine the fair value of our auction rate securities using an internally-developed valuation model, using inputs that include interest rate curves,credit and liquidity spreads and effective maturity.
Assets and liabilities recognized or disclosed at fair value on a nonrecurring basis may include items such as property, plant and equipment, goodwill and otherintangible assets, equity and other investments and other assets. We determine the fair value of these items using Level 3 inputs, as described in the related sectionsbelow.
Derivative Instruments
We manage our exposure to various risks within our consolidated financial statements according to a market price risk management policy. Under this policy, wemay engage in transactions involving various derivative instruments to hedge interest rates, commodity prices and foreign currency-denominated revenue streams,inventory purchases, assets and liabilities and investments in certain foreign operations. In order to manage our exposure to these risks, we use various types ofderivative instruments including forward contracts, commodity futures contracts, collars and swaps. Forward contracts and commodity futures contracts areagreements to buy or sell a quantity of a currency or commodity at a predetermined future date and at a predetermined rate or price. A collar is a strategy that usesa combination of a purchased call option and a sold put option with equal premiums to hedge a portion of anticipated cash flows, or to limit possible gains or losseson an underlying asset or liability to a specific range. A swap agreement is a contract between two parties to exchange cash flows based on specified underlyingnotional amounts, assets and/or indices. We do not enter into derivative instruments for speculative purposes.
We record all derivatives on our consolidated balance sheets at fair value and typically do not offset derivative assets and liabilities. Excluding interest rate hedginginstruments, cross-currency swaps and foreign currency debt hedging instruments, we generally do not enter into derivative instruments with maturities longer thanthree years. However, we are allowed to net settle transactions with respective counterparties for certain derivative contracts, inclusive of interest rate swaps andforeign currency forwards, with a single, net amount payable by one party to the other. We also enter into collateral security arrangements that provide forcollateral to be received or posted when the net fair value of certain financial instruments fluctuates from contractually established thresholds. As of October 3,2021 and September 27, 2020, cash collateral held under collateral security arrangements was $44.7 million and $34.9 million, respectively, and is included inother long-term liabilities on our consolidated balance sheets. The potential effects of netting arrangements with our derivative contracts, excluding the effects ofcollateral, would not have had a material impact on our consolidated balance sheets.
By using these derivative instruments, we expose ourselves to potential credit risk. Credit risk is the failure of the counterparty to perform under the terms of thederivative contract. We minimize this credit risk by entering into transactions with carefully selected, credit-worthy counterparties and distribute contracts amongseveral financial institutions to reduce the concentration of credit risk.
Cash Flow Hedges
For derivative instruments that are designated and qualify as a cash flow hedge, the derivative's gain or loss is reported as a component of other comprehensiveincome (“OCI”) and recorded in accumulated other comprehensive income (“AOCI”) on our consolidated balance sheets. The gain or loss is subsequentlyreclassified into net earnings when the hedged exposure affects net earnings, in the same line item as the underlying hedged item on our consolidated statements ofearnings.
Cash flow hedges related to anticipated transactions are designated and documented at the inception of each hedge. Cash flows from hedging transactions areclassified in the same categories as the cash flows from the respective hedged items. For de-designated cash flow hedges in which the transactions are no longerlikely to occur, the related accumulated derivative gains or losses are recognized in interest income and other, net on our consolidated statements of earnings basedon the nature of the underlying transaction.
Net Investment Hedges
For derivative instruments that are designated and qualify as a net investment hedge, the derivative's, or qualifying non-derivative instrument’s gain or loss isreported as a component of OCI and recorded in AOCI. The gain or loss will be subsequently reclassified into net earnings when the hedged net investment iseither sold or substantially liquidated.
49

Table of Contents
Fair Value Hedges
For derivative instruments that are designated and qualify as a fair value hedge, the changes in fair value of the derivative instrument and the offsetting changes infair value of the underlying hedged item due to changes in the hedged risk are recorded in interest income and other, net or interest expense on our consolidatedstatements of earnings.
Derivatives Not Designated As Hedging Instruments
We also enter into certain foreign currency forward contracts, commodity futures contracts, collars and swaps that are not designated as hedging instruments foraccounting purposes. The changes in the fair values of these contracts are immediately recognized in interest income and other, net on our consolidated statementsof earnings.
Normal Purchase Normal Sale
We enter into fixed-price and price-to-be-fixed green coffee purchase commitments, which are described further in Note 5, Inventories. For both fixed-price andprice-to-be-fixed purchase commitments, we expect to take delivery of green coffee and to utilize the coffee in a reasonable period of time in the ordinary course ofbusiness. Since these types of purchase commitments qualify for the normal purchase normal sale exemption, they are not recorded as derivative instruments onour consolidated balance sheets.
Refer to Note 3, Derivative Financial Instruments, and Note 5, Inventories, for further discussion of our derivative instruments and green coffee purchasecommitments.
Receivables, net of Allowance for Credit Losses
Our receivables are mainly comprised of receivables for product and equipment sales to and royalties from our licensees, as well as receivables from our GlobalCoffee Alliance and other Channel Development customers. The primary indicators of the credit quality of our receivables are aging, payment history, economicsector information and outside credit monitoring, and are assessed on a quarterly basis. Our credit loss exposure is mainly concentrated in our accounts receivableportfolio. Our allowance for credit losses is calculated using a loss-rate method based on historical experience, current market conditions and reasonable forecasts.We also assessed incremental risks due to COVID-19 on our licensees’ financial viability. For the year ended October 3, 2021, we did not observe a significantdeterioration of our receivable portfolio that required a significant increase in our allowance for credit losses. As of October 3, 2021, our allowance for credit losseswas $25.6 million. As of September 27, 2020, prior to adoption of the new estimated credit losses methodology, our allowance for doubtful accounts was $27.1million.
To assist certain international licensed partners with their business recovery from the impact of the COVID-19 pandemic, we provided payment extensions for theiroutstanding receivables to help them dedicate their capital to further develop stores and build the brand. During the third quarter of fiscal 2020, we also temporarilywaived royalty payments from our international licensees and did not recognize royalty revenues associated with these accounts. Normal royalty billings andcollections resumed during the fourth quarter of fiscal 2020. We do not believe the terms and forms of these financial relief actions changed our revenuerecognition policy or had a significant impact on future collectability.
Inventories
Inventories are stated at the lower of cost (primarily moving average cost) or net realizable value. We record inventory reserves for obsolete and slow-movinginventory and for estimated shrinkage between physical inventory counts. Inventory reserves are based on inventory obsolescence trends, historical experience andapplication of the specific identification method. As of October 3, 2021 and September 27, 2020, inventory reserves were $36.6 million and $48.4 million,respectively.
Property, Plant and Equipment
Property, plant and equipment is carried at cost less accumulated depreciation. Cost includes all direct costs necessary to acquire and prepare assets for use,including internal labor and overhead in some cases. Depreciation is computed using the straight-line method over estimated useful lives of the assets, generallyranging from 2 to 15 years for equipment and 30 to 40 years for buildings. Leasehold improvements are amortized over the shorter of their estimated useful lives orthe related lease life, generally 10 years. For leases with renewal periods at our option, we generally use the original lease term, excluding renewal option periods,to determine estimated useful lives. If failure to exercise a renewal option imposes an economic penalty to us, we may determine at the inception of the lease thatrenewal is reasonably assured and include the renewal option period in the determination of the appropriate estimated useful lives.
The portion of depreciation expense related to production and distribution facilities is included in product and distribution costs on our consolidated statements ofearnings. The costs of repairs and maintenance are expensed when incurred, while expenditures for refurbishments and improvements that significantly add to theproductive capacity or extend the useful life of an asset are capitalized. When assets are disposed of, whether through retirement or sale, the net gain or loss isrecognized in
50
Table of Contents
net earnings. Long-lived assets to be disposed of are reported at the lower of their carrying amount or fair value less estimated costs to sell.
We evaluate property, plant and equipment for impairment when facts and circumstances indicate that the carrying values of such assets may not be recoverable.When evaluating for impairment, we first compare the carrying value of the asset to the asset’s estimated future undiscounted cash flows. If the estimatedundiscounted future cash flows are less than the carrying value of the asset, we determine if we have an impairment loss by comparing the carrying value of theasset to the asset's estimated fair value and recognize an impairment charge when the asset’s carrying value exceeds its estimated fair value. The fair value of theasset is estimated using a discounted cash flow model based on forecasted future revenues and operating costs, using internal projections. Property, plant andequipment assets and ROU assets related to the store lease are grouped at the lowest level for which identifiable cash flows are largely independent of the cashflows of other assets and liabilities. For company-operated store assets, the impairment test is performed at the individual store asset group level.
We recognized net disposition and impairment charges of $153.1 million, $294.9 million and $108.0 million in fiscal 2021, 2020 and 2019, respectively. Of thetotal net impairment and disposition charges, $53.1 million, $151.0 million and $7.3 million in fiscal 2021, 2020 and 2019, respectively, were restructuring relatedand recorded in restructuring and impairment expenses. For fiscal 2021 and 2020, we evaluated COVID-19 business recovery trends and their estimated impacts onfuture revenue growth and profitability for assessing impairment of our company-operated retail store and related operating lease ROU assets. As a result, werecorded $44.4 million and $59.6 million of impairment losses within store operating expenses on our consolidated statements of earnings during the years endedOctober 3, 2021 and September 27, 2020, respectively. Unless it is restructuring related, the nature of the underlying asset that is impaired or disposed of willdetermine the operating expense line on which the related impact is recorded on our consolidated statements of earnings.
Leases
The majority of our leases are operating leases for our company-operated retail store locations. We also lease, among other things, roasting, distribution andwarehouse facilities and office space for corporate administrative purposes.
We categorize leases as either operating or finance leases at the commencement date of the lease. Operating lease agreements may contain tenant improvementallowances, rent holidays, rent escalation clauses and/or contingent rent provisions. We have lease agreements with lease and non-lease components, which areaccounted for together as a single lease component for all underlying classes of assets.
We recognize a ROU asset and lease liability for each operating and finance lease with a contractual term greater than 12 months at the time of lease inception. Wedo not record leases with an initial term of 12 months or less on our consolidated balance sheet but continue to record rent expense on a straight-line basis over thelease term. Our leases often include options to extend or terminate at our sole discretion, which are included in the determination of lease term when they arereasonably certain to be exercised.
Our lease liability represents the present value of future lease payments over the lease term. Given our policy election to combine lease and non-lease components,we also consider fixed common area maintenance (“CAM”) part of our fixed future lease payments; therefore, fixed CAM is also included in our lease liability.
We cannot determine the interest rate implicit in each of our leases. Therefore, we use market and term-specific incremental borrowing rates. Our incrementalborrowing rate for a lease is the rate of interest we expect to pay on a collateralized basis to borrow an amount equal to the lease payments under similar terms.Because we do not borrow on a collateralized basis, we consider a combination of factors, including our credit-adjusted risk-free interest rate, the risk profile andfunding cost of the specific geographic market of the lease, the lease term and the effect of adjusting the rate to reflect consideration of collateral. Our credit-adjusted risk-free rate takes into consideration interest rates we pay on our unsecured long-term bonds as well as quoted interest rates obtained from financialinstitutions.
Total lease costs recorded as rent and other occupancy costs include fixed operating lease costs, variable lease costs and short-term lease costs. Most of our realestate leases require we pay certain expenses, such as CAM costs, real estate taxes and other executory costs, of which the fixed portion is included in operatinglease costs. We recognize operating lease costs on a straight-line basis over the lease term. In addition to the above costs, variable lease costs also include amountsbased on a percentage of gross sales in excess of specified levels and are recognized when probable and are not included in determining the present value of ourlease liability. Our lease agreements do not contain any material residual value guarantees or material restrictive covenants. A significant majority of our leases arerelated to our company-operated stores, and their related costs are recorded within store operating expenses.
The ROU asset is measured at the initial amount of the lease liability adjusted for lease payments made at or before the lease commencement date, initial directcosts and any tenant improvement allowances received. For operating leases, ROU assets are reduced over the lease term by the recognized straight-line leaseexpense less the amount of accretion of the lease liability determined using the effective interest method. For finance leases, ROU assets are amortized on astraight-line basis over the
51

Table of Contents
shorter of the useful life of the leased asset or the lease term. Interest expense on each finance lease liability is recognized utilizing the effective interest method.ROU assets are tested for impairment in the same manner as long-lived assets.
Additionally, we monitor for events or changes in circumstances that may require a reassessment of one of our leases and determine if a remeasurement is required.During fiscal 2021, the COVID-19-related rent concessions we received for stores, primarily in our International segment, were immaterial. During fiscal 2020, wereceived $27.6 million of COVID-19-related rent concessions for stores in our International segment generally correlating with the temporary period our storeswere closed. Consistent with updated guidance from the Financial Accounting Standards Board (“FASB”) in April 2020, we elected to treat COVID-19-relatedrent concessions as variable rent. Rent concessions were recognized as an offset to our rent expense within store operating expenses on our consolidated statementof earnings. See Note 10, Leases, for additional details. Additionally, for the years ended October 3, 2021 and September 27, 2020, we recognized acceleratedamortization of ROU lease assets and other lease costs of $89.5 million and $87.7 million, respectively, due to planned store closures prior to the end of contractuallease terms, which were recorded in restructuring and impairments on the consolidated statement of earnings.
Goodwill
We evaluate goodwill for impairment annually during our third fiscal quarter, or more frequently if an event occurs or circumstances change, such as materialdeterioration in performance or a significant number of store closures, that would indicate that impairment may exist. When evaluating goodwill for impairment,we may first perform a qualitative assessment to determine whether it is more likely than not that a reporting unit is impaired. If we do not perform a qualitativeassessment, or if we determine that it is not more likely than not that the fair value of the reporting unit exceeds its carrying amount, we calculate the estimated fairvalue of the reporting unit. Fair value is typically calculated using a discounted cash flow model. For certain reporting units, where deemed appropriate, we mayalso utilize a market approach for estimating fair value. If the carrying amount of the reporting unit exceeds the estimated fair value, an impairment charge isrecorded to reduce the carrying value to the estimated fair value.
As part of our ongoing operations, we may close certain stores within a reporting unit containing goodwill due to underperformance of the store or inability torenew our lease, among other reasons. We may abandon certain assets associated with a closed store, including leasehold improvements and other non-transferableassets. When a portion of a reporting unit that constitutes a business is to be disposed of, goodwill associated with the business is included in the carrying amountof the business in determining any loss on disposal. Our evaluation of whether the portion of a reporting unit being disposed of constitutes a business occurs on thedate of abandonment. Although an operating store meets the accounting definition of a business prior to abandonment, it does not constitute a business on theclosure date because the remaining assets on that date do not constitute an integrated set of activities (substantive processes) and assets that are capable of beingmanaged for the purpose of providing a return to investors. As a result, when closing individual stores, we do not include goodwill in the calculation of any loss ondisposal of the related assets.
We recorded no goodwill impairment during fiscal 2021 and fiscal 2020. In fiscal 2019, we recorded goodwill impairment of $10.5 million. See Note 8, OtherIntangible Assets and Goodwill, for further information.
Other Intangible Assets
Other intangible assets include finite-lived intangible assets, which mainly consist of acquired and reacquired rights, trade secrets, licensing agreements, contract-based patents and copyrights. These assets are amortized over their estimated useful lives and are tested for impairment using a similar methodology to ourproperty, plant and equipment, as described above.
Indefinite-lived intangibles, which consist primarily of trade names and trademarks, are tested for impairment annually during the third fiscal quarter, or morefrequently if an event occurs or circumstances change that would indicate that impairment may exist. When evaluating other intangible assets for impairment, wemay first perform a qualitative assessment to determine whether it is more likely than not that an intangible asset group is impaired. If we do not perform thequalitative assessment, or if we determine that it is not more likely than not that the fair value of the intangible asset group exceeds its carrying amount, wecalculate the estimated fair value of the intangible asset group. Fair value is the price a willing buyer would pay for the intangible asset group and is typicallycalculated using an income approach, such as a relief-from-royalty model. If the carrying amount of the intangible asset group exceeds the estimated fair value, animpairment charge is recorded to reduce the carrying value to the estimated fair value. In addition, we continuously monitor and may revise our intangible assetuseful lives if and when facts and circumstances change.
There were no significant other intangible asset impairment charges recorded during fiscal 2021. We recorded other intangible asset impairment charges of $22.1million during fiscal 2020. There were no significant other intangible asset impairments charges recorded during fiscal 2019. See Note 8, Other Intangible Assetsand Goodwill, for further information.
52

Table of Contents
Insurance Reserves
We use a combination of insurance and self-insurance mechanisms, including a wholly-owned captive insurance entity and participation in a reinsurance treaty, toprovide for the potential liabilities for certain risks, including workers’ compensation, healthcare benefits, general liability, property insurance and director andofficers’ liability insurance. Liabilities associated with the risks that are retained by us are not discounted and are estimated, in part, by considering historicalclaims experience, demographics, exposure and severity factors and other actuarial assumptions.
Revenue Recognition
Consolidated revenues are presented net of intercompany eliminations for wholly-owned subsidiaries and investees controlled by us and for product sales to androyalty and other fees from licensees accounted for under the equity method. Additionally, consolidated revenues are recognized net of any discounts, returns,allowances and sales incentives, including coupon redemptions and rebates.
Company-operated Store Revenues
Company-operated store revenues are recognized when payment is tendered at the point of sale as the performance obligation has been satisfied. Company-operated store revenues are reported excluding sales, use or other transaction taxes that are collected from customers and remitted to taxing authorities.
Licensed Store Revenues
Licensed store revenues consist of product and equipment sales, royalties and other fees paid by licensees using the Starbucks brand. Sales of coffee, tea, food andrelated products are generally recognized upon shipment to licensees, depending on contract terms. Shipping charges billed to licensees are also recognized asrevenue, and the related shipping costs are included in product and distribution costs on our consolidated statements of earnings.
We consider pre-opening services, including site evaluation and selection, store architectural/design and development and operational training, to be performanceobligations that are separate from the license to operate under the Starbucks brand. These services provide distinct value to our licensees, including business andindustry insight and knowledge that transfers value apart from the license. Revenues associated with pre-opening services are recognized upon completion of therelated performance obligations, generally when a store is opened. Royalty revenues are recognized based upon a percentage of reported sales, and othercontinuing fees, such as marketing and service fees, are recognized as the performance obligations are met.
Stored Value Cards
Stored value cards can be activated through various channels, including at our company-operated and most licensed store locations, online at Starbucks.com or viamobile devices held by our customers and at certain other third-party websites and locations, such as grocery stores, although they cannot be reloaded at thesethird-party websites or locations. Amounts loaded onto stored value cards are initially recorded as deferred revenue and recognized as revenue upon redemption.Historically, the majority of stored value cards are redeemed within one year.
In many of our company-owned markets, including the U.S., our stored value cards do not have an expiration date nor do we charge service fees that cause adecrement to customer balances. Based on historical redemption rates, a portion of stored value cards is not expected to be redeemed and will be recognized asbreakage over time in proportion to stored value card redemptions. The redemption rates are based on historical redemption patterns for each market, including thetiming and business channel in which the card was activated or reloaded, and remittance to government agencies under unclaimed property laws, if applicable.
Breakage is recognized as company-operated stores and licensed stores revenue within the consolidated statement of earnings. For the fiscal years ended October 3,2021, September 27, 2020 and September 29, 2019, we recognized breakage revenue of $164.5 million, $130.3 million and $125.1 million in company-operatedstore revenues, respectively, and $16.6 million, $14.3 million and $15.7 million in licensed store revenues, respectively.
53

Table of Contents
Loyalty Program
Customers in the U.S., Canada and certain other countries who register their Starbucks Card are automatically enrolled in the Starbucks Rewards program, whichis primarily a spend-based loyalty program. They earn loyalty points (“Stars”) in a variety of ways, including with each purchase at participating Starbucks storesand when making purchases with the Starbucks-branded credit and debit cards. Starbucks Rewards members can earn Stars by paying with cash, credit or debitcards, or selected mobile wallets at company-operated stores in the U.S. and Canada. After accumulating a certain number of Stars, the customer earns a rewardthat can be redeemed for free product that, regardless of where the related Stars were earned within that country, will be honored at company-operated stores andcertain participating licensed store locations in that same country.
We defer revenue associated with the estimated selling price of Stars earned by Starbucks Rewards members towards free product as each Star is earned and acorresponding liability is established in deferred revenue. This deferral is based on the estimated value of the product for which the reward is expected to beredeemed, net of estimated unredeemed Stars. Stars generally expire after six months.
When a customer redeems an earned reward, we recognize revenue for the redeemed product and reduce the related deferred revenue.
Other Revenues
Other revenues primarily include royalty revenues, sales of packaged coffee, tea and a variety of ready-to-drink beverages and single-serve coffee and tea productsto customers outside of our company-operated and licensed stores. Sales of these products are generally recognized upon shipment to customers, depending oncontract terms.
Other revenues also include product sales to and licensing revenue from Nestlé related to our Global Coffee Alliance. Product sales to Nestlé are generallyrecognized when the product is shipped whereas royalty revenues are recognized based on a percentage of reported sales.
Deferred Revenues
Our deferred revenue primarily consists of the up-front prepaid royalty from Nestlé, for which we have continuing performance obligations to support the GlobalCoffee Alliance, and our unredeemed stored value card liability and unredeemed Stars associated with our loyalty program. See Note 11, Deferred Revenue, forfurther information.
Disaggregation of Revenues
Revenues disaggregated by segment, product type and geographic area are disclosed in Note 17, Segment Reporting.
Product and Distribution Costs
Product and distribution costs primarily consist of raw materials, purchased goods and packaging costs as well as operational costs of our supply chainorganization, such as wages and benefits, occupancy costs and depreciation expenses, in support of sourcing, procuring, manufacturing, warehousing andtransportation activities of products sold at our company-operated and licensed stores as well as through Channel Development and our other businesses. Alsoincluded are inventory and supply chain asset impairment costs.
Store Operating Expenses
Store operating expenses consist of costs incurred in our company-operated stores, primarily wages and benefits related to store partners (employees), occupancycosts and other costs that directly support the operation and sales-related activities of those stores.
General and Administrative Expenses
General and administrative expenses primarily consist of wages and benefits, professional service fees and occupancy costs for corporate headquarter and regionaloffices that support our corporate functions, including technology, finance, legal and partner resources.
Advertising
We expense most advertising costs as they are incurred, except for certain production costs that are expensed the first time the advertising takes place. Advertisingexpenses totaled $305.1 million, $258.8 million and $245.7 million in fiscal 2021, 2020 and 2019, respectively.
®
®
®
®
54

Table of Contents
Government Subsidies
On March 27, 2020, the U.S. government enacted the Coronavirus Aid, Relief and Economic Security Act (“CARES Act”), which among other things, providesemployer payroll tax credits for wages paid to employees who are unable to work during the COVID-19 pandemic and options to defer payroll tax payments for alimited period. Based on our evaluation of the CARES Act, we qualify for certain employer payroll tax credits as well as the deferral of payroll tax payments in thefuture. Additionally, the Canadian government enacted the Canada Emergency Wage Subsidy (“CEWS”) to help employers offset a portion of their employeewages for a limited period. We elected to treat qualified government subsidies from the U.S., Canada and other governments as offsets to the related operatingexpenses. The qualified payroll credits reduced our store operating expenses by $210.0 million and $349.6 million on our consolidated statement of earningsduring fiscal 2021 and 2020, respectively. After netting the qualified credits against our payable, a receivable balance of $172.4 million and $155.1 million wasincluded in prepaid expenses and other current assets as of October 3, 2021 and September 27, 2020, respectively. During the year ended October 3, 2021, wedeferred $81.7 million of qualified payroll tax payments. As of October 3, 2021, deferred payroll tax payments of $116.4 million were included in both accruedliabilities and other long-term liabilities, respectively, on our consolidated balance sheets. As of September 27, 2020, deferred payroll tax payments of $151.0million were included in other long-term liabilities on our consolidated balance sheets.
Store Preopening Expenses
Costs incurred in connection with the start-up and promotion of new company-operated store openings are expensed as incurred.
Asset Retirement Obligations
We recognize a liability for the fair value of required asset retirement obligations (“ARO”) when such obligations are incurred. Our AROs are primarily associatedwith leasehold improvements, which, at the end of a lease, we are contractually obligated to remove in order to comply with the lease agreement. At the inceptionof a lease with such conditions, we record an ARO liability and a corresponding capital asset in an amount equal to the estimated fair value of the obligation. Weestimate the liability using a number of assumptions, including store closing costs, cost inflation rates and discount rates, and accrete the liability to its projectedfuture value over time. The capitalized asset is depreciated using the same depreciation convention as leasehold improvement assets. Upon satisfaction of the AROconditions, any difference between the recorded ARO liability and the actual retirement costs incurred is recognized as a gain or loss in store operating expense onour consolidated statements of earnings. As of October 3, 2021 and September 27, 2020, our net ARO assets included in property, plant and equipment were $30.9million and $30.7 million, respectively, and our net ARO liabilities included in other long-term liabilities were $116.5 million and $111.0 million, respectively.
Stock-based Compensation
We maintain several equity incentive plans under which we may grant non-qualified stock options, incentive stock options, restricted stock, restricted stock units(“RSUs”) or stock appreciation rights to employees, non-employee directors and consultants. We also have an employee stock purchase plan (“ESPP”). RSUsissued by us are equivalent to nonvested shares under the applicable accounting guidance. We record stock-based compensation expense based on the fair value ofstock awards at the grant date and recognize the expense over the related service period following a graded vesting expense schedule. Expense for performance-based RSUs is recognized when it is probable the performance goal will be achieved. Performance goals are determined by the Board of Directors and may includemeasures such as earnings per share, operating income and return on invested capital. The fair value of each stock option granted is estimated on the grant dateusing the Black-Scholes-Merton option valuation model. The assumptions used to calculate the fair value of options granted are evaluated and revised, asnecessary, to reflect market conditions and our historical experience. The fair value of RSUs is based on the closing price of Starbucks common stock on the awarddate, less the present value of expected dividends not received during the vesting period. If applicable, our total shareholder return relative to our peer group isincorporated into the underlying assumptions using a Monte Carlo simulation valuation model to calculate grant date fair value. Compensation expense isrecognized over the requisite service period for each separately vesting portion of the award, and only for those awards expected to vest, with forfeitures estimatedat the date of grant based on our historical experience and future expectations.
Foreign Currency Translation
Our international operations generally use their local currency as their functional currency. Assets and liabilities are translated at exchange rates in effect at thebalance sheet date. Income and expense accounts are translated at the average monthly exchange rates during the year. Resulting translation adjustments arereported as a component of OCI and recorded in AOCI on our consolidated balance sheets.
55

Table of Contents
Income Taxes
We compute income taxes using the asset and liability method, under which deferred income taxes are recognized based on the differences between the financialstatement carrying amounts and the respective tax bases of our assets and liabilities. Deferred tax assets and liabilities are measured using current enacted tax ratesexpected to apply to taxable income in the years in which we expect the temporary differences to reverse. The effect of a change in tax rates on deferred taxes isrecognized in income in the period that includes the enactment date.
We routinely evaluate the likelihood of realizing the benefit of our deferred tax assets and may record a valuation allowance if, based on all available evidence, wedetermine that some portion of the tax benefit will not be realized. In evaluating our ability to recover our deferred tax assets within the jurisdictions from whichthey arise, we consider all available positive and negative evidence, including scheduled reversals of deferred tax liabilities, projected future taxable income, tax-planning strategies and results of recent operations. If we determine that we would be able to realize our deferred tax assets in the future in excess of their netrecorded amount, we would make an adjustment to the deferred tax asset valuation allowance, which would reduce the provision for income taxes.
In addition, our income tax returns are periodically audited by domestic and foreign tax authorities. These audits include review of our tax filing positions,including the timing and amount of deductions taken and the allocation of income between tax jurisdictions. We evaluate our exposures associated with our varioustax filing positions and recognize a tax benefit from an uncertain tax position only if it is more likely than not that the tax position will be sustained uponexamination by the relevant taxing authorities, including resolutions of any related appeals or litigation processes, based on the technical merits of our position.The tax benefits recognized in the financial statements from such a position are measured based on the largest benefit that has a greater than 50% likelihood ofbeing realized upon ultimate settlement. For uncertain tax positions that do not meet this threshold, we record a related liability. We adjust our unrecognized taxbenefit liability and income tax expense in the period in which the uncertain tax position is effectively settled, the statute of limitations expires for the relevanttaxing authority to examine the tax position or when new information becomes available.
Starbucks recognizes interest and penalties related to income tax matters in income tax expense on our consolidated statements of earnings. Accrued interest andpenalties are included within the related tax balances on our consolidated balance sheets.
Global intangible low-taxed income (“GILTI”) provisions are applied, providing an incremental tax on foreign income. We have made a policy election to classifytaxes due under the GILTI provision as a current period expense.
Earnings per Share
Basic earnings per share is computed based on the weighted average number of shares of common stock outstanding during the period. Diluted earnings per shareis computed based on the weighted average number of shares of common stock and the effect of dilutive potential common shares outstanding during the period,calculated using the treasury stock method. Dilutive potential common shares include outstanding stock options and RSUs. Performance-based RSUs areconsidered dilutive when the related performance criterion has been met.
Common Stock Share Repurchases
We may repurchase shares of Starbucks common stock under a program authorized by our Board of Directors, including pursuant to a contract, instruction orwritten plan meeting the requirements of Rule 10b5-1(c)(1) of the Exchange Act. Under applicable Washington State law, shares repurchased are retired and notdisplayed separately as treasury stock on the financial statements. Instead, the par value of repurchased shares is deducted from common stock and the excessrepurchase price over par value is deducted from additional paid-in capital and from retained earnings (deficit).
Recent Accounting Pronouncements
Recently Adopted Accounting PronouncementsIn June 2016, the FASB issued guidance replacing the incurred loss impairment methodology with a new methodology that reflects current expected credit losseson financial assets, including receivables and available-for-sale securities. The new methodology requires entities to estimate and recognize expected credit losseseach reporting period. The guidance was adopted during the first quarter of fiscal 2021 under the modified retrospective approach and resulted in a $2.2 milliontransition adjustment to opening shareholders’ retained deficit on our consolidated statements of equity.
Recent Accounting Pronouncements Not Yet Adopted
In March 2020, the FASB issued guidance related to reference rate reform. The pronouncement provides temporary optional expedients and exceptions to thecurrent guidance on contract modifications and hedge accounting to ease the financial reporting burden related to the expected market transition from the LondonInterbank Offered Rate (“LIBOR”) and other interbank offered rates to alternative reference rates. The guidance was effective upon issuance and generally can beapplied to applicable contract modifications through December 31, 2022. We expect to adopt the guidance and begin transitioning from
56

Table of Contents
LIBOR to alternative reference rates in the first quarter of fiscal 2022. We do not expect adoption and transition to alternative reference rates to have a materialimpact on our consolidated financial statements.
Note 2: Acquisitions, Divestitures and Strategic Alliance
Fiscal 2021
In the fourth quarter of fiscal 2021, we sold our 50% ownership interest in Starbucks Coffee Korea Co., Ltd. where our joint venture partner, E-Mart Inc., acquiredan additional 17.5% interest and Apfin Investment Pte Ltd, an affiliate of GIC Private Limited, which is a Singapore sovereign wealth fund, acquired the remaining32.5%. The sale had a combined price of $1.175 billion. This transaction resulted in a pre-tax gain of $864.5 million, which is included in net gain resulting fromdivestiture of certain operations on our consolidated statements of earnings.
Fiscal 2019
In the third quarter of fiscal 2019, we sold our company-operated retail business in Thailand to Coffee Concepts Thailand, a joint-venture between Maxim'sCaterers Limited and F&N Retail Connection Co. Ltd, converting this operation to a fully licensed market. This transaction resulted in a pre-tax gain of $601.9million, which was included in net gains resulting from divestiture of certain operations on our consolidated statements of earnings.
In the second quarter of fiscal 2019, we sold our company-operated retail businesses in France and the Netherlands to Alsea, S.A.B. de C.V. converting theseoperations to fully licensed markets. These transactions did not have a material impact on our consolidated financial statements.
Note 3: Derivative Financial Instruments
Interest Rates
From time to time, we enter into designated cash flow hedges to manage the variability in cash flows due to changes in benchmark interest rates. We enter intointerest rate swap agreements and treasury locks, which are synthetic forward sales of U.S. treasury securities settled in cash based upon the difference between anagreed-upon treasury rate and the prevailing treasury rate at settlement. These agreements are cash settled at the time of the pricing of the related debt. Eachderivative agreement's gain or loss is recorded in AOCI and is subsequently reclassified to interest expense over the life of the related debt.
To hedge the exposure to changes in the fair value of our fixed-rate debt, we enter into interest rate swap agreements, which are designated as fair value hedges.The changes in fair values of these derivative instruments and the offsetting changes in fair values of the underlying hedged debt due to changes in the relevantbenchmark interest rates are recorded in interest expense. Refer to Note 9, Debt, for additional information on our long-term debt.
Foreign Currency
To reduce cash flow volatility from foreign currency fluctuations, we enter into forward and swap contracts to hedge portions of cash flows of anticipatedintercompany royalty payments, inventory purchases and intercompany borrowing and lending activities. The resulting gains and losses from these derivatives arerecorded in AOCI and subsequently reclassified to revenue, product and distribution costs, or interest income and other, net, respectively, when the hedgedexposures affect net earnings.
From time to time, we may enter into financial instruments, including, but not limited to, forward and swap contracts or foreign currency-denominated debt, tohedge the currency exposure of our net investments in certain international operations. The resulting gains and losses from these derivatives are recorded in AOCIand are subsequently reclassified to net earnings when the hedged net investment is either sold or substantially liquidated.
Foreign currency forward and swap contracts not designated as hedging instruments are used to mitigate the foreign exchange risk of certain other balance sheetitems. Gains and losses from these derivatives are largely offset by the financial impact of translating foreign currency-denominated payables and receivables;these gains and losses are recorded in interest income and other, net.
Commodities
Depending on market conditions, we may enter into coffee forward contracts, futures contracts and collars to hedge anticipated cash flows under our price-to-be-fixed green coffee contracts, which are described further in Note 5, Inventories, or our longer-dated forecasted coffee demand where underlying fixed price andprice-to-be-fixed contracts are not yet available. The resulting gains and losses are recorded in AOCI and are subsequently reclassified to product and distributioncosts when the hedged exposure affects net earnings.
Depending on market conditions, we may also enter into dairy forward contracts and futures contracts to hedge a portion of anticipated cash flows under our dairypurchase contracts and our forecasted dairy demand. The resulting gains or losses are
57

Table of Contents
recorded in AOCI and are subsequently reclassified to product and distribution costs when the hedged exposure affects net earnings.
Cash flow hedges related to anticipated transactions are designated and documented at the inception of each hedge. Cash flows from hedging transactions areclassified in the same categories as the cash flows from the respective hedged items. For de-designated cash flow hedges in which the underlying transactions areno longer probable of occurring, the related accumulated derivative gains or losses are recognized in interest income and other, net on our consolidated statementsof earnings. There were no significant cash flow hedge de-designations in fiscal 2021. During the second and third quarters of fiscal 2020, we de-designated certaincash flow hedges due to the global COVID-19 impacts, which resulted in the release of an insignificant net gain from AOCI to our consolidated statement ofearnings.
To mitigate the price uncertainty of a portion of our future purchases, including diesel fuel and other commodities, we enter into swap contracts, futures and collarsthat are not designated as hedging instruments. The resulting gains and losses are recorded in interest income and other, net to help offset price fluctuations on ourbeverage, food, packaging and transportation costs, which are included in product and distribution costs on our consolidated statements of earnings.Gains and losses on derivative contracts and foreign currency-denominated debt designated as hedging instruments included in AOCI and expected to bereclassified into earnings within 12 months, net of tax (in millions):
Net Gains/(Losses)Included in AOCI Net Gains/(Losses)
Expected to beReclassified from AOCIinto Earnings within 12
Months
Outstanding Contract/DebtRemaining Maturity
(Months)Oct 3, 2021
Sep 27, 2020
Sep 29, 2019
Cash Flow Hedges:Coffee $ 197.8 $ (2.5) $ (1.0) $ 117.4 8Cross-currency swaps 4.4 5.2 (1.4) — 38Dairy (0.4) 0.5 — (0.4) 11Foreign currency - other 1.3 5.3 12.9 (0.6) 34Interest rates (44.8) (90.6) 0.5 (1.6) 133
Net Investment Hedges:Cross-currency swaps 37.9 32.6 — — 96Foreign currency 16.0 16.0 16.0 — 0Foreign currency debt (5.3) (37.1) (26.1) — 30
58

Table of Contents
Pre-tax gains and losses on derivative contracts and foreign currency-denominated long-term debt designated as hedging instruments recognized in OCI andreclassifications from AOCI to earnings (in millions):
Year Ended
Gains/(Losses)Recognized in
OCI Before ReclassificationsGains/(Losses) Reclassified from
AOCI to Earnings
Location of gain/(loss)Oct 3, 2021
Sep 27, 2020
Sep 29, 2019
Oct 3, 2021
Sep 27, 2020
Sep 29, 2019
Cash Flow Hedges:Coffee $ 223.5 $ (1.2) $ (1.2) $ (3.5) $ 0.5 $ (0.3) Product and distribution costsCross-currency swaps
13.7 4.4 (5.9) 1.9 2.3 0.1 Interest expense12.7 (6.1) (19.8) Interest income and other, net
Dairy0.5 3.0 — 1.7 4.0 — Product and distribution costs
— (1.7) — Interest income and other, netForeign currency - other
(10.0) (6.4) 20.8 1.8 5.5 7.0 Licensed stores revenues
(7.3) (8.7) 4.4 Product and distribution costs— 6.1 — Interest income and other, net
Interest rates 56.1 (126.1) (27.8) (1.8) — 4.7 Interest expense(3.6) — — Interest income and other, net
Net Investment Hedges:Cross-currency swaps 20.5 56.8 — 13.4 13.3 — Interest expenseForeign currency debt 42.6 (18.1) (39.8) — — —
As a result of the global COVID-19 impacts, we discontinued cash flow hedges during the year ended September 27, 2020.
Pre-tax gains and losses on non-designated derivatives and designated fair value hedging instruments and the related fair value hedged item recognized in earnings(in millions):
Gains/(Losses) Recognized in Earnings
Location of gain/(loss) recognized in earnings
Year Ended
Oct 3, 2021 Sep 27, 2020 Sep 29, 2019Non-Designated Derivatives:
Dairy Interest income and other, net $ — $ — $ (1.9)Diesel fuel and other commodities Interest income and other, net 2.6 (8.8) (5.9)Foreign currency - other Interest income and other, net 7.5 0.3 (8.1)
Fair Value Hedges:Interest rate swap Interest expense (0.5) 28.7 54.7 Long-term debt (hedged item) Interest expense 14.0 (23.8) (50.7)
Notional amounts of outstanding derivative contracts (in millions):Oct 3, 2021 Sep 27, 2020
Coffee $ 481 $ 63 Cross-currency swaps 806 870 Dairy 53 61 Diesel fuel and other commodities 10 5 Foreign currency - other 1,009 1,140 Interest rate swaps 1,250 1,750
(1)
(1)
(1)
59

Table of Contents
Fair value of outstanding derivative contracts (in millions) including the location of the asset and/or liability on the consolidated balance sheets:Derivative Assets
Balance Sheet Location Oct 3, 2021 Sep 27, 2020Designated Derivative Instruments:
Coffee Prepaid expenses and other current assets $ 130.5 $ 2.6 Cross-currency swaps Other long-term assets 54.7 37.7 Dairy Prepaid expenses and other current assets 0.8 2.1 Foreign currency - other Prepaid expenses and other current assets 8.9 8.6
Other long-term assets 6.9 3.8 Interest rate swap Other long-term assets 22.7 45.8
Non-designated Derivative Instruments:Diesel fuel and other commodities Prepaid expenses and other current assets 0.1 — Foreign currency Prepaid expenses and other current assets 7.3 2.3
Derivative LiabilitiesBalance Sheet Location Oct 3, 2021 Sep 27, 2020
Designated Derivative Instruments:Coffee Accrued liabilities $ — $ 1.4
Other long-term liabilities — 0.1 Cross-currency swaps Other long-term liabilities 3.3 7.3 Dairy Accrued liabilities 0.9 1.4 Foreign currency - other Accrued liabilities 7.4 1.6
Other long-term liabilities 3.6 2.6 Interest rates Other long-term liabilities 1.3 69.3
Non-designated Derivative Instruments:Dairy Accrued liabilities 0.2 — Diesel fuel and other commodities Accrued liabilities — 1.7 Foreign currency Accrued liabilities 0.1 1.2
The following amounts were recorded on the consolidated balance sheets related to fixed-to-floating interest rate swaps designated in fair value hedgingrelationships:
Carrying amount of hedged itemCumulative amount of fair value hedging adjustment
included in the carrying amountOct 3, 2021 Sep 27, 2020 Oct 3, 2021 Sep 27, 2020
Location on the balance sheetLong-term debt $ 771.7 $ 785.6 $ 21.7 $ 35.6
Additional disclosures related to cash flow gains and losses included in AOCI, as well as subsequent reclassifications to earnings, are included in Note 12, Equity.
60

Table of Contents
Note 4: Fair Value Measurements
Assets and Liabilities Measured at Fair Value on a Recurring Basis (in millions): Fair Value Measurements at Reporting Date Using
Balance at
October 3, 2021
Quoted Pricesin Active
Markets for Identical Assets
(Level 1)
Significant Other Observable
Inputs(Level 2)
SignificantUnobservable Inputs
(Level 3)Assets:Cash and cash equivalents $ 6,455.7 $ 6,455.7 $ — $ — Short-term investments:
Available-for-sale debt securitiesCommercial paper 63.0 — 63.0 — Corporate debt securities 24.7 — 24.7 — Mortgage and other asset-backed securities 0.1 — 0.1 —
Total available-for-sale debt securities 87.8 — 87.8 — Marketable equity securities 74.4 74.4 — —
Total short-term investments 162.2 74.4 87.8 — Prepaid expenses and other current assets:
Derivative assets 147.6 131.1 16.5 — Long-term investments:
Available-for-sale debt securitiesAuction rate securities 6.0 — — 6.0 Corporate debt securities 162.0 — 162.0 — Foreign government obligations 4.0 — 4.0 — Mortgage and other asset-backed securities 31.9 — 31.9 — State and local government obligations 1.5 — 1.5 — U.S. government treasury securities 76.3 76.3 — —
Total long-term investments 281.7 76.3 199.4 6.0 Other long-term assets:
Derivative assets 84.3 — 84.3 — Total assets $ 7,131.5 $ 6,737.5 $ 388.0 $ 6.0 Liabilities:Accrued liabilities:
Derivative liabilities $ 8.6 $ 0.3 $ 8.3 $ — Other long-term liabilities:
Derivative liabilities 8.2 — 8.2 — Total liabilities $ 16.8 $ 0.3 $ 16.5 $ —
61

Table of Contents
Fair Value Measurements at Reporting Date Using
Balance at
September 27, 2020
Quoted Prices in Active
Markets for Identical Assets
(Level 1)
Significant Other Observable
Inputs (Level 2)
Significant Unobservable Inputs
(Level 3)Assets:Cash and cash equivalents $ 4,350.9 $ 4,350.9 $ — $ — Short-term investments:
Available-for-sale debt securitiesCertificates of deposit 1.6 — 1.6 — Commercial paper 66.8 — 66.8 — Corporate debt securities 123.6 — 123.6 — Foreign government obligations 8.5 — 8.5 — Mortgage and other asset-backed securities 15.8 — 15.8 —
Total available-for-sale debt securities 216.3 — 216.3 — Marketable equity securities 64.9 64.9 — —
Total short-term investments 281.2 64.9 216.3 — Prepaid expenses and other current assets:
Derivative assets 15.6 3.6 12.0 — Long-term investments:
Available-for-sale debt securitiesAuction rate securities 5.7 — — 5.7 Corporate debt securities 82.6 — 82.6 — Mortgage and other asset-backed securities 19.3 — 19.3 — State and local government obligations 3.6 — 3.6 — U.S. government treasury securities 94.9 94.9 — —
Total long-term investments 206.1 94.9 105.5 5.7 Other long-term assets:
Derivative assets 87.3 — 87.3 — Total assets $ 4,941.1 $ 4,514.3 $ 421.1 $ 5.7 Liabilities:Accrued liabilities:
Derivative liabilities $ 7.3 $ 1.9 $ 5.4 $ — Other long-term liabilities:
Derivative liabilities 79.3 0.1 79.2 — Total $ 86.6 $ 2.0 $ 84.6 $ —
There were no material transfers between levels and there was no significant activity within Level 3 instruments during the periods presented. The fair values ofany financial instruments presented above exclude the impact of netting assets and liabilities when a legally enforceable master netting agreement exists.
Available-for-sale Debt Securities
Long-term investments generally mature within 4 years. Proceeds from sales of securities were $134.1 million, $177.4 million and $291.1 million for fiscal 2021,2020 and 2019, respectively. Realized gains and losses were not material for fiscal 2021, 2020 and 2019. Gross unrealized holding gains and losses were notmaterial as of October 3, 2021 and September 27, 2020.
62

Table of Contents
Marketable Equity Securities
Marketable equity securities include equity mutual funds and exchange-traded funds. Our marketable equity securities portfolio approximates a portion of ourliability under our MDCP, a defined contribution plan. Our MDCP liability was $105.2 million and $91.4 million as of October 3, 2021 and September 27, 2020,respectively. The changes in net unrealized holding gains and losses in the marketable equity securities portfolio included in earnings for fiscal 2021, 2020 and2019 were not material. Gross unrealized holding gains and losses on marketable equity securities were not material as of October 3, 2021 and September 27,2020.
Derivative Assets and Liabilities
Derivative assets and liabilities include foreign currency forward contracts, commodity futures contracts, collars and swaps, which are described further in Note 3,Derivative Financial Instruments.
Assets and Liabilities Measured at Fair Value on a Nonrecurring Basis
Assets and liabilities recognized or disclosed at fair value on a nonrecurring basis include items such as property, plant and equipment, goodwill and otherintangible assets, equity and other investments and other assets. These assets are measured at fair value if determined to be impaired. Impairment of property, plantand equipment and ROU assets is included in Note 1, Summary of Significant Accounting Policies.
We have recognized impairments during fiscal 2021 and 2020 primarily related to our North America restructuring plan. See Note 1, Summary of SignificantAccounting Policies, Note 10, Leases and Note 8, Other Intangible Assets and Goodwill for additional discussion of these impairments.
Fair Value of Other Financial Instruments
The estimated fair value of our long-term debt based on the quoted market price (Level 2) is included at Note 9, Debt.
Note 5: Inventories (in millions) Oct 3, 2021 Sep 27, 2020
Coffee:Unroasted $ 670.3 $ 664.7 Roasted 233.5 223.5
Other merchandise held for sale 329.3 293.9 Packaging and other supplies 370.8 369.3 Total $ 1,603.9 $ 1,551.4
Other merchandise held for sale includes, among other items, serveware, food and tea. Inventory levels vary due to seasonality, commodity market supply andprice fluctuations.
As of October 3, 2021, we had committed to purchasing green coffee totaling $599 million under fixed-price contracts and an estimated $1,126 million underprice-to-be-fixed contracts. A portion of our price-to-be-fixed contacts are effectively fixed through the use of futures. See Note 3, Derivative FinancialInstruments for further discussion. Price-to-be-fixed contracts are purchase commitments whereby the quality, quantity, delivery period and other negotiated termsare agreed upon, but the date, and therefore the price, at which the base “C” coffee commodity price component will be fixed has not yet been established. Formost contracts, either Starbucks or the seller has the option to “fix” the base “C” coffee commodity price prior to the delivery date. For other contracts, Starbucksand the seller may agree upon pricing parameters determined by the base “C” coffee commodity price. Until prices are fixed, we estimate the total cost of thesepurchase commitments. We believe, based on relationships established with our suppliers in the past and continuous monitoring of the business environment, therisk of non-delivery on these purchase commitments is remote.
During fiscal 2020, we wrote off approximately $50 million of inventory that was expiring or expected to expire due to COVID-19 related store closures, primarilyperishable food and beverage ingredients located at our stores, distribution centers and suppliers. This was included in product and distribution costs on ourconsolidated statement of earnings. We did not record significant write-offs related to COVID-19 during the fiscal year ended October 3, 2021.
63

Table of Contents
Note 6: Equity Investments (in millions) Oct 3, 2021 Sep 27, 2020
Equity method investments $ 216.0 $ 426.4 Other investments 52.5 52.3 Total $ 268.5 $ 478.7
Equity Method Investments
As of October 3, 2021, we had a 50% ownership interest in Tata Starbucks Limited (India), which operates licensed Starbucks retail stores. Prior to its divestiturein September 2021, we had a 50% ownership interest in Starbucks Coffee Korea Co., Ltd. Additional disclosure regarding changes in our equity methodinvestments due to acquisition or divestiture is included in Note 2, Acquisitions, Divestitures and Strategic Alliance.
We also license the rights to produce and distribute Starbucks-branded products to our 50% owned joint venture, The North American Coffee Partnership with thePepsi-Cola Company, which develops and distributes bottled Starbucks beverages, including Frappuccino coffee drinks, Starbucks Doubleshot espresso drinks,Starbucks Iced Espresso Classics and Starbucks Iced Coffee.
Our share of income and losses from our equity method investments is included in income from equity investees on our consolidated statements of earnings. Alsoincluded in this line item is our proportionate share of gross profit resulting from coffee and other product sales to, and royalty and license fee revenues generatedfrom, equity investees. Revenues generated from these entities were $160.8 million, $123.9 million and $130.7 million in fiscal 2021, 2020 and 2019, respectively.Related product and distribution costs were $92.1 million, $79.8 million and $73.2 million in fiscal 2021, 2020 and 2019, respectively. As of October 3, 2021 andSeptember 27, 2020, there were $7.9 million and $28.7 million of accounts receivable from equity investees, respectively, on our consolidated balance sheets,primarily related to product sales and royalty revenues.
Additionally, we hold equity interests in other entities to support our corporate and investment strategies. The related financial statements activities were notmaterial during the periods presented.
Other Investments
We have equity interests in entities that develop and operate Starbucks licensed stores in several global markets, as well as in companies that support our strategicinitiatives. We do not have significant influence over these entities and their fair values are not readily determinable. Therefore, we elected to measure theseinvestments at cost with adjustments for observable changes in price or impairment.
®
® ® ®
® ®
64

Table of Contents
Note 7: Supplemental Balance Sheet and Statement of Earnings Information (in millions)
Prepaid Expenses and Other Current Assets Oct 3, 2021 Sep 27, 2020
Income tax receivable $ 20.7 $ 356.9 Government subsidies receivable 172.4 155.1 Other prepaid expenses and current assets 401.5 227.5 Total prepaid expenses and current assets $ 594.6 $ 739.5
Property, Plant and Equipment, net Oct 3, 2021 Sep 27, 2020
Land $ 46.2 $ 46.0 Buildings 587.6 586.8 Leasehold improvements 8,637.6 8,262.6 Store equipment 2,934.1 2,800.3 Roasting equipment 857.2 796.6 Furniture, fixtures and other 1,392.0 1,285.7 Work in progress 374.1 377.3 Property, plant and equipment, gross 14,828.8 14,155.3 Accumulated depreciation (8,459.3) (7,913.9)Property, plant and equipment, net $ 6,369.5 $ 6,241.4
Accrued Liabilities Oct 3, 2021 Sep 27, 2020
Accrued occupancy costs $ 107.1 $ 76.9 Accrued dividends payable 578.1 — Accrued capital and other operating expenditures 840.7 677.2 Self-insurance reserves 229.3 243.9 Accrued business taxes 218.0 162.7 Total accrued liabilities $ 1,973.2 $ 1,160.7
Store Operating Expenses Year Ended
Oct 3, 2021 Sep 27, 2020 Sep 29, 2019Wages and benefits $ 6,989.3 $ 6,131.9 $ 5,941.7 Occupancy costs 2,561.5 2,388.0 2,411.2 Other expenses 2,380.1 2,244.1 2,140.7 Total store operating expenses $ 11,930.9 $ 10,764.0 $ 10,493.6
65

Table of Contents
Note 8: Other Intangible Assets and Goodwill
Indefinite-Lived Intangible Assets(in millions) Oct 3, 2021 Sep 27, 2020Trade names, trademarks and patents $ 96.4 $ 95.0
Finite-Lived Intangible AssetsOct 3, 2021 Sep 27, 2020
(in millions)Gross Carrying
AmountAccumulatedAmortization
Net CarryingAmount
Gross CarryingAmount
AccumulatedAmortization
Net CarryingAmount
Acquired and reacquired rights $ 1,141.5 $ (971.9) $ 169.6 $ 1,116.1 $ (765.0) $ 351.1 Acquired trade secrets and processes 27.6 (24.8) 2.8 27.6 (22.0) 5.6 Trade names, trademarks and patents 126.3 (51.9) 74.4 124.8 (32.1) 92.7 Licensing agreements 18.8 (13.5) 5.3 16.6 (15.0) 1.6 Other finite-lived intangible assets 24.0 (22.6) 1.4 22.8 (16.7) 6.1 Total finite-lived intangible assets $ 1,338.2 $ (1,084.7) $ 253.5 $ 1,307.9 $ (850.8) $ 457.1
Amortization expense for finite-lived intangible assets was $223.4 million, $223.7 million and $232.8 million during fiscal 2021, 2020 and 2019, respectively.During the fiscal year ended September 27, 2020, we recorded a charge of $22.1 million to restructuring and impairments on our consolidated statement ofearnings as the analysis indicated the carrying value of one of the assets exceeded its fair value. Our fiscal 2021 analysis indicated excess fair values over carryingvalues for these assets, and therefore no impairment charge was recorded.
Estimated future amortization expense as of October 3, 2021 (in millions):Fiscal Year Ending2022 $ 194.3 2023 21.0 2024 20.4 2025 14.4 2026 1.4 Thereafter 2.0 Total estimated future amortization expense $ 253.5
Goodwill
Changes in the carrying amount of goodwill by reportable operating segment (in millions):
North America International Channel
DevelopmentCorporate and
Other TotalGoodwill balance at September 29, 2019 $ 492.0 $ 2,963.1 $ 34.7 $ 1.0 $ 3,490.8
Other (0.2) 106.6 — — 106.4 Goodwill balance at September 27, 2020 $ 491.8 $ 3,069.7 $ 34.7 $ 1.0 $ 3,597.2
Other 1.4 78.6 — 0.1 80.1 Goodwill balance at October 3, 2021 $ 493.2 $ 3,148.3 $ 34.7 $ 1.1 $ 3,677.3
North America and International goodwill as of September 27, 2020 and September 29, 2019, was restated to conform with current period presentation.
"Other" consists of changes in the goodwill balance resulting from foreign currency translation.
During the third quarter of fiscal 2021, we completed our annual goodwill impairment analysis. The results of our analysis indicated significant excess fair valuesover carrying values across the different reporting units, and therefore no goodwill impairment was recorded.
(1) (1)
(2)
(2)
(1)
(2)
66

Table of Contents
Note 9: Debt
Revolving Credit Facility
During the fourth quarter of fiscal 2021, we replaced our $2.0 billion unsecured 5-year revolving credit facility (the "2018 credit facility") and our $1.0 billionunsecured 364-Day credit facility (the "364-day credit facility") with a new $3.0 billion unsecured 5-year revolving credit facility (the "2021 credit facility"). The2021 credit facility is available for working capital, capital expenditures and other corporate purposes, including acquisitions and share repurchases.
The 2021 credit facility, of which $150 million may be used for issuances of letters of credit, is currently set to mature on September 16, 2026. We have the option,subject to negotiation and agreement with the related banks, to increase the maximum commitment amount by an additional $1.0 billion. Borrowings under thecredit facility will bear interest at a variable rate based on LIBOR, and, for U.S. dollar-denominated loans under certain circumstances, a Base Rate (as defined inthe credit facility), in each case plus an applicable margin. The applicable margin is based on the Company’s long-term credit ratings assigned by Moody’s andStandard & Poor’s rating agencies. The 2021 credit facility contains alternative interest rate provisions specifying rate calculations to be used at such time LIBORceases to be available as a benchmark due to reference rate reform. The “Base Rate” of interest is the highest of (i) the Federal Funds Rate plus 0.025%, (ii) Bankof America’s prime rate, and (iii) the Eurocurrency Rate (as defined in the credit facility) plus 1.025%.
The 2021 credit facility contains provisions requiring us to maintain compliance with certain covenants, including a minimum fixed charge coverage ratio, whichmeasures our ability to cover financing expenses. As of October 3, 2021, we were in compliance with all applicable covenants. No amounts were outstanding underour 2021 credit facility as of October 3, 2021.
Short-term Debt
Under our commercial paper program, we may issue unsecured commercial paper notes up to a maximum aggregate amount outstanding at any time of $3.0billion, with individual maturities that may vary but not exceed 397 days from the date of issue. Amounts outstanding under the commercial paper program arerequired to be backstopped by available commitments under our credit facility discussed above. The proceeds from borrowings under our commercial paperprogram may be used for working capital needs, capital expenditures and other corporate purposes, including, but not limited to, business expansion, payment ofcash dividends on our common stock and share repurchases. As of October 3, 2021, we had no borrowings outstanding under the program.
Additionally, we hold the following Japanese yen-denominated credit facilities that are available for working capital needs and capital expenditures within ourJapanese market:
• A ¥5 billion, or $44.9 million,facility is currently set to mature on December 30, 2021. Borrowings under the credit facility are subject to terms definedwithin the facility and will bear interest at a variable rate based on TIBOR plus an applicable margin of 0.400%.
• A ¥10 billion, or $89.9 million, facility is currently set to mature on March 26, 2022. Borrowings under the credit facility are subject to terms definedwithin the facility and will bear interest at a variable rate based on TIBOR plus 0.350%.
As of October 3, 2021, we had no borrowings outstanding under these credit facilities. For the year ended September 27, 2020, we had ¥15 billion, or$142.3 million, outstanding under these Japanese yen-denominated credit facilities.
67

Table of Contents
Long-term Debt
Components of long-term debt including the associated interest rates and related fair values by calendar maturity (in millions, except interest rates):
Oct 3, 2021 Sep 27, 2020
Stated Interest RateEffective Interest
Rate Issuance Face ValueEstimated Fair
Value Face ValueEstimated Fair
ValueNovember 2020 notes $ — — $ 500.0 501.5 2.200 % 2.228 %February 2021 notes — — 500.0 502.3 2.100 % 2.293 %February 2021 notes — — 250.0 251.1 2.100 % 1.600 %May 2022 notes 500.0 503.1 500.0 506.5 1.300 % 1.334 %June 2022 notes 500.0 506.7 500.0 517.5 2.700 % 2.819 %March 2023 notes 1,000.0 1,035.9 1,000.0 1,058.8 3.100 % 3.107 %October 2023 notes 750.0 794.8 750.0 817.5 3.850 % 2.859 %March 2024 notes 763.8 761.0 806.4 794.4 0.372 % 0.462 %August 2025 notes 1,250.0 1,371.5 1,250.0 1,414.5 3.800 % 3.721 %June 2026 notes 500.0 526.4 500.0 542.6 2.450 % 2.511 %March 2027 notes 500.0 513.0 500.0 528.9 2.000 % 2.058 %March 2028 notes 600.0 663.2 600.0 679.5 3.500 % 3.529 %November 2028 notes 750.0 855.9 750.0 886.0 4.000 % 3.958 %August 2029 notes 1,000.0 1,109.9 1,000.0 1,147.1 3.550 % 3.840 %March 2030 notes 750.0 758.6 750.0 778.0 2.250 % 3.084 %November 2030 notes 1,250.0 1,286.9 1,250.0 1,325.9 2.550 % 2.582 %June 2045 notes 350.0 414.1 350.0 412.4 4.300 % 4.348 %December 2047 notes 500.0 556.5 500.0 546.6 3.750 % 3.765 %November 2048 notes 1,000.0 1,248.6 1,000.0 1,222.8 4.500 % 4.504 %August 2049 notes 1,000.0 1,241.0 1,000.0 1,215.5 4.450 % 4.447 %March 2050 notes 500.0 527.5 500.0 517.1 3.350 % 3.362 %November 2050 notes 1,250.0 1,339.5 1,250.0 1,332.2 3.500 % 3.528 % Total 14,713.8 16,014.1 16,006.4 17,498.7 Aggregate debt issuance costs andunamortized premium/(discount), net (119.7) (132.5)Hedge accounting fair value adjustment 21.7 35.6 Total $ 14,615.8 $ 15,909.5
Includes the effects of the amortization of any premium or discount and any gain or loss upon settlement of related treasury locks or forward-starting interestrate swaps utilized to hedge the interest rate risk prior to the debt issuance.
November 2020 and February 2021 notes were repaid in the first and second quarters of fiscal 2021, respectively.
Amount includes the change in fair value due to changes in benchmark interest rates related to our October 2023 notes. Refer to Note 3, Derivative FinancialInstruments, for additional information on our interest rate swap designated as a fair value hedge.
Japanese yen-denominated long-term debt.
(1)
(2)
(2)
(2)
(3)
(4)
(3)
(1)
(2)
(3)
(4)
68

Table of Contents
The following table summarizes our long-term debt maturities as of October 3, 2021 by fiscal year (in millions):Fiscal Year Total2022 $ 1,000.0 2023 1,000.0 2024 1,513.8 2025 1,250.0 2026 500.0 Thereafter 9,450.0
Total $ 14,713.8
Note 10: Leases
During the years ended October 3, 2021 and September 27, 2020, we recognized accelerated amortization of ROU lease assets and other lease costs of$89.5 million and $87.7 million, respectively, which were recognized within restructuring and impairments on the consolidated statements of earnings.
The components of lease costs (in millions):Year Ended
Oct 3, 2021 Sep 27, 2020Operating lease costs $ 1,579.2 $ 1,573.6 Variable lease costs 949.6 833.4 Short-term lease costs 30.9 34.1 Total lease costs $ 2,559.7 $ 2,441.1
Includes immaterial amounts of sublease income and rent concessions.
The following table includes supplemental information (in millions):Year Ended
Oct 3, 2021 Sep 27, 2020Cash paid related to operating lease liabilities $ 1,707.1 $ 1,463.3 Operating lease liabilities arising from obtaining ROU assets 1,590.3 1,093.0
Excludes the initial impact of adoption during the year ended September 27, 2020.
Oct 3, 2021 Sep 27, 2020Weighted-average remaining operating lease term 8.7 years 8.8 yearsWeighted-average operating lease discount rate 2.5 % 2.5 %
Finance lease assets are recorded in property, plant and equipment, net with the corresponding lease liabilities included in accrued liabilities on the consolidatedbalance sheet. Finance leases were immaterial as of October 3, 2021 and September 27, 2020.
(1)
(1)
(1)
(1)
69

Table of Contents
Minimum future maturities of operating lease liabilities (in millions):Fiscal Year Total2022 $ 1,504.6 2023 1,441.3 2024 1,310.2 2025 1,156.6 2026 1,012.5 Thereafter 3,704.7 Total lease payments 10,129.9 Less imputed interest (1,140.6)Total $ 8,989.3
As of October 3, 2021, we have entered into operating leases that have not yet commenced of $830.9 million, primarily related to real estate leases. These leaseswill commence between fiscal year 2022 and fiscal year 2028 with lease terms of 10 years to 20 years.
Previous Lease Guidance Disclosures
Rent expense under operating lease agreements under the previous lease guidance, which excludes certain amounts required under the new guidance (in millions):Year EndedSep 29, 2019
Minimum rent $ 1,441.7 Contingent rent 224.3 Total 1,666.0
We have subleases related to certain of our operating leases. We recognized $10.9 million of sublease income during the fiscal year ended September 29, 2019.Additionally, as of September 29, 2019, the gross carrying value of assets related to build-to-suit lease arrangements accounted for as financing leases was$122.3 million, with associated accumulated depreciation of $17.2 million. Lease exit costs associated with our restructuring efforts primarily relate to the closureof Teavana retail stores and certain Starbucks company-operated stores, and are recognized concurrently with actual store closures. Total lease exit costs of $55.3million was recorded in restructuring and impairments on the consolidated statement of earnings in fiscal 2019.
70

Table of Contents
Note 11: Deferred Revenue
In the fourth quarter of fiscal 2018, we licensed the rights to sell and market our products in authorized channels through the Global Coffee Alliance and receivedan up-front prepaid royalty from Nestlé. The up-front payment of approximately $7 billion was recorded as deferred revenue as we have continuing performanceobligations to support the Global Coffee Alliance, including providing Nestlé access to certain intellectual properties and products for future resale. The up-frontpayment is being recognized as other revenue on a straight-line basis over the estimated economic life of the arrangement of 40 years for the ongoing access to thelicenses within the contractual territories. Our obligations to maintain the Starbucks brand and other intellectual properties are generally constant throughout theterm of the arrangement. Therefore, a ratable recognition pattern is reflective of how we will satisfy our performance obligations.
At October 3, 2021, the current and long-term deferred revenue related to the Nestlé up-front payment was $177.0 million and $6.4 billion, respectively. AtSeptember 27, 2020, the current and long-term deferred revenue related to the Nestlé up-front payment was $179.3 million and $6.5 billion, respectively. Duringthe fiscal years ended October 3, 2021, September 27, 2020 and September 29, 2019, we recognized $176.6 million, $176.8 million and $175.2 million of currentdeferred revenue, respectively, related to amortization of the up-front payment.
Changes in our deferred revenue balance related to our stored value cards and loyalty program (in millions):Fiscal Year Ended October 3, 2021 TotalStored value cards and loyalty program at September 27, 2020 $ 1,280.5 Revenue deferred - card activations, card reloads and Stars earned 12,563.4 Revenue recognized - card and Stars redemptions and breakage (12,401.7)Other 6.3 Stored value cards and loyalty program at October 3, 2021 $ 1,448.5
Fiscal Year Ended September 27, 2020 TotalStored value cards and loyalty program at September 29, 2019 $ 1,113.7 Revenue deferred - card activations, card reloads and Stars earned 10,527.7 Revenue recognized - card and Stars redemptions and breakage (10,367.9)Other 7.0 Stored value cards and loyalty program at September 27, 2020 $ 1,280.5
“Other” primarily consists of changes in the stored value cards and loyalty program balances resulting from foreign currency translation.
As of October 3, 2021, approximately $1.3 billion of this amount was current. As of September 27, 2020, approximately $1.2 billion of this amount wascurrent.
Note 12: Equity
In addition to 2.4 billion shares of authorized common stock with $0.001 par value per share, we have authorized 7.5 million shares of preferred stock, none ofwhich was outstanding at October 3, 2021.
In March 2019, we entered into ASR agreements with third-party financial institutions totaling $2.0 billion, effective March 22, 2019. We made a $2.0 billion up-front payment to the financial institutions and received an initial delivery of 22.2 million shares. In June 2019, we received an additional 3.9 million shares uponthe completion of the program based on a volume-weighted average share price (less discount) of $76.50.
Outside of the ASR agreements noted above, we repurchased 36.6 million shares of common stock for $3.1 billion on the open market during the year endedSeptember 29, 2019. In total, we repurchased 139.6 million shares at a total cost of $10.1 billion for the year ended September 29, 2019.
Our Board of Directors authorized the repurchase of up to an additional 120 million and 40 million shares under our ongoing share repurchase program during thefiscal first quarter of 2019 and fiscal second quarter of 2020, respectively. In March 2020, we announced a temporary suspension of our share repurchase programuntil we restored certain financial leverage targets. We repurchased 20.3 million shares of common stock for $1.7 billion on the open market during the year endedSeptember 27, 2020. As of September 27, 2020, 48.9 million shares remained available for repurchase under current authorizations. Due to our business recoveryand restoration of certain leverage metrics, we have resumed our share repurchase program in the first quarter of fiscal 2022.
(1)
(2)
(1)
(2)
(1)
(2)
71

Table of Contents
During the fourth quarter of fiscal 2021, our Board of Directors declared a quarterly cash dividend to shareholders of $0.49 per share to be paid on November 26,2021 to shareholders of record as of the close of business on November 12, 2021.
Comprehensive Income
Comprehensive income includes all changes in equity during the period, except those resulting from transactions with our shareholders. Comprehensive income iscomprised of net earnings and other comprehensive income. Accumulated other comprehensive income reported on our consolidated balance sheets consists offoreign currency translation adjustments and other items and the unrealized gains and losses, net of applicable taxes, on available-for-sale debt securities and onderivative instruments designated and qualifying as cash flow and net investment hedges.
Changes in AOCI by component for the years ended October 3, 2021, September 27, 2020 and September 29, 2019, net of tax, are as follows:
(in millions) Available-for-Sale
Securities Cash Flow
Hedges Net Investment
Hedges
TranslationAdjustment and
Other TotalOctober 3, 2021Net gains/(losses) in AOCI, beginning of period $ 5.7 $ (82.1) $ 11.5 $ (299.7) $ (364.6)
Net gains/(losses) recognized in OCI before reclassifications (2.7) 240.2 47.1 190.4 475.0 Net (gains)/losses reclassified from AOCI to earnings (1.5) 0.2 (10.0) 48.1 36.8
Other comprehensive income/(loss) attributable to Starbucks (4.2) 240.4 37.1 238.5 511.8 Net gains/(losses) in AOCI, end of period $ 1.5 $ 158.3 $ 48.6 $ (61.2) $ 147.2
(in millions) Available-for-Sale
Securities Cash Flow
Hedges Net Investment
Hedges
TranslationAdjustment and
Other TotalSeptember 27, 2020Net gains/(losses) in AOCI, beginning of period $ 3.9 $ 11.0 $ (10.1) $ (508.1) $ (503.3)
Net gains/(losses) recognized in OCI before reclassifications 6.5 (95.0) 28.9 208.4 148.8 Net (gains)/losses reclassified from AOCI to earnings (4.0) (1.1) (9.8) — (14.9)
Other comprehensive income/(loss) attributable to Starbucks 2.5 (96.1) 19.1 208.4 133.9 Cumulative effect of accounting adoption (0.7) 3.0 2.5 — 4.8 Net gains/(losses) in AOCI, end of period $ 5.7 $ (82.1) $ 11.5 $ (299.7) $ (364.6)
(in millions) Available-for-Sale Securities
Cash FlowHedges
Net InvestmentHedges
TranslationAdjustment and
Other TotalSeptember 29, 2019Net gains/(losses) in AOCI, beginning of period $ (4.9) $ 17.7 $ 19.6 $ (362.7) $ (330.3)
Net gains/(losses) recognized in OCI before reclassifications 8.2 (10.7) (29.7) (143.7) (175.9)Net (gains)/losses reclassified from AOCI to earnings 0.6 4.0 — (1.7) 2.9
Other comprehensive income/(loss) attributable to Starbucks 8.8 (6.7) (29.7) (145.4) (173.0)Net gains/(losses) in AOCI, end of period $ 3.9 $ 11.0 $ (10.1) $ (508.1) $ (503.3)
72

Table of Contents
Impact of reclassifications from AOCI on the consolidated statements of earnings (in millions):
AOCIComponents
Amounts Reclassified from AOCI
Affected Line Item inthe Statements of Earnings
Year EndedOct 3, 2021 Sep 27, 2020 Sep 29, 2019
Gains/(losses) on available-for-sale securities $ 1.8 $ 4.9 $ 0.9 Interest income and other, netGains/(losses) on cash flow hedges 1.9 1.9 (3.9) Please refer to Note 3, Derivative Instruments for additional
information.Gains/(losses) on net investment hedges 13.4 13.3 — Interest expenseTranslation adjustment and other
Korea (58.9) — — Net gain resulting from divestiture of certain operationsThailand — — 1.7 Net gain resulting from divestiture of certain operations
(41.8) 20.1 (1.3) Total before tax5.0 (5.2) (1.6) Tax (expense)/benefit
$ (36.8) $ 14.9 $ (2.9) Net of tax
Release of cumulative translation adjustments and other activities to earnings upon sale or liquidation of foreign businesses.
Note 13: Employee Stock and Benefit Plans
We maintain several equity incentive plans under which we may grant non-qualified stock options, incentive stock options, restricted stock, restricted stock units(“RSUs”) or stock appreciation rights to employees, non-employee directors and consultants. We issue new shares of common stock upon exercise of stock optionsand the vesting of RSUs. We also have an employee stock purchase plan (“ESPP”).
As of October 3, 2021, there were 41.0 million shares of common stock available for issuance pursuant to future equity-based compensation awards and 11.3million shares available for issuance under our ESPP.
Stock-based compensation expense recognized in the consolidated financial statements (in millions):Fiscal Year Ended Oct 3, 2021 Sep 27, 2020 Sep 29, 2019RSUs $ 316.9 $ 241.0 $ 288.0 Options 2.2 7.5 20.0 Total stock-based compensation expense recognized in the consolidated statements ofearnings $ 319.1 $ 248.5 $ 308.0 Total related tax benefit $ 51.6 $ 47.8 $ 59.3 Total capitalized stock-based compensation included in net property, plant andequipment on the consolidated balance sheets $ 3.7 $ 3.6 $ 3.4
RSUs
We have both time-vested and performance-based RSUs. Time-vested RSUs are awarded to eligible employees and entitle the grantee to receive shares of commonstock at the end of a vesting period, subject solely to the employee’s continuing employment. The time-vested RSUs either vest in two or four equal annualinstallments beginning a year from the grant date. Our performance-based RSUs are awarded to eligible employees and entitle the grantee to receive shares ofcommon stock if we achieve specified performance goals during the performance period and the grantee remains employed through the vesting period.
(1)
(1)
73

Table of Contents
RSU transactions for the year ended October 3, 2021 (in millions, except per share and contractual life amounts):
Number of
Shares
Weighted Average
Grant Date Fair Value per Share
Weighted Average
Remaining Contractual Life (Years)
Aggregate Intrinsic
ValueNonvested, September 27, 2020 8.3 $ 74.23 1.1 $ 699 Granted 4.1 96.05 Vested (3.2) 69.99 Forfeited/canceled (1.5) 87.72 Nonvested, October 3, 2021 7.7 86.23 0.9 869
As of October 3, 2021, total unrecognized stock-based compensation expense related to nonvested RSUs, net of estimated forfeitures, was approximately $145million, before income taxes, and is expected to be recognized over a weighted average period of approximately 2.0 years. The total fair value of RSUs vested was$226 million, $211 million and $255 million during fiscal 2021, 2020 and 2019, respectively. For fiscal 2020 and 2019, the weighted average fair value per RSUgranted was $81.96 and $68.14, respectively.
Stock Option Plans
We may provide stock options as a form of employee compensation, which are primarily time-vested. The majority of time-vested options become exercisable infour equal installments beginning a year from the grant date and generally expire 10 years from the grant date. Options granted to non-employee directors generallyvest immediately or one year from grant. All outstanding stock options are non-qualified stock options.
The fair value of stock option awards was estimated at the grant date with the following weighted average assumptions for fiscal 2021, 2020 and 2019:Stock Options
Granted During the PeriodFiscal Year Ended 2021 2020 2019Expected term (in years) 8.1 7.8 4.1Expected stock price volatility 26.3 % 27.3 % 21.6 %Risk-free interest rate 1.4 % 1.2 % 2.9 %Expected dividend yield 1.6 % 2.9 % 2.1 %Weighted average grant price $ 110.46 $ 56.33 $ 67.33 Estimated fair value per option granted $ 27.59 $ 11.30 $ 11.06
The expected term of the options represents the estimated period of time until exercise and is based on historical experience of similar awards, giving considerationto the contractual terms, vesting schedules and expectations of future employee behavior. Expected stock price volatility is based on a combination of historicalvolatility of our stock and the one-year implied volatility of Starbucks traded options, for the related vesting periods. The risk-free interest rate is based on theimplied yield available on U.S. Treasury zero-coupon issues with an equivalent remaining term. The dividend yield assumption is based on our anticipated cashdividend payouts. The amounts shown above for the estimated fair value per option granted are before the estimated effect of forfeitures, which reduce the amountof expense recorded in the consolidated statements of earnings.
74

Table of Contents
Stock option transactions for the year ended October 3, 2021 (in millions, except per share and contractual life amounts):
Shares Subject to
Options
Weighted Average Exercise
Price per Share
Weighted Average
Remaining Contractual Life (Years)
Aggregate Intrinsic
ValueOutstanding, September 27, 2020 9.2 $ 53.06 5.4 $ 286 Granted 0.0 110.46 Exercised (4.0) 51.31 Expired/forfeited 0.0 56.69 Outstanding, October 3, 2021 5.2 54.58 4.5 303 Exercisable, October 3, 2021 4.4 53.06 4.1 261 Vested and expected to vest, October 3, 2021 5.2 54.57 4.5 302
The aggregate intrinsic value in the table above, which is the amount by which the market value of the underlying stock exceeded the exercise price of outstandingoptions, is before applicable income taxes and represents the amount optionees would have realized if all in-the-money options had been exercised on the lastbusiness day of the period indicated.
As of October 3, 2021, total unrecognized stock-based compensation expense, net of estimated forfeitures, related to nonvested options was approximately $0.1million, before income taxes, and is expected to be recognized over a weighted average period of approximately 0.5 years. The total intrinsic value of optionsexercised was $219 million, $236 million and $466 million during fiscal 2021, 2020 and 2019, respectively. The total fair value of options vested was $14 million,$25 million and $31 million during fiscal 2021, 2020 and 2019, respectively.
ESPP
Our ESPP allows eligible employees to contribute up to 10% of their base earnings toward the quarterly purchase of our common stock, subject to an annualmaximum dollar amount. The purchase price is 95% of the fair market value of the stock on the last business day of the quarterly offering period. The number ofshares issued under our ESPP was 0.5 million in fiscal 2021.
Deferred Compensation Plan
We have a Deferred Compensation Plan for Non-Employee Directors under which non-employee directors may, for any fiscal year, irrevocably elect to deferreceipt of shares of common stock the director would have received upon vesting of restricted stock units. The number of deferred shares outstanding related todeferrals made under this plan is not material.
Defined Contribution Plans
We maintain voluntary defined contribution plans, both qualified and non-qualified, covering eligible employees as defined in the plan documents. Participatingemployees may elect to defer and contribute a portion of their eligible compensation to the plans up to limits stated in the plan documents, not to exceed the dollaramounts set by applicable laws.
Our matching contributions to all U.S. and non-U.S. plans were $145.1 million, $132.7 million and $122.1 million in fiscal 2021, 2020 and 2019, respectively.
Note 14: Income Taxes
Components of earnings before income taxes (in millions):Fiscal Year Ended Oct 3, 2021 Sep 27, 2020 Sep 29, 2019United States $ 4,138.5 $ 904.6 $ 3,518.7 Foreign 1,218.4 259.8 947.5 Total earnings before income taxes $ 5,356.9 $ 1,164.4 $ 4,466.2
75

Table of Contents
Provision/(benefit) for income taxes (in millions):Fiscal Year Ended Oct 3, 2021 Sep 27, 2020 Sep 29, 2019Current taxes:
U.S. federal $ 681.8 $ 49.9 $ 1,414.3 U.S. state and local 190.0 36.9 447.8 Foreign 409.8 181.4 458.3
Total current taxes 1,281.6 268.2 2,320.4 Deferred taxes:
U.S. federal 10.4 (8.4) (1,074.5)U.S. state and local (6.4) (4.8) (322.4)Foreign (129.0) (15.3) (51.9)
Total deferred taxes (125.0) (28.5) (1,448.8)Total income tax expense $ 1,156.6 $ 239.7 $ 871.6
Reconciliation of the statutory U.S. federal income tax rate with our effective income tax rate:Fiscal Year Ended Oct 3, 2021 Sep 27, 2020 Sep 29, 2019Statutory rate 21.0 % 21.0 % 21.0 %State income taxes, net of federal tax benefit 2.7 2.2 2.1 Foreign rate differential 0.5 (3.2) (0.1)Change in tax rates (1.3) (2.2) — Excess tax benefits of stock-based compensation (0.9) (4.2) (2.1)Foreign derived intangible income (0.5) (1.4) (1.5)Charitable contributions (0.4) (1.7) — Valuation allowances 0.2 10.0 — Residual tax on foreign earnings — — 1.7 Tax impacts related to sale of certain operations — — (1.3)Other, net 0.3 0.1 (0.3)Effective tax rate 21.6 % 20.6 % 19.5 %
As of October 3, 2021, in certain foreign subsidiaries in which we are partially indefinitely reinvested, the gross taxable temporary difference between theaccounting basis and tax basis was approximately $1.8 billion for which there could be up to approximately $290 million of unrecognized tax liability.
76

Table of Contents
Tax effect of temporary differences and carryforwards that comprise significant portions of deferred tax assets and liabilities (in millions):Oct 3, 2021 Sep 27, 2020
Deferred tax assets:Operating lease liabilities $ 2,395.2 $ 2,313.0 Stored value card liability and deferred revenue 1,679.4 1,678.6 Intangible assets and goodwill 317.7 248.6 Other 641.0 554.4 Total $ 5,033.3 $ 4,794.6 Valuation allowance (275.3) (239.4)Total deferred tax asset, net of valuation allowance $ 4,758.0 $ 4,555.2 Deferred tax liabilities:Operating lease, right-of-use assets (2,296.5) (2,191.8)Property, plant and equipment (451.2) (463.3)Other (284.0) (268.3)Total (3,031.7) (2,923.4)Net deferred tax asset (liability) $ 1,726.3 $ 1,631.8 Reported as:Deferred income tax assets 1,874.8 1,789.9 Deferred income tax liabilities (included in Other long-term liabilities) (148.5) (158.1)Net deferred tax asset (liability) $ 1,726.3 $ 1,631.8
The valuation allowances as of October 3, 2021 and September 27, 2020 were primarily related to net operating losses and other deferred tax assets of consolidatedforeign subsidiaries.
As of October 3, 2021, we had federal net operating loss carryforwards of $70.8 million which have an indefinite carryforward period, state net operating losscarryforwards of $109.7 million which will begin to expire in fiscal 2024, federal tax credit carryforwards of $21.8 million which will begin to expire in fiscal2030, state tax credit carryforwards of $1.2 million which will begin to expire in fiscal 2024 and foreign net operating loss carryforwards of $327.9 million, ofwhich $118.8 million have an indefinite carryforward period and the remainder expire at various dates starting from fiscal 2022.
Uncertain Tax Positions
As of October 3, 2021, we had $82.6 million of gross unrecognized tax benefits of which $62.8 million, if recognized, would affect our effective tax rate. Werecognized a benefit of $4.6 million, an expense of $3.0 million and a benefit of $2.8 million of interest and penalties in income tax expense, prior to the benefit ofthe federal tax deduction, for fiscal 2021, 2020 and 2019, respectively. As of October 3, 2021 and September 27, 2020, we had accrued interest and penalties of$7.1 million and $13.0 million, respectively, within our consolidated balance sheets.
The following table summarizes the activity related to our unrecognized tax benefits (in millions):Oct 3, 2021 Sep 27, 2020 Sep 29, 2019
Beginning balance $ 123.7 $ 132.1 $ 224.6 Increase related to prior year tax positions 4.8 11.1 3.8 Decrease related to prior year tax positions (11.9) (0.5) (75.3)Increase related to current year tax positions 8.9 9.8 18.5 Decreases related to settlements with taxing authorities (4.4) — (16.4)Decrease related to lapsing of statute of limitations (38.5) (28.8) (23.1)Ending balance $ 82.6 $ 123.7 $ 132.1
We are currently under examination, or may be subject to examination, by various U.S. federal, state, local and foreign tax jurisdictions for fiscal 2014 through2020. We are no longer subject to U.S. federal examination for years prior to fiscal 2018, U.S. state and local examinations for years prior to fiscal 2014 orexamination in any material international markets prior to 2015.
77

Table of Contents
We do not expect a significant amount of Company's gross unrecognized tax benefits to be recognized by the end of fiscal 2022 for reasons such as a lapse of thestatute of limitations or resolution of examinations with tax authorities.
Note 15: Earnings per Share
Calculation of net earnings per common share (“EPS”) — basic and diluted (in millions, except EPS):Fiscal Year Ended Oct 3, 2021 Sep 27, 2020 Sep 29, 2019Net earnings attributable to Starbucks $ 4,199.3 $ 928.3 $ 3,599.2 Weighted average common shares outstanding (for basic calculation) 1,177.6 1,172.8 1,221.2 Dilutive effect of outstanding common stock options and RSUs 7.9 9.0 12.0 Weighted average common and common equivalent shares outstanding (for dilutedcalculation) 1,185.5 1,181.8 1,233.2 EPS — basic $ 3.57 $ 0.79 $ 2.95 EPS — diluted $ 3.54 $ 0.79 $ 2.92
Potential dilutive shares consist of the incremental common shares issuable upon the exercise of outstanding stock options (both vested and non-vested) andunvested RSUs, calculated using the treasury stock method. The calculation of dilutive shares outstanding would exclude out-of-the-money stock options (i.e., suchoptions’ exercise prices were greater than the average market price of our common shares for the period) because their inclusion would be antidilutive. As ofOctober 3, 2021, September 27, 2020 and September 29, 2019, we had no out-of-the-money stock options.
Note 16: Commitments and Contingencies
Legal Proceedings
On April 13, 2010, an organization named Council for Education and Research on Toxics (“Plaintiff”) filed a lawsuit in the Superior Court of the State ofCalifornia, County of Los Angeles, against the Company and certain other defendants who manufacture, package, distribute or sell brewed coffee. The lawsuit isCouncil for Education and Research on Toxics v. Starbucks Corporation, et al. On May 9, 2011, the Plaintiff filed an additional lawsuit in the Superior Court of theState of California, County of Los Angeles, against the Company and additional defendants who manufacture, package, distribute or sell packaged coffee. Thelawsuit is Council for Education and Research on Toxics v. Brad Barry LLC, et al. Both cases have since been consolidated and now include nearly eightydefendants, which constitute the great majority of the coffee industry in California. Plaintiff alleges that the Company and the other defendants failed to providewarnings for their coffee products of exposure to the chemical acrylamide as required under California Health and Safety Code section 25249.5, the California SafeDrinking Water and Toxic Enforcement Act of 1986, better known as Proposition 65. Plaintiff seeks equitable relief, including providing warnings to consumers ofcoffee products, as well as civil penalties in the amount of the statutory maximum of two thousand five hundred dollars per day per violation of Proposition 65.The Plaintiff asserts that every consumed cup of coffee, absent a compliant warning, is equivalent to a violation under Proposition 65.
The Company, as part of a joint defense group organized to defend against the lawsuit, disputes the claims of the Plaintiff. Acrylamide is not added to coffee but ispresent in all coffee in small amounts (parts per billion) as a byproduct of the coffee bean roasting process. The Company has asserted multiple affirmativedefenses. Trial of the first phase of the case commenced on September 8, 2014, and was limited to three affirmative defenses shared by all defendants. OnSeptember 1, 2015, the trial court issued a final ruling adverse to defendants on all Phase 1 defenses. Trial of the second phase of the case commenced in the fall of2017. On May 7, 2018, the trial court issued a ruling adverse to defendants on the Phase 2 defense, the Company's last remaining defense to liability. On June 22,2018, the California Office of Environmental Health Hazard Assessment (“OEHHA”) proposed a new regulation clarifying that cancer warnings are not requiredfor coffee under Proposition 65. The case was set to proceed to a third phase trial on damages, remedies and attorneys’ fees on October 15, 2018. However, onOctober 12, 2018, the California Court of Appeal granted the defendants request for a stay of the Phase 3 trial.
On June 3, 2019, the Office of Administrative Law approved the coffee exemption regulation. The regulation became effective on October 1, 2019. On June 24,2019, the Court of Appeal lifted the stay of the litigation. At the status conference on August 25, 2020, the trial judge granted the defendants’ motion for summaryjudgment, ruling that the coffee exemption regulation is a complete defense to the Plaintiff’s complaint. The Notice of Entry of Judgment from the court wasserved on October 6, 2020, and the Plaintiff filed a Notice of Appeal on November 20, 2020, and its opening brief in the appeals process on April 9, 2021.Defendants filed their response brief on August 9, 2021, and Plaintiff filed a reply on November 15, 2021. Starbucks believes that the likelihood that the Companywill ultimately incur a material loss in connection with this litigation is less than reasonably possible. Accordingly, no loss contingency was recorded for thismatter.
78
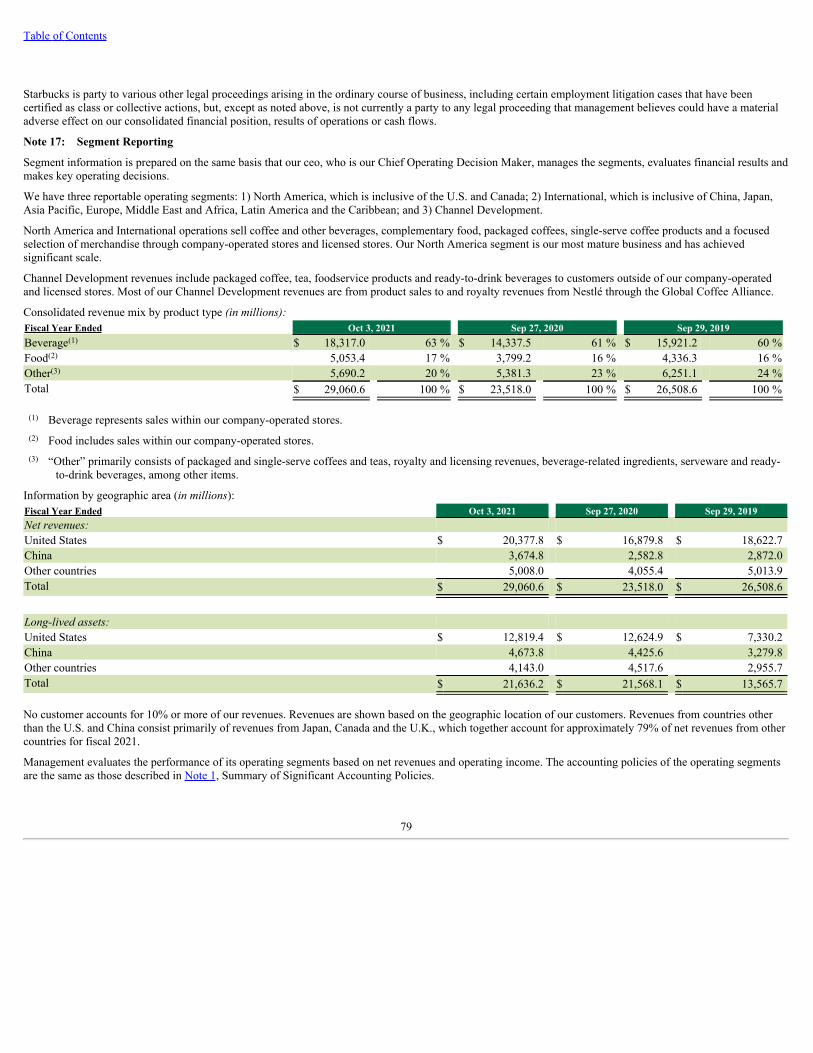
Table of Contents
Starbucks is party to various other legal proceedings arising in the ordinary course of business, including certain employment litigation cases that have beencertified as class or collective actions, but, except as noted above, is not currently a party to any legal proceeding that management believes could have a materialadverse effect on our consolidated financial position, results of operations or cash flows.
Note 17: Segment Reporting
Segment information is prepared on the same basis that our ceo, who is our Chief Operating Decision Maker, manages the segments, evaluates financial results andmakes key operating decisions.
We have three reportable operating segments: 1) North America, which is inclusive of the U.S. and Canada; 2) International, which is inclusive of China, Japan,Asia Pacific, Europe, Middle East and Africa, Latin America and the Caribbean; and 3) Channel Development.
North America and International operations sell coffee and other beverages, complementary food, packaged coffees, single-serve coffee products and a focusedselection of merchandise through company-operated stores and licensed stores. Our North America segment is our most mature business and has achievedsignificant scale.
Channel Development revenues include packaged coffee, tea, foodservice products and ready-to-drink beverages to customers outside of our company-operatedand licensed stores. Most of our Channel Development revenues are from product sales to and royalty revenues from Nestlé through the Global Coffee Alliance.
Consolidated revenue mix by product type (in millions):Fiscal Year Ended Oct 3, 2021 Sep 27, 2020 Sep 29, 2019Beverage $ 18,317.0 63 % $ 14,337.5 61 % $ 15,921.2 60 %Food 5,053.4 17 % 3,799.2 16 % 4,336.3 16 %Other 5,690.2 20 % 5,381.3 23 % 6,251.1 24 %Total $ 29,060.6 100 % $ 23,518.0 100 % $ 26,508.6 100 %
Beverage represents sales within our company-operated stores.
Food includes sales within our company-operated stores.
“Other” primarily consists of packaged and single-serve coffees and teas, royalty and licensing revenues, beverage-related ingredients, serveware and ready-to-drink beverages, among other items.
Information by geographic area (in millions):Fiscal Year Ended Oct 3, 2021 Sep 27, 2020 Sep 29, 2019Net revenues:United States $ 20,377.8 $ 16,879.8 $ 18,622.7 China 3,674.8 2,582.8 2,872.0 Other countries 5,008.0 4,055.4 5,013.9 Total $ 29,060.6 $ 23,518.0 $ 26,508.6
Long-lived assets:United States $ 12,819.4 $ 12,624.9 $ 7,330.2 China 4,673.8 4,425.6 3,279.8 Other countries 4,143.0 4,517.6 2,955.7 Total $ 21,636.2 $ 21,568.1 $ 13,565.7
No customer accounts for 10% or more of our revenues. Revenues are shown based on the geographic location of our customers. Revenues from countries otherthan the U.S. and China consist primarily of revenues from Japan, Canada and the U.K., which together account for approximately 79% of net revenues from othercountries for fiscal 2021.
Management evaluates the performance of its operating segments based on net revenues and operating income. The accounting policies of the operating segmentsare the same as those described in Note 1, Summary of Significant Accounting Policies.
(1)
(2)
(3)
(1)
(2)
(3)
79

Table of Contents
Operating income represents earnings before other income and expenses and income taxes. The identifiable assets by segment disclosed in this note are those assetsspecifically identifiable within each segment and include cash and cash equivalents, ROU assets, net property, plant and equipment, equity and cost investments,goodwill and other intangible assets. Assets not attributed to reportable operating segments are corporate assets and are primarily comprised of cash and cashequivalents available for general corporate purposes, investments, assets of the corporate headquarters and roasting facilities and inventory.
The table below presents financial information for our reportable operating segments and Corporate and Other segment for the years ended October 3, 2021,September 27, 2020 and September 29, 2019.
(in millions) North America InternationalChannel
DevelopmentCorporate and
Other TotalFiscal 2021Total net revenues $ 20,447.9 $ 6,921.6 $ 1,593.6 $ 97.5 $ 29,060.6 Depreciation and amortization expenses 753.9 544.7 1.2 141.9 1,441.7 Income from equity investees — 135.3 250.0 — 385.3 Operating income/(loss) 4,259.3 1,245.7 789.1 (1,422.0) 4,872.1 Total assets $ 10,571.8 $ 10,083.3 $ 125.4 $ 10,612.1 $ 31,392.6
Fiscal 2020Total net revenues $ 16,296.2 $ 5,230.6 $ 1,925.0 $ 66.2 $ 23,518.0 Depreciation and amortization expenses 762.0 518.4 1.2 149.7 1,431.3 Income from equity investees — 102.3 220.2 — 322.5 Operating income/(loss) 1,801.7 370.6 687.2 (1,297.8) 1,561.7 Total assets $ 10,717.4 $ 9,449.7 $ 165.0 $ 9,042.4 $ 29,374.5
Fiscal 2019Total net revenues $ 18,130.4 $ 6,319.3 $ 1,992.6 $ 66.3 $ 26,508.6 Depreciation and amortization expenses 696.1 511.5 13.0 156.7 1,377.3 Income from equity investees — 102.4 195.6 — 298.0 Operating income/(loss) 3,728.1 1,011.3 697.5 (1,359.0) 4,077.9 Total assets $ 4,446.7 $ 6,724.6 $ 132.2 $ 7,916.1 $ 19,219.6
North America, International and Corporate and Other total net revenues and operating income/(loss) for fiscal years ended September 27, 2020 andSeptember 29, 2019, have been restated to conform with current period presentation.
(1)
(1)
(1)
(1)
(1)
80
Table of Contents
REPORT OF INDEPENDENT REGISTERED PUBLIC ACCOUNTING FIRM
To the shareholders and the Board of Directors of Starbucks Corporation
Opinion on the Financial Statements
We have audited the accompanying consolidated balance sheets of Starbucks Corporation and subsidiaries (the “Company”) as of October 3, 2021 and September27, 2020, the related consolidated statements of earnings, comprehensive income, equity, and cash flows, for each of the three years in the period ended October 3,2021, and the related notes (collectively referred to as the “financial statements”). In our opinion, the financial statements present fairly, in all material respects, thefinancial position of the Company as of October 3, 2021 and September 27, 2020, and the results of its operations and its cash flows for each of the three years inthe period ended October 3, 2021, in conformity with accounting principles generally accepted in the United States of America.
We have also audited, in accordance with the standards of the Public Company Accounting Oversight Board (United States) (PCAOB), the Company's internalcontrol over financial reporting as of October 3, 2021, based on criteria established in Internal Control - Integrated Framework (2013) issued by the Committee ofSponsoring Organizations of the Treadway Commission and our report dated November 19, 2021, expressed an unqualified opinion on the Company's internalcontrol over financial reporting.
Basis for Opinion
These financial statements are the responsibility of the Company's management. Our responsibility is to express an opinion on the Company's financial statementsbased on our audits. We are a public accounting firm registered with the PCAOB and are required to be independent with respect to the Company in accordancewith the U.S. federal securities laws and the applicable rules and regulations of the Securities and Exchange Commission and the PCAOB.
We conducted our audits in accordance with the standards of the PCAOB. Those standards require that we plan and perform the audit to obtain reasonableassurance about whether the financial statements are free of material misstatement, whether due to error or fraud. Our audits included performing procedures toassess the risks of material misstatement of the financial statements, whether due to error or fraud, and performing procedures that respond to those risks. Suchprocedures included examining, on a test basis, evidence regarding the amounts and disclosures in the financial statements. Our audits also included evaluating theaccounting principles used and significant estimates made by management, as well as evaluating the overall presentation of the financial statements. We believethat our audits provide a reasonable basis for our opinion.
Critical Audit Matter
The critical audit matter communicated below is a matter arising from the current-period audit of the financial statements that was communicated or required to becommunicated to the Audit and Compliance Committee and that (1) relates to accounts or disclosures that are material to the financial statements and (2) involvedour especially challenging, subjective, or complex judgments. The communication of critical audit matters does not alter in any way our opinion on the financialstatements, taken as a whole, and we are not, by communicating the critical audit matter below, providing a separate opinion on the critical audit matter or on theaccounts or disclosures to which it relates.
Income Taxes — Indefinite Reinvestment of Foreign Earnings - Refer to Note 14 to the financial statements
Critical Audit Matter Description
Under the provisions of ASC 740, Income Taxes, (“ASC 740”), there is a presumption that investments in foreign subsidiaries will be recovered upon sale orthrough a partial or complete distribution of earnings to the parent entity, and therefore subject the parent entity to additional taxes. If sufficient evidence shows theforeign subsidiary has invested or will invest the undistributed earnings indefinitely, the ASC 740 presumption may be overcome, and no additional taxes shall beaccrued. The Company has investments in the profitable operations of certain foreign subsidiaries that may be subject to additional foreign withholding taxesand/or U.S. federal and state income taxes upon sale or a partial or complete distribution of earnings, incremental to local income taxes already paid. As of October3, 2021, the Company is partially indefinitely reinvested in certain foreign subsidiaries. The Company has recorded a deferred tax liability of $83 million related tothe taxable temporary difference for which it is not indefinitely reinvested. For the remaining $1.8 billion of taxable temporary difference, there could be up toapproximately $290 million of unrecognized tax liability.
The Company’s assertion of partial indefinite reinvestment for certain foreign subsidiaries requires management to make long-term forecasting assumptions anddetailed plans for reinvestment. The most significant assumption supporting the Company’s indefinite reinvestment assertion is the forecast of capital expendituresin international markets. Performing audit procedures to evaluate the reasonableness of management’s indefinite reinvestment analysis and capital expendituresforecast required a high degree of auditor judgment and an increased extent of effort, including the need to involve our income tax specialists.
81

Table of Contents
How the Critical Matter Was Addressed in the Audit
Our principal audit procedures related to management’s indefinite reinvestment analysis and the supporting forecast of capital expenditures for certain foreignsubsidiaries, included the following, among others:
• We tested the effectiveness of controls related to management’s forecast of capital expenditures.
• We performed a retrospective review of management’s historical ability to accurately forecast capital expenditures by comparing actual results tomanagement’s historical forecast.
• We inquired of senior executives of the Company to corroborate strategic plans for growth.
• We compared the forecasts obtained to support the indefinite reinvestment assertion to:◦ Historical capital expenditures, including costs per new store opening;◦ Historical new store growth; and◦ Historical profitability of new stores by region; and◦ Forecasts used by the Company for financial reporting purposes in other areas, such as the evaluation of the recoverability of goodwill; and◦ Internal communications to management and the Board of Directors; and◦ Forecasted information included in the Company’s press releases, other external communications and analyst reports; and◦ External publications of expected industry growth.
• With the assistance of our tax specialists, we evaluated the appropriateness of management’s analysis under ASC 740 and the sufficiency of the evidenceprovided by management to support that the Company has the intent and ability to partially indefinitely reinvest the undistributed earnings.
/s/ Deloitte & Touche LLP
Seattle, Washington
November 19, 2021
We have served as the Company's auditor since 1987.
82

Table of Contents
Item 9. Changes in and Disagreements with Accountants on Accounting and Financial Disclosure
Not applicable.
Item 9A. Controls and Procedures
Disclosure Controls and Procedures
We maintain disclosure controls and procedures that are designed to ensure that material information required to be disclosed in our periodic reports filed orsubmitted under the Securities Exchange Act of 1934, as amended (the “Exchange Act”), is recorded, processed, summarized and reported within the time periodsspecified in the SEC’s rules and forms. Our disclosure controls and procedures are also designed to ensure that information required to be disclosed in the reportswe file or submit under the Exchange Act is accumulated and communicated to our management, including our principal executive officer and principal financialofficer, as appropriate to allow timely decisions regarding required disclosure.
During the fourth quarter of fiscal 2021, we carried out an evaluation, under the supervision and with the participation of our management, including our chiefexecutive officer and our chief financial officer, of the effectiveness of the design and operation of our disclosure controls and procedures, as defined in Rules 13a-15(e) and 15d-15(e) under the Exchange Act. Based upon that evaluation, our chief executive officer and chief financial officer concluded that our disclosurecontrols and procedures were effective, as of the end of the period covered by this report (October 3, 2021).
There were no changes in our internal control over financial reporting (as defined in Rules 13a-15(f) and 15d-15(f) of the Exchange Act) during our most recentlycompleted fiscal quarter that materially affected or are reasonably likely to materially affect internal control over financial reporting.
The certifications required by Section 302 of the Sarbanes-Oxley Act of 2002 are filed as exhibits 31.1 and 31.2, respectively, to this 10-K.
Report of Management on Internal Control over Financial Reporting
Our management is responsible for establishing and maintaining adequate internal control over financial reporting. Internal control over financial reporting is aprocess to provide reasonable assurance regarding the reliability of our financial reporting for external purposes in accordance with accounting principles generallyaccepted in the United States of America. Internal control over financial reporting includes maintaining records that in reasonable detail accurately and fairlyreflect our transactions; providing reasonable assurance that transactions are recorded as necessary for preparation of our financial statements; providing reasonableassurance that receipts and expenditures are made in accordance with management authorization; and providing reasonable assurance that unauthorized acquisition,use or disposition of company assets that could have a material effect on our financial statements would be prevented or detected on a timely basis. Because of itsinherent limitations, internal control over financial reporting is not intended to provide absolute assurance that a misstatement of our financial statements would beprevented or detected.
Management conducted an evaluation of the effectiveness of our internal control over financial reporting based on the framework and criteria established inInternal Control — Integrated Framework, issued by the Committee of Sponsoring Organizations of the Treadway Commission. This evaluation included reviewof the documentation of controls, evaluation of the design effectiveness of controls, testing of the operating effectiveness of controls and a conclusion on thisevaluation. Based on this evaluation, management concluded that our internal control over financial reporting was effective as of October 3, 2021.
Our internal control over financial reporting as of October 3, 2021 has been audited by Deloitte & Touche LLP, an independent registered public accounting firm,as stated in their report which is included herein.
83

Table of Contents
REPORT OF INDEPENDENT REGISTERED PUBLIC ACCOUNTING FIRM
To the shareholders and the Board of Directors of Starbucks Corporation
Opinion on Internal Control over Financial Reporting
We have audited the internal control over financial reporting of Starbucks Corporation and subsidiaries (the “Company”) as of October 3, 2021, based on criteriaestablished in Internal Control - Integrated Framework (2013) issued by the Committee of Sponsoring Organizations of the Treadway Commission (COSO). Inour opinion, the Company maintained, in all material respects, effective internal control over financial reporting as of October 3, 2021, based on criteria establishedin Internal Control - Integrated Framework (2013) issued by COSO.
We have also audited, in accordance with the standards of the Public Company Accounting Oversight Board (United States) (PCAOB), the consolidated financialstatements as of and for the year ended October 3, 2021, of the Company and our report dated November 19, 2021, expressed an unqualified opinion on thosefinancial statements.
Basis for Opinion
The Company’s management is responsible for maintaining effective internal control over financial reporting and for its assessment of the effectiveness of internalcontrol over financial reporting, included in the accompanying Report of Management on Internal Control over Financial Reporting. Our responsibility is toexpress an opinion on the Company’s internal control over financial reporting based on our audit. We are a public accounting firm registered with the PCAOB andare required to be independent with respect to the Company in accordance with the U.S. federal securities laws and the applicable rules and regulations of theSecurities and Exchange Commission and the PCAOB.
We conducted our audit in accordance with the standards of the PCAOB. Those standards require that we plan and perform the audit to obtain reasonable assuranceabout whether effective internal control over financial reporting was maintained in all material respects. Our audit included obtaining an understanding of internalcontrol over financial reporting, assessing the risk that a material weakness exists, testing and evaluating the design and operating effectiveness of internal controlbased on the assessed risk, and performing such other procedures as we considered necessary in the circumstances. We believe that our audit provides a reasonablebasis for our opinion.
Definition and Limitations of Internal Control over Financial Reporting
A company’s internal control over financial reporting is a process designed to provide reasonable assurance regarding the reliability of financial reporting and thepreparation of financial statements for external purposes in accordance with generally accepted accounting principles. A company’s internal control over financialreporting includes those policies and procedures that (1) pertain to the maintenance of records that, in reasonable detail, accurately and fairly reflect thetransactions and dispositions of the assets of the company; (2) provide reasonable assurance that transactions are recorded as necessary to permit preparation offinancial statements in accordance with generally accepted accounting principles, and that receipts and expenditures of the company are being made only inaccordance with authorizations of management and directors of the company; and (3) provide reasonable assurance regarding prevention or timely detection ofunauthorized acquisition, use, or disposition of the company’s assets that could have a material effect on the financial statements.
Because of its inherent limitations, internal control over financial reporting may not prevent or detect misstatements. Also, projections of any evaluation ofeffectiveness to future periods are subject to the risk that controls may become inadequate because of changes in conditions, or that the degree of compliance withthe policies or procedures may deteriorate.
/s/ Deloitte & Touche LLP
Seattle, Washington
November 19, 2021
84

Table of Contents
Item 9B. Other Information
None.
Item 9C. Disclosure Regarding Foreign Jurisdictions that Prevent Inspections
Not applicable.
85

Table of Contents
PART III
Item 10. Directors, Executive Officers and Corporate Governance
Information regarding our executive officers is set forth in Item 1 of Part I of this Report under the caption “Information about our Executive Officers.”
We adopted a code of ethics that applies to our chief executive officer, chief financial officer, controller and other finance leaders, which is a “code of ethics” asdefined by applicable rules of the SEC. This code is publicly available on our website at www.starbucks.com/about-us/company-information/corporate-governance. If we make any amendments to this code other than technical, administrative or other non-substantive amendments, or grant any waivers, includingimplicit waivers, from a provision of this code to our chief executive officer, chief operating officer, chief financial officer, chief accounting officer or controller,we will disclose the nature of the amendment or waiver, its effective date and to whom it applies on our website at www.starbucks.com/about-us/company-information/corporate-governance or in a report on Form 8-K filed with the SEC.
The remaining information required by this item is incorporated herein by reference to the sections entitled “Proposal 1 - Election of Directors,” “BeneficialOwnership of Common Stock,” “Corporate Governance” and “Corporate Governance - Audit and Compliance Committee” in our definitive Proxy Statement forthe Annual Meeting of Shareholders to be held on March 16, 2022 (the “Proxy Statement”).
We will provide disclosure of delinquent Section 16(a) reports, if any, in our Proxy Statement, and such disclosure, if any, is incorporated herein by reference.
Item 11. Executive Compensation
The information required by this item is incorporated by reference to the sections entitled “Executive Compensation,” “Executive Compensation Tables,”“Compensation of Directors” and “Compensation Committee Interlocks and Insider Participation” in the Proxy Statement.
Item 12. Security Ownership of Certain Beneficial Owners and Management and Related Shareholder Matters
The information required by this item is incorporated by reference to the sections entitled “Equity Compensation Plan Information” and “Beneficial Ownership ofCommon Stock” in the Proxy Statement.
Item 13. Certain Relationships and Related Transactions and Director Independence
The information required by this item is incorporated by reference to the section entitled “Certain Relationships and Related Person Transactions” and “CorporateGovernance - Affirmative Determinations Regarding Director Independence and Other Matters” in the Proxy Statement.
Item 14. Principal Accountant Fees and Services
The information required by this item is incorporated by reference to the sections entitled “Proposal 4 - Ratification of Selection of Deloitte & Touche LLP as ourIndependent Registered Public Accounting Firm - Independent Registered Public Accounting Firm Fees” and “Proposal 4 - Ratification of Selection of Deloitte &Touche LLP as our Independent Registered Public Accounting Firm - Policy on Audit Committee Pre-Approval of Audit and Permissible Non-Audit Services ofthe Independent Registered Public Accounting Firm” in the Proxy Statement.
86

Table of Contents
PART IV
Item 15. Exhibits and Financial Statement Schedules
(a) The following documents are filed as a part of this 10-K:
1. Financial Statements
The following financial statements are included in Part II, Item 8 of this 10-K:
• Consolidated Statements of Earnings for the fiscal years ended October 3, 2021, September 27, 2020, and September 29, 2019;
• Consolidated Statements of Comprehensive Income for the fiscal years ended October 3, 2021, September 27, 2020, and September 29, 2019;
• Consolidated Balance Sheets as of October 3, 2021 and September 27, 2020;
• Consolidated Statements of Cash Flows for the fiscal years ended October 3, 2021, September 27, 2020, and September 29, 2019;
• Consolidated Statements of Equity for the fiscal years ended October 3, 2021, September 27, 2020, and September 29, 2019;
• Notes to Consolidated Financial Statements; and
• Reports of Independent Registered Public Accounting Firm
2. Financial Statement Schedules
Financial statement schedules are omitted because they are not required or are not applicable, or the required information is provided in the consolidated financialstatements or notes described in Item 15(a)(1) above.
87

Table of Contents
3. Exhibits Incorporated by Reference
ExhibitNumber Exhibit Description Form File No. Date of Filing
ExhibitNumber
FiledHerewith
2.1 Transaction Agreement, dated as of May 6,2018, by and between Starbucks Corporationand Nestlé S.A.
8-K 0-20322 5/7/2018 2.1
3.1 Restated Articles of Incorporation ofStarbucks Corporation
10-Q 0-20322 4/28/2015 3.1
3.2 Amended and Restated Bylaws of StarbucksCorporation (As amended and restatedthrough March 17, 2021)
8-K 0-20322 3/19/2021 3.1
4.1 Indenture, dated as of September 15, 2016, byand between Starbucks Corporation and U.S.Bank National Association, as trustee
S-3ASR 333-213645 9/15/2016 4.1
4.2 First Supplemental Indenture, dated March17, 2017, by and between StarbucksCorporation and U.S. Bank NationalAssociation, as trustee, transfer agent andregistrar, and Elavon Financial Services,DAC, UK Branch, as paying agent (0.372%Senior Notes due 2024)
8-K 0-20322 3/20/2017 4.2
4.3 Form of 0.372% Senior Note due March 15,2024
8-K 0-20322 3/20/2017 4.3
4.4 Second Supplemental Indenture, dated as ofNovember 22, 2017, by and betweenStarbucks Corporation and U.S. BankNational Association, as trustee (2.200%Senior Notes due 2020 and 3.750% SeniorNotes due 2047)
8-K 0-20322 11/22/2017 4.2
4.5 Form of 3.750% Senior Notes dueDecember 1, 2047 (included in Exhibit 4.2)
8-K 0-20322 11/22/2017 4.4
4.6 Third Supplemental Indenture, dated as ofFebruary 28, 2018, by and between StarbucksCorporation and U.S. Bank NationalAssociation, as trustee (3.100% Senior Notesdue 2023 and 3.500% Senior Notes due 2028)
8-K 0-20322 2/28/2018 4.2
4.7 Form of 3.100% Senior Notes due March 1,2023
8-K 0-20322 2/28/2018 4.3
4.8 Form of 3.500% Senior Notes due March 1,2028
8-K 0-20322 2/28/2018 4.4
4.9 Fourth Supplemental Indenture, dated as ofAugust 10, 2018, by and between StarbucksCorporation and U.S. Bank NationalAssociation, as trustee (3.800% Senior Notesdue 2025, 4.000% Senior Notes due 2028 and4.500% Senior Notes due 2048)
8-K 0-20322 8/10/2018 4.2
4.10 Form of 3.800% Senior Notes due August 15,2025
8-K 0-20322 8/10/2018 4.3
4.11 Form of 4.000% Senior Notes due November15, 2028
8-K 0-20322 8/10/2018 4.4
88

Table of Contents
Incorporated by Reference ExhibitNumber Exhibit Description Form File No. Date of Filing
ExhibitNumber
FiledHerewith
4.12 Form of 4.500% Senior Notes due November15, 2048
8-K
4.13 Fifth Supplemental Indenture, dated as ofMay 13, 2019, by and between StarbucksCorporation and U.S. Bank NationalAssociation, as trustee (3.550% Senior Notesdue 2029 and 4.450% Senior Notes due 2049)
8-K 0-20322 5/13/2019 4.2
4.14 Form of 3.550% Senior Notes due August 15,2029 (included in Exhibit 4.2)
8-K 0-20322 5/13/2019 4.3
4.15 Form of 4.450% Senior Notes due August 15,2049 (included in Exhibit 4.2)
8-K 0-20322 5/13/2019 4.4
4.16 Sixth Supplemental Indenture, dated as ofMarch 12, 2020, by and between StarbucksCorporation and U.S. Bank NationalAssociation, as trustee (2.000% Senior Notesdue 2027, 2.250% Senior Notes due 2030 and3.350% Senior Notes due 2050)
8-K 0-20322 3/12/2020 4.2
4.17 Form of 2.000% Senior Notes due March 12,2027 (included in Exhibit 4.2)
8-K 0-20322 3/12/2020 4.3
4.18 Form of 2.250% Senior Notes due March 12,2030 (included in Exhibit 4.2)
8-K 0-20322 3/12/2020 4.4
4.19 Form of 3.350% Senior Notes due March 12,2050 (included in Exhibit 4.2)
8-K 0-20322 3/12/2020 4.5
4.20 Seventh Supplemental Indenture, dated as ofMay 7, 2020, by and between StarbucksCorporation and U.S. Bank NationalAssociation, as trustee (1.300% Senior Notesdue 2022, 2.550% Senior Notes due 2030 and3.500% Senior Notes due 2050)
8-K 0-20322 5/7/2020 4.2
4.21 Form of 1.300% Senior Notes due May 7,2022 (included in Exhibit 4.2)
8-K 0-20322 5/7/2020 4.3
4.22 Form of 2.550% Senior Notes due November15, 2030 (included in Exhibit 4.2)
8-K 0-20322 5/7/2020 4.4
4.23 Form of 3.500% Senior Notes due November15, 2050 (included in Exhibit 4.2)
8-K 0-20322 5/7/2020 4.5
4.24 Indenture, dated as of August 23, 2007, byand between Starbucks Corporation andDeutsche Bank Trust Company Americas, astrustee
S-3ASR 333-190955 9/3/2013 4.1
89

Table of Contents
Incorporated by Reference ExhibitNumber Exhibit Description Form File No. Date of Filing
ExhibitNumber
FiledHerewith
4.25 Second Supplemental Indenture, dated as ofSeptember 6, 2013, by and between StarbucksCorporation and Deutsche Bank TrustCompany Americas, as trustee (3.850% SeniorNotes due October 1, 2023)
8-K 0-20322 9/6/2013 4.2
4.26 Form of 3.850% Senior Notes due October 1,2023
8-K 0-20322 9/6/2013 4.3
4.27 Fourth Supplemental Indenture, dated as ofJune 10, 2015, by and between StarbucksCorporation and Deutsche Bank TrustCompany Americas, as trustee (2.700% SeniorNotes due June 15, 2022 and 4.300% SeniorNotes due June 15, 2045)
8-K 0-20322 6/10/2015 4.2
4.28 Form of 2.700% Senior Notes due June 15,2022
8-K 0-20322 6/10/2015 4.3
4.29 Form of 4.300% Senior Notes due June 15,2045
8-K 0-20322 6/10/2015 4.4
4.30 Sixth Supplemental Indenture, dated as of May16, 2016, by and between StarbucksCorporation and Deutsche Bank TrustCompany Americas, as trustee (2.450% SeniorNotes due June 15, 2026)
8-K 0-20322 5/16/2016 4.4
4.31 Form of 2.450% Senior Notes due June 15,2026
8-K 0-20322 5/16/2016 4.5
4.32 Description of Securities 10-K 0-20322 11/15/2019 4.2910.1* Starbucks Corporation Employee Stock
Purchase Plan — 1995 as amended andrestated on April 9, 2015 to reflect adjustmentsfor the 2-for-1 forward stock split effective onsuch date
10-Q 0-20322 8/1/2017 10.1
10.2* Starbucks Corporation Executive ManagementBonus Plan, as amended and restated on June25, 2019
10-Q 0-20322 7/30/2019 10.1
10.3* Starbucks Corporation Management DeferredCompensation Plan, as amended and restatedeffective January 1, 2011
10-Q 0-20322 2/4/2011 10.2
10.4* Fifth Amendment to Starbucks CorporationManagement Deferred Compensation Plan
10-Q
10.5* Starbucks Corporation Deferred CompensationPlan for Non-Employee Directors, effectiveOctober 3, 2011, as amended and restatedeffective September 11, 2018
10-K 0-20322 11/16/2018 10.5
10.6* Starbucks Corporation 2005 Long-TermEquity Incentive Plan, as amended andrestated effective March 20, 2013, as restatedon April 9, 2015 to reflect adjustments for the2-for-1 forward stock split effective on suchdate, and as amended and restated by theBoard on September 11, 2018
10-K 0-20322 11/16/2018 10.7
90

Table of Contents
Incorporated by Reference ExhibitNumber Exhibit Description Form File No. Date of Filing
ExhibitNumber
FiledHerewith
10.7* 2005 Key Employee Sub-Plan to the StarbucksCorporation 2005 Long-Term Equity IncentivePlan, as amended and restated effectiveNovember 15, 2005
10-Q 0-20322 2/10/2006 10.2
10.8* 2005 Non-Employee Director Sub-Plan to theStarbucks Corporation 2005 Long-Term EquityIncentive Plan, as amended and restatedeffective September 11, 2018
10-K 0-20322 11/16/2018 10.9
10.9* Form of Global Stock Option Grant Agreementfor Purchase of Stock under the Key EmployeeSub-Plan to the 2005 Long Term EquityIncentive Plan
10-K 0-20322 11/18/2016 10.14
10.10* Form of Stock Option Grant Agreement forPurchase of Stock under the 2005 Non-Employee Director Sub-Plan to the StarbucksCorporation 2005 Long-Term Equity IncentivePlan
10-Q 0-20322 4/26/2016 10.2
10.11 Credit Agreement, dated September 16, 2021,among Starbucks Corporation, Bank ofAmerica, N.A., in its capacity asAdministrative Agent, Swing Line Lender andL/C Issuer, Wells Fargo Bank, N.A., Citibank,N.A. and U.S. Bank National Association, asL/C Issuers, and the other Lenders from time totime a party thereto.
8-K 0-20322 9/17/2021 10.1
10.12 Form of Commercial Paper Dealer Agreementbetween Starbucks Corporation, as Issuer, andthe Dealer
8-K 0-20322 7/29/2016 10.1
10.13* Form of Time Vested Global Restricted StockUnit Grant Agreement under the KeyEmployee Sub-Plan to the 2005 Long-TermEquity Incentive Plan
10-K 0-20322 11/18/2016 10.21
10.14* Form of Global Key Employee RestrictedStock Unit Grant Agreement (EffectiveNovember 2019)
10-K 0-20322 11/15/2019 10.22
10.15* Form of Global Key Employee RestrictedStock Unit Grant Agreement - No RetirementVesting (Effective November 2020)
10-K 0-20322 11/12/2020 10.23
10.16* Form of Global Key Employee RestrictedStock Unit Grant Agreement - RetirementVesting (Effective November 2020)
10-K 0-20322 11/12/2020 10.24
10.17* Form of Global Key Employee Stock OptionGrant Agreement for Purchase of Stock underthe 2005 Long-Term Equity Incentive Plan
10-K 0-20322 11/17/2017 10.25
10.18* Form of Global Key Employee Performance-Based Stock Option Grant Agreement forPurchase of Stock under the 2005 Long-TermEquity Incentive Plan
10-K 0-20322 11/16/2018 10.23
91

Table of Contents
Incorporated by Reference ExhibitNumber Exhibit Description Form File No. Date of Filing
ExhibitNumber
FiledHerewith
10.19* Form of Global Key Employee Restricted StockUnit Grant Agreement (Performance-Based -Retirement Vesting) (Effective November2019)
10-K 0-20322 11/15/2019 10.26
10.20* Form of Global Key Employee Restricted StockUnit Grant Agreement (Performance-Based -Retirement Vesting) (Effective November2020)
10-K 0-20322 11/12/2020 10.29
10.21* Offer Letter dated January 6, 2021 betweenStarbucks Corporation and Rachel Ruggeri
8-K 0-20322 1/7/2021 10.1
21 Subsidiaries of Starbucks Corporation — — — — X23 Consent of Independent Registered Public
Accounting Firm— — — — X
31.1 Certification of Principal Executive OfficerPursuant to Rule 13a-14(a) of the SecuritiesExchange Act of 1934, As Adopted Pursuant toSection 302 of the Sarbanes-Oxley Act of 2002
— — — — X
31.2 Certification of Principal Financial OfficerPursuant to Rule 13a-14(a) of the SecuritiesExchange Act of 1934, As Adopted Pursuant toSection 302 of the Sarbanes-Oxley Act of 2002
— — — — X
32** Certifications of Principal Executive Officerand Principal Financial Officer Pursuant to18 U.S.C. Section 1350, As Adopted Pursuantto Section 906 of the Sarbanes-Oxley Act of2002
— — — —
101 The following financial statements from theCompany’s 10-K for the fiscal year endedOctober 3, 2021, formatted in iXBRL:(i) Consolidated Statements of Earnings, (ii)Consolidated Statements of ComprehensiveIncome, (iii) Consolidated Balance Sheets, (iv)Consolidated Statements of Cash Flows, (v)Consolidated Statements of Equity, and (vi)Notes to Consolidated Financial Statements
— — — — X
104 Cover Page Interactive Data File (formatted iniXBRL and contained in Exhibit 101)
* Denotes a management contract or compensatory plan or arrangement.** Furnished herewith.
Item 16. Form 10-K Summary
None.
92
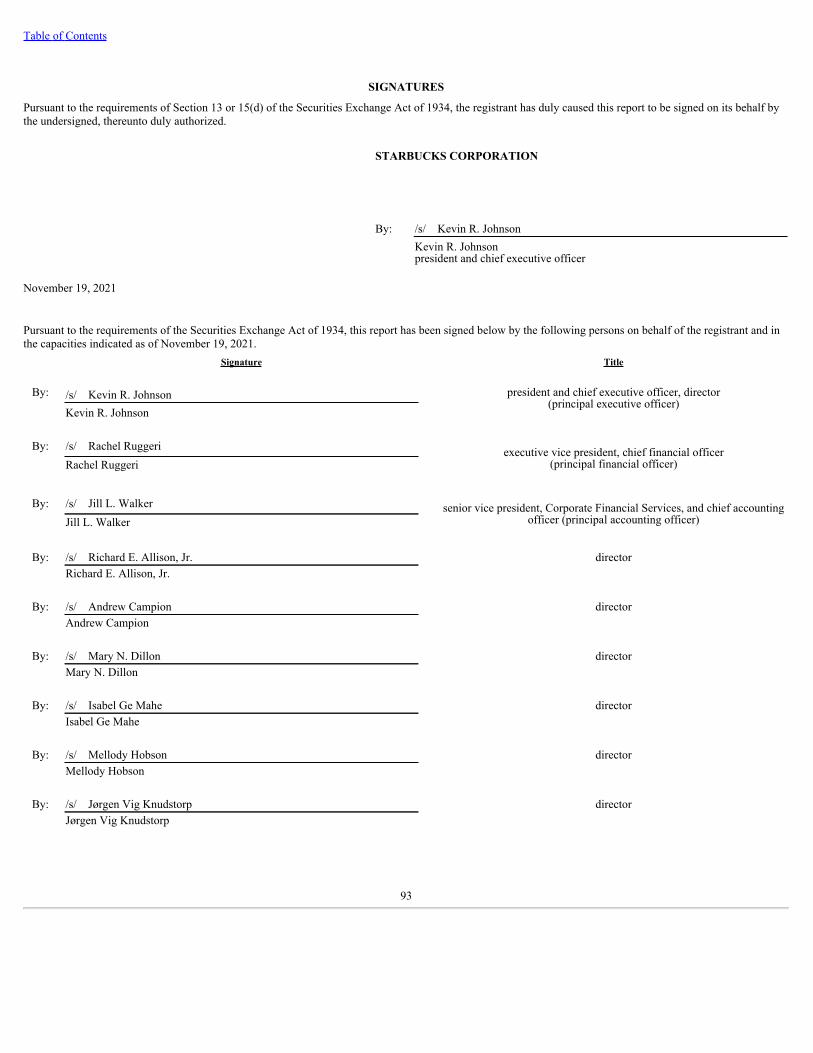
Table of Contents
SIGNATURES
Pursuant to the requirements of Section 13 or 15(d) of the Securities Exchange Act of 1934, the registrant has duly caused this report to be signed on its behalf bythe undersigned, thereunto duly authorized.
STARBUCKS CORPORATION
By: /s/ Kevin R. Johnson Kevin R. Johnson
president and chief executive officer
November 19, 2021
Pursuant to the requirements of the Securities Exchange Act of 1934, this report has been signed below by the following persons on behalf of the registrant and inthe capacities indicated as of November 19, 2021. Signature Title
By: /s/ Kevin R. Johnson president and chief executive officer, director(principal executive officer)
Kevin R. Johnson
By: /s/ Rachel Ruggeri executive vice president, chief financial officer(principal financial officer)Rachel Ruggeri
By: /s/ Jill L. Walker senior vice president, Corporate Financial Services, and chief accountingofficer (principal accounting officer)Jill L. Walker
By: /s/ Richard E. Allison, Jr. directorRichard E. Allison, Jr.
By: /s/ Andrew Campion directorAndrew Campion
By: /s/ Mary N. Dillon directorMary N. Dillon
By: /s/ Isabel Ge Mahe directorIsabel Ge Mahe
By: /s/ Mellody Hobson directorMellody Hobson
By: /s/ Jørgen Vig Knudstorp directorJørgen Vig Knudstorp
93

Table of Contents
By: /s/ Satya Nadella directorSatya Nadella
By: /s/ Joshua Cooper Ramo directorJoshua Cooper Ramo
By: /s/ Clara Shih directorClara Shih
By: /s/ Javier G. Teruel directorJavier G. Teruel
94

Exhibit 21SUBSIDIARIES OF STARBUCKS CORPORATION
The list below excludes certain subsidiaries which, considered in the aggregate as a single subsidiary, would not constitute a significant subsidiary under SEC rulesas of October 3, 2021.Entity Name Organized Under the Laws of:AmRest Coffee s.r.o. Czech RepublicAmRest Coffee Sp. z o. o. PolandAmRest Kavezo Kft. HungaryAssociation Centro de Assessoria e Suporte da Starbucks Brazil BrazilBay Bread LLC DelawareBeijing Starbucks Coffee Co., Ltd. ChinaCentro de Apoyo al Productor de Starbucks Guatemala, Limitada GuatemalaChengdu Starbucks Coffee Company Limited ChinaCHH Cafe LLC TexasCHH Holdings of Texas LLC TexasCoffee Concepts (Southern China) Limited Hong KongCoffee House Holdings, Inc. WashingtonConifer Ventures Limited United KingdomCorporacion Starbucks Farmer Support Center Colombia ColombiaEmerald City C.V. NetherlandsEvolution Fresh, Inc. DelawareFarmer Support Center, Asociacion Civil MexicoGuangdong Starbucks Coffee Company Limited ChinaHigh Grown Investment Group (Hong Kong) Ltd. Hong KongHolding Company International Limited United KingdomHubei Starbucks Coffee Company Limited ChinaKoffee Sirena LLC RussiaNorth American Coffee Partnership New YorkOlympic Casualty Insurance Company VermontPrinci Global Limited United KingdomQingdao American Starbucks Coffee Company Limited ChinaSBI Nevada, Inc. NevadaSCC Innoventure L.P. ChinaSCI Europe I, LLC WashingtonSCI Europe II, LLC WashingtonSCI Investment, Inc. WashingtonSeastar Colombia Supply Company S.A.S. ColombiaSeattle Coffee Company GeorgiaSeattle’s Best Coffee LLC WashingtonShanghai Starbucks Coffee Enterprise Co., Ltd. ChinaShaya Coffee Limited CyprusSiren Retail Corporation WashingtonSR Holdings Corporation WashingtonSR2 Holdings Corporation WashingtonStarbucks (China) Company Limited ChinaStarbucks (Kunshan) Coffee Co., Ltd. ChinaStarbucks (Shanghai) Coffee Company Limited ChinaStarbucks (Shanghai) Supply Chain Co., Ltd. ChinaStarbucks (Shanghai) Trade Company Limited China
Page 1 of 2

Starbucks AINI Coffee (Yunnan) Company Limited ChinaStarbucks Asia Pacific Investment Holding II Limited Hong KongStarbucks Asia Pacific Investment Holding III Limited Hong KongStarbucks Asia Pacific Investment Holding Limited Hong KongStarbucks Capital Asset Leasing Company, LLC DelawareStarbucks Card Europe Limited United KingdomStarbucks Coffee (Cayman) Holdings Ltd. Cayman IslandsStarbucks Coffee (Dalian) Company Limited ChinaStarbucks Coffee (Liaoning) Company Limited ChinaStarbucks Coffee (Shenzhen) Company Limited ChinaStarbucks Coffee Agronomy Company S.R.L. Costa RicaStarbucks Coffee Asia Pacific Limited Hong KongStarbucks Coffee Austria GmbH AustriaStarbucks Coffee Canada, Inc. CanadaStarbucks Coffee Company (Australia) Pty Ltd AustraliaStarbucks Coffee Company (UK) Limited United KingdomStarbucks Coffee Development (Yunnan) Company Limited ChinaStarbucks Coffee EMEA B.V. NetherlandsStarbucks Coffee Holdings (UK) Limited United KingdomStarbucks Coffee International, Inc. WashingtonStarbucks Coffee Japan, Ltd. JapanStarbucks Coffee Switzerland GmbH SwitzerlandStarbucks Coffee Trading Company Sarl SwitzerlandStarbucks EMEA Holdings Ltd United KingdomStarbucks EMEA Investment Ltd United KingdomStarbucks EMEA Ltd United KingdomStarbucks Farmer Support Center Rwanda Ltd RwandaStarbucks Farmer Support Center Tanzania Limited TanzaniaStarbucks Holding Company WashingtonStarbucks Holding Company Pte. Ltd. SingaporeStarbucks International (Holdings) Ltd United KingdomStarbucks Italy S.r.l. ItalyStarbucks Manufacturing Corporation WashingtonStarbucks Manufacturing EMEA B.V. NetherlandsStarbucks New Venture Company WashingtonStarbucks Singapore Investment Pte. Ltd. SingaporeStarbucks Switzerland Austria Holdings B.V. NetherlandsStarbucks Trading, G.K. JapanTata Starbucks Private Limited IndiaTeavana Puerto Rico, LLC DelawareThe New French Bakery, Inc. CaliforniaTorrefazione Italia LLC WashingtonXi’an Starbucks Coffee Company Limited ChinaXingran (Shanghai) Investment Partnership China
Page 2 of 2

EXHIBIT 23CONSENT OF INDEPENDENT REGISTERED PUBLIC ACCOUNTING FIRM
We consent to the incorporation by reference in Registration Statement Nos. 33-52526, 33-52528, 33-92208, 33-92184, 333-65181, 333-94987, 333-37442, 333-70648, 333-101806, 333-114090, 333-123688, 333-142878, 333-167572, 333-174995 and 333-191512 on Form S-8 and Registration Statement No. 333-233771on Form S-3 of our reports dated November 19, 2021, relating to the financial statements of Starbucks Corporation, and the effectiveness of StarbucksCorporation's internal control over financial reporting, appearing in this Annual Report on Form 10-K of Starbucks Corporation for the year ended October 3,2021./s/ Deloitte & Touche LLP
Seattle, WashingtonNovember 19, 2021

Exhibit 31.1
CERTIFICATION PURSUANT TO RULE 13a-14(a) OF THE SECURITIES EXCHANGE ACT OF 1934AS ADOPTED PURSUANT TO SECTION 302 OF THE SARBANES-OXLEY ACT OF 2002
I, Kevin R. Johnson, certify that: 1. I have reviewed this Annual Report on Form 10-K for the fiscal year ended October 3, 2021 of Starbucks Corporation;2. Based on my knowledge, this report does not contain any untrue statement of a material fact or omit to state a material fact necessary to make the
statements made, in light of the circumstances under which such statements were made, not misleading with respect to the period covered by this report;3. Based on my knowledge, the financial statements, and other financial information included in this report, fairly present in all material respects the
financial condition, results of operations and cash flows of the registrant as of, and for, the periods presented in this report;4. The registrant’s other certifying officer and I are responsible for establishing and maintaining disclosure controls and procedures (as defined in Exchange
Act Rules 13a-15(e) and 15d-15(e)) and internal control over financial reporting (as defined in Exchange Act Rules 13a-15(f) and 15d-15(f)) for theregistrant and have:(a) Designed such disclosure controls and procedures, or caused such disclosure controls and procedures to be designed under our supervision, to
ensure that material information relating to the registrant, including its consolidated subsidiaries, is made known to us by others within thoseentities, particularly during the period in which this report is being prepared;
(b) Designed such internal control over financial reporting, or caused such internal control over financial reporting to be designed under oursupervision, to provide reasonable assurance regarding the reliability of financial reporting and the preparation of financial statements forexternal purposes in accordance with generally accepted accounting principles;
(c) Evaluated the effectiveness of the registrant’s disclosure controls and procedures and presented in this report our conclusions about theeffectiveness of the disclosure controls and procedures, as of the end of the period covered by this report based on such evaluation; and
(d) Disclosed in this report any change in the registrant’s internal control over financial reporting that occurred during the registrant’s most recentfiscal quarter (the registrant’s fourth fiscal quarter in the case of an annual report) that has materially affected, or is reasonably likely tomaterially affect, the registrant’s internal control over financial reporting; and
5. The registrant’s other certifying officer and I have disclosed, based on our most recent evaluation of internal control over financial reporting, to theregistrant’s auditors and the audit committee of the registrant’s board of directors (or persons performing the equivalent functions):(a) All significant deficiencies and material weaknesses in the design or operation of internal control over financial reporting which are reasonably
likely to adversely affect the registrant’s ability to record, process, summarize and report financial information; and(b) Any fraud, whether or not material, that involves management or other employees who have a significant role in the registrant’s internal control
over financial reporting.
Date: November 19, 2021
/s/ Kevin R. JohnsonKevin R. Johnsonpresident and chief executive officer

Exhibit 31.2
CERTIFICATION PURSUANT TO RULE 13a-14(a) OF THE SECURITIES EXCHANGE ACT OF 1934AS ADOPTED PURSUANT TO SECTION 302 OF THE SARBANES-OXLEY ACT OF 2002
I, Rachel Ruggeri, certify that: 1. I have reviewed this Annual Report on Form 10-K for the fiscal year ended October 3, 2021 of Starbucks Corporation;2. Based on my knowledge, this report does not contain any untrue statement of a material fact or omit to state a material fact necessary to make the
statements made, in light of the circumstances under which such statements were made, not misleading with respect to the period covered by this report;3. Based on my knowledge, the financial statements, and other financial information included in this report, fairly present in all material respects the
financial condition, results of operations and cash flows of the registrant as of, and for, the periods presented in this report;4. The registrant’s other certifying officer and I are responsible for establishing and maintaining disclosure controls and procedures (as defined in Exchange
Act Rules 13a-15(e) and 15d-15(e)) and internal control over financial reporting (as defined in Exchange Act Rules 13a-15(f) and 15d-15(f)) for theregistrant and have:(a) Designed such disclosure controls and procedures, or caused such disclosure controls and procedures to be designed under our supervision, to
ensure that material information relating to the registrant, including its consolidated subsidiaries, is made known to us by others within thoseentities, particularly during the period in which this report is being prepared;
(b) Designed such internal control over financial reporting, or caused such internal control over financial reporting to be designed under oursupervision, to provide reasonable assurance regarding the reliability of financial reporting and the preparation of financial statements forexternal purposes in accordance with generally accepted accounting principles;
(c) Evaluated the effectiveness of the registrant’s disclosure controls and procedures and presented in this report our conclusions about theeffectiveness of the disclosure controls and procedures, as of the end of the period covered by this report based on such evaluation; and
(d) Disclosed in this report any change in the registrant’s internal control over financial reporting that occurred during the registrant’s most recentfiscal quarter (the registrant’s fourth fiscal quarter in the case of an annual report) that has materially affected, or is reasonably likely tomaterially affect, the registrant’s internal control over financial reporting; and
5. The registrant’s other certifying officer and I have disclosed, based on our most recent evaluation of internal control over financial reporting, to theregistrant’s auditors and the audit committee of the registrant’s board of directors (or persons performing the equivalent functions):(a) All significant deficiencies and material weaknesses in the design or operation of internal control over financial reporting which are reasonably
likely to adversely affect the registrant’s ability to record, process, summarize and report financial information; and(b) Any fraud, whether or not material, that involves management or other employees who have a significant role in the registrant’s internal control
over financial reporting.
Date: November 19, 2021
/s/ Rachel RuggeriRachel Ruggeriexecutive vice president, chief financial officer

Exhibit 32
CERTIFICATIONS PURSUANT TO 18 U.S.C. SECTION 1350AS ADOPTED PURSUANT TO SECTION 906 OF THE SARBANES-OXLEY ACT OF 2002
In connection with the Annual Report of Starbucks Corporation (“Starbucks”) on Form 10-K for the fiscal year ended October 3, 2021, as filed with the Securitiesand Exchange Commission on November 19, 2021 (the “Report”), Kevin R. Johnson, president and chief executive officer of Starbucks, and Rachel Ruggeri,executive vice president, chief financial officer of Starbucks, each hereby certifies, pursuant to 18 U.S.C. Section 1350, as adopted pursuant to Section 906 of theSarbanes-Oxley Act of 2002, that, to his or her knowledge: (1) the Report fully complies with the requirements of Section 13(a) or 15(d) of the Securities Exchange Act of 1934; and(2) the information contained in the Report fairly presents, in all material respects, the financial condition and results of operations of Starbucks.
November 19, 2021
/s/ Kevin R. JohnsonKevin R. Johnsonpresident and chief executive officer
November 19, 2021
/s/ Rachel RuggeriRachel Ruggeriexecutive vice president, chief financial officer