STARBUCKS CORPORATION Fiscal 2013 Annual Report
100
STARBUCKS CORPORATION Fiscal 2013 Annual Report
-
Upload
independent -
Category
Documents
-
view
3 -
download
0
Transcript of STARBUCKS CORPORATION Fiscal 2013 Annual Report

STARBUCKS CORPORATIONFiscal 2013 Annual Report
258490_Starbuck_CVR_R4.indd 1 1/10/14 7:34 PM

Board of Directors and Senior Leadership Team
Market Information
Board of Directors Howard Schultz
Starbucks Corporation, chairman, president and chief executive officer William W. Bradley
Allen & Company LLC, managing director Robert M. Gates
Former United States Secretary of DefenseMellody Hobson
Ariel Investments, LLC, president Kevin R. Johnson
Juniper Networks, Inc., retired chief executive officerOlden Lee
PepsiCo, Inc., retired executive Joshua Cooper Ramo
Kissinger Associates, Inc., vice chairmanJames G. Shennan, Jr.
Trinity Ventures, general partner emeritus Clara Shih
Hearsay Social, Inc., chief executive officer Javier G. Teruel
Colgate-Palmolive Company, retired vice chairman Myron E. Ullman, III
JC Penney Company, Inc., chief executive officerCraig E. Weatherup
Pepsi-Cola Company, retired chief executive officer
Senior Leadership Team Howard Schultz chairman, president and chief executive officer*
Troy Alstead chief financial officer and group president, Global Business Services*
Marissa Andrada senior vice president, Global Partner Resources
Adam Brotman executive vice president, chief digital officer
Clifford Burrows group president, Starbucks Coffee Americas, EMEA and Teavana*
Michael Conway executive vice president, Global Channel Development
John Culver group president, Starbucks Coffee China and Asia Pacific,
Channel Development and Emerging Brands*
Curtis Garner executive vice president, chief information officer
Jeff Hansberry president, Starbucks Coffee China and Asia Pacific*
Lucy Lee Helm executive vice president, general counsel and secretary*
Deverl Maserang executive vice president, Global Supply Chain
Sharon Rothstein executive vice president, global chief marketing officer
Arthur Rubinfeld chief creative officer, president, Global Innovation and Evolution Fresh Retail
Craig Russell senior vice president, Global Coffee
Matthew Ryan executive vice president, global chief strategy officer
Blair Taylor executive vice president, chief community officer and Global Partner Resources
Vivek Varma executive vice president, Public Affairs
*executive officer
Starbucks common stock is traded on the NASDAQ Global Select Market (“NASDAQ”), under the symbol SBUX. The following table shows the quarterly high and low sale prices per share of Starbucks common stock for each quarter during the last two fiscal years and the quarterly cash dividend declared per share of its common stock during the periods indicated:
Cash DividendsSeptember 29, 2013 High Low Declared
Fourth Quarter $77.84 $65.82 $0.26Third Quarter 67.48 56.65 0.21Second Quarter 58.97 52.39 0.21First Quarter 54.90 44.27 0.21
Cash DividendsSeptember 30, 2012 High Low Declared
Fourth Quarter $54.28 $43.04 $0.21Third Quarter 62.00 51.03 0.17Second Quarter 56.55 45.28 0.17First Quarter 46.50 35.12 0.17
The company’s U.S. Securities and Exchange Commission filings may be obtained without charge by accessing the Investor Relations section of the company’s website at http://investor.starbucks.com, at http://sec.gov, or by making a request to Investor Relations through the address, phone number or website listed below.
Starbucks Coffee Company Investor Relations, Mailstop: EX4 2401 Utah Avenue South Seattle, WA 98134 Phone: (206) 318-7118 [email protected] http://investor.starbucks.com
Independent Auditors Deloitte & Touche LLP
Transfer Agent Computershare PO Box 43078 Providence, RI 02940-3078 Phone: (888) 835-2866 https://www-us.computershare.com/investor
Annual Meeting of Shareholders March 19, 2014, 10:00 a.m. PDT Marion Oliver McCaw Hall Seattle, Washington Live webcast at: http://investor.starbucks.com
Global Responsibility Starbucks is committed to being a deeply responsible company in the communities where it does business around the world. The programs and goals that address these commitments are integral to the company’s overall business strategy and can be reviewed in the annual Global Responsibility report. Please see Starbucks fiscal 2013 Global Responsibility Report, available online this spring at http://www.starbucks.com/responsibility/global-report.
Updated Financial Information Please visit http://investor.starbucks.com to find the latest financial information publicly available for the company.
Keurig, the Cup and Star design, Keurig Brewed, K-Cup, and the Keurig brewer trade dress are trademarks of Keurig, Incorporated, used with permission. K-Cup® packs for use in Keurig® K-Cup® brewing systems.
© 2014 Starbucks Corporation. All rights reserved. SJBQ1140TH-01078 This Annual Report is printed on FSC-certified, recycled paper containing 100% post-consumer waste, and the Form 10-K is printed on FSC-certified, recycled paper containing 30% post-consumer waste, using Green-e certified renewable energy and processed chlorine-free. It was printed with soy-based inks, using wind power.
258490_Starbuck_CVR_R4.indd 2 1/10/14 7:34 PM

Dear Shareholders,
I am honored to share with you that Starbucks has once again delivered record performance in fiscal 2013, exceeding expectations on almost all fronts as we continued to drive growth across geographies,
categories, and our multiple channels of distribution. As you review the highlights of our 42nd year, I hope you will agree that we are achieving our goals in ways in which we can all be extremely proud.
In fiscal 2013, Starbucks consolidated revenues reached a record $14.9 billion, a 12 percent increase over last year driven by a 7 percent rise in global comparable store sales and the opening of 1,701 net new stores around the globe. Our non-GAAP operating income* was $2.5 billion, a 23 percent increase, with record non-GAAP operating margin* of 16.5 percent, an impressive 150 basis points higher than last year.
This strong revenue growth, coupled with excellent margin improvement, led to record non-GAAP earnings per share* of $2.26, up 26 percent over fiscal 2012. Through dividends and share repurchases, Starbucks returned a record $1.2 billion of cash to you, our shareholders.
Today, Starbucks is healthier and more diverse than at any time in our history. In addition to the incredibly hard work of our more than 200,000 partners (employees) who proudly wear the green apron, as well as our leaders in Seattle and throughout the world, our success would not be possible without our bold, strategic vision; a dedication to disruptive innovation and operational excellence; and a foundation of strong values. Together, these tenets are driving our performance.
Our Foundational ValuesA distinctive set of values has always shaped how we engage our customers, our partners, and the communities where we do business. This past year, given the tenuous economic and political environment we continued to observe in the U.S. and around the world, Starbucks was particularly cognizant of our responsibility to stay true to our guiding principles, and to lead by example.
The complexity of these times requires, in my view, that businesses complement their main goal of profitability with actions that can help our society move forward in ways that benefit as many people as possible. With this in mind, those of us who lead public companies, in particular, have a duty to share our organizations’ success with our people and reach out to the communities we serve, in addition to creating shareholder value.
* Fiscal 2013 non-GAAP operating income, non-GAAP operating margin and non-GAAP earnings per share exclude a pretax charge of $2.8 billion resulting from the conclusion of the arbitration with Kraft Foods Global, Inc. For GAAP results and a reconciliation of GAAP to non-GAAP measures, please see the Fiscal 2013 Financial Highlights on page iv of this 2013 annual report. i.
258490_Starbuck_NARR_R3.indd 1 1/10/14 7:42 PM

At Starbucks, we are proud that, in 2013, we continued to reward and invest in our full- and part-time partners by helping them to realize more than $230 million in value from equity awards, and by retaining industry-leading health care benefits regardless of changes to the U.S. health care laws. Our efforts to serve communities included a company-wide volunteer effort of more than 600,000 hours to help foster long-term improvements in neighborhoods around the world. And in November 2013, we made the strategic business decision to commit to hiring 10,000 veterans and military spouses over the next five years, a talent base with demonstrated leadership, discipline, and operational skills.
Taking these and other steps during 2013 reinforced once again that we can stand for something more than just profitability, while also delivering record performance. Indeed, that harmonious achievement is threaded into the equity of the Starbucks brand, creating a reservoir of trust with our customers, partners, and communities that is deeper than at any time in our history. In the years to come, we will—indeed we must—continue to ask ourselves how we can use our scale for good.
A Core of Innovation and Operational ExcellenceOur laser focus on disciplined execution and robust innovation was key to the success we experienced across our business this past year.
Global performance. In fiscal 2013, Starbucks had more than 3 billion customer visits to our more than 19,000 stores in 62 countries. The Americas, our largest segment, produced revenue growth of 11 percent, led by the strength of the U.S., where comparable store sales have grown 7 percent or higher for 15 consecutive quarters, which is particularly noteworthy given the size of the market. In addition, Canada exceeded $1 billion in full-year revenues for the first time ever, while our dynamic Latin America business grew to nearly 700 stores, an 18 percent increase, with sales growth in all 12 markets.
The China and Asia Pacific segment, now comprising 13 countries including India and Vietnam, was once again our fastest growing region, delivering a healthy 27 percent revenue growth in 2013. We expanded our loyalty program to additional markets during the year, as well as recently opened our 1,000th stores in both China and Japan, all of which added to our sales success in this segment. We also are pleased that our EMEA segment—Europe, the Middle East, and Africa—is once again positively contributing to the company’s performance as a result of ongoing efforts to transform this business.
Looking ahead, our plans to open 1,500 net new stores, paired with continued financial discipline and productivity improvements, will fuel momentum in every region.
Innovative concepts. Sustainable growth requires that we preserve the integrity of our core business as we carefully expand our products and expertise into new channels, brands, and markets. Throughout 2013, we once again delighted our customers with iconic beverages as well as new menu choices. Pumpkin Spice Latte celebrated its 10th year, while new creations debuted, including Hazelnut Macchiato, a fantastic single-origin coffee from Ethiopia, and a wonderful Starbucks Reserve® coffee from Colombia. And in our Channel Development segment, revenues grew by 10 percent to $1.4 billion as we continued to provide consumers more opportunities to enjoy their favorite Starbucks® products outside our retail stores.
Beyond our coffee core, the grand opening of Teavana® Fine Teas + Tea Bar, our reimagined Teavana® store in New York City, with its unique tea bar concept, extended our Teavana retail platform while heralding our plans to do for the $90 billion global tea industry what we have done for coffee. In juice, we exceeded our aggressive growth plans for Evolution Fresh™, which is now available in more than 8,000 locations, while the opening of our state-of-the-art juicery in California will help us further increase our share of the
i i.
258490_Starbuck_NARR_R3.indd 2 1/10/14 7:42 PM

$1.6 billion super-premium juice category, while bringing more manufacturing jobs to the U.S. We also began exploring the potential of handcrafted carbonated beverages, another exciting concept that leverages Starbucks® beverage and retail expertise while expanding our refreshment options.
What’s more, delicious new food offerings, led by the rollout of La Boulange™ bakery items in more than 3,500 U.S. company-operated stores today, are receiving strong customer response and lifting sales.
Customer connections. The relationship that we have with our customers has always been core to our brand. Today, these connections are more powerful than ever because of the combined, complementary influence of our global retail footprint, our world-class digital and mobile technologies, and our innovative loyalty programs.
Consider the depth and scope of our reach: In our thousands of stores, our engaging, talented baristas and beautiful new store designs are enhancing the Starbucks Experience; indeed, our fleet of new stores is among the best performing in the company’s history. What’s more, nearly 7 million people are active My Starbucks Rewards™ members in the U.S., with $4 billion loaded onto cards in fiscal 2013 globally, and one in every three U.S. transactions paid for with a Starbucks Card. What’s more, our customers are using our mobile payment apps to make, on average, more than 4 million mobile transactions per week in the U.S.
The value that these assets and capabilities bring to our brand, and how that is translating into record financial performance, cannot be understated. Few if any companies can match the diversity of our customer touch points. Like a flywheel effect, the momentum from the intersecting nature of this unique network drives our business every day, giving Starbucks a potent competitive advantage.
Responsible Growth To realize our ambition of ranking among the world’s most admired brands and enduring companies, we understand more than ever what it means to grow responsibly—with fiscal discipline grounded in our guiding principles. Today, I have no doubt that our values are driving our ability to deliver increased value to our stakeholders, and I want to thank our partners for all they do every day to contribute to our success.
Finally, thank you, our shareholders, for your trust in us as we do our best to exceed expectations and enter the most exciting period of our existence.
Warm regards,
chairman, president and chief executive officer
Howard visiting our first international Community Store in Bangkok, Thailand. iii.
258490_Starbuck_NARR_R3.indd 3 1/10/14 7:42 PM

Operating Cash Flow & Capital Expenditures (in Millions)
$2,908
$1,151
7%
$1,612
$532
$1,705
$441
$1,389
$446
Operating Margin
Earnings per Diluted Share
Net Revenues (in Billions) Comparable Store Sales Growth (Company-Operated Stores Open 13 Months or Longer)
8%
$9.8
(6%)
$10.7
$11.7
7%(A)
$1,728
$1.62
14.8%
$1,419
$1.24
13.3%
$562
$0.52
5.7%
$1,698(B)
$1.52(D)
14.5%(B)
$1,414(B)
$1.23(B)
13.5%(B)
$894(B)
$0.80(B)
9.2%(B)
GAAP
Cash from Operations
Non-GAAP
Capital Expenditures
GAAP Non-GAAP
GAAP EPS Non-GAAP EPS
$13.3
$14.9
$2,459(C)
($325)
16.5%(C)
(2.2%)
$2.26(C)
2009 2010 2011 2012 2013
2009 2010 2011 2012 2013
2009 2010 2011 2012 2013 2009 2010 2011 2012 2013
2009 2010 2011 2012 2013
2009 2010 2011 2012 2013
Operating Income / (Loss) (in Millions)
(A) 2010 comparable store sales growth was calculated excluding the 53rd week in September 2010.
(B) Non-GAAP measure. Excludes $332 million and $53 million in pretax restructuring and transformation charges in 2009 and 2010, respectively. Also excludes a benefit from the 53rd week in 2010 of approximately $59 million and a gain on the sale of properties in 2011 of $30 million. (C) Non-GAAP measure. Excludes a pretax charge of $2,784.1 million resulting from the conclusion of the arbitration with Kraft Foods Global, Inc.
(D) 2011 excludes $0.10 of gain resulting from the acquisition of the company’s joint venture operations in Switzerland and Austria and the gain on the sale of properties.
$1,997
$1.79
$0.01
7%
15.0%
$1,750
$856
Fiscal 2013 Financial Highlights
i v.
258490_Starbuck_NARR_R3.indd 4 1/10/14 7:42 PM

UNITED STATES SECURITIES AND EXCHANGE COMMISSIONWashington, DC 20549
Form 10-KANNUAL REPORT PURSUANT TO SECTION 13 OR 15(d) OF THE SECURITIES EXCHANGE
ACT OF 1934For the Fiscal Year Ended September 29, 2013
orTRANSITION REPORT PURSUANT TO SECTION 13 OR 15(d) OF THE SECURITIES
EXCHANGE ACT OF 1934For the transition period from to .
Commission File Number: 0-20322
Starbucks Corporation(Exact Name of Registrant as Specified in its Charter)
Washington 91-1325671(State of Incorporation) (IRS Employer ID)
2401 Utah Avenue South, Seattle, Washington 98134(206) 447-1575
(Address of principal executive offices, zip code, telephone number)Securities Registered Pursuant to Section 12(b) of the Act:
Title of Each Class Name of Each Exchange on Which RegisteredCommon Stock, $0.001 par value per share Nasdaq Global Select Market
Securities Registered Pursuant to Section 12(g) of the Act: NoneIndicate by check mark if the registrant is a well-known seasoned issuer, as defined in Rule 405 of the Securities Act. Yes No Indicate by check mark if the registrant is not required to file reports pursuant to Section 13 or Section 15(d) of the Act. Yes No Indicate by check mark whether the registrant: (1) has filed all reports required to be filed by Section 13 or 15(d) of the Securities Exchange Act of 1934 during the preceding 12 months (or for such shorter period that the registrant was required to file such reports), and (2) has been subject to such filing requirements for the past 90 days. Yes No Indicate by check mark whether the registrant has submitted electronically and posted on its corporate Web site, if any, every Interactive Data File required to be submitted and posted pursuant to Rule 405 of Regulation S-T (§ 232.405 of this chapter) during the preceding 12 months (or for such shorter period that the registrant was required to submit and post such files). Yes No Indicate by check mark if disclosure of delinquent filers pursuant to Item 405 of Regulation of S-K (§ 229.405 of this chapter) is not contained herein, and will not be contained, to the best of the registrant’s knowledge, in definitive proxy or information statements incorporated by reference in Part III of this Form 10-K or any amendment to this Form 10-K. Indicate by check mark whether the registrant is a large accelerated filer, an accelerated filer, a non-accelerated filer, or a smaller reporting company. See the definitions of “large accelerated filer,” “accelerated filer” and “smaller reporting company” in Rule 12b-2 of the Exchange Act. (Check one):
Large accelerated filer Accelerated filerNon-accelerated filer (Do not check if a smaller reporting company) Smaller reporting company
Indicate by check mark whether the registrant is a shell company (as defined in Rule 12b-2 of the Act). Yes No The aggregate market value of the voting stock held by non-affiliates of the registrant as of the last business day of the registrant’s most recently completed second fiscal quarter, based upon the closing sale price of the registrant’s common stock on March 29, 2013 as reported on the NASDAQ Global Select Market was $41 billion. As of November 8, 2013, there were 753.6 million shares of the registrant’s Common Stock outstanding.
DOCUMENTS INCORPORATED BY REFERENCEPortions of the definitive Proxy Statement for the registrant’s Annual Meeting of Shareholders to be held on March 19, 2014 have been incorporated by reference into Part III of this Annual Report on Form 10-K.

STARBUCKS CORPORATIONForm 10-K
For the Fiscal Year Ended September 29, 2013 TABLE OF CONTENTS
PART IItem 1Item 1AItem 1BItem 2Item 3Item 4
PART IIItem 5
Item 6Item 7Item 7AItem 8
Item 9Item 9AItem 9B
PART IIIItem 10Item 11Item 12Item 13Item 14
PART IVItem 15
Business 2Risk Factors 10Unresolved Staff Comments 14Properties 15Legal Proceedings 15Mine Safety Disclosures 15
Market for the Registrant’s Common Equity, Related Shareholder Matters and Issuer Purchases of Equity Securities 16Selected Financial Data 18Management’s Discussion and Analysis of Financial Condition and Results of Operations 21Quantitative and Qualitative Disclosures About Market Risk 42Financial Statements and Supplementary Data 43Report of Independent Registered Public Accounting Firm 77Changes in and Disagreements with Accountants on Accounting and Financial Disclosure 78Controls and Procedures 78Other Information 80
Directors, Executive Officers and Corporate Governance 81Executive Compensation 81Security Ownership of Certain Beneficial Owners and Management and Related Shareholder Matters 81Certain Relationships and Related Transactions, and Director Independence 81Principal Accountant Fees and Services 81
Exhibits, Financial Statement Schedules 82SIGNATURES 83INDEX TO EXHIBITS 85

1
CAUTIONARY NOTE REGARDING FORWARD-LOOKING STATEMENTS
This Annual Report on Form 10-K includes “forward-looking” statements within the meaning of the Private Securities Litigation Reform Act of 1995. Forward-looking statements can be identified by the fact that they do not relate strictly to historical or current facts. They often include words such as “believes,” “expects,” “anticipates,” “estimates,” “intends,” “plans,” “seeks” or words of similar meaning, or future or conditional verbs, such as “will,” “should,” “could,” “may,” “aims,” “intends,” or “projects.” A forward-looking statement is neither a prediction nor a guarantee of future events or circumstances, and those future events or circumstances may not occur. You should not place undue reliance on forward-looking statements, which speak only as of the date of this Annual Report on Form 10-K. These forward-looking statements are all based on currently available operating, financial and competitive information and are subject to various risks and uncertainties. Our actual future results and trends may differ materially depending on a variety of factors, including, but not limited to, the risks and uncertainties discussed under “Risk Factors” and “Management’s Discussion and Analysis of Financial Condition and Results of Operations”. Given these risks and uncertainties, you should not rely on forward-looking statements as a prediction of actual results. Any or all of the forward-looking statements contained in this Annual Report on Form 10-K and any other public statement made by us, including by our management, may turn out to be incorrect. We are including this cautionary note to make applicable and take advantage of the safe harbor provisions of the Private Securities Litigation Reform Act of 1995 for forward-looking statements. We expressly disclaim any obligation to update or revise any forward-looking statements, whether as a result of new information, future events or otherwise.
2013 10-KStarbucks Corporation Form

2
PART IItem 1. Business
General
Starbucks is the premier roaster, marketer and retailer of specialty coffee in the world, operating in 62 countries. Formed in 1985, Starbucks Corporation’s common stock trades on the NASDAQ Global Select Market (“NASDAQ”) under the symbol “SBUX.” We purchase and roast high-quality coffees that we sell, along with handcrafted coffee, tea and other beverages and a variety of fresh food items, through company-operated stores. We also sell a variety of coffee and tea products and license our trademarks through other channels such as licensed stores, grocery and national foodservice accounts. In addition to our flagship Starbucks brand, our portfolio also includes goods and services offered under these brands: Teavana, Tazo, Seattle’s Best Coffee, Starbucks VIA, Starbucks Refreshers, Evolution Fresh, La Boulange and Verismo.
Our objective is to maintain Starbucks standing as one of the most recognized and respected brands in the world. To achieve this, we are continuing the disciplined expansion of our global store base. In addition, by leveraging the experience gained through our traditional store model, we continue to offer consumers new coffee and other products in a variety of forms, across new categories, and through diverse channels. Starbucks Global Responsibility strategy and commitments related to coffee and the communities we do business in, as well as our focus on being an employer of choice, are also key complements to our business strategies.
In this Annual Report on Form 10-K (“10-K” or “Report”) for the fiscal year ended September 29, 2013 (“fiscal 2013”), Starbucks Corporation (together with its subsidiaries) is referred to as “Starbucks,” the “Company,” “we,” “us” or “our.”
Segment Financial Information
We have four reportable operating segments: 1) Americas, inclusive of the US, Canada, and Latin America; 2) Europe, Middle East, and Africa ("EMEA"); 3) China / Asia Pacific (“CAP”) and 4) Channel Development. Segment revenues as a percentage of total net revenues for fiscal year 2013 were as follows: Americas (74%), EMEA (8%), CAP (6%), Channel Development (9%), and all other segments (3%).
Our Americas, EMEA, and CAP segments include both company-operated and licensed stores. Our Americas segment is our most mature business and has achieved significant scale. Certain markets within our EMEA and CAP operations are still in the early stages of development and require a more extensive support organization, relative to their current levels of revenue and operating income, than our Americas operations. The Americas and EMEA segments also include certain foodservice accounts, primarily in Canada and the UK. Our Americas segment also includes our La Boulange® retail stores.
Our Channel Development segment includes whole bean and ground coffees, premium Tazo® teas, Starbucks- and Tazo-branded single serve products, a variety of ready-to-drink beverages, such as Starbucks Refreshers™ beverages, and other branded products sold worldwide through channels such as grocery stores, warehouse clubs, specialty retailers, convenience stores, and US foodservice accounts.
Our other, non-reportable, operating segments include the operating results from Teavana, Seattle's Best Coffee, Evolution Fresh, and our Digital Ventures business. These other operating segments are referred to as All Other Segments.
Effective at the beginning of fiscal 2013, we decentralized certain leadership functions in the areas of retail marketing and category management, global store development and partner resources to support and align with the respective operating segment presidents. In conjunction with these moves, certain general and administrative and depreciation and amortization expenses associated with these functions, which were previously reported as unallocated corporate expenses within "Other," are now reported within the respective reportable operating segments to align with the regions they support.
Beginning in the second quarter of fiscal 2013, we changed the presentation of our unallocated corporate expenses, which were previously combined with our non-reportable operating segments in "Other". Unallocated corporate operating expenses pertain primarily to corporate administrative functions that support the operating segments but are not specifically attributable to or managed by any segment. These expenses are now presented as a reconciling item between total segment operating results and consolidated operating results.
Concurrent with the reporting changes noted above, we revised our prior period financial information to reflect comparable financial information. Historical financial information presented herein reflects these changes. There was no impact on consolidated net revenues, total operating expenses, operating income, or net earnings as a result of these changes.
Starbucks segment information is included in Note 16 to the consolidated financial statements included in Item 8 of Part II of this 10-K.
2013 10-KStarbucks Corporation Form

3
Revenue Components
We generate nearly all of our revenues through company-operated stores, licensed stores, consumer packaged goods ("CPG") and foodservice operations.
Company-operated and Licensed Store Summary as of September 29, 2013
Americas
As a% of Total
Americas Stores EMEA
As a% of Total
EMEA Stores CAP
As a% of TotalCAP
StoresAll OtherSegments
As a% of Total
All Other Segments
Stores Total
As a% ofTotal Stores
Company-operatedstores 8,078 60 % 853 43 % 906 23 % 357 84 % 10,194 52 %Licensed stores 5,415 40 % 1,116 57 % 2,976 77 % 66 16 % 9,573 48 %
Total 13,493 100% 1,969 100% 3,882 100% 423 100% 19,767 100%
The mix of company-operated versus licensed stores in a given market will vary based on several factors, including our ability to access desirable local retail space, the complexity and expected ultimate size of the market for Starbucks, and our ability to leverage the support infrastructure in an existing geographic region.
Company-operated Stores
Revenue from company-operated stores accounted for 79% of total net revenues during fiscal 2013. Our retail objective is to be the leading retailer and brand of coffee in each of our target markets by selling the finest quality coffee and related products, and by providing each customer a unique Starbucks Experience. The Starbucks Experience is built upon superior customer service, as well as clean and well-maintained company-operated stores that reflect the personalities of the communities in which they operate, thereby building a high degree of customer loyalty.
Our strategy for expanding our global retail business is to increase our market share in a disciplined manner, by selectively opening additional stores in new and existing markets, as well as increasing sales in existing stores, to support our long-term strategic objective to maintain Starbucks standing as one of the most recognized and respected brands in the world. Store growth in specific existing markets will vary due to many factors, including the maturity of the market.
2013 10-KStarbucks Corporation Form

4
Company-operated store data for the year-ended September 29, 2013:
Stores Open
as ofStores Open
as of Sep 30, 2012 Opened Closed Net Sep 29, 2013
Americas(1):US 6,856 231 (38) 193 7,049Canada 874 69 (3) 66 940Brazil 53 18 (1) 17 70Puerto Rico 19 1 (1) — 19
Total Americas 7,802 319 (43) 276 8,078EMEA(2):
UK 593 6 (50) (44) 549Germany 157 9 (9) — 157France 67 7 (2) 5 72Switzerland 50 4 (2) 2 52Austria 12 4 — 4 16Netherlands 3 4 — 4 7
Total EMEA 882 34 (63) (29) 853CAP:
China 408 209 (3) 206 614Thailand 155 22 (3) 19 174Singapore 80 20 (6) 14 94Australia 23 1 — 1 24
Total CAP 666 252 (12) 240 906All Other Segments:
Teavana(3) — 340 (2) 338 338Seattle's Best Coffee 12 11 (8) 3 15Evolution Fresh 2 2 — 2 4
Total All Other Segments 14 353 (10) 343 357Total company-operated 9,364 958 (128) 830 10,194
(1) Americas store data has been adjusted for the sale of store locations in Chile to a joint venture partner in the fourth quarter of fiscal 2013 by reclassifying historical information from company-operated stores to licensed stores, and to exclude Seattle's Best Coffee and Evolution Fresh, which are now reported within All Other Segments.
(2) EMEA store data has been adjusted for the transfer of certain company-operated stores to licensees in the fourth quarter of fiscal 2012.
(3) Acquired during the second quarter of fiscal 2013.
Starbucks® company-operated stores are typically located in high-traffic, high-visibility locations. Our ability to vary the size and format of our stores allows us to locate them in or near a variety of settings, including downtown and suburban retail centers, office buildings, university campuses, and in select rural and off-highway locations. To provide a greater degree of access and convenience for non-pedestrian customers, we continue to expand development of Drive Thru stores.
Starbucks® stores offer a choice of coffee and tea beverages, distinctively packaged roasted whole bean and ground coffees, a variety of premium single serve products, juices and bottled water. Starbucks® stores also offer an assortment of fresh food offerings, including selections focusing on high-quality ingredients, nutritional value and great flavor. A focused selection of beverage-making equipment and accessories are also sold in our stores. Each Starbucks® store varies its product mix depending upon the size of the store and its location. To complement the in-store experience, our company-operated Starbucks® stores in the US, Canada, and certain other international markets also provide customers free access to wireless internet.
2013 10-KStarbucks Corporation Form

5
Retail sales mix by product type for company-operated stores:
Fiscal Year EndedSep 29,
2013Sep 30,
2012Oct 2,2011
Beverages 74% 75% 75%Food 20% 19% 19%Packaged and single serve coffees 3% 4% 4%Coffee-making equipment and other merchandise 3% 2% 2%Total 100% 100% 100%
Starbucks Card
The Starbucks stored value card program is designed to provide convenience, support gifting, and increase the frequency of store visits by cardholders. Starbucks Cards are sold in company-operated and most licensed stores in North America, as well as on-line and in other retail locations. The cards are also sold in a number of other international locations. Customers may access their card balances by utilizing their Starbucks Card or mobile app in retail stores. Customers who register their card in the US, Canada, and certain other countries are automatically enrolled in the My Starbucks Rewards™ program and can receive various benefits depending on the number of reward points (“Stars”) earned in a 12-month period.
Licensed Stores
Product sales to and royalty and license fee revenues from our licensed stores accounted for 9% of total net revenues in fiscal 2013. In our licensed store operations, we leverage the expertise of our local partners and share our operating and store development experience. Licensees provide improved, and at times the only, access to desirable retail space. Most licensees are prominent retailers with in-depth market knowledge and access. As part of these arrangements, we receive royalties and license fees and sell coffee, tea and related products for resale in licensed locations. Employees working in licensed retail locations are required to follow our detailed store operating procedures and attend training classes similar to those given to employees in company-operated stores. For Teavana and Seattle's Best Coffee, as well as Starbucks in the UK, we also use traditional franchising.
2013 10-KStarbucks Corporation Form

6
Licensed store data for the year-ended September 29, 2013:
Stores Open
as ofStores Open
as of Sep 30, 2012 Opened Closed Net Sep 29, 2013
Americas(1):US 4,189 281 (62) 219 4,408Mexico 356 48 (1) 47 403Canada 300 98 (1) 97 397Other 166 41 — 41 207
Total Americas 5,011 468 (64) 404 5,415EMEA(2):
UK 168 48 (1) 47 215Turkey 171 26 (4) 22 193United Arab Emirates 99 9 (1) 8 107Spain 78 4 — 4 82Kuwait 65 6 (2) 4 69Saudi Arabia 64 6 (8) (2) 62Russia 60 8 (3) 5 65Other 282 54 (13) 41 323
Total EMEA 987 161 (32) 129 1,116CAP:
Japan 965 49 (14) 35 1,000China 292 116 (5) 111 403South Korea 467 108 (16) 92 559Taiwan 271 33 (7) 26 297Philippines 201 18 (3) 15 216Other 432 87 (18) 69 501
Total CAP 2,628 411 (63) 348 2,976All Other Segments:
Teavana(3) — 28 — 28 28Seattle's Best Coffee 76 1 (39) (38) 38
Total All Other Segments 76 29 (39) (10) 66Total licensed 8,702 1,069 (198) 871 9,573
(1) Americas store data has been adjusted for the sale of store locations in Chile to a joint venture partner in the fourth quarter of fiscal 2013 by reclassifying historical information from company-operated stores to licensed stores, and to exclude Seattle's Best Coffee and Evolution Fresh, which are now reported within All Other Segments.
(2) EMEA store data has been adjusted for the transfer of certain company-operated stores to licensees in the fourth quarter of fiscal 2012.
(3) Acquired during the second quarter of fiscal 2013.
Consumer Packaged Goods
Consumer packaged goods includes both domestic and international sales of packaged coffee and tea as well as a variety of ready-to-drink beverages and single-serve coffee and tea products to grocery, warehouse club and specialty retail stores. It also includes revenues from product sales to and licensing revenues from manufacturers that produce and market Starbucks and Seattle’s Best Coffee branded products through licensing agreements. Revenues from sales of consumer packaged goods comprised 7% of total net revenues in fiscal 2013.
2013 10-KStarbucks Corporation Form

7
Foodservice
Revenues from foodservice accounts comprised 4% of total net revenues in fiscal 2013. We sell Starbucks® and Seattle’s Best Coffee® whole bean and ground coffees, a selection of premium Tazo® teas, Starbucks VIA® Ready Brew, and other coffee and tea related products to institutional foodservice companies that service business and industry, education, healthcare, office coffee distributors, hotels, restaurants, airlines and other retailers. We also sell our Seattle’s Best Coffee® through arrangements with national accounts. The majority of the sales in this channel come through national broadline distribution networks with SYSCO Corporation, US Foodservice™, and other distributors.
Product Supply
Starbucks is committed to selling only the finest whole bean coffees and coffee beverages. To ensure compliance with our rigorous coffee standards, we control coffee purchasing, roasting and packaging, and the global distribution of coffee used in our operations. We purchase green coffee beans from multiple coffee-producing regions around the world and custom roast them to our exacting standards for our many blends and single origin coffees.
The price of coffee is subject to significant volatility. Although most coffee trades in the commodity market, high-altitude arabica coffee of the quality sought by Starbucks tends to trade on a negotiated basis at a premium above the “C” coffee commodity price. Both the premium and the commodity price depend upon the supply and demand at the time of purchase. Supply and price can be affected by multiple factors in the producing countries, including weather, natural disasters, crop disease, general increase in farm inputs and costs of production, inventory levels and political and economic conditions. Price is also impacted by trading activities in the arabica coffee futures market, including hedge funds and commodity index funds. In addition, green coffee prices have been affected in the past, and may be affected in the future, by the actions of certain organizations and associations that have historically attempted to influence prices of green coffee through agreements establishing export quotas or by restricting coffee supplies.
We buy coffee using fixed-price and price-to-be-fixed purchase commitments, depending on market conditions, to secure an adequate supply of quality green coffee. Price-to-be-fixed contracts are purchase commitments whereby the quality, quantity, delivery period, and other negotiated terms are agreed upon, but the date, and therefore the price, at which the base “C” coffee commodity price component will be fixed has not yet been established. For these types of contracts, either Starbucks or the seller has the option to select a date on which to “fix” the base “C” coffee commodity price prior to the delivery date. Until prices are fixed, we estimate the total cost of these purchase commitments. Total green coffee purchase commitments as of September 29, 2013 were $882 million, comprised of $588 million under fixed-price contracts and an estimated $294 million under price-to-be-fixed contracts. As of September 29, 2013, approximately $0.3 million of our price-to-be-fixed contracts were effectively fixed through the use of futures contracts. All price-to-be-fixed contracts as of September 29, 2013 were at the Company’s option to fix the base “C” coffee commodity price component. Total purchase commitments, together with existing inventory, are expected to provide an adequate supply of green coffee through fiscal 2014.
We depend upon our relationships with coffee producers, outside trading companies and exporters for our supply of green coffee. We believe, based on relationships established with our suppliers, the risk of non-delivery on such purchase commitments is remote.
To help ensure the future supply of high-quality green coffees, and to reinforce our leadership role in the coffee industry, Starbucks operates farmer support centers in six countries. The farmer support centers are staffed with agronomists and sustainability experts who work with coffee farming communities to promote best practices in coffee production designed to improve both coffee quality and yields.
In addition to coffee, we also purchase significant amounts of dairy products, particularly fluid milk, to support the needs of our company-operated stores. We believe, based on relationships established with our dairy suppliers, that the risk of non-delivery of sufficient fluid milk to support our stores is remote.
Products other than whole bean coffees and coffee beverages sold in Starbucks® stores include tea and a number of ready-to-drink beverages that are purchased from several specialty suppliers, usually under long-term supply contracts. Food products, such as La Boulange™ pastries, breakfast sandwiches and lunch items, are purchased from national, regional and local sources. We also purchase a broad range of paper and plastic products, such as cups and cutlery, from several companies to support the needs of our retail stores as well as our manufacturing and distribution operations. We believe, based on relationships established with these suppliers and manufacturers, that the risk of non-delivery of these items is remote.
2013 10-KStarbucks Corporation Form

8
Competition
Our primary competitors for coffee beverage sales are quick-service restaurants and specialty coffee shops. In almost all markets in which we do business, there are numerous competitors in the specialty coffee beverage business. We believe that our customers choose among specialty coffee retailers primarily on the basis of product quality, service and convenience, as well as price. We continue to experience direct competition from large competitors in the US quick-service restaurant sector and the US ready-to-drink coffee beverage market, in addition to well-established companies in many international markets. We also compete with restaurants and other specialty retailers for prime retail locations and qualified personnel to operate both new and existing stores.
Our coffee and tea products sold through our Channel Development segment compete directly against specialty coffees and teas sold through grocery stores, warehouse clubs, specialty retailers, convenience stores, and US foodservice accounts and compete indirectly against all other coffees and teas on the market.
Patents, Trademarks, Copyrights and Domain Names
Starbucks owns and has applied to register numerous trademarks and service marks in the US and in additional countries throughout the world. Some of our trademarks, including Starbucks, the Starbucks logo, Tazo, Seattle’s Best Coffee, Teavana, Frappuccino, Starbucks VIA, Evolution Fresh and La Boulange are of material importance. The duration of trademark registrations varies from country to country. However, trademarks are generally valid and may be renewed indefinitely as long as they are in use and/or their registrations are properly maintained.
We own numerous copyrights for items such as product packaging, promotional materials, in-store graphics and training materials. We also hold patents on certain products, systems and designs. In addition, Starbucks has registered and maintains numerous Internet domain names, including “Starbucks.com,” “Starbucks.net,” "Tazo.com," “Seattlesbest.com" and “Teavana.com.”
Seasonality and Quarterly Results
Our business is subject to seasonal fluctuations, including fluctuations resulting from the holiday season in December. Our cash flows from operations are considerably higher in the first fiscal quarter than the remainder of the year. This is largely driven by cash received as Starbucks Cards are purchased and loaded during the holiday season. Since revenues from Starbucks Cards are recognized upon redemption and not when purchased, seasonal fluctuations on the consolidated statements of earnings are much less pronounced. Quarterly results are also affected by the timing of the opening of new stores and the closing of existing stores. For these reasons, results for any quarter are not necessarily indicative of the results that may be achieved for the full fiscal year.
Employees
Starbucks employed approximately 182,000 people worldwide as of September 29, 2013. In the US, Starbucks employed approximately 137,000 people, with 129,000 in company-operated stores and the remainder in support facilities, store development, and roasting and warehousing operations. Approximately 45,000 employees were employed outside of the US, with 43,000 in company-operated stores and the remainder in regional support operations. The number of Starbucks employees represented by unions is not significant. We believe our current relations with our employees are good.
Executive Officers of the Registrant
Name Age Position
Howard Schultz 60 chairman, president and chief executive officerCliff Burrows 54 group president, Americas and US, EMEA and TeavanaJohn Culver 53 group president, China & Asia Pacific, Channel Development
and Emerging Brands
Jeff Hansberry 49 president, China & Asia PacificTroy Alstead 50 chief financial officer and group president, Global Business
Services
Lucy Lee Helm 56 executive vice president, general counsel and secretary
2013 10-KStarbucks Corporation Form

9
Howard Schultz is the founder of Starbucks Corporation and serves as the chairman, president and chief executive officer. Mr. Schultz has served as chairman of the board of directors since Starbucks inception in 1985, and in January 2008, he reassumed the role of president and chief executive officer. From June 2000 to February 2005, Mr. Schultz also held the title of chief global strategist. From November 1985 to June 2000, he served as chairman of the board and chief executive officer. From November 1985 to June 1994, Mr. Schultz also served as president. From January 1986 to July 1987, Mr. Schultz was the chairman of the board, chief executive officer and president of Il Giornale Coffee Company, a predecessor to the Company. From September 1982 to December 1985, Mr. Schultz was the director of retail operations and marketing for Starbucks Coffee Company, a predecessor to the Company.
Cliff Burrows joined Starbucks in April 2001 and has served as group president, Americas and US, EMEA (Europe, Middle East and Africa) and Teavana since May 2013. Mr. Burrows served as president, Starbucks Coffee Americas and US from October 2011 to May 2013 and as president, Starbucks Coffee US from March 2008 to October 2011. He served as president, Europe, Middle East and Africa (EMEA) from April 2006 to March 2008. He served as vice president and managing director, UK prior to April 2006. Prior to joining Starbucks, Mr. Burrows served in various management positions with Habitat Designs Limited, a furniture and house wares retailer.
John Culver joined Starbucks in August 2002 and has served as group president, China & Asia Pacific, Channel Development (CPG) and Emerging Brands since May 2013. Mr. Culver served as president, Starbucks Coffee China and Asia Pacific from October 2011 to May 2013. From December 2009 to October 2011, he served as president, Starbucks Coffee International. Mr. Culver served as executive vice president; president, Global Consumer Products, Foodservice and Seattle’s Best Coffee from February 2009 to September 2009, and then as president, Global Consumer Products and Foodservice from October 2009 to November 2009. He previously served as senior vice president; president, Starbucks Coffee Asia Pacific from January 2007 to February 2009, and vice president; general manager, Foodservice from August 2002 to January 2007.
Jeff Hansberry joined Starbucks in June 2010 and has served as president, China and Asia Pacific since May 2013. Mr. Hansberry served as president, Channel Development and Emerging Brands from June 2012 to May 2013. From October 2011 to June 2012, he served as president, Channel Development and president, Seattle’s Best Coffee. From June 2010 to October 2011, he served as president, Global Consumer Products and Foodservice. Prior to joining Starbucks, Mr. Hansberry served as vice president and general manager, Popular BU for E. & J. Gallo Winery, a family-owned winery, from November 2008 to May 2010. From September 2007 to November 2008, Mr. Hansberry served as vice president and general manager, Value BU, and from April 2005 to August 2007, he served as vice president and general manager Asia, for E. & J. Gallo Winery. Prior to E. & J. Gallo, Mr. Hansberry held various positions with Procter & Gamble.
Troy Alstead joined Starbucks in 1992 and has served as chief financial officer and group president, Global Business Services since September 2013. Mr. Alstead previously served as chief financial officer and chief administrative officer from November 2008 to September 2013, as chief operating officer, Starbucks Greater China from April 2008 to October 2008, senior vice president, Global Finance and Business Operations from August 2007 to April 2008, and senior vice president, Corporate Finance from September 2004 to August 2007. Mr. Alstead served in a number of other senior positions with Starbucks prior to 2004.
Lucy Lee Helm joined Starbucks in September 1999 and has served as executive vice president, general counsel and secretary since May 2012. She served as senior vice president and deputy general counsel from October 2007 to April 2012 and served as interim general counsel and secretary from April 2012 to May 2012. Ms. Helm previously served as vice president, assistant general counsel from June 2002 to September 2007 and as director, corporate counsel from September 1999 to May 2002. During her tenure at Starbucks, Ms. Helm has led various teams of the Starbucks legal department, including the Litigation and Brand protection team, the Global Business (Commercial) team and the Litigation and Employment team. Prior to joining Starbucks, Ms. Helm was a principal at the Seattle law firm of Riddell Williams P.S. from 1990 to 1999, where she was a trial lawyer specializing in commercial, insurance coverage and environmental litigation.
Global Responsibility
We are committed to being a deeply responsible company in the communities where we do business. Our focus is on ethically sourcing high-quality coffee, reducing our environmental impacts and contributing positively to communities around the world. Starbucks Global Responsibility strategy and commitments are integral to our overall business strategy. As a result, we believe we deliver benefits to our stakeholders, including employees, business partners, customers, suppliers, shareholders, community members and others. For an overview of Starbucks Global Responsibility strategy and commitments, please visit www.starbucks.com.
2013 10-KStarbucks Corporation Form

10
Available Information
Starbucks 10-K reports, along with all other reports and amendments filed with or furnished to the Securities and Exchange Commission (“SEC”), are publicly available free of charge on the Investor Relations section of our website at investor.starbucks.com or at www.sec.gov as soon as reasonably practicable after these materials are filed with or furnished to the SEC. Our corporate governance policies, code of ethics and Board committee charters and policies are also posted on the Investor Relations section of Starbucks website at investor.starbucks.com. The information on our website is not part of this or any other report Starbucks files with, or furnishes to, the SEC.
Item 1A. Risk Factors
You should carefully consider the risks described below. If any of the risks and uncertainties described in the cautionary factors described below actually occurs, our business, financial condition and results of operations, and the trading price of our common stock could be materially and adversely affected. Moreover, we operate in a very competitive and rapidly changing environment. New factors emerge from time to time and it is not possible to predict the impact of all these factors on our business, financial condition or results of operation.
• Economic conditions in the US and certain international markets could adversely affect our business and financial results. As a retailer that is dependent upon consumer discretionary spending, our results of operations are sensitive to changes in macro-economic conditions. Our customers may have less money for discretionary purchases and may stop or reduce their purchases of our products or trade down to Starbucks or competitors' lower priced products as a result of job losses, foreclosures, bankruptcies, increased fuel and energy costs, higher interest rates, higher taxes, reduced access to credit and lower home prices. Decreases in customer traffic and/or average value per transaction will negatively impact our financial performance as reduced revenues without a corresponding decrease in expenses result in sales de-leveraging, which creates downward pressure on margins and also negatively impacts comparable store sales, net revenues, operating income and earnings per share. There is also a risk that if negative economic conditions persist for a long period of time or worsen, consumers may make long-lasting changes to their discretionary purchasing behavior, including less frequent discretionary purchases on a more permanent basis.
• We may not be successful in implementing important strategic initiatives or effectively managing growth, which may have an adverse impact on our business and financial results.
There is no assurance that we will be able to implement important strategic initiatives in accordance with our expectations, which may result in an adverse impact on our business and financial results. These strategic initiatives are designed to create growth, improve our results of operations and drive long-term shareholder value, and include:
• successfully leveraging Starbucks brand portfolio outside the company-operated store base, including our increased focus on international licensed stores;
• focusing on relevant product innovation and profitable new growth platforms, including retail tea, and achieving customer acceptance of these new products and platforms while maintaining demand for our current offerings;
• continuing to accelerate the growth of our Channel Development business;• balancing disciplined global store growth and existing store renovation while meeting target store-level unit economics
in a given market; • timely completion of certain supply chain capacity expansion initiatives, including increased roasting capacity and
construction of a new soluble products plant;• executing a multi-channel advertising and marketing campaign to effectively communicate our message directly to
Starbucks consumers and employees; and• strategic acquisitions, divestitures or joint ventures.
In addition to other factors listed in this risk factors section, factors that may adversely affect the successful implementation of these initiatives, which could adversely impact our business and financial results, include construction cost increases associated with new store openings and remodeling of existing stores; delays in store openings for reasons beyond our control or a lack of desirable real estate locations available for lease at reasonable rates, either of which could keep us from meeting annual store opening targets in the US and internationally; lack of customer acceptance of new products due to price increases necessary to cover the costs of new products or higher input costs; the degree to which we enter into, maintain, develop and are able to negotiate appropriate terms and conditions of, and enforce, commercial and other agreements; not successfully consummating favorable strategic transactions or integrating acquired businesses; or the deterioration in our credit ratings, which could limit the availability of additional financing and increase the cost of obtaining financing to fund our initiatives.
Additionally, effectively managing growth can be challenging, particularly as we continue to expand into new channels outside the retail store model, increase our focus on our Channel Development business, and expand into new markets internationally
2013 10-KStarbucks Corporation Form

11
where we must balance the need for flexibility and a degree of autonomy for local management against the need for consistency with our goals, philosophy and standards. Growth can make it increasingly difficult to ensure a consistent supply of high-quality raw materials, to locate and hire sufficient numbers of key employees, to maintain an effective system of internal controls for a globally dispersed enterprise and to train employees worldwide to deliver a consistently high quality product and customer experience.
• We face intense competition in each of our channels and markets, which could lead to reduced profitability.
The specialty coffee market is intensely competitive, including with respect to product quality, innovation, service, convenience, and price, and we face significant and increasing competition in all these areas in each of our channels and markets. Accordingly, we do not have leadership positions in all channels and markets. In the US, the ongoing focus by large competitors in the quick-service restaurant sector on selling high-quality specialty coffee beverages could lead to decreases in customer traffic to Starbucks® stores and/or average value per transaction adversely affecting our sales and results of operations. Similarly, continued competition from well-established competitors in our international markets could hinder growth and adversely affect our sales and results of operations in those markets. Increased competition in the US packaged coffee and tea and single-serve and ready-to-drink coffee beverage markets, including from new and large entrants to this market, could adversely affect the profitability of the Channel Development segment. Additionally, declines in general consumer demand for specialty coffee products for any reason, including due to consumer preference for other products, could have a negative effect on our business.
• We are highly dependent on the financial performance of our Americas operating segment.
Our financial performance is highly dependent on our Americas operating segment, as it comprised approximately 74% of consolidated total net revenues in fiscal 2013. If the Americas operating segment revenue trends slow or decline our other segments may be unable to make up any significant shortfall and our business and financial results could be adversely affected. And because the Americas segment is relatively mature and produces the large majority of our operating cash flows, such a slowdown or decline could result in reduced cash flows for funding the expansion of our international business and other initiatives and for returning cash to shareholders.
• We are increasingly dependent on the success of our EMEA and CAP operating segments in order to achieve our growth targets.
Our future growth increasingly depends on the growth and sustained profitability of our EMEA and CAP operating segments. Some or all of our international market business units (“MBUs”), which we generally define by the countries in which they operate, may not be successful in their operations or in achieving expected growth, which ultimately requires achieving consistent, stable net revenues and earnings. The performance of these international operations may be adversely affected by economic downturns in one or more of our large MBUs. In particular, our China MBU contributes meaningfully to both net revenues and earnings for our CAP segment and our Japan MBU contributes significantly to earnings in that segment. In the EMEA segment, our UK MBU accounts for a significant portion of the net revenues. A decline in performance of any of these MBUs could have a material adverse impact on the results of our international operations.
Additionally, some factors that will be critical to the success of the EMEA and CAP segments are different than those affecting our US stores and licensees. Tastes naturally vary by region, and consumers in some MBUs may not embrace our products to the same extent as consumers in the US or other international markets. Occupancy costs and store operating expenses can be higher internationally than in the US due to higher rents for prime store locations or costs of compliance with country-specific regulatory requirements. Because many of our international operations are in an early phase of development, operating expenses as a percentage of related revenues are often higher compared to more developed operations, such as in the US. Additionally, our international joint venture partners or licensees may face capital constraints or other factors that may limit the speed at which they are able to expand and develop in a certain market.
Our international operations are also subject to additional inherent risks of conducting business abroad, such as: • foreign currency exchange rate fluctuations, or requirements to transact in specific currencies; • changes or uncertainties in economic, legal, regulatory, social and political conditions in our markets; • interpretation and application of laws and regulations; • restrictive actions of foreign or US governmental authorities affecting trade and foreign investment, especially during
periods of heightened tension between the US and such foreign governmental authorities, including protective measures such as export and customs duties and tariffs, government intervention favoring local competitors, and restrictions on the level of foreign ownership;
• import or other business licensing requirements;• the enforceability of intellectual property and contract rights;
2013 10-KStarbucks Corporation Form

12
• limitations on the repatriation of funds and foreign currency exchange restrictions due to current or new US and international regulations;
• in developing economies, the growth rate in the portion of the population achieving targeted levels of disposable income may not be as fast as we forecast;
• difficulty in staffing, developing and managing foreign operations and supply chain logistics, including ensuring the consistency of product quality and service, due to distance, language and cultural differences, as well as challenges in recruiting and retaining high quality employees in local markets;
• local laws that make it more expensive and complex to negotiate with, retain or terminate employees;• delays in store openings for reasons beyond our control, competition with locally relevant competitors or a lack of desirable
real estate locations available for lease at reasonable rates, any of which could keep us from meeting annual store opening targets and, in turn, negatively impact net revenues, operating income and earnings per share; and
• disruption in energy supplies affecting our markets.
Moreover, many of the foregoing risks are particularly acute in developing countries, which are important to our long-term growth prospects.
• Our success depends substantially on the value of our brands and failure to preserve their value, either through our actions or those of our business partners, could have a negative impact on our financial results.
We believe we have built an excellent reputation globally for the quality of our products, for delivery of a consistently positive consumer experience and for our corporate social responsibility programs. Our brand is recognized throughout the world and we have received high ratings in global brand value studies. To be successful in the future, particularly outside of US, where the Starbucks brand and our other brands are less well-known, we believe we must preserve, grow and leverage the value of our brands across all sales channels. Brand value is based in part on consumer perceptions on a variety of subjective qualities.
Additionally, our business strategy, including our plans for new stores, foodservice, branded products and other initiatives, relies significantly on a variety of business partners, including licensee and partnership relationships, particularly in our international markets. Licensees and food service operators are often authorized to use our logos and provide branded beverages, food and other products directly to customers. We provide training and support to, and monitor the operations of, certain of these business partners, but the product quality and service they deliver may be diminished by any number of factors beyond our control, including financial pressures. We believe customers expect the same quality of products and service from our licensees and food services providers as they do from us and we strive to ensure customers receive the same quality products and service experience whether they visit a company-operated store, licensed store or food service location. We also source our food, beverage and other products from a wide variety of domestic and international business partners in our supply chain operations, and in certain cases such products are produced or sourced by our licensees directly.
Business incidents, whether isolated or recurring and whether originating from us or our business partners, that erode consumer trust, such as contaminated food, recalls or actual or perceived breaches of privacy, particularly if the incidents receive considerable publicity or result in litigation, can significantly reduce brand value and have a negative impact on our financial results. Consumer demand for our products and our brand equity could diminish significantly if we or our licensees or other business partners fail to preserve the quality of our products, are perceived to act in an unethical or socially irresponsible manner, fail to comply with laws and regulations or fail to deliver a consistently positive consumer experience in each of our markets. Additionally, inconsistent uses of our brand and other of our intellectual property assets, as well as failure to protect our intellectual property, including from unauthorized uses of our brand or other of our intellectual property assets, can erode consumer trust and our brand value and have a negative impact on our financial results.
• Increases in the cost of high-quality arabica coffee beans or other commodities or decreases in the availability of high-quality arabica coffee beans or other commodities could have an adverse impact on our business and financial results.
We purchase, roast, and sell high-quality whole bean arabica coffee beans and related coffee products. The price of coffee is subject to significant volatility and, although coffee prices have come down from their near-record highs of 2011, they may again increase significantly due to factors described below. The high-quality arabica coffee of the quality we seek tends to trade on a negotiated basis at a premium above the “C” price. This premium depends upon the supply and demand at the time of purchase and the amount of the premium can vary significantly. Increases in the “C” coffee commodity price do increase the price of high-quality arabica coffee and also impact our ability to enter into fixed-price purchase commitments. We frequently enter into supply contracts whereby the quality, quantity, delivery period, and other negotiated terms are agreed upon, but the date, and therefore price, at which the base “C” coffee commodity price component will be fixed has not yet been established. These are known as price-to-be-fixed contracts. The supply and price of coffee we purchase can also be affected by multiple factors in the producing countries, including weather, natural disasters, crop disease, general increase in farm inputs and costs of production, inventory levels and political and economic conditions, as well as the actions of certain organizations and associations that have historically
2013 10-KStarbucks Corporation Form

13
attempted to influence prices of green coffee through agreements establishing export quotas or by restricting coffee supplies. Speculative trading in coffee commodities can also influence coffee prices. Because of the significance of coffee beans to our operations, combined with our ability to only partially mitigate future price risk through purchasing practices and hedging activities, increases in the cost of high-quality arabica coffee beans could have an adverse impact on our profitability. In addition, if we are not able to purchase sufficient quantities of green coffee due to any of the above factors or to a worldwide or regional shortage, we may not be able to fulfill the demand for our coffee, which could have an adverse impact on our profitability.
In addition to coffee, we also purchase significant amounts of dairy products, particularly fluid milk, to support the needs of our company-operated retail stores. Although less significant to our operations than coffee or dairy, other commodities including but not limited to those related to food inputs, such as tea, produce, baking ingredients, and energy, are important to our operations. Increases in the cost of dairy products and other commodities could have an adverse impact on our profitability.
• Our financial condition and results of operations are sensitive to, and may be adversely affected by, a number of factors, many of which are largely outside our control.
Our operating results have been in the past and will continue to be subject to a number of factors, many of which are largely outside our control. Any one or more of the factors listed below or described elsewhere in this risk factors section could adversely impact our business, financial condition and/or results of operations:
• declines in general consumer demand for specialty coffee products; • increases in labor costs such as increased health care costs, general market wage levels and workers' compensation
insurance costs; • adverse outcomes of current or future litigation; • especially in our larger or fast growing markets, labor discord, war, terrorism (including incidents targeting us), political
instability, boycotts, social unrest, and natural disasters, including health pandemics that lead to avoidance of public places or restrictions on public gatherings such as in our stores.
• Interruption of our supply chain could affect our ability to produce or deliver our products and could negatively impact our business and profitability.
Any material interruption in our supply chain, such as material interruption of roasted coffee supply due to the casualty loss of any of our roasting plants, interruptions in service by our third party logistic service providers or common carriers that ship goods within our distribution channels, trade restrictions, such as increased tariffs or quotas, embargoes or customs restrictions, or natural disasters that cause a material disruption in our supply chain could negatively impact our business and our profitability.
Additionally, our food, beverage and other products are sourced from a wide variety of domestic and international business partners in our supply chain operations, and in certain cases are produced or sourced by our licensees directly. We rely on these suppliers and vendors to provide high quality products and to comply with applicable laws. Our ability to find qualified suppliers and vendors who meet our standards and supply products in a timely and efficient manner is a significant challenge, especially with respect to goods sourced from outside the US. A vendor's or supplier's failure to meet our standards, provide products in a timely and efficient manner, and comply with applicable laws is beyond our control. These issues could negatively impact our business and profitability.
• Failure to meet market expectations for our financial performance will likely adversely affect the market price and volatility of our stock.
Failure to meet market expectations going forward, particularly with respect to operating margins, earnings per share, comparable store sales, operating cash flows, and net revenues, will likely result in a decline and/or increased volatility in the market price of our stock. In addition, price and volume fluctuations in the stock market as a whole may affect the market price of our stock in ways that may be unrelated to our financial performance.
• The loss of key personnel or difficulties recruiting and retaining qualified personnel could adversely impact our business and financial results.
Much of our future success depends on the continued availability and service of senior management personnel. The loss of any of our executive officers or other key senior management personnel could harm our business. We must continue to recruit, retain and motivate management and other employees sufficiently, both to maintain our current business and to execute our strategic initiatives, some of which involve ongoing expansion in business channels outside of our traditional company-operated store model. Our success also depends substantially on the contributions and abilities of our retail store employees whom we rely on to give customers a superior in-store experience. Accordingly, our performance depends on our ability to recruit and retain high quality employees to work in and manage our stores, both domestically and internationally. If we are unable to recruit, retain and motivate employees sufficiently to maintain our current business and support our projected growth, our business and financial performance may be adversely affected.
2013 10-KStarbucks Corporation Form

14
• Adverse public or medical opinions about the health effects of consuming our products, as well as reports of incidents involving food-borne illnesses, food tampering or food contamination, whether or not accurate, could harm our business.
Some of our products contain caffeine, dairy products, sugar and other compounds, the health effects of which are the subject of public scrutiny, including the suggestion that excessive consumption of caffeine, dairy products, sugar and other compounds can lead to a variety of adverse health effects. Particularly in the US, there is increasing consumer awareness of health risks, including obesity, due in part to increased publicity and attention from health organizations, as well as increased consumer litigation based on alleged adverse health impacts of consumption of various food products. While we have a variety of beverage and food items, including items that are coffee-free and have reduced calories, an unfavorable report on the health effects of caffeine or other compounds present in our products, whether accurate or not, or negative publicity or litigation arising from certain health risks could significantly reduce the demand for our beverages and food products.
Similarly, instances or reports, whether true or not, of unclean water supply, food-borne illnesses, food tampering and food contamination, either during growing, manufacturing, packaging or preparation, have in the past severely injured the reputations of companies in the food processing, grocery and quick-service restaurant sectors and could affect us as well. Any report linking us to the use of unclean water, food-borne illnesses or food tampering or contamination could damage our brand value and severely hurt sales of our beverages and food products, and possibly lead to product liability claims, litigation (including class actions) or damages. Clean water is critical to the preparation of coffee and tea beverages and our ability to ensure a clean water supply to our stores can be limited, particularly in some international locations. If customers become ill from food-borne illnesses, tampering or contamination, we could also be forced to temporarily close some stores and/or supply chain facilities. In addition, instances of food-borne illnesses, food tampering or food contamination, even those occurring solely at the restaurants or stores of competitors, could, by resulting in negative publicity about the foodservice industry, adversely affect our sales on a regional or global basis. A decrease in customer traffic as a result of these health concerns or negative publicity, or as a result of a temporary closure of any of our stores, as well as adverse results of claims or litigation, could materially harm our business and results of operations.
• We rely heavily on information technology in our operations, and any material failure, inadequacy, interruption or security failure of that technology could harm our ability to effectively operate our business and expose us to potential liability and loss of revenues.
We rely heavily on information technology systems across our operations, including for administrative functions, point-of-sale processing and payment in our stores and online, management of our supply chain, Starbucks Cards, online business and various other processes and transactions. Our ability to effectively manage our business and coordinate the production, distribution and sale of our products depends significantly on the reliability, integrity and capacity of these systems. We also rely on third party providers for some of these information technology systems and support. The failure of these systems to operate effectively, problems with transitioning to upgraded or replacement systems, or a breach in security of these systems, including through cyber terrorism, could cause material negative impacts to our product sales, the efficiency of our operations and our financial results. Significant capital investments and other expenditures could be required to remedy the problem. Furthermore, security breaches of our employees' or customers' private data could result in a violation of applicable US and international privacy and other laws, loss of revenues from the potential adverse impact to our reputation and our ability to retain or attract new customers, and could result in litigation, potential liability and the imposition of penalties.
• Failure to comply with applicable laws and regulations could harm our business and financial results.
Our policies and procedures are designed to comply with all applicable laws, accounting and reporting requirements, tax rules and other regulations and requirements, including those imposed by the SEC, NASDAQ, and foreign countries, as well as applicable trade, labor, healthcare, privacy, food, anti-bribery and corruption and merchandise laws. The complexity of the regulatory environment in which we operate and the related cost of compliance are both increasing due to additional or changing legal and regulatory requirements, our ongoing expansion into new markets and new channels, and the fact that foreign laws occasionally conflict with domestic laws. In addition to potential damage to our reputation and brand, failure to comply with the various laws and regulations as well as changes in laws and regulations or the manner in which they are interpreted or applied, may result in litigation, civil and criminal liability, damages, fines and penalties, increased cost of regulatory compliance and restatements of our financial statements.
Item 1B. Unresolved Staff Comments
None.
2013 10-KStarbucks Corporation Form

15
Item 2. Properties
The significant properties used by Starbucks in connection with its roasting, distribution and corporate administrative operations, serving all segments, are as follows:
LocationApproximate Size
in Square Feet Purpose
Rancho Cucamonga, CA 265,000 ManufacturingAtlanta, GA 87,000 Warehouse and distributionAugusta, GA 131,000 ManufacturingCarson Valley, NV 360,000 Roasting and distributionYork County, PA 888,000 Roasting, distribution and warehouseSandy Run, SC 117,000 Roasting and distributionLebanon, TN 680,000 Distribution centerAuburn, WA 490,000 Warehouse and distributionKent, WA 332,000 Roasting and distributionSeattle, WA 1,000,000 Corporate administrativeAmsterdam, Netherlands 97,000 Roasting and distribution
We own our roasting facilities and lease the majority of our warehousing and distribution locations. As of September 29, 2013, Starbucks had 10,194 company-operated stores, almost all of which are leased. We also lease space in various locations worldwide for regional, district and other administrative offices, training facilities and storage.
Item 3. Legal Proceedings
See Note 15 to the consolidated financial statements included in Item 8 of Part II of this 10-K for information regarding certain legal proceedings in which we are involved.
Item 4. Mine Safety Disclosures
Not applicable.
2013 10-KStarbucks Corporation Form

16
PART II
Item 5. Market for the Registrant’s Common Equity, Related Shareholder Matters and Issuer Purchases of Equity Securities
SHAREHOLDER INFORMATION
MARKET INFORMATION AND DIVIDEND POLICY
Starbucks common stock is traded on NASDAQ, under the symbol “SBUX.”
The following table shows the quarterly high and low sale prices per share of Starbucks common stock as reported by NASDAQ for each quarter during the last two fiscal years and the quarterly cash dividend declared per share of our common stock during the periods indicated:
High LowCash Dividends
Declared
2013:Fourth Quarter $ 77.84 $ 65.82 $ 0.26Third Quarter 67.48 56.65 0.21Second Quarter 58.97 52.39 0.21First Quarter 54.90 44.27 0.21
2012:Fourth Quarter $ 54.28 $ 43.04 $ 0.21Third Quarter 62.00 51.03 0.17Second Quarter 56.55 45.28 0.17First Quarter 46.50 35.12 0.17
As of November 8, 2013, we had approximately 18,470 shareholders of record. This does not include persons whose stock is in nominee or “street name” accounts through brokers.
Future decisions to pay cash dividends continue to be at the discretion of the Board of Directors and will be dependent on our operating performance, financial condition, capital expenditure requirements, and other such factors that the Board of Directors considers relevant.
ISSUER PURCHASES OF EQUITY SECURITIES
Starbucks did not repurchase any shares during the fourth quarter of fiscal 2013. As of the end of the quarter, the maximum number of shares that may yet be purchased under our current share repurchase program was 26,359,511 shares. The share repurchase program is conducted under authorizations made from time to time by our Board of Directors. On November 3, 2011, we publicly announced the authorization of up to an additional 20 million shares, and on November 15, 2012, we publicly announced the authorization of up to an additional 25 million shares. These authorizations have no expiration date.
2013 10-KStarbucks Corporation Form

17
Performance Comparison Graph
The following graph depicts the total return to shareholders from September 28, 2008 through September 29, 2013, relative to the performance of the Standard & Poor’s 500 Index, the NASDAQ Composite Index, and the Standard & Poor’s 500 Consumer Discretionary Sector, a peer group that includes Starbucks. All indices shown in the graph have been reset to a base of 100 as of September 28, 2008, and assume an investment of $100 on that date and the reinvestment of dividends paid since that date. The stock price performance shown in the graph is not necessarily indicative of future price performance.
Sep 28, 2008 Sep 27, 2009 Oct 3, 2010 Oct 2, 2011 Sep 30, 2012 Sep 29, 2013
Starbucks Corporation 100.00 132.55 175.02 255.59 352.59 545.34S&P 500 100.00 93.09 102.55 103.72 135.05 161.17NASDAQ Composite 100.00 103.76 116.52 120.44 157.60 195.67S&P Consumer Discretionary 100.00 99.94 123.56 131.19 179.25 236.32
$0
$100
$200
$300
$400
$500
$600
9/28/08 9/27/09 10/3/10 10/2/11 9/30/12 9/29/13
Starbucks Corporation
NASDAQ Composite
S&P 500
S&P Consumer Discretionary
2013 10-KStarbucks Corporation Form
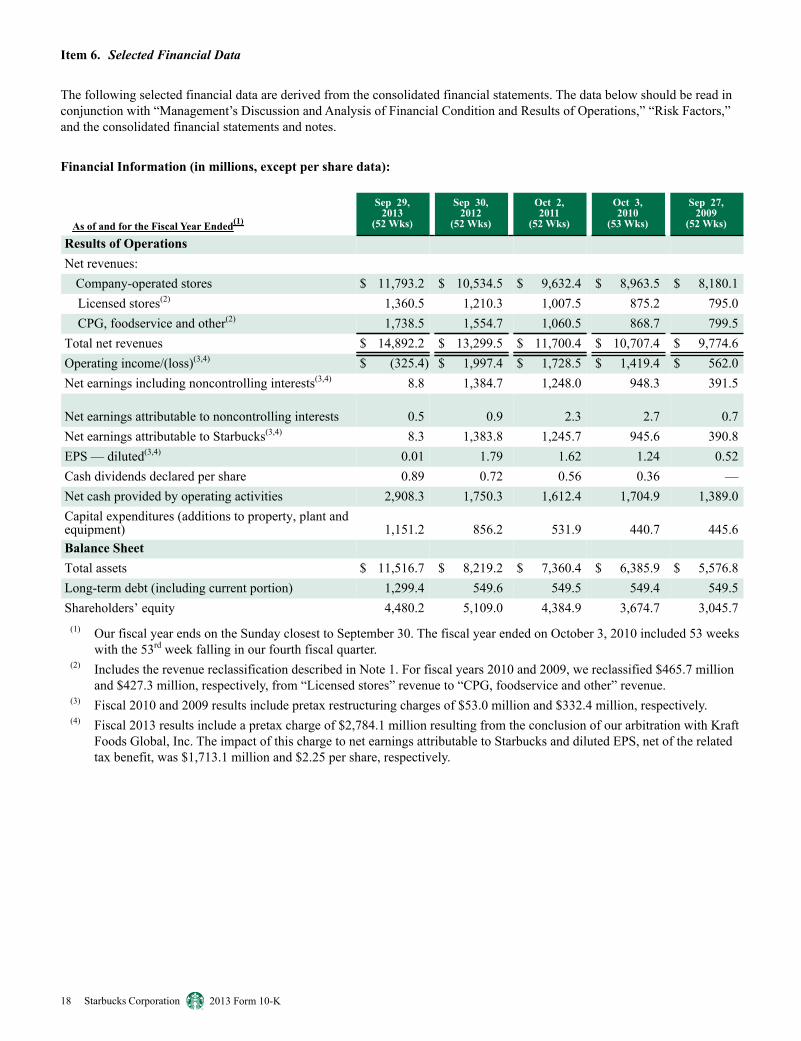
18
Item 6. Selected Financial Data
The following selected financial data are derived from the consolidated financial statements. The data below should be read in conjunction with “Management’s Discussion and Analysis of Financial Condition and Results of Operations,” “Risk Factors,” and the consolidated financial statements and notes.
Financial Information (in millions, except per share data):
As of and for the Fiscal Year Ended(1)
Sep 29,2013
(52 Wks)
Sep 30,2012
(52 Wks)
Oct 2,2011
(52 Wks)
Oct 3,2010
(53 Wks)
Sep 27,2009
(52 Wks)
Results of OperationsNet revenues:
Company-operated stores $ 11,793.2 $ 10,534.5 $ 9,632.4 $ 8,963.5 $ 8,180.1Licensed stores(2) 1,360.5 1,210.3 1,007.5 875.2 795.0CPG, foodservice and other(2) 1,738.5 1,554.7 1,060.5 868.7 799.5
Total net revenues $ 14,892.2 $ 13,299.5 $ 11,700.4 $ 10,707.4 $ 9,774.6Operating income/(loss)(3,4) $ (325.4) $ 1,997.4 $ 1,728.5 $ 1,419.4 $ 562.0Net earnings including noncontrolling interests(3,4) 8.8 1,384.7 1,248.0 948.3 391.5
Net earnings attributable to noncontrolling interests 0.5 0.9 2.3 2.7 0.7Net earnings attributable to Starbucks(3,4) 8.3 1,383.8 1,245.7 945.6 390.8EPS — diluted(3,4) 0.01 1.79 1.62 1.24 0.52Cash dividends declared per share 0.89 0.72 0.56 0.36 —Net cash provided by operating activities 2,908.3 1,750.3 1,612.4 1,704.9 1,389.0Capital expenditures (additions to property, plant andequipment) 1,151.2 856.2 531.9 440.7 445.6Balance SheetTotal assets $ 11,516.7 $ 8,219.2 $ 7,360.4 $ 6,385.9 $ 5,576.8Long-term debt (including current portion) 1,299.4 549.6 549.5 549.4 549.5Shareholders’ equity 4,480.2 5,109.0 4,384.9 3,674.7 3,045.7
(1) Our fiscal year ends on the Sunday closest to September 30. The fiscal year ended on October 3, 2010 included 53 weeks with the 53rd week falling in our fourth fiscal quarter.
(2) Includes the revenue reclassification described in Note 1. For fiscal years 2010 and 2009, we reclassified $465.7 million and $427.3 million, respectively, from “Licensed stores” revenue to “CPG, foodservice and other” revenue.
(3) Fiscal 2010 and 2009 results include pretax restructuring charges of $53.0 million and $332.4 million, respectively.(4) Fiscal 2013 results include a pretax charge of $2,784.1 million resulting from the conclusion of our arbitration with Kraft
Foods Global, Inc. The impact of this charge to net earnings attributable to Starbucks and diluted EPS, net of the related tax benefit, was $1,713.1 million and $2.25 per share, respectively.
2013 10-KStarbucks Corporation Form

19
Comparable Store Sales:
Fiscal Year Ended
Sep 29,2013
(52 Wks)
Sep 30,2012
(52 Wks)
Oct 2,2011
(52 Wks)
Oct 3,2010
(53 Wks)
Sep 27,2009
(52 Wks)
Percentage change in comparable store sales(5)
AmericasSales growth 7 % 8% 8% 7 % (6)%Change in transactions 5 % 6% 5% 3 % (4)%Change in ticket 2 % 2% 2% 3 % (2)%
EMEASales growth — % —% 3% 5 % (3)%Change in transactions 2 % —% 3% 6 % — %Change in ticket (2)% —% —% (1)% (3)%
China / Asia PacificSales growth 9 % 15% 22% 11 % 2 %Change in transactions 7 % 11% 20% 9 % — %Change in ticket 2 % 3% 2% 2 % 2 %
ConsolidatedSales growth 7 % 7% 8% 7 % (6)%Change in transactions 5 % 6% 6% 4 % (4)%Change in ticket 2 % 1% 2% 3 % (2)%
(5) Includes only Starbucks® company-operated stores open 13 months or longer. For fiscal year 2010, comparable store sales percentages were calculated excluding the 53rd week. Comparable store sales exclude the effect of fluctuations in foreign currency exchange rates.
2013 10-KStarbucks Corporation Form

20
Store Count Data:
As of and for the Fiscal Year Ended
Sep 29,2013
(52 Wks)
Sep 30,2012
(52 Wks)
Oct 2,2011
(52 Wks)
Oct 3,2010
(53 Wks)
Sep 27,2009
(52 Wks)
Net stores opened (closed) during the year:Americas(6)
Company-operated stores 276 228 32 (32) (419)Licensed stores 404 280 215 101 110
EMEA(7)
Company-operated stores (29) 10 25 (64) 20Licensed stores 129 101 79 100 98
China / Asia PacificCompany-operated stores 240 154 73 30 24Licensed stores 348 294 193 79 129
All Other Segments (8)
Company-operated stores 343 — 6 (1) (2)Licensed stores(9) (10) (4) (478) 10 (5)
Total 1,701 1,063 145 223 (45)Stores open at year end:Americas (6)
Company-operated stores 8,078 7,802 7,574 7,542 7,574Licensed stores 5,415 5,011 4,731 4,516 4,415EMEA(7)
Company-operated stores 853 882 872 847 911Licensed stores 1,116 987 886 807 707
China / Asia PacificCompany-operated stores 906 666 512 439 409Licensed stores 2,976 2,628 2,334 2,141 2,062
All Other Segments (8)
Company-operated stores 357 14 14 8 9Licensed stores (9) 66 76 80 558 548
Total 19,767 18,066 17,003 16,858 16,635(6) Americas store data has been adjusted for the sale of store locations in Chile to a joint venture partner in the fourth
quarter of fiscal 2013 by reclassifying historical information from company-operated stores to licensed stores, and to exclude Seattle's Best Coffee and Evolution Fresh, which are now reported within All Other Segments.
(7) EMEA store data has been adjusted for the acquisition of store locations in Austria and Switzerland in the fourth quarter of fiscal 2011 by reclassifying historical information from licensed stores to company-operated stores, and the transfer of certain company-operated stores to licensees in the fourth quarter of fiscal 2012.
(8) Includes 366 Teavana stores added in fiscal 2013. (9) Includes the closure of 475 licensed Seattle’s Best Coffee® locations in Borders Bookstores during fiscal 2011.
2013 10-KStarbucks Corporation Form

21
Item 7. Management’s Discussion and Analysis of Financial Condition and Results of Operations
General
Our fiscal year ends on the Sunday closest to September 30. The fiscal years ended on September 29, 2013, September 30, 2012 and October 2, 2011 all included 52 weeks. All references to store counts, including data for new store openings, are reported net of related store closures, unless otherwise noted.
Financial Highlights
• Total net revenues increased 12.0% to $14.9 billion in fiscal 2013 compared to $13.3 billion in fiscal 2012.
• Global comparable store sales grew 7% driven by a 5% increase in the number of transactions and a 2% increase in average ticket.
• Consolidated operating income decreased to $(0.3) billion in fiscal 2013 compared to $2.0 billion in fiscal 2012 and fiscal 2013 operating margin was (2.2)% compared to 15.0% in fiscal 2012. The declines were due to the litigation charge noted below.
• EPS for fiscal 2013 decreased to $0.01, compared to EPS of $1.79 in fiscal 2012. The decline was due to the litigation charge noted below.
• Arbitration concluded on litigation with Kraft Foods Global, Inc. ("Kraft") on November 12, 2013, which resulted in a pretax charge to fiscal 2013 operating results of $2.8 billion. This charge reduced EPS by $2.25 per share in fiscal 2013.
• Cash flow from operations was $2.9 billion in fiscal 2013 compared to $1.8 billion in fiscal 2012. Capital expenditures were $1.2 billion in fiscal 2013 compared to $856 million in fiscal 2012.
• Available operating cash flow after capital expenditures during fiscal 2013 was directed at returning $1.2 billion of cash to our shareholders through dividends and share repurchases.
Overview
Starbucks segment results for fiscal 2013 demonstrate the fundamental health of our global business model and our continued ability to successfully execute new growth initiatives in a disciplined manner. Our strong revenue growth of 12% and continued segment margin expansion drove increased operating cash flows, which allowed us to both fund our growth initiatives and increase cash returned to shareholders through dividends and share repurchases.
The Americas segment continued its strong performance in fiscal 2013, with revenues growing 11% and comparable store sales growth of 7%. Strength in beverage innovation and promotions, operational improvements, and expanded food offerings all contributed to the increase in comparable store sales. Operating margin expanded 120 basis points to 21.5%, driven by sales leverage, store efficiencies, and lower commodity costs. Looking forward, we expect to continue to drive sales growth and profitability through new stores and enhanced product offerings, including the continued roll out of La Boulange™ bakery items into all of our company-operated stores by the end of fiscal 2014.
In the EMEA segment, we are continuing to make steady progress toward long-term profitability in the region. Revenues grew 2% compared to the prior year, with licensed store revenue growth nearly offset by a decline in company-operated store revenues. This reflects the shift in our ownership structure, as we have closed underperforming company-operated stores and are focused on growing our licensed store base in profitable locations. Comparable store sales were flat year over year, but were modestly positive in the second half of fiscal 2013. EMEA operating margin improved to 5.5% in fiscal 2013 due to our ongoing cost management efforts and our store portfolio optimization activities which began in the prior year. We expect the investments we are making in this segment will result in improved operating performance as we progress on our plan towards mid-teens operating margin over time.
Our CAP segment results reflect a combination of rapid new store growth and solid performance from our existing store base, including our joint venture operations in China and Japan. New store growth, along with a 9% increase in comparable store sales, drove a 27% increase in total net revenues for fiscal 2013. Operating income grew 27% to $321 million and operating margin was unchanged at 35%, primarily due to our rapid growth shifting away from our historically licensed model. We expect this segment will become a more meaningful contributor to overall company profitability in the future, as we look forward to continued store openings and establishing China as our largest market outside of the US.
2013 10-KStarbucks Corporation Form

22
Channel Development segment revenues grew 10% in fiscal 2013, primarily due to increased sales of premium single serve products. Lower coffee costs was the primary contributor to the 290 basis point increase in operating margin for fiscal 2013. As we continue to expand customer occasions outside of our retail stores, including growing our presence in the premium single serve category, we expect this segment will become a more significant contributor to our future growth.
Our consolidated operating results included a litigation charge as a result of the conclusion of our arbitration with Kraft which resulted in a pretax charge to operating expenses of $2.8 billion. The conclusion of this litigation is described in more detail in Note 15 to the consolidated financial statements included in Item 8 of Part II of this 10-K. We believe we have adequate liquidity to fund this expected payment, both in the form of cash on hand and the expected issuance of additional debt in fiscal 2014.
Fiscal 2014 — The View Ahead
For fiscal year 2014, we expect revenue growth driven by mid-single-digit global comparable store sales growth, 1,500 new store openings, and continued growth in the Channel Development business.
We expect fiscal year 2014 consolidated operating margin improvement, when compared to our fiscal 2013 operating results excluding the litigation charge associated with the Kraft arbitration, of 150 to 200 basis points and strong EPS growth, driven primarily by leverage on revenue growth.
The effective tax rate for fiscal 2014 is expected to be approximately 34.5%.
Capital expenditures in fiscal 2014 are expected to be approximately $1.2 billion, primarily for store renovations and new stores, as well for other investments to support our ongoing growth initiatives.
Operating Segment Overview
Starbucks has four reportable operating segments: 1) Americas, inclusive of the US, Canada, and Latin America markets; 2) Europe, Middle East, and Africa, ("EMEA"); 3) China / Asia Pacific (“CAP”) and 4) Channel Development. All Other Segments includes Teavana, Seattle's Best Coffee and Evolution Fresh, as well as our Digital Ventures business.
The Americas, EMEA and CAP segments include company-operated stores and licensed stores. Licensed stores generally have a higher operating margin than company-operated stores. Under the licensed model, Starbucks receives a reduced share of the total store revenues, but this is more than offset by the reduction in its share of costs as these are primarily incurred by the licensee. The EMEA and CAP segments have a higher relative share of licensed stores versus company-operated stores compared to the Americas segment; however, the Americas segment has been operating significantly longer than the other segments and has developed deeper awareness of, and attachment to, the Starbucks brand and stores among its customer base. As a result, the more mature Americas segment has significantly more stores and higher total revenues than the other two segments. Average sales per store are also higher in the Americas due to various factors including length of time in market.
In certain international markets occupancy costs and store operating expenses can be higher than in the US market due to higher rents for prime store locations or costs of compliance with country-specific regulatory requirements. Because many of our international operations are in an early phase of development, operating expenses as a percentage of related revenues are often higher compared to the US market. International markets in the early stages of development require a more extensive support organization, relative to the current levels of revenue and operating income, than the US market.
We continue to add new stores in both existing, more-mature markets such as the US, and in newer, higher growth markets such as China. Our disciplined approach to expanding our global store base also includes optimizing the mix of company-operated and licensed stores in each market.
Our Channel Development segment includes whole bean and ground coffees, premium Tazo® teas, Starbucks- and Tazo-branded single serve products, a variety of ready-to-drink beverages, such as Starbucks Refreshers™ beverages, and other branded products sold worldwide through channels such as grocery stores, warehouse clubs, specialty retailers, convenience stores, and US foodservice accounts. Ready-to-drink beverages are primarily manufactured and distributed through The North American Coffee Partnership, a joint venture with the Pepsi-Cola Company. The proportionate share of the results of the joint venture is included, on a net basis, in income from equity investees on the consolidated statements of earnings.
Acquisitions
See Note 2 to the consolidated financial statements included in Item 8 of Part II of this 10-K for information regarding acquisitions.
2013 10-KStarbucks Corporation Form

23
RESULTS OF OPERATIONS — FISCAL 2013 COMPARED TO FISCAL 2012
Consolidated results of operations (in millions):
Revenues
Fiscal Year EndedSep 29,
2013Sep 30,
2012%
ChangeSep 29,
2013Sep 30,
2012
% of Total
Net Revenues
Net revenues:Company-operated stores $ 11,793.2 $ 10,534.5 11.9 % 79.2 % 79.2 %Licensed stores 1,360.5 1,210.3 12.4 % 9.1 % 9.1 %CPG, foodservice and other 1,738.5 1,554.7 11.8 % 11.7 % 11.7 %
Total net revenues $ 14,892.2 $ 13,299.5 12.0% 100.0% 100.0%
Total net revenues were $14.9 billion for fiscal 2013, an increase of $1.6 billion, or 12%, over fiscal 2012, primarily due to increased revenues from company-operated stores (contributing $1.3 billion). The increase in company-operated store revenue was driven by an increase in comparable store sales (7%, or approximately $720 million) and incremental revenues from 492 net new company-operated store openings over the past 12 months (approximately $386 million).
Licensed store revenue growth contributed $150 million to the increase in total net revenues in fiscal 2013, primarily due to higher product sales to and royalty revenues from our licensees, as a result of improved comparable store sales and the opening of 843 net new licensed stores over the past 12 months.
CPG, foodservice and other revenues increased $184 million, primarily driven by increased sales of premium single serve products (approximately $116 million) and increased foodservice sales (approximately $37 million).
Operating Expenses
Fiscal Year EndedSep 29,
2013Sep 30,
2012Sep 29,
2013Sep 30,
2012% of Total
Net Revenues
Cost of sales including occupancy costs $ 6,382.3 $ 5,813.3 42.9 % 43.7 %Store operating expenses 4,286.1 3,918.1 28.8 % 29.5 %Other operating expenses 457.2 429.9 3.1 % 3.2 %Depreciation and amortization expenses 621.4 550.3 4.2 % 4.1 %General and administrative expenses 937.9 801.2 6.3 % 6.0 %Litigation charge 2,784.1 — 18.7 % — %Total operating expenses 15,469.0 11,512.8 103.9 % 86.6 %Income from equity investees 251.4 210.7 1.7 % 1.6 %Operating income/(loss) $ (325.4) $ 1,997.4 (2.2)% 15.0%Supplemental ratios as a % of related revenues:Store operating expenses 36.3 % 37.2 %
Cost of sales including occupancy costs as a percentage of total net revenues decreased 80 basis points, primarily due to lower commodity costs (approximately 50 basis points), driven by a decrease in coffee costs.
Store operating expenses as a percentage of total net revenues decreased 70 basis points. As a percentage of company-operated store revenues, store operating expenses decreased 90 basis points, primarily driven by sales leverage in our Americas segment (approximately 90 basis points) and store portfolio optimization initiatives in Europe that began in the fourth quarter of fiscal 2012 (approximately 50 basis points). This was partially offset by the addition of Teavana and continued investment in our emerging brands (approximately 60 basis points).
2013 10-KStarbucks Corporation Form

24
Other operating expenses as a percentage of total net revenues decreased 10 basis points. As a percentage of non-company-operated store revenues, other operating expenses decreased 70 basis points, primarily driven by sales leverage (approximately 40 basis points) and decreased marketing expenses (approximately 20 basis points).
General and administrative expenses as a percentage of total net revenues increased 30 basis points, primarily driven by increased costs to support overall company growth and the costs related to our October Global Leadership Conference.
Income from equity investees increased $41 million, primarily due to increased income from of our joint venture operations in Japan and China, as well as improved performance from our North American Coffee Partnership joint venture, which produces, bottles and distributes our ready-to-drink beverages.
Litigation charge of $2,784.1 million reflects the accrual we recorded as a result of the conclusion of the arbitration with Kraft. This charge includes $2,227.5 million in damages and $556.6 million in estimated interest and attorneys' fees.
The combination of the above resulted in an operating loss of $325.4 million and operating margin of (220) basis points.
Other Income and Expenses
Fiscal Year EndedSep 29,
2013Sep 30,
2012Sep 29,
2013Sep 30,
2012
% of Total
Net Revenues
Operating income/(loss) $ (325.4) $ 1,997.4 (2.2)% 15.0 %Interest income and other, net 123.6 94.4 0.8 % 0.7 %Interest expense (28.1) (32.7) (0.2)% (0.2)%Earnings/(loss) before income taxes (229.9) 2,059.1 (1.5)% 15.5 %Income taxes (238.7) 674.4 (1.6)% 5.1 %Net earnings including noncontrolling interests 8.8 1,384.7 0.1 % 10.4 %Net earnings attributable to noncontrolling interests 0.5 0.9 — % — %Net earnings attributable to Starbucks $ 8.3 $ 1,383.8 0.1 % 10.4 %Effective tax rate including noncontrolling interests 103.8 % 32.8 %
Net interest income and other increased $29 million over the prior year, primarily due to gains on the sale of the equity in our Chile and Argentina joint ventures in the fourth quarter of fiscal 2013 (approximately $45 million) and in Mexico in the second quarter of fiscal 2013 (approximately $35 million). These gains were partially offset by the absence of additional income recognized in the prior year associated with unredeemed gift cards following a court ruling related to state unclaimed property laws (approximately $29 million). Also offsetting the gains were unfavorable mark-to-market adjustments in fiscal 2013 compared to favorable mark-to-market adjustments in fiscal 2012 from derivatives used to manage our risk of commodity price fluctuations (approximately $24 million).
Income taxes for fiscal year 2013 resulted in an effective tax rate of 103.8% compared to 32.8% for fiscal year 2012. The change in our effective tax rate was primarily due to the impact of the litigation charge associated with the Kraft arbitration in fiscal 2013. For additional information on the impact to our fiscal 2013 effective tax rate from the litigation charge, see Note 13 to the consolidated financial statements included in Item 8 of Part II of this 10-K. Excluding the impact of the litigation charge, the effective tax rate for fiscal year 2013 decreased slightly compared to fiscal 2012 primarily due to benefits from releasing certain tax reserves in fiscal 2013 and a further benefit in fiscal 2013 primarily relating to state income tax expense adjustments for returns filed in prior years. These items were partially offset by a decrease in tax benefits relating to coffee procurement in the current year.
2013 10-KStarbucks Corporation Form

25
Segment Information
The following tables summarize the results of operations by segment (in millions):
Americas
Fiscal Year EndedSep 29,
2013Sep 30,
2012Sep 29,
2013Sep 30,
2012
As a % of Americas Total Net Revenues
Total net revenues $ 11,000.8 $ 9,936.0 100.0% 100.0%Cost of sales including occupancy costs 4,214.9 3,885.5 38.3 % 39.1 %Store operating expenses 3,710.2 3,427.8 33.7 % 34.5 %Other operating expenses 96.9 83.8 0.9 % 0.8 %Depreciation and amortization expenses 429.3 392.4 3.9 % 3.9 %General and administrative expenses 186.7 128.2 1.7 % 1.3 %Total operating expenses 8,638.0 7,917.7 78.5 % 79.7 %Income from equity investees 2.4 2.1 — % — %Operating income $ 2,365.2 $ 2,020.4 21.5% 20.3%Supplemental ratios as a % of related revenues:Store operating expenses 37.0 % 37.8 %
Revenues
Americas total net revenues for fiscal 2013 increased $1.1 billion, or 11%, primarily due to increased revenues from company-operated stores (contributing $961 million) and licensed stores (contributing $90 million).
The increase in company-operated store revenues was driven by an increase in comparable store sales (7%, or approximately$676 million) and incremental revenues from 276 net new company-operated store openings over the past 12 months (approximately $273 million). The increase in licensed stores revenue was due to higher product sales to and royalty revenues from our licensees as a result of improved comparable store sales and the opening of 404 net new licensed stores over the past 12 months.
Operating Expenses
Cost of sales including occupancy costs as a percentage of total net revenues decreased 80 basis points, primarily due to store initiatives to reduce waste (approximately 40 basis points) and lower commodity costs (approximately 30 basis points), driven by a decrease in coffee costs.
Store operating expenses as a percentage of total net revenues (as well as a percentage of company-operated store revenues) decreased 80 basis points, primarily driven by sales leverage (approximately 60 basis points).
General and administrative expenses as a percentage of total net revenues increased 40 basis points primarily due to the costs related to our October Global Leadership Conference (approximately 20 basis points).
The combination of these changes resulted in an increase in operating margin of 120 basis points over fiscal 2012.
2013 10-KStarbucks Corporation Form

26
EMEA
Fiscal Year EndedSep 29,
2013Sep 30,
2012Sep 29,
2013Sep 30,
2012 As a % of EMEA Total Net Revenues
Total net revenues $ 1,160.0 $ 1,141.3 100.0% 100.0%Cost of sales including occupancy costs 590.9 597.3 50.9 % 52.3 %Store operating expenses 339.4 371.1 29.3 % 32.5 %Other operating expenses 38.5 33.6 3.3 % 2.9 %Depreciation and amortization expenses 55.5 57.1 4.8 % 5.0 %General and administrative expenses 71.9 75.7 6.2 % 6.6 %Total operating expenses 1,096.2 1,134.8 94.5 % 99.4 %Income from equity investees 0.4 0.3 — % — %Operating income $ 64.2 $ 6.8 5.5% 0.6%Supplemental ratios as a % of related revenues:Store operating expenses 36.4 % 38.3 %
Revenues
EMEA total net revenues for fiscal 2013 increased $19 million, or 2%, over fiscal 2012. Licensed stores revenue grew $51 million, or 36%, due to increased product sales to and higher royalty revenues from licensees, primarily from the opening of 129 net new licensed stores over the past 12 months and improved comparable store sales. This growth was largely offset by a decline of $36 million in company-operated stores revenue resulting from our store portfolio optimization activities which began in the prior year.
Operating Expenses
Cost of sales including occupancy costs as a percentage of total net revenues decreased 140 basis points, primarily due to lower occupancy costs resulting from our store portfolio optimization initiatives in Europe that began in the fourth quarter of fiscal 2012 (approximately 120 basis points) and a reduction to the estimated asset retirement obligations of our store leases in the region in fiscal 2013 (approximately 70 basis points). These improvements were partially offset by the impact of the shift in composition of our store portfolio in the region to more licensed stores, which have a lower gross margin.
Store operating expenses as a percentage of total net revenues decreased 320 basis points. As a percentage of company-operated store revenues, store operating expenses decreased 190 basis points, primarily from our store portfolio optimization initiatives (approximately 120 basis points).
Other operating expenses as a percentage of total net revenues increased 40 basis points. As a percentage of non-company-operated store revenues, other operating expenses decreased 250 basis points, mainly driven by sales leverage (approximately 180 basis points).
The above changes contributed to an overall improvement in operating margin of 490 basis points over fiscal 2012.
2013 10-KStarbucks Corporation Form

27
China / Asia Pacific
Fiscal Year EndedSep 29,
2013Sep 30,
2012Sep 29,
2013Sep 30,
2012 As a % of CAP
Total Net Revenues
Total net revenues $ 917.0 $ 721.4 100.0% 100.0%Cost of sales including occupancy costs 449.5 362.8 49.0 % 50.3 %Store operating expenses 170.0 119.2 18.5 % 16.5 %Other operating expenses 46.1 47.0 5.0 % 6.5 %Depreciation and amortization expenses 33.8 23.2 3.7 % 3.2 %General and administrative expenses 48.4 39.0 5.3 % 5.4 %Total operating expenses 747.8 591.2 81.5 % 82.0 %Income from equity investees 152.0 122.4 16.6 % 17.0 %Operating income $ 321.2 $ 252.6 35.0% 35.0%Supplemental ratios as a % of related revenues:Store operating expenses 25.3 % 24.4 %
Revenues
China/Asia Pacific total net revenues for fiscal 2013 increased $196 million, or 27%, primarily due to increased revenues from company-operated stores (contributing $183 million), driven by the opening of 240 net new stores over the past 12 months (approximately $129 million) and a 9% increase in comparable store sales (approximately $43 million).
Licensed store revenues contributed $13 million to the increase in total net revenues, mainly from increased royalty revenues from and product sales to licensees, driven by the opening of 348 net new licensed stores over the past 12 months.
Operating Expenses
Cost of sales including occupancy costs as a percentage of total net revenues decreased 130 basis points, primarily driven by company-operated store growth (approximately 170 basis points) as product sales through company-operated stores have higher gross margins than product sales to licensees.
Store operating expenses as a percentage of total net revenues increased 200 basis points due primarily to new store growth. As a percentage of company-operated store revenues, store operating expenses increased 90 basis points due to a change in classification of certain operating costs that were included in general and administrative expenses (approximately 50 basis points) and other operating expenses (approximately 40 basis points) in the prior year.
Other operating expenses as a percentage of total net revenues decreased 150 basis points. As a percentage of non-company-operated store revenues, other operating expenses decreased 140 basis points, primarily driven by a change in classification of certain operating costs to store operating expenses in the current year (approximately 110 basis points).
Income from equity investees increased $30 million, primarily due to improved performance of our joint venture operations in Japan and China.
The above changes resulted in the operating margin percentage being unchanged year over year.
2013 10-KStarbucks Corporation Form

28
Channel Development
Fiscal Year EndedSep 29,
2013Sep 30,
2012Sep 29,
2013Sep 30,
2012
As a % of Channel Development Total Net Revenues
Total net revenues $ 1,420.7 $ 1,292.2 100.0% 100.0%Cost of sales 878.4 827.6 61.8 % 64.0 %Other operating expenses 201.2 191.1 14.2 % 14.8 %Depreciation and amortization expenses 1.1 1.3 0.1 % 0.1 %General and administrative expenses 21.1 17.0 1.5 % 1.3 %Total operating expenses 1,101.8 1,037.0 77.6 % 80.3 %Income from equity investees 96.6 85.2 6.8 % 6.6 %Operating income $ 415.5 $ 340.4 29.2% 26.3%
Revenues
Channel Development total net revenues for fiscal 2013 increased $129 million, or 10%, primarily due to increased sales of premium single serve products (approximately $116 million).
Operating Expenses
Cost of sales as a percentage of total net revenues decreased 220 basis points, primarily due to lower coffee costs (approximately 250 basis points).
Other operating expenses as a percentage of total net revenues decreased 60 basis points, due primarily to lower marketing expenditures (approximately 20 basis points) and increased sales leverage (approximately 20 basis points).
The above changes contributed to an increase in operating margin of 290 basis points over fiscal 2012.
All Other Segments
Fiscal Year EndedSep 29,
2013Sep 30,
2012 % Change
Total net revenues $ 393.7 $ 208.6 88.7 %Cost of sales 239.8 140.1 71.2 %Store operating expenses 66.5 — 100.0 %Other operating expenses 75.3 74.4 1.2 %Depreciation and amortization expenses 11.7 2.5 368.0 %General and administrative expenses 34.9 19.7 77.2 %Total operating expenses 428.2 236.7 80.9 %Income from equity investees — 0.7 (100.0)%Operating loss $ (34.5) $ (27.4) 25.9 %
All Other Segments includes Teavana, Seattle’s Best Coffee, Evolution Fresh, and Digital Ventures.
Total net revenues for All Other Segments increased $185 million, driven by incremental revenues from the acquisition of Teavana in the second quarter of fiscal 2013 (approximately $156 million).
Total operating expenses increased $192 million, largely due to incremental expenses from the acquisition of Teavana.
2013 10-KStarbucks Corporation Form

29
RESULTS OF OPERATIONS — FISCAL 2012 COMPARED TO FISCAL 2011
Consolidated results of operations (in millions):
Revenues
Fiscal Year EndedSep 30,
2012Oct 2,2011
%Change
Sep 30,2012
Oct 2,2011
% of Total
Net Revenues
Net revenues:Company-operated stores $ 10,534.5 $ 9,632.4 9.4 % 79.2 % 82.3 %Licensed stores 1,210.3 1,007.5 20.1 % 9.1 % 8.6 %CPG, foodservice and other 1,554.7 1,060.5 46.6 % 11.7 % 9.1 %
Total net revenues $ 13,299.5 $ 11,700.4 13.7% 100.0% 100.0%
Consolidated net revenues were $13.3 billion for fiscal 2012, an increase of 13.7%, or $1.6 billion over fiscal 2011, primarily due to increased revenues from company-operated stores (contributing $902 million), driven by an increase in comparable store sales (approximately 7%, or $680 million). Also contributing to the increase were incremental revenues from net new company-operated store openings over the past 12 months (approximately $184 million).
Licensed store revenues contributed $203 million to the increase in total net revenues in fiscal 2012, primarily due to higher product sales to and royalty revenues from our licensees, resulting from improved comparable store sales and the opening of 665 net new licensed stores over the past 12 months.
CPG, foodservice and other revenues increased $494 million, primarily due to sales of Starbucks- and Tazo-branded K-Cup®
portion packs launched in the CPG channel on November 1, 2011 (approximately $232 million). The benefit of recognizing full revenue from packaged coffee and tea under the direct distribution model (approximately $78 million) and an increase in foodservice revenues (approximately $50 million) also contributed.
Operating Expenses
Fiscal Year EndedSep 30,
2012Oct 2,2011
Sep 30,2012
Oct 2,2011
% of TotalNet Revenues
Cost of sales including occupancy costs $ 5,813.3 $ 4,915.5 43.7 % 42.0 %Store operating expenses 3,918.1 3,594.9 29.5 % 30.7 %Other operating expenses 429.9 392.8 3.2 % 3.4 %Depreciation and amortization expenses 550.3 523.3 4.1 % 4.5 %General and administrative expenses 801.2 749.3 6.0 % 6.4 %Total operating expenses 11,512.8 10,175.8 86.6 % 87.0 %Gain on sale of properties — 30.2 — % 0.3 %Income from equity investees 210.7 173.7 1.6 % 1.5 %Operating income $ 1,997.4 $ 1,728.5 15.0% 14.8%Supplemental ratios as a % of related revenues:Store operating expenses 37.2 % 37.3 %
Cost of sales including occupancy costs as a percentage of total net revenues increased 170 basis points, driven by increased commodity costs (approximately 160 basis points), primarily due to higher coffee costs.
Store operating expenses as a percentage of total net revenues decreased 120 basis points, due to increased Channel Development and licensed store revenues. Store operating expenses as a percent of company-operated store revenues decreased 10 basis points due to increased sales leverage.
2013 10-KStarbucks Corporation Form

30
Other operating expenses as a percentage of total net revenues decreased 20 basis points. As a percentage of net revenues excluding company-operated store revenues, other operating expenses decreased 350 basis points. This decrease was primarily driven by increased sales leverage (approximately 150 basis points), the absence of charges in fiscal 2012 related to the Seattle’s Best Coffee® store closures in Borders bookstores (approximately 80 basis points) and a shift in the timing of marketing spend (approximately 60 basis points).
Income from equity investees increased $37.0 million, primarily due to an increase in income from our North American Coffee Partnership (approximately $13 million), Japan (approximately $11 million) and Shanghai (approximately $10 million) joint venture operations.
The combination of these changes, along with increased sales leverage on depreciation and amortization (approximately 40 basis points) and general and administrative expenses (approximately 40 basis points), resulted in an increase in operating margin of 20 basis points over fiscal 2011.
Other Income and Expenses
Fiscal Year EndedSep 30,
2012Oct 2,2011
Sep 30,2012
Oct 2,2011
% of Total
Net Revenues
Operating income $ 1,997.4 $ 1,728.5 15.0 % 14.8 %Interest income and other, net 94.4 115.9 0.7 % 1.0 %Interest expense (32.7) (33.3) (0.2)% (0.3)%Earnings before income taxes 2,059.1 1,811.1 15.5 % 15.5 %Income taxes 674.4 563.1 5.1 % 4.8 %Net earnings including noncontrolling interests 1,384.7 1,248.0 10.4 % 10.7 %Net earnings attributable to noncontrolling interests 0.9 2.3 — % — %Net earnings attributable to Starbucks $ 1,383.8 $ 1,245.7 10.4 % 10.6 %Effective tax rate including noncontrolling interests 32.8 % 31.1 %
Net interest income and other decreased $21 million over the prior year, primarily due to the absence of the gain recognized in the fourth quarter of fiscal 2011 resulting from the acquisition of the remaining interest in our previous joint venture operations in Switzerland and Austria (approximately $55 million), partially offset by the recognition of additional income associated with unredeemed gifts cards in the second quarter of fiscal 2012 (approximately $29 million), following a court ruling related to state unclaimed property laws.
Income taxes for the fiscal year ended 2012 resulted in an effective tax rate of 32.8% compared to 31.1% for fiscal year 2011. The rate increased in fiscal year 2012 primarily due to tax benefits recognized in fiscal 2011 from the Switzerland and Austria transaction and the release of foreign valuation allowances.
2013 10-KStarbucks Corporation Form

31
Segment Information
The following tables summarize the results of operations by segment (in millions):Americas
Fiscal Year EndedSep 30,
2012Oct 2,2011
Sep 30,2012
Oct 2,2011
As a % of Americas Total
Net Revenues
Total net revenues $ 9,936.0 $ 9,065.0 100.0% 100.0%Cost of sales including occupancy costs 3,885.5 3,512.7 39.1 % 38.8 %Store operating expenses 3,427.8 3,184.2 34.5 % 35.1 %Other operating expenses 83.8 75.8 0.8 % 0.8 %Depreciation and amortization expenses 392.4 391.4 3.9 % 4.3 %General and administrative expenses 128.2 127.3 1.3 % 1.4 %Total operating expenses 7,917.7 7,291.4 79.7 % 80.4 %Income from equity investees 2.1 1.6 — % — %Operating income $ 2,020.4 $ 1,775.2 20.3% 19.6%Supplemental ratios as a % of related revenues:Store operating expenses 37.8 % 38.1 %
Revenues
Americas total net revenues for fiscal 2012 increased 10%, or $871 million, primarily due to increased revenues from company-operated stores (contributing $712 million), driven by an increase in comparable store sales (approximately 8%, or $626 million). Also contributing to the increase were incremental revenues from net new company-operated store openings over the past 12 months (approximately $100 million).
Licensed store revenues also contributed to the increase in total net revenues with an increase of $149 million in fiscal 2012 over the prior year period, primarily due to higher product sales to and royalty revenues from our licensees, resulting from improved comparable store sales and the opening of 270 net new licensed stores over the past 12 months.
Operating Expenses
Cost of sales including occupancy costs as a percentage of total net revenues increased 30 basis points, primarily driven by higher commodity costs (approximately 110 basis points), mainly coffee, partially offset by increased sales leverage on occupancy costs (approximately 70 basis points).
Store operating expenses as a percentage of total net revenues decreased 60 basis points. Increased licensed store revenues contributed approximately 30 basis points of the decrease. Store operating expenses as a percentage of company-operated store revenues decreased 30 basis points, primarily due to increased sales leverage (approximately 70 basis points), partially offset by higher debit card transaction fees (approximately 20 basis points).
Other operating expenses as a percentage of total net revenues was flat over prior year. As a percentage of net revenues excluding company-operated store revenues, other operating expenses decreased 100 basis points, primarily driven by increased sales leverage.
The combination of these changes, along with increased sales leverage on depreciation and amortization expense (approximately 40 basis points), resulted in an increase in operating margin of 70 basis points over fiscal 2011.
2013 10-KStarbucks Corporation Form

32
EMEA
Fiscal Year EndedSep 30,
2012Oct 2,2011
Sep 30,2012
Oct 2,2011
As a % of EMEA Total Net Revenues
Total net revenues $ 1,141.3 $ 1,046.8 100.0% 100.0%Cost of sales including occupancy costs 597.3 530.3 52.3 % 50.7 %Store operating expenses 371.1 327.3 32.5 % 31.3 %Other operating expenses 33.6 36.5 2.9 % 3.5 %Depreciation and amortization expenses 57.1 53.4 5.0 % 5.1 %General and administrative expenses 75.7 66.4 6.6 % 6.3 %Total operating expenses 1,134.8 1,013.9 99.4 % 96.9 %Income from equity investees 0.3 6.0 — % 0.6 %Operating income $ 6.8 $ 38.9 0.6% 3.7%Supplemental ratios as a % of related revenues:Store operating expenses 38.3 % 36.1 %
Revenues
EMEA total net revenues for fiscal 2012 increased 9%, or $95 million, primarily driven by increased revenues from company-operated stores (contributing $63 million), due to the acquisition of the remaining interest in our previous joint venture operations in Switzerland and Austria in the fourth quarter of fiscal 2011 (approximately $80 million), partially offset by unfavorable foreign currency fluctuations (approximately $33 million).
An increase in licensed store revenues of $27 million also contributed to the increase in total net revenues, primarily due to higher product sales to and royalty revenues from our licensees, resulting from the opening of 101 net new licensed stores over the past 12 months.
Operating Expenses
Cost of sales including occupancy costs as a percentage of total net revenues increased 160 basis points, primarily driven by higher costs related to the transition to a consolidated food and dairy distribution model in the UK that began in the first quarter of fiscal 2012 (approximately 180 basis points). These costs are expected to decline over time as the full benefits of the transition are realized. Also contributing to the increase were costs related to store portfolio optimization initiatives occurring in the fourth quarter of fiscal 2012 (approximately 60 basis points), partially offset by increased sales leverage on occupancy costs.
Store operating expenses as a percentage of total net revenues increased 120 basis points. Store operating expenses as a percentage of company-operated store revenues increased 220 basis points, primarily driven by asset impairments related to underperforming stores (approximately 140 basis points). Also contributing to the increase were costs related to store portfolio optimization initiatives occurring in the fourth quarter of fiscal 2012 (approximately 40 basis points).
Other operating expenses as a percentage of total net revenues decreased 60 basis points. Excluding the impact of company-operated store revenues, other operating expenses decreased 640 basis points, primarily driven by operational efficiencies.
Income from equity investees declined to $0.3 million in fiscal 2012, due to the acquisition of the remaining interest in our previous joint venture operations in Switzerland and Austria.
The above changes contributed to a decrease in operating margin of 310 basis points over the prior year.
2013 10-KStarbucks Corporation Form
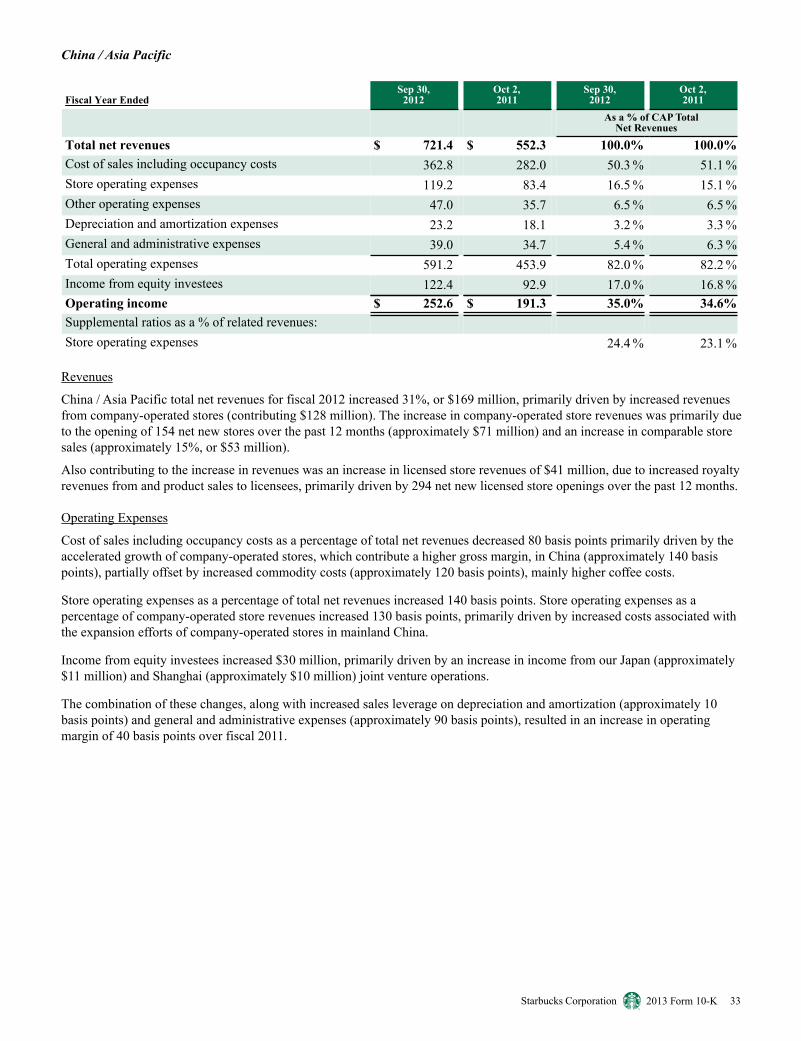
33
China / Asia Pacific
Fiscal Year EndedSep 30,
2012Oct 2,2011
Sep 30,2012
Oct 2,2011
As a % of CAP Total Net Revenues
Total net revenues $ 721.4 $ 552.3 100.0% 100.0%Cost of sales including occupancy costs 362.8 282.0 50.3 % 51.1 %Store operating expenses 119.2 83.4 16.5 % 15.1 %Other operating expenses 47.0 35.7 6.5 % 6.5 %Depreciation and amortization expenses 23.2 18.1 3.2 % 3.3 %General and administrative expenses 39.0 34.7 5.4 % 6.3 %Total operating expenses 591.2 453.9 82.0 % 82.2 %Income from equity investees 122.4 92.9 17.0 % 16.8 %Operating income $ 252.6 $ 191.3 35.0% 34.6%Supplemental ratios as a % of related revenues:Store operating expenses 24.4 % 23.1 %
Revenues
China / Asia Pacific total net revenues for fiscal 2012 increased 31%, or $169 million, primarily driven by increased revenues from company-operated stores (contributing $128 million). The increase in company-operated store revenues was primarily due to the opening of 154 net new stores over the past 12 months (approximately $71 million) and an increase in comparable store sales (approximately 15%, or $53 million).
Also contributing to the increase in revenues was an increase in licensed store revenues of $41 million, due to increased royalty revenues from and product sales to licensees, primarily driven by 294 net new licensed store openings over the past 12 months.
Operating Expenses
Cost of sales including occupancy costs as a percentage of total net revenues decreased 80 basis points primarily driven by the accelerated growth of company-operated stores, which contribute a higher gross margin, in China (approximately 140 basis points), partially offset by increased commodity costs (approximately 120 basis points), mainly higher coffee costs.
Store operating expenses as a percentage of total net revenues increased 140 basis points. Store operating expenses as a percentage of company-operated store revenues increased 130 basis points, primarily driven by increased costs associated with the expansion efforts of company-operated stores in mainland China.
Income from equity investees increased $30 million, primarily driven by an increase in income from our Japan (approximately $11 million) and Shanghai (approximately $10 million) joint venture operations.
The combination of these changes, along with increased sales leverage on depreciation and amortization (approximately 10 basis points) and general and administrative expenses (approximately 90 basis points), resulted in an increase in operating margin of 40 basis points over fiscal 2011.
2013 10-KStarbucks Corporation Form

34
Channel Development
Fiscal Year EndedSep 30,
2012Oct 2,2011
Sep 30,2012
Oct 2,2011
As a % of Channel Development
Total Net Revenues
Total net revenues $ 1,292.2 $ 860.5 100.0% 100.0%Cost of sales 827.6 487.5 64.0 % 56.7 %Other operating expenses 191.1 151.8 14.8 % 17.6 %Depreciation and amortization expenses 1.3 2.4 0.1 % 0.3 %General and administrative expenses 17.0 10.9 1.3 % 1.3 %Total operating expenses 1,037.0 652.6 80.3 % 75.8 %Income from equity investees 85.2 75.6 6.6 % 8.8 %Operating income $ 340.4 $ 283.5 26.3% 32.9%
Revenues
Channel Development total net revenues for fiscal 2012 increased 50%, or $432 million, primarily due to sales of Starbucks- and Tazo-branded K-Cup® portion packs (approximately $232 million). The benefit of recognizing full revenue from packaged coffee and tea sales under the direct distribution model through the second quarter of fiscal 2012 (approximately $70 million) and increased foodservice revenues (approximately $33 million) also contributed.
Operating Expenses
Cost of sales as a percentage of total net revenues increased 730 basis points, primarily due to increased commodity costs (approximately 570 basis points), mainly coffee, and a shift in our product mix driven by the introduction of Starbucks- and Tazo-branded K-Cup® portion packs (approximately 140 basis points).
Other operating expenses as a percentage of total net revenues decreased 280 basis points, primarily due to increased sales leverage.
Income from equity investees increased $10 million over the prior year period, driven by increased income from our North American Coffee Partnership joint venture. Income from equity investees declined as a percentage of total net revenues (approximately 220 basis points) primarily due to the growth in segment revenues.
The combination of these changes resulted in a decrease in operating margin of 660 basis points over fiscal 2011.
All Other Segments
Fiscal Year EndedSep 30,
2012Oct 2,2011
%Change
Total net revenues $ 208.6 $ 175.8 18.7 %Cost of sales 140.1 103.0 36.0 %Other operating expenses 74.4 93.0 (20.0 )%Depreciation and amortization expenses 2.5 1.0 150.0 %General and administrative expenses 19.7 12.2 61.5 %Total operating expenses 236.7 209.2 13.1 %Income/(Loss) from equity investees 0.7 (2.4) nmOperating loss $ (27.4) $ (35.8) (23.5)%
All other segments includes operating results from Teavana, Seattle’s Best Coffee, Evolution Fresh and Digital Ventures.
Total net revenues increased $33 million, primarily due to incremental revenues from Evolution Fresh, which was acquired during the first quarter of fiscal 2012.
Total operating expenses increased $28 million, primarily due to increased cost of sales resulting from higher coffee costs.
2013 10-KStarbucks Corporation Form

35
SUMMARIZED QUARTERLY FINANCIAL INFORMATION (unaudited; in millions, except EPS)
First Quarter
SecondQuarter
Third Quarter
FourthQuarter
Full Year
Fiscal 2013:(1)
Net revenues $ 3,799.6 $ 3,555.9 $ 3,741.7 $ 3,795.0 $ 14,892.2Operating income/(loss) 630.6 544.1 615.2 (2,115.2) (325.4)Net earnings/(loss) attributable to Starbucks 432.2 390.4 417.8 (1,232.0) 8.3EPS — diluted $ 0.57 $ 0.51 $ 0.55 $ (1.64) $ 0.01Fiscal 2012:Net revenues $ 3,435.9 $ 3,195.9 $ 3,303.6 $ 3,364.2 $ 13,299.5Operating income 556.0 430.4 491.6 519.6 1,997.4Net earnings attributable to Starbucks 382.1 309.9 333.1 359.0 1,383.8EPS — diluted $ 0.50 $ 0.40 $ 0.43 $ 0.46 $ 1.79
(1) The fourth quarter of fiscal 2013 includes a pretax charge of $2,784.1 million resulting from the conclusion of the arbitration with Kraft.
FINANCIAL CONDITION, LIQUIDITY AND CAPITAL RESOURCES
Investment Overview
Starbucks cash and short-term investments were $3.2 billion and $2.0 billion as of September 29, 2013 and September 30, 2012, respectively. As of September 29, 2013, approximately $994.4 million of cash was held in foreign subsidiaries. Of our cash held in foreign subsidiaries, $527.4 million is denominated in the US dollar. We actively manage our cash and short-term investments in order to internally fund operating needs domestically and internationally, make scheduled interest and principal payments on our borrowings, and return cash to shareholders through common stock cash dividend payments and share repurchases. Our short-term investments consisted predominantly of US Treasury securities, commercial paper, corporate bonds, and US Agency securities. Also included in our short-term investment portfolio are certificates of deposit placed through an account registry service, with maturities ranging from 91 days to one year. The principal amounts of the individual certificates of deposit do not exceed the Federal Deposit Insurance Corporation limits. Our portfolio of long-term available for sale securities consists predominantly of high investment-grade corporate bonds, diversified among industries and individual issuers.
Borrowing capacity
Our previous $500 million unsecured, revolving credit facility (the “2010 credit facility”) was set to mature in November 2014. In the second quarter of fiscal 2013, we replaced the 2010 credit facility with a new $750 million unsecured, revolving credit facility (the “2013 credit facility”) with various banks, of which $150 million may be used for issuances of letters of credit.
The 2013 credit facility is available for working capital, capital expenditures and other corporate purposes, including acquisitions and share repurchases, and is currently set to mature on February 5, 2018. Starbucks has the option, subject to negotiation and agreement with the related banks, to increase the maximum commitment amount by an additional $750 million. Borrowings under the 2013 credit facility will bear interest at a variable rate based on LIBOR, and, for US dollar-denominated loans under certain circumstances, a Base Rate (as defined in the 2013 credit facility), in each case plus an applicable margin. The applicable margin is based on the better of (i) the Company's long-term credit ratings assigned by Moody's and Standard & Poor's rating agencies, and (ii) the Company's fixed charge coverage ratio, pursuant to a pricing grid set forth in the 2013 credit facility. The current applicable margin is 0.795% for Eurocurrency Rate Loans and 0.00% for Base Rate Loans. The 2013 credit facility contains provisions requiring us to maintain compliance with certain covenants, including a minimum fixed charge coverage ratio, which measures our ability to cover financing expenses. As a result of the arbitrator’s ruling on the Kraft litigation, which is discussed further in Note 15 to the consolidated financial statements included in Item 8 of Part II of this 10-K, the credit facility was amended on November 15, 2013 to exclude the impact of the litigation charge, including the impact on our fixed charge coverage ratio. As of September 29, 2013, we were in compliance with each of these covenants, as amended.
2013 10-KStarbucks Corporation Form

36
Under our commercial paper program, as approved by our board of directors, we may issue unsecured commercial paper notes up to a maximum aggregate amount outstanding at any time of $1 billion, with individual maturities that may vary, but not exceed 397 days from the date of issue. Amounts outstanding under the commercial paper program are to be backstopped by available commitments under our credit facility. Currently, we may issue up to $729 million under our commercial paper program (the $750 million committed credit facility amount, less $21 million in outstanding letters of credit). The proceeds from borrowings under our commercial paper program may be used for working capital needs, capital expenditures and other corporate purposes, including acquisitions and share repurchases. During fiscal 2013 and fiscal 2012, there were no borrowings under the credit facility or commercial paper programs. As of September 29, 2013 and September 30, 2012, a total of $21 million and $18 million, respectively, in letters of credit were outstanding under the credit facility.
In September 2013, we issued $750 million of 10-year 3.85% Senior Notes due in October 2023, in an underwritten registered public offering. Interest on the notes is payable semi-annually on April 1 and October 1 of each year, commencing April 1, 2014. As discussed further in Note 3 to the consolidated financial statements included in Item 8 of Part II of this 10-K, during the third quarter of fiscal 2013 we entered into forward-starting interest rate swap agreements to hedge the variability in cash flows due to changes in the benchmark interest rate related to these Senior Notes. We cash settled these swap agreements during the fourth quarter of fiscal 2013 at the time of the pricing of the $750 million in Senior Notes. The resulting net gains from these agreements are included in accumulated other comprehensive income and will be amortized as a reduction to interest expense on the consolidated statements of earnings over the life of these Senior Notes.
The indentures under which our $550 million of 10-year 6.25% Senior Notes and our $750 million of 10-year 3.85% Senior Notes were issued also require us to maintain compliance with certain covenants, including limits on future liens and sale and leaseback transactions on certain material properties. As of September 29, 2013, we were in compliance with each of these covenants.
Use of Cash
As discussed further in Note 15 to the consolidated financial statements included in Item 8 of Part II of this 10-K, the arbitration concluded for a commercial dispute relating to a distribution agreement we previously held with Kraft. As a result of the arbitration proceedings, Starbucks was ordered to pay Kraft $2.23 billion in damages plus prejudgment interest and attorneys' fees. We have estimated prejudgment interest and attorneys' fees to be approximately $557 million. We expect to fund our payment to Kraft through the use of available cash on hand in the US and anticipated additional issuance of debt.
We expect to use additional available cash and short-term investments, including additional potential future borrowings under the credit facility and commercial paper program, to invest in our core businesses, including new product innovations and related marketing support, as well as other new business opportunities related to our core businesses. We believe that future cash flows generated from operations and existing cash and short-term investments both domestically and internationally will be sufficient to finance capital requirements for our core businesses in those respective markets as well as shareholder distributions for the foreseeable future.
We consider the majority of undistributed earnings of our foreign subsidiaries and equity investees as of September 29, 2013 to be indefinitely reinvested and, accordingly, no US income and foreign withholding taxes have been provided on such earnings. We have not, nor do we anticipate the need to, repatriate funds to the US to satisfy domestic liquidity needs; however, in the event that we need to repatriate all or a portion of our foreign cash to the US we would be subject to additional US income taxes, which could be material. We do not believe it is practical to calculate the potential tax impact of repatriation, as there is a significant amount of uncertainty around the calculation, including the availability and amount of foreign tax credits at the time of repatriation, tax rates in effect, and other indirect tax consequences associated with repatriation.
We may use our available cash resources to make proportionate capital contributions to our equity method and cost method investees. We may also seek strategic acquisitions to leverage existing capabilities and further build our business in support of our growth agenda. Acquisitions may include increasing our ownership interests in our equity method and cost method investees. Any decisions to increase such ownership interests will be driven by valuation and fit with our ownership strategy. Significant new joint ventures, acquisitions and/or other new business opportunities may require additional outside funding.
Other than the expected payment to Kraft and normal operating expenses, cash requirements for fiscal 2014 are expected to consist primarily of new company-operated stores; capital expenditures for remodeling and refurbishment of, and equipment upgrades for, existing company-operated stores; systems and technology investments in the stores and in the support infrastructure; and additional investments in manufacturing capacity. Total capital expenditures for fiscal 2014 are expected to be approximately $1.2 billion.
2013 10-KStarbucks Corporation Form

37
During each of the first three quarters of fiscal 2012, we declared and paid a cash dividend to shareholders of $0.17 per share. In the fourth quarter of fiscal 2012 and each of the first three quarters of fiscal 2013 we declared a cash dividend of $0.21 per share. Cash dividends paid in fiscal 2013 and 2012 totaled $629 million and $513 million, respectively. In the fourth quarter of fiscal 2013, we declared a cash dividend of $0.26 per share to be paid on November 29, 2013 with an expected payout of $196 million.
During fiscal years 2013 and 2012, we repurchased 11 million and 12 million shares of common stock, respectively, or $544 million and $593 million, respectively, under share repurchase authorizations. The number of remaining shares authorized for repurchase at September 29, 2013 totaled 26.4 million.
Cash Flows
Cash provided by operating activities was $2.9 billion for fiscal year 2013, compared to $1.8 billion for fiscal year 2012. The increase was primarily due to increased earnings, excluding the accrued litigation charge, and improvements in working capital accounts, primarily driven by a decrease in inventories and an increase in accounts payable.
Cash used by investing activities totaled $1.4 billion for fiscal years 2013, compared to $974 million for fiscal year 2012. The increase was primarily due to cash paid to acquire Teavana and an increase in capital expenditures, primarily for remodeling and renovating existing company-operated stores and opening new retail stores, partially offset by a net increase in cash received from investment securities.
Cash used by financing activities for fiscal year 2013 totaled $108 million, compared to $746 million for fiscal year 2012. The decrease was primarily due to the net cash proceeds from the fiscal 2013 issuance of long-term debt, partially offset by an increase in cash returned to shareholders through higher dividend payments in fiscal 2013.
Contractual Obligations
Our contractual obligations and borrowings as of September 29, 2013, and the timing and effect that such commitments are expected to have on our liquidity and capital requirements in future periods (in millions):
Payments Due by Period
Contractual Obligations(1) TotalLess than 1
Year1 - 3
Years3 - 5
YearsMore than
5 Years
Operating lease obligations(2) $ 4,585.9 $ 875.1 $ 1,490.2 $ 978.1 $ 1,242.5Purchase obligations(3) 915.7 570.4 300.3 45.0 —Debt obligations(4) 1,697.3 48.8 126.5 642.1 879.9Other obligations(5) 2,837.6 2,787.7 6.0 6.4 37.5Total $ 10,036.5 $ 4,282.0 $ 1,923.0 $ 1,671.6 $ 2,159.9
(1) Income tax liabilities for uncertain tax positions were excluded as we are not able to make a reasonably reliable estimate of the amount and period of related future payments. As of September 29, 2013, we had $91.1 million of gross unrecognized tax benefits for uncertain tax positions.
(2) Amounts include direct lease obligations, excluding any taxes, insurance and other related expenses.(3) Purchase obligations include agreements to purchase goods or services that are enforceable and legally binding on
Starbucks and that specify all significant terms. Green coffee purchase commitments comprise 96% of total purchase obligations.
(4) Debt amounts include principal maturities and scheduled interest payments on our long-term debt.(5) Other obligations include our estimated future payments associated with the accrued litigation charge and other long-
term liabilities primarily consisting of asset retirement obligations, capital lease obligations and hedging instruments.
Starbucks currently expects to fund these commitments primarily with operating cash flows generated in the normal course of business.
Off-Balance Sheet Arrangements
Off-balance sheet arrangements relate to operating lease and purchase commitments detailed in the footnotes to the consolidated financial statements in this 10-K.
2013 10-KStarbucks Corporation Form

38
COMMODITY PRICES, AVAILABILITY AND GENERAL RISK CONDITIONS
Commodity price risk represents Starbucks primary market risk, generated by our purchases of green coffee and dairy products, among other items. We purchase, roast and sell high-quality whole bean arabica coffee and related products and risk arises from the price volatility of green coffee. In addition to coffee, we also purchase significant amounts of dairy products to support the needs of our company-operated stores. The price and availability of these commodities directly impact our results of operations and we expect commodity prices, particularly coffee, to impact future results of operations. For additional details see Product Supply in Item 1, as well as Risk Factors in Item 1A of this 10-K.
FINANCIAL RISK MANAGEMENT
Market risk is defined as the risk of losses due to changes in commodity prices, foreign currency exchange rates, equity security prices, and interest rates. We manage our exposure to various market-based risks according to a market price risk management policy. Under this policy, market-based risks are quantified and evaluated for potential mitigation strategies, such as entering into hedging transactions. The market price risk management policy governs how hedging instruments may be used to mitigate risk. Risk limits are set annually and prohibit speculative trading activity. We also monitor and limit the amount of associated counterparty credit risk. In general, hedging instruments do not have maturities in excess of five years.
The sensitivity analyses disclosed below provide only a limited, point-in-time view of the market risk of the financial instruments discussed. The actual impact of the respective underlying rates and price changes on the financial instruments may differ significantly from those shown in the sensitivity analyses.
Commodity Price Risk
We purchase commodity inputs, including coffee, dairy products and diesel that are used in our operations and are subject to price fluctuations that impact our financial results. In addition to fixed-price and price-to-be-fixed contracts for coffee purchases, we have entered into commodity hedges to manage commodity price risk using financial derivative instruments.
The following table summarizes the potential impact as of September 29, 2013 to Starbucks future net earnings and other comprehensive income (“OCI”) from changes in commodity prices. The information provided below relates only to the hedging instruments and does not represent the corresponding changes in the underlying hedged items (in millions):
Increase/(Decrease) to Net Earnings Increase/(Decrease) to OCI
10% Increase inUnderlying Rate
10% Decrease inUnderlying Rate
10% Increase inUnderlying Rate
10% Decrease inUnderlying Rate
Commodity hedges $ 6 $ (6) $ — $ —
Foreign Currency Exchange Risk
The majority of our revenue, expense and capital purchasing activities are transacted in US dollars. However, because a portion of our operations consists of activities outside of the US, we have transactions in other currencies, primarily the Canadian dollar, Japanese yen, Chinese renminbi, British pound, and euro. As a result, we may engage in transactions involving various derivative instruments to hedge revenues, inventory purchases, assets, and liabilities denominated in foreign currencies.
As of September 29, 2013, we had forward foreign exchange contracts that hedge portions of anticipated international revenue streams and inventory purchases. In addition, we had forward foreign exchange contracts that qualify as accounting hedges of our net investment in Starbucks Japan to minimize foreign currency exposure.
Starbucks also had forward foreign exchange contracts that are not designated as hedging instruments for accounting purposes (free standing derivatives), but which largely offset the financial impact of translating certain foreign currency denominated payables and receivables. Increases or decreases in the fair value of these derivatives are generally offset by corresponding decreases or increases in the US dollar value of our foreign currency denominated payables and receivables (i.e., “hedged items”) that would occur within the period.
2013 10-KStarbucks Corporation Form

39
The following table summarizes the potential impact as of September 29, 2013 to Starbucks future net earnings and other comprehensive income (“OCI”) from changes in the fair value of these derivative financial instruments due in turn to a change in the value of the US dollar as compared to the level of foreign exchange rates. The information provided below relates only to the hedging instruments and does not represent the corresponding changes in the underlying hedged items (in millions):
Increase/(Decrease) to Net Earnings Increase/(Decrease) to OCI
10% Increase inUnderlying Rate
10% Decrease inUnderlying Rate
10% Increase inUnderlying Rate
10% Decrease inUnderlying Rate
Foreign currency hedges $ 8 $ (8) $ 37 $ (37)
Equity Security Price Risk
We have minimal exposure to price fluctuations on equity mutual funds and equity exchange-traded funds within our trading portfolio. The trading securities approximate a portion of our liability under the Management Deferred Compensation Plan (“MDCP”). A corresponding liability is included in accrued compensation and related costs on the consolidated balance sheets. These investments are recorded at fair value with unrealized gains and losses recognized in net interest income and other in the consolidated statements of earnings. The offsetting changes in the MDCP liability are recorded in general and administrative expenses. We performed a sensitivity analysis based on a 10% change in the underlying equity prices of our investments as of September 29, 2013 and determined that such a change would not have a significant impact on the fair value of these instruments.
Interest Rate Risk
Debt Securities
We utilize short-term and long-term financing and may use interest rate hedges to manage the effect of interest rate changes on our existing debt as well as the anticipated issuance of new debt. As of September 29, 2013 and September 30, 2012, we did not have any interest rate hedge agreements outstanding.
The following table summarizes the impact of a change in interest rates as of September 29, 2013 on the fair value of Starbucks debt (in millions):
Change in Fair Value
Fair Value100 Basis Point Increase in
Underlying Rate100 Basis Point Decrease in
Underlying Rate 6.25% Senior Notes $ 644 $ (23) $ 233.85% Senior Notes $ 762 $ (62) $ 62
Available-for-Sale Securities
Our available-for-sale securities comprise a diversified portfolio consisting mainly of fixed income instruments. The primary objectives of these investments are to preserve capital and liquidity. Available-for-sale securities are recorded on the consolidated balance sheets at fair value with unrealized gains and losses reported as a component of accumulated other comprehensive income. We do not hedge the interest rate exposure on our available-for-sale securities. We performed a sensitivity analysis based on a 100 basis point change in the underlying interest rate of our available-for-sale securities as of September 29, 2013, and determined that such a change would not have a significant impact on the fair value of these instruments.
APPLICATION OF CRITICAL ACCOUNTING POLICIES
Critical accounting policies are those that management believes are both most important to the portrayal of our financial condition and results and require the most difficult, subjective or complex judgments, often as a result of the need to make estimates about the effect of matters that are inherently uncertain. Judgments and uncertainties affecting the application of those policies may result in materially different amounts being reported under different conditions or using different assumptions.
We consider financial reporting and disclosure practices and accounting policies quarterly to ensure that they provide accurate and transparent information relative to the current economic and business environment. We believe that of our significant accounting policies, the following policies involve a higher degree of judgment and/or complexity:
2013 10-KStarbucks Corporation Form

40
Property, Plant and Equipment and Definite-Lived Assets
When facts and circumstances indicate that the carrying values of property plant and equipment and definite-lived intangible assets may not be recoverable, we evaluate such assets for impairment. We first compare the carrying value of the asset to the asset’s estimated future undiscounted cash flows. If the estimated future cash flows are less than the carrying value of the asset, we measure an impairment loss based on the asset’s estimated fair value. For retail assets, the impairment test is performed at the individual store asset group level. The fair value of a store’s assets is estimated using a discounted cash flow model based on internal projections. Key assumptions used in this calculation include revenue growth, operating expenses and a discount rate that we believe a buyer would assume when determining a purchase price for the store. Estimates of revenue growth and operating expenses are based on internal projections and consider a store’s historical performance, local market economics and the business environment impacting the store’s performance. These estimates are subjective and can be significantly impacted by changes in the business or economic conditions. For non-retail assets, fair value is determined using an approach that is appropriate based on the relevant facts and circumstances, which may include discounted cash flows, comparable transactions, or comparable company analyses.
Our impairment loss calculations contain uncertainties because they require management to make assumptions and to apply judgment to estimate future cash flows and asset fair values, including forecasting asset useful lives. Further, our ability to realize undiscounted cash flows in excess of the carrying values of our assets is affected by factors such as the ongoing maintenance and improvement of the assets, changes in economic conditions, and changes in operating performance. During the past three fiscal years, we have not made any material changes in the accounting methodology that we use to assess property plant and equipment and definite-lived intangible asset impairment loss. For the foreseeable future, we do not believe there is a reasonable likelihood that there will be a material change in the estimates or assumptions that we use to calculate such impairment losses. However, as we periodically reassess estimated future cash flows and asset fair values, changes in our estimates and assumptions may cause us to realize material impairment charges in the future.
Goodwill and Indefinite-Lived Intangible Assets
We evaluate goodwill for impairment on an annual basis during our third fiscal quarter, or more frequently if circumstances, such as material deterioration in performance or a significant number of store closures, indicate reporting unit carrying values may exceed their fair values. When evaluating goodwill for impairment, we may first perform a qualitative assessment to determine if the fair value of the reporting unit is more likely than not greater than its carrying amount. If we do not perform a qualitative assessment or if the fair value of the reporting unit is not more likely than not greater than its carrying amount, we calculate the implied estimated fair value of the reporting unit. If the carrying amount of goodwill exceeds the implied estimated fair value, an impairment charge is recorded to reduce the carrying value to the implied estimated fair value. The fair value of each of our reporting units is the price a willing buyer would pay for the reporting unit and is typically calculated using a discounted cash flow model. Key assumptions used in this calculation include revenue growth, operating expenses and a discount rate that we believe a buyer would assume when determining a purchase price for the reporting unit. Estimates of revenue growth and operating expenses are based on internal projections considering a reporting unit’s past performance and forecasted growth, local market economics and the local business environment impacting the reporting unit’s performance. The discount rate is calculated using an estimated cost of capital for a retail operator to operate the reporting unit in the region. These estimates are highly subjective judgments and can be significantly impacted by changes in the business or economic conditions.
As a part of our ongoing operations, we may close certain stores within a reporting unit containing goodwill due to underperformance of the store or inability to renew our lease, among other reasons. We abandon certain assets associated with a closed store including leasehold improvements and other non-transferable assets. When a portion of a reporting unit that constitutes a business is to be disposed of, goodwill associated with the business is included in the carrying amount of the business in determining any loss on disposal. Our evaluation of whether the portion of a reporting unit being disposed of constitutes a business occurs on the date of abandonment. Although an operating store meets the accounting definition of a business prior to abandonment, it does not constitute a business on the closure date because the remaining assets on that date do not constitute an integrated set of assets that are capable of being conducted and managed for the purpose of providing a return to investors. As a result, when closing individual stores, we do not include goodwill in the calculation of any loss on disposal of the related assets. As noted above, if store closures are indicative of potential impairment of goodwill at the reporting unit level, we perform an evaluation of our reporting unit goodwill when such closures occur.
We evaluate indefinite-lived intangible assets (primarily trade names and trademarks) for impairment on an annual basis or more frequently if an event occurs or changes in circumstances indicate that impairment may exist. When evaluating indefinite-lived intangible assets for impairment, we may first perform a qualitative assessment to determine if the fair value of the intangible asset group is more likely than not greater than its carrying amount. If we do not perform a qualitative assessment or if the fair value of the intangible asset group is not more likely than not greater than its carrying amount, we calculate the implied estimated fair value of the intangible asset group. If the carrying amount of the intangible asset group exceeds the
2013 10-KStarbucks Corporation Form

41
implied estimated fair value, an impairment charge is recorded to reduce the carrying value to the implied estimated fair value. Fair value is the price a willing buyer would pay for the intangible asset and is typically calculated using a discounted cash flow model. Key assumptions used in this calculation include revenue growth, the royalty rate that could hypothetically be charged by a licensor of the asset to an unrelated licensee and a discount rate that we believe reflects the level of risk associated with receiving the future cash flows attributable to the asset. Estimates of revenue growth are based on internal projections considering the intangible asset group's past performance and forecasted growth. The royalty rate used is based on observed market royalty rates for similar licensing arrangements adjusted for our particular facts and circumstances. The discount rate is calculated using an estimated cost of capital that reflects the risk profile of the related business. These estimates are subjective judgments and can be significantly impacted by changes in the business or economic conditions.
Our impairment loss calculations contain uncertainties because they require management to make assumptions in the qualitative assessment of the reporting unit or intangible asset group and require management to apply judgment to estimate the reporting units or intangible asset group's fair value, including estimating future cash flows, and if necessary, the fair value of a reporting units’ assets and liabilities. Further, our ability to realize the future cash flows used in our fair value calculations is affected by factors such as changes in economic conditions, changes in our operating performance, and changes in our business strategies. During the past three fiscal years, we have not made any material changes in the accounting methodology that we use to assess impairment loss. For fiscal 2013, we determined the fair value of our reporting units and intangible asset group's were substantially in excess of their carrying values. Accordingly, we did not recognize any goodwill impairments during the current fiscal year. We do not believe there is a reasonable likelihood that there will be a material change in the estimates or assumptions that we use to test for impairment losses in the foreseeable future. However, as we periodically reassess our fair value calculations, including estimated future cash flows, changes in our estimates and assumptions may cause us to realize material impairment charges in the future.
Income Taxes
We recognize deferred tax assets and liabilities based on the differences between the financial statement carrying amounts and the respective tax bases of our assets and liabilities. Deferred tax assets and liabilities are measured using current enacted tax rates expected to apply to taxable income in the years in which we expect the temporary differences to reverse. We routinely evaluate the likelihood of realizing the benefit of our deferred tax assets and may record a valuation allowance if, based on all available evidence, we determine that some portion of the tax benefit will not be realized.
In addition, our income tax returns are periodically audited by domestic and foreign tax authorities. These audits include review of our tax filing positions, including the timing and amount of deductions taken and the allocation of income between tax jurisdictions. We evaluate our exposures associated with our various tax filing positions and recognize a tax benefit only if it is more likely than not that the tax position will be sustained upon examination by the relevant taxing authorities, based on the technical merits of our position. For uncertain tax positions that do not meet this threshold, we record a related liability. We adjust our unrecognized tax benefits liability and income tax expense in the period in which the uncertain tax position is effectively settled, the statute of limitations expires for the relevant taxing authority to examine the tax position, or when new information becomes available.
Income generated in certain foreign jurisdictions has not been subject to US income taxes. We intend to reinvest these earnings for the foreseeable future. If these amounts were distributed to the US, in the form of dividends or otherwise, we would be subject to additional US income taxes, which could be material. Determination of the amount of unrecognized deferred income tax liabilities on these earnings is not practicable because such liability, if any, is dependent on circumstances existing if and when remittance occurs.
Deferred tax asset valuation allowances and our liability for unrecognized tax benefits require significant management judgment regarding applicable statutes and their related interpretation, the status of various income tax audits, and our particular facts and circumstances. Although we believe that the judgments and estimates discussed herein are reasonable, actual results could differ, and we may be exposed to losses or gains that could be material. To the extent we prevail in matters for which a liability has been established, or are required to pay amounts in excess of our established liability, our effective income tax rate in a given financial statement period could be materially affected.
Litigation Accruals
We are involved in various claims and legal actions that arise in the ordinary course of business. Legal and other contingency reserves and related disclosures are based on our assessment of the likelihood of a potential loss and our ability to estimate the loss or range of loss, which includes consultation with outside legal counsel and advisors. We record reserves related to legal matters when it is probable that a loss has been incurred and the range of such loss can be reasonably estimated. Such assessments are reviewed each period and revised, based on current facts and circumstances and historical experience with similar claims, as necessary.
2013 10-KStarbucks Corporation Form

42
Our disclosures of and accruals for litigation claims, if any, contain uncertainties because management is required to use judgment to estimate the probability of a loss and a range of possible losses related to each claim. Note 15 to the consolidated financial statements included in Item 8 of Part II of this 10-K describes the Company’s legal and other contingent liability matters.
As we periodically review our assessments of litigation accruals, we may change our assumptions with respect to loss probabilities and ranges of potential losses. Any changes in these assumptions could have a material impact on our future results of operations.
RECENT ACCOUNTING PRONOUNCEMENTS
See Note 1 to the consolidated financial statements included in Item 8 of Part II of this 10-K for a detailed description of recent accounting pronouncements. We do not expect these recently issued accounting pronouncements to have a material impact on our results of operations, financial condition, or liquidity in future periods.
Item 7A. Quantitative and Qualitative Disclosures About Market Risk
The information required by this item is incorporated by reference to the section entitled “Management’s Discussion and Analysis of Financial Condition and Results of Operations — Commodity Prices, Availability and General Risk Conditions” and “Management’s Discussion and Analysis of Financial Condition and Results of Operations — Financial Risk Management” in Item 7 of this Report.
2013 10-KStarbucks Corporation Form

43
Item 8. Financial Statements and Supplementary Data
STARBUCKS CORPORATIONCONSOLIDATED STATEMENTS OF EARNINGS
(in millions, except per share data)
Fiscal Year EndedSep 29,
2013Sep 30,
2012Oct 2,2011
Net revenues:Company-operated stores $ 11,793.2 $ 10,534.5 $ 9,632.4Licensed stores 1,360.5 1,210.3 1,007.5CPG, foodservice and other 1,738.5 1,554.7 1,060.5
Total net revenues 14,892.2 13,299.5 11,700.4Cost of sales including occupancy costs 6,382.3 5,813.3 4,915.5Store operating expenses 4,286.1 3,918.1 3,594.9Other operating expenses 457.2 429.9 392.8Depreciation and amortization expenses 621.4 550.3 523.3General and administrative expenses 937.9 801.2 749.3Litigation charge 2,784.1 — —
Total operating expenses 15,469.0 11,512.8 10,175.8Gain on sale of properties — — 30.2Income from equity investees 251.4 210.7 173.7
Operating income/(loss) (325.4) 1,997.4 1,728.5Interest income and other, net 123.6 94.4 115.9Interest expense (28.1) (32.7) (33.3)
Earnings/(loss) before income taxes (229.9) 2,059.1 1,811.1Income taxes (238.7) 674.4 563.1
Net earnings including noncontrolling interests 8.8 1,384.7 1,248.0Net earnings attributable to noncontrolling interests 0.5 0.9 2.3Net earnings attributable to Starbucks $ 8.3 $ 1,383.8 $ 1,245.7
Earnings per share — basic $ 0.01 $ 1.83 $ 1.66Earnings per share — diluted $ 0.01 $ 1.79 $ 1.62Weighted average shares outstanding:
Basic 749.3 754.4 748.3Diluted 762.3 773.0 769.7
Cash dividends declared per share $ 0.89 $ 0.72 $ 0.56
See Notes to Consolidated Financial Statements.
2013 10-KStarbucks Corporation Form

44
STARBUCKS CORPORATIONCONSOLIDATED STATEMENTS OF COMPREHENSIVE INCOME
(in millions)
Sep 29,2013
Sep 30,2012
Oct 2,2011
Net earnings including noncontrolling interests $ 8.8 $ 1,384.7 $ 1,248.0Other comprehensive income/(loss), net of tax:
Unrealized holding gains/(losses) on available-for-sale securities (0.6) 0.7 0.7Tax (expense)/benefit 0.2 (0.3) (0.3)
Unrealized holding gains/(losses) on cash flow hedging instruments 47.1 (42.2) (12.2)Tax (expense)/benefit (24.6) 4.3 4.5
Unrealized holding gains/(losses) on net investment hedginginstruments 32.8 1.0 (12.1)
Tax (expense)/benefit (12.1) (0.4) 4.5Reclassification adjustment for net (gains)/losses realized in netearnings for cash flow hedges 46.3 14.8 16.6
Tax expense/(benefit) (3.5) (4.3) (6.1)Net unrealized holding gains/(losses) 85.6 (26.4) (4.4)Translation adjustment (41.6) 6.1 (7.4)
Tax (expense)/benefit 0.3 (3.3) 0.9Other comprehensive income/(loss) 44.3 (23.6) (10.9)Comprehensive income/(loss) including noncontrolling interests 53.1 1,361.1 1,237.1
Comprehensive income attributable to noncontrolling interests 0.5 0.9 2.3Comprehensive income attributable to Starbucks $ 52.6 $ 1,360.2 $ 1,234.8
See Notes to Consolidated Financial Statements.
2013 10-KStarbucks Corporation Form

45
STARBUCKS CORPORATIONCONSOLIDATED BALANCE SHEETS
(in millions, except per share data)
Sep 29,2013
Sep 30,2012
ASSETSCurrent assets:
Cash and cash equivalents $ 2,575.7 $ 1,188.6Short-term investments 658.1 848.4Accounts receivable, net 561.4 485.9Inventories 1,111.2 1,241.5Prepaid expenses and other current assets 287.7 196.5Deferred income taxes, net 277.3 238.7
Total current assets 5,471.4 4,199.6Long-term investments 58.3 116.0Equity and cost investments 496.5 459.9Property, plant and equipment, net 3,200.5 2,658.9Deferred income taxes, net 967.0 97.3Other assets 185.3 144.7Other intangible assets 274.8 143.7Goodwill 862.9 399.1TOTAL ASSETS $ 11,516.7 $ 8,219.2
LIABILITIES AND EQUITYCurrent liabilities:
Accounts payable $ 491.7 $ 398.1Accrued litigation charge 2,784.1 —Accrued liabilities 1,269.3 1,133.8Insurance reserves 178.5 167.7Deferred revenue 653.7 510.2
Total current liabilities 5,377.3 2,209.8Long-term debt 1,299.4 549.6Other long-term liabilities 357.7 345.3
Total liabilities 7,034.4 3,104.7Shareholders’ equity:
Common stock ($0.001 par value) — authorized, 1,200.0 shares; issued andoutstanding, 753.2 shares and 749.3 shares (includes 3.4 common stock units),respectively 0.8 0.7Additional paid-in capital 282.1 39.4Retained earnings 4,130.3 5,046.2Accumulated other comprehensive income 67.0 22.7
Total shareholders’ equity 4,480.2 5,109.0Noncontrolling interests 2.1 5.5
Total equity 4,482.3 5,114.5TOTAL LIABILITIES AND EQUITY $ 11,516.7 $ 8,219.2
See Notes to Consolidated Financial Statements.
2013 10-KStarbucks Corporation Form

46
STARBUCKS CORPORATIONCONSOLIDATED STATEMENTS OF CASH FLOWS
(in millions)
Fiscal Year EndedSep 29,
2013Sep 30,
2012Oct 2,2011
OPERATING ACTIVITIES:Net earnings including noncontrolling interests $ 8.8 $ 1,384.7 $ 1,248.0Adjustments to reconcile net earnings to net cash provided by operating activities:
Depreciation and amortization 655.6 580.6 550.0Litigation charge 2,784.1 — —Gain on sale of properties — — (30.2)Deferred income taxes, net (1,045.9) 61.1 106.2Income earned from equity method investees, net of distributions (56.2) (49.3) (32.9)Gain resulting from sale/acquisition of equity in joint ventures (80.1) — (55.2)Stock-based compensation 142.3 153.6 145.2Other 23.0 23.6 33.3Cash provided/(used) by changes in operating assets and liabilities:
Accounts receivable (68.3) (90.3) (88.7)Inventories 152.5 (273.3) (422.3)Accounts payable 88.7 (105.2) 227.5Accrued liabilities and insurance reserves 87.6 23.7 (81.8)Deferred revenue 139.9 60.8 35.8Prepaid expenses, other current assets and other assets 76.3 (19.7) (22.5)
Net cash provided by operating activities 2,908.3 1,750.3 1,612.4INVESTING ACTIVITIES:Purchase of investments (785.9) (1,748.6) (966.0)Sales, maturities and calls of investments 1,040.2 1,796.4 430.0Acquisitions, net of cash acquired (610.4) (129.1) (55.8)Additions to property, plant and equipment (1,151.2) (856.2) (531.9)Proceeds from the sale of property, plant, and equipment 15.3 5.3 117.4Proceeds from sale of equity in joint ventures 108.0 — —Other (27.2) (41.8) (13.2)Net cash used by investing activities (1,411.2) (974.0) (1,019.5)FINANCING ACTIVITIES:Proceeds from issuance of long-term debt 749.7 — —Principal payments on long-term debt (35.2) — —(Payments)/proceeds from short-term borrowings — (30.8) 30.8Purchase of noncontrolling interest — — (27.5)Proceeds from issuance of common stock 247.2 236.6 250.4Excess tax benefit on share-based awards 258.1 169.8 103.9Cash dividends paid (628.9) (513.0) (389.5)Repurchase of common stock (588.1) (549.1) (555.9)Minimum tax withholdings on share-based awards (121.4) (58.5) (15.0)Other 10.4 (0.5) (5.2)Net cash used by financing activities (108.2) (745.5) (608.0)Effect of exchange rate changes on cash and cash equivalents (1.8) 9.7 (0.8)Net increase/(decrease) in cash and cash equivalents 1,387.1 40.5 (15.9)CASH AND CASH EQUIVALENTS:Beginning of period 1,188.6 1,148.1 1,164.0End of period $ 2,575.7 $ 1,188.6 $ 1,148.1SUPPLEMENTAL DISCLOSURE OF CASH FLOW INFORMATION:Cash paid during the period for:Interest, net of capitalized interest $ 34.4 $ 34.4 $ 34.4Income taxes $ 539.1 $ 416.9 $ 350.1
See Notes to Consolidated Financial Statements.
2013 10-KStarbucks Corporation Form

47
STA
RB
UC
KS
CO
RPO
RAT
ION
CO
NSO
LID
ATE
D S
TAT
EM
EN
TS
OF
EQ
UIT
Y(in
mill
ions
)
C
omm
on S
tock
Add
ition
al P
aid-
in C
apita
lR
etai
ned
Ear
ning
s
Acc
umul
ated
Oth
erC
ompr
ehen
sive
Inco
me/
(Los
s)Sh
areh
olde
rs’
Equ
ityN
onco
ntro
lling
Inte
rest
Tot
al
Shar
esA
mou
ntB
alan
ce, O
ctob
er 3
, 201
074
2.6
$0.
7$
145.
6$
3,47
1.2
$57
.2$
3,67
4.7
$7.
6$
3,68
2.3
Net
ear
ning
s—
——
1,24
5.7
—1,
245.
72.
31,
248.
0O
ther
com
preh
ensi
ve in
com
e/(lo
ss)
(10.
9)(1
0.9)
—(1
0.9)
Stoc
k-ba
sed
com
pens
atio
n ex
pens
e—
—14
7.2
——
147.
2—
147.
2Ex
erci
se o
f sto
ck o
ptio
ns, i
nclu
ding
tax
bene
fit o
f$9
6.1
17.3
—31
2.5
——
312.
5—
312.
5Sa
le o
f com
mon
stoc
k, in
clud
ing
tax
bene
fit o
f $0.
10.
5—
19.1
——
19.1
—19
.1R
epur
chas
e of
com
mon
stoc
k(1
5.6)
—(5
55.9
)—
—(5
55.9
)—
(555
.9)
Cas
h di
vide
nds d
ecla
red
——
—(4
19.5
)—
(419
.5)
—(4
19.5
)Pu
rcha
se o
f non
cont
rolli
ng in
tere
sts
——
(28.
0)—
—(2
8.0)
(7.5
)(3
5.5)
Bal
ance
, Oct
ober
2, 2
011
744.
8$
0.7
$40
.5$
4,29
7.4
$46
.3$
4,38
4.9
$2.
4$
4,38
7.3
Net
ear
ning
s—
——
1,38
3.8
—1,
383.
80.
91,
384.
7O
ther
com
preh
ensi
ve in
com
e/(lo
ss)
(23.
6)(2
3.6)
—(2
3.6)
Stoc
k-ba
sed
com
pens
atio
n ex
pens
e—
—15
5.2
——
155.
2—
155.
2Ex
erci
se o
f sto
ck o
ptio
ns, i
nclu
ding
tax
bene
fit o
f$1
67.3
16.5
—32
6.1
——
326.
1—
326.
1Sa
le o
f com
mon
stoc
k, in
clud
ing
tax
bene
fit o
f $0.
20.
3—
19.5
——
19.5
—19
.5R
epur
chas
e of
com
mon
stoc
k(1
2.3)
—(5
01.9
)(9
1.3)
—(5
93.2
)—
(593
.2)
Cas
h di
vide
nds d
ecla
red
——
—(5
43.7
)—
(543
.7)
—(5
43.7
)N
onco
ntro
lling
inte
rest
resu
lting
from
acq
uisi
tion
——
——
——
2.2
2.2
Bal
ance
, Sep
tem
ber
30, 2
012
749.
3$
0.7
$39
.4$
5,04
6.2
$22
.7$
5,10
9.0
$5.
5$
5,11
4.5
Net
ear
ning
s—
——
8.3
—8.
30.
58.
8O
ther
com
preh
ensi
ve in
com
e/(lo
ss)
44.3
44.3
—44
.3St
ock-
base
d co
mpe
nsat
ion
expe
nse
——
144.
1—
—14
4.1
—14
4.1
Exer
cise
of s
tock
opt
ions
, inc
ludi
ng ta
x be
nefit
of
$259
.914
.40.
136
6.7
——
366.
8—
366.
8Sa
le o
f com
mon
stoc
k, in
clud
ing
tax
bene
fit o
f $0.
20.
3—
20.4
——
20.4
—20
.4R
epur
chas
e of
com
mon
stoc
k(1
0.8)
—(2
88.5
)(2
55.6
)—
(544
.1)
—(5
44.1
)C
ash
divi
dend
s dec
lare
d—
——
(668
.6)
—(6
68.6
)—
(668
.6)
Non
cont
rolli
ng in
tere
st re
sulti
ng fr
om d
ives
titur
e—
——
——
—(3
.9)
(3.9
)B
alan
ce, S
epte
mbe
r 29
, 201
375
3.2
$0.
8$
282.
1$
4,13
0.3
$67
.0$
4,48
0.2
$2.
1$
4,48
2.3
See
Not
es to
Con
solid
ated
Fin
anci
al S
tate
men
ts.
2013 10-KStarbucks Corporation Form

48
STARBUCKS CORPORATIONNOTES TO CONSOLIDATED FINANCIAL STATEMENTS
Fiscal Years ended September 29, 2013, September 30, 2012 and October 2, 2011
Note 1: Summary of Significant Accounting Policies
Description of Business
We purchase and roast high-quality coffees that we sell, along with handcrafted coffee and tea beverages and a variety of fresh food items, through our company-operated stores. We also sell a variety of coffee and tea products and license our trademarks through other channels such as licensed stores, grocery and national foodservice accounts.
In this 10-K, Starbucks Corporation (together with its subsidiaries) is referred to as “Starbucks,” the “Company,” “we,” “us” or “our.”
We have four reportable operating segments: 1) Americas, inclusive of the US, Canada, and Latin America; 2) Europe, Middle East, and Africa ("EMEA"); 3) China / Asia Pacific (“CAP”) and 4) Channel Development. Teavana, Seattle's Best Coffee, Evolution Fresh and our Digital Ventures business are included in All Other Segments. Unallocated corporate operating expenses, which pertain primarily to corporate administrative functions that support the operating segments but are not specifically attributable to or managed by any segment, are presented as a reconciling item between total segment operating results and consolidated financial results.
Additional details on the nature of our business and our reportable operating segments are included in Note 16 of these Consolidated Financial Statements.
Principles of Consolidation
The consolidated financial statements reflect the financial position and operating results of Starbucks, including wholly owned subsidiaries and investees that we control. Investments in entities that we do not control, but have the ability to exercise significant influence over operating and financial policies, are accounted for under the equity method. Investments in entities in which we do not have the ability to exercise significant influence are accounted for under the cost method. Intercompany transactions and balances have been eliminated.
Fiscal Year End
Our fiscal year ends on the Sunday closest to September 30. Fiscal years 2013, 2012 and 2011 included 52 weeks.
Estimates and Assumptions
Preparing financial statements in conformity with accounting principles generally accepted in the United States of America (“GAAP”) requires management to make estimates and assumptions that affect the reported amounts of assets, liabilities, revenues and expenses. Examples include, but are not limited to, estimates for asset and goodwill impairments, stock-based compensation forfeiture rates, future asset retirement obligations, and inventory reserves; assumptions underlying self-insurance reserves and income from unredeemed stored value cards; and the potential outcome of future tax consequences of events that have been recognized in the financial statements. Actual results and outcomes may differ from these estimates and assumptions.
Cash and Cash Equivalents
We consider all highly liquid instruments with a maturity of three months or less at the time of purchase to be cash equivalents. We maintain cash and cash equivalent balances with financial institutions that exceed federally insured limits. We have not experienced any losses related to these balances and we believe credit risk to be minimal.
Our cash management system provides for the funding of all major bank disbursement accounts on a daily basis as checks are presented for payment. Under this system, outstanding checks are in excess of the cash balances at certain banks, which creates book overdrafts. Book overdrafts are presented as a current liability in accounts payable on the consolidated balance sheets.
Short-term and Long-term Investments
Our short-term and long-term investments consist primarily of investment grade debt securities all of which are classified as available-for-sale. Also included in our available-for-sale investment portfolio are certificates of deposit placed through an account registry service. Available-for-sale securities are recorded at fair value, and unrealized holding gains and losses are recorded, net of tax, as a component of accumulated other comprehensive income. Available-for-sale securities with remaining
2013 10-KStarbucks Corporation Form

49
maturities of less than one year and those identified by management at the time of purchase to be used to fund operations within one year are classified as short term. All other available-for-sale securities, including all of our auction rate securities, are classified as long term. Unrealized losses are charged against net earnings when a decline in fair value is determined to be other than temporary. We review several factors to determine whether a loss is other than temporary, such as the length and extent of the fair value decline, the financial condition and near term prospects of the issuer, and whether we have the intent to sell or will likely be required to sell before the securities anticipated recovery, which may be at maturity. Realized gains and losses are accounted for using the specific identification method. Purchases and sales are recorded on a trade date basis.
We also have a trading securities portfolio, which is comprised of marketable equity mutual funds and equity exchange-traded funds. Trading securities are recorded at fair value with unrealized holding gains and losses included in net earnings.
Fair Value
Fair value is the price we would receive to sell an asset or pay to transfer a liability (exit price) in an orderly transaction between market participants. We determine fair value based on the following:
Level 1: The carrying value of cash and cash equivalents approximates fair value because of the short-term nature of these instruments. For government treasury securities, we use quoted prices in active markets for identical assets to determine fair value.
Level 2: For corporate and agency bonds, for which a quoted market price is not available for identical assets, we determine fair value based upon the quoted market price of similar assets or the present value of expected future cash flows, calculated by applying revenue multiples to estimate future operating results and using discount rates appropriate for the duration and the risks involved. Fair values for commercial paper are estimated using a discounted cash flow calculation that applies current imputed interest rates of similar securities. Fair values for certificates of deposit are estimated using a discounted cash flow calculation that applies current interest rates to aggregate expected maturities. The fair value of our long-term debt is estimated based on the quoted market prices for the same or similar issues or on the current rates offered to us for debt of the same remaining maturities.
Level 3: We determine fair value of our auction rate securities using an internally developed valuation model, using inputs that include interest rate curves, credit and liquidity spreads, and effective maturity.
Derivative Instruments
We manage our exposure to various risks within the consolidated financial statements according to a market price risk management policy. Under this policy, we may engage in transactions involving various derivative instruments to hedge interest rates, commodity prices and foreign currency denominated revenues, purchases, assets and liabilities. We generally do not offset derivative assets and liabilities in our consolidated balance sheets or enter into derivative instruments with maturities longer than five years.
We enter into fixed-price and price-to-be-fixed green coffee purchase commitments. Price-to-be-fixed contracts are purchase commitments whereby the quality, quantity, delivery period, and other negotiated terms are agreed upon, but the date, and therefore price, at which the base “C” coffee commodity price component will be fixed has not yet been established. For these types of contracts, either Starbucks or the seller has the option to “fix” the base “C” coffee commodity price prior to the delivery date. For both fixed-price and price-to-be-fixed purchase commitments, we expect to take delivery of and to utilize the coffee in a reasonable period of time and in the conduct of normal business. Accordingly, these purchase commitments qualify as normal purchases and are not recorded at fair value on our balance sheets.
We record all derivatives on the balance sheets at fair value. For a cash flow hedge, the effective portion of the derivative's gain or loss is initially reported as a component of other comprehensive income (“OCI”) and subsequently reclassified into net earnings when the hedged exposure affects net earnings. For a net investment hedge, the effective portion of the derivative's gain or loss is reported as a component of OCI.
Cash flow hedges related to anticipated transactions are designated and documented at the inception of each hedge by matching the terms of the contract to the underlying transaction. We classify the cash flows from hedging transactions in the same categories as the cash flows from the respective hedged items. Once established, cash flow hedges are generally not removed until maturity unless an anticipated transaction is no longer likely to occur. For discontinued or dedesignated cash flow hedges, the related accumulated derivative gains or losses are recognized in net interest income and other on the consolidated statements of earnings.
Forward contract effectiveness for cash flow hedges is calculated by comparing the fair value of the contract to the change in value of the anticipated transaction using forward rates on a monthly basis. For net investment hedges, the spot-to-spot method is used to calculate effectiveness. Under this method, the change in fair value of the forward contract attributable to the changes in spot exchange rates (the effective portion) is reported as a component of OCI. The remaining change in fair value of the
2013 10-KStarbucks Corporation Form

50
forward contract (the ineffective portion) is reclassified into net earnings. Any ineffectiveness is recognized immediately in net interest income and other on the consolidated statements of earnings.
Certain foreign currency forward contracts, commodity swap contracts, and futures contracts are not designated as hedging instruments for accounting purposes. These contracts are recorded at fair value, with the changes in fair value recognized in net interest income and other on the consolidated statements of earnings.
Allowance for Doubtful Accounts
Allowance for doubtful accounts is calculated based on historical experience, customer credit risk and application of the specific identification method. As of September 29, 2013 and September 30, 2012, the allowance for doubtful accounts was $5.7 million and $5.6 million, respectively.
Inventories
Inventories are stated at the lower of cost (primarily moving average cost) or market. We record inventory reserves for obsolete and slow-moving inventory and for estimated shrinkage between physical inventory counts. Inventory reserves are based on inventory obsolescence trends, historical experience and application of the specific identification method. As of September 29, 2013 and September 30, 2012, inventory reserves were $52.0 million and $22.6 million, respectively.
Property, Plant and Equipment
Property, plant and equipment are carried at cost less accumulated depreciation. Cost includes all direct costs necessary to acquire and prepare assets for use, including internal labor and overhead in some cases. Depreciation of property, plant and equipment, which includes assets under capital leases, is provided on the straight-line method over estimated useful lives, generally ranging from 2 to 15 years for equipment and 30 to 40 years for buildings. Leasehold improvements are amortized over the shorter of their estimated useful lives or the related lease life, generally 10 years. For leases with renewal periods at our option, we generally use the original lease term, excluding renewal option periods, to determine estimated useful lives. If failure to exercise a renewal option imposes an economic penalty to us, we may determine at the inception of the lease that renewal is reasonably assured and include the renewal option period in the determination of the appropriate estimated useful lives. The portion of depreciation expense related to production and distribution facilities is included in cost of sales including occupancy costs on the consolidated statements of earnings. The costs of repairs and maintenance are expensed when incurred, while expenditures for refurbishments and improvements that significantly add to the productive capacity or extend the useful life of an asset are capitalized. When assets are retired or sold, the asset cost and related accumulated depreciation are eliminated with any remaining gain or loss recognized in net earnings.
Goodwill
We test goodwill for impairment on an annual basis during our third fiscal quarter, or more frequently if circumstances, such as material deterioration in performance or a significant number of store closures, indicate reporting unit carrying values may exceed their fair values. When evaluating goodwill for impairment, we may first perform a qualitative assessment to determine if the fair value of the reporting unit is more likely than not greater than its carrying amount. If we do not perform a qualitative assessment or if the fair value of the reporting unit is not more likely than not greater than its carrying amount, we calculate the implied estimated fair value of the reporting unit. If the carrying amount of goodwill exceeds the implied estimated fair value, an impairment charge to current operations is recorded to reduce the carrying value to the implied estimated fair value.
As a part of our ongoing operations, we may close certain stores within a reporting unit containing goodwill due to underperformance of the store or inability to renew our lease, among other reasons. We abandon certain assets associated with a closed store including leasehold improvements and other non-transferable assets. When a portion of a reporting unit that constitutes a business is to be disposed of, goodwill associated with the business is included in the carrying amount of the business in determining any loss on disposal. Our evaluation of whether the portion of a reporting unit being disposed of constitutes a business occurs on the date of abandonment. Although an operating store meets the accounting definition of a business prior to abandonment, it does not constitute a business on the closure date because the remaining assets on that date do not constitute an integrated set of assets that are capable of being conducted and managed for the purpose of providing a return to investors. As a result, when closing individual stores, we do not include goodwill in the calculation of any loss on disposal of the related assets. As noted above, if store closures are indicative of potential impairment of goodwill at the reporting unit level, we perform an evaluation of our reporting unit goodwill when such closures occur. There were no goodwill impairment charges recorded during fiscal 2013, 2012, and 2011.
2013 10-KStarbucks Corporation Form

51
Other Intangible Assets
Other intangible assets consist primarily of trade names and trademarks with indefinite lives, which are tested for impairment annually during the third quarter of the fiscal year, or more frequently if events or changes in circumstances indicate that assets might be impaired. When evaluating other intangible assets for impairment, we may first perform a qualitative assessment to determine if the fair value of the intangible asset group is more likely than not greater than its carrying amount. If we do not perform the qualitative assessment or if the fair value of the intangible asset group is not more likely than not greater than its carrying amount, we calculate the implied estimated fair value of the intangible asset group. If the carrying amount of the intangible asset group exceeds the implied estimated fair value, an impairment charge to current operations is recorded to reduce the carrying value to the implied estimated fair value.
Definite-lived intangible assets, which mainly consist of acquired rights, trade secrets, contract-based patents and copyrights, are amortized over their estimated useful lives, and are tested for impairment when facts and circumstances indicate that the carrying values may not be recoverable. There were no other intangible asset impairment charges recorded during fiscal 2013, 2012, and 2011.
Long-lived Assets
When facts and circumstances indicate that the carrying values of long-lived assets may not be recoverable, we evaluate long-lived assets for impairment. We first compare the carrying value of the asset to the asset’s estimated future cash flows (undiscounted). If the estimated future cash flows are less than the carrying value of the asset, we calculate an impairment loss based on the asset’s estimated fair value. The fair value of the assets is estimated using a discounted cash flow model based on forecasted future revenues and operating costs, using internal projections. Property, plant and equipment assets are grouped at the lowest level for which there is identifiable cash flows when assessing impairment. Cash flows for company-operated store assets are identified at the individual store level. Long-lived assets to be disposed of are reported at the lower of their carrying amount, or fair value less estimated costs to sell.
We recognized net disposition and impairment losses of $30.1 million, $31.7 million, and $36.2 million in fiscal 2013, 2012, and 2011, respectively. The nature of the underlying asset that is impaired will determine which operating expense line the impairment charge is recorded in on the consolidated statements of earnings. For assets within our retail operations, net impairment and disposition losses are recorded in store operating expenses. For all other assets, these losses are recorded in cost of sales including occupancy costs, other operating expenses, or general and administrative expenses.
Insurance Reserves
We use a combination of insurance and self-insurance mechanisms, including a wholly owned captive insurance entity and participation in a reinsurance treaty, to provide for the potential liabilities for certain risks, including workers’ compensation, healthcare benefits, general liability, property insurance, and director and officers’ liability insurance. Liabilities associated with the risks that are retained by us are not discounted and are estimated, in part, by considering historical claims experience, demographic, exposure and severity factors, and other actuarial assumptions.
Revenue Recognition
Consolidated revenues are presented net of intercompany eliminations for wholly owned subsidiaries and investees controlled by us and for product sales to and royalty and other fees from licensees accounted for under the equity method. Additionally, consolidated revenues are recognized net of any discounts, returns, allowances and sales incentives, including coupon redemptions and rebates.
Company-operated Stores Revenues
Company-operated stores revenues are recognized when payment is tendered at the point of sale. Company-operated store revenues are reported net of sales, use or other transaction taxes that are collected from customers and remitted to taxing authorities.
Licensed Stores Revenues
Licensed stores revenues consist of product sales to licensed stores, as well as royalties and other fees paid by licensees to use the Starbucks brand. Sales of coffee, tea and related products are generally recognized upon shipment to licensees, depending on contract terms. Shipping charges billed to licensees are also recognized as revenue, and the related shipping costs are included in cost of sales including occupancy costs on the consolidated statements of earnings.
Initial nonrefundable development fees for licensed stores are recognized upon substantial performance of services for new market business development activities, such as initial business, real estate and store development planning, as well as providing operational materials and functional training courses for opening new licensed retail markets. Additional store
2013 10-KStarbucks Corporation Form

52
licensing fees are recognized when new licensed stores are opened. Royalty revenues based upon a percentage of reported sales and other continuing fees, such as marketing and service fees, are recognized on a monthly basis when earned.
CPG, Foodservice and Other Revenues
CPG, foodservice and other revenues primarily consist of packaged coffee and tea as well as a variety of ready-to-drink beverages and single-serve coffee and tea products to grocery, warehouse club and specialty retail stores, sales to our national foodservice accounts, and revenues from sales of products to and license fee revenues from manufacturers that produce and market Starbucks and Seattle’s Best Coffee branded products through licensing agreements. Sales of coffee, tea, ready-to-drink beverages and related products to grocery and warehouse club stores are generally recognized when received by the customer or distributor, depending on contract terms. Revenues are recorded net of sales discounts given to customers for trade promotions and other incentives and for sales return allowances, which are determined based on historical patterns.
Revenues from sales of products to manufacturers that produce and market Starbucks and Seattle’s Best Coffee branded products through licensing agreements are generally recognized when the product is received by the manufacturer or distributor. License fee revenues from manufacturers are based on a percentage of sales and are recognized on a monthly basis when earned. National foodservice account revenues are recognized when the product is received by the customer or distributor.
Stored Value Cards
Revenues from our stored value cards, primarily Starbucks Cards, are recognized when redeemed or when the likelihood of redemption, based on historical experience, is deemed to be remote. Outstanding customer balances are included in deferred revenue on the consolidated balance sheets. There are no expiration dates on our stored value cards, and we do not charge any service fees that cause a decrement to customer balances. While we will continue to honor all stored value cards presented for payment, management may determine the likelihood of redemption to be remote for certain cards due to long periods of inactivity. In these circumstances, if management also determines there is no requirement for remitting balances to government agencies under unclaimed property laws, card balances may then be recognized in the consolidated statements of earnings, in net interest income and other. For the fiscal years ended September 29, 2013, September 30, 2012, and October 2, 2011, income recognized on unredeemed stored value card balances was $33.0 million, $65.8 million, and $46.9 million, respectively.
Customers in the US, Canada, the UK and Germany who register their Starbucks Card are automatically enrolled in the My Starbucks Rewards™ program and earn reward points (“Stars”) with each purchase. Reward program members receive various benefits depending on the number of Stars earned in a 12-month period. The value of Stars earned by our program members towards free product is included in deferred revenue and recorded as a reduction in revenue at the time the Stars are earned, based on the value of Stars that are projected to be redeemed.
Marketing & Advertising
Our annual marketing expenses include many components, one of which is advertising costs. We expense most advertising costs as they are incurred, except for certain production costs that are expensed the first time the advertising campaign takes place.
Marketing expenses totaled $306.8 million, $277.9 million and $244.0 million in fiscal 2013, 2012, and 2011, respectively. Included in these costs were advertising expenses, which totaled $205.8 million, $182.4 million and $141.4 million in fiscal 2013, 2012, and 2011, respectively.
Store Preopening Expenses
Costs incurred in connection with the start-up and promotion of new store openings are expensed as incurred.
Operating Leases
We lease retail stores, roasting, distribution and warehouse facilities, and office space under operating leases. Most lease agreements contain tenant improvement allowances, rent holidays, lease premiums, rent escalation clauses and/or contingent rent provisions. For purposes of recognizing incentives, premiums and minimum rental expenses on a straight-line basis over the terms of the leases, we use the date of initial possession to begin amortization, which is generally when we enter the space and begin to make improvements in preparation of intended use.
For tenant improvement allowances and rent holidays, we record a deferred rent liability on the consolidated balance sheets and amortize the deferred rent over the terms of the leases as reductions to rent expense on the consolidated statements of earnings.
For premiums paid upfront to enter a lease agreement, we record a deferred rent asset on the consolidated balance sheets and amortize the deferred rent over the terms of the leases as additional rent expense on the consolidated statements of earnings.
2013 10-KStarbucks Corporation Form

53
For scheduled rent escalation clauses during the lease terms or for rental payments commencing at a date other than the date of initial occupancy, we record minimum rental expenses on a straight-line basis over the terms of the leases on the consolidated statements of earnings.
Certain leases provide for contingent rents, which are determined as a percentage of gross sales in excess of specified levels. We record a contingent rent liability on the consolidated balance sheets and the corresponding rent expense when specified levels have been achieved or when we determine that achieving the specified levels during the fiscal year is probable.
When ceasing operations in company-operated stores under operating leases, in cases where the lease contract specifies a termination fee due to the landlord, we record such expense at the time written notice is given to the landlord. In cases where terms, including termination fees, are yet to be negotiated with the landlord, we will record the expense upon signing of an agreement with the landlord. In cases where the landlord does not allow us to prematurely exit the lease, but allows for subleasing, we estimate the fair value of any sublease income that can be generated from the location and expense the present value of the excess of remaining lease payments to the landlord over the projected sublease income at the cease-use date.
Asset Retirement Obligations
We recognize a liability for the fair value of required asset retirement obligations (“ARO”) when such obligations are incurred. Our AROs are primarily associated with leasehold improvements, which, at the end of a lease, we are contractually obligated to remove in order to comply with the lease agreement. At the inception of a lease with such conditions, we record an ARO liability and a corresponding capital asset in an amount equal to the estimated fair value of the obligation. The liability is estimated based on a number of assumptions requiring management’s judgment, including store closing costs, cost inflation rates and discount rates, and is accreted to its projected future value over time. The capitalized asset is depreciated using the same depreciation convention as leasehold improvement assets. Upon satisfaction of the ARO conditions, any difference between the recorded ARO liability and the actual retirement costs incurred is recognized as an operating gain or loss, included in cost of sales including occupancy costs, in the consolidated statements of earnings. As of September 29, 2013 and September 30, 2012, our net ARO asset included in property, plant and equipment was $3.8 million and $8.8 million, respectively, and our net ARO liability included in other long-term liabilities was $27.7 million and $42.6 million, respectively.
Stock-based Compensation
We maintain several equity incentive plans under which we may grant non-qualified stock options, incentive stock options, restricted stock, restricted stock units (“RSUs”) or stock appreciation rights to employees, non-employee directors and consultants. We also have an employee stock purchase plan (“ESPP”). RSUs issued by us are equivalent to nonvested shares under the applicable accounting guidance. We record stock-based compensation expense based on the fair value of stock awards at the grant date and recognize the expense over the related service period following a graded vesting expense schedule. For stock option awards we use the Black-Scholes-Merton option pricing model to measure fair value. For RSUs, fair value is calculated using the stock price at the date of grant.
Foreign Currency Translation
Our international operations generally use their local currency as their functional currency. Assets and liabilities are translated at exchange rates in effect at the balance sheet date. Income and expense accounts are translated at the average monthly exchange rates during the year. Resulting translation adjustments are recorded as a component of accumulated other comprehensive income on the consolidated balance sheets.
Income Taxes
We compute income taxes using the asset and liability method, under which deferred income taxes are provided for the temporary differences between the financial statement carrying amounts and the tax basis of our assets and liabilities. We routinely evaluate the likelihood of realizing the benefit of our deferred tax assets and may record a valuation allowance if, based on all available evidence, we determine that some portion of the tax benefit will not be realized. We recognize the tax benefit from an uncertain tax position only if it is more likely than not that the tax position will be sustained on examination by the relevant taxing authorities, based on the technical merits of our position. The tax benefits recognized in the financial statements from such a position are measured based on the largest benefit that has a greater than 50% likelihood of being realized upon ultimate settlement. Starbucks recognizes interest and penalties related to income tax matters in income tax expense.
Earnings per Share
Basic earnings per share is computed based on the weighted average number of shares of common stock outstanding during the period. Diluted earnings per share is computed based on the weighted average number of shares of common stock and the
2013 10-KStarbucks Corporation Form

54
effect of dilutive potential common shares outstanding during the period, calculated using the treasury stock method. Dilutive potential common shares include outstanding stock options and RSUs. Performance-based RSUs are considered dilutive when the related performance criterion has been met.
Common Stock Share Repurchases
We may repurchase shares of Starbucks common stock under a program authorized by our Board of Directors, including pursuant to a contract, instruction or written plan meeting the requirements of Rule 10b5-1(c)(1) of the Securities Exchange Act of 1934. Under applicable Washington State law, shares repurchased are retired and not displayed separately as treasury stock on the financial statements. Instead, the par value of repurchased shares is deducted from common stock and the excess repurchase price over par value is deducted from additional paid-in capital and from retained earnings, once additional paid-in capital is depleted.
Recent Accounting Pronouncements
In July 2013, the FASB issued guidance on the financial statement presentation of an unrecognized tax benefit when a net operating loss carryforward, a similar tax loss, or a tax credit carryforward exists. This guidance requires the unrecognized tax benefit to be presented in the financial statements as a reduction to a deferred tax asset. When a deferred tax asset is not available, or the asset is not intended to be used for this purpose, an entity should present the unrecognized tax benefit in the financial statements as a liability and should not net the unrecognized tax benefit with a deferred tax asset. The guidance will become effective for us at the beginning of our first quarter of fiscal 2015. We do not expect the adoption of this guidance will have a material impact on our financial statements.
In March 2013, the FASB issued guidance on a parent's accounting for the cumulative translation adjustment upon derecognition of certain subsidiaries or groups of assets within a foreign entity or of an investment in a foreign entity. This guidance requires a parent to release any related cumulative translation adjustment into net income only if the sale or transfer results in the complete or substantially complete liquidation of the foreign entity in which the subsidiary or group of assets had resided. The guidance will become effective for us at the beginning of our first quarter of fiscal 2015. We do not expect the adoption of this guidance will have a material impact on our financial statements.
In February 2013, the FASB issued guidance that adds additional disclosure requirements for items reclassified out of accumulated other comprehensive income. This guidance requires the disclosure of significant amounts reclassified from each component of accumulated other comprehensive income and the income statement line items affected by the reclassification. The guidance will become effective for us at the beginning of our first quarter of fiscal 2014. The adoption of this guidance will result in the disclosure of reclassifications from accumulated other comprehensive income by component in the consolidated statements of comprehensive income either on the face of the consolidated statements of earnings or in the Notes.
In January 2013, the FASB issued guidance clarifying the scope of disclosure requirements for offsetting assets and liabilities. The amended guidance limits the scope of balance sheet offsetting disclosures to derivatives, repurchase agreements, and securities lending transactions to the extent that they are offset in the financial statements or subject to an enforceable master netting arrangement or similar agreement. The guidance will become effective for us at the beginning of our first quarter of fiscal 2014. We do not expect the adoption of this guidance will have a material impact on our financial statements.
In July 2012, the FASB issued guidance that revises the requirements around how entities test indefinite-lived intangible assets, other than goodwill, for impairment. The guidance allows companies to perform a qualitative assessment before calculating the fair value of the indefinite-lived intangible asset. If entities determine, on the basis of qualitative factors, that the fair value of the indefinite-lived intangible asset is more likely than not greater than the carrying amount, a quantitative calculation would not be needed. The guidance became effective for us at the beginning of our first quarter of fiscal 2013. The adoption of this guidance did not have a material impact on our financial statements.
In June 2011, the FASB issued guidance that revises the manner in which entities present comprehensive income in their financial statements. The guidance requires entities to report the components of comprehensive income in either a single, continuous statement or two separate but consecutive statements. The guidance became effective for us at the beginning of our first quarter of fiscal 2013. In adopting this guidance, we added the consolidated statements of comprehensive income following our consolidated statements of earnings.
Reclassifications
Change in shared service allocations
Effective at the beginning of fiscal 2012, we implemented a strategic realignment of our organizational structure designed to accelerate our global growth strategy. A president for each region, reporting directly to our chief executive officer, was appointed to oversee the company-operated retail business working closely with both the licensed and joint-venture business
2013 10-KStarbucks Corporation Form

55
partners in each market. The regional presidents were to also work closely with our Channel Development team to continue building out our brands and channels in each region.
In connection with the changes to our organizational structure and reporting, we changed the accountability for, and reporting of, certain indirect overhead costs. Certain indirect merchandising, manufacturing costs and back-office shared service costs, which were previously allocated to segment level costs of sales and operating expenses, are now managed at a corporate level and are reported within unallocated corporate expenses. These expenses have therefore been removed from the segment level financial results. In order to conform prior period classifications with the new alignment, the historical consolidated financial statements have been recast with the following adjustments to previously reported amounts (in millions):
Year Ended October 2, 2011 As Filed Reclass As Adjusted
Total net revenues $ 11,700.4 $ — $ 11,700.4Cost of sales including occupancy costs 4,949.3 (33.8) 4,915.5Store operating expenses 3,665.1 (70.2) 3,594.9Other operating expenses 402.0 (9.2) 392.8Depreciation and amortization expenses 523.3 — 523.3General and administrative expenses 636.1 113.2 749.3
Total operating expenses 10,175.8 — 10,175.8Gain on sale of properties 30.2 — 30.2Income from equity investees 173.7 — 173.7
Operating income $ 1,728.5 $ — $ 1,728.5
There was no impact on consolidated net revenues, total operating expenses, operating income, or net earnings as a result of this change. Additional discussion regarding the change in our organizational structure and segment results is included at Note 16.
Effective in the second half of fiscal 2013, there were further changes to the leadership team which resulted in the promotion of two of these regional presidents to the role of group president. In these new roles, the group presidents have oversight of multiple operating segments. However, this did not change how we manage costs or report on our segment results and therefore did not have an impact on the historical presentation of our financial statements.
Note 2: Acquisitions and Divestitures
In the fourth quarter of fiscal 2013, we acquired a 49% equity method ownership interest in Starbucks Spain from our licensee partner Sigla S.A. (Grupo Vips) for approximately $33 million in cash.
During the fourth quarter of 2013, we sold our 82% interest in Starbucks Coffee Chile S.A. to our joint venture partner Alsea, S.A.B. de C.V., converting this to a 100% licensed market, for a total purchase price of $68.6 million, which includes final working capital adjustments. This transaction resulted in a gain of $45.9 million, which was included in net interest income and other in the consolidated statements of earnings.
In the third quarter of fiscal 2013, we acquired 100% ownership of a coffee farm in Costa Rica for $8.1 million in cash. The fair value of the net assets acquired on the acquisition date primarily comprises property, plant and equipment.
On December 31, 2012, we acquired 100% of the outstanding shares of Teavana Holdings, Inc. (“Teavana”), a specialty retailer of premium loose-leaf teas, authentic artisanal teawares and other tea-related merchandise, to elevate our tea offerings as well as expand our domestic and global tea footprint. We acquired Teavana for $615.8 million in cash. Of the total cash paid, $12.2 million was excluded from the purchase price allocation below as it represents contingent consideration receivable. At closing, we also repaid $35.2 million for long term debt outstanding on Teavana's balance sheet, which was recognized separately from the business combination. The following table summarizes the allocation of the purchase price to the fair values of the assets acquired and liabilities assumed on the closing date (in millions):
2013 10-KStarbucks Corporation Form

56
Fair Value at Dec 31, 2012
Cash and cash equivalents $ 47.0Inventories 21.3Property, plant and equipment 59.7Intangible assets 120.8Goodwill 467.5Other current and noncurrent assets 19.8Current liabilities (36.0)Long-term deferred tax liability (54.3)Long-term debt (35.2)Other long-term liabilities (7.0)
Total purchase price $ 603.6
Subsequent to the initial purchase price allocation performed in the second quarter of fiscal 2013, we recorded certain immaterial purchase accounting adjustments, which are reflected in the purchase price allocation table above.
The assets acquired and liabilities assumed are reported within All Other Segments. Other current and noncurrent assets acquired primarily include prepaid expenses, trade receivables, and deferred tax assets. In addition, we assumed various current liabilities primarily consisting of accounts payable, accrued payroll related liabilities and other accrued operating expenses. The intangible assets acquired as part of the transaction include the Teavana trade name, tea blends and non-compete agreements. The Teavana trade name was valued at $105.5 million and determined to have an indefinite life, based on our expectation that the brand will be used indefinitely and has no contractual limitations. The intangible asset related to the tea blends was valued at $13.0 million and will be amortized on a straight-line basis over a period of 10 years, and the intangible asset related to the non-compete agreements was valued at $2.3 million and will be amortized on a straight-line basis over a period of 3 years. The $467.5 million of goodwill represents the intangible assets that do not qualify for separate recognition, primarily including Teavana's established global store presence in high traffic mall locations and other high-sales-volume retail venues, Teavana's global customer base, and Teavana's "Heaven of tea" retail experience in which store employees engage and educate customers about the ritual and enjoyment of tea. The goodwill was allocated to All Other Segments and is not deductible for income tax purposes.
On July 3, 2012, we acquired 100% ownership interest in Bay Bread, LLC and its La Boulange bakery brand (collectively “La Boulange”) to elevate our core food offerings and build a premium, artisanal bakery brand. We acquired La Boulange for a purchase price of approximately $100 million in cash. The following table summarizes the allocation of the purchase price to the fair values of the assets acquired and liabilities assumed on the closing date (in millions):
Fair Value at July 3, 2012
Property, plant and equipment $ 18.1Intangible assets 24.3Goodwill 58.7Other current and noncurrent assets 5.1Current liabilities (6.4)
Total cash paid $ 99.8
The assets acquired and liabilities assumed are included in our Americas operating segment. Other current assets acquired primarily include cash, trade receivables, and inventory. In addition, we assumed various current liabilities primarily consisting of accounts payable and accrued payroll related liabilities. The intangible assets acquired as part of the transaction include the La Boulange trade name and proprietary recipes and processes. The La Boulange trade name was valued at $9.7 million and determined to have an indefinite life while the intangible asset relating to the proprietary recipes and processes was valued at $14.6 million and will be amortized over a period of 10 years. The $58.7 million of goodwill is deductible for income tax purposes and was allocated to our Americas operating segment.
On November 10, 2011, we acquired the outstanding shares of Evolution Fresh, Inc., a super-premium juice company, to expand our portfolio of product offerings and enter into the super-premium juice market. We acquired Evolution Fresh for a
2013 10-KStarbucks Corporation Form

57
purchase price of $30 million in cash. The fair value of the net assets acquired on the acquisition date included $18 million of goodwill. Evolution Fresh is reported in “All Others Segments.”
In the fourth quarter of fiscal 2011, we acquired the 50% ownership interest in Switzerland and Austria from our joint venture partner, Marinopoulos Holdings S.A.R.L, converting these markets to 100% owned company-operated markets, for a purchase price of $65.5 million. As a result of this acquisition, we adjusted the carrying value of our previous equity investment to fair value, resulting in a gain of approximately $55 million which was included in net interest income and other on our consolidated statements of earnings. The fair value of 100% of the net assets of these markets on the acquisition date was $131 million and was recorded on our consolidated balance sheets. Included in these net assets were $63.8 million of goodwill and $35.1 million in definite-lived intangible assets.
In the third quarter of fiscal 2011, we acquired the remaining 30% ownership of our business in the southern portion of China from our noncontrolling partner, Maxim’s Caterers Limited (Maxim’s). We simultaneously sold our 5% ownership interest in the Hong Kong market to Maxim’s.
The following table shows the effects of the change in Starbucks ownership interest in our business in South China on Starbucks equity:
Fiscal Year EndedSep 29,
2013Sep 30,
2012Oct 2,2011
Net earnings attributable to Starbucks $ 8.3 $ 1,383.8 $ 1,245.7Transfers (to) from the noncontrolling interest:
Decrease in additional paid-in capital for purchase of interestin subsidiary — — (28.0)
Change from net earnings attributable to Starbucks and transfers tononcontrolling interest $ 8.3 $ 1,383.8 $ 1,217.7
Note 3: Derivative Financial Instruments
Interest Rates
During the third quarter of fiscal 2013, we entered into forward-starting interest rate swap agreements with an aggregate notional amount of $750 million. These swaps hedged the variability in cash flows due to changes in the benchmark interest rate related to the $750 million of 10-year 3.85% Senior Notes due in October 2023 issued in the fourth quarter of 2013. We cash settled these swap agreements at the time of the pricing of the $750 million in Senior Notes, effectively locking in the benchmark interest rate in effect at the time the swap agreements were initiated. The resulting net gains from these agreements are included in accumulated other comprehensive income and amortized using the constant effective yield method as a reduction to interest expense over the life of these Senior Notes, as the underlying interest expense is recognized in the consolidated statements of earnings.
Net derivative gains from these cash flow hedges of $41.4 million, net of taxes, were included in accumulated other comprehensive income as of September 29, 2013. We had no outstanding forward-starting interest rate swaps as of September 30, 2012. Of the net derivative gains accumulated as of September 29, 2013, $3.6 million is expected to be reclassified into earnings within 12 months.
Foreign Currency
We enter into forward and swap contracts to hedge portions of cash flows of anticipated revenue streams and inventory purchases in currencies other than the entity's functional currency. Net derivative losses from cash flow hedges of $0.3 million and $2.9 million, net of taxes, were included in accumulated other comprehensive income as of September 29, 2013 and September 30, 2012, respectively. Of the net derivative losses accumulated as of September 29, 2013, $0.1 million of net gains are expected to be reclassified into earnings within 12 months and will also continue to experience fair value changes before affecting earnings. Outstanding contracts will expire within 21 months.
We also enter into net investment derivative instruments to hedge our equity method investment in Starbucks Coffee Japan, Ltd., to minimize foreign currency exposure. Net derivative losses from net investment hedges of $12.9 million and $33.6 million, net of taxes, were included in accumulated other comprehensive income as of September 29, 2013 and September 30, 2012, respectively. Outstanding contracts will expire within 29 months.
2013 10-KStarbucks Corporation Form

58
In addition to the hedging instruments above, to mitigate the translation risk of certain balance sheet items, we enter into certain foreign currency swap contracts that are not designated as hedging instruments. These contracts are recorded at fair value, with the changes in fair value recognized in net interest income and other on the consolidated statements of earnings. Gains and losses from these instruments are largely offset by the financial impact of translating foreign currency denominated payables and receivables, which is also recognized in net interest income and other.
Coffee
Depending on market conditions, we enter into futures contracts to hedge a portion of anticipated cash flows under our price-to-be-fixed green coffee contracts, which are described further in Note 1. Net derivative losses of $12.2 million and $32.9 million, net of taxes, were included in accumulated other comprehensive income as of September 29, 2013 and September 30, 2012, respectively. Of the net derivative losses accumulated as of September 29, 2013, $11.5 million is expected to be reclassified into earnings within 12 months and will also continue to experience fair value changes before affecting earnings. Outstanding contracts will expire within 6 months.
Dairy
To mitigate the price uncertainty of a portion of our future purchases of dairy products, we enter into futures contracts that are not designated as hedging instruments. These contracts are recorded at fair value, with the changes in fair value recognized in net interest income and other. Gains and losses from these instruments are largely offset by price fluctuations on our dairy purchases which are included in cost of sales.
Diesel Fuel
To mitigate the price uncertainty of a portion of our future purchases of diesel fuel, we enter into swap contracts that are not designated as hedging instruments. These contracts are recorded at fair value, with the changes in fair value recognized in net interest income and other. Gains and losses from these instruments are largely offset by the financial impact of diesel fuel fluctuations on our shipping costs which are included in operating expenses.
The following table presents the pretax effect of derivative contracts designated as hedging instruments on earnings and other comprehensive income ("OCI") for fiscal years ending (in millions):
Interest Rates Foreign Currency Coffee
Sep 29, 2013 Sep 30, 2012 Sep 29, 2013 Sep 30, 2012 Sep 29, 2013 Sep 30, 2012
Cash Flow Hedges:Gain/(Loss) recognized in earnings $ 0.5 $ — $ 3.5 $ (11.5) $ (49.4) $ (3.4)Gain/(Loss) recognized in OCI $ 66.2 $ — $ 7.4 $ (2.5) $ (26.5) $ (39.8)
Net Investment Hedges:Gain/(Loss) recognized in earnings $ — $ —Gain/(Loss) recognized in OCI $ 32.8 $ 1.1
The amounts shown in the above table as recognized in earnings for interest rates, foreign currency and coffee hedges represent the realized gains/(losses) reclassified from OCI to net earnings during the year. The amounts shown as recognized in OCI are prior to these reclassifications.
The following table presents the pretax effect of derivative contracts not designated as hedging instruments on earnings for fiscal years ending (in millions):
Foreign Currency Coffee Dairy Diesel Fuel
Sep 29,
2013Sep 30,
2012Sep 29,
2013Sep 30,
2012Sep 29,
2013Sep 30,
2012Sep 29,
2013Sep 30,
2012
Gain/(Loss) recognized in earnings $ (1.8) $ (2.2) $ (2.1) $ — $ (4.7) $ 7.8 $ 0.3 $ 3.1
2013 10-KStarbucks Corporation Form

59
Notional amounts of outstanding derivative contracts (in millions):
Sep 29, 2013 Sep 30, 2012
Foreign currency $ 452 $ 383Coffee — 125Dairy 38 72Diesel fuel 17 24
Note 4: Fair Value Measurements
Assets and Liabilities Measured at Fair Value on a Recurring Basis (in millions):
Fair Value Measurements at Reporting Date Using
Balance at
September 29, 2013
Quoted Pricesin Active
Markets for Identical Assets
(Level 1)
Significant Other Observable
Inputs(Level 2)
SignificantUnobservable
Inputs(Level 3)
Assets:Cash and cash equivalents $ 2,575.7 $ 2,575.7 $ — $ —Short-term investments:
Available-for-sale securitiesAgency obligations 20.0 — 20.0 —Commercial paper 127.0 — 127.0 —Corporate debt securities 57.5 — 57.5 —Government treasury securities 352.9 352.9 — —Certificates of deposit 34.1 — 34.1 —
Total available-for-sale securities 591.5 352.9 238.6 —Trading securities 66.6 66.6 — —
Total short-term investments 658.1 419.5 238.6 —Short-term derivatives 12.5 — 12.5 —Long-term investments:
Available-for-sale securitiesAgency obligations 8.1 — 8.1 —Corporate debt securities 36.8 — 36.8 —Auction rate securities 13.4 — — 13.4
Total long-term investments 58.3 — 44.9 13.4Long-term derivatives 11.4 — 11.4 —
Total $ 3,316.0 $ 2,995.2 $ 307.4 $ 13.4Liabilities:Short-term derivatives $ 3.5 $ — $ 3.5 $ —Long-term derivatives 0.5 — 0.5 —
Total $ 4.0 $ — $ 4.0 $ —
2013 10-KStarbucks Corporation Form

60
Fair Value Measurements at Reporting Date Using
Balance at
September 30, 2012
Quoted Pricesin Active
Markets for Identical Assets
(Level 1)
Significant Other Observable
Inputs(Level 2)
SignificantUnobservable
Inputs(Level 3)
Assets:Cash and cash equivalents $ 1,188.6 $ 1,188.6 $ — $ —Short-term investments:
Available-for-sale securitiesAgency obligations 80.0 — 80.0 —Commercial paper 103.9 — 103.9 —Corporate debt securities 84.3 — 84.3 —Government treasury securities 459.7 459.7 — —Certificates of deposit 62.9 — 62.9 —
Total available-for-sale securities 790.8 459.7 331.1 —Trading securities 57.6 57.6 — —
Total short-term investments 848.4 517.3 331.1 —Short-term derivatives 9.5 — 9.5 —Long-term investments:
Available-for-sale securitiesAgency obligations 14.0 — 14.0 —Corporate debt securities 61.3 — 61.3 —Auction rate securities 18.6 — — 18.6Certificates of deposit 22.1 — 22.1 —
Total long-term investments 116.0 — 97.4 18.6Total $ 2,162.5 $ 1,705.9 $ 438.0 $ 18.6
Liabilities:Short-term derivatives $ 18.9 $ — $ 18.9 $ —Long-term derivatives 3.0 — 3.0 —
Total $ 21.9 $ — $ 21.9 $ —
Short-term and long-term derivative assets are included in prepaid expenses and other current assets and other assets, respectively. Short-term and long-term derivative liabilities are included in other accrued liabilities and other long-term liabilities, respectively.
Available-for-sale Securities
Available-for-sale securities include government treasury securities, corporate and agency bonds, commercial paper, certificates of deposit placed through an account registry service and auction rate securities (“ARS”). Proceeds from sales of, and realized gains and losses on sales and maturities of, available-for-sale securities were not material for fiscal years 2013, 2012, and 2011.
Certificates of deposit have maturity dates ranging from approximately 1 month to 9 months and principal amounts, that when aggregated with interest that will accrue over the investment term, will not exceed Federal Deposit Insurance Corporation limits. Certificates of deposit with original maturities of 90 days or less, which are included in cash and cash equivalents, were not material as of September 29, 2013 and September 30, 2012.
Long-term investments (except for ARS) generally mature within 3 years. ARS have contractual maturities ranging from 17 to 30 years and are collateralized by portfolios of student loans, substantially all of which are guaranteed by the United States Department of Education.
Gross unrealized holding gains and losses on investments were not material as of September 29, 2013 and September 30, 2012.
Trading Securities
Trading securities include equity mutual funds and exchange-traded funds. For these securities, we use quoted prices in active markets for identical assets to determine fair value, thus these securities are considered Level 1 instruments. Our trading securities portfolio approximates a portion of the liability under the Management Deferred Compensation Plan (“MDCP”), a
2013 10-KStarbucks Corporation Form

61
defined contribution plan. The corresponding deferred compensation liability of $101.6 million and $94.8 million as of September 29, 2013 and September 30, 2012, respectively, is included in accrued compensation and related costs on the consolidated balance sheets. The changes in net unrealized holding gains/losses in the trading portfolio included in earnings for fiscal years 2013, 2012 and 2011 were a net gain of $11.7 million, a net gain of $10.9 million, and a net loss of $2.1 million, respectively.
Derivative Assets and Liabilities
Derivative assets and liabilities include foreign currency forward contracts, commodity swaps and futures contracts. Where applicable, we use quoted prices in active markets for identical derivative assets and liabilities that are traded on exchanges. Derivative assets and liabilities included in Level 2 are over-the-counter currency forward contracts and commodity swaps whose fair values are estimated using industry-standard valuation models. Such models project future cash flows and discount the future amounts to a present value using market-based observable inputs, including interest rate curves and forward and spot prices for currencies and commodities.
Changes in Level 3 Instruments Measured at Fair Value on a Recurring Basis
Financial instruments measured using Level 3 inputs described above are comprised entirely of our ARS. Changes in this balance related primarily to calls of certain of our ARS. In fiscal 2013 and 2012, $5.0 million and $10.7 million, respectively, of our ARS were called at par.
Assets and Liabilities Measured at Fair Value on a Nonrecurring Basis
Assets and liabilities recognized or disclosed at fair value on a nonrecurring basis include items such as property, plant and equipment, goodwill and other intangible assets, equity and cost method investments, and other assets. These assets are measured at fair value if determined to be impaired. During fiscal 2013 and 2012, there were no material fair market value adjustments.
Fair Value of Other Financial Instruments
The estimated fair value of the $750 million of 3.85% Senior Notes was approximately $762 million as of September 29, 2013, determined using Level 2 inputs.
The estimated fair value of the $550 million of 6.25% Senior Notes was approximately $644 million and $674 million as of September 29, 2013 and September 30, 2012, respectively, determined using Level 2 inputs.
Note 5: Inventories (in millions)
Sep 29, 2013 Sep 30, 2012
Coffee:Unroasted $ 493.0 $ 711.3Roasted 235.4 222.2
Other merchandise held for sale 243.3 181.6Packaging and other supplies 139.5 126.4Total $ 1,111.2 $ 1,241.5
Other merchandise held for sale includes, among other items, serveware and tea. Inventory levels vary due to seasonality, commodity market supply and price fluctuations.
As of September 29, 2013, we had committed to purchasing green coffee totaling $588 million under fixed-price contracts and an estimated $294 million under price-to-be-fixed contracts. As of September 29, 2013, approximately $0.3 million of our price-to-be-fixed contracts were effectively fixed through the use of futures contracts. Price-to-be-fixed contracts are purchase commitments whereby the quality, quantity, delivery period, and other negotiated terms are agreed upon, but the date, and therefore the price, at which the base “C” coffee commodity price component will be fixed has not yet been established. For these types of contracts, either Starbucks or the seller has the option to “fix” the base “C” coffee commodity price prior to the delivery date. Until prices are fixed, we estimate the total cost of these purchase commitments. We believe, based on relationships established with our suppliers in the past, the risk of non-delivery on such purchase commitments is remote.
2013 10-KStarbucks Corporation Form

62
Note 6: Equity and Cost Investments (in millions)
Sep 29,2013
Sep 30,2012
Equity method investments $ 450.9 $ 393.9Cost method investments 45.6 66.0Total $ 496.5 $ 459.9
Equity Method Investments
As of September 29, 2013, we had a 50 percent ownership interest in each of the following international equity method investees: Starbucks Coffee Korea Co., Ltd.; President Starbucks Coffee Taiwan Ltd.; Shanghai President Coffee Co.; Berjaya Starbucks Coffee Company Sdn. Bhd. (Malaysia); and Tata Starbucks Limited (India). In addition, we had a 49 percent ownership interest in Starbucks Coffee España, S.L. and a 39.6 percent ownership interest in Starbucks Coffee Japan, Ltd. These international entities operate licensed Starbucks® retail stores. We also have licensed the rights to produce and distribute Starbucks branded products to The North American Coffee Partnership with the Pepsi-Cola Company. We have a 50 percent ownership interest in The North American Coffee Partnership with the Pepsi-Cola Company, which develops and distributes bottled Starbucks® beverages, including Frappuccino®coffee drinks, Starbucks Doubleshot® espresso drinks, Starbucks Refreshers™ beverages, and Starbucks Discoveries Iced Café Favorites™.
Our share of income and losses from our equity method investments is included in income from equity investees on the consolidated statements of earnings. Also included in this line item is our proportionate share of gross profit resulting from coffee and other product sales to, and royalty and license fee revenues generated from, equity investees. Revenues generated from these related parties, net of eliminations, were $205.1 million, $190.3 million, and $151.6 million in fiscal years 2013, 2012, and 2011, respectively. Related costs of sales, net of eliminations, were $115.4 million, $111.0 million, and $83.2 million in fiscal years 2013, 2012, and 2011, respectively. As of September 29, 2013 and September 30, 2012, there were $48.3 million and $33.0 million of accounts receivable from equity investees, respectively, on our consolidated balance sheets, primarily related to product sales and royalty revenues.
As of September 29, 2013, the aggregate market value of our investment in Starbucks Japan was approximately $691 million, determined based on its available quoted market price, which exceeds its carrying value of $182 million.
Summarized combined financial information of our equity method investees, which represent 100% of the investees’ financial information (in millions):
Financial Position as ofSep 29,
2013Sep 30,
2012
Current assets $ 675.8 $ 603.1Noncurrent assets 783.3 735.3Current liabilities 466.6 411.2Noncurrent liabilities 148.9 119.7
Results of Operations for Fiscal Year EndedSep 29,
2013Sep 30,
2012Oct 2,2011
Net revenues $ 3,018.7 $ 2,796.7 $ 2,395.1Operating income 434.8 353.5 277.0Net earnings 358.0 286.7 231.1
Cost Method Investments
As of September 29, 2013, we had a $19 million investment of equity interests in entities that develop and operate Starbucks® licensed retail stores in several global markets. We have the ability to acquire additional interests in some of these cost method investees at certain intervals. Depending on our total percentage ownership interest and our ability to exercise significant influence over financial and operating policies, additional investments may require a retroactive application of the equity method of accounting.
2013 10-KStarbucks Corporation Form

63
During the fourth quarter of 2013, we sold our 18% interest in Starbucks Coffee Argentina S.R.L. to our joint venture partner Alsea, S.A.B. de C.V., for a total purchase price of $4.4 million. This transaction resulted in a loss of $1.0 million, which was included in net interest income and other in the consolidated statements of earnings.
During the second quarter of fiscal 2013, we sold our 18% interest in Cafe Sirena S. de R.L. de CV (a Mexican limited liability company), to our controlling joint venture partner, SC de Mexico, S.A. de CV, owned by Alsea, S.A.B. de C.V., for a total purchase price of $50.3 million, which includes final working capital adjustments. This transaction resulted in a gain of $35.2 million, which was included in net interest income and other in the consolidated statements of earnings.
During the fourth quarter of fiscal 2012, we made a $25 million investment in the preferred stock of Square, Inc. In addition, in conjunction with a commercial agreement with Square, we also received warrants to purchase common stock of Square that are subject to certain vesting conditions.
Note 7: Supplemental Balance Sheet Information (in millions)
Property, Plant and Equipment, net Sep 29, 2013 Sep 30, 2012
Land $ 47.0 $ 46.2Buildings 259.6 225.2Leasehold improvements 4,431.6 3,957.6Store equipment 1,353.9 1,251.0Roasting equipment 397.9 322.8Furniture, fixtures and other 949.7 836.2Work in progress 342.4 264.1Property, plant and equipment, gross 7,782.1 6,903.1Less accumulated depreciation (4,581.6) (4,244.2)Property, plant and equipment, net $ 3,200.5 $ 2,658.9
On August 8, 2011, we completed the sale of two office buildings for gross consideration of $125 million. As a result of this sale, we recognized a $30.2 million gain within operating income on the consolidated statements of earnings in fiscal 2011.
Accrued Liabilities Sep 29, 2013 Sep 30, 2012
Accrued compensation and related costs $ 420.2 $ 381.6Accrued occupancy costs 120.7 126.9Accrued taxes 125.0 138.3Accrued dividend payable 195.8 157.4Other 407.6 329.6Total accrued liabilities $ 1,269.3 $ 1,133.8
Note 8: Other Intangible Assets and Goodwill
Other intangible assets (in millions):
Sep 29, 2013 Sep 30, 2012
Indefinite-lived intangibles $ 205.6 $ 87.7Definite-lived intangibles 89.7 72.3Accumulated amortization (20.5) (16.3)Definite-lived intangibles, net 69.2 56.0Total other intangible assets $ 274.8 $ 143.7Definite-lived intangibles approximate remaining weighted average useful life inyears 9 10
2013 10-KStarbucks Corporation Form

64
Amortization expense for definite-lived intangibles was $7.7 million, $4.5 million, and $2.2 million during fiscal 2013, 2012, and 2011, respectively. Amortization expense is estimated to be approximately $8 million each year from fiscal 2014 through fiscal 2018, and a total of approximately $29 million thereafter.
Changes in the carrying amount of goodwill by reportable operating segment (in millions):
Americas EMEAChina /
Asia PacificChannel
DevelopmentAll OtherSegments Total
Balance at October 2, 2011(1)
Goodwill prior to impairment $ 162.9 $ 63.0 $ 74.8 $ 23.8 $ 5.7 $ 330.2Accumulated impairment charges (8.6) — — — — (8.6)Goodwill $ 154.3 $ 63.0 $ 74.8 $ 23.8 $ 5.7 $ 321.6
Acquisitions 70.5 — — — 7.0 77.5Other(2) 2.5 (3.0) 0.5 — — —Balance at September 30, 2012
Goodwill prior to impairment $ 235.9 $ 60.0 $ 75.3 $ 23.8 $ 12.7 $ 407.7Accumulated impairment charges (8.6) — — — — (8.6)Goodwill $ 227.3 $ 60.0 $ 75.3 $ 23.8 $ 12.7 $ 399.1
Acquisitions/(divestitures) (3.7) — — — 467.5 463.8Other(2) (2.0) 2.2 (0.2) — — —Balance at September 29, 2013
Goodwill prior to impairment $ 230.2 $ 62.2 $ 75.1 $ 23.8 $ 480.2 $ 871.5Accumulated impairment charges (8.6) — — — — (8.6)Goodwill $ 221.6 $ 62.2 $ 75.1 $ 23.8 $ 480.2 $ 862.9
(1) In conjunction with the change in reportable operating segments, we reclassified goodwill by segment as of October 2, 2011.
(2) Other is primarily comprised of changes in the goodwill balance as a result of foreign exchange fluctuations.
Note 9: Debt
Revolving Credit Facility and Commercial Paper Program
Our previous $500 million unsecured, revolving credit facility (the “2010 credit facility”) was set to mature in November 2014. In the second quarter of fiscal 2013, we replaced the 2010 credit facility with a new $750 million unsecured, revolving credit facility (the “2013 credit facility”) with various banks, of which $150 million may be used for issuances of letters of credit.
The 2013 credit facility is available for working capital, capital expenditures and other corporate purposes, including acquisitions and share repurchases, and is currently set to mature in February 2018. Starbucks has the option, subject to negotiation and agreement with the related banks, to increase the maximum commitment amount by an additional $750 million. Borrowings under the 2013 credit facility will bear interest at a variable rate based on LIBOR, and, for US dollar-denominated loans under certain circumstances, a Base Rate (as defined in the 2013 credit facility), in each case plus an applicable margin. The applicable margin is based on the better of (i) the Company's long-term credit ratings assigned by Moody's and Standard & Poor's rating agencies, and (ii) the Company's fixed charge coverage ratio, pursuant to a pricing grid set forth in the 2013 credit facility. The current applicable margin is 0.795% for Eurocurrency Rate Loans and 0.00% for Base Rate Loans. The 2013 credit facility contains provisions requiring us to maintain compliance with certain covenants, including a minimum fixed charge coverage ratio, which measures our ability to cover financing expenses. As a result of the arbitrator’s ruling on the Kraft litigation, the credit facility was amended on November 15, 2013 to exclude the impact of the litigation charge, including the impact on our fixed charge coverage ratio. As of September 29, 2013, we were in compliance with each of these covenants, as amended.
Under our commercial paper program, as approved by our board of directors, we may issue unsecured commercial paper notes up to a maximum aggregate amount outstanding at any time of $1 billion, with individual maturities that may vary, but not
2013 10-KStarbucks Corporation Form

65
exceed 397 days from the date of issue. Amounts outstanding under the commercial paper program are to be backstopped by available commitments under our credit facility. Currently, we may issue up to $729 million under our commercial paper program (the $750 million committed credit facility amount, less $21 million in outstanding letters of credit).
The proceeds from borrowings under our commercial paper program may be used for working capital needs, capital expenditures and other corporate purposes, including acquisitions and share repurchases. During fiscal 2013 and fiscal 2012, there were no borrowings under the credit facility or commercial paper programs. As of September 29, 2013 and September 30, 2012, a total of $21 million and $18 million, respectively, in letters of credit were outstanding under the revolving credit facility.
Long-term Debt
In September 2013, we issued $750 million of 10-year 3.85% Senior Notes ("the 2013 notes") due October 2023, in an underwritten registered public offering. Interest on the 2013 notes is payable semi-annually on April 1 and October 1 of each year, commencing April 1, 2014. As discussed in Note 3, we entered into forward-starting interest rate swap agreements related to this debt issuance that effectively locked in the benchmark interest rate, resulting in an effective borrowing cost of 2.86%. As of September 29, 2013, the carrying value of the 2013 notes, recorded on the consolidated balance sheets, was $749.8 million.
In August 2007, we issued $550 million of 6.25% Senior Notes (“the 2007 notes”) due in August 2017, in an underwritten registered public offering. Interest on the 2007 notes is payable semi-annually on February 15 and August 15 of each year. As of September 29, 2013 and September 30, 2012, the carrying value of the 2007 notes, recorded on the consolidated balance sheets, was $549.7 million and $549.6 million, respectively.
The indentures under which the 2013 notes and the 2007 notes were issued also require us to maintain compliance with certain covenants, including limits on future liens and sale and leaseback transactions on certain material properties. As of September 29, 2013 and September 30, 2012, we were in compliance with each of these covenants.
Interest Expense
Interest expense, net of interest capitalized, was $28.1 million, $32.7 million, and $33.3 million in fiscal 2013, 2012 and 2011, respectively. In fiscal 2013, 2012, and 2011, $10.4 million, $3.2 million, and $4.4 million, respectively, of interest was capitalized for asset construction projects.
Note 10: Leases
Rental expense under operating lease agreements (in millions):
Fiscal Year Ended Sep 29, 2013 Sep 30, 2012 Oct 2, 2011
Minimum rentals $ 838.3 $ 759.0 $ 715.6Contingent rentals 56.4 44.7 34.3Total $ 894.7 $ 803.7 $ 749.9
Minimum future rental payments under non-cancelable operating leases as of September 29, 2013 (in millions):
Fiscal Year Ending
2014 $ 875.12015 799.82016 690.42017 559.12018 419.0Thereafter 1,242.5Total minimum lease payments $ 4,585.9
We have subleases related to certain of our operating leases. During fiscal 2013, 2012, and 2011, we recognized sublease income of $9.3 million, $10.0 million, and $13.7 million, respectively.
2013 10-KStarbucks Corporation Form

66
Note 11: Shareholders’ Equity
In addition to 1.2 billion shares of authorized common stock with $0.001 par value per share, we have authorized 7.5 million shares of preferred stock, none of which was outstanding at September 29, 2013.
Included in additional paid-in capital in our consolidated statements of equity as of September 29, 2013 and September 30, 2012 is $39.4 million related to the increase in value of our share of the net assets of Starbucks Japan at the time of its initial public stock offering in fiscal 2002.
Share repurchase activity (in millions, except for average price data):
Period Ended Sep 29, 2013 Sep 30, 2012
Number of shares acquired 10.8 12.3Average price per share of acquired shares $ 50.52 $ 48.15Total cost of acquired shares $ 544.1 $ 593.2
As of September 29, 2013, 26.4 million shares remained available for repurchase under current authorizations.
During fiscal years 2013 and 2012, our Board of Directors declared the following dividends (in millions, except per share amounts):
Dividend Per Share Record date Total Amount Payment Date
Fiscal Year 2013:First quarter $0.21 February 7, 2013 $157.5 February 22, 2013Second quarter $0.21 May 9, 2013 $157.3 May 24, 2013Third quarter $0.21 August 8, 2013 $158.0 August 23, 2013Fourth quarter $0.26 November 14, 2013 $195.8 November 29, 2013
Fiscal Year 2012:First quarter $0.17 February 8, 2012 $128.2 February 24, 2012Second quarter $0.17 May 9, 2012 $129.0 May 25, 2012Third quarter $0.17 August 8, 2012 $129.1 August 24, 2012Fourth quarter $0.21 November 15, 2012 $157.4 November 30, 2012
Comprehensive Income
Comprehensive income includes all changes in equity during the period, except those resulting from transactions with our shareholders. Comprehensive income is comprised of net earnings and other comprehensive income. Accumulated other comprehensive income reported on our consolidated balance sheets consists of foreign currency translation adjustments and the unrealized gains and losses, net of applicable taxes, on available-for-sale securities and on derivative instruments designated and qualifying as cash flow and net investment hedges.
Components of accumulated other comprehensive income, net of tax (in millions):
Fiscal Year Ended Sep 29, 2013 Sep 30, 2012
Net unrealized gains/(losses) on available-for-sale securities $ (0.5) $ (0.1)Net unrealized gains/(losses) on hedging instruments 13.9 (72.1)Translation adjustment 53.6 94.9Accumulated other comprehensive income $ 67.0 $ 22.7
As of September 29, 2013 and September 30, 2012, the translation adjustment was net of tax provisions of $6.3 million and $6.6 million, respectively.
2013 10-KStarbucks Corporation Form

67
Note 12: Employee Stock and Benefit Plans
We maintain several equity incentive plans under which we may grant non-qualified stock options, incentive stock options, restricted stock, restricted stock units (“RSUs”), or stock appreciation rights to employees, non-employee directors and consultants. We issue new shares of common stock upon exercise of stock options and the vesting of RSUs. We also have an employee stock purchase plan (“ESPP”).
As of September 29, 2013, there were 18.2 million shares of common stock available for issuance pursuant to future equity-based compensation awards and 7.8 million shares available for issuance under our ESPP.
Stock based compensation expense recognized in the consolidated financial statements (in millions):
Fiscal Year Ended Sep 29, 2013 Sep 30, 2012 Oct 2, 2011
Options $ 37.1 $ 46.2 $ 60.4RSUs 105.2 107.4 84.8Total stock-based compensation expense recognized in theconsolidated statements of earnings $ 142.3 $ 153.6 $ 145.2Total related tax benefit $ 49.8 $ 54.2 $ 51.2Total capitalized stock-based compensation included in netproperty, plant and equipment and inventories on the consolidatedbalance sheets $ 1.8 $ 2.0 $ 2.1
Stock Option Plans
Stock options to purchase our common stock are granted at the fair market value of the stock on the date of grant. The majority of options become exercisable in four equal installments beginning a year from the date of grant and generally expire 10 years from the date of grant. Options granted to non-employee directors generally vest over one to three years. Nearly all outstanding stock options are non-qualified stock options.
The fair value of each stock option granted is estimated on the grant date using the Black-Scholes-Merton option valuation model. The assumptions used to calculate the fair value of options granted are evaluated and revised, as necessary, to reflect market conditions and our historical experience. Options granted are valued using the multiple option valuation approach, and the resulting expense is recognized over the requisite service period for each separately vesting portion of the award. Compensation expense is recognized only for those options expected to vest, with forfeitures estimated at the date of grant based on our historical experience and future expectations.
The fair value of stock option awards was estimated at the grant date with the following weighted average assumptions for fiscal years 2013, 2012, and 2011:
Employee Stock OptionsGranted During the Period
Fiscal Year Ended 2013 2012 2011
Expected term (in years) 4.8 4.8 5.0Expected stock price volatility 34.0% 38.2% 39.0%Risk-free interest rate 0.7% 1.0% 1.6%Expected dividend yield 1.6% 1.5% 1.7%Weighted average grant price $ 51.23 $ 44.26 $ 31.46Estimated fair value per option granted $ 12.88 $ 12.79 $ 9.58
The expected term of the options represents the estimated period of time until exercise, and is based on historical experience of similar awards, giving consideration to the contractual terms, vesting schedules and expectations of future employee behavior. Expected stock price volatility is based on a combination of historical volatility of our stock and the one-year implied volatility of Starbucks traded options, for the related vesting periods. The risk-free interest rate is based on the implied yield available on US Treasury zero-coupon issues with an equivalent remaining term. The dividend yield assumption is based on our anticipated cash dividend payouts. The amounts shown above for the estimated fair value per option granted are before the estimated effect of forfeitures, which reduce the amount of expense recorded on the consolidated statements of earnings.
2013 10-KStarbucks Corporation Form

68
Stock option transactions for the year ended September 29, 2013 (in millions, except per share and contractual life amounts):
SharesSubject toOptions
WeightedAverageExercise
Priceper Share
WeightedAverage
RemainingContractualLife (Years)
AggregateIntrinsic
Value
Outstanding, September 30, 2012 33.1 $ 22.19 6.1 $ 945Granted 3.6 51.23Exercised (13.2) 17.20Expired/forfeited (1.5) 33.97Outstanding, September 29, 2013 22.0 29.11 6.0 1,060Exercisable, September 29, 2013 13.3 22.07 4.7 734Vested and expected to vest, September 29, 2013 21.0 28.36 5.9 1,031
The aggregate intrinsic value in the table above is the amount by which the market value of the underlying stock exceeded the exercise price of outstanding options, is before applicable income taxes and represents the amount optionees would have realized if all in-the-money options had been exercised on the last business day of the period indicated.
As of September 29, 2013, total unrecognized stock-based compensation expense, net of estimated forfeitures, related to nonvested stock options was approximately $32 million, before income taxes, and is expected to be recognized over a weighted average period of approximately 2.7 years. The total intrinsic value of stock options exercised was $539 million, $440 million, and $323 million during fiscal years 2013, 2012, and 2011, respectively. The total fair value of options vested was $56 million, $59 million, and $126 million during fiscal years 2013, 2012, and 2011, respectively.
RSUs
We have both time-vested and performance-based RSUs. Time-vested RSUs are awarded to eligible employees and entitle the grantee to receive shares of common stock at the end of a vesting period, subject solely to the employee’s continuing employment. Our performance-based RSUs are awarded to eligible employees and entitle the grantee to receive shares of common stock if we achieve specified performance goals during the performance period and the grantee remains employed during the subsequent vesting period. The fair value of RSUs is based on the closing price of Starbucks common stock on the award date. Expense for performance-based RSUs is recognized when it is probable the performance goal will be achieved.
RSU transactions for the year ended September 29, 2013 (in millions, except per share and contractual life amounts):
Numberof
Shares
WeightedAverage
Grant DateFair Valueper Share
WeightedAverage
RemainingContractualLife (Years)
AggregateIntrinsic
Value
Nonvested, September 30, 2012 7.3 34.68 0.9 366Granted 3.1 50.23Vested (3.5) 30.22Forfeited/cancelled (1.1) 43.26Nonvested, September 29, 2013 5.8 44.08 0.9 452
The weighted average fair value per RSU granted was $44.05 and $31.06 in fiscal 2012 and 2011, respectively. As of September 29, 2013, total unrecognized stock-based compensation expense related to nonvested RSUs, net of estimated forfeitures, was approximately $78 million, before income taxes, and is expected to be recognized over a weighted average period of approximately 2.2 years. The total fair value of RSUs vested was $104 million, $80 million and $16 million during fiscal years 2013, 2012, and 2011, respectively.
ESPP
Our ESPP allows eligible employees to contribute up to 10% of their base earnings toward the quarterly purchase of our common stock, subject to an annual maximum dollar amount. The purchase price is 95% of the fair market value of the stock on the last business day of the quarterly offering period. The number of shares issued under our ESPP was 0.3 million in fiscal 2013.
2013 10-KStarbucks Corporation Form

69
Deferred Stock Plan
Our 1997 Deferred Stock Plan for certain key-employees enabled participants in the plan to defer receipt of ownership of common shares from the exercise of nonqualified stock options. Pursuant to this plan, our chairman, president and ceo elected to defer receipt of approximately 3.4 million shares of common stock (as adjusted for stock splits since 1997). In November 2006, he re-deferred receipt of the shares until December 21, 2012 (or earlier if his employment with Starbucks terminated before such date). On December 21, 2012, the deferral period ended and pursuant to the terms of the plan, we issued approximately 2.2 million shares of common stock to him and withheld approximately 1.2 million shares to satisfy tax withholdings. As of September 29, 2013 there were no remaining deferrals under the terms of this plan and no new deferrals are permitted.
Defined Contribution Plans
We maintain voluntary defined contribution plans, both qualified and non-qualified, covering eligible employees as defined in the plan documents. Participating employees may elect to defer and contribute a portion of their eligible compensation to the plans up to limits stated in the plan documents, not to exceed the dollar amounts set by applicable laws.
Our matching contributions to all US and non-US plans were $54.7 million, $59.8 million, and $45.5 million in fiscal years 2013, 2012, and 2011, respectively.
Note 13: Income Taxes
The components of earnings/(loss) before income taxes were as follows (in millions):
Fiscal Year Ended Sep 29, 2013Sep 30, 2012 Oct 2, 2011
TotalLitigation
charge All Other
United States $ (674.0) $ (2,784.1) $ 2,110.1 $ 1,679.6 $ 1,523.4Foreign 444.1 — 444.1 379.5 287.7Total earnings/(loss) before income taxes $ (229.9) $ (2,784.1) $ 2,554.2 $ 2,059.1 $ 1,811.1
Provision/(benefit) for income taxes (in millions):
Fiscal Year Ended Sep 29, 2013Sep 30, 2012 Oct 2, 2011
TotalLitigation
charge All Other
Current taxes:US federal $ 616.6 $ — $ 616.6 $ 466.0 $ 344.7US state and local 93.8 — 93.8 79.9 61.2Foreign 95.9 — 95.9 76.8 37.3
Total current taxes 806.3 — 806.3 622.7 443.2Deferred taxes:
US federal (898.8) (922.3) 23.5 49.2 111.6US state and local (144.0) (148.7) 4.7 (0.7) 8.3Foreign (2.2) — (2.2) 3.2 —
Total deferred taxes (1,045.0) (1,071.0) 26.0 51.7 119.9Total provision/(benefit) for income taxes $ (238.7) $ (1,071.0) $ 832.3 $ 674.4 $ 563.1
2013 10-KStarbucks Corporation Form

70
Reconciliation of the statutory US federal income tax rate with our effective income tax rate:
Fiscal Year Ended Sep 29, 2013Sep 30, 2012 Oct 2, 2011
TotalLitigation
charge All Other
Statutory rate 35.0% 35.0% 35.0 % 35.0 % 35.0 %State income taxes, net of federal tax benefit 15.8% 3.5% 2.4 % 2.5 % 2.5 %Benefits and taxes related to foreign operations 37.5% —% (3.4)% (3.3)% (3.1)%Domestic production activity deduction 8.1% —% (0.7)% (0.7)% (0.8)%Domestic tax credits 2.8% —% (0.3)% (0.3)% (0.7)%Charitable contributions 3.9% —% (0.3)% (0.5)% (0.3)%Other, net(1) 0.7% —% (0.1)% 0.1 % (1.5)%Effective tax rate 103.8% 38.5% 32.6 % 32.8 % 31.1 %
(1) Fiscal 2011 includes a benefit of 0.9% related to the acquisition of the remaining ownership interest in Switzerland and Austria.
Our effective tax rate in 2013 was significantly affected by the litigation charge we recorded as a result of the conclusion of our arbitration with Kraft. In order to provide a more meaningful analysis of tax expense and the effective tax rate, the tables above present separate reconciliations of the effect of the litigation charge. The deferred tax asset related to the litigation charge is estimated to be recovered over a period of years; the deferred tax asset has been classified between current and non-current consistent with the expected recovery period for income tax reporting purposes.
US income and foreign withholding taxes have not been provided on approximately $1.9 billion of cumulative undistributed earnings of foreign subsidiaries and equity investees. We intend to reinvest these earnings for the foreseeable future. If these amounts were distributed to the US, in the form of dividends or otherwise, we would be subject to additional US income taxes, which could be material. Determination of the amount of unrecognized deferred income tax liabilities on these earnings is not practicable because of the complexities with its hypothetical calculation, and the amount of liability, if any, is dependent on circumstances existing if and when remittance occurs.
2013 10-KStarbucks Corporation Form

71
Tax effect of temporary differences and carryforwards that comprise significant portions of deferred tax assets and liabilities (in millions):
Sep 29, 2013 Sep 30, 2012
Deferred tax assets:Property, plant and equipment $ 64.9 $ 62.7Accrued occupancy costs 69.0 72.0Accrued compensation and related costs 77.6 66.9Other accrued liabilities 22.0 15.7Asset retirement obligation asset 21.0 20.1Deferred revenue 49.9 43.7Asset impairments 33.3 38.5Tax credits 19.1 14.6Stock based compensation 120.9 131.8Net operating losses 99.0 99.2Litigation charge 1,071.9 —Other 62.7 80.9Total $ 1,711.3 $ 646.1Valuation allowance (160.5) (154.2)Total deferred tax asset, net of valuation allowance $ 1,550.8 $ 491.9Deferred tax liabilities:Property, plant and equipment (182.9) (89.0)Intangible assets and goodwill (81.6) (34.0)Other (53.1) (44.8)Total (317.6) (167.8)Net deferred tax asset $ 1,233.2 $ 324.1Reported as:Current deferred income tax assets $ 277.3 $ 238.7Long-term deferred income tax assets 967.0 97.3Current deferred income tax liabilities (included in Accrued liabilities) (1.0) (1.3)Long-term deferred income tax liabilities (included in Other long-term liabilities) (10.1) (10.6)Net deferred tax asset $ 1,233.2 $ 324.1
The valuation allowance as of September 29, 2013 and September 30, 2012 is primarily related to net operating losses and other deferred tax assets of consolidated foreign subsidiaries. The net change in the total valuation allowance for the years ended September 29, 2013 and September 30, 2012, was an increase of $6.3 million and $16.8 million, respectively.
As of September 29, 2013, Starbucks has state tax credit carryforwards of $19.1 million with an expiration date of fiscal 2024. Starbucks has foreign net operating loss carryforwards of $324 million, with the predominant amount having no expiration date.
Uncertain Tax Positions
As of September 29, 2013, we had $88.8 million of gross unrecognized tax benefits of which $59.6 million, if recognized, would affect our effective tax rate. We recognize interest and penalties related to income tax matters in income tax expense. As of September 29, 2013 and September 30, 2012, we had accrued interest and penalties of $4.7 million and $5.5 million, respectively, before the benefit of the federal tax deduction, recorded on our consolidated balance sheets.
2013 10-KStarbucks Corporation Form

72
The following table summarizes the activity related to our unrecognized tax benefits (in millions):
Sep 29, 2013 Sep 30, 2012 Oct 2, 2011
Beginning balance $ 75.3 $ 52.9 $ 68.4Increase related to prior year tax positions 8.9 8.8 4.4Decrease related to prior year tax positions (9.3) — (32.3)Increase related to current year tax positions 19.3 20.0 26.0Decrease related to current year tax positions (0.4) (1.1) (0.8)Decreases related to settlements with taxing authorities — (0.5) (5.0)Decreases related to lapsing of statute of limitations (5.0) (4.8) (7.8)Ending balance $ 88.8 $ 75.3 $ 52.9
We are currently under routine audit by various jurisdictions inside and outside the US as well as US state taxing jurisdictions for fiscal years 2006 through 2012. We are no longer subject to US federal or state examination for years prior to fiscal year 2010, with the exception of nine states. We are no longer subject to examination in any material international markets prior to 2006.
There is a reasonable possibility that the unrecognized tax benefits will change within 12 months, but we do not expect this change to be significant to the consolidated financial statements.
Note 14: Earnings per Share
Calculation of net earnings per common share (“EPS”) — basic and diluted (in millions, except EPS):
Fiscal Year Ended Sep 29, 2013 Sep 30, 2012 Oct 2, 2011
Net earnings attributable to Starbucks $ 8.3 $ 1,383.8 $ 1,245.7Weighted average common shares and common stock unitsoutstanding (for basic calculation) 749.3 754.4 748.3Dilutive effect of outstanding common stock options and RSUs 13.0 18.6 21.4Weighted average common and common equivalent sharesoutstanding (for diluted calculation) 762.3 773.0 769.7EPS — basic $ 0.01 $ 1.83 $ 1.66EPS — diluted $ 0.01 $ 1.79 $ 1.62
Potential dilutive shares consist of the incremental common shares issuable upon the exercise of outstanding stock options (both vested and non-vested) and unvested RSUs, calculated using the treasury stock method. The calculation of dilutive shares outstanding excludes out-of-the-money stock options (i.e., such options’ exercise prices were greater than the average market price of our common shares for the period) because their inclusion would have been antidilutive. We had no out-of-the-money stock options as of September 29, 2013. We had 0.2 million and 0.1 million out-of-the-money stock options as of September 30, 2012, and October 2, 2011, respectively.
Note 15: Commitments and Contingencies
Legal Proceedings
In the first quarter of fiscal 2011, Starbucks notified Kraft Foods Global, Inc. (now known as Kraft Foods Group, Inc.) (“Kraft”) that we were discontinuing our distribution arrangement with Kraft on March 1, 2011 due to material breaches by Kraft of its obligations under the Supply and License Agreement between the Company and Kraft, dated March 29, 2004 (the “Agreement”), which defined the main distribution arrangement between the parties. Through our arrangement with Kraft, Starbucks sold a selection of Starbucks and Seattle's Best Coffee branded packaged coffees in grocery and warehouse club stores throughout the US, and to grocery stores in Canada, the UK and other European countries. Kraft managed the distribution, marketing, advertising and promotion of these products.
Kraft denied it had materially breached the Agreement. On November 29, 2010, Starbucks received a notice of arbitration from Kraft putting the commercial dispute between the parties into binding arbitration pursuant to the terms of the Agreement. In addition to denying it materially breached the Agreement, Kraft further alleged that if Starbucks wished to terminate the
2013 10-KStarbucks Corporation Form

73
Agreement it must compensate Kraft as provided in the Agreement in an amount equal to the fair value of the Agreement, with an additional premium of up to 35% under certain circumstances.
On December 6, 2010, Kraft commenced a federal court action against Starbucks, entitled Kraft Foods Global, Inc. v. Starbucks Corporation, in the U.S. District Court for the Southern District of New York (the “District Court”) seeking injunctive relief to prevent Starbucks from terminating the distribution arrangement until the parties' dispute is resolved through the arbitration proceeding. On January 28, 2011, the District Court denied Kraft's request for injunctive relief. Kraft appealed the District Court's decision to the Second Circuit Court of Appeals. On February 25, 2011, the Second Circuit Court of Appeals affirmed the District Court's decision. As a result, Starbucks has been in full control of our packaged coffee business since March 1, 2011.
On April 2, 2012, Starbucks and Kraft exchanged expert reports regarding alleged damages on their affirmative claims. Starbucks claimed damages of up to $62.9 million from the loss of sales resulting from Kraft's failure to use commercially reasonable efforts to market Starbucks® coffee, plus attorney fees. Kraft's expert opined that the fair market value of the Agreement was $1.9 billion. After applying a 35% premium and 9% interest, Kraft claimed damages of up to $2.9 billion, plus attorney fees. The arbitration hearing commenced on July 11, 2012 and was completed on August 3, 2012. Starbucks presented evidence of material breaches on Kraft's part and sought nominal damages from Kraft for those breaches. Kraft presented evidence denying it had breached the parties' Agreement and sought damages of $2.9 billion plus attorney fees.
We believe we had valid claims of material breach by Kraft under the Agreement that allowed us to terminate the Agreement and certain other relationships with Kraft without compensation to Kraft. Although Kraft disclosed to the press and in federal court filings a $750 million offer Starbucks made to Kraft in August 2010 to avoid litigation and ensure a smooth transition of the business, the figure was not a proper basis upon which to estimate a possible outcome of the arbitration but was based upon facts and circumstances at the time. Kraft rejected the offer immediately and did not provide a counter-offer, effectively ending the discussions between the parties with regard to any payment. Moreover, the offer was made prior to our investigation of Kraft's breaches and without consideration of Kraft's continuing failure to comply with material terms of the agreements. As a result, prior to receiving the arbitrator's ruling we could not reasonably estimate the possible loss. Accordingly, no loss contingency was recorded for this matter.
On November 12, 2013, the arbitrator ordered Starbucks to pay Kraft $2,227.5 million in damages plus prejudgment interest and attorneys' fees. We have estimated prejudgment interest, which includes an accrual through the estimated payment date, and attorneys fees to be approximately $556.6 million. As a result, we recorded a litigation charge of $2,784.1 million in our fiscal 2013 operating results.
Starbucks is party to various other legal proceedings arising in the ordinary course of business, including certain employment litigation cases that have been certified as class or collective actions, but, except as noted above, is not currently a party to any legal proceeding that management believes could have a material adverse effect on our consolidated financial position, results of operations or cash flows.
Note 16: Segment Reporting
Segment information is prepared on the same basis that our ceo, who is our chief operating decision maker, manages the segments, evaluates financial results, and makes key operating decisions. Beginning with the first quarter of fiscal 2012, we redefined our reportable operating segments to align with the three-region leadership and organizational structure of our retail business that took effect at the beginning of fiscal 2012. The three-region structure includes: 1) Americas, inclusive of the US, Canada, and Latin America; 2) Europe, Middle East, and Africa (“EMEA”); and 3) China / Asia Pacific (“CAP”).
Accordingly, beginning with the first quarter of fiscal 2012, we revised our reportable operating segments from 1) US, 2) International, and 3) Global Consumer Products Group to the following four reportable segments: 1) Americas, 2) EMEA, 3) CAP, and 4) Global Consumer Products Group. In the second quarter of fiscal 2012, we renamed our Global Consumer Products Group segment “Channel Development.”
Effective at the beginning of fiscal 2013, we decentralized certain leadership functions in the areas of retail marketing and category management, global store development and partner resources to support and align with the respective operating segment presidents. In conjunction with these moves, certain general and administrative and depreciation and amortization expenses associated with these functions, which were previously reported as unallocated corporate expenses within "Other," are now reported within the respective reportable operating segments to align with the regions which they support.
Concurrent with the change in reportable operating segments and realignment of certain operating expenses noted above, we revised our prior period financial information to reflect comparable financial information for the new segment structure and
2013 10-KStarbucks Corporation Form

74
reporting changes. Historical financial information presented herein reflects these changes. There was no impact on consolidated net revenues, total operating expenses, operating income, or net earnings as a result of these changes.
Beginning in the second quarter of fiscal 2013, we removed unallocated corporate expenses from Other. Other is now referred to as All Other Segments and includes Teavana, Seattle's Best Coffee and Evolution Fresh, as well as our Digital Ventures business. Unallocated corporate operating expenses, which pertain primarily to corporate administrative functions that support the operating segments but are not specifically attributable to or managed by any segment, are presented as a reconciling item between total segment operating results and consolidated financial results. While our consolidated results are not impacted, our historical segment financial information has been revised to be consistent with the current presentation.
AmericasAmericas operations sell coffee and other beverages, complementary food, packaged coffees, single serve coffee products and a focused selection of merchandise through company-operated stores and licensed stores. The Americas segment is our most mature business and has achieved significant scale.
Europe, Middle East, and AfricaEMEA operations sell coffee and other beverages, complementary food, packaged coffees, single serve coffee products and a focused selection of merchandise through company-operated stores and licensed stores. Certain markets within EMEA operations are in the early stages of development and require a more extensive support organization, relative to the current levels of revenue and operating income, than Americas.
China / Asia PacificChina /Asia Pacific operations sell coffee and other beverages, complementary food, packaged coffees, single serve coffee products and a focused selection of merchandise through company-operated stores and licensed stores. Certain markets within China / Asia Pacific operations are in the early stages of development and require a more extensive support organization, relative to the current levels of revenue and operating income, than Americas.
Channel DevelopmentChannel Development operations sell a selection of packaged coffees as well as a selection of premium Tazo® teas globally. Channel Development operations also produce and sell a variety of ready-to-drink beverages, Starbucks- and Tazo-branded single serve products, and Starbucks Refreshers™ beverages. The US foodservice business, which is included in the Channel Development segment, sells coffee and other related products to institutional foodservice companies.
All Other Segments
All Other Segments includes Teavana, Seattle's Best Coffee and Evolution Fresh, as well as our Digital Ventures business.
Consolidated revenue mix by product type (in millions):
Fiscal Year Ended Sep 29, 2013 Sep 30, 2012 Oct 2, 2011
Beverage $ 8,588.9 58% $ 7,838.8 59% $ 7,217.0 62%Food 2,424.6 16% 2,092.8 16% 2,008.0 17%Packaged and single serve coffees 2,166.5 15% 2,001.1 15% 1,451.0 12%
Other(1) 1,712.2 11% 1,366.8 10% 1,024.4 9%Total $ 14,892.2 100% $ 13,299.5 100% $ 11,700.4 100%
(1) Other includes royalty and licensing revenues, beverage-related ingredients, tea, packaging and other merchandise.
Information by geographic area (in millions):
Fiscal Year Ended Sep 29, 2013 Sep 30, 2012 Oct 2, 2011
Net revenues from external customers:United States $ 11,415.0 $ 10,177.5 $ 8,966.9Other countries 3,477.2 3,122.0 2,733.5Total $ 14,892.2 $ 13,299.5 $ 11,700.4
2013 10-KStarbucks Corporation Form

75
No customer accounts for 10% or more of our revenues. Revenues are shown based on the geographic location of our customers. Revenues from countries other than the US consist primarily of revenues from Canada, the UK, and China, which together account for approximately 64% of net revenues from other countries for fiscal 2013.
Fiscal Year Ended Sep 29, 2013 Sep 30, 2012 Oct 2, 2011
Long-lived assets:United States $ 4,641.3 $ 2,767.1 $ 2,587.1Other countries 1,404.0 1,252.5 978.4Total $ 6,045.3 $ 4,019.6 $ 3,565.5
Management evaluates the performance of its operating segments based on net revenues and operating income. The accounting policies of the operating segments are the same as those described in Note 1. Operating income represents earnings before net interest income and other, interest expense and income taxes. Management does not evaluate the performance of its operating segments using asset measures. The identifiable assets by segment disclosed in this note are those assets specifically identifiable within each segment and include cash, net property, plant and equipment, equity and cost investments, goodwill, and other intangible assets. Assets not identified by reportable operating segment below are corporate assets and are primarily comprised of cash and investments, assets of the corporate headquarters and roasting facilities, and inventory.
The table below presents financial information for our reportable operating segments and All Other Segments for the years ended September 29, 2013, September 30, 2012, and October 2, 2011 including the reclassifications discussed in Note 1 (in millions):
Americas EMEAChina /
Asia PacificChannel
DevelopmentAll OtherSegments
SegmentTotal
Fiscal 2013Total net revenues $ 11,000.8 $ 1,160.0 $ 917.0 $ 1,420.7 $ 393.7 $ 14,892.2Depreciation and amortization expenses 429.3 55.5 33.8 1.1 11.7 531.4Income/(loss) from equity investees 2.4 0.4 152.0 96.6 — 251.4Operating income/(loss) 2,365.2 64.2 321.2 415.5 (34.5) 3,131.6Total assets 2,323.4 510.6 805.0 89.2 821.1 4,549.3
Fiscal 2012Total net revenues $ 9,936.0 $ 1,141.3 $ 721.4 $ 1,292.2 $ 208.6 $ 13,299.5Depreciation and amortization expenses 392.4 57.1 23.2 1.3 2.5 476.5Income/(loss) from equity investees 2.1 0.3 122.4 85.2 0.7 210.7Operating income/(loss) 2,020.4 6.8 252.6 340.4 (27.4) 2,592.8Total assets 2,199.0 467.4 656.6 88.8 80.8 3,492.6
Fiscal 2011Total net revenues $ 9,065.0 $ 1,046.8 $ 552.3 $ 860.5 $ 175.8 $ 11,700.4Depreciation and amortization expenses 391.4 53.4 18.1 2.4 1.0 466.3Income/(loss) from equity investees 1.6 6.0 92.9 75.6 (2.4) 173.7Operating income/(loss) 1,775.2 38.9 191.3 283.5 (35.8) 2,253.1Total assets 1,841.9 398.2 540.0 54.7 44.8 2,879.6
2013 10-KStarbucks Corporation Form

76
The following table reconciles total segment operating income in the table above to consolidated earnings/(loss) before income taxes (in millions):
Fiscal Year Ended Sep 29, 2013 Sep 30, 2012 Oct 2, 2011
Total segment operating income $ 3,131.6 $ 2,592.8 $ 2,253.1Unallocated corporate operating expenses(1) (3,457.0) (595.4) (524.6)
Consolidated operating income/(loss) (325.4) 1,997.4 1,728.5Interest income and other, net 123.6 94.4 115.9Interest expense (28.1) (32.7) (33.3)Earnings/(loss) before income taxes $ (229.9) $ 2,059.1 $ 1,811.1
(1) Fiscal 2013 includes a pretax charge of $2,784.1 million resulting from the litigation charge we recorded associated with the conclusion of our arbitration with Kraft.
2013 10-KStarbucks Corporation Form

77
REPORT OF INDEPENDENT REGISTERED PUBLIC ACCOUNTING FIRM
To the Board of Directors and Shareholders of Starbucks CorporationSeattle, Washington
We have audited the accompanying consolidated balance sheets of Starbucks Corporation and subsidiaries (the “Company”) as of September 29, 2013 and September 30, 2012, and the related consolidated statements of earnings, comprehensive income, equity, and cash flows for each of the three years in the period ended September 29, 2013. These financial statements are the responsibility of the Company’s management. Our responsibility is to express an opinion on these financial statements based on our audits.
We conducted our audits in accordance with the standards of the Public Company Accounting Oversight Board (United States). Those standards require that we plan and perform the audit to obtain reasonable assurance about whether the financial statements are free of material misstatement. An audit includes examining, on a test basis, evidence supporting the amounts and disclosures in the financial statements. An audit also includes assessing the accounting principles used and significant estimates made by management, as well as evaluating the overall financial statement presentation. We believe that our audits provide a reasonable basis for our opinion.
In our opinion, such consolidated financial statements present fairly, in all material respects, the financial position of Starbucks Corporation and subsidiaries as of September 29, 2013 and September 30, 2012, and the results of their operations and their cash flows for each of the three years in the period ended September 29, 2013, in conformity with accounting principles generally accepted in the United States of America.
We have also audited, in accordance with the standards of the Public Company Accounting Oversight Board (United States), the Company’s internal control over financial reporting as of September 29, 2013, based on criteria established in Internal Control — Integrated Framework (1992) issued by the Committee of Sponsoring Organizations of the Treadway Commission and our report dated November 18, 2013 expressed an unqualified opinion on the Company’s internal control over financial reporting.
/s/ Deloitte & Touche LLP
Seattle, WashingtonNovember 18, 2013
2013 10-KStarbucks Corporation Form

78
Item 9. Changes in and Disagreements with Accountants on Accounting and Financial Disclosure
Not applicable.
Item 9A. Controls and Procedures
Disclosure Controls and Procedures
We maintain disclosure controls and procedures that are designed to ensure that material information required to be disclosed in our periodic reports filed or submitted under the Securities Exchange Act of 1934, as amended (the “Exchange Act”), is recorded, processed, summarized and reported within the time periods specified in the SEC’s rules and forms. Our disclosure controls and procedures are also designed to ensure that information required to be disclosed in the reports we file or submit under the Exchange Act is accumulated and communicated to our management, including our principal executive officer and principal financial officer as appropriate, to allow timely decisions regarding required disclosure.
During the fourth quarter of fiscal 2013, we carried out an evaluation, under the supervision and with the participation of our management, including our chief executive officer and our chief financial officer, of the effectiveness of the design and operation of our disclosure controls and procedures, as defined in Rules 13a-15(e) and 15d-15(e) under the Exchange Act. Based upon that evaluation, our chief executive officer and chief financial officer concluded that our disclosure controls and procedures were effective, as of the end of the period covered by this report (September 29, 2013).
There were no changes in our internal control over financial reporting (as defined in Rules 13a-15(f) and 15d-15(f) of the Exchange Act) during our most recently completed fiscal quarter that materially affected or are reasonably likely to materially affect internal control over financial reporting.
The certifications required by Section 302 of the Sarbanes-Oxley Act of 2002 are filed as exhibits 31.1 and 31.2, respectively, to this 10-K.
Report of Management on Internal Control over Financial Reporting
Our management is responsible for establishing and maintaining adequate internal control over financial reporting. Internal control over financial reporting is a process to provide reasonable assurance regarding the reliability of our financial reporting for external purposes in accordance with accounting principles generally accepted in the United States of America. Internal control over financial reporting includes maintaining records that in reasonable detail accurately and fairly reflect our transactions; providing reasonable assurance that transactions are recorded as necessary for preparation of our financial statements; providing reasonable assurance that receipts and expenditures are made in accordance with management authorization; and providing reasonable assurance that unauthorized acquisition, use or disposition of company assets that could have a material effect on our financial statements would be prevented or detected on a timely basis. Because of its inherent limitations, internal control over financial reporting is not intended to provide absolute assurance that a misstatement of our financial statements would be prevented or detected.
Management conducted an evaluation of the effectiveness of our internal control over financial reporting based on the framework and criteria established in Internal Control — Integrated Framework (the "1992 Framework"), issued by the Committee of Sponsoring Organizations of the Treadway Commission. This evaluation included review of the documentation of controls, evaluation of the design effectiveness of controls, testing of the operating effectiveness of controls and a conclusion on this evaluation. Based on this evaluation, management concluded that our internal control over financial reporting was effective as of September 29, 2013.
Our internal control over financial reporting as of September 29, 2013, has been audited by Deloitte & Touche LLP, an independent registered public accounting firm, as stated in their report which is included herein.
2013 10-KStarbucks Corporation Form

79
REPORT OF INDEPENDENT REGISTERED PUBLIC ACCOUNTING FIRM
To the Board of Directors and Shareholders of Starbucks CorporationSeattle, Washington
We have audited the internal control over financial reporting of Starbucks Corporation and subsidiaries (the “Company”) as of September 29, 2013, based on criteria established in Internal Control — Integrated Framework (1992) issued by the Committee of Sponsoring Organizations of the Treadway Commission. The Company’s management is responsible for maintaining effective internal control over financial reporting and for its assessment of the effectiveness of internal control over financial reporting, included in the accompanying Report of Management on Internal Control over Financial Reporting. Our responsibility is to express an opinion on the Company’s internal control over financial reporting based on our audit.
We conducted our audit in accordance with the standards of the Public Company Accounting Oversight Board (United States). Those standards require that we plan and perform the audit to obtain reasonable assurance about whether effective internal control over financial reporting was maintained in all material respects. Our audit included obtaining an understanding of internal control over financial reporting, assessing the risk that a material weakness exists, testing and evaluating the design and operating effectiveness of internal control based on the assessed risk, and performing such other procedures as we considered necessary in the circumstances. We believe that our audit provides a reasonable basis for our opinion.
A company’s internal control over financial reporting is a process designed by, or under the supervision of, the company’s principal executive and principal financial officers, or persons performing similar functions, and effected by the company’s board of directors, management, and other personnel to provide reasonable assurance regarding the reliability of financial reporting and the preparation of financial statements for external purposes in accordance with generally accepted accounting principles. A company’s internal control over financial reporting includes those policies and procedures that (1) pertain to the maintenance of records that, in reasonable detail, accurately and fairly reflect the transactions and dispositions of the assets of the company; (2) provide reasonable assurance that transactions are recorded as necessary to permit preparation of financial statements in accordance with generally accepted accounting principles, and that receipts and expenditures of the company are being made only in accordance with authorizations of management and directors of the company; and (3) provide reasonable assurance regarding prevention or timely detection of unauthorized acquisition, use, or disposition of the company’s assets that could have a material effect on the financial statements.
Because of the inherent limitations of internal control over financial reporting, including the possibility of collusion or improper management override of controls, material misstatements due to error or fraud may not be prevented or detected on a timely basis. Also, projections of any evaluation of the effectiveness of the internal control over financial reporting to future periods are subject to the risk that the controls may become inadequate because of changes in conditions, or that the degree of compliance with the policies or procedures may deteriorate.
In our opinion, the Company maintained, in all material respects, effective internal control over financial reporting as of September 29, 2013, based on the criteria established in Internal Control — Integrated Framework (1992) issued by the Committee of Sponsoring Organizations of the Treadway Commission.
We have also audited, in accordance with the standards of the Public Company Accounting Oversight Board (United States), the consolidated financial statements as of and for the fiscal year ended September 29, 2013, of the Company and our report dated November 18, 2013 expressed an unqualified opinion on those financial statements.
/s/ Deloitte & Touche LLP
Seattle, WashingtonNovember 18, 2013
2013 10-KStarbucks Corporation Form

80
Item 9B. Other Information
On November 15, 2013, Starbucks entered into Amendment No. 1 (the “Amendment”) to the Credit Agreement (the “Credit Agreement”) dated February 5, 2013 with Bank of America, N.A., in its capacity as Administrative Agent, Swing Line Lender and L/C Issuer and each of the other Lenders a party thereto.
The Amendment amends the Credit Agreement to exclude the impact of the litigation matter involving Kraft Foods Global, Inc., including but not limited to, the impact of fees, charges, reserves, costs or expenses related to the matter in an amount up to $2.9 billion commencing with the fiscal quarter ending September 29, 2013 and through and including all fiscal quarters ending on or before December 31, 2014. Starbucks previously disclosed that the arbitrator assigned to the matter has ordered Starbucks to pay Kraft $2.23 billion in damages plus prejudgment interest and attorneys' fees (the "Award"). Starbucks has estimated prejudgment interest and attorneys' fees to be approximately $557 million.
A copy of the Amendment is attached to this report as Exhibit 10.23 and is incorporated herein by reference as though it were fully set forth herein. The description above is a summary of the Amendment, does not provide a complete description of the Amendment, and is qualified in its entirety by the complete text of the Amendment itself.
2013 10-KStarbucks Corporation Form

81
PART III
Item 10. Directors, Executive Officers and Corporate Governance
Information regarding our executive officers is set forth in Item 1 of Part 1 of this Report under the caption “Executive Officers of the Registrant.”
We adopted a code of ethics applicable to our chief executive officer, chief financial officer, controller and other finance leaders, which is a “code of ethics” as defined by applicable rules of the SEC. This code is publicly available on our website at www.starbucks.com/about-us/company-information/corporate-governance. If we make any amendments to this code other than technical, administrative or other non-substantive amendments, or grant any waivers, including implicit waivers, from a provision of this code to our chief executive officer, chief financial officer or controller, we will disclose the nature of the amendment or waiver, its effective date and to whom it applies on our website at http://www.starbucks.com/about-us/company-information/corporate-governance or in a report on Form 8-K filed with the SEC.
The remaining information required by this item is incorporated herein by reference to the sections entitled “Proposal 1 — Election of Directors” and “Beneficial Ownership of Common Stock — Section 16(a) Beneficial Ownership Reporting Compliance,” “Corporate Governance — Board Committees and Related Matters” and “Corporate Governance — Audit Committee” in our definitive Proxy Statement for the Annual Meeting of Shareholders to be held on March 19, 2014 (the “Proxy Statement”).
Item 11. Executive Compensation
The information required by this item is incorporated by reference to the sections entitled “Executive Compensation,” “Compensation of Directors,” “Corporate Governance — Compensation Committee” and "Compensation Committee Report" in the Proxy Statement.
Item 12. Security Ownership of Certain Beneficial Owners and Management and Related Shareholder Matters
The information required by this item is incorporated by reference to the sections entitled “Equity Compensation Plan Information” and “Beneficial Ownership of Common Stock” in the Proxy Statement.
Item 13. Certain Relationships and Related Transactions, and Director Independence
The information required by this item is incorporated by reference to the section entitled “Certain Relationships and Related Transactions” and “Corporate Governance — Affirmative Determinations Regarding Director Independence and Other Matters” in the Proxy Statement.
Item 14. Principal Accounting Fees and Services
The information required by this item is incorporated by reference to the sections entitled “Independent Registered Public Accounting Firm Fees” and “Policy on Audit Committee Pre-Approval of Audit and Permissible Non-Audit Services of the Independent Registered Public Accounting Firm” in the Proxy Statement.
2013 10-KStarbucks Corporation Form

82
PART IV
Item 15. Exhibits, Financial Statement Schedules
(a) The following documents are filed as a part of this 10-K:
1. Financial Statements
The following financial statements are included in Part II, Item 8 of this 10-K:• Consolidated Statements of Earnings for the fiscal years ended September 29, 2013, September 30, 2012, and
October 2, 2011;• Consolidated Statements of Comprehensive Income for the years ended September 29, 2013, September 30, 2012, and
October 2, 2011;• Consolidated Balance Sheets as of September 29, 2013 and September 30, 2012;• Consolidated Statements of Cash Flows for the fiscal years ended September 29, 2013, September 30,
2012, and October 2, 2011;• Consolidated Statements of Equity for the fiscal years ended September 29, 2013, September 30, 2012, and October 2,
2011;• Notes to Consolidated Financial Statements; and• Reports of Independent Registered Public Accounting Firm
2. Financial Statement Schedules
Financial statement schedules are omitted because they are not required or are not applicable, or the required information is provided in the consolidated financial statements or notes described in Item 15(a)(1) above.
3. Exhibits
The Exhibits listed in the Index to Exhibits, which appears immediately following the signature page and is incorporated herein by reference, are filed as part of this 10-K.
2013 10-KStarbucks Corporation Form

83
SIGNATURES
Pursuant to the requirements of Section 13 or 15(d) of the Securities Exchange Act of 1934, the registrant has duly caused this report to be signed on its behalf by the undersigned, thereunto duly authorized.
STARBUCKS CORPORATION
By: /s/ Howard Schultz Howard Schultz
chairman, president and chief executive officer
November 18, 2013
POWER OF ATTORNEY
Know all persons by these presents, that each person whose signature appears below constitutes and appoints Howard Schultz and Troy Alstead, and each of them, as such person’s true and lawful attorneys-in-fact and agents, with full power of substitution and resubstitution, for such person and in such person’s name, place and stead, in any and all capacities, to sign any and all amendments to this Report, and to file the same, with all exhibits thereto, and other documents in connection therewith, with the Securities and Exchange Commission, granting unto said attorneys-in-fact and agents, and each of them, full power and authority to do and perform each and every act and thing requisite and necessary to be done in connection therewith, as fully to all intents and purposes as such person might or could do in person, hereby ratifying and confirming all that said attorneys-in-fact and agents, or any of them or their or such person’s substitute or substitutes, may lawfully do or cause to be done by virtue thereof.
Pursuant to the requirements of the Securities Exchange Act of 1934, this report has been signed below by the following persons on behalf of the registrant and in the capacities indicated as of November 18, 2013.
Signature Title
By: /s/ Howard Schultz chairman, president and chief executive officerHoward Schultz
By: /s/ Troy Alstead chief financial officer and group president, GlobalBusiness Services (principal financial officer and
principal accounting officer)Troy Alstead
By: /s/ William W. Bradley directorWilliam W. Bradley
By: /s/ Robert M. Gates directorRobert M. Gates
By: /s/ Mellody Hobson directorMellody Hobson
By: /s/ Kevin R. Johnson directorKevin R. Johnson
By: /s/ Olden Lee directorOlden Lee
2013 10-KStarbucks Corporation Form

84
Signature Title
By: /s/ Joshua Cooper Ramo directorJoshua Cooper Ramo
By: /s/ James G. Shennan, Jr. directorJames G. Shennan, Jr.
By: /s/ Clara Shih directorClara Shih
By: /s/ Javier G. Teruel directorJavier G. Teruel
By: /s/ Myron E. Ullman, III directorMyron E. Ullman, III
By: /s/ Craig E. Weatherup directorCraig E. Weatherup
2013 10-KStarbucks Corporation Form

85
INDEX TO EXHIBITS
Incorporated by Reference ExhibitNumber Exhibit Description Form File No. Date of Filing
ExhibitNumber
FiledHerewith
2.1 Agreement and Plan of Merger, datedas of November 14, 2012, amongStarbucks Corporation, TajAcquisition Corp. and TeavanaHoldings, Inc.
8-K 0-20322 11/15/2012 2.1
3.1 Restated Articles of Incorporation ofStarbucks Corporation
10-Q 0-20322 5/12/2006 3.1
3.2 Amended and Restated Bylaws ofStarbucks Corporation (As amendedand restated through November 13,2012)
10-K 0-20322 11/16/2012 3.2
4.1 Indenture, dated as of August 23,2007, by and between StarbucksCorporation and Deutsche Bank TrustCompany Americas, as trustee
S-3ASR 333-190955 9/3/2013 4.1
4.2 Form of Note for 6.25% Senior Notesdue 2017
8-K 0-20322 8/23/2007 4.2
4.3 Form of Supplemental Indenture for6.25% Senior Notes due 2017
8-K 0-20322 8/23/2007 4.3
4.4 Second Supplemental Indenture, datedas of September 6, 2013, by andbetween Starbucks Corporation andDeutsche Bank Trust CompanyAmericas, as trustee (3.850% SeniorNotes due October 1, 2023)
8-K 0-20322 9/6/2013 4.2
4.5 Form of 3.850% Senior Notes dueOctober 1, 2023
8-K 0-20322 9/6/2013 4.3
10.1* Starbucks Corporation Amended andRestated Key Employee Stock OptionPlan — 1994, as amended and restatedthrough March 18, 2009
8-K 0-20322 3/20/2009 10.2
10.2* Starbucks Corporation Amended andRestated 1989 Stock Option Plan forNon-Employee Directors
10-K 0-20322 12/23/2003 10.2
10.3* Starbucks Corporation 1991Company-Wide Stock Option Plan, asamended and restated throughMarch 18, 2009
8-K 0-20322 3/20/2009 10.3
10.3.1* Starbucks Corporation 1991Company-Wide Stock Option Plan —Rules of the UK Sub-Plan, asamended and restated throughNovember 20, 2003
10-K 0-20322 12/23/2003 10.3.1
10.4* Starbucks Corporation EmployeeStock Purchase Plan — 1995 asamended and restated through April 1,2009
10-Q 0-20322 2/4/2009 10.6
10.5 Amended and Restated Lease, datedas of January 1, 2001, between Firstand Utah Street Associates, L.P. andStarbucks Corporation
10-K 0-20322 12/20/2001 10.5
10.6* Starbucks Corporation ExecutiveManagement Bonus Plan, as amendedand restated effective November 8,2011
10-Q 0-20322 5/2/2012 10.2
2013 10-KStarbucks Corporation Form

86
Incorporated by Reference ExhibitNumber Exhibit Description Form File No. Date of Filing
ExhibitNumber
FiledHerewith
10.7* Starbucks Corporation ManagementDeferred Compensation Plan, asamended and restated effectiveJanuary 1, 2011
10-Q 0-20322 2/4/2011 10.2
10.8* Starbucks Corporation 1997 DeferredStock Plan
10-K 0-20322 12/23/1999 10.17
10.9 Starbucks Corporation UK Share SavePlan
10-K 0-20322 12/23/2003 10.9
10.10* Starbucks Corporation DirectorsDeferred Compensation Plan, asamended and restated effectiveSeptember 29, 2003
10-K 0-20322 12/23/2003 10.10
10.11* Starbucks Corporation DeferredCompensation Plan for Non-EmployeeDirectors, effective October 3, 2011
10-K 0-20322 11/18/2011 10.11
10.12* Starbucks Corporation UK ShareIncentive Plan, as amended andrestated effective November 14, 2006
10-K 0-20322 12/14/2006 10.12
10.13* Starbucks Corporation 2005 Long-Term Equity Incentive Plan, asamended and restated effectiveMarch 20, 2013
S-8 333-191512 10/1/2013 99.1
10.14* 2005 Key Employee Sub-Plan to theStarbucks Corporation 2005 Long-Term Equity Incentive Plan, asamended and restated effectiveNovember 15, 2005
10-Q 0-20322 2/10/2006 10.2
10.15* 2005 Non-Employee Director Sub-Plan to the Starbucks Corporation2005 Long-Term Equity IncentivePlan, as amended and restatedeffective September 13, 2011
10-K 0-20322 11/18/2011 10.17
10.16* Form of Stock Option GrantAgreement for Purchase of Stockunder the Key Employee Sub-Plan tothe 2005 Long-Term Equity IncentivePlan
10-Q 0-20322 5/2/2012 10.1
10.17* Form of Global Stock Option GrantAgreement for Purchase of Stockunder the Key Employee Sub-Plan tothe 2005 Long Term Equity IncentivePlan
__ __ __ __ X
10.18* Form of Stock Option GrantAgreement for Purchase of Stockunder the 2005 Non-EmployeeDirector Sub-Plan to the StarbucksCorporation 2005 Long-Term EquityIncentive Plan
8-K 0-20322 2/10/2005 10.5
10.19* Form of Restricted Stock Unit GrantAgreement under the 2005 Non-Employee Director Sub-Plan to theStarbucks Corporation 2005 Long-Term Equity Incentive Plan
10-K 0-20322 11/18/2011 10.20
2013 10-KStarbucks Corporation Form

87
Incorporated by Reference ExhibitNumber Exhibit Description Form File No. Date of Filing
ExhibitNumber
FiledHerewith
10.20* 2005 Company-Wide Sub-Plan to theStarbucks Corporation 2005 Long-Term Equity Incentive Plan, asamended and restated onSeptember 14, 2010
10-K 0-20322 11/22/2010 10.20
10.21* Form of Stock Option GrantAgreement for Purchase of Stockunder the 2005 Company-Wide Sub-Plan to the Starbucks Corporation2005 Long-Term Equity IncentivePlan
10-Q 0-20322 8/10/2005 10.2
10.22 Credit Agreement dated February 5,2013 among Starbucks Corporation,Bank of America, N.A., in its capacityas Administrative Agent, Swing LineLender and L/C Issuer, and the otherLenders from time to time a partythereto.
8-K 0-20322 2/8/2013 10.1
10.23 Amendment No.1 dated November 15,2013 to Credit Agreement datedFebruary 5, 2013 among StarbucksCorporation, Bank of America, N.A.,in its capacity as AdministrativeAgent, Swing Line Lender and L/CIssuer, and the other Lenders fromtime to time a party thereto.
__ __ __ __ X
10.24 Commercial Paper Dealer Agreementbetween Starbucks Corporation andBanc of America Securities LLC,dated as of March 27, 2007
8-K 0-20322 3/27/2007 10.1.1
10.25 Commercial Paper Dealer Agreementbetween Starbucks Corporation andGoldman, Sachs & Co., dated as ofMarch 27, 2007
8-K 0-20322 3/27/2007 10.1.2
10.26* Letter Agreement dated February 21,2008 between Starbucks Corporationand Clifford Burrows
10-Q 0-20322 5/8/2008 10.3
10.27* Letter Agreement dated November 6,2008 between Starbucks Corporationand Troy Alstead
8-K 0-20322 11/12/2008 10.1
10.28* Form of Time Vested Restricted StockUnit Grant Agreement (US) under theKey Employee Sub-Plan to the 2005Long-Term Equity Incentive Plan
10-K 0-20322 11/18/2011 10.30
10.29* Form of Time Vested GlobalRestricted Stock Unit GrantAgreement under the Key EmployeeSub-Plan to the 2005 Long-TermEquity Incentive Plan
__ __ __ __ X
2013 10-KStarbucks Corporation Form

88
Incorporated by Reference ExhibitNumber Exhibit Description Form File No. Date of Filing
ExhibitNumber
FiledHerewith
10.30* Form of Performance Based GlobalRestricted Stock Unit GrantAgreement under the Key EmployeeSub-Plan to the 2005 Long-TermEquity Incentive Plan
__ __ __ __ X
10.31* Letter Agreement dated November 30,2009 between Starbucks Corporationand John Culver
10-Q 0-20322 2/2/2010 10.3
10.32* Letter of Understanding dated May22, 2013, between StarbucksCorporation and Jeff Hansberry
__ __ __ __ X
10.33* Letter Agreement dated August 9,2011 between Starbucks Corporationand Michelle Gass
10-K 0-20322 11/18/2011 10.38
10.34* Letter Agreement dated September 16,2011 between Starbucks Corporationand Michelle Gass
10-K 0-20322 11/18/2011 10.39
12 Computation of Ratio of Earnings toFixed Charges
— — — — X
21 Subsidiaries of Starbucks Corporation — — — — X23 Consent of Independent Registered
Public Accounting Firm— — — — X
24 Power of Attorney (included on theSignatures page of this Annual Reporton Form 10-K)
__ __ __ __ X
31.1 Certification of Principal ExecutiveOfficer Pursuant to Rule 13a-14(a) ofthe Securities Exchange Act of 1934,As Adopted Pursuant to Section 302of the Sarbanes-Oxley Act of 2002
— — — — X
31.2 Certification of Principal FinancialOfficer Pursuant to Rule 13a-14(a) ofthe Securities Exchange Act of 1934,As Adopted Pursuant to Section 302of the Sarbanes-Oxley Act of 2002
— — — — X
32** Certifications of Principal ExecutiveOfficer and Principal Financial OfficerPursuant to 18 U.S.C. Section 1350,As Adopted Pursuant to Section 906of the Sarbanes-Oxley Act of 2002
101 The following financial statementsfrom the Company’s 10-K for thefiscal year ended September 29, 2013,formatted in XBRL: (i) ConsolidatedStatements of Earnings, (ii)Consolidated Statements ofComprehensive Income, (iii)Consolidated Balance Sheets, (iv)Consolidated Statements of CashFlows, (v) Consolidated Statements ofEquity, and (vi) Notes to ConsolidatedFinancial Statements
— — — — X
* Denotes a management contract or compensatory plan or arrangement.**Furnished herewith.
2013 10-KStarbucks Corporation Form

This page intentionally left blank.

This page intentionally left blank.

Board of Directors and Senior Leadership Team
Market Information
Board of Directors Howard Schultz
Starbucks Corporation, chairman, president and chief executive officer William W. Bradley
Allen & Company LLC, managing director Robert M. Gates
Former United States Secretary of DefenseMellody Hobson
Ariel Investments, LLC, president Kevin R. Johnson
Juniper Networks, Inc., retired chief executive officerOlden Lee
PepsiCo, Inc., retired executive Joshua Cooper Ramo
Kissinger Associates, Inc., vice chairmanJames G. Shennan, Jr.
Trinity Ventures, general partner emeritus Clara Shih
Hearsay Social, Inc., chief executive officer Javier G. Teruel
Colgate-Palmolive Company, retired vice chairman Myron E. Ullman, III
JC Penney Company, Inc., chief executive officerCraig E. Weatherup
Pepsi-Cola Company, retired chief executive officer
Senior Leadership Team Howard Schultz chairman, president and chief executive officer*
Troy Alstead chief financial officer and group president, Global Business Services*
Marissa Andrada senior vice president, Global Partner Resources
Adam Brotman executive vice president, chief digital officer
Clifford Burrows group president, Starbucks Coffee Americas, EMEA and Teavana*
Michael Conway executive vice president, Global Channel Development
John Culver group president, Starbucks Coffee China and Asia Pacific,
Channel Development and Emerging Brands*
Curtis Garner executive vice president, chief information officer
Jeff Hansberry president, Starbucks Coffee China and Asia Pacific*
Lucy Lee Helm executive vice president, general counsel and secretary*
Deverl Maserang executive vice president, Global Supply Chain
Sharon Rothstein executive vice president, global chief marketing officer
Arthur Rubinfeld chief creative officer, president, Global Innovation and Evolution Fresh Retail
Craig Russell senior vice president, Global Coffee
Matthew Ryan executive vice president, global chief strategy officer
Blair Taylor executive vice president, chief community officer and Global Partner Resources
Vivek Varma executive vice president, Public Affairs
*executive officer
Starbucks common stock is traded on the NASDAQ Global Select Market (“NASDAQ”), under the symbol SBUX. The following table shows the quarterly high and low sale prices per share of Starbucks common stock for each quarter during the last two fiscal years and the quarterly cash dividend declared per share of its common stock during the periods indicated:
Cash DividendsSeptember 29, 2013 High Low Declared
Fourth Quarter $77.84 $65.82 $0.26Third Quarter 67.48 56.65 0.21Second Quarter 58.97 52.39 0.21First Quarter 54.90 44.27 0.21
Cash DividendsSeptember 30, 2012 High Low Declared
Fourth Quarter $54.28 $43.04 $0.21Third Quarter 62.00 51.03 0.17Second Quarter 56.55 45.28 0.17First Quarter 46.50 35.12 0.17
The company’s U.S. Securities and Exchange Commission filings may be obtained without charge by accessing the Investor Relations section of the company’s website at http://investor.starbucks.com, at http://sec.gov, or by making a request to Investor Relations through the address, phone number or website listed below.
Starbucks Coffee Company Investor Relations, Mailstop: EX4 2401 Utah Avenue South Seattle, WA 98134 Phone: (206) 318-7118 [email protected] http://investor.starbucks.com
Independent Auditors Deloitte & Touche LLP
Transfer Agent Computershare PO Box 43078 Providence, RI 02940-3078 Phone: (888) 835-2866 https://www-us.computershare.com/investor
Annual Meeting of Shareholders March 19, 2014, 10:00 a.m. PDT Marion Oliver McCaw Hall Seattle, Washington Live webcast at: http://investor.starbucks.com
Global Responsibility Starbucks is committed to being a deeply responsible company in the communities where it does business around the world. The programs and goals that address these commitments are integral to the company’s overall business strategy and can be reviewed in the annual Global Responsibility report. Please see Starbucks fiscal 2013 Global Responsibility Report, available online this spring at http://www.starbucks.com/responsibility/global-report.
Updated Financial Information Please visit http://investor.starbucks.com to find the latest financial information publicly available for the company.
Keurig, the Cup and Star design, Keurig Brewed, K-Cup, and the Keurig brewer trade dress are trademarks of Keurig, Incorporated, used with permission. K-Cup® packs for use in Keurig® K-Cup® brewing systems.
© 2014 Starbucks Corporation. All rights reserved. SJBQ1140TH-01078 This Annual Report is printed on FSC-certified, recycled paper containing 100% post-consumer waste, and the Form 10-K is printed on FSC-certified, recycled paper containing 30% post-consumer waste, using Green-e certified renewable energy and processed chlorine-free. It was printed with soy-based inks, using wind power.
258490_Starbuck_CVR_R4.indd 2 1/10/14 7:34 PM

STARBUCKS CORPORATIONFiscal 2013 Annual Report
258490_Starbuck_CVR_R4.indd 1 1/10/14 7:34 PM