Fiscal Reforms during Fiscal Consolidation: The Case of Italy
29
FISCAL REFORMS DURING FISCAL CONSOLIDATION: THE CASE OF ITALY GIAMPAOLO ARACHI VALERIA BUCCI ERNESTO LONGOBARDI PAOLO PANTEGHINI MARIA LAURA PARISI SIMONE PELLEGRINO ALBERTO ZANARDI Working paper No. 2 - February 2012 DEPARTMENT OF ECONOMICS AND STATISTICS WORKING PAPER SERIES Quaderni del Dipartimento di Scienze Economico-Sociali e Matematico-Statistiche ISSN 2279-7114 Founded in 1404 UNIVERSITÀ DEGLI STUDI DI TORINO ALMA UNIVERSITAS TAURINENSIS
-
Upload
independent -
Category
Documents
-
view
1 -
download
0
Transcript of Fiscal Reforms during Fiscal Consolidation: The Case of Italy
FISCAL REFORMS DURING FISCAL
CONSOLIDATION: THE CASE OF ITALY
GIAMPAOLO ARACHI
VALERIA BUCCI
ERNESTO LONGOBARDI
PAOLO PANTEGHINI
MARIA LAURA PARISI
SIMONE PELLEGRINO
ALBERTO ZANARDI
Working paper No. 2 - February 2012
DEPARTMENT OF ECONOMICS AND STATISTICS
WORKING PAPER SERIES
Quaderni del Dipartimento di Scienze Economico-Sociali e Matematico-Statistiche
ISSN 2279-7114 Founded in 1404
UNIVERSITÀ DEGLI STUDI
DI TORINO
ALMA UNIVERSITAS TAURINENSIS
Fiscal Reforms during Fiscal Consolidation: The Case of Italy*
Giampaolo Arachi University of Salento, Italy
Valeria Bucci University of Salento, Italy
Ernesto Longobardi University of Bari, Italy
Paolo Panteghini University of Brescia, Italy
Maria Laura Parisi University of Brescia, Italy
Simone Pellegrino University of Torino, Italy
Alberto Zanardi University of Bologna, Italy
Abstract
In this paper we aim to discuss the strengths and weaknesses of the fiscal consolidation package adopted recently by the Italian Government in order to achieve a balanced budget by 2013. Revenues are forecasted to increase by more than 3.3 GDP percentage points; these stem mostly from indirect and property taxation. The analysis of the Italian case is interesting since it seems to be consistent with a recent strand of the literature which, in order to foster both short and long-term economic growth, advocated a shift of the tax burden from capital and labour income to consumption and property. Through a set of micro simulation models, this paper evaluates the effects of the Italian fiscal package on households and firms. We show that, in respect of households’ income, indirect and property tax reforms are highly regressive, whilst the reform makes limited resources available for growth enhancing policies (reduction in the effective corporate tax burden). Then, we propose an alternative fiscal package. We show that a less regressive reform on households can be obtained by shifting taxation from personal and corporate income tax to indirect taxation. Our proposal allows the tax burden on firms to be reduced substantially and, in the meantime, offers lower personal income tax rates on households in the lowest deciles of income distribution since they are penalized most by the increase in indirect taxation.
JEL Codes: H2, D22, D31
Keywords: Tax reforms, Fiscal consolidation, Micro simulation models, Italy
* We gratefully acknowledge financial support from Assolombarda.

1
1. Introduction
In recent years, a consensus has emerged amongst tax policy analysts that the tax
structure is relevant to countries’ economic performance. Taxes have been ranked
according to their distortion effect, whereby taxes on immobile property are the least
distortive followed by consumption taxes, personal income taxes and corporate income
taxes.
This consensus on the opportunity to introduce, along the lines described above, growth
oriented reforms in the tax system is reflected in Johansson et al. (2008)’s “tax and
growth” recommendations These can be summarized as follows: firstly, the
implementation of revenue-neutral reforms which shift the burden of taxation from
income to consumption and/or residential property; and secondly, the design of the tax
system being improved by broadening the tax base and, thereby, reducing tax rates and
strengthening the externality correction.
With regard to these recommendations, Italy is an important case study. On the basis of
the current legislation, general government net borrowing is expected to be 3.9 and 3.0
GDP percentage points respectively in 2011 and 2012. In order to achieve a balanced
budget by 2013, the Italian Government, starting from summer 2011, enacted three
important fiscal packages to change the economic situation by about 5 GDP percentage
points. These measures included significant adjustments to both revenue and
expenditure. Focusing on revenue, fiscal reforms enhanced both indirect and property
taxation. Growth enhancing measures included, also, a reduction in corporate taxation.
There were no relevant changes to taxation of personal income.
This paper evaluates the economic effects of these reforms from the perspective of both
households and firms. We show that indirect and property tax reforms are highly
regressive in respect of households’ incomes whilst the reform made available limited
resources for growth enhancing policies (reduction in effective corporate tax burden). In
order to overcome these shortcomings, we propose an alternative tax package which
provides for a different shift in tax between indirect and corporate taxation.
The remainder of the paper is organized as follows. Section 2 sets out the relevant
issues concerning the effects of tax reforms during an economic crisis. In Section 3,
focusing in particular on tax measures, we discuss the strengths and weaknesses of the
2
Italian Government’s fiscal consolidation packages, enacted in 2011, in order to achieve
a balanced budget by 2013. The first part of Section 4 presents the data and the micro
simulation models which we used to evaluate the effects of these tax reforms on
households and firms. In the second part, we present the results of these evaluations.
Section 5 describes our alternative set of tax reforms and presents the relevant effects.
Section 6 presents our conclusions.
2. Tax Reforms in the Crisis
Since the outbreak of the financial crisis in September 2008, the tax system has been the
subject of a heated policy debate which evolved through three phases1. In the first phase,
in the aftermath of the crisis, the main question was whether the tax system had played
any role in triggering the crisis. During 2009 and 2010 the debate focused on the role
which taxes could play in policy response. A number of special taxes were proposed
and introduced to recover the costs of the ‘bailout’ in several countries. These involved
both special taxes on financial institutions and taxes on bonuses. The debate
highlighted, also, that taxation might be used as a corrective instrument to complement
prudential regulation of the banking sector. Some corrective tax proposals aimed to
curtail activity in the financial sector (‘Tobin taxes’) on the grounds that a large number
of transactions were either speculative or of no social use. To date, no international
consensus has emerged concerning the most appropriate approach (Alworth and Arachi,
2012). As suggested by numerous past experiences, without some global coordination,
such measures would create inevitably competitive distortions across countries and
market segments. The crisis has drawn attention, also, to a number of well-known
weaknesses in the taxation of the banking sector, particularly in respect of loan loss
provisioning; the relationship between financial and tax accounting; mark-to-market
accounting; and value added taxation. These issues were by no means new. The crisis
has added saliency to finding longer-term solutions. However, after renewed attention to
these questions, no longer does the political climate appear propitious to address the
needed structural reforms. 1 The first two phases of the debate are illustrated by Alworth and Arachi (2012).
3
The latter phase, beginning in 2010, has been characterized by the problem of fiscal
consolidation especially in Europe. The massive and unprecedented fiscal interventions
and stimulus packages, which were deployed to counter the economic downturn, have
had an impressive impact on EU Member States’ public finances. In 2009, the EU wide
deficit peaked at 6.8% of GDP (up from 0.8% of GDP before the crisis); stayed at a
similar level in 2010 (6.4% of GDP); before declining slightly. It was projected that
public debt would increase continuously from 59 % of GDP in 2007 to 83.3% in 2012
(Prammer, 2011). There has been an ongoing debate on the most appropriate exit
strategy but the magnitude of the sums at stake has suggested that a taxation
contribution might be inevitable. Indeed, the majority of the EU Member States have
increased their taxes in a wide range of categories which have resulted in an overall
increase in the tax burden (Prammer, 2011).
In this new scenario, the most pressing question was whether or not the negative effects
of the tax increase on economic growth could be limited by shifting the tax burden
between different tax bases.
For countries within the Euro area, the economic literature provides some guidance with
reference to counter-cyclical policies. These countries cannot use the nominal exchange
rate depreciation as a means to boosting external demand but they can achieve the same
goal through an “internal” or “fiscal” devaluation. In the short run, with fixed nominal
wages, a cut in employers’ social contributions lowers the labour costs relative to
foreign prices as measured in domestic currency in the same way as nominal exchange-
rate devaluation (Calmfors, 1993). If the government budget is balanced by raising the
tax burden on workers and households or by reducing public expenditure, there are no
direct effects on aggregate demand and the final outcome is a devaluation of the real
exchange rate. The similarity between an “external” and an “internal” exchange rate
devaluation is most clear when the reduction in social contributions is financed by an
increase in taxes on labour income such as a employee contributions, personal income
tax or VAT. In both cases, employees experience a loss in purchasing power in terms of
imports. At the same time, to the extent that lower labour costs are reflected in lower
prices for domestically produced commodities, the purchasing power in terms of
domestic goods remains unchanged. Quite surprisingly, the empirical literature on the
“internal devaluation” was rather narrow but the available evidence suggested that, with
4
sizeable short-run effects, a shift from social contributions to VAT might improve the
trade balance (Alworth and Arachi 2010, de Mooij and Keen 2011, Franco 2011).
The conclusions of the economic literature on the relationship between the tax structure
and long-term growth were less clear-cut2. However in recent years, a consensus has
emerged amongst tax policy experts on ranking taxes according to their impact on
growth (Johansson et al., 2008, Prammer, 2011). Taxes on immobile property have been
considered the least harmful to long-term growth followed by consumption taxes,
personal income taxes and corporate income taxes. In the first place, this ranking
reflects the international mobility of the different tax bases. Corporation income tax is
the most vulnerable to the effects of increased openness and to tax competition amongst
countries. Labour income is certainly less mobile, especially within Europe, although
immigrants and high skilled workers from third world countries are more mobile. The
base of VAT is relatively immobile when levied at the point of purchase. Finally,
immobile property is affected least by economic globalization.
Beside international mobility, the ranking of taxes reflects the common wisdom on their
economic effects: capital income taxes (especially those levied on a source base) are
seen as highly detrimental to growth since they might reduce capital accumulation.
Although the relevance of their effects is debatable and not uniform across individual
workers (Micheletto and Sonedda, 2011) taxes on labour income have been considered
always harmful since they discourage both labour participation (the so called extensive
margin) and the number of hours worked (the intensive margin). Consumption taxes are
considered more conductive to growth to the extent that their bases are broader than
labour income (so that the same revenue can be raised by lower tax rates) and that they
are not progressive. Furthermore, consumption taxes may be designed to correct some
externalities (environment taxes) or to reduce the distortion on the supply of labour
(differential taxation of goods which are complements to labour) and, consequently,
improve the efficiency of the tax system.
The most straightforward policy prescription would be an increase in property taxes.
However, it would be unlikely that this would change significantly the structure of the
existing tax system. In 2009, property taxes accounted for only 5% of total revenue in
2 For recent reviews, see Micheletto and Sonedda (2011) and Prammer (2011).
5
OECD countries (OECD 2011). Any significant increase would face severe
administrative and political obstacles such as the assessment of the true property value;
taxpayers’ liquidity constraints; and the widespread belief that residence as a primary
good should not be taxed or should be taxed only at a low rate. A similar argument
applies to environmental taxes. Although they can play a greater role, the main revenue
source, i.e. the excise tax on fossil fuels, is already quite heavy in most EU countries
and, consequently, offers limited scope for further increases.
For these reasons, the fiscal devaluation, i.e. a reduction in non-wage labour costs
through a tax shift from labour income and, especially from social security contributions
compensated by an increase in VAT, seems the most viable option not only to boost
demand in the short run but, also, to make the tax system more conducive to growth in
the long-run. Indeed, since the outbreak of the financial crisis, the clearest trend,
amongst EU Member States, has been the increase in VAT standard rates.
Consequently, over the period from 2008 to 2011, the weighted EU average VAT rate
increased by 1.3 percentage points to 20.7% (Prammer, 2011). This resulted in a (albeit
modest) shift in the composition of the overall tax burden from labour and capital
towards consumption and environmental taxation.
3. Fiscal Consolidation and Tax Reforms in Italy
3.1. Government Objectives and Strategy
Compared to other EU counties, Italy has a long-lasting record of sluggish economic
growth and high public debt. In Italy between 2008 and 2010 GDP fell on average by
1.7 a year against -0.6 in the Euro Area and almost zero in Germany. In the same
period, public debt to GDP ratio grew everywhere in Europe but in Italy reached 119%
which was almost 40% higher than what was recorded on average in the Euro area and
43% more than Germany. At the beginning of 2011, the Italian economy’s prospects
were no more favourable. The Italian Government estimated a GDP growth of 1.1% in
2011 (1.0% below the Euro area) whereas, for the period between 2012 and 2014, GDP
was pegged to increase at an average of 1.5% per year. As for public finance public
debt, it was estimated to increase further to 120% of GDP in 2011. Given this scenario,
6
it was clear why, in 2011, the Italian Government’s policy agenda was dominated by the
need for stronger fiscal consolidation measures but without restraining economic
growth.
Under the Euro Plus Pact guidelines, in the Stability programme submitted to European
Commission in April 2011 the Italian Government committed itself to meeting the
medium-term objective of balancing the budget by 2014. In order to deliver this goal,
the Government adopted in July 2011 a fiscal adjustment package which included
measures for 48 billion euro (over the period from 2012 to 2014). In mid August,
following tensions in financial markets and the increasing difference in the spread
between Italian Treasury bonds and those issued by other countries in the Euro Area,
the Government agreed an additional package which raised the overall correction to
59.8 billion This was to achieve a balanced budget in 2013, a year earlier than initially
predicted. The July-August stabilization package included measures aimed at both
curtailing public spending and increasing revenues. On the revenue side, the package
provided for an increase in the ordinary VAT rate by one percentage point; a reform of
taxation on financial income; harsher penalties for tax evasion; higher taxes on energy
companies; and new revenues from excise duties.
No more than three months later, the worsening economic outlook and a further increase
in interest payments on public debt forced the new Government, appointed last
November, to approve in December an additional wave of fiscal consolidation measures
required to confirm the balanced budget target in 2013. In addition to steps aimed at
reducing pension expenditure and cutting local government transfers, this new package,
on the revenue side, provided for the strengthening of the real estate tax at Municipal
level; higher excise taxes on fuels; tax surcharges on luxury items; and higher taxes on
financial assets. The overall strategy included, also, a number of growth-enhancing
measures (partly implemented already in the December package and partly to be
deployed in the following months) ranging from infrastructure investments to
liberalization and deregulation initiatives and, finally, to tax reforms. In particular, the
latter included corporate tax benefits in the case of recapitalization and tax deductions
from Regional Business Tax in the case of the employment of young workers and
women. Overall, the 2012-2014 fiscal package provided a cumulative adjustment of
7
81.3 billion euro (5 GDP percentage points), of which 54 billion euro related to
measures on taxation (3.3 GDP percentage points).
3.2. Main Tax Measures and Budgetary Impact
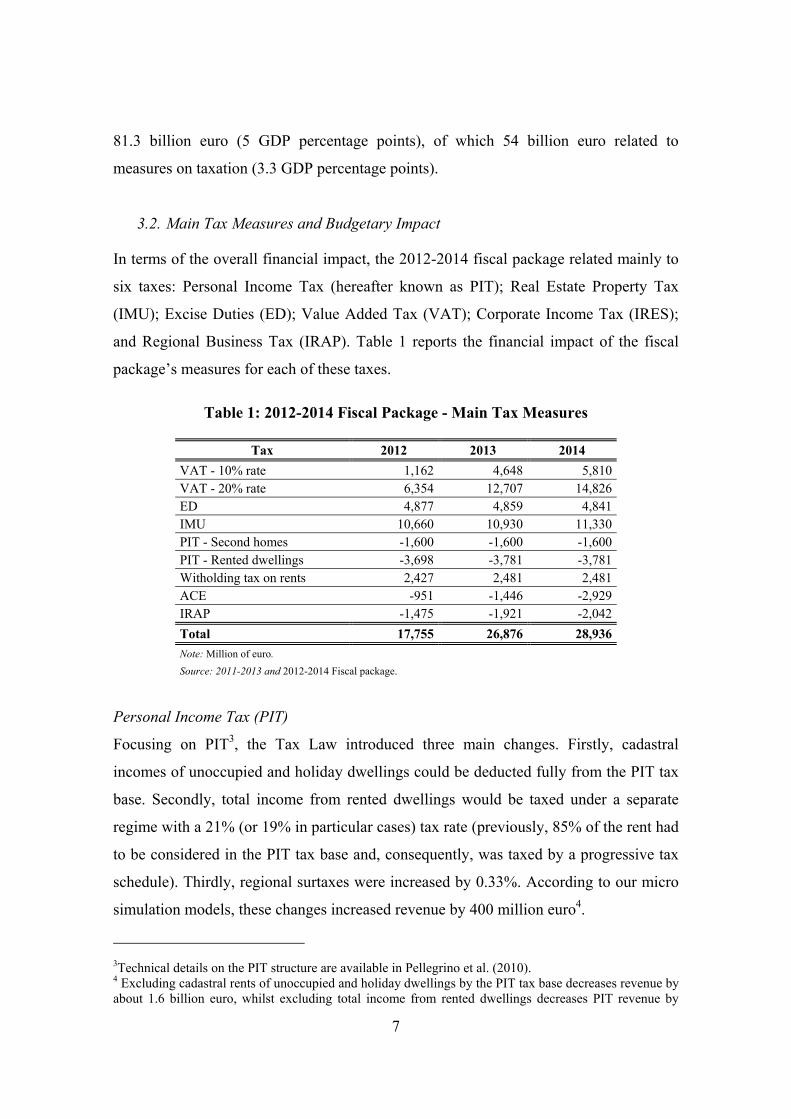
In terms of the overall financial impact, the 2012-2014 fiscal package related mainly to
six taxes: Personal Income Tax (hereafter known as PIT); Real Estate Property Tax
(IMU); Excise Duties (ED); Value Added Tax (VAT); Corporate Income Tax (IRES);
and Regional Business Tax (IRAP). Table 1 reports the financial impact of the fiscal
package’s measures for each of these taxes.
Table 1: 2012-2014 Fiscal Package - Main Tax Measures
Tax 2012 2013 2014 VAT - 10% rate 1,162 4,648 5,810 VAT - 20% rate 6,354 12,707 14,826 ED 4,877 4,859 4,841 IMU 10,660 10,930 11,330 PIT - Second homes -1,600 -1,600 -1,600 PIT - Rented dwellings -3,698 -3,781 -3,781 Witholding tax on rents 2,427 2,481 2,481 ACE -951 -1,446 -2,929 IRAP -1,475 -1,921 -2,042 Total 17,755 26,876 28,936 Note: Million of euro. Source: 2011-2013 and 2012-2014 Fiscal package.
Personal Income Tax (PIT)
Focusing on PIT3, the Tax Law introduced three main changes. Firstly, cadastral
incomes of unoccupied and holiday dwellings could be deducted fully from the PIT tax
base. Secondly, total income from rented dwellings would be taxed under a separate
regime with a 21% (or 19% in particular cases) tax rate (previously, 85% of the rent had
to be considered in the PIT tax base and, consequently, was taxed by a progressive tax
schedule). Thirdly, regional surtaxes were increased by 0.33%. According to our micro
simulation models, these changes increased revenue by 400 million euro4.
3Technical details on the PIT structure are available in Pellegrino et al. (2010). 4 Excluding cadastral rents of unoccupied and holiday dwellings by the PIT tax base decreases revenue by about 1.6 billion euro, whilst excluding total income from rented dwellings decreases PIT revenue by
8
Real Estate Property Tax (IMU)
Property Tax was modified greatly. Until now, dwellings, other than the main residence,
were subject to a tax rate ranging between 4 and 7 per thousand (6.1 per thousand on
average), whilst the main residence was completely exempt (unless classified as luxury
home). Simply, the tax base was derived by multiplying the cadastral income by 100.
The 2012-2014 Tax law increased both the rate of tax (.76 per thousand) and the
multiplier (160 instead of 100). Moreover, the main residence cadastral income was no
longer exempt: the tax rate became 4 per thousand and a tax credit was allowed5. Our
simulations show that the expected revenue increase for households is about 4.8 billion
euro: 2.6 billion on main residences and about 2.2 billion on dwellings other than the
main residence6.
Value Added Tax (VAT)
Up to September 2011, the standard rate of VAT was 20%, whilst reduced rates were 10
and 4%. Then, by October 2012, the standard rate would increase to 23%; the 10% tax
rate would increase to 12%; whilst the 4 % rate would increase to 5%. By 2014, these
standard and reduced tax rates would increase to 23.5% and 12.5 respectively.
According to our micro simulation models, in respect to the 4, 10 and 20% tax rates7,
the 2014 tax schedule increases VAT paid by households by 11.4 billion euro.
about 3.8 billion euro. Taxing rents under a separate regime at 21% (or 19%) increases revenue by about 2.5 billion euro. Finally, the increased Regional surtax increases revenue by about 2.5 million euro. 5 Tax credit is 200 euro for each dwelling, and increases by 50 euro for each son within the household (up to 400 euro). 6 According to the Ministry of Economy and Finance, the reorganization of the Real Estate taxation enhances revenue by about 11 billion euro. The total number of real estate is about 65 million; our micro simulation model focuses only on dwellings owned by households; these represent almost a half of the total number of real estate (29.5 million dwellings). 7 The Ministry of Economy and Finance’s latest data available showed that the 2008 VAT revenue was about 111 billion euro, whilst a one percentage point increase of the standard rate and the 10% tax rate would increase revenues by about 4.2 and 2.3 billion euro respectively. The overall increase of VAT rates increases revenues by 16.4 billion euro. Focusing on households, our estimates, which are based on the Italian Institute of Statistics survey on households consumption, indicate that VAT paid by households. was about 62 billion euro, whilst a one percentage point increase of the standard rate would increase revenue by 2.3 billion euro.
9
Excise Duties (ED)
Also, excise duties on transport fuels have been increased considerably. Up to 2011,
.583 euro per litre was applied to fuel, and 0.442 to gas oil. By 2012, these duties would
be increased to 0.7047 and 0.5932 respectively. Our simulations show that increased ED
revenue paid by households would be about 2.9 billion euro8.
Corporate Income Tax (IRES)
Fiscal packages introduced the so called “Aiuto alla Crescita Economica” (Aid to
Economic Growth) aimed at stimulating companies’ capitalization. This relief shares
not only the acronym but, also, the main characteristics of the British ACE (see IFS,
1991). Under both systems, a company would be entitled to deduct an allowance (ACE)
for equity. This allowance is calculated by applying an imputation (or notional) rate to
the equity invested in the company. Under this tax scheme, companies’ earnings are
split thus into two components. Firstly, there is an imputed return on new investments
financed with equity capital (called the “ordinary return”) which is calculated by
applying a nominal interest rate to equity capital. Secondly, there is the residual taxable
profit, namely profit less ordinary return. The ordinary return, which is approximating
the opportunity cost of new equity capital, is exempt at a corporate level. Only the latter
component is taxed at the corporate income tax rate.9 Therefore, by ensuring the
deduction of both interest expenses and the imputed income of equity capital, ACE
reduces (or even eliminates) the tax advantage of financed debt and encourages a
company to retain profit or issue new equity.
Regional Business Tax (IRAP)
Since the introduction of IRAP in 1998, several deductions and allowances have been
introduced in the computation of the IRAP tax base in order to reduce the burden of the
tax on labour costs10. Following the same strategy, the 2011 Tax Reform increased the
lump sum amount which could be deducted for every female worker and for every
8 According to the Ministry of Economy and Finance, ED revenue increases by about 4.8 billion euro. 9 For further details on these rules, see: Bordignon et al. (1999, 2001) and Panteghini (2001). 10 For example, base the contributions for compulsory industrial insurances; the social security contributions relative to permanent employees; and the expenses relative to apprentices, etc. are deductible from the IRAP tax.
10
worker younger than 35 years. Moreover, the Tax Reform allowed companies to deduct
from the corporate tax (IRES, the share of the Regional Business Tax relative to the
labour costs, net of the other existing deductions).
Having defined the institutional details of the overall tax package for 2011-2014 and, in
light of the recent literature identifying a ranking of taxes according to their distortion
effect and impact on growth potential stimulus, we evaluated the economic effects of
the package. As pointed out, the least distortive taxes seemed to be those on immobile
property and consumption, whilst the most distortive ones were the personal and
corporate income taxes. The Italian tax package followed these guidelines whilst
increasing overall tax GDP ratio from 42 to 44%. In order for reform to succeed, the
negative effects of the tax increase had to be compensated by a balanced tax shift
between property and consumption tax and income taxes which were able to enhance
economic growth. According to the Government, the twofold aim of ACE was not only
to facilitate the capitalization of businesses but, also, to encourage new investment by
reducing the cost of capital11. For this reason, the Government decided to anticipate the
introduction of this ACE device which was provided already by a delegated law under
the Parliament’s scrutiny.
4. The Economic Effects of the Tax Package
In order to estimate the effects of the 2012-2014 fiscal package, we used a collection of
micro simulation models on the taxes referred to in section 3.2.
Through an analysis of households, we aimed to investigate by decile of equivalent
households gross income the changes in average tax rate before and after the tax
packages. These results helped our understanding of the dimension and the distribution
of the tax shift. Our analysis on firms was twofold: firstly, we evaluated the tax changes
on grounds of both efficiency and equity and, secondly, we analyzed their effects by
size of firm, geographic area and economic sector.
11 As stressed by the Government, Italian companies have a relatively high leverage (about 1.5, as compared with 0.6 in France and 0.7 in Spain). Moreover, they are subject to an effective tax rate which is well above the EU average (i.e. 27.4% against an EU average of 21.8%). According to the Government, therefore, the introduction of an ACE would both reduce the tax burden and encourage a rebalancing of their capital structure.
11
4.1. Micro simulation Model and Data
4.1.1. Households
As for taxes on households, we used an updated version of the micro simulation model
described in Pellegrino et al. (2011). It estimated all the Italian tax system’s most
important direct taxes on income and wealth. As for input data, the model considered
the Bank of Italy’s 2010 Survey on Household Income and Wealth (hereafter known as
SHIW) which contained information on household post-tax income and wealth in 2008.
The sample was representative of the Italian population (Bank of Italy, 2010). The
SHIW did not contain detailed information on the households’ consumption;
consequently, in order to evaluate consumption taxation, we matched the SHIW with
the Italian Institute of Statistics (hereafter ISTAT) dataset on households’
consumption12.
In order to evaluate average tax rate changes, we considered household gross income
defined as the sum of gross PIT income, family benefits, incomes exempt from taxation,
gross incomes from financial assets, and gross incomes taxed under a separate regime.
We did not include imputed rents in the definition of gross income. We obtained the
household equivalent gross income by adopting the Cutler Scale13.
4.1.2. Firms
As for taxes on firms, we developed a micro simulation model which estimated the
amount of tax on corporate income paid by incorporated firms. The model was based on
accounting data from the AIDA Bureau van Dijk database. Our sample, which included
69.550 companies (8.5% of the total number of firms), was restricted to firms which had
balance sheet data for the 2006 and 2008 fiscal years.
In order to evaluate the overall fiscal package, we performed three different simulations.
Firstly, we estimated the reduction in tax due to the introduction of the ACE (without
taking into account the newly introduce IRAP). Secondly, we calculated the tax
12We wish to thank Massimo Baldini for provided us the matching programme based on the psmatch2 STATA command. 13 The Cutler scale is defined as: ( )68.33. CA NNCS += where AN and CN are respectively the number of adults and children (individual within the household aged 17 or less) within each household and we chose the parameters in order to minimize re-ranking according to the 2008 tax rules.
12
reduction due to the deductibility of the IRAP (in the absence of ACE) and, finally, we
simulated the combined effect of ACE and IRAP deductibility.
The ACE will be effective from the fiscal period ongoing from December 31, 2012 and
we evaluated the increase in the firm’s equity with regard to the amount recorded at
December 31, 2010. 2008 was the most recent year in our sample. Accordingly, we
used the increase of the equity invested into the company between 2006 and 2008. The
increase of the equity invested into the company was given by the sum of the variations
of share capital, premium reserves, revaluation reserves, legal reserves, reserves for own
shares and other reserves. Then, the ordinary return was calculated by applying a
nominal interest rate to equity capital. Using the income before tax as tax base, we
computed the tax bill, in the absence of ACE, by multiplying the tax bases by the
statutory IRES tax rate which was equal to 27.5%. Using as the tax base the difference
between the income before tax and the ordinary return we computed the tax bill, in the
presence of ACE, by multiplying the tax base by 27.5%. Then, we obtained the tax loss
due to the introduction of ACE which was the difference between these respective tax
bills.
To compute the effect of the deductibility of the IRAP relative to the labor cost from
IRES, we had to evaluate the amount of deductions of labour cost from which the
companies benefitted. When such information was unavailable in the balance sheet, we
computed this amount using the income tax return data provided by the Ministry of
Economy and Finance. In particular, we assigned to each company in the sample an
amount of deduction of labour cost which was equal to the mean of the mean value of
deduction from which all the companies in the same economic sectors, in the same
region and in same value class of production benefitted. We subtracted this amount
from the total labour cost and obtained the amount of labour cost net of the different
existing deductions. Applying the IRAP tax rate14 to this share of labour cost, we
obtained the amount of Regional Income Tax deductible from the IRES.
Using the income before tax as the tax base, we computed the tax bill, in the absence of
deductibility of IRAP, by multiplying the tax bases by 27.5%. Using the difference
14 The regional IRAP rate was assigned to each company, taking into account the possible increase or reduction existing for some economic sectors.
13
between the income before tax and the amount of IRAP deductible as tax base, we
computed the tax bill, in the presence of ACE, by multiplying the tax base by 27.5%.
Then, we obtained the tax loss due to the deductibility of IRAP as difference between
these different tax bills. Finally, using the income before tax as the tax base we
computed the tax bill, in the absence of both ACE and the deductibility of IRAP, by
multiplying the tax bases by 27.5%. Using the difference between the income before tax
and the ordinary return and the amount of IRAP deductible as the tax base, we
computed the tax bill, in the presence of both ACE and the deductibility of IRAP, by
multiplying the tax base by 27.5%. We computed the combined effect of the two fiscal
reforms as the difference between these tax bills.
4.2. Results
4.2.1. Households
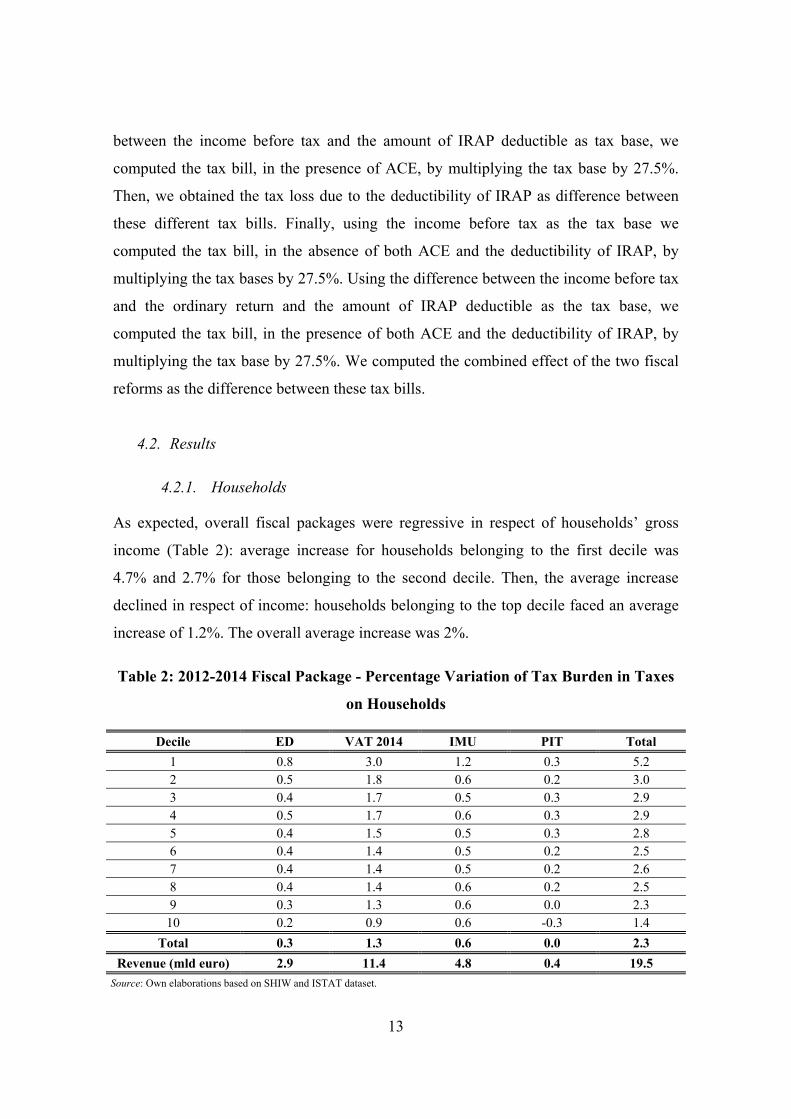
As expected, overall fiscal packages were regressive in respect of households’ gross
income (Table 2): average increase for households belonging to the first decile was
4.7% and 2.7% for those belonging to the second decile. Then, the average increase
declined in respect of income: households belonging to the top decile faced an average
increase of 1.2%. The overall average increase was 2%.
Table 2: 2012-2014 Fiscal Package - Percentage Variation of Tax Burden in Taxes
on Households
Decile ED VAT 2014 IMU PIT Total 1 0.8 3.0 1.2 0.3 5.2 2 0.5 1.8 0.6 0.2 3.0 3 0.4 1.7 0.5 0.3 2.9 4 0.5 1.7 0.6 0.3 2.9 5 0.4 1.5 0.5 0.3 2.8 6 0.4 1.4 0.5 0.2 2.5 7 0.4 1.4 0.5 0.2 2.6 8 0.4 1.4 0.6 0.2 2.5 9 0.3 1.3 0.6 0.0 2.3
10 0.2 0.9 0.6 -0.3 1.4 Total 0.3 1.3 0.6 0.0 2.3
Revenue (mld euro) 2.9 11.4 4.8 0.4 19.5 Source: Own elaborations based on SHIW and ISTAT dataset.
14
The most regressive impact was due to VAT followed by IMU and ED tax schedule
reform. Changes to the PIT structure produced an almost proportional increase of the
average tax rate, even if top deciles faced a lower increase and the top one a decrease of
about .3%. This figure was clearly due to the change in taxation of cadastral rents of
unoccupied and holiday dwellings (fully deductible from the PIT tax base) and total
income from rented dwellings (taxed under a separate regime).
4.2.2. Firms
In order to evaluate the impact of the fiscal package, we described the change in two
different measures of the effective tax burden. The first one was a forward-looking
effective marginal tax rate (EMTR)15, calculated using the approach described by
Bordignon et al. (1999). The second was a backward looking measure of the average tax
rate calculated as the ratio between taxes and pre-tax profits.
In the measurement of the EMTR, we omitted, for simplicity, personal taxation16: this
enabled us to compare our figures with those obtained by Bordignon et al. (2000)17.
For this purpose, we let i be the market interest rate. Denoting t, tr and ρ as respectively
the corporate income tax rate, the IRAP rate and the ACE imputation rate, we were able
to write the user cost of capital as follows:
p =i+[itr/(1- tr-t)]+i(1-σ)[1-(ρ/i)] [t/(1- tr-t)] 1)
Where σ was the portion of investment financed through debt. As explained in
Bordignon et al. (1999), the term, itr/(1- tr-t), measured the real distortion caused by the
IRAP. Moreover, the term, i(1-σ)[1-(ρ/i)] [t/(1- tr-t)], was an additional distortion due to
the absence of fully debt finance. As can be seen, this term increased in the ratio (1-σ)
15 The quality of results would not change if we focused on effective average tax rates: see Bordignon et al. (2001). 16 Notice that the role of personal taxation is highly controversial in a small open economy since its effect depends on international tax arbitrage operations and on the characteristics of shareholders; the tax treatment of foreign income; and the size of the economy. Moreover, as shown by Bordignon et al. (2000), extending the analysis to personal taxation did not change the picture significantly. 17 We disregarded the earning-stripping rule and a lump deduction of interest expenses from IRAP since to account for both rules we should have introduced additional assumptions regarding a company’s financial statement.Since 2008, Italy has moved from a thin-cap rule to a earning-stripping rule, designed to fight tax avoidance. Under the existing rule (similar to the one in force in Germany), interest payments exceeding 30% of EBITDA (Earnings Before Interest Taxes Depreciation and Amortization) are non-deductible. Moreover, starting from the fiscal year in progress at December 31, 2008, taxpayers could deduct 10% of IRAP liability as a lump sum portion of interest expense and similar charges. Whilst the former device reduces the tax advantage of debt finance, the latter has the opposite effect.
15
(i.e., the portion of new investment financed through equity issues or retained profit). Of
course, the higher the imputation rate ρ became, this tax distortion became smaller18.
Using standard techniques (à la la King and Fullerton, 1984), we were able now to
calculate the EMTR as follows:
EMTR=(p-i)/i 2)
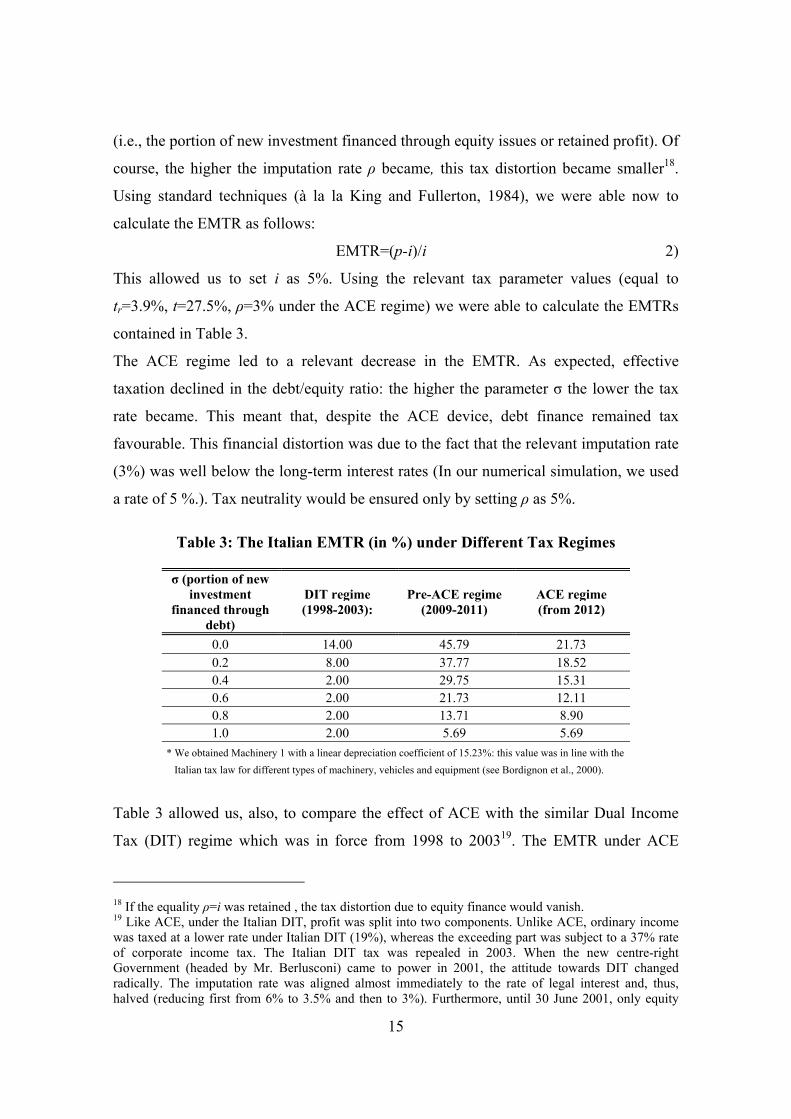
This allowed us to set i as 5%. Using the relevant tax parameter values (equal to
tr=3.9%, t=27.5%, ρ=3% under the ACE regime) we were able to calculate the EMTRs
contained in Table 3.
The ACE regime led to a relevant decrease in the EMTR. As expected, effective
taxation declined in the debt/equity ratio: the higher the parameter σ the lower the tax
rate became. This meant that, despite the ACE device, debt finance remained tax
favourable. This financial distortion was due to the fact that the relevant imputation rate
(3%) was well below the long-term interest rates (In our numerical simulation, we used
a rate of 5 %.). Tax neutrality would be ensured only by setting ρ as 5%.
Table 3: The Italian EMTR (in %) under Different Tax Regimes
σ (portion of new investment
financed through debt)
DIT regime (1998-2003):
Pre-ACE regime (2009-2011)
ACE regime (from 2012)
0.0 14.00 45.79 21.73 0.2 8.00 37.77 18.52 0.4 2.00 29.75 15.31 0.6 2.00 21.73 12.11 0.8 2.00 13.71 8.90 1.0 2.00 5.69 5.69
* We obtained Machinery 1 with a linear depreciation coefficient of 15.23%: this value was in line with the Italian tax law for different types of machinery, vehicles and equipment (see Bordignon et al., 2000).
Table 3 allowed us, also, to compare the effect of ACE with the similar Dual Income
Tax (DIT) regime which was in force from 1998 to 200319. The EMTR under ACE
18 If the equality ρ=i was retained , the tax distortion due to equity finance would vanish. 19 Like ACE, under the Italian DIT, profit was split into two components. Unlike ACE, ordinary income was taxed at a lower rate under Italian DIT (19%), whereas the exceeding part was subject to a 37% rate of corporate income tax. The Italian DIT tax was repealed in 2003. When the new centre-right Government (headed by Mr. Berlusconi) came to power in 2001, the attitude towards DIT changed radically. The imputation rate was aligned almost immediately to the rate of legal interest and, thus, halved (reducing first from 6% to 3.5% and then to 3%). Furthermore, until 30 June 2001, only equity
16
were higher than DIT despite the fact that between 1998 and 2012 the statutory rates
declined substantially (The IRES rate declined from 33% to 27.5% and the IRAP rate
declined from 4.25% to 3.9 %.). This was partially due to the low ACE imputation rate
and the repeal of accelerated depreciation in 2008.
Calculated through the micro simulation model described in section 4.1.2, Table 4
illustrates the impact of the overall fiscal package on the effective average tax burden of
firms. The effective tax burden, measured here, was the ratio between taxes and pre-tax
accounting profits. The simulation captured the effect of the tax package on tax paid in
the first year after it was introduced. We took into account the changes in taxes due
currently which will change future tax payments through loss and ACE carry-forwards.
As a consequence, the estimated tax change for firms with losses is zero.
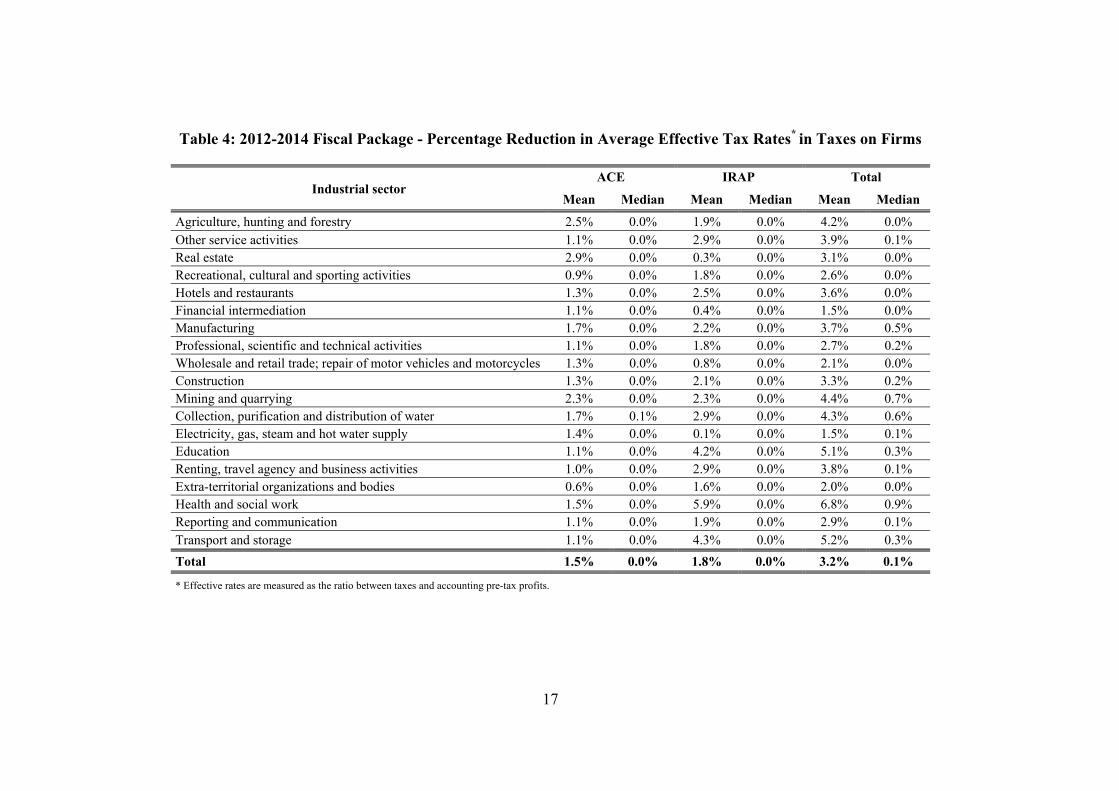
The simulation results show that the mean reduction of the average effective tax rate,
brought about by two main provisions of the tax package for firms, was equal to 3.2%.
The introduction of ACE and the partial deduction of IRAP contributed to the total
reduction in a similar way (1.5% and 1.8% respectively). However, the distribution of
the reduction in the tax rate is not uniform across industrial sectors, reflecting the
uneven distribution of the ACE base and labour costs. Capital intensive sectors such as
manufacturing; mining; and collection, purification and distribution of water benefitted
relatively more than average from the introduction of ACE. Probably, the results
overestimate the even higher reduction recorded by the real estate sector (2.9%). We
based the calculation of the ACE allowance on the increase in equity between 2006 and
2008; this was particularly strong in the real estate sector due to the booming housing
prices.
As to the effect of the partial deduction of IRAP from corporate tax, the reduction of the
average tax rate is higher in the labour-intensive sectors such as education (4.2%),
health (5.9%) and transport and storage (4.3%).
increases were relevant to calculating the incentive. The cut in the imputation rate and the "freezing" of the benefit were clear signals of the future abandonment of the DITS which occurred at the end of 2003.
17
Table 4: 2012-2014 Fiscal Package - Percentage Reduction in Average Effective Tax Rates* in Taxes on Firms
Industrial sector ACE IRAP Total
Mean Median Mean Median Mean Median
Agriculture, hunting and forestry 2.5% 0.0% 1.9% 0.0% 4.2% 0.0% Other service activities 1.1% 0.0% 2.9% 0.0% 3.9% 0.1% Real estate 2.9% 0.0% 0.3% 0.0% 3.1% 0.0% Recreational, cultural and sporting activities 0.9% 0.0% 1.8% 0.0% 2.6% 0.0% Hotels and restaurants 1.3% 0.0% 2.5% 0.0% 3.6% 0.0% Financial intermediation 1.1% 0.0% 0.4% 0.0% 1.5% 0.0% Manufacturing 1.7% 0.0% 2.2% 0.0% 3.7% 0.5% Professional, scientific and technical activities 1.1% 0.0% 1.8% 0.0% 2.7% 0.2% Wholesale and retail trade; repair of motor vehicles and motorcycles 1.3% 0.0% 0.8% 0.0% 2.1% 0.0% Construction 1.3% 0.0% 2.1% 0.0% 3.3% 0.2% Mining and quarrying 2.3% 0.0% 2.3% 0.0% 4.4% 0.7% Collection, purification and distribution of water 1.7% 0.1% 2.9% 0.0% 4.3% 0.6% Electricity, gas, steam and hot water supply 1.4% 0.0% 0.1% 0.0% 1.5% 0.1% Education 1.1% 0.0% 4.2% 0.0% 5.1% 0.3% Renting, travel agency and business activities 1.0% 0.0% 2.9% 0.0% 3.8% 0.1% Extra-territorial organizations and bodies 0.6% 0.0% 1.6% 0.0% 2.0% 0.0% Health and social work 1.5% 0.0% 5.9% 0.0% 6.8% 0.9% Reporting and communication 1.1% 0.0% 1.9% 0.0% 2.9% 0.1% Transport and storage 1.1% 0.0% 4.3% 0.0% 5.2% 0.3% Total 1.5% 0.0% 1.8% 0.0% 3.2% 0.1%
* Effective rates are measured as the ratio between taxes and accounting pre-tax profits.
18
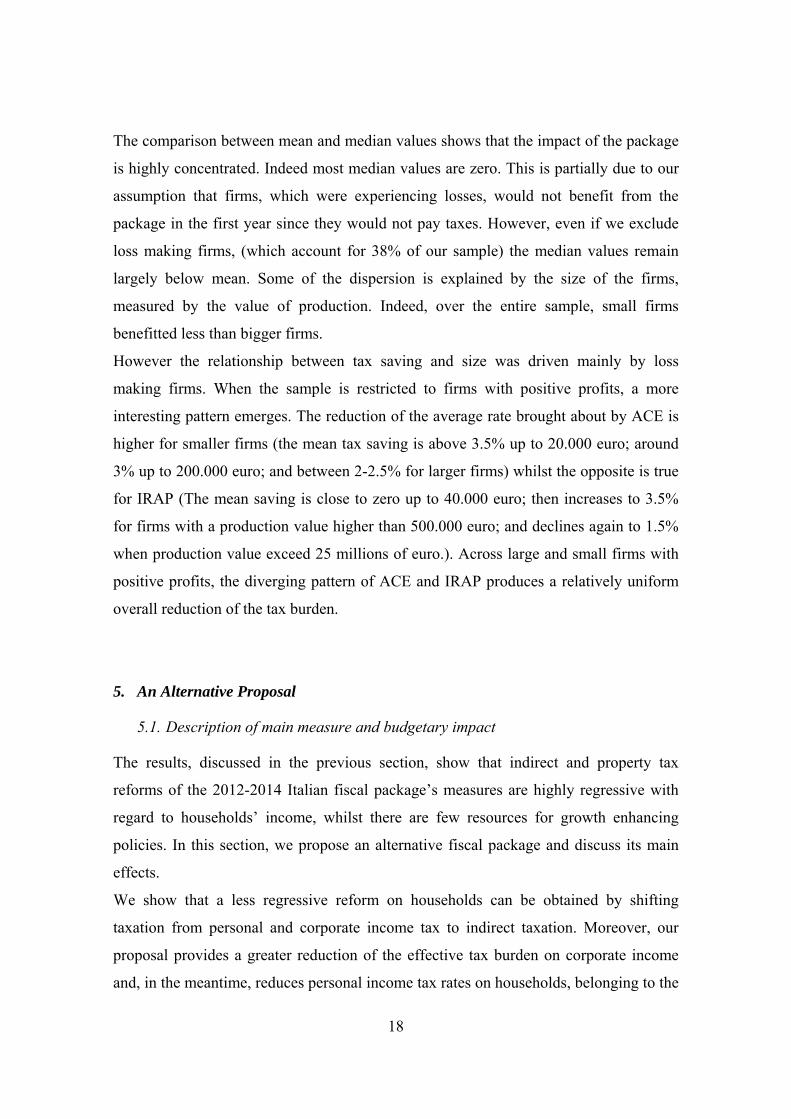
The comparison between mean and median values shows that the impact of the package
is highly concentrated. Indeed most median values are zero. This is partially due to our
assumption that firms, which were experiencing losses, would not benefit from the
package in the first year since they would not pay taxes. However, even if we exclude
loss making firms, (which account for 38% of our sample) the median values remain
largely below mean. Some of the dispersion is explained by the size of the firms,
measured by the value of production. Indeed, over the entire sample, small firms
benefitted less than bigger firms.
However the relationship between tax saving and size was driven mainly by loss
making firms. When the sample is restricted to firms with positive profits, a more
interesting pattern emerges. The reduction of the average rate brought about by ACE is
higher for smaller firms (the mean tax saving is above 3.5% up to 20.000 euro; around
3% up to 200.000 euro; and between 2-2.5% for larger firms) whilst the opposite is true
for IRAP (The mean saving is close to zero up to 40.000 euro; then increases to 3.5%
for firms with a production value higher than 500.000 euro; and declines again to 1.5%
when production value exceed 25 millions of euro.). Across large and small firms with
positive profits, the diverging pattern of ACE and IRAP produces a relatively uniform
overall reduction of the tax burden.
5. An Alternative Proposal
5.1. Description of main measure and budgetary impact
The results, discussed in the previous section, show that indirect and property tax
reforms of the 2012-2014 Italian fiscal package’s measures are highly regressive with
regard to households’ income, whilst there are few resources for growth enhancing
policies. In this section, we propose an alternative fiscal package and discuss its main
effects.
We show that a less regressive reform on households can be obtained by shifting
taxation from personal and corporate income tax to indirect taxation. Moreover, our
proposal provides a greater reduction of the effective tax burden on corporate income
and, in the meantime, reduces personal income tax rates on households, belonging to the

19
first part of income distribution, since they are affected most by indirect taxation
reform.
5.2. Economic evaluation
5.2.1. Households
In order both to reduce the regressive impact of Italian Government reforms and to
strengthen the tax shift from households to firms, we considered an alternative scenario
focused on VAT and PIT. On the contrary, we propose a zero ED increase in respect of
the 2011 structure and the same reform of dwelling taxation. With regard to the 2012-
2014 fiscal package’s measures, this alternative scenario increases revenues, which are
paid by households, by about 3 billion euro and improves the redistributive effect of the
overall tax system.
Whilst we considered a very different tax structure for PIT, we introduced, in particular,
a rate schedule of 4%, 14% and 24% for VAT. We reduced both the number of brackets
(from 5 to 4) and the first two tax rates (from 23% to 22% and from 27% to 26%
respectively), whilst we increased the last two tax rates (from 38% to 40% and from
41% to 46% respectively) (see Table 5). Moreover, we considered both cadastral
incomes and rents in the definition of the PIT tax base; regional surtaxes were not
increased, differently from in 2012-14 fiscal package; the tax credit for earned income
were considerably augmented for lower incomes20. On the contrary, tax credits and
allowances for tax expenditures would be cut by 5% for incomes lower than 25
thousand euro and, then, would decrease and become zero for incomes greater than 50
thousand euro. Finally, we introduced a negative income tax: whenever gross tax
liability was lower than tax credits for earned incomes and for the type of relationship,
75% of the difference would become a cash transfer.
20 It decreases in respect of income and becomes zero for incomes greater than 45 thousand euro (55 thousand euro with the actual tax schedule).
20
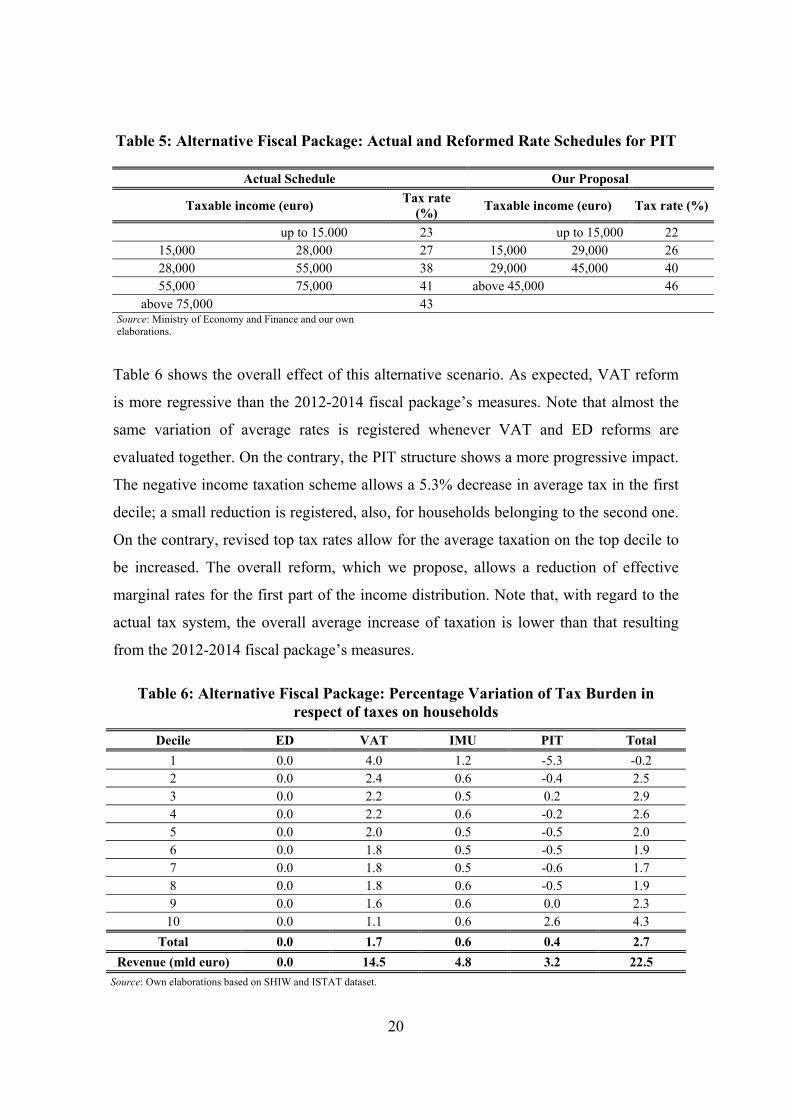
Table 5: Alternative Fiscal Package: Actual and Reformed Rate Schedules for PIT
Actual Schedule Our Proposal
Taxable income (euro) Tax rate (%) Taxable income (euro) Tax rate (%)
up to 15.000 23 up to 15,000 22 15,000 28,000 27 15,000 29,000 26 28,000 55,000 38 29,000 45,000 40 55,000 75,000 41 above 45,000 46
above 75,000 43 Source: Ministry of Economy and Finance and our own elaborations.
Table 6 shows the overall effect of this alternative scenario. As expected, VAT reform
is more regressive than the 2012-2014 fiscal package’s measures. Note that almost the
same variation of average rates is registered whenever VAT and ED reforms are
evaluated together. On the contrary, the PIT structure shows a more progressive impact.
The negative income taxation scheme allows a 5.3% decrease in average tax in the first
decile; a small reduction is registered, also, for households belonging to the second one.
On the contrary, revised top tax rates allow for the average taxation on the top decile to
be increased. The overall reform, which we propose, allows a reduction of effective
marginal rates for the first part of the income distribution. Note that, with regard to the
actual tax system, the overall average increase of taxation is lower than that resulting
from the 2012-2014 fiscal package’s measures.
Table 6: Alternative Fiscal Package: Percentage Variation of Tax Burden in respect of taxes on households
Decile ED VAT IMU PIT Total 1 0.0 4.0 1.2 -5.3 -0.2 2 0.0 2.4 0.6 -0.4 2.5 3 0.0 2.2 0.5 0.2 2.9 4 0.0 2.2 0.6 -0.2 2.6 5 0.0 2.0 0.5 -0.5 2.0 6 0.0 1.8 0.5 -0.5 1.9 7 0.0 1.8 0.5 -0.6 1.7 8 0.0 1.8 0.6 -0.5 1.9 9 0.0 1.6 0.6 0.0 2.3
10 0.0 1.1 0.6 2.6 4.3 Total 0.0 1.7 0.6 0.4 2.7
Revenue (mld euro) 0.0 14.5 4.8 3.2 22.5 Source: Own elaborations based on SHIW and ISTAT dataset.

21
5.2.2. Firms
Section 4.2.2 illustrates the 2012-2014 fiscal package’s twofold effect on firms: firstly,
a reduction in the EMTR and, secondly, a reduction in the average tax burden. We have
documented that, whilst the first effect is substantial, the second one, albeit not
negligible, is relatively modest and highly concentrated. In particular, given that both
ACE and the deduction of IRAP work through the income tax, the package does not
provide immediate relief for the firms which have been hit by the economic crisis and
are experiencing losses. For this reason, our proposal aims at increasing the reduction of
average tax rates especially for loss making firms, whilst maintaining the effect of the
2012-2014 fiscal package on EMTR. To this aim, we suggest 1) using the entire stock
of equity, and not the increase since 2010, as the base for ACE and 2) reducing IRAP by
deducting 30% of labour costs, instead of allowing to partially deduce it from the
income tax base Furthermore, we propose the elimination of the earning stripping rule
since it works pro-cyclically by increasing the tax burden when firms experience a fall
in revenue.
The impact of our proposal on the EMTR is almost equivalent to the 2012-2014 fiscal
package. The calculations in section 4.2.2 do not depend on whether the ACE is based
on the existing or increased equity stock. The removal of the earning stripping rule
would have an impact through reducing the EMTR for debt-financed investments.
Table 7, which contains the results of our simulations, illustrates the effects of our
proposal on average effective rates. The Table contains negative rates as the reduction
of IRAP and, to a lesser extent, the removal of the earning stripping rule brings about a
reduction in taxes even for firms with accounting losses. The tax reduction is still
asymmetric (mean values are higher than median) since median values are generally
different to zero for ACE and IRAP. Median values remain zero for the removal of the
earning stripping rule (ESR column). This does not come as a surprise since the rule
aims to curtail abnormal interest expenses.
In order to clarify the effects of the proposal, Table 8 reports the changes in average
effective rates with reference to firms which have positive pre-tax incomes.

22
Table 7: Alternative Fiscal Package - Percentage Reduction in Average Effective Tax Rates* in Taxes on Firms
Industrial sector ACE ESR IRAP
Mean Median Mean Median Mean Median
Agriculture, hunting and forestry 31.9% 0.3% 56.9% 0.0% 27.9% 0.0% Other service activities 4.2% 0.3% 2.1% 0.0% -10.9% 0.9% Real estate 6.3% 0.2% -295.0% 0.0% -0.4% 0.0% Recreational, cultural and sporting activities 5.9% 0.1% 12.9% 0.0% - 0.0% Hotels and restaurants 7.7% 0.1% -1.5% 0.0% 1.7% 0.0% Financial intermediation 5.8% 0.4% -2.5% 0.0% 2.8% 0.1% Manufacturing 5.3% 0.5% 8.5% 0.0% 2.1% 2.0% Professional, scientific and technical activities 14.0% 0.5% 5.0% 0.0% 9.5% 0.4% Wholesale and retail trade; repair of motor vehicles and motorcycles 7.5% 0.5% 5.7% 0.0% 6.7% 0.8% Construction 15.9% 0.4% 57.4% 0.0% 4.9% 0.1% Mining and quarrying 5.6% 0.6% 2.5% 0.0% 12.2% 1.6% Collection, purification and distribution of water 8.4% 0.8% 3.9% 0.0% 15.2% 1.6% Electricity, gas, steam and hot water supply 9.2% 0.5% -69.9% 0.0% 1.1% 0.0% Education 8.8% 0.4% 3.2% 0.0% 43.8% 1.2% Renting, travel agency and business activities 11.3% 0.4% 7.0% 0.0% 7.0% 1.3% Extra-territorial organizations and bodies 2.9% 0.2% 3.1% 0.0% 4.6% 0.0% Health and social work 6.2% 0.4% 22.5% 0.0% 9.9% 2.9% Reporting and communication 9.1% 0.5% 1.1% 0.0% 196.0% 1.6% Transport and storage 11.8% 0.4% 3.5% 0.0% -10.6% 2.4% Total 9.4% 0.4% -16.6% 0.0% -18.7% 0.5%
* Effective rates are measured as the ratio between taxes and accounting pre-tax profits.

23
Table 8: Alternative Fiscal Package - Percentage Reduction in Average Effective Tax Rates* in Taxes on Firms with Positive Pre-Tax Income
Industrial sector ACE ESR IRAP
Mean Median Mean Median Mean Median
Agriculture, hunting and forestry 53.8% 3.2% 104.0% 0.0% 68.0% 3.7% Other service activities 6.5% 1.0% 4.1% 0.0% 12.0% 4.5% Real estate 10.2% 1.1% 100.0% 0.0% 1.5% 0.0% Recreational, cultural and sporting activities 10.2% 1.2% 35.6% 0.0% 10.7% 2.2% Hotels and restaurants 13.7% 1.1% 9.0% 0.0% 29.1% 5.4% Financial intermediation 8.0% 0.9% 3.0% 0.0% 5.9% 1.1% Manufacturing 7.3% 1.0% 21.7% 0.0% 23.0% 4.3% Professional, scientific and technical activities 18.8% 1.0% 38.7% 0.0% 16.4% 1.7% Wholesale and retail trade; repair of motor vehicles and motorcycles 10.5% 1.2% 17.7% 0.0% 16.4% 2.5% Construction 22.7% 0.9% 144.0% 0.0% 14.3% 2.3% Mining and quarrying 7.8% 1.9% 4.5% 0.0% 19.7% 3.9% Collection, purification and distribution of water 10.6% 1.4% 6.3% 0.0% 22.0% 3.0% Electricity, gas, steam and hot water supply 12.0% 1.2% 4.8% 0.0% 2.6% 0.3% Education 12.5% 0.9% 8.4% 0.0% 72.6% 5.0% Renting, travel agency and business activities 16.3% 0.9% 12.9% 0.0% 26.8% 4.7% Extra-territorial organizations and bodies 5.2% 1.2% 8.7% 0.0% 10.6% 1.0% Health and social work 8.3% 1.0% 43.3% 0.0% 93.3% 6.7% Reporting and communication 12.1% 1.0% 4.3% 0.0% 267.0% 3.4% Transport and storage 17.1% 1.0% 6.4% 0.0% 38.6% 6.7% Total 13.5% 1.0% 48.2% 0.0% 32.2% 2.6%
* Effective rates are measured as the ratio between taxes and accounting pre-tax profits.

24
Mean and median tax reductions are substantially higher than in the actual 2012-14
package. Median values show that the majority of firms experience a significant
reduction (around 3-4%) in the tax burden due to the deduction of 30% of labour costs
from the IRAP tax base. To the extent that the reduction in the tax burden on labour
translates into lower prices for domestically produced goods, it will compensate
(partially) for the increase of VAT and, thus, realizing a “fiscal devaluation”.
6. Concluding Remarks
This paper evaluated the economics effects of the tax measures enacted by the Italian
Government as a part of the fiscal consolidation strategy aimed at achieving a balanced
budget in 2013. In order to limit negative effects on economic growth this tax reform,
consistently with recent suggestions in the economic literature, included some elements
of fiscal devaluation through a tax shift from labour income compensated by an increase
in VAT and real estate property taxation. By using a collection of micro-simulation
models we showed that this tax strategy had a strong regressive impact on households’
income, whereas the reform made limited resources available for growth enhancing
policies (reduction in corporate tax). We investigated whether these shortcomings could
be overcome by an alternative approach. We showed that a less regressive reform on
households could be achieved by shifting taxation from personal and corporate income
tax to indirect taxation. Our proposal allows the tax burden on firms to be reduced
substantially and, in the meantime, enables lower personal income tax rates on
households in the lowest deciles of income distribution since they are penalized most
penalized by the increase in indirect taxes.
25
References
Affuso A. and Nannariello G. (2011), Incentivi alle imprese: una quantificazione delle
risorse, EyesReg, N. 3., September.
Alwoth J. and Arachi G. (2010), “Taxation policy in EMU” in Buti M., S. Deroose, V.
Gaspar, J. Nogueria Martins, (eds.) Euro-The First Decade, Cambridge University
Press, Cambridge, Chapter 15, pp. 557-596.
Alworth J. and Arachi G. (2012), (eds.) Taxation and the Financial Crisis, Oxford,
Oxford University Press.
Bank of Italy (2010), Household Income and Wealth in 2008, Supplements to the
Statistical Bulletin, Vol. XX (New Series), n. 8.
Bordignon M., Giannini S. and Panteghini P.M. (1999), Corporate Taxation in Italy:
The 1998 Reform, Finanzarchiv, 56, pp. 335-362.
Bordignon M., Giannini S. and Panteghini P.M. (2000), Reforming Business Taxation:
Lessons from Italy?, University of Brescia, Discussion Paper n. 0005.
Bordignon M., Giannini S. and Panteghini P.M. (2001), Reforming Business Taxation:
Lessons from Italy?, International Tax and Public Finance, 8, pp. 191-210.
Calmfors L., (1993), Lessons from the Macroeconomic Experience of Sweden,
European Journal of Political Economy 9.1 (1993): pp. 25-72.
de Mooij R. and Keen M. (2011), Tax reform and fiscal policy, International Monetary
Fund, mimeo.
de Mooij R. (2011), Tax Biases to Debt Finance: Assessing the Problem, Finding
Solutions, International Monetary Fund, Fiscal Affairs Department.
Franco, F. (2011), Adjustment to External Imbalances within the EMU: the Case of
Portugal, University of Lisbon, mimeo.
IFS Capital Taxes Group (1991), Equity for Companies: A Corporation Tax for the
1990s, A Report of the IFS Capital Taxes Group, chaired by M. Gammie, The
Institute for Fiscal Studies, Commentary 26, London.
Johansson A, C., Heady, J., Arnold, B., Brys and L. Vartia (2008): Tax and Economic
Growth, OECD Economics Department Working Papers, No. 620, OECD
Publishing.

26
King M.A. and Fullerton D. (1984), The Taxation of Income from Capital: A
Comparative Study of the United States, the United Kingdom, Sweden and West
Germany, Chicago: University of Chicago Press.
Micheletto L. and Sonedda (2011), Taxes on labour income: a review of the literature,
Rivista di Diritto Finanziario e Scienza delle Finanze, forthcoming.
Panteghini P.M. (2001), Dual Income Taxation: The Choice of the Imputed Rate of
Return, Finnish Economic Papers, 14, pp. 5-13.
Pellegrino S., Piacenza M., Turati G. (2011), Developing a static micro simulation
model for the analysis of housing taxation in Italy, International Journal of Micro
simulation, 4(2), 73-85.
Pellegrino S., Vernizzi A. (2010), The Decomposition of the Redistributive Effect and
the Issue of Close Equals Identification, Department of Economics and Public
Finance “G. Prato” Working Paper Series, WP n. 16.
Prammer, D. (2011), Quality of taxation and the crisis: Tax shifts from a growth
perspective, Taxation Papers 29, Directorate General Taxation and Customs Union,
European Commission.

DEPARTMENT OF ECONOMICS AND STATISTICS UNIVERSITY OF TORINO
Corso Unione Sovietica 218 bis - 10134 Torino (ITALY) Web page: http://esomas.econ.unito.it/