
Openness, Economic Reforms, and Poverty: Globalization in Developing Countries
Upload
independentCategory
view
3download
0
Economic Reforms in India since 1991: Has Gradualist ApproachWorked?
By Vadapalli.Tilak Kumar, India was a latecomer to economic reforms, embarking on theprocess in earnest only in 1991, in the wake of anexceptionally severe balance of payments crisis. The need fora policy shift had become evident much earlier, as manycountries in east Asia achieved high growth and povertyreduction through policies which emphasized greater exportorientation and encouragement of the private sector. Indiatook some steps in this direction in the 1980s, but it was notuntil 1991 that the government signaled a systemic shift to amore open economy with greater reliance upon market forces, alarger role for the private sector including foreigninvestment, and a restructuring of the role of government. India’s economic performance in the post-reforms period hasmany positive features. The average growth rate in the tenyear period from 1992-93 to 2001-02 was around 6.0 percent, asshown in Table 1, which puts India among the fastest growingdeveloping countries in the 1990s. In sharp contrast, growthin the 1990s was accompanied by remarkable external stabilitydespite the east Asian crisis. In addition, the annual averagegrowth rate for the periods 2002-03 to 2011-12 is 7.97percent. Poverty also declined significantly in the post-reform period, and at a faster rate than in the 1980saccording to studies. India still remained among the fastest growing developingcountries in the second sub-period because other developingcountries also slowed down after the east Asian crisis, butthe annual growth of 5.4 percent was much below the target of7.5 percent which the government had set for the period.Inevitably, this has led to some questioning about theeffectiveness of the reforms.Opinions on the causes of the growth deceleration vary. Worldeconomic growth was slower in the second half of the 1990s andthat would have had some effect, but India’s dependence on theworld economy is not large enough for this to account for theslowdown. However, the opposite view is that the slowdown isdue not to the effects of reforms, but rather to the failureto implement the reforms effectively. However, even agradualist pace should be able to achieve significant policy

changes over twenty years. This paper examines India’sexperience with gradualist reforms from this perspective.We review policy changes in Six major areas covered by thereform program: fiscal deficit reduction, industrial and tradepolicy, agricultural policy, infrastructure development andsocial sector development. Based on this review, we considerthe cumulative outcome of twenty years of gradualism to assesswhether the reforms have created an environment which cansupport increase in percentage of GDP growth, which is now thegovernment largest target. Fiscal DisciplineFiscal profligacy was seem to have cause for balance ofpayments crisis in 1991and reduction in fiscal deficit wastherefore an urgent priority at the start of the reforms. By 1990, the current account and fiscal deficits had risen to3.5% and 9.4% of GDP respectively, leading to the BOP crisisof 1991. Containing this deficit was one of the key structuraladjustments undertaken by the Indian government at the time.Economic reforms helped reduce the fiscal deficit, and thecombined fiscal deficit fell to 6.3% of GDP in 1996–1997. Thecombined fiscal deficit came down to 4.2% of GDP in 2007–2008(well below the prescribed 6.0%) and the primary deficit(fiscal deficit net of interest payments) turned into asurplus of 1.3% of GDP in 2007–2008. But un relatively, thecombined fiscal deficit increased to 10.2% of GDP in 2009-10.*Fortunately, the combined fiscal deficit has came down againto 4.2% in the year 2013-14 (*Source ; RBI various issues)The tax rate for individual reduced to 30 %. The tax rate fordomestic companies reduced from 40 % to 30 %. The tax rate onforeign companies reduced from 55 % to 40 %. Scheme forsubmission of returns through tax return prepares has beenintroduced.
Table : Finances of the Central and State Governments: Selected Indicators
Central
States
Combined
Year GFD GPD RD GFD GPD RD GFD GPD RD
1980–1989 6.7 4.1 1.7 2.8 1.7 -0.1 7.9 4.9 1.6
2
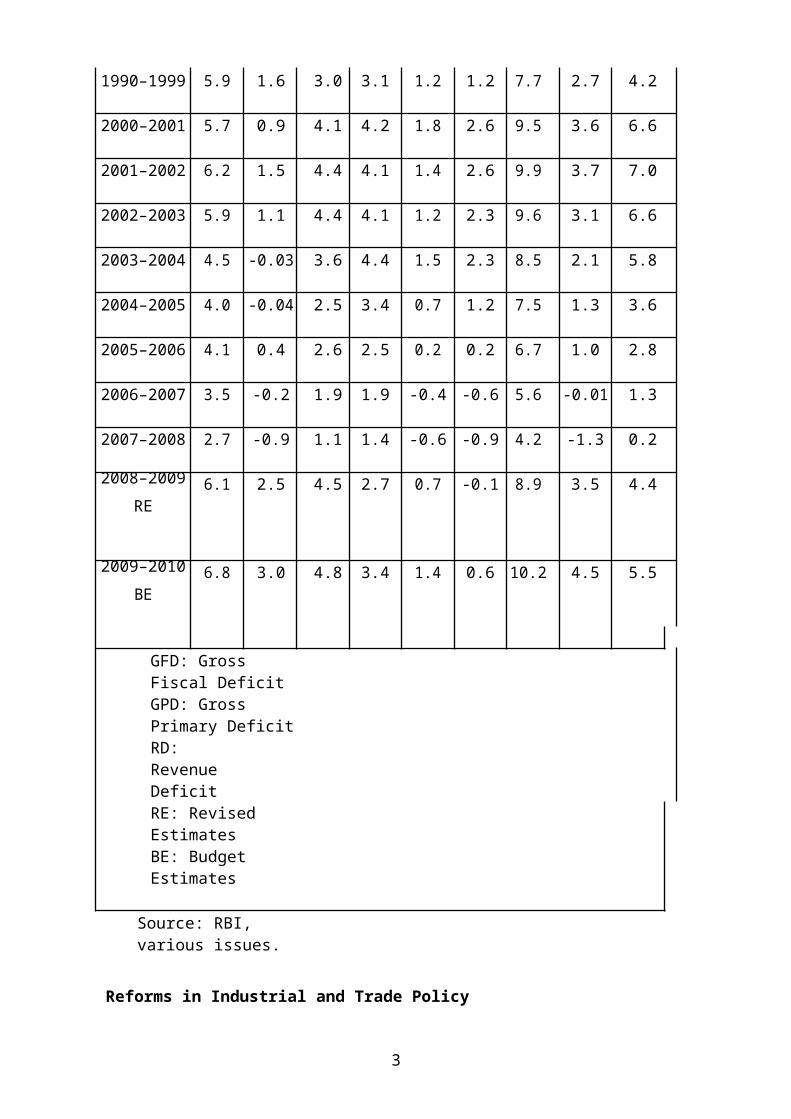
1990–1999 5.9 1.6 3.0 3.1 1.2 1.2 7.7 2.7 4.2
2000–2001 5.7 0.9 4.1 4.2 1.8 2.6 9.5 3.6 6.6
2001–2002 6.2 1.5 4.4 4.1 1.4 2.6 9.9 3.7 7.0
2002–2003 5.9 1.1 4.4 4.1 1.2 2.3 9.6 3.1 6.6
2003–2004 4.5 -0.03 3.6 4.4 1.5 2.3 8.5 2.1 5.8
2004–2005 4.0 -0.04 2.5 3.4 0.7 1.2 7.5 1.3 3.6
2005–2006 4.1 0.4 2.6 2.5 0.2 0.2 6.7 1.0 2.8
2006–2007 3.5 -0.2 1.9 1.9 -0.4 -0.6 5.6 -0.01 1.3
2007–2008 2.7 -0.9 1.1 1.4 -0.6 -0.9 4.2 -1.3 0.2
2008–2009 6.1 2.5 4.5 2.7 0.7 -0.1 8.9 3.5 4.4RE
2009–2010 6.8 3.0 4.8 3.4 1.4 0.6 10.2 4.5 5.5BE
GFD: Gross Fiscal DeficitGPD: Gross Primary DeficitRD: Revenue DeficitRE: Revised EstimatesBE: Budget Estimates
Source: RBI, various issues.
Reforms in Industrial and Trade Policy
3
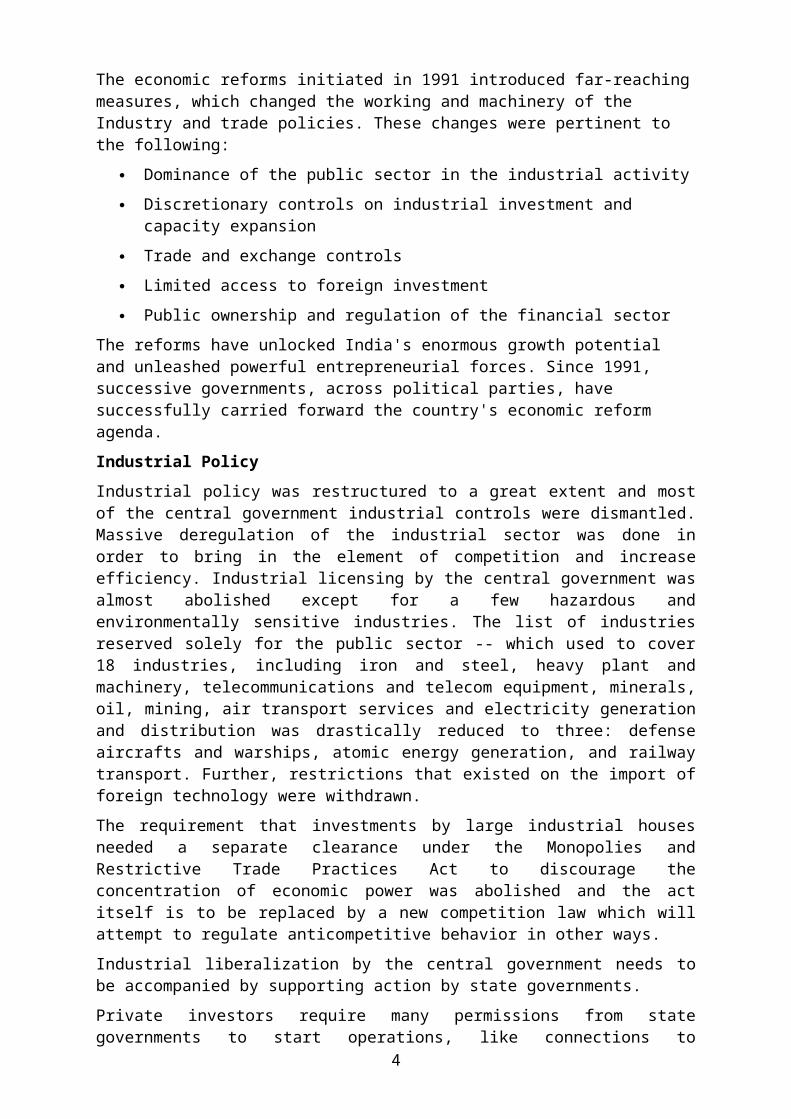
The economic reforms initiated in 1991 introduced far-reachingmeasures, which changed the working and machinery of the Industry and trade policies. These changes were pertinent to the following:
Dominance of the public sector in the industrial activity Discretionary controls on industrial investment and
capacity expansion Trade and exchange controls Limited access to foreign investment Public ownership and regulation of the financial sector
The reforms have unlocked India's enormous growth potential and unleashed powerful entrepreneurial forces. Since 1991, successive governments, across political parties, have successfully carried forward the country's economic reform agenda.Industrial PolicyIndustrial policy was restructured to a great extent and mostof the central government industrial controls were dismantled.Massive deregulation of the industrial sector was done inorder to bring in the element of competition and increaseefficiency. Industrial licensing by the central government wasalmost abolished except for a few hazardous andenvironmentally sensitive industries. The list of industriesreserved solely for the public sector -- which used to cover18 industries, including iron and steel, heavy plant andmachinery, telecommunications and telecom equipment, minerals,oil, mining, air transport services and electricity generationand distribution was drastically reduced to three: defenseaircrafts and warships, atomic energy generation, and railwaytransport. Further, restrictions that existed on the import offoreign technology were withdrawn.The requirement that investments by large industrial housesneeded a separate clearance under the Monopolies andRestrictive Trade Practices Act to discourage theconcentration of economic power was abolished and the actitself is to be replaced by a new competition law which willattempt to regulate anticompetitive behavior in other ways. Industrial liberalization by the central government needs tobe accompanied by supporting action by state governments. Private investors require many permissions from stategovernments to start operations, like connections to
4
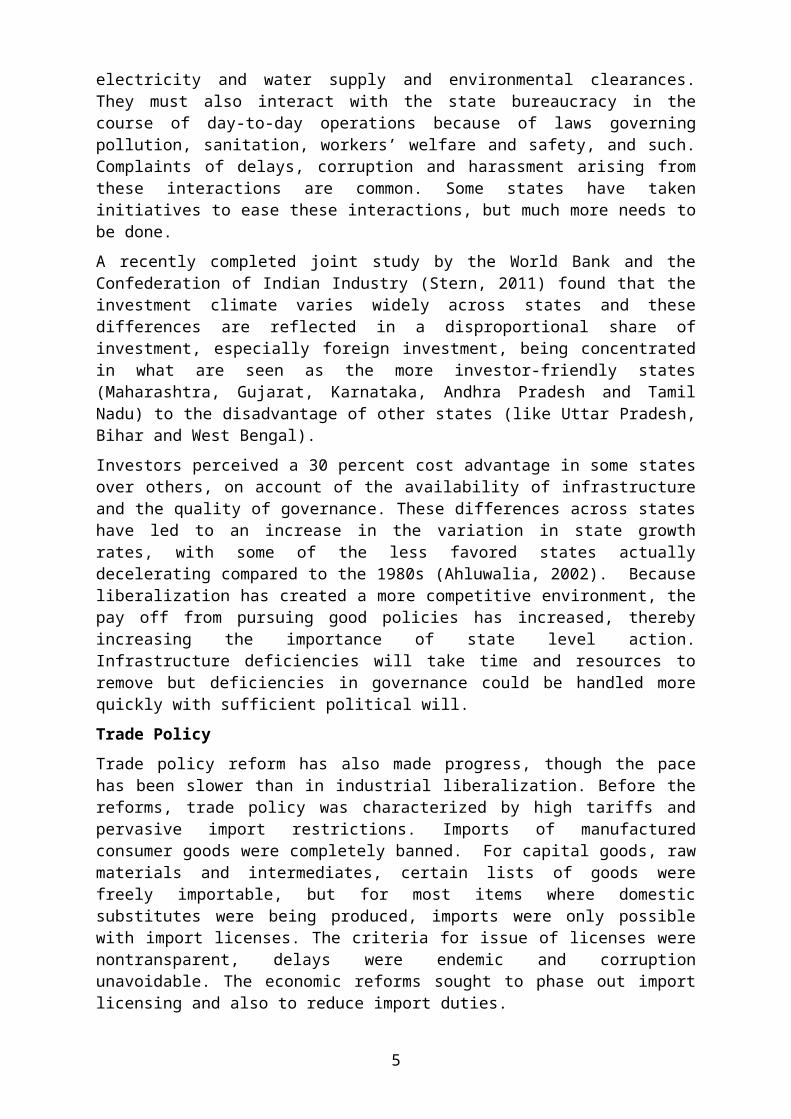
electricity and water supply and environmental clearances.They must also interact with the state bureaucracy in thecourse of day-to-day operations because of laws governingpollution, sanitation, workers’ welfare and safety, and such.Complaints of delays, corruption and harassment arising fromthese interactions are common. Some states have takeninitiatives to ease these interactions, but much more needs tobe done.A recently completed joint study by the World Bank and theConfederation of Indian Industry (Stern, 2011) found that theinvestment climate varies widely across states and thesedifferences are reflected in a disproportional share ofinvestment, especially foreign investment, being concentratedin what are seen as the more investor-friendly states(Maharashtra, Gujarat, Karnataka, Andhra Pradesh and TamilNadu) to the disadvantage of other states (like Uttar Pradesh,Bihar and West Bengal). Investors perceived a 30 percent cost advantage in some statesover others, on account of the availability of infrastructureand the quality of governance. These differences across stateshave led to an increase in the variation in state growthrates, with some of the less favored states actuallydecelerating compared to the 1980s (Ahluwalia, 2002). Becauseliberalization has created a more competitive environment, thepay off from pursuing good policies has increased, therebyincreasing the importance of state level action.Infrastructure deficiencies will take time and resources toremove but deficiencies in governance could be handled morequickly with sufficient political will.Trade Policy Trade policy reform has also made progress, though the pacehas been slower than in industrial liberalization. Before thereforms, trade policy was characterized by high tariffs andpervasive import restrictions. Imports of manufacturedconsumer goods were completely banned. For capital goods, rawmaterials and intermediates, certain lists of goods werefreely importable, but for most items where domesticsubstitutes were being produced, imports were only possiblewith import licenses. The criteria for issue of licenses werenontransparent, delays were endemic and corruptionunavoidable. The economic reforms sought to phase out importlicensing and also to reduce import duties.
5
Import licensing was abolished relatively early for capitalgoods and intermediates which became freely importable in1993, simultaneously with the switch to a flexible exchangerate regime. Import licensing had been traditionally defendedon the grounds that it was necessary to manage the balance ofpayments, but the shift to a flexible exchange rate enabledthe government to argue that any balance of payments impactwould be effectively dealt with through exchange rateflexibility. Removing quantitative restrictions on imports ofcapital goods and intermediates was relatively easy, becausethe number of domestic producers was small and Indian industrywelcomed the move as making it more competitive. Quantitative restrictions on imports of manufactured consumergoods and agricultural products were finally removed on April1, 2001, almost exactly ten years after the reforms began, andthat in part because of a ruling by a World Trade Organizationdispute panel on a complaint brought by the United States. Although India’s tariff levels are significantly lower than in1991, they remain among the highest in the developing worldbecause most other developing countries have also reducedtariffs in this period. The weighted average import duty inChina and southeast Asia is currently about half the Indianlevel. The government has announced that average tariffs willbe reduced to around 12 percent by 2011, but even if this isimplemented, tariffs in India will be much higher than inChina which has committed to reduce weighted average duties toabout 8 percent by 2010 as a condition for admission to theWorld Trade Organization.
Foreign Direct InvestmentLiberalizing foreign direct investment was another importantpart of India’s reforms, driven by the belief that this wouldincrease the total volume of investment in the economy,improve production technology, and increase access to worldmarkets. Procedures for obtaining permission were greatlysimplified by listing industries that are eligible forautomatic approval up to specified levels of foreign equity(100 percent, 74 percent and 51 percent).
As the third-largest economy in the world in PPP terms,India has attracted foreign direct investment . During theyear 2011, FDI inflow into India stood at $36.5 billion, 51.1%higher than 2010 figure of $24.15 billion. India has strengthsin telecommunication, information technology and other
6
significant areas such as auto components, chemicals,apparels, pharmaceuticals, and jewellery. Despite a surge inforeign investments, rigid FDI policies were a significanthindrance. Over time, India has adopted a number of FDIreforms. India has a large pool of skilled managerial andtechnical expertise. The size of the middle-class populationstands at 300 million and represents a growing consumermarket.
India liberalized its FDI policy in 2005, allowing up toa 100% FDI stake in ventures. Industrial policy reforms havesubstantially reduced industrial licensing requirements,removed restrictions on expansion and facilitated easy accessto foreign technology and foreign direct investment FDI. Theupward moving growth curve of the real-estate sector owes somecredit to a booming economy and liberalised FDI regime. InMarch 2005, the government amended the rules to allow 100% FDIin the construction sector, including built-up infrastructureand construction development projects comprising housing,commercial premises, hospitals, educational institutions,recreational facilities, and city- and regional-levelinfrastructure. Over 2012-14, India extended these reforms todefense, telecom, oil, retail, aviation and a number of othersectors.
Reforms in Financial Sector :Reforms in stock market were accelerated by stock marketscams in 1992 that reveals serious weakness in the regulatory
mechanism. Reforms implemented inculcating establishment ofstatutory regulatory, establishing govt. bodies in capitalmarket, introduction of electronic trading to improvetransparency, prohibition of Insider trading,dematerialization of shares to eliminate need for physicalmovement of shares.Bank rates has been decreased to 6 % per annum. CRR has beenreduced to a large extent, SLR has been reduced to 25 % duringrecent times, Prime lending rates are now set by banks, not byRBI w.e.f April 2001.Public sectors banks are allowed toapproach public to raise resources. Reduction of NPA’s hasbeen observed and Enforcement of Security Interest Act waspassed for assessing the banks in recovery of loans. The insurance sector including pension scheme was a publicsector monopoly at the start of reforms. The need to open this
7
sector to private companies was recommended by an expertcommittee in 1994.An independent Insurance Development and Regulatory Authorityhave now been established in the year 2000. 10 new lifeinsurance companies and 6 general insurance companies withmany well known international companies as partners hasstarted operations.Reforms in AgricultureIndia ranks second worldwide in farm output. Agriculture andallied sectors like forestry, logging and fishing accountedfor 18.6% of the GDP in 2009, employed 60% of the totalworkforce and despite a steady decline of its share in theGDP, is still the largest economic sector and plays asignificant role in the overall socio-economic development ofIndia. .A common criticism of India’s economic reforms is that theyhave been excessively focused on industrial and trade policy,neglecting agriculture which provides the livelihood of 60percent of the population. Critics point to the decelerationin agricultural growth in the second half of the 1990s asproof of this neglect. However, the notion that trade policychanges have not helped agriculture is clearly amisconception. The reduction of protection to industry, andthe accompanying depreciation in the exchange rate, has tiltedrelative prices in favor of agriculture and helpedagricultural exports. The index of agricultural pricesrelative to manufactured products has increased by almost 30percent in the past ten years (Ministry of Finance, 2002,Chapter 5). The share of India’s agricultural exports in worldexports of the same commodities increased from 1.1 percent in1990 to 2.9 percent in 2009, whereas it had declined in theten years before the reforms. The Essential Commodities act which empowered the state govt.to impose restrictions on movement of agricultural productsacross states and sometimes even district boundaries and tolimit the maximum stocks was designed to prevent exploitivetraders from diverting local supplies to other areas ofscarcity to cash benefits.Main problems in the agricultural sector, as listed by theWorld Bank, are:
India's large agricultural subsidies are hamperingproductivity-enhancing investment.
8
Overregulation of agriculture has increased costs, pricerisks and uncertainty.
Government interventions in labour, land, and creditmarkets.
Inadequate infrastructure and services.But while agriculture has benefited from trade policy changes,it has suffered in other respects, most notably from thedecline in public investment in areas critical foragricultural growth, such as irrigation and drainage, soilconservation and water management systems, and rural roads. The report of the Task Force on Employment has madecomprehensive proposals for review of several other outdatedagricultural law (Planning Commission, 2001b). For example,laws designed to protect land tenants, undoubtedly animportant objective, end up discouraging marginal farmers fromleasing out nonviable holdings to larger farmers for fear ofbeing unable to reclaim the land from the tenant. TheAgricultural Produce Marketing Acts in various states compeltraders to buy agricultural produce only in regulated markets,making it difficult for commercial traders to enter intocontractual relationships with farmers. Development of amodern food processing sector, which is essential to the nextstage of agricultural development, is also hampered byoutdated and often contradictory laws and regulations. Theseand other outdated laws need to be changed if the logic ofliberalization is to be extended to agriculture. Infrastructure DevelopmentRapid growth in a globalized environment requires a well-functioning infrastructure including especially electricpower, road and rail connectivity, telecommunications, airtransport, and efficient ports. India lags behind east andsoutheast Asia in these areas. These services weretraditionally provided by public sector monopolies but sincethe investment needed to expand capacity and improve qualitycould not be mobilized by the public sector, these sectorswere opened to private investment, including foreigninvestment. The greatest disappointment has been in the electric powersector, which was the first area opened for privateinvestment. Private investors were expected to produceelectricity for sale to the State Electricity Boards, whichwould control of transmission and distribution. However, the
9

State Electricity Boards were financially very weak, partlybecause electricity tariffs for many categories of consumerswere too low and also because very large amounts of power werelost in transmission and distribution. This loss, which shouldbe between 10 to 15 percent on technical grounds (depending onthe extent of the rural network), varies from 35 to 50percent. Private investors, fearing nonpayment by the StateElectricity Boards insisted on arrangements which guaranteedpurchase of electricity by state governments backed byadditional guarantees from the central government. Thesearrangements attracted criticism because of controversiesabout the reasonableness of the tariffs demanded by privatesector power producers. Although a large number of proposalsfor private sector projects amounting to about 80 percent ofexisting generation capacity were initiated, very few reachedfinancial closure and some of those which were implemented raninto trouble subsequently. The flaws in the policy have now been recognized and a morecomprehensive reform is being attempted by several stategovernments. Independent statutory regulators have beenestablished to set tariffs in a manner that would be perceivedto be fair to both consumers and producers. Several states aretrying to privatize distribution in the hope that this willovercome the corruption which leads to the enormousdistribution losses. However, these reforms are not easy toimplement. The results in telecommunications have been much better andthis is an important factor underlying India’s success ininformation technology. Several private sector serviceproviders of both fixed line and cellular services, many inpartnership with foreign investors, are now operating andcompeting with the pre-existing public sector supplier. Civil aviation and ports are two other areas where reformsappear to be succeeding, though much remains to be done. Twoprivate sector domestic airlines, which began operations afterthe reforms, now have more than half the market for domesticair travel. However, proposals to attract private investmentto upgrade the major airports at Mumbai and Delhi have yet tomake visible progress. In the case of ports, 17 private sectorprojects involving port handling capacity of 60 million tons,about 20 percent of the total capacity at present, are beingimplemented. Some of the new private sector port facilitieshave set high standards of productivity.
10
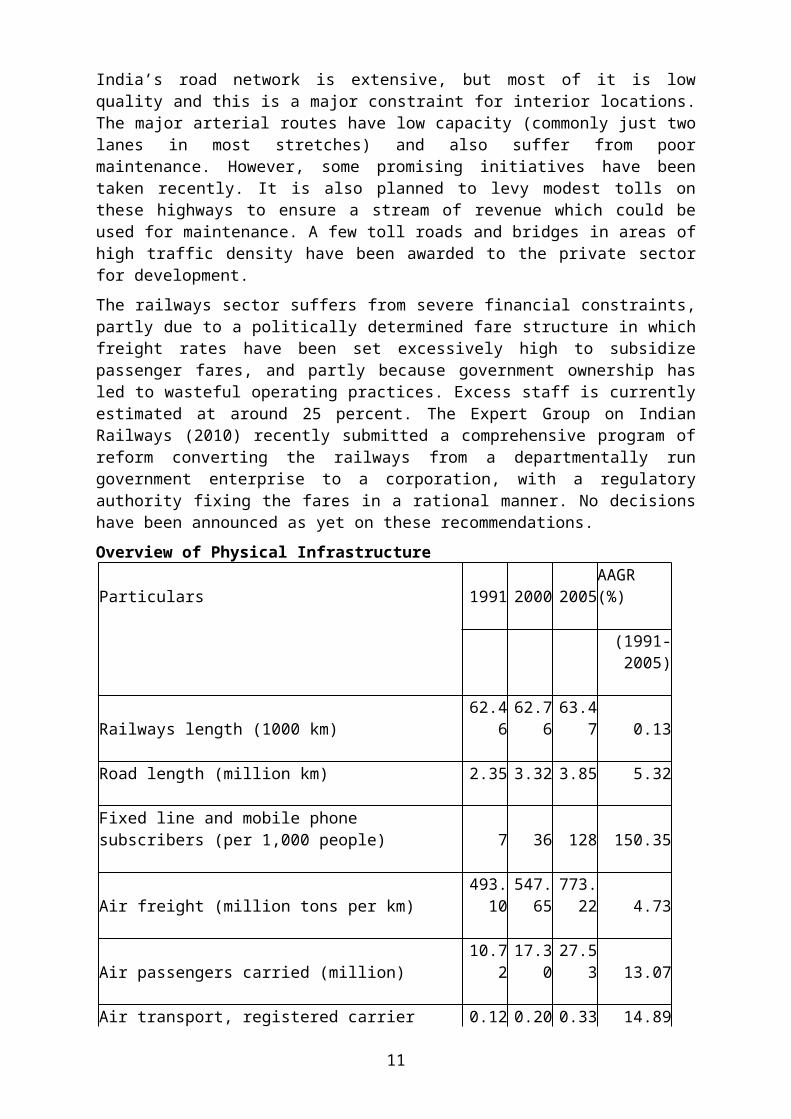
India’s road network is extensive, but most of it is lowquality and this is a major constraint for interior locations.The major arterial routes have low capacity (commonly just twolanes in most stretches) and also suffer from poormaintenance. However, some promising initiatives have beentaken recently. It is also planned to levy modest tolls onthese highways to ensure a stream of revenue which could beused for maintenance. A few toll roads and bridges in areas ofhigh traffic density have been awarded to the private sectorfor development.The railways sector suffers from severe financial constraints,partly due to a politically determined fare structure in whichfreight rates have been set excessively high to subsidizepassenger fares, and partly because government ownership hasled to wasteful operating practices. Excess staff is currentlyestimated at around 25 percent. The Expert Group on IndianRailways (2010) recently submitted a comprehensive program ofreform converting the railways from a departmentally rungovernment enterprise to a corporation, with a regulatoryauthority fixing the fares in a rational manner. No decisionshave been announced as yet on these recommendations.Overview of Physical Infrastructure
Particulars 1991 2000 2005AAGR (%)
(1991-2005)
Railways length (1000 km)62.4
662.7
663.4
7 0.13 Road length (million km) 2.35 3.32 3.85 5.32 Fixed line and mobile phone subscribers (per 1,000 people) 7 36 128 150.35
Air freight (million tons per km)493.
10547.65
773.22 4.73
Air passengers carried (million)10.7
217.3
027.5
3 13.07 Air transport, registered carrier 0.12 0.20 0.33 14.89
11
departures worldwide (million) Container port traffic (million TEUs) 0.15 2.45 4.94 266.01 Electric power consumption (kWh per capita)
295.02
402.02
457.32 4.58
Electric power consumption (kWh)255.
65408.42
493.78 7.76
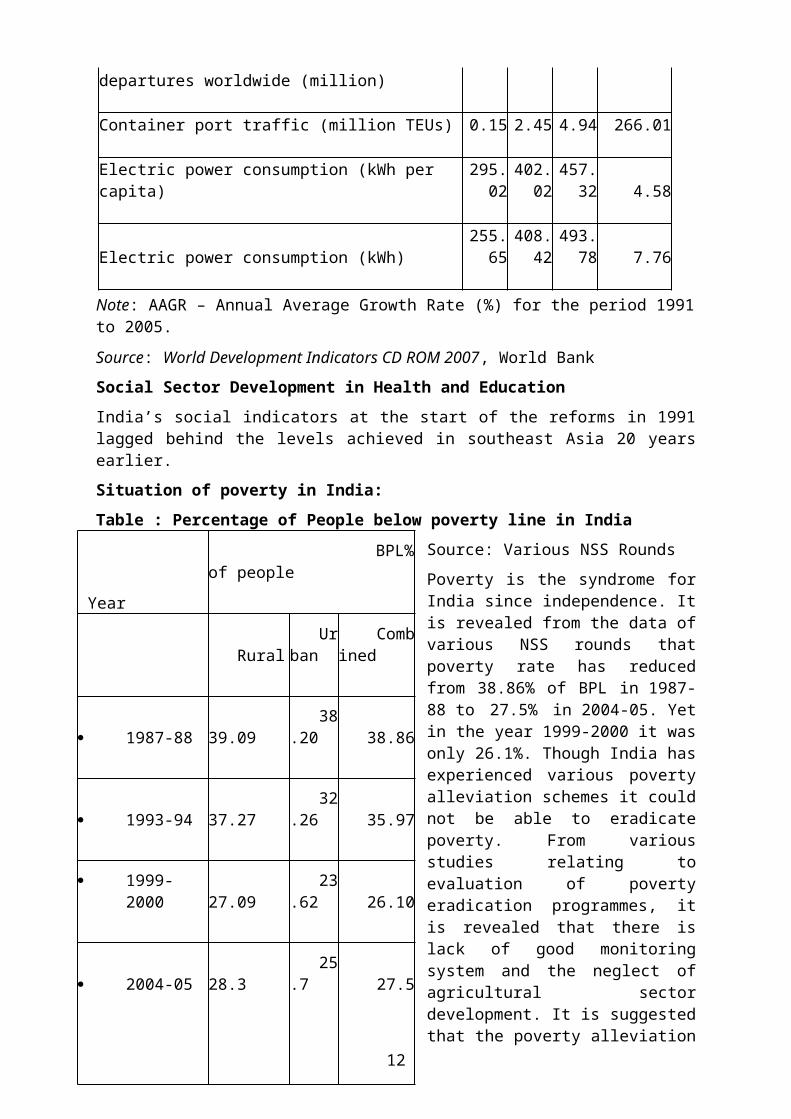
Note: AAGR – Annual Average Growth Rate (%) for the period 1991to 2005.Source: World Development Indicators CD ROM 2007, World BankSocial Sector Development in Health and EducationIndia’s social indicators at the start of the reforms in 1991lagged behind the levels achieved in southeast Asia 20 yearsearlier. Situation of poverty in India:Table : Percentage of People below poverty line in India
Source: Various NSS RoundsPoverty is the syndrome forIndia since independence. Itis revealed from the data ofvarious NSS rounds thatpoverty rate has reducedfrom 38.86% of BPL in 1987-88 to 27.5% in 2004-05. Yetin the year 1999-2000 it wasonly 26.1%. Though India hasexperienced various povertyalleviation schemes it couldnot be able to eradicatepoverty. From variousstudies relating toevaluation of povertyeradication programmes, itis revealed that there islack of good monitoringsystem and the neglect ofagricultural sectordevelopment. It is suggestedthat the poverty alleviation
Year
BPL%of people
Rural Urban
Combined
1987-88 39.09
38.20 38.86
1993-94 37.27
32.26 35.97
1999-
2000 27.09
23.62 26.10
2004-05 28.3
25.7 27.5
12
programmes should be of agricultural orientedand agricultural-friendly.Source: Socio-Economic Statistics of India, 2011, RBI
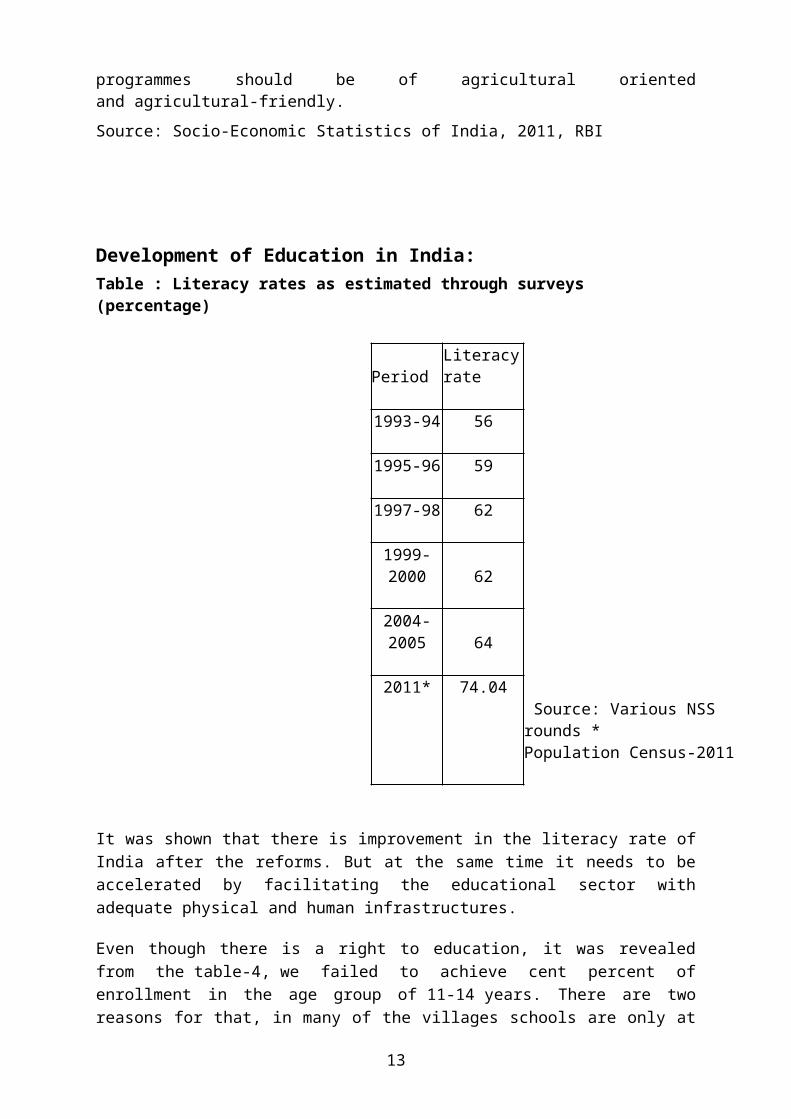
Development of Education in India:Table : Literacy rates as estimated through surveys (percentage)
PeriodLiteracyrate
1993-94 56
1995-96 59
1997-98 62
1999-2000 62
2004-2005 64
2011* 74.04
Source: Various NSS rounds * Population Census-2011
It was shown that there is improvement in the literacy rate ofIndia after the reforms. But at the same time it needs to beaccelerated by facilitating the educational sector withadequate physical and human infrastructures.
Even though there is a right to education, it was revealedfrom the table-4, we failed to achieve cent percent ofenrollment in the age group of 11-14 years. There are tworeasons for that, in many of the villages schools are only at
13
the primary level and parents were also not allow this agegroup of people to school and make them as a wage earner ofthe family. There is a need of policy measure to overcomethese two problems.
Housing Amenities in IndiaPercentage of households that: Total Urban Rural Have electricity 67.9 93.1 55.7 Use piped drinking water 42.0 71.0 27.9 Have access to a toilet facility 44.5 83.1 25.9 Live in a pucca house 41.4 74.1 25.5 Source: NFHS-III
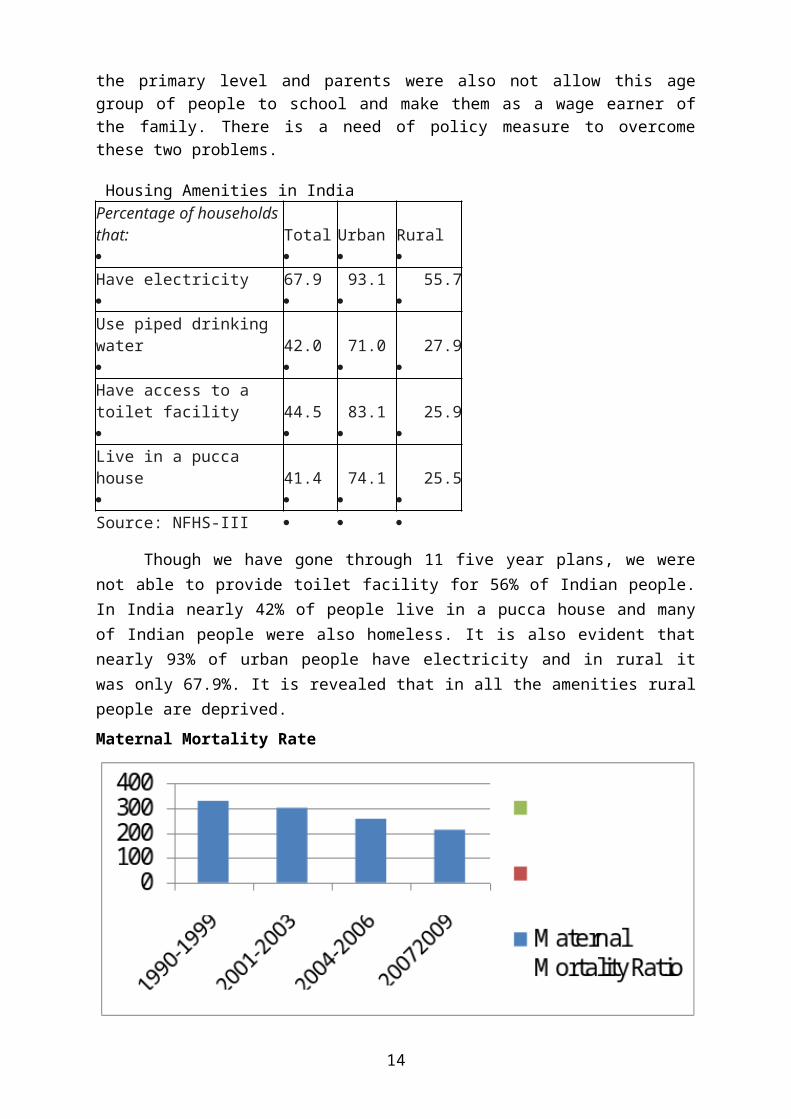
Though we have gone through 11 five year plans, we werenot able to provide toilet facility for 56% of Indian people.In India nearly 42% of people live in a pucca house and manyof Indian people were also homeless. It is also evident thatnearly 93% of urban people have electricity and in rural itwas only 67.9%. It is revealed that in all the amenities ruralpeople are deprived.Maternal Mortality Rate
14
The Maternal Mortality Ratio (MMR) is the number of women who die from any cause related to or aggravated by pregnancy or its management (excluding accidental or incidental causes) during pregnancy and childbirth or within 42 days of termination of pregnancy, irrespective of the duration and site of the pregnancy, per 100,000 live births. The incidence of maternal deaths is too rare an event to provide a robust estimate of the MMR by sample survey method. The present estimates are available from Sample Registration System (SRS) based studies taking into account the requirement of large sample size for sub-national estimates of MMR.The national MMR level has come down from 327 per 100,000 livebirths in 1999-2001 to 212 per 100,000 live births in 2007-09, registering a decline of 35.2% over a span of eight years. Part of the solution lies in greater participation by the beneficiaries in supervising education and health systems, which in turn requires decentralization to local levels and effective peoples’ participation at these levels. Nongovernment organizations can play a critical role in this process. Adequate human resources are required in health and education sectors and strengthening of infrastructural development is also needed. Social sector spending should assume a greater percentage of GDP. Different state governments are experimenting with alternative modalities but a great deal more needs to be done in this area. ConclusionsThe impact of twenty years of gradualist economic reforms inIndia on the policy environment presents a mixed picture. Reforms in Industrial and Trade Policies were a central focusof much of India’s reform effort in the early Stages. Reformsaimed at encouraging private investment in infrastructure haveworked in some areas but not in others. The complexity of theproblems in this area was underestimated, especially in thepower sector. This has now been recognized and policies arebeing reshaped accordingly.
Industrial Policy has seen greater change , with most centralgovernment industrial controls being dismantled.Progress has been made in several areas of financial sectorreforms, though some of the critical issues relating togovernment ownership of the banks remain to be addressed.
15
Critics often blame the delays in implementation and failureto act in certain areas to the choice of gradualism as astrategy. However, gradualism implies a clear definition ofthe goal and a deliberate choice of extending the time takento reach it, in order to ease the pain of transition. This isnot what happened in all areasThe result was a process of change that was not so muchgradualist as fitful and opportunistic. Progress was made asand when politically feasible, but since the end point was notalways clearly indicated, many participants were unclear abouthow much change would have to be accepted, and this may haveled to less adjustment than was otherwise feasible.Have the reforms laid the basis for India to grow at 8 percentper year? The main reason for being optimistic is that thecumulative change brought about is substantial. The slow paceof implementation has meant that many of the reforminitiatives have been put in place recently and theirbeneficial effects are yet to be felt. The policy environment today is therefore potentially muchmore supportive, especially if the critical missing links areput in place. However, the failure on the fiscal front couldundo much of what has been achieved. Both the central andstate governments are under severe fiscal stress whichseriously undermines their capacity to invest in certain typesof infrastructure and in social development where the publicsector is the only credible source of investment. If thesetrends are not reversed, it may be difficult even to maintain6 percent annual growth in the future, let alone accelerate to8 percent. However, if credible corrective steps are taken on the fiscalfront, then the cumulative policy changes that have alreadytaken place in many areas, combined with continued progress onthe unfinished agenda, should make it possible for India toaccelerate to well beyond 9 percent growth over the next fewyears.Acknowledgements
The views expressed in this article are those of theauthor and do not necessarily reflect the views of either theInternational Monetary Fund or the Government of India. Thanksare due to Dr.R.Siva Ram Prasad, Dr.B.K.Surya Prakash Rao,N.Bhavasing Naik, and R.PraveenKumar. .
16

ReferencesAhluwalia, Isher J., “Productivity and Growth in Indian Manufacturing,”Oxford University Press, New Delhi 1991.Ahluwalia, Isher J., “Industrial Growth in India: Stagnation since the mid-sixties,” Oxford University Press, New Delhi, 1995.Ahluwalia, Montek S., “India’s Economic Reforms: An Appraisal,” inJeffrey Sachs and Nirupam Bajpa’s (eds.), “India in the Era ofEconomic Reform,” Oxford University Press, New Delhi, 2000.____________, “State Level Performance Under Economic Reforms in India,” in“……………,” by Anne Krueger (ed.), Chicago University Press(forthcoming).____________, “India’s Vulnerability to External Crises: An Assessment,” in“Macro-economics and Monetary Policy: Issues for a Reforming Economy,” MontekS. Ahluwalia, Y.V. Reddy and S.S. Tarapore (editors), OxfordUniversity Press (forthcoming).Bhagwati, J., and Srinivasan, T.N., “Outward-Orientation onDevelopment: Are the Revisionists Right,” in Trade, Development and PoliticalEconomy, by Deepak Lal and Richard Snape eds. Palgrave, 2001.Chaudhuri, Sudip, “Economic Reforms and Industrial Structure in India,”Economic and Political Weekly, January 12, 2002.Ministry of Finance “Economic Survey 2001-02”, New Delhi 2002.Planning Commission, “Report of the Advisory Group on Tax Policy and TaxAdministration for the Tenth Plan,” 2001a.____________, “Report of the Task Force on Employment Opportunities,” 2001b.Prime Ministers’ Economic Advisory Council “Economic Reforms: AMedium-Term Perspective”.Saxena, N.C., “Improving Effectiveness of Government Programmes: An Agendaof Reform for the 10th Plan,” paper presented at a conference on“Fiscal Policies to Accelerate Growth,” organized by the WorldBank, New Delhi, May 8, 2001, available at www.fiscalconf.org.Stern, Nicholas, “Building a Climate for Investment, Growth and PovertyReduction in India,” in “A Strategy for Development,” published by WorldBank (2001).
http://www.statista.com/statistics/263617/gross-domestic-product-gdp-growth-rate-in-india/
17

http://www.indiainbusiness.nic.in/economy/economic_reforms.html
http://www.importantindia.com/1859/economic-reforms-in-india-since-1991/
http://www.planningcommission.gov.in/hindi/aboutus/speech/spemsa/msa012.pdf
Table 1 India’s Growth Performance http://www.statista.com/statistics/263617/gross-domestic-product-gdp-growth-rate-in-india
(Percent per year)
GDP Growth
1970-72to 1980-81(average)
3.2
1981-82to 1990-91(average)
5.7
1992 1.3 1993 5.1 1994 5.9 1995 7.31996 7.31997 7.81998 4.81999 6.52000 6.12001 4.0
18
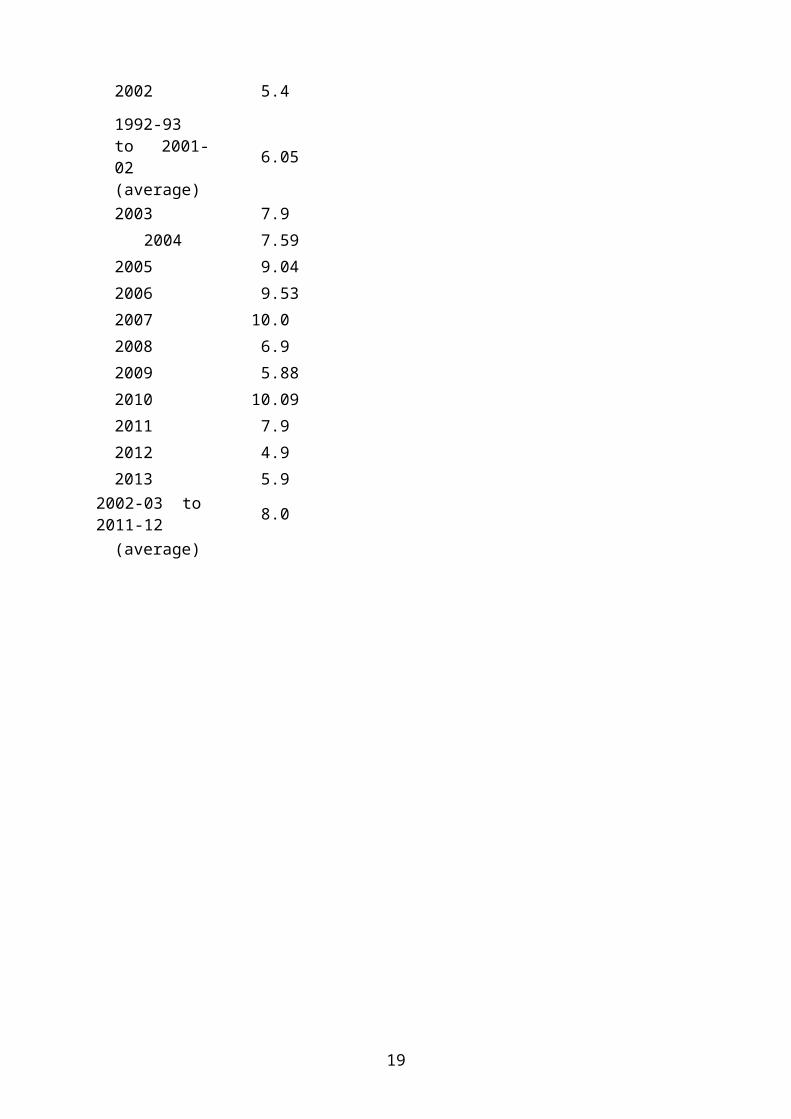
2002 5.4
1992-93to 2001-02(average)
6.05
2003 7.9 2004 7.592005 9.042006 9.532007 10.02008 6.92009 5.882010 10.092011 7.92012 4.92013 5.9
2002-03 to2011-12 8.0
(average)
19
Copyright © 2022 FDOKUMEN